Making Institutional Bodies: Socialization into the Nursing ...
Upload
khangminh22Category
view
0download
0
An Institutional Mapping of Urban
Local Bodies Through the Lens of
Sanitation and Solid Waste
Management Services
2020

ii
All Rights Reserved @International Budget Partnership (IBP) 2020
This joint report reflects the activities of individual agencies around an issue of common
concern. The principles and policies of each agency are governed by the relevant decisions
of its governing body.
Each agency implements the interventions described in this document in accordance with
these principles and policies and within the scope of its mandate.
The text has not been edited or fact-checked to official publications standards and IBP
accepts no responsibility for error.

iii
All Rights Reserved @ International Budget Partnership (IBP) 2020
Research and Writing by the following members of Centre for
Budget and Policy Studies (CBPS), Bangalore:
Sridhar R Prasad, Madhusudhan Rao B V, Swathi Krishnamurthy, Vivek P Nair, Sowmya J and Jyotsna Jha.
This paper can be quoted in part, with the full citation.
Suggested citation: Prasad, R. S., Rao, B.V. M., Krishnamurthy, S., Nair, P. V., Sowmya, J., Jha. J. (2020).
An Institutional Mapping of Urban Local Bodies Through the Lens of
Sanitation and Solid Waste Management Services.
Centre for Budget and Policy Studies, India and International Budget Partnership, USA.

iv
Table of Contents
Acknowledgements .............................................................................................................. 1
List of Tables .......................................................................................................................... 2
List of Figures......................................................................................................................... 6
List of Abbreviations ............................................................................................................. 7
Chapter 1: Introduction ...................................................................................................... 13
1.1. Urbanisation and its Challenges ................................................................................ 13
1.2. Urban Governance ....................................................................................................... 14
1.3. Municipal Reforms ....................................................................................................... 15
1.4. Context to the Study .................................................................................................... 15
Chapter 2: Study Objectives and Methodology .............................................................. 17
2.1. Study Objectives ........................................................................................................... 17
2.2. Methodology ................................................................................................................. 17
Chapter 3: Urban Administration and Devolution of 3 Fs in Six States ..................... 19
3.1. Urban Administration and Devolution of 3 Fs in Karnataka ............................... 19
3.1.1. Functions .................................................................................................................... 21
3.1.2. Functionaries .............................................................................................................. 29
3.1.3. Funds ........................................................................................................................... 31
3.2. Urban Administration and Devolution of 3 Fs in Tamil Nadu ............................. 33
3.2.1. Functions .................................................................................................................... 38
3.2.2. Functionaries .............................................................................................................. 39
3.2.3. Funds ........................................................................................................................... 40
3.3. Urban Administration and Devolution of 3 Fs in Maharashtra ............................ 43
3.3.1. Functions .................................................................................................................... 44
3.3.2. Functionaries .............................................................................................................. 47
3.3.3. Funds ........................................................................................................................... 48
3.4. Urban Administration and Devolution of 3 Fs in Telangana ................................ 50
3.4.1. Functions .................................................................................................................... 52

v
3.4.2. Functionaries .............................................................................................................. 53
3.4.3. Funds ........................................................................................................................... 55
3.5. Urban Administration and Devolution of 3 Fs in Andhra Pradesh ..................... 57
3.5.1. Functions .................................................................................................................... 59
3.5.2. Functionaries .............................................................................................................. 60
3.5.3. Funds ........................................................................................................................... 62
3.6. Urban Administration and Devolution of 3 Fs in Kerala ....................................... 63
3.6.1. Functions .................................................................................................................... 65
3.6.2. Functionaries .............................................................................................................. 67
3.6.3. Funds ........................................................................................................................... 68
Chapter 4: A Comparative Summary of Six States: Urbanisation, State/ULB Finances
& Sanitation/SWM Indicators ............................................................................................ 71
Chapter 5: Analysis of Expenditures on Sanitation and Solid Waste Management
Across Six States .................................................................................................................. 79
Chapter 6: Planning and Implementation of Sanitation and SWM Services in ULBs
................................................................................................................................................ 84
6.1. Doddaballapura City Municipal Council (CMC) (Karnataka State) ................... 85
6.1.1. Profile of Doddaballapura CMC ............................................................................. 85
6.1.2. Water Supply, Sanitation and SWM System ......................................................... 87
6.1.3. Organisational Chart and Governance Structure in Relation to Sanitation/SWM
......................................................................................................................................... 91
6.1.4. Staffing and Assets in Relation to Sanitation/SWM ............................................. 94
6.1.5. Doddaballapura CMC Finances .............................................................................. 99
6.1.6. Observations from the Budget books and audit reports of the Doddaballapura
CMC ............................................................................................................................. 112
6.1.7. Status and Welfare of Manual Scavengers .......................................................... 113
6.2. Hosur City Municipal Corporation (HCMC)Tamil Nadu State .......................... 116
6.2.1. Profile of HCMC ...................................................................................................... 116
6.2.2. Water Supply, Sanitation and Solid Waste Management (SWM) system ...... 118

vi
6.2.3. Organisational Chart and Governance Structure in Relation to Sanitation/SWM
....................................................................................................................................... 123
6.2.4. Staffing and Assets in Relation to Sanitation/SWM ........................................... 124
6.2.5. HCMC Finances ....................................................................................................... 129
6.2.6. Status and Welfare of Manual Scavengers .......................................................... 135
Chapter 7: Recommendations of 15th Finance Commission for the Sanitation and
SWM services in ULBs ...................................................................................................... 138
7.1. Empowering Local Governments ............................................................................ 138
7.2. Augmenting the revenues of ULBs .......................................................................... 139
Chapter 8: Key Takeaways and Policy Implications .................................................... 141
References ........................................................................................................................... 147
Annexure 1: Obligatory and Discritionary Functions of the Municipal
Council/Corporation (KM Act) ....................................................................................... 152
Annexure 2: Karnataka ..................................................................................................... 157
A2.1. Urbanisation in Karnataka ..................................................................................... 157
A2.2. Provisioning of Sanitation and SWM Services .................................................... 159
A2.3. Urban Reforms Related to Sanitation and SWM ................................................ 161
A2.4. Sanitation and SWM: State Level Targets and Progress Made So Far ............ 165
A2.5. Manual Scavenging and Welfare of Sanitation Workers .................................. 166
A2.6. Urbanisation Challenges (Specific to Sanitation and SWM) ............................. 168
Annexure 3: Criteria for Organisation of ULBs into Corporations, Councils, and
Nagar Panchayats .............................................................................................................. 170
Annexure 4: Powers of Taxation Under Municipal Laws Pre and Post 74th CAA
(Singh, 2011) ....................................................................................................................... 171
Annexure 5: Tamil Nadu .................................................................................................. 174
A5.1. Urbanisation in Tamil Nadu .................................................................................. 174
A5.2. Provisioning of Sanitation and SWM services .................................................... 176
A5.3. Urban Reforms Related to Sanitation and Solid Waste Management ............. 179
A5.4. Sanitation and SWM: State Level Targets and Progress Made So Far ............ 182

vii
A5.5. Manual Scavenging and Welfare of Sanitation Workers .................................. 184
A5.6. Urbanisation Challenges (Specific to Sanitation and SWM) ............................. 184
Annexure 6: Maharashtra ................................................................................................. 186
A6.1. Urbanisation in Maharashtra ................................................................................. 186
A6.2. Provisioning of Sanitation and SWM services .................................................... 187
A6.3. Urban Reforms Related to Sanitation and SWM ................................................ 191
A6.4. Sanitation and SWM: State Level Targets and Progress Made So Far ............ 195
A6.5. Manual Scavenging and Welfare of Sanitation Workers .................................. 197
A6.6. Urbanisation Challenges (Specific to Sanitation and SWM) ............................. 199
Annexure 7: The Duties of The Ward Member Within His / Her Jurisdiction Area
.............................................................................................................................................. 201
Annexure 8: Telangana ..................................................................................................... 202
A8.1. Urbanisation in Telangana ..................................................................................... 202
A8.2. Provisioning of Sanitation and SWM Services .................................................... 204
A8.3. Urban Reforms Related to Sanitation and SWM ................................................ 206
A8.4. Sanitation and SWM: State Level Targets and Progress Made So Far ............ 208
A8.5. Manual Scavenging and Welfare of Sanitation Workers .................................. 210
A8.6. Urbanisation Challenges (Specific to Sanitation and SWM) ............................. 211
Annexure 9: Criteria for Constitution of Nagar Panchayat and Municipality ......... 214
Annexure 10: Section 56: Powers and Functions of the Commissioner ................... 216
Annexure 11: Gradation of Municipalities in Andhra Pradesh .................................. 217
Annexure 12: Andhra Pradesh ........................................................................................ 218
A12.1. Urbanisation in Andhra Pradesh ........................................................................ 218
A12.2. Provisioning of Urban Sanitation and SWM Services ..................................... 219
A12.3. Urban Reforms Related to Sanitation and SWM .............................................. 223
A12.4. Sanitation and SWM: State Level Targets and Progress Made So Far .......... 225
A12.5. Manual Scavenging and Welfare of Sanitation Workers ................................ 227
A12.6. Urbanisation Challenges (Specific to Sanitation and SWM) ........................... 228

viii
Annexure 13: General Functions of Municipalities ...................................................... 231
Annexure 14: Kerala .......................................................................................................... 232
A14.1. Urbanisation in Kerala .......................................................................................... 232
A14.2. Provisioning of Sanitation and SWM Services .................................................. 233
A14.3. Urban Reforms Related to Sanitation and SWM .............................................. 237
A14.4. Sanitation and SWM: State Level Targets and Progress Made So Far .......... 239
A14.5. Manual Scavenging and Welfare of Sanitation Workers ................................ 241
A14.6. Urbanisation Challenges (Specific to Sanitation and SWM) ........................... 242
Notes ................................................................................................................................... 244
Notes ................................................................................................................................... 245
Notes ................................................................................................................................... 246
Notes ................................................................................................................................... 247

1
Acknowledgements
This study would not have been possible without the active support of the
Doddaballapura Municipal Council (DCMC), Government of Karnataka and Hosur
City Municipal Corporation (HCMC), Government of Tamil Nadu. We appreciate their
transparency in sharing with us all the relevant government orders, circulars and also
internal data, some of which has so far not been in public domain. A special thanks to
Commissioner of Municipal Administration Government of Tamil Nadu, Dr. K.
Baskaran, IAS and Director of Municipal Administration Government of Karnataka,
Ms. B.B. Kaveri, IAS and other staff members of DMA and CMA.
We would like to especially thank the Commissioner, Environmental Engineer,
Health/Sanitation Inspectors, Assistant Executive Engineer, Junior Engineer, Account
Superintendent, clerks and Sanitation workers of DCMC and HCMC who shared
valuable information during the course of the fieldwork. We would also like to
acknowledge the valuable inputs provided by Mr. Prabhudeva, Ex-President of DCMC
and Mr. Kumar, Ex-elected councilor of DCMC.
We would like to mention the fieldwork support provided by Mr. Vasanth Kumar.
Additional inputs were given by Thyagarajan R, Shiboni Sundar, Susmitha M V and
Summaiya Khan.
We would also like to extend our thanks to International Budget Partnership (IBP) for
the financial support. Special thanks to Ms. Pooja Parvati from IBP India office for her
constant support and inputs during the course of the study.
Research Team at Centre for Budget and Policy Studies (CBPS), Bangalore:
Sridhar R Prasad
Madhusudhan Rao B V
Swathi Krishnamurthy
Vivek P Nair
Sowmya J and
Jyotsna Jha

2
List of Tables
Table 3. 1: Showing the Actual Implementation of Functions ............................................. 23
Table 3. 2: Executive Set-Up of City Corporations and Other ULBs .................................. 29
Table 3. 3: Status of Devolution of Funds to ULBs and PRIs ............................................... 32
Table 3. 4: Number and Type of ULB in Tamil Nadu ........................................................... 35
Table 3. 5: Category of ULB Based on Their Annual Revenues .......................................... 35
Table 3. 6: Municipal Staffing Norms in Tamil Nadu ........................................................... 40
Table 3. 7: Receipts and Expenditure of ULB’s ...................................................................... 42
Table 3. 8: Types of Urban Areas According to the Municipal Acts in Maharashtra ....... 44
Table 3. 9: Classification of cities of Maharashtra .................................................................. 44
Table 3. 10: Status of Functions in the 12th Schedule ............................................................. 45
Table 3. 11: The Various Sources of Revenues of ULBs ........................................................ 49
Table 3. 12: Functional Distribution in Municipality ............................................................ 54
Table 3. 13: Yearly Break Up of ULBs Grants Allocated to Telangana ............................... 56
Table 3. 14: Number of ULBs .................................................................................................... 58
Table 3. 15: Sections in Municipalities in Andhra Pradesh .................................................. 61
Table 3. 16: Types of Municipality No. Of Wards Within Them and The Average
Population ................................................................................................................................... 65
Table 4. 1: SWM and Sanitation Index and Ranking Among Six States………………71
Table 4. 2: Comparative summary of six states on Urbanisation, State/ULB Finances &
Sanitation/SWM Indicators ....................................................................................................... 73
Table 5. 1: Karnataka Sanitation and SWM Expenditures……………………………….80
Table 5. 2: Tamil Nadu Sanitation and SWM Expenditures ................................................ 81
Table 5. 3: Maharashtra Sanitation and SWM Expenditures ............................................... 82
Table 5. 4: Telangana Sanitation and SWM Expenditures.................................................... 82
Table 5. 5: Andhra Pradesh Sanitation and SWM Expenditures ......................................... 82
Table 5. 6: Kerala Sanitation and SWM Expenditures .......................................................... 83
Table 5. 1: Karnataka Sanitation and SWM Expenditures……………………………….80

3
Table 5. 2: Tamil Nadu Sanitation and SWM Expenditures ................................................ 81
Table 5. 3: Maharashtra Sanitation and SWM Expenditures ............................................... 82
Table 5. 4: Telangana Sanitation and SWM Expenditures.................................................... 82
Table 5. 5: Andhra Pradesh Sanitation and SWM Expenditures ......................................... 82
Table 5. 6: Kerala Sanitation and SWM Expenditures .......................................................... 83
Table 6. 2: Profile of Doddaballapura CMC……………………………………………….85
Table 6. 3: Modes of Employment of Sanitation/SWM Workers ......................................... 95
Table 6. 4: Salaries and Other Benefits Given to Workers Based on Their Mode of
Employment ................................................................................................................................ 97
Table 6. 5: Aggregate finances of the Doddaballapura City Municipal Council ............ 101
Table 6. 6: Categories of revenues and expenditure of Doddaballapura CMC .............. 102
Table 6. 7: Receipts and Expenditure of Doddaballapura CMC ....................................... 104
Table 6. 8: Own Source Revenues of Doddaballapura CMC over years .......................... 104
Table 6. 9: Grant Revenues of Doddaballapura CMC Across Years ................................. 106
Table 6. 10: Components of Revenue expenditure of Doddaballapura CMC ................. 107
Table 6. 11: Capital expenditure of Doddaballapura CMC over years ............................ 108
Table 6. 12: Sanitation expenditure of Doddaballapura CMC over years ....................... 109
Table 6. 13: SWM expenditure of Doddaballapura CMC over years ............................... 109
Table 6. 14: Revenues from SWM and Sanitation of Doddaballapura CMC ................... 110
Table 6. 15: Costs and Revenues from Sanitation and SWM in Doddaballapura CMC 111
Table 6. 16: Share of OSR in the Revenue expenditure of the CMC ................................. 111
Table 6. 17: Average collections against budget estimates of revenue for the period 2015-
16 to 2018-19 .............................................................................................................................. 111
Table 6. 18: Profile of HCMC .................................................................................................. 116
Table 6. 19: Modes of Employment of Sanitation/SWM Workers ..................................... 125
Table 6. 20: Salaries and Other Benefits Given to Workers Based on Their Mode of
Employment .............................................................................................................................. 128
Table 6. 21: Receipts and Expenditure of HCMC (Rs. in lakhs) with year-on-year growth
(%) ............................................................................................................................................... 131

4
Table 6. 22: Sources of revenues of Hosur City Municipal Corporation (HCMC) Rs. in
Lakhs and its share (%) ............................................................................................................ 132
Table 6. 23: Revenue and Capital expenditures of HCMC (Rs. in lakhs) and its share (in
%) ................................................................................................................................................ 132
Table 6. 24: Revenue Expenditures of the HCMC (Rs. in lakhs) and its share (in %) .... 133
Table 6. 25: Capital expenditure on sanitation (Rs. in lakhs) and its share (in %) .......... 134
Table 6. 26: Sanitation expenditure in HCMC (Rs. in lakhs) and its share in total
expenditure ............................................................................................................................... 134
Table 6. 27: Sanitation Expenditure and Receipts from Sanitation of HCMC ................. 135
Table A2. 1: Sectoral Share of GSDP……………………………………………………...158
Table A2. 2: Performance of Karnataka State on Indicators of SDG 6, 11 and 12 ........... 165
Table A2. 3: Progress Made Across Various Sanitation Related Parameters From 2012 to
2018 ............................................................................................................................................. 166
Table A5. 2: Classification of Town Panchayats Based on Annual Income………….174
Table A5. 3: Urbanisation in Tamil Nadu ............................................................................. 175
Table A5. 4: Solid Waste Generation Status ......................................................................... 179
Table A5. 5: Sector Wise Proposed Project Funds and Corresponding Sharing Pattern180
Table A5. 6: Performance of TN State on Indicators of SDG 6, 11 and 12 ........................ 182
Table A5. 7: Progress Made Across Various Sanitation Related Parameters From 2012 To
2018 ............................................................................................................................................. 183
Table A6. 2: Position of Sanitation and Conservancy Function in Maharashtra Municipal
Laws Prior To 74th CAA (I.E. Prior To 1994 In Maharashtra)……………188
Table A6. 3: Institutions Responsible for Water Supply and Sanitation in Maharashtra
..................................................................................................................................................... 188
Table A6. 4: Components of MSNA ...................................................................................... 192
Table A6. 5: Performance Against SLB’s For Water Supply .............................................. 193
Table A6. 6: Performance Against SLB’s for Sewage Management .................................. 194
Table A6. 7: Performance Against SLB’s for Solid Waste Management .......................... 195
Table A6. 8: Performance of Maharashtra State on Indicators of SDG 6, 11 and SDG 12
..................................................................................................................................................... 196

5
Table A6. 9: Progress Made Across Various Sanitation Related Parameters From 2012 to
2018 ............................................................................................................................................. 196
Table A8. 2: Sewerage schemes…………………………………………………………….208
Table A8. 3: Sewerage Projects and its Expenditure ........................................................... 208
Table A8. 4: Performance of Telangana State on Indicators of SDG 6, 11 and 12 ........... 209
Table A8. 5: Sanitation Related Parameters, 2018 ................................................................ 209
Table A12. 2: Status on SWM Benchmark Indicators in AP……………………………221
Table A12. 3: Total Investment Required to Improve Sanitation Across all the ULBs .. 223
Table A12. 4: Urban Development Reforms, Policies and Schemes ................................. 223
Table A12. 5: Performance of Telangana State on Indicators of SDG 6, 11 and 12 ......... 226
Table A12. 6: Progress Made Across Various Sanitation Related Parameters From 2012 to
2018 ............................................................................................................................................. 227
Table A12. 7: Sector Wise Breakup of Consolidated Investments for all ULBs in the State
..................................................................................................................................................... 230
Table A14. 1: Performance of Kerala State on Indicators of SDG 6, 11 and 12………239
Table A14. 2: Progress Made Across Various Sanitation Related Parameters From 2012 to
2018 ............................................................................................................................................. 240

6
List of Figures
Figure 3. 1: Organisational Structure with Respect to Functioning of ULBs In Karnataka
State .............................................................................................................................................. 21
Figure 3. 2: Function-Wise Role of ULBs ................................................................................ 22
Figure 3. 3: Organisational Structure for Administration of ULBs in Tamil Nadu .......... 36
Figure 3. 4: Functionaries and Hierarchy of the Executive Wing ........................................ 55
Figure 6. 1: Cleaning of Open Drain…………………………………………………………87
Figure 6. 2: Sewage Treatment Plant at Doddaballapura ..................................................... 88
Figure 6. 3: Water Supply and Sanitation Ecosystem ........................................................... 89
Figure 6. 4: Paper and Plastic Waste Compressed by Belling Machine ............................. 90
Figure 6. 5: Solid Waste Management Ecosystem ................................................................. 91
Figure 6. 6: Legacy Waste Dumped in Landfill Site .............................................................. 91
Figure 6. 7: Organisation Chart ................................................................................................ 92
Figure 6. 8: Distribution of Type of Sanitation/SWM Work Versus Mode of Employment
....................................................................................................................................................... 96
Figure 6. 9: Share of sources of revenues of Doddaballapura CMC over years .............. 102
Figure 6. 10: Share of sources of expenditure of Doddaballapura CMC over years ...... 103
Figure 6. 11: Water Supply and Sanitation Ecosystem ....................................................... 118
Figure 6. 12: Open Drain Cleaning – Work Process ............................................................ 119
Figure 6. 13: Public and Community Toilets in Hosur ....................................................... 120
Figure 6. 14: Solid Waste Management Ecosystem ............................................................. 120
Figure 6. 15: Waste Collection, Transportation, Segregation and Compost .................... 121
Figure 6. 16: Onsite Compost Center in Hosur Municipal ................................................. 122
Figure 6. 17: CNG Bio-Methanisation Bottling Plant .......................................................... 122
Figure 6. 18: Organisation Chart ............................................................................................ 123
Figure 6. 19: Distribution of Type of Sanitation/SWM Work Versus Mode of Employment
..................................................................................................................................................... 127

7
List of Abbreviations
ACC Aurangabad City Corporation
ADB Asian Development Bank
AEGR Annual Exponential Growth Rate
AIIB Asian Infrastructure Investment Bank
AMRUT Atal Mission Rejuvenation of Urban Towns
APUFIDC Andhra Pradesh Urban Finance and Infrastructure Development
Corporation
ASCI Administrative Staff College of India
ASI Annual Survey of Industries
ATR Action Taken Report
B and D Birth and Death
BBMP Bruhat Bengaluru Mahanagara Palike
BDA Bangalore Development Authority
BDW Biodegradable Waste
BIAL Bengaluru International Airport
BMRDA Bangalore Metropolitan Regional Development Authority
BOT Build Operate and Transfer
BOV Battery Operated Vehicles
BPMC Act Bombay Provincial Municipal Corporations Act
BSUP Basic Services for Urban Poor
BWSSB Bangalore Water Supply and Sewerage Board
C & D Construction and Demolition
CAG Comptroller and Auditor General of India
CC City Corporations
CCDU Communication and Capacity Development Unit
CDMA Commissioner & Director of Municipal Administration
CFC Common Fund for Commodities
CMC City Municipal Council
CNG Compressed Natural Gas
CIDCO City and Industrial Development Corporation of Maharashtra Ltd
C & R Cadre & Recruitment
DBFOT Design, Build, Finance, Operate and Transfer
DC Deputy Commissioner
DMA Directorate of Municipal Administration

8
DPR Detailed Project Report
DTCP Director of Town & Country Planning
DUDC District Urban Development Cell
EPF Employee Provident Fund
ES Engineering Section
ESI Employee State Insurance
EWS Economically Weaker Section
FBDEAAS Fund Based Double Entry Accrual Accounting System
FSTP Faecal Sludge Treatment Plants
GFC Garbage Free Cities
GHMC Greater Hyderabad Municipal Corporation
GHMC Act Greater Hyderabad Municipal Corporation Act
GIZ Gesellschaft International Zusammenarbeit
GoAP Government of Andhra Pradesh
GoT Government of Telangana
GPF General Purpose Fund
GSDA Groundwater Survey and Development Agency
GSDP Gross State Domestic Product
GVMC Greater Vishakhapatnam Municipal Corporation
GWMC Greater Warangal Municipal Corporation
HCMC Hosur City Municipal Corporation
HH Household
HHs Households
HITEC Hyderabad Information Technology and Engineering Consultancy
HKS Haritha Karma Sena
HMC Act Hyderabad Municipal Corporations Act
HR Human Resource
HRIDAY Heritage City Development and Augmentation Yojana
ICT Information & Communication Technology
IDSMT Integrated Development of Small & Medium Towns
IHHL Individual Household Latrine
ILCS Integrated Low-Cost Sanitation
IT Information Technology
ITES Information Technology Enabled Services
ITIR Information Technology Investment Regions

9
JE Junior Engineer
JNNURM Jawaharlal Nehru National Urban Renewal Mission
KIADB Karnataka Industrial Areas Development Board
KIUWMIP Karnataka Integrated Urban Water Management Investment
Programme
KM Karnataka Municipalities
KM Kerala Municipality
KMC Karnataka Municipal Corporation
KMRP Karnataka Municipal Reforms Project
KSIDC Kerala State Industrial Development corporation
KSUDP Kerala Sustainable Urban Development Project
KSWMP Kerala Solid Waste Management Project
KUDCEMP Karnataka Urban Development and Coastal Environmental
Management Project
KUIFDC Karnataka Urban Infrastructure Development and Finance
Corporation
KUWASIP Karnataka Urban Water Sector Improvement Project
KUWS &DB Karnataka Urban Water Supply and Drainage Board
KUWSMP Karnataka Urban Water Supply Modernisation Project
KWA Kerala Water Authority
KWMA Kerala Waste Management Authority
LCV Light Commercial Vehicle
LGSs local Self-Governments
LPCD Litre Per Capita Per Day
LSGD Local Self Government Department
LWM Liquid Waste Management
MA&UD Municipal Administration and Urban Development
MCC Micro Composting Centre
MCGM Municipal Corporation of Greater Mumbai
MCGM Municipal Corporation of Greater Mumbai
MIDC Maharashtra Industrial Development Corporation
MJP Maharashtra Jeevan Pradhikaran
ML Medical Leave
MLA Members of the Legislative Assembly
MLD Millions of Litter Per Day
10
MLC Member of the Legislative Council
MLP Multi Layered Plastics
MMC Act Mumbai Municipal Corporation Act
MPBCDC Mahatma Phule Backward Class Development Corporation Limited
MS Manual Scavenging
MSNA Maharashtra Sujal Nirmal Abhiyan
MSWM Municipal Solid Waste Management
MT Metric Tonnes
NBDW Non Bio Degradable Waste
NCSK National Commission for Safai Karamcharis
NIMZ National Investment and Manufacturing Zones
NKUSIP North Karnataka Urban Sector Investment Programme
NLNORR Non-Loan Net Own Revenue Receipts
NMC Act Nagpur Municipal Corporation Act
NSKFDC National Safai Karamchari Finance and Development Corporation
NULM National Urban Livelihood Mission
NUSP National Urban Sanitation Policy
OBC Other Backward Class
O & M Operation & Maintenance
ODF Open Defecation Free
ORR Outer Ring Road
OSR Own Source Revenue
OTCA One Time Cash Assistance
OTSFA One Time Special Financial Assistance
PAS Performance Assessment System
PHS Public Health Section
PF Provident Fund
PGR Public Grievances and Redressal system
PH&MED Public Health & Municipal Engineering Department
PRIs Panchayat Raj Institutions
PSC Public Service Commission
PTIS Property Tax Information system
RRC Resource Recovery Centre
RRFs Resource Recovery Facilities
RWAs Resident Welfare Associations
11
SAAP State’s Annual Action Plan
SAC Swachha Andhra Corporation
SAPCC State Action Plan for Climate Change
SBM Swachh Bharat Mission
SC Scheduled Caste
SCM Smart Cities Mission
SDGI Sustainable Development Goals Index
SEZ Special Economic Zones
SFCs State Finance Commissions
SHG Self-Help Group
SI Sanitary Inspector
SIT Smart Industrial Township
SLBs Service Level Benchmarking
SLSC State Level Sanitation Committee
SPVs Special Purpose Vehicles
SRMS Self-Employment Scheme for Rehabilitation of Manual Scavengers
SS Swachh Survekshan
SSP Slum Sanitation Programme
SSS State Sanitation Strategy
SSS State Sanitation Strategies
ST Scheduled Tribes
STP Sewage Treatment Plant
SW Sanitary Worker
SWM Solid Waste Management
TDR Transferable Development Rights
TMC Town Municipal Council
TNSUDP Tamil Nadu Sustainable Urban Development Project
TNUDF Tamil Nadu Urban Development Fund
TPD Tonnes Per Day
TPD Total Waste Generated
TUFIDC Telangana Urban Finance and Infrastructure Development
Corporation
TNUIFSL Tamil Nadu Urban Infrastructure Financial Services Limited
TWAD Tamil Nadu Water and Drainage Board
UAs Urban Agglomerations

12
UDAs Urban Development Authorities
UDD Urban Development Department
UDWSP Urban Drinking Water and Sanitation policy
UGD Underground Drainage
UGSS Underground Sewerage Scheme
UI&G Urban Infrastructure & Governance
UIDSSMT Urban Infrastructure Development Scheme for Small and Medium
Towns
ULBs Urban Local Bodies
UPA Urban Poverty Alleviation
UWSS Urban Water Supply & Sanitation
WCs ward committees
WSSD Water Supply and Sanitation Department
ZP Zilla Parishad

13
Chapter 1: Introduction
1.1. Urbanisation and its Challenges
Cities have been regarded as the engines of economic growth and the top 10 cities
together contribute about 1.26 trillion USD (PPP) to India’s GDP of 9.49 trillion USD
(PPP). Global and Indian experiences show that productivity and growth are strongly
correlated with urbanisation (Pronab Sen, 2017). Urbanisation expands the product and
labour markets, creates competition and enhances efficiency. Through its scale in
operations, it provides opportunities for division of labour as well as specialization
leading towards improved productivity. However, for cities to drive growth and
sustain its productivity, urban services like water supply, sanitation, solid waste
management, transport, communication, clean energy, and housing become very
critical. India has 53 cities with a population of one million and above and these cities
together constitute about 42 % of India’s urban population. The number is likely to go
up to 68 cities by 2021. The subject of local governments is in the State list and the
impetus given for the local governments to flourish and deliver largely depends on the
political will of the State Governments. The 74th Constitutional Amendment provided
Urban Local Bodies (ULBs) / municipalities the much-required legal status as local self-
governments. The 12th schedule of the Indian Constitution lists the 18 functions that
may be devolved to the ULBs by the state governments. The functioning of specialized
parastatal bodies1 and Special Purpose Vehicles (SPVs)2 has resulted in ULBs being
largely confined to four core urban services of water supply, street lighting or public
safety, municipal roads and solid waste management. ULBs also implement urban
development schemes3 aimed at improving urban infrastructure and services even
though they have very little or no say in designing them.
1 Urban Water Supply and Drainage Board, Urban Infrastructure Development and Finance Corporation,
Slum Development Board are urban development authorities which are funded by state and have
superior powers in urban management in comparison to ULBs. 2 Special Purpose Vehicles (SPVs) like the Smart City Mission have overarching objectives of urban
development and are funded by the state/union government 3 Jawaharlal Nehru National Urban Renewal Mission (JNNURM), Atal Mission Rejuvenation of Urban
Towns (AMRUT), Heritage City Development and Augmentation Yojana (HRIDAY) have been
implemented to improve the provision of urban services and reduce the deficits in infrastructure. Basic
Services for Urban Poor (BSUP), National Urban Livelihood Mission (NULM), and Housing for All have
been targeted to enhance the quality of urban services provided to poor.

14
Indian urbanisation is characterized largely by the natural growth of the population
and increase in the urban area by way of absorbing the villages in the periphery.
Together they account for about 80 % of the urban growth. There is also the migrant
population who come to the cities/towns seeking employment and better opportunities
for living through improved health and education facilities. Challenges of urbanisation
in India are many and often very complex. Absorbing of villages in the urban periphery
poses huge challenges in terms of providing basic services to these areas.
The paucity of funds, lack of planning and excessive state control as some of the
problems which have resulted in inefficient and substandard urban governance4. Urban
experts conclude that the three challenges of Indian urbanisation are - a) investments
for urban infrastructure; b) reforming institutions; and c) capacity building of local
government.5 Adding to these challenges is the fact that there is no clean slate to start
with. There are already institutions, laws and structures in place which can make even
the best-laid plans go astray. Hence, in the Indian context governance structures also
assume significant importance.
1.2. Urban Governance
Much of the existing literature has listed issues of municipal governance viz. poor
institutional capacities and finances, state control, lack of ownership of schemes by
ULBs and inefficient capacity building efforts from an external viewer perspective.
There are very few studies that have looked into the underpinnings of both supply and
demand side of urban governance from within (the ULB). Supply side of urban
governance looks deep into various functional aspects of ULB and attempts to seek
answers to the following critical questions. How are the basic services planned and
delivered? What is the governance structure and how are decisions taken and political
will exercised? What is the role of data in decision making? How are finances planned
and budgeted for provision of public services? What are the various ways of resource
generation? What do budgets of ULB reveal and how does the ULB interact with the
state government as well as its citizenry? How does the ULB proactively disclose the
information to citizenry to enable their participation in urban governance? Demand
side of governance tries to understand and seek answers regarding stakeholder
engagement with the ULB. Questions in these aspects include, who engages with the
4 http://rnlkwc.org/pdf/anudhyan/18_04_2016/Urban_Local_Government_In_India.pdf 5 http://www.epw.in/system/files/pdf/2014_49/42/Understanding_the_Urban_Challenge.pdf
15
ULB through ward committees (WCs) or Resident Welfare Associations (RWAs)? How
do they participate in these interactions? How do they use the information provided by
the ULB?
1.3. Municipal Reforms
In the last two decades, state governments have taken many initiatives and have
implemented various municipal reforms to strengthen and improve service delivery
mechanisms, enhance community participation and increase accountability of ULBs.
Reforms include computerization of ULBs, introduction of fund based double entry
accounting system on the lines of national municipal accounting manual, business
process re-engineering, training and handholding of ULBs. Service Level Benchmarking
(SLBs) for urban services provide the framework for monitoring of performances of
ULBs across various dimensions wherein the basic minimum standards of services are
measured through benchmarking which could be used to make better decisions,
improve services and understood by all stakeholders. Reforms were also introduced for
increased citizen participation and engagement in urban governance.
1.4. Context to the Study
Management of Urban Waste (including both sanitation and solid waste) is one of the
important urban services that has a bearing on urban productivity and sustainability in
the long run. SDGs 6 and 11 also emphasize the importance of urban sanitation and
SWM services. Successive Finance Commissions have taken cognizance of the
importance of urban services including SWM and Sanitation. The terms of reference for
15th Finance Commission also highlighted the need for improving the quality of basic
services including the solid and liquid waste management through incentivization of
ULBs. It has also stressed the need for focusing on behavioural change communication
to achieve the objective of ending open defecation and to put an end to the inhuman
practice of manual scavenging6 by putting proper sewerage systems in place. The
Integrated Low-Cost Sanitation (ILCS) Scheme which facilitates building of low-cost
sanitation units and the Self Employment Scheme for Rehabilitation of Manual
Scavengers (SRMS) which focuses on rehabilitation of manual scavengers by providing
cash assistance and capital subsidy for entrepreneurial activity are very important
6 The Employment of Manual Scavengers and Construction of Dry Latrines (Prohibition) Act, 1993 was
amended in 2013 to form the Prohibition of Employment as Manual Scavengers and their Rehabilitation
Act.
16
schemes in this regard. It is of utmost importance to ensure the effective
implementation and reach of these critical schemes to the intended beneficiaries.
The underlying issues of solid and liquid waste management in an ULB relating to
institutional capacity, cost recovery, regulatory mechanism and citizen participation
needs to be addressed in a comprehensive manner to achieve this objective. It then
becomes imperative to understand how these services are provided at an ULB level and
what is its role in implementing the schemes like ILCS and SRMS apart from
understanding the challenges of providing quality services with respect to solid and
liquid waste management.

17
Chapter 2: Study Objectives and Methodology
2.1. Study Objectives
a. How do the ULBs plan and implement sanitation and SWM services? To map - 1)
The role of data 2) Governance structure 3) Implementation of Schemes 4) Budgeting
process and 5) The roles and implications on both the frontline staff and citizenry.
b. What is the interaction of the ULB with the State government including parastatal
bodies in the provisioning of sanitation and SWM services?
c. What is the specific role played by the ULBs in eradicating manual scavenging? What
is their involvement in the effective implementation of schemes like ILCS and SRMS?
d. What are the implications of the recommendations of 15th Finance Commission
specifically relating to Sanitation and SWM services in ULBs?
e. What are the potential ways of resource mobilization for ULBs to fund the Sanitation
and SWM services efficiently?
2.2. Methodology
SI.
No Method Tools and Techniques
1. Review the devolution of functions under the
12th schedule across the six south Indian
states (Kerala, Tamil Nadu, Andhra Pradesh,
Karnataka, Telangana and Maharashtra)
including the existence of parastatal bodies
with urban functions to provide a context for
the study with a greater focus on the services
of sanitation and SWM. The review also
focuses on the devolution of funds and
functionaries for these services.
This will be done through a web-
search of acts and documents. This
will include the web-sites of various
governments, urban bodies and
parastatals as well as a few research
agencies working on these issues.
If necessary, we will have a few
phone-interviews with key
stakeholders
2. An analysis of the budgets of these six states
to understand the devolution to urban
services as a whole and sanitation and SWM
in particular in the last 4-5 years.
Budget analysis to understand the
expenditure trend for eight years
(2012-13 to 2019-20) with respect to
solid and liquid waste management.
3. An in-depth institutional mapping of 2
ULBs, one in Karnataka (Doddaballapura)
and one in Tamil Nadu (Hosur) which have
proximity to Bangalore. This would
specifically entail a deeper understanding of
their sanitation and SWM services. It will
include:
The in-depth study will involve field
work in two identified sites for the
purposes of both data collection and
conducting interviews.

18
3a A detailed budget analysis of the two ULBs (last 3 years). This would also involve
studying the various mechanisms for raising municipal revenues (taxes and user
charges), other sources of revenue generation and total operational costs.
3b Analyse sectoral data being collected and maintained by the two ULBs pertaining to
sanitation and solid waste management (including relevant scheme related data)
3c Building an understanding of the governance structure, planning and decision
making on sanitation and SWM services. This will be achieved through document
analysis and semi-structured interviews.

19
Chapter 3: Urban Administration and Devolution of 3 Fs in Six
States
The economic reforms that took place in the early 1990s led to Indian cities becoming
hubs of economic activities, as they were able to provide the basic minimum
infrastructure requirements. These cities were able to increasingly attract both
investment and talent and this meant that the supporting infrastructure such as roads,
public transport, housing and other amenities had to also keep up pace with the city’s
growth. Hence, there was a serious need to devolve powers and authorities to the
lower tiers of the government – the municipal bodies that are largely responsible for
creating and maintaining these infrastructure facilities. However, the framework for
urban administration and the extent of devolution of the 3 Fs – Funds, Functions and
Functionaries varies from state to state.
In the context of this particular study, apart from understanding the framework for
urban administration and the extent of devolution in each of the six states of interest, it
would be of value to also simultaneously gain some perspective on the following
aspects:
1. Urbanization trends of the state (Causes, Rate and Challenges).
2. Provisioning of Sanitation and SWM services in the state.
3. Urban reforms in relation to Sanitation and SWM.
4. Sanitation and SWM: State level targets and progress made.
5. Manual scavenging and welfare of sanitation workers in the state.
Annexure 2 provides the above details for Karnataka, Annexure 5 for Tamil Nadu,
Annexure 6 for Maharashtra, Annexure 8 for Telangana, Annexure 12 for Andhra
Pradesh and Annexure 14 for Kerala.
3.1. Urban Administration and Devolution of 3 Fs in Karnataka
The history of urban local self-governing bodies in Karnataka state dates back to more
than a century. Based on the population urban local bodies are classified into various
categories like City Corporations, City Municipalities, Town Municipalities and Town
Panchayats. The Municipal bodies are now governed by the provisions contained in
Karnataka Municipalities Act, 1964 (for City Municipalities, Town Municipalities and
Town Panchayats) and Corporation Act, 1976 (for Corporations).
When Karnataka emerged as a unified state after the linguistic reorganisation of states
in 1956, there was no uniformity in the rules and regulations governing the urban
20
government. The Karnataka Municipal Corporation (KMC) Act was enacted with an
intention to consolidate the Bangalore Municipal Corporation Act, 1949 and the Hubli-
Dharwar Municipal Corporation functioning under the Bombay Provincial Municipal
Corporations Act, 1949 which was in force in the Belgaum Area. Similarly, the
municipal councils in the state were governed by seven different enactments in force in
different areas, and to unify them, the Karnataka Municipalities (KM) Act, 1964 was
introduced.
After the 74th Constitutional Amendment, in order to delegate powers to the urban local
bodies, the KM and the KMC Acts were amended. As a result of this amendment, a
four-tier system was introduced and ULBs were categorised into – 1) Town Panchayats
(Population with 10000 to 20000), 2) Town Municipal Council (Population with 20000 to
50000), 3) City Municipal Council (Population 50000 to 300000) and 4) City Corporation
(Population 3 lakhs and, above). Each Corporation/Municipal area has been divided
into wards, which are determined and notified by the State Government for the purpose
of election of Councillors. In January 2007, the Karnataka Government issued a
notification to merge the areas under the existing Bangalore Mahanagara Palike with
seven City municipal council (CMC)'s, one Town municipal council (TMC) and 111
villages around the city to form a single administrative body, the Bruhat Bangalore
Mahanagara Palike (BBMP). The process was completed by April 2007 and the body
was renamed as ‘BBMP' (Karnataka State Pollution Control Board, 2016).
The Urban Development Department (UDD) is the apex body for urban governance
and is headed by Additional Chief Secretary to Government of Karnataka. The
Directorate of Municipal Administration (DMA), established in December 1984, is the
nodal agency to control and monitor the administrative, development and financial
activities of the ULBs except the BBMP, which functions directly under the UDD. The
organisational structure with respect to functioning of ULBs in the state is as shown
below:

21
Figure 3. 1: Organisational Structure with Respect to Functioning of ULBs In Karnataka State
Source: Report of the Comptroller and Auditor General of India on Local Bodies. Report 2009
Link:
https://cag.gov.in/webroot/uploads/download_audit_report/2009/Karnataka_Local_Bodies_200
9-10.pdf
3.1.1. Functions
After the enactment of the 74th CAA, the State Government through amendments to KM
& KMC Acts transferred 17 out of 18 functions to ULBs. The only function not
transferred was Fire Services. Though all the devolved functions were to be made
mandatory, the state further classified these functions as obligatory and discretionary.
Out of the 17 functions, 12 were obligatory and 5 were discretionary functions for City
Corporations, whereas it was 11 obligatory and 6 discretionary functions for all the
other categories of ULBs (Obligatory and discretionary functions from both the KM and
KMC Acts have been enclosed in Annexure - 1).
Apart from urban local bodies, there are a host of other parastatal bodies and state
departmental agencies that are involved in the planning and implementation of urban
services. This is particularly true in metropolitan cities where there are separate
government agencies dealing with water supply and sewerage, transport, land and
infrastructure development. For example, in the case of Bangalore, there are far too
many parallel urban governance organisations—the local body, the BBMP, the
Bangalore Water Supply and Sewerage Board (BWSSB), the Bangalore Development
Authority (BDA), the Bangalore Metropolitan Regional Development Authority
(BMRDA), to name a few are competing for political space. This multi-institutional
structure has led to a lack of holistic approach to urban development.
22
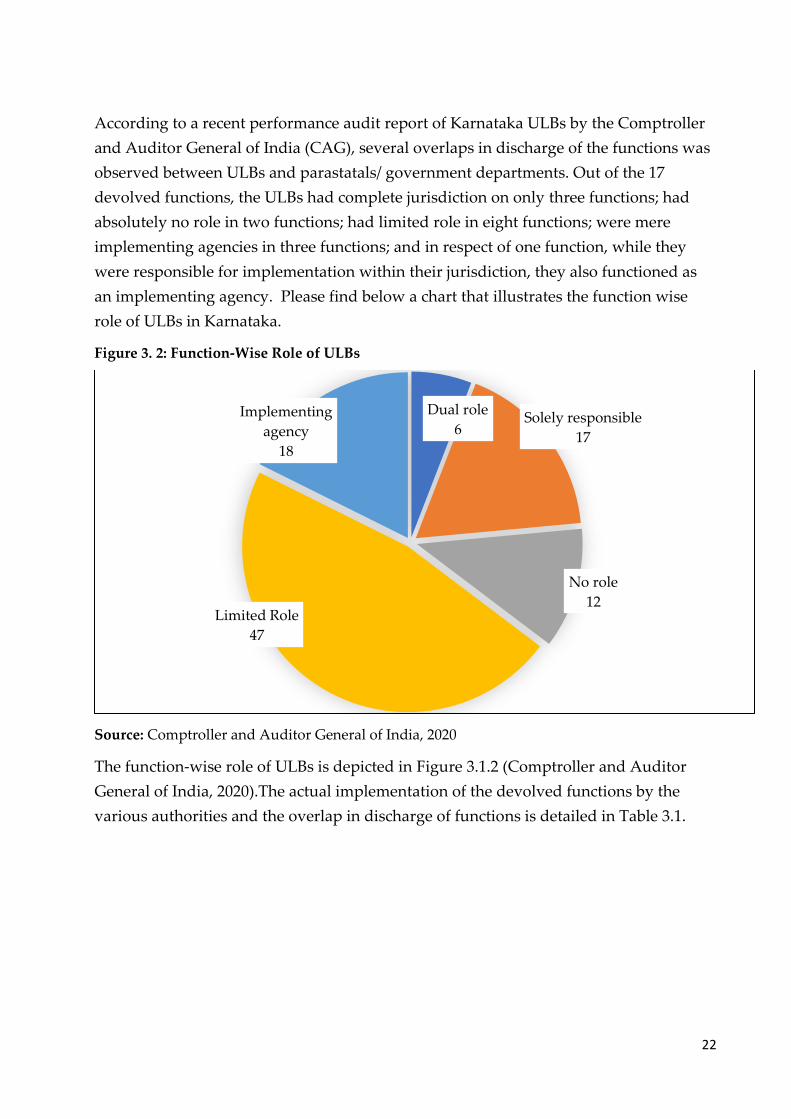
According to a recent performance audit report of Karnataka ULBs by the Comptroller
and Auditor General of India (CAG), several overlaps in discharge of the functions was
observed between ULBs and parastatals/ government departments. Out of the 17
devolved functions, the ULBs had complete jurisdiction on only three functions; had
absolutely no role in two functions; had limited role in eight functions; were mere
implementing agencies in three functions; and in respect of one function, while they
were responsible for implementation within their jurisdiction, they also functioned as
an implementing agency. Please find below a chart that illustrates the function wise
role of ULBs in Karnataka.
Figure 3. 2: Function-Wise Role of ULBs
Source: Comptroller and Auditor General of India, 2020
The function-wise role of ULBs is depicted in Figure 3.1.2 (Comptroller and Auditor
General of India, 2020).The actual implementation of the devolved functions by the
various authorities and the overlap in discharge of functions is detailed in Table 3.1.
Dual role
6Solely responsible
17
No role
12Limited Role
47
Implementing
agency
18

23
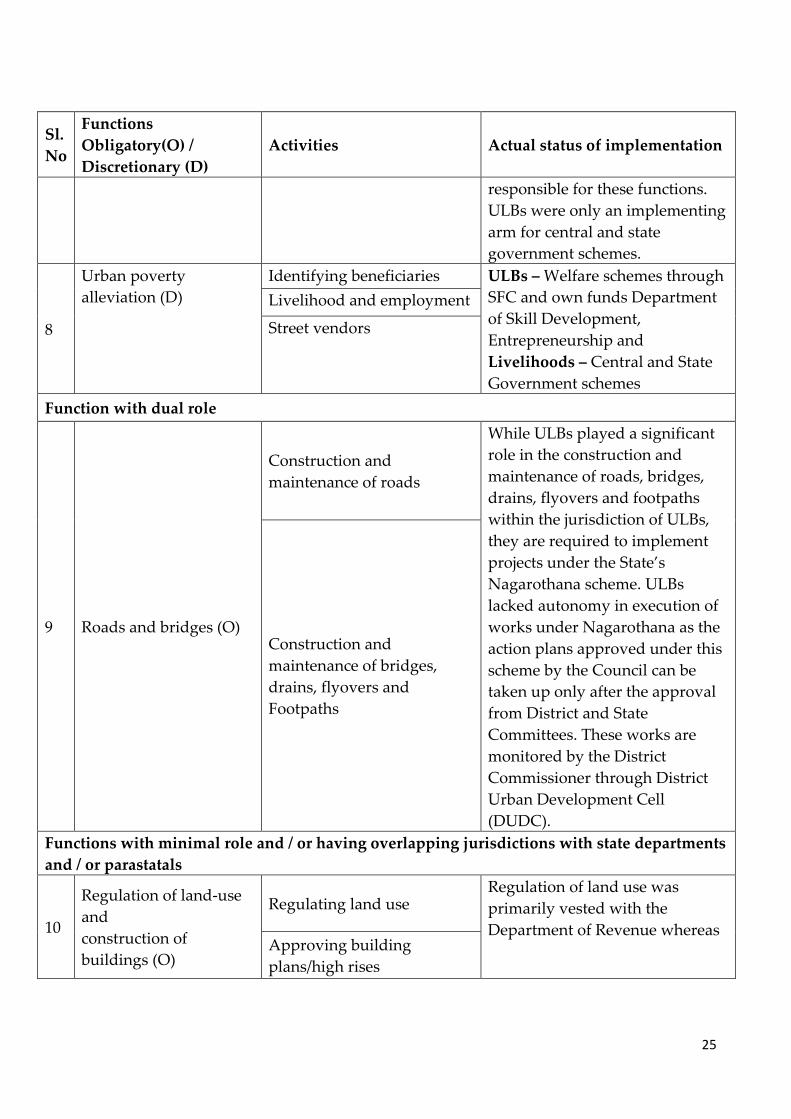
Table 3. 1: Showing the Actual Implementation of Functions
Sl.
No
Functions
Obligatory(O) /
Discretionary (D)
Activities Actual status of implementation
Functions where ULB has full jurisdiction
1
Burials and burial
grounds; cremations,
cremation grounds (O)
Construction and O&M of
crematoriums and burial
grounds and electric
crematoriums
ULBs were wholly responsible
for discharging this function
2
Cattle pounds;
prevention of cruelty to
animals (O)
Catching and keeping strays
ULBs were wholly responsible for
discharging this function
Sterilisation and anti-rabies
Ensuring animal safety
3
Regulation of slaughter
houses and tanneries
(O)
Ensuring quality of animals
and meat ULBs were wholly responsible
for discharging this function Disposal of waste
O & M of slaughter houses
Functions with no role for ULBs
4
Urban planning
including town
planning (O)
Master Planning /
Development Plans / Zonal
Plans
Master plans prepared by
UDAs/TPAs. Members of ULBs
and Executive heads are
nominated to the Planning
authority.
Enforcing master planning
Regulations Enforcement is by UDA/TPA.
Enforcing building byelaws
and licenses
ULBs role is limited to issue and
renewal of building licenses
Group Housing,
Development of Industrial
areas
ULBs role is to identify
beneficiaries for group housing.
5 Slum improvement and
upgradation (D)
Identifying beneficiaries ULBs have no role in Slum
improvement and upgradation
Affordable Housing
Upgradation

24
Sl.
No
Functions
Obligatory(O) /
Discretionary (D)
Activities Actual status of implementation
ULBs as mere implementing agencies
6
Planning for economic
and
Social development (O)
Program implementation for
economic activities
ULBs - Implementation of
Welfare schemes in sectors such
as Housing, Employment, Health,
Education and Basic necessities
by reserving 34.35% of both the
SFC untied grants and own
revenue of the ULBs. The funds
are allocated at 24.10% for SC/ST,
7.25% for OEWS (Other
Economically Weaker Sections)
and 3% for differently abled
persons in the ratio of 40:60
between individual welfare
activities and community
development. The State
Government issues the guidelines
for implementation of these
schemes.
Social Welfare Department –
Safeguarding welfare of SC/ST
and other weaker sections of the
population, implementation of
various programmes and
schemes for the upliftment of
SC/ST for their socio-economic
and educational advancement,
implementation of Special
Component Plan and Tribal Sub
Plan schemes, various
scholarships and maintenance of
hostels.
Policies for social
development
7
Safeguarding the
interests of weaker
sections of society,
including the
handicapped and
mentally retarded (D)
Identifying beneficiaries State departments such as Social
welfare, Tribal welfare,
Empowerment of Differently
abled and senior citizens and
parastatal such as Rajiv Gandhi
Rural Housing Corporation were
Providing tools/benefits
such as tricycles
Housing programs
Scholarships
25
Sl.
No
Functions
Obligatory(O) /
Discretionary (D)
Activities Actual status of implementation
responsible for these functions.
ULBs were only an implementing
arm for central and state
government schemes.
8
Urban poverty
alleviation (D)
Identifying beneficiaries ULBs – Welfare schemes through
SFC and own funds Department
of Skill Development,
Entrepreneurship and
Livelihoods – Central and State
Government schemes
Livelihood and employment
Street vendors
Function with dual role
9 Roads and bridges (O)
Construction and
maintenance of roads
While ULBs played a significant
role in the construction and
maintenance of roads, bridges,
drains, flyovers and footpaths
within the jurisdiction of ULBs,
they are required to implement
projects under the State’s
Nagarothana scheme. ULBs
lacked autonomy in execution of
works under Nagarothana as the
action plans approved under this
scheme by the Council can be
taken up only after the approval
from District and State
Committees. These works are
monitored by the District
Commissioner through District
Urban Development Cell
(DUDC).
Construction and
maintenance of bridges,
drains, flyovers and
Footpaths
Functions with minimal role and / or having overlapping jurisdictions with state departments
and / or parastatals
10
Regulation of land-use
and
construction of
buildings (O)
Regulating land use Regulation of land use was
primarily vested with the
Department of Revenue whereas Approving building
plans/high rises
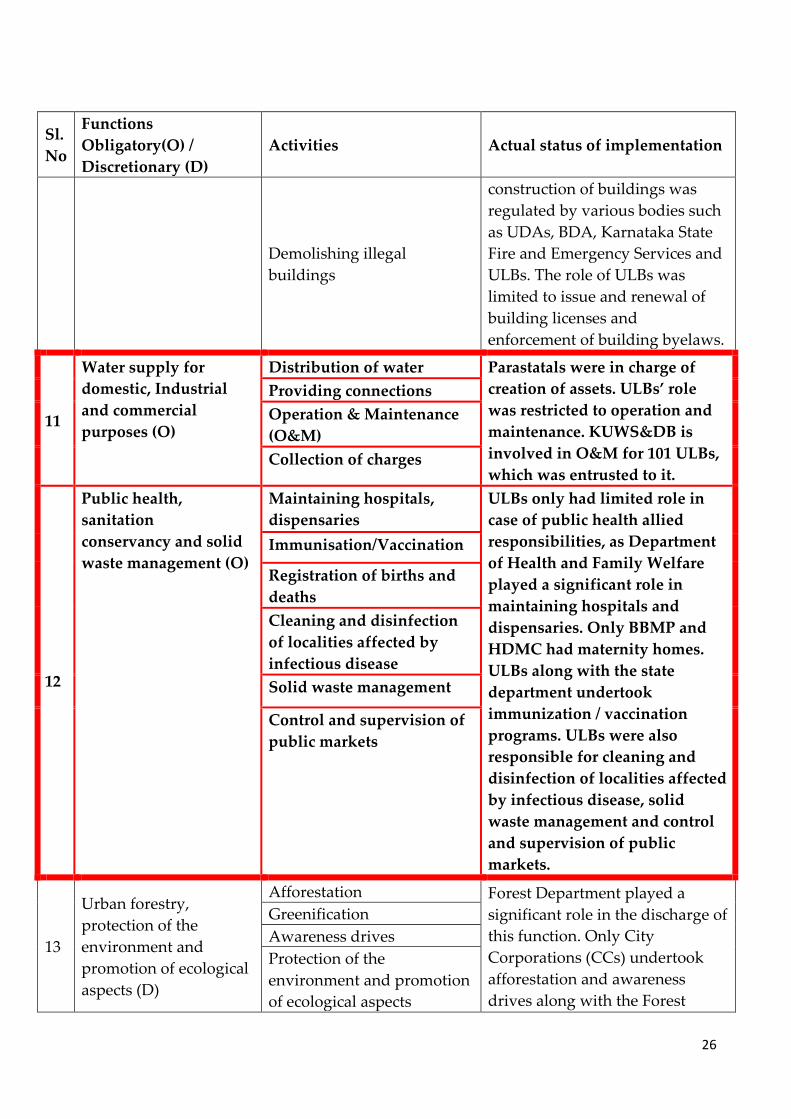
26
Sl.
No
Functions
Obligatory(O) /
Discretionary (D)
Activities Actual status of implementation
Demolishing illegal
buildings
construction of buildings was
regulated by various bodies such
as UDAs, BDA, Karnataka State
Fire and Emergency Services and
ULBs. The role of ULBs was
limited to issue and renewal of
building licenses and
enforcement of building byelaws.
11
Water supply for
domestic, Industrial
and commercial
purposes (O)
Distribution of water Parastatals were in charge of
creation of assets. ULBs’ role
was restricted to operation and
maintenance. KUWS&DB is
involved in O&M for 101 ULBs,
which was entrusted to it.
Providing connections
Operation & Maintenance
(O&M)
Collection of charges
12
Public health,
sanitation
conservancy and solid
waste management (O)
Maintaining hospitals,
dispensaries
ULBs only had limited role in
case of public health allied
responsibilities, as Department
of Health and Family Welfare
played a significant role in
maintaining hospitals and
dispensaries. Only BBMP and
HDMC had maternity homes.
ULBs along with the state
department undertook
immunization / vaccination
programs. ULBs were also
responsible for cleaning and
disinfection of localities affected
by infectious disease, solid
waste management and control
and supervision of public
markets.
Immunisation/Vaccination
Registration of births and
deaths
Cleaning and disinfection
of localities affected by
infectious disease
Solid waste management
Control and supervision of
public markets
13
Urban forestry,
protection of the
environment and
promotion of ecological
aspects (D)
Afforestation Forest Department played a
significant role in the discharge of
this function. Only City
Corporations (CCs) undertook
afforestation and awareness
drives along with the Forest
Greenification
Awareness drives
Protection of the
environment and promotion
of ecological aspects

27
Sl.
No
Functions
Obligatory(O) /
Discretionary (D)
Activities Actual status of implementation
Maintenance of natural
resources like water bodies
etc.
Department. Protection of the
environment and promotion of
ecological aspects was solely
vested with the Forest Department
14
Provision of urban
amenities and facilities
such as parks, gardens,
playgrounds (O) (D)
Creation of parks and
gardens
This function was obligatory for
CCs and discretionary for other
ULBs.
ULBs - O & M of parks, gardens,
playgrounds, installation of play
and gymnasium equipment in
parks.
UDAs - Reservation of not less
than 15 % of the total area of the
layout for public parks and play
grounds and an additional area of
not less than 10 % of the total area
of the layout for civic amenities at
the time of approval of residential
layouts.
Operation and Maintenance
15
Promotion of cultural,
educational and
aesthetic aspects (D)
Schools and education Schools and education were
handled by Education
Department. BBMP was the only
ULB to run schools. ULBs along
with the State Departments such
as Kannada & Culture,
Archeology and UDAs undertake
activities allied with public space
beautification, organizing fairs
and festivals.
Fairs and festivals
Cultural buildings /
institutions
Heritage
Public space beautification
16
Vital statistics including
birth and death
registration (O)
Coordinating with hospitals
/ crematoriums etc. for
obtaining information
Both ULBs and the Department of
Health and Family Welfare
maintained database of births
and deaths. ULBs register and
issue certificates of birth and
death.
Maintaining and updating
database
17
Public amenities
including street
lighting, parking lots,
Installation and maintenance
of street lights
ULBs were in-charge of creation
and maintenance of parking lots
and public toilets and
maintenance of street lighting.
Creation and maintenance of
parking lots

28
Sl.
No
Functions
Obligatory(O) /
Discretionary (D)
Activities Actual status of implementation
bus stops and public
conveniences (O)
Creation and maintenance of
public toilets
The State Road Transport
Corporations share jurisdiction in
respect of provision of bus
shelters.
Deciding and operating bus
routes
Function not devolved
18 Fire Services
Establishing and
maintaining fire brigades This function was vested with
Karnataka State Fire and
Emergency Services Department.
Providing fire NOC /
approval certificate in
respect of high-rise
buildings
Source: Comptroller and Auditor General of India, 2020
It is important to note that almost all functions that ULBs are performing are merely
managerial, overseeing, or implementation. They have very little space in planning.
Provisioning of basic services such as water, sanitation and solid waste management
have been more or less taken over by parastatal bodies. With regard to these services,
the ULBs are largely confined to operation and maintenance. Thus, the existence of
these parastatal bodies has significantly eroded the autonomy of the ULBs in the
implementation of functions especially urban planning and regulation of land use, slum
improvement, water supply and sanitation.
Since 2003 onwards, The District Urban Development Cell (DUDC) under the control of
the Deputy Commissioner (DC) were formed to develop, formulate and implement
Central and State Government schemes in the Municipality areas in co-ordination with
ULBs. The action plans prepared by ULBs are placed before the respective Councils for
their approval and subsequently forwarded to the DCs for further approval. Only upon
approval from the DCs, ULBs invite tenders for execution of works. The system of
seeking approval by DUDC after approval by the Council is against the intention of the
74th CAA to provide autonomy to ULBs.
The state Government also has the following powers for monitoring the proper
functioning of all ULBs:
- To frame rules to carry out the purposes of KMC and KM Acts.
- To dissolve those ULBs which fail to perform or default in the performance of any of
the duties imposed on them.

29
- To cancel a resolution or decision taken by the ULBs if the state government is of the
opinion that it has not been legally passed or is in excess of the powers conferred by
provisions of the Acts.
- To regulate classification, method of recruitment, conditions of service, pay and
allowance, discipline and conduct of the staff and officers of ULBs.
3.1.2. Functionaries
As per the KM and KMC Acts, the Corporations and Municipalities consist of elected
Corporators/councillors, nominated Corporators/councillors, Member of Legislative
Assembly, Member of Legislative Council, Member of Lok Sabha, Member of Rajya
Sabha representing the constituencies which comprise wholly or partly the Municipal
area. The nominated members do not have voting power. The Mayor/President is
elected from amongst the councillors and is assisted by the Standing Committees. The
City Corporations (CCs) have four Standing Committees7 while the other types of
municipalities have only one Standing Committee. The Commissioner/Chief Officer is
the executive head of ULB. The officers of ULBs exercise such powers and perform
such functions as notified by the State Government from time to time. The executive set-
up of CCs and other ULBs are as shown below:
Table 3. 2: Executive Set-Up of City Corporations and Other ULBs
Source: Report of the Comptroller and Auditor General of India on Local Bodies. Report 2009
Link:
https://cag.gov.in/webroot/uploads/download_audit_report/2009/Karnataka_Local_Bodies_200
9-10.pdf
7 Taxation, finance and appeals; public health, education and social justice; town planning and
improvement; and accounts

30
In Karnataka, the term of office of the Mayor and Deputy Mayor in the case of CCs is
limited to only one year from the date of election. A period of one year for a Mayor
would be too little for carrying out effective reforms and there exists the possibility of
change in priorities each time there is a change in leadership. Most of the time, the
Mayor may not even get to see the projects announced by him/her reaching their
conclusion.
Karnataka has a well-established municipal cadre and has allocated training budgets
for the same. Even the selection methods for recruitment and promotions are well laid
out8. However, in accordance with the Acts, the State Government regulates the
classification, method of recruitment, conditions of service, pay and allowance,
discipline and conduct of staff and officers of ULBs. The Karnataka Municipalities
(Recruitment of Officers and Employees) Rules, 2010 and the Karnataka Municipal
Corporations (Common Recruitment of Officers and Employees) Rules, 2010, lists out
the appointing authorities for various categories of posts. The appointing authority for
Group A (high ranking officials) is the state government, The DMA is the appointing
authority for Group B and C, and the Municipal Commissioner / Deputy Commissioner
are responsible only for Group D category.
The objective of the 74th CAA was to entrust delivery of major civic functions to ULBs.
However, functions such as urban/town planning, regulation of land use, water supply
& sanitation and slum development continue to be delivered by parastatals as already
indicated in Table 3.1. These parastatals were controlled by the state government and
have their own governing bodies which do not include elected representatives of ULBs.
They are only accountable to the state government rather than the ULBs. Although
many of these parastatals had been established even before the constitutional
amendment through notifications and governed by the respective Acts, the state
government chose not to amend these Acts to ensure that they are accountable to the
ULBs. The key parastatals in services related to water supply and sanitation are:
Karnataka Slum Development Board which is responsible for slum improvement and,
Karnataka Urban Water Supply and Drainage Board (KUWS&DB) which is responsible
for water supply and underground drainage works (UGD) and Karnataka Urban
Infrastructure Development and Finance Corporation (KUIFDC) which is also
responsible for water supply, UGD and other infrastructure projects.
8 Departmental examinations –subjects, marks, percentage for passing, selection committee constitution,
weightage for other factors such as seniority etc. are given and practiced accordingly

31
A recent CAG audit report notes that there were no Municipal Councils in 210 of the
273 ULBs in the state. In the absence of an elected council, the involvement of elected
representatives in decision making and implementation which is an essential element of
democracy was missing. Further, a ULB without a council cannot be held accountable
by citizens. The CAG audit noticed that the state government had appointed
Administrators9 for these 210 ULBs. Though the Acts provided for constitution of an
advisory committee10 through notification to assist the Administrator, this was not done
in any of the ULBs. This affected the discharge of functions in matters of policy
involving public interest such as identification of eligible beneficiaries for welfare
schemes and prioritisation of development works. The Constitution provides for Wards
Committees in all Municipalities with a population of three lakh or more11. The audit
observed that Ward Committees were not constituted in any of the CCs except BBMP.
The audit also observed that ULBs neither had the powers to assess the staff
requirement nor to recruit the required staff. These powers are vested primarily with
the state government. The state government independently assessed the requirement of
staff without seeking any inputs from the ULBs. (Comptroller and Auditor General of
India, 2020).
3.1.3. Funds
The devolution of funds to ULBs is a natural corollary to the implementation of
transferred functions. The state government directly releases grants to the ULBs to
implement the devolved functions. In addition, grants are also released to implement
state and centrally sponsored schemes. After the 74th Amendment Act was
implemented, the various state finance commissions (SFCs) of Karnataka recommended
a share in the total tax revenues of the state instead of individual taxes. Hence, the ULBs
get grants from the state on the basis of the recommendations of SFC. The main sources
of income for the municipalities are derived from (a) taxes on building and lands, (b)
user charge for water supply (c) license fee for regulating the building construction
activities and fee from other trade license (d) taxes on advertisement (e) duty on certain
transfers of property. Property tax is the most important source. While power to collect
certain taxes is vested with the ULBs, powers pertaining to the rates and revisions
thereof, procedure of collection, method of assessment, exemptions, concessions, etc.
9 Sections 99 and 100 of KMC Act and sections 315 and 316 of KM Act. 10 As per Section 99(6) of KMC Act, an advisory committee shall consist of not less than fifteen
and not more than twenty-five persons who shall be qualified to become councillors under this
Act. The provisions of KM Act do not specify any such condition. 11 As per section 13H of KMC Act, Wards Committee shall be constituted by all the Corporations.
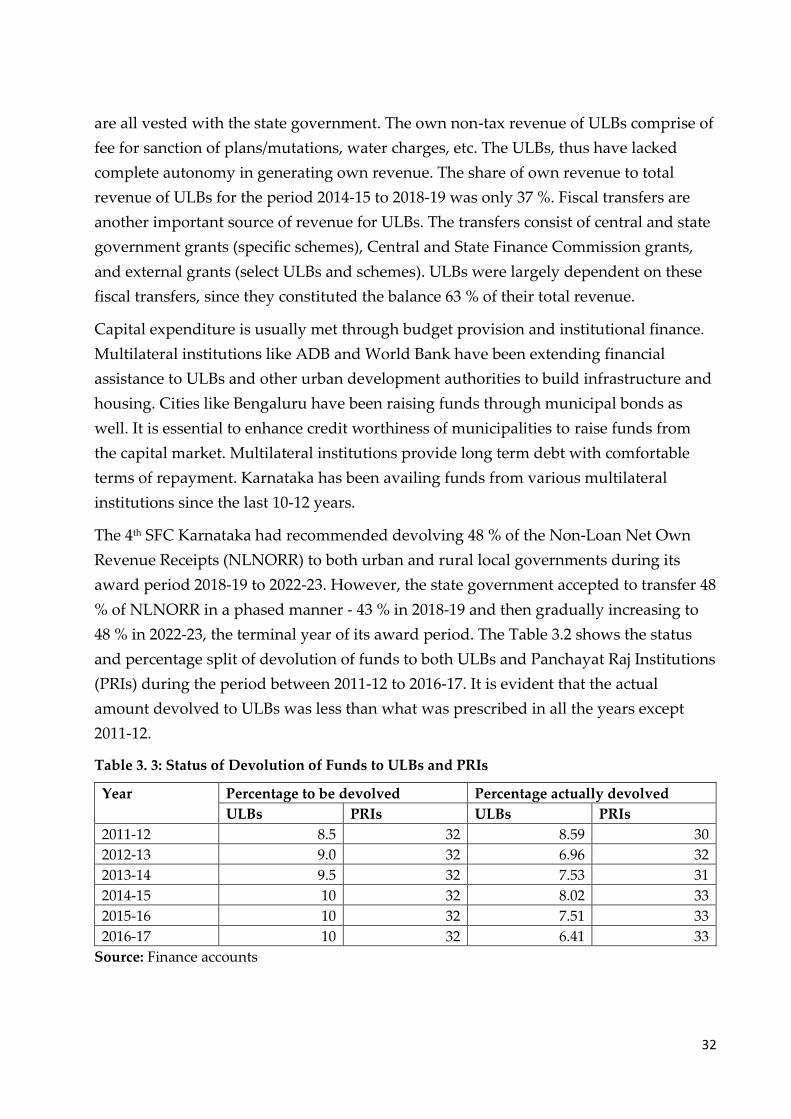
32
are all vested with the state government. The own non-tax revenue of ULBs comprise of
fee for sanction of plans/mutations, water charges, etc. The ULBs, thus have lacked
complete autonomy in generating own revenue. The share of own revenue to total
revenue of ULBs for the period 2014-15 to 2018-19 was only 37 %. Fiscal transfers are
another important source of revenue for ULBs. The transfers consist of central and state
government grants (specific schemes), Central and State Finance Commission grants,
and external grants (select ULBs and schemes). ULBs were largely dependent on these
fiscal transfers, since they constituted the balance 63 % of their total revenue.
Capital expenditure is usually met through budget provision and institutional finance.
Multilateral institutions like ADB and World Bank have been extending financial
assistance to ULBs and other urban development authorities to build infrastructure and
housing. Cities like Bengaluru have been raising funds through municipal bonds as
well. It is essential to enhance credit worthiness of municipalities to raise funds from
the capital market. Multilateral institutions provide long term debt with comfortable
terms of repayment. Karnataka has been availing funds from various multilateral
institutions since the last 10-12 years.
The 4th SFC Karnataka had recommended devolving 48 % of the Non-Loan Net Own
Revenue Receipts (NLNORR) to both urban and rural local governments during its
award period 2018-19 to 2022-23. However, the state government accepted to transfer 48
% of NLNORR in a phased manner - 43 % in 2018-19 and then gradually increasing to
48 % in 2022-23, the terminal year of its award period. The Table 3.2 shows the status
and percentage split of devolution of funds to both ULBs and Panchayat Raj Institutions
(PRIs) during the period between 2011-12 to 2016-17. It is evident that the actual
amount devolved to ULBs was less than what was prescribed in all the years except
2011-12.
Table 3. 3: Status of Devolution of Funds to ULBs and PRIs
Year Percentage to be devolved Percentage actually devolved
ULBs PRIs ULBs PRIs
2011-12 8.5 32 8.59 30
2012-13 9.0 32 6.96 32
2013-14 9.5 32 7.53 31
2014-15 10 32 8.02 33
2015-16 10 32 7.51 33
2016-17 10 32 6.41 33
Source: Finance accounts

33
Between 2015-16 and 2019-20, Karnataka had the highest per capita recommended
devolution12 by SFC’s (Rs. 6101.04) while the all-state average per capita recommended
devolution was Rs.1136.10. Transfers Recommended by SFCs as a percent of GSDP was
around 3 % for Karnataka and clearly an outlier since the all state average
recommendation was only 1.02 % of GSDP. The 4th SFC Karnataka also decided upon a
horizontal sharing of funds (between PRIs and ULBs) based on eleven indicators under
three domains which are common to both rural and urban areas: (i) Demography (net
increase in population, area, SC/ST population, Illiteracy), (ii) Decentralised
Governance, and (iii) Basic Household Amenities (2011 census). (Distribution: PRI 75%,
ULBs 25%) (CEPT University, 2013).
The CAG Audit report highlighted that ULBs had spent on an average about 69 % of
the funds available with them and as per the audit finding this was largely due to the
state government limiting the financial and administrative powers of ULBs which
hampered the utilisation of funds.
3.2. Urban Administration and Devolution of 3 Fs in Tamil Nadu
History of Urban Administration
The legal framework for urban governance prior to the 74th CAA comprised of multiple
legislations and the administrative thinking on urban governance, influenced by the
distinct histories of the city of Madras, other municipalities and the large number of
smaller towns. The Corporation of Chennai (CoC) was governed from 1919 by the
Madras Municipal Corporation Act, 1919, now known as the Chennai City Municipal
Corporation Act. Municipal corporations formed in the 1970s and 1980s had legislations
closely modelled on the Madras Municipal Corporation Act, namely Madurai (The
Madurai City Municipal Corporation Act 1971) and Coimbatore (The Coimbatore City
Municipal Corporation Act, 1981). Aside from the Municipal Corporations, larger
towns and cities in Tamil Nadu were under the jurisdiction of the District
Municipalities Act 1920. The governance of smaller towns —Town Panchayats—
evolved within a legal framework shared with villages, i.e. the Tamil Nadu Panchayats
Act, 1958. The state amended existing laws in 1994 and carried out a re-assignment of
the rural-urban for enacting conformity to the 73rd and 74th CAA at the national level.
The Tamil Nadu Panchayats Act of 1958 was amended in 1994 to constitute the
12 Devolution in Karnataka includes salaries of government staff (including teachers, health workers etc.)
placed on deputation with Zilla Panchayats, Taluka Panchayats and Gram Panchayats, over which the
latter have very little supervisory control. Most plan allocations are towards tied schemes over which the
departments maintain tight control. In fact, there is very little untied component in devolution in the State
34
conformity legislation for the 73rd Amendment, dealing only with rural areas, while
Town Panchayats were re-designated as transitional areas from rural to urban and
hence ULBs, and brought under the purview of the Tamil Nadu District Municipalities
Act, 1920. Amendments were made to the District Municipalities Act to bring it into
conformity with the 74th Amendment, with a separate chapter on Town Panchayats
inserted into the Act, and the administrative section, Directorate of Town Panchayats,
brought under the administrative control of the MAWS Department at the Secretariat.
All sections of the Act13 except sections 85, 7 12-c, 13-b, 43, 68, 77-aa and 77-b, were
made applicable to the town panchayats by a government order in 2014. The various
Municipal Corporation Acts (by this time numbering six) were amended suitably to
provide for the various provisions of the 74th CAA, essentially pertaining to ULB
structure, as was the Tamil Nadu District Municipalities Act, 1920, and also for defining
the roles of the State Election Commission (SEC) and State Finance Commission (SFC).
The SEC and the SFC were created in 1994. Elections to Local Bodies were held after a
long break in October 1996 and subsequently in 2001, 2006 and 2011 (TNSEC, n.d.).
Under state legislation, Tamil Nadu had constituted various tiers of ULBs prior to the
74th CAA. After adopting the 74th CAA in 1994, Tamil Nadu reclassified transitional
village areas as ULBs and brought them under the jurisdiction of the municipal
administration department; and streamlined income and population-based criteria for
classifying ULBs. Even though ULBs were in existence, elections had not been
conducted for the local bodies since the year 1968, except once in 1986. After the 74th
CAA, elections to local bodies were held under an independent State Election
Commission in the year 1996. Prior to 74th CAA, the state established autonomous
parastatal organisations for urban functions such as Chennai Metropolitan Water
Supply and Sewage Board, Tamil Nadu Water and Drainage Board, Chennai
Metropolitan Development Authority (CMDA), Tamil Nadu Housing Board and Tamil
Nadu Slum Clearance Board. Further, the Directorate of Town Planning was
responsible for town planning functions.
Urban Administration After the 74th Amendment
The State Legislature amended the Tamil Nadu District Municipalities Act, 1920, for
transferring the powers and responsibilities to ULBs in order to implement schemes for
economic development and social justice including those in relation to the matters listed
13 Tamil Nadu District Municipalities Act, 1920

35
in the Twelfth Schedule of the Constitution. Currently, the number and type of ULB are
as follows14:
Table 3. 4: Number and Type of ULB in Tamil Nadu
Type of ULB Number
Municipal Corporations (MC) 15
Municipalities 121
Town Panchayats (TP) 528
TOTAL 664
Source: Tamil Nadu State Election Commission
The ULBs are classified into classified into different grades based on their annual
revenues and population.
Table 3. 5: Category of ULB Based on Their Annual Revenues
Category of ULB Grade Annual Income
Municipalities
Special Grade Above Rs. 10 crores
Selection Grade Rs. 6 crore and above but below Rs. 10
crores
First Grade Rs. 4 crore and above but below Rs. 6
crores
Second Grade Below Rs. 4 crores
Total
Town Panchayats
Special Grade Above Rs. 20 lakhs
Selection Grade Above Rs. 16 lakhs but below Rs. 20 lakhs
Grade- I Above Rs. 8 lakhs but below Rs. 16 lakhs
Grade- II Above Rs. Rs. 4 lakhs but below Rs. 8 lakhs
Total
Source: (An overview of Urban Local Bodies, 2017).
For a ULB to become a municipal corporation, income must be above Rs.50 crores with
minimum population of 5 lakhs (An overview of Urban Local Bodies, 2017).
14 Tamil Nadu State Election Commission - https://tnsec.tn.nic.in/tnsec_upload/about_us/introduction.html

36
Figure 3. 3: Organisational Structure for Administration of ULBs in Tamil Nadu
Source: An overview of Urban Local Bodies, 2017
The State administration in Tamil Nadu manages the urban governance, infrastructure
and development domain through two key departments, namely Municipal
Administration and Water Supply (MAWS) Department and Housing and Urban
Development Department (HUDD). The MAWS Department is headed by an officer of
the rank of Principal Secretary, while the HUDD is headed by an officer of the rank of
Secretary. Both these key departments have a number of departments within, with clear
delineation of roles. Each of these departments is part of different ministerial portfolios
and hence ministers. While these departments function independently, it is reported
that the HUDD delegates its powers of building approval (Ground plus one level) to
ULBs, which are in turn administered by MAWS Department.
Under MAWS, there are three institutions which operate independently of each other –
Chennai City Corporation (CoC), Commissionerate of Municipal Administration
(CMA) - which handles affairs of 14 municipal corporations other than CoC and 121
municipalities and Directorate of Town Panchayats-which handles 528 town
panchayats. In all other states, C/DMA is responsible for functioning of all ULBs except
the capital city corporation, which functions independently (Capacity Building for
Urban Development project (CBUD) , 2014).
In Tamil Nadu, unlike most states, the City Corporation and Water Supply & Sewerage
Board work together. In Tamil Nadu, Municipal Administration & Water Supply
[MAWS] is headed by Secretary under whom CMA, Directorate of Town Panchayat,
Chennai Corporation, CMWSSB and TN Water & Drainage Board [TWAD] function
together.

37
Composition of Municipalities and Corporations
Municipalities comprise of a council, a chairperson and an executive authority. The
number of councillors as stipulated by the Act15 was to be decided by the State
government once in five years, but were to be not less than 20 and not more than 52.
MPs and MLAs whose constituencies fell within or overlapped with the municipality
were also members of the council, but would not have the right to vote.
Chairpersons and 43 vice-chairpersons were to be elected indirectly by, and from
among, the members of the council (excepting MPs and MLAs). Each municipality
(listed under schedule IX of the District Municipalities Act) and others notified by the
state government were to have a commissioner appointed by the state government
Municipalities can also appoint up to three standing committees for specific functions,
as well as a Taxation Appeals Committee. Special Committees comprising experts from
outside the council (number of such persons not to exceed one-third of the strength of
the committee) can be appointed by a council resolution. Wards committees can be
constituted by the state government, for one or more wards having a population of
three lakhs or more, and will comprise of the councillors from the relevant ward(s).
Joint committees comprising representatives of other local authorities can also be
constituted, with provision for outside experts (not to exceed one-third of strength of
the committee).
Amendments following the 74th Amendment, introduced wards committees into the
council structure. In 1996, the Chennai Municipal Corporation comprised, apart from
155 councillors representing the 155 wards of the city, MPs, and MLAs whose
constituencies comprised the area of the corporation, and members of Council of State
registered as electors in the area. Wards committee is to comprise of several wards and
the number of wards within a wards committee and the number of wards committees
within a corporation is to be decided by the state government. Each wards committee
would comprise all the 44 councillors of the wards included in the territorial area of the
wards committee, and a chairperson to be elected from among members of the
committee. The Mayor was, from 1996 until 2006, elected directly by voters. In 2006, an
amendment made the post, along with that of the deputy mayor, subject to indirect
election by council members. A government order issued in 1997 (GO No.27, MAWS,
dated 7 Feb 1997), stipulated rules for the constitution of Standing Committees: councils
of the corporations could constitute a maximum of 6 Standing Committees, each with a
15 The District Municipalities Act 1920.

38
minimum of 6 and a maximum of 15 councillors, of which no less than a third had to be
women, and a chairman elected by the members (THE MADRAS INSTITUTE OF
DEVELOPMENT STUDIES (MIDS), 2011).
3.2.1. Functions
The functions of Town Panchayats, Municipalities and Municipal Corporations became
as defined by the TN District Municipalities Act. The obligatory functions include:
a) Provision and maintenance of water supply; b) Provision and maintenance of street
lights; c) Provision and maintenance of public drainage; d) Provision and maintenance
of latrines; e) Arrangements for sweeping streets and removing solid waste; f) Provision
and maintenance of public streets and roads; g) Planting and maintenance of trees on
the sides of roads.
Except that in the case of the Chennai Corporation, water supply and drainage is
completely managed by the Chennai Metropolitan Water Supply and Sewerage Board
(CMWSSB) - A state level parastatal Board.
As of November 2017, out of 18 functions enlisted in the Twelfth Schedule of the
Constitution, 12 functions were devolved to the Town Panchayats (TPs) and 17
functions (except Fire Services) were devolved to the Municipalities and Municipal
Corporations by the State Government. In respect of Greater Chennai Corporation
(GCC), 13 out of 18 functions were devolved until September 2017, of which, the
function of water supply is handled by the Chennai Metropolitan Water Supply and
Sewerage Board.
While the 74th Amendment in 1993 recommended that planning be handed over as one
of the functions of ULBs, the legacy of the Town Planning Act of 1971 has remained
fairly strong in the state, in the form of specialized parastatal Metropolitan
Development Authorities, like the Chennai Metropolitan Development Authority
(CMDA) and the Directorate of Town and Country Planning (DTCP), that have kept
planning functions in the hands of bureaucrats and expert planners accountable to the
state government. The CMDA has, since the 1970s, carried out all the planning and
development functions that were supposed to be devolved to local bodies. It published
the first master plan in 1975, and the second in 2008. In recent years, the CMDA has
gradually delegated some limited powers to local bodies, as discussed in the future
sections. The DTCP was established in 1972 under the provisions of the Town and
Country Planning Act, 1971, and has performed the role of producing master plans and

39
detailed development plans, issuing building permits and licenses, and enforcing land-
use and building regulations in all local bodies across the state.
The Tamil Nadu Housing Board (TNHB) is another parastatal body created in 1961 as a
successor to the City Improvement Trust, and constituted by the Tamil Nadu Housing
Board Act, 1961. Its role is to provide affordable housing for various categories of the
population in tune with their economic status, to developing house sites and plots
across the state, and to create satellite towns and developments with the required
infrastructure (such as roads, water, sanitation, etc) in appropriate areas (THE
MADRAS INSTITUTE OF DEVELOPMENT STUDIES (MIDS), 2011).
3.2.2. Functionaries
Tamil Nadu has a well-established municipal cadre and has allocated training budgets.
Selection methods for recruitment and promotions are well laid out. Among the states
that have a municipal cadre, Tamil Nadu ranks fifth in overall performance of ULBs,
according to JNNURM Reform Score Card16 (Capacity Building for Urban Development
project (CBUD) , 2014). In 1970, Tamil Nadu adopted a series of rules for various
municipal services, which provincialized many cadres of municipal staff, bringing them
within a statutory framework for recruitment, grades and salaries, and regulating
transfers and promotions. These rules included the Tamil Nadu Municipal Town
Planning Rules, 1970; the Tamil Nadu Municipal Medical Service Rules, the Tamil
Nadu Municipal Engineering Service Rules, 1970; the Tamil Nadu Municipal General
Service Rules, 1970; and the Tamil Nadu Municipal Educational Service Rules, 1970. At
present, Tamil Nadu has a cadre of municipal officers for key roles such as chief officers
of ULBs, engineering, finance, town planning and public health. Senior positions are
recruited by the state governments which increases the attractiveness of these job
positions to potential applicants. The positions are transferable across the state which
ensures good practices are replicated across ULBs. Transfer of staff from small to large
towns also provides opportunities for career progression. However, the average
vacancy is 18.8% in key positions (STATE LEVEL BACKGROUND PAPER ON TAMIL
NADU, 2011).
The elevation of Town Panchayats (TPs) to the status of urban local bodies after 1994
created expectations of higher service levels from these bodies. The first SFC (1996),
examining these enhanced service roles of ULBs, recommended an increase in levels of
staffing for civic services, particularly in order to support O&M of existing assets. In
16 http://jnnurm.nic.in/scoring.html

40
general, the report recommended slight reduction in technical staff, but enhancement in
the semi-skilled, and unskilled staff. A special task force was formed by the first SFC to
make recommendations on restructuring of ULBs with a view to better financial
viability, efficiency and economy. Between 1996 and 1998, the government issued
orders fixing norms for enhancing the staffing levels and regularizing casual workers in
TPs. In 1998, a separate engineering wing was also created for TPs, with one Junior
Engineer (JE) appointed for seven TPs, and one AEE for a region, resulting in a total of
90 JEs and 16 AEEs for TPs. The table below shows Municipal staffing norms
recommended by the Second SFC for Tamil Nadu:
Table 3. 6: Municipal Staffing Norms in Tamil Nadu
Categories of ULBs Recommended staff per 1000 population
Chennai Corporation 3.5
All other corporations 3
Municipalities 2.5 to 3
Town Panchayaths 1.75 to 1.90
Source: State Level Background Paper On Tamil Nadu, 2011
In the case of municipalities, it was found that staffing ratios were unjustifiably high,
averaging about 3.87/1000, and going up to 6.85 in some cases. In Corporations, it was
found that the existing staff strength worked out to a ratio of 5.11 per 1000, about 71%
higher than the desired norm. Reductions were to be made by abolishing posts on
retirement of existing staff, and/or transferring them to other departments or positions
when vacancies arose. Wherever feasible, computerisation and privatization of
operations was recommended to accompany the ban on filling up new posts, and SFC
recommended a continuous review of workload and sanctioned strength in order to
“right-size” the ULBs (STATE LEVEL BACKGROUND PAPER ON TAMIL NADU,
2011).
3.2.3. Funds
The major sources of finances for ULBs in Tamil Nadu are own revenues that include
tax and non-tax revenues, and assigned revenues that include grants and loans from the
government (Entertainment tax, Surcharge on Stamp Duty and Local Cess/Local Cess
Surcharge). According to the Tamil Nadu District Municipalities Act 1920, tax revenues
that can be levied by an ULB or municipal council (as described under Sec 78, Sec 78A,
Sec 79, Sec 88, Sec 88 –A, Sec 93, Sec 98, Sec 116) are Property tax, Professional tax, tax
on carriage and animals, tax on carts, tax on advertisements other than advertisements
published in the newspaper and advertisements broadcast by radio or television, hill
41
station municipal council may also levy a tax on servants, pilgrim tax, surcharge on
transfer of Property and miscellaneous income such as income from interest on
deposits. Though there are a range of taxes that the ULB can derive its revenue from,
property tax and professional tax are the two major sources. Property Tax is the most
important tax source revenue to Urban Local Bodies, particularly in a non-Octroi State
like Tamil Nadu. According to the State Finance Commissions reports, property tax
alone constitutes anywhere between 30-60% of municipal revenues. Other taxes and
assigned revenues are Advertisement, tax on cable tv, entertainment tax and surcharge
on stamp duty.
Non-Tax Revenue Income from regulatory fees and user charges form part of Non-Tax
Revenue. A major portion of this income comes from water charges, Dangerous &
Offensive license fees (D&O), building fees, development charges, lease rental and other
fees and fines. From these incomes, a sizeable investment is made for water supply and
sewerage schemes, and water charges. In some states such as Tamil Nadu, some of
these taxes are adjunct to property tax so that the effective cost of collection is reduced.
In effect, people from different economic strata are charged at different rates for the
same level of services such as street lighting and collection of recyclable waste from
garbage scavenging (JLL India, 2018).
A sum of 1,416.82 crore was sanctioned by GoI as Fourteenth CFC grant to the ULBs in
Tamil Nadu for the year 2016-17 and the same was released by GoTN to the ULBs.
Tamil Nadu was one of the first States to set up a State Finance Commission (SFC) as
mandated by the 74th CAA. The First SFC submitted its report for the period FY 1998–
2002, the Second SFC constituted in 2001 submitted its report for the period FY 2003–
2007, the Third SFC constituted in 2006 for the period FY 2008–2012 and the Fourth SFC
for FY 2013–2017 (GoTN, 2011). The Fifth SFC for FY 2018-22, submitted in 2017 (Gupta
& Chakraborty, 2019).
The first SFC was set up in 1994 and submitted its recommendations in 1996 which
were accepted in March 1997 by the state government. Based on the SFC
recommendations, the GoTN decided to share 8% of its own tax revenues with the
ULBs. Tamil Nadu was amongst the first states to follow this approach of sharing a part
of its total revenues. This encouraged other SFCs to recommend this approach and has
now been adopted by other states. Tamil Nadu since set up four more SFCs periodically
and the share of own tax revenues to ULBs has increased to 10%. In addition, the SFCs
made important recommendations which have been accepted by the state government
such as - (i) reclassification of ULBs, (ii) incentive and equalization funds, (iii) limiting

42
salary expenditure of ULBs to less than 49% of revenues, (iv) debt relief for ULBs, (v)
property tax reforms, and (vi) award and incentive for best practices.
The devolution package provided by the State to local bodies was initially meant for
maintenance of existing assets and for those that are newly created and also for the
payment of salaries to staff of local bodies. Apart from this, An Infrastructure Gap-
Filling Fund and an Operation and Maintenance Gap-Filling Fund were also created in
order to fund the creation of new infrastructure by local bodies as well as their regular
maintenance which were essential for provision of basic services such as water supply
and sewerage. The current allocation is 3% towards the Infrastructure Gap-Filling Fund
and 2% for Operation and Maintenance Gap Filling Fund from out of the share of each
tier. These two funds have provided the much-needed scope to local bodies for the
maintenance of their assets as well as to meet certain operational expenses.
Table 3. 7: Receipts and Expenditure of ULB’s
(Rs. In crores)
2012-13 2013-14 2014-15* 2015-16* 2016-17
Own Revenue 2,467 2,957 2,875 3,364 3,776
Assigned Revenue17 1,084 1,211 1,047 1,717 1,469
Grants 4,020 4,391 4,073 5,033 5,468
Loans 323 903 772 724 1,964
Total Receipts 7,894 9,462 8,767 10,838 12,677
Revenue Expenditure 3,461 4,985 5,331 6,704 6,895
Capital Expenditure 3,117 5,107 4,954 6,750 6,406
Total Expenditure 6,578 10,092 10,285 13,454 13,301
Source: Report of the Comptroller and Auditor General of India (Local Bodies) for the year
ended March 2017
Note: * Figures differ from the figures of Audit Report 2015-16 due to furnishing of revised
figures by GCC.
The Fourth SFC, constituted in December 2009, recommended a vertical sharing ratio of
56:44 between rural and urban local bodies. GoTN accepted (June 2013) the
recommendations with modifications to adopt the vertical sharing ratio between rural
and urban local bodies at 58:42 and the horizontal sharing ratio of SFC devolution funds
at 40:31:29 among Municipal Corporations, Municipalities and Town Panchayats
respectively. The amount of SFC grants released to the ULBs during 2016-17 was
17 Ninety per cent of Entertainment Tax and 50 per cent of Surcharge on Stamp Duty collected within the
jurisdiction of the local body were assigned to the concerned local body
43
3,075.35 crore. The 5th SFC also maintained the vertical sharing ratio of 56:44. It
recommend that the composition of the divisible pool be 10% of the state’s net own tax
revenue (net of surcharge on Stamp Duty of RLBs/ULBs and other surcharges) (Gupta
& Chakraborty, 2019).
3.3. Urban Administration and Devolution of 3 Fs in Maharashtra
All ULBs in Maharashtra are governed by 4 Municipal Acts namely: 1. Mumbai
Municipal Corporation Act, 1888 (MMC Act), 2. The City of Nagpur Municipal
Corporation Act, 1948 (NMC Act), 3. Bombay Provincial Municipal Corporations Act,
1949 (BPMC Act), and 4. Maharashtra Municipal Councils, Nagar Panchayats, and
Industrial Townships Act, 1965 (hereafter The Maharashtra Municipal Councils Act).
These Acts have laid down the provisions for constitution, composition, election of
members, functions, municipal authority and staff, municipal funds, sources of
revenue, audit of ULBs i.e. the framework within which all municipal bodies are
expected to function. This framework has been then expanded, detailed out, modified
through creation of institution, practices pertaining to financial and human resources
and introduction of reporting formats.
According to the provisions in ‘The Maharashtra Municipal Councils Act 1965’, every
municipal area was classified by the state government as ‘A’ Class, ‘B’ Class or ‘C’
Class, based on their population. After the 74th CAA, municipal laws of Maharashtra
were amended by the Maharashtra Amendment Act No.41 1994, section 109 (A); as per
the Article 243Q of 74th CAA18. Accordingly, all ULBs in Maharashtra were categorized
as Municipal Corporations, Municipal Councils and Nagar Panchayats. The state
government then considered population and proportion of people engaged in non-
agricultural activities as a major criterion for the constitution of ULBs. The Maharashtra
Municipal Councils Act 1965 defines a Municipal Council and Nagar panchayat19, while
BPMC Act defines a Municipal Corporation (Annexure 3). Further, Municipal Councils
were classified into type A, B, and C based on the population (Table 3.8).
18 Article 243Q of the 74th CAA has stipulated the criteria for 3 types of ULBs. 19 See Section 3, 4, 341A and 341F the Maharashtra Municipal Councils Act 1965.

44
Table 3. 8: Types of Urban Areas According to the Municipal Acts in Maharashtra
Type Population Criteria Type of Local Body
Larger Urban Area Population more than 3,00,000 Municipal Corporation
Smaller
Urban Area
Type A Population more than 1,00,000 Municipal Council
Type B Population of more than 40,000 but
not more than 1,00,000
Type C Population of 40,000 or less but more
than 25,000
Transitional Area 10,000 to 25,000 Nagar Panchayat
Link: https://en.wikipedia.org/wiki/Local_government_in_Maharashtra
Table 3.9 shows the classification of total number of 387 ULBs of the state into
Municipal Corporations, Councils, and Nagar Panchayats (Maharashtra Pollution
Control Board, 2019).
Table 3. 9: Classification of cities of Maharashtra
Sl. No Name Statistic
1 Municipal Corporation 27 Cities
2 Municipal Council 236 Cities
3 Nagar Panchayat 124 Cities
4 Total Number of ULBs 387
Source: Annual Report on Solid Waste Management Rules, 2016
Twenty-seven Municipal Corporations have been created for urban agglomerations
having a population of more than three lakhs. The amended BPMC Act also further
categorized these corporations based on population. These categories determine the
number of councillors in the city. The 27 Municipal Corporations have been categorised
into five categories namely A+, A, B, C and D based on the criteria of population and
per capita income. At present only the Municipal Corporation of Greater Mumbai
(MCGM) falls in category of A+, 2 in category A, 3 in category B, 4 in category C and the
remaining 17 Municipal Corporations in category D. Similarly, 358 Municipal Councils
including Nagar Panchayats have been created for smaller areas and categorised based
on their population. At present there are 17 A class, 69 B class and 145 C class Municipal
Councils and 127 Nagar Panchayats in the state.
3.3.1. Functions
In view of the 74th CAA, the state Govt. of Maharashtra amended the legal provision
related to “duties and responsibility” in all four existing municipal laws in the State20.
The 18 functions under the 12th Schedule are suggestive in nature and not mandatory.
20 These have been amended under the Maharashtra Municipal Corporations and Councils (Amendment)
Act 1994 [41st Amendment Act of 1994].

45
It is the state government’s decision to treat some of them as obligatory/mandatory or
discretionary/non-mandatory functions. However, some of the functions enlisted in the
12th Schedule of 74th CAA, already existed in the municipal laws of Maharashtra even
before the enforcement of the 74th CAA.
Functions like Planning for economic and social development, Urban Forestry,
Protection of environment and ecology, Slum improvement and up gradation, Urban
Poverty Alleviation, Cattle Pounds, prevention of cruelty to animals, Public amenities
including parking lots, bus stops and Regulation of tanneries were incorporated for the
first time in the Municipal Laws after enactment of the 74th CAA. Maharashtra is one of
the very few states to have transferred all 18 subjects listed in the 12th Schedule to ULBs.
Table 3.10 details among the 18 functions, the ones considered obligatory/mandatory or
discretionary/non-mandatory according to the amendments made to the four Acts that
govern municipal functions in Maharashtra.
Table 3. 10: Status of Functions in the 12th Schedule
Sl.
No
Functions under 12th
Schedule
Mumbai
Municipal
Corporation
Act 1888
(MMC Act)
The City of
Nagpur
Municipal
Corporation Act
1948 (NMC Act)
Bombay
Provincial
Municipal
Corporation Act
1949 (BPMC Act)
Maharashtra
Municipal
Councils, Nagar
Panchayats and
Industrial
Townships Act 1965
1
Urban Planning
including Town
Planning
Obligatory Obligatory Obligatory Obligatory
2
Regulation of land use
and construction of
Building
Obligatory Obligatory Obligatory Obligatory
3 Planning for economic
and social development Obligatory Obligatory Obligatory Obligatory
4 Roads and Bridge Obligatory Obligatory Obligatory Obligatory
5
Water supply for
domestic, industrial, and
commercial purpose
Obligatory Obligatory Obligatory Obligatory
6
Public Health,
Sanitation, Conservancy
and Solid Waste
Management
Obligatory Obligatory Obligatory Obligatory
7 Fire Services Obligatory Obligatory Obligatory Obligatory
8
Urban Forestry,
Protection of
environment and
ecology
Obligatory Obligatory Obligatory Obligatory

46
Sl.
No
Functions under 12th
Schedule
Mumbai
Municipal
Corporation
Act 1888
(MMC Act)
The City of
Nagpur
Municipal
Corporation Act
1948 (NMC Act)
Bombay
Provincial
Municipal
Corporation Act
1949 (BPMC Act)
Maharashtra
Municipal
Councils, Nagar
Panchayats and
Industrial
Townships Act 1965
9
Safeguarding the interest
of weaker section
including handicapped
and mentally retarded
Discretionary Absent Absent Obligatory &
Discretionary
10 Slum improvement and
upgradation Discretionary Discretionary Discretionary Discretionary
11 Urban Poverty
Alleviation Discretionary Discretionary Discretionary Discretionary
12
Provision for urban
amenities and facilities
like parks, gardens, and
playgrounds
Discretionary Obligatory Discretionary Discretionary
13
Promotion of cultural,
educational and
aesthetics aspects
Discretionary Discretionary Discretionary Discretionary
14
Burials and burials
ground, cremation
grounds and
Electronic crematoriums
Obligatory Obligatory Obligatory Obligatory
15
Cattle Pounds,
prevention of cruelty to
animals
Absent Discretionary Discretionary Discretionary
16
Vital Statistics including
registration of births and
deaths
Obligatory Obligatory Obligatory Obligatory
17
Public amenities
including
(a) street lightening,
(b) parking lots, bus
stops
(c) public conveniences
Obligatory
Discretionary
Obligatory
Obligatory
Discretionary
Obligatory
Obligatory
Discretionary
Obligatory
Obligatory
Discretionary
Obligatory
18
a) Regulation of
slaughter houses.
b) Regulation of
tanneries
Obligatory
Discretionary
Obligatory
Discretionary
Obligatory
Discretionary
Obligatory
Discretionary
Source: Maharashtra Municipal Councils, Nagar Panchayats 233 and Industrial Townships Act,
1965
47
Functions and duties related to basic services like water supply, public health,
sanitation, conservancy and solid waste management (SWM), fire services, roads and
bridges (Function no. 4,5,6,7) are obligatory to all municipal councils and municipal
corporations. Every ULB is expected to make provision in its municipal budget and
management of human resources to deliver these services to its citizens. The state
government provides special grants to perform these functions to ULBs. Function no. 10
and 11 are related to urban poor. In all Municipal laws these functions are treated as
discretionary functions. That means for any corporation or council it is not mandatory
to perform these functions. Officials of Municipal bodies state that even though they are
willing to perform these functions, the major constraint is lack of funds. For these
functions, ULBs are mainly dependent on the Central Govt. or the State Govt. (Singh,
2011).
Any duty imposed or any function assigned under these municipal laws to these ULB’s
under this Act or any other law for the time for which it is in force, or a Corporation
which has been entrusted with the implementation of a scheme by the state government
or any other authority , the corporation may either discharge such a duty or perform
such a function or implement such schemes by itself or subject to directions given by
the state government cause it to be discharged, performed or implemented by any
agency provided that the corporation may also specify terms and conditions for such an
agency which are consistent with the terms and conditions of the state government21.
3.3.2. Functionaries
The state of Maharashtra has a well-established dedicated municipal cadre, where the
selection methods are well laid out. State Public Service Commission is the cadre
management authority for group services as well as selecting officers for all India
services. The state allocates training budgets to get the staff trained in various reputed
institutions within and outside the state and is in the process of establishing training
institutions to cater to urban development capacity building22. However, numerous
functions that are significant are being managed by different parastatal organisations in
the state in varied forms – as corporation, board, authority, etc. specifically with respect
to housing and slum rehabilitation (Capacity Building for Urban Development project
(CBUD) , 2014). Provisions for municipal staff, their appointments, appointing
authority, term for the posts and authority determining rules and regulations of service
21 Section 63-A of Mumbai Municipal Corporation Act, Section 66-A and 67-A of Bombay Provincial
Municipal Corporation Act, Section 58-B and 58-C of the city of Nagpur Corporations Act and section 77
(1-A) of the Maharashtra Municipal Councils, Nagar Panchayats and Industrial Townships Act. 22 YASHADA in Maharashtra are currently catering to urban training requirements.

48
have been specified in the Act23. The power of appointing municipal officers in all
leadership positions in corporations is either vested fully with the state government or
with different authorities like the municipal commissioner, the Brihan Mumbai Electric
Supply and Transport Committee, the Standing Committee and Education Committee
subject again to approval from the state government. All recruitments of municipal
officers and staff are carried out with the prior approval of the state government24.
3.3.3. Funds
The 74th CAA envisages that states should devolve additional taxation powers to ULBs
so as to make them financially competent for performing additional functions and
responsibilities. All the four Acts governing municipalities in the state have provisions
for ‘Imposition of compulsory and voluntary taxes.’25 ; compulsory taxes are those
which are compulsorily levied by every ULB while voluntary taxes are left to the
discretion of ULB. Tables comparing “Powers of Taxation” in all four municipal Acts,
during pre and post 74th CAA period can be found in Annexure 4. For example - prior
to the 74th CAA, there were four compulsory taxes which were levied by Nagpur
Municipal Corporation. However, by Mah.13 of 1992, section 11, a latrine or
conservancy tax, a tax for the construction and maintenance of public latrines and
water–rate were abolished. At present there are only two compulsory taxes namely
Property Tax and Cess on animals or goods that could be levied by the corporation.
(Singh, 2011).
Overall, it is seen that compulsory taxes were reduced post 74th CAA. Further it is also
seen that there is very little flexibility for ULBs in exercising the power to impose taxes.
The rates of taxes, the rules pertaining to the same are all decided by the state
government. However, the 74th CAA also provides for State Finance Commissions to
establish a sound basis for these decisions. Mumbai Municipal Corporation has no
autonomy regarding the components and rate for each component of the tax. However,
the ceilings are fairly high. Nagpur Municipal Corporation has very limited autonomy
to decide rate for Water Benefit tax and Street tax. All other municipal corporations
under the BPMC Act have sufficient autonomy compared to Mumbai and Nagpur
23 The Mumbai Municipal Corporation Act 1888 has [under sections 60A, 73A, 76A, 76B, 77,78, 78A, 78B,
78C,79, 80, 80A and 80 B] 24 In 2006, the Government of Maharashtra took a major step in bringing uniformity in the staffing pattern
of all municipal corporations except Mumbai. Until then every municipal corporation had the power to
decide all regulations related to their staff according to provisions in the said acts. 25 Section 139 of MMC Act, 1988, Section 127 of BPMC Act, 1949, Section 114 of NCMC Act 1948, Sections
105 and 108 of Maharashtra Municipal Councils, Nagar Panchayats and Industrial Townships Act.

49
Municipal corporations, especially regarding Water and Water Benefit Tax and
Sewerage Tax. However, there is no freedom or power to any municipal corporation to
levy any new component of property tax or changing the tax base. The sources of
revenue for ULBs are listed in Table 3.11.
Between 2006-07 to 2014-15, on an average own source revenue (Rents, Taxes etc.,
Income from Commercial Enterprises, Other Income) accounted for nearly 87.49 % of
the total receipts, while government grants accounted for a meagre 4.77 % of the total
receipts and loans and deposits accounted for the remaining 7.73 %.
Table 3. 11: The Various Sources of Revenues of ULBs
Item 2006-
07
2007-
08
2008-
09
2009-
10
2010-
11
2011-
12
2012-
13
2013-
14
2014-
15
Average
% Rent, taxes etc.
including octroi,
property tax and
water charges
11147
(68.74)
12094
(65.91)
12253
(51.11)
12712
(44.05)
15989
(53.05)
17800
(55.22)
19233
(51.92)
20173
(50.92)
21647
(49.93) 54.48
Government
grants
636
(3.92)
990
(5.40)
1084
(4.52)
1217
(4.22)
972
(3.23)
1198
(3.72)
1867
(5.04)
3036
(7.59)
2302
(5.31) 4.77
Commercial
enterprises
199
(1.23)
198
(1.08)
2387
(9.96)
2650
(9.18)
13
(0.04)
82
(0.25)
17
(0.05)
75
(0.19)
89
(0.21) 2.46
Deposits, loans,
etc.
640
(3.95)
2525
(13.76)
4111
(17.15)
6242
(21.63)
1280
(4.25)
1853
(5.75)
496
(1.34)
251
(0.63)
477
(1.10) 7.73
Other income 3595
(22.17)
2541
(13.85)
4138
(17.26)
6039
(20.93)
11883
(39.43)
11302
(35.06)
15433
(41.66)
16477
(41.18)
18840
(43.46) 30.55
Total 16217 18348 23973 28860 30137 32235 37046 40012 43355
Source: Report on State Finances of Maharashtra Submitted to the 15th Finance Commission
Note: Numbers in parenthesis are %
The Revenue Composition of ULB’s In Graphical Terms Is as Follows
Maharashtra is one of the few states where it’s ULBs have the capacity to provide core
services using its own resources. It can meet the entire expenditure of basic services
from the funds it raises on its own. Maharashtra has shown extensive experience in
mobilisation of resources for financing urban development. The land banking model
was developed by Magarpatta City (near Pune) with active participation of the citizens,
under which they would surrender land for an equal share in the development
company. The development company would develop and sell land for various uses and
utilise the proceeds for the development of infrastructure. Pune has used Transferable
Development Rights (TDR) for acquiring land for development, which is modelled on
the already successful experience of using TDR in Mumbai for a wide range of purposes
like road, reservation, and slum development. Likewise, e-tendering in Aurangabad has

50
resulted in a better contract awarding system and lowered the cost by 5-10% (JLL India,
2018).
The 4th SFC of Maharashtra had recommended devolution of 40 % of the state’s own tax
and own non-tax revenues to local government. The state government did not accept
the recommendation of the 4th SFC. It also did not provide reasons for not accepting the
recommendation of the Commission (Gupta & Chakraborty, 2019). In Maharashtra, it is
observed that nearly 72 % of non-plan SFC grants are united in nature. This gives ULBs
the autonomy and freedom to use the funds in a manner they deem fit. Currently most
ULBs use these funds to meet their institutional and salary expenditures. All other grant
and scheme funds (Plan funds) represent tied funding, with different degrees of
freedom of use by the ULBs (CEPT University, 2013).
3.4. Urban Administration and Devolution of 3 Fs in Telangana
The State of Andhra Pradesh was bifurcated as State of Andhra Pradesh and State of
Telangana on 2nd June 2014. Andhra Pradesh (then including Telangana) was formed in
1956 by merging the state of Andhra with the Telugu-speaking districts of the then
Hyderabad state; the municipalities in Andhra area continued to be governed by the
Andhra District Municipalities Act, 1920, whereas the municipalities belonging to the
then Hyderabad State were governed by the Hyderabad District Municipalities Act,
1956. To maintain uniformity in service provisions, a uniform municipal act for the
entire state covering both the Andhra as well as Hyderabad areas was enacted in 1965,
called the Andhra Pradesh Municipalities Act. In 2015, this Act was adapted by the
state of Telangana, and came to be known as the Telangana Municipalities Act, 1965.
In the erstwhile Hyderabad State, there were two municipal corporations, one at
Hyderabad and the other at Secunderabad and they were both governed by the
Hyderabad Municipal Corporations (HMC) Act, 1955. The two corporations were
merged in 1960 to become the Hyderabad Municipal Corporation. Subsequently, in
2007, 12 nearby municipalities around Hyderabad were merged with HMC to become
the Greater Hyderabad Municipal Corporation (GHMC) and the Hyderabad Municipal
Corporations Act, 1955 (HMC Act) was renamed as the Greater Hyderabad Municipal
Corporation Act, 1955 (GHMC Act). After the State of Telangana was formed, the
Andhra Pradesh Municipal Corporations Act, 1994 was adapted in the State and the Act
became the Telangana Municipal Corporations Act, 1994. Currently, while the
municipalities in the State are governed by the Telangana Municipalities Act, 1965, the
municipal corporations are governed by the Telangana Municipal Corporations Act,
1994 (with GHMC Act, 1955 as the mother Act).

51
As per Art. 243 Q of the Constitution of India which was introduced through the 74th
Amendment of 1992, Municipalities include Municipal Councils and Municipal
Corporations. The Government of Telangana desired to bring forth an integrated act
covering all municipalities and municipal corporations excluding GHMC, to ensure
uniform, effective and responsive governance and to meet the growing needs of people.
It was contemplated that the age-old enactments be replaced with a fresh legislation
brought out with new contents as per the felt needs of the urban population. This
resulted in the present Telangana Municipalities Act, 2019. The Act governs all
municipalities and municipal corporations in the State except the GHMC. To extend
better services to the citizens of Greater Hyderabad, the State government is looking to
enact a new GHMC Act on the lines of the Telangana Municipalities Act.
The state of Telangana has 141 ULBs/municipalities, of which 128 are Municipal
Councils (smaller urban area) and the remaining 13 are Municipal Corporations (larger
urban area)26. The power to constitute municipalities vests with the legislature of the
state. Most of the provisions, either (i) require government approval, or (ii)
implemented as prescribed (under rules issued by government). The Council or the
Corporation consists of: (i) elected members, (ii) ex-officio members and (iii) co-opted
members. The municipality is divided into wards and voters in each ward elect a
member who is called a ward member. Ex-officio members are either members of the
Legislative Assembly (MLA), representing the constituency, or members of the House
of People (MP – Lok Sabha), representing the constituency, or member of the
Legislative Council (MLC)27, or member of the Council of States (MP -Rajya Sabha). Co-
opted members are two persons in the case of Councils and three persons in the case of
Corporations and having special knowledge or experience in municipal administration,
and two persons belonging to minority community.
26 A smaller urban area or a larger urban area means such area as the Governor may, having regard to the
population of the area, the density of the population therein, the revenue generated for local
administration, the percentage of employment in non-agricultural activities, the economic importance or
such other factors as he may deem fit, specify by public notification. 27The MLCs are elected through (i) electorate of local authorities, (ii) electorate consisting of graduates, (iii)
electorate consisting of teachers and (iv) members of the Legislative Assembly; and, through (v)
nomination by Governor.

52
3.4.1. Functions
The duties and responsibilities of a municipality are covered in sections 51 to 58 of the
Telangana Municipalities Act, 2019 (Chapter IV). The functions of a municipality
include28:
• Developmental activities or urban planning, including town planning
• Regulation of land use and construction of buildings
• Construction and maintenance of roads, drains and bridges
• Water supply for domestic, industrial and commercial purposes
• Public health, sanitation, conservancy and solid waste management
• Urban forestry and urban lung spaces, protection of environment and promotion of
ecological aspects
• Slum improvement and up-gradation
• Night shelter for urban homeless
• Urban amenities and facilities such as community halls, sports complexes and bus
shelters
• Promotion of cultural, educational and aesthetic aspects
• Development of burial grounds (vaikuntadhamams) and electric crematoriums, and
arrange vaikuntarathams
• Vital statistics including registration of births and deaths
• Public amenities, including street lighting, parking spaces, bus stops and public
conveniences
• Regulation and scientific management of slaughterhouses and tanneries
• Use of Information Technology in service delivery and citizen centric services
• Census-related functions
• Any other function or responsibility entrusted by State Government from time to
time.
The functions listed in the XII Schedule of Constitution of India except planning for
economic and social development, fire services, safeguarding the interests of the weaker
sections of society, including the physically handicapped and mentally unsound,
promotion of cultural, educational and aesthetic aspects, cattle ponds and prevention of
cruelty to animals are covered in the list. Additionally, use of Information Technology
in service delivery, citizen centric services and census related functions are also
covered. The administration of a municipality rests with the municipal council, and
28 Listed in Section 52

53
other authorities like the Chairperson/ Commissioner and Ward Members have detailed
duties and responsibilities. The responsibilities as a member of Council include:
• Calling the attention of Chairperson to any grievance
• Moving resolution on any matter relating to municipal administration
• Consideration by Council and taking appropriate resolution on any matter or subject
raised or submitted by him/her.
As maybe observed, they are not specific actionable items, nor are they sector specific,
they are in-general largely managerial and administrative in nature. The duties and
responsibilities of the Commissioner are detailed in Section 53. Besides performing the
functions of the Municipality listed in section 52, the Commissioner is also responsible
to keep the municipality clean and take measures for general upkeep of sanitation
ensuring human safety. Duties and responsibilities of ward member are detailed in
section 56 and can be found in Annexure 7. Most of the functions are with respect to
provisioning and maintenance of water supply, sanitation, and waste management. It
is to be noted that, in provisioning of sanitation and waste management services, both,
the executive and deliberative wings (state appointed and elected) are equally involved
and responsible. Sections 57 and 58 are the novel features of the Act relating to
municipal functions. The municipality has to strive to transform the town into a model
town by preparing a perspective plan and delivering municipal services through online
services. For this purpose, the municipality has to:
• Adopt e-governance system for citizen services on anytime-anywhere basis for better,
speedy, accountable, and transparent administration.
• Deliver municipal services online for the convenience of citizens in a time bound
manner as per the Citizens Charter.
• Recover penalty from the person responsible for the delay, if timeline as per Citizen
Charter not adhered.
• Establish one or more Citizen Services Centres for the purpose of providing online
services, and for facilitating redressal of citizen grievances.
Sections such as these are seldom found in the legislation of other states despite several
amendments. This amounts for legal provisioning of more transparency, accountability
and time-bound delivery of services.
3.4.2. Functionaries
A well-established Municipal cadre exists in the State of Telangana. The organisational
set up dividing municipal functions into various sections and designating different

54
categories of officers and employees with different skill set-up is an inbuilt system
within the state. The creation of state common municipal service provides career
growth as well as vertical and lateral movement of officers and employees. Table 3.12
lists the various sections of municipal functions as designated by the state.
Table 3. 12: Functional Distribution in Municipality
Sl. No Section Broad functions
1 Administration To look after general administration, including meetings of
council and committees
2 Revenue To assess and collect various taxes and collection of rents from
municipal properties
3 Accounts To maintain accounts, prepare annual accounts and budget,
attend to audit of accounts
4 Public health
and sanitation
To look after sanitation, scavenging, solid waste management
and other public health related activities
5 Engineering To look after public works like roads, drains, buildings, parks
and play grounds; water supply and sewerage; and street
lighting
6 Town Planning To regulate town planning activities including land uses, lay
outs, building activities, advertisements and encroachments
7 Urban Poverty
Alleviation
(UPA)
To look after urban poverty alleviation programmes
Source: Centre for Good Governance
Link: https://www.cgg.gov.in/core/uploads//2017/07/Municipal_cadres_in_Telangana-1.pdf
There are three services which cater to the personnel requirements of municipalities in
Telangana as per the provisions of the Andhra Pradesh Municipalities Act, 1965. These
are – 1) State services that cater to both municipalities and various departments of the
state government (Sections 29 and 71). These officers are at the top of the hierarchy and
the state government is the appointing authority. 2) State municipal subordinate service
i.e. a common service consisting of mid-level officers and employees to cater exclusively
for municipalities on state-wide basis. (Section 80). In this cadre, for categories I to III,
the CDMA is the appointing authority whereas the Regional Director of Municipal
Administration is the appointing authority for categories IV to VI. 3) Municipal service
to cater to the requirements of each municipality in the lower levels of hierarchy.
(Section 73). The Chairperson of the municipality is the appointing authority for
municipal services but as per Section 75 of the Act, the state government has the power
to transfer any officer or employee of a municipality to the service of any other
municipality or local authority.

55
The commissioner specifies the duties of the officers and employees of the municipality,
exercises supervision and control, and initiates disciplinary action over them29. Figure
3.4 shows the hierarchy, and the functionaries in the executive wing, as per the Act.
Figure 3. 4: Functionaries and Hierarchy of the Executive Wing
Source: Centre for Good Governance,
Link: https://www.cgg.gov.in/core/uploads//2017/07/Municipal_cadres_in_Telangana-1.pdf
The District Collector is empowered with authority over the municipal functionaries.
He/she has the power to suspend the Commissioner or any other employee, if in
his/her opinion, the said officer has failed to carry out the duties entrusted under this
Act or for any other form of impropriety or dereliction of duties.
3.4.3. Funds
Telangana, the newest state of India, was formed out of Andhra Pradesh in June 2014. It
constituted its first SFC in December 2017. The inter-se-share of Telangana state in the
total divisible pool according to the 14th Central Finance Commission is 2.437%. The
total award to the state is Rs.1,06,344.50 crores over the five-year period (2015-16 to
2019-2020) of which Rs. 3,388 crores were allocated as grants to ULBs (approx. 3.2 %).
The following table provides the yearly break up of Urban local bodies grants allocated
to Telangana.
29 Section 48 of the Telangana Municipalities Act, 2019
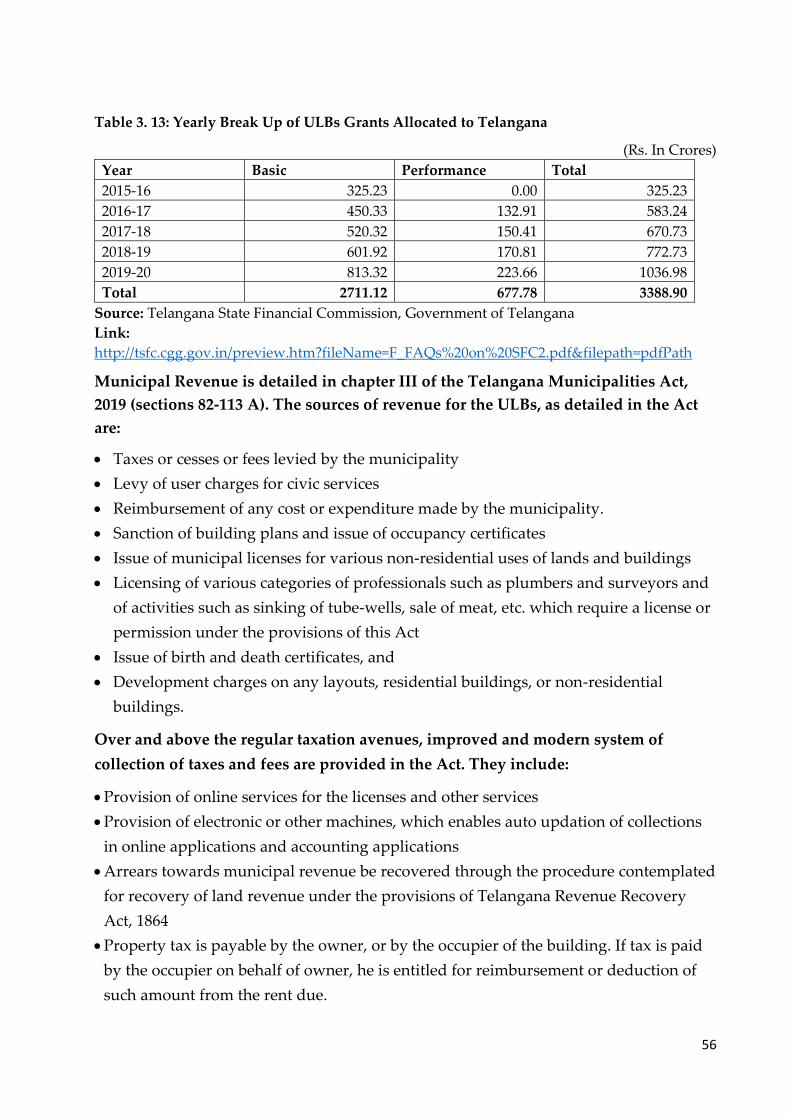
56
Table 3. 13: Yearly Break Up of ULBs Grants Allocated to Telangana
(Rs. In Crores)
Year Basic Performance Total
2015-16 325.23 0.00 325.23
2016-17 450.33 132.91 583.24
2017-18 520.32 150.41 670.73
2018-19 601.92 170.81 772.73
2019-20 813.32 223.66 1036.98
Total 2711.12 677.78 3388.90
Source: Telangana State Financial Commission, Government of Telangana
Link:
http://tsfc.cgg.gov.in/preview.htm?fileName=F_FAQs%20on%20SFC2.pdf&filepath=pdfPath
Municipal Revenue is detailed in chapter III of the Telangana Municipalities Act,
2019 (sections 82-113 A). The sources of revenue for the ULBs, as detailed in the Act
are:
• Taxes or cesses or fees levied by the municipality
• Levy of user charges for civic services
• Reimbursement of any cost or expenditure made by the municipality.
• Sanction of building plans and issue of occupancy certificates
• Issue of municipal licenses for various non-residential uses of lands and buildings
• Licensing of various categories of professionals such as plumbers and surveyors and
of activities such as sinking of tube-wells, sale of meat, etc. which require a license or
permission under the provisions of this Act
• Issue of birth and death certificates, and
• Development charges on any layouts, residential buildings, or non-residential
buildings.
Over and above the regular taxation avenues, improved and modern system of
collection of taxes and fees are provided in the Act. They include:
• Provision of online services for the licenses and other services
• Provision of electronic or other machines, which enables auto updation of collections
in online applications and accounting applications
• Arrears towards municipal revenue be recovered through the procedure contemplated
for recovery of land revenue under the provisions of Telangana Revenue Recovery
Act, 1864
• Property tax is payable by the owner, or by the occupier of the building. If tax is paid
by the occupier on behalf of owner, he is entitled for reimbursement or deduction of
such amount from the rent due.
57
The resource base of the ULBs in the state of Telangana include mainly own income
raised through taxes, service charges, license fee, penalties, earning on own assets,
sundry receipts, assigned revenues from the state government (entertainment tax,
stamp duty etc.) and grants from the state and central government. In addition to this,
ULBs are also provided loans by the state government and they are allowed to borrow
from markets through bonds for which the CDMA has been implementing independent
credit rating system which looks at their financial performance, economic growth
prospect, capital utilization, infrastructure, and reduction in dependency on the State
government grants, etc. Over the past three years (2014-15 to 2016-17) there is a
fluctuation in the cumulative expenditure and receipts of the state’s ULBs. In the year
2014-15 and 2016-17 the receipts were more than the expenditure whereas in 2015-16 the
expenditure was more than the receipts. The ULBS own revenues as a percentage of the
total revenues constantly decreased over the years from 81 % in 2014-15 to 54 % in 2016-
17 (Indian Audits and Accounts Department, 2018).
According to a study by the Administrative Staff College of India (ASCI)30, the estimated
additional financial requirement for improving the delivery of services across all the ULBs of
Telangana including the GHMC is estimated at Rs 40,720 crores over five years. As per the
findings, the current financial situation of ULBs in the state is weak and they are barely able to
cover the cost of administration, and operations and maintenance (O&M) expenditure. The
capital investment required to address the infrastructure needs cannot be financed through the
modest revenues being generated by ULBs. The study highlighted those significant reforms are
needed to address these financial needs for service delivery improvement in ULBs. These could
include improving coverage and collection efficiency of property tax, vacant land tax and other
non-tax revenues, land monetisation measures, promoting public private partnership for
amenable municipal infrastructure areas and increasing the share of assigned revenues from the
state to ULBs. GHMC has taken some proactive steps in this regard and is one of the few ULBs
in the country to have raised funds for service delivery improvement projects by selling
multiple bonds in 2018 and 201931 (Business Standard, 2019).
3.5. Urban Administration and Devolution of 3 Fs in Andhra Pradesh
When the state of Andhra was formed in 1953, by the bifurcation of the then Madras
state (now Tamil Nadu), it adopted the Madras District Municipalities Act, 1920 as the
Andhra District Municipalities Act, 1920. Later, when Andhra Pradesh was formed in
1956 by merging the state of Andhra with the Telugu-speaking districts of the then
Hyderabad state, the municipalities in Andhra area continued to be governed by the
30 The SFC had engaged ASCI to give reports and recommendations on strengthening ULB 31 Raised Rs 100 crore through an issue of municipal bonds as part of its Rs. 300 crores fund raising plan, in
2019. Raised Rs. 195 crores by selling municipal bonds in 2019.
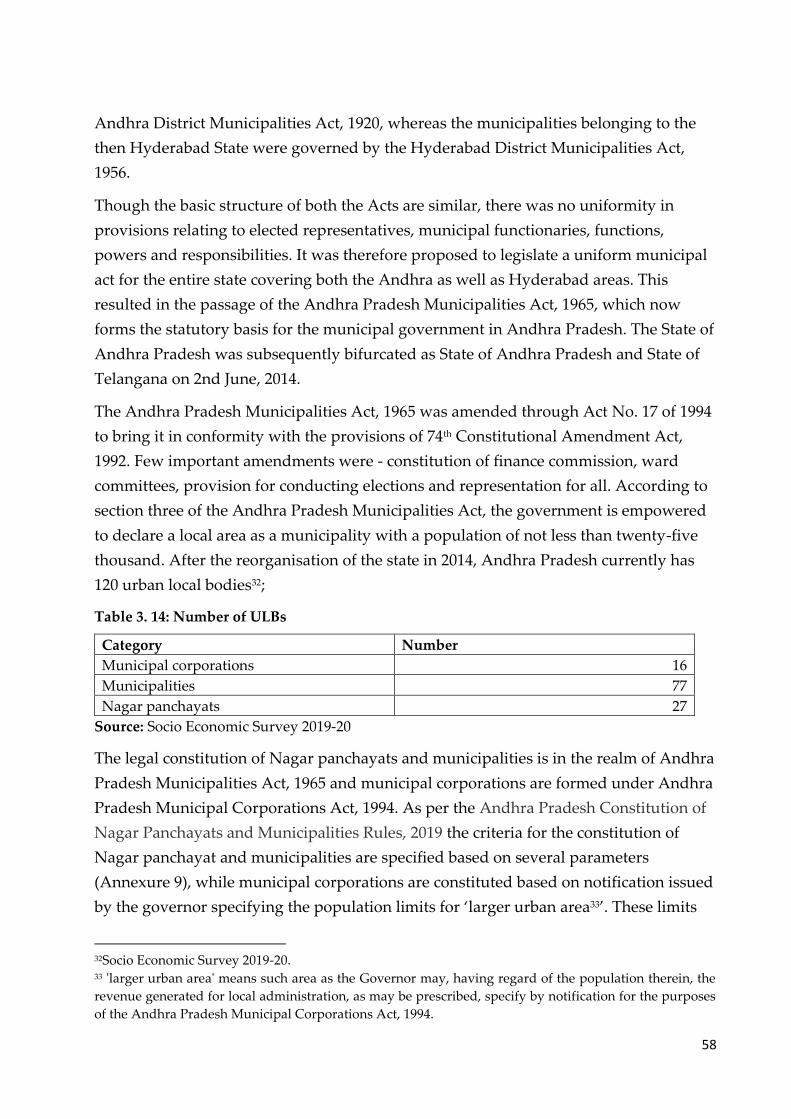
58
Andhra District Municipalities Act, 1920, whereas the municipalities belonging to the
then Hyderabad State were governed by the Hyderabad District Municipalities Act,
1956.
Though the basic structure of both the Acts are similar, there was no uniformity in
provisions relating to elected representatives, municipal functionaries, functions,
powers and responsibilities. It was therefore proposed to legislate a uniform municipal
act for the entire state covering both the Andhra as well as Hyderabad areas. This
resulted in the passage of the Andhra Pradesh Municipalities Act, 1965, which now
forms the statutory basis for the municipal government in Andhra Pradesh. The State of
Andhra Pradesh was subsequently bifurcated as State of Andhra Pradesh and State of
Telangana on 2nd June, 2014.
The Andhra Pradesh Municipalities Act, 1965 was amended through Act No. 17 of 1994
to bring it in conformity with the provisions of 74th Constitutional Amendment Act,
1992. Few important amendments were - constitution of finance commission, ward
committees, provision for conducting elections and representation for all. According to
section three of the Andhra Pradesh Municipalities Act, the government is empowered
to declare a local area as a municipality with a population of not less than twenty-five
thousand. After the reorganisation of the state in 2014, Andhra Pradesh currently has
120 urban local bodies32;
Table 3. 14: Number of ULBs
Category Number
Municipal corporations 16
Municipalities 77
Nagar panchayats 27
Source: Socio Economic Survey 2019-20
The legal constitution of Nagar panchayats and municipalities is in the realm of Andhra
Pradesh Municipalities Act, 1965 and municipal corporations are formed under Andhra
Pradesh Municipal Corporations Act, 1994. As per the Andhra Pradesh Constitution of
Nagar Panchayats and Municipalities Rules, 2019 the criteria for the constitution of
Nagar panchayat and municipalities are specified based on several parameters
(Annexure 9), while municipal corporations are constituted based on notification issued
by the governor specifying the population limits for ‘larger urban area33’. These limits
32Socio Economic Survey 2019-20. 33 'larger urban area' means such area as the Governor may, having regard of the population therein, the
revenue generated for local administration, as may be prescribed, specify by notification for the purposes
of the Andhra Pradesh Municipal Corporations Act, 1994.

59
may also be altered from time to time. The apex administrative authority of all the ULBs
is the Commissioner and Director of Municipal Administration (CDMA). The CDMA
plays a supervisory role; for which it has to co-ordinate with other departments such as
Public Health Engineering Department, Town and Country planning department, State
Audit Department, Urban Developmental Authorities, Municipal Corporations and
Water boards to enable service delivery.
The governance structure and administrative set up differ among the ULBs. While there
are 26 ULBs falling directly under the administration of Directorate of Town and
Country Planning, the remaining 94 ULBs are under various Urban Development
Authorities (UDAs). There are 16 UDAs along with two special development
authorities34. The UDAs are constituted under the Andhra Pradesh Metropolitan region
and Urban Development Authorities Act, 2016.
3.5.1. Functions
The 74th Constitutional Amendment Act, 1992 identified 18 functions in the Twelfth
Schedule of the Constitution to be devolved to ULBs by the state government. All the
functions mentioned in this schedule were devolved to ULBs in AP except ‘Fire
Services’.35 The following functions are assigned to ward committees through the
Andhra Pradesh Municipal Councils (Constitution of Wards Committees, election of
chair persons, powers and functions, etc.,) Rules, 1995. Rule 21 states the powers and
functions of these ward committees:
(i) Maintenance of sanitation;
(ii) Maintenance of water supply and drainage;
(iii) Maintenance of street lighting;
(iv) Maintenance of roads;
(v) Maintenance of markets;
(vi) Maintenance of parks and play grounds; and
(vii) Maintenance of school buildings wherever they are under the control of the
Municipality.
It may be noted that all of the functions under Rule 21 are restricted to ‘maintenance’
and ‘regulation’, rather than planning and execution. Additionally, there is no mention
of functions relating to urban and town planning or planning for economic and social
34 http://dtcp.ap.gov.in/dtcpweb/ULBS.html 35 Report of the Comptroller and Auditor General of India on local bodies. Report No.6 of 2018, Government
of Andhra Pradesh.
60
development. These are essential functions that need to be devolved to the
municipalities if local-self-governance36 needs to be implemented in its fullest spirit.
With limited scope for resource mobilization at the ULB level, infrastructure projects
(which are highly capital intensive) are carried out through national and state level
missions37, with limited autonomy of ULBs, since these grants and loans are tied to
certain reforms. These projects generally target larger towns and do not provide
coverage for ULBs with a population of less than 100,000 inhabitants leaving a
significant share of the population underserved in the state (Asian Infrastructure
Investment Bank, 2018).
The powers and functions of the commissioner and other officers as detailed in the
Andhra Pradesh Municipalities Act, 196538, largely encompass tax collection, imposition
of disciplinary action, accounts keeping, record keeping and data collection (Annexure
10). However, none of these functions directly affect urban planning. Nevertheless, all
of these functions are of prime importance in efficient governance and maintaining
overall health of the municipality. The municipal health officer is the key functionary
responsible for the management of functions such as urban sanitation and solid waste
management.
3.5.2. Functionaries
Municipal authorities charged with carrying out the provisions of the Act39 are: (a)
council; (b) a Chairperson; (c) a commissioner; (d) the Wards Committee. This
arrangement is similar to the one envisioned at the national level after the 74th CAA.
Andhra Pradesh Municipalities (Gradation of Municipal Councils and Nagar
Panchayats) Rules, 1995, classified municipalities into five grades based on their annual
income40 (Annexure 11). The gradation of municipalities was done to deploy
functionaries. For instance, it is only at the selection, special and first grade
municipalities; specialized functionaries like the Public Health Officer, Municipal
36 The term “Local Government” or “Local-self-government’ as envisioned by the 74 CAA, means the
government by freely elected local bodies which are endowed with power, discretion and responsibility to
be exercised and discharged by them, without control over their decisions by any other higher authority. 37 According to a report by AIIB in 2018, under AMRUT, 55 water supply projects (USD388 million), 25
sewerage projects (USD120 million), seven stormwater drains (USD53.8 million) and nine parks at (USD14
million) are under implementation in AP. A World Bank funded project, covering water supply systems in
6 ULBs (USD161 million) is nearing its completion. 38 Chapter III, Section 56 of the Andhra Pradesh Municipalities Act, 1965, details the powers and functions
of commissioner and other officers. 39 Chapter II, Section 4 of the Andhra Pradesh Municipalities Act, 1965, lists the municipal authorities. 40 “Annual Income of the Municipality" means, the amount realised through all sources during the last
financial year except teaching grants and loans.

61
Engineer, Town Planning Officer and Revenue Officer (all belonging to the state cadre)
are appointed. In the smaller municipalities, the locally recruited, sanitary inspector,
municipal supervisors and others attend to these tasks (Kannaiah, 2013).
The state of Andhra Pradesh has a well-established, dedicated municipal cadre. The
reforms contemplated under AMRUT on ‘constitution and professionalization of
municipal cadre’ has been functional in the state of Andhra Pradesh41. It is well tested
and is in operation for the last 2‐3 decades effectively. Three milestones under the
reform, which are (i) establishment of municipal cadres, (ii) cadre‐linked training, and
(iii) right‐sizing the number of municipal functionaries is already in place in the state.
The organisational set up of dividing municipal functions into various sections and
designating different categories of officers and employees with different skill set‐up is
an inbuilt system in the state. Roles and responsibilities of various functionaries have
been defined and norms for the creation of posts in different sections have also been
notified by the state govt. through the ‘Manual of Roles and Responsibilities of Various
Functionaries in Urban Local Bodies in AP,2009’. Functionaries are created for each of
the sections provided to municipalities, as shown in Table 3.15 Apart from efficient
division of roles, the creation of state common municipal service provides career
growth as well as vertical and horizontal movement of officers and employees (Centre
for Good Governance, 2017).
Table 3. 15: Sections in Municipalities in Andhra Pradesh
Sl.
No Section Broad functions
1 Administration To look after general administration, including meetings of council
and committees
2 Revenue To assess and collect various taxes and collection of rents from
municipal properties
3 Accounts To maintain accounts, prepare annual accounts and budget, attend
to audit of accounts
4 Public health
and sanitation
To look after sanitation, scavenging, solid waste management and
other public health related activities
5 Engineering To look after public works like roads, drains, buildings, parks and
play grounds; water supply and sewerage; and street lighting
6 Town Planning To regulate town planning activities including land uses, lay outs,
building activities, advertisements and encroachments
41 11 reforms including milestones and implementation timelines have been set under AMRUT Mission.
One of the reforms (No.2) reads as ‘constitution and professionalization of municipal cadre’.

62
Sl.
No Section Broad functions
7
Urban Poverty
Alleviation
(UPA)
To look after urban poverty alleviation programmes
Source: Manual of Role and Responsibilities of various functionaries in Urban Local Bodies in
Andhra Pradesh, 2009. Centre for Good Governance
Link: https://cgg.gov.in/core/uploads/2017/07/Rolesresponsibilities-of-ULB-functionaries1.pdf
3.5.3. Funds
According to the recommendations made by the 3rd State Finance Commission (SFC) of
Andhra Pradesh, the definition of divisible or sharable pool of resources is not
specified, instead the devolution is decided by assessing the needs of local bodies by
way of grants and assignments, in order to fill the gap between expenditure demand
and revenue demand. As per the 14th Finance Commission, GoI have allocated an
amount of nearly Rs. 3635 crores to Urban Local Bodes in the State of Andhra Pradesh.
Out of which basic grant allocated to Urban Local Bodies is around Rs. 2908 crores (80
%) and performance grant is approximately Rs.727 crores (20 %) which are used to
disburse grants to Urban Local Bodies (ULBs) based on their performance on 28 SLB
indicators (Government of Andhra Pradesh, 2016).
Taxes that can be levied by the municipality42, are: (i) property tax; (ii) tax on carriages
and carts; and (iii) tax on animals. The council may, by resolution and with the previous
sanction of the state government also levy a tax on advertisements. Additionally, the
government can by notification levy new taxes. The method of assessment of property
tax and rate needs to be determined by the municipality. It is one of the most important
sources of own revenue for the Andhra Pradesh state municipalities. AP is one of the
very few states where the own revenue of ULBs account for more than 50 % of their
total revenues (58.5 %) (National Institute of Public Finance and Policy, 2011).
ULBs in AP have been facing several challenges as they are not truly independent and
remain incapable of maintaining and delivering services. The cities are largely being
governed by the state appointed bureaucrats or agencies (ASICS, 2017). Many ULBs in
AP (For E.g. Vishakhapatnam) have not had directly elected mayors43. While it is
fundamental to have an elected municipal government with regular elections, ULBs in
42 Part 4, Chapter I, Section 81 of the Andhra Pradesh Municipalities Act, 1965 specifies the Taxes that can
be levied by municipalities. 43 V R Vachana, (2018), India’s cities without ownership: A continuing tale of deficiency, Economic and
Political Weekly.

63
AP seem to have done away with them. Vishakhapatnam district which is the most
urbanized in the state and houses a lot of urban investments has not held municipal
elections for 13 years now44. Although state wide municipal elections were conducted in
2014, the Greater Vishakhapatnam Municipal Corporation (GVMC) along with several
other municipal corporations such as Kakinada, Guntur, Kurnool, Ongole and Tirupati
did not conduct elections due to various reasons including court cases45. This shows the
pathetic state of accountability and how peoples’ representation has been suffering in
the state. With no effective elected body in place, the state appointed bureaucrats
continue to govern these cities.
The CAG audit reports have also observed huge underutilization of funds in various
projects and that ULBs of AP haven’t submitted utilization certificates for various
projects and public works, thus depriving its citizens with their intended benefits.
These lapses have been observed mainly in road works. The 2018 CAG audit report
indicates close to Rs. 75 crores of expenditure as wasteful, avoidable and infructuous.
3.6. Urban Administration and Devolution of 3 Fs in Kerala
Kerala is one of the few states in the country where a concerted attempt has been made
to ensure that local bodies can function as institutions of self-governance. Citizen
engagement from the grassroots level has brought better devolution of local self-
governance in Kerala. Under the British rule, Kerala was divided into three areas -
Travancore and Cochin were two princely states, while Malabar was part of the Madras
Presidency. However, the social conditions in all the three areas were almost similar,
with the upper castes oppressing the lower castes. Kerala witnessed a string of social
reform movements in the late 19th and early 20th century. The reform movements at
the grassroots helped the people to understand the rights, duties and responsibilities of
the state and encouraged them to articulate their needs. These social movements played
an important role in laying a strong foundation for decentralisation in Kerala.
As early as in 1958, the Administrative Reforms Committee pushed for the need to set
up panchayats (for rural areas) and municipalities (for urban areas) and empowering
them with revenue administration and other regulatory functions. Taking into account
the recommendations of the Administrative Reforms Committee, the Kerala Panchayat
Act, 1960, the Kerala Municipalities Act, 1960 and the Kerala Corporation Act, 1961
44https://www.thehindu.com/news/cities/Visakhapatnam/gvmc-to-go-to-elections-on-march-23-after-a-
long-gap/article31027359.ece 45https://timesofindia.indiatimes.com/city/hyderabad/Civic-elections-in-AP-unlikely-this-
year/articleshow/53295453.cms

64
were passed, unifying the laws governing the local bodies in the Travancore–Cochin–
Malabar regions. However, the local self-governments (LGSs) were limited to only civic
duties. Though the successive governments in the state introduced several bills for
empowering LSGs in Kerala, all the initiatives failed to meet the desired results, as they
were poorly executed. Few decades later, the74th Constitutional Amendment stipulated
an amendment of the state laws by April 24, 1994 to conform to the constitutional
requirements on urban LSGs.
The government of Kerala considered that instead of making amendments to the
existing Kerala Municipalities Act,1960 and the Kerala Municipal Corporations Act,
1961 it would be better to enact a new Municipalities Act applicable uniformly to the
Municipal Councils, Municipal Corporations and Nagar Panchayats, incorporating the
provisions in accordance with the 74th Constitutional Amendment Act, 1992. As a result,
the Kerala Municipality (KM) Act was enacted in 1994. As per this Act, the government
shall constitute by notification of the Gazette: (a) a "Town Panchayat" for a transitional
area; (b) a "Municipal Council" fora smaller urban area; and (c) a "Municipal
Corporation" for a larger urban area, and conduct direct elections to all seats in the
municipalities. The Act mandates the establishment of either ward sabhas or ward
committees in each ward of the municipality. In case the municipality has less than one
lakh population, then every ward should form a ward sabha and every person from the
ward on the electoral roll becomes a member of this ward sabha. If the population of the
municipality is more than one lakh, then a ward committee is formed and the following
become members:
• The Councillor of the ward;
• Fifteen persons to be elected in the manner prescribed, from among the members of
the resident's association of that ward, which are registered in the municipality;
• Twenty members to be elected in the manner prescribed from among the members of
the registered neighbourhood groups of that ward which are registered in the
municipality;
• One person each nominated by every political party having representation in the
municipality;
• The Heads of all recognised educational institutions functioning in that ward;
• Twenty persons nominated jointly by the chairperson and councillor of the Ward
In both cases, the local Councillor is the chairperson/convenor of the ward Committee.
The Kerala Municipality (Constitution of Ward Committee and Procedure for Meeting)
Rules, 1995 provides further rules for the setting up and functioning of these
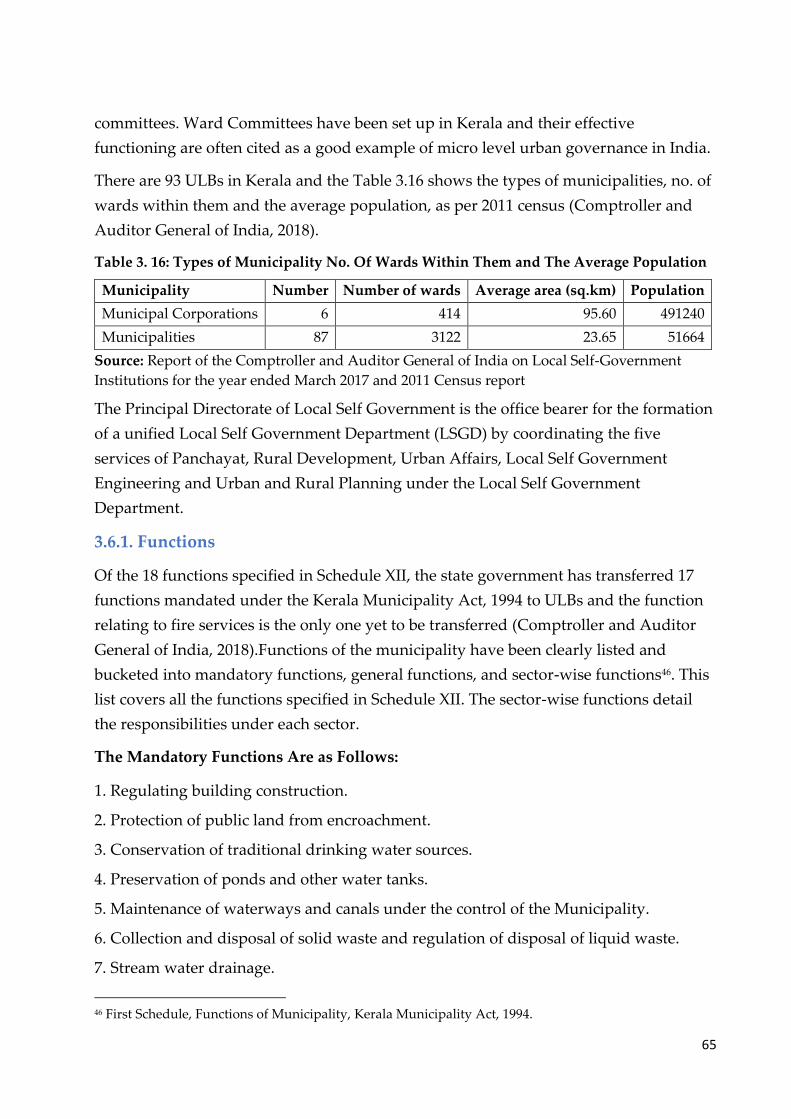
65
committees. Ward Committees have been set up in Kerala and their effective
functioning are often cited as a good example of micro level urban governance in India.
There are 93 ULBs in Kerala and the Table 3.16 shows the types of municipalities, no. of
wards within them and the average population, as per 2011 census (Comptroller and
Auditor General of India, 2018).
Table 3. 16: Types of Municipality No. Of Wards Within Them and The Average Population
Municipality Number Number of wards Average area (sq.km) Population
Municipal Corporations 6 414 95.60 491240
Municipalities 87 3122 23.65 51664
Source: Report of the Comptroller and Auditor General of India on Local Self-Government
Institutions for the year ended March 2017 and 2011 Census report
The Principal Directorate of Local Self Government is the office bearer for the formation
of a unified Local Self Government Department (LSGD) by coordinating the five
services of Panchayat, Rural Development, Urban Affairs, Local Self Government
Engineering and Urban and Rural Planning under the Local Self Government
Department.
3.6.1. Functions
Of the 18 functions specified in Schedule XII, the state government has transferred 17
functions mandated under the Kerala Municipality Act, 1994 to ULBs and the function
relating to fire services is the only one yet to be transferred (Comptroller and Auditor
General of India, 2018).Functions of the municipality have been clearly listed and
bucketed into mandatory functions, general functions, and sector-wise functions46. This
list covers all the functions specified in Schedule XII. The sector-wise functions detail
the responsibilities under each sector.
The Mandatory Functions Are as Follows:
1. Regulating building construction.
2. Protection of public land from encroachment.
3. Conservation of traditional drinking water sources.
4. Preservation of ponds and other water tanks.
5. Maintenance of waterways and canals under the control of the Municipality.
6. Collection and disposal of solid waste and regulation of disposal of liquid waste.
7. Stream water drainage.
46 First Schedule, Functions of Municipality, Kerala Municipality Act, 1994.

66
8. Maintenance of environmental hygiene.
9. Management of public markets.
10. Vector control.
11. Regulation of slaughtering of animals and sale of meat, fish and other easily
perishable
food stuffs etc.
12. Control of eating houses.
13. Prevention of food adulteration.
14. Maintenance of roads and other public properties.
15. Street lighting and its maintenance.
16. Adopt immunisation measures.
17. Effective implementation of National arid State level strategies and programmes for
prevention and control of diseases.
18. Establishment and maintenance of burial and burning grounds.
19. Issue of licenses to dangerous and offensive trades and industries.
20. Registration of births and deaths.
21. Providing bathing and washing ghats.
22. Arranging ferries.
23. Providing parking spaces for vehicles.
24. Construction of waiting sheds for travellers.
25. Providing toilet facilities and bathing ghats at public places.
26. Regulating the conduct of fairs and festivals.
27. Issue license to domestic dogs and destroy stray dogs.
28. Providing basic facilities in slum areas.
29. Amenities including foot path and road crossing facilities for pedestrians.
30. Preparation of detailed town planning and Action plan for implementation in a
phased
manner.
General functions are on the lines of data collection, awareness building, mobilising
local resources, etc., the list of which can be found in Annexure 13. In practice however
the devolution of functions to ULBs is only partial, as the Kerala Municipality Act, 1994
67
gives the state government overriding powers over ULBs. Some of the provisions of the
Act that allow the state government to prevail over ULBs are:
• Section 56: The state government may, by notification in Gazette make rule to carry
out all or any purpose of KM Act subject to approval by the State Legislature.
• Section 64: State government may dissolve LSGIs if the Government is of the opinion
that the LSGIs persistently make default in performing the duties imposed on it law.
The dissolution of the LSGIs is subject to approval by State Legislature.
• Section 57: State government may cancel a resolution or decision taken by LSGIs if it
is of the opinion that it is not legally passed or in excess of the power conferred by KM
Act/any other law or likely to endanger human life, health, public safety or communal
harmony or in violation of directions issued by Government.
• Section 58: State government has the power to issue directions to urban local bodies
in accordance with the national and state policies in matters of finance, maintenance of
accounts, office managements, selection of schemes, sites, and beneficiaries, proper
function of ward sabhas and ward committees, welfare programs, environmental
control etc.
The above provisions illustrate that ULBs in Kerala are functioning in a restrictive
setting. The result is that ULBs are unable to exercise the powers that are transferred to
them to the fullest.
3.6.2. Functionaries
The success of decentralisation lies on the deployment of staff with necessary expertise
and authority for discharging the functions that are devolved to the local bodies. Kerala
does not have a dedicated municipal cadre. ULBs in the state of Kerala have their own
staff, but the state government is responsible for staff recruitment and creation of posts.
ULB staffs are recruited through the Public Service Commission (PSC). Yet, each ULB
takes on the task of salary dispersal of its staff. Thus, in the whole recruitment process,
only the payment of salary comes under the purview of ULBs, while GoK determines
staff creation and other terms and conditions. The post of the mayor is just a ceremonial
position with limited powers. As ULBs in the state are unable to exercise their powers,
mayors enjoy only limited powers in making decisions related to local issues. The
mayor’s post is neither attractive nor lucrative in Kerala. It was only in 2016 that the
salary of the mayor was revised to Rs 15,800 from Rs 7900. The salary of councillors of a
city corporation is Rs 8200. Hence, competent candidates are not attracted to the post of
68
mayor or councillor; instead, everyone aspire to be an MLA, as the real power vests
with the state government ( Mathew & Dhanuraj, 2017).
Since urban local bodies are required to provide better urban services to the citizens and
also to ensure planned development of the urban areas, there is a need to have a
dedicated municipal cadre to meet the requirement of functional domain of the urban
local bodies. Significant increase in urban population as well as financial transactions of
ULB and implementation of urban reforms along with centrally sponsored/externally
aided projects are added responsibilities of ULBs. These challenges necessitate separate
municipal cadres in administrative, accounts, engineering and other technical services.
Creation of municipal cadre will help in improving the performance of the urban local
bodies and attract qualified people to the services. A cadre will facilitate career
opportunities for officials working in the municipalities and also sharing of best
practices across cities.
3.6.3. Funds
The funds available to ULBs in Kerala comprise of own revenues (tax and non-tax),
grants given by the state and central Governments and loans or aids. ULBs in the state
are entitled to collect property tax, professional tax, entertainment tax, advertisement
tax, service tax, surcharge, cess on conversion of land use and tax on animals, vessels,
vehicles, timber and surcharge47. The 5thstate finance commission recommended that the
composition of the divisible pool be 20% of the state’s net own tax revenue in 2016-17;
and for subsequent years to increase by 1% every year. Devolution comprises of
General Purpose Fund (GPF), Maintenance Fund and Development Fund. Each Fund
has its own distribution criteria (Gupta & Chakraborty, 2019).
Even though the Kerala Municipality Act, 1994 lays down the need to revise tax rates
regularly, it hasn’t happened for the last 20 years. This is because the state government
takes the final decision in taxation matters, while the urban local bodies only act as
implementing agencies. While there is a large scope for ULBs to increase their tax
revenue, the provisions in the Kerala Municipality Act giving excessive power to the
state government has hindered the growth of the local tax base. As per a report
submitted by the 5thState Finance Commission, own revenues of ULBs in Kerala
constitute only 32.5 % of their total revenues. It shows that ULBs are highly dependent
on the State Government for funds. The report recommends periodical revision of tax
47Section 243-X, Kerala Municipality Act: The Legislature of a State may, by law, - (a) authorise a Municipality to levy, collect and appropriate such taxes, duties, tolls and fees in accordance with such procedure and subject to such limits; (b) assign to a Municipality such taxes, duties, tolls and fees levied and collected by the State Government for such purposes and subject to such conditions and limits.

69
and non-tax revenue sources and improvement in the efficiency of tax collection as
important steps to be taken for making ULBs financially independent.
In Kerala, it’s the state government that collects most of the taxes, with only a limited
number of taxes assigned to the local bodies. Even though the Kerala Municipality Act
claims to widen the scope of ULBs in taxation, the status of ULBs in Kerala has not
changed much since 1994. The current tax domains of local governing bodies are almost
similar to those of the pre-1994 period, when resources were insufficient to meet the
responsibilities of the local bodies. This proves how ULBs are ill equipped in the matter
of taxation to execute their functions effectively.
The limited power of ULBs in taxation negatively affects their efficiency in the
collection of taxes assigned to them. This in turn negatively affects the growth rate of
own resources of ULBs. As per the Comptroller and Auditor General (CAG) report, the
growth rate of own resources of 21 ULBs in Kerala declined from 23 % in 2010-11 to 8 %
in 2013- 14. ULBs were blamed for their inefficiency in collecting taxes, as they did not
take any stringent measures to make up for the loss. However, Kerala follows a
complicated taxation structure, and ULBs in the state are only assigned agencies while
the primary control rests with the state government (Comptroller and Auditor General
of India, 2018). While ULBs in Kerala have access to funds, they are mostly tied funds,
which serve only specific purposes of the local bodies. It has been observed that these
funds are underutilised in most cases. For instance, the Cochin Municipal Corporation
spent only 20 % of its total plan allocation by the state government for the FY 2016-17 (
Mathew & Dhanuraj, 2017).
ULBs in Kerala do not access the bond market for capital, because credit rating is
mandatory for the issue of debt instruments such as municipal bonds with a maturity
exceeding 18 months. But the revenue and expenditure pattern of ULBs in Kerala48
prevents them from securing a good credit rating. Major factors that prevent the Kerala
ULBs from achieving high rating are heavy dependence on central and state grants, low
tax collection efficiency, shortage of trained and professional manpower, limited
resource mobilisation strategies and large investment requirements of the city to
48 The tax and non-tax revenues form a small proportion of the total revenue receipts of the Cochin
Municipal Corporation. There is considerable decline in the share of tax revenue to the total revenue
receipts in the five-year period. The share of non-tax revenue also declined from 0.075 in 2009-10 to 0.062
in 20 14-15. Grants still occupy the highest share (0.392) in the total revenue receipts of the Corporation.
However, a declining trend is visible even under this head. Capital expenditure (excluding the repayment
of loans) meant to create new stocks of infrastructure is also declining. The share of capital expenditure
declined from 0.55 in 2009-10 to 0.38 in 2014-15. Thus, it can be concluded that the fiscal condition of the
Cochin Municipal Corporation is deteriorating.

70
improve its urban infrastructure. Given these constraints, it will be difficult for ULBs to
enter into the debt market for mobilising resources. It is ironic that a state known for its
success in decentralisation is unable to tap the debt market due to low credit ratings.
Overall, ULBs in Kerala are struggling to improve access to municipal services owing to
significant challenges in their planning, financial and implementation systems. Further,
the ULBs continue to face a significant investment gap despite increasing fiscal transfers
due to a substantial pending backlog of municipal investments and growing risk of
natural disaster. ULBs lack adequate preparedness to be able to face natural disasters
which are on the rise as there are effectively no guidelines or systems at the local level
to incorporate urban resilience into infrastructure planning for disaster risk reduction.
Moreover, the lack of adequate manpower to design projects, manage contracts and
supervise the implementation leads to sub-optimal quality of implementation, which is
also often significantly delayed. This is also reflected in the annual performance of
ULBs, wherein on an average ULBs implemented around 50-70% of the total planned
expenditure for capital investments (Kerala Economic Review 2016).

71
Chapter 4: A Comparative Summary of Six States: Urbanisation,
State/ULB Finances & Sanitation/SWM Indicators
An attempt to summarize the six states of the study on various parameters such as
urbanization levels, size of the economy, devolution of the 3 Fs (functions, funds and
functionaries), state expenditure on water supply and sanitation as well as urban
development, indicators of municipal finances, sanitation and SWM was undertaken by
forming a matrix. The matrix consists of 60 indicators across 10 important parameters
and this gives a snapshot of the state of affairs of ULBs including the SWM and sanitation
aspects (Table 4.2)
Out of the 60 parameters across 10 important indicators, 13 parameters (listed below)
relating to sanitation were picked to form the SWM and Sanitation Index to facilitate the
comparison among the 6 states (Table 1):
1. Urban households having access to some form of latrine facilities
2. Urban households with flush/pour-flush latrine connected to a pipe sewer system
3. Urban households with no drainage system
4. Percentage of Districts verified to be ODF
5. Percentage of urban households with individual household toilet
6. Percentage of installed sewage treatment capacity to the total sewage generated in
urban areas
7. Percentage of Wards with 100% door to door waste collection
8. Percentage of wards with 100 % source segregation
9. Percentage of MSW treated against MSW generated
10. Percentage of waste processed
11. 2019 Swachh Survekshan State Ranking
12. 2019 Swachh Survekshan State Ranking in SWM (ULBs < 1 Lakh population and ULB
> 1 lakh population)
13. 2019 Swachh Survekshan State Ranking in SWM (ULBs > 1 Lakh population)
Table 4. 1: SWM and Sanitation Index and Ranking Among Six States
State Maharashtra Telangana Karnataka Tamil Nadu Andhra Pradesh Kerala
Index Value 0.79 0.55 0.52 0.50 0.43 0.12
Rank 1 2 3 4 5 6
The state of Maharashtra stood first followed by the states of Telangana and Karnataka
while the Kerala took the last position. Maharashtra ranked higher owing to the higher

72
proportion of households who are connected to sewer systems, more districts being ODF
and higher installed capacity of the sewer systems along with high ranking in Swachh
Survekshan survey. Kerala performed better in SWM but poor in terms of sewer systems.
Tamil Nadu has highest urbanisation followed by Kerala, Maharashtra and Karnataka.
All the southern states have higher urbanisation than the All-India average except
Andhra Pradesh. The growth rate of urbanisation is also higher in the southern states. All
of the southern states have devolved 17 functions while Maharashtra has devolved only
12 functions to the ULBs. While Kerala and Tamil Nadu has constituted 6th state finance
commission, the state of Karnataka and Maharashtra had their 4th and 5th SFCs
constituted. The per-capita own revenue of ULBs was highest in Maharashtra. The
percentage share of own revenues in the total revenues of the ULB was highest in
Telangana followed by Maharashtra and Andhra Pradesh. The own revenue share was
less than the all-India average in the states of Tamil Nadu Kerala and Karnataka.

73
Table 4. 2: Comparative summary of six states on Urbanisation, State/ULB Finances & Sanitation/SWM Indicators
SI. No Comparative Indicators / Parameters Source Karnataka Tamil
Nadu Maharashtra Telangana
Andhra
Pradesh Kerala India
1. State Urbanization
1.1 Percentage of Urban Population (Level of
Urbanisation)
Census, 2011 (Handbook of
Urban Statistics, 2019) 38.7 48.4 45.2 38.7 29.6 47.7 31.14
1.2
Annual Exponential Growth Rate (AEGR) of
Urbanisation from 2001 to 2011 (Rate of
Urbanization)
Census, 2011 (Handbook of
Urban Statistics, 2019) 2.74 2.39 2.12 NA 3.05 6.56 2.76
1.3 State Share of Slum Population to Total Slum
Population of India
Census, 2011 (Handbook of
Urban Statistics, 2019) 5 8.9 18.1 NA 15.6 < 1% NA
1.4 Number of Urban Local Bodies (ULBs) State Election Commission
Websites 273 728 387 73 120 93
2. State Economy
2.1 2018-19 GSDP at Current Prices (Crore Rs) /
(Rank)
Ministry of Statistics & Program
Implementation
1544399 /
(4th)
1630208 /
(2nd)
2632792 /
(1st) 861031 / (9th)
862957 /
(8th) 781653 / (11th) 19220355
2.2 2018-19 GSDP % Growth over previous year /
(Rank)
Ministry of Statistics & Program
Implementation 13.76 (5th)
11.27
(20th) 10.5 (24th) 14.33 (1st) 8.8 (28th) 11.41 (18th) 11.4
2.3 2018-19 Per Capita NSDP at Current Prices (in Rs)
/ (Rank)
Ministry of Statistics & Program
Implementation
212477 /
(5th)
193964 /
(10th)
191736 /
(11th) 204488 / (6th)
151173
(14th) 204105 / (7th) 167578
3. Devolution of the 3Fs
3.1 Number of Functions Devolved (12th Schedule) 17 17 12 17 17 17 NA
3.2 No. of municipal elections conducted since 1994
State Election Commission /
Newspaper Articles / National
Institute of Public Finance and
Policy (NIPFP) Report
4 4 5 2 4 6 (Including
Dec 2020) NA
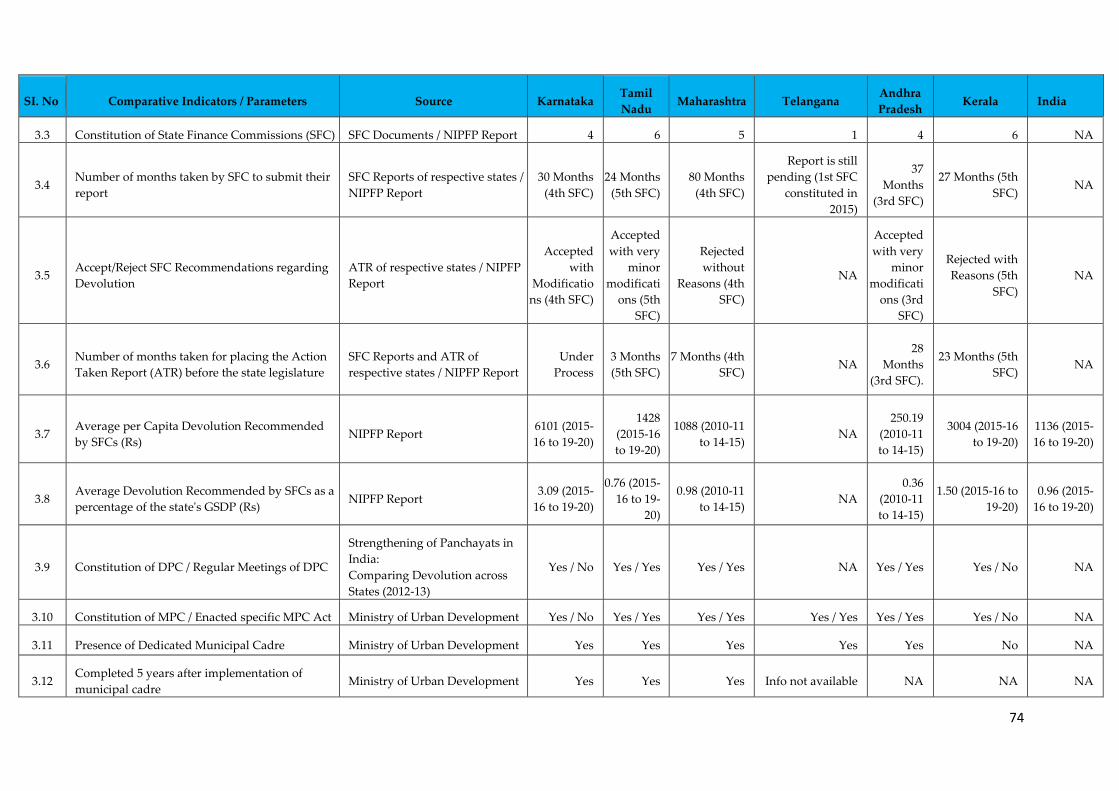
74
SI. No Comparative Indicators / Parameters Source Karnataka Tamil
Nadu Maharashtra Telangana
Andhra
Pradesh Kerala India
3.3 Constitution of State Finance Commissions (SFC) SFC Documents / NIPFP Report 4 6 5 1 4 6 NA
3.4 Number of months taken by SFC to submit their
report
SFC Reports of respective states /
NIPFP Report
30 Months
(4th SFC)
24 Months
(5th SFC)
80 Months
(4th SFC)
Report is still
pending (1st SFC
constituted in
2015)
37
Months
(3rd SFC)
27 Months (5th
SFC) NA
3.5 Accept/Reject SFC Recommendations regarding
Devolution
ATR of respective states / NIPFP
Report
Accepted
with
Modificatio
ns (4th SFC)
Accepted
with very
minor
modificati
ons (5th
SFC)
Rejected
without
Reasons (4th
SFC)
NA
Accepted
with very
minor
modificati
ons (3rd
SFC)
Rejected with
Reasons (5th
SFC)
NA
3.6 Number of months taken for placing the Action
Taken Report (ATR) before the state legislature
SFC Reports and ATR of
respective states / NIPFP Report
Under
Process
3 Months
(5th SFC)
7 Months (4th
SFC) NA
28
Months
(3rd SFC).
23 Months (5th
SFC) NA
3.7 Average per Capita Devolution Recommended
by SFCs (Rs) NIPFP Report
6101 (2015-
16 to 19-20)
1428
(2015-16
to 19-20)
1088 (2010-11
to 14-15) NA
250.19
(2010-11
to 14-15)
3004 (2015-16
to 19-20)
1136 (2015-
16 to 19-20)
3.8 Average Devolution Recommended by SFCs as a
percentage of the state's GSDP (Rs) NIPFP Report
3.09 (2015-
16 to 19-20)
0.76 (2015-
16 to 19-
20)
0.98 (2010-11
to 14-15) NA
0.36
(2010-11
to 14-15)
1.50 (2015-16 to
19-20)
0.96 (2015-
16 to 19-20)
3.9 Constitution of DPC / Regular Meetings of DPC
Strengthening of Panchayats in
India:
Comparing Devolution across
States (2012-13)
Yes / No Yes / Yes Yes / Yes NA Yes / Yes Yes / No NA
3.10 Constitution of MPC / Enacted specific MPC Act Ministry of Urban Development Yes / No Yes / Yes Yes / Yes Yes / Yes Yes / Yes Yes / No NA
3.11 Presence of Dedicated Municipal Cadre Ministry of Urban Development Yes Yes Yes Yes Yes No NA
3.12 Completed 5 years after implementation of
municipal cadre Ministry of Urban Development Yes Yes Yes Info not available NA NA NA
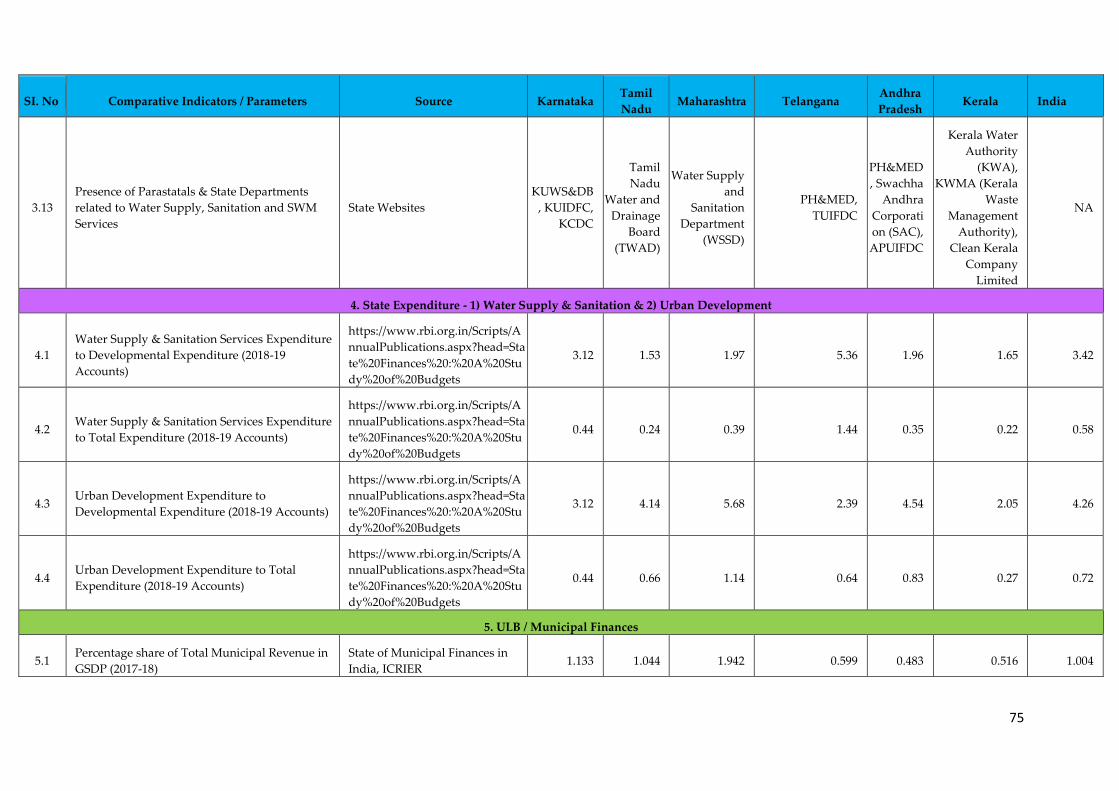
75
SI. No Comparative Indicators / Parameters Source Karnataka Tamil
Nadu Maharashtra Telangana
Andhra
Pradesh Kerala India
3.13
Presence of Parastatals & State Departments
related to Water Supply, Sanitation and SWM
Services
State Websites
KUWS&DB
, KUIDFC,
KCDC
Tamil
Nadu
Water and
Drainage
Board
(TWAD)
Water Supply
and
Sanitation
Department
(WSSD)
PH&MED,
TUIFDC
PH&MED
, Swachha
Andhra
Corporati
on (SAC),
APUIFDC
Kerala Water
Authority
(KWA),
KWMA (Kerala
Waste
Management
Authority),
Clean Kerala
Company
Limited
NA
4. State Expenditure - 1) Water Supply & Sanitation & 2) Urban Development
4.1
Water Supply & Sanitation Services Expenditure
to Developmental Expenditure (2018-19
Accounts)
https://www.rbi.org.in/Scripts/A
nnualPublications.aspx?head=Sta
te%20Finances%20:%20A%20Stu
dy%20of%20Budgets
3.12 1.53 1.97 5.36 1.96 1.65 3.42
4.2 Water Supply & Sanitation Services Expenditure
to Total Expenditure (2018-19 Accounts)
https://www.rbi.org.in/Scripts/A
nnualPublications.aspx?head=Sta
te%20Finances%20:%20A%20Stu
dy%20of%20Budgets
0.44 0.24 0.39 1.44 0.35 0.22 0.58
4.3 Urban Development Expenditure to
Developmental Expenditure (2018-19 Accounts)
https://www.rbi.org.in/Scripts/A
nnualPublications.aspx?head=Sta
te%20Finances%20:%20A%20Stu
dy%20of%20Budgets
3.12 4.14 5.68 2.39 4.54 2.05 4.26
4.4 Urban Development Expenditure to Total
Expenditure (2018-19 Accounts)
https://www.rbi.org.in/Scripts/A
nnualPublications.aspx?head=Sta
te%20Finances%20:%20A%20Stu
dy%20of%20Budgets
0.44 0.66 1.14 0.64 0.83 0.27 0.72
5. ULB / Municipal Finances
5.1 Percentage share of Total Municipal Revenue in
GSDP (2017-18)
State of Municipal Finances in
India, ICRIER 1.133 1.044 1.942 0.599 0.483 0.516 1.004

76
SI. No Comparative Indicators / Parameters Source Karnataka Tamil
Nadu Maharashtra Telangana
Andhra
Pradesh Kerala India
5.2 Per capita Total Municipal Revenue for all ULBs
(2017-18)
State of Municipal Finances in
India, ICRIER 5211.6 3971.7 8772.4 1466.1 2541.7 3822 4624.2
5.3 Per capita Total Expenditure for all ULBs (2017-
18)
State of Municipal Finances in
India, ICRIER 3198.1 3455.1 7854.2 1454.1 2540.4 2583.9 3569.9
5.4 Per capita Own Revenue for all ULBs (2017-18) State of Municipal Finances in
India, ICRIER 1393.3 1184.4 5730.4 965 1595.3 885.7 1975
5.5 Percentage share of Municipal Own Revenue in
Total Municipal Revenue for all ULBs (2017-18)
State of Municipal Finances in
India, ICRIER 26.7 29.8 65.3 65.8 62.8 23.2 42.7
6. Sanitation Indicators
6.1 Percentage of Urban Households having no
Latrine 2011 Census 15.1 24.9 28.7 NA 13.9 2.6 18.6
6.2 Percentage of Urban Households having pipe
sewer system 2011 Census 53.3 27.4 37.8 NA 33.7 14.3 32.7
6.3 Percentage of Urban Households having to
defecate in the open 2011 Census 10.7 16.2 7.7 NA 11.9 1.7 12.6
6.4 Urban households having access to some form of
latrine facilities NSSO 76th round data – 2018
95.7
93.9 98.6 98.4 97 100 96.2
6.5 Urban households with flush/pour-flush latrine
connected to a pipe sewer system NSSO 76th round data – 2018 61.3 30.3 64.2 53 9.7 1.1 39.1
6.7 Urban households with flush/pour-flush latrine
connected to a septic tank NSSO 76th round data – 2018 20.2 67.2 33.3 42.3 85.3 37.7 48.9
6.8 Urban households with flush/pour-flush latrine
connected to a single/twin pit NSSO 76th round data – 2019 15 0.5 1.9 4.3 2.8 56.4 8.7
6.9 Urban households connected to underground
drainage system NSSO 76th round data – 2018 60 41.5 71.5 79.6 59.9 43.5 53.5
6.10 Urban households with no drainage system NSSO 76th round data – 2018 3.8 8.8 2.3 2.7 9 17.5 8
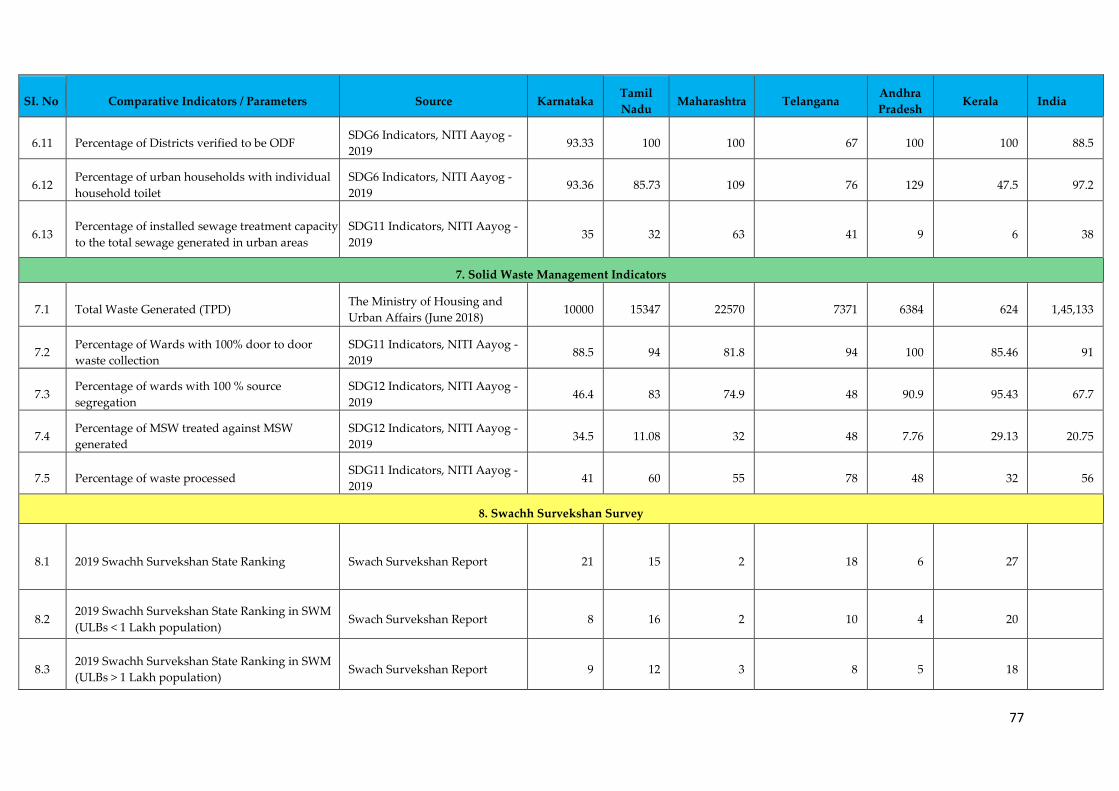
77
SI. No Comparative Indicators / Parameters Source Karnataka Tamil
Nadu Maharashtra Telangana
Andhra
Pradesh Kerala India
6.11 Percentage of Districts verified to be ODF SDG6 Indicators, NITI Aayog -
2019 93.33 100 100 67 100 100 88.5
6.12 Percentage of urban households with individual
household toilet
SDG6 Indicators, NITI Aayog -
2019 93.36 85.73 109 76 129 47.5 97.2
6.13 Percentage of installed sewage treatment capacity
to the total sewage generated in urban areas
SDG11 Indicators, NITI Aayog -
2019 35 32 63 41 9 6 38
7. Solid Waste Management Indicators
7.1 Total Waste Generated (TPD) The Ministry of Housing and
Urban Affairs (June 2018) 10000 15347 22570 7371 6384 624 1,45,133
7.2 Percentage of Wards with 100% door to door
waste collection
SDG11 Indicators, NITI Aayog -
2019 88.5 94 81.8 94 100 85.46 91
7.3 Percentage of wards with 100 % source
segregation
SDG12 Indicators, NITI Aayog -
2019 46.4 83 74.9 48 90.9 95.43 67.7
7.4 Percentage of MSW treated against MSW
generated
SDG12 Indicators, NITI Aayog -
2019 34.5 11.08 32 48 7.76 29.13 20.75
7.5 Percentage of waste processed SDG11 Indicators, NITI Aayog -
2019 41 60 55 78 48 32 56
8. Swachh Survekshan Survey
8.1 2019 Swachh Survekshan State Ranking Swach Survekshan Report 21 15 2 18 6 27
8.2 2019 Swachh Survekshan State Ranking in SWM
(ULBs < 1 Lakh population) Swach Survekshan Report 8 16 2 10 4 20
8.3 2019 Swachh Survekshan State Ranking in SWM
(ULBs > 1 Lakh population) Swach Survekshan Report 9 12 3 8 5 18

78
SI. No Comparative Indicators / Parameters Source Karnataka Tamil
Nadu Maharashtra Telangana
Andhra
Pradesh Kerala India
9. Implementation of SRMS Scheme
9.1
The number of new manual scavengers identified
as per 2013 & 2018 NSKFDC Surveys (As on
14/9/2020)
NSKFDC Website 3204 425 7378 NA 2061 600 66692
9.2
Percentage of Manual Scavengers provided with
One Time Cash Assistance / Amount in Lakh Rs
(As on 14/9/2020)
NSKFDC Website 91 / 1156 93 / 158.8 85 / 2504.4 NA 85 / 703.2 86 / 207.2 86 / 22958.4
9.3
Percentage of Manual Scavengers provided with
Capital Subsidy / Amount in Lakh Rs (As on
14/9/2020)
NSKFDC Website 5.9 / 148.63 17.6 /
18.71 0 / 0 NA 0 / 0 0 / 0 1.64 / 779.6
9.4 Percentage of Manual Scavengers provided with
Skill Development Training during FY 2018-19 NSKDFC Annual Report 2.1 76 7.7 NA 16.3 52.3 14.78
9.5 Number of sewer deaths between 1993 to 2019 NCSK Annual Report 71 203 19 4 18 3 774
10. Implementation of Swachh Bharat Mission (Urban) - Individual Household Toilets
10.1 Estimated number of Urban Households (As on
Oct 1st 2018) NSSO 76th round data – 2018 6695200 10184800 10831700 4569100 4824500 4196400 92723900
10.2 Number of Urban Households not having
Individual toilets (As on Oct 1st 2018) NSSO 76th round data – 2018 836900 2434167 2707925 1041755 1153056 247588 20770154
10.3 Number of Urban Households not having access
to any form of toilet (As on Oct 1st 2018) NSSO 76th round data – 2018 287894 621273 151644 73106 144735 0 3523508
10.4 Individual toilets (IHHL) constructed under
SBM-U between May 2019 to Jan 2020
Swachh Bharat Mission-Urban
Website 24880 13321 17586 2134 712 0 293053
10.5
Percentage of IHHL constructed to Urban
Households not having individual toilets
(Between May 2019 to Jan 2020)
2.97 0.55 0.65 0.20 0.06 0.00 1.41
10.6
Percentage of IHHL constructed to Urban
Households not having access to any form of
toilet (Between May 2019 to Jan 2020)
8.64 2.14 11.60 2.92 0.49 NA 8.32

79
Chapter 5: Analysis of Expenditures on Sanitation and Solid
Waste Management Across Six States
The expenditure on sanitation and SWM has been extracted from state budgets,
accounts of parastatals as well as the special purpose vehicles meant for the purpose
of executing the sanitation and SWM projects in the ULBs. While the expenditures
from the state budget do flow to ULBs directly in the form of general and special
grants, the expenditures from the parastatals and SPVs have many urban
development components in which the sanitation would be one of them. Extracting
the expenditure involves knowing the exact expenditures for sanitation and SWM or
arriving at expenditures through the shares in the project costs. Apart from these
expenditures incurred by the State and parastatals, the ULBs will also incur
expenditure through their own sources (tax and non-tax revenues) which can only
be ascertained from the books of the ULBs. Often the devolution meant for ULBs (as
prescribed by State Finance Commission to be shared with ULBs-and in turn
accepted by state government) are diverted to parastatals for creating assets
pertaining to sanitation and SWM in ULBs. The ULBs often do not get to know the
deductions unless it is communicated to them.
The information on sanitation and SWM expenditures available through state
budget and from the books of the parastatals presented below is limited to the
available data. The SFC reports were used for Tamil Nadu to ascertain the
expenditures of the SWM and Sanitation in the absence of the state budget
documents and expenditure through the parastatal agencies.
Compilation of the expenditures on sanitation and SWM indicated the following.
1. The interception49 of the grants meant for ULBs and transferring it to
parastatals/SPV is being done despite several state finance commissions
recommending making the payments to parastatals from ULBs. The ULBs do not
know of these deductions unless it is communicated to them
2. Often these deductions do not get reflected in the books of accounts of ULBs.
49https://www.tnurbantree.tn.gov.in/wp-content/uploads/2021/01/7188-SFC-December-2020-
Mty_0001.pdf
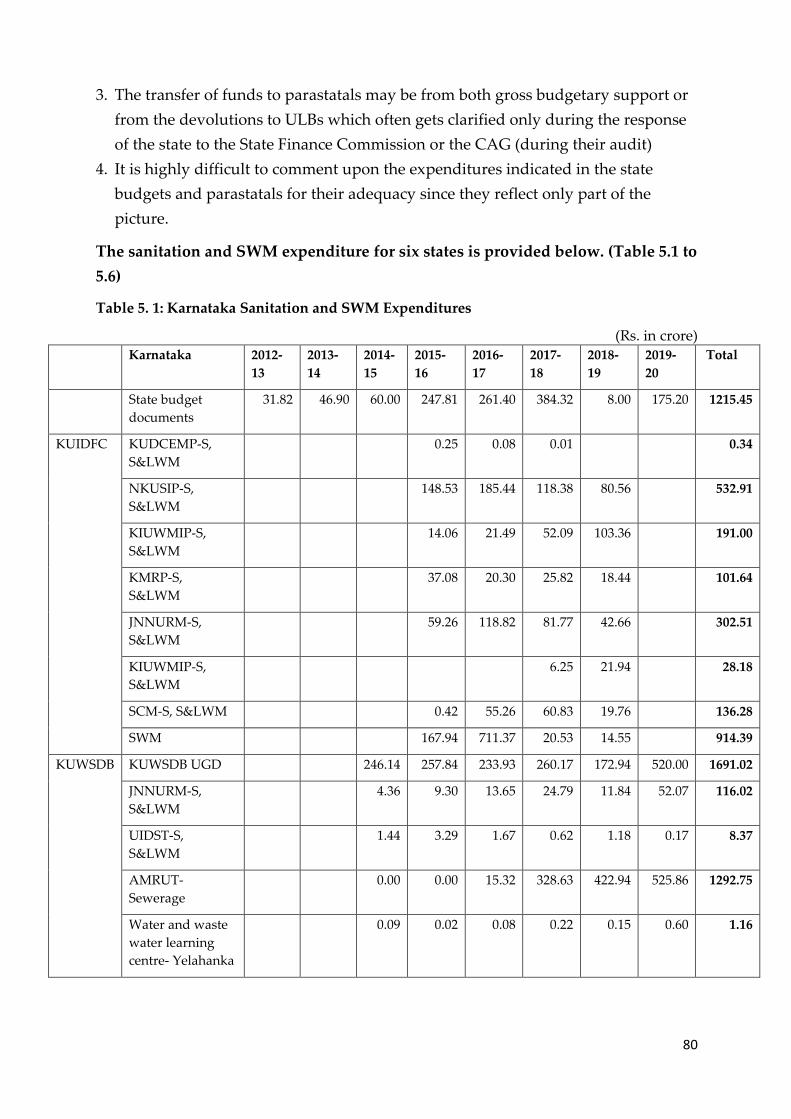
80
3. The transfer of funds to parastatals may be from both gross budgetary support or
from the devolutions to ULBs which often gets clarified only during the response
of the state to the State Finance Commission or the CAG (during their audit)
4. It is highly difficult to comment upon the expenditures indicated in the state
budgets and parastatals for their adequacy since they reflect only part of the
picture.
The sanitation and SWM expenditure for six states is provided below. (Table 5.1 to
5.6)
Table 5. 1: Karnataka Sanitation and SWM Expenditures
(Rs. in crore)
Karnataka 2012-
13
2013-
14
2014-
15
2015-
16
2016-
17
2017-
18
2018-
19
2019-
20
Total
State budget
documents
31.82 46.90 60.00 247.81 261.40 384.32 8.00 175.20 1215.45
KUIDFC KUDCEMP-S,
S&LWM
0.25 0.08 0.01 0.34
NKUSIP-S,
S&LWM
148.53 185.44 118.38 80.56 532.91
KIUWMIP-S,
S&LWM
14.06 21.49 52.09 103.36 191.00
KMRP-S,
S&LWM
37.08 20.30 25.82 18.44 101.64
JNNURM-S,
S&LWM
59.26 118.82 81.77 42.66 302.51
KIUWMIP-S,
S&LWM
6.25 21.94 28.18
SCM-S, S&LWM 0.42 55.26 60.83 19.76 136.28
SWM 167.94 711.37 20.53 14.55 914.39
KUWSDB KUWSDB UGD 246.14 257.84 233.93 260.17 172.94 520.00 1691.02
JNNURM-S,
S&LWM
4.36 9.30 13.65 24.79 11.84 52.07 116.02
UIDST-S,
S&LWM
1.44 3.29 1.67 0.62 1.18 0.17 8.37
AMRUT-
Sewerage
0.00 0.00 15.32 328.63 422.94 525.86 1292.75
Water and waste
water learning
centre- Yelahanka
0.09 0.02 0.08 0.22 0.15 0.60 1.16

81
Karnataka 2012-
13
2013-
14
2014-
15
2015-
16
2016-
17
2017-
18
2018-
19
2019-
20
Total
Smart city-S,
S&LWM
0.00 0.00 0.00 0.84 0.00 60.26 28.16 28.16 117.43
AMRUT-S,
S&LWM
0.00 0.00 0.00 92.84 134.88 453.48 628.44 426.25 1735.89
KMRP-S,
S&LWM
64.24 128.17 127.88 19.22 0.00 3.20 6.40 16.00 365.11
NKUSIP-S,
S&LWM
71.50 115.50 77.90 0.00 165.00 165.65 0.00 0.00 595.55
BBMP (O&M) 276.53 354.05 16.85 513.84 639.89 1021.50 923.29 1141.80 4887.75
SWD 21.24 7.60 7.85 25.56 62.25
BBMP (Capital) 33.38 13.21 95.70 71.97 214.26
Own 175.48 190.05 219.46 243.49 244.44 303.52 317.28 288.41 1982.13
Total 674.19 855.48 857.67 1913.56 2823.02 3372.03 2821.89 3174.52 16492.37
Source: State budget reports and Annual accounts of parastatals
Table 5. 2: Tamil Nadu Sanitation and SWM Expenditures
(Rs. in Lakhs)
Tamil Nadu 2014 -15 AC 2015-16 AC 2016-17 AC 2017-18 AC 2018-19 AC
Sewerage and Sanitation 1360.00 1500.00 1999.00 760.00 640.00
Grant Fund 1 2260.67 278.00 9377.33 9935.67 5661.00
Sewerage and Sanitation 1518.00 0.00 0.00 0.00 0.00
Capital Development 1274.57 2374.63 1186.07 544.39
Slum 61645.00 8222.19 17584.09 8687.61
Other Schemes 1063.26 685.98 707.42 711.70
Natural Calamities 36870.52 7500.00 3608.98 5460.00
3604 137626.32 151088.40 191165.20 176956.57 183914.77
107834.06 119889.45 147071.44 129775.24 133724.19
103370.97 105571.03 140286.87 136110.21 142139.42
412814.18 422327.57 506689.65 457036.38 465782.77
Share of Sanitation 0.08598005 0.0859801 0.0859801 0.0859801 0.0859801
35493.7856 36311.747 43565.204 39296.013 40048.028
Total Sanitation Exp 40632.45 38089.75 54941.54 49991.68 46349.03
Source: TNUIFSL website and 5th SFC Report annexure

82
Table 5. 3: Maharashtra Sanitation and SWM Expenditures
(Rs. in crore)
Maharashtra 2012-
13
2013-
14
2014-
15
2015-
16
2016-
17
2017-
18
2018-19 2019-
20
Total
Sanitation /SWM/LWM
(State budget) 24.68 62.30 361.75 1236.90 1710.33 1594.92 4979.65 3411.27 13381.79
AMRUT 184.16 581.86 364.41 5472.64 899.28 7502.35
JNNURM/UIDSSMT/IDSMT 21.96 2.67 38.90 7.98 5.05 2.56 0.32 79.44
SMART CITIES 1.51 91.78 61.39 99.49 99.94 354.12
CIDCO 9.69 2.48 12.17
Total 46.64 64.97 410.34 1433.02 2389.02 2023.28 10552.10 4410.49 21329.86
Source: State budget reports and Annual accounts of parastatals
Table 5. 4: Telangana Sanitation and SWM Expenditures
(Rs. in crore)
Telangana 2014-15 2015-16 2016-
17
2017-
18
2018-19 2019-20 Total
Sanitation /SWM/LWM
(State budget) 274.58 1925.58 1000.00 1194.50 1420.50 825.00
6640.1
7
AMRUT COST 224.97
JNNURM Cost 71.49
SMART Cities Mission 84.04
GHMC SWM 570 534 425 509 509 509
3056.0
0
GHMC SWM 212 220 218 216 216 216
1298.0
0
Sanitation-est GHMC 122.46 132.26 169.62 192.47 149.39 766.19
Source: State budget reports and Annual accounts of parastatals
Table 5. 5: Andhra Pradesh Sanitation and SWM Expenditures
(Rs. in crore)
Andhra Pradesh 2015-16 2016-17 2017-18 2018-19 2019-20 Total Sanitation/SWM/LWM
Expenditures
Sanitation /SWM/LWM
(State budget) 155 1523 106 481 191 2457 2457
Andhra Pradesh Urban
Water Supply and
Septage Management
Improvement Project
25 25 8
Smart cities 382 630 348 190 200 1750 123
AMRUT 94 114 645 140 374 1366 533

83
Andhra Pradesh 2015-16 2016-17 2017-18 2018-19 2019-20 Total Sanitation/SWM/LWM
Expenditures
JNNURM 1449 304
OTSFA 1365 1365
SWM 46 46
Swachh Andhra Mission 605 605
Swachh Andhra
Corporation 200 10 210 210
Total 632 2267 1099 1011 800 9273 5650
Source: State budget reports and Annual accounts of parastatals
Table 5. 6: Kerala Sanitation and SWM Expenditures
(Rs. in crore)
Kerala 2014-15 2015-16 2016-17 2017-18 2018-19 2019-20
Sanitation /SWM/LWM (State budget) 47.24 76.24 92.46 62.25 2188.19 351.53
Sanitation /SWM/LWM (local government transfer) 3.17 1.75 1.16 10.70 28.44 12.09
50.41 77.99 93.63 72.95 2216.62 363.61
Smart cities 390.80 13.20 165.32 290.92
AMRUT 214.75 113.88 525.34 359.76
JNNURM 25.89 19.64
total 631.44 146.72 690.66 650.68
20% for sanitation 126.29 29.34 138.13 130.14
Total 50.41 77.99 219.91 102.30 2354.75 493.75
The above tables which include the sanitation expenditures under different urban
development schemes/ Swachh Bharat Mission assumes the proportion as present in
the project documents. However, the actual expenditures do vary depending upon
the field requirements.
At the level of ULB, more often than not, the sanitation and Solid Waste
Management are handled together by a section. The managerial staff are often
common for both under the name of public health. The staff and the expenditure
under these two services form significant portion of the ULB expenditure often
accounting for 30-35% of the expenditure at the ULB. Thus, the expenditure compilation at
state level including the parastatal provides only part of the story.

84
Chapter 6: Planning and Implementation of Sanitation and
SWM Services in ULBs
While the 74th Constitutional Amendment Act formally recognised ULBs as the third
tier of government, it only ‛recommended’ that state governments assign to the ULBs
a set of 18 functions under the 12th Schedule - Public health, sanitation conservancy,
and solid waste management being one of the functions. However, as described in
the earlier chapters, many of the state governments have only partially complied
with devolution. Despite this, ULBs are expected to play a critical role in the delivery
of services in relation to sanitation and SWM. For example, the National Urban
Sanitation Policy (2008) envisions the role of ULBs as creating assets and managing
systems to meet the sanitation related service norms along with fixing tariffs and
collecting revenues for its O&M. Similarly, the Solid Waste Management Rules (2016)
makes the ULBs responsible for door-to-door collection and transportation of
segregated waste, setting up of material recovery facilities, facilitating the
construction and O&M of solid waste processing facilities and sanitary landfill.
While the ULBs have been prescribed to collect SWM user fees as deemed
appropriate, the SWM Rules have also clearly directed the ULBs to make adequate
provisions of funds for both capital investments as well as O&M of SWM services in
their annual budgets and to also ensure that funds for discretionary functions are
only allocated after meeting the requirement of necessary funds for SWM and other
obligatory functions.
To study in more detail how ULBs plan and implement sanitation and SWM
services, we have selected two disparate ULBs – 1) Doddaballapura ULB in
Karnataka which is a City Municipal Council and a Class II city50 and 2) Hosur ULB
in Tamil Nadu which is a City Municipal Corporation and a Class 1C city49. The
following sections would describe in more detail our findings with regard to:
1. Profile of the ULB.
2. The existing water supply, sanitation and SWM system.
3. ULB Organizational Chart and Governance Structure in relation to provisioning
Sanitation/SWM services.
4. Staffing Process and Assets in relation to Sanitation/SWM services.
50 As per the reclassification of Census Classes by the High Powered Expert Committee (HPEC) set up
by the Ministry of Urban Development. Class II city has a population size between 50000-100000 while
Class 1C city has a population size between 100000-1 million.

85
5. ULB Finances.
6. Status and welfare of Manual Scavengers.
6.1. Doddaballapura City Municipal Council (CMC) (Karnataka State)
6.1.1. Profile of Doddaballapura CMC
Doddaballapura is a City Municipal Council (CMC) in Bengaluru Rural district of
Karnataka and is located about 40 kms north of Bengaluru city. For centuries
Doddaballapura has been an important trading and textile centre. It was once dotted
with innumerable cotton and silk handloom units and while a majority of them have
fallen silent today, it has given way to a much bigger and modern apparel park
established by the Karnataka Industrial Areas Development Board (KIADB). This
apparel park spread over almost 450 acres along with other nearby industrial areas
employ thousands of people from in and around Doddaballapura city.
Doddaballapura’s proximity to the Bengaluru International Airport (BIAL) is further
accelerating its urbanization. The proposed Rs. 22 billion, 12,000-acre BIAL IT
Investment Region, the largest IT Park in India is going to come up near
Doddaballapura as well. The profile of Doddaballapura CMC has been summarized
in the below table:
Table 6. 1: Profile of Doddaballapura CMC
SI.
No Indicator Doddaballapura
1 Population (2011 Census) 9310551
2 Category wise-breakup (2011 Census) 81874 (General & OBC) 9290
(SC) & 1941 (ST)
3 Percentage of Population living in Slums
(2011 Census) 17.5
4 Sex Ratio (2011 Census) 955 females for 1000 males
5 Total Number of Households (2011 Census) 2236552
6 Geographical Area (Sq. Kms) 18
7 Number of Wards 31
8 Length of Roads (Kms) 165.8
9 Water Supply (LPCD) 63
10 Percentage of Households having individual
toilets Not Available
51115465 as per 2019, Population projected by City Sanitation Plan (SBM)
5226059 as per SWM DPR 2018

86
SI.
No Indicator Doddaballapura
11 Percentage of households with flush/pour-
flush latrine connected to a septic tank* 0
12
Percentage of households with flush/pour-
flush latrine connected to a single or twin
pit**
35
13
Percentage of households with flush/pour-
flush latrine that are connected to a piped
sewer system***
60
14 Length of Sewer System (Kms) 121.7
15 Length of Drainage
(Open/Closed/Stormwater) (Kms) 160.4
16
Percentage of household with no drainage
system (No underground, covered pucca,
open pucca or open kutcha drainages)
0
17 Percentage of households whose sewage
generated is treated. 95
18 STP Capacity (MLD) 12
19 Total solid waste generated (TPD) 42
20
Percentage distribution of various types of
solid waste (Wet waste, Dry waste and Other
waste)
Wet Waste-57
Dry Waste-31
#Other Waste- 12
21 Percentage of households having door to
door waste collection 100
22 Percentage of households with waste
segregation at source 70
23 Percentage of MSW processed 54
Source: Data collected from Doddaballapura CMC and compiled by CBPS
Note: *septic tank: With or without a separate soak pit but is a complete water tight tank
made of concrete. May or may not have a partition wall in-between.
** single/twin pit: The liquid infiltrates/leaches into the soil through the bottom.
***Piped sewer system: A system of sewer pipes, also called sewerage that is designed to
collect human excreta and waste water and remove them from the household environment.
#Other Waste: Hazardous Waste, E-Waste, C & D Waste and Inert Waste.
In the above table, many of the data pertaining to sanitation and SWM indicators
were obtained by interviewing ULB officials and not based on any official
documents maintained by the ULB. The data management in relation to sanitation
and SWM indicators is fairly poor and hence may also have a bearing on the future

87
planning of the ULB’s sanitation and SWM infrastructure. For example, while the
ULB had maintained data regarding the number of households that had paid the
one-time Underground Drainage (UGD) connection fees (5505 households), almost
all the ULB officials we spoke to concurred that the actual number of households
connected to the UGD are much higher (around 14,000 households) but they haven’t
paid the UGD connection fees and that only a door-to-door survey can verify the
exact numbers.
6.1.2. Water Supply, Sanitation and SWM System
In regard to water supply and sanitation, households in Doddaballapura have
traditionally depended on private borewells and either soak pits or open drains to
dispose blackwater. However, over the years this has resulted in severe pollution of
the ground water and nearby water bodies. With an aim to better manage the
disposal of waste water, in 2017 the Doddaballapura CMC built a comprehensive
UGD network. The World Bank provided a loan of Rs. 35 crores for this project and it
was implemented by the Karnataka Urban Infrastructure Department and Finance
Corporation (KUIDFC) – a state owned parastatal agency. The project aimed to
connect 14,000 households to the UGD network which transports the city’s faecal
sludge to a Sewage Treatment Plant (STP) located 5 kms from the city.
Figure 6. 1: Cleaning of Open Drain
Source: Photograph taken by CBPS Team during field visit
Figure 6.1 gives an overview of the entire water supply and sanitation system of
Doddaballapura CMC. The water supply pipelines were laid by the Karnataka
Urban Water Supply & Drainage Board (KUWS&DB) – a state owned parastatal
body while its operation and maintenance (O&M) is the sole responsibility of the

88
ULB. Households do not have individual meters and hence pay flat charges of Rs.
180/month for residential and Rs. 800/month for a commercial water connection. A
similar arrangement also exists for the UGD network. While the capital asset was
created by the KUIDFC, its O&M is once again the sole responsibility of the ULB. To
get a UGD connection, households have to pay a one-time fee to the ULB that ranges
from Rs. 2500 to Rs. 5000 along with an additional Rs. 3000 for material and labour.
To recover the O&M costs, the CMC is also planning on levying a flat user fee of Rs.
60 per month. For households that aren’t connected to the UGD, the desludging of
their leach pits is being carried out using suction machines owned by the ULB for
which the households have to pay Rs. 1700. It is interesting to note that while the
ULB has taken on the responsibility of supervising the potentially hazardous
cleaning of sewers and septic tanks, the actual work is carried out only by labour that
is outsourced from private agencies. The ULB has also constructed a network of
open, closed and storm water drains to primarily transport household greywater and
rainwater to nearby lakes. However, a certain level of contamination is occurring due
to a small percentage of households in the old city discharging their blackwater
directly into these drains. The sewage being transported through the UGD and faecal
sludge from emptying the pits is treated in a nearby Sewage Treatment Plant (STP)
that is fully owned and operated by the ULB.
Figure 6. 2: Sewage Treatment Plant at Doddaballapura
Source: Photograph taken by CBPS Team during field visit

89
Figure 6. 3: Water Supply and Sanitation Ecosystem
Source: Compiled by CBPS Team Note: Grey Water: Water from kitchen and bathroom sinks, showers, tubs and washing
machines. Black Water: Water from toilets that contains urine and faecal matter.
Figure 6.3 gives an overview of the entire solid waste management (SWM) system of
Doddaballapura CMC. Segregated waste from both households and commercial
establishments are collected in two rounds by 25 GPS enabled auto tippers. Four
tractor trailers and one tipper truck are used to collect unsegregated roadside waste
while one compactor is used to collect unsegregated waste from the markets.
According to the ULB’s environmental engineer, the overall waste generated by the
ULB is 35 TPD. From this about 30 TPD is being collected through the above-

90
mentioned ways while 5 TPD remains uncollected. Among the waste collected, 19
TPD gets segregated at source while the remaining 11 TPD is unsegregated. The
entire cleaning staff (Pourakarmikas) is engaged in street sweeping, collection of
segregated household waste and cleaning of open drains on a daily basis. The ULB
charges an annual SWM cess of Rs. 540 per household and Rs. 3000 for commercial
establishments and is collected along with the Property Tax.
Figure 6. 4: Paper and Plastic Waste Compressed by Belling Machine
Source: Photograph taken by CBPS Team during field visit
The vehicles transport the waste directly to a 15-acre centralized Municipal Solid
Waste (MSW) processing and disposal facility that is located about 9 kms from the
city. At this centralized facility, the segregated wet waste is directly composted to
produce manure. From the segregated dry waste, the combustible portion goes to a
bailing unit after removing all the waste that is resalable. However, according to the
environmental engineer the revenue generated from the above two processes is
negligible. From the unsegregated waste, only waste that is resalable gets separated,
while the remaining waste is directly dumped into a landfill site without any
processing. Currently, in the landfill site about 12000 tons of legacy waste has gotten
accumulated of which only 4000 tons has been scientifically disposed through bio-
capping. Other kinds of wastes such as electronic, bio-medical and inert wastes are
also being collected from households and other commercial establishments.
However, there was a lack of clarity among the ULB officials as to how these other
types of wastes are being processed. Some officials mentioned that they are
unscientifically dumped into the landfill while others were of the opinion that it was
being handed over to authorized waste management vendors.

91
Figure 6. 5: Solid Waste Management Ecosystem
Source: Compiled by CBPS Team
Figure 6. 6: Legacy Waste Dumped in Landfill Site
Source: Photograph taken by CBPS Team during field visit
6.1.3. Organisational Chart and Governance Structure in Relation to
Sanitation/SWM
Figure 6.1.7 illustrates the Doddaballapura CMC Organisational Chart. The
sanitation and SWM services are the joint responsibility of both the health and
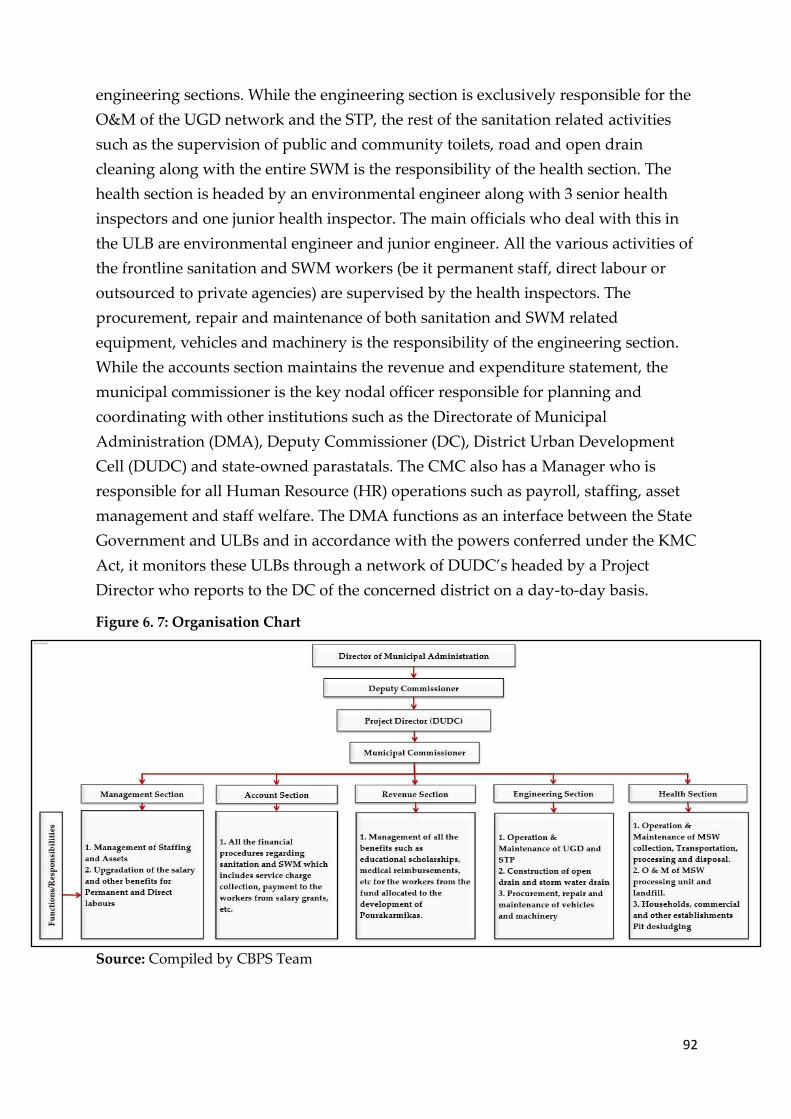
92
engineering sections. While the engineering section is exclusively responsible for the
O&M of the UGD network and the STP, the rest of the sanitation related activities
such as the supervision of public and community toilets, road and open drain
cleaning along with the entire SWM is the responsibility of the health section. The
health section is headed by an environmental engineer along with 3 senior health
inspectors and one junior health inspector. The main officials who deal with this in
the ULB are environmental engineer and junior engineer. All the various activities of
the frontline sanitation and SWM workers (be it permanent staff, direct labour or
outsourced to private agencies) are supervised by the health inspectors. The
procurement, repair and maintenance of both sanitation and SWM related
equipment, vehicles and machinery is the responsibility of the engineering section.
While the accounts section maintains the revenue and expenditure statement, the
municipal commissioner is the key nodal officer responsible for planning and
coordinating with other institutions such as the Directorate of Municipal
Administration (DMA), Deputy Commissioner (DC), District Urban Development
Cell (DUDC) and state-owned parastatals. The CMC also has a Manager who is
responsible for all Human Resource (HR) operations such as payroll, staffing, asset
management and staff welfare. The DMA functions as an interface between the State
Government and ULBs and in accordance with the powers conferred under the KMC
Act, it monitors these ULBs through a network of DUDC’s headed by a Project
Director who reports to the DC of the concerned district on a day-to-day basis.
Figure 6. 7: Organisation Chart
Source: Compiled by CBPS Team

93
With the approval of the local municipal council, the ULB can independently take up
any sanitation or SWM related project as long as the total project estimate is below
Rs. 50 lakhs. For projects of this scale, the municipal commissioner is empowered as
the final signing authority. If the work estimates fall between Rs. 50 lakhs and Rs. 2
crores, then it needs to be first signed off by the Project Director (DUDC) followed by
the DC. Work estimates that goes beyond Rs. 2 crores require the approval from the
DMA. Since 2018, the municipal council (elected body) of Doddaballapura CMS has
not been in existence due to an ongoing court case in relation to the state
government’s reservation policy in regard to a few wards. In the absence of a
municipal council, even work estimates that are below Rs. 50 lakhs now require the
approval of the DC who plays the dual role of a state appointed administrator.
However, any major work in relation to the water supply and UGD systems that
exceed Rs. 50000 will be the sole responsibility of KUWS & DB. Other works such as
construction of overhead tanks, STPs and water treatment plants that require
specialized technical expertise are also assigned to KUWS&DB. On the other hand,
irrespective of the work estimate, work in relation to open, closed and storm water
drains will be the sole responsibility of the ULB.
The governance structure for planning and implementing any sanitation or SWM
related work depends on various factors such as the nature of work, source of
funding, scheme and project. One example that we would like to illustrate here is
the Karnataka Municipal Reform Project (KMRP) in which one of the sub-
components was to construct a UGD network and STP for Doddaballapura CMC.
The State government appointed KUIDFC – a parastatal body as the nodal agency
for implementation, monitoring and management of funds for this project. Apart
from borrowing a loan on behalf of Doddaballapura CMC from the World Bank,
KUIDFC also received a 10 % contribution from the ULB to implement the project.
The remaining 90 % of the implementation cost will be a loan which the ULB has to
repay. KUIDFC conducted an initial feasibility study by also seeking inputs from the
ULB. Subsequently KUIDFC was required to obtain two types of approval – an
administrative approval from a state level empowered committee and technical
approval from the chief engineer of KUWS&DB. After obtaining the approvals,
KUIDFC appointed a Project Management Consultant (PMC) to prepare a detailed
project report (DPR) along with cost estimation. Based on this, Doddaballapura CMC
called for a tender and finalized a contractor for executing the work. The day-to-day
supervision of the contractor was the responsibility of KUIDFC which it managed
through the PMC. Based on the PMC/KUIDFC’s signoff on the progress made, the

94
payment to the contractor was made by the ULB. KUIDFC in turn released the loan
amount to the ULB in a phased manner. Once the project was completed it was
handed over to the Doddaballapura CMC for the O&M of these assets.
6.1.4. Staffing and Assets in Relation to Sanitation/SWM
There are four different modes of employing Sanitation/SWM workers in
Doddaballapura ULB – As Permanent Staff, Direct Labour, Outsourced to Private
Agencies (Labour) and Outsourced to Private Agencies (Service). The term ‘Direct
Labour’ refers to sanitation/SWM workers employed by the ULB without any formal
contract and on a daily wage basis. Apart from this, the ULB also either outsources
some of the labour work to private agencies or engages with them on a service
contract basis. Doddaballapura CMC currently has 74 sanitation/SWM workers who
are permanent staff of the ULB, 88 have been hired as direct labour and 12 workers
are under Private Agencies. The number of workers employed by private agencies
who have a service contract with the ULB (for specific sanitation/SWM related
activities such as maintenance of public toilets) could not be ascertained. Apart from
cleaning of drains, the permanent staff and direct labour is mostly engaged in SWM
related work such as door to door waste collection, street sweeping and roadside
shrub clearing. There is no fixed task or responsibility assigned to either the
permanent staff or direct labour and hence they should be flexible to take up any of
the above mentioned activities. However, the scenario is a bit different for the 12
workers employed by private agencies. Among them, 5 are dedicated to the
maintenance of the MSW processing and disposal facility while the remaining 7 are
responsible for the maintenance of the UGD and the STP facilities. Within the 5
workers working in the SWM processing facility, 1 is responsible for operating the
bailing and compost screening machines while the remaining 4 are engaged in
manual work such as loading and waste segregation. Out of the 7 workers
responsible for the maintenance of the UGD and STP facilities, 3 are dedicated to
operating the jetting & suction machine for clearing blockages in the UGD, 2 for
desilting manholes and the other two 2 are for maintenance of the STP facility. The
same workers who operate the jetting and suction machines are also responsible for
the desludging of household pits. The below table when perused column-wise,
provides more details on the 4 different modes of employment of Sanitation/SWM
workers, the type of sanitation/SWM work being carried out by each one of them
and the nature of interaction between the ULB and the private agencies.
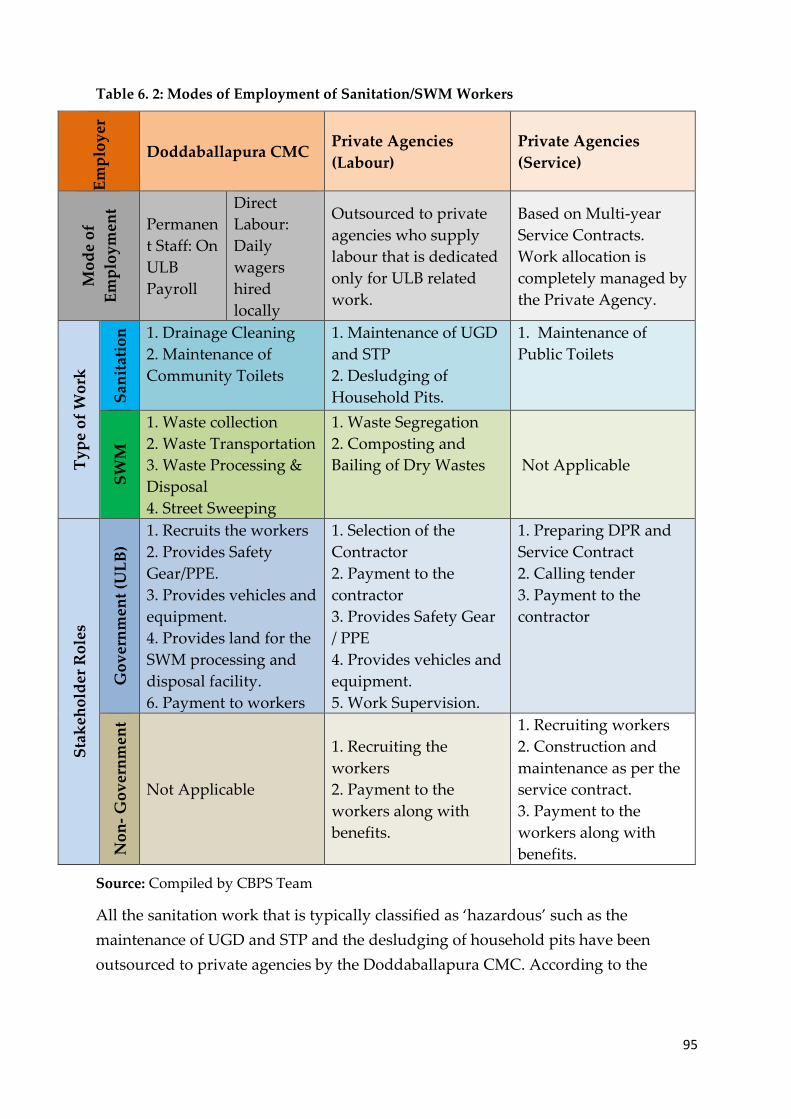
95
Table 6. 2: Modes of Employment of Sanitation/SWM Workers E
mp
loy
er
Doddaballapura CMC Private Agencies
(Labour)
Private Agencies
(Service)
Mo
de
of
Em
plo
ym
ent
Permanen
t Staff: On
ULB
Payroll
Direct
Labour:
Daily
wagers
hired
locally
Outsourced to private
agencies who supply
labour that is dedicated
only for ULB related
work.
Based on Multi-year
Service Contracts.
Work allocation is
completely managed by
the Private Agency.
Ty
pe
of
Wo
rk
San
itat
ion
1. Drainage Cleaning
2. Maintenance of
Community Toilets
1. Maintenance of UGD
and STP
2. Desludging of
Household Pits.
1. Maintenance of
Public Toilets
SW
M
1. Waste collection
2. Waste Transportation
3. Waste Processing &
Disposal
4. Street Sweeping
1. Waste Segregation
2. Composting and
Bailing of Dry Wastes Not Applicable
Sta
keh
old
er R
ole
s
Go
ver
nm
ent
(UL
B)
1. Recruits the workers
2. Provides Safety
Gear/PPE.
3. Provides vehicles and
equipment.
4. Provides land for the
SWM processing and
disposal facility.
6. Payment to workers
1. Selection of the
Contractor
2. Payment to the
contractor
3. Provides Safety Gear
/ PPE
4. Provides vehicles and
equipment.
5. Work Supervision.
1. Preparing DPR and
Service Contract
2. Calling tender
3. Payment to the
contractor
No
n-
Go
ver
nm
ent
Not Applicable
1. Recruiting the
workers
2. Payment to the
workers along with
benefits.
1. Recruiting workers
2. Construction and
maintenance as per the
service contract.
3. Payment to the
workers along with
benefits.
Source: Compiled by CBPS Team
All the sanitation work that is typically classified as ‘hazardous’ such as the
maintenance of UGD and STP and the desludging of household pits have been
outsourced to private agencies by the Doddaballapura CMC. According to the

96
officials we spoke to, the main reason behind this is that posts such as UGD operator
or UGD helper haven’t been sanctioned as per the Cadre & Recruitment (C&R) Rules
for Karnataka State Municipalities53 and hence the ULB does not have the approval
to hire them as permanent staff of the ULB. To circumvent this, it was suggested to
the ULB by the DMA to outsource this to private agencies and make payments using
own revenue which is an additional financial burden to the ULB. However,
Municipal Corporations in the state have approvals to hire workers as UGD
operators or UGD helpers and going ahead the ULB hopes that the C&R rules for
Municipalities will also be amended so that they too can employ workers for UGD
and STP maintenance as permanent staff of the ULB. The current strength of 174
sanitation/SWM workers matches with what is stipulated in the C&R Rules and
hence there are no additional vacant posts. When asked as to why the number of
workers hired as direct labour (88) is even higher than the number of workers hired
as permanent staff of the ULB (74), the officials informed us that all staffing related
decisions are made by the DC office and according to them this situation arises when
the job applicants have not met the eligibility criteria for being hired as permanent
staff of the ULB. The below Figure gives an idea about various types of
sanitation/SWM work mapped to the various modes of employment.
Figure 6. 8: Distribution of Type of Sanitation/SWM Work Versus Mode of Employment
Source: Doddaballapura CMC
53 Karnataka Municipalities (Recruitment of Officers and Employees) Rules, 2010
74 74
88 88
3 2 2 5
12
0
20
40
60
80
100
120
140
160
180
200
Garbage
collection, Street,
Bus Stand &
Drainage
Cleaning
UGD
Maintenance &
Household Pits
Desludging
Manhole
Desilting
STP Maintenance MSW Processing
Unit and Landfill
Total Number of
Workers
No
. of
Wo
rker
s
Type of Activities
Permanent Direct Outsourcing to Private Agencies

97
The below table 6.3 provides details on the range of salaries, working hours, leaves
and other staff benefits being provided to sanitation/SWM workers across the
various modes of employment. From the 24% funds reserved for SC/ST in the State
Finance Commission (SFC) grants, 20 % from that is allocated for the welfare of only
those sanitation/SWM workers who have been hired as permanent staff of the ULB.
The medical reimbursement and educational scholarship for their children is
disbursed from these funds. The DC can approve medical reimbursement up to Rs.
one lakh and beyond that the DMA is empowered to approve on a case-to-case basis.
The children of permanent staff are also being provided an annual education
scholarship of Rs. 5000 to 6000 applicable from the secondary education level. Under
the Pourakarmika Gruha Bhagya Yojana – A housing scheme launched by
Karnataka, permanent sanitation/SWM workers are also entitled to receive Rs. 7.5
lakhs (Rs. 6 lakhs as contribution from the State Government and Rs. 1.5 lakhs from
convergence with the Pradhan Mantri Awas Yojana). Any additional cost beyond Rs.
7.5 lakhs towards house construction should either be borne by the ULB or the
beneficiary.
The compensation and benefits for workers either employed as direct labour or
outsourced from private agencies is not on par with those working as permanent
staff of the ULB. Workers belonging to both these categories are paid a fixed
renumeration irrespective of the number of years of experience. Apart from free
health check-ups, the only other major benefits that they are entitled to are the
Employee Provident Fund (EPF) and Employee State Insurance (ESI), wherein the
employer’s contribution to both EPF and ESI is being paid by either the ULB or
private agencies.
Table 6. 3: Salaries and Other Benefits Given to Workers Based on Their Mode of
Employment
Monthly Gross Salary
Range (In Rs.) Working
Hours Off Days Leaves Other Benefits
Min Max
UL
B P
erm
anen
t S
taff
11059 42516 8
Wednesday
and Sunday
(Only Second
half)
Casual
Leaves: 10
Encashment
Leaves: 30
1. Medical Reimbursement
2. Health Check-ups
3. Over Time Payment
4. Annual Increment.
5. Education Scholarship
for children
6. Housing Scheme
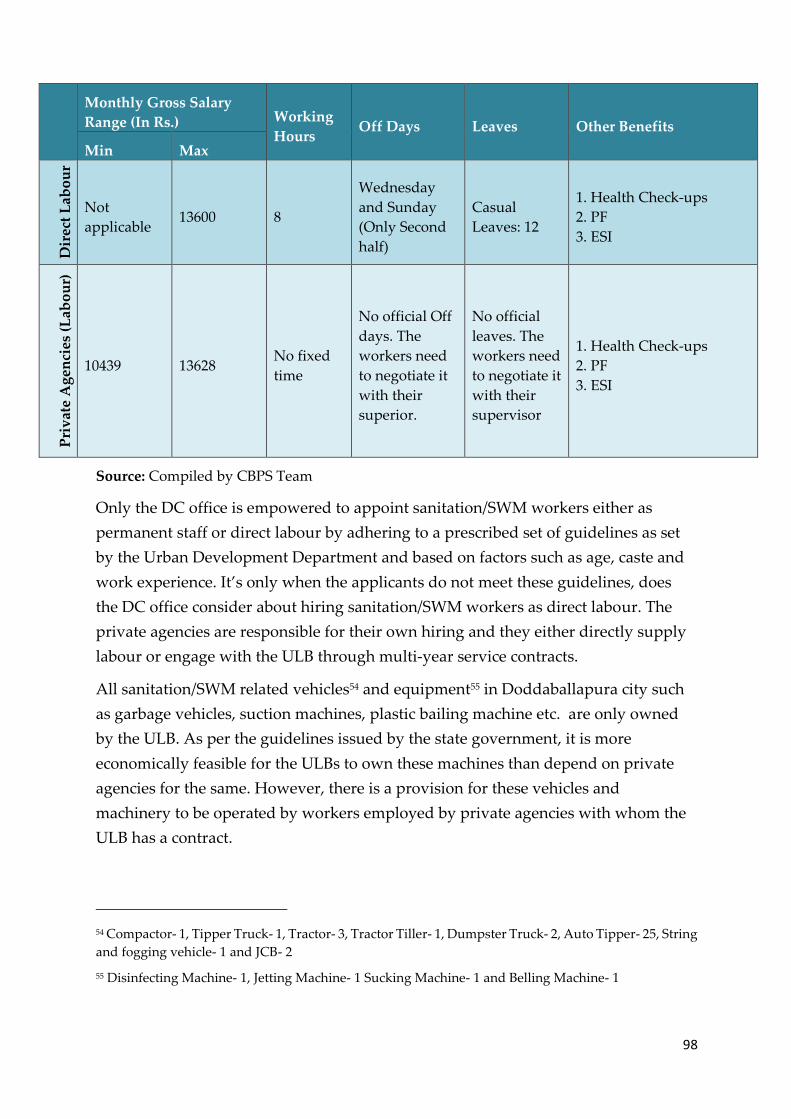
98
Monthly Gross Salary
Range (In Rs.) Working
Hours Off Days Leaves Other Benefits
Min Max
Dir
ect
Lab
ou
r
Not
applicable 13600 8
Wednesday
and Sunday
(Only Second
half)
Casual
Leaves: 12
1. Health Check-ups
2. PF
3. ESI
Pri
vat
e A
gen
cies
(L
abo
ur)
10439 13628 No fixed
time
No official Off
days. The
workers need
to negotiate it
with their
superior.
No official
leaves. The
workers need
to negotiate it
with their
supervisor
1. Health Check-ups
2. PF
3. ESI
Source: Compiled by CBPS Team
Only the DC office is empowered to appoint sanitation/SWM workers either as
permanent staff or direct labour by adhering to a prescribed set of guidelines as set
by the Urban Development Department and based on factors such as age, caste and
work experience. It’s only when the applicants do not meet these guidelines, does
the DC office consider about hiring sanitation/SWM workers as direct labour. The
private agencies are responsible for their own hiring and they either directly supply
labour or engage with the ULB through multi-year service contracts.
All sanitation/SWM related vehicles54 and equipment55 in Doddaballapura city such
as garbage vehicles, suction machines, plastic bailing machine etc. are only owned
by the ULB. As per the guidelines issued by the state government, it is more
economically feasible for the ULBs to own these machines than depend on private
agencies for the same. However, there is a provision for these vehicles and
machinery to be operated by workers employed by private agencies with whom the
ULB has a contract.
54 Compactor- 1, Tipper Truck- 1, Tractor- 3, Tractor Tiller- 1, Dumpster Truck- 2, Auto Tipper- 25, String
and fogging vehicle- 1 and JCB- 2
55 Disinfecting Machine- 1, Jetting Machine- 1 Sucking Machine- 1 and Belling Machine- 1

99
6.1.5. Doddaballapura CMC Finances
The municipalities in Karnataka are governed by the Karnataka Municipalities Act
1964, Karnataka Municipal Corporation Act. The accounts of the municipalities are
maintained as per the Karnataka Municipal Accounting and Budgeting Rules 2006
(KMABR-2006)56 in the lines of National Municipal Accounting Manual. The
important sources of revenues of an ULB in Karnataka include the grants as
recommended by State Finance Commission (and accepted with or without changes
by state government) both in the form of tied (specific purpose) and untied grants,
Own source revenues (OSR) and assigned revenues. The own source revenues
include the property tax, advertisement tax, water supply charges, solid waste
management cess and trade license fees. All of these own source revenues are to be
collected by the ULB while the rates are stipulated by the state government. The
trade license fee is stipulated to be revised in every three years by the ULBs. The
assigned revenue is the surcharge on stamp duty levied for the registration of
properties in the jurisdiction of the ULB. The state will collect on behalf of the ULB
and retain 10% of it as the collection charges and the rest 90% is to be shared with the
ULB. However, this revenue is delayed in reaching ULB more often than not and
ULB has no clue till it gets it. Overall, the own revenues of the ULB are subject to tax
effort and updated tax base with very little or no scope to do in terms of tweaking
the rates.
The grants from state government usually referred to as State Finance Commission
grants or SFC grants comes in the form of both tied and untied nature. The tied
grants are for salaries (also referred to as SFC salary grants), specific purposes such
as for implementation of schemes and even for repayment of loan by the ULB.
The property tax collected by the ULB also has a component of cess collected as a
proportion of property tax. These cesses include health cess @15%, library cess@6%,
beggary cess @3% and urban transport cess @2% amounting to 26% of the property
tax. These cesses have to be remitted to the respective authorities57after retaining 10%
of the cess as collection charges except for the urban transport cess which has to be
remitted in full. The ULBs are also expected to collect the solid waste management
cess (SWM cess) at the rates prescribed by the state government (latest rates being
56 This also stipulates double entry accrual-based accounting system.
57 Health Cess to Health Department, Beggary Cess to Directorate of Beggary, Library Cess to
Department of Libraries and UTC to Urban Transport Fund being administered by Director of Urban
Land Transport
100
given in Karnataka Government Gazette dated October 10 2019) along with the
property tax. The SWM cess are fixed based on the area of the buildings and the
category of the municipalities. The SWM cess also vary for residential and
commercial properties and bulk generators. The SWM cess bye-laws also has rates
fixed for fines to be imposed by the ULBs for various categories of SWM generators
including fines for dumping on roads. However, the government buildings, places
of worship, educational institutions are being exempted from the SWM cess.
The analysis of finances of the Doddaballapura City Municipal Council (CMC)
covers the period 2014-15 to 2020-21 with the last two years being the revised
estimates (RE) and budget estimates (BE) respectively. The analysis focuses on the
aggregate finances of the ULB, the share of OSR and grants, the revenue and capital
expenditures along with the expenditures on sanitation and SWM.
The aggregate finances of the ULB indicate that the revenues have grown from Rs.
2063 lakhs in 2014-15 to Rs 2935 lakhs in 2019-20 (Table 6.4)58. The year-on-year
growth rates indicate that the revenues have declined over the previous year during
the years 2016-17 to 2018-19 while the highest increase was during 2015-16 when it
reached over Rs. 3106 lakhs recording 50% increase over the year 2014-15. The
revenues grew at an average annual growth rate of 10% over the period 2014-15 to
2019-20. The expenditure increased from Rs. 1796 lakhs in 2014-15 to Rs. 2826 lakhs
during the year 2019-20. The expenditure had declined during the years 2016-17 and
2018-19 over the previous year while it recorded an increase during the years 2015-16
and 2017-18 over the previous year. The average annual growth rate of expenditure
was 11% over the period 2014-15 to 2019-20.
The expenditure as a proportion of total revenue (revenue + opening balance)
hovered between 49% to 63% during the period 2014-15 to 2019-20 while the average
for the period was 58%. The expenditure as a proportion of the revenue for the year
stood at an average of 96% for the period 2014-15 to 2019-20. The lower proportion of
expenditure in relation to the total revenues indicate the issues of flow of funds to
the ULBs. Despite a higher revenue available at the disposal of the ULB, the
utilisation has not crossed 63%. The expenditures as proportion of revenues for the
year seemed to be better and has crossed 100% to utilise the revenues from the
previous years during the years 2017-18 and 2018-19.
58 The last year 2020-21 being the Budget Estimates are not considered for the interpretation as it seemed
to be highly inflated.

101
Table 6. 4: Aggregate finances of the Doddaballapura City Municipal Council
(Rs. in lakhs)
2014-15 2015-16 2016-17 2017-18 2018-19 2019-20
RE
2020-21
BE
Opening Balance 957.12 1224.41 1970.04 2276.22 1977.46 1582.75 1691.29
Revenue 2063.53 3104.63 2473.50 2385.09 2218.53 2934.66 4265.08
Total Revenue 3020.65 4329.05 4443.54 4661.31 4195.98 4517.41 5956.37
Expenditure 1796.23 2359.01 2167.31 2683.85 2613.24 2826.12 5806.37
Closing Balance 1224.41 1970.04 2276.22 1977.46 1582.75 1691.29 150.00
Exp as % of Total
Revenue 59 54 49 58 62 63 97
Exp as % of revenue
for the year 87 76 88 113 118 96 136
Year on year growth
of revenue 50% -20% -4% -7% 32% 45%
Year on year growth
of exp 31% -8% 24% -3% 8% 105%
Detailed Receipts and Expenditure of Doddaballapura CMC
The receipts of the CMC include own source revenue (OSR), Grants (specific and
untied) and extra-ordinary receipts. The extraordinary receipts of the CMC include
those which are temporarily held by the CMC to be paid later. These include EMD,
security deposits, deductions pertaining to GST, royalty, income tax, cesses payable
to the respective authorities and recoveries of loans or advances to employees.
Similarly, the extraordinary payments include the refund of EMDs, security deposits,
cesses paid to authorities, deductions paid to authorities and advances for
employees. These extraordinary receipts and payments need to be excluded to
arrive at the true picture of the finances of ULBs.
The OSR has increased from Rs. 509.31 lakhs in 2014-15 to Rs. 1077.01 lakhs in 2019-
20 (Table 6.5). The growth of OSR was positive on all the years except the year 2016-
17 when it was reduced by 2 percent. The average year-on-year growth of the OSR,
for the period 2015-16 to 2019-20 was 18% while the grants grew at an average of
11%. The revenue expenditure grew from Rs. 1003 lakhs in 2014-15 to Rs. 1841 lakhs
in 2019-20 recording an annual average growth of 15%. The capital expenditure grew
from Rs. 497 lakhs in 2014-15 to Rs 1132 lakhs in 2017-18 and reduced to Rs. 496
lakhs in 2019-20 and recorded an annual average growth of 9% for the period.
The share of OSR increased from 25% of total revenues in 2014-15 to 37% in 2019-20
(Figure 6.1.9). The average share of the OSR and grants in the total revenues for the
period 2014-15 to 2019-20 stood at 32% and 59% respectively indicating a higher

102
dependency of the ULB on the grant receipts. The share of revenue expenditure
increased from 56% in 2014-15 to 65% in 2019-20 while the share of capital
expenditure reduced from 28% to 18% during the same period. The average share of
revenue and capital expenditure in total expenditure for the period 2014-15 to 2019-
20 stood at 55% and 34% respectively (Figure 6.10).
Table 6. 5: Categories of revenues and expenditure of Doddaballapura CMC
(Rs. in Lakhs)
Sources 2014-15 2015-16 2016-17 2017-18 2018-19 2019-20 RE 2020-21 BE
Own source revenue 509.31 752.2 737.13 801.2 813.88 1077.01 1595.75
Grants 1282.86 2179.46 1535.81 1315.34 1174.97 1618.28 2351.58
Extraordinary receipts 271.36 172.97 200.55 268.55 229.68 239.37 317.75
Total Rev 2063.53 3104.63 2473.5 2385.09 2218.53 2934.66 4265.08
Revenue Expenditure 1003.70 1328.16 1214.43 1510.29 1323.32 1841.15 2561.26
Capital Expenditure 496.92 786.43 717.90 949.04 1132.23 496.20 2672.05
Extraordinary Payments 295.62 244.41 234.98 224.52 157.68 488.77 573.06
Total Exp 1796.23 2359.01 2167.31 2683.85 2613.24 2826.12 5806.37
Sources 2015-16 2016-17 2017-18 2018-19 2019-20 RE AVE
Own source revenue 48% -2% 9% 2% 32% 18%
Grants 70% -30% -14% -11% 38% 11%
Sources 2015-16 2016-17 2017-18 2018-19 2019-20 RE AVE
Extraordinary receipts -36% 16% 34% -14% 4% 1%
Total Rev 50% -20% -4% -7% 32% 10%
Revenue Payments 32% -9% 24% -12% 39% 15%
Capital Payments 58% -9% 32% 19% -56% 9%
Extraordinary Payments -17% -4% -4% -30% 210% 31%
Total Exp 31% -8% 24% -3% 8% 11%
Figure 6. 9: Share of sources of revenues of Doddaballapura CMC over years
25 24 30 34 37 37 37
62 70 62 55 53 55 55
13 6 8 11 10 8 7
0%
20%
40%
60%
80%
100%
2014-15 2015-16 2016-17 2017-18 2018-19 2019-20 RE 2020-21 BE
Own source revenue Grants Extraordinary receipts

103
Figure 6. 10: Share of sources of expenditure of Doddaballapura CMC over years
Given that extraordinary receipts and extraordinary payments do not really form the
receipts and payments of the CMC, the real receipts of the CMC confine to the OSR
and the grants received. Similarly, the revenue and capital payments would
constitute the real expenditure of the CMC. This becomes more important to
understand the utilisation of funds of CMC (Table 6.6)59. The opening balance along
with the OSR and Grants together make up the funds available for the expenditure in
a year. The utilisation ranged between 53% to 73% between the years 2014-15 and
2019-20. The utilisation based on the receipts of the year excluding opening balance
was 116% and 123% in the years 2017-18 and 2018-19 the arrears from the previous
years have also been used while during the other years the CMC could not fully
utilise even the receipts of that year. While the shortage of funds has been a cause of
concern, this lower utilisation also points out to the flow of funds. The funds from
state reaching the CMC in late February or March has an impact on utilisation and
the next year utilisation is also delayed since the expenditure cannot happen without
making the budget provision for the year.
59 Extraordinary receipts - include EMD, security deposits, deductions pertaining to GST, royalty,
income tax, cesses payable to the respective authorities and recoveries of loans or advances to
employees. Extraordinary expenditure- include the refund of EMDs, security deposits, cesses paid to
authorities, deductions paid to authorities and advances for employees
56 56 56 56 5165
44
2833 33 35 43 18
46
16 10 11 8 617 10
0%
20%
40%
60%
80%
100%
2014-15 2015-16 2016-17 2017-18 2018-19 2019-20 RE 2020-21 BE
Revenue Payments Capital Payments Extraordinary Payments

104
Table 6. 6: Receipts and Expenditure of Doddaballapura CMC
(Rs. in lakhs)
2014-15 2015-16 2016-17 2017-18 2018-19 2019-20 RE 2020-21 BE
OB 253.92 545.47 1362.54 1703.14 1360.36 893.65 1251.59
OSR+ grants 1792.17 2931.66 2272.94 2116.54 1988.85 2695.29 3947.33
Total 2046.09 3477.13 3635.48 3819.68 3349.21 3588.94 5198.92
Revenue exp+ Capital exp 1500.62 2114.59 1932.33 2459.33 2455.55 2337.35 5233.31
CB 545.47 1362.54 1703.14 1360.36 893.65 1251.59 -34.39
Utilisation % total 73% 61% 53% 64% 73% 65% 101%
Utilisation % for the year* 84% 72% 85% 116% 123% 87% 133%
Note: *based on receipts for the year
Analysis of Own Source Revenues (OSR) of Doddaballapura CMC
The Own source revenues (OSR) comprises of property tax, advertisement tax, trade
license, rents from properties, water supply charges, charges related to sanitation
and SWM related as well as fees related to town planning. General revenues include
the fees fines, RTI fees, birth and death certificate, sale of tender forms, road cutting
charges, empanelment of plumbers, registration of contractors etc.
Property tax has the largest share among the OSR accounting for 45% followed by
water supply charges, charges under town planning and sanitation accounting for
20%, 8%, 8% of OSR respectively. The property tax and trade license revenues
recorded a steady positive growth rate over previous years while the water charges
and sanitation and SWM charges (including SWM cess) recorded negative growth
for at least one year in between the years 2015-16 to 2019-20. The fluctuations in the
rent revenues, advertisement tax, water and sanitation revenues also partly indicate
the changes in the tax effort owing to personnel availability at the CMC.
Table 6. 7: Own Source Revenues of Doddaballapura CMC over years
(Rs. in lakhs)
Own Source Revenue 2014-
15
2015-
16
2016-
17
2017-
18
2018-
19
2019-20
RE AVE Share
Property tax related 237.82 288.13 303.54 350.53 411.53 513.10 350.77 45%
General revenues 30.73 27.02 88.58 55.46 70.47 152.44 70.78 9%
stamp duty surcharge 0.00 0.00 7.48 22.50 18.01 10.00 9.66 1%
Advertisement tax 1.08 1.87 2.02 1.72 11.13 2.08 3.32 0%
Trade license 9.45 11.70 12.77 12.94 14.04 14.85 12.63 2%

105
Own Source Revenue 2014-
15
2015-
16
2016-
17
2017-
18
2018-
19
2019-20
RE AVE Share
Rents from properties
and land 44.62 48.34 50.78 43.80 60.05 64.07 51.94 7%
Water supply related 111.65 149.95 159.89 212.95 129.85 186.26 158.43 20%
Sanitation and SWM
related 12.05 83.28 72.06 54.00 77.59 72.75 61.96 8%
Town planning related 61.91 141.89 40.02 47.29 21.21 61.45 62.30 8%
Total 509.31 752.20 737.13 801.20 813.88 1077.01 781.79 100%
Own Source Revenue (year on
year growth)
2015-
16
2016-
17
2017-
18
2018-
19
2019-20
RE
AVE
Property tax related 21% 5% 15% 17% 25% 17%
General revenues -12% 228% -37% 27% 116% 64%
stamp duty surcharge 201% -20% -44% -32%
Advertisement tax 74% 8% -15% 546% -81% 106%
Own Source Revenue (year on
year growth)
2015-
16
2016-
17
2017-
18
2018-
19
2019-20
RE AVE
Trade license 24% 9% 1% 8% 6% 10%
Rents from properties and land 8% 5% -14% 37% 7% 9%
Water Supply related 34% 7% 33% -39% 43% 16%
Sanitation and SWM related 591% -13% -25% 44% -6% 118%
Town planning related 129% -72% 18% -55% 190% 42%
Total 48% -2% 9% 2% 32% 18%
As discussed earlier the grants form significant proportion of revenues of the CMC
accounting for nearly 60% of the receipts. Among the grants, the grants from SFC
account for major proportion. The SFC grants are provided for salary, paying the
electricity bills (for water supply and streetlighting) and also for development
purposes. The Central Finance Commission (CFC) grants are for development
(infrastructure creation) purposes and this include basic grant and performance
grant (14th CFC). Specific purpose grants include the grants for implementation of
schemes such as Swacch Bharat Abhiyaan, National Urban Livelihoods Mission,
Calamity Relief Fund/water supply grant, census grants, Karnataka Municipal
Reforms Project grants (KMRP) grants and Grants for repaying Karnataka urban
water supply and drainage board (KUWSDB) loan. The grants were also provided
for manual scavengers survey and sanitary workers housing scheme (Pourakarmika
Gruhabhagya) (Table 6.9). The salary grants together with electricity grants
accounted for 44% of the grant expenditure which is spent on salary and power
charges. The SFC untied grants, CFC grants and specific purposes grants are spent to

106
augment the basic infrastructure in the CMC area and this account for 56% of the
grant revenue. The share of untied grants was about 17% for the period 2014-15 to
2019-20.
Table 6. 8: Grant Revenues of Doddaballapura CMC Across Years
2014-
15
2015-
16
2016-
17
2017-
18
2018-
19
2019-20
RE
2020-
21 BE Share
SFC grants untied 302.90 438.29 183.03 198.15 188.71 200.00 98.00 17%
SFC Salary grants 364.86 384.54 344.51 370.04 483.55 464.20 617.02 26%
SFC electricity grants 70.93 778.90 27.91 138.80 139.00 447.96 460.00 18%
CFC grants 242.86 292.03 267.32 228.42 267.95 417.09 430.00 19%
Specific purpose grants 300.54 285.70 713.05 363.93 84.26 69.04 596.56 20%
Manual scavengers
survey grant 0.76 0.00 0.00 0.00 0.00 0.00 0.00 0%
Pourakarmika
Gruhabhagya grant 0.00 0.00 0.00 16.00 11.50 20.00 150.00 1%
Total Grants 1282.86 2179.46 1535.81 1315.34 1174.97 1618.28 2351.58 100%
Share of untied grants 24% 20% 12% 15% 16% 12% 24%
Source: Budget books of Doddaballapura CMC
Analysis of Expenditures of Doddaballapura CMC
Analysis of Revenue expenditures of Doddaballapura CMC
The average share of revenue expenditures was 55% of the total expenditures for the
period 2014-15 to 2019-20. Of the revenue expenditures, the expenditures on general
administration (office), water supply, sanitation, streetlighting, poverty alleviation
programmes form the major part. Sanitation and SWM accounting for 36% has the
highest share among the revenue expenditures while the water supply accounts for
30% of revenue expenditure. Streetlighting and poverty alleviation expenditures
account for 8% and 7% of revenue expenditure respectively (Table 6.9).
The average share of wage expenditure (salaries, outsourced expenditures, direct
payment workers, daily wages, professional fees, leave encashment etc) accounted
for 50 % of the revenue expenditure during the period 2014-15 to 2019-20. The
expenditure on outsourced/non-permanent staff accounted for an average of 30% of
the wage expenditure over the period 2014-15 to 2019-20. Majority of the outsourced
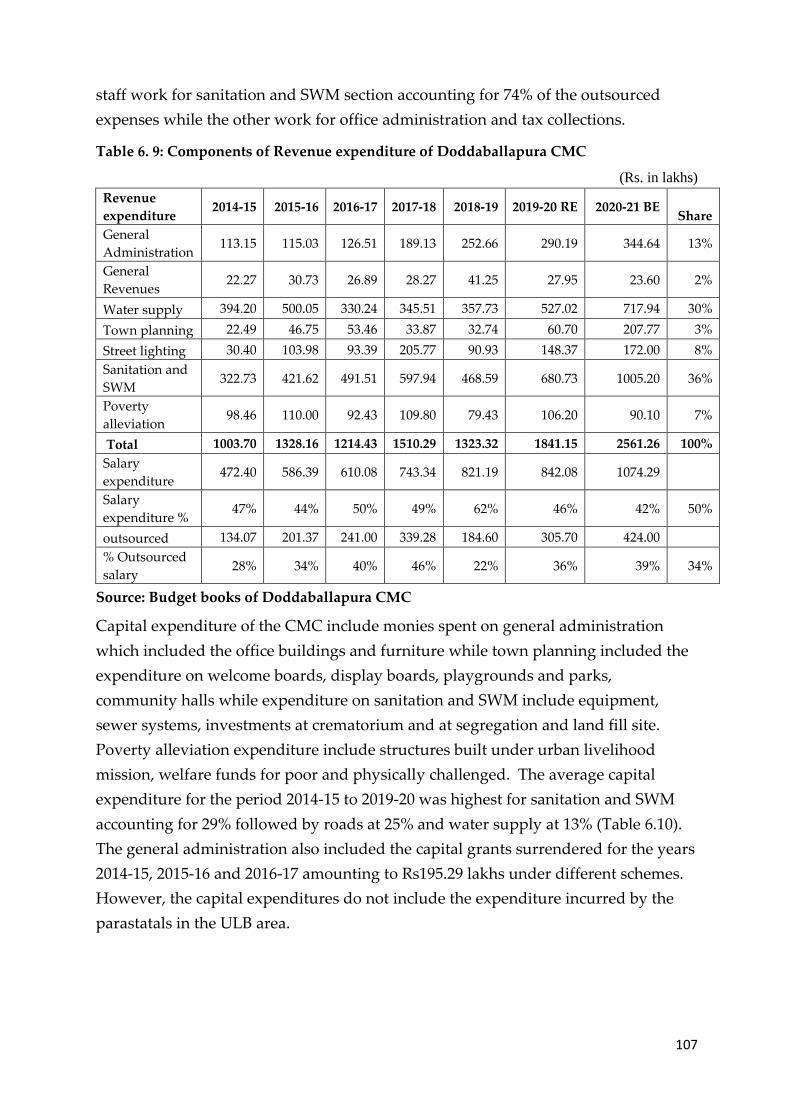
107
staff work for sanitation and SWM section accounting for 74% of the outsourced
expenses while the other work for office administration and tax collections.
Table 6. 9: Components of Revenue expenditure of Doddaballapura CMC
(Rs. in lakhs)
Revenue
expenditure 2014-15 2015-16 2016-17 2017-18 2018-19 2019-20 RE 2020-21 BE
Share
General
Administration 113.15 115.03 126.51 189.13 252.66 290.19 344.64 13%
General
Revenues 22.27 30.73 26.89 28.27 41.25 27.95 23.60 2%
Water supply 394.20 500.05 330.24 345.51 357.73 527.02 717.94 30%
Town planning 22.49 46.75 53.46 33.87 32.74 60.70 207.77 3%
Street lighting 30.40 103.98 93.39 205.77 90.93 148.37 172.00 8%
Sanitation and
SWM 322.73 421.62 491.51 597.94 468.59 680.73 1005.20 36%
Poverty
alleviation 98.46 110.00 92.43 109.80 79.43 106.20 90.10 7%
Total 1003.70 1328.16 1214.43 1510.29 1323.32 1841.15 2561.26 100%
Salary
expenditure 472.40 586.39 610.08 743.34 821.19 842.08 1074.29
Salary
expenditure % 47% 44% 50% 49% 62% 46% 42% 50%
outsourced 134.07 201.37 241.00 339.28 184.60 305.70 424.00
% Outsourced
salary 28% 34% 40% 46% 22% 36% 39% 34%
Source: Budget books of Doddaballapura CMC
Capital expenditure of the CMC include monies spent on general administration
which included the office buildings and furniture while town planning included the
expenditure on welcome boards, display boards, playgrounds and parks,
community halls while expenditure on sanitation and SWM include equipment,
sewer systems, investments at crematorium and at segregation and land fill site.
Poverty alleviation expenditure include structures built under urban livelihood
mission, welfare funds for poor and physically challenged. The average capital
expenditure for the period 2014-15 to 2019-20 was highest for sanitation and SWM
accounting for 29% followed by roads at 25% and water supply at 13% (Table 6.10).
The general administration also included the capital grants surrendered for the years
2014-15, 2015-16 and 2016-17 amounting to Rs195.29 lakhs under different schemes.
However, the capital expenditures do not include the expenditure incurred by the
parastatals in the ULB area.

108
Table 6. 10: Capital expenditure of Doddaballapura CMC over years
(Rs. in lakhs) 2014-15 2015-16 2016-17 2017-18 2018-19 2019-20 RE 2020-21 BE Share
General
Administration 74.49 142.57 130.73 25.68 266.17 206.52 526.75 18%
Poverty
Alleviation 13.77 9.32 44.51 0.00 16.34 32.52 246.28 3%
Roads 154.56 199.48 153.85 364.38 249.83 31.04 320.64 25%
Sanitation and
SWM 124.03 308.99 181.51 261.05 338.09 120.14 825.48 29%
Streetlighting 29.74 37.08 61.45 63.12 51.00 16.53 35.00 6%
Town planning 0.00 36.72 7.95 79.75 115.09 13.60 543.25 6%
Water supply 100.33 52.27 137.91 155.06 95.72 75.86 174.65 13%
Grand Total 496.92 786.43 717.90 949.04 1132.23 496.20 2672.05 100%
Source: Budget books of Doddaballapura CMC
Sanitation and SWM expenditure Analysis
The SWM and sanitation management are being done together by the ULB under the
public health section and engineering section. Thus, the salaries of the section
(comprising of environment engineer, senior health inspector, health inspector and
others) who supervise both the sanitation and SWM in the ULB is combined and is
difficult to separate this component between SWM and sanitation. However, the
salaries have been split between SWM and sanitation in the ratio of their
expenditures excluding the salaries to arrive at expenditures of SWM and sanitation
separately.
The expenditure on sanitation includes the construction and maintenance of sewer
systems, Sewerage treatment plants, public toilets and road side drains. This
expenditure is highest under capital expenses followed by salaries paid for sanitation
activity accounting for 37% and 32% respectively. The wages account for 10% of the
sanitation expenditure (Table 6.11) and these expenditures are payments made for
workers who work on daily wage basis or being outsourced to agencies (which
supply human labour) for carrying out the activity while the O&M sanitation which
include non-wage expenditures (fuel charges, maintenance of road side drains
including cleaning and repairs, protective gears, consumables and repairs of sewer
systems) accounted for 21% for the period 2014-15 to 2019-20.

109
Table 6. 11: Sanitation expenditure of Doddaballapura CMC over years
(Rs. in lakhs)
Sanitation 2014-15 2015-16 2016-17 2017-18 2018-19 2019-
20 RE
2020-21
BE Ave Share
Wages
Sanitation 31.79 41.26 38.09 0.00 18.49 126.00 144.00 42.60 10%
O&M
Sanitation 33.85 63.75 87.18 120.19 82.66 152.56 334.04 90.03 21%
Capital
Sanitation 31.61 156.44 132.67 235.45 295.69 119.84 600.06 161.95 37%
Salaries
Sanitation 79.67 111.79 114.97 102.20 216.82 216.24 274.02 140.28 32%
Total 176.92 373.24 372.91 457.84 613.67 614.63 1352.12 434.87 100%
Source: Budget books of Doddaballapura CMC
The expenditure on SWM includes door to door collection of waste, segregation of
waste, maintenance of segregation site, MSW processing unit, bio mining and land
fill site. The wages accounted for 8% of the SWM expenditure (Table 6.12) and these
expenditures are payments made for workers who work on daily wage basis or
being outsourced to agencies (which supply human labour) for carrying out the
activity. Salaries paid under SWM accounted for 32% while the capital expenditure
accounted for 21% of the expenditure. The O&M sanitation which include non-wage
expenses (fuel charges, segregation activity including cleaning, protective gears,
consumables and repairs of vehicles meant for SWM) expenditure was highest which
accounted for 39% for the period 2014-15 to 2019-20.
Table 6. 12: SWM expenditure of Doddaballapura CMC over years
(Rs. in lakhs)
SWM 2014-
15
2015-
16
2016-
17
2017-
18
2018-
19
2019-20
RE
2020-21
BE Ave
Shar
e
O&M SWM 55.91 95.88 144.64 250.01 43.94 70.41 148.65 110.13 39%
Capital SWM 92.42 152.54 48.84 25.60 42.40 0.30 225.42 60.35 21%
Wages SWM 0.00 1.90 14.10 35.99 38.48 50.00 7.50 23.41 8%
Salaries SWM 121.51 107.03 92.52 89.54 68.20 65.52 96.98 90.72 32%
Total 269.84 357.36 300.10 401.15 193.01 186.23 478.55 284.62 100%
Source: Budget books of Doddaballapura CMC
The Salaries paid to Permanent Staff (Sanitation and SWM together) is 64% whereas
Wages paid to Direct Labour and Outsourced from Private Agencies (Sanitation and
SWM together) is only 18%. On the other hand, when it comes to the headcount
Permanent Staff are 74/ 42.5% and Direct Labour & Outsourced from Private

110
Agencies are 100 / 57.5%. This shows the huge disparity in salaries which varies
depending upon the mode of employment even though they are all performing the
same sanitation/SWM task.
The revenues from the SWM by way of collection of SWM cess, sale of recyclable
materials, scrap, sale of compost together averaged at about Rs. 22 lakhs per year for
the period 2014-15 to 2019-20 (Table 6.13). The sanitation revenues averaged about
Rs. 40 lakhs per year for the same period. The SWM collections has seen a big dip
during the year 2018-19 and 2019-20. The UGD monthly maintenance charges has
been proposed to be collected every year however, no collections have been done till
date against the estimates while the one-time UGD connection charges have been
collected (but yet to be 100% collected from all the households that have UGD
connection).
Table 6. 13: Revenues from SWM and Sanitation of Doddaballapura CMC
(Rs. in lakhs)
Particulars 2014-
15
2015-
16
2016-
17
2017-
18
2018-
19
2019-20
RE
2020-21
BE
Sale of Compost 0.94 2.91 1.78 10.00
Sale of Stores & Scrap 4.91 2.51 0.05 2.84 0.52 0.00 2.00
SWM cess 23.49 23.38 27.39 15.36 25.51 30.00
Receipts from SWM 4.91 26.00 23.43 31.18 18.79 27.30 42.00
Pay & Use toilet user Charges 3.64 2.72 14.40 1.68 3.49 18.85 9.00
UGD Monthly Charges 0.00 0.00 0.00 0.00 0.10 0.00 84.00
UGD Connection Charges 0.00 52.95 33.82 20.77 55.20 26.51 100.00
User Charges (Sucking Machine) 3.50 1.61 0.42 0.38 0.00 0.10 0.30
Receipts from Sanitation 7.14 57.28 48.63 22.82 58.80 45.46 193.30
Total Receipts from SWM and
Sanitation 12.05 83.28 72.06 54.00 77.59 72.75 235.30
Source: Budget books of Doddaballapura CMC
The expenditure of sanitation and SWM was compared with the receipts obtained by
providing these services including that of the charges obtained for these services.
The average revenues collected from the SWM and sanitation for the period 2014-15
to 2019-20 was Rs 62 lakhs while the amount spent was about Rs. 497 lakhs for O &M
and Rs. 222 lakhs as capital expenditure for the same period (Table 6.14). The
revenues accounted for 12% of the revenue expenditure incurred for the period 2014-
15 to 2019-20.
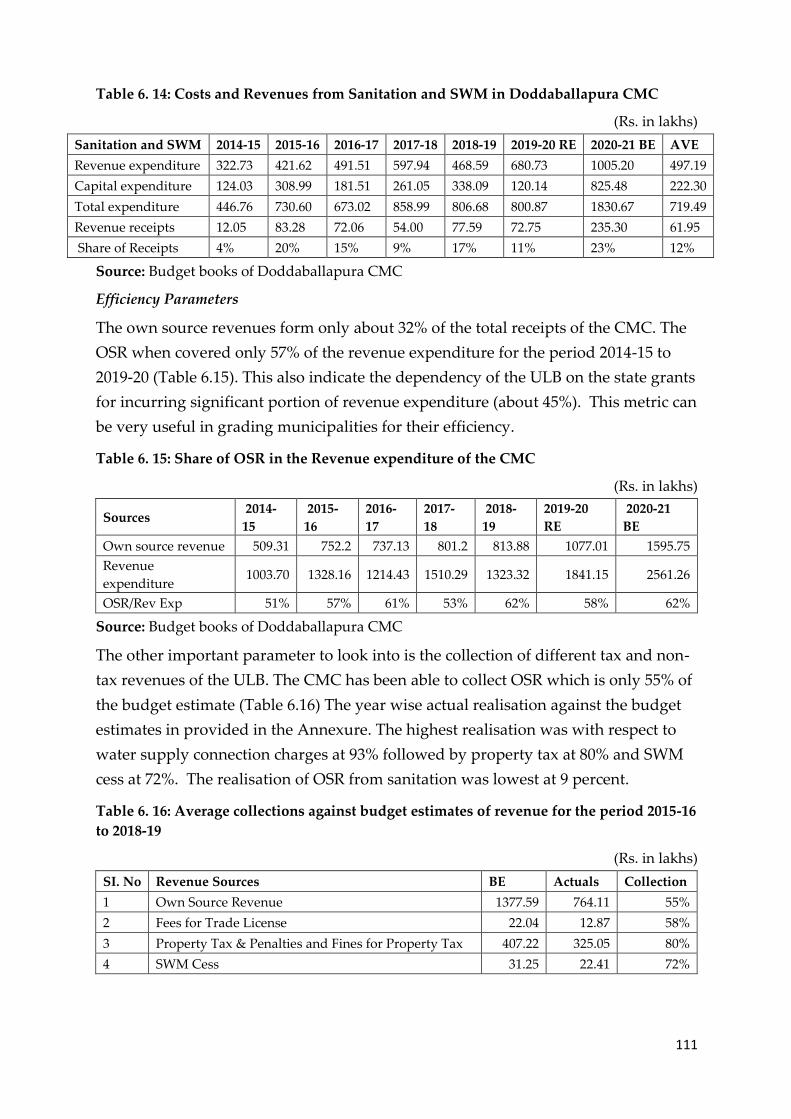
111
Table 6. 14: Costs and Revenues from Sanitation and SWM in Doddaballapura CMC
(Rs. in lakhs)
Sanitation and SWM 2014-15 2015-16 2016-17 2017-18 2018-19 2019-20 RE 2020-21 BE AVE
Revenue expenditure 322.73 421.62 491.51 597.94 468.59 680.73 1005.20 497.19
Capital expenditure 124.03 308.99 181.51 261.05 338.09 120.14 825.48 222.30
Total expenditure 446.76 730.60 673.02 858.99 806.68 800.87 1830.67 719.49
Revenue receipts 12.05 83.28 72.06 54.00 77.59 72.75 235.30 61.95
Share of Receipts 4% 20% 15% 9% 17% 11% 23% 12%
Source: Budget books of Doddaballapura CMC
Efficiency Parameters
The own source revenues form only about 32% of the total receipts of the CMC. The
OSR when covered only 57% of the revenue expenditure for the period 2014-15 to
2019-20 (Table 6.15). This also indicate the dependency of the ULB on the state grants
for incurring significant portion of revenue expenditure (about 45%). This metric can
be very useful in grading municipalities for their efficiency.
Table 6. 15: Share of OSR in the Revenue expenditure of the CMC
(Rs. in lakhs)
Sources 2014-
15
2015-
16
2016-
17
2017-
18
2018-
19
2019-20
RE
2020-21
BE
Own source revenue 509.31 752.2 737.13 801.2 813.88 1077.01 1595.75
Revenue
expenditure 1003.70 1328.16 1214.43 1510.29 1323.32 1841.15 2561.26
OSR/Rev Exp 51% 57% 61% 53% 62% 58% 62%
Source: Budget books of Doddaballapura CMC
The other important parameter to look into is the collection of different tax and non-
tax revenues of the ULB. The CMC has been able to collect OSR which is only 55% of
the budget estimate (Table 6.16) The year wise actual realisation against the budget
estimates in provided in the Annexure. The highest realisation was with respect to
water supply connection charges at 93% followed by property tax at 80% and SWM
cess at 72%. The realisation of OSR from sanitation was lowest at 9 percent.
Table 6. 16: Average collections against budget estimates of revenue for the period 2015-16
to 2018-19
(Rs. in lakhs)
SI. No Revenue Sources BE Actuals Collection
1 Own Source Revenue 1377.59 764.11 55%
2 Fees for Trade License 22.04 12.87 58%
3 Property Tax & Penalties and Fines for Property Tax 407.22 325.05 80%
4 SWM Cess 31.25 22.41 72%

112
SI. No Revenue Sources BE Actuals Collection
5 Water supply User Charges 321.92 143.37 45%
6 Water supply connection Charges 20.50 19.06 93%
7 OSR From SWM (sale of products) 11.55 2.44 21%
8 UGD connection charges 175.00 40.68 23%
9 OSR From Sanitation 65.52 6.20 9%
Source: Budget books of Doddaballapura CMC
Different respondents shared their own personal views on how the ULB can
mobilize more resources. According to the municipal commissioner Doddaballapura
CMC needs to construct new municipal buildings in commercial areas and get rental
income for the same. He also felt that construction of new parks and creating tourism
spots around lakes can also help generate revenues for the ULB. On the other hand,
the environmental engineer felt that the revenue collection system should be first
improved as there is significant gap between the projected demand and actual
collection of revenues. Timely collection of UGD connection fees, service charges and
rigorously implementing fines on those who violate sanitation and SWM rules can
itself help in generating more revenues for the CMC. The accounts superintendent
gave a fairly interesting perspective on newer ways to mobilizing revenues.
According to him, all agencies and institutions that use land owned by the ULB for
activities such as laying electric posts, pipelines and underground cables should pay
the ULB monthly rent apart from the one-time fees.
6.1.6. Observations from the Budget books and audit reports of the
Doddaballapura CMC
The budget books were not sufficient to understand the receipts and payments and
the abstract of receipts and payments maintained by the ULB were also used to
ascertain the finances. The budgets were not prepared fully in line with the KMABR
2006.
The audit reports (conducted by State Accounts Department) for the year 2016-17
and 2017-18 were also referred to understand the issues with the municipal finances.
The budget estimates for both receipts and expenditure are very high and un
realistic. The budget copies were not sent to the local audit circle despite the
requirement for the same.
About Rs. 10.35 crore received as grants from centre and state was kept in the PD
account as the action plans were not prepared. Instead of 4 bank accounts for 4
113
schemes (NULM, SBM, Ashraya housing, SAS) to be implemented by ULB, 17 bank
accounts were opened against the instructions of the state government. Of the 46
bank accounts maintained by the ULB, 5 are current accounts (has amounts over 80
lakhs) which yield no interest and this seems to be overlooked by the ULB.
The cesses collected have not been paid by the ULB to the respective authorities and
the pending amount by the end of the year 2017-18 was Rs. 1.66 crore. The
deductions in the form of Income tax, royalty, service tax collected by ULB during
the process of implementation of works has not been remitted fully and the balance
stands at Rs. 1.26 crore.
The Demand Collection and Balance (DCB register) for shops owned by the ULB is
not maintained properly and the difference between the collections and the estimates
by the auditors amounted to Rs. 36 lakhs more than what was collected by the ULB.
The audit fees have not been paid in full by the ULB since 2010-11 and the balance to
be paid at the end of the year 2017-18 was Rs. 36 lakhs. (Average annual fees was
about 8 lakhs)
The amount placed under objection due to non-production of vouchers and details of
expenditure has been increasing over the years.
6.1.7. Status and Welfare of Manual Scavengers
At present there aren’t any officially recognised manual scavengers working within
Doddaballapura CMC limits. During a survey carried out in 2013, seven manual
scavengers were identified by the ULB to receive benefits under the Self-
Employment Scheme for Rehabilitation of Manual Scavengers (SRMS). However, till
date, only two out of the seven identified manual scavengers have been provided
housing under the SRMS scheme. Incidents of death due to manual scavenging has
also been reported in Doddaballapura CMC. In 2016, four people died of
asphyxiation in a manhole while trying to unclog a blockage in the UGD. After the
2013 survey, two additional surveys were conducted in 2018 and 2019 but no new
manual scavengers were identified. During our field work, a few sanitation workers
informed us that they continue to clear faecal matter that clog open drains within the
old city limits or in the STP. According to the ULB officials, only if a person touches
faecal matter with his/ her bare hands can it be considered as manual scavenging
while cleaning and carrying faecal matter with proper safety gears such as gloves
and shovels isn’t.

114
During the 2013 National Manual Scavengers (MS) Survey carried out by the
Ministry of Social Justice and Empowerment, seven manual scavengers were
identified to be working within Doddaballapura ULB limits and hence eligible for
receiving benefits under the Self-Employment Scheme for Rehabilitation of Manual
Scavengers (SRMS). A report submitted by the ULB to the local district
administration mentions that it coordinated with the NSKFDC to provide an OTCA
of Rs 40,000 for six out of the seven identified manual scavengers via the Dr. B. R.
Ambedkar Development Corporation Limited (The State Channelizing Agency).
Apart from this, no other loans or skill development training was provided to these
identified manual scavengers through the various other schemes being implemented
by the NSKFDC. On the other hand, the ULB provided direct financial assistance to
some of these identified Manual Scavengers by utilizing the Karnataka Scheduled
Castes Sub Plan and Tribal Sub Plan (Planning, Allocation and Utilisation of
Financial Resources) that mandates them to spend 24.1% of their total budget
on SC/ST welfare (17.15% for SCs and 6.95% for STs). From this fund, the ULB
provided Rs. 25000 to one of the manual scavengers to open a vegetable stall, Rs.
50000 to another manual scavenger to support his existing business and Rs. 71000
each to two manual scavengers to start a handloom business and a provision store.
Each year, the ULB also allocates about 20% from this fund towards the welfare of
sanitation/SWM workers who have been hired as permanent staff. This is being used
towards medical expenses reimbursement and providing education scholarship for
the children of sanitation workers. The Deputy Commissioner (DC) can approve
medical expense reimbursement of up to Rs. one lakh and beyond that the
Directorate of Municipal Administration (DMA) is empowered to approve on a case-
to-case basis. The children of sanitation workers (only those who are permanent staff
of ULB) are also being provided with an annual education scholarship of Rs. 6000
which is applicable from the secondary education level onwards. Additionally,
through the Pourakarmika Gruha Bhagya Yojana – A scheme launched by Karnataka
government, permanent sanitation/SWM workers are entitled to receive Rs. 7.5 lakhs
(Rs. 6 lakhs as contribution from the State Government and Rs. 1.5 lakhs from
convergence with the Pradhan Mantri Awas Yojana) towards the construction of
pucca houses. Any additional expenses beyond the ceiling of Rs. 7.5 lakhs should
either be borne by the ULB or the beneficiary. Table 6.8 in the ULB finances section
provides details about the grants received by the ULB under the Pourakarmika
Gruha Bhagya scheme. It also indicates a budget estimate of Rs 1.50 Crores for the
year 2020-21. The ULB also provides free health checkups to all its’s sanitation/SWM

115
workers – both permanent staff and private agencies. Other benefits include the
Employee Provident Fund (EPF) and Employee State Insurance (ESI), wherein the
employer’s contribution to both EPF and ESI is being paid either by the ULB or
private agencies. Apart from these, the ULB does not specifically interact with the
state government on any other components such as educational loans, skills training
and loans.
After the 2013 MS survey, an additional MS survey was conducted in 2018 but no
new manual scavengers were identified by the ULB. The ULB has a quarterly
meeting with the NSKFDC wherein details regarding the implementation of various
schemes along with the list of eligible beneficiaries are discussed. The NSKDFC then
independently acts on providing scheme related benefits to the beneficiaries
identified by the ULB. The NSKFDC also interacts with the ULB whenever a
complaint regarding a manual scavenging incident gets reported to them through
either citizens or NGOs. The NSKFDC then coordinates with the ULB to ensure legal
action is taken against the concerned authorities and penalize them if found guilty of
committing this act.
It is interesting to note that while the ULB has taken on the responsibility of
supervising potentially hazardous tasks such as cleaning of sewers and septic tanks,
the actual work is carried out only by labour that is outsourced from private agencies
and not by any of the permanent staff of the ULB. The ULB informed us that the
latest technological appliances for cleaning of sewers and septic tanks (such as
jetting, desilting and suction machines) are being used so that it eliminates the need
for any manual handling of excreta. However, incidents of death due to manual
scavenging has also been reported in Doddaballapura CMC. In 2016, four people
died of asphyxiation in a manhole while trying to unclog a blockage in the UGD. The
ULB has been regularly conducting awareness sessions on manual scavenging and
the legal ramifications associated with it. During our field work, a few sanitation
workers informed us that they continue to clear faecal matter that clog open drains
within the old city limits or in the STP. According to the ULB officials that we
interviewed, only if a worker directly touches faecal matter with his/ her bare hands
does it get defined as a manual scavenging act while doing the same with proper
safety gears such as gloves and shovels isn’t.

116
6.2. Hosur City Municipal Corporation (HCMC)Tamil Nadu State
6.2.1. Profile of HCMC
Hosur is an industrial hub in Krishnagiri district (Tamil Nadu), located 40 kms
southwest of Bangalore. It is home to 1500+ automobile and manufacturing
industries such as TVS Motors, Ashok Leyland, Hindustan Lever, Titan and many
more. There are plans for the development of Special Economic Zones near Hosur
which will further boost urbanisation and development of the region. Proximity to
Bangalore is seen as a huge advantage with many IT companies setting up their
operations in Electronic City which is less than a half hour drive from Hosur. The
estimated population growth of Hosur between the years 2015-2020 was a staggering
49.88%. Thus, Hosur was upgraded as Hosur City Municipal Corporation (HCMC)
in March 2019. The profile of HCMC has been summarized in the below table:
Table 6. 17: Profile of HCMC
SI. No Parameter Hosur
1 Population as per 2011 census 24535460
2 Category wise-breakup (General, OBC, SC/ST etc) as per 2011 census General & OBC- 220694
SC- 24005
ST-655
3 Sex Ratio as per 2011 census 933
4 Total Number of Households as per 2011 census 82220
5 Percentage of Population living in Slums 5.17
6 Geographical Area (Sq. Km) 72.41
7 Number of Wards 45
8 Length of Roads (Km) 666.34
9 Water Supply in LPCD 90
10 Percentage of Households having individual toilets 98
11 Percentage of households with flush/pour-flush latrine connected to a
septic tank* 56
12 Percentage of households with flush/pour-flush latrine connected to a
single or twin pit** 0
13 Percentage of households with flush/pour-flush latrine that are
connected to a piped sewer system*** 16
14 Length of Sewer System Not Applicable
15 Length of Drainages (Km) 334
16 Percentage of household with no drainage system (No underground,
covered pucca, open pucca or open kutcha drainages) 20
17 Percentage of households whose sewage generated is treated. 16
18 STP Capacity (MLD) Not Applicable
60 328880 as per 2020 survey
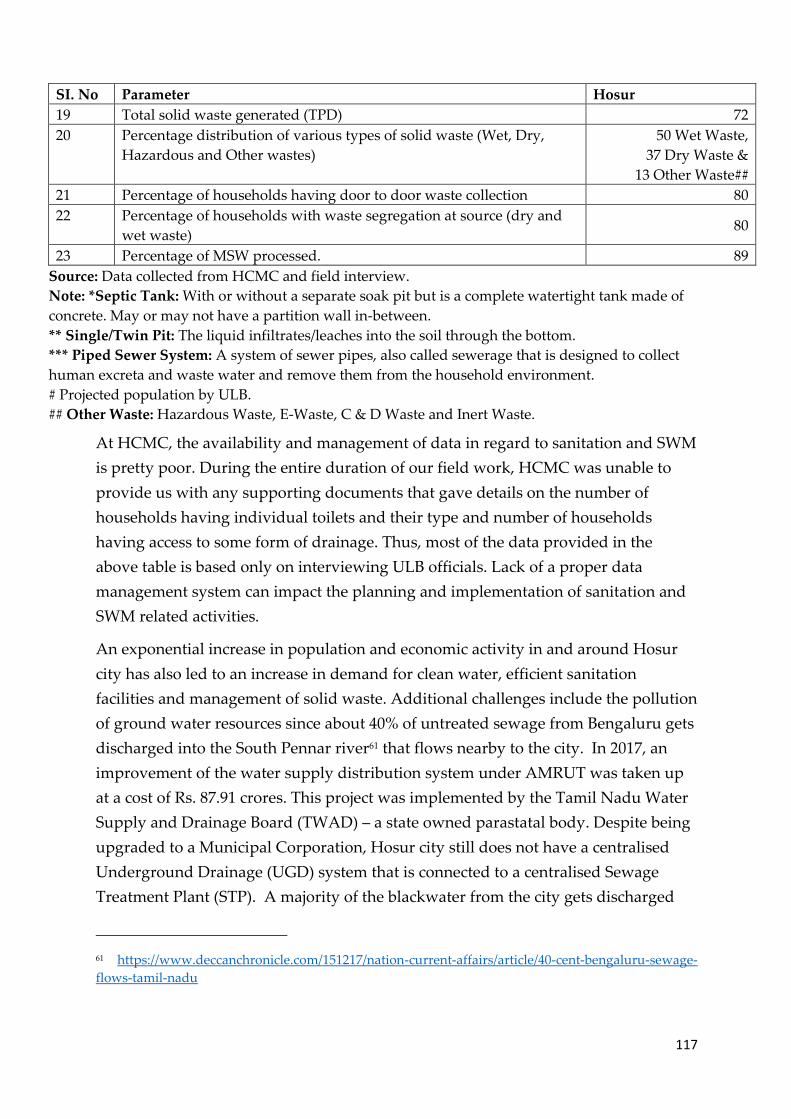
117
SI. No Parameter Hosur
19 Total solid waste generated (TPD) 72
20 Percentage distribution of various types of solid waste (Wet, Dry,
Hazardous and Other wastes)
50 Wet Waste,
37 Dry Waste &
13 Other Waste##
21 Percentage of households having door to door waste collection 80
22 Percentage of households with waste segregation at source (dry and
wet waste) 80
23 Percentage of MSW processed. 89
Source: Data collected from HCMC and field interview.
Note: *Septic Tank: With or without a separate soak pit but is a complete watertight tank made of
concrete. May or may not have a partition wall in-between.
** Single/Twin Pit: The liquid infiltrates/leaches into the soil through the bottom.
*** Piped Sewer System: A system of sewer pipes, also called sewerage that is designed to collect
human excreta and waste water and remove them from the household environment.
# Projected population by ULB.
## Other Waste: Hazardous Waste, E-Waste, C & D Waste and Inert Waste.
At HCMC, the availability and management of data in regard to sanitation and SWM
is pretty poor. During the entire duration of our field work, HCMC was unable to
provide us with any supporting documents that gave details on the number of
households having individual toilets and their type and number of households
having access to some form of drainage. Thus, most of the data provided in the
above table is based only on interviewing ULB officials. Lack of a proper data
management system can impact the planning and implementation of sanitation and
SWM related activities.
An exponential increase in population and economic activity in and around Hosur
city has also led to an increase in demand for clean water, efficient sanitation
facilities and management of solid waste. Additional challenges include the pollution
of ground water resources since about 40% of untreated sewage from Bengaluru gets
discharged into the South Pennar river61 that flows nearby to the city. In 2017, an
improvement of the water supply distribution system under AMRUT was taken up
at a cost of Rs. 87.91 crores. This project was implemented by the Tamil Nadu Water
Supply and Drainage Board (TWAD) – a state owned parastatal body. Despite being
upgraded to a Municipal Corporation, Hosur city still does not have a centralised
Underground Drainage (UGD) system that is connected to a centralised Sewage
Treatment Plant (STP). A majority of the blackwater from the city gets discharged
61 https://www.deccanchronicle.com/151217/nation-current-affairs/article/40-cent-bengaluru-sewage-
flows-tamil-nadu

118
into nearby open land or water bodies. The Tamil Nadu Sustainable Urban
Development Project (TNSUDP)62 funded by the World Bank aims at improving
urban services delivery in the participating ULB’s, HCMC being one of them. Under
the TNSUDP, a UGD system along with a STP is currently being undertaken by the
HCMC.
6.2.2. Water Supply, Sanitation and Solid Waste Management (SWM)
system
Figure 6. 11: Water Supply and Sanitation Ecosystem
Source: Compiled by CBPS Team
Note: Grey Water: Water from kitchen and bathroom sinks, showers, tubs and
washing machines.
Black Water: Water from toilets that contains urine and faecal matter.
62 The Tamil Nadu Urban Infrastructure Financial Services Limited (TNUIFSL) – a parastatal body
manages the Tamil Nadu Urban Development Fund (TNUDF) to financially implement the Tamil Nadu
Sustainable Urban Development Project (TNSUDP) being externally funded by the World Bank for an
amount of USD $600 million.
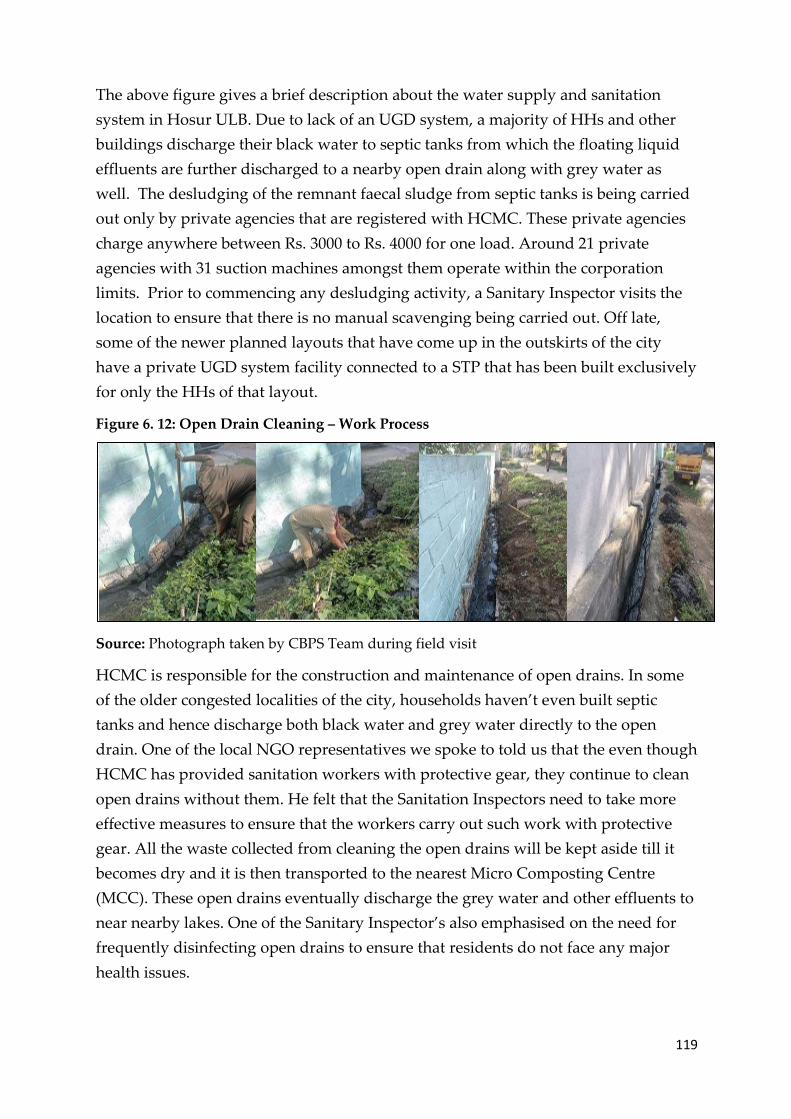
119
The above figure gives a brief description about the water supply and sanitation
system in Hosur ULB. Due to lack of an UGD system, a majority of HHs and other
buildings discharge their black water to septic tanks from which the floating liquid
effluents are further discharged to a nearby open drain along with grey water as
well. The desludging of the remnant faecal sludge from septic tanks is being carried
out only by private agencies that are registered with HCMC. These private agencies
charge anywhere between Rs. 3000 to Rs. 4000 for one load. Around 21 private
agencies with 31 suction machines amongst them operate within the corporation
limits. Prior to commencing any desludging activity, a Sanitary Inspector visits the
location to ensure that there is no manual scavenging being carried out. Off late,
some of the newer planned layouts that have come up in the outskirts of the city
have a private UGD system facility connected to a STP that has been built exclusively
for only the HHs of that layout.
Figure 6. 12: Open Drain Cleaning – Work Process
Source: Photograph taken by CBPS Team during field visit
HCMC is responsible for the construction and maintenance of open drains. In some
of the older congested localities of the city, households haven’t even built septic
tanks and hence discharge both black water and grey water directly to the open
drain. One of the local NGO representatives we spoke to told us that the even though
HCMC has provided sanitation workers with protective gear, they continue to clean
open drains without them. He felt that the Sanitation Inspectors need to take more
effective measures to ensure that the workers carry out such work with protective
gear. All the waste collected from cleaning the open drains will be kept aside till it
becomes dry and it is then transported to the nearest Micro Composting Centre
(MCC). These open drains eventually discharge the grey water and other effluents to
near nearby lakes. One of the Sanitary Inspector’s also emphasised on the need for
frequently disinfecting open drains to ensure that residents do not face any major
health issues.
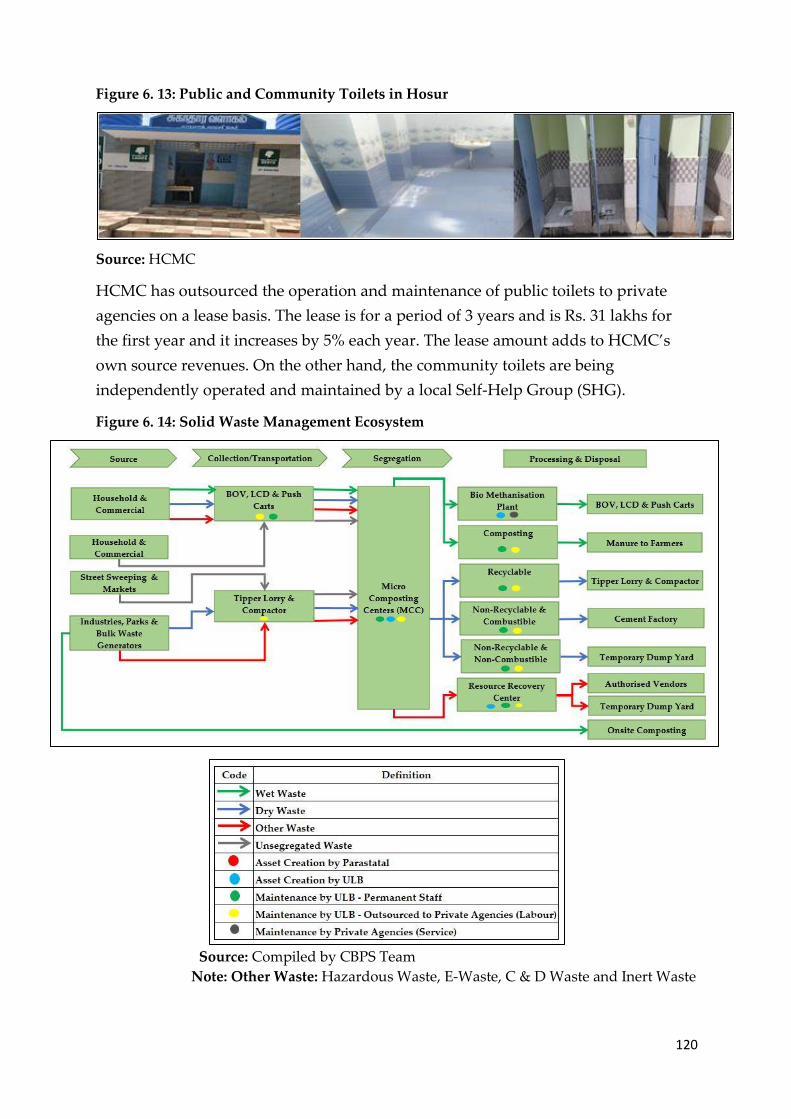
120
Figure 6. 13: Public and Community Toilets in Hosur
Source: HCMC
HCMC has outsourced the operation and maintenance of public toilets to private
agencies on a lease basis. The lease is for a period of 3 years and is Rs. 31 lakhs for
the first year and it increases by 5% each year. The lease amount adds to HCMC’s
own source revenues. On the other hand, the community toilets are being
independently operated and maintained by a local Self-Help Group (SHG).
Figure 6. 14: Solid Waste Management Ecosystem
Source: Compiled by CBPS Team
Note: Other Waste: Hazardous Waste, E-Waste, C & D Waste and Inert Waste
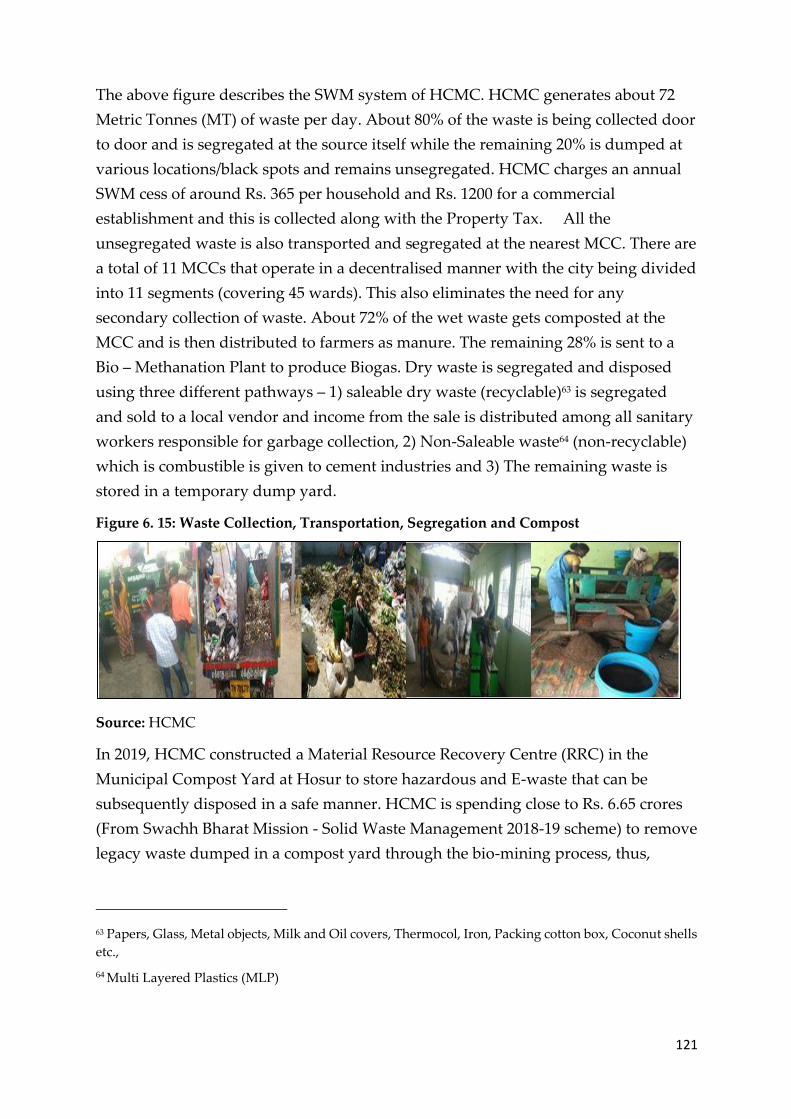
121
The above figure describes the SWM system of HCMC. HCMC generates about 72
Metric Tonnes (MT) of waste per day. About 80% of the waste is being collected door
to door and is segregated at the source itself while the remaining 20% is dumped at
various locations/black spots and remains unsegregated. HCMC charges an annual
SWM cess of around Rs. 365 per household and Rs. 1200 for a commercial
establishment and this is collected along with the Property Tax. All the
unsegregated waste is also transported and segregated at the nearest MCC. There are
a total of 11 MCCs that operate in a decentralised manner with the city being divided
into 11 segments (covering 45 wards). This also eliminates the need for any
secondary collection of waste. About 72% of the wet waste gets composted at the
MCC and is then distributed to farmers as manure. The remaining 28% is sent to a
Bio – Methanation Plant to produce Biogas. Dry waste is segregated and disposed
using three different pathways – 1) saleable dry waste (recyclable)63 is segregated
and sold to a local vendor and income from the sale is distributed among all sanitary
workers responsible for garbage collection, 2) Non-Saleable waste64 (non-recyclable)
which is combustible is given to cement industries and 3) The remaining waste is
stored in a temporary dump yard.
Figure 6. 15: Waste Collection, Transportation, Segregation and Compost
Source: HCMC
In 2019, HCMC constructed a Material Resource Recovery Centre (RRC) in the
Municipal Compost Yard at Hosur to store hazardous and E-waste that can be
subsequently disposed in a safe manner. HCMC is spending close to Rs. 6.65 crores
(From Swachh Bharat Mission - Solid Waste Management 2018-19 scheme) to remove
legacy waste dumped in a compost yard through the bio-mining process, thus,
63 Papers, Glass, Metal objects, Milk and Oil covers, Thermocol, Iron, Packing cotton box, Coconut shells
etc.,
64 Multi Layered Plastics (MLP)
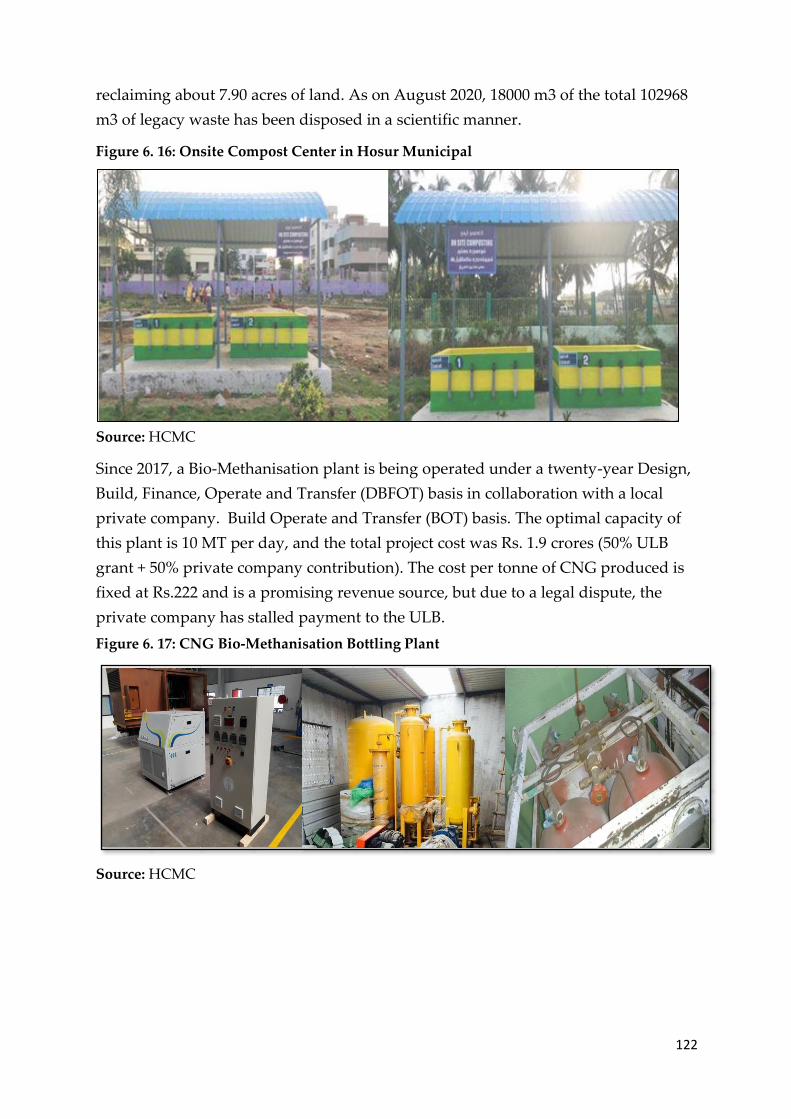
122
reclaiming about 7.90 acres of land. As on August 2020, 18000 m3 of the total 102968
m3 of legacy waste has been disposed in a scientific manner.
Figure 6. 16: Onsite Compost Center in Hosur Municipal
Source: HCMC
Since 2017, a Bio-Methanisation plant is being operated under a twenty-year Design,
Build, Finance, Operate and Transfer (DBFOT) basis in collaboration with a local
private company. Build Operate and Transfer (BOT) basis. The optimal capacity of
this plant is 10 MT per day, and the total project cost was Rs. 1.9 crores (50% ULB
grant + 50% private company contribution). The cost per tonne of CNG produced is
fixed at Rs.222 and is a promising revenue source, but due to a legal dispute, the
private company has stalled payment to the ULB.
Figure 6. 17: CNG Bio-Methanisation Bottling Plant
Source: HCMC

123
6.2.3. Organisational Chart and Governance Structure in Relation to
Sanitation/SWM
The figure below describes the functions and responsibilities of the HCMC in
relation to SWM and sanitation related activities. The Engineering Section (ES)65 and
Public Health Section (PHS)66 are responsible for SWM and sanitation activities in
Hosur ULB. All the civil works,67 procurement, repair and maintenance of
equipment, vehicles and machinery will be handled by the ES. The PHS is
responsible for cleaning open drains, street sweeping, waste collection, waste
transportation, segregation, waste processing and disposal. The revenue section is
responsible for tax collection while the general section looks into all the
administration related activities. The municipal commissioner is the key nodal officer
and is responsible for planning and coordinating with other departments and
parastatals. The CMA acts as a bridge between the HCMC and the state government.
Figure 6. 18: Organisation Chart
Source: Compiled by CBPS Team
HCMC can independently take up any civil work in relation to sanitation and SWM
as long as the cost estimate of the work is less than Rs. 2 crores. Beyond Rs. 2 crores,
HCMC needs to get an administrative sanction from the CMA. Subsequently, the
ULB can identify a contractor and is also responsible for the overall supervision of
65 Engineering Section: Municipal engineer, Junior Engineer, Overseer and Draughtsman
66 Public Health Section: Six sanitary workers, 11 sanitary supervisor, 179 permanent sanitary workers
and 520 sanitary workers outsourced from private agency
67 Construction of drains, public & community toilets
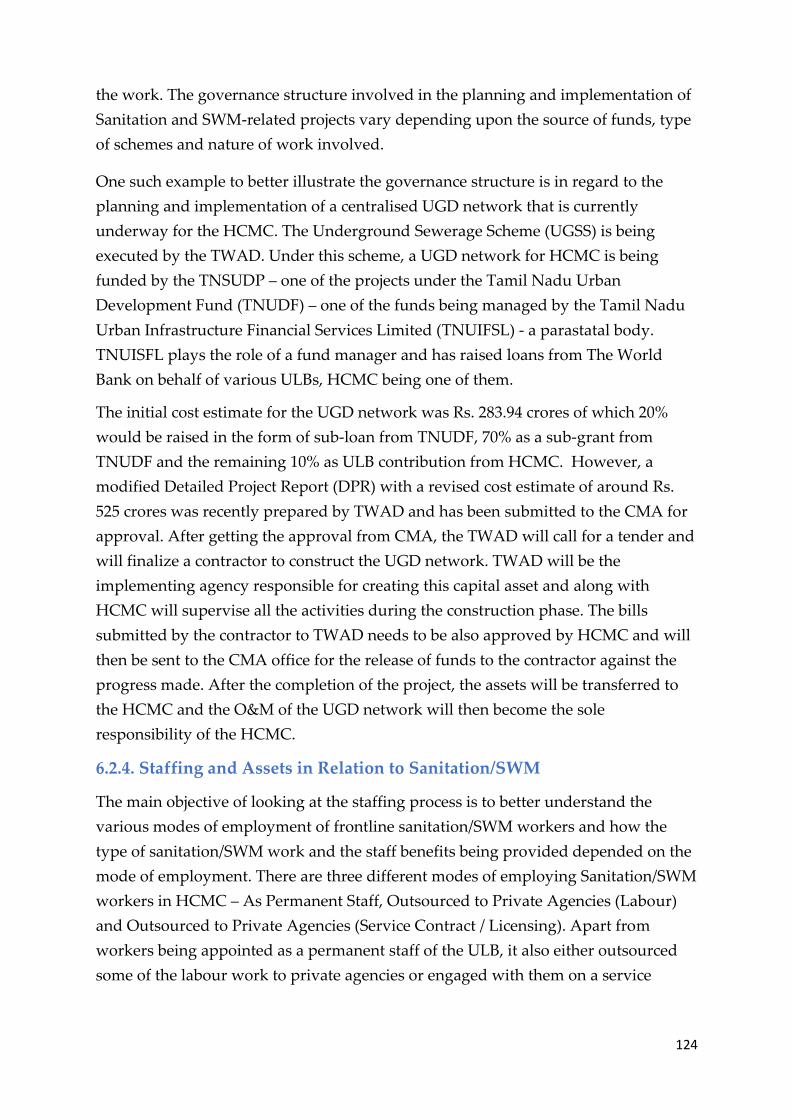
124
the work. The governance structure involved in the planning and implementation of
Sanitation and SWM-related projects vary depending upon the source of funds, type
of schemes and nature of work involved.
One such example to better illustrate the governance structure is in regard to the
planning and implementation of a centralised UGD network that is currently
underway for the HCMC. The Underground Sewerage Scheme (UGSS) is being
executed by the TWAD. Under this scheme, a UGD network for HCMC is being
funded by the TNSUDP – one of the projects under the Tamil Nadu Urban
Development Fund (TNUDF) – one of the funds being managed by the Tamil Nadu
Urban Infrastructure Financial Services Limited (TNUIFSL) - a parastatal body.
TNUISFL plays the role of a fund manager and has raised loans from The World
Bank on behalf of various ULBs, HCMC being one of them.
The initial cost estimate for the UGD network was Rs. 283.94 crores of which 20%
would be raised in the form of sub-loan from TNUDF, 70% as a sub-grant from
TNUDF and the remaining 10% as ULB contribution from HCMC. However, a
modified Detailed Project Report (DPR) with a revised cost estimate of around Rs.
525 crores was recently prepared by TWAD and has been submitted to the CMA for
approval. After getting the approval from CMA, the TWAD will call for a tender and
will finalize a contractor to construct the UGD network. TWAD will be the
implementing agency responsible for creating this capital asset and along with
HCMC will supervise all the activities during the construction phase. The bills
submitted by the contractor to TWAD needs to be also approved by HCMC and will
then be sent to the CMA office for the release of funds to the contractor against the
progress made. After the completion of the project, the assets will be transferred to
the HCMC and the O&M of the UGD network will then become the sole
responsibility of the HCMC.
6.2.4. Staffing and Assets in Relation to Sanitation/SWM
The main objective of looking at the staffing process is to better understand the
various modes of employment of frontline sanitation/SWM workers and how the
type of sanitation/SWM work and the staff benefits being provided depended on the
mode of employment. There are three different modes of employing Sanitation/SWM
workers in HCMC – As Permanent Staff, Outsourced to Private Agencies (Labour)
and Outsourced to Private Agencies (Service Contract / Licensing). Apart from
workers being appointed as a permanent staff of the ULB, it also either outsourced
some of the labour work to private agencies or engaged with them on a service

125
contract / licensing basis. The below table when perused column-wise, provides
more details on the three different modes of employment of Sanitation/SWM
workers, the type of sanitation/SWM work being carried out by each one of them
and the nature of interaction between the ULB and the private agencies.
Table 6. 18: Modes of Employment of Sanitation/SWM Workers
Em
plo
yer
Hosur City Municipal
Corporation (HCMC) Private Agencies (Labour)
Private Agencies (Services &
Licensing)
Mo
de
of
Em
plo
ym
ent
Permanent Workers
(Part of the ULB staff)
1. Labour is outsourced to
private agencies
2. Workers are fully
dedicated only for work
allocated and managed
by the ULB.
1. Private agencies either have a
multi-year service contract or
operate through a licensing mode.
2. The work allocation is
completely managed by the
private agency.
Ty
pe
of
wo
rk S
anit
atio
n
1. Cleaning of Open
Drains.
1. Cleaning of Open
Drains.
1. Desludging of Septic Tanks
2. Maintenance of Public &
Community Toilets
SW
M
2. Waste collection,
transportation,
segregation, processing
& disposal.
3. Street & Bus stand
sweeping.
1. Waste collection,
transportation,
segregation, processing &
disposal.
2. Street & Bus stand
sweeping.
3. Machine Operator/
Helpers at MCC
1. Processing of Hazardous & E-
Wastes.
2. Collection and Processing of Bio-
Medical Waste.
Sta
keh
old
er r
ole
s
Go
ver
nm
ent
(UL
B)
1. Recruitment of
Workers
2. Providing Training to
Workers
3. Payments to
sanitation and SWM
workers
4. Periodic Health
Check-ups for workers
5. Providing Safety
Gears/ Equipment and
Vehicles for Sanitation
and SWM activities
1. Selection of the
Contractor
2. Payment to the
Contractor
3. Work Supervision.
4. Providing Equipment
and Vehicles for Sanitation
and SWM activities
1. Developing Standard Operating
Procedures (SOPs) / Service
Contract.
2. Registration and providing
license to Desludging Operators
3. Monitoring Work

126
Em
plo
yer
Hosur City Municipal
Corporation (HCMC) Private Agencies (Labour)
Private Agencies (Services &
Licensing)
7. Providing Land MCC,
MRC and temporary
dump yard
No
n-G
ov
ern
men
t
Not Applicable
1. Recruiting the Workers
2. Payment to the Workers
(PF & ESI)
3. Providing Training to
Workers
4. Periodic Health Check-
ups
5. Providing Safety Gears /
PPE
1. Execute as per terms of
license/service contract
2. Providing Safety Gears / PPE.
3. Informing sanitary inspector
before desludging
4. Providing suction machine for
desludging.
5. Processing & Disposal of Faecal
Sludge. Source: Compiled by CBPS Team
As per the government order68, HCMC is entitled to engage 1250 permanent
sanitation/SWM workers but CMA has sanctioned only 250 of them. At present the
HCMC has appointed 17969 permanent workers and remaining 71 posts are still
vacant. To manage the work load HCMC has also outsourced 520 more workers
from private agencies. A majority of these outsourced workers are involved in door-
to-door garbage collection and segregating waste at the MCC’s. Compared to the
number of workers hired as permanent staff of the ULB, the strength of workers
outsourced from private agencies is almost three times more. According to an ex-
councillor, one of the main reasons for this disparity is that outsourced workers are
paid lesser than permanent staff and hence it results in a lesser financial burden to
the HCMC. Apart from this, about 124 sanitation workers are involved only in the
desludging of septic tanks which is completely being handled by private operators
on a licensing basis.
68 GO Ms. No. 101. dated 30.4.97
69 Currently 148 permanent workers are working as SW. The remaining 31 permanent workers are
divided in the following manner - 25 workers diverted to water supply; 6 workers are involved in office
cleaning.
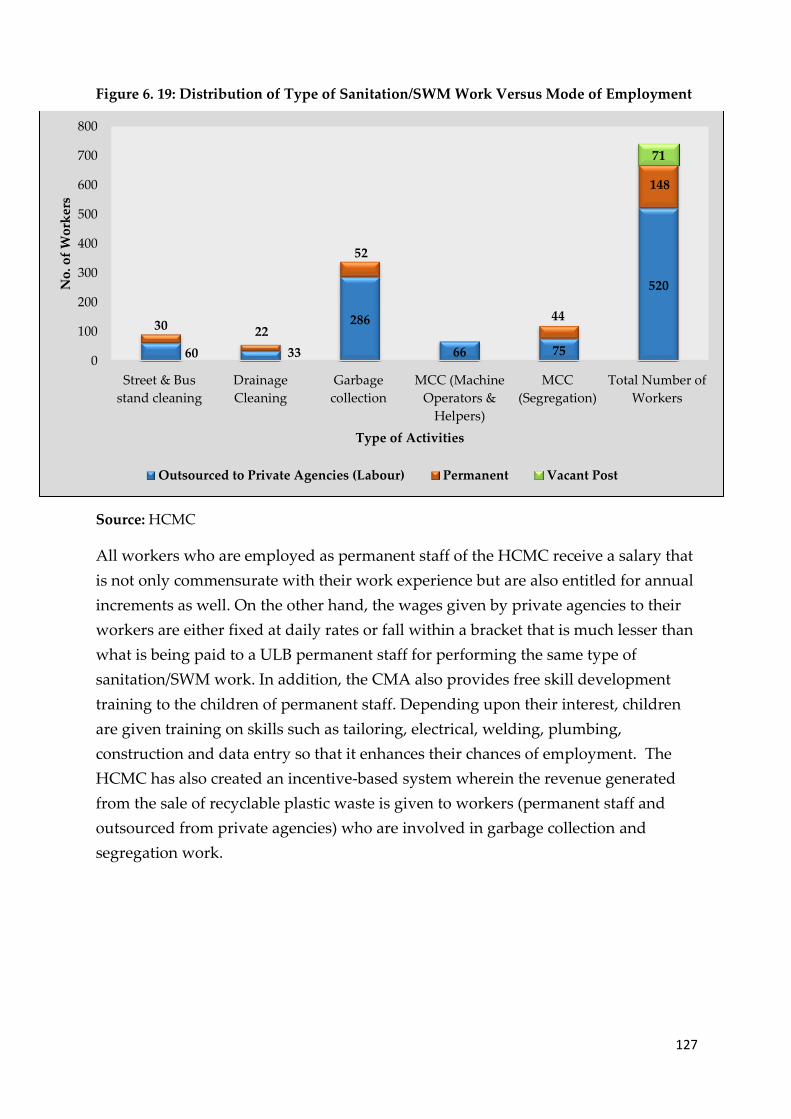
127
Figure 6. 19: Distribution of Type of Sanitation/SWM Work Versus Mode of Employment
Source: HCMC
All workers who are employed as permanent staff of the HCMC receive a salary that
is not only commensurate with their work experience but are also entitled for annual
increments as well. On the other hand, the wages given by private agencies to their
workers are either fixed at daily rates or fall within a bracket that is much lesser than
what is being paid to a ULB permanent staff for performing the same type of
sanitation/SWM work. In addition, the CMA also provides free skill development
training to the children of permanent staff. Depending upon their interest, children
are given training on skills such as tailoring, electrical, welding, plumbing,
construction and data entry so that it enhances their chances of employment. The
HCMC has also created an incentive-based system wherein the revenue generated
from the sale of recyclable plastic waste is given to workers (permanent staff and
outsourced from private agencies) who are involved in garbage collection and
segregation work.
60 33
286
66 75
520
30 22
52
44
148
71
0
100
200
300
400
500
600
700
800
Street & Bus
stand cleaning
Drainage
Cleaning
Garbage
collection
MCC (Machine
Operators &
Helpers)
MCC
(Segregation)
Total Number of
Workers
No
. of
Wo
rker
s
Type of Activities
Outsourced to Private Agencies (Labour) Permanent Vacant Post

128
Table 6. 19: Salaries and Other Benefits Given to Workers Based on Their Mode of
Employment
Monthly Gross Salary
Range (in Rs.) Working
Hours Off Days* Leaves Other Benefits
Min Max
UL
B P
erm
anen
t S
taff
23494 51269 8 Sunday
1. Casual Leaves:
12 days
2. Encashment
Leaves:15 days
3. Medical leave
(ML)70
1. Health Check-
up
2. Annual
Increment
4. PF
5. Skill Develop
Training to
Children
Ou
tso
urc
ed t
o P
riv
ate
Ag
enci
es (
Lab
ou
r)
Not
Applicable
495
per/day 71 8
No official off
days. The
workers need
to negotiate it
with their
superiors.
No official
leaves. The
workers need to
negotiate it with
their superiors.
1. Health Check-
up
2. PF
3. ESI
Pri
vat
e A
gen
cies
(Ser
vic
es)
10000 15000 No fixed
time
No official off
days. The
workers need
to negotiate it
with their
superiors.
No official off
days. The
workers need to
negotiate it with
their superiors.
1. Provide
Housing facilities.
Source: CBPS field interviews
Note: *During rainy season, both permanent workers and workers who are outsourced to
private agencies need to work seven days.
CMA also sanctions the number of posts based on the population of the ULB.
Through the Government Employment Exchange, the ULB will screen applications
that matches with the job description. In case, they do not find a suitable match in
terms of the application, they will advertise the same in local newspapers. The
70 Workers with 5 to 10 years of experience can get one month of Medical Leave (ML), workers with 10
to 15 years of work experience can take up to 60 days of ML and workers with more than 15 years of
experience can avail up to 180 days of ML.
71 Rs. 330/- in hand after PF and ESI deduction.

129
applicants will be shortlisted by the ULB based on their qualification and experience
and a list of shortlisted applicants will be sent to CMA to get an approval. To
outsource the workers from a private agency, the ULB calls for a tender. The private
agencies will then quote their tender amount. The first criterion for selection is the
agency that has quoted the least amount. The second criterion for selection is the
experience of the company in providing sanitation/SWM related services. The
private agencies are fully responsible for their own staffing and the ULB does not
involve in the same.
The HCMC owns all the machineries72 and vehicles73 required for sanitation/SWM
related activities except suction machines that are required for desludging septic
tanks. According to the junior engineer we interviewed, from many decades private
operators have been in the business of desludging household septic tanks and hence
the ULB decided to bring in only a registration/licensing process so that all the
private operators adhere to standard operating procedures and inform the ULB prior
to undertaking any desludging work. About 31 suction machines are currently in
operation across the 21 registered private agencies.
6.2.5. HCMC Finances
The municipalities in Tamil Nadu are governed by the Districts Municipalities Act
1920, Municipal Corporation Act. The accounts of the municipalities are maintained
as per the Tamil Nadu Municipal Accounting Manual (MAM)74 in the lines of
National Municipal Accounting Manual. The important sources of revenues of an
ULB in Tamil Nadu state government both in the form of tied (specific purpose) and
untied grants, Own source revenues (OSR) and assigned revenues.
The key own source revenues include the property tax- general, water supply and
drainage tax and elementary education tax. The other important tax sources include
professional tax, advertisement tax and tax on carriage and animals. The important
fees include metered/tap water charges, trade license fees, market fees, slaughter
house fees, parking fees and fees for pay and use toilets. All of taxes which are part
72 Machineries- Fogging Machineries- Mini - 12, Mega – 6, Waste Processing Machines- 11 and Waste
Shredding Machines- 4.
73 Vehicles: BOV- 136, LCV- 25, Tractor Trailer - 1, Tipper Truck - 9 and Compactor -1
74 https://www.tnurbantree.tn.gov.in/wp-content/uploads/2020/10/Municipal-Account-Manual.pdf -
This also stipulates double entry accrual-based accounting system.

130
of these own source revenues are collected by the ULB while the rates are stipulated
by the state government.
The assigned revenue includes the surcharge on stamp duty levied for the
registration of properties in the jurisdiction of the ULB and the entertainment tax
which are collected by the state and transferred to the ULB. However, this revenue
is delayed in reaching ULB more often than not and ULB has no clue till it gets it.
Overall, the own revenues of the ULB are subject to tax effort and updated tax base
with very little or no scope to do in terms of tweaking the rates.
The grants from state government usually referred to as State Finance Commission
grants or Devolution fund comes in the untied form. The other grants include CFC
grants and the grants for capital works or capital grants.
The Tamil Nadu municipal budgets are to be prepared on the lines of the Municipal
Budget Manual75 both in abstract (Appendix VI) and detailed form (Appendix VII).
However, the budgets of the Hosur City Municipal Corporation did not prepare the
budgets in the prescribed manner. The financial status of the ULB has been analysed
using the audited statements for the year 2014-15 to 2018-19 which had Income-
Expenditure statements and Trial Balance sheets76. While the statements were
available, the observations of the audit were not available.
Total Receipts and Expenditure of Hosur City Municipal Corporation
The receipts and expenditure of Hosur City Municipal Corporation77 is presented in
the table 6.21 The receipts have grown significantly at an average annual rate of 18%
from 2014-15 to 2018-19 from Rs. 6501 lakhs to Rs. 11905 lakhs. The expenditure also
has grown from Rs. 4766 lakhs to Rs. 8919 lakhs for the same period recording an
average annual growth of 17%. The yea-on-year growth was highest for receipts
during 2018-19 while it was highest for expenditure during 2016-17.
75 http://117.202.8.226/SSII_DOCUMENTS/MUNICIPAL_BUDGET_MANUAL_TNUDPIII.pdf
76 http://www.tnbudget.tn.gov.in/tnweb_files/SFC/5th%20SFC%20REPORT.pdf ( page 163- extraction
of actual receipts and charges code wise is not possible with the existing software)
77 Few clarifications are being sought about the receipts and expenditure with the HCMC accountant
and the figures would be revised soon. (minor changes)

131
Table 6. 20: Receipts and Expenditure of HCMC (Rs. in lakhs) with year-on-year growth
(%)
2014 -15 AC 2015-16 AC 2016-17 AC 2017-18 AC 2018-19 AC
Receipts 6501.15 6253.14 6900.28 8318.23 11905.43
Expenditure 4766.83 5934.13 7395.04 8208.75 8919.45
Savings/deficit 1734.33 319.01 -494.76 109.48 2985.99
Receipts (Y-o-Y)
-4% 10% 21% 43%
Expenditure
24% 25% 11% 9%
Source: Audited Accounts of HCMC
The chief Own source revenues (OSR) comprises of property tax general, water and
drainage tax, elementary education78 along with library cess collected at the rate of
14.6% of the annual rateable value79 which is collected twice a year on a half yearly
basis. Others include the professional tax, advertisement tax, trade license, rents
from properties, water supply charges, charges related to sanitation related as well
as fees related to town planning. Other revenues include the fees fines, sale of tender
forms, interests from investments, rent from buildings owned by HCMC and road
cutting charges. SFC grants/ Devolution fund, CFC grants and Capital grants from
state government also form part of the revenues of the ULB.
The revenues of the HCMC have grown significantly over the period 2014-15 to
2018-19 from Rs. 6501 lakhs to Rs. 11905.43 lakhs recording an average growth of
21% on a year-on-year basis (Table 6.21). The devolution fund forms the important
source of revenue which accounts for 30% of the revenue followed by own tax
revenues which account for 25%. Other revenues which include rent from buildings,
interest from investments, market fees, water supply charges etc forms about 21% of
the total revenues of the ULB. The CFC grants and Capital grants accounted for 7%
and 13% of the total revenues respectively. The devolution fund, CFC grants and
capital grants together account for 50% of the average revenues of the HCMC
indicating the dependency on the transfers from the state. The sanitation related
revenues accounted for mere one percent of the revenues of the HCMC.
78 Half Yearly Tax = Base Street Rate (BSR) x Area of the Building x 135.40 (Factor)
795.75%- gen, 5.25% water and drainage, education 2.5% and library cess 1.1% total 14.6%
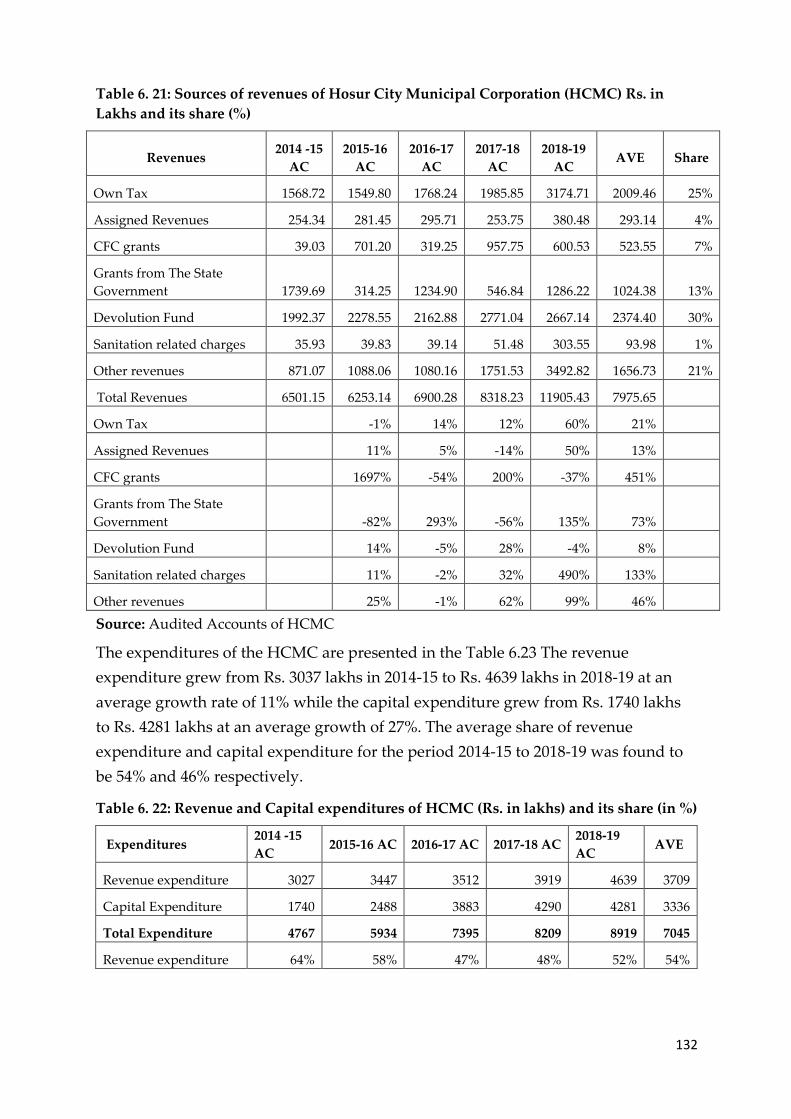
132
Table 6. 21: Sources of revenues of Hosur City Municipal Corporation (HCMC) Rs. in
Lakhs and its share (%)
Revenues 2014 -15
AC
2015-16
AC
2016-17
AC
2017-18
AC
2018-19
AC AVE Share
Own Tax 1568.72 1549.80 1768.24 1985.85 3174.71 2009.46 25%
Assigned Revenues 254.34 281.45 295.71 253.75 380.48 293.14 4%
CFC grants 39.03 701.20 319.25 957.75 600.53 523.55 7%
Grants from The State
Government 1739.69 314.25 1234.90 546.84 1286.22 1024.38 13%
Devolution Fund 1992.37 2278.55 2162.88 2771.04 2667.14 2374.40 30%
Sanitation related charges 35.93 39.83 39.14 51.48 303.55 93.98 1%
Other revenues 871.07 1088.06 1080.16 1751.53 3492.82 1656.73 21%
Total Revenues 6501.15 6253.14 6900.28 8318.23 11905.43 7975.65
Own Tax -1% 14% 12% 60% 21%
Assigned Revenues 11% 5% -14% 50% 13%
CFC grants 1697% -54% 200% -37% 451%
Grants from The State
Government -82% 293% -56% 135% 73%
Devolution Fund 14% -5% 28% -4% 8%
Sanitation related charges 11% -2% 32% 490% 133%
Other revenues 25% -1% 62% 99% 46%
Source: Audited Accounts of HCMC
The expenditures of the HCMC are presented in the Table 6.23 The revenue
expenditure grew from Rs. 3037 lakhs in 2014-15 to Rs. 4639 lakhs in 2018-19 at an
average growth rate of 11% while the capital expenditure grew from Rs. 1740 lakhs
to Rs. 4281 lakhs at an average growth of 27%. The average share of revenue
expenditure and capital expenditure for the period 2014-15 to 2018-19 was found to
be 54% and 46% respectively.
Table 6. 22: Revenue and Capital expenditures of HCMC (Rs. in lakhs) and its share (in %)
Expenditures 2014 -15
AC 2015-16 AC 2016-17 AC 2017-18 AC
2018-19
AC AVE
Revenue expenditure 3027 3447 3512 3919 4639 3709
Capital Expenditure 1740 2488 3883 4290 4281 3336
Total Expenditure 4767 5934 7395 8209 8919 7045
Revenue expenditure 64% 58% 47% 48% 52% 54%
133
Expenditures 2014 -15
AC 2015-16 AC 2016-17 AC 2017-18 AC
2018-19
AC AVE
Capital Expenditure 36% 42% 53% 52% 48% 46%
Revenue expenditure 14% 2% 12% 18% 11%
Capital Expenditure 43% 56% 10% 0% 27%
Source: Audited Accounts of HCMC
Among the revenue expenditures, operating expenses covering the operations of
street lighting, water supply, sanitation and solid waste management accounted for
45% while the salaries accounted for 32% of the revenue expenditures of the HCMC
(Table 6.24). The repair and maintenance expenditure which included the repairs
and maintenance of heavy and light vehicles, maintenance charges paid to Tamil
Nadu Water supply and Drainage Board (TWAD) and repairs of roads, buildings,
drains and machineries accounted for 17% of the revenue expenditure while the
administrative expenses accounted for 6%. The salaries grew at an annual average
rate of 16% while the operating expenses and repairs and maintenance expenditure
grew by 15% and 12% respectively.
Table 6. 23: Revenue Expenditures of the HCMC (Rs. in lakhs) and its share (in %)
Expenditures 2014 -15 AC 2015-16 AC 2016-17 AC 2017-18 AC 2018-19 AC AVE Share
Salaries 958.69 926.30 1144.09 1309.55 1682.67 1204.26 32%
Administrative expenses 356.00 216.20 223.57 142.77 198.25 227.36 6%
Operating Expenses 1231.22 1517.74 1571.86 1841.46 2127.43 1657.94 45%
Repair and Maintenance 481.24 785.61 571.76 624.77 630.02 618.68 17%
Others 0.14 0.71 0.85 0.05 0.15 0.38 0%
Total 3027.29 3446.56 3512.13 3918.59 4638.53 3708.62 100%
Salaries -3% 24% 14% 28% 16%
Administrative expenses -39% 3% -36% 39% -8%
Operating Expenses 23% 4% 17% 16% 15%
Repair and Maintenance 63% -27% 9% 1% 12%
Source: Audited Accounts of HCMC
The capital expenditures incurred from different urban development projects are
collated as project expenditures and it is very difficult to ascertain the capital
expenditures by sectors such as water supply, sanitation, streetlighting or building
construction. However, the information available through the income and
expenditure statement the capital expenditures80 relating to sanitation and solid
waste management were extracted to see the expenditure share in the total
80 Since the capital expenditures relating to projects also have drainage/SWM/sanitation components,
the expenditures are lesser to that extent.
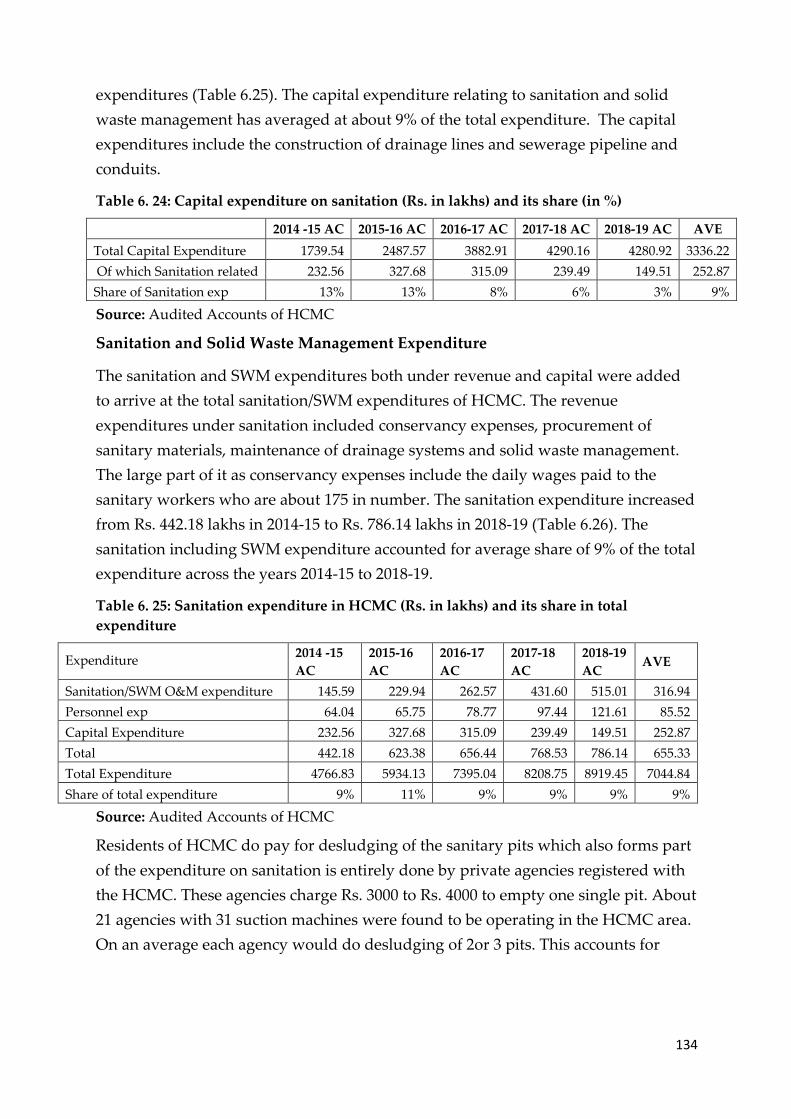
134
expenditures (Table 6.25). The capital expenditure relating to sanitation and solid
waste management has averaged at about 9% of the total expenditure. The capital
expenditures include the construction of drainage lines and sewerage pipeline and
conduits.
Table 6. 24: Capital expenditure on sanitation (Rs. in lakhs) and its share (in %)
2014 -15 AC 2015-16 AC 2016-17 AC 2017-18 AC 2018-19 AC AVE
Total Capital Expenditure 1739.54 2487.57 3882.91 4290.16 4280.92 3336.22
Of which Sanitation related 232.56 327.68 315.09 239.49 149.51 252.87
Share of Sanitation exp 13% 13% 8% 6% 3% 9%
Source: Audited Accounts of HCMC
Sanitation and Solid Waste Management Expenditure
The sanitation and SWM expenditures both under revenue and capital were added
to arrive at the total sanitation/SWM expenditures of HCMC. The revenue
expenditures under sanitation included conservancy expenses, procurement of
sanitary materials, maintenance of drainage systems and solid waste management.
The large part of it as conservancy expenses include the daily wages paid to the
sanitary workers who are about 175 in number. The sanitation expenditure increased
from Rs. 442.18 lakhs in 2014-15 to Rs. 786.14 lakhs in 2018-19 (Table 6.26). The
sanitation including SWM expenditure accounted for average share of 9% of the total
expenditure across the years 2014-15 to 2018-19.
Table 6. 25: Sanitation expenditure in HCMC (Rs. in lakhs) and its share in total
expenditure
Expenditure 2014 -15
AC
2015-16
AC
2016-17
AC
2017-18
AC
2018-19
AC AVE
Sanitation/SWM O&M expenditure 145.59 229.94 262.57 431.60 515.01 316.94
Personnel exp 64.04 65.75 78.77 97.44 121.61 85.52
Capital Expenditure 232.56 327.68 315.09 239.49 149.51 252.87
Total 442.18 623.38 656.44 768.53 786.14 655.33
Total Expenditure 4766.83 5934.13 7395.04 8208.75 8919.45 7044.84
Share of total expenditure 9% 11% 9% 9% 9% 9%
Source: Audited Accounts of HCMC
Residents of HCMC do pay for desludging of the sanitary pits which also forms part
of the expenditure on sanitation is entirely done by private agencies registered with
the HCMC. These agencies charge Rs. 3000 to Rs. 4000 to empty one single pit. About
21 agencies with 31 suction machines were found to be operating in the HCMC area.
On an average each agency would do desludging of 2or 3 pits. This accounts for

135
about Rs. 1.5- 2 lakhs and works out to about Rs. 18 -24 lakhs per annum (current
prices- 2020) which should also be added to the sanitation expenditure of HCMC.
Recovery of Sanitation and SWM expenditures.
The sanitation/SWM expenditures were compared with the revenues raised through
the charges levied for sanitation by the HCMC. The revenues raised accounted for
less than 20% of the costs incurred for sanitation and SWM services during the year
2014-15 to 2018-19 (Table 6.27). During the year 2018-19, owing to the increased collection
of SWM cess due to revised rates of property taxes the sanitation expenditure was covered
by the receipts to the tune of 48%.
Table 6. 26: Sanitation Expenditure and Receipts from Sanitation of HCMC
(Rs. In lakhs)
2014 -15 AC 2015-16 AC 2016-17 AC 2017-18 AC 2018-19 AC AVE
Sanitation charges 35.93 39.83 39.14 51.48 303.55 93.98
Sanitation Expenditure 442.18 623.38 656.44 768.53 786.14 655.33
Receipts/Expenditure 17% 13% 11% 10% 48% 20%
Source: Audited Accounts of HCMC
6.2.6. Status and Welfare of Manual Scavengers
From the past three years, the HCMC has officially not identified any manual
scavengers. According to the ULB officials we interviewed; no manual scavenging
activity is taking place within HCMC limits. About 10 % of the HHs do not have
septic tanks and hence they directly discharge black water to the adjacent open
drain. The sanitation workers responsible for cleaning such open drains will in all
likelihood come in direct contact with faecal sludge. Since a vast majority of the
households are not connected to a UGD network, the sanitation workers who
desludge septic tanks and work under registered private agencies may also come in
direct contact with faecal sludge. However, according to a ULB official and ex-
councillor, only if an individual gets inside a manhole/drain and touches faecal
matter with his bare hands then it is defined as manual scavenging. The official also
mentioned that just cleaning the open drains cannot be termed as manual
scavenging.
The Hosur City Municipal Corporation (HCMC) hasn’t identified a single manual
scavenger over the last 5 years despite conducting an annual survey. Hence, no one
has been found to be eligible for SRMS and the corresponding OTCA of Rs. 40,000.
Neither was any information available with the ULB in regard to the implementation

136
of SRMS or for that matter any other schemes offered by the NSKFDC. None of the
sanitary workers in HCMC (both permanent staff and outsourced from private
agencies) that we spoke to are even aware of any scheme such as SRMS.
However, The Commissionerate of Municipal Administration (CMA), Tamil Nadu
provides a three-to-four-day skill development training for the children of only those
sanitation workers who have been appointed as permanent staff of the ULB.
Depending upon their interest, the children receive training on skills such as
tailoring, electrical, welding, plumbing, construction and data entry so that it
enhances their chances of getting employment in a different sector. Apart from this,
HCMC also regularly provides training to its own permanent staff but only on
Sanitation and SWM related activities. These trainings are conducted three to four
times a year and the cost of the training is borne by the State Government. At the end
of this training, the ULB conducts a test and gives away non-cash awards to a few of
the top performers. Apart from this, HCMC has also initiated an incentive-based
system wherein, the revenue generated from the sale of recyclable plastic waste is
distributed among sanitation workers (both permanent staff and outsourced from
private agencies) who are involved in door-to-door garbage collection. The ULB
officials we interviewed informed us that they do not have any interaction with the
NSKFDC. Other benefits include the Employee Provident Fund (EPF) and Employee
State Insurance (ESI), wherein the employer’s contribution to both EPF and ESI is
being paid either by the ULB or private agencies. Apart from these, the ULB does
not specifically interact with the state government on any other components such as
educational loans, skills training and loans.
The ULB officials informed us that there is no manual scavenging activity taking
place within HCMC limits. HCMC doesn’t have an Underground Drainage (UGD)
system. Due to lack of an UGD system, a majority of Households and other buildings
discharge their black water to septic tanks from which the floating liquid effluents
are further discharged to a nearby open drain along with grey water as well. The
desludging of the remnant faecal sludge from septic tanks is being carried out only
by private agencies that are registered with the HCMC. Prior to commencing any
desludging activity of these septic tanks, a Sanitary Inspector from the HCMC is
required to inspect the location and ensure that appropriate machinery for cleaning
of septic tanks is being used by private agencies and that there isn’t any need for
manual handling of excreta.

137
However, about 10 % of the HHs do not have septic tanks and hence they directly
discharge black water to the adjacent open drain. The sanitation workers responsible
for cleaning such open drains will in all likelihood come in direct contact with faecal
sludge. According to ULB officials and also an ex-councillor, only if an individual
gets inside a manhole/drain and comes in direct contact with faecal matter should it
be considered as manual scavenging. Cleaning of open drains that perhaps contain
faecal matter is not considered as manual scavenging as long as the sanitation
workers use proper safety gear. The sanitation workers (both ULB permanent staff
and outsourced from private agencies) also concurred with this view on what
constitutes manual scavenging. However, one of the local NGO’s we spoke to
highlighted that even though HCMC provides sanitation workers with safety gear,
they are seldom used by the sanitation workers while cleaning open drains.

138
Chapter 7: Recommendations of 15th Finance Commission for
the Sanitation and SWM services in ULBs
7.1. Empowering Local Governments
• The 15th Finance Commission recommends grants of Rs. 4,36,361 crores for local
governments for the five-year period 2021-26. It also has advocated for a fixed
amount of grants for Local Governments rather than a proportion of the
divisible pool of taxes to ensure greater predictability of the quantum and timing
of fund flow. Of the total grants recommended for local governments, Rs. 8,000
crores are earmarked for performance-based grants for incubation of new cities,
Rs. 450 crores for shared municipal services and Rs 70,051 crores for primary
health sector. (Balance amount is Rs 3,57,860 crores)
• In view of the fast pace of 138 urbanisation, the ratio of inter se distribution of the
grants recommended for rural and urban local bodies gradually moves from
67.5:32.5 in 2020-21 to 65:35 in 2025-26. This works out to Rs 1,21,055 crores to
ULBs from the balance amount of Rs 3,57,860 crores. It is recommended to follow
a differentiated approach in the allocation of grants to ULBs.
• For the Million Plus Cities/Category-I Cities, Million-Plus Cities Challenge Fund
worth Rs. 38,196 crore is being prescribed by 15th FC. Out of this, performance
grants of Rs. 26,057 crore is linked to the performance of these cities in
improving their service level benchmarks on urban drinking water supply,
sanitation and solid waste management. The Ministry of Housing and Urban
Affairs (MoHUA) shall evaluate the performance of these cities in service level
benchmark indicators.
• For the Non-Million-Plus Cities/Category-II Cities, the 15th FC recommends a
disbursal of Rs. 82,859 crore out of tied grants to the tune of Rs. 24,858 Crores to
be disbursed for only for sanitation and solid waste management and
attainment of star ratings as developed by the MoHUA. This includes
management and treatment of household waste, in particular human excreta and
faecal sludge and movement towards more innovative and environment-friendly
ways to tackle this problem.
• The 15th FC also recommended State-specific grants-in-aid of Rs. 49,599 crores to
help States meet special burdens or obligations of national concern across six
broad areas: (a) social needs, (b) administrative governance and related
infrastructure, (c) conservation and sustainable use of water, drainage and
sanitation, (d) preserving culture and historical monuments, € high-cost physical
infrastructure and (f) tourism. From this grant amount, around 2,200 crores are

139
planned to be allocated exclusively for drainage, sanitation and SWM
infrastructure by the states of Kerala, Manipur, Odisha, Tripura, UP and
Uttarakhand.
7.2. Augmenting the revenues of ULBs
• The 15th FC has recommended for enhancing the limit of professions tax from the
present, Rs. 2,500 per annum (which is levied as per the Constitution Sixtieth
Amendment Act, 1988). In some states, the tax is levied and collected by the
State, but in others, municipal bodies levy and collect the tax under a State
legislation (E.g., Tamil Nadu). By even correcting for inflation, Rs. 2,500 fixed in
1988 works out to around Rs. 18,000 per annum at 2019-20 prices. The
professions tax collections (by ULBs) have the potential to grow by more than
seven times with the same number of assesses just by rationalizing rates.
• The 15th FC has recommended an additional entry level condition for receiving
grants by the ULBs, - which is the notification of minimum floor rates81 of
property taxes by the relevant State government followed by consistent
improvement in the collection of property taxes in tandem with the simple
average growth rate of the State’s own GSDP in the most recent five years.
The 15th FC recommendations have focused on the service level bench markings and
grants based on the star ratings to be developed by the MoHUA. Implementation of
the same could pose severe challenges. The grants available to an ULB through this
rating for its performance may be too small to induce the change to the less endowed
ULBs.
The current costs of managing the SWM and sanitation in most of the ULBs are a
severe underestimate. This is because less people are employed for it than the actual
requirement (vacancies are not filled) and often it is outsourced or hired labour (at a
daily wage/monthly wage basis) and the costs incurred are far less than the actual
costs that would be involved for permanent posts. Similarly, the consumables and
the protective gears are also not procured as per the requirements but guided by the
availability of funds. The processes such as segregation, treatment of different kinds
of waste under SWM leading up to less than or equal to one percent of waste for the
landfill are often reduced to fit to finances of the ULB.
The most comprehensive way for addressing the sanitation and SWM issues would
be to assess the O&M costs required for the scientific management of sanitation and
SWM in its entirety and recover the same. And this is the best possible way to
81 The minimum floor rate shall have different slab-wise property tax rates for different types of
properties; and differential rates for commercial, residential and industrial properties.

140
address the welfare issues of the sanitary workers. Unless the services are costed
fully and O&M costs are recovered, the plight of sanitary workers can hardly be
changed for better.
The finance commission could also have focused on the need for funding the
sanitation and SWM in its entirety as well as the requirement of O& M costs recovery
in the light of environmental concern and efficient resource management. It is also
important that the under recovery would impact the very provisioning of services in
an efficient manner in the long run.
The increase of professional tax even if it is adjusted to inflation would definitely
augment revenues of ULB in significant manner wherever it is vested with them like
in the case of Tamil Nadu. The property tax floor rates in line with the GSDP growth
is a good measure which are also recommended by State Finance Commission as
well82 . However, the follow up aspect is one which seems to be ignored.
82 http://www.tnbudget.tn.gov.in/tnweb_files/SFC/5th%20SFC%20REPORT.pdf ( page ix)

141
Chapter 8: Key Takeaways and Policy Implications
The subject of ULBs is in the state list and the state government wields absolute
power over the functioning of the ULBs by way of recruitment (hire and transfer) of
officials, regulating the rates of taxes and fees, provisioning of grant/devolution fund
upon the recommendations of SFC and creating the capital assets/provisioning of
urban services through the specialized agencies which are directly controlled by it.
Often these specialized agencies wield greater power in comparison with the ULB in
provisioning of the services. The elected council is expected to perform by taking
prudent decisions with the local knowledge and local requirement in their
background. The administration is expected to provide the required information
(data, circulars/directions from the state) for smooth functioning of the elected
council. However, the reality is that the administration wields a greater power owing
to the information it holds. The functioning of ULB in provisioning of the urban
services need to be viewed with this backdrop.
Management of Urban Waste (including both sanitation and solid waste) is one of
the important urban services that have been vested with the ULBs. Creation of
capital assets pertaining to SWM and sanitation such as installation of sewer
systems/ faecal sludge management systems, bio-methanation plants, waste
processing units have largely been undertaken through funds from the state
government. This could be in the form of loan/ grant. The property tax rates, the
water charges, SWM cess rates are prescribed by the state governments and the ULBs
are expected to augment the taxes by improving the efficiency in tax collection and
updating the tax base. Devolution in the form of grants/ devolution fund form major
portion of the revenue to the ULB apart from grants for creation of capital assets.
Assigned revenues are due to ULB and transferred by the state which ULB gets to
know after it is received83. The devolution fund/ grants due to ULB gets often
intercepted and diverted to parastatals and ULB may not be aware of it unless it is
informed of the same.
83 Entertainment tax was devolved for 2014-15 and 2017-18 while it was not received during the years
2015-16 and 2016-17 in Hosur City Municipal Corporation.

142
Sanitation and SWM progress at state level
An index was developed using the indicators of SWM and sanitation to compare the
six states using 13 indicators and Maharashtra ranked first followed by Telangana
and Karnataka while Kerala stood the last.
Sanitation and SWM expenditures at the state level
The expenditures indicated in the state budget together with the expenditures of the
parastatals is an understatement on the expenditures of sanitation and SWM. This is
because of the fact that ULBs also spend on these services from their own source
revenues, assigned revenues and untied grants/devolution.
Staffing & Welfare of Sanitation/SWM workers
• The power to assess the staff requirement, mode of employment, conditions of
service, pay and allowances rests entirely with the State/District administration and
not with the ULBs. It is the state/district administration that determines the number
of sanitation/SWM workers that can be employed as permanent staff of the ULB.
• The ULBs have restricted the employment of sanitation/SWM workers as permanent
staff due to budget constraints. Hence sanitation/SWM work is increasingly
becoming contractual in nature. In states such as Karnataka, where the existing
Cadre & Recruitment (C&R) Rules do not allow Municipalities to hire workers as
UGD operators or UGD helpers, has also led to work being outsourced to private
agencies.
• The remuneration and benefits provided to sanitation/SWM workers are a direct
function of their mode of employment (permanent staff, direct labour or private
agencies). The income is significantly higher for workers who are hired as
permanent staff of the ULB. Also, for sanitation/SWM workers who are hired as
either direct labour or from private agencies there is hardly any correlation between
factors such nature of work, age and experience with the salaries being paid to
them.
• The major concerns of marginalized workers who are typically either hired as direct
labour or from private agencies are regularization of jobs and regular payment of
salaries.
• The ULBs are not playing an effective role in ensuring that sanitation workers and
manual scavengers receive the benefits that are entitled to them from various state
and central level welfare schemes. Also, since workers who are either employed as
direct labour or from private agencies don’t have government Ids or formal

143
contracts with the ULB, they are unable to avail any government benefits/ schemes.
However, irrespective of the mode of employment all sanitation/SWM workers are
being provided with free health check-ups by the ULBs.
Data Management
• The data pertaining to transfers by ULB is being made available through a separate
supplementary document in the states of Karnataka and Kerala. However, it is not
available in the other states. Apart from devolution (usually indicated through
major Head 3604), the transfers to the parastatals especially when the devolutions
are intercepted is not made available to the ULBs.
• The ULBs are not periodically collecting or maintaining sanitation/SWM data such
as the number of households having individual toilets, number of households
connected to the UGD network, amount of solid waste segregated and processed.
Poor data management impacts the planning and implementation of both schemes
and projects in relation to sanitation and SWM.
• Poor capacity in data management especially in financial management has resulted
in masking the true finances of the ULB (indicated by 5th SFC report Tamil Nadu)
Governance Structure
• While the ULBs (in particular HCMC) have issued operating guidelines for
hazardous types of sanitation work such as desludging of septic tanks, they are not
supervising the work to ensure that private operators are adhering to the prescribed
norms.
• Since both the ULBs didn’t have a functioning elected council, none of the elected
representatives were involved in the planning, regulation and implementation of
sanitation and SWM services. Thus, the entire decision-making rested in the hands
of state govt appointed officials who have little or no accountability towards the
citizenry of these 2 ULBs.
• Beyond a prescribed limit, ULBs need to seek administrative approval from either
the District or State Administration for civil work/projects despite it being
completely financed by the own source revenues of the ULBs and with an approval
of the respective elected councils. This limits the autonomy of ULBs.
• Due to lack of technical and financial capacities of ULBs, parastatal agencies have
been entrusted with the responsibility of creating capital assets while the ULBs have
been restricted only to the O&M of these assets. However, these parastatal agencies
are only accountable to the state government and not to the ULB.

144
Manual Scavenging
• ULB officials do not seem to have a clear understanding of what defines and
constitutes manual scavenging. We found many of them to have a narrow and
varied understanding of the 2013 Manual Scavenging Act. The ULB officials also
suppressed the prevalence of unsafe sanitation practices and were reluctant to
acknowledge any incidents/deaths due to manual scavenging. Although they have
conducted several rounds of surveys, they claim to have not identified a single new
manual scavenger since 2013. And there has been no third-party assessment of
manual scavengers either.
• In both ULBs, sanitation workers regularly unclog open drains using shovels but
often without any protective gear. Since many households discharge their black
water directly into these open drains, workers are exposed to waste that contains
faecal matter. However, this wasn’t considered as a manual scavenging activity by
the ULB officials.
Municipal Finances
Doddaballapura CMC (Karnataka state)
The variation in actual receipts accounted for 39 to 98 per cent of budget estimates
during the period 2014-15 to 2018-19 and were overestimated in all the years. On the
other hand, the expenditure was also on an average overestimated by over 50
percent for these years. This suggests a flawed budget exercise that resulted in the
preparation of unrealistic budgets by the ULBs. The own source revenues share in
the total revenues was 32% while the grants accounted for about 60% of the total
revenues indicating the higher dependency on the grants by the ULB. Assigned
revenues (surcharge on stamp duty) cannot be estimated properly by the ULB and it
may not be received in a given year. Property tax and water supply charges formed
the important sources of own revenues accounting for 45% and 20% of own revenues
respectively.
Expenditure on sanitation was highest at 36% for sanitation followed by water
supply at 30% under revenue expenditure. The wage expenditure (including salaries
and wages of contractual workers) accounted for 50% of the revenue expenditure of
the CMC. The expenditure on wages for contractual/outsourced workers accounted
for 30% of the wage expenditure of the CMC. Capital expenditure was highest for
sanitation at 29% followed by roads and water supply at 25% and 13% respectively.
The revenues from the sanitation and SWM accounted for a mere 12% of the revenue

145
expenditure on SWM and Sanitation while the entire OSR covered only 57% of the
total revenue expenditure of the CMC. Only 23% of the UGD connection charges
were collected against the demand.
Many of the registers such as DCB of property tax, rented out buildings are not
updated, the cesses and deductions not being paid by the ULB in time to the
respective authorities and even the audit fees are not full paid.
While the availability of the budget documents, audit reports, abstracts of receipts
and expenditure together has revealed the issues, one thing that seems obvious is the
lack of supervision and action upon those issues. This will have a bearing on the
administration of the CMC in for a very long time (perpetuity). The very cleaning up
of the accounts and audit observations needs immediate attention in terms of fixing
the responsibility and action to correct the same. However, the shortage of staff both
in ULBs as well as the state accounts department which creates backlog in audit adds
to the problem which also needs to be fixed.
Hosur City Municipal Corporation (HCMC) (Tamil Nadu state)
The budgets were not prepared in line with the municipal budget manual in Hosur
City Municipal Corporation and had prepared budget which only had budget
estimate for the ensuing year and the revised estimate of the current year. The
audited financial statements were used to understand the finances of the HCMC. The
income and expenditure statements were present however, it became difficult to
understand the actual receipts and expenditure in the absence of the proper budget
in the prescribed format84 and this was voiced even by state finance commission.
The devolution fund and the property tax accounted for 30% and 25% of the total
revenues respectively. The grants from the state and centre accounted for 13% and
7% of the revenues respectively. The sanitation and SWM expenditure together
accounted for 9% of the total expenditure of HCMC. The HCMC collected over Rs.
2.6 crore as SWM cess in 2018-19 and together with water and drainage tax could
meet the sanitation expenditure for that year.
Other important implications
While the observations and findings seem to be pointing towards the ULB for its
performance, the underpinning seems to be of the responsibility of the state as well
in empowering the ULB. Empowering the ULBs to function as local government in
84 The receipts and expenditure data is subject to few clarifications from HCMC.

146
the true sense would be the best possible action. This would mean a greater
transparency in devolution of funds to the ULBs, interception of funds meant for
ULBs, along with ensuring the adequate staff for the ULB. This also means a
platform for the ULBs to interact with the state needs to be created wherein the
representatives of ULB have an opportunity to discuss regarding the issues relating
to its performance. The ULBs should be able to recover O&M costs of the services by
convincing the people of the costs along with the possible impact on poor recoveries
which only an empowered ULB can do. (This phenomenon is witnessed in several
Gram Panchayats and water user associations as well)
Only when the ULB succeeds in provisioning the basic services with full recovery of
O& M costs, the issues of the welfare of the sanitary workers would get
comprehensively addressed.

147
References
Mathew, D. M., & Dhanuraj, D. (2017). Defending Decentralisation In Kerala.
Centre For Public Policy Research.
All India Institute Of Local Self Government Mumbai. (2011). Urban Water And
Sanitation In Maharashtra. PAS Project, CEPT University.
AMRUT Kerala. (N.D.). Retrieved From Https://Amrutkerala.Org/State-Level-
Progress/
APUFIDC. (2015). STATE ANNUAL ACTION PLAN (SAAP) For Implementation
Of AMRUT In Andhra Pradesh. APUFIDC.
Asian Development Bank. (2018). India: Kerala Sustainable Urban Development
Project.
Asian Infrastructure Investment Bank. (2018). Andhra Pradesh Urban Water Supply
And Septage Management Improvement Project. Asian Infrastructure Investment
Bank.
Beck, H., & Darokar, S. (2005). Socioeconomic Status Of Scavengers Engaged In The
Practice Of Manual Scavenging In Maharashtra. Tata Institute Of Social Sciences.
Business Standard. (2019, June 25). Urban Local Bodies In Telangana Need
Additional Rs 40,720 Cr. Retrieved From Business Standard:
Https://Www.Business-Standard.Com/Article/Pti-Stories/Urban-Local-Bodies-In-
Telangana-Need-Additional-Rs-40-720-Cr-119062500890_1.Html
Capacity Building For Urban Development Project (CBUD) . (2014). Approach
Towards Establishing Municipal Cadres In India. Ministry Of Urban Development,
Government Of India And World Bank.
Census India . (N.D.). Census India. Retrieved From
Https://Www.Censusindia.Gov.In/2011-Prov-Results/Paper2-
Vol2/Data_Files/Kerala/Chapter_IV.Pdf
Census Of India . (2011). Size, Growth And Rural- Urban Distribution Of
Population. Census Of India.
Centre For Good Governance. (2017). Municipal Cadres In Andhra Pradesh – A
Study In The Light Of Reforms Under AMRUT . Governmnet Of Andhra Pradesh.
Centre For Policy Research. (2019). Self Employment Scheme For Rehabilitation Of
Manual Scavengers (SRMS) Goi, 2018-19. Centre For Policy Research.
Centre For Socio-Economic & Environmental Studies. (2017). ENDLINE STUDY OF
THE KERALA LOCAL GOVERNMENT SERVICE DELIVERY PROJECT.
CEPT University. (2013). Financing Urban Water Supply And Sanitation In
Maharashtra. PAS.

148
Cochin Smart Mission Limited. (N.D.). Retrieved From Http://Csml.Co.In/
Comptroller And Auditor General Of India . (2017). Report Of The Comptroller
And Auditor General Of India On Local Bodies. Government Of Mahrashtra.
Comptroller And Auditor General Of India. (2018). Comptroller And Auditor
General Of India On Local Self-Government Institutions. Government Of Kerala.
Comptroller And Auditor General Of India. (2020). Performance Audit Of
Implementation Of 74th Constitutional Amendment Act. Government Of
Karnataka.
Department For International Development. (N.D.). Sanitation For The Urban
Poor:Whose Choice, Theirs Or Ours? University Of Southampton.
DEPARTMENT OF TOWN AND COUNTRY PLANNING - GOVERNMENT OF
KERALA. (2012). STATE URBANISATION REPORT. Government Of Kerala.
Directorate Of Municipal Administration. (2012). Urban Egovernance Initiatives In
Karnataka State. Government Of Karnataka.
Dubey, S. (2018, May 26). News Click. Retrieved From Another Cheat Survey, In
The Name Of Manual Scavengers: Https://Www.Newsclick.In/Another-Cheat-
Survey-Name-Manual-Scavengers
ENVIS Centre On Hygiene, Sanitation, Sewage Treatment Systems And
Technology. (2018, August 17). Manual Scavenging. Retrieved From ENVIS Centre
On Hygiene, Sanitation, Sewage Treatment Systems And Technology:
Http://Sulabhenvis.Nic.In/Database/Manualscavenging_8058.Aspx
Financial Express. (2017, June 6). Manual Scavenging In Telangana: Government
Rolls Out 70 Mini Sewer-Jetting Machines, All Set To End Degrading Practice.
Retrieved From Financial Express : Https://Www.Financialexpress.Com/India-
News/Manual-Scavenging-In-Telangana-Government-Rolls-Out-70-Mini-Sewer-
Jetting-Machines-All-Set-To-End-Degrading-Practice/703502/
Government Of Andhra Pradesh. (2016). Andhra Pradesh State Sanitation Strategy.
Government Of Andhra Pradesh.
Government Of Karnataka. (2020). Economic Survey Of Karnataka . Planning,
Programme Monitoring And Statistics Department.
Government Of Kerala. (2015). Kerala State Sanitation Strategy. Government Of
Kerala.
Government Of Kerala. (2018). Integrated Solid Waste Management Strategy.
Government Of Kerala.
Government Of Kerala. (2018). Kerala State Policy Of Solid Waste Management.
Government Of Kerala.
149
Government Of Maharashtra. (2013). FOURTH MAHARASHTRA FINANCE
COMMISSION REPORT. Government Of Maharashtra.
Government Of Telangana. (2017). State Sanitation Strategy. Government Of
Telangana.
Government Of Telangana. (2017). Statistical Year Book . Government Of
Telangana.
Government Of Telangana. (2017). Telangana State Sanitation Strategy.
Government Of Telangana.
Government Of Telangana. (2018). Solid Waste Management Policy And Strategy.
Government Of Telangana.
Government Of Telangana. (2020). Socio Economic Outlook . Government Of
Telangana.
Govt Of Kerala. (2019). Declaration Of Service Level Standards. Local Self
Government Department.
Gupta, M., & Chakraborty, P. (2019). State Finance Commissions: How Successful
Have They Been In Empowering Local Governments? National Institute Of Public
Finance And Policy.
Indian Audits And Accounts Department. (2018). Report Of The Comptroller And
Auditor General Of India On Local Bodies. Government Of Telangana.
Indian Institute Of Management Kozhikode. (2017). State Finances Of Kerala:
Performance, Challenges And The Way Ahead.
Jayaram, D. (2018). What’s Choking Kerala’s Roads? Times Of India.
JLL India. (2018). Municipal Finance: Funding Urban Development In India. JLL
India.
Kannaiah, M. (2013). Study On Municipal Administration In Andhra Pradesh With
Special Reference To Guntakal, Municipality In Anantapuramu District. Shodh
Ganga.
Karnataka State Pollution Control Board. (2016). Annual Report. Karnataka State
Pollution Control Board.
Kerala Solid Waste Management Project. (2020). ENVIRONMENTAL AND
SOCIAL MANAGEMENT FRAMEWORK. GOVERNMENT OF KERALA.
Kerala Urban Service Delivery Project. (N.D.). Retrieved From
Https://Kusdp.Org/Objective-Of-The-Project/
Kumar, A. (2018, August 5). Sans Policy, Kerala Pushes For Waste-To-Energy
Model. THIRUVANANTHAPURAM, Kerala, India.
Live Mint. (2018). Water, Vector-Borne Disease Outbreak Looms Over Kerala.

150
LSGD, Govt Of Kerala. (N.D.). Retrieved From
Http://Lsgkerala.Gov.In/En/Projects/Ksudp
Maharashtra Pollution Control Board. (2019). Annual Report On Solid Waste
Management Rules, 2016. Maharashtra Pollution Control Board.
Maharashtra Pollution Control Board. (2019). SWM Annual Report. Maharashtra
Pollution Control Board.
Ministry Of Housing And Urban Affairs, Government Of India. (2018). Swach
Survekshan 2018.
Ministry Of Housing And Urban Affairs, Government Of India. (2019). Swach
Survekshan 2019.
Ministry Of Housing And Urban Affairs, Government Of India. (2020). Swachh
Survekshana.
Ministry Of Social Justice And Empowerment. (2019). First Report - STANDING
COMMITTEE ON SOCIAL JUSTICE AND EMPOWERMENT. Ministry Of Social
Justice And Empowerment.
Ministry Of Urban Development. (2016). Handbook Of Urban Statistics.
Government Of India.
Ministry Of Urban Development. (2016). Municipal Solid Waste Management
Manual.
Ministry Of Urban Development, Govt Of India. (N.D.). Smart City Proposal.
Kochi.
Mishra, D., & Sen, J. (2019, November 18). Five Years After SC Judgment, States Yet
To Submit Proper Data On Sewer Deaths. Retrieved From The Wire:
Https://Thewire.In/Government/Manual-Scavenging-Deaths-Data-Nskc
Municipal Administration And Urban Development Department. (2020). Annual
Report. Government Of Telangana.
NATIONAL COMMISSION ON POPULATION. (2019). POPULATION
PROJECTIONS FOR NDIA AND STATES 2011 – 2036. Delhi: MINISTRY OF
HEALTH & FAMILY WELFARE.
National Institute Of Public Finance And Policy. (2011). Municipal Finance Matters.
National Institute Of Public Finance And Policy.
National Institute Of Urban Affairs . (2018). Urban Wastewater Management In
Telangana. National Institute Of Urban Affairs .
NCSK. (2019). Annual Report. Ministry Of Social Justice And Empowerment.
NITI Aayog. (N.D.). SDG India Index 2019-20.

151
NPR. (2019, August 2). A Robot Might Take His Job — And That's Good News.
Retrieved From NPR:
Https://Www.Npr.Org/Sections/Goatsandsoda/2019/08/02/697180430/A-Robot-
Might-Take-His-Job-And-Thats-Good-News
NSKFDC. (2019). 22nd Annual Report. Ministry Of Social Justice And
Empowerment.
NSSO. (2018). Drinking Water, Sanitation, Hygiene And Housing Condition In
India. Ministry Of Statistics And Programme Implementation.
Prasad, D. (2007). Scavengers And Scavenging In Andhra Pradesh. Research Gate.
Prasanna, S., & Jayachandra, D. (2018). Urbanisation Trends And Potentials In
Telangana. International Journal Of Research And Innovation In Social Science
(IJRISS) |Volume II, Issue VIII.
Rashtriya Garima Abhiyan. (2018). Justice Denied: Death Of Workers Engaged In
Manual Scavenging While Cleaning The Septic Tank Or Sewer. Rashtriya Garima
Abhiyan.
Roy, A. (2009). Urban Governance In Karnataka. Shodh Ganga.
Santhosh, K. (2014). Kerala Headed For Water Scarcity. The Hindu.
Sarkar, A. (2018). World Bank’s Reformed Model Of Development In Karnataka.
Bangalore: The Institute For Social And Economic Change,.
Sen, P. (2017).
Singh, B. (2011). Solid Waste Management In Maharashtra. Research Gate.
Smart City Trivandrum Limited. (N.D.). Retrieved From
Https://Www.Smartcitytvm.In/
State Finance Commission. (2015). Report Of The Fifth State Finance Commission .
State Planning Board, Kerala. (2016). Economic Review.
Suchitwa Mission. (2020). INTRODUCTION AND STRATEGIC ENVIROMENTAL
ASSESSMENT OF WASTE MANAGEMENT SECTOR IN KERALA: VOLUME I.
Government Of Kerala.
The Economic Times. (2018). Robots To Soon Clean Up Manholes In Kerala. The
Economic Times.
The Hindu. (2019, November 21). Kerala’s Sanitation Staff Have The Best Pay:
Panel. Thiruvananthapuram, Kerala, India.
The Hindu. (2020, October 23). New SWM Policy Aims To Achieve 100%
Segregation At Source. Bangalore, Karnataka, India.

152
Annexure 1: Obligatory and Discritionary Functions of the
Municipal Council/Corporation (KM Act)
(a) Obligatory and Discritionary Functions Of The Municipal Council (KM Act)
Obligatory functions of Municipal
Councils
Discretionary functions of Municipal
Councils
(a) lighting public streets, places and
buildings;
(b) watering public streets and places;
(c) cleansing public streets, places and
sewers, and all spaces not being private
property, which are open to the
enjoyment of the public, whether such
spaces are vested in the municipal
council or not, removing noxious
vegetation and abating all public
nuisances;
(d) extinguishing fires and protecting life
and property when fires occur;
(e) regulating or abating offensive or
dangerous trades or practices;
(f) removing obstructions and projections
in public streets, bridges, and other
public places, and in spaces not being
private property, which are open to the
enjoyment of the public, whether such
spaces are vested in the municipal
council or belong to the Government;
(g) securing or removing dangerous
buildings or places and reclaiming
unhealthy localities;
(h) acquiring and maintaining, changing
and regulating places for the disposal of
the dead;
(i) constructing, altering and maintaining
public streets, culverts, municipal
boundary marks, markets 1[(including
separate and suitable place for vending
vegetables)]1, slaughter houses, latrines,
privies, urinals, drains, sewers, drainage
(a) laying out, whether in areas
previously built upon or not new
public streets and acquiring the land
for that purpose, including the land
requisite for the construction of
buildings or cartilages thereof, to abut
on such street;
(b) constructing, establishing or
maintaining public parks, gardens,
libraries, museums, mental hospitals,
halls, offices, dharmasalas, choultries,
musafirkhanas, rest-houses, homes for
the disabled and destitute persons and
other public buildings;
(c) providing shelter for destitute
women;
(d) constructing and maintaining,
where necessary, suitable sanitary
houses for the habitation of the poor
and granting loans for construction of
such houses or for effecting necessary
improvements connected therewith;
(e) providing accommodation for any
class of servants other than sweepers
and scavengers employed by the
municipal council or granting loans to
such servants for construction of
houses, subject to the rules prescribed
in this behalf;
(g) planting and maintaining roadside
and other trees;
(h) taking statistics and granting
rewards for information which may
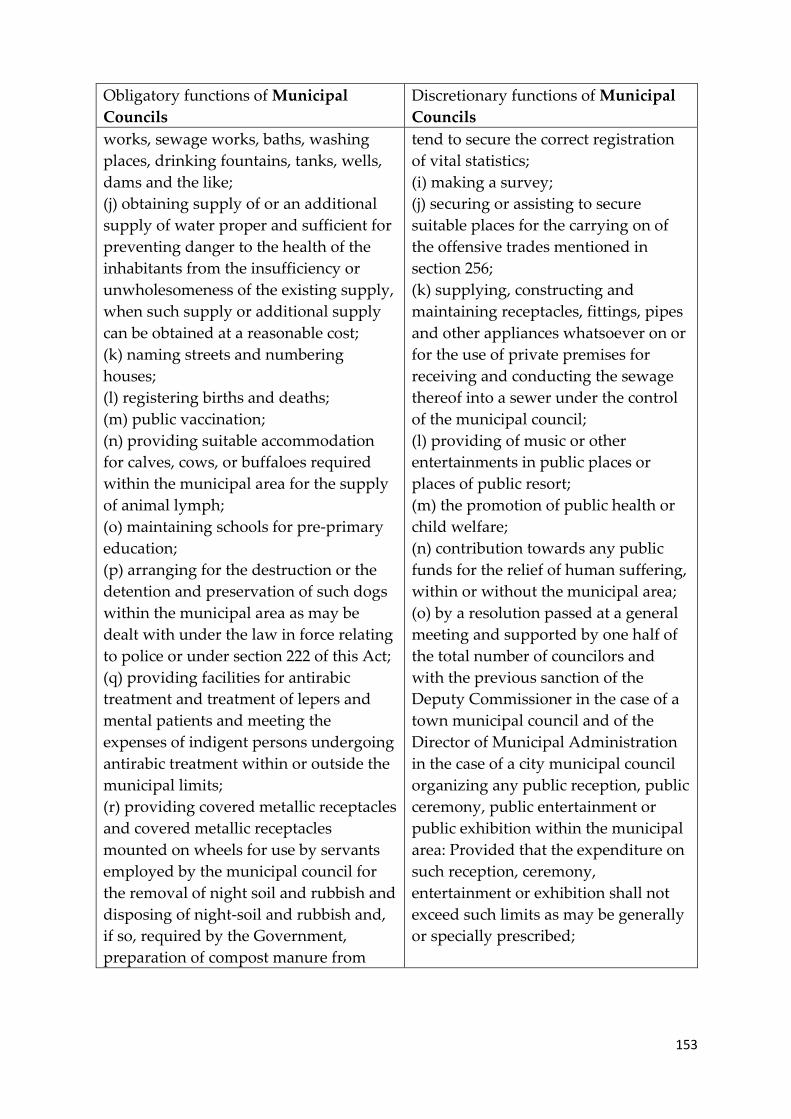
153
Obligatory functions of Municipal
Councils
Discretionary functions of Municipal
Councils
works, sewage works, baths, washing
places, drinking fountains, tanks, wells,
dams and the like;
(j) obtaining supply of or an additional
supply of water proper and sufficient for
preventing danger to the health of the
inhabitants from the insufficiency or
unwholesomeness of the existing supply,
when such supply or additional supply
can be obtained at a reasonable cost;
(k) naming streets and numbering
houses;
(l) registering births and deaths;
(m) public vaccination;
(n) providing suitable accommodation
for calves, cows, or buffaloes required
within the municipal area for the supply
of animal lymph;
(o) maintaining schools for pre-primary
education;
(p) arranging for the destruction or the
detention and preservation of such dogs
within the municipal area as may be
dealt with under the law in force relating
to police or under section 222 of this Act;
(q) providing facilities for antirabic
treatment and treatment of lepers and
mental patients and meeting the
expenses of indigent persons undergoing
antirabic treatment within or outside the
municipal limits;
(r) providing covered metallic receptacles
and covered metallic receptacles
mounted on wheels for use by servants
employed by the municipal council for
the removal of night soil and rubbish and
disposing of night-soil and rubbish and,
if so, required by the Government,
preparation of compost manure from
tend to secure the correct registration
of vital statistics;
(i) making a survey;
(j) securing or assisting to secure
suitable places for the carrying on of
the offensive trades mentioned in
section 256;
(k) supplying, constructing and
maintaining receptacles, fittings, pipes
and other appliances whatsoever on or
for the use of private premises for
receiving and conducting the sewage
thereof into a sewer under the control
of the municipal council;
(l) providing of music or other
entertainments in public places or
places of public resort;
(m) the promotion of public health or
child welfare;
(n) contribution towards any public
funds for the relief of human suffering,
within or without the municipal area;
(o) by a resolution passed at a general
meeting and supported by one half of
the total number of councilors and
with the previous sanction of the
Deputy Commissioner in the case of a
town municipal council and of the
Director of Municipal Administration
in the case of a city municipal council
organizing any public reception, public
ceremony, public entertainment or
public exhibition within the municipal
area: Provided that the expenditure on
such reception, ceremony,
entertainment or exhibition shall not
exceed such limits as may be generally
or specially prescribed;

154
Obligatory functions of Municipal
Councils
Discretionary functions of Municipal
Councils
such night-soil and rubbish; Explanation.
In this clause, “rubbish” includes dust,
ashes, broken bricks, mortar, sewage,
dung, dirt, decomposed substances and
refuse of any kind.
(s) providing accommodation for
municipal sweepers and scavengers and
granting of loans to such sweepers and
scavengers for construction of houses,
subject to rules prescribed in this behalf;
(t) printing such annual reports on the
municipal administration of the
municipal area as the Government, by
general or special orders, requires the
municipal council to submit;
(u) paying the salary and the contingent
expenditure on account of such police or
guards as may be required by the
municipal council for the purpose of this
Act or for the protection of any
municipal property, and providing such
accommodation as may be required by
the Government under the law in force
relating to police.
(u1) vital statistics including registration
of births and deaths;
(u2) regulation of taneries;
(v) maintenance of up-to-date record of
all buildings and sites within the
municipal area; and
(w) planting and maintaining of road-
side trees. (Sec 87 KMA) Special function
(a) providing special medical aid and
accommodation for the sick in time of
dangerous disease; and taking such
measures as may be required to prevent
the outbreak or suppress and prevent the
recurrence of the disease;
(p) the organisation or maintenance
during scarcity, of shops or stalls for
the sale of necessaries of life;
(q) housing and maintaining destitute
orphans and destitute cripples;
(r) subject to the provisions of any law
regulating the establishment of
warehouses, constructing, establishing
and maintaining warehouses;
(s) establishment and maintaining of
dairy farms and breeding studs;
(t) provision of transport facilities
within the municipal area;
(u) maintenance of an ambulance
service;
(v) supply of water beyond the limits
of the municipal area;
(w) the acquisition and maintenance of
grazing grounds;
(x) guaranteeing the payment of
interest on money expended for the
construction of a telephone line subject
to the previous sanction of the
Government when the line extends
beyond the limits of the municipal
area;
(y) promoting the well-being of
municipal employees or any class of
municipal employees and of their
dependents;
(z) the construction, purchase,
organisation, maintenance extension
and management, of mechanically
propelled transport facilities for the
conveyance of the public;
(aa) the construction, maintenance,
repairs, purchase of any works for the
supply of electrical energy;

155
Obligatory functions of Municipal
Councils
Discretionary functions of Municipal
Councils
(b) giving relief to and establishing and
maintaining relief works in times of
famine or scarcity for destitute persons
within the limits of the municipal area.
(Sec 88 KMA)
(bb) making contributions towards the
construction, establishment or
maintenance of educational
institutions including libraries and
museums, any hospital, dispensary or
similar institution providing for public
medical relief, or any other institution
of a charitable nature;
(cc) construction, maintenance and
provision of public bathing houses;
(dd) revival or promotion of cottage
industries; (ee) improvement of cattle
and live-stock including construction
and maintenance of veterinary
hospitals;
(ff) maintenance of maternity homes
and child welfare centres;
(gg) maintenance of art galleries;
(gg1) slum improvements and up-
gradation;
(gg2) urban forestry, protection of
environment and promotion of
ecological aspects;
(gg3) urban poverty alleviation;
(gg4) promotion of cultural, education
and aesthetic aspects;
(hh) promotion, formation, extension
or assistance of cooperative societies;
and
(ii) any other matter not hereinbefore
specifically named which is likely to
promote education or public health,
safety or general welfare or
convenience, or the advancement of
the economic condition of the
inhabitants or which is necessary for
carrying out the purposes of this Act,
expenditure whereon is resolved by
the municipal council by the votes of

156
Obligatory functions of Municipal
Councils
Discretionary functions of Municipal
Councils
not less than two-thirds of the total
number of councilors and with the
approval of the Government, to be an
appropriate charge on the municipal
fund.(Sec 91 KMA)
(b) Obligatory and Discritionary Functions Of The Municipal Corporations (KMC
Act)
Under sections 58 and 59 of the KMC Act, corporations are required to perform
certain obligatory and discretionary functions. Some of the obligatory functions of
ULBs are as below; 1. Lighting public streets, places and buildings 2. Sanitation 3.
Supply of drinking water 4. Registering births and deaths 5. Construction and
maintenance of roads, drains, etc. Some of the main discretionary functions are as
below; 1. Maintenance and establishment of public parks 2. Maintenance of public
library 3. Constructing, establishing of homes for the disabled and destitute persons
etc

157
Annexure 2: Karnataka
A2.1. Urbanisation in Karnataka
The state of Karnataka has 30 districts grouped into 4 administrative divisions:
Belagavi division, Bengaluru division, Kalburgi division, and Mysuru division. The
percentage of urban population to the total population has increased from 33.99% in
2001 to 38.67% in 2011, registering an Annual Exponential Growth Rate (AEGR) of
2.74% which is almost the same as India’s AEGR of 2.76% during the same time
period. As per the 2011 census, Karnataka is the 7th most urbanized state in India. For
the first time since independence, the decade between 2001 to 2011 saw an absolute
increase in population to be more in urban than in rural areas. The percentage of
urban population in the state has been consistently above the national average in all
the censuses conducted so far and the gap has only been increasing over the years.
Karnataka exhibits a fluctuating trend of urbanisation with a high regional variation.
However, disparities exist in urban growth with Bengaluru being the most urbanised
district with 90.94% of its population residing in urban areas followed by Dharwad
district with 56.82%. The least urbanised district in the State is Kodagu with 14.61%.
70% of urban population lives in 10% of towns/urban agglomeration (Economic
Survey of Karnataka , 2020). As per the 2011 census, about 2.35 crores out of a total
population of 6.11 crores reside in urban areas. It is projected that by around 2031-35,
the urban population of Karnataka would be anywhere between 3.41 crores to 3.65
crores and the percentage of Karnataka’s urban population to the total population
would increase to 49.3%85. At present there are a total of 273 ULBs in the state - 11
City Corporations, 59 City Municipal Councils, 114 Town Municipal Councils and
89 Town Panchayats86.
Rapid industrialisation has been one of the main drivers of urbanisation in
Karnataka. The state has been spearheading the growth of Indian industry,
particularly in terms of advanced technology industries in the areas of electrical and
electronics, Information & Communication Technology (ICT), biotechnology and,
more recently, nanotechnology. The industrial structure of Karnataka presents a
blend of modern high-tech capital goods and knowledge intensive industries on the
one hand and traditional consumer goods industries on the other. The liberalisation
of the economy brought about sizable investment in the software industry because of
the easy availability of skilled manpower and low investment criterion. The state
85 Population Projections for India and States 2011 – 2036, Ministry of Health and Family Welfare 86 As per Karnataka State Election Commission, May 2020.

158
economic policy was quick to read the characteristics of liberalisation and
accordingly made Information Technology (IT) a priority industry to build in
Bengaluru by attracting foreign capital with moderate land acquisition rules and
keeping the infrastructure cost extremely low. This led to an IT boom in the early
2000’s which contributed significantly to the state’s industrial growth. In late 2000, a
study found that the contribution of IT services to the state’s GSDP had increased
from 1.70% in 2001-02 to 2.95% in 2003 – 04. Also, the growth of ICT had a positive
impact (for the period between 2001 – 01 and 2002 – 03) on per capita income, share
in tertiary sector for state income and in the expansion of tele-density (Narayana,
2008). The Karnataka Municipalities Act, 1964 was amended (through Act 24 of 2003)
to have a separate chapter for specifying industrial townships and other related
matters, to make elaborate provision given the development and the requirement of
industrial townships adjacent to or within municipal areas and transitional gram
panchayats. (JLL India, 2018).
The overall organized industrial sector of Karnataka registered a 4.03% growth in
2018-19 as compared to 2017-18. Within the organized industrial sector, the
electricity sector shows the highest growth at 11.32% followed by the mining sector
at 5.89% whereas the manufacturing sector registered the lowest growth of 3.01%. As
a result of this moderate growth of 4.03% was observed in General Index. The
Annual Survey of Industries (ASI) statistics indicates that Karnataka accounted for
5.68% of the total registered factories in 2016-17 in the country.
The advance estimates of Gross State Domestic Product (GSDP) of Karnataka for the
year 2019-20 at constant (2011-12) prices, is likely to attain a level of Rs. 12,01,031
crores with a growth of 6.8%. In comparison, the GDP at national level is estimated
to be 5.0% at constant (2011-12) prices. The sectoral growth rate of Agriculture,
Industry and services are expected to be 3.9%, 4.8% and 7.9% respectively. The
service sector is a major contributor of overall GSDP of the state as the share of
private corporate sector to this sector is significantly higher when compared to other
sectors. Table 4.1 shows the sectoral share of GSDP.
Table A2. 1: Sectoral Share of GSDP
Sectors 2018-19 F.R.E. 2019-20 A.E.
Agriculture and Allied 11.18 10.97
Industry sector 23.67 22.84
Service Sector 65.15 66.19
Source: Directorate of Economics and Statistics, Government of Karnataka.
Note: A.E.: Advance Estimates, F.R.E.: First Revised Estimates.
159
While India’s average year-on-year GDP growth was 6.9% between 2013 to 2017, it
was 8.1% for Karnataka during the same time period. While India’s GDP grew by
6.7% in 2018, the GSDP growth rate of Karnataka in 2018 was 9.3% and the fifth
highest in the country87. The share of Karnataka's GSDP to India’s GDP is 8.3%
during 2019-20. Additionally, Karnataka's fiscal performance in comparison to other
states is considerably sound. Driven by various fiscal consolidation measures,
Karnataka while enhancing its revenues has managed its expenditure well. In 2019-
20, the State has estimated (i) revenue surplus of Rs.257.97 crores, (ii) Fiscal Deficit at
2.65% of GSDP and (iii) Total liabilities at 20.60% of GSDP (Economic Survey of
Karnataka , 2020).
A2.2. Provisioning of Sanitation and SWM Services
Both the KM and the KMC Acts have provisions for water supply, sanitation, and
waste managements as an obligatory service to be provided by ULBs. They have
been listed under Sections 58(3) and 59(10) of the Karnataka Municipal Corporations
Act, 1976 and Section 87(c), 87(m), 87(q), 87(r), 91(m) and 91(u) of the Karnataka
Municipalities Act, 1964. Functions under these items are as listed in Table 4.2.
As per the 2011 census, the key sanitation indicators of Karnataka are:
• 15.10 % of urban households in Karnataka do not have access to latrines as
compared to the national average of 18.6 %.
• Open Defecation by urban households of Karnataka is 10.7 % which is slightly
lower than the national average of 12.6 %.
• Only 53.3 % of Karnataka’s urban households are connected to a piped sewerage
network
• Manual Scavenging: As per the 2011 census, approx. 0.1 % of the urban households
(5688 households) in Karnataka get night soil removed manually.
As per the information furnished by the Bruhat Bengaluru Maha Nagara Palike
(BBMP) and other local bodies in Annual Report for 2016-17, Karnataka State
generates about 11,186 tons per day (TPD) of municipal solid waste (MSW) out of
which Bengaluru alone generates around 5680 tonnes of MSW daily. From this, 9706
TPD are collected, 3475 TPD are treated and 5170 TPD are landfilled. (Karnataka
State Pollution Control Board, 2016). Most ULBs spend nearly 60%-70% of their total
87 States of Growth 2.0, A CRISIL Research Report, 2019

160
overall budgetary allocation on collection, another 20%-30% on transportation, and
often less than 10% on the treatment and final disposal of MSW.
The Government of Karnataka brought out an Urban Drinking Water and Sanitation
policy (UDWSP) in 2002. The main objectives of the policy were to ensure demand
based universal coverage of water supply, commercial and economical sustainability
of the operations and a minimum level of service to all citizens. The ULBs were
responsible for water supply and sewerage services from water catchments to waste
water treatment. The National Urban Sanitation Policy (NUSP) 2008 demands for
each of the states to prepare their own state sanitation strategies (SSS) taking into
account its local urban context. The idea was to allow state level framework in which
cities will plan and implement their city specific sanitation plans. However,
Karnataka till date does not have a state sanitation strategy.
The State Government of Karnataka adopted a policy on integrated solid waste
management (ISWM) in 2004 with an objective of developing and implementing
scientific and sustainable methods for municipal solid waste management (MSWM).
The primary objectives of the Karnataka State policy on ISWM are to: (i) provide
directions for MSWM activities in an environmentally, socially, and financially
sustainable manner; (ii) establish an integrated and self-contained operating
framework for MSWM; and enhance the ability of ULBs to provide effective waste
management services to their citizens. Some of the provisions are in sync with the
SWM 2016 Rules. The Urban Development Department notified the Karnataka
Municipalities Solid Waste Management Model by-laws 2019 for all the Urban Local
Bodies (ULBs), including BBMP, placing the onus of disposal of waste on the
generator. A comprehensive legal and regulatory framework was put in place by
encompassing all aspects of waste management, right from its inception to final
disposal. The by-laws include collection, transportation, and disposal of waste along
with monitoring and regulation. This is the first time that the by-laws are being
framed under the Karnataka Municipal Corporation Act, 1976, thereby giving ULBs
teeth to implement provisions, including collecting hefty penalties for violations.
Hitherto, rules on solid waste management were being framed under the
Environment Protection Act, 1986. On 22nd October 2020, the state government
approved the Karnataka State Urban Solid Waste Management (SWM) Policy-2020
and the Urban Solid Waste Management Strategy-2020. The new policy has an
ambitious target of achieving 100% segregation at source of solid waste in all urban
local bodies across the State. The new policy also aims to reduce waste going to
161
landfills to less than 30% of the total waste generated by 2025. The policy was
prepared by the Directorate of Municipal Administration in compliance with the
Solid Waste Management Rules, 2016, and is applicable to all ULBs in the State (The
Hindu, 2020).
The Karnataka Urban Water Supply and Drainage Board (KUWS&DB) was
constituted by an Act of legislature in 1974 and is functioning from 1975 onwards.
KUWS&DB is the implementing parastatal body for water supply and underground
drainage facilities (UGD) for all the ULBs except Bruhath Bengaluru Mahanagara
Palike (under the KUWS&DB Act, 1973). Since its inception, KUWS&DB had
commissioned 567 water supply and 88 UGD projects across the state incurring an
expenditure of Rs. 8,357.17 crores up to the end of March 2019 (Economic Survey of
Karnataka , 2020). Bengaluru Water Supply and Sewerage Board (BWSSB) is an
independent parastatal body created by the state government that is responsible for
providing water supply and disposal of sewerage to 800 Sq. kms of BBMP area. It is
one of the first water supply & sanitation utilities in India.
Karnataka Urban Infrastructure Development and Finance Corporation (KUIDFC) is
another important parastatal body that was incorporated in 1993 with an objective to
prepare, formulate and implement projects, schemes and programmes relating to
infrastructure development in the urban areas of the state and to provide technical,
financial, consultancy and other assistance to ULBs for development, schemes,
including implementation of master plans. Considering its expertise in project
formulation, appraisal, management and implementation KUIDFC has been
appointed as the Nodal Agency for implementing various urban infrastructure
development projects in the state. One such project being to improve the quality of
SWM services in the BBMP area.
Water supply and sanitation, and SWM were marked as priority services under the
14th finance commission grant details. Of the total allocation of Rs. 4685.51 crores
(including BBMP), 25% is for SWM, and 20% for sanitation and water supply, and
20% for Underground drainage (UGD) schemes (Economic Survey of Karnataka ,
2020).
A2.3. Urban Reforms Related to Sanitation and SWM
The 74th CAA provided new opportunities for urban governance reforms in the
country. Karnataka has been a pioneer and a role model state in carrying out urban
sector reforms along with structural reforms. The Urban Development Department,
162
Government of Karnataka through the Directorate of Municipal Administration
launched a Municipal Reforms in the year 2004, in order to upgrade the existing
municipal functions and to provide smoother delivery of municipal services to the
citizens of Karnataka. It soon initiated an Asian Development Bank (ADB) funded
state-wide reform initiative covering the largest 49 municipal bodies in the state.
Titled ‘Nirmala Nagara Project (referred to as NN), the objective of the project was to
introduce reforms across these municipal bodies. These reforms were further
extended to cover another 164 ULBs under the World Bank funded “Karnataka
Municipal Reforms Project”. Few of the reforms implemented were: 1) GIS-based
Property Tax Information system (PTIS), 2) Public Grievances and Redressal system
(PGR), 3) Birth and Death Registration and Certification (BandD), 4) Fund Based
Double Entry Accrual Accounting System (FBDEAAS) & 5) ULB websites. As part of
this reform, several other online applicants were created to ease service delivery
(Directorate of Municipal Administration, 2012).
List of existing online applications: Municipal Reforms
• Birth & Dearth Registration and certification system. E-Janma application.
• Janahitha- Improved version of online Public Grievance and Redressal System.
• Nirman- Online building license issuance system.
• Nirman 2-End to end online system with auto DCR for building license issuance
service has been developed and implemented in AMRUT.
• Vyapar- End to end online trade license issuance system.
• Jalanidi- End to end water tap and UGD connection permit and water tariff
management system.
• E-Aasthi- property details management system.
• Sweekruthi application integrated with khajane 2 has been developed and
implemented across all ULBs to avoid cash-based transactions at ULBs.
• Role Based facility in FBAS application is made available to digitize the payment
approvals online.
• FBAS application is implemented in DUDCs, DMA, newly formed ULBs and
planned to implement in authorities.
• PID number-based Property tax calculator has been developed.
• Online application to manage AMRUT project has been developed and planned to
implemented in AMRUT ULBs.
• Integration of schemes application with FBAS and E-procurement applications done
to ensure online updation of financial transactions.

163
The KUIDFC is the key implementing agency for many urban infrastructure-based
reform projects financed by multilateral development institutions such as World
Bank and Asian Development Bank (ADB). Some of the key urban reform projects
related to water supply, sanitation and SWM in Karnataka are:
- Karnataka Urban Development and Coastal Environmental Management Project
(KUDCEMP, Assisted by ADB): The purpose of the project was to improve urban
infrastructure, operation and management, and resource mobilization in 10 ULBs
along the west coast of Karnataka. The total expenditure for the six components of
KUDCEMP was Rs. 1001.44 crores (End of March, 2019). The six components are - (i)
capacity building, community participation and poverty reduction (3% of actual
project cost); (ii) water supply systems rehabilitation and expansions (27%); (iii)
urban environmental improvement through sewage systems (31%); (iv) street and
bridge improvements (10%); (v) coastal environmental management (2%); and (vi)
implementation assistance (11%).
- Karnataka Urban Water Sector Improvement Project (KUWASIP, Assisted by
World Bank): KUWASIP is a project for reforms in water and sanitation sector and
service improvements in water sector. The estimated cost of the project was Rs.
237.04 crores. The project has been implemented in three cities viz., Belgaum,
Gulbarga and Hubli-Dharwad during the period 2005-2011. All the works under the
two physical components viz., (i) Priority Investments (for improving bulk supply)
and (ii) Demonstration Project (for demonstrating feasibility of 24x7 continuous
pressured water supplies) have been completed and commissioned. The system has
been working satisfactorily and has benefitted a population of about 2.14 lakhs. The
contract for O&M of 24x7 water supplies in the Demonstration Zones is being carried
out by respective ULBs with assistance from KUIDFC.
- Karnataka Municipal Reforms Project (KMRP, Assisted by World Bank): KMRP
aims to improve the quality of life of citizens by improving the delivery of urban
services and promoting good governance among the urban local bodies (ULBs). The
total project expenditure, as on March-2019 was Rs. 1391.12 crores. Of this, Rs. 298.3
crores was spent on Water Supply, Under Ground Drainage, Sewage Treatment
Plants, Storm Water Drain, SWM and Low-Cost Sanitation in 32 selected ULBs.
- North Karnataka Urban Sector Investment Programme (NKUSIP, Assisted by
ADB): The primary objective of this programme is to improve the status of urban
infrastructure and attempt towards better service provision, focusing on
environmental sanitation improvement. Some of the major components under

164
NKUSIP are Water Supply, Sewerage and Urban Drainage. The overall Project cost is
Rs.2500 Cr of which ADB provided a loan of Rs. 1386 crores and the balance amount
are from GoK and ULBs. State of the Art Sewage Treatment Plants were constructed
and commissioned in Hubballi-Dharwad, Davangere and Kalburgi.
- Karnataka Integrated Urban Water Management Investment Programme
(KIUWMIP, Assisted by ADB): This programme has an estimated cost of Rs. 1476
crores with a loan component of Rs. 975 crores from ADB. The bulk of this
investment pertains to expanding water supply and sewerage infrastructure in the
selected cities and it proposes to cover an area of 377 Sq. kms to benefit a population
of 1.3 million after its implementation. Four sewerage work packages were awarded,
at a cost of Rs. 256.00 Cr. In 2019-20, a total of 302.46 km of sewer network was laid
in all three project towns against the target of 315.39 km and 20 & 5 MLD STPs at
Davanagere were completed, 18 MLD STP in Harihara and 5 MLD STP in Byadgi is
under progress.
- Karnataka Urban Water Supply Modernisation Project (KUWSMP, Assisted by
World Bank): The project involves an up-scaling of 24x7 water supply to the entire
corporation areas of Belagavi, Kalaburagi and Hubballi-Dharwad at an estimated
cost of Rs. 1809 crores. The share of the World Bank is 67% (Rs. 1209 crores). The
estimated capital expenditure for Belagavi is Rs. 427 crores, Kalaburagi Rs.453 crores
and for Hubballi-Dharwad Rs.763 crores.
Under the AMRUT scheme, 26 cities/towns with a population of one lakh and above
have been selected and Badami city which is categorized as a heritage city has been
selected under the HRIDAY scheme. The GoI has approved Rs. 4952.87 crores for the
entire mission for a period of 5 years. About 91% of this budget (Rs. 4500.79 crores)
has been earmarked only for Water Supply and UGD schemes. An amount of Rs.
1985.61 crores was released by the Government for the project as on November 2019
(Government of Karnataka, 2020).
Seven cities from the state namely, Belagavi, Davanagere, Huballi, Dhaewad,
Shivamogga, Mangaluru, Tumakuru & Bengaluru have been selected under the
smart cities mission. Under the smart cities mission, Rs. 2303 crores (Rs. 1325 crores
from GoI and Rs. 978 crores from GoK) has been released to cities and Rs. 413.52
crores has been spent up to November 2019 (Economic Survey of Karnataka , 2020).

165
A2.4. Sanitation and SWM: State Level Targets and Progress Made So
Far
According to the Sustainable Development Goals Index (SDGI) released by Niti
Aayog, Karnataka ranks 6th in overall performance with respect to all the goals. State
performance in Sanitation and waste management related indicators are mentioned
in the below table. It may be noted that on all the below listed indicators, Karnataka’s
performance is either comparable or slightly worse than the national average, expect
for the amount of waste treated.
Table A2. 2: Performance of Karnataka State on Indicators of SDG 6, 11 and 12
Goal Indicator Karnataka
2019
National
2019
Target
2030
6 Districts verified to be Open Defecation
Free (%)
93.33 88.5 100
6 Urban households with individual
household toilet (%)
93.36 97.2 100
11 Wards with 100% door to door waste
collection (%)
88.51 91 100
11 Waste processed (%) 41 56 100
11 Installed sewage treatment capacity as
a proportion of sewage generated in
urban areas
35 38 100
12 Municipal Solid Waste (MSW) treated
against MSW generated (%)
34.49 20.7 100
12 Wards with 100 % source segregation
(%)
46.43 67.6 100
Source: SDG India Index Baseline report, 2018 and SDG India Index & Dashboard, 2019-20
Table A2.3 shows the progress made across various sanitation related parameters
from the NSSO 69th round data (2012) of urban households in Karnataka to the NSSO
76th round data (2018) of urban households belonging to state.

166
Table A2. 3: Progress Made Across Various Sanitation Related Parameters From 2012 to
2018
SI.
No
Sanitation Parameter
NSSO 69th round
data - 2012
(Per 1000
distribution of
households) / (%)
NSSO 76th round
data – 2018
( %)
NSSO 76th
round National
Average (%)
1 Urban households having access to
some form of latrine facilities
910 / (91.0) 95.7 96.2
2 Urban households with flush/pour-
flush latrine connected to a pipe
sewer system
591 / (59.1) 61.3
39.1
3 Urban households with flush/pour-
flush latrine connected to a septic
tank
155 / (15.5) 20.2
48.9
4 Urban households connected to
underground drainage system
NA 60 53.5
5 Urban households with no drainage
system
86 / (8.6) 3.8 8
6 Urban households disposing waste
water without treatment
NA 92 92.4
Source: NSSO 69th and 76th round report
Karnataka has always performed poorly in all the three Swachh Survekshan (SS)
national level surveys (14th position in 2018 and 2019, and 21st in 2020). However,
Mysore ULB has consistently been among the top 3 cleanest medium sized cities
(population between 3 to 10 Lakhs) over the last 3 years. Despite having chronic
SWM related issues, in the 2020 SS Survey, (based on parameters such as Garbage
Free Cities (GFC), Open Defecation Free & SWM cost versus revenue) surprisingly
Bengaluru was awarded the ‘best sustainable mega city’ in the country. (Greater than
40 lakh population). Additionally, in SS 2020, with regard to the provisioning of
SWM services, Karnataka was ranked 8th in both categories - for ULBs less than 1
lakh population and in ULBs greater than 1 lakh population across all large states.
A2.5. Manual Scavenging and Welfare of Sanitation Workers
Like in many states of India, even in Karnataka those working as manual scavengers
are mostly dalits and among dalits also they are members of the most marginalized
caste groups in the area. A recent study carried out by the National Law School of
India University, Bengaluru reported that 92.33% of workers engaging in this

167
occupation across all 30 districts of Karnataka were dalits, and 3.3% belonged to
Scheduled Tribes. Among those surveyed, about 74% belonged to the madiga
community.
The state of Karnataka identified and reported 73288 manual scavengers according to
the MS survey of 2013. However, the number of manual scavengers in the state as of
March 31st 2019, as reported from a survey conducted by the National Safai
Karamchari Finance and Development Corporation (NSKFDC) is 174289. However,
according to activists, even this number is a gross under-estimate. A report
published by the Safai Karmachari Kavalu Samithi estimates the number of manual
scavengers in the state to be anywhere between 75,000 to 80,000. According to the
Annual report (2018-19) of the National Commission for Safai Karamcharis (NCSK),
the total number of sewer deaths in the state between 1993 to 2018 is 69, and only 2
in 2018 -19, thus an overall official count of 71 sewer deaths in the state since the
Parliament passed The Employment of Manual Scavengers and Construction of Dry
Latrines Prohibition Act in 1993 (NCSK, 2019).
The proportion of identified manual scavengers who received the One Time Cash
Assistance (OTCA) was one of the lowest in Karnataka (62 %). Under the Self
Employment Scheme for Rehabilitation of Manual Scavengers (SRMS) scheme, 1233
projects were sanctioned across the country, and while Karnataka accounted for 18 %
of all the projects sanctioned, it has released one third of the total subsidy amount
given across states. Trainings for 13,587 beneficiaries was sanctioned under the
SRMS scheme, Karnataka sanctioned the same for 31 % of the identified manual
scavengers (Centre for Policy Research, 2019). Under the scheme for pre-metric
scholarship, from the year 2014-18, Karnataka has not demanded for any scholarship
sum to support manual scavengers’ children’s education (Rashtriya Garima
Abhiyan, 2018). NSKDFC had made National Allocation of Funds of Rs. 158 crores
for disbursement to different states in 2018-19, of which Rs. 3.6 crores was
designated for Karnataka (NSKFDC, 2019).
The State government launched the “Pourakarmika Gruha Bhagya Yojana” – a
housing scheme for the welfare of sanitation workers (pourakarmikas). In this
scheme, for a house (pucca houses) with an estimated cost of Rs. 7.50 lakh per unit,
Rs. 6.00 lakh will be contributed by the state government and the remaining Rs.1.50
lakh to be contributed by the beneficiaries or by 'Pradhan Mantri Awas Yojana’ or by
88 Ministry of Social Justice and Empowerment, 2019-20 89 NSKFDC 22nd Annual report 2018-19
168
other funds of ULBs. A total of 4112 beneficiaries from various ULBs were approved
for this scheme. As of early 2019, 570 houses had already been constructed, 1048
were under progress and they were at the tender phase of which about 2000 houses
were expected to be completed by the end of 2019. Several other programmes for
pourakarmikas have also been specifically initiated by the GoK such as general and
master health checkups, vaccinations, life and accidental insurance cover, health
insurance, provision of morning breakfast, pre-metric scholarships to children of
sanitation workers, minimum wages and provident fund to be provided to
permanent workers.
A2.6. Urbanisation Challenges (Specific to Sanitation and SWM)
Government schemes to provide sanitation facilities for the urban poor have been
inadequate. Under the Integrated Low-Cost Sanitation Scheme, only 7,513 toilets
have been constructed in urban areas across the state over the past three years. In
urban areas of Karnataka, the non-usage of toilets was found to be largely due to
technical discrepancies, behavioural concerns, space issues, water scarcity and poor
maintenance of toilets. In rural Karnataka, apart from water scarcity, restricted space,
poor maintenance, cultural habits and financial constraints have been the main
reasons for non-usage of toilets. Public health experts and other studies have pointed
out that large sections of the urban poor are denied access to toilets. Extent of night
soil disposed into rain water drains is of serious concern that could cause
implications on health. Inadequate water availability has also affected toilet usage as
water access and availability is a matter of concern across most of the slums.
Although the slum dwellers have access to water, it is not sufficient to fully meet
their requirements. Purchasing of water is a common feature across slums. This
affects sanitation drastically. People face problems in balancing expenditure, as
purchasing water is a major component, where they have to purchase water for
drinking and also for toilet usage. The unplanned waste dumping places and open
defecation become the sites of the growth of a number of disease carriers like flies
and mosquitoes. These cause health hazards not only in slum areas but also in other
nearby places. According to the NSSO 76th Round (2018), 35.9% of households
reported that during past one yar they faced severe problems related to
flies/mosquitoes.
SWM practices in India are employee intensive, with an estimated 50% of the total
municipal staff engaged in these activities. Moreover, the machinery and equipment
used by the staff are mostly of outdated technology and serve poorly in meeting the

169
new demands. A CAG Audit report highlighted that none of the 30 test-checked
ULBs adhered to the methodology as prescribed in the Manual on Municipal Solid
Waste Management (2016). According to the report, GoK had failed to operationalize
a focused waste minimization strategy in its urban centres (Comptroller and Auditor
General of India, 2020)
The disposal of waste is being carried out in an unscientific manner, with crude open
dumping in low-lying areas being the prevalent practice followed by most ULBs.
MSW is also commonly deposited at dump-yards without ascertaining the suitability
of the land for waste disposal. The results of these are foul smell, breeding of flies
and other pests and generation of liquid run offs (leachate), which pose a serious
threat to the underground water reserves.

170
Annexure 3: Criteria for Organisation of ULBs into
Corporations, Councils, and Nagar Panchayats
Section 3,4, 341A and 341F the Maharashtra Municipal Councils Act 1965 defines a
Municipal Council as an area where the population is not less than 25,000 and the
percentage of employment in non-agricultural activities is not less than 35%.
Similarly, a Nagar Panchayat is an area where the population is more than 10,000 but
less than 25,000 and the percentage of employment in non-agricultural activities is
not less than 25%. ‘The BPMC Act that applies to all municipal corporations then
defined the corporation as any urban area with a population of not less than 3 lakhs
as a Larger Urban Area. In this case, population has been applied as the sole
parameter for change in institutional trajectory.
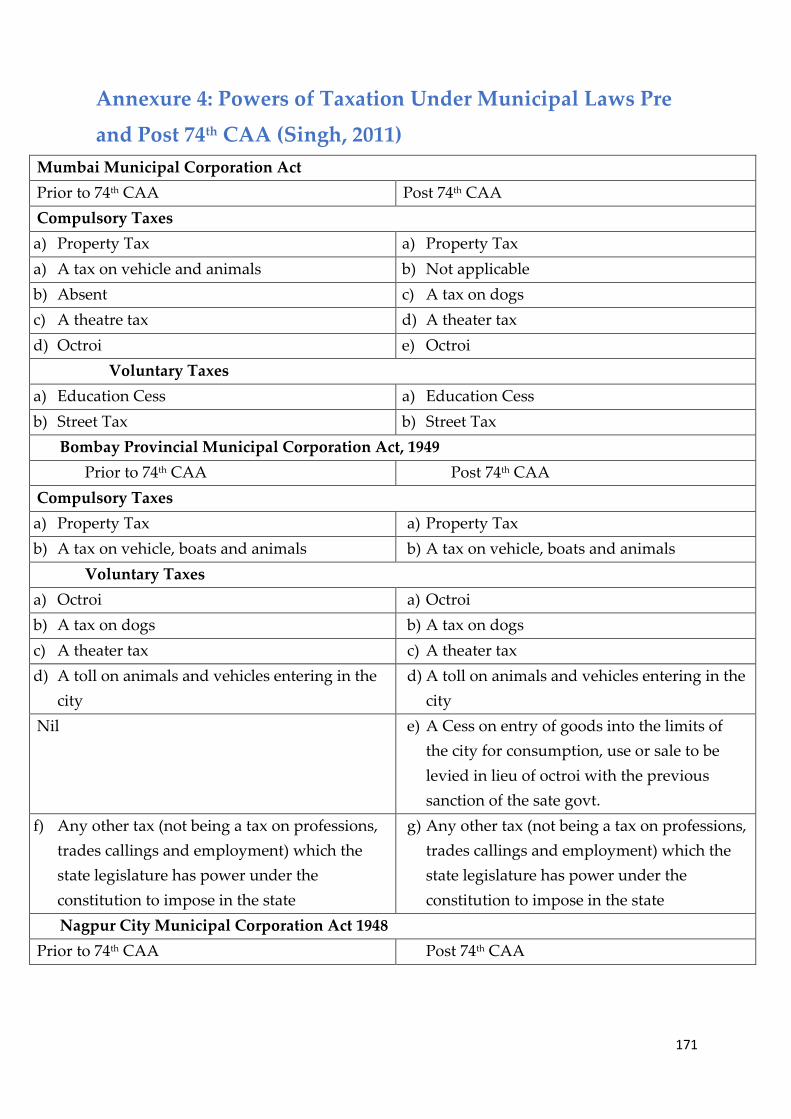
171
Annexure 4: Powers of Taxation Under Municipal Laws Pre
and Post 74th CAA (Singh, 2011)
Mumbai Municipal Corporation Act
Prior to 74th CAA Post 74th CAA
Compulsory Taxes
a) Property Tax a) Property Tax
a) A tax on vehicle and animals b) Not applicable
b) Absent c) A tax on dogs
c) A theatre tax d) A theater tax
d) Octroi e) Octroi
Voluntary Taxes
a) Education Cess a) Education Cess
b) Street Tax b) Street Tax
Bombay Provincial Municipal Corporation Act, 1949
Prior to 74th CAA Post 74th CAA
Compulsory Taxes
a) Property Tax a) Property Tax
b) A tax on vehicle, boats and animals b) A tax on vehicle, boats and animals
Voluntary Taxes
a) Octroi a) Octroi
b) A tax on dogs b) A tax on dogs
c) A theater tax c) A theater tax
d) A toll on animals and vehicles entering in the
city
d) A toll on animals and vehicles entering in the
city
Nil e) A Cess on entry of goods into the limits of
the city for consumption, use or sale to be
levied in lieu of octroi with the previous
sanction of the sate govt.
f) Any other tax (not being a tax on professions,
trades callings and employment) which the
state legislature has power under the
constitution to impose in the state
g) Any other tax (not being a tax on professions,
trades callings and employment) which the
state legislature has power under the
constitution to impose in the state
Nagpur City Municipal Corporation Act 1948
Prior to 74th CAA Post 74th CAA
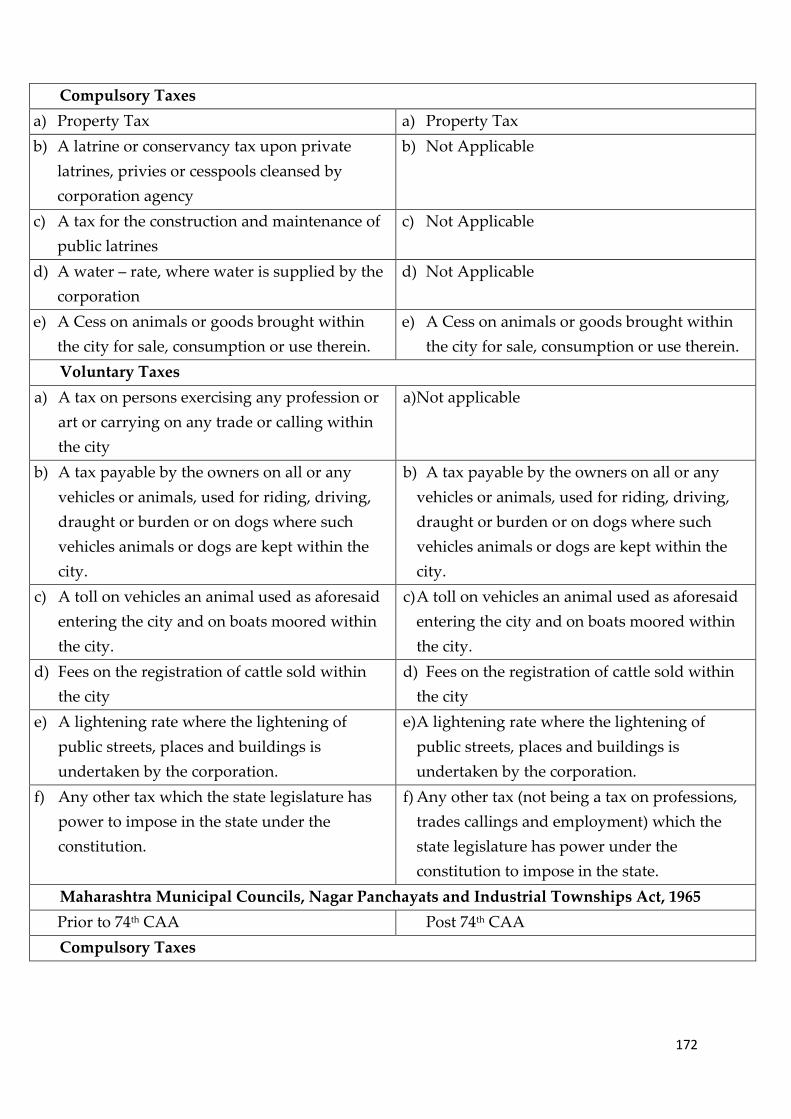
172
Compulsory Taxes
a) Property Tax a) Property Tax
b) A latrine or conservancy tax upon private
latrines, privies or cesspools cleansed by
corporation agency
b) Not Applicable
c) A tax for the construction and maintenance of
public latrines
c) Not Applicable
d) A water – rate, where water is supplied by the
corporation
d) Not Applicable
e) A Cess on animals or goods brought within
the city for sale, consumption or use therein.
e) A Cess on animals or goods brought within
the city for sale, consumption or use therein.
Voluntary Taxes
a) A tax on persons exercising any profession or
art or carrying on any trade or calling within
the city
a) Not applicable
b) A tax payable by the owners on all or any
vehicles or animals, used for riding, driving,
draught or burden or on dogs where such
vehicles animals or dogs are kept within the
city.
b) A tax payable by the owners on all or any
vehicles or animals, used for riding, driving,
draught or burden or on dogs where such
vehicles animals or dogs are kept within the
city.
c) A toll on vehicles an animal used as aforesaid
entering the city and on boats moored within
the city.
c) A toll on vehicles an animal used as aforesaid
entering the city and on boats moored within
the city.
d) Fees on the registration of cattle sold within
the city
d) Fees on the registration of cattle sold within
the city
e) A lightening rate where the lightening of
public streets, places and buildings is
undertaken by the corporation.
e) A lightening rate where the lightening of
public streets, places and buildings is
undertaken by the corporation.
f) Any other tax which the state legislature has
power to impose in the state under the
constitution.
f) Any other tax (not being a tax on professions,
trades callings and employment) which the
state legislature has power under the
constitution to impose in the state.
Maharashtra Municipal Councils, Nagar Panchayats and Industrial Townships Act, 1965
Prior to 74th CAA Post 74th CAA
Compulsory Taxes

173
a) Consolidated Property tax a) Consolidated Property tax
b) An Octroi b) Not Applicable
c) Profession tax c) Not Applicable
d) A tax on cinemas, theaters, circuses, carnivals
and other performance and show
d) A tax on cinemas, theaters, circuses, carnivals
and other performance and show
e) A tax on advertisements other than
advertisements published in the newspapers.
Provided that the maximum and minimum rates
at which the taxes aforesaid shall be levied in
different classes of municipal areas and other
matters relation to imposition, assessment,
collection and exemptions there of shall be
prescribed by the rules.
e) A tax on advertisements other than
advertisements published in the newspapers.
f) Provided that the maximum and minimum
rates at which the taxes aforesaid shall be
levied in different classes of municipal areas
and other matters relation to imposition,
assessment, collection and exemptions there
of shall be prescribed by the rules.
Voluntary Taxes
a) A tax on all vehicles (excluding motor vehicles
as defined in the motor vehicle act 1939 [IV
1939]), boats or animals. Used for riding,
driving, draught or burden and kept for use
within the municipal area, whether they are
actually kept within or outside such area.
a) A tax on all vehicles (excluding motor
vehicles as defined in the motor vehicle act
1939 [IV 1939]), boats or animals. Used for
riding, driving, draught or burden and kept
for use within the municipal area, whether
they are actually kept within or outside such
area.
b) A toll on vehicles (excluding motor vehicles
save as provided in the section 20 of the
Bombay Motor Vehicle Tax Act 1958) and
animals used.
b) A toll on vehicles (excluding motor vehicles
save as provided in the section 20 of the
Bombay Motor Vehicle Tax Act 1958) and
animals used.
c) A tax on dogs kept within the municipal area c) A tax on dogs kept within the municipal area
d) A special sanitary tax on private latrines,
premises or compounds cleansed by
municipal agency
d) A special sanitary tax on private latrines,
premises or compounds cleansed by
municipal agency
e) A drainage tax e) A drainage tax
f) A special water tax for water supplied by the
council in individual cases
f) A special water tax for water supplied by the
council in individual cases
g) A tax on pilgrims g) A tax on pilgrims
h) A special Educational tax h) A special Educational tax
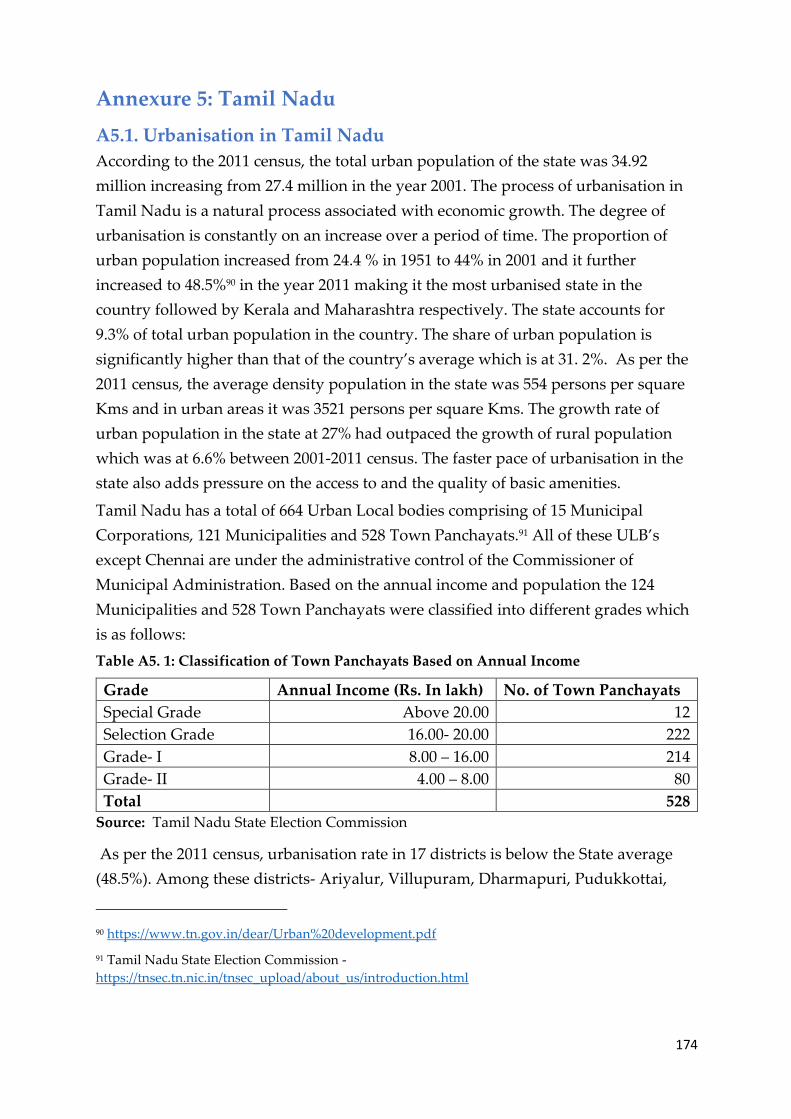
174
Annexure 5: Tamil Nadu
A5.1. Urbanisation in Tamil Nadu
According to the 2011 census, the total urban population of the state was 34.92
million increasing from 27.4 million in the year 2001. The process of urbanisation in
Tamil Nadu is a natural process associated with economic growth. The degree of
urbanisation is constantly on an increase over a period of time. The proportion of
urban population increased from 24.4 % in 1951 to 44% in 2001 and it further
increased to 48.5%90 in the year 2011 making it the most urbanised state in the
country followed by Kerala and Maharashtra respectively. The state accounts for
9.3% of total urban population in the country. The share of urban population is
significantly higher than that of the country’s average which is at 31. 2%. As per the
2011 census, the average density population in the state was 554 persons per square
Kms and in urban areas it was 3521 persons per square Kms. The growth rate of
urban population in the state at 27% had outpaced the growth of rural population
which was at 6.6% between 2001-2011 census. The faster pace of urbanisation in the
state also adds pressure on the access to and the quality of basic amenities.
Tamil Nadu has a total of 664 Urban Local bodies comprising of 15 Municipal
Corporations, 121 Municipalities and 528 Town Panchayats.91 All of these ULB’s
except Chennai are under the administrative control of the Commissioner of
Municipal Administration. Based on the annual income and population the 124
Municipalities and 528 Town Panchayats were classified into different grades which
is as follows:
Table A5. 1: Classification of Town Panchayats Based on Annual Income
Grade Annual Income (Rs. In lakh) No. of Town Panchayats
Special Grade Above 20.00 12
Selection Grade 16.00- 20.00 222
Grade- I 8.00 – 16.00 214
Grade- II 4.00 – 8.00 80
Total 528
Source: Tamil Nadu State Election Commission
As per the 2011 census, urbanisation rate in 17 districts is below the State average
(48.5%). Among these districts- Ariyalur, Villupuram, Dharmapuri, Pudukkottai,
90 https://www.tn.gov.in/dear/Urban%20development.pdf
91 Tamil Nadu State Election Commission -
https://tnsec.tn.nic.in/tnsec_upload/about_us/introduction.html

175
Tiruvannamalai, Thiruvarur, Krishnagiri and Nagapattinam are the least urbanised
ones. Urbanisation was higher than the state’s average in the remaining 15 districts.
Among them-Chennai, Kanyakumari, Coimbatore, Tiruvallur, Kanchipuram,
Tiruppur and Madurai are highly urbanised districts. The following table shows in
the rate of urbanisation in all the districts of Tamil Nadu:92
Table A5. 2: Urbanisation in Tamil Nadu
District Rate of Urbanization District Rate of Urbanization
Chennai 100.0 Namakkal 40.3
Kanniyakumari 82.3 Dindigul 37.4
Coimbatore 75.7 Thanjavur 35.4
Thiruvallur 65.1 Cuddalore 34.0
Kancheepuram 63.5 Sivagangai 30.8
Tiruppur 61.4 Ramanathapuram 30.3
Madurai 60.8 Krishnagiri 22.8
The Nilgiris 59.2 Nagapattinam 22.6
Theni 53.8 Thiruvarur 20.4
Erode 51.4 Thiruvannamalai 20.1
Salem 51.0 Pudukkottai 19.5
Virudhunagar 50.5 Dharmapuri 17.3
Tuticorin 50.1 Perambalur 17.2
Tirunelveli 49.4 Villupuram 15.0
Tiruchirappalli 49.2 Ariyalur 11.1
Vellore 43.2 State 48.5
Karur 40.8
Source: https://www.tn.gov.in/dear/Urban%20development.pdf
Tamil Nadu has a spatially dispersed pattern of urbanisation with large number of
small and medium towns spread throughout the state93. While it is accompanied by
92 https://www.tn.gov.in/dear/Urban%20development.pdf
93 https://www.thehindu.com/news/national/tamil-nadu/what-drives-urbanisation-in-tamil-
nadu/article7386961.ece

176
developments in the transport infrastructure, it also enabled a de-agrarianisation of
employment. Historically, most part of Tamil Nadu depended on rain-fed
agriculture, textile industry and in particular handloom industry was a part of the
economic activities in rural areas to augment income. In Tamil Nadu, the industrial
estates conceived later wherein economic activities started spurring in all districts
that gradually paved way for creation of small towns. Another reason for rapid
urbanisation is the migration of people from rural to urban areas in search of
employment opportunities and better healthcare and educational facilities. The
evolution of the transport industry in the state led to easy transition from
agricultural employment to non-agricultural employment. However, currently urban
growth is heavily concentrated in the Chennai region and in western Tamil Nadu.
The Gross Domestic Product (GSDP) of Tamil Nadu for 2019-20 at current prices is
estimated to be Rs 17,25,639 crore which is 8% higher than the revised estimate for
2018-19. The GSDP of Tamil Nadu (at current prices) has grown at a rate of 10.2%
during the period 2013-14 to 2017-18. The per capita GSDP of Tamil Nadu in 2017-18
(at current prices) was Rs 1,86,125 which is 11% higher than that of 2016-1794.
A5.2. Provisioning of Sanitation and SWM services
According to the District Municipalities Act, the obligatory functions of
municipalities with respect to water, sanitation and waste management are: a)
Provision and maintenance of water supply; b) Provision and maintenance of public
drainage; c) Provision and maintenance of latrines; d) Arrangements for sweeping
streets and removing solid waste;
The Tamil Nadu Water and Drainage Act 1971 and the Chennai Metropolitan Water
Supply and Drainage Act, 1977 provided for the creation of parastatal bodies at the
state level to deliver services and/or take responsibility for municipal functions such
as water and sanitation. Apart from Chennai, where the Chennai Metropolitan
Water Supply and Sewerage Board supplies water, in all other ULBs water supply
remains one of the core functions. Water in ULBs is either supplied through a locally
administered scheme or a combined water supply scheme administered by the Tamil
Nadu Water Supply and Drainage Board (TWAD). Data from the Third SFC shows
that except for Chennai, all other ULBs have large arrears payable to the TWAD.
94 https://www.prsindia.org/parliamenttrack/budgets/tamil-nadu-budget-analysis-2019-
20#:~:text=GSDP%3A%20The%20GSDP%20of%20Tamil,%2D14%20to%202017%2D18.&text=Per%20ca
pita%20GSDP%3A%20The%20per,(Rs%201%2C67%2C240)

177
Even though the government has been revising the water charges under the
Combined Water Supply Scheme, ULBs continue to charge a flat rate per month
from residential and higher flat rates for industrial or commercial use. For both
sanitation and SWM services, the state government’s Norms Committees specify
norms from time to time regarding staffing. In order to reduce manpower, in regard
to solid waste management, the second SFC saw a significant scope for privatization,
and recommended that specific components be privatized to reduce conservancy
staff to bare minimum, and ensure lower cost and better service.
Policies/State Level Strategies: Sanitation and SWM
In line with the requirements of the NUSP, 2008, The Tamil Nadu State Urban
Sanitation Policy (draft) was prepared by the Commissionerate of Municipal
Administration in 2012. The vision of the policy is to eradicate open defecation, while
the specific goals are: a. Awareness generation and behaviour change, open
defecation free cities, and integrated city-wide sanitation. Some of the key issues that
raise the need for a sanitation policy are as follows: 1) Lack of/ Poor Awareness:
Sanitation has been accorded low priority and there is poor awareness about its
inherent linkages with public health. 2) Social and Occupational aspects of
Sanitation: Despite the appropriate legal framework, little or no attention has been
paid towards the occupational hazard faced by sanitation workers daily. 3)
Fragmented Institutional Roles and Responsibilities: There are considerable gaps and
overlaps in institutional roles and responsibilities at the national, state, and city
levels. Lack of clear lines of accountability for sanitation has led to inefficient systems
and solutions. 4) Lack of an Integrated City-wide Approach: Sanitation investments
are currently planned in a piece-meal manner and do not take into account the full
cycle of safe confinement, treatment and safe disposal. 5) Limited Technology
Choices: Technologies have been focussed on limited options that have not been
cost-effective, and sustainability of investments has been in question. 6) Reaching the
unserved and poor: Urban poor communities, as well other residents of informal
settlements, have been constrained by lack of tenure, space or economic constraints,
in obtaining affordable access to safe sanitation. In this context, the issues of whether
services to the poor should be individualised and whether community services
should be provided in non-notified slums should be addressed. However, provision
of individual toilets should be prioritised. In relation to “Pay and Use” toilets, the
issue of subsidies inadvertently reaching the non-poor should be addressed by
identifying different categories of urban poor. 7) Lack of Demand Responsiveness:

178
Sanitation has been provided by public agencies in a supply-driven manner, with
little regard for demands and preferences of households as customers of sanitation
services (International Environmental Law Research Centre, 2012).
According to Census (2001 and 2011 provisional) figures there are 59 lakh urban
households in Tamil Nadu out of which, 35.7% of the urban households do not have
access to toilets, 7.7% use community toilets, 30% do not have access to drainage
network and 35% are connected to open drains. Further, the proportion of notified
and non-notified slums with no latrine facility was found to be significantly higher
for Tamil Nadu; 27 % and 40 % respectively.
SWM Policy: solid waste Management policy and strategy for the state of Tamil
Nadu
On 24th August 2018, the government of Tamil Nadu issued a notification
‘implementation of the solid waste management Rules-Rule 11 of the solid waste
management rules 2016 - solid waste Management policy and strategy for the state’.
According to the notification, the need for the policy is explained as follows: Given
the slow pace of implementation of Solid Waste Management Rules, the mammoth
task ahead, the complexities involved like selection and application of technically,
economically and socially appropriate solutions for waste collection, transfer,
treatment & disposal and lack of technical know-how at the local government level,
the Government of Tamil Nadu felt it necessary to frame a State policy on SWM
giving clear directives to facilitate expeditious implementation of the present SWM
Rules 2016 to improve the quality of life of people. The action goals are as follows: 1)
To have high standard of cleanliness in the urban and rural areas of the state by
effective management of solid waste 2) To ensure 100% Door to Door collection of
waste and abolition of unhygienic system of disposal by the households. 3) To make
local bodies capable of managing Solid Waste efficiently and cost effectively. 4) To
promote the practice of Reduce, Reuse, Recycle and Recover (4Rs) to achieve 80%
reduction in waste. 5) To make the Solid Waste Management services sustainable. 6)
To minimize waste going to landfill (implementation of the solid waste management
Rules, 2018).
Two significant features of the policy are (i) decentralised processing of waste, and
(ii) bio-mining to address the challenges of legacy waste, i.e., the garbage hills which
have become an unfortunate hallmark of Indian cities. The ultimate objective would
be to ensure zero waste by practicing the concept of 4Rs in a concerted manner.
Extended producers’ liability is also to be insisted on. The policy document aims that
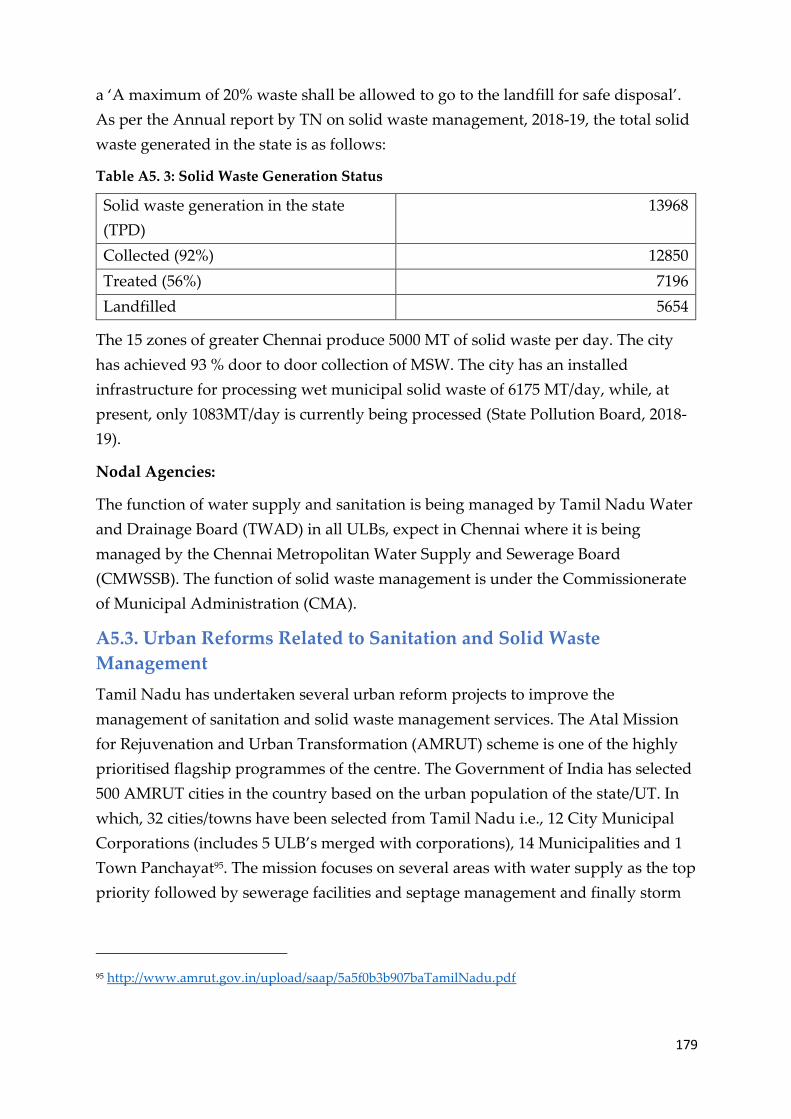
179
a ‘A maximum of 20% waste shall be allowed to go to the landfill for safe disposal’.
As per the Annual report by TN on solid waste management, 2018-19, the total solid
waste generated in the state is as follows:
Table A5. 3: Solid Waste Generation Status
Solid waste generation in the state
(TPD)
13968
Collected (92%) 12850
Treated (56%) 7196
Landfilled 5654
The 15 zones of greater Chennai produce 5000 MT of solid waste per day. The city
has achieved 93 % door to door collection of MSW. The city has an installed
infrastructure for processing wet municipal solid waste of 6175 MT/day, while, at
present, only 1083MT/day is currently being processed (State Pollution Board, 2018-
19).
Nodal Agencies:
The function of water supply and sanitation is being managed by Tamil Nadu Water
and Drainage Board (TWAD) in all ULBs, expect in Chennai where it is being
managed by the Chennai Metropolitan Water Supply and Sewerage Board
(CMWSSB). The function of solid waste management is under the Commissionerate
of Municipal Administration (CMA).
A5.3. Urban Reforms Related to Sanitation and Solid Waste
Management
Tamil Nadu has undertaken several urban reform projects to improve the
management of sanitation and solid waste management services. The Atal Mission
for Rejuvenation and Urban Transformation (AMRUT) scheme is one of the highly
prioritised flagship programmes of the centre. The Government of India has selected
500 AMRUT cities in the country based on the urban population of the state/UT. In
which, 32 cities/towns have been selected from Tamil Nadu i.e., 12 City Municipal
Corporations (includes 5 ULB’s merged with corporations), 14 Municipalities and 1
Town Panchayat95. The mission focuses on several areas with water supply as the top
priority followed by sewerage facilities and septage management and finally storm
95 http://www.amrut.gov.in/upload/saap/5a5f0b3b907baTamilNadu.pdf
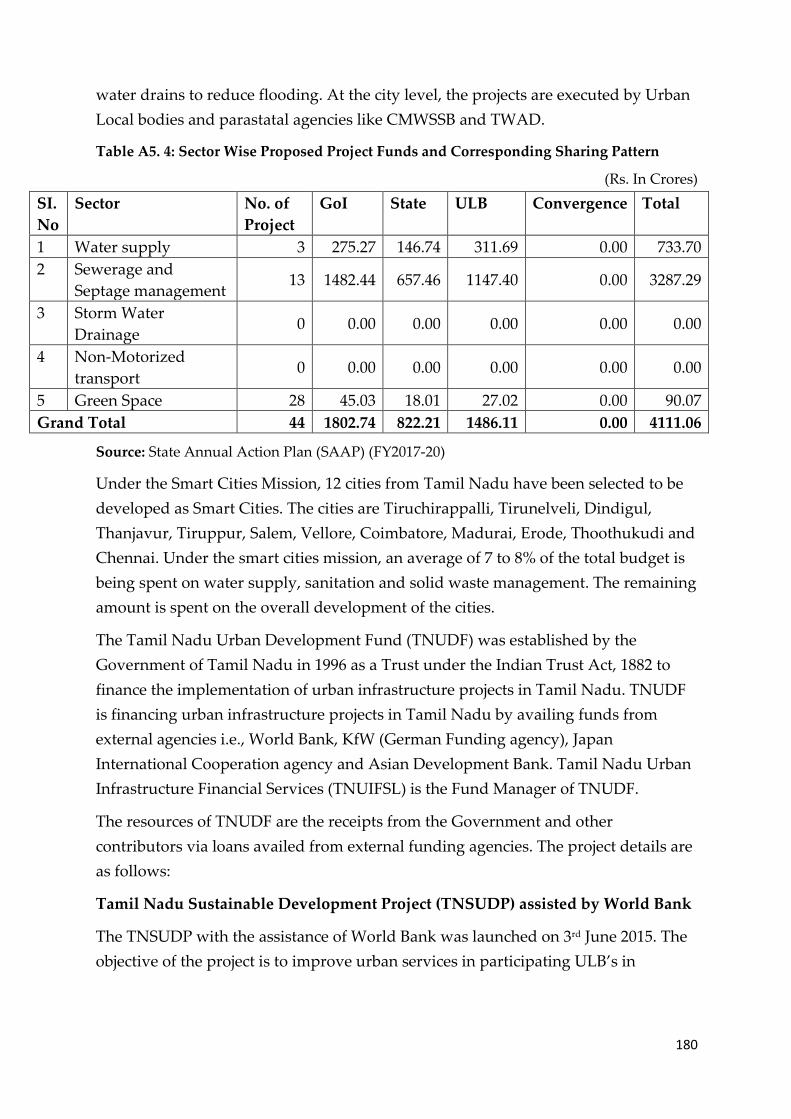
180
water drains to reduce flooding. At the city level, the projects are executed by Urban
Local bodies and parastatal agencies like CMWSSB and TWAD.
Table A5. 4: Sector Wise Proposed Project Funds and Corresponding Sharing Pattern
(Rs. In Crores)
SI.
No
Sector No. of
Project
GoI State ULB Convergence Total
1 Water supply 3 275.27 146.74 311.69 0.00 733.70
2 Sewerage and
Septage management 13 1482.44 657.46 1147.40 0.00 3287.29
3 Storm Water
Drainage 0 0.00 0.00 0.00 0.00 0.00
4 Non-Motorized
transport 0 0.00 0.00 0.00 0.00 0.00
5 Green Space 28 45.03 18.01 27.02 0.00 90.07
Grand Total 44 1802.74 822.21 1486.11 0.00 4111.06
Source: State Annual Action Plan (SAAP) (FY2017-20)
Under the Smart Cities Mission, 12 cities from Tamil Nadu have been selected to be
developed as Smart Cities. The cities are Tiruchirappalli, Tirunelveli, Dindigul,
Thanjavur, Tiruppur, Salem, Vellore, Coimbatore, Madurai, Erode, Thoothukudi and
Chennai. Under the smart cities mission, an average of 7 to 8% of the total budget is
being spent on water supply, sanitation and solid waste management. The remaining
amount is spent on the overall development of the cities.
The Tamil Nadu Urban Development Fund (TNUDF) was established by the
Government of Tamil Nadu in 1996 as a Trust under the Indian Trust Act, 1882 to
finance the implementation of urban infrastructure projects in Tamil Nadu. TNUDF
is financing urban infrastructure projects in Tamil Nadu by availing funds from
external agencies i.e., World Bank, KfW (German Funding agency), Japan
International Cooperation agency and Asian Development Bank. Tamil Nadu Urban
Infrastructure Financial Services (TNUIFSL) is the Fund Manager of TNUDF.
The resources of TNUDF are the receipts from the Government and other
contributors via loans availed from external funding agencies. The project details are
as follows:
Tamil Nadu Sustainable Development Project (TNSUDP) assisted by World Bank
The TNSUDP with the assistance of World Bank was launched on 3rd June 2015. The
objective of the project is to improve urban services in participating ULB’s in

181
financially sustainable manner and improve urban management practices in selected
cities. A sum of Rs 930.57 crores was disbursed as loan. The Tamil Nadu Water
Supply and Drainage Board (TWAD) board is entrusted with the development of
Water Supply and Sewerage facilities in the state of Tamil Nadu except Chennai
Metropolitan region. TWAD Board further expanded their horizon of service to
include maintenance of major Combined Water Supply Schemes (CWSS) into their
domain. Further an UGD scheme was implemented in Namakkal Municipality
during 2012 and it was proposed to enhance Water Supply service level in Namakkal
Municipality to 135 LPCD by implementing a separate Water Supply Improvement
scheme with Head works near Jederpalayam Anaicut. The project has been proposed
under TNSUDP at an estimating cost of Rs. 185.24 crores.96 The project aims at
providing 17.66 MLD of water supply improvement scheme to Namakkal
Municipality and enhancing the service level to 135 LPCD.
Furthermore, the Municipal Administration and Water Supply Department of the
Greater Chennai Corporation has taken up construction of integrated storm water
drains for Rs. 1101.43 crores in the extended areas of Greater Chennai Corporation in
Cooum and Adyar river basins.97
Sustainable Municipal Infrastructure Financing – Tamil Nadu (SMIF-TN) assisted
by KFW
The SMIF-TN programme assisted by KFW was launched in 2008. The objective was
to improve the living conditions of residents in urban areas by constructing and
improving water supply, sewerage and other urban facilities. The program had two
Phases wherein Phase-1 is completed and Phase-2 is under implementation. A sum
of Rs.865.03 crores (Rs.371.52 crores under SMIF – TN Program, Rs.267.96 crores
under SMIF – TN-II-Part-1 Program and Rs.225.55 crores under SMIF – TN-II-Part-2
Program) has been disbursed as term loan to the ULBs based on the progress of the
projects up to 31.03.2019.98
Tamil Nadu Urban Flagship Investment Program (TNUFIP)- assisted by Asian
Development Bank (ADB)
The TNUFIP has three phases. The objective of the program is to develop priority
water supply, sewerage and drainage infrastructure located within strategic
96 https://www.twadboard.tn.gov.in/sites/default/files/esia-wsis_0.pdf
97 https://www.chennaicorporation.gov.in/images/SWDPadikuppamEnglish.pdf
98 http://tnuifsl.com/tnudf.asp
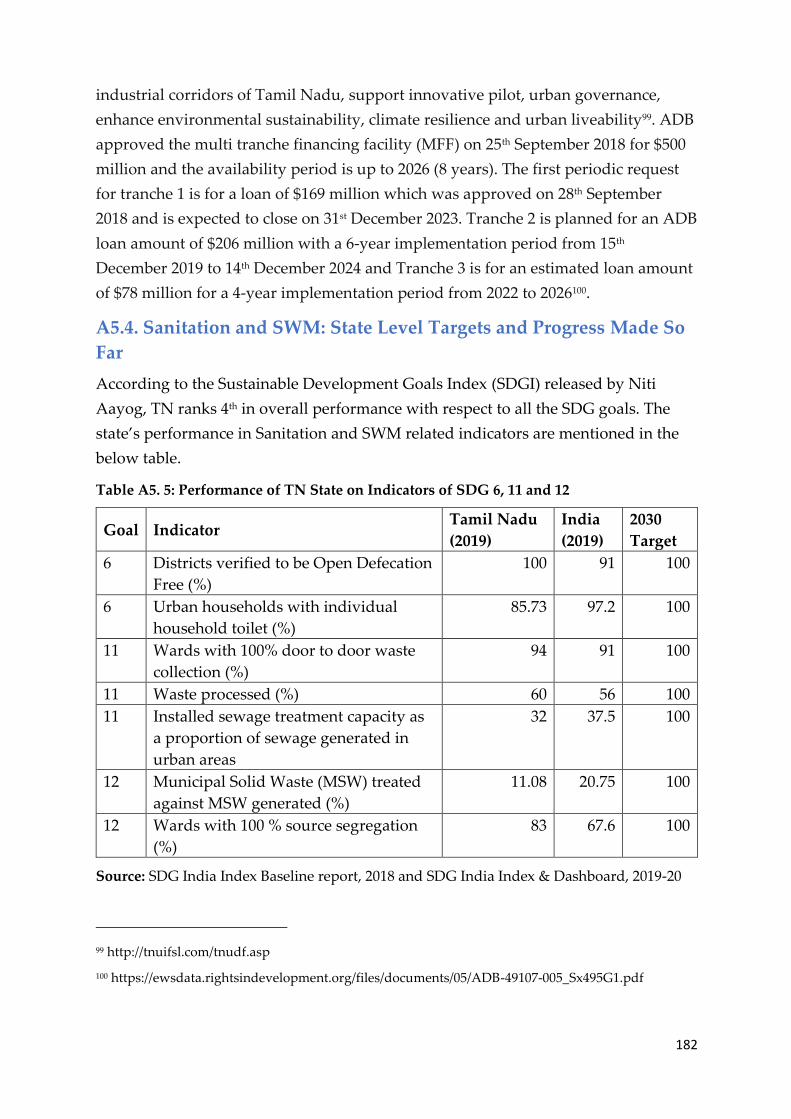
182
industrial corridors of Tamil Nadu, support innovative pilot, urban governance,
enhance environmental sustainability, climate resilience and urban liveability99. ADB
approved the multi tranche financing facility (MFF) on 25th September 2018 for $500
million and the availability period is up to 2026 (8 years). The first periodic request
for tranche 1 is for a loan of $169 million which was approved on 28th September
2018 and is expected to close on 31st December 2023. Tranche 2 is planned for an ADB
loan amount of $206 million with a 6-year implementation period from 15th
December 2019 to 14th December 2024 and Tranche 3 is for an estimated loan amount
of $78 million for a 4-year implementation period from 2022 to 2026100.
A5.4. Sanitation and SWM: State Level Targets and Progress Made So
Far
According to the Sustainable Development Goals Index (SDGI) released by Niti
Aayog, TN ranks 4th in overall performance with respect to all the SDG goals. The
state’s performance in Sanitation and SWM related indicators are mentioned in the
below table.
Table A5. 5: Performance of TN State on Indicators of SDG 6, 11 and 12
Goal Indicator Tamil Nadu
(2019)
India
(2019)
2030
Target
6 Districts verified to be Open Defecation
Free (%)
100 91 100
6 Urban households with individual
household toilet (%)
85.73 97.2 100
11 Wards with 100% door to door waste
collection (%)
94 91 100
11 Waste processed (%) 60 56 100
11 Installed sewage treatment capacity as
a proportion of sewage generated in
urban areas
32 37.5 100
12 Municipal Solid Waste (MSW) treated
against MSW generated (%)
11.08 20.75 100
12 Wards with 100 % source segregation
(%)
83 67.6 100
Source: SDG India Index Baseline report, 2018 and SDG India Index & Dashboard, 2019-20
99 http://tnuifsl.com/tnudf.asp
100 https://ewsdata.rightsindevelopment.org/files/documents/05/ADB-49107-005_Sx495G1.pdf

183
Table A5.6 shows the progress made across various sanitation related parameters
from the NSSO 69th round data (2012) to the NSSO 76th round data (2018) of urban
households belonging to TN state.
Table A5. 6: Progress Made Across Various Sanitation Related Parameters From 2012 To
2018
SI.
No Sanitation Parameter
NSSO 69th round
data - 2012
(Per 1000
distribution of
households) / (%)
NSSO 76th
round data –
2018
(%)
NSSO 76th round
National
Average (%)
1 Urban households having
access to some form of latrine
facilities
878/ (87.8) 93.9 96.2
2 Urban households with
flush/pour-flush latrine
connected to a pipe sewer
system
221/ (22.1) 30.3 39.1
3 Urban households with
flush/pour-flush latrine
connected to a septic tank
578 / (57.8) 67.2 48.9
4 Urban households connected
to underground drainage
system
Not Available 41.5 53.5
5 Urban households with no
drainage system 171 / (17.1) 9.8 8
6 Urban households disposing
waste water without treatment Not Available 93.6 92.4
Source: NSSO 69th and 76th round report
Tamil Nadu has always been a below-average scoring state in all the three Swachh
Survekshan (SS) national level surveys (2018, 19, and 20). It has never made it to the
top 10 states. In SS 2020, Melathiruppanthruthi was ranked 4th in the category of
ULBs with less than 25,000 population. Greater Chennai received the award for ‘best
mega city in Innovation and Best practices’, and Melathiruppanthruthi for ‘best
mega city in Innovation and Best practices’ in less than 25,000 population categories.
Additionally, with regard to the provisioning of SWM services, TN had a poor score
of 256 as against the highest score of 1050 (Chhattisgarh) (for ULBs more than 1 lakh
population category), and even lesser score of 92 as against the highest score of 924
(Dadra and Nagar Haveli) (for ULBs with less than 1 lakh population category).

184
A5.5. Manual Scavenging and Welfare of Sanitation Workers
The state of Tamil Nadu identified and reported 363101 manual scavengers according
to the MS survey of 2013. However, the number of manual scavengers in the state as
of 2018, as reported from a survey conducted by the National Safai Karamchari
Finance and Development Corporation (NSKFDC) is 62102. According to the Annual
report (2018-19) of National Commission for Safai Karamcharis (NCSK), the total
number of sewer deaths in the state between 1993-2019 is 194, and 9 during 2018-19,
thus an overall official count of 203 sewer deaths of manual scavengers in the state
(NCSK, 2019). The proportion of identified manual scavengers who received the One
Time Cash Assistance (OTCA) was 93%. Training for 13,587 beneficiaries was
sanctioned under the SRMS scheme, which is 69 % of the identified manual
scavengers (Centre for Policy Research, 2019). Under the scheme for pre-metric
scholarship, from the year 2014-18, TN has not demanded for any scholarship to
support manual scavengers’ children’s education (Rashtriya Garima Abhiyan, 2018).
NSKDFC had made a national allocation of Funds of Rs. 158 crores for disbursement
to different states in 2018-19, of which 3.6 crores was designated to TN (NSKFDC,
2019).
In 2003, the Government issued a notification that no person shall engage in or
employ or permit to be engaged in or employed for any other person for manually
carrying human excreta, or construct or maintain a dry latrine in areas comprising of
the whole of the State of Tamil Nadu with effect from 1st October 200 (International
Environmental Law Research Centre, 2012).
A5.6. Urbanisation Challenges (Specific to Sanitation and SWM)
Lack of adequate sanitation poses one of greatest barriers to the development of
Tamil Nadu. It further hampers the maintenance of high standards of safety and
public health. While sewerage and treatment plants have received adequate policy
investments in the larger cities of the state, on-site systems that are predominantly
households have been given limited attention. Moreover, the pits and septic tanks
are not built properly which leads to leakage of faecal matter into drains, water
bodies and open areas. These septic tanks are left unclean for a long period of time
posing major health and environmental hazards. UGD systems in many locations
suffer from problem of maintenance such that the sewerage generated does not reach
101 Ministry of Social Justice and Empowerment, 2019-20
102 NSKFD 22nd Annual report 2018-19
185
the treatment plants and the existing ones are unable to treat the waste received103.
However, currently with the funding received from AMRUT and Swachh Bharat
Mission-the situation is slowly improving.
With regards to the accessibility of toilet facilities, 75.1% of urban households have
individual toilets within their premises. However, only 8.6% of households accessed
public toilets while 16.2% followed the practice of open defecation as against the
national average of 13%.104 The inadequacy and lack of proper sanitation facilities in
public toilets were cited as the main reasons for practising open defecation. The
situation is however improving currently with adequate monitoring and
implementation of schemes.
Solid Waste Management is one of the most important obligatory functions of urban
local bodies as per the 74th Constitutional Amendment. The ULB’s in the state have
taken many initiatives to bring about improvements to primary collection and
transportation of waste. However, the major issues that still persist are absence of
segregation of waste at source, lack of technical expertise, appropriate arrangements
for disposal, dearth of sanitation workers and indifference of public towards waste
management due to lack of awareness105. The indiscriminate burning of waste by
public and sanitation workers in almost all the urban local bodies has led to
significant environmental hazards.
103 http://muzhusugadharam.co.in/tnussp/
104 https://www.tn.gov.in/dear/Urban%20development.pdf
105 https://www.tn.gov.in/dear/Urban%20development.pdf

186
Annexure 6: Maharashtra
A6.1. Urbanisation in Maharashtra
Maharashtra is the second largest state in India in terms of population and has a
geographical area of about 3.08 lakh sq. km. The State has 36 districts which are
functioning under six revenue divisions viz. Konkan, Pune, Nashik, Aurangabad,
Amravati and Nagpur, with effective machinery for planning at the district level.
With an urban population of 45.22%, Maharashtra is the third most urbanised state
among the major states of India, behind Tamil Nadu and Kerala106. The percentage of
urban population to the total population increased from 42.23% in 2001 to 45.22% in
2011, registering an annual exponential growth rate (AEGR) of 2.12% which is
slightly lower than India’s AEGR of 2.76% during the same time period. It is
projected that by around 2031-35, the percentage of Maharashtra’s urban population
to the total population would increase to 51.3%. The increase in urban population
has accounted for nearly 62.8% of the total population growth in Maharashtra.
Maharashtra has 387 urban local bodies comprising of 27 Municipal Corporations,
236 Municipal Councils and 124 Nagar Panchayats107. Mumbai, the capital of
Maharashtra and the financial capital of India, houses the headquarters of many
major corporate & financial institutions. India's main stock exchanges & capital
market and commodity exchanges are in Mumbai. The state ranks second in India in
terms of number of factories, workers and fixed capital with a share of 12.4 %, 12.1 %
and 13.6 %, respectively. However, the growth of urbanisation within Maharashtra is
very disparate. The western region of the state is much more urbanized as compared
to the eastern region of the state. Marathwada and Vidarbha have the lowest levels
of urbanisation in the state. As per the 2011 census, Mumbai (100%), Thane (77%),
Nagpur (68%) and Pune (61%) are the most urbanised districts in the state whereas
Gadchiroli (11%), Sindhudurg (13%) and Hingoli (15%) are the least urbanised
districts in the state108. The rapid growth in information technology sectors is one of
the main causes of high urbanisation levels in Mumbai, Pune and Nagpur districts.
(Government of Maharashtra, 2013).
106 Data according to census 2011. https://www.dnaindia.com/mumbai/report-maharashtra-third-most-
urbanised-state-1567143 107 Report_No.5_of_2017_–_Local_Bodies_Government_of_Maharashtra-CAG 108
https://www.researchgate.net/publication/319553254_LEVEL_OF_URBANISATION_AND_THEIR_DI
SPARITIES_IN_MAHARASHTRA_STATE/link/59b381f20f7e9b374350d96b/download
187
Over the last few decades, people from different parts of the country have migrated
to Maharashtra in general, and Mumbai in particular in search of livelihood. Since
the 2000’s, the city of Pune has also witnessed a significant increase urbanisation
which is mainly attributed due to the rapid growth in the IT sector. High levels of
urbanisation in only certain cities is due to better services in terms of education,
health, transport and infrastructure. Lack of infrastructure and employment
opportunities are key driving forces which favour rural population from
Maharashtra’s hinterlands to migrate to nearby urban centres. In Maharashtra, thus,
urbanisation is not only due to industrialisation but also due to demographic
explosion and induced rural-urban migration.
While India’s average year-on-year GDP growth has been 6.9% between 2013 to
2017, it was 7.4% for Maharashtra during the same time period. While India’s GDP
grew by 6.7% in 2018, the Gross State Domestic Product (GSDP) growth rate of
Maharashtra in 2018 was 7.3%109. The GSDP of Maharashtra for 2020-21 (at current
prices) is estimated to be Rs. 32,24,013 crores. This is a 12% increase from the revised
estimate of 2019-20. In 2018-19, agriculture, manufacturing, and services contributed
13%, 31%, and 56%, respectively, to the state’s economy. In the same year, these
sectors grew by -1.6%, 6.1%, and 8.1%, respectively110. Maharashtra has the highest
GSDP among all the states in the country. and in 2019-20 contributed close to 14% of
India’s GDP. Maharashtra has consistent been among the top five states that have
been major contributors to the nation’s GDP.
A6.2. Provisioning of Sanitation and SWM services
Even prior to the 74th CAA, all Municipal Acts of Maharashtra mention sanitation,
conservancy, and solid waste management as obligatory functions (Table A6.1). It is
also enlisted in the 12th schedule of 74th CAA 1992. However, ‘to set up farm or
factory for disposal of waste’ is listed as a discretionary function across all the 4
Municipal Acts.
109 States of Growth 2.0, A CRISIL Research Report, 2019 110 Maharashtra Budget Analysis 2020-21 by PRS Legislative Research

188
Table A6. 1: Position of Sanitation and Conservancy Function in Maharashtra Municipal
Laws Prior To 74th CAA (I.E. Prior To 1994 In Maharashtra)
Functions under 12th
schedule
Mumbai
Municipal
Corporation
Act 1881
The city of
Nagpur
Municipal
Corporation
Act 1948
Bombay
Provincial
Municipal
Corporation
Act 1949
Maharashtra
Municipal
Councils, Nagar
Panchayats and
Industrial
Townships Act 1965
Public Health,
Sanitation, conservancy
and Solid waste
Management
Obligatory Obligatory Obligatory Obligatory
To set up farm or
factory for disposal of
waste
Obligatory Obligatory Obligatory Obligatory
Source: Maharashtra Municipal Councils, Nagar Panchayats 233 and Industrial Townships
Act, 1965
In 1996, the state government took a major step by separating the functions of water
supply and sanitation from the department of urban and rural development and
formed an independent department for Water Supply and Sanitation to exclusively
concentrate and improve upon the poor coverage and access to these essential
services in both urban and rural areas. The Water Supply and Sanitation Department
(WSSD) is responsible for setting the policies for the state in this sector and
coordinates with the Central Government and other key institutions. The WSSD is
supported by two technical wings viz: Maharashtra Jeevan Pradhikaran (MJP) and
Groundwater Survey and Development Agency (GSDA). Along with WSSD, MJP
and GSDA, following institutions at various levels are responsible for water supply
and distribution in the State (see Table A6.2) (All India Institute of Local Self
Government Mumbai, 2011).
Table A6. 2: Institutions Responsible for Water Supply and Sanitation in Maharashtra
Institutional Set-Up Area of Functioning
WSSD (Maharashtra
Water Supply and
Sanitation Dept.)
State-level Department. Formulates and implements policies,
operates and maintains regional water supply schemes in
both rural and urban areas
MJP (Maharashtra
Jeevan Pradhikaran)
One of the most important government bodies for urban
water supply. Formulates and executes schemes and

189
Institutional Set-Up Area of Functioning
determines tariff structures, though its objectives do not
encompass financial sustenance.
GSDA (Groundwater
Survey and
Development
Agency)
Implements schemes based on groundwater resources mostly
in rural areas. However, since many peri-urban areas
without piped water supply are increasingly being
dependent on groundwater, role of this organisation is
becoming important
MIDC (Maharashtra
Industrial
Development
Corporation)
Established to promote industries. The organisation
eventually undertook development of water works. Though
not a regular agency for domestic water supply, it does
supply water to a few towns in the state of Maharashtra.
ZP (Zilla Parishad) Mainly responsible for Rural Water Supply schemes
ULB (Urban Local
Body)
Elected municipal body or institution of self-government for
comprehensive development of urban areas, responsible for
provision of civic amenities and economic development.
Source: All India Institute of Local Self Government Mumbai. (2011). Urban Water and
Sanitation in Maharashtra. PAS Project, CEPT University.
According to Maharashtra Budget Analysis by the PRS Legislative Research, in 2020-
21, sectors such as Water Supply, Sanitation, Housing and Urban Development saw
the highest increase in allocation over the revised estimate of the previous year
(26%).
As per the 2011 census in Maharashtra state:
• 28.7 % of urban households in Maharashtra do not have latrines as compared to
the national average of 18.6 %.
• 7.7% of the urban households defecate in open areas which is comparatively lower
than the national average of 12.6 %.
• Only 37.8% of Maharashtra’s urban households are connected to a piped sewerage
network.
• Manual Scavenging: Maharashtra with 63,713 cases tops the list with largest
number of households working as manual scavengers followed by the states of
Madhya Pradesh, Uttar Pradesh, Tripura and Karnataka.
The Government of Maharashtra launched the Swachh Maharashtra Mission on 15th
May 2015. The objective of the mission is to make cities Open Defecation Free and to
ensure scientific management of solid waste and sewerage including ensuring
behavioural changes with regard to health and sanitation practices. Under the
190
mission about seven lakh individual household latrine (IHHL) were constructed. In
the State, 92 cities have an ODF status, 230 cities are ODF+ and 62 cities are ODF++.
Maharashtra is one of the few states that has a specific policy on the treatment of
faecal sludge. The Government has sanctioned faecal sludge treatment plants (FSTP)
for 311 urban local bodies, of which, 52 ULBs have initiated operations and the
remaining FSTPs are under construction. A campaign titled ‘Kachra lakh Molacha’
has been rolled out from 2017 onwards to segregate 100 % of the waste into wet and
dry waste, at the source of production across all ULBs.
Until the introduction of Municipal Solid Waste Management Rules (2000), the
responsibility of municipalities with respect to SWM was confined to only collection
and disposal of waste. Prior to 2000, there was no special grants or funds provided to
ULBs for SWM. As a basic and obligatory function of ULB, the expenditure for the
same was incurred from the regular budget of the ULB and formed a bulk of it. After
the implementation of the SWM Rules 2000, there were two new sources of finance,
specifically directed at SWM - these are the 12th finance commission grants and the
MLA funds. Additionally, there were also funds received from urban reform projects
such as JNNURM and AMRUT (Singh, 2011).
The state has positively adopted the SWM Rules 2016 in totality and is working
towards scientific management of solid waste in ULBs. The state has a robust solid
waste management policy in accordance with the SWM Rules 2016 and lays stress on
100% segregation, collection, transportation & processing of wet waste through
composting and bio-methanization; dry waste recycling, reuse and recovery through
establishing material recovery facilities, landfilling of inert and processing of legacy
waste through biomining.
As per the 2019 annual report on SWM for the state of Maharashtra, the solid waste
generated by Municipal Corporations is 19050.11 MT/day with a share of 83.02 %
while generation by “A” class Municipal Councils is 1028.00 MT/Day with share of
4.48 %, “B” class Municipal Councils generate 1276.92 MT/Day with share of 5.53 %,
“C” class Municipal Councils generates 1051.96 MT/Day with share of 4.58 % , Nagar
Panchayats generates 450.766 MT/Day with a share of 1.96 % and Cantonment
Boards generate 96.5 MT/day with a share of 0.42 %. Table A6.7 indicates the total
waste generated from ULBs. The percentage of solid waste being scientifically
treated has increased from 53 % in 2018 to 70% in 2019. Maharashtra generates 82.38
lakh metric tonnes (MT) of waste an annum or 22,570 MT waste a day, of which 44%
is being treated. Maharashtra generated 81.08 lakh MT in 2016-17 and 80.11 lakh MT

191
in 2016 according to the Central Pollution Control Board. The Maharashtra pollution
control board states that the data indicates an increase in waste treatment in
Maharashtra to 44% in 2018 from 27% in 2013. The average waste segregation is 74.46
% and solid waste transportation is 96.45 %111 (Maharashtra Pollution Control Board,
2019).
Vehicles deployed for collection and transportation of waste have two compartments
for dry and wet waste. Segregated waste is further segregated at a processing facility
and then scientifically disposed. Maharashtra is the only state to have registered its
own brand “Harit Maha City Compost” for sale of city compost which is as per the
FCO standards and SWM Rules 2016.
A6.3. Urban Reforms Related to Sanitation and SWM
Maharashtra has undertaken several urban reform projects to improve the
management of solid waste and sanitation services. The Atal Mission for
Rejuvenation and Urban Transformation (AMRUT) scheme is one of the highly
prioritised and flagship programmes of the centre. Nearly 70 % of the urban
population of Maharashtra is covered under the AMRUT scheme. In 2017, the
Government of Maharashtra released Rs. 235 crores112 as a first instalment (about
20% of the eligible central share of Rs. 1176 crores) towards implementation of
projects related to water supply, sewerage and parks. A second instalment of Rs. 500
crores113 was released (about 40% of the eligible central share) again for projects
related to water supply, sewerage and parks. The mission is being implemented
across 44 ULBs in the state. In accordance with the needs and service level gaps,
water supply was given first priority by the state government during the first,
second and third years of the mission. Sewerage facility and reuse of wastewater has
been given second priority.
Ten cities from Maharashtra have been chosen for the smart cities mission114 namely
Mumbai, Thane, Solapur, Pune, Nashik, Aurangabad, Nagpur, Kalyan-Dombivali,
Pimpri-Chinchwad and Amravati. Each of these cities have largely focused on
improving water and sanitation facilities. Under the smart cities mission, about 7% of
111 The Annual Report (2019) on Solid Waste Management Rules, 2016 FOR THE STATE OF
MAHARASHTRA provides no details on fund allocation for SWM, % of funds spent in each phase of
waste management. 112 http://amrut.gov.in/amrut/upload/uploadfiles/files/MaharashtraCorrigendum1718.pdf 113 http://amrut.gov.in/amrut/upload/uploadfiles/files/Maharashtra_Sanction_Feb2019.pdf 114 Under the Smart Cities Mission, few of the core elements of the project is to ensure adequate water
supply, electricity and sanitation inclusive of solid waste management.

192
the total cost has been spent on water supply, sanitation and SWM related projects.
The remaining 93% is focused on area-based development of the region in terms of
effective transportation, housing, roads and road widening and development of
riverfront. A total sum of 100 crores is distributed amongst the states every year
which is further distributed amongst these districts for the mission. Another scheme
called the Maharashtra Sujal Nirmal Abhiyan (MSNA) is a reform led programme.
Its places thrust on a series of reform measures spread over 3 phases and the
objective of it is to attain 24x7 water supply alongside a sustainable institutional
arrangement that will optimize water management. The MSNA sets out a
mechanism by which the ULB’s can be guided to achieve the service level
benchmarks. The components of MSNA are described in the below table:
Table A6. 3: Components of MSNA
Bulk metering Sewerage system Sewerage system including
STP
Hydraulic modeling MIS
GIS mapping Tariff framing
Computer billing Solid waste management
PPP in O & M ODF
Source: Urban Water Sector Reforms - Maharashtra Sujal Nirmal Abhiyan
Link: http://www.iukan.in/wp-
content/uploads/2013/01/MSNA_URBAN_WATER_SECTOR_REFORMS_Feb_2012.pdf
The overarching goal of MSNA is to make water supply systems sustainable. The
key focus of the programme is to ensure that reforms precede any investment in
capital works in water supply and sanitation in urban areas. In addition to the SLB’s,
financial aspects were added by the state such as ensuring separate accounts for
water and sanitation in ULBs, institution of depreciation funds/ sinking funds,
levying of user charges, and monitoring of billing and collection ratios. Fund flows
from JNNURM and UIDSSMT for water and sanitation were also subjected to this
criterion115.
All the ULBs of Maharashtra have implemented the Performance Assessment System
(PAS) in water supply and sanitation. This was a seven-year project (2009 – 2016)
that was implemented in partnership with CEPT University, Ahmedabad and the All
India Institute of Local Self Government, Mumbai. The aim of this project was to
115 JAWAHARLAL NEHRU NATIONAL URBAN RENEWAL MISSION (JNNURM) – GoM,
https://mhada.gov.in/sites/default/files/JNNURM-Information-English-26_07_2019-Corrected.pdf

193
develop a sustainable state-wide Urban Water Supply & Sanitation (UWSS) model
that can be used for improving service delivery making it more efficient, equitable
and sustainable. In relation to sanitation and SWM, the progress made on some of
the key indicators as result of implementing PAS is captured in the below section:
Table A6. 4: Performance Against SLB’s For Water Supply116
Sl.
No
Performance
Indicators
National
level
benchmarks
State level
benchmarks Unit
2011-
12
2012-
13
2013-
14
2014-
15
2015-
16
1 Coverage of Water
Supply connection 100 100 Percent 45 42 42 36 44
2 Per capita supply of
water 135 135 LPCD 103 103 103 103 115.8
3 Extent of metering of
water connections 100 100 Percent 0.01 0.01 0.01 1.93 2.01
4 Extent of nonrevenue
water 20 15 Percent 17.95 13.33 11.60 10.00 12.22
5 Continuity of water
supply 24x7 24x7 -- Once in three days
6
Efficiency in
redressal of customer
complaints
80 80 Percent 100 100 100 100 99.36
7 Quality of water
supply 100 100 Percent 99.09 99.79 99.62 100 100
8 Cost recovery in
water supply services 100 100 Percent 62.18 75.71 65.96 70.97 74.94
9
Efficiency in
collection of water
supply related
charges
90 100 Percent 44.95 42.74 49.30 52.18 52.49
Source: Jawaharlal Nehru National Urban Renewal Mission (JNNURM) – GOM,
Link: https://mhada.gov.in/sites/default/files/JNNURM-Information-English-26_07_2019-
Corrected.pdf
The water requirement of Aurangabad City Corporation (AMC) is 180 million litres
per day. As the existing water supply schemes of AMC were old, only 122 to 124
MLD could be supplied for
water consumption against the water availability of 166 MLD. The existing water
pipelines of about 900 km length are around 30 years old and water leakages during
116
https://cag.gov.in/uploads/download_audit_report/2017/Report_No.5_of_2017_%E2%80%93_Local_B
odies_Government_of_Maharashtra.pdf

194
distribution was 42 MLD. AMC could provide only 103 to 116 LPCD against the
targeted SLB of 135 LPCD to a population of 11.65 lakh. The depleted status of the
existing water supply system of AMC led to significant shortfall in achieving the
SLB.
Table A6. 5: Performance Against SLB’s for Sewage Management
(In percent)
Performance Indicators
National
level
benchmarks
State level
benchmarks
2011-
12
2012-
13
2013-
14 2014-15
2015-
16
Coverage of toilets 100 100 92.77 93.70 93.99 Records not
available
Coverage of sewage
network 100 100 80.98 70.71 68.50 67 67
Collection efficiency of
sewage network 100 100 8 8 8 8 7.9
Adequacy of sewage
treatment capacity 100 100 13 12.5 11.9 11.7 11.16
Quality of sewage
treatment 100 100 Records not available
Extent of reuse and
recycling of treated
water
20 20 29.72 29.72 29.72 29.72 29.72
Extent of cost recovery 100 100 0 0 0 0 0
Efficiency in redressal
of customer complaints 80 100 100 100 100 100 100
Efficiency in collection
of sewage charges 90 90 0 0 0 0 0
Source: Report of the Comptroller and Auditor General of India on Local Bodies for the
year ended 31 March 2016

195
Table A6. 6: Performance Against SLB’s for Solid Waste Management
(In percent)
Performance
Indicators
National
level
benchmarks
State level
benchmarks
2011-
12
2012-
13
2013-
14
2014-
15
2015-
16
Household level
coverage of SWM
services through
door to door
collection of waste
100 100 50.01 53.94 56.14 59.49 66.46
Efficiency in
collection of solid
waste
100 100 93.20 94.19 89.97 93.56 92.77
Extent of segregation
of solid waste 100 100 0 0 0 0 19.95
Extent of solid waste
recovered 80 80 0 0 0 0 0
Extent of scientific
disposal of solid
waste
100 100 0 0 0 0 0
Extent of cost
recovery in SWM
services
100 100 0 0 0 0 0
Efficiency in
redressal of
complaints
80 100 99.70 100 100 100 100
Efficiency in
collection of SWM
charges
90 100 0 0 0 0 0
Source: Report of the Comptroller and Auditor General of India on Local Bodies for the year
ended 31 March 2016
A6.4. Sanitation and SWM: State Level Targets and Progress Made So
Far
Sustainable development goals (SDGs) pertaining to Sanitation and SWM services
are goals 6, 11 and 12. Table A6.7 shows the indicator within these goals, their scores
for Maharashtra, India, and target to be achieved by 2030.
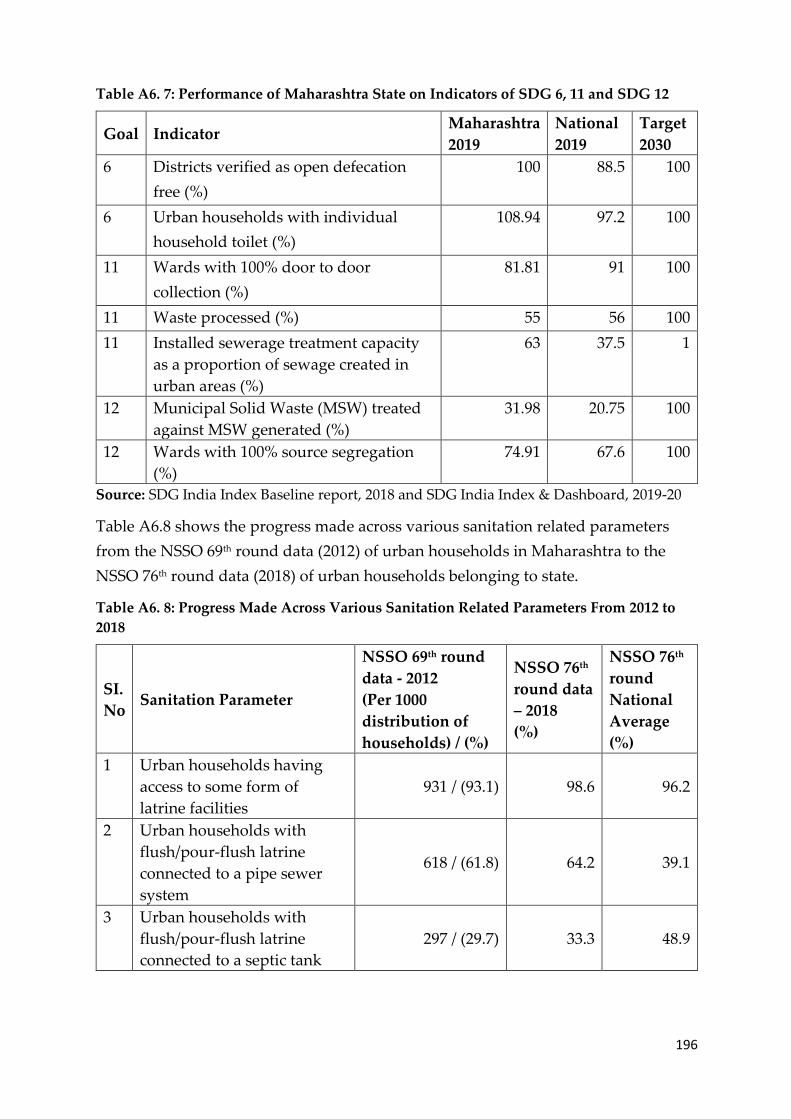
196
Table A6. 7: Performance of Maharashtra State on Indicators of SDG 6, 11 and SDG 12
Goal Indicator Maharashtra
2019
National
2019
Target
2030
6 Districts verified as open defecation
free (%)
100 88.5 100
6 Urban households with individual
household toilet (%)
108.94 97.2 100
11 Wards with 100% door to door
collection (%)
81.81 91 100
11 Waste processed (%) 55 56 100
11 Installed sewerage treatment capacity
as a proportion of sewage created in
urban areas (%)
63 37.5 1
12 Municipal Solid Waste (MSW) treated
against MSW generated (%)
31.98 20.75 100
12 Wards with 100% source segregation
(%)
74.91 67.6 100
Source: SDG India Index Baseline report, 2018 and SDG India Index & Dashboard, 2019-20
Table A6.8 shows the progress made across various sanitation related parameters
from the NSSO 69th round data (2012) of urban households in Maharashtra to the
NSSO 76th round data (2018) of urban households belonging to state.
Table A6. 8: Progress Made Across Various Sanitation Related Parameters From 2012 to
2018
SI.
No Sanitation Parameter
NSSO 69th round
data - 2012
(Per 1000
distribution of
households) / (%)
NSSO 76th
round data
– 2018
(%)
NSSO 76th
round
National
Average
(%)
1 Urban households having
access to some form of
latrine facilities
931 / (93.1) 98.6 96.2
2 Urban households with
flush/pour-flush latrine
connected to a pipe sewer
system
618 / (61.8) 64.2 39.1
3 Urban households with
flush/pour-flush latrine
connected to a septic tank
297 / (29.7) 33.3 48.9

197
SI.
No Sanitation Parameter
NSSO 69th round
data - 2012
(Per 1000
distribution of
households) / (%)
NSSO 76th
round data
– 2018
(%)
NSSO 76th
round
National
Average
(%)
4 Urban households connected
to underground drainage
system
Not Available 71.5 53.5
5 Urban households with no
drainage system 70 / (7) 2.3 8
6 Urban households disposing
waste water without
treatment
Not Available 96 92.4
Source: NSSO 69th and 76th round report
Maharashtra was ranked 2nd and 3rd the Swachh Survekshan (SS) 2020 and 2019
national level surveys and prior to that it was again ranked 2nd in 2018. Hence, it has
been consistently been one of the better performing states with regard to the SS
Survey. In SS 2020, the top 3 cleanest cities in the country (in the less than 1 lakh
population category) were all from Maharashtra (Karad, Sasvad and Lonavala
ULBs). Additionally, in SS 2020, with regard to the provisioning of SWM services,
Maharashtra was ranked 2nd (for ULBs less than 1 lakh) and 3rd (for ULBs greater
than 1 lakh) across all large states.
A6.5. Manual Scavenging and Welfare of Sanitation Workers
The state of Maharashtra reported of not having a single manual scavenger during
the Manual Scavenging (MS) survey 2013. However, the number of manual
scavengers in the state as of 2018-19, as reported from a survey conducted by the
National Safai Karamchari Finance and Development Corporation (NSKFDC) is
6,387117. Even this number is a gross under-estimate, because not only did the survey
lack effective implementation, but in several cases, there have been deliberate
attempts to exclude reporting of manual scavengers. For instance, in Mumbai
Metropolitan Region, all the camps for the survey (2018) were held in South
Mumbai, the most developed area of the city, with one of the highest property rates
in the country. In such areas, none of the households have dry or pit latrines. The
survey was not conducted in the outskirts of the city where sewer lines are not yet
fully built and perhaps manual scavenging of dry latrines is more likely. In addition,
117 https://nskfdc.nic.in/en/content/home/progress-report-srms

198
only those sanitation workers could fill the survey forms who live in the areas where
camps were held. Even those sanitation workers who clean South Mumbai can most
definitely not afford a home there. They stay in the suburbs and the outskirts of the
city, and were hence excluded from the survey (Dubey, 2018). However, startling
facts emerged from the socio-economic caste census of 2015. Maharashtra topped the
list in the number of manual scavengers, with an overwhelming number of 63,713
households engaged in manual scavenging (ENVIS Centre on Hygiene, Sanitation,
Sewage Treatment Systems and Technology, 2018).
By virtue of official non-identification of manual scavengers in the state, there were
no beneficiaries for the One Time Cash Assistance (OTCA) until 2018. In 2018
however, there were 4,605 beneficiaries, and 879 in 2019. Similarly, Maharashtra
sanctioned no trainings and skill development programs until 2019, when finally,
117 of the scavengers were sanctioned trainings (Ministry of Social Justice and
Empowerment, 2019). Maharashtra has reported a total of 19 sewer deaths. The total
number of sewer deaths between 1993 to 2018 was 9 and the number jumped to 10
deaths in one single year of 2018-2019118. However, the state government’s response
indicates that the Rs ten lakh compensation has not been given to even a single
victim’s family (Mishra & Sen, 2019).
There have been some attempts by both national and state level schemes to
rehabilitate manual scavengers, once identified. The 'National Scheme for Liberation
and Rehabilitation of Scavengers' is one such (since 1993). Unfortunately, the safai
karmcharis have very low levels of awareness of such schemes. Therefore, most of
them (82 %) have not been able to opt for these schemes and remain deprived of the
benefits. Thus, the rehabilitation process remains virtually a non-starter. The
Mahatma Phule Backward Class Development Corporation Limited (MPBCDC) also
offers diverse training programmes to manual scavengers such as carpentry,
plumbing, masonry, wiring, bicycle repairing, wheeler mechanic, hand pump
repairing, electrician, refrigerator and air-conditioning mechanic, beauty parlour for
women, tailoring/cutting, welding (gas, electric), computer operator motor mechanic,
spray painting, and so on. Unfortunately, an overwhelming number of the safai
karmcharis have hardly enrolled in such training programmes. Lack of information,
commitment to complete the course and lack of technical feasibility/support in
initiating self-employment activities are some of the reasons stated by the manual
scavengers for their low motivation in enrolling for the training programmes. The
118 https://ncsk.nic.in/sites/default/files/NCSK_Annual-Report18-19.pdf
199
safai karmcharis, who opt for the training programmes, encounter several difficulties
in mobilising the capital requirement to initiate self-employment activities (Beck &
Darokar, 2005).
A6.6. Urbanisation Challenges (Specific to Sanitation and SWM)
With an increasing urban population in Maharashtra, Sanitation and SWM stand to
be one of the growing concerns owing to the increase in slums. Management of
sewage and septic tanks is a major challenge in most parts of the state and even in
cities which are said to have good infrastructure. Majority of the problems take place
due to structural collapses of septic tanks and explosion of septic tanks which have
not been cleaned for a while due to accumulation of methane. Shared sanitation
facilities are falling short in serving slum dwellers, thus leading to open defecation in
water bodies. However, there is a growing demand for sanitation systems that are
more hygienic, efficient, cost effective and those that cater to the privacy of the users.
Nearly 50 lakh residents of the city-Mumbai’s notified slums119 are served by 750-odd
community toilet blocks constructed under the World Bank-initiated Slum Sanitation
Programme (SSP). They collectively have 26,379 toilet seats which approximately
means one toilet seat to be shared by 190 users, as against the Municipal Corporation
of Greater Mumbai (MCGM) accepted WHO norms of one toilet seat per 50 users120.
An MCGM survey of SSP community toilets conducted in 2016 revealed that while
58 % had no electricity, around 78 % had no water facilities.
Although, Maharashtra is doing better than most states in the disposal and
segregation of waste, the main constraint for the effective implementation of MSW
rules and setting up of waste processing facilities for local bodies is the non-
availability of suitable land along with lack of public awareness/participation, lack of
management skills of the local bodies and resistance from local communities. A
performance audit conducted on ‘Management of Municipal Solid Waste by Select
Municipal Corporations’ by CAG in 2017 revealed that the selected seven Municipal
Corporations (MCs) had neither prepared comprehensive city plans for management
of Municipal Solid Waste (MSW) in accordance with the MSW Manual nor had they
met the timelines for improvement of existing landfills and for setting up of new
waste processing and disposal facilities in their jurisdiction. Budget provisions were
119 slums which existed before the 1995/2000 cut-off date of the Slum Rehabilitation Scheme and
therefore eligible for free housing under the scheme 120https://www.orfonline.org/expert-speak/42671-sanitation-problems-in-mumbai-at-catastrophic-
proportions/

200
not fully utilized in all the seven MCs, though there were shortages of vehicles for
transportation of MSW. Except MCGM and Pune MC, where partial segregation was
available, segregation of waste at household level was not in place. Different
coloured community bins were not provided by any of the seven MCs for collection
of segregated waste. Open body vehicles were used for transportation of MSW in all
the MCs except Pune MC. MSW processing facility was not available in Amravati,
Kalyan-Dombivali and Kolhapur MCs. Sanitary Landfills were developed only by
Nagpur and Pune MCs. (Comptroller and Auditor General of India , 2017).
According to the 2019 SWM Annual Report (SWM Annual report, 2019), the major
issues and gaps in the effective implementation of SWM in Maharashtra were – 1)
Lack of training to improve efficiency and safety standards, 2) Lack of quantification
of waste data, 3) Lack of personnel operating the processing facility, 4) Current waste
collection and transportation system is not optimized, 5) Non availability of suitable
land, 6) Local community resistance, 7) Inadequate finances of ULBs for SWM, 8)
Improper selection of waste processing technology with respect to quantity of waste
generation including waste to energy plants, 9) Lack of public
awareness/participation and 10) Unsegregated Waste at Source.
The absence of adequate sanitation becomes more critical in the context of absence of
reliable, safe drinking water in the state. Due to the lack of toilets, there is also less
visible deficits at the household level. For example, in case of pit latrines, minimum
distances to sources of drinking water needs to be maintained to avoid the possibility
of water contamination. However, that is not done effectively and excreta is let out in
the environment and urban poor households suffer the most as it is not possible to
maintain minimum distance in high density settlements.
Although, Maharashtra is doing better than most states in the disposal and
segregation of waste, the main constraint for the effective implementation of MSW
rules and setting up of waste processing facilities for local bodies is the non-
availability of suitable land along with lack of public awareness/participation, lack of
management skills of the local bodies and local community resistance. Solid waste
management problems are more in the urban areas as compared to rural areas of the
state. They cover many issues like collection of mixed waste, lack of use of sanitary
landfills, dumping of waste in open grounds, socio-economic problems etc. This is
also causing a problem of environmental degradation and resource depletion. The
state generates a large amount of municipal, industrial, hazardous waste which has a
direct impact on the environment and ecology of the state.
201
Annexure 7: The Duties of The Ward Member Within His /
Her Jurisdiction Area
• Ensure proper sanitation, water supply, and streetlights
• Ensure door-to-door garbage collection from all residential and commercial
establishments
• Ensure in-situ composting for wet waste and processing of dry waste at ward
level
• Take up plantation in accordance with the District Action plan and ensure their
survival to at least 85%
• Reduce non-revenue water, transmission loss of water, and usage of power bores,
wherever not required
• Safeguard and protect water sources, lakes or any other water bodies
• Undergo training on developmental activities in the administration of the
municipality
• All functions specifically conferred by this Act or may be assigned by Government
from time to time.

202
Annexure 8: Telangana
A8.1. Urbanisation in Telangana
Telangana is the 29th and youngest state of India, formed on 2nd June 2014 by the
enactment of the Andhra Pradesh Reorganisation Act 2014 with Hyderabad as its
capital. Ten districts from the erstwhile Andhra Pradesh were carved out to become
the new state of Telangana. On 11th October 2016, 21 new districts were created
which leads to 31 districts in Telangana. In February 2019, with an intention to bring
administration closer to the public and to ensure that the benefits of development
and welfare schemes reach the poorest of the poor in the state more effectively and
efficiently, two more districts were created, taking the total number of districts to 33
(Socio Economic Outlook , 2020).
As per the 2011 census, the total population of the state was about 3.50 crores. The
overall population growth rate from 2001 to 2011 is about 13.58 % as against the
national growth of 17.70 %. The percentage of urban population to total population
in Telangana was 31.8 % in 2001 and it jumped to 38.9 % in 2011; which is higher
than all India growth rate of urban population during the same time period.
According to the Socio-Economic Survey report, Telangana is one of the fastest
urbanising states in the country, along with rapid economic transformation. Urban
centres have become epicentres for industrial and service-oriented business activity,
robust transportation, civic facilities and availability of skilled workforce. (Socio
Economic Outlook , 2020). In 2016-17, the percentage of urban population to total
population touched 42 % and is likely to cross the 50 % mark in the next five years
(Statistical Year book , 2017). As per the Population Projections for India and States
2011 – 2036 report, Ministry of Health and Family Welfare, the urban population of
Telangana state is expected to touch 2.73 crores by 2036 (nearly doubling from the
1.36 crores as per the 2011 Census).
The urban population of the state is spread across 73 Urban Local Bodies – consisting
of 6 Municipal Corporations, 42 Municipalities, 25 Nagar Panchayats and 1
Secunderabad Cantonment apart from 13 urban agglomerations and 79 census
towns. The urban population is largely contributed by five districts namely
Hyderabad (100 % urban), Ranga Reddy (70.32 % urban), Warangal (28.34 % urban),
Adilabad (27.68 % urban) and Karimnagar (26.08 % urban). Hyderabad is the only
100 % urbanized district in the state with the Greater Hyderabad Municipal
Corporation (GHMC) alone making up for close to 50 % of the state’s total urban
population. The Greater Warangal Municipal Corporation (GWMC) has been
203
another fast-urbanising geographical area in the state. Telangana is the 7th most
urbanized state among all the larger states of India121.
Telangana’s GSDP was Rs. 505849 crores in 2014-15 (at current prices) and it
increased to Rs. 969604 crores in 2019-20, thus exhibiting an overall growth rate of
12.6 %. While India’s average year-on-year GDP growth has been 6.9 % between 2013
to 2017, it was 7.4 % for Telangana during the same time period. While India’s GDP
grew by 6.7 % in 2018, the GSDP growth rate of Telangana in 2018 was 10.4 % and
the fourth highest in the country122. The urban areas contribute close to 53.76 % of the
economic growth in the state. The two most urbanized districts in the state
(Hyderabad and Ranga Reddy) collectively contributed close to 35% of the entire
state’s GSDP.
According to the 2001 census, India has six megacities (with a population of 5 million
and above) and Hyderabad – the capital of Telangana state is one of them. The
creation of several new districts in the state of Telangana has boosted urbanisation
with 21 new towns being made as district headquarters for the newly formed
districts. The Outer Ring Road (ORR) project for connecting ULBs which are located
on national & state highways in and around Hyderabad and having the status of
new district headquarters will see considerable growth within a short span of time.
The Govt of India has also identified 12 ULBs of the state as Smart cities and AMRUT
cities (Prasanna & Jayachandra, 2018).
The government of Telangana (GoT) has revolutionized industrial development by
reforming procedural structures for obtaining clearance from various departments
and this has further sped up the process of urbanisation of the state. Additionally,
by providing uninterrupted power supply (including in rural areas) as well as plans
to extend the metro rail connectivity from the capital city of Hyderabad to more than
25 nearby ULBs, is further going to accelerate the process of urbanisation. These new
infrastructure projects has made Hyderabad a frontrunner to serve as a gateway to
the South when compared to other competing cities of Southern India. Several major
software giants have their Indian headquarters based in Hyderabad. Hyderabad
contributed nearly 10 % of India's and 98 % of the erstwhile Andhra Pradesh's
exports in IT (Information technology) and ITES (Information Technology Enabled
Services) sectors. HITEC (Hyderabad Information Technology and Engineering
Consultancy) City is Hyderabad’s premier software hub. As of 2020, Hyderabad has
121 Excluding the smaller states of Delhi and Goa. 122 States of Growth 2.0, A CRISIL Research Report, 2019

204
about six lakh employees in the IT/ITES sector, working in more than 1500
companies. Since the formation of the state, nearly three thousand revenue villages
have been identified for setting up of industrial layouts. This rate of industrialisation
would not only generate local employment but will also lead to urbanisation of the
surrounding areas. (Prasanna & Jayachandra, 2018)
A8.2. Provisioning of Sanitation and SWM Services
Unlike other states that have amended their historical municipal Acts, Telangana
having enacted a new one in 2019 has several provisions that legally entrust several
responsibilities and duties on various functionaries with regard to the basic services
of sanitation and solid waste management. Several sections detail the specific roles123.
It is expected of the chairperson of the municipality to maintain sanitation and water
supply, ensure door-to-door garbage collection from all residential and commercial
establishments, and dispose waste in a scientific manner. The responsibilities of
municipalities with regard to sanitation and SWM are to provide and maintain
drains, map the overall drainage system, clean and de-silt drains, and many more. It
is mandatory for municipalities to prepare a city sanitation plan, which includes
ward-wise and town-wise plan for collection, segregation, transfer, and processing of
waste, so that 100% municipal solid waste is collected on a daily basis. Every
individual household or user, whether domestic or non-domestic must segregate
solid waste at source, and hand over segregated waste to the municipality. If they
fail to comply, then the municipality is empowered to collect segregation and
collection fines from such defaulters. The municipality has to make arrangements as
per the waste disposal rules and guidelines of the Government for (i) collection of
segregated solid waste from all residential and non-residential premises separately,
(ii) regular sweeping and cleaning of the streets, and removal of waste there from,
(iii) removal of filth, and carcasses of animals from all premises, (iv) collection, safe-
keep, transportation and disposal of solid waste, and (v) establishment of dry
resource collection centres. Unlike most other states, the Telangana Act rightfully
includes establishment of dry waste collection centres as part of the solid waste
management process.
Additionally, the municipality either directly or indirectly has to provide sufficient
public convenience places and facilities like restrooms, urinals, washrooms, child-
feeding centres and ensure their regular maintenance and upkeep.
123 Sections 122-134 (sanitation), Sections 119-121 (SWM), Telangana Municipalities Act, 2019

205
As per the 2011 census report:
• 91.62 % of urban HHs in Telangana have access to toilets as compared to the
national average of 81.4 %.
• Open Defecation in Telangana ULBs is 8.38 % which is lower than the national
average of 12.6 %. There are 2,27,094 urban households practicing open defecation
out of 27,11,202 total urban households in state.
• 57.07 % of Telangana’s urban population is connected to a piped sewerage network
(Under Ground Drainage-UGD) with 98.5 % falling within the GHMC. Apart from
GHMC, only 3 other cities have existing Underground Drainage facilities and in 4
towns it’s currently under implementation.
ULBs in Telangana generate about 6770 metric tons (MT) of solid waste per day of
which 6336 MT per day is collected and about 5120 MT/day is processed124. The per
capita of waste generation in the ULBs ranges from 0.3-0.4 kg/per day. The quantity
of waste produced is growing 5 % annually and the collection efficiency is 80 %.
However, apart from GHMC, a majority of the ULBs lack proper treatment and
scientific disposal of waste (State Sanitation Strategy, 2017).
As per a NIUA report125, 91 % of the households and establishments in Telangana are
covered by door-to-door solid waste collection, while the segregation of garbage
varies from 5.9 % to 100 %, with only two ULBs in the state achieving 100 %. The
extent of recycling or recovery of waste varies between 4.1 % to 77.6 % which is
below the Service Level Benchmarking of 80 %.
With a goal to ensure that all cities and towns become totally clean, sanitized,
liveable, and focus on hygienic and affordable sanitation for the urban poor and
women, GoT through the state level sanitation committee (SLSC) developed the
Telangana State Sanitation Strategy (SSS) in 2017. It is committed to implement
national and state level programmes for urban areas. It covers the overall sanitation
sector including the sub-sectors of solid waste, waste water, storm water, drainage
and water supply (Telangana State Sanitation Strategy, 2017).
In line with the MSW Rules 2016, a Solid Waste Management Policy and Strategy
was implemented in 2018 by the state of Telangana. The vision is to achieve 100 %
treatment and reuse of municipal waste. The policy provides operational guidelines
for safe, responsible, and ecologically sound management of MSW and defines
124 State of Environment Report of Telangana, 2015. 125 NIUA (2018) “Urban Wastewater Management in Telangana”.
206
standardised techniques of managing waste, covering all aspects of the value chain,
from collection to treatment and reuse. It stresses on ‘circular economy’ to manage
waste better (Solid Waste Management Policy and Strategy, 2018).
All matters related to urban water supply and sanitation are within the functional
domain of the state government. The Municipal Administration and Urban
Development (MA&UD) department has overall administrative control of – 1)
Commissioner & Director of Municipal Administration (CDMA), 2) Public Health &
Municipal Engineering Department (PH&MED), 3) Director of Town & Country
Planning (DTCP) and a parastatal body – The Telangana Urban Finance and
Infrastructure Development Corporation (TUFIDC). The CDMA looks after the
overall municipal administration, revenue, audit and accounts, poverty alleviation,
other municipal services like solid waste management, capacity building and
coordination with the other wings of MA&UD. The PH&MED takes care of water
supply and sewerage schemes and other engineering activities like planning,
investigation, project formulation, design, procurement, implementation, quality
control, and exercises technical control over all the engineering works in all the
ULBs. The DTCP handles the tasks of planning and development in urban and rural
areas by preparing master plans, and regulation of development through
development control and enforcement activities (NIUA, 2018))126. TUFIDC was
initiated by the GoT for implementing several infrastructure and housing schemes
for the urban poor.
A8.3. Urban Reforms Related to Sanitation and SWM
In order to meet the growing demands of the population due to rapid urbanization,
the CDMA has been designing various programs that are being implemented in the
state of Telangana for improving water and sanitation facilities along with AMRUT
scheme, Swachh Bharat Mission (SBM), Smart Cities Mission (SCM), Pattana
Pragathi apart from external aided programs supported by GIZ and World Bank.
Hyderabad, Karimnagar and Warangal ULBs are covered under the SCM in
Telangana state. Under the SCM, 140 projects have been initiated worth Rs. 4135
crores in Warangal and Karimnagar ULBs. (Socio Economic Outlook , 2020). Under
the SCM proposal for Karimnagar, the budget allocated for water supply is Rs. 109
crores, Rs. 75 crores for sewerage/canals and Rs. 18 crores for SWM and Sanitation.
Both Karimnagar and Warangal ULBs have been declared as ODF. But for Warangal
126 NIUA (2018) “Urban Wastewater Management in Telangana”.
207
to graduate towards ODF+, projects related to MSW collection, recycling and lake
regeneration worth Rs. 134.90 crores has been planned under SCM. Based on
Karimnagar acquiring the ODF status, PH&MED has proposed providing a septage
management system for Rs. 75 crores.
Eleven cities from Telangana have been identified for development under the
Central Government’s AMRUT scheme127. Under this scheme, GoT has proposed to
invest Rs. 5413 crores on water supply and Rs. 5435 crores on underground sewerage
connections to all households in the 11 mission cities128. 15 Water Supply projects, 2
Sewerage Projects and 8 parks have so far been completed in Telangana (Socio
Economic outlook report, 2020). As per the State Annual Action Plan (SAAP) 2017-20
for the AMRUT cities (Table A8.1), for sewerage and septage management - Rs. 18.34
crores were allocated in 2015-16, Rs. 40 crores in 2016-17 and Rs. 126 crores in 2017-
20.
Apart from the above projects, the Telangana Urban Finance Infrastructure
Development Corporation (TUFIDC) has undertaken a scheme (Urban Infrastructure
& Governance (UI&G)) to provide urban infrastructure in the sectors of water
supply, underground drainage, storm water drains, solid waste management and
transportation in mission cities in a planned manner. This scheme is a component of
JNNURM programme and under this scheme a total of 23 projects were taken up at a
cost of Rs. 2661.86 crores of which 16 projects have been already completed (Socio
Economic Outlook Report Telangana, 2020).
The Urban Infrastructure Development Scheme for Small and Medium Towns
(UIDSSMT) is a component of JNNURM programme launched with an aim to
provide urban infrastructure in the sector of water supply, underground drainage
(UGD), storm water drains, solid waste management and transportation in non-
mission ULBs in a planned manner. Under this program the Government of India
sanctioned 32 projects with a project cost of Rs. 980.16 crores. Out of 32 projects, 21
are water supply projects costing Rs. 576.45 Crores, 4 are Sewerage / UGD projects
costing Rs. 225.24 crores, 5 are storm water drain projects costing Rs. 107.31 crores
127 The towns selected under AMRUT scheme include Khammam, Warangal, Nizamabad,
Mahabubnagar, Karimnagar, Ramagundem, Nalgonda, Suryapet, Miryalguda and Adilabad. The
AMRUT scheme adopts a project approach to ensure basic infrastructure services relating to water
supply, sewerage, septage management, storm water drains, transport and development of green
spaces and parks with special provision for meeting the needs of children. 128 https://economictimes.indiatimes.com/news/economy/infrastructure/amrut-telangana-lines-up-rs-
405-crore-plan-for-water-supply-in-11-cities/articleshow/49518557.cms?from=mdr

208
and 2 are road projects costing Rs.71.16 crores. Out of these 32 projects, 27 projects
have been already completed under JNNURM with a cost of Rs. 730.28 crores (Socio
Economic Outlook Report Telangana, 2020).
The PH&MED has taken up 11 Underground Drainage (UGD) schemes with a total
estimated cost of Rs. 1235.68 crores. Out of the 11, 3 UGD schemes have already been
completed with a total cost of Rs. 447.45 crores. The below table summarizes the
sewer network and sewage treatment plant completed in the last decade by
PH&MED (Municipal Administration and Urban Development Department, 2020).
Table A8. 1: Sewerage schemes
Services Work Completed during
the period 2009-14
Work Completed during
the period 2014-19
Sewer Network 580 Kms 719 Kms
Sewage Treatment plants 13 MLD (1 No) 107 MLD (6 Nos)
House Sewer
Connections 15000 Nos 128000 Nos
Source: Municipal Administration and Urban development Department Govt. of Telangana
Annual Report 2019-20
The Telangana Urban Finance and Infrastructure Development Corporation
(TUFIDC) Limited has taken up four sewerage projects and out of these two projects
have been completed.
Table A8. 2: Sewerage Projects and its Expenditure
SAAP year Sewerage (2 ULBs)
No. of works Rs. in crores
2015-16 1 18.34
2016-17 1 40
2017-20 2 126
Total 4 184.34
Source: Municipal Administration and Urban development Department Govt. of Telangana
Annual Report 2019-20
A8.4. Sanitation and SWM: State Level Targets and Progress Made So
Far
According to the Sustainable Development Goals Index (SDGI) released by NITI
Aayog, Telangana improved its performance from the previous year in 8 out of the
17 SDGs. The State is now placed above the national composite average and moved

209
from the Performer category to the Front Runner category. Under SDG 11, the sub-
indicator in which Telangana is farthest from the target for 2030 is with regard to
sewage treatment capacity (41%). However, it is still better than the national level
achievement (37.5%). State performance in sanitation and waste management related
indicators are mentioned in below table.
Table A8. 3: Performance of Telangana State on Indicators of SDG 6, 11 and 12
Goal Indicator Telangana
2019
National
2019
Target
2030
6 Districts verified to be Open Defecation
Free (%)
67 91 100
6 Urban households with individual
household toilet (%)
76 97.2 100
11 Wards with 100% door to door waste
collection (%)
94 91 100
11 Waste processed (%) 78 56 100
11 Installed sewage treatment capacity as
a proportion of sewage generated in
urban areas
41 37.5 100
12 Municipal Solid Waste (MSW) treated
against MSW generated (%)
48 20.7 100
12 Wards with 100 % source segregation
(%)
48 67.6 100
Source: SDG India Index Baseline report, 2018 and SDG India Index & Dashboard, 2019-20
Table A8.4 shows various sanitation related parameters from the NSSO 76th round
data (2018) of urban households of the state129.
Table A8. 4: Sanitation Related Parameters, 2018
SI.
No Sanitation Parameter
NSSO 76th
round data –
2018 (%)
NSSO 76th round
National Average
(%)
1 Urban households having access to
some form of latrine facilities
98.4 96.2
2 Urban households with flush/pour-
flush latrine connected to a pipe
sewer system
53.0
39.1
129 Telangana state was formed in 2014, hence no data available for this state from NSSO 69 th round
(2012).
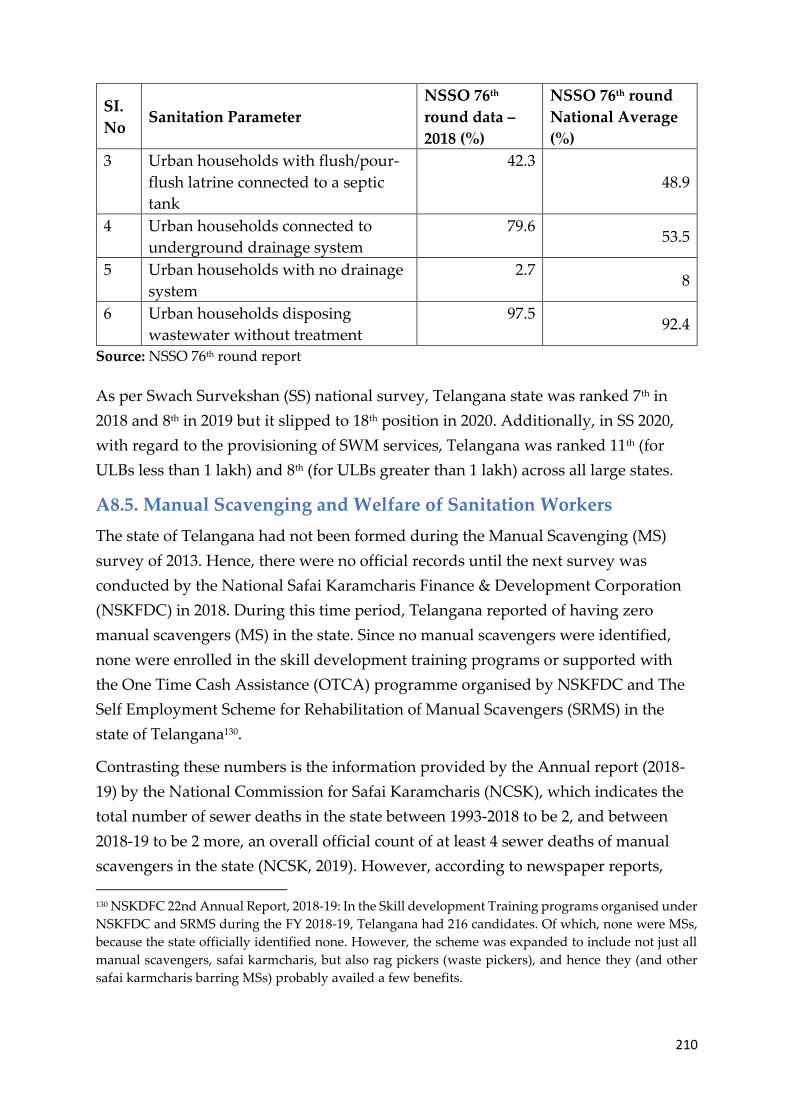
210
SI.
No Sanitation Parameter
NSSO 76th
round data –
2018 (%)
NSSO 76th round
National Average
(%)
3 Urban households with flush/pour-
flush latrine connected to a septic
tank
42.3
48.9
4 Urban households connected to
underground drainage system
79.6 53.5
5 Urban households with no drainage
system
2.7 8
6 Urban households disposing
wastewater without treatment
97.5 92.4
Source: NSSO 76th round report
As per Swach Survekshan (SS) national survey, Telangana state was ranked 7th in
2018 and 8th in 2019 but it slipped to 18th position in 2020. Additionally, in SS 2020,
with regard to the provisioning of SWM services, Telangana was ranked 11th (for
ULBs less than 1 lakh) and 8th (for ULBs greater than 1 lakh) across all large states.
A8.5. Manual Scavenging and Welfare of Sanitation Workers
The state of Telangana had not been formed during the Manual Scavenging (MS)
survey of 2013. Hence, there were no official records until the next survey was
conducted by the National Safai Karamcharis Finance & Development Corporation
(NSKFDC) in 2018. During this time period, Telangana reported of having zero
manual scavengers (MS) in the state. Since no manual scavengers were identified,
none were enrolled in the skill development training programs or supported with
the One Time Cash Assistance (OTCA) programme organised by NSKFDC and The
Self Employment Scheme for Rehabilitation of Manual Scavengers (SRMS) in the
state of Telangana130.
Contrasting these numbers is the information provided by the Annual report (2018-
19) by the National Commission for Safai Karamcharis (NCSK), which indicates the
total number of sewer deaths in the state between 1993-2018 to be 2, and between
2018-19 to be 2 more, an overall official count of at least 4 sewer deaths of manual
scavengers in the state (NCSK, 2019). However, according to newspaper reports,
130 NSKDFC 22nd Annual Report, 2018-19: In the Skill development Training programs organised under
NSKFDC and SRMS during the FY 2018-19, Telangana had 216 candidates. Of which, none were MSs,
because the state officially identified none. However, the scheme was expanded to include not just all
manual scavengers, safai karmcharis, but also rag pickers (waste pickers), and hence they (and other
safai karmcharis barring MSs) probably availed a few benefits.
211
Hyderabad alone witnessed the death of 4 manual scavengers between 2016 and 17
(Financial Express, 2017). Post these incidents, as a step forward towards ending
manual scavenging, the Telangana government commissioned a fleet of 70 mini
sewer-jetting machines to suck sludge out of sewers and clear pipes with high-
pressure jets of water, in order to clean clogged sewage lines in Hyderabad. The
efficacy of these machines is yet to be determined. While the Hyderabad
Metropolitan Water Supply and Sewage Board claims (HMWSSB) that these
machines can access narrow lanes and smaller colonies, various other reports say
that they are too long to enter narrow by-lanes, particularly in dense urban areas
where clogging happen frequently, and hence one would need to resort to manual
scavenging (NPR, 2019).
NSKDFC had allocated Rs. 158 crores for disbursement to different states in 2018-19,
of which Rs. 3.2 crores was designated for Telangana. However, since no manual
scavengers were identified in the state, the benefits were not passed on for their
rehabilitation or as benefits (NSKFDC, 2019). The NCSK have some noteworthy
progress with respect to the welfare of sanitation workers. The contractor of safai
karmcharis are now required to issue identity cards to all workers. Provision is made
to engage a supervisor in any work where greater than 12 safai karmcharis are
involved (NCSK, 2019).
A8.6. Urbanisation Challenges (Specific to Sanitation and SWM)
In many urban households of Telangana ULBs, the septic tanks are usually
undersized, have faulty designs and are poorly constructed. They are often installed
underneath homes, driveways or sidewalks due to small lot sizes, thus making
access for inspecting or desludging extremely difficult. In many instances, what is
referred to as “septic tanks” are not septic tanks at all, but are instead just seepage
pits or cesspools. These unlined, earthen receptacles not only do a very poor job at
treating sewage, but they frequently serve as direct conduits to aquifers, resulting in
faecal contamination that can impact precious drinking water supplies. Wastewater
disposal and treatment is another major problem in the ULBs of Telangana. Most
towns and cities in the state do not have underground sewerage systems and sewage
treatment services for disposal of the waste water. Only 57.07 % of urban households
in the state are connected to underground drainage system a majority of which
belong to GHMC and in most other ULBs in the state the wastewater from toilets is
being disposed to septic tanks and soak pits, while the grey water from kitchen and
bathrooms is directly discharged into the sullage drains without any treatment and
212
they in turn flow into water bodies in and around the ULBs. The total waste water
generated is 1784 MLD but only about 681 MLD of it is being treated. Thus, there is a
large gap between generation and treatment of wastewater in the state. Even the
existing treatment capacity is also not effectively utilized due to operation and
maintenance problems. Operation and Maintenance of existing plants and sewage
pumping stations is not satisfactory. Discharge of untreated sewage is the single
most important cause for pollution of surface and ground water since there is a large
gap between generation and treatment of domestic wastewater (State Sanitation
Strategy, 2017).
A CAG Audit report131 found that there was no mechanism to assess the quantity of
waste generated / collected in the GHMC. Existing intermediary storage facilities
(transfer stations) were not equipped with weighbridges both at entry and exit
points. According to the SSS, major issues as identified in the solid waste
management sector are as follows:
• Lack of resources, systems and capacity for development and disposal of solid
waste at ULB level.
• Lack of support in financial, technical, and project development at state level to
ULBs in identifying right technologies, processes, structuring projects and
implementation.
• Lack of awareness about the importance of effective solid waste management
practices.
• Lack of capacities within the urban local bodies on processing technologies and
scientific landfills.
• Lack of substantial capital and O&M expenses without matching revenues.
• Land acquisition is a major issue in SWM projects and a major cause of delay.
• Lack of technical expertise and institutional arrangements.
• Poor structuring of Waste to Energy projects on PPP mode
Overall, the challenge for the state of Telangana is to ensure the effective
performance of the sewerage system by providing adequate water supply to all the
households in the sewerage service area. Even where there is water tap connection,
although the per capita supply is around 108 LPCD (for e.g. in Karimnagar ULB),
unreliable and intermittent supply is a big constraint leading to low performance of
the sewerage system. Further low per capita water supply like in case of
Mahbubnagar (60 LPCD) is simply not feasible for an UGD system. Despite adequate
131 Report of the Comptroller and Auditor General of India on Local Bodies. Report No. 3 of 2018

213
land being assigned to ULBs for scientific disposal of urban waste, the ULBs are not
following scientific, biological and chemical processes to treat solid waste. Lack of
financial and organisation capacity is leading to open dumping sites in the highly
dense areas of ULBs. In these conditions it is becoming very difficult to manage
suitable sites for landfills. In addition, one of the major challenges of ULBs is the cost
recovery from solid waste management (National Institute of Urban Affairs , 2018).
Limited capacities of ULBs and absence of regulations on maintenance and cleaning
of septic tanks and pits are a major challenge. In many instances, the septage is
dumped in drains and open areas posing considerable health and environmental
risks. Sanitary workers also work in hazardous conditions having to manually clean
on-site pits and tanks without adequate protective gear and equipment. There is a
general lack of awareness on septic tanks and how these should be planned,
designed, installed, operated and maintained, especially among the system owners
and ULBs which results in pollution of the ground and surface water bodies thus
impacting public health. Municipal wastewater collection, treatment, and disposal
are still not a priority for the municipality/ state government as compared to water
supply. In the absence of sewer lines, untreated wastewater flows into storm water
drains and poses as a health hazard to the citizens inhabiting the areas near the
drain. In case of poor drainage systems, sullage is directly dumped into canals and
water bodies in urban watershed without any treatment. The poor slum residents are
the most vulnerable and disproportionately affected as they often reside in informal
settlements located in low-lying areas. In poorly drained areas with inadequate
sanitation, urban runoff increases the risks to health, as flooded septic tanks and
leach pits, and blocked drains become breeding grounds for vectors. Over the last
few years, while the service delivery situation with respect to water supply, solid
waste management and drainage has improved in ULBs such as the GHMC, gaps
continue to exist and requiring considerable investment to address the same.

214
Annexure 9: Criteria for Constitution of Nagar Panchayat and
Municipality
(a) Criteria for Constitution of Nagar Panchayat
An area may be notified as Transitional Area (Nagar Panchayat) under Clause
(42-a) of section-2 of the Andhra Pradesh Municipalities Act, 1965 if the following
criteria is satisfied:
(a) Population (as per last
census)
: 20,000 to 40,000
(b) Density of population
per Sq. Km
: 400
(c) Revenue : Rs. 40.00 Lakhs provided that local area
with a lesser income may also be
considered if it has acquired urban
characteristics
(d) Percentage of
employment in non-
agriculture activities.
: 25% provided that a local area with lesser
percentage of employment in Non-
agricultural activities may also be
considered if it is not more than 20 Kms.
away from a Municipality (District Head
quarter) or Municipal Corporation
(e) Economic importance : Availability of market facilities and
potentialities to attract industries
(f) Other factors : Local area acquiring Urban Characteristics
Provided that whenever a main urbanized Gram Panchayat is proposed to be
constituted as a Nagar Panchayat with merger of surrounding other village(s) of
Gram Panchayat(s), such village(s) shall fulfill the following condition: -
The proposed village(s) going to be merged shall not be more than 3 Kms. from the
periphery of outer habitation of the main Gram Panchayat to the outer Periphery of
the habitation of village(s).
(b) Criteria for Constitution of Municipality
An area may be notified as Smaller Urban Area (Municipality) under Clause (42-
a) of section-2 of the Andhra Pradesh Municipalities Act, 1965 if the following
criteria is satisfied:
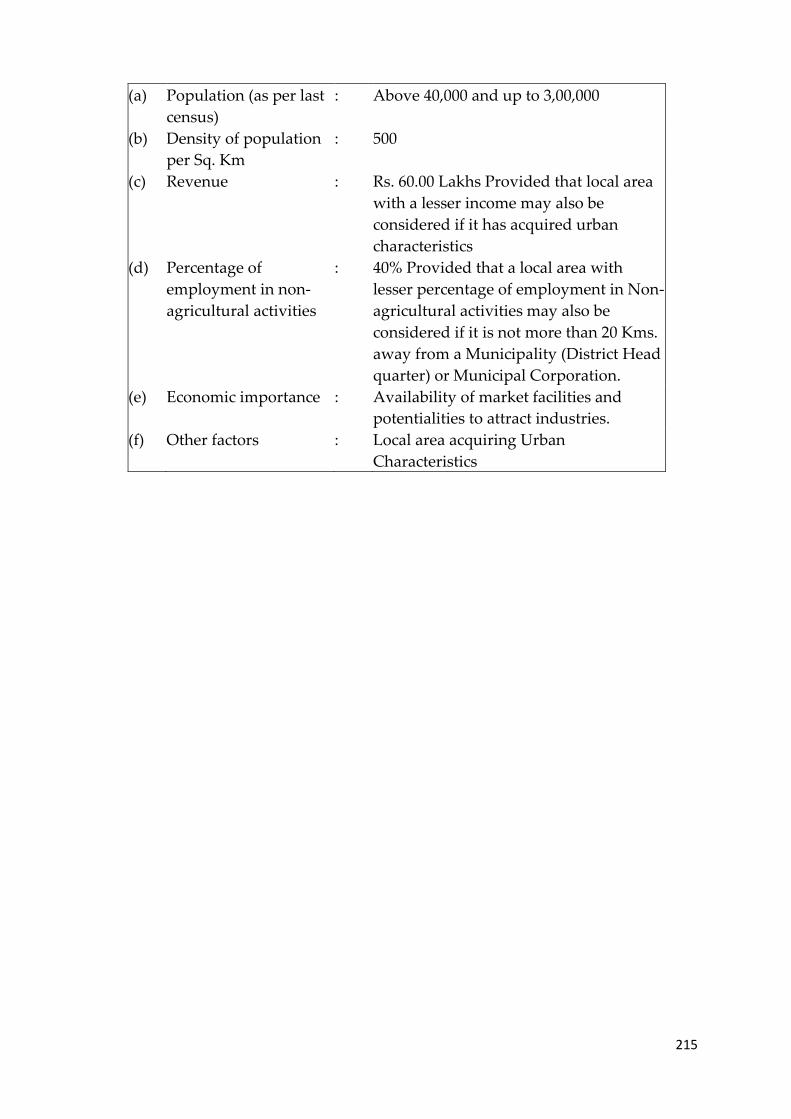
215
(a) Population (as per last
census)
: Above 40,000 and up to 3,00,000
(b) Density of population
per Sq. Km
: 500
(c) Revenue : Rs. 60.00 Lakhs Provided that local area
with a lesser income may also be
considered if it has acquired urban
characteristics
(d) Percentage of
employment in non-
agricultural activities
: 40% Provided that a local area with
lesser percentage of employment in Non-
agricultural activities may also be
considered if it is not more than 20 Kms.
away from a Municipality (District Head
quarter) or Municipal Corporation.
(e) Economic importance : Availability of market facilities and
potentialities to attract industries.
(f) Other factors : Local area acquiring Urban
Characteristics

216
Annexure 10: Section 56: Powers and Functions of the
Commissioner
(1) The Commissioner shall, save as otherwise provided in this Act,
(a) carry into effect all the resolutions of the council;
(b) furnish to the council such periodical reports regarding the progress made in
carrying out the resolutions of the council;
(c) subject to all other restrictions, limitations and conditions hereinafter imposed,
exercise the executive power for the purpose of carrying out the provisions of this
Act, and be directly responsible for the due fulfillment of the purposes of this Act;
(cc) exercise disciplinary control over the employees of the Municipal Council, who
shall be subordinate to the Commissioner;
(d) exercise all powers in relation to the collection of taxes and fees, the licenses and
the removal of encroachments;
(e) be in charge of the office of the municipality and have custody of the municipal
records;
(f) inspect the places of entertainment for the purposes of verification of the sale of
tickets; and
(g) exercise all the powers and perform all the functions specifically conferred or
imposed on the Commissioner by or under this Act.
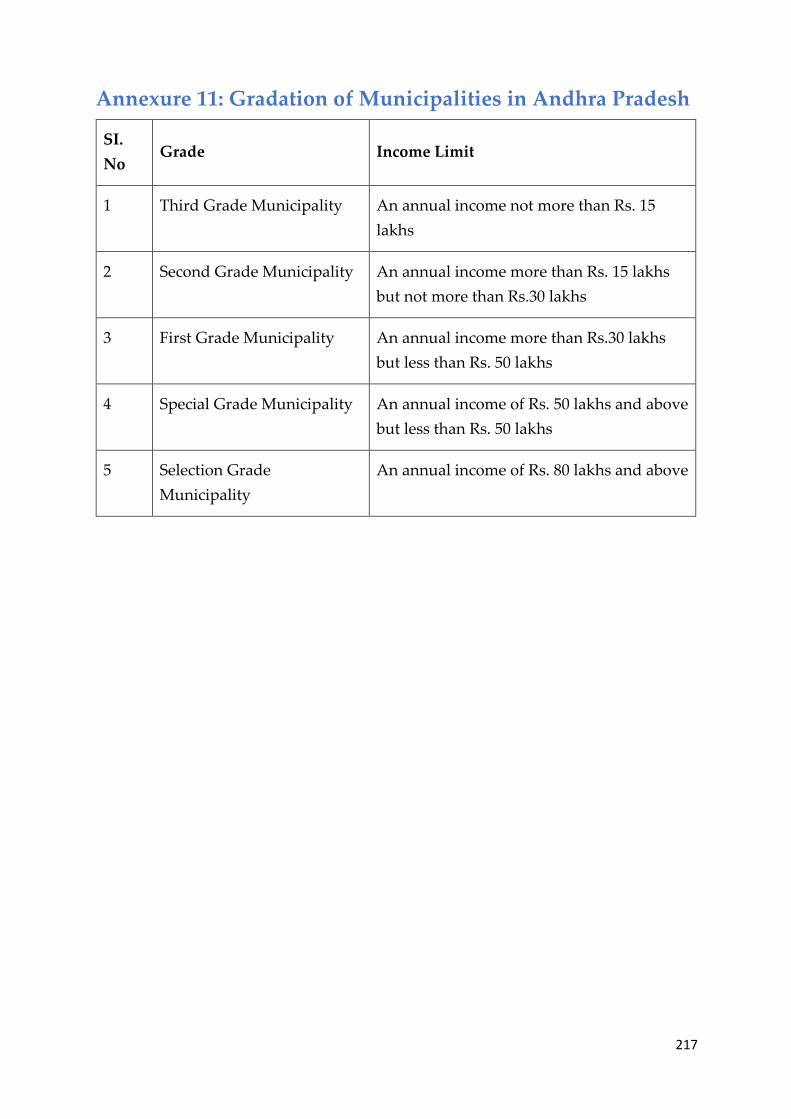
217
Annexure 11: Gradation of Municipalities in Andhra Pradesh
SI.
No Grade Income Limit
1 Third Grade Municipality An annual income not more than Rs. 15
lakhs
2 Second Grade Municipality An annual income more than Rs. 15 lakhs
but not more than Rs.30 lakhs
3 First Grade Municipality An annual income more than Rs.30 lakhs
but less than Rs. 50 lakhs
4 Special Grade Municipality An annual income of Rs. 50 lakhs and above
but less than Rs. 50 lakhs
5 Selection Grade
Municipality
An annual income of Rs. 80 lakhs and above
218
Annexure 12: Andhra Pradesh
A12.1. Urbanisation in Andhra Pradesh
The urban population of Andhra Pradesh has been increasing since 1971 onwards
barring a slight dip in the decade between 1991 and 2001. The percentage of urban
population to the total population has increased from 27.30% in 2001 to 33.36% in
2011, registering an annual exponential growth rate (AEGR) of 3.05% which is
slightly higher than India’s AEGR of 2.76% during the same time period. The
number of Urban Agglomerations (UAs)132 in the state grew from 37 in 2001 to 58 in
2011133. As per the 2011 census, undivided Andhra Pradesh was the 10th most
urbanized state of India134. After the reorganisation of the state in 2014, Andhra
Pradesh currently has 120 urban local bodies (ULBs) which includes 27 Nagar
Panchayats, 77 Municipalities and 16 Municipal Corporations135. Of all the districts,
Vishakhapatnam district has the highest proportion of urban population (47.45%)
whereas Srikakulam district has the lowest (16.16%). It is projected that by around
2031-35, the percentage of AP’s urban population to the total population would
increase to 42.8%136.
The state is strategically located on the Southeast coast of India and is a natural
gateway to East & Southeast Asia. Andhra Pradesh has abundant natural resources
(Barytes, Limestone, Bauxite, and a number of minor minerals), fertile land and river
basins, water resources, extensive canal system and conducive agro-climatic
conditions. The State has the second longest coastline in India and is also one of the
largest producers of marine products. Andhra Pradesh, over the years, has
established a strong presence in agro and food processing, textiles, chemicals &
petrochemicals, pharmaceuticals, metallurgy, electronics and electrical engineering
sectors. The state ranks 1st in ease of doing business and 4th in SKOCH Governance
rankings. Andhra Pradesh’s vantage location, policy environment, conducive
business environment, incentives for entrepreneurship, easy procedural processes
and commitment to drive urbanisation through industrialization by the state
government has attracted large industrial units and a lot of MSMEs.
132 A town together with its outgrowth(s) is treated as an integrated urban area and is designated as
“Urban agglomeration”. 133 Handbook of Urban Statistics, MoH&UA, 2019 134 Excluding the smaller states of Delhi and Goa. 135 Socio Economic Survey 2019-20. 136 Population Projections for India and States 2011 – 2036, Ministry of Health and Family Welfare

219
The state has been a destination for National Investment and Manufacturing Zones
(NIMZ), Information Technology Investment Regions (ITIR), Smart Industrial
Township (SIT), Special Economic Zones (SEZ) and Industrial Parks. As of February
2020, the state has 20 operational SEZs and 63 in the pipeline across various sectors -
textiles & apparel, food processing, footwear & leather products, multi-product,
pharma and IT SEZs137 which are located mainly in Vishakhapatnam, Krishna and
Nellore districts. Several global and national players have set up firms, industries,
manufacturing hubs, companies in different cities of the state. The Satyavedu
Reserve Infracity Pvt. Ltd., an integrated business city is one such example of a
planned city that houses 185 companies from 27 countries at a strategic location
north of Chennai.
While India’s average year-on-year GDP growth has been 6.9% between 2013 to
2017, it was 7.6% for AP during the same time period. While India’s GDP grew by
6.7% in 2018, the GSDP growth rate of AP in 2018 was 11.2% and the second highest
in the country138. The service sector contributes the highest at 39% while the Industry
sector contributes to 33% of the GSDP. The growth rate of the service sector has been
the highest at 9.11% and industrial sector at 5.67% in 2019-20. In Andhra Pradesh,
65% of the economic growth is contributed by the urban areas of the state 139.
A12.2. Provisioning of Urban Sanitation and SWM Services
Water Supply, Sanitation, and Solid Waste Management are some of the most vital
services to be provided by ULBs. Few of the responsibilities with respect to
sanitation, legally entrusted upon the ULBs are140: (i) To frame by-laws for drain
management and ensure that private latrines within the municipalities adhere to
these standards, (ii) To ensure that house drains of private latrines are connected
with public drains, and/or public sewers. (iii) To provide for and maintain public
latrines and urinals in sufficient numbers and at convenient places. (iv) To ensure
that every person employing more than 10 workmen or labourers provides and
maintains latrines separately for each sex. (v) To ensure that market, cart-stand,
cattle-shed, poultry, theatre, railway station, dock, wharf, or other place of public
resort provide and maintain latrines separately for each sex.
137 https://www.ibef.org/states/andhra-pradesh.aspx 138 States of Growth 2.0, A CRISIL Research Report, 2019 139 Solid waste management policy, 2018 140 Andhra Pradesh Municipalities Act, 1965 discusses the Water Supply, Sanitation, and Solid Waste
Management functions in part V, chapters I and II.

220
Responsibilities with respect to solid waste management are as follows: (a) ensure
regular sweeping and cleaning of the streets; (b) daily removal of filth and carcasses
of animals from private premises; (c) daily removal of rubbish from dustbins and
private premises141; (d) Plan for utilization of road sweepings, rubbish and filth for
preparation of compost and its sale; (e) Plan for utilization of carcasses of animals for
the supply of bones for the purpose of manures and its sale. It is also the
responsibility of the municipality to dispose of the waste collected in the prescribed
manner (as per the rules).
As per the 2011 census and APUFIDC urban services data for AMRUT & Non-
AMRUT cities (2015-16):
• 13.9 % of urban households in AP do not have latrines as compared to the national
average of 18.6 %.
• Open Defecation by urban households of AP is 11.9 % which is slightly lower than
the national average of 12.6 %.
• 33.7% of AP’s urban households are connected to a piped sewerage network which
is slightly higher than the national average of 32.7%.
• Lack of a formal mechanism and improper septage management is leading to
disposal of sewage and septage into water bodies in and around the cities without
any treatment in more than 100 ULBs of the state.
• Manual Scavenging: As per the 2011 census, approx. 0.02 % of the urban
households get night soil removed manually and about 3,50,000 households in the
state have insanitary latrines in their premises.
ULBs in AP generate about 6600 metric tons (MT) of solid waste per day of which
6490 MT per day is collected and about 550 MT/day is processed142. The per capita
waste generation ranges from 0.3 to 0.4 kg/ per day. The quantity of waste is growing
at 5 % annually with a collection efficiency greater than 90%. All the urban wards in
AP have 100% door to door collection, 89% of them have 100% source segregation
and 40% of the total waste generated in the state is getting processed143.
141 In order to do this, the following must be arranged for: (i) depots for the deposits of filth, rubbish
and the carcasses of animals, (ii) covered vehicles or vessels for the removal of filth, (iii) vehicles or
other suitable means for the removal of the carcasses of large animals and rubbish, (iv) dust-bins for the
temporary deposit of rubbish; 142 Solid Waste Management Policy, 2018 143 Handbook of Urban Statistics, MoH&UA, 2019

221
In order to address these infrastructure and service gaps, Government of Andhra
Pradesh (GoAP) formulated the ‘State Sanitation Strategy’ (2016) and ‘Solid Waste
Management Policy’ (2018) to guide the ULBs. The State Sanitation Strategy (2016)
has been developed by CMDA, Swachha Andhra Corporation (SAC), MA&UD and
The Deutsche Gesellschaft für Internationale Zusammenarbeit (GIZ). The strategy
envisions to achieve a “Swachha Andhra” ensuring healthy and clean cities
providing access to sanitation infrastructure to all citizens. The goals of the State
Sanitation Strategy (2016) are to ensure 100% hygienically safe and sanitary
treatment and disposal, achieving Open Defecation Free cities, improved
institutional governance and enhanced human resource capacities for city-wide
sanitation, enhanced awareness and sustained behavioural change, technological
efficiency and appropriateness.
As per the Solid Waste Management Policy (2018), the state is committed to be a
zero-dumping state. The state envisions to transform cities and towns into neat, clean
and litter free areas (with special focus on hygienic and affordable sanitation for
urban poor and women), best in class liveability, improve health and environment
standards, tourism and investment attractiveness. Through a shift from linear
approach to a zero waste and circular economy approach, the state sets to encourage
social and private entrepreneurship in SWM. It aims to achieve the Service Level
Benchmarks by 2023 and reduce landfilling to less than 20%.
Table A12. 1: Status on SWM Benchmark Indicators in AP
SI.
No Indicator
Benchmark
(in %)
Present Status
(in %)
1 Household level coverage of solid waste
management services 100 95 – 98
2 Efficiency of collection of municipal solid waste 100 95 – 98
3 Extent of segregation of municipal solid waste 100 50 -55
4 Extent of municipal solid waste
recovered/recycled 80 12 - 15
5 Extent of scientific disposal of municipal solid
waste 100 8 - 12
6 Extent of cost recovery in solid waste
management services 100 25 - 28
7 Efficiency in redressal of customer complaints 80 96
8 Efficiency in collection of user charges 90 2 -3
Source: Solid Waste Management Policy, 2018
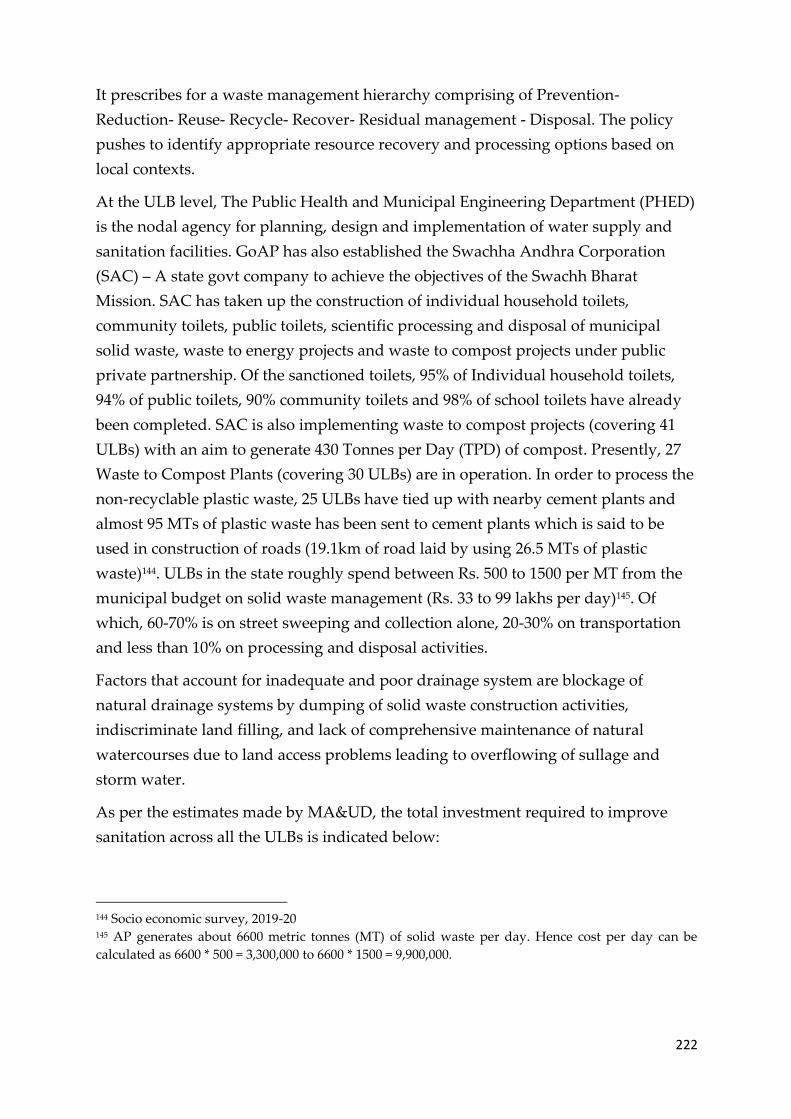
222
It prescribes for a waste management hierarchy comprising of Prevention-
Reduction- Reuse- Recycle- Recover- Residual management - Disposal. The policy
pushes to identify appropriate resource recovery and processing options based on
local contexts.
At the ULB level, The Public Health and Municipal Engineering Department (PHED)
is the nodal agency for planning, design and implementation of water supply and
sanitation facilities. GoAP has also established the Swachha Andhra Corporation
(SAC) – A state govt company to achieve the objectives of the Swachh Bharat
Mission. SAC has taken up the construction of individual household toilets,
community toilets, public toilets, scientific processing and disposal of municipal
solid waste, waste to energy projects and waste to compost projects under public
private partnership. Of the sanctioned toilets, 95% of Individual household toilets,
94% of public toilets, 90% community toilets and 98% of school toilets have already
been completed. SAC is also implementing waste to compost projects (covering 41
ULBs) with an aim to generate 430 Tonnes per Day (TPD) of compost. Presently, 27
Waste to Compost Plants (covering 30 ULBs) are in operation. In order to process the
non-recyclable plastic waste, 25 ULBs have tied up with nearby cement plants and
almost 95 MTs of plastic waste has been sent to cement plants which is said to be
used in construction of roads (19.1km of road laid by using 26.5 MTs of plastic
waste)144. ULBs in the state roughly spend between Rs. 500 to 1500 per MT from the
municipal budget on solid waste management (Rs. 33 to 99 lakhs per day)145. Of
which, 60-70% is on street sweeping and collection alone, 20-30% on transportation
and less than 10% on processing and disposal activities.
Factors that account for inadequate and poor drainage system are blockage of
natural drainage systems by dumping of solid waste construction activities,
indiscriminate land filling, and lack of comprehensive maintenance of natural
watercourses due to land access problems leading to overflowing of sullage and
storm water.
As per the estimates made by MA&UD, the total investment required to improve
sanitation across all the ULBs is indicated below:
144 Socio economic survey, 2019-20 145 AP generates about 6600 metric tonnes (MT) of solid waste per day. Hence cost per day can be
calculated as 6600 * 500 = 3,300,000 to 6600 * 1500 = 9,900,000.

223
Table A12. 2: Total Investment Required to Improve Sanitation Across all the ULBs
Sewerage and Septage management - US $ 2230 M
Storm Water drains - US $ 2041 M
Water Supply- US $ 2135 M
Source: MA & UD-Investment opportunities in Urban Infrastructure in AP - 2016
Under the 14th Finance Commission (2015-16), out of the total sanctioned grant of
nearly Rs. 331 crores, GoAP made special allocations to the following sectors, viz;
Water Supply (Rs. 75.11 crores), Sanitation including Septage Management (Rs. 5.61
crores), Sewerage and Solid Waste Management (Rs. 1.40 crores) and Solid Waste
Management (Rs. 1.13 crores) (Andhra Pradesh State Sanitation Strategy, 2016).
A12.3. Urban Reforms Related to Sanitation and SWM
The state of Andhra Pradesh has laid emphasis on urban development through
various reforms, policies and schemes (Table 12.3). As per the state’s Sunrise Andhra
Pradesh Vision 2029, urban development is one of the key sectors and priorities of
Andhra Pradesh. The vision of “Urban development in AP encompasses the
provision of employment opportunities, affordable housing, reliable and convenient
services, clean and green environment, as well as building accountable and
financially strong Urban Local Bodies (ULBs)”.
Table A12. 3: Urban Development Reforms, Policies and Schemes
SI.
No Scheme
No of
ULBs Sector/Description
Cost Rs.
In Crores
Completed Projects
1
JNNURM Completed Projects 12
Water Supply, Sewerage, Roads,
Drains and Solid waste
management.
1449.09
2 Works taken up under 14th FC,
SFC, SCC & STC sub plan etc. 110
Water Supply, Roads, drains, and
Solid Waste Management 1986.55
3 Smart LED Lighting 110
Conversion of Street Lamps into
LED Lights 220.00
4 Municipal General 110 Infrastructure Development 195.53
5 Andhra Pradesh Municipal
Development Project (APMDP) 6
Water Supply in Viziangaram,
Badvel, Markapur, Kakinada,
Ananthpur and Guntur
856.51
Sub Total 4707.68

224
SI.
No Scheme
No of
ULBs Sector/Description
Cost Rs.
In Crores
Ongoing Projects
1
Atal Mission for Rejuvenation and
Urban Transformation (AMRUT) 32
To improve the SLBs in Water
Supply, Sewerage and Septage
Management, Storm, Water Drains
and Parks & Green Spaces.
3762.91
2
Smart City Mission (GoI) (GVMC,
Kakinada, Tirupathi and
Amaravathi)
4
To improve the quality of life of
people by enabling local area
development and harnessing
technology, especially technology
that leads to Smart outcomes
6420.48
3
Smart City Mission (GOAP)
(Srikakulam, Eluru, Ongole,
Mellore, Kurnool & Anantapur)
6
To improve the quality of life of
people by enabling local area
development and harnessing
technology, especially technology
that leads to Smart outcomes
594.00
4 One Time Special Financial
Assistance (OTSPA) 2
Sewerage in Guntur and Storm
Water Drainage in Vijayawada 1364.86
5 Housing and Urban Development
Corporation (HUDCO) 1
Water Supply and Sewerage in
Nellore 1137.62
Source: White Paper, Department of Municipal Administration& Urban Development, 2018
A review of the various urban reforms projects and initiatives clearly suggest that
there is a high presence and influence of the State Govt along with Public Private
partnerships, Special Purpose Vehicles, Parastatals and external agencies in
providing sanitation and SWM services in AP. For e.g., GoAP implemented ‘The
Andhra Pradesh and Telangana Municipal Development’ project with financial
assistance of 300 million USD from the World bank with an objective to improve
urban infrastructure and service needs in ULBs across a variety of sectors including
urban roads, sewerage, water supply, sanitation, solid waste management, street
lighting, energy efficiency, and community centres. However, only the water supply
sub-project could be fully completed. Prior to this sub-project, the coverage in the 6
selected ULBs was between 21 and 75 % with an average per capita piped water
supply ranging between 27 and 100 LPCD. Upon completion, the sub-project
achieved 100 % coverage with an average per capita water supply ranging between
70 and 135 LPCD.
Another example is the recently initiated ‘AP Urban Water Supply & Septage
Management Improvement’ Project (2019-2023) with financial loan of 400 million

225
USD from the Asian Infrastructure Investment Bank (AIIB). The project is being
implemented by The Public Health & Municipal Engineering Department and
Andhra Pradesh Urban Finance and Infrastructure Development Corporation
(APUFIDC). The proposed project includes investments in water supply
infrastructure across 50 ULBs in AP that are not covered under the AMRUT scheme.
Another component of this project is sanitation and drainage pilots in 5 selected
ULBs by constructing waste water treatment plants for gray water treatment
alongside critical drainage improvements.
Apart from the above major urban reforms’ projects, AP also has 16 smart city
projects - 3 under the Government of India (GoI) mission and 13 identified by GoAP
along with 32 AMRUT cities. For the AMRUT cities, the highest investment has been
on water supply at 61% (Rs. 1351.36cr), followed by 24% (Rs. 529.13cr) for sewerage
& septage management and 13% (Rs. 296.63cr) for storm water drainage for the
period between 2016 to 2020.
The above-mentioned projects are a few examples that demonstrate how various
urban services need to be interconnected so that robust sanitation and waste
management services can be provided. However, huge differences between the
demand and supply of these services continue to exist but the space available for
ULBs to bridge this gap is very limited due to the existence of various parastatals,
public-private partnerships and external agencies.
A12.4. Sanitation and SWM: State Level Targets and Progress Made So
Far
According to the Sustainable Development Goals Index (SDGI) released by NITI
Aayog, Andhra Pradesh scored 67 out of 100 points which marginally qualified it as
a frontline state among all 28 states. AP’s SDG score comparatively stands higher
than the national average 60. The state also improved on its overall score by three
points compared to 2018 when it was 64 qualifying it as just a ‘performer’. AP’s
highest score of 96 comes with clean water and sanitation. State performance in
sanitation and waste management related indicators are mentioned in below table.

226
Table A12. 4: Performance of Telangana State on Indicators of SDG 6, 11 and 12
Goal Indicator
Andhra
Pradesh
2019
National
2019
Target
2030
6 Districts verified to be Open Defecation
Free (%) 129.10 91 100
6 Urban households with individual
household toilet (%) 100 97.2 100
11 Wards with 100% door to door waste
collection (%) 100 91 100
11 Waste processed (%) 48 56 100
11 Installed sewage treatment capacity as a
proportion of sewage generated in
urban areas
0.09 37.5 100
12 Municipal Solid Waste (MSW) treated
against MSW generated (%) 7.76 20.7 100
12 Wards with 100 % source segregation
(%) 90.94 67.6 100
Source: SDG India Index Baseline report, 2018 and SDG India Index & Dashboard, 2019-20
For AMRUT cities, the annual targets146 of increment from the baseline value
(51.65%) of household level coverage of direct water supply connections are in the
range of 9% to 24% across 2016-20. Despite having a very low baseline coverage of
sewerage network services (12.52%), the increment targets have only been set
between 0.22 % to 0.45% across 2016-20. Surprisingly, there have been no targets
planned to improve the efficiency in sewage collection even though the baseline
coverage was only 12.35%. In terms of the adequacy in STP capacity the incremental
targets were set at only 8% for 2019 & 20 even though the baseline is only 39.12%.
The state’s annual action plan (SAAP) for AMRUT cities between 2017-20 are
prioritised and planned based on the mobilization of funds.
Table A12.5 shows the progress made across various sanitation related parameters
from the NSSO 69th round data (2012) of urban households belonging to the
erstwhile combined AP to the NSSO 76th round data (2018) of urban households
belonging to the recently formed reorganized AP in 2014.
146 State Annual Action Plan, SAAP 2017-20

227
Table A12. 5: Progress Made Across Various Sanitation Related Parameters From 2012 to
2018
SI.
No Sanitation Parameter
NSSO 69th round
data - 2012
(Per 1000
distribution of
households) / (%)
NSSO 76th
round data
– 2018
(%)
NSSO 76th round
National
Average (%)
1 Urban households having
access to some form of latrine
facilities
919 / (91.9) 97 96.2
2 Urban households with
flush/pour-flush latrine
connected to a pipe sewer
system
315 / (31.5) 9.7 39.1
3 Urban households with
flush/pour-flush latrine
connected to a septic tank
567 / (56.7) 85.3 48.9
4 Urban households connected
to underground drainage
system
Not Available 59.9 53.5
5 Urban households with no
drainage system 76 / (7.6) 9.0 8
6 Urban households disposing
waste water without treatment Not Available 50.5 92.4
Source: NSSO 69th and 76th round report
AP was ranked 6th in both the Swachh Survekshan (SS) 2019 and 2020 national level
surveys and prior to that it was ranked 5th in 2018. Over the past 3 years, AP has
consistently ranked higher than all its southern counterparts. In SS 2020, Tirupati
ULB was recognized as the country’s best ‘self-sustainable small city’ whereas
Vijayawada was recognized as India’s cleanest big city. Additionally, in SS 2020,
with regard to the provisioning of SWM services, AP was ranked 4th (for ULBs less
than 1 lakh) and 5th (for ULBs greater than 1 lakh) across all large states.
A12.5. Manual Scavenging and Welfare of Sanitation Workers
The number of new manual scavengers in AP as identified by a survey coordinated
by the National Safai Karamchari Finance and Development Corporation (NSKFDC)
during 2018-19 was 1982147; but according to activists even this number is grossly
underestimated. Out of a total of 774 sewer deaths that took place in the country
147 Survey results as on March 2019 (5 districts identified for the survey in AP)

228
between 1993 to 2019, AP had accounted for only 18 of them and none in FY 2018-
19148. However, as per another article, the GoAP claims that there have only been 8
sewer deaths in the state since 1993 and all families have been paid full
compensation (Mishra & Sen, 2019).
From 1983 to 1992, efforts have been made by the state to convert dry latrines to
water-borne latrines through low cost sanitation programmes. The GoAP has
constructed sanitary latrines through the Integrated Low-Cost Sanitation (ILCS)
programme for economically weaker section (EWS) category houses. About 1.85 lakh
dry latrines and 1,983 community latrines have been converted to sanitary ones.
GoAP started a mission for ‘Eradication of Manual Scavenging and Rehabilitation of
Scavengers’ with a specific objective to declare AP as a ‘manual scavenger free’ state
by 2002. However, even today there are still insanitary latrines, so the objective is yet
to be achieved (Prasad, 2007).
Despite these initiatives, AP has performed very poorly in comparison to other states
by failing to rehabilitate even the officially identified manual scavengers. The
proportion of identified manual scavengers who received the One Time Cash
Assistance (OTCA) was one of the lowest in AP (72 %). Under the Self Employment
Scheme for Rehabilitation of Manual Scavengers (SRMS) scheme, 1233 projects were
sanctioned across the country, but none were sanctioned in AP. Similarly, trainings
for 13,587 beneficiaries were sanctioned under the SRMS scheme, while AP had only
one (Centre for Policy Research, 2019). Between 2014 to 2018, AP hadn’t demanded a
single scholarship sum to support the education of children of manual scavengers’
under the pre-metric scholarship scheme (Rashtriya Garima Abhiyan, 2018).
A12.6. Urbanisation Challenges (Specific to Sanitation and SWM)
Andhra Pradesh is urbanizing rapidly however the development of basic
infrastructure hasn’t been able to match the urban growth that the state is
witnessing. Water supply, waste water collection and treatment, drainage, solid
waste and other basic infrastructure are largely inadequate in urban areas of the state
and are not capable to respond to the growth in urban population and economy.
Particularly, water supply and sanitation are characterized by low coverage,
intermittent services, poor standards and quality. The water supply in the state is
currently intermittent and averages 87 LPCD whereas the GoAP plans to provide
continuous water supply of 135 LPCD (Asian Infrastructure Investment Bank, 2018).
148 2018-19 Annual Report, National Commission for Safai Karamcharis (NCSK), Ministry of Social
Justice

229
The main issues found in water supply are that there are inadequate water sources as
the existing water sources are being tapped to the maximum. Also, the unaccounted
water (leakages) ranges from 20% to 82.84%. Though the connections exist, the water
supply is found to be low. Only 18.07 % of the urban households are connected to an
underground drainage system. Only 8 cities have existing partial underground
drainage facilities. Inadequate and improper maintenance of storm water drains with
frequent flooding and choking of drains is leading to unhygienic environment 149.
Since the waste water treatment plants are located only at a few locations, most of
the waste water is discharged through septic tanks, soak pits and in some cases
directly to sludge drains without treatment. Many of the waste water treatment
plants and sewage pumping stations have been found to be not functioning
effectively due to defunct parts. Direct discharge of such huge sewage is polluting
both surface and ground water. As of 2015, only 21% of the waste water in the
sewerage system and 7% of solid wastes were being effectively treated.150 The
monitoring of landfill sites for ambient air, ground water, leachate quality, compost
quality and volatile organic compounds has been found to be very weak in the state.
The ministry of Municipal Administration & Urban Development (MA&UD)
reported that 50.81 lakh metric tonnes of legacy waste continues to exist in dump
yards.151 The waterborne diseases in the state were in the range of 13-15 lakhs during
the period of 2014 -16 (MoHFW, 2017). The State Action Plan for Climate Change
(SAPCC) has pointed out that the existing drainage systems in many ULBs are not
adequate to accommodate the precipitation from heavy rains and the huge
generation of sewage and solid waste, all of which are posing a serious threat to
urban health.
In terms of access to basic/core services in ULBs, AP scores 67.42 %. Table A12.7
details the AP Sector wise breakup of consolidated Investments for all ULBs in the
state AMRUT mission.
149 State Sanitation strategy, 2016 150http://apvision.ap.gov.in/urban.php#:~:text=New%20'Economic%20Cities'%20are%20being,of%20la
nd%20has%20been%20approved 151 APPCB Annual report, 2018-19
230
Table A12. 6: Sector Wise Breakup of Consolidated Investments for all ULBs in the State
(Rs. In crores)
Sector Water
Supply
Sewerage and
Septage
Management
Drainage Urban
Transport
Others (Green
Spaces & Parks)
Total 6117.24 10888.75 6814.85 1998.88 202.37
Source: State Annual Action Plan (SAAP) (FY2017-20) State- Andhra Pradesh
It may be noted that the maximum planned expenditure is in the water supply and
sanitation sectors, as compared to urban transport and other basic services
(APUFIDC, 2015).

231
Annexure 13: General Functions of Municipalities
1. Collection and updating of essential statistics.
2. Organising voluntary workers and make them participate in collective activities.
3. Organise campaign for thrift.
4. Awareness building against social evils like drinking, consumption of narcotics,
dowry
and abuse of women and children.
5. Ensuring maximum people's participation in all stages of development.
6. Organise relief activities during natural calamities.
7. Inculcating environmental awareness and motivating local action for its
upgradation.
8. Development of Co-operative Sector.
9. Promoting communal harmony.
10. Mobilising local resources in cash or in kind including free surrender of Land for
developmental purposes.
11. Propagating legal awareness among the weaker sections.
12. Campaign against economic offences.
13. Organising neighborhood groups and self-help groups with focus on the poor.
14. Awareness building on civil duties.
232
Annexure 14: Kerala
A14.1. Urbanisation in Kerala
Kerala is divided into three distinct regions- hills & valleys, midland plains and
coastal region. The population of Kerala was 33.38 million in 2011 and it accounts for
3.01 % of India’s population. The population density in Kerala is 859 persons per Sq.
Km as per the 2011 census and one of the highest in the country. Across Kerala there
are a large number of small and medium towns and hence one cannot clearly
distinguish a rural area from an urban area. During 2001 to 2011, Kerala experienced
an urban population growth rate of 92.72%.The percentage of urban population to
the total population increased from 25.96% in 2001 to 47.70% in 2011, registering an
Annual Exponential Growth Rate (AEGR) of 6.56% which is significantly higher than
India’s AEGR of 2.76% during the same time period152.As per the 2011 census, Kerala
was the 2ndmost urbanized state (after Tamil Nadu) among all the larger states of
India153.It is projected that by around 2031-35, the percentage of Kerala’s urban
population to the total population would increase to 92.8%154, thus making it as one
of the fastest and most urbanized large states of the country.
The total number of towns in Kerala rapidly increased from 150 to 520 towns
between 2001 to 2011. Among the 520 towns in the state, 59 were statutory
towns155and 461 were census towns156. Currently there are 93 statutory towns of
which 87 are municipalities and the remaining 6 are municipal corporations. As per
the 2011 census, 4 out of the 14 districts in the state had less than 25% of
urbanisation, another 4 districts between 25 to 50% of urbanisation and the
remaining 6 districts had more than 50% of urbanisation. Eranakulam district had
the highest percentage of urban population (68.07%) whereas Wayanad district had
the lowest percentage of urban population (3.86 %).
One of the unique trends of urbanisation in Kerala is that it is not concentrated in a
few large metropolitan cities but is almost equally distributed across many mid-sized
cities and smaller towns across the state. The urban settlement pattern in the state is
152 Handbook of Urban Statistics, MoH&UA, 2019 153 Excluding the smaller states of Delhi and Goa. 154 Population Projections for India and States 2011 – 2036, Ministry of Health and Family Welfare 155 Statutory Town: All places with a municipality, corporation, cantonment board or notified town area
committee. 156Census Town: Places that satisfy the following criteria, a) A minimum population of 5000, b) At least
75% of the male population engaged in non-agricultural pursuits, c) A density of population of at least
400 per sq.km

233
a continuous spread of habitation without much open land or fields separating these
habitations. Such a habitation pattern itself is driving urbanisation in a rapid
manner. Moreover, the infrastructure facilities available to the population does not
vary much between rural and urban, especially access to educational and healthcare
facilities (Economic Review, 2016). The occupational shift from agriculture to other
categories157of employment is another main driver for the high level of urbanisation
in Kerala. Rather than seeing an increase in the population within an existing urban
area, the number of urban areas in the state is increasing very rapidly. The census
data from 2001 and 2011 regarding the increase in number of towns also validates
this fact. Kerala’s GSDP was Rs. 382134crores in 2014-15 (at current prices) and it
increased to Rs. 513321 crores in 2018-19. While India’s average year-on-year GDP
growth had been 6.9% between 2013 to 2017, at5.8% it was much lower for Kerala
during the same time period. While India’s GDP grew by 6.7% in 2018, the GSDP
growth rate of Kerala in 2018 was estimated to be 5% and one of the lowest in the
country158.
A14.2. Provisioning of Sanitation and SWM Services
Solid waste management is listed as a mandatory function in the Kerala Municipality
Act as “Collection and disposal of solid waste and regulation of disposal of liquid
waste”, while sanitation is listed under the ‘sector-wise’ list of functions, where the
Act specifies implementation of sanitation programmes as one of the key functions of
municipalities. It mandates provisioning of sanitation facilities such as creation and
maintenance of public latrines, including all other sewerage provisions.
The Kerala Water Supply and Sewerage Act159 led to the formation of the Kerala
Water Authority (KWA) in 1984.Upon the formation of KWA – a parastatal body, all
the municipalities and corporations were directed to transfer the power of water
supply to the KWA. The Kerala Municipality Act passed in 1994 again entrusted
ULBs with the power of water supply for domestic, industrial and commercial
purposes160. However, water auditing done in the Cochin Municipal Corporation
found that 75 % of the households depended on the KWA to meet their demands.
Among them, nearly 40 % of the households complained about insufficient water
157Other non-agricultural work like construction, small scale businesses, etc. 158 States of Growth 2.0, A CRISIL Research Report, 2019 159The Kerala Water Supply and Sewerage Act, 1986: An Act to provide for the establishment of an
autonomous authority for the development and regulation of water supply and wastewater collection
and disposal in the State of Kerala 160 KM Act, 1994 – Section 315 B

234
supply by KWA, with only 25 % receiving uninterrupted water supply from KWA.
The existence of KWA is preventing ULBs from exercising this power. ( Mathew &
Dhanuraj, 2017).
As per the 2011 census, 14.3% of urban households are connected to a piped sewer
system (compared to the national average of 32.7%), 56.7% are connected to septic
tanks while 21.9% use pit latrines. Among the total urban households in the state,
only 2.6% households don’t have latrines while the national average is 18.6%. Also,
open defecation by urban households in Kerala is one of the lowest at 1.7 % which is
significantly lower than the national average of 12.6 %. (Census India ).
The total Municipal Solid Waste (MSW) generation in the state is 3.7 million tons
every year / 10,136 tons per day (TPD). Of this the 6 municipal corporations generate
about 1415 TPD (14%) and the 87 municipalities generate 4523 TPD (45%). As per the
Suchitwa mission progress report 2018-19 (latest available), several steps have been
implemented in the state for the processing of biodegradable and non-biodegradable
wastes in urban areas. For biodegradable waste processing, the two main steps were
installation of composting pits and biogas plant. In the household level, about 8.3
Lakh urban households have installed composting pit and about 17K urban
households have installed biogas plant (Approx. 77% HH coverage). Apart from this
2663 institutional level and 1216 community level composting pits have been
installed in 2018-19 and 522 institutional level and 49 community level biogas plants
are also installed during this year. Regarding non-biodegradable waste management,
119 Material Collection Facilities (MCFs) and 50 Resource Recovery Facilities (RRFs)
had been constructed all over the state. Among these, 113 MCFs and 40 RRFs are
functional during the year 2018-19. As a result, 948 TPD waste was treated in 2018-
19.
The nodal agencies for managing and operationalising the functions of sanitation in
urban areas of the state are the urban local bodies and the Kerala Water Authority
(KWA). The Executive Director, Suchitwa Mission161 was designated as member
convener and as nodal office for the purpose of steering the development of the State
Sanitation Strategy (SSS).
161The Suchitwa Mission functions as an advisory authority for the State Government. The Suchitwa
Mission, the Technical Support Group (TSG) in Waste Management sector under the Local Self
Government Department, Government of Kerala is responsible for providing technical and managerial
support to the Local Self Governments of the State.

235
Sanitation
In 2015, the state sanitation strategy (SSS) of Kerala was developed in line with the
requirement for states to create their own SSS as per the 2008 National Urban
Sanitation Policy. It was created with a vision that all cities and towns in Kerala
become totally clean, sanitized, healthy, liveable, ensuring and sustaining good
public health and environmental outcomes for all citizens, with a special focus on
hygienic and affordable sanitation for the urban poor and women with specific focus
on the diverse topography of the state and its implications. The overall vision of
Kerala SSS is to achieve an urban Kerala ensuring environmentally safe disposal of
solid and liquid waste. The specific goals are: (i) Ensuring 100 % hygienically safe
and sanitary treatment and disposal, (ii) Enhanced awareness and sustained
behavioural change, (iii) Achieving Open Defecation Free Cities, (iv) Improved
Institutional governance and enhanced human resource capacities for city-wide
sanitation, (v) Technological efficiency and appropriateness.
However, in many of the census towns across Kerala, more than 70 % of the
households are using septic tanks as means of faecal sludge disposal. Whereas in the
Municipal Corporations, Kochi is the only Municipal Corporation where more than
70 % of households are using septic tanks. This calls for an immediate set of policy
and programme intervention on septage management by the Government and ULBs
to mitigate public health risks. The state government has come up with a plan on
integrated septage management that takes in to account the entire value chain of the
septage management and development of appropriate guidelines at the state level
considering the dimensions of social, legislative, technical, governance and financial
issues. (Kerala State Sanitation strategy, 2015).
Due to poor solid waste management within the state, the environment department
has constituted the Kerala Waste Management Authority (KWMA) which is to
function along with urban local bodies. This parastatal body will be undertaking
various water pollution and waste management projects on a larger scale. Urban
Local Bodies and KWMA are both responsible for solid waste management in
Kerala. Kerala State Industrial Development corporation (KSIDC) is currently the
nodal body for projects revolving around the waste to energy spectrum. The
Suchitwa Mission functions as an advisory authority for the state government on
SWM as well. It is also the Nodal agency for implementing the Swachh Bharat
Mission (Urban), Swachh Bharat Mission (Rural) and Communication and Capacity
Development Unit (CCDU) in the State (Suchitwa Mission, 2020).

236
Kerala was one among ten states and two union territories directed by the Supreme
Court to pay a fine for failing to comply with the orders passed by the Supreme
Court regarding implementation of Solid Waste Management Rules, 2016 (Kumar,
2018).Subsequently, the state created the Kerala Solid Waste Management
Operational Guidelines in 2017 and Kerala State Policy on Solid Waste Management
in 2018.
The 2017 SWM operational guidelines expect residential waste generators to process
and dispose of biodegradable waste (BDW), or transport the BDW at their own cost
to the nearest community facility, or hand over to authorized waste collectors by
paying a user fee. It lays down a uniform rate of user fee, irrespective of income
considerations which may leave out slum waste generators who are a priority as per
the SWM Rules. Although ULBs are free to charge a reduced user fee for poorer
sections, these guidelines require that they compensate Haritha Karma Sena (HKS)162
for any shortfalls.
The Kerala State Policy on Solid Waste Management, 2018 envisages a healthy,
prosperous and resource efficient society in which waste is reduced, reused, recycled
and prevented wherever feasible and beneficial and disposed of in an
environmentally safe manner. The main focus is on waste to energy conversion
(Kerala State Policy of Solid Waste Management, 2018). KSIDC has invited request
for proposal for integrated solid waste management with a waste-to-energy project
of minimum 5 MW capacity on design, build, finance, operate and transfer basis at
Kozhikode (Kumar, 2018).
As per the 5th state finance commission report (latest), the total expenses incurred
towards sanitation related operations & maintenance (O&M) across the 60
municipalities for the year 2013-14 was Rs. 10.5 crores (14.71% of the total O&M
expenditure) whereas it was Rs. 1.3 crores (Only 3% of the total O&M expenditure)
across the 5 municipal corporations. On the other hand, the total revenues raised by
municipalities during the same period was Rs. 1312.3 crores and municipal
corporations raised Rs. 1065.63 crores. The own source revenue raised by
municipalities was Rs 398.19 crores (tax: 201.83 and non-tax: 196.36) which is 30 % of
the total revenue. The municipal corporations raised Rs. 377.3 crores (tax: 253 and
non-tax: 124.3) which is 35 % of the total revenues raised during 2013- 14 (State
Finance Commission, 2015).
162In order to institute door-to-door collection of non-biodegradable waste, an enterprise group namely
Haritha Karma Sena (HKS) has been formed through the Kudumbasree Mission.
237
A14.3. Urban Reforms Related to Sanitation and SWM
Major urban reform projects in the state that are linked to sanitation and solid waste
management are under the aegis of the Kerala Sustainable Urban Development
Project (KSUDP) and Kerala Solid Waste Management Project (KSWMP). The latter
is aided by the World Bank and the former is aided by the Asian Development Bank
(ADB) and Govt of India. KSUDP is an initiative to improve urban infrastructure
services in Kerala in a sustainable manner. It’s a Special Purpose Vehicle (SPV) to
implement multi-disciplinary projects envisaged under the LSGD. KSUDP was also
designated as the State Level Nodal Agency for the UIG163and
UIDSSMT164components of the Jawaharlal Nehru National Urban Renewal Mission
(JNNURM); a flagship programme of Government of India (LSGD, Govt of Kerala,
n.d.). The main objective of KSUDP was to increase the growth potential and reduce
poverty in 5 municipal corporations (Kochi, Kollam, Kozhikode, Trivandrum and
Thrissur). The expected outcome of the project was a better environment, stronger
economy and improved living conditions for the people This project was initiated in
2005 and was planned to be completed by 2011 but eventually was completed in
2016. The total estimated amount for this project from ADB was 316 million USD.
However, the actual cost of the project was eventually limited to 158 million USD.
The expenditure towards sewerage and sanitation was 22 %, urban drainage was 9 %
and solid waste management was 3 % The remaining expenditure as towards Land
acquisition and resettlement, Road and Transport and Water Supply (Asian
Development Bank, 2018).
KSWMP, with financial assistance from the World Bank, aims to strengthen the
institutional and service delivery systems for waste management services in urban
areas of Kerala (Kerala Solid Waste Management Project, 2020). This project is
managed by the Suchitwa Mission, which is currently the nodal agency in the state
for decentralised solid waste management. Through this project, the state
government intends to upgrade existing household/institution decentralized
treatment plants to scientific treatment plants based on bio-digestion, provide
necessary infrastructure (bins, collection vehicles) for primary collection, set up the
primary collection mechanism for untreated biodegradable waste, upgrade existing
material collection and recycling facilities and resource recovery facilities, scale up
163Urban Infrastructure and Governance: Meant for providing basic service to urban population, urban infrastructure development and reformation of urban governance system. 164Urban Infrastructure Development Scheme for Small and Medium Towns: Aims at improvement in urban infrastructure in towns and cities in a planned manner.

238
secondary collection infrastructure, set up regional treatment and disposal facilities
for solid, biomedical and construction and demolition (C&D) wastes and improve
existing dumpsites. The total cost of the project is estimated to be Rs. 3010 crores, in
which World Bank would fund Rs. 2100 crores and the remaining will be supported
by the central government. KSWMP is proposed as an Investment Project Financing
(IPF) operation for the period 2020 to 2025 which will cover all the ULBs in the state.
This project comprises of three components - 1) Institutional development, capacity
building and management support, 2) Grant support to ULBs and 3) development of
regional solid, C&D165 and Bio medical waste processing, recycling and disposal
facilities.
Apart from the above project, urban development schemes like the Atal Mission for
Rejuvenation & Urban Transformation (AMRUT), Smart Cities Mission (SCM) and
JNNURM are also functional in Kerala. Based on the latest data, 1008 projects have
been initiated in the state under the AMRUT scheme with a total estimated cost of
Rs. 2357.69 crores. Among these, 476 projects have been completed with an
expenditure of Rs. 837.5 crores which is 36 % of the total estimated cost (AMRUT
Kerala, n.d.). Of this, 140 projects under AMRUT are assigned to sewerage and
septage management with an estimated cost of Rs. 630 crores which is 27 % of the
total estimated cost and 498 projects on storm water drainage with an estimated cost
of Rs. 385 crores which is 16 % of total estimated cost. However, only 43 projects of
the former have been completed with an expenditure of Rs. 38.5 crores (6 %) and 323
projects of the latter have been completed with a cost of Rs. 178.29 crores (46 %).
Smart city is a Special Purpose Vehicle (SPV) setup for the implementation of smart
city mission of Govt. of India. There are two smart cities in Kerala - Kochi and
Trivandrum. The proposed investment on Kochi Smart City project is Rs. 2076 crores
of which Rs. 202 crores (10 %) is allocated for sewerage and septage, Rs. 7 crores (0.3
%) is allocated for sanitation and SWM, Rs. 41 crores (2 %) for canal restoration and
drain improvement. (Smart City Proposal). On the other hand, Trivandrum smart
city mission with 43 projects, the estimated project investment is Rs. 1538.2 crores in
which Rs. 26.57crores (2 %) is allocated for underground drainage network, Rs. 47.5
crores (3 %) allocated for storm water drains, Rs. 2.57 crores (0.2 %) allocated for
decentralised SWM and Rs. 1.41 crores (0.1 %) for upgradation of existing public
toilets. A majority share of the smart city mission funds in both Kochi and
Trivandrum have been allocated to housing, sustainable campuses, disaster
165C&D: Construction and Demolition Waste.

239
management, building markets and railway complex restoration. The various
sources of funds for SCM is central grants (32.5%), state grants (32.5%), central
schemes (16.9%), ULBs (8.8%) and PPP (9.3%).
A14.4. Sanitation and SWM: State Level Targets and Progress Made So
Far
In terms of achieving the targets with regard to the Sustainable Development Goals
(SDGs), Kerala retained its number one position in the country for the year 2019-20.
However, when it came to 2 particular SDGs related with urban sanitation - “Clean
water and sanitation” (SDG 6) and “Sustainable cities and communities” (SDG 11),
the performance of the state is not that impressive. Kerala is in 23rd position with
regard to SDG 6 and in 11th position with regard to SDG 11 (NITI Aayog). When we
further analyse these two SDG goals, the picture becomes clearer. Regarding the
installed sewage treatment capacity as a percentage of total sewage generated in
urban areas, Kerala was at a dismal 6 % in both 2018 and 2019 while the national
average was 38 % for both years. In Kerala, only 43 % of wards had door to door
waste collection in 2018 (national average was 74 %) which increased to 85 % in 2019
(national average was 91 %). With regard to waste processing, only 32 % of waste
produced in Kerala was processed in 2019 compared to the national average of 56 %.
Also, the number of urban households with an individual toilet is extremely less
(47.52%) when compared to the national average (97.2%). The state performance in
Sanitation and SWM related SDG goals are summarized in the below table.
Table A14. 1: Performance of Kerala State on Indicators of SDG 6, 11 and 12
Goal Indicator Kerala
2019
National
2019
Target
2030
6 Districts verified to be Open Defecation
Free (%) 100 91 100
6 Urban households with individual
household toilet (%) 47.52 97.2 100
11 Wards with 100% door to door waste
collection (%) 85.46 91 100
11 Waste processed (%) 32 56 100
11 Installed sewage treatment capacity as a
proportion of sewage generated in
urban areas
6 37.5 100
12 Municipal Solid Waste (MSW) treated
against MSW generated (%) 29.13 20.7 100

240
Goal Indicator Kerala
2019
National
2019
Target
2030
12 Wards with 100 % source segregation
(%) 95.53 67.6 100
Source: SDG India Index Baseline report, 2018 and SDG India Index & Dashboard, 2019-20
Table A14.2 shows the progress made across various sanitation related parameters
from both the NSSO 69th round data (2012) and the NSSO 76th round data (2018) of
urban households belonging to the state.
Table A14. 2: Progress Made Across Various Sanitation Related Parameters From 2012 to
2018
SI.
No Sanitation Parameter
NSSO 69th round
data – 2012 (Per
1000 distribution of
households) / (%)
NSSO 76th
round data
– 2018 (%)
NSSO 76th
round
National
Average (%)
1 Urban households having access
to some form of latrine facilities 988/ (98.8) 100 96.2
2 Urban households with
flush/pour-flush latrine connected
to a pipe sewer system
49 / (4.9) 1.1 39.1
3 Urban households with
flush/pour-flush latrine connected
to a septic tank
466 / (46.6) 37.7 48.9
4 Urban households connected to
underground drainage system Not Available 43.5 53.5
5 Urban households with no
drainage system 298 / (29.8) 17.5 8
6 Urban households disposing
waste water without treatment to –
drainage system, open low land
areas/streets, ponds and nearby
river/nalla
Not Available 50.5 92.4
Source: NSSO 69th and 76th round report
In the nationwide Swach Survekshan (SS) Survey, Kerala was in 19th position in 2018,
it slipped to 21st position in 2019 and eventually 27th position in2020. In 2020,
Alappuzha won the award for Best Small City in 'Innovation & Best Practices'.
Additionally, in SS 2020, with regard to the provisioning of SWM services, Kerala
was ranked 17th (for ULBs less than 1 lakh) and 18th (for ULBs greater than 1 lakh)
across all the large states.

241
A14.5. Manual Scavenging and Welfare of Sanitation Workers
The state of Kerala reported of not having a single manual scavenger during the
Manual Scavenging (MS) survey 2013. However, as per a survey conducted by the
National Safai Karamchari Finance and Development Corporation (NSKFDC) in
2018 the number of manual scavengers identified in the state was 600166. Kollam
district has the highest number of manual scavengers at 274, followed by Ernakulam
at 155, Alappuzha at 96, and Palakkad at 75167. According to the2018-19 annual report
of the National Commission for Safai Karamcharis (NCSK), the total number of
sewer deaths recorded in the state between 1993-2018 is only 3, and it was zero in the
year 2018-19 (NCSK, 2019).
By virtue of no manual scavengers being officially identified in the state, there were
no beneficiaries for the One Time Cash Assistance (OTCA) until 2018. However, in
2018, 504 beneficiaries were identified and again zero beneficiaries in 2019.
Similarly, the state did not sanction any trainings or skill development programs for
manual scavengers until 2018, when 161 manual scavengers were sanctioned for
trainings, but again in 2019, no trainings have been sanctioned (Ministry of Social
Justice and Empowerment, 2019).
A Kerala based start-up Genrobotics has developed a pneumatic semi-robotic device
called “Bandicoot” to clean sewers and manholes without any manual intervention.
It is stated to be the world’s first manhole cleaning robot with the aim of eliminating
manual scavenging, saving humans from manhole accidents and adding dignity to
human life. This manhole cleaning robot has already been leveraged by more than
six states in the country. In one of the early trials held in Thiruvananthapuram, the
robot could clean four different types of manholes with ease and it did not face any
problem to manoeuvre its way. (The Economic Times, 2018).
The Employment of Manual Scavengers and Construction of Dry Latrines
(Prohibition)Act, 1993 was not adopted by Kerala since it claimed non-existence of
dry toilets and manual scavengers. However, according to a survey in 2002-03,
Kerala still had 1,339 dry latrines (Department for International Development). It is
this non-acknowledgement that has led to the state hardly implementing any welfare
schemes or programmes to rehabilitate manual scavengers. With regard to sanitation
workers, according to the chairperson of NCSK, sanitation workers in Kerala have
166 NSKFDC 22nd Annual report 2018-19 167 These were the only4 districts surveyed.

242
the best wages and are at a better place socially when compared with sanitation
workers in other states (The Hindu, 2019).
A14.6. Urbanisation Challenges (Specific to Sanitation and SWM)
Even though Kerala achieved ODF status in 2016, there are certain areas of sanitation
and SWM which needs to improve. There aren’t many faecal sludge treatment plants
in the state. As a result, private tankers suck and collect sewage from septic tanks
and illegally dump this in nearby rivers and other water bodies. Also, the coverage
of piped sewer system is very less across the state. The existing centralised piped
sewerage system installed by the Kerala Water Authority (KWA) only covers Kochi
and Trivandrum. As per the 2011 census, almost 56.69 % of the urban households are
still connected to septic tanks. There are both technical and institutional dimensions
to the problem of septic tanks in the state of Kerala. The septic tanks design does not
comply with the national guidelines with reference to planning, design and
construction. Local masons are unaware of the existing design and construction
guidelines to construct and design the septic tanks. There are multiple agencies
involved in operation and maintenance of water and sanitation services in Kerala.
Septage management is viewed as private provision with limited role of urban local
bodies.
Regarding solid waste management, the state is in high need for access to scientific
waste management systems for Non Bio Degradable Waste (NBDW). There are 28
centralised systems to process Bio- Degradable waste which can only treat 10 % of
the total bio waste being produced in the state. Another major challenge is marine
plastic waste. Kerala has a 560 km long coastline, with an estimated 1057 tonnes of
plastic waste littering along the coastline (Suchitwa Mission, 2020). With major
urbanisation being largely confined to the coastal areas (Trivandrum, Kochi, Calicut,
etc), the management of marine waste requires immediate attention. According to
the integrated solid waste management strategy prepared by the state, one of the
major challenges with the existing system of waste management is inadequate
disposal sites complying to environmental regulations along with leachate
treatment/ gas collection facilities (Integrated Solid Waste Management Strategy,
2018).
Due to improper sanitation facilities, the state is frequently dealing with vector borne
disease outbreaks such as dengue and chickungunya. The main transmitters of these
diseases, mosquitoes, are the outcome of poor sanitation. In addition to this, floods
during monsoons, which is a recurrent sight in the state since the last 3 years is a

243
major challenge due to lack of proper storm water drains and rain water harvesting
systems. Stagnant rain water has led to cholera, typhoid, hepatitis and leptospirosis
(Live Mint, 2018).Due to poor SWM, illegal dumping of wastes from both
households and industries has led to the pollution of various water bodies in the
state. This in turn has had an impact on the availability of potable ground water.

244
Notes
245
Notes

246
Notes

247
Notes

248
Copyright © 2022 FDOKUMEN