An improved method on Wilcoxon rank sum test for gene selection from microarray experiments
16
This article was downloaded by: [McMaster University] On: 06 February 2013, At: 10:44 Publisher: Taylor & Francis Informa Ltd Registered in England and Wales Registered Number: 1072954 Registered office: Mortimer House, 37-41 Mortimer Street, London W1T 3JH, UK Communications in Statistics - Simulation and Computation Publication details, including instructions for authors and subscription information: http://www.tandfonline.com/loi/lssp20 An Improved Method on Wilcoxon Rank Sum Test for Gene Selection from Microarray Experiments Ahmed Hossain a b c , Andrew R. Willan a b & Joseph Beyene b c a Dalla Lana School of Public Health, University of Toronto, Toronto, ON, Canada b Biostatistics Methodology Unit, Program in Child Health Evaluative Sciences, SickKids Research Institute, Toronto, ON, Canada c Department of Clinical Epidemiology & Biostatistics, McMaster University, Hamilton, ON, Canada Version of record first published: 02 Jan 2013. To cite this article: Ahmed Hossain , Andrew R. Willan & Joseph Beyene (2013): An Improved Method on Wilcoxon Rank Sum Test for Gene Selection from Microarray Experiments, Communications in Statistics - Simulation and Computation, 42:7, 1563-1577 To link to this article: http://dx.doi.org/10.1080/03610918.2012.667479 PLEASE SCROLL DOWN FOR ARTICLE Full terms and conditions of use: http://www.tandfonline.com/page/terms-and-conditions This article may be used for research, teaching, and private study purposes. Any substantial or systematic reproduction, redistribution, reselling, loan, sub-licensing, systematic supply, or distribution in any form to anyone is expressly forbidden. The publisher does not give any warranty express or implied or make any representation that the contents will be complete or accurate or up to date. The accuracy of any instructions, formulae, and drug doses should be independently verified with primary sources. The publisher shall not be liable for any loss, actions, claims, proceedings, demand, or costs or damages whatsoever or howsoever caused arising directly or indirectly in connection with or arising out of the use of this material.
-
Upload
independent -
Category
Documents
-
view
0 -
download
0
Transcript of An improved method on Wilcoxon rank sum test for gene selection from microarray experiments

This article was downloaded by: [McMaster University]On: 06 February 2013, At: 10:44Publisher: Taylor & FrancisInforma Ltd Registered in England and Wales Registered Number: 1072954 Registeredoffice: Mortimer House, 37-41 Mortimer Street, London W1T 3JH, UK
Communications in Statistics - Simulationand ComputationPublication details, including instructions for authors andsubscription information:http://www.tandfonline.com/loi/lssp20
An Improved Method on WilcoxonRank Sum Test for Gene Selection fromMicroarray ExperimentsAhmed Hossain a b c , Andrew R. Willan a b & Joseph Beyene b ca Dalla Lana School of Public Health, University of Toronto, Toronto,ON, Canadab Biostatistics Methodology Unit, Program in Child Health EvaluativeSciences, SickKids Research Institute, Toronto, ON, Canadac Department of Clinical Epidemiology & Biostatistics, McMasterUniversity, Hamilton, ON, CanadaVersion of record first published: 02 Jan 2013.
To cite this article: Ahmed Hossain , Andrew R. Willan & Joseph Beyene (2013): An Improved Methodon Wilcoxon Rank Sum Test for Gene Selection from Microarray Experiments, Communications inStatistics - Simulation and Computation, 42:7, 1563-1577
To link to this article: http://dx.doi.org/10.1080/03610918.2012.667479
PLEASE SCROLL DOWN FOR ARTICLE
Full terms and conditions of use: http://www.tandfonline.com/page/terms-and-conditions
This article may be used for research, teaching, and private study purposes. Anysubstantial or systematic reproduction, redistribution, reselling, loan, sub-licensing,systematic supply, or distribution in any form to anyone is expressly forbidden.
The publisher does not give any warranty express or implied or make any representationthat the contents will be complete or accurate or up to date. The accuracy of anyinstructions, formulae, and drug doses should be independently verified with primarysources. The publisher shall not be liable for any loss, actions, claims, proceedings,demand, or costs or damages whatsoever or howsoever caused arising directly orindirectly in connection with or arising out of the use of this material.
Communications in Statistics—Simulation and Computation R©, 42: 1563–1577, 2013Copyright © Taylor & Francis Group, LLCISSN: 0361-0918 print / 1532-4141 onlineDOI: 10.1080/03610918.2012.667479
An Improved Method on Wilcoxon Rank Sum Testfor Gene Selection from Microarray Experiments
AHMED HOSSAIN,1,2,3 ANDREW R. WILLAN,1,2
AND JOSEPH BEYENE2,3
1Dalla Lana School of Public Health, University of Toronto, Toronto,ON, Canada2Biostatistics Methodology Unit, Program in Child Health Evaluative Sciences,SickKids Research Institute, Toronto, ON, Canada3Department of Clinical Epidemiology & Biostatistics, McMaster University,Hamilton, ON, Canada
Selecting a small subset out of the thousands of genes in microarray data is importantfor accurate classification of phenotypes. In this paper, we propose a flexible rank-basednonparametric procedure for gene selection from microarray data. In the method wepropose a statistic for testing whether area under receiver operating characteristiccurve (AUC) for each gene is equal to 0.5 allowing different variance for each gene.The contribution to this “single gene” statistic is the studentization of the empiricalAUC, which takes into account the variances associated with each gene in the exper-iment. Delong et al. proposed a nonparametric procedure for calculating a consistentvariance estimator of the AUC. We use their variance estimation technique to get a teststatistic, and we focus on the primary step in the gene selection process, namely, theranking of genes with respect to a statistical measure of differential expression. Two realdatasets are analyzed to illustrate the methods and a simulation study is carried out toassess the relative performance of different statistical gene ranking measures. The workincludes how to use the variance information to produce a list of significant targets andassess differential gene expressions under two conditions. The proposed method doesnot involve complicated formulas and does not require advanced programming skills.We conclude that the proposed methods offer useful analytical tools for identifyingdifferentially expressed genes for further biological and clinical analysis.
Keywords Microarray gene expression analysis; Receiver operating characteristiccurve; Wilcoxon rank sum test
Mathematics Subject Classification 62P10; 62G35.
1. Introduction
There are a variety of gene selection methods developed in the last few years. Among them,some methods assume explicit statistical models on the gene expression data, which arecalled parametric methods. Other methods do not assume any specific distribution model on
Received August 11, 2011; Accepted February 8, 2012Address correspondence to Joseph Beyene, Department of Clinical Epidemiology & Biostatis-
tics, McMaster University, Hamilton, ON, Canada; E-mail: [email protected] or Ahmed HossainE-mail: [email protected].
1563
Dow
nloa
ded
by [
McM
aste
r U
nive
rsity
] at
10:
44 0
6 Fe
brua
ry 2
013
1564 Hossain et al.
the gene expression data and they are referred to as nonparametric gene selection methods.For example, Pepe et al. (2003) proposed two measures related to the receiver operatingcharacteristic (ROC) curve for ranking genes (or proteins) in regard to differential expres-sion between tissues: area under ROC curve (AUC) and partial AUC(t0) (i.e., pAUC), wheret0 is some small false-positive rate. Ding et al. (2008) proposed a gene selection proce-dure that can target at finding other genes whose expression patterns correlate significantlywith the gene of known biological significance. Xiong et al. (2001) suggested a method toselect genes through the space of feature subsets using classification errors. Jeffery et al.(2006) compared the efficiency of 10 gene selection methods including both parametricand nonparametric methods. It has been reported that the results of nonparametric geneselection methods may be influenced by the classification methods chosen for scoring thegenes (Troyanskaya et al. 2002). Nonetheless, model-based gene selection methods lackadaptability, because it is often impossible to construct a universal probabilistic analysismodel that is suitable for all kinds of gene expression data, where noise and variance mayvary dramatically across different gene expression data (Troyanskaya et al. 2002). In thissense, nonparametric gene selection methods are more desirable than model-based ones.
An assessment of the expression of a gene can be made through the use of an ROCcurve. If a gene could perfectly discriminate between two conditions, then there will bean expression level that the entire treatment population would fall above and all controlexpressions would fall bellow or vise versa. The curve would then pass through the point(0,1) on the unit grid. The closer an ROC curve comes to this ideal point, the betterits discriminating ability. A gene with no discriminating ability will produce a curvethat follows the diagonal of the grid. Recently, Li and Fine (2010) proposed a flexibleweight function for AUC for gene selection and the weight in the weighted AUC (WAUC)corresponds to the probability distribution of the threshold. The WAUC may be interpretedas the weighted average of sensitivity with weight emphasizing the specificity of interest.The parametric and nonparametric inference is shown according to the estimation of theROC and the density of specificity, which is considered from a parametric distribution onthe range [0,1].
For continuous data, the nonparametric ROC curve may be preferred since it passesthrough all observed points and provides unbiased estimates of sensitivity, specificity, andAUC in large samples (Zweig and Campbell 1993). More importantly, the nonparametricapproach does not require that data be fitted to any particular model. If the distributions ofscores for true-positive and true-negative test subjects are far from Gaussian, the parametricAUC and its corresponding standard error (SE) derived from a directly fitted binormalmodel may be distorted (Godard and Hinberg 1990). Convergence may also be an issuewith expression data since presence of extreme values (EVs) are common in such data. Forthese reasons, as well as its relative simplicity and ease of use, the nonparametric approachcontinues to be popular among many researchers. Here, we propose a new gene selectionmethod that does not assume any explicit statistical model on the gene expression values.
2. Motivation
The motivation of this paper comes from two published papers containing nonparametricapproaches for identifying differentially expressed genes. Pepe et al. (2003) proposed twomeasures related to the ROC curve for ranking genes (or proteins) in regard to differentialexpression between tissues: AUC and partial AUC(t0) (i.e., pAUC), where t0 is some smallfalse-positive rate. The nonparametric AUC is equal to the numerator of the Mann–Whitney
Dow
nloa
ded
by [
McM
aste
r U
nive
rsity
] at
10:
44 0
6 Fe
brua
ry 2
013
Gene Selection from Microarray Experiments 1565
−200 0 200 400 600
0.00
00.
002
0.00
40.
006
U97502_rna1_at
−200 0 200 400 600 800
0.00
00.
002
0.00
40.
006
D14874_at
−1000 −600 −200 0 200
0.00
00.
002
0.00
40.
006
U82970_at
−200 0 200 400 600 800
0.00
00.
004
0.00
8
X93512_at
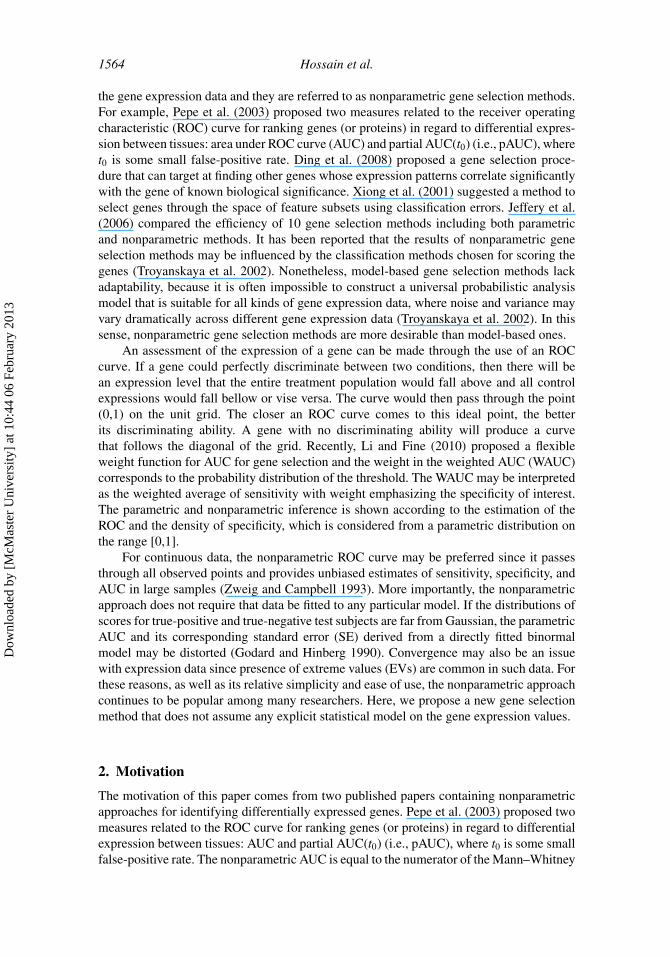
Figure 1. Density plots of four genes from leukemia dataset: solid line AML and dashed line ALL.(Color figure available online).
U-statistic and hence equivalent to the Wilcoxon rank sum test (RST). pAUC is not arecommended method for small sample size (Jeffery et al. 2006). Troyanskaya et al. (2002)compared three model-free approaches and assessed their performances under varyingnoise levels. The three model-free approaches were (1) nonparametric t-test, (2) RST, and(3) a heuristic method based on high Pearson correlation to a perfectly differentiating gene(“ideal discriminator method”). The RST is used as an alternative to the t-test to avoid theparametric assumptions.
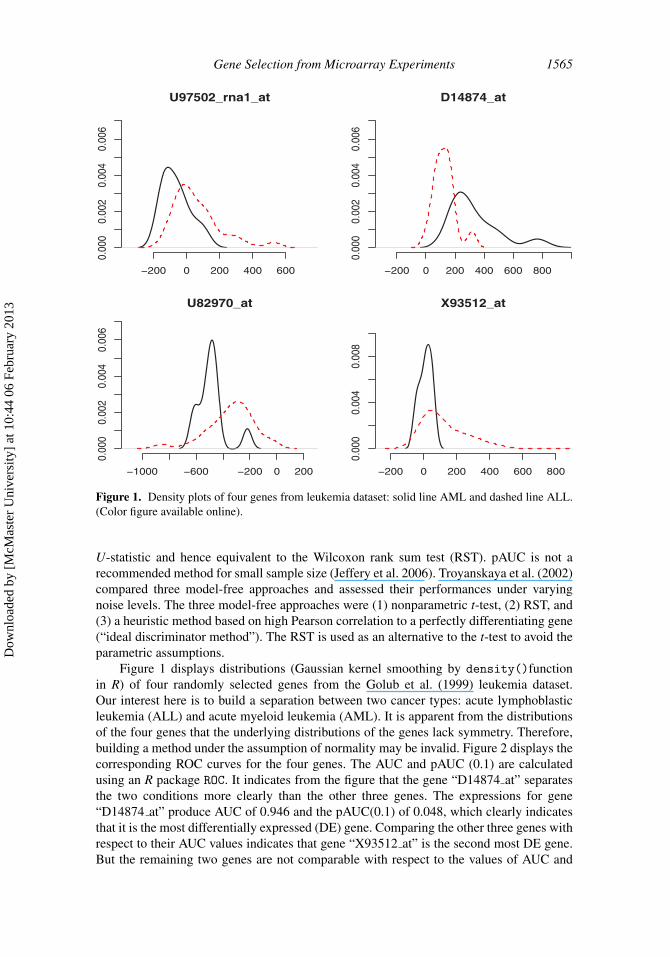
Figure 1 displays distributions (Gaussian kernel smoothing by density()functionin R) of four randomly selected genes from the Golub et al. (1999) leukemia dataset.Our interest here is to build a separation between two cancer types: acute lymphoblasticleukemia (ALL) and acute myeloid leukemia (AML). It is apparent from the distributionsof the four genes that the underlying distributions of the genes lack symmetry. Therefore,building a method under the assumption of normality may be invalid. Figure 2 displays thecorresponding ROC curves for the four genes. The AUC and pAUC (0.1) are calculatedusing an R package ROC. It indicates from the figure that the gene “D14874 at” separatesthe two conditions more clearly than the other three genes. The expressions for gene“D14874 at” produce AUC of 0.946 and the pAUC(0.1) of 0.048, which clearly indicatesthat it is the most differentially expressed (DE) gene. Comparing the other three genes withrespect to their AUC values indicates that gene “X93512 at” is the second most DE gene.But the remaining two genes are not comparable with respect to the values of AUC and
Dow
nloa
ded
by [
McM
aste
r U
nive
rsity
] at
10:
44 0
6 Fe
brua
ry 2
013
1566 Hossain et al.
0.0 0.2 0.4 0.6 0.8 1.0
0.0
0.2
0.4
0.6
0.8
1.0
1−specificity
sens
itivi
ty
U97502_rna1_at (A=0.785, pA=0.0273)D14874_at (A=0.946, pA=0.048)U82970_at (A=0.785, pA=0.0273)X93512_at (A=0.805, pA=0.0559)
Figure 2. ROC curves of four randomly selected genes from leukemia dataset. (Color figure availableonline).
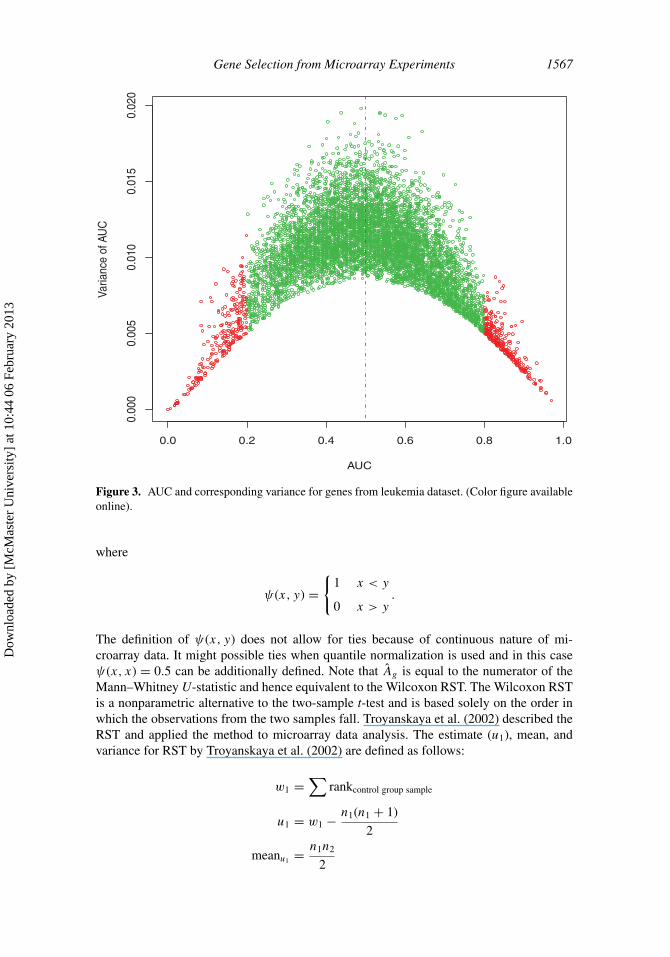
pAUC because they have equal values of AUC and pAUC. One of the features of the pAUCand AUC (or RST) is that they do not account for gene-specific variability of the expressionvalues. To improve this scenario in microarray analysis, we suggest a statistic that can takegene-specific variances under the two conditions. Figure 3 shows the estimate of AUCsand their corresponding variances for each gene from Golub et al. leukemia dataset. Theestimation procedure is given in the next section. We can see from the figure that the geneswith AUC values close to 0.5 have higher variances and the genes with AUC values close to0 or 1 are having lower variances. Therefore, it is important to take gene-specific variancesinto account into the test statistic for testing the equal expression for the two conditions.
3. Materials and Methods
3.1. Single Gene Analysis: AUC
For simplicity, it is assumed that higher values on the expression are associated withtreatment group. Let {xig}n1
i=1 and {yjg}n2j=1 denote expression values for the n1 control and
n2 treatment subjects for the gth (g = 1, · · · ,m) gene. An unbiased estimator of AUC forthe gth gene (Ag) is given by
Ag =∑n1
i=1
∑n2j=1 ψ(xig, yjg)
n1n2= ψ..,
Dow
nloa
ded
by [
McM
aste
r U
nive
rsity
] at
10:
44 0
6 Fe
brua
ry 2
013
Gene Selection from Microarray Experiments 1567
0.0 0.2 0.4 0.6 0.8 1.0
0.00
00.
005
0.01
00.
015
0.02
0
AUC
Varia
nce
of A
UC
Figure 3. AUC and corresponding variance for genes from leukemia dataset. (Color figure availableonline).
where
ψ(x, y) ={
1 x < y
0 x > y.
The definition of ψ(x, y) does not allow for ties because of continuous nature of mi-croarray data. It might possible ties when quantile normalization is used and in this caseψ(x, x) = 0.5 can be additionally defined. Note that Ag is equal to the numerator of theMann–Whitney U-statistic and hence equivalent to the Wilcoxon RST. The Wilcoxon RSTis a nonparametric alternative to the two-sample t-test and is based solely on the order inwhich the observations from the two samples fall. Troyanskaya et al. (2002) described theRST and applied the method to microarray data analysis. The estimate (u1), mean, andvariance for RST by Troyanskaya et al. (2002) are defined as follows:
w1 =∑
rankcontrol group sample
u1 = w1 − n1(n1 + 1)
2
meanu1 = n1n2
2
Dow
nloa
ded
by [
McM
aste
r U
nive
rsity
] at
10:
44 0
6 Fe
brua
ry 2
013
1568 Hossain et al.
varianceu1 = n1n2(n1 + n2 + 1)
12.
It is apparent that the mean and variance for the u1-statistic are constant depending on thesizes of both the groups and therefore do not take gene-specific variability into account.
The AUC can be used as an alternative to a t-test when the data are not normallydistributed. The AUC index reflects the inherent discriminative ability of a diagnosticprocedure and has a nice interpretation as the probability of correct discrimination betweentreatment and control groups. The estimator Ag is approximately normally distributed underquite general assumptions (Hoeffding 1948). Hence, knowing the variance of the estimatoris essential for constructing a test statistic for testing the hypothesis H0 : Ag = 0.5 againstthe alternativeH1 : Ag �= 0.5.AnAg value of 0.5 represents no predictive or discriminativeability. In gene expression studies there is rarely any a priori knowledge of whether a geneis overexpressed or underexpressed in the treatment condition and so two-sided tests arerecommended.
Several methods (DeLong et al. 1988; Dorfman et al. 1992; Efron and Tibshirani1993; Hanley and McNeil 1983) proposed for computing the variances and covariance ofnonparametric AUC estimates derived from the same sample of cases. These may be used tofacilitate statistical tests of AUC differences between measures. The consistent, completelynonparametric estimators of the covariance matrix for AUC estimators were developedby DeLong et al. (1988). The conventional variance estimator proposed by DeLong et al.(1988) can also be shown to be equivalent to the two-sample jackknife estimator (Arvesen1969) of the variance. Because of the structure of the nonparametric estimator of AUC, itsvariance estimator is easy to compute, that is,
1. Compute the treatment and control group components:
ψi. = 1
n2
n2∑j=1
ψ(xi, yj ) ψ.j = 1
n1
n1∑i=1
ψ(xi, yj ).
2. Calculate
s10 = 1
n1 − 1
n1∑i=1
[ψi. − ψ..]2, s01 = 1
n2 − 1
n2∑j=1
[ψ.j − ψ..]2.
3. The consistent estimator of the variance for the gth gene is
V (Ag) = s10
n1+ s01
n2.
Now for testing the hypothesis H0 : Ag = 0.5, the test statistics becomes,
Zg = Ag − 0.5
SE(Ag),
which is approximately standard normally distributed. We can rank gene according to thevalues of Zg .
However, when there are only a small number of arrays in each group, the estimates ofSEs for each gene can be unstable. Some genes might by chance have very small SEs, andtherefore appear highly significant. If the discrimination between the two conditions happen
Dow
nloa
ded
by [
McM
aste
r U
nive
rsity
] at
10:
44 0
6 Fe
brua
ry 2
013

Gene Selection from Microarray Experiments 1569
perfectly by the gene, that is, Ag is 1, then SE(Ag) becomes 0, which makes the Zg-statisticarbitrarily large. To address this problem, we smooth the variance estimates by borrowinginformation from the ensemble of genes. This can assist in inference about each geneindividually. This technique of smoothing variances is not new in microarray studies. Forexample, Tusher et al. (2001), Efron et al. (2001), and Broberg (2003) used t-statistics wherean offset was added to the standard deviation, while Smyth (2004) proposed a t-statisticwith a Bayesian adjustment to the denominator. We took the offset s0 as the quantile of thegenewise SEs, which minimizes the coefficient of variation of the Zg-statistic. Therefore,we can calculate the dg-statistic to test for treatment effect:
dg = Ag − 0.5
SE(Ag) + s0.
Similar adjustments for computing a test statistic were also used by Garrett et al. (2004)and Hu et al. (2006).
3.2. FDR Estimation with dg-Statistic
In the application, false discovery rate (FDR) is estimated using permutation and thresh-olding the test statistics. Alternative estimation methods using p-values can also be applied.We can use the following permutation algorithm to select significant genes and estimateFDR:
1. For the original data, calculate the dg-statistics and denote their ordered values as
d(g).
2. For the bth permutation, calculate the dg-statistic and denote their ordered valuesas
db(g); b = 1, . . . , B.
Denote their averages across all permutations as
d(g) = 1
B
B∑b= 1
db(g).
3. For a cutoff value �, identify the following genes as significant
| d(g) − d(g) |≥ �.
Denote
d0 = maxd(g) ≤ d(g) −�d(g), and d1 = mind(g) ≥ d(g) +�d(g),
and estimate the expected number of false positives by chance for the dg-statisticas following:
V (�) =B∑b=1
∑g I
{db(g) ≥ d1
} + I{db(g) ≤ d0
}B
,
Dow
nloa
ded
by [
McM
aste
r U
nive
rsity
] at
10:
44 0
6 Fe
brua
ry 2
013
1570 Hossain et al.
where I {·} is the indicator function, and the estimated FDR is
ˆFDR(�) = V (�)
R(�),
where
R(�) =∑g
I {| d(g) − d(g) |≥ �}
is the total number of significant genes. We can similarly calculate the expectednumber of false positives and FDR for the significance analysis of microarray(SAM), t, AUC, and pAUC statistics.
4. Results
In this section, we evaluate the performance of our methods using simulated data as wellas three published datasets.
4.1. Simulation
We implemented and evaluated four methods for identifying differentially expressed genes:SAM, RST, t-statistic, and dg-statistic. The performance of our proposed methods is evalu-ated using simulated data generated from two distributions incorporating variability, treat-ment effect, and sample size effect. We consider the scenarios having two conditions:treatment versus control, and sample sizes of 10 and 40 per condition. We generated datafrom 5,000 genes and set that the 2% of the genes are DE. We consider equal sample sizesfor each scenario. The following simulation scenarios are considered here:
Sim1: Sim1 simulates normal data with gene-specific variances from a standard exponentialdistribution. We consider fixed effect size (D) as 1 and effects are added to the secondgroup.
Sim2: Sim2 generates data from the EV distribution. That is, expressions for a gene aregenerated from EVm(0, b′). We consider scale parameters as b′ = 2 in the simulation toallow EVs at the right side of the distribution. The treatment effect (D) is as describedfor previous scenario.
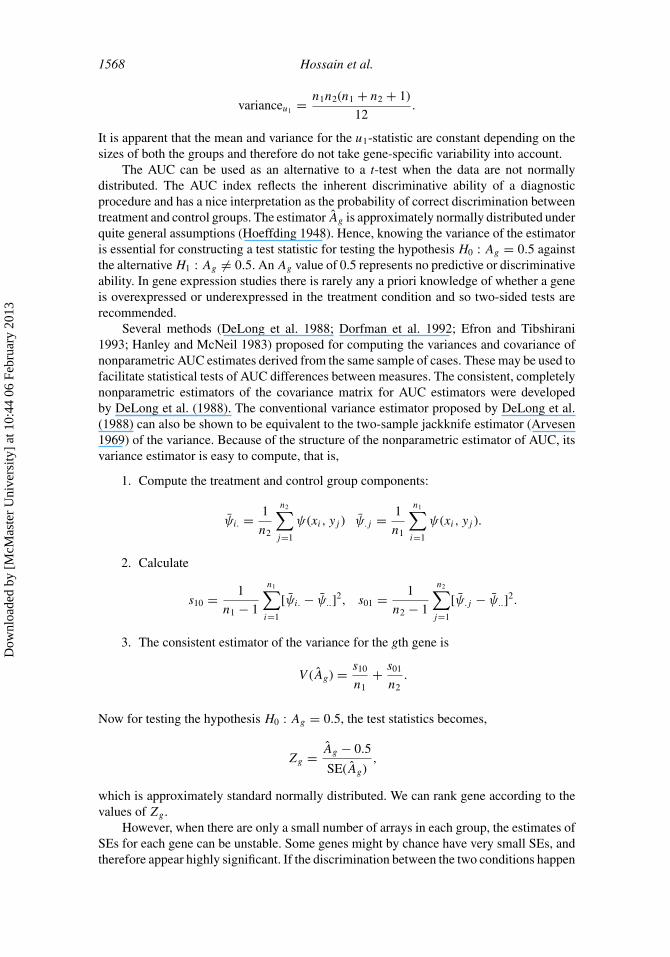
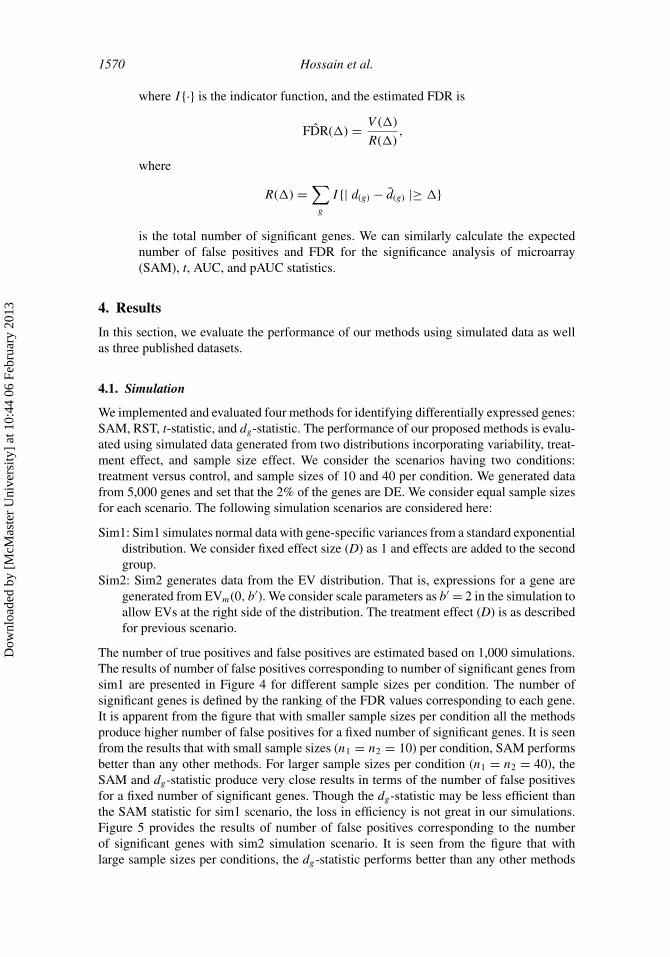
The number of true positives and false positives are estimated based on 1,000 simulations.The results of number of false positives corresponding to number of significant genes fromsim1 are presented in Figure 4 for different sample sizes per condition. The number ofsignificant genes is defined by the ranking of the FDR values corresponding to each gene.It is apparent from the figure that with smaller sample sizes per condition all the methodsproduce higher number of false positives for a fixed number of significant genes. It is seenfrom the results that with small sample sizes (n1 = n2 = 10) per condition, SAM performsbetter than any other methods. For larger sample sizes per condition (n1 = n2 = 40), theSAM and dg-statistic produce very close results in terms of the number of false positivesfor a fixed number of significant genes. Though the dg-statistic may be less efficient thanthe SAM statistic for sim1 scenario, the loss in efficiency is not great in our simulations.Figure 5 provides the results of number of false positives corresponding to the numberof significant genes with sim2 simulation scenario. It is seen from the figure that withlarge sample sizes per conditions, the dg-statistic performs better than any other methods
Dow
nloa
ded
by [
McM
aste
r U
nive
rsity
] at
10:
44 0
6 Fe
brua
ry 2
013
Gene Selection from Microarray Experiments 1571
20 40 60 80 100
010
2030
40
Number of Significant Genes
Numb
er of
False
Posit
ives
n1=n2=10
tRSTSAMdg
20 40 60 80 100
05
1015
20Number of Significant Genes
Numb
er of
False
Posit
ives
n1=n2=40
tRSTSAMdg
Figure 4. Comparison of t, RST, SAM, and dg-statistics at Sim1 scenario. (Color figure availableonline).
while the t-statistics are worse than the others. Therefore, the performance of dg-statisticincreases with larger sample sizes and with the presence of contamination in the data. It isalso noticed from the figures that the dg-statistic improves over RST at every scenario ofsimulations.
20 40 60 80 100
010
2030
40
Number of Significant Genes
Numb
er of
False
Posit
ives
n1=n2=10
tRSTSAMdg
20 40 60 80 100
05
1015
20
Number of Significant Genes
Numb
er of
False
Posit
ives
n1=n2=40
tRSTSAMdg
Figure 5. Comparison of t, RST, SAM, and dg-statistics at Sim2 scenario. (Color figure availableonline).
Dow
nloa
ded
by [
McM
aste
r U
nive
rsity
] at
10:
44 0
6 Fe
brua
ry 2
013
1572 Hossain et al.
4.2. Applications
A detailed evaluation of gene selection methods on real biological data is challenging dueto the difficulty of defining a gold standard. Here, we have evaluated and applied all themethods to two publicly available datasets.
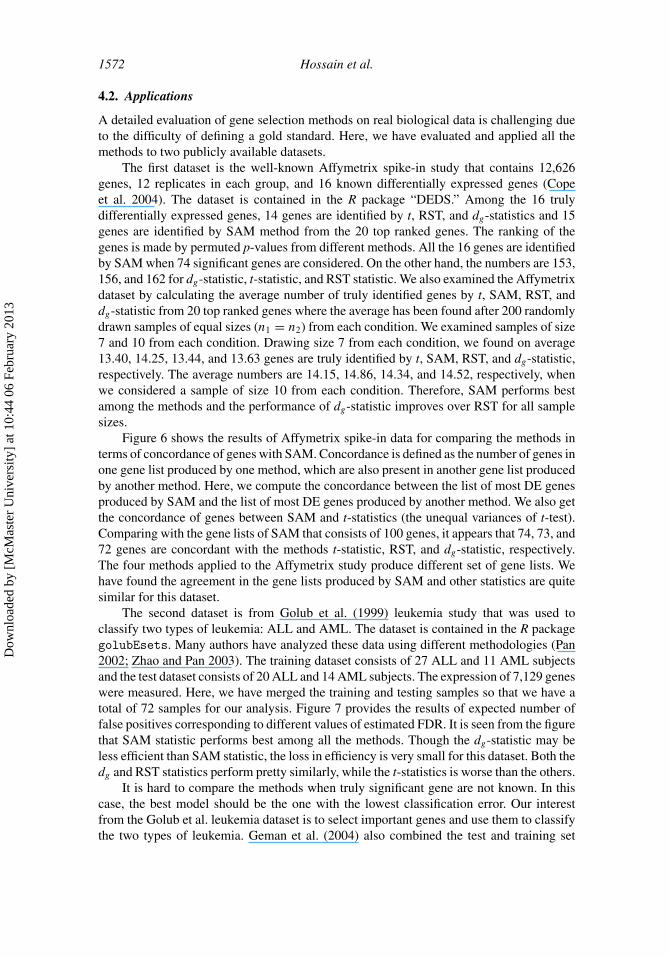
The first dataset is the well-known Affymetrix spike-in study that contains 12,626genes, 12 replicates in each group, and 16 known differentially expressed genes (Copeet al. 2004). The dataset is contained in the R package “DEDS.” Among the 16 trulydifferentially expressed genes, 14 genes are identified by t, RST, and dg-statistics and 15genes are identified by SAM method from the 20 top ranked genes. The ranking of thegenes is made by permuted p-values from different methods. All the 16 genes are identifiedby SAM when 74 significant genes are considered. On the other hand, the numbers are 153,156, and 162 for dg-statistic, t-statistic, and RST statistic. We also examined the Affymetrixdataset by calculating the average number of truly identified genes by t, SAM, RST, anddg-statistic from 20 top ranked genes where the average has been found after 200 randomlydrawn samples of equal sizes (n1 = n2) from each condition. We examined samples of size7 and 10 from each condition. Drawing size 7 from each condition, we found on average13.40, 14.25, 13.44, and 13.63 genes are truly identified by t, SAM, RST, and dg-statistic,respectively. The average numbers are 14.15, 14.86, 14.34, and 14.52, respectively, whenwe considered a sample of size 10 from each condition. Therefore, SAM performs bestamong the methods and the performance of dg-statistic improves over RST for all samplesizes.
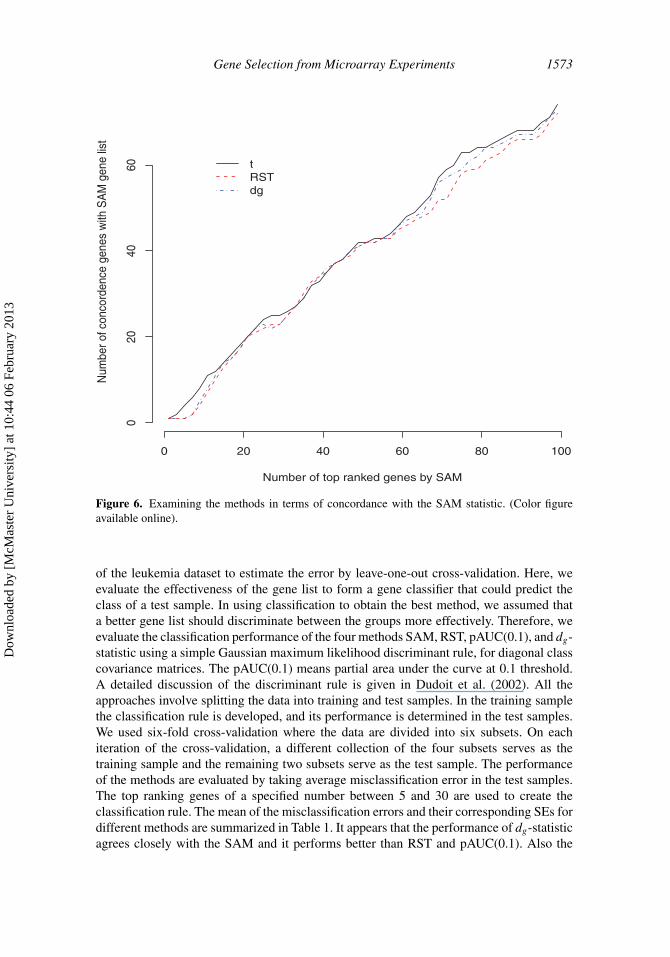
Figure 6 shows the results of Affymetrix spike-in data for comparing the methods interms of concordance of genes with SAM. Concordance is defined as the number of genes inone gene list produced by one method, which are also present in another gene list producedby another method. Here, we compute the concordance between the list of most DE genesproduced by SAM and the list of most DE genes produced by another method. We also getthe concordance of genes between SAM and t-statistics (the unequal variances of t-test).Comparing with the gene lists of SAM that consists of 100 genes, it appears that 74, 73, and72 genes are concordant with the methods t-statistic, RST, and dg-statistic, respectively.The four methods applied to the Affymetrix study produce different set of gene lists. Wehave found the agreement in the gene lists produced by SAM and other statistics are quitesimilar for this dataset.
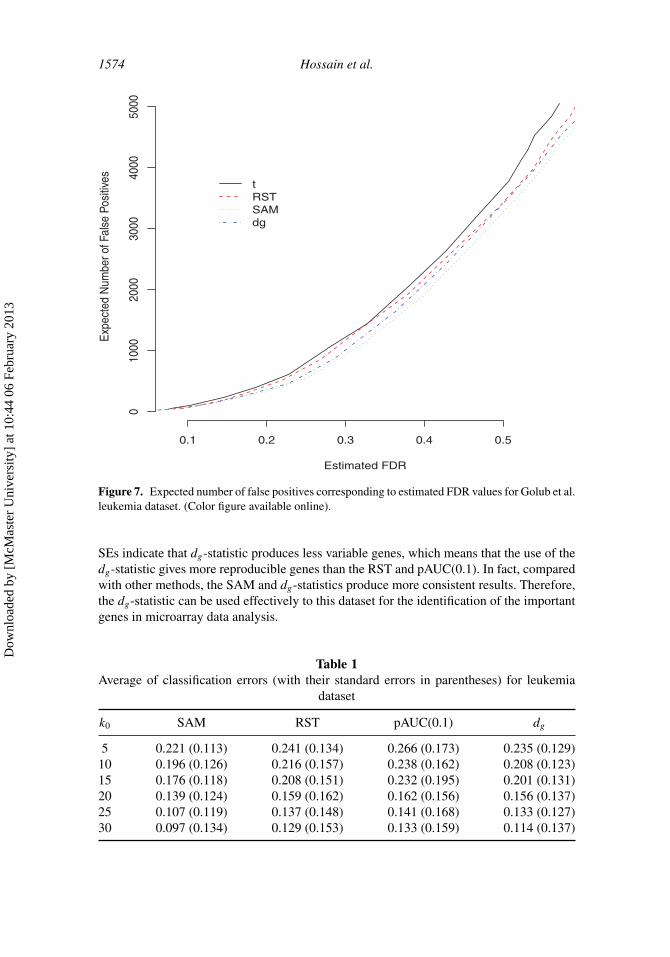
The second dataset is from Golub et al. (1999) leukemia study that was used toclassify two types of leukemia: ALL and AML. The dataset is contained in the R packagegolubEsets. Many authors have analyzed these data using different methodologies (Pan2002; Zhao and Pan 2003). The training dataset consists of 27 ALL and 11 AML subjectsand the test dataset consists of 20 ALL and 14 AML subjects. The expression of 7,129 geneswere measured. Here, we have merged the training and testing samples so that we have atotal of 72 samples for our analysis. Figure 7 provides the results of expected number offalse positives corresponding to different values of estimated FDR. It is seen from the figurethat SAM statistic performs best among all the methods. Though the dg-statistic may beless efficient than SAM statistic, the loss in efficiency is very small for this dataset. Both thedg and RST statistics perform pretty similarly, while the t-statistics is worse than the others.
It is hard to compare the methods when truly significant gene are not known. In thiscase, the best model should be the one with the lowest classification error. Our interestfrom the Golub et al. leukemia dataset is to select important genes and use them to classifythe two types of leukemia. Geman et al. (2004) also combined the test and training set
Dow
nloa
ded
by [
McM
aste
r U
nive
rsity
] at
10:
44 0
6 Fe
brua
ry 2
013
Gene Selection from Microarray Experiments 1573
0 20 40 60 80 100
020
4060
Number of top ranked genes by SAM
Num
ber o
f con
cord
ence
gen
es w
ith S
AM
gen
e lis
t
tRSTdg
Figure 6. Examining the methods in terms of concordance with the SAM statistic. (Color figureavailable online).
of the leukemia dataset to estimate the error by leave-one-out cross-validation. Here, weevaluate the effectiveness of the gene list to form a gene classifier that could predict theclass of a test sample. In using classification to obtain the best method, we assumed thata better gene list should discriminate between the groups more effectively. Therefore, weevaluate the classification performance of the four methods SAM, RST, pAUC(0.1), and dg-statistic using a simple Gaussian maximum likelihood discriminant rule, for diagonal classcovariance matrices. The pAUC(0.1) means partial area under the curve at 0.1 threshold.A detailed discussion of the discriminant rule is given in Dudoit et al. (2002). All theapproaches involve splitting the data into training and test samples. In the training samplethe classification rule is developed, and its performance is determined in the test samples.We used six-fold cross-validation where the data are divided into six subsets. On eachiteration of the cross-validation, a different collection of the four subsets serves as thetraining sample and the remaining two subsets serve as the test sample. The performanceof the methods are evaluated by taking average misclassification error in the test samples.The top ranking genes of a specified number between 5 and 30 are used to create theclassification rule. The mean of the misclassification errors and their corresponding SEs fordifferent methods are summarized in Table 1. It appears that the performance of dg-statisticagrees closely with the SAM and it performs better than RST and pAUC(0.1). Also the
Dow
nloa
ded
by [
McM
aste
r U
nive
rsity
] at
10:
44 0
6 Fe
brua
ry 2
013
1574 Hossain et al.
0.1 0.2 0.3 0.4 0.5
010
0020
0030
0040
0050
00
Estimated FDR
Exp
ecte
d N
umbe
r of F
alse
Pos
itive
s
tRSTSAMdg
Figure 7. Expected number of false positives corresponding to estimated FDR values for Golub et al.leukemia dataset. (Color figure available online).
SEs indicate that dg-statistic produces less variable genes, which means that the use of thedg-statistic gives more reproducible genes than the RST and pAUC(0.1). In fact, comparedwith other methods, the SAM and dg-statistics produce more consistent results. Therefore,the dg-statistic can be used effectively to this dataset for the identification of the importantgenes in microarray data analysis.
Table 1Average of classification errors (with their standard errors in parentheses) for leukemia
dataset
k0 SAM RST pAUC(0.1) dg
5 0.221 (0.113) 0.241 (0.134) 0.266 (0.173) 0.235 (0.129)10 0.196 (0.126) 0.216 (0.157) 0.238 (0.162) 0.208 (0.123)15 0.176 (0.118) 0.208 (0.151) 0.232 (0.195) 0.201 (0.131)20 0.139 (0.124) 0.159 (0.162) 0.162 (0.156) 0.156 (0.137)25 0.107 (0.119) 0.137 (0.148) 0.141 (0.168) 0.133 (0.127)30 0.097 (0.134) 0.129 (0.153) 0.133 (0.159) 0.114 (0.137)
Dow
nloa
ded
by [
McM
aste
r U
nive
rsity
] at
10:
44 0
6 Fe
brua
ry 2
013
Gene Selection from Microarray Experiments 1575
5. Discussion and Conclusion
One aspect of microarray studies is to provide a list of differentially expressed genes in agiven experimental systems. To provide this, we have proposed a nonparametric rank-basedapproach for ranking genes. We presented a dg-statistic that performs as a modified form ofRST on the data, that takes into account the gene-specific variance information to producea list of significant targets and assess differential gene expressions. The proposed methodperforms extremely well in ideal situations. For large sample sizes (40 per condition)and data contaminated with noise, the dg-statistic gives better results by determining lessfalse-positive genes (or more true positive) compared with the other methods.
Previous studies suggest that using rank-transformed data in microarray analysis isadvantageous (Raychaudhuri et al. 2000; Tsodikov et al. 2002). Theory predicts that rank-based methods will be optimal in extremely noisy data. Heteroscedasticity is common ingene expression data (Craig et al. 2003; Pepe et al. 2003; Thomas et al. 2001). The presenceof outliers is very common in microarray data, which may result in different variances inthe two experimental conditions. The current study shows that when variances are different,the tests, in particular the dg-statistic, are useful to test for differences between the twoconditions. In comparing RST and dg-statistic, the version of the dg-statistic that allowsdifferent variance for each gene is likely to give more reliable results in microarray geneexpression analysis.
With large subjects from each condition, it can be difficult to identify from the dataalone the underlying distribution. In such cases, the application of domain knowledge andgood judgment about the nature of the distribution is required. In these circumstances,we recommend to the dg-statistic. Another instances where we recommend our methodsis when the gene-specific variances are different. Also, the use of the dg-statistic is notcomputationally intensive. The proposed statistical approach does not always outperformall the other methods, they are always comparable and sometimes superior.
In the analysis of real microarray data, there is no correct answer as to which methodor which statistic should be used, as the choice of statistic can dramatically affect the setof genes that is selected. A researcher should choose the measure of differential expressionbased on the biological system of interest. If changes in expression relative to the underlyingnoise are important with large samples, then our method is preferable since it provides usefuland robust analytical tools for gene selection with minimum requirements about the under-lying features of the datasets of interest than most existing methods in microarray literature.
Acknowledgments
Ahmed Hossain acknowledges Research Training fellowship funding from the Hospital forSick Children. Andrew R. Willan is funded through the Discovery Grant Program of theNatural Sciences and Engineering Research Council of Canada (grant number 44868-08).Joseph Beyene would like to acknowledge funding from the Natural Sciences and Engi-neering Research Council of Canada (NSERC) and Canadian Institutes of Health Research(CIHR) (grant number 84392). We are grateful to David Tritchler, Laurent Briollais andAngelo Canty for many helpful comments and suggestions. We would also like to thank twoanonymous reviewers whose comments were very helpful and improved our manuscript.
References
Arvesen, J. N. (1969). Jackknifing U-statistics. Annals of Mathematical Statistics 40(6):2076–2100.Broberg, P. (2003). Statistical methods for ranking differentially expressed genes. Genome Biology
4:41:1–9.
Dow
nloa
ded
by [
McM
aste
r U
nive
rsity
] at
10:
44 0
6 Fe
brua
ry 2
013

1576 Hossain et al.
Cope, L. M., Irizarray, R. A., Jaffee, H., Wu, Z., Speed, T. P. (2004). A benchmark for AffymetrixGeneChip expression measures. Bioinformatics 20:323–331.
Craig, B. A., Black, M. A., Doerge, R. W. (2003). Gene expression data: the technology and statisticalanalysis. Journal of Agricultural, Biological, and Environmental Statistics 8:1–28.
DeLong, E. R., DeLong, D. M., Clarke-Pearson, D. L. (1988). Comparing the area under two ormore correlated receiver operating characteristic curves: A nonparametric approach. Biometrics44(3):837–845.
Ding, A. A., Lin, J., Niu, T. (2008). A statistical procedure for detecting highly correlated genes witha pre-specified candidate gene in microarray analysis. Communications in Statistics -Theory andMethods 37(18):2991–3007.
Dorfman, D., Berbaum, K., Metz, C. (1992). Receiver operating characteristic rating analysis: Gen-eralization to the population of readers and patients with the jackknife method. InvestigativeRadiology 27:723–731.
Dudoit, S., Fridlyand, J., Speed, T. P. (2002). Comparison of discrimination methods for the classi-fication of tumors using gene expression data. Journal of the American Statistical Association97(457):77–87.
Efron, B., Tibshirani, R. (1993). An Introduction to the Bootstrap. New York: Chapman and Hall.Efron, B., Tibshirani, R., Storey, J., Tusher, V. (2001). Empirical Bayes analysis of a microarray
experiment. Journal of the American Statistical Association 96:1151–1160.Garrett-Mayer, E., Parmigiani, G., Zhong, X., Cope, L., Gabrielson, E. (2004). Cross-study validation
and combined analysis of gene expression microarray data. Technical Report, Department ofBiostatistics, Johns Hopkins University. Biostatistics 9(2):333–54.
Geman, D., d’Avignon, C., Naiman, D. Q., Winslow, R. L. (2004). Classifying gene expressionprofiles from pairwise mRNA comparisons. Statistical Applications in Genetics and MolecularBiology 3(1):1–9.
Goddard, M. J., Hinberg, I. (1990). Receiver operating characteristic (ROC) curves and non-normaldata: An empirical study. Statistics in Medicine 9:325–337.
Golub, T. R., Slonim, D. K., Tamayo, P., Huard, C., Gaasenbeek, M., Mesirov, J. P., Coller, H., Loh,M. L., Downing, J. R., Caligiuri, M. A., Bloomfield, C. D., Lander, E. S. (1999). Molecularclassification of cancer: Class discovery and class prediction by gene expression monitoring.Science 286:531–537.
Hanley, J., McNeil, B. (1983). A method for comparing the areas under receiver operating character-istic curves derived from the same cases. Radiology 148:839–843.
Hoeffding, W. (1948). A class of statistics with asymptotically normal distribution. Annals of Math-ematical Statistics 19(3):293–325.
Hu, P., Beyene, J., Greenwood, C. M. T. (2006). Tests for differential gene expression using weightsin oligonucleotide microarray experiments. BMC Genomics 7(33):1–15.
Jeffery, I. B., Higgins, D. G., Culhane, A. C. (2006). Comparison and evaluation of methods for gener-ating differentially expressed gene lists from microarray data. BMC Bioinformatics 7(359):1–16.
Li, J., Fine, J. (2010). Weighted area under the received operating characteristic curve and its appli-cation to gene selection. Journal of the Royal Statistical Society: Applied Statistics 59:673–692.
Pan, W. (2002). A comparative review of statistical methods for discovering differentially expressedgenes in replicated microarray experiments. Bioinformatics 12:546–554.
Pepe, M. S., Longton, G., Anderson, G. L., Schummer, M. (2003). Selecting differentially expressedgenes from microarray experiments. Biometrics 59:133–142.
Raychaudhuri, S., Stuart, J. M., Liu, X., Small, P. M., Altman, R. B. (2000). Pattern recognition ofgenomic features with microarrays: Site typing of Mycrobacterium tuberculosis strains. Pro-ceedings of the International Conference Intelligent Systems for Molecular Biology 8:286–295.
Smyth, G. K. (2004). Linear models and empirical Bayes methods for assessing differential expres-sion in microarray experiments. Statistical Applications in Genetics and Molecular Biology3(1):1–25.
Dow
nloa
ded
by [
McM
aste
r U
nive
rsity
] at
10:
44 0
6 Fe
brua
ry 2
013

Gene Selection from Microarray Experiments 1577
Thomas, J. G., Olson, J. M., Tapscott, S. J., Zhao, L. P. (2001). An efficient and robust statisticalmodeling approach to discover differentially expressed genes using genomic expression profiles.Genome Research 11:1227–1236.
Troyanskaya, O. G., Garber, M., Brown, P., Botstein, D., Altman, R. B. (2002). Nonparamet-ric methods for identifying differentially expressed genes in microarray data. Bioinformatics18(11):1454–1461.
Tsodikov, A., Szabo, A., Jones, D. (2002). Adjustments and measures of differential expression formicroarray data. Bioinformatics 18:251–260.
Tusher, V. G., Tibshirani, R., Chu, G. (2001). Significance analysis of microarray applied to theionizing radiation response. Proceedings of the National Academy of Sciences 98(9):5116–5121.
Xiong, M., Fang, X., Zhao, J. (2001). Biomarker identification by feature wrappers. Genome Research11:1878–1887.
Zhao, Y., Pan, W. (2003). Modified nonparametric approaches to detecting differentially expressedgenes in replicated microarray experiments. Bioinformatics 19:1046–1054.
Zweig, M. H., Campbell, G. (1993). Receiver operating characteristic (ROC) plots: A fundamentalevaluation tool in clinical medicine. Clinical Chemistry 39(4):561–577.
Dow
nloa
ded
by [
McM
aste
r U
nive
rsity
] at
10:
44 0
6 Fe
brua
ry 2
013