
An Implicit Cover Problem in Wild Population Study
49
Electronic copy available at: http://ssrn.com/abstract=1129351 Working Paper No. RHS-06-060 April 24, 2008 Effects of Word-of-Mouth Versus Traditional Marketing: Findings from an Internet Social Networking Site Michael Trusov University of Maryland Randolph E. Bucklin University of California, Los Angeles - Marketing Area Koen H. Pauwels Tuck School of Business at Dartmouth Marketing Department Robert H. Smith School of Business University of Maryland College Park, MD 20742-1815 This Paper can be downloaded without charge from the Social Science Research Network Electronic Paper Collection http://ssrn.com/abstract=1129351
-
Upload
wwwiqraisb -
Category
Documents
-
view
0 -
download
0
Transcript of An Implicit Cover Problem in Wild Population Study
Electronic copy available at: http://ssrn.com/abstract=1129351
Working Paper No. RHS-06-060
April 24, 2008
Effects of Word-of-Mouth Versus Traditional Marketing: Findings from an Internet Social Networking Site
Michael Trusov
University of Maryland
Randolph E. Bucklin University of California, Los Angeles - Marketing Area
Koen H. Pauwels
Tuck School of Business at Dartmouth
Marketing Department Robert H. Smith School of Business
University of Maryland College Park, MD 20742-1815
This Paper can be downloaded without charge from the
Social Science Research Network Electronic Paper Collection http://ssrn.com/abstract=1129351
Electronic copy available at: http://ssrn.com/abstract=1129351Electronic copy available at: http://ssrn.com/abstract=1129351
EFFECTS OF WORD-OF-MOUTH VERSUS TRADITIONAL MARKETING:
FINDINGS FROM AN INTERNET SOCIAL NETWORKING SITE
Michael Trusov
Randolph E. Bucklin
Koen Pauwels*
April 24, 2008
* Michael Trusov ([email protected], phone: (301) 405-5878, fax: (301) 405-0146) is Assistant Professor, Robert H. Smith School of Business, University of Maryland, College Park, MD 20742, Randolph E. Bucklin ([email protected]) is Peter W. Mullin Professor, UCLA Anderson School, 110 Westwood Plaza, Los Angeles, CA 90095. Koen Pauwels ([email protected]) is Associate Professor at Ozyegin University (Istanbul, Turkey) and at the Tuck School of Business at Dartmouth (Hanover, NH). The authors thank the guest editor, three anonymous JM reviewers, and participants of the 2006 Marketing Dynamics Conference and the 2007 DMEF Research Summit, for helpful comments. The authors are also grateful to the anonymous collaborating firm for providing the data used in this study.
Electronic copy available at: http://ssrn.com/abstract=1129351
EFFECTS OF WORD-OF-MOUTH VERSUS TRADITIONAL MARKETING:
FINDINGS FROM AN INTERNET SOCIAL NETWORKING SITE
ABSTRACT
The authors study the effect of word-of-mouth (WOM) marketing on member growth at an
Internet social networking site and compare it with traditional marketing vehicles. Because social
network sites record the electronic invitations sent out by existing members, outbound WOM
may be precisely tracked. WOM, along with traditional marketing, can then be linked to the
number of new members subsequently joining the site (signups). Due to the endogeneity among
WOM, new signups, and traditional marketing activity, the authors employ a Vector
Autoregression (VAR) modeling approach. Estimates from the VAR model show that word-of-
mouth referrals have substantially longer carryover effects than traditional marketing actions.
The long-run elasticity of signups with respect to WOM is estimated to be 0.53 (substantially
larger than the average advertising elasticities reported in the literature) and the WOM elasticity
is about 20 times higher than the elasticity for marketing events, and 30 times that of media
appearances. Based on revenue from advertising impressions served to a new member, the
monetary value of a WOM referral can be calculated; this yields an upper bound estimate for the
financial incentives the firm might offer to stimulate word-of-mouth.
Keywords: Word-of-Mouth Marketing, Internet, Social Networks, Vector Autoregression
Effects of Word-of-Mouth versus Traditional Marketing
Introduction
Word-of-mouth (WOM) marketing has recently attracted a great deal of attention among
practitioners. For example, several books tout word-of-mouth as a viable alternative to traditional
marketing communication tools. One calls it “the world’s most effective, yet least understood
marketing strategy” (Misner 1999). Marketers are particularly interested in better understanding
word-of-mouth as traditional forms of communication appear to be losing effectiveness
(Forrester 2005). For example, one survey showed consumer attitudes toward advertising
plummeting between September 2002 and June 2004. Forrester (2005) reported that 40% fewer
agree that ads are a good way to learn about new products, 59% fewer say they buy products
because of their ads, and 49% fewer find ads entertaining.
WOM communication strategies are appealing because they combine the prospect of
overcoming consumer resistance with significantly lower costs and fast delivery – especially
through technology such as the Internet. Unfortunately, empirical evidence is currently scant
regarding the relative effectiveness of WOM marketing in increasing firm performance over
time. This raises the need to study how firms can measure the effects of word-of-mouth
communications and how WOM compares to other forms of marketing communication.
WOM marketing is a particularly prominent feature on the Internet. The Internet provides
numerous venues for consumers to share their views, preferences, or experiences with others as
well as opportunities for firms to take advantage of WOM marketing. As one commentator
stated, “Instead of tossing away millions of dollars on Superbowl ads, fledging dot-com
companies are trying to catch attention through much cheaper marketing strategies such as
blogging and word-of-mouth campaigns” (Whitman 2006). As many of these companies have
“grown up” and also begin to spend significantly on traditional marketing (e.g., the Superbowl
3
Effects of Word-of-Mouth versus Traditional Marketing
ads of Careerbuilder.com and GoDaddy.com), it is important to understand whether word-of-
mouth is truly effective and, if so, how its impact compares to traditional marketing activities.
One of the fastest growing arenas of the World Wide Web is the space of so-called social
networking sites (e.g., Facebook, MySpace, Friendster, Xanga). These sites rely upon user-
generated content to attract and retain visitors, obtaining revenue primarily from the sale of
online display advertising. They also accumulate user information that may be valuable for
targeted marketing purposes.
The social network setting offers an appealing context to study word-of-mouth. The sites
provide easy-to-use tools for current users to invite others to join the network. The electronic
recording of these outbound referrals opens a new window into the effects of WOM, giving
researchers an unobtrusive trace of this often hard-to-study activity. When combined with data
that also tracks new member signups, it becomes possible to model the dynamic relationship
between this form of word-of-mouth and the addition of new members to the social networking
site. These members are, in a real sense, also the “customers” of the social networking site, as
their exposure to advertising while using the site produces revenue for the firm.
Internet companies commonly employ several types of WOM marketing activities. The
major categories include the following:
1) Viral Marketing – creating entertaining or informative messages designed to be
passed on by each message receiver, analogous to the spread of an epidemic,
often electronically or by email;
2) Referral Programs – creating tools that enable satisfied customers to refer their
family and friends; and
4
Effects of Word-of-Mouth versus Traditional Marketing
3) Community Marketing – forming or supporting niche communities that are likely
to share interests about a product or brand (such as user groups, fan clubs, and
discussion forums) and providing tools, content, and information to support those
communities.1
In this paper, we focus on electronic referrals in social networking, one specific form of WOM
activity in the referral program category listed above.
The goal of this research is to develop and estimate a model that captures the relationship
between new member acquisition and WOM referrals. Our objective is to use the model to
estimate the elasticity, both short and long-run, for word-of-mouth referral activity at the site.
We also compare these elasticity estimates with those obtained for two forms of traditional
marketing communications. These are media appearances (public relations) and event marketing
– the main company-sponsored marketing activity at the time. The model is estimated on daily
time series data from an Internet social networking site. Specifically, the data record number of
new members, outbound referrals, and the occurrence of other marketing activity for a
continuous period of about nine months in 2005. Because daily data are available, we also seek
to provide new empirical findings on the carryover effects of word-of-mouth activity.
Our modeling approach (Vector Autoregression) explicitly takes into account the
potential endogeneity in customer acquisition, WOM activity, and other marketing
communication efforts. WOM may be endogenous because it not only influences new customer
acquisition but is itself affected by the number of new customers. Likewise, traditional
marketing activities may stimulate WOM; they should be credited for this indirect effect as well
as the direct effect they may have on customer acquisition. We empirically test for this
1 The interested reader can find a detailed overview of different forms of WOM marketing available at the Word of Mouth Marketing Association web site (www.womma.org).
5
Effects of Word-of-Mouth versus Traditional Marketing
endogeneity, and additionally demonstrate the superior fit and forecasting ability of the Vector-
Autoregressive Model as compared to several modeling alternatives.
Our empirical results show that WOM referrals strongly affect new customer acquisitions
at the social networking site. We estimate a long-run elasticity of 0.53. This is approximately 2.5
times higher than the average advertising elasticity reported in the literature (e.g. Hanssens et al
2001). Part of the reason for the high long-run elasticity is the strong carryover effect that WOM
has in our data. We find that a change in WOM activity continues to significantly impact the
firm’s new signups for 21 days. WOM also has a much stronger impact on new customer
acquisition than traditional forms of marketing. In particular, long-run WOM elasticity is about
20 times higher than the elasticity for marketing events (0.53 vs. 0.026) while the carryover
effect from these events is significant for only five days.
We illustrate the managerial implications by showing how firms could use the modeling
results to gauge the potential value of seeding additional word-of-mouth. Specifically, we
calculate how much the average newly acquired customer contributes to firm revenues via their
exposure to advertising on the site. This can provide an upper bound to the financial incentives
the firm might consider offering to existing customers to stimulate outbound word-of-mouth. We
note that the practice of seeding or stimulating word-of-mouth has recently grown rapidly but
that quantifying the effectiveness or returns of this activity remains difficult (e.g., Godes et al
2004).
Research Background
The earliest study on the effectiveness of WOM is survey-based (Katz and Lazarsfeld
1955). The authors found that WOM was seven times more effective than print advertising in
influencing consumers to switch brands. Since the 1960s, word of mouth has been the subject of
6
Effects of Word-of-Mouth versus Traditional Marketing
more than 70 marketing studies (Money et al 1998). Researchers have examined the conditions
under which consumers are likely to rely on others’ opinions to make a purchase decision, the
motivations for different people to spread the word about a product, and the variation in strength
of influence people have on their peers in WOM communications. Consumer influence over
other consumers has been demonstrated in scholarly research concerning social and
communication networks, opinion leadership, source credibility, uses and gratifications, and
diffusion of innovations (Phelps et al 2004).
In addition to survey and experimental methods, another long-standing approach to
studying WOM has been to infer its role using social contagion models (e.g., Coleman et al.
1966). In the vast majority of these studies, network effects are inferred from over-time adoption
behavior. While a social contagion interpretation of diffusion patterns is intuitively appealing,
recent studies have pointed out that such inferences can be due to misattribution. For example,
Van den Bulte and Lilien (2001) showed that WOM effects may be confounded with some
common contextual effects. When the authors re-estimated Coleman et al.’s social contagion
model for physician adoption of tetracycline, they found that the contagion effects disappeared
when marketing actions were included in the model. This raises the question whether WOM
effects might be significant in a model had there been data available on the actual transmission of
information from one physician to another.
A major challenge in studying actual WOM is obtaining accurate data on interpersonal
communications. Examining WOM on the Internet can help address this problem by offering an
easy way to track online interactions. The Internet, of course, gives only a partial view of
interpersonal communication; WOM exchange is not limited to the online world. Nevertheless,
for some products or product categories, Internet measures of WOM could be a good proxy for
7

Effects of Word-of-Mouth versus Traditional Marketing
overall WOM. We believe that for online communities, the electronic form of “spreading the
word” is the most natural one. This leads us to suggest that online WOM should be a good proxy
for overall WOM in the Internet social network setting of our study.
Recent research has begun to study WOM in an Internet setting. Godes and Mayzlin
(2004) suggest that online conversations (e.g., Usenet posts) could offer an easy and cost-
effective way to measure word of mouth. In an application to new television shows, they linked
the volume and dispersion of conversations across different Usenet groups to offline show
ratings. Chevalier and Mayzlin (2006) used book reviews posted by customers at Amazon.com
and BarnesandNoble.com online stores as a proxy for WOM. The authors found that while most
reviews were positive, an improvement in a book’s reviews led to an increase in relative sales at
that site and the impact of a negative review was greater than the impact of a positive one. In
contrast, Liu (2006) shows that both negative and positive WOM increase performance (box
office revenue).
Villanueva, Yoo and Hanssens (2008) compared customer lifetime value (CLV) for
customers acquired through WOM versus traditional channels. Studying data from a web hosting
company, the authors showed that customers acquired through marketing add more short-term
value to the firm, but customers acquired by word-of-mouth added nearly twice as much long-
term value. However, the authors did not observe the firm’s marketing activity. Thus, the
response of customer acquisition to WOM and traditional marketing activity could not be
directly estimated.
Lastly, De Bruyn and Lilien (2007) observed the reactions of 1,100 recipients after they
received an unsolicited email invitation from one of their acquaintances to participate in a
survey. They found that the characteristics of the social tie influenced recipients’ behaviors but
8
Effects of Word-of-Mouth versus Traditional Marketing
had varied effects at different stages of the decision-making process. The authors reported that
tie strength exclusively facilitated awareness, perceptual affinity triggered recipients’ interest,
and demographic similarity had a negative influence on each stage of the decision-making
process.
Our paper differs from the above studies in research question and application. First, we
seek to directly compare the effects of word-of-mouth referrals with those of traditional
marketing efforts. We do this using model-based estimates for short-run elasticities, carryover
effects, and long-run elasticity estimates that take into account endogeneity. Second, our
empirical application is to an Internet social networking site which provides a set of substantive
findings based on actual consumer WOM activity in an important new setting. The setting also
enables us to illustrate the potential value of stimulating word-of-mouth activity.
Internet Social Networking Sites
While still a relatively new online phenomenon, social networking has already attracted
attention from major Internet corporations. Microsoft, Google, Yahoo! and AOL are among
companies offering online community services. According to Wikipedia (www.wikipedia.org),
at present there are about 30 social networking websites each with more than one million
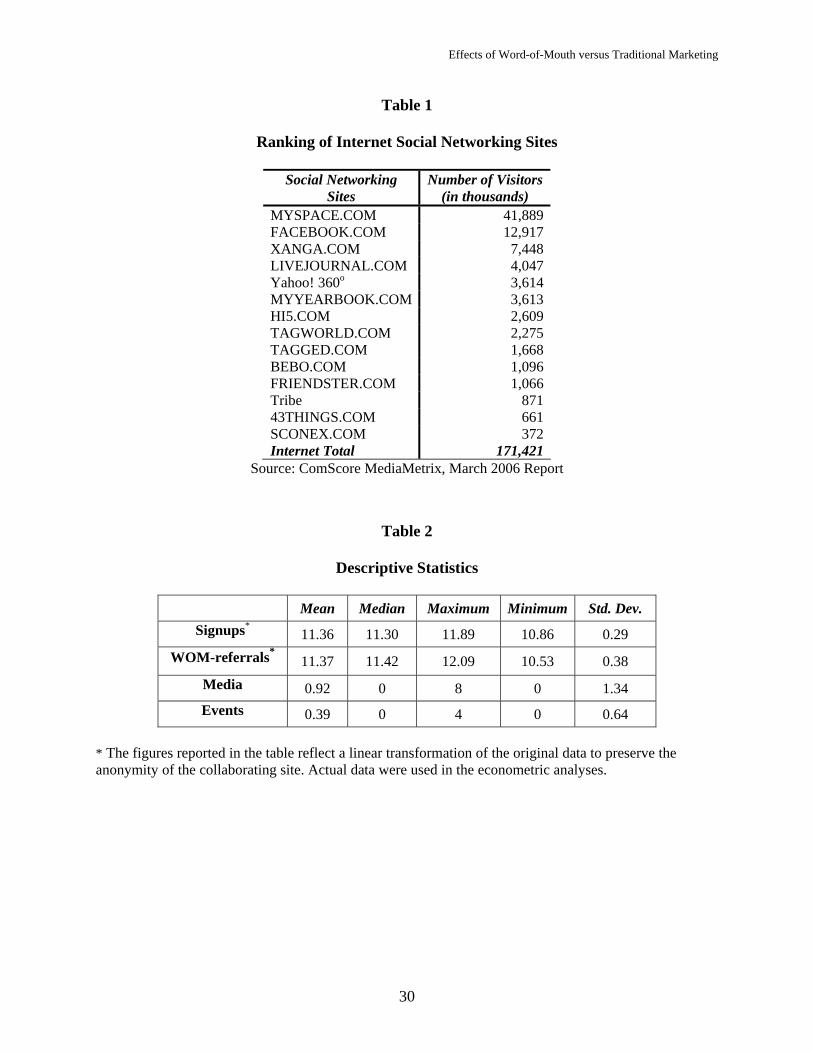
registered users and several dozen significant, though smaller, sites. In terms of web traffic, as of
March 2006, ComScore, Inc. reports that the largest online social networking site was
MySpace.com with 42 million unique visitors per month, followed by FaceBook.com with 13
million and Xanga.com with 7.4 million unique visitors. ComScore numbers suggest that every
second Internet user in the U.S. visits one of the top 15 social networking sites (Table 1).
[Table 1. Social Networking Sites Ranking]
9
Effects of Word-of-Mouth versus Traditional Marketing
A social networking site is typically initiated by a small group of founders who send out
invitations to join the site to the members of their own personal networks. In turn, new members
send invitations to their networks, and so on. Hence, invitations (i.e., WOM referrals) have been
the foremost driving force for sites to acquire new members. Typical social networking sites
allow a user to build and maintain a network of friends for social or professional interaction. In
the core of a social networking site are personalized user profiles. Individual profiles are usually
a combination of users’ images (or avatars), list of interests, music, books, movies preferences,
and links to affiliated profiles (“friends”). Different sites impose different levels of privacy in
terms of what information is revealed through profile pages to non-affiliated visitors and how far
“strangers” vs. “friends” can traverse through the network of a profile’s friends. Profile holders
acquire new “friends” by browsing and searching through the site and sending requests to be
added as a friend. Other forms of relation formation also exist.
In contrast to other Internet businesses, online communities rely upon user-generated
content to retain users. A community member has a direct benefit from bringing in more
“friends” (e.g., through participating in the referral program), as each new member creates new
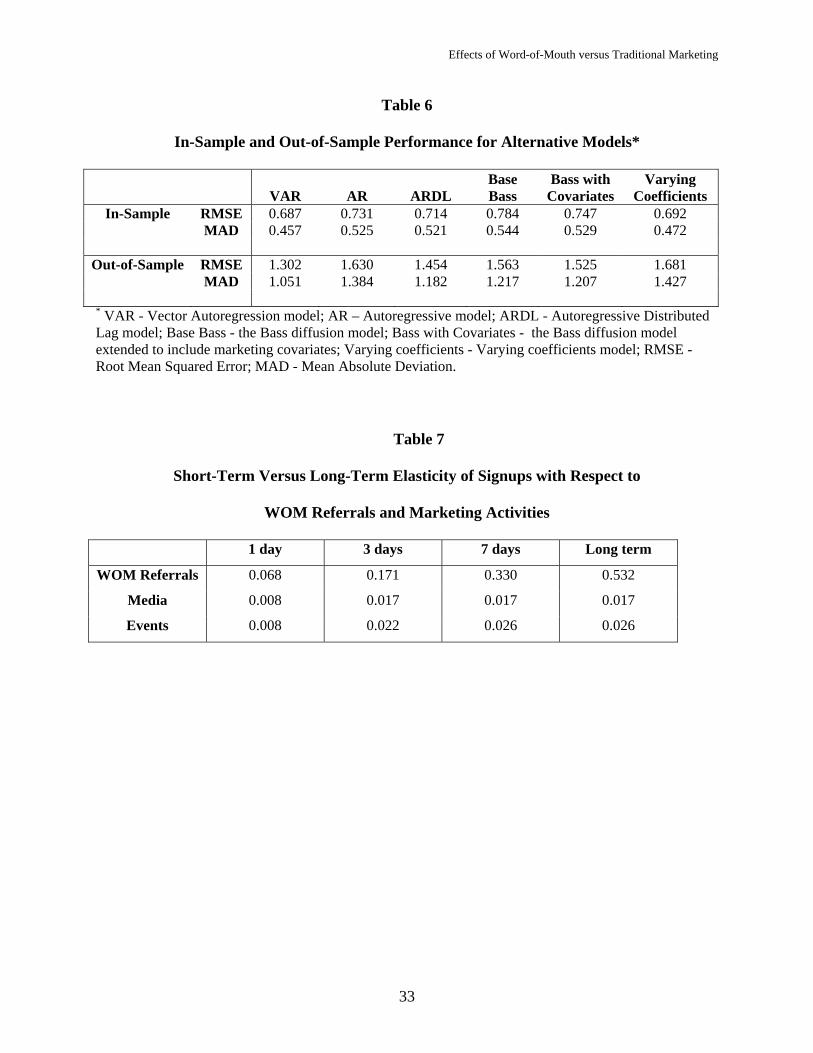
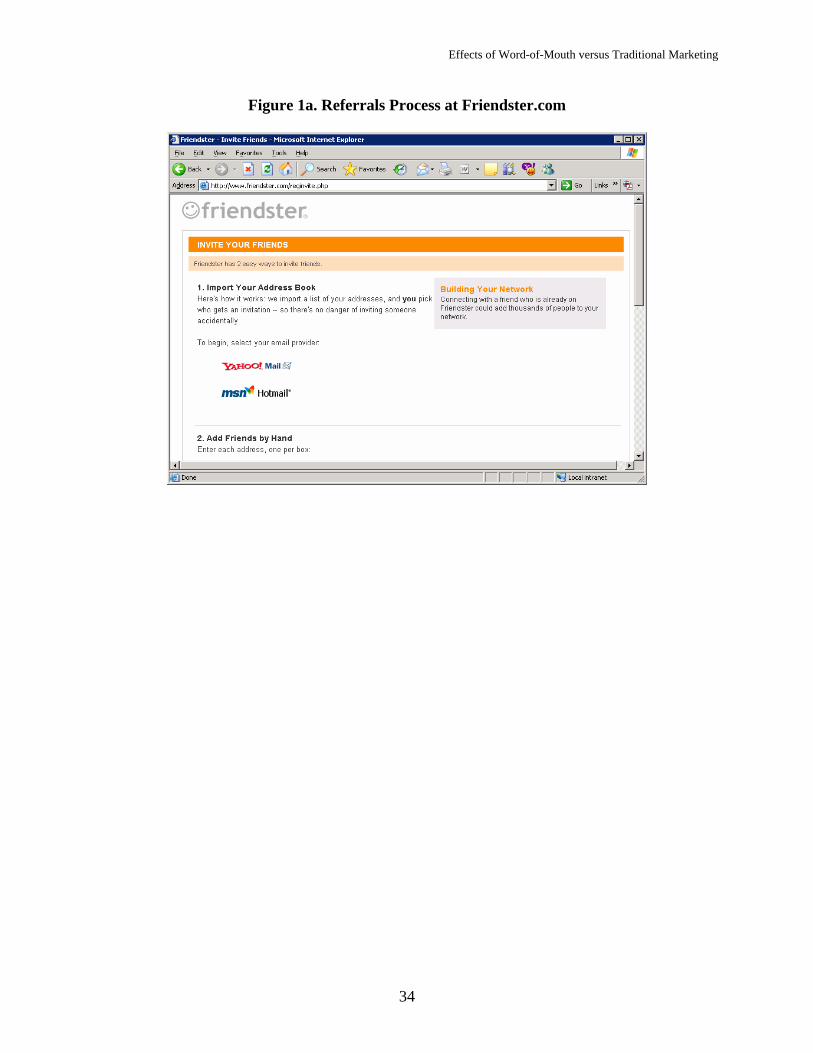
content, which is likely to be of value to the inviting (referring) party. Typically, sites facilitate
referrals by offering users a convenient interface for sending invitations to non-members to join
the community. Figure 1 shows how two popular social networking sites, Friendster.com and
Tribe.com, implement the referral process.
[Figure 1. Referrals Process at Friendster.com and Tribe.com]
Referrals made through the interface provided by the site are easily tracked. Some sites
offer incentives to make a referral. For example, Netflix.com recently offered its existing
customers the opportunity to pass along a “gift” of a month of free service to their non-member
10
Effects of Word-of-Mouth versus Traditional Marketing
acquaintances. Many subscription-based services offer progressive discounts on monthly fees for
each referral made.
While the mechanics of social network formation through the WOM referrals process
may be straightforward, little is known about the dynamics and sustainability of this process.
Also, as social networking sites mature, they may begin to increase their use of traditional
marketing tools. Management therefore may start to question the relative effectiveness of WOM
at this stage. Our objective is to contribute a new set of empirical findings on this subject.
Modeling Approach
A social networking site has several ways to attract new customers, including event
marketing (directly paid for by the company), media appearances (induced by PR) and word-of-
mouth (WOM) referrals. We apply several modeling approaches to estimate the effect of these
marketing variables on signups. These models are autoregressive (AR), autoregressive-
distributed lag (ARDL), vector-autoregression (VAR), social contagion (Bass diffusion) with and
without marketing covariates, and time-varying coefficients. We describe the AR, ARDL, and
VAR models below. In the interest of brevity, we have placed further details of the VAR model
and specifications for the last three models in the technical appendix.
Our modeling approach also needs to account for the possibility that these
communication mechanisms may have permanent effects on signups. For instance, WOM may
be passed along beyond its originally intended audience and thus increase the site’s potential to
recruit signups in the future.2 Network externalities can also imply that signup gains today may
translate into higher signup gains tomorrow, even in the absence of marketing actions. In either
case, the time series for signups would be classified as ‘evolving.’ The opposite classification of
‘stationary’ implies that signups have a fixed mean and that changes (including those caused by 2 We thank an anonymous reviewer for this insight.
11

Effects of Word-of-Mouth versus Traditional Marketing
marketing actions) do not have a permanent impact (e.g., Dekimpe and Hanssens 1995, 1999).
The technical appendix provides details on testing for evolution versus stationarity of new
signups.
Our first model is an autoregressive (AR) specification. Here, we regress signups on
events, media and WOM, controlling for deterministic components such as a base level
(constant), a deterministic (time) trend, seasonality and lags of the dependent variable (e.g., Box
and Jenkins 1970). The time trend is intended to capture external factors, including growth in
Internet access, growth in people with high-speed bandwidth, and general increases in content
and interest in social networking sites. Seasonal patterns may be both high frequency (e.g. day-
of-week), as most Internet use occurs during weekdays (Pauwels and Dans 2001), as well as low
frequency, e.g., annual holiday periods such as summer vacation. Equation (1) specifies the
autoregressive (AR) model:
6
1 2 31 1
J
t t t t i i t j t ji j
Y X M E C T d H Y tβ β β δ γ θ φ −= =
= + + + + + + + +∑ ∑ ε (1)
where
t = day index,
Yt = number of signups (new members),
Xt = number of WOM-referrals,
Mt = number of media appearances,
Et = number of promotional events,
C = constant,
T = deterministic time trend,
di = indicators for days of the week (Friday is the index or benchmark),
H = holiday indicator (set equal to one during summer vacation),
12
Effects of Word-of-Mouth versus Traditional Marketing
J = number of lags of the dependent variable (hence the term auto-regressive) needed to
ensure the residuals εt are white-noise errors (no residual autocorrelation), and
1 3 1 6 1, , , , and Jβ δ γ θ φ− − −
t
are parameters to be estimated.
Note that equation (1) directly models only the immediate effects of marketing actions on
signups. While this immediate effect may carry over to future periods through the auto-
regressive parameters, the model assumes such carry-over does not depend on the marketing
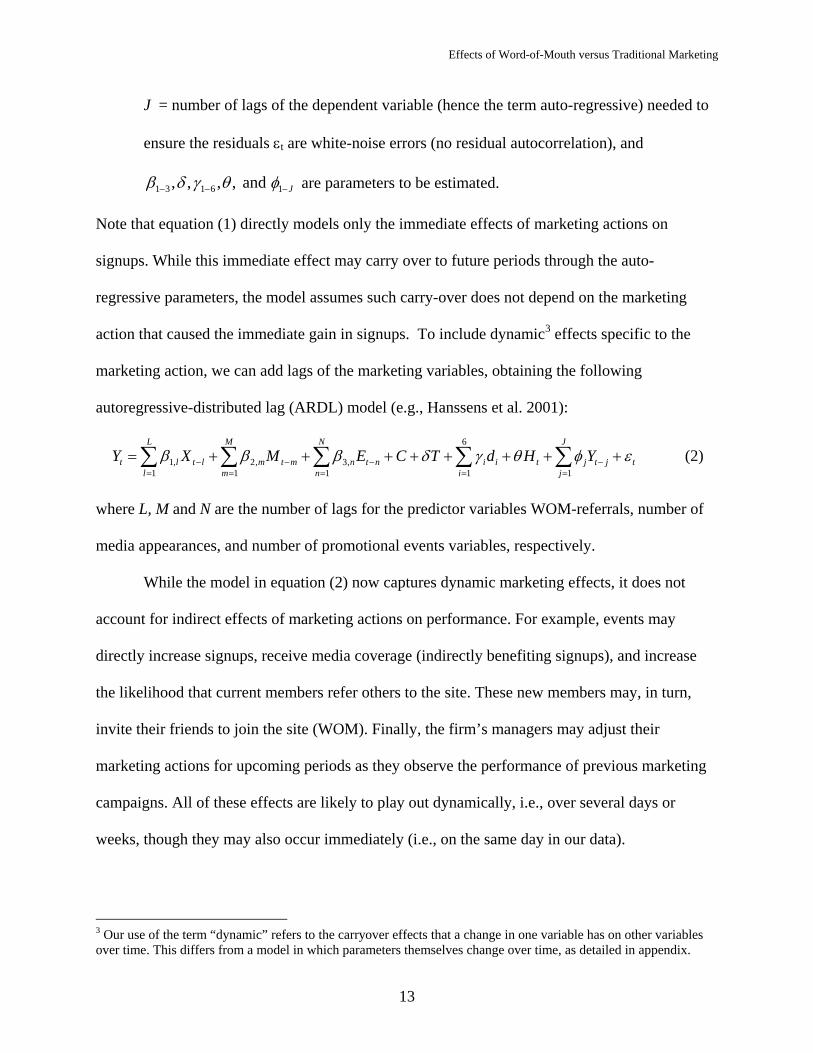
action that caused the immediate gain in signups. To include dynamic3 effects specific to the
marketing action, we can add lags of the marketing variables, obtaining the following
autoregressive-distributed lag (ARDL) model (e.g., Hanssens et al. 2001):
6
1, 2, 3,1 1 1 1 1
L M N J
t l t l m t m n t n i i t j t jl m n i j
Y X M E C T d H Yβ β β δ γ θ φ− − −= = = = =
= + + + + + + +∑ ∑ ∑ ∑ ∑ ε− +
(2)
where L, M and N are the number of lags for the predictor variables WOM-referrals, number of
media appearances, and number of promotional events variables, respectively.
While the model in equation (2) now captures dynamic marketing effects, it does not
account for indirect effects of marketing actions on performance. For example, events may
directly increase signups, receive media coverage (indirectly benefiting signups), and increase
the likelihood that current members refer others to the site. These new members may, in turn,
invite their friends to join the site (WOM). Finally, the firm’s managers may adjust their
marketing actions for upcoming periods as they observe the performance of previous marketing
campaigns. All of these effects are likely to play out dynamically, i.e., over several days or
weeks, though they may also occur immediately (i.e., on the same day in our data).
3 Our use of the term “dynamic” refers to the carryover effects that a change in one variable has on other variables over time. This differs from a model in which parameters themselves change over time, as detailed in appendix.
13
Effects of Word-of-Mouth versus Traditional Marketing
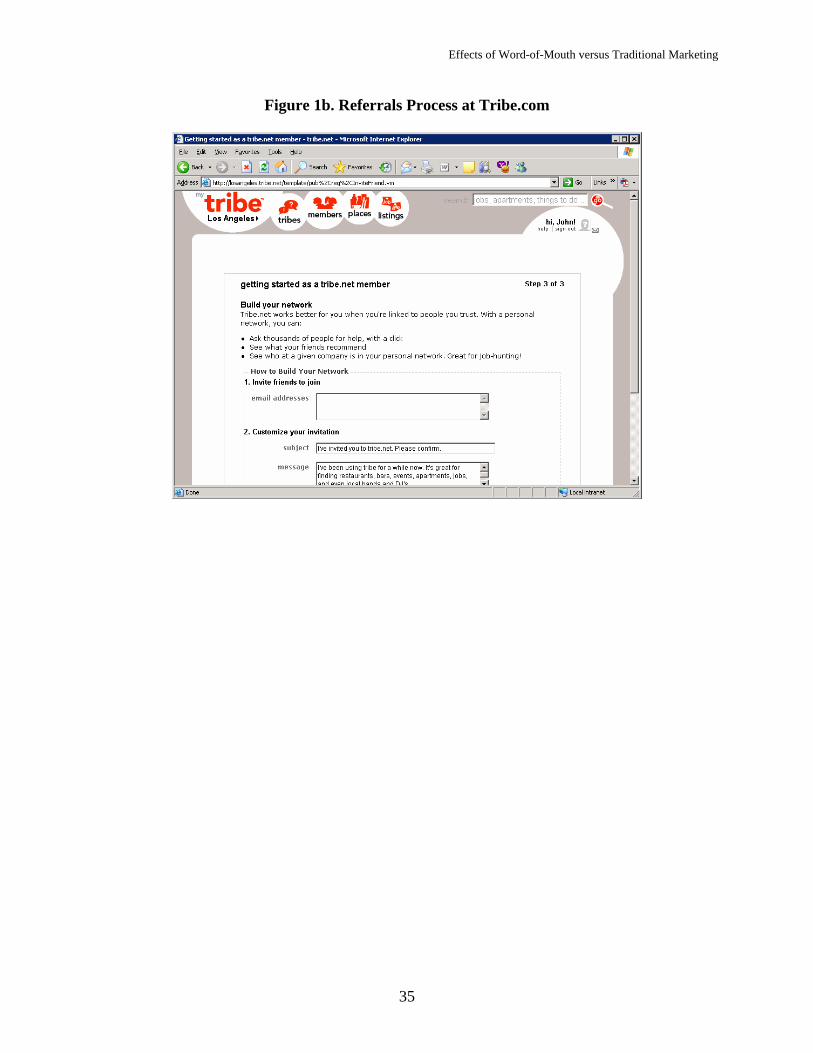
In Figure 2 we display our conceptual model for capturing the complete set of effects of
WOM and marketing actions in our social network site setting. The figure shows that we
anticipate WOM referrals to lead to new signups and (following the reverse arrow) new signups
to lead to more WOM referrals, and therefore indirectly to more new signups. A similar pattern
of causality is anticipated for new signups and traditional marketing activity. It is also quite
likely that traditional marketing may stimulate WOM referrals, leading to another indirect effect
on new signups. We do not anticipate a direct causal link from WOM referrals to traditional
marketing (i.e., we do not expect that an increase in WOM activity per se would lead to an
increase in traditional marketing). Lastly, lagged effects of traditional marketing, new signups,
and WOM referrals are also included in the model (as indicated by the curved arrows).
[Figure 2. Modeling Framework]
The links represented in Figure 2 can be tested by investigating which variables Granger
cause other variables (Granger 1969, Hanssens et al. 2001). In essence, Granger causality implies
that knowing the history of a variable X helps explain a variable Y, over and above Y’s own
history. This ‘temporal causality’ is the closest proxy for causality that can be gained from
studying the time series of the variables (i.e., in the absence of manipulating causality in
controlled experiments). We perform a series of Granger causality tests on each pair of key
variables.4 If signups do Granger cause (some of) the marketing variables, we need to capture the
complex interactions of Figure 2 in a full dynamic system. To this end, we specify and estimate a
vector-autoregressive (VAR) model. Compared to alternative specifications, VAR models are
especially well suited to measure dynamic interactions among performance (signups) and
4 We note that a wrong choice for the number of lags in the test may erroneously conclude the absence of Granger causality (e.g., Hanssens 1980). Because we are applying these tests to investigate the need for modeling a full dynamic system, we are not interested in whether variable X causes variable Y at a specific lag, but in whether we can rule out that X Granger causes Y at any lag. Therefore, we run the causality tests for lags up to 20 and report the results for the lag that has the highest significance for Granger causality.
14
Effects of Word-of-Mouth versus Traditional Marketing
marketing variables and to estimate the dynamic response of signups to both WOM and
traditional marketing actions. Recently, VAR models have been used to analyze a wide variety of
long-term marketing effects – including advertising, price promotions and new product
introductions (e.g., Dekimpe and Hanssens 1999; Pauwels et al. 2002, 2004; Srinivasan et al.
2004).
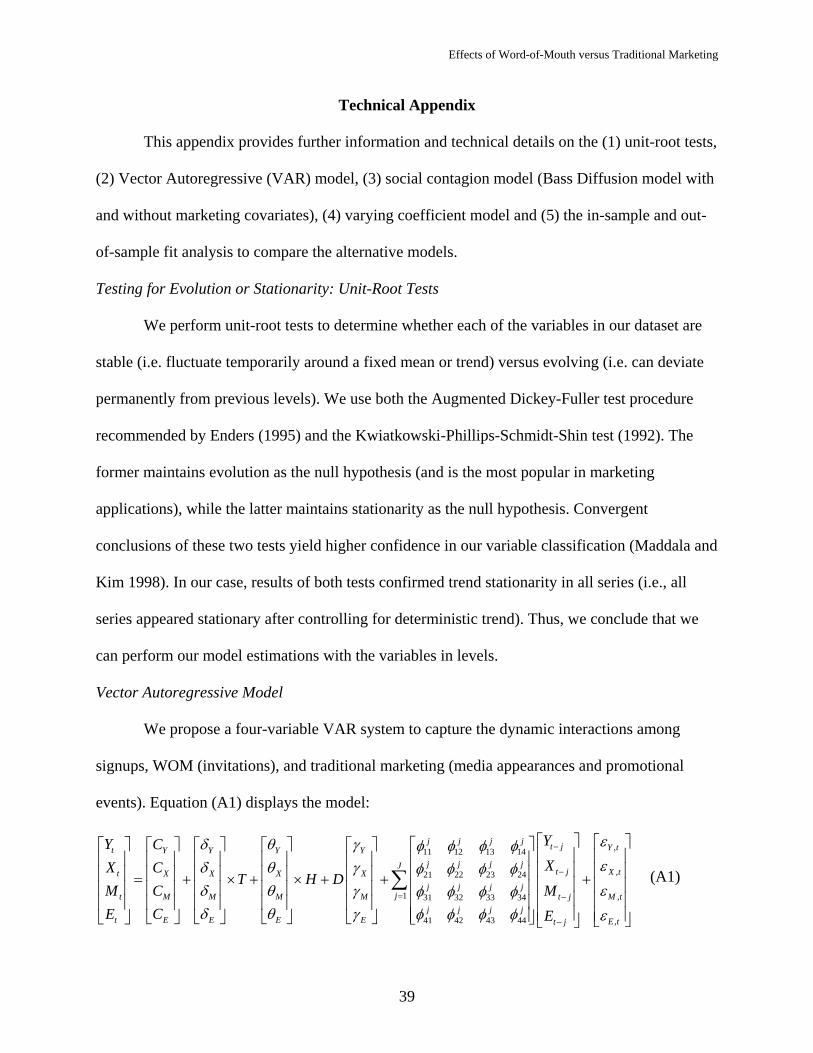
The technical appendix presents the mathematical specification of the proposed VAR
model (equation A1). The VAR model is designed to capture the complex set of relationships
depicted in Figure 2. The appendix also describes how the VAR model results can be used to
represent the carryover effects of a change in WOM or marketing activity and compute the short
and long-run elasticities for WOM, promotional events, and media. In addition to the VAR
model, specifications for three additional modeling approaches (Bass diffusion, Bass diffusion
with covariates, and varying coefficients) are also given in the appendix. Lastly, the appendix
details the procedures used to compare the fit performance of the six alternative models in-
sample and out-of-sample.5
Empirical Analysis
Data Description
We applied our model to data from one of the major social networking sites, which
wishes to remain anonymous. The dataset contains 36 weeks of the daily number of signups and
referrals (provided to us by the company) along with marketing events and media activity
(obtained from third party sources). The data cover the period from February 1 to October 16,
2005. Table 2 provides descriptive statistics for the variables.
[Table 2. Descriptive Statistics]
5 We thank the guest editor and reviewers for suggesting alternative models and the comparison tests.
15
Effects of Word-of-Mouth versus Traditional Marketing
During the observation period, the daily signups and WOM-referrals showed a positive
trend. We observed somewhat lower activity in referrals over the summer season (as practiced in
the U.S. - June 20 through Labor Day, which was September 5 in 2005). Over the 36 weeks, the
company organized or co-sponsored 101 promotion events. On some days, multiple events
occurred in different locations. Overall, 86 days in the observation period had some promotion
event activity. Finally, we identified 236 appearances (on 127 days) of the company name in the
media. We considered 102 different sources, both electronic and traditional media, as provided
by Factiva News and Business Information services (www.factiva.com). We did not use the
content of these publications; thus, our measure of media activity is coarse. In a more general
case it would be important to account for the valence of the message (e.g., as Godes and Mayzlin
(2004) report for TV shows). Given the relatively young age of the company, we had no reason
to believe that a significant share of the media reports would have a negative tone. Moreover, we
removed a few negative “suspects” from the sample as judged by the title of the publication.6 In
sum, we feel the number of media appearances is a useful measure for our research purpose.
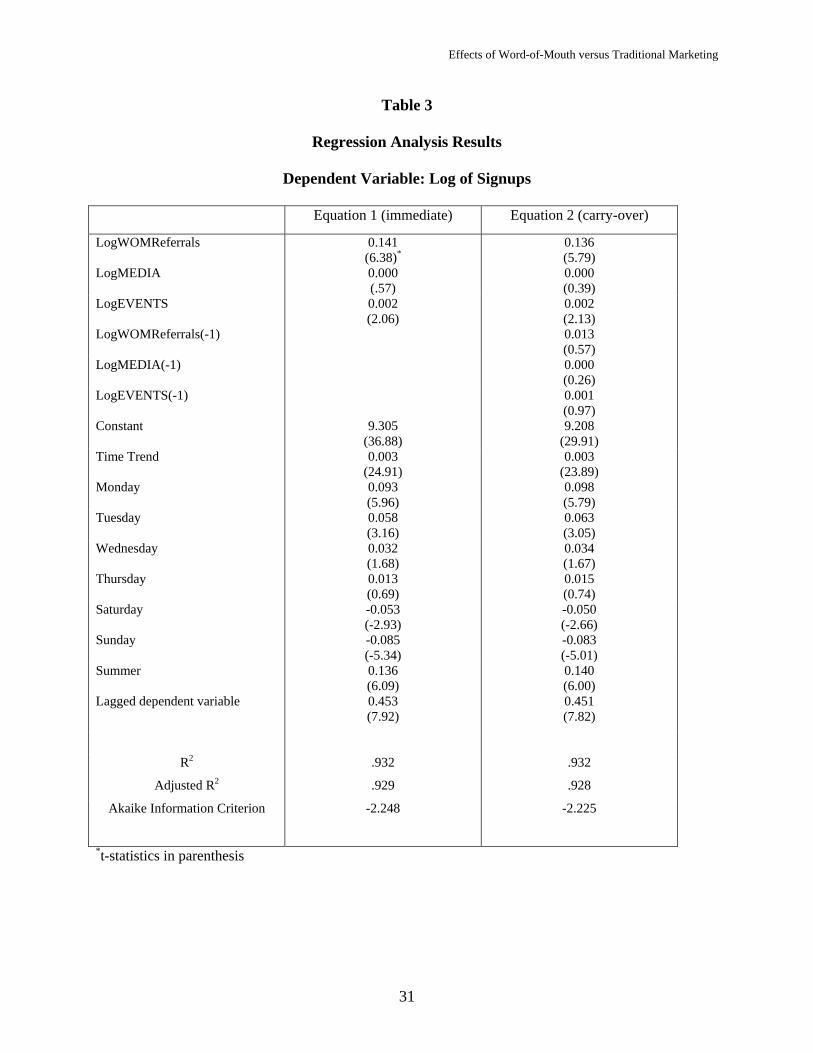
Direct Effects of Marketing on Signups
We first present the results from estimating the benchmark time series regression models
given in equations (1) and (2). These models regress signups against WOM referrals, media, and
events, while controlling for a time trend, day-of-week, and seasonality. Results from both
models are presented in Table 3. The left column of parameter estimates corresponds to the
specification for immediate effects only (equation 1) while the right column corresponds to the
carryover effects specification (equation 2). The models are estimated in log form, which
provides direct results for the elasticities from the estimated coefficients.
[Table 3. Regression Analysis Results] 6 The removal of these events did not have a significant impact on estimation results.
16
Effects of Word-of-Mouth versus Traditional Marketing
Across both regression models, we find high explanatory power (R2 = .932) and the
expected signs for marketing actions (positive), trend (positive) and seasonality (positive for
weekdays and for the summer break, negative for the weekend). Moreover, we find similar effect
magnitudes across the two models. WOM has the largest elasticity (0.14), about 75 times larger
than that for events (0.002), while media appearances do not significantly increase signups.
Because all of the distributed lag effects (equation 2) and potential interaction effects7 are
insignificant, adding them to the model in equation (1) does not change our substantive findings.
Indeed, the model in equation (1) outperforms more complex models based on both adjusted R2
and the Akaike Information Criterion (AIC).
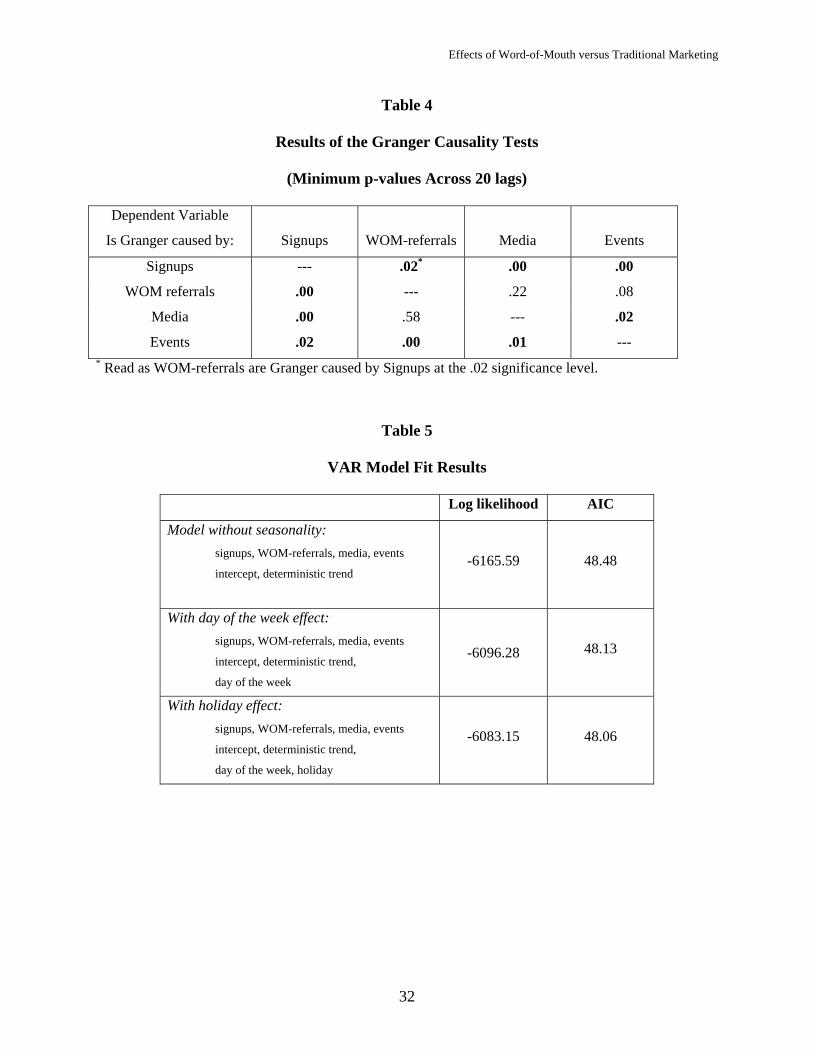
Endogeneity (Granger Causality Test Results)
A limitation of the benchmark regression models in equations (1) and (2) is their inability
to handle potential endogeneity in the data. To investigate whether endogeneity is present, we
conduct Granger causality tests. We summarize the results in Table 4. Each cell gives the
minimum p-value obtained from the causality tests as conducted from one lag to 20 lags.
[Table 4. Granger Causality Test Results]
The test results clearly indicate that endogeneity is present among the variables in our
data. As expected, Granger causality is detected for WOM referrals, media and events on signups
(the direct effects). In addition, Granger causality is also found for many of the other pairings.
For example, signups Granger cause WOM referrals (the interdependent effect argued earlier),
events (indicating management performance feedback, e.g. Dekimpe and Hanssens 1999), and
media (indicating that spikes in signups may receive media attention). Moreover, events Granger
cause media (indicating that media covers events) and media Granger causes events (indicating
that management may seek to time events to match pending media coverage). On the other hand, 7 Results are available upon request.
17

Effects of Word-of-Mouth versus Traditional Marketing
WOM-referrals do not Granger cause events or media appearances (as the media does not
observe referrals directly) and media appearances do not Granger cause WOM. In sum, the
results from the Granger causality tests indicate the need to consider the full dynamic system, as
in a VAR-model, and account for the indirect effects of marketing actions.
VAR Model Selection and Estimation
Our VAR-model selection starts with the four endogenous variables (number of signups
and WOM-referrals, media appearances, promotional events) and a deterministic trend, which
captures the firm’s growth during the observation period. Next, we add day of the week effects,
and then a holiday effect. The model fit results are presented in Table 5. The AIC criterion
suggests that the best model should include all of the proposed variables. Finally, we note that
the AIC criterion selects two as the optimal lag length.
[Table 5. VAR Model Fit Results]
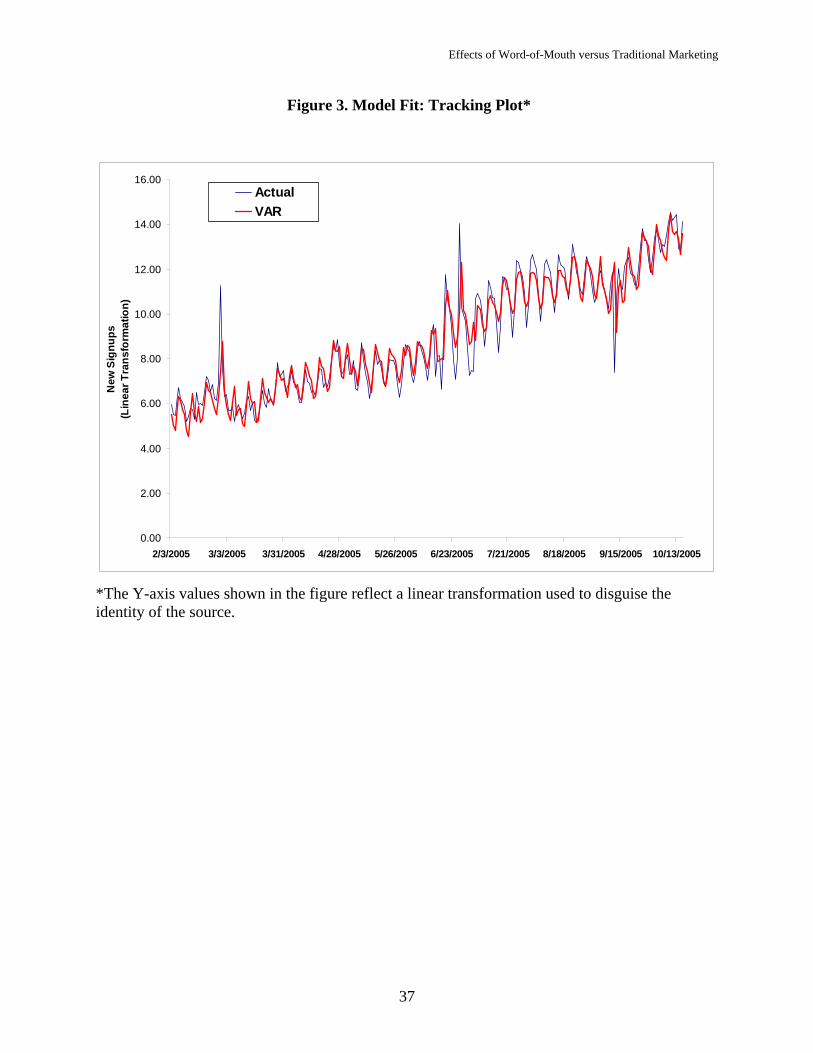
To illustrate the ability of the VAR system model to represent the data, we plotted
predicted versus actual values of daily signups and display this in Figure 3. The predicted values
(labeled VAR) closely track the actual number of signups. (Note that the values on the Y-axis
for signups reflect a linear transformation employed to preserve the anonymity of the social
networking site.)
[Figure 3. Model Fit: Tracking Plot]
Comparison with Alternative Models
We also compared the performance of the VAR model against the five alternative models
in order to cover a range of approaches used in the analysis of growth data. Besides the time-
series models of AR and ARDL, represented by equations (1) and (2), we also compare the VAR
18
Effects of Word-of-Mouth versus Traditional Marketing
model to the Bass diffusion model (equation A2), the Bass diffusion model with marketing
covariates (equation A3), and a varying coefficients model (equation A4).
In Table 6 we report the results of the model comparisons. The proposed VAR model
offers the best fit both in and out of sample. Though the varying coefficients model does almost
as well in-sample, it fares poorly in the out-of-sample (holdout) period.8
[Table 6. In-Sample and Out-of-Sample Performance of Alternative Models]
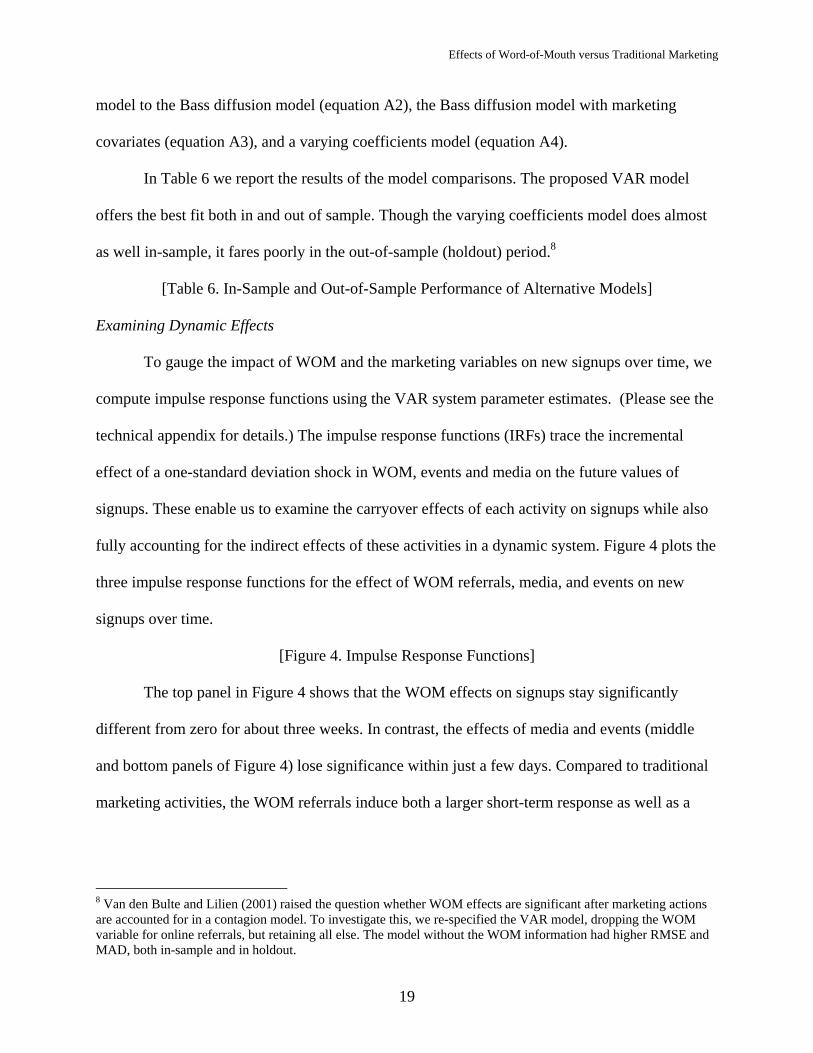
Examining Dynamic Effects
To gauge the impact of WOM and the marketing variables on new signups over time, we
compute impulse response functions using the VAR system parameter estimates. (Please see the
technical appendix for details.) The impulse response functions (IRFs) trace the incremental
effect of a one-standard deviation shock in WOM, events and media on the future values of
signups. These enable us to examine the carryover effects of each activity on signups while also
fully accounting for the indirect effects of these activities in a dynamic system. Figure 4 plots the
three impulse response functions for the effect of WOM referrals, media, and events on new
signups over time.
[Figure 4. Impulse Response Functions]
The top panel in Figure 4 shows that the WOM effects on signups stay significantly
different from zero for about three weeks. In contrast, the effects of media and events (middle
and bottom panels of Figure 4) lose significance within just a few days. Compared to traditional
marketing activities, the WOM referrals induce both a larger short-term response as well as a
8 Van den Bulte and Lilien (2001) raised the question whether WOM effects are significant after marketing actions are accounted for in a contagion model. To investigate this, we re-specified the VAR model, dropping the WOM variable for online referrals, but retaining all else. The model without the WOM information had higher RMSE and MAD, both in-sample and in holdout.
19
Effects of Word-of-Mouth versus Traditional Marketing
substantially longer carryover effect. The IRF results highlight the need for researchers to
employ models which can also estimate longer-term effects for word-of-mouth marketing.
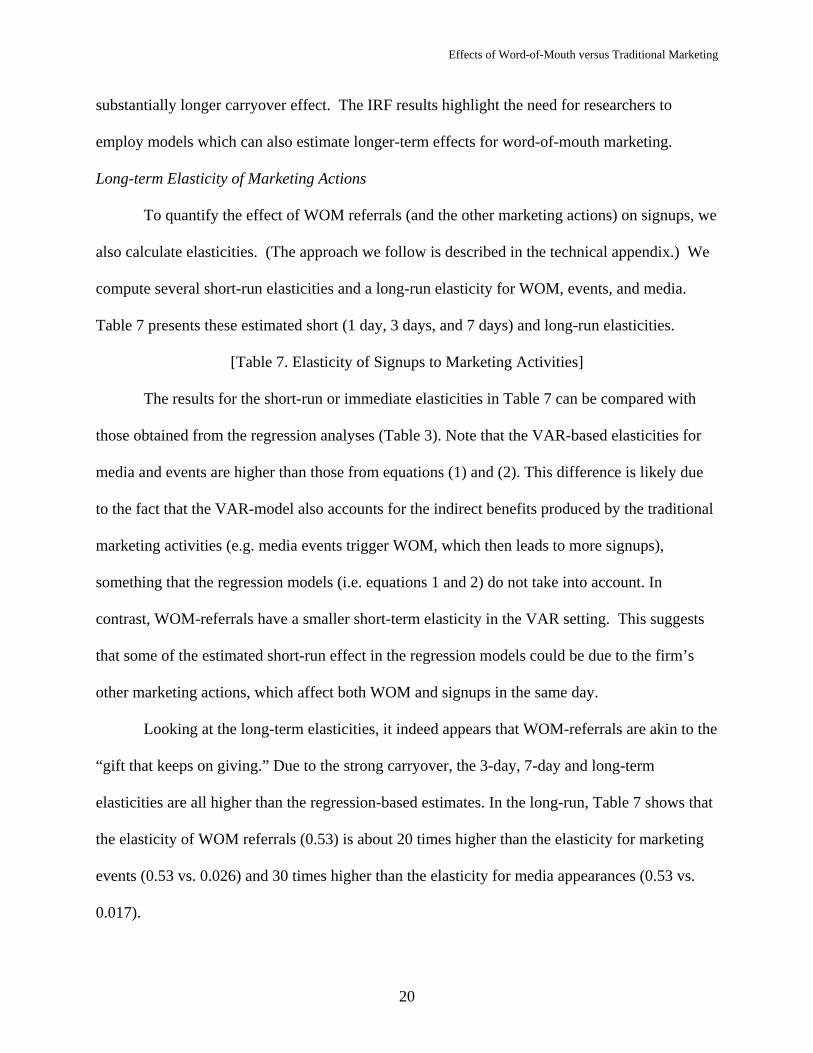
Long-term Elasticity of Marketing Actions
To quantify the effect of WOM referrals (and the other marketing actions) on signups, we
also calculate elasticities. (The approach we follow is described in the technical appendix.) We
compute several short-run elasticities and a long-run elasticity for WOM, events, and media.
Table 7 presents these estimated short (1 day, 3 days, and 7 days) and long-run elasticities.
[Table 7. Elasticity of Signups to Marketing Activities]
The results for the short-run or immediate elasticities in Table 7 can be compared with
those obtained from the regression analyses (Table 3). Note that the VAR-based elasticities for
media and events are higher than those from equations (1) and (2). This difference is likely due
to the fact that the VAR-model also accounts for the indirect benefits produced by the traditional
marketing activities (e.g. media events trigger WOM, which then leads to more signups),
something that the regression models (i.e. equations 1 and 2) do not take into account. In
contrast, WOM-referrals have a smaller short-term elasticity in the VAR setting. This suggests
that some of the estimated short-run effect in the regression models could be due to the firm’s
other marketing actions, which affect both WOM and signups in the same day.
Looking at the long-term elasticities, it indeed appears that WOM-referrals are akin to the
“gift that keeps on giving.” Due to the strong carryover, the 3-day, 7-day and long-term
elasticities are all higher than the regression-based estimates. In the long-run, Table 7 shows that
the elasticity of WOM referrals (0.53) is about 20 times higher than the elasticity for marketing
events (0.53 vs. 0.026) and 30 times higher than the elasticity for media appearances (0.53 vs.
0.017).
20
Effects of Word-of-Mouth versus Traditional Marketing
In sum, the long-term elasticity obtained from the VAR-model is higher than the direct
effect calculated from the regression models (equations 1 and 2). This indicates the importance
of accounting for the indirect effects illustrated in Figure 2. It is interesting to note that the direct
WOM elasticity (estimated from regression models) is close to the average advertising elasticity
of 0.10 to 0.20 reported in the literature (e.g., Hanssens et al 2001), but that the long-run
elasticity is several times higher. Thus, our results provide further impetus for advertising
researchers to go beyond the direct effects of advertising to incorporate indirect benefits such as
increasing retailer support (e.g., Reibstein and Farris 1995) and investor awareness (e.g., Joshi
and Hanssens 2006).
The findings from estimating the VAR model on the social networking site data illustrate
how the model incorporates the endogeneity among WOM, new customers, and other marketing
activity. A comparison of the VAR model with a series of alternative models also showed that it
provided the best fit to the data both in-sample and out-of-sample. Finally, through the impulse
response functions, the VAR modeling approach yields estimates of short-run and long-run
elasticities as well as the extent and nature of carryover dynamics.
Managerial Implications
The promising technical performance of the model when applied to the social networking
site data, raises the question how it can be used in practice. We now turn to a discussion of
several managerial implications. These include improved metrics for both WOM and traditional
marketing, testing changes in online WOM referral content, and evaluating the extent to which
financial incentives might be used to stimulate WOM.
21

Effects of Word-of-Mouth versus Traditional Marketing
Improved Metrics for WOM and Traditional Marketing
A key benefit from applying the proposed model in practice is likely to come from better
measures of the effects of both WOM and traditional marketing. As noted above, the VAR
model incorporates the potential endogeneity likely to be present with WOM, indirect effects
among marketing variables and WOM, and allows each variable (WOM and traditional
marketing) to have different – and potentially long-lasting – carryover effects. In the case of the
social networking site data, it turns out that the estimated long-run effects for both WOM and
traditional marketing are substantially higher than those provided by standard regression models
(even when those models incorporate carryover effects, as in equation 2).
An important factor that the VAR model captures is the indirect role that WOM plays in
augmenting the effects of promotional events. Because the firm’s promotional events were found
to cause (in the Granger sense) WOM and WOM caused (also in the Granger sense) new
signups, there is an additional pathway, via WOM, for traditional marketing activity to generate
new customers. The role and importance of this indirect effect becomes clearer with the advent
of accurate tracking of customer WOM together with the VAR modeling approach. The general
result is a potentially very different estimate of the return on the firm’s investments in
promotional event activity. Specifically, in our case, the elasticity for events was found to run
about four times higher than the elasticity implied from the best fitting standard regression
model. This higher response can then be used to re-evaluate the returns to the firm’s activity
levels in this area.
We also note that the VAR model (via the IRFs) implies a significant effect of media
while the regressions in Table 3 do not. While media does not Granger cause WOM in our data
set, it does Granger cause events, providing an additional indirect pathway for investments in
22
Effects of Word-of-Mouth versus Traditional Marketing
public relations to produce new customers for the firm. In sum, the explicit capture of the time
series of WOM activity (alongside other marketing and customer signups), together with the
flexible dynamics of the VAR model, offers managers a new lens with which to view the
productivity of both WOM as well as traditional marketing spending.
Testing Changes to Referral Content
When an existing member wants to refer a friend to join the site (the outbound referrals
we study), the member completes a preformatted message which is then sent out by email. At
many social networking sites (including major ones such as Facebook and MySpace), members
have relatively little control over the content and format of this invitation. While there is room
for a short text message, many of these are left blank. The upshot is that the firm is largely
responsible for the appearance and content of the referral message. This provides the
opportunity to test and refine the message. The firm could also consider targeting different
messages based on what is known about the referrer (e.g., demographics, usage history, etc.).
Our proposed modeling approach should be useful to managers in these and analogous settings
as a means to gauge the effect of different content executions while controlling for other
concurrent marketing activity. This could be done by, for example, estimating the model on the
data for different test periods or target samples.
Financial Incentives for WOM Referrals
A growing practice in both offline and online markets is to offer financial incentives to
existing customers to provide WOM referrals (e.g., the Netflix campaign mentioned earlier).
Authors of several studies in the academic WOM literature also have suggested that companies
should actively try to create WOM communication (e.g., Godes and Mayzlin 2004, Liu 2006,
23
Effects of Word-of-Mouth versus Traditional Marketing
and Rosen 2000). This raises the question to what extent should the firm be prepared to invest
financial resources to stimulate additional WOM?
Important input for such a referral program would be the value a WOM communication
provides to the firm. To this end, we conduct a simulation to illustrate the implications from
inducing additional WOM by offering financial incentives to existing customers. Our simulation
is based on the economics of the online advertising business model, which is standard to many
social networking sites. In this model, each new customer acquisition translates into an expected
number of banner ad exposures. For the simulation, we use industry averages for cost per
thousand impressions (CPM) and number of impressions per user/day while making assumptions
regarding customer’s projected lifetime with the firm. Of course, marketing practitioners should
use these results with caution as the suggested measures may vary greatly across firms. Other
online advertising models such as pay per click (PPC), pay per lead (PPL), and pay per sale
(PPS) could be incorporated in this analysis in a similar manner by substituting the appropriate
conversion rates.
While CPM on some premium sites could reach as much as $15, for most social
networking sites, CPM does not exceed a dollar. We have obtained price quotes from several
social networking sites and concluded that about 40 cents per thousand impressions is a
reasonable number. According to Nielsen//NetRatings (2005), the average number of pages
viewed on a community site by a unique visitor per month is about 130. From what we have
observed across multiple social networking sites, the average page carries about 2 to 3 ads.
Accordingly, the average user contributes approximately 13 cents per month or approximately
$1.50 a year. From the IRF analysis above, we estimated a long-run marginal effect of WOM of
0.52 or, in words, 10 WOM-referrals bring in approximately 5 new site members over the course
24
Effects of Word-of-Mouth versus Traditional Marketing
of 3 weeks.9 These figures imply that each outbound referral sent is worth about 75 cents per
year. By sending out 10 referrals, each network member could bring in about $7.50 to the firm.
An important caveat to this approach is that it cannot take into account the possible
difference between the quality of WOM that occurs naturally versus WOM stimulated by the
firm. Nonetheless we feel that managers can use figures derived from this type of approach as an
upper bound when contemplating the offer of financial incentives for WOM. For example, if the
firm cannot effectively generate additional referrals at less than 75 cents each, it should not
pursue firm-stimulated WOM programs.
Conclusion
The purpose of this study has been to add to our empirical understanding of the effects of
word-of-mouth marketing by taking advantage of new, detailed tracking information made
possible by the Internet. Using data from an online social networking site, we quantified the
effect of WOM referrals, which are recorded electronically, on new member signups to the site
(i.e., customer acquisitions). We also compare the effect of WOM versus traditional marketing
activity and examine its carryover dynamics. This permits us to speak to the relative
effectiveness of WOM both in the short-run and in the long-run.
Using a Vector Autoregression (VAR) model, we found that WOM referrals have a very
strong impact on new customer acquisition. The long-run elasticity for WOM referrals was
about 2.5 times higher than the average advertising elasticity reported in the literature. In
addition, our estimated WOM effect on new member signups is also substantially larger than that
of traditional forms of marketing used by the site. Long-run WOM is about 20 times higher than
the elasticity for marketing events (0.53 vs. 0.026) and 30 times higher than the elasticity for
9 Note that in our dataset the ratio of daily average number of signups to the daily average number of WOM-referrals is close to one (Table 2). Accordingly, the estimation of long-run marginal effect of WOM (0.52) appears to be not significantly different from the estimation of WOM elasticity (0.53).
25
Effects of Word-of-Mouth versus Traditional Marketing
media appearances (0.53 vs. 0.017). Part of the reason for the high long-run effect of WOM
relative to traditional marketing is that it has a much longer carryover period. We find that an
increase in WOM continues to impact new member signups for three weeks while traditional
marketing effects last for three to seven days.
An important feature of the VAR-based modeling approach is the ability to handle the
endogeneity and indirect effects among WOM, marketing activity, and new customer
acquisition. Results from Granger causality tests revealed that WOM and new signups are
endogenous, i.e., WOM leads to more new members and more new members lead to more
WOM. The tests also showed that WOM may also enhance the effect of traditional marketing
when that activity serves to stimulate WOM, as the firm’s promotional events did in our data set.
Because our VAR model specification incorporates all of these effects, the resulting elasticity
estimates should be more valid. Comparisons of the predictive validity of the VAR model
results versus a series of benchmark models (including regression and diffusion models)
provided additional evidence that the use of the VAR model is appropriate for this problem and
data.
We believe that our work has a number of important implications for practicing
managers. Our approach offers managers a tool to improve the metrics they use for assessing the
effectiveness of traditional marketing when WOM effects are present. Given the growth of
online social networks and other avenues for posting and presenting user-generated content, an
increasing number of business settings will offer the chance to gather accurate data on WOM
activity and include it in models of market response.
We also conducted a simulation analysis to illustrate the potential monetary implications
from inducing additional WOM by offering financial incentives to existing customers. Our
26
Effects of Word-of-Mouth versus Traditional Marketing
results suggest that social networking firms with a primary stream of revenues from online
display advertising might consider paying upwards of 75 cents for each referral. When a
company stimulates WOM activity, we note that it is no longer “organic” word-of-mouth.
Indeed, one might term it “fertilized” word-of-mouth. We do not know whether fertilized word-
of-mouth would produce the same elasticity as the organic word-of-mouth observed in our data.
If the paid nature of WOM activity is known to prospective members, fertilized word-of-mouth
may be substantially less effective than organic word-of-mouth. In this respect, our monetary
value calculations represent an upper bound of the money that could be generated by stimulating
word-of-mouth.
On the other hand, our data may miss some benefits from increasing word-of-mouth
activity. These could include signups not attributed to a referral (i.e., not captured in the referral
process or self-reported at signup). Finally, our simulation does not consider other important
aspects of customer lifetime value such as the impact that one user may have on retention and
site usage by other existing network members. Metcalfe's law (e.g., Reed 1999) states that the
value of a network is proportional to the square of the number of users of the system. Our
approach does not evaluate customer value beyond what can be attributed to a larger volume of
generated referrals. Thus, one logical next step would be to develop an individual level model
which allows for user-specific contributions to the network.
Our research also has several limitations which should be noted. Our data come from one
large social networking site, cover a period of less than one year, and are at the aggregate level.
This means that data limitations prevent us from analyzing the effects of WOM for – and
marketing actions by – competing sites. While unfortunate, this is also a situation common to
this type of company-specific data set. Because our data set tracks new signups and WOM at the
27
Effects of Word-of-Mouth versus Traditional Marketing
aggregate level, a second limitation is that we are unable to model heterogeneity. Thus, we do
not address segmentation in WOM response or potential differences in wear-out or saturation
effects at the individual level. Also, site members attracted in different ways (i.e. through WOM,
events or media appearances) could differ in visit frequency and pages viewed, and thus yield
different revenue benefits to the site (Villanueva, Yoo and Hanssens 2008). The lack of such
individual-level data did not allow us to make this distinction in our revenue calculations.
Another data-related limitation to our work is that the stationary nature of this company’s
signup series means that none of the changes to signups (including those caused by WOM and
other marketing actions) has a permanent impact. This is consistent with marketing effect
findings for large, established brands across industries (e.g. Nijs et al. 2001, Srinivasan et al.
2004), but not with those for smaller brands (Slotegraaf and Pauwels 2008). In light of our
description of how social networking sites start out (with a crucial mix of user-generated content
and WOM of founders to friends), signup growth/evolution for small sites may be driven by
network externalities (more user-generated content makes membership more valuable) and
WOM transmission beyond the initial audience of the founders’ friends. Moreover, smaller
social networks may not have sufficient funding to engage in traditional marketing events, and
thus necessarily focus on cost-effective options such as blogging and WOM campaigns
(Whitman 2006). Thus, our estimates of WOM elasticities for an established site are likely to be
conservative for smaller sites. More generally, further research is needed to determine whether
our substantive generalize to other companies and settings. We note that our results are
consistent with the spirit of the findings reported by East et al. (2005); in a review of 23 service
categories, they found that WOM had greater reported impact on brand choice than advertising
or personal search.
28

Effects of Word-of-Mouth versus Traditional Marketing
Lastly, our model is in reduced as opposed to structural form. This implies that the long-
run impact calculations are subject to the assumption that the basic data-generating process does
not change. This is appropriate for “innovation accounting,” i.e., identifying and quantifying the
effects of WOM and traditional marketing on signups in the data sample (Franses 2005; van
Heerde, Dekimpe, and Putsis 2005). The modeling approach is not suited for revealing structural
aspects of subscriber and company behavior.
In sum, our goal has been to shed new light on “the world’s most effective, yet least
understood marketing strategy” (Misner 1999). We do this by quantifying the dynamic
performance effects of word-of-mouth in an Internet social network setting – a setting which
offers researchers and managers a direct way of observing this phenomenon. Our elasticity
results add further evidence for the view that word-of-mouth communication is a critical factor
for firms seeking to acquire new customers and that WOM can have larger and longer-lasting
effects than traditional marketing activity. We also illustrate the potential monetary value of
stimulating additional word-of-mouth in the context of Internet social networks.
29
Effects of Word-of-Mouth versus Traditional Marketing
Table 1
Ranking of Internet Social Networking Sites
Social Networking Sites
Number of Visitors (in thousands)
MYSPACE.COM 41,889FACEBOOK.COM 12,917XANGA.COM 7,448LIVEJOURNAL.COM 4,047Yahoo! 360o 3,614MYYEARBOOK.COM 3,613HI5.COM 2,609TAGWORLD.COM 2,275TAGGED.COM 1,668BEBO.COM 1,096FRIENDSTER.COM 1,066Tribe 87143THINGS.COM 661SCONEX.COM 372Internet Total 171,421
Source: ComScore MediaMetrix, March 2006 Report
Table 2
Descriptive Statistics
Mean Median Maximum Minimum Std. Dev. Signups* 11.36 11.30 11.89 10.86 0.29
WOM-referrals* 11.37 11.42 12.09 10.53 0.38 Media 0.92 0 8 0 1.34 Events 0.39 0 4 0 0.64
* The figures reported in the table reflect a linear transformation of the original data to preserve the anonymity of the collaborating site. Actual data were used in the econometric analyses.
30
Effects of Word-of-Mouth versus Traditional Marketing
Table 3
Regression Analysis Results
Dependent Variable: Log of Signups
Equation 1 (immediate) Equation 2 (carry-over)
LogWOMReferrals
0.141 (6.38)*
0.136 (5.79)
LogMEDIA
0.000 (.57)
0.000 (0.39)
LogEVENTS
0.002 (2.06)
0.002 (2.13)
LogWOMReferrals(-1)
0.013 (0.57)
LogMEDIA(-1)
0.000 (0.26)
LogEVENTS(-1)
0.001 (0.97)
Constant
9.305 (36.88)
9.208 (29.91)
Time Trend
0.003 (24.91)
0.003 (23.89)
Monday
0.093 (5.96)
0.098 (5.79)
Tuesday
0.058 (3.16)
0.063 (3.05)
Wednesday
0.032 (1.68)
0.034 (1.67)
Thursday
0.013 (0.69)
0.015 (0.74)
Saturday
-0.053 (-2.93)
-0.050 (-2.66)
Sunday
-0.085 (-5.34)
-0.083 (-5.01)
Summer
0.136 (6.09)
0.140 (6.00)
Lagged dependent variable
0.453 (7.92)
0.451 (7.82)
R2
Adjusted R2
.932
.929
.932
.928
Akaike Information Criterion -2.248
-2.225
*t-statistics in parenthesis
31
Effects of Word-of-Mouth versus Traditional Marketing
Table 4
Results of the Granger Causality Tests
(Minimum p-values Across 20 lags)
Dependent Variable
Is Granger caused by:
Signups
WOM-referrals
Media
Events
Signups --- .02* .00 .00
WOM referrals .00 --- .22 .08
Media .00 .58 --- .02
Events .02 .00 .01 --- * Read as WOM-referrals are Granger caused by Signups at the .02 significance level.
Table 5
VAR Model Fit Results
Log likelihood AIC
Model without seasonality: signups, WOM-referrals, media, events
intercept, deterministic trend
-6165.59 48.48
With day of the week effect: signups, WOM-referrals, media, events
intercept, deterministic trend,
day of the week
-6096.28 48.13
With holiday effect: signups, WOM-referrals, media, events
intercept, deterministic trend,
day of the week, holiday
-6083.15 48.06
32
Effects of Word-of-Mouth versus Traditional Marketing
Table 6
In-Sample and Out-of-Sample Performance for Alternative Models*
VAR AR ARDL Base Bass
Bass with Covariates
Varying Coefficients
In-Sample RMSE 0.687 0.731 0.714 0.784 0.747 0.692 MAD 0.457 0.525 0.521 0.544 0.529 0.472
Out-of-Sample RMSE 1.302 1.630 1.454 1.563 1.525 1.681 MAD 1.051 1.384 1.182 1.217 1.207 1.427
* VAR - Vector Autoregression model; AR – Autoregressive model; ARDL - Autoregressive Distributed Lag model; Base Bass - the Bass diffusion model; Bass with Covariates - the Bass diffusion model extended to include marketing covariates; Varying coefficients - Varying coefficients model; RMSE - Root Mean Squared Error; MAD - Mean Absolute Deviation.
Table 7
Short-Term Versus Long-Term Elasticity of Signups with Respect to
WOM Referrals and Marketing Activities
1 day 3 days 7 days Long term
WOM Referrals 0.068 0.171 0.330 0.532
Media 0.008 0.017 0.017 0.017
Events 0.008 0.022 0.026 0.026
33
Effects of Word-of-Mouth versus Traditional Marketing
Figure 1a. Referrals Process at Friendster.com
34
Effects of Word-of-Mouth versus Traditional Marketing
Figure 1b. Referrals Process at Tribe.com
35
Effects of Word-of-Mouth versus Traditional Marketing
Figure 2
Modeling Framework
TRADITIONAL MARKETING
WOM REFERRALS NEW SIGNUPS
36
Effects of Word-of-Mouth versus Traditional Marketing
Figure 3. Model Fit: Tracking Plot*
0.00
2.00
4.00
6.00
8.00
10.00
12.00
14.00
16.00
2/3/2005 3/3/2005 3/31/2005 4/28/2005 5/26/2005 6/23/2005 7/21/2005 8/18/2005 9/15/2005 10/13/2005
ActualVAR
New
Sig
nups
(L
inea
r Tra
nsfo
rmat
ion)
*The Y-axis values shown in the figure reflect a linear transformation used to disguise the identity of the source.
37

Effects of Word-of-Mouth versus Traditional Marketing
Figure 4. IRFs: Response of Signups to Shock in Referrals, Media and Promotional Events
-0.5
0
0.5
1
1.5
2
2.5
3
1 3 5 7 9 11 13 15 17 19 21 23 25 27 29
Response to Shock in Referrals
Days
New
Sig
nups
-0.5
0
0.5
1
1.5
2
1 3 5 7 9 11 13 15 17 19 21 23 25 27 29
Response to Shock in Media
Days
New
Sig
nups
-0.5
0
0.5
1
1.5
2
1 3 5 7 9 11 13 15 17 19 21 23 25 27 29
Response to Shock in Events
Days
New
Sig
nups
38
Effects of Word-of-Mouth versus Traditional Marketing
Technical Appendix
This appendix provides further information and technical details on the (1) unit-root tests,
(2) Vector Autoregressive (VAR) model, (3) social contagion model (Bass Diffusion model with
and without marketing covariates), (4) varying coefficient model and (5) the in-sample and out-
of-sample fit analysis to compare the alternative models.
Testing for Evolution or Stationarity: Unit-Root Tests
We perform unit-root tests to determine whether each of the variables in our dataset are
stable (i.e. fluctuate temporarily around a fixed mean or trend) versus evolving (i.e. can deviate
permanently from previous levels). We use both the Augmented Dickey-Fuller test procedure
recommended by Enders (1995) and the Kwiatkowski-Phillips-Schmidt-Shin test (1992). The
former maintains evolution as the null hypothesis (and is the most popular in marketing
applications), while the latter maintains stationarity as the null hypothesis. Convergent
conclusions of these two tests yield higher confidence in our variable classification (Maddala and
Kim 1998). In our case, results of both tests confirmed trend stationarity in all series (i.e., all
series appeared stationary after controlling for deterministic trend). Thus, we conclude that we
can perform our model estimations with the variables in levels.
Vector Autoregressive Model
We propose a four-variable VAR system to capture the dynamic interactions among
signups, WOM (invitations), and traditional marketing (media appearances and promotional
events). Equation (A1) displays the model:
11 12 13 14
21 22 23 24
1 31 32 33 34
41 42 43 44
j j j j t jt Y Y Y Yj j j jJ
tt X X X Xj j j j
jt M M M Mj j j j
E E E Et
YY CXX C
T H DM C
CE
δ θ γ φ φ φ φδ θ γ φ φ φ φδ θ γ φ φ φ φδ θ γ φ φ φ φ
−
−
=
⎡ ⎤⎡ ⎤ ⎡ ⎤ ⎡ ⎤ ⎡ ⎤ ⎡ ⎤⎢ ⎥⎢ ⎥ ⎢ ⎥ ⎢ ⎥ ⎢ ⎥ ⎢ ⎥⎢ ⎥⎢ ⎥ ⎢ ⎥ ⎢ ⎥ ⎢ ⎥ ⎢ ⎥= + × + × + +⎢ ⎥⎢ ⎥ ⎢ ⎥ ⎢ ⎥ ⎢ ⎥ ⎢ ⎥⎢ ⎥⎢ ⎥ ⎢ ⎥ ⎢ ⎥ ⎢ ⎥ ⎢ ⎥⎢ ⎥⎣ ⎦ ⎣ ⎦ ⎣ ⎦ ⎣ ⎦⎣ ⎦ ⎣ ⎦
∑
,
,
,
,
Y t
j X t
t j M t
E tt j
M
E
ε
ε
ε
ε−
−
⎡ ⎤ ⎡ ⎤⎢ ⎥ ⎢ ⎥⎢ ⎥ ⎢+⎢ ⎥ ⎢⎢ ⎥ ⎢ ⎥⎢ ⎥ ⎢ ⎥⎣ ⎦⎣ ⎦
⎥⎥
(A1)
39
Effects of Word-of-Mouth versus Traditional Marketing
where t indexes days, J equals the number of lags included (based on the Akaike Information
Criterion), D is the vector of day-of-week dummies and tε are white-noise disturbances
distributed as . (0, )N ∑
In equation (A1) the vector of endogenous variables – signups (Y), WOM-referrals (X),
media appearances (M) and promotional events (E) – is also related to its own past, which allows
complex dynamic interactions among these variables. The vector of exogenous variables
includes (i) an intercept C, (ii) a deterministic-trend variable T, to capture the impact of omitted,
gradually changing variables, (iii) indicators for days of the week D, and (iv) seasonal (e.g.,
Holidays) dummy variables H. Instantaneous effects are captured by the variance-covariance
matrix of the residuals . ∑
Because it is infeasible to interpret estimated VAR-coefficients directly (Sims 1980),
researchers use the estimated coefficients to calculate impulse response functions (IRFs). The
IRF simulates the over-time impact of a change (over its baseline) to one variable on the full
dynamic system and thus represents the net result of all modeled actions and reactions (see
Pauwels 2004 for an elaborate discussion). With regard to identification, we adopt the
generalized IRF, i.e., simultaneous-shocking approach (Pesaran and Shin 1998). This uses
information in the residual variance-covariance matrix of the VAR model, instead of requiring
the researcher to impose a causal ordering among the endogenous variables (Dekimpe and
Hanssens 1999). In the context of our research questions, we use impulse response functions to
disentangle the short and the long-run effects of WOM and traditional marketing on signups.
Consistent with previous VAR literature (Pesaran, Pierse, and Lee 1993, Sims and Zha 1999), we
use |tvalue| < 1 to assess whether each impulse-response value is significantly different from zero.
This also follows the tradition of VAR-related research published in marketing.
40
Effects of Word-of-Mouth versus Traditional Marketing
Finally, we translate the IRF results into long-run elasticity by calculating arc elasticities
as follows. First, the IRF analysis yields the total change in number of signups, , in response
to a one standard deviation shock to WOM referrals. Second, using our data, we calculate the
standard deviation for word-of-mouth referrals (
Y∆
Xσ ) and mean values for signups (Y ) and
WOM-referrals ( X ). Lastly, we calculate the arc elasticity, arcη , as arcX
Y XY
ησ∆
= × . Note that
this is a standard elasticity formula, except that Xσ is substituted for X∆ . This follows because
Xσ the change in X that is used to generate the IRF.
Social Contagion Model (Bass Diffusion Model)
Social contagion models (such as the Bass diffusion model) allow for several dynamic
processes in the growth of online communities, and have recently been applied to this setting
(e.g., Firth et al 2006). An important issue is that stable and robust parameter estimates for the
Bass model are obtained only if the data include the peak for the noncumulative adoption curve,
which is hard to assess a priori (Heeler and Hustad 1980; Srinivasan and Mason 1986). To
address this problem, we assist the Bass model by using information about the number of site
members observed in the time since the detailed original data were collected (specifically, two
years later). We also ensure that the selected value for m (market capacity) provides the best
possible model fit to the in-sample data. The Bass model and extended Bass model are both
estimated with non-linear least squares (e.g., Srinivasan and Mason 1986).
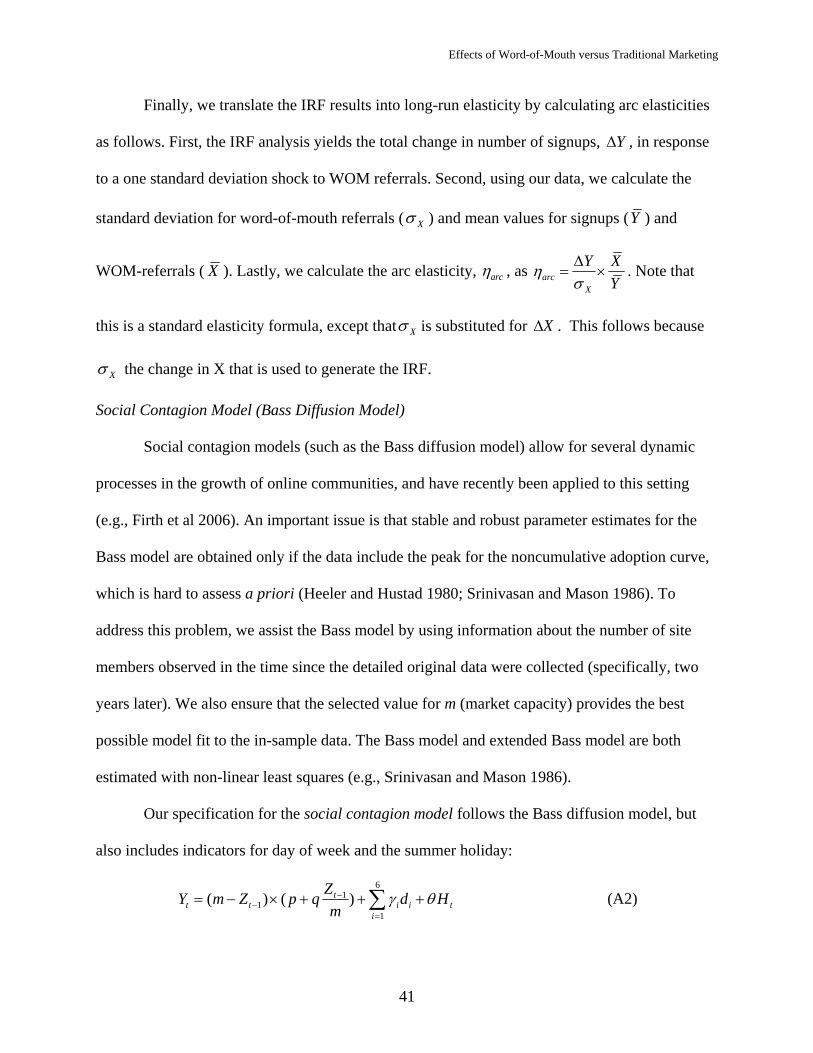
Our specification for the social contagion model follows the Bass diffusion model, but
also includes indicators for day of week and the summer holiday:
61
11
( ) ( )tt t i i
i
ZY m Z p q d Hm tγ θ−
−=
= − × + + +∑ (A2)
41
Effects of Word-of-Mouth versus Traditional Marketing
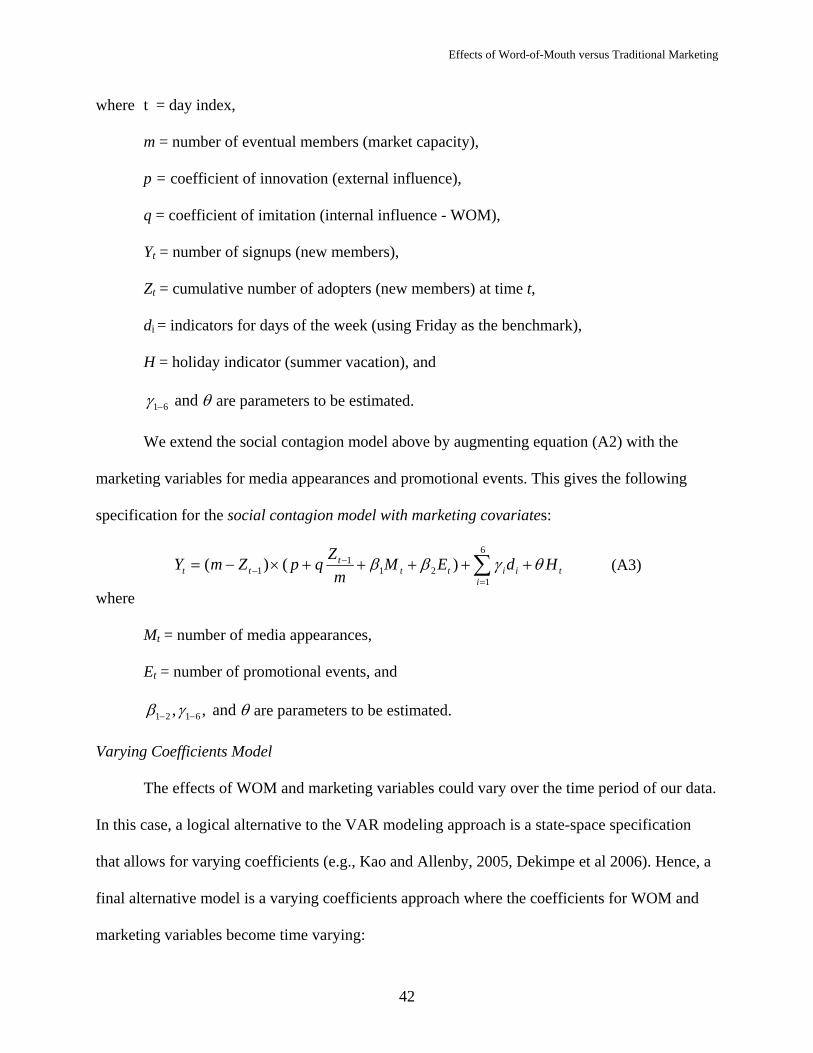
where t = day index,
m = number of eventual members (market capacity),
p = coefficient of innovation (external influence),
q = coefficient of imitation (internal influence - WOM),
Yt = number of signups (new members),
Zt = cumulative number of adopters (new members) at time t,
di = indicators for days of the week (using Friday as the benchmark),
H = holiday indicator (summer vacation), and
1 6 and γ θ− are parameters to be estimated.
We extend the social contagion model above by augmenting equation (A2) with the
marketing variables for media appearances and promotional events. This gives the following
specification for the social contagion model with marketing covariates:
61
1 1 21
( ) ( )tt t t t i i
i
ZY m Z p q M E d Hm tβ β γ θ−
−=
= − × + + + + +∑ (A3)
where
Mt = number of media appearances,
Et = number of promotional events, and
1 2 1 6, , and β γ− − θ are parameters to be estimated.
Varying Coefficients Model
The effects of WOM and marketing variables could vary over the time period of our data.
In this case, a logical alternative to the VAR modeling approach is a state-space specification
that allows for varying coefficients (e.g., Kao and Allenby, 2005, Dekimpe et al 2006). Hence, a
final alternative model is a varying coefficients approach where the coefficients for WOM and
marketing variables become time varying:
42
Effects of Word-of-Mouth versus Traditional Marketing
6
1 2 31
t t tt t t t i i t
iY X M E C T d H tβ β β δ γ θ
=
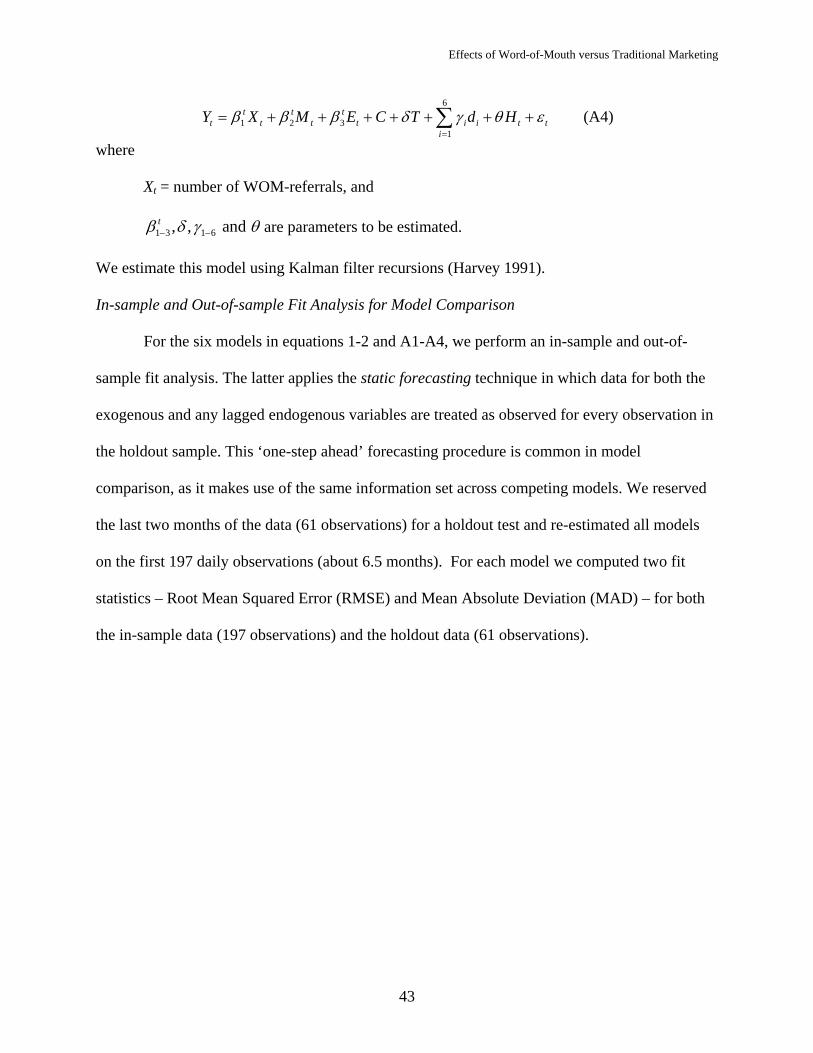
= + + + + + + +∑ ε (A4)
where
Xt = number of WOM-referrals, and
1 3 1 6, , and tβ δ γ θ− − are parameters to be estimated.
We estimate this model using Kalman filter recursions (Harvey 1991).
In-sample and Out-of-sample Fit Analysis for Model Comparison
For the six models in equations 1-2 and A1-A4, we perform an in-sample and out-of-
sample fit analysis. The latter applies the static forecasting technique in which data for both the
exogenous and any lagged endogenous variables are treated as observed for every observation in
the holdout sample. This ‘one-step ahead’ forecasting procedure is common in model
comparison, as it makes use of the same information set across competing models. We reserved
the last two months of the data (61 observations) for a holdout test and re-estimated all models
on the first 197 daily observations (about 6.5 months). For each model we computed two fit
statistics – Root Mean Squared Error (RMSE) and Mean Absolute Deviation (MAD) – for both
the in-sample data (197 observations) and the holdout data (61 observations).
43
Effects of Word-of-Mouth versus Traditional Marketing
References
Box, George E.P. and Gwilym M. Jenkins (1970), Time series analysis: Forecasting and control,
San Francisco: Holden-Day.
Chevalier, Judith, and Dina Mayzlin (2006), “The Effect of Word of Mouth Online: Online Book
Reviews,” Journal of Marketing Research, 43 (August), 345-354.
Coleman, James S., Elihu Katz, and Herbert Menzel (1966), Medical Innovation: A Diffusion
Study. Indianapolis: Bobbs-Merrill.
comScore Media Metrix (2006), “Total Number of Unique Visitors to Selected Social
Networking Sites, as of March 2006,” (accessed May 22, 2006), [available at
http://www.emergencemarketing.com/archives/2006/05/social_networking_sites_d.php].
De Bruyn, Arnaud, and Gary L. Lilien (2007), “A Multi-Stage Model of Word of Mouth through
Viral Marketing,” International Journal of Research in Marketing, forthcoming.
Dekimpe, Marnik G., Philip Hans Franses, Dominique M. Hanssens, and Prasad A. Naik (2006),
“Time-Series Models in Marketing,” ERIM Report Series Research In Management,
Erasmus Research Institute of Management.
Dekimpe, Marnik, and Dominique M. Hanssens (1995), “The Persistence of Marketing Effects
on Sales,” Marketing Science, 14(1), 1-21.
Dekimpe, Marnik, and Dominique M. Hanssens (1999), “Sustained Spending and Persistent
Response: a New Look at Long-term Marketing Profitability,” Journal of Marketing
Research, 36 (November), 397-412.
East, Robert, Kathy Hammond, Wendy Lomax, and Helen Robinson (2005), “What is the Effect
of a Recommendation?” Marketing Review, 5, 2, 145-157.
Enders, Walter (1995), Applied Econometric Time Series, Wiley, New York.
Firth, David R., Cameron Lawrence, and Shawn F. Clouse (2006), “Predicting Internet-based
Online Community Size and Time to Peak Membership Using the Bass Model of New
Product Growth,” Interdisciplinary Journal of Information, Knowledge, and Management,
1, 1-12.
Forrester Research (2005), “What’s The Buzz on Word-Of-Mouth Marketing? Social Computing
and Consumer Control Put Momentum into Viral Marketing,” May (2005),
www.forrester.com.
44
Effects of Word-of-Mouth versus Traditional Marketing
Franses, Philip Hans (2005), “On the Use of Econometric Models for Policy Simulation in
Marketing,” Journal of Marketing Research, 42, 4-14.
Godes, David, and Dina Mayzlin (2004), “Using Online Conversations to Study Word-of-Mouth
Communication,” Marketing Science, 23 (4), 545-560.
Godes, David, Dina Mayzlin, Yubo Chen, Sanjiv Das, Chrysanthos Dellarocas, Bruce Pfeiffer,
Barak Libai, Subrata Sen, Mengze Shi, and Peeter Verlegh (2005), “The Firm's Management
of Social Interactions,” Marketing Letters, 16:3/4, 415-428.
Granger, Clive W.J. (1969), “Investigating Causal Relations by Econometric Models and Cross-
Spectral Methods,” Econometrica, 37, 424–438.
Hanssens, Dominique M. (1980), “Market Response, Competitive Behavior, and Time Series
Analysis,” Journal of Marketing Research, 17 (November), 470-485.
Hanssens, Dominique M., Leonard J. Parsons, and Randall L. Schultz (2001), Market Response
Models: Econometric and Time-Series Research, 2nd ed., Kluwer Academic Publishers,
Boston, MA.
Harvey, Andrew C. (1991), Forecasting, Structural Time Series Models and the Kalman Filter,
Cambridge University Press, Cambridge.
Heeler, Roger M. and Thomas P. Hustad (1980), “Problems in Predicting New Product Growth
for Consumer Durables,” Management Science, 26 (October), 1007-20.
Joshi, Amit and Dominique M. Hanssens (2006), “Advertising Spending and Market
Capitalization,” Marketing Science Institute Report No. 04-110.
Kao, Ling-Jing and Greg M. Allenby (2005), “Estimating State-Space Models of Economic
Behavior: A Hierarchical Bayes Approach,” Working Paper, The Ohio State University.
Katz, Elihu, and Paul F. Lazarsfeld (1955), Personal Influence; The Part Played by People in the
Flow of Mass Communications, Glencoe, Ill. Free Press.
Kwiatkowski, Denis, Peter C. B. Phillips, Peter Schmidt, and Yongcheol Shin (1992), “Testing
the Null Hypothesis of Stationarity Against the Alternative of a Unit Root: How Sure Are
We that Economic Time Series Have a Unit Root?” Journal of Econometrics, 54(1-3), 159-
178.
Liu, Yong (2006), “Word-of-Mouth for Movies: Its Dynamics and Impact on Box Office
Revenue,” Journal of Marketing, 70 (July), 74-89.
45
Effects of Word-of-Mouth versus Traditional Marketing
Lutkepohl, Helmut (1993), Introduction to Multiple Time Series Analysis, Springer-Verlag,
Berlin, Germany.
Misner, Ivan R. (1999), The World’s Best Known Marketing Secret: Building Your Business with
Word-of-Mouth Marketing, 2nd ed. Bard Press, Austin, TX.
Maddala, G.S. and I.M. Kim (1998), Unit Roots, Cointegration, and Structural Change,
Cambridge, University Press, Cambridge.
Money, Bruce R., Mary C. Gilly, and John L. Graham (1998), “Explorations of National Culture
and Word-Of-Mouth Referral Behavior in the Purchase of Industrial Services in the United
States and Japan,” Journal of Marketing, 62 (4), 76-87.
Montgomery, Alan L., Shibo Li, Kannan Srinivasan, and John C. Liechty (2004), “Modeling
Online Browsing and Path Analysis Using Click-stream Data,” Marketing Science, 23(4),
579-595.
Nielsen//NetRatings (2005), “A Community Uprising,” February, www.nielsen-netratings.com.
Nijs, Vincent, Marnik Dekimpe, Jan-Benedict E. M. Steenkamp, and Dominique Hanssens
(2001), “The Category Demand Effects of Price Promotions,” Marketing Science, 20(1), 1-
22.
Pauwels, Koen (2004), “How Dynamic Consumer Response, Competitor Response, Company
Support, and Company Inertia Shape Long-Term Marketing Effectiveness,” Marketing
Science, 23(4), 596-610.
Pauwels, Koen and Enrique Dans (2001), “Internet Marketing the News: Leveraging Brand
Equity from Marketplace to Marketspace,” Brand Management, 8(4), 303-314.
Pauwels, Koen, Dominique Hanssens, and S. Siddarth (2002), “The Long-term Effects of Price
Promotions on Category Incidence, Brand Choice and Purchase Quantity,” Journal of
Marketing Research, 39 (November), 421-439.
Pauwels, Koen, Jorge Silva-Risso, Shuba Srinivasan and Dominique Hanssens (2004), "New
Products, Sales Promotions and Firm Value: The Case of the Automobile Industry", Journal
of Marketing, 68 (October), 142-156.
Pesaran, M. Hashem, Richard G. Pierse, and Kevin C. Lee (1993), “Persistence, Cointegration,
and Aggregation: A Disaggregated Analysis of Output Fluctuations in the U.S. Economy,”
Journal of Econometrics, 56 (March), 57-88.
46
Effects of Word-of-Mouth versus Traditional Marketing
Pesaran, M. Hashem, and Yongcheol Shin (1998), “Generalized Impulse Response Analysis in
Linear Multivariate Models,” Economics Letters, Vol.58, 17-29.
Phelps, Joseph E., Lewis, Regina, Lynne Mobilio, David Perry, and Niranjan Raman (2004),
“Viral Marketing or Electronic W-O-M Advertising: Examining Consumer Responses to
Pass Along Email,” Journal of Advertising Research, 44(4), 333-348.
Reed, David P. (1999), “Weapon of Math Destruction: a Simple Formula Explains Why the
Internet is Wreaking Havoc on Business Models,” Context Magazine, Spring 1999.
Reibstein, David J. and Paul W. Farris (1995), “Market Share and Distribution: A Speculation,
and Some Implications,” Marketing Science, (14), 3 (part 2), 190-202.
Rosen, Emmanuel (2000), The Anatomy of Buzz: How to Create Word-of-Mouth Marketing,
New York: Doubleday.
Sims, Christopher A. (1980), “Macroeconomics and Reality,” Econometrica, vol. 48(1), 1-48.
Sims, Christopher A. and Tao Zha (1999), “Error Bands for Impulse Responses,” Econometrica,
67 (5), 1113-1155.
Slotegraaf, Rebecca and Koen Pauwels (2008), “The Impact of Brand Equity and Innovation on
the Long-term Effectiveness of Promotions,” Journal of Marketing Research, forthcoming.
Srinivasan, Shuba, Koen Pauwels, Dominique M. Hanssens, and Marnik G. Dekimpe (2004),
“Do Promotions Benefit Manufacturers, Retailers, or Both?” Management Science, 50
(May), 617-629.
Srinivasan, V. and Mason, Charlotte H. (1986), “Nonlinear Least Squares Estimation of New
Product Diffusion Models,” Marketing Science, (5), 2 (Spring), 169–178.
Van Heerde, Harald J., Marnik. G. Dekimpe, and William P. Putsis, Jr. (2005), “Marketing
Models and the Lucas Critique,” Journal of Marketing Research, February, 42 (1), 15-21.
Van den Bulte, Christophe and Gary Lilien (2001), “Medical Innovation Revisited: Social
Contagion versus Marketing Effort,” American Journal of Sociology, 106 (5), 1409-1435.
Villanueva, Julian, Shijin Yoo, and Dominique M. Hanssens (2008), “The Impact of Marketing-
Induced vs. Word-of-Mouth Customer Acquisition on Customer Equity Growth,” Journal of
Marketing Research, February, 45 (1), 48-59.
Whitman, Janet (2006), “Lessons Learned: New Dot-Coms Seek Attention Cheaply,” The Wall
Street Journal, February 13, B3A.
47
Effects of Word-of-Mouth versus Traditional Marketing
Wikipedia (2006), “List of Social Networking Websites,” (accessed May 22, 2006), [available at
http://en.wikipedia.org/wiki/List_of_social_networking_websites].
48