An examination of the validity of the Subjective Vitality Questionnaire
15
UNCORRECTED PROOF AUTHOR’S QUERY SHEET Author(s): J.R. Abrams et al. RMMM 337112 Article title: Article no: Dear Author The following queries have arisen during the editing of your manuscript and are identified on the proofs. Unless advised otherwise, please submit all corrections using the CATS online correction form. AQ1 Please provide full reference details for [Ytsma, Viladot, and Giles (1985)]. AQ2 Please check the value in Table [1].
-
Upload
universidadlagrancolombia -
Category
Documents
-
view
2 -
download
0
Transcript of An examination of the validity of the Subjective Vitality Questionnaire

UNCORRECTED PROOF
AUTHOR’S QUERY SHEET
Author(s): J.R. Abrams et al. RMMM 337112Article title:Article no:
Dear Author
The following queries have arisen during the editing of your manuscript andare identified on the proofs. Unless advised otherwise, please submit allcorrections using the CATS online correction form.
AQ1 Please provide full reference details for [Ytsma, Viladot, and Giles(1985)].
AQ2 Please check the value in Table [1].
UNCORRECTED PROOF
An examination of the validity of the Subjective Vitality Questionnaire
Jessica R. Abramsa*, Valerie Barkerb, and Howard Gilesc
aDepartment of Communication Studies, California State University, Long Beach, USA;bDepartment of Communication, California State University, San Diego, USA; cDepartment ofCommunication, University of California, Santa Barbara, USA
(Received 18 April 2008; final version received 08 July 2008)
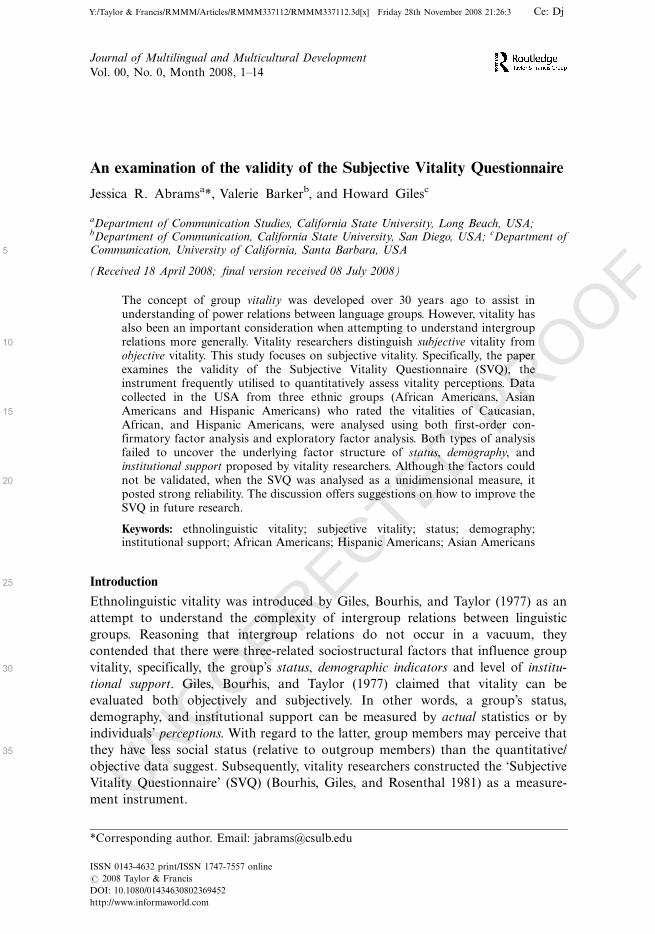
The concept of group vitality was developed over 30 years ago to assist inunderstanding of power relations between language groups. However, vitality hasalso been an important consideration when attempting to understand intergrouprelations more generally. Vitality researchers distinguish subjective vitality fromobjective vitality. This study focuses on subjective vitality. Specifically, the paperexamines the validity of the Subjective Vitality Questionnaire (SVQ), theinstrument frequently utilised to quantitatively assess vitality perceptions. Datacollected in the USA from three ethnic groups (African Americans, AsianAmericans and Hispanic Americans) who rated the vitalities of Caucasian,African, and Hispanic Americans, were analysed using both first-order con-firmatory factor analysis and exploratory factor analysis. Both types of analysisfailed to uncover the underlying factor structure of status, demography, andinstitutional support proposed by vitality researchers. Although the factors couldnot be validated, when the SVQ was analysed as a unidimensional measure, itposted strong reliability. The discussion offers suggestions on how to improve theSVQ in future research.
Keywords: ethnolinguistic vitality; subjective vitality; status; demography;institutional support; African Americans; Hispanic Americans; Asian Americans
Introduction
Ethnolinguistic vitality was introduced by Giles, Bourhis, and Taylor (1977) as an
attempt to understand the complexity of intergroup relations between linguistic
groups. Reasoning that intergroup relations do not occur in a vacuum, they
contended that there were three-related sociostructural factors that influence group
vitality, specifically, the group’s status, demographic indicators and level of institu-
tional support. Giles, Bourhis, and Taylor (1977) claimed that vitality can be
evaluated both objectively and subjectively. In other words, a group’s status,
demography, and institutional support can be measured by actual statistics or by
individuals’ perceptions. With regard to the latter, group members may perceive that
they have less social status (relative to outgroup members) than the quantitative/
objective data suggest. Subsequently, vitality researchers constructed the ‘Subjective
Vitality Questionnaire’ (SVQ) (Bourhis, Giles, and Rosenthal 1981) as a measure-
ment instrument.
5
10
15
20
25
30
35
*Corresponding author. Email: [email protected]
Journal of Multilingual and Multicultural Development
Vol. 00, No. 0, Month 2008, 1�14
ISSN 0143-4632 print/ISSN 1747-7557 online
# 2008 Taylor & Francis
DOI: 10.1080/01434630802369452
http://www.informaworld.com
Y:/Taylor & Francis/RMMM/Articles/RMMM337112/RMMM337112.3d[x] Friday 28th November 2008 21:26:3 Ce: Dj
UNCORRECTED PROOF
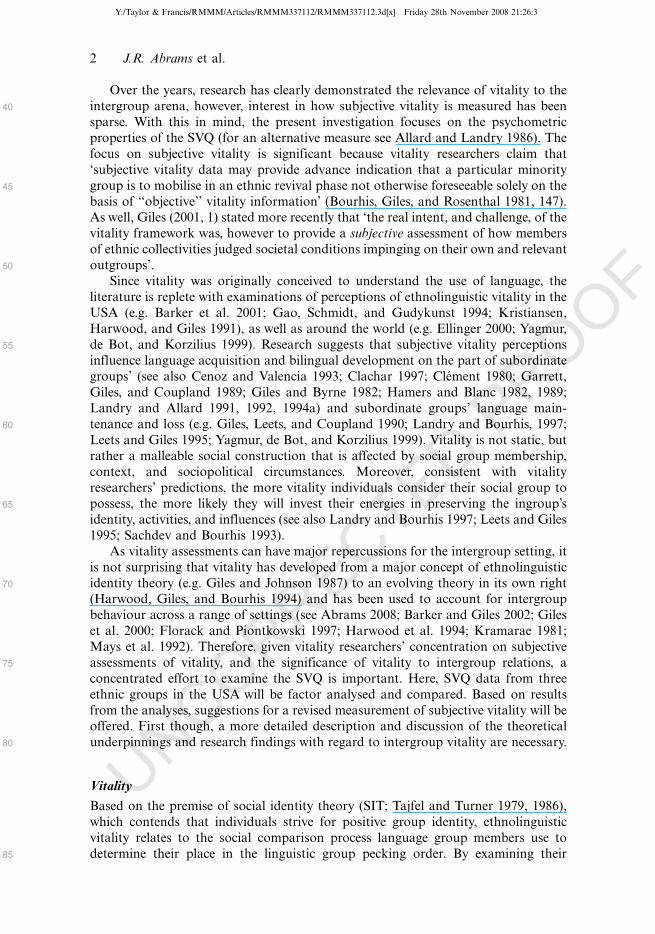
Over the years, research has clearly demonstrated the relevance of vitality to the
intergroup arena, however, interest in how subjective vitality is measured has been
sparse. With this in mind, the present investigation focuses on the psychometric
properties of the SVQ (for an alternative measure see Allard and Landry 1986). The
focus on subjective vitality is significant because vitality researchers claim that
‘subjective vitality data may provide advance indication that a particular minority
group is to mobilise in an ethnic revival phase not otherwise foreseeable solely on the
basis of ‘‘objective’’ vitality information’ (Bourhis, Giles, and Rosenthal 1981, 147).As well, Giles (2001, 1) stated more recently that ‘the real intent, and challenge, of the
vitality framework was, however to provide a subjective assessment of how members
of ethnic collectivities judged societal conditions impinging on their own and relevant
outgroups’.
Since vitality was originally conceived to understand the use of language, the
literature is replete with examinations of perceptions of ethnolinguistic vitality in the
USA (e.g. Barker et al. 2001; Gao, Schmidt, and Gudykunst 1994; Kristiansen,
Harwood, and Giles 1991), as well as around the world (e.g. Ellinger 2000; Yagmur,de Bot, and Korzilius 1999). Research suggests that subjective vitality perceptions
influence language acquisition and bilingual development on the part of subordinate
groups’ (see also Cenoz and Valencia 1993; Clachar 1997; Clement 1980; Garrett,
Giles, and Coupland 1989; Giles and Byrne 1982; Hamers and Blanc 1982, 1989;
Landry and Allard 1991, 1992, 1994a) and subordinate groups’ language main-
tenance and loss (e.g. Giles, Leets, and Coupland 1990; Landry and Bourhis, 1997;
Leets and Giles 1995; Yagmur, de Bot, and Korzilius 1999). Vitality is not static, but
rather a malleable social construction that is affected by social group membership,context, and sociopolitical circumstances. Moreover, consistent with vitality
researchers’ predictions, the more vitality individuals consider their social group to
possess, the more likely they will invest their energies in preserving the ingroup’s
identity, activities, and influences (see also Landry and Bourhis 1997; Leets and Giles
1995; Sachdev and Bourhis 1993).
As vitality assessments can have major repercussions for the intergroup setting, it
is not surprising that vitality has developed from a major concept of ethnolinguistic
identity theory (e.g. Giles and Johnson 1987) to an evolving theory in its own right(Harwood, Giles, and Bourhis 1994) and has been used to account for intergroup
behaviour across a range of settings (see Abrams 2008; Barker and Giles 2002; Giles
et al. 2000; Florack and Piontkowski 1997; Harwood et al. 1994; Kramarae 1981;
Mays et al. 1992). Therefore, given vitality researchers’ concentration on subjective
assessments of vitality, and the significance of vitality to intergroup relations, a
concentrated effort to examine the SVQ is important. Here, SVQ data from three
ethnic groups in the USA will be factor analysed and compared. Based on results
from the analyses, suggestions for a revised measurement of subjective vitality will beoffered. First though, a more detailed description and discussion of the theoretical
underpinnings and research findings with regard to intergroup vitality are necessary.
Vitality
Based on the premise of social identity theory (SIT; Tajfel and Turner 1979, 1986),
which contends that individuals strive for positive group identity, ethnolinguistic
vitality relates to the social comparison process language group members use to
determine their place in the linguistic group pecking order. By examining their
40
45
50
55
60
65
70
75
80
85
2 J.R. Abrams et al.
Y:/Taylor & Francis/RMMM/Articles/RMMM337112/RMMM337112.3d[x] Friday 28th November 2008 21:26:3
UNCORRECTED PROOF
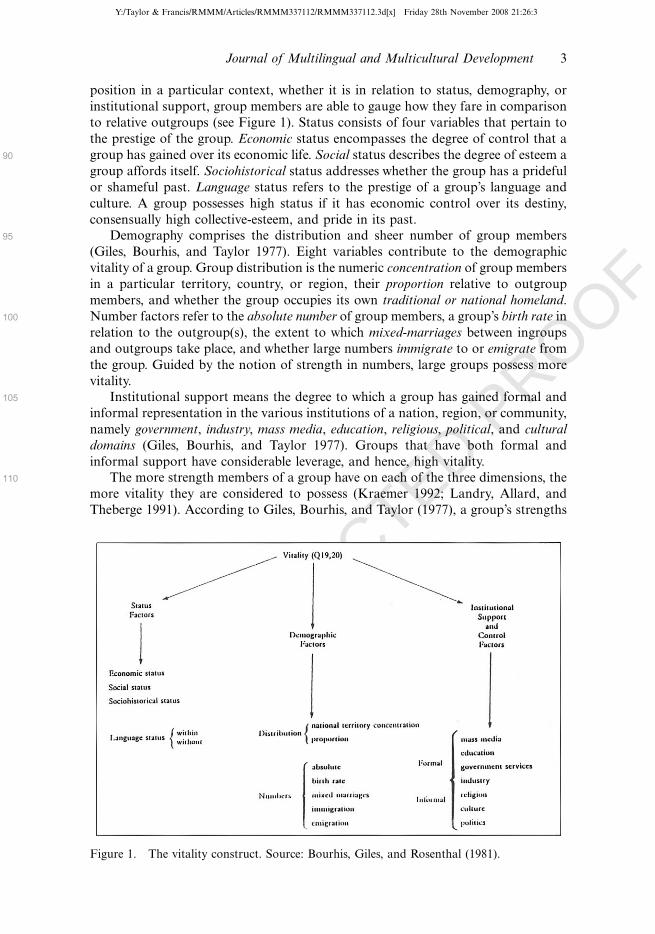
position in a particular context, whether it is in relation to status, demography, or
institutional support, group members are able to gauge how they fare in comparison
to relative outgroups (see Figure 1). Status consists of four variables that pertain to
the prestige of the group. Economic status encompasses the degree of control that a
group has gained over its economic life. Social status describes the degree of esteem a
group affords itself. Sociohistorical status addresses whether the group has a prideful
or shameful past. Language status refers to the prestige of a group’s language and
culture. A group possesses high status if it has economic control over its destiny,
consensually high collective-esteem, and pride in its past.
Demography comprises the distribution and sheer number of group members
(Giles, Bourhis, and Taylor 1977). Eight variables contribute to the demographic
vitality of a group. Group distribution is the numeric concentration of group members
in a particular territory, country, or region, their proportion relative to outgroup
members, and whether the group occupies its own traditional or national homeland.
Number factors refer to the absolute number of group members, a group’s birth rate in
relation to the outgroup(s), the extent to which mixed-marriages between ingroups
and outgroups take place, and whether large numbers immigrate to or emigrate from
the group. Guided by the notion of strength in numbers, large groups possess more
vitality.
Institutional support means the degree to which a group has gained formal and
informal representation in the various institutions of a nation, region, or community,
namely government, industry, mass media, education, religious, political, and cultural
domains (Giles, Bourhis, and Taylor 1977). Groups that have both formal and
informal support have considerable leverage, and hence, high vitality.
The more strength members of a group have on each of the three dimensions, the
more vitality they are considered to possess (Kraemer 1992; Landry, Allard, and
Theberge 1991). According to Giles, Bourhis, and Taylor (1977), a group’s strengths
90
95
100
105
110
Figure 1. The vitality construct. Source: Bourhis, Giles, and Rosenthal (1981).
Journal of Multilingual and Multicultural Development 3
Y:/Taylor & Francis/RMMM/Articles/RMMM337112/RMMM337112.3d[x] Friday 28th November 2008 21:26:3
UNCORRECTED PROOF
on each of the three domains can be assessed so as to provide a classification of low,
medium, or high vitality. Groups with high vitality are likely to prosper and flourish,
whereas groups with low vitality are likely to atrophy, and ultimately disappear as
distinct entities (Giles and Johnson 1981).
Subjective Vitality Questionnaire (SVQ)
Although research has established the heuristic value of vitality as a concept, explicit
attention has yet to be paid to the SVQ’s success in measuring it (see the debate,Husband and Khan 1982; Johnson, Giles, and Bourhis 1983). Perhaps, the SVQ has
not been examined in detail because in one of the first attempts to validate the
measure, the researchers were able to confirm the posited structure fairly convin-
cingly albeit with four factors. Specifically, when Giles, Rosenthal, and Young (1985)
investigated vitality by looking at Greek, Australians and Anglo Australians, four
factors emerged from the data (institutional support and power, demography I,
status, and demography II). Since these results provided a relatively strong validation
for the SVQ, there was little reason to challenge or reconsider the measure. Now thatmore than two decades have past, numerous studies utilising the SVQ have resulted in
a variety of outcomes that make it pertinent to revisit the measure and critically
examine its psychometric properties.
Close inspection of the literature reveals that researchers rarely examine the
underlying structure of the data when using the SVQ. In cases where this has
happened, some weaknesses emerge. First, when researchers have examined the
validity of the SVQ, they have not consistently been able to confirm a three-factor
solution. For example, when Currie and Hogg (1994) factor analysed their data onsocial adaptation among Vietnamese refugees in Australia using the SVQ, a six-
factor solution emerged. However, three of the six were indistinct and contributed
minimally to the total variance, and therefore, what remained was a three-factor
solution. Importantly, the remaining factor structure did not confirm the three
separate vitality factors. In their words, the factors reflect: (1) political and economic
vitality; (2) language vitality; and (3) cultural and religious vitality rather than the
expected vitality factors of status, demography, and institutional support. Similarly,
in their work using the SVQ to address relative vitality, Kraemer, Olshtain, andBadier’s (1994) factor analysis produced a four-factor solution (although the fourth
factor only comprised one item). Their data produced two status factors, group status
and language/cultural status factor, and a demography factor.
Some research attests to the reliability of the SVQ without first examining the
validity. For example, in their investigation of the relationship between ethnolinguis-
tic vitality and second language proficiency, Labrie and Clement (1986, 279) report
that the ‘internal consistency reliability coefficients obtained for the perceived vitality
scales support the reliability of the corresponding construct’. However, since only oneCronbach alpha (0.85) is reported and the intercorrelations between subscales are
described rather than subscale reliabilities, the data do not appear to have been factor
analysed. In other words, the underlying structure of the data was not validated.
Failure to confirm the three factors appears to be somewhat common when using
the SVQ (see Allard and Landry 1994; Clement 1986; Ytsma, Viladot, and Giles
1985). Indeed, in commenting on the structure of the vitality construct, Sachdev and
Bourhis (1993, 39) stated that even ‘after fifteen years of vitality research only a few
studies have assessed the factorial structure of subjective vitality’. One exception is
115
120
125
130
135
140
145
150
155
AQ1
4 J.R. Abrams et al.
Y:/Taylor & Francis/RMMM/Articles/RMMM337112/RMMM337112.3d[x] Friday 28th November 2008 21:26:4
UNCORRECTED PROOF
Willemyns, Pittam, and Gallois’s (1993, 494) examination of perceived ethnolinguis-
tic vitality of Vietnamese and English in Australia. Using confirmatory factor
analysis (CFA), they were able to validate the three indicators of vitality. However,
several items posted low loadings, and more important only 12 of the 19 items on the
SVQ were included and analysed. Given that the researchers handpicked the 12
items, the outcome is not particularly surprising. Even so, they acknowledge that
‘some variables clearly worked better than others . . . Part of this problem is probably
due to unreliability in the measures . . .’.A related shortcoming of the SVQ is that the items do not consistently load on
their intended factor (Hogg, d’Agata, and Abrams 1989; Kraemer, Olshtain, and
Badier 1994). For instance, Currie and Hogg (1994) found that items designated to
load on specific factors, loaded on other factors, and some items had multiple
loadings on factors (e.g. education and mass media). And, although the overall
reliability for the entire 21-item scale was convincing (Cronbach’s Alpha�0.88; see
also Giles et al. 2000; Harwood et al. 1994; Ytsma, Viladot, and Giles 1994), the
reliability of the three subscales was low (0.59, 0.65, and 0.71). In reaction to their
trouble validating SVQ, Landry and Allard (1994b) remarked that it was difficult tountangle the three factors. This is possibly why many researchers who used the SVQ
have analysed the items separately rather than multidimensionally, as originally
constructed (e.g. Gibbons and Ashcroft 1995; Giles, Rosenthal, and Young 1985;
Karahan 2004; Yagmur and Kroon 2003; Young, Giles, and Pierson 1986). After
Bourhis and Sachdev (1984, 124) analysed their data in this manner, they concluded
that ‘more basic empirical work remains to be done to establish the internal and
external validity of the Subjective Vitality Questionnaire’.
There is little doubt that the SVQ has contributed to the understanding of
intergroup relations and that the three factors � status, demography, and institutional
support � are conceptually robust because the essence of the original conceptualisa-
tion has been widely supported by research. Still, research using the SVQ clearly
reveals some ambiguities with regard to operationalisation in particular, whether the
SVQ can effectively uncover three dimensions with the expected items loading on
them. Although, some researchers were able to uncover a factor solution using the
SVQ, to date no empirical evidence truly validates the three-factor solution. The
present study then represents a definitive attempt to validate the SVQ. Specifically,
the vitality perceptions of three ethnic groups in the USA were investigated using theSVQ.
Method
Two versions (items were reverse ordered to avoid response fatigue) of an 83-item
questionnaire were administered to undergraduate students (all US citizens)
enrolled in communication courses at universities and community colleges in
Southern California. Some of the data from the questionnaire have been previously
published. The sample reflects self-identified African Americans’ (n�154; age range
16�38, M�22.17, SD�6.18; 63% female), Hispanic Americans’ (n�162; age
range18�41, M�20.7, SD�4.10, 73.5% female), and Asian Americans’ (n�114;
age range17�49, M�20.9, SD�4.28; 58% female) perceptions of subjective vitality
of Caucasians, African Americans, and Hispanic Americans in the USA.1 Somestudents earned course credit for their involvement. Participation was voluntary,
and responses were anonymous.
160
165
170
175
180
185
190
195
200
205
Journal of Multilingual and Multicultural Development 5
Y:/Taylor & Francis/RMMM/Articles/RMMM337112/RMMM337112.3d[x] Friday 28th November 2008 21:26:4

UNCORRECTED PROOF
Perceptions of group vitality
The SVQ (Bourhis, Giles, and Rosenthal 1981) items were modified to reflect ethnic
and racial groups for this study. For example, the item ‘How well-represented are the
following languages in Melbourne mass media (e.g. TV, radio, newspapers)’ on
the original SVQ was changed to ‘How well-represented are the following groups
in the U.S. mass media (e.g. TV, radio, newspapers)’. Participants answered questions
regarding their perceptions of status, demography, and institutional support for all
three ethnic groups (African Americans, Hispanic Americans, and Caucasians).
Items (except the estimated percentage population question) were closed-ended and
asked participants to respond on a seven-point Likert-like measure. The order in
which the ethnic groups appeared was counterbalanced to avoid a response set.
Factor analyses
The approach was two pronged. First, for each of the ethnic groups (African
Americans, Hispanic Americans, and Asian Americans), a first-order CFA of the
vitality measures (using structural equation modeling) was undertaken for all three
groups assessed in the questionnaire (African Americans, Hispanic Americans, and
Caucasians). CFA is used to determine if the number of factors and their indicator
variables conform to a priori expectations. That is, it is used to determine if measures
created to represent latent variables (the three factors associated with vitality) load
together appropriately and that the three dimensions are related (as would be
expected in this case). This is sometimes referred to as a measurement model because
the goal is to assess the value or otherwise of the measures used as indicators of latent
(unmeasured) variables. The model is then evaluated using goodness-of-fit measures.
Next, in order to assess if the indicators would load as expected when they were
free to load on any factor, exploratory factor analyses (EFA) were conducted of the
ethnic groups’ (African Americans, Hispanic Americans, and Asian Americans)
vitality perceptions of African Americans, Hispanic Americans, and Caucasians.
EFA is used to find a latent structure of observed variables by uncovering the
underlying common structure (Park, Dailey, and Lemus 2002). Three EFAs were
conducted for each ethnic group, where the number of factors retained were those
posting eigen values of greater than one. Maximum likelihood was chosen as the
means of extraction to allow for optimal goodness-of-fit (Costello and Osborne 2005;
Park, Dailey, and Lemus 2002). And finally, direct oblimin as an oblique method of
rotation was employed because of the assumption that the factors were likely to be
correlated (Costello and Osborne 2005). As suggested by Tabachnick and Fidell
(2001) as a rule of thumb for minimum loading, 0.32 was specified in all cases.
Results
Confirmatory factor analyses (CFAs) (African American, Hispanic American, andAsian American Data)
A total of nine CFAs were conducted of the ethnic groups’ (African Americans,
Hispanic Americans, and Asian Americans) vitality perceptions of African Amer-
icans, Hispanic Americans, and Caucasians. Only two of the nine CFAs owned
indicators that loaded on their factors as expected and posted even acceptable fit
(African American vitality assessments of African Americans and Hispanic American
210
215
220
225
230
235
240
245
250
6 J.R. Abrams et al.
Y:/Taylor & Francis/RMMM/Articles/RMMM337112/RMMM337112.3d[x] Friday 28th November 2008 21:26:4
UNCORRECTED PROOF
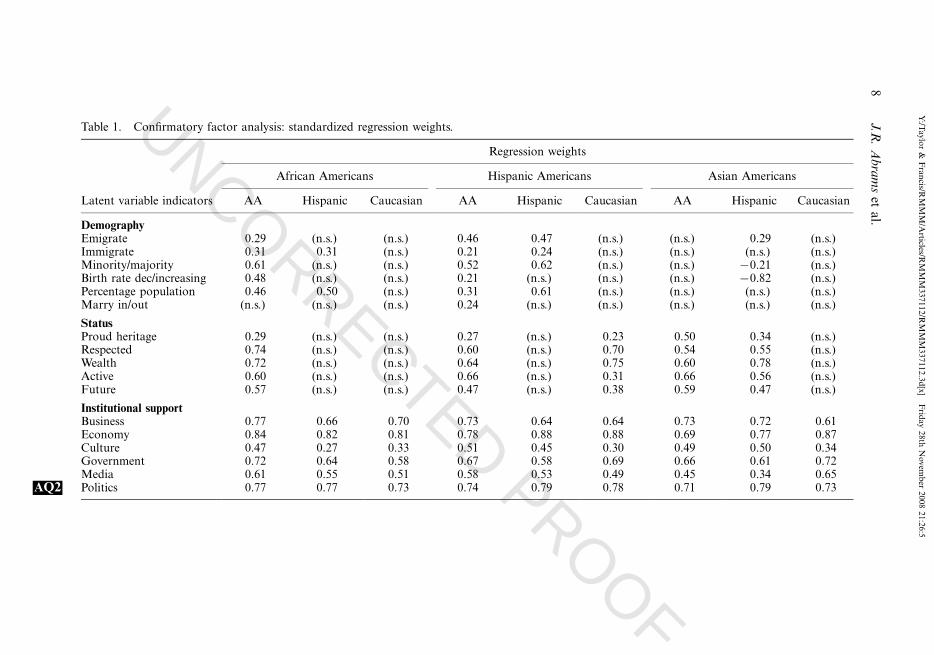
vitality assessments of African Americans). That said, these models showed that the
relationship between perceptions about status and perceptions of institutional
support was exceptionally strong (standardised regression coefficients�0.99, 0.95,
respectively), a pattern closely mirrored in the remaining models. This suggests that
these factors were not discrete; in other words, they overlapped to such an extent that
they were almost collinear. With regard to the remaining seven CFAs, their most
common shortcoming was that many or all of the demography indictors did not load
at all on that factor. All of the coefficients relating to each confirmatory model are
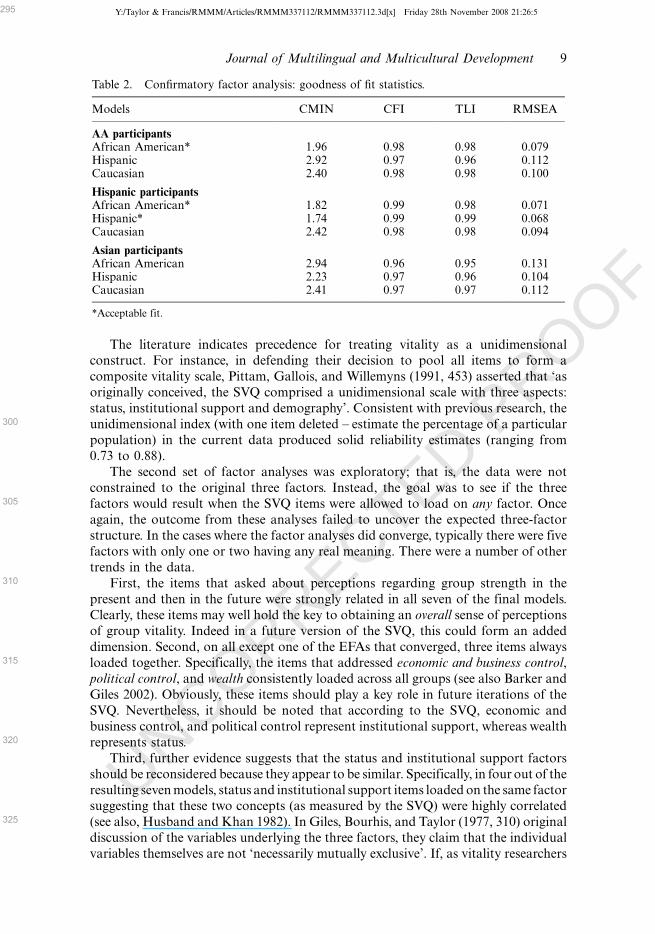
shown in Table 1, and the goodness-of-fit statistics are shown in Table 2.
Exploratory factor analyses (EFAs) (African American, Hispanic American, andAsian American Data)
As in the case of the CFAs, nine EFAs were conducted � three for each of the three
ethnic groups in the sample: African Americans’, Hispanic Americans’, and Asian
Americans’ vitality perceptions of African Americans, Hispanic Americans, and
Caucasians. The results indicated that the percentage of variance accounted for
ranged from 40 to 54%, and the number of factors produced ranged from four to five,
with five being the most common. One factor model converged after only six
iterations, other models needed several more (in one case 23), and two models failed
to converge after 25 iterations (African Americans’ assessments of Hispanic
Americans’ vitality and Asian Americans’ assessments of African Americans’
vitality). Obviously, the failure to produce a pattern matrix within these data is
problematic. In the pattern matrixes that did result, the outcomes partially mirrored
the findings from the CFAs: the three-factor structure could not be confirmed; many
items did not consistently load on their appropriate factor (as shown in Figure 1) and
some items split-loaded, loaded negatively on the factors, or did not load on any
factor.2 These outcomes and their implications are addressed in more detail in the
discussion section.
Discussion
The original intention of the SVQ was to provide a means of measuring subjective
linguistic group vitality perceptions with regard to demographic indicators, status,
and institutional support. However, since its inception, this instrument has been used
in a variety of intergroup contexts to assess social comparison processes in relation to
group vitality. The goal here has been to assess and discuss the validity of the SVQ.
After analysing responses to the SVQ from participants of a variety of ethnic
backgrounds, the three factors � status, demography, and institutional support �could not be validated. Specifically, in an effort to identify the vitality structure (see
Figure 1), the data were factor analysed using two methods. First, CFAs for each
sample were conducted in an attempt to confirm the expected factor structure. The
two most common outcomes from these factor analyses were that the demographic
indicators did not load together (See Table 1) and that when the status and
institutional support indicators did load significantly, the resulting factors often
appeared to be collinear. In short, this suggests that these SVQ items were not
measuring discrete latent variables but essentially provided a unidimensional measure
of overall vitality perceptions.
255
260
265
270
275
280
285
290
Journal of Multilingual and Multicultural Development 7
Y:/Taylor & Francis/RMMM/Articles/RMMM337112/RMMM337112.3d[x] Friday 28th November 2008 21:26:4
UNCORRECTED PROOF
Table 1. Confirmatory factor analysis: standardized regression weights.
Regression weights
African Americans Hispanic Americans Asian Americans
Latent variable indicators AA Hispanic Caucasian AA Hispanic Caucasian AA Hispanic Caucasian
DemographyEmigrate 0.29 (n.s.) (n.s.) 0.46 0.47 (n.s.) (n.s.) 0.29 (n.s.)Immigrate 0.31 0.31 (n.s.) 0.21 0.24 (n.s.) (n.s.) (n.s.) (n.s.)Minority/majority 0.61 (n.s.) (n.s.) 0.52 0.62 (n.s.) (n.s.) �0.21 (n.s.)Birth rate dec/increasing 0.48 (n.s.) (n.s.) 0.21 (n.s.) (n.s.) (n.s.) �0.82 (n.s.)Percentage population 0.46 0.50 (n.s.) 0.31 0.61 (n.s.) (n.s.) (n.s.) (n.s.)Marry in/out (n.s.) (n.s.) (n.s.) 0.24 (n.s.) (n.s.) (n.s.) (n.s.) (n.s.)
StatusProud heritage 0.29 (n.s.) (n.s.) 0.27 (n.s.) 0.23 0.50 0.34 (n.s.)Respected 0.74 (n.s.) (n.s.) 0.60 (n.s.) 0.70 0.54 0.55 (n.s.)Wealth 0.72 (n.s.) (n.s.) 0.64 (n.s.) 0.75 0.60 0.78 (n.s.)Active 0.60 (n.s.) (n.s.) 0.66 (n.s.) 0.31 0.66 0.56 (n.s.)Future 0.57 (n.s.) (n.s.) 0.47 (n.s.) 0.38 0.59 0.47 (n.s.)
Institutional supportBusiness 0.77 0.66 0.70 0.73 0.64 0.64 0.73 0.72 0.61Economy 0.84 0.82 0.81 0.78 0.88 0.88 0.69 0.77 0.87Culture 0.47 0.27 0.33 0.51 0.45 0.30 0.49 0.50 0.34Government 0.72 0.64 0.58 0.67 0.58 0.69 0.66 0.61 0.72Media 0.61 0.55 0.51 0.58 0.53 0.49 0.45 0.34 0.65
AQ2 Politics 0.77 0.77 0.73 0.74 0.79 0.78 0.71 0.79 0.73
8J.R
.A
bra
ms
eta
l.
Y:/T
aylo
r&
Fra
ncis/R
MM
M/A
rticles/RM
MM
33
71
12
/RM
MM
33
71
12
.3d
[x]
Frid
ay2
8th
No
vem
ber
20
08
21
:26
:5
UNCORRECTED PROOF
The literature indicates precedence for treating vitality as a unidimensionalconstruct. For instance, in defending their decision to pool all items to form a
composite vitality scale, Pittam, Gallois, and Willemyns (1991, 453) asserted that ‘as
originally conceived, the SVQ comprised a unidimensional scale with three aspects:
status, institutional support and demography’. Consistent with previous research, the
unidimensional index (with one item deleted � estimate the percentage of a particular
population) in the current data produced solid reliability estimates (ranging from
0.73 to 0.88).
The second set of factor analyses was exploratory; that is, the data were not
constrained to the original three factors. Instead, the goal was to see if the three
factors would result when the SVQ items were allowed to load on any factor. Once
again, the outcome from these analyses failed to uncover the expected three-factor
structure. In the cases where the factor analyses did converge, typically there were five
factors with only one or two having any real meaning. There were a number of other
trends in the data.
First, the items that asked about perceptions regarding group strength in the
present and then in the future were strongly related in all seven of the final models.
Clearly, these items may well hold the key to obtaining an overall sense of perceptions
of group vitality. Indeed in a future version of the SVQ, this could form an added
dimension. Second, on all except one of the EFAs that converged, three items always
loaded together. Specifically, the items that addressed economic and business control,
political control, and wealth consistently loaded across all groups (see also Barker and
Giles 2002). Obviously, these items should play a key role in future iterations of the
SVQ. Nevertheless, it should be noted that according to the SVQ, economic and
business control, and political control represent institutional support, whereas wealth
represents status.
Third, further evidence suggests that the status and institutional support factors
should be reconsidered because they appear to be similar. Specifically, in four out of the
resulting seven models, status and institutional support items loaded on the same factorsuggesting that these two concepts (as measured by the SVQ) were highly correlated
(see also, Husband and Khan 1982). In Giles, Bourhis, and Taylor (1977, 310) original
discussion of the variables underlying the three factors, they claim that the individual
variables themselves are not ‘necessarily mutually exclusive’. If, as vitality researchers
295
300
305
310
315
320
325
Table 2. Confirmatory factor analysis: goodness of fit statistics.
Models CMIN CFI TLI RMSEA
AA participantsAfrican American* 1.96 0.98 0.98 0.079Hispanic 2.92 0.97 0.96 0.112Caucasian 2.40 0.98 0.98 0.100
Hispanic participantsAfrican American* 1.82 0.99 0.98 0.071Hispanic* 1.74 0.99 0.99 0.068Caucasian 2.42 0.98 0.98 0.094
Asian participantsAfrican American 2.94 0.96 0.95 0.131Hispanic 2.23 0.97 0.96 0.104Caucasian 2.41 0.97 0.97 0.112
*Acceptable fit.
Journal of Multilingual and Multicultural Development 9
Y:/Taylor & Francis/RMMM/Articles/RMMM337112/RMMM337112.3d[x] Friday 28th November 2008 21:26:5
UNCORRECTED PROOF
suggest, the variables underlying the three-factor structure are not mutually exclusive,
then the variables should not load discretely on the three factors. However, the current
data indicate they are too similar as measured by the SVQ. For example, the item ‘How
well represented are the following groups in business institutions in the U.S.’ can
possibly reflect both status and institutional support. That is, if a social group is well
represented in business, then it also probably has status. This same argument applies for
other institutions as well. For instance, the social group that controls media, an
important institution in most societies, arguably has status. Future research could
attempt to conceptually differentiate status from institutional support.
Future research should also examine the language used to operationalise the
institutional support items. For example, several items that should load on the
institutional support factor are phrased as ‘How well represented . . .’ While this
language is intended to signify institutional support, the language can just as easily
reflect status or demography (see also Landry and Allard 1994b). In fact, in almost
every analysis conducted on the present data, every item that began with ‘How well
represented . . .’ loaded on the first factor, which was most reflective of group status.
The one exception was the item, ‘How well represented are the following groups inthe cultural life of the U.S. (e.g. festivals, concerts, art exhibitions)’, which frequently
split-loaded on the factors. Instead of asking ‘how well represented’ are groups in the
mass media, the item could ask ‘What kind of support does the group have from
mass media’ or ‘How often does the group appear in mass media’. Similarly, the item
that asks ‘How well represented are groups in the cultural life’ could be changed by
asking ‘How well supported are groups in the cultural life’.
And finally, as in the EFAs, the demographic indicators did not load together in
any of the models; in fact, one would describe them as being all over the conceptual
map. For example, the analysis indicates that the item that asks participants to write
in ‘What percentage of the population is made up of a group’ lacks reliability.
Because participants have a difficult time estimating the size of a group, the answers
they give vary greatly. This item would probably be better constructed as a closed-
ended question. The items ‘Estimate the birth rates of the following groups in the
U.S.’ and ‘To what extent do the following groups in the U.S. marry only within their
own group’ frequently loaded on the other factors. The two items that more
consistently loaded together that are reflective of demography are ‘How many of the
following groups immigrate into the U.S. each year’ and ‘How many of the followinggroups emigrate from the U.S. to other countries each year’. While the language of
these two items could be simplified for participants who may not know the definition
of immigrate and emigrate (e.g. ‘How many of the following groups come from
another country to live each year’ and ‘How many of the following groups leave the
country to live in other countries each year’), they seem to tap into something more
indicative of social comparison concerns. This is consistent with the Barker and Giles
(2002) finding that Anglo Americans’ belief that Latinos are increasing in numbers
predicted their support for English-only policies. It seems important then to revisit
the demographic dimension in terms of face validity.
Conclusion
This study underscores the value of vitality in understanding intergroup relations.Clearly, the concept has strong predictive and explanatory power, as well as heuristic
value. Even so, researchers wishing to measure subjective vitality using the SVQ
330
335
340
345
350
355
360
365
370
10 J.R. Abrams et al.
Y:/Taylor & Francis/RMMM/Articles/RMMM337112/RMMM337112.3d[x] Friday 28th November 2008 21:26:5

UNCORRECTED PROOF
should be aware of its shortcomings (and maybe engage group-focused discussions
before finalising it in any one intergroup setting). Still, our analysis indicates that
(with the exception of one demographic item), the SVQ is reliable when measuring
subjective vitality unidimensionally. And, although the focus of the present study has
been on the validity of measuring subjective vitality quantitatively, researchers should
continue invoking the tripartite conceptual structure when conducting objective
analyses of intergroup settings or assessing vitality with qualitative methods (Bourhis
2008; Komondouros and McEntee-Atalianis 2007; Sayahi 2005). Our hope is thatthis paper initiates the discussion about the psychometric properties of a valuable
construct.
Notes
1. These ethnic groups were selected because they include both minority and majority groups.Importantly, we do not believe that the groups themselves are of importance for the focusof this particular study. Any intercultural comparison could fulfill the aim of theexamination.
2. Space precluded inclusion of the tables summarising the results of the EFAs. Interestedreaders should obtain these from the first author.
References
Abrams, J.R. 2008. African Americans’ television activity: Is it related to perceptions ofoutgroup vitality? Howard Journal of Communications 19: 1�18.
Allard, R., and R. Landry. 1986. Subjective ethnolinguistic vitality viewed as a belief system.Journal of Multilingual and Multicultural Development 7: 1�12.
Allard, R., and R. Landry. 1994. Subjective ethnolinguistic vitality: A comparison of twomeasures. International Journal of the Sociology of Language 108: 117�44.
Barker, V., and H. Giles. 2002. Who supports the English-only movement? Evidence formisconceptions about Latino group vitality. Journal of Multilingual and MulticulturalDevelopment 23: 353�70.
Barker, V., H. Giles, K. Noels, J. Duck, M. Hecht, and R. Clement. 2001. The English-onlymovement: A communication analysis of changing perceptions of language vitality. Journalof Communication 51: 3�37.
Bourhis, R.Y., ed., 2008. The vitality of the English-speaking communities of Quebec: Fromcommunity decline to revival. Montreal, QC: CEETUM, Universite de Montreal.
Bourhis, R.Y., H. Giles, and D. Rosenthal. 1981. Notes on the construction of a ‘subjectivevitality questionnaire’ for ethnolinguistic groups. Journal of Multilingual and MulticulturalDevelopment 2: 144�55.
Bourhis, R.Y., and I. Sachdev. 1984. Vitality perceptions and language attitudes: SomeCanadian data. Journal of Language and Social Psychology 3: 97�126.
Cenoz, J., and J.F. Valencia. 1993. Ethnolinguistic vitality, social networks and motivation insecond language acquisition: Some data from Basque Country. Language, Culture, andCurriculum 6: 113�27.
Clachar, A. 1997. Ethnolinguistic identity and Spanish proficiency in a paradoxical situation:The case of Puerto Rican return immigrants. Journal of Multilingual and MulticulturalDevelopment 18: 107�24.
Clement, R. 1980. Ethnicity, contact and communicative competence in a second language. InLanguage: Social psychological perspectives, ed. H. Giles, W.P. Robinson, and P.M. Smith,147�54. Oxford: Pergamon.
Clement, R. 1986. Second language proficiency and acculturation: An investigation of theeffects of language status and individual characteristics. Journal of Language and SocialPsychology 5: 271�90.
Costello, A.B., and J.W. Osborne. 2005. Best practices in exploratory factor analysis: Fourrecommendations for getting the most from your analysis. Practical Assessment, Researchand Evaluation 7: 1�9.
375
380
385
390
395
400
405
410
415
420
425
Journal of Multilingual and Multicultural Development 11
Y:/Taylor & Francis/RMMM/Articles/RMMM337112/RMMM337112.3d[x] Friday 28th November 2008 21:26:5
UNCORRECTED PROOF
Currie, M., and M.A. Hogg. 1994. Subjective ethnolinguistic vitality and social adaptationamong Vietnamese refugees in Australia. International Journal of the Sociology ofLanguage 108: 97�115.
Ellinger, B. 2000. The relationship between ethnolinguistic identity and English languageachievement for native Russian speakers and native Hebrew speakers in Israel. Journal ofMultilingual and Multicultural Development 21: 292�307.
Florack, A., and U. Piontkowski. 1997. Identification and perceived vitality: The Dutch andthe Germans in the European Union. Journal of Multilingual and Multicultural Develop-ment 18: 349�63.
Gao, G., K.L. Schmidt, and W.B. Gudykunst. 1994. Strength of ethnic identity andperceptions of ethnolinguistic vitality among Mexican Americans. Hispanic Journal ofBehavioral Sciences 16: 332�41.
Garrett, F., H. Giles, and N. Coupland. 1989. The contexts of language learning: Extendingthe intergroup model of second language acquisition. In Language, communication, andculture: Current directions, ed. S. Ting-Toomey and F. Korzenny, 201�20. Newbury Park,CA: Sage.
Gibbons, J., and L. Ashcroft. 1995. Multiculturalism and language shift: A subjective vitalityquestionnaire study of Sydney Italians. Journal of Multilingual and MulticulturalDevelopment 16: 281�99.
Giles, H. 2001. Ethnolinguistic vitality. In Concise encyclopaedia of sociolinguistics, ed. R.Mesthrie, 472�3. Oxford: Elsevier.
Giles, H., R.Y. Bourhis, and D.M. Taylor. 1977. Towards a theory of language in ethnicgrouprelations. In Language, ethnicity, and intergroup relations, ed. H. Giles, 307�48.London: Academic Press.
Giles, H., and J.L. Byrne. 1982. An intergroup approach to second language acquisition.Journal of Multilingual and Multicultural Development 3: 17�40.
Giles, H., and P. Johnson. 1981. The role of language in ethnic group relations. In Intergroupbehavior, ed. J. Turner and H. Giles, 199�243. Oxford: Blackwell.
Giles, H., and P. Johnson. 1987. Ethnolinguistic identity theory: A social psychologicalapproach to language maintenance. International Journal of the Sociology of Language 68:69�99.
Giles, H., L. Leets, and N. Coupland. 1990. Minority language group status: A theoreticalconspexus. Journal of Multilingual and Multicultural Development 11: 37�56.
Giles, H., K. Noels, H. Ota, S.H. Ng, C. Gallois, E.B. Ryan, A. Williams et al. 2000. Agevitality across eleven nations. Journal of Multilingual and Multicultural Development 21:308�23.
Giles, H., D. Rosenthal, and L. Young. 1985. Perceived ethnolinguistic vitality: The Anglo-andGreek-Australian setting. Journal of Multilingual and Multicultural Development 6: 253�69.
Hamers, J., and M. Blanc. 1982. Towards a social psychological model of bilingualdevelopment. Journal of Language and Social Psychology 1: 29�49.
Hamers, J., and M. Blanc. 1989. Bilinguality and bilingualism. Cambridge, UK: CambridgeUniversity Press.
Harwood, J., H. Giles, and R.Y. Bourhis. 1994. The genesis of vitality theory: Historicalpatterns and discoursal dimensions. International Journal of the Sociology of Language 108:167�206.
Harwood, J., H. Giles, H.D. Pierson, R. Clement, and S. Fox. 1994. Vitality perceptions of agecategories in California and Hong Kong. Journal of Multilingual and MulticulturalDevelopment 15: 311�8.
Hogg, M., P. d’Agata, and D. Abrams. 1989. Ethnolinguistic betrayal and speaker evaluationsamong Italian Australians. Genetic. Social and General Psychology Monographs 115:153�81.
Husband, C., and V.S. Khan. 1982. The viability of ethnolinguistic vitality some creativedoubts. Journal of Multilingual and Multicultural Development 3: 193�205.
Johnson, P., H. Giles, and R.Y. Bourhis. 1983. The viability of ethnolinguistic vitality: A replyto Husband and Khan. Journal of Multilingual and Multicultural Development 4: 255�69.
Karahan, F. 2004. Ethnolinguistic vitality, attitudes, social network and code-switching: Thecase of Bosnian-Turks living in Sakarya, Turkey. International Journal of the Sociology ofLanguage 165: 59�92.
430
435
440
445
450
455
460
465
470
475
480
12 J.R. Abrams et al.
Y:/Taylor & Francis/RMMM/Articles/RMMM337112/RMMM337112.3d[x] Friday 28th November 2008 21:26:6
UNCORRECTED PROOF
Komondouros, M., and L. McEntee-Atalianis. 2007. Language attitudes, shift and ethno-linguistic vitality of the Greek Orthodox community in Istanbul. Journal of Multilingualand Multicultural Development 28: 365�84.
Kraemer, R. 1992. Ethnolinguistic vitality perceptions in Israel in the wake of the Intifada.Journal of Multilingual and Multicultural Development 13: 482�503.
Kraemer, R., E. Olshtain, and S. Badier. 1994. Ethnolinguistic vitality, attitudes, and networksof linguistic contact: The case of the Israeli Arab minority. International Journal of theSociology of Language 108: 79�95.
Kramarae, C. 1981. Women and men speaking. Rowley, MA: Newbury House.Kristiansen, T., J. Harwood, and H. Giles. 1991. Ethnolinguistic vitality in ‘‘the Danish capital
of America’’. Journal of Multilingual and Multicultural Development 12: 421�48.Labrie, N., and R. Clement. 1986. Ethnolinguistic vitality, self confidence and second language
proficiency: An investigation. Journal of Multilingual and Multicultural Development 7:269�82.
Landry, R., and R. Allard. 1991. Can schools promote additive bilingualism in minority groupchildren? In Language, Culture and Cognition: A collection of studies in first and secondlanguage acquisition, ed. L. Malave and G. Duquette, 198�231. Clevedon, UK: Multi-lingual Matters.
Landry, R., and R. Allard. 1992. Ethnolinguistic vitality and the bilingual development ofminority and majority group students. In Maintenance and loss of minority languages, ed.W. Fase, K. Jaespaert, and S. Kroon, 223�51. Amsterdam, The Netherlands: Benjamins.
Landry, R., and R. Allard. 1994a. The Acadians of New Brunswick: Demolinguisticrealitiesand the vitality of the French language. International Journal of the Sociology of Language105/106: 187�215.
Landry, R., and R. Allard. 1994b. Diglossia, ethnolinguistic vitality, and language behavior.International Journal of the Sociology of Language 108: 15�42.
Landry, R., R. Allard, and R. Theberge. 1991. School and family French ambiance and thebilingual development of Francophone western Canadians. Canadian Modern LanguageReview 47: 878�915.
Landry, R., and R.Y. Bourhis. 1997. Linguistic landscape and ethnolinguistic vitality: Anempirical study. Journal of Language and Social Psychology 16: 23�49.
Leets, L., and H. Giles. 1995. Intergroup cognitions and communication climates: Newdimensions of minority language maintenance. In The state of minority languages:International perspectives on survival and decline, ed. W. Fase, K. Jaspaert, and S. Kroon,37�74. Lisse, The Netherlands: Swets & Zeitlinger.
Mays, C.M., S.D. Cochran, G. Bellinger Jr, R.G. Smith, N. Henley, M. Daniels, T. Tibbits,G.D. Victorianne, O.K. Sei, and D.K. Birt. 1992. The language of black gay men’s sexualbehavior: Implications for AIDS risk reduction. Journal of Sex Research 29: 425�34.
Park, H.S., R.M. Dailey, and D. Lemus. 2002. The use of exploratory factor analysis andprincipal components analysis in communication research. Human CommunicationResearch 28: 562�77.
Pittam, J., C. Gallois, and M. Willemyns. 1991. Perceived change in ethnolinguistic vitality bydominant and minority groups. Journal of Multilingual and Multicultural Development 12:449�57.
Sachdev, I., and R.Y. Bourhis. 1993. Ethnolinguistic vitality: Some motivational and cognitiveconsiderations. In Group motivation: Social psychological perspectives, ed. M. Hogg andD. Abrams, 33�51. New York: Harvester-Wheatsheat.
Sayahi, L. 2005. Language and identity among speakers of Spanish in northern Morocco:Between ethnolinguistic vitality and acculturation. Journal of Sociolinguistics 9: 95�107.
Tabachnick, B.G., and L.S. Fidell. 2001. Using multivariate statistics, 4th edn. Boston, MA:Allyn and Bacon.
Tajfel, H., and J.C. Turner. 1979. An integrative theory of intergroup conflict. In The socialpsychology of intergroup relations, ed. W.C. Austin and S. Worchel, 33�53. Monterey, CA:Brooks/Cole.
Tajfel, H., and J.C. Turner. 1986. The social identity theory of intergroup behavior. InPsychology of Intergroup Relations, ed. S. Worchel and W.G. Austin, 7�24. Chicago, IL:Nelson.
485
490
495
500
505
510
515
520
525
530
535
540
Journal of Multilingual and Multicultural Development 13
Y:/Taylor & Francis/RMMM/Articles/RMMM337112/RMMM337112.3d[x] Friday 28th November 2008 21:26:6

UNCORRECTED PROOF
Willemyns, M., J. Pittam, and C. Gallois. 1993. Perceived ethnolinguistic vitality of Vietnameseand English in Australia: A confirmatory factor analysis. Journal of Multilingual andMulticultural Development 14: 481�97.
Yagmur, K., K. de Bot, and H. Korzilius. 1999. Language shift and ethnolinguistic vitality ofTurkish in Australia. Journal of Multilingual and Multicultural Development 20: 51�69.
Yagmur, K., and S. Kroon. 2003. Ethnolinguistic vitality perceptions and languagerevitalization in Bashkortostan. Journal of Multilingual and Multicultural Development 4:319�36.
Young, L., H. Giles, and H. Pierson. 1986. Sociopolitical change and perceived vitality.International Journal of Intercultural Relations 10: 459�69.
Ytsma, J., M. Viladot, and H. Giles. 1994. Ethnolinguistic vitality and ethnic identity: SomeCatalan and Frisian data. International Journal of the Sociology of Language 108: 63�78.
545
550
14 J.R. Abrams et al.
Y:/Taylor & Francis/RMMM/Articles/RMMM337112/RMMM337112.3d[x] Friday 28th November 2008 21:26:6