An Evaluation of Two Career Exploration Programs in 1970-71.
145
4r,' DOCUMENT RESUME ED 073 3,10 VT 019 094 AUTHOR Cochran, John R.; Weis, David M. TITLE An Evaluation of Two Career Exploration Programs in 1970-71. INSTITUTION . Akron Univ., Ohio. SPONS AGENCY Ohio State Dept. of Education, Columbus. Div. of Vocational Education. PUB DATE (72) NOTE 144p. EDRS PRICE ME-S0.65 HC-S6.58 DESCRIPTORS Area Vocational Schools; *Career Education; Career Planning; Educational Objectives; General High Schools; *High School Students; Parent Reaction; Pilot Projects; Program Effectiveness; *Program Evaluation; Self Concept; Tables (Data); Vocational Development; *Vocational Interests IDENTIFIERS *Career Exploration ABSTRACT An evaluation of vocational interests of students in Grades 9 and 10 in two pilot career exploration programs, one at an area vocational school and the other at a general high school, was conducted to determine whether or not the programs were: (1) .developing a positive self-image as a potential worker, (2) providing a program valued by students and parents, (3) developing appropriate career interest patterns based on self-awareness and voca ;ional awareness, and (4) developing educational and vocational planning abilities. Students in the two experimental schools plus a control school without vocational programs were administered the Ohio Vocational Interest Surrey, the Tennessee Self-Concept Scale, and the Career Plans Survey in the fall of 1970 and again in the spring of 1971. As compared to students from the control school and the general high school, the students from the area vocational school were better informed about career choice and demonstrated more positive attitudes toward their abilities and chances for vocational advancement. However, changes in vocational interests were more closely related to grade level-tban,tO school programs. Parents of the vocatidffil students were the most favorably impressed with the school's career exploration program. (AG) r.
-
Upload
khangminh22 -
Category
Documents
-
view
3 -
download
0
Transcript of An Evaluation of Two Career Exploration Programs in 1970-71.
4r,'
DOCUMENT RESUME
ED 073 3,10 VT 019 094
AUTHOR Cochran, John R.; Weis, David M.TITLE An Evaluation of Two Career Exploration Programs in
1970-71.INSTITUTION . Akron Univ., Ohio.SPONS AGENCY Ohio State Dept. of Education, Columbus. Div. of
Vocational Education.PUB DATE (72)NOTE 144p.
EDRS PRICE ME-S0.65 HC-S6.58DESCRIPTORS Area Vocational Schools; *Career Education; Career
Planning; Educational Objectives; General HighSchools; *High School Students; Parent Reaction;Pilot Projects; Program Effectiveness; *ProgramEvaluation; Self Concept; Tables (Data); VocationalDevelopment; *Vocational Interests
IDENTIFIERS *Career Exploration
ABSTRACTAn evaluation of vocational interests of students in
Grades 9 and 10 in two pilot career exploration programs, one at anarea vocational school and the other at a general high school, wasconducted to determine whether or not the programs were: (1).developing a positive self-image as a potential worker, (2) providinga program valued by students and parents, (3) developing appropriatecareer interest patterns based on self-awareness and voca ;ionalawareness, and (4) developing educational and vocational planningabilities. Students in the two experimental schools plus a controlschool without vocational programs were administered the OhioVocational Interest Surrey, the Tennessee Self-Concept Scale, and theCareer Plans Survey in the fall of 1970 and again in the spring of1971. As compared to students from the control school and the generalhigh school, the students from the area vocational school were betterinformed about career choice and demonstrated more positive attitudestoward their abilities and chances for vocational advancement.However, changes in vocational interests were more closely related tograde level-tban,tO school programs. Parents of the vocatidffilstudents were the most favorably impressed with the school's careerexploration program. (AG)
r.

r
t,*
1
r-4 Project Title:
Pr%N Project Organization:C:)
C:3Initiators:
U S DEPARTMENT OF HEALTH.EDUCATION WELFAREOFFICE OF EDUCATION
THIS DOCUMENT HAS REIN REPRO-DUCED EXACTLY AS RECEIVED FROMTHE PERSON OR ORGANIZATION ORIGINATING IT POINTS OF VIEW OR °PINIONS STATED DO NOT NECESSARILYREPRESENT OFFICIAL OFFICE OF EDU-CATION POSITION OR POUCY
41,
Transmitted by:
Duration of Activity:
Purpose of Grant:
Use of Funds:
Total State Funds Expended:
Date Transmitted:
FILMED FROM BEST AVAILABLE COPY
An Evaluation of Two CareerExploration Programs in 1970-1971.
The University of Akron
Dr. John R. CochranAssistant Professor of EducationThe University of AkronAkron, Ohio 44304(216) 762-2441, Ext. 510
Dr. David M. WeisAssociate Professor of EducationThe University of AkronAkron, Ohio 44304(216) 762-2441, Ext. 369
Dr. Dominic J. GuzzettaPresident,The University of AkronAkron, Ohio 44304(216) 762-2441, Ext. 245
August 1, 1970 to April 1, 1972
(ii) Evaluation of experimental,developmental or pilot procrams.
(4) Demonstration and disseminationprojects

ABSTRACT
An evaluation of the Career Exploration Programs at Dayton Patterson(Vocational High School) and Toledo Woodward (general high school) wasconducted to determine if these programs were effective in meeting thefollowing objectives: (1) to help students to develop more appropriatecareer interest patterns based upon knowledge of themselves and the worldof work; (2) to help students to develop store appropriate educational andvocational plans and goals based upon knowledge of himself and the worldof work; (3) to help students to develop a more positive self-image ofhimself as a person and as a potential worker; and (4) to provide a programthat will be considered worthwhile by parents and students in the program.Toledo Waite was used as the control school.
Students in the two experimental and one control school were given theOhio Vocational Interest Survey (OVIS), the Tennessee Self-Concept Scale(TSC), and the Career Plans Survey (CPS) in the fall of 1970 and again inthe spring of 1971. Students' tests were matched from fall to spring toprovide a longitudinal sample for analysis of the data.
In general, the Career Exploration Program had very little effect uponthe general areas of student interest as expressed as change in scale scoreon the OVIS. Change was more related to grade level than school program.Patterson students tended to be more consistent than the other groups intheir expressed like or dislike of activities related to a particular occu-pational area from fall to spring. The expressed interests of Patterson tenthgraders tended to be more stable from fall to spring than the other groups.
On the Career Plans Survey, Patterson students felt better informed tomake a career choice than students v- the other schools. There was no significantelange from fall to spring within or Jetween groups relating to post-highschool educational and vocational plans. Patterson students were more positivein their attitude toward school and more definite in their plans to graduatefrom high school than students from Woodward and Waite. Patterson students hadgiven the matter of chofce-more thought and felt their winds were made up asto career choice more frequently than students from Woodward and Waite. Inspecific instances of the CPS, Woodward students demonstrated changes signifi-cantly greater than the control group; however, there was no definitive patternof difference in any area.
There were only two minor significant differences between groups on theTennessee Self-Concept Scale--one in favor of an experimental and one in favorof a control school. On the Career Plans Survey, Patterson students demon-strated that they had developed a more positive attitude toward their abilitiesand chances for getting ahead in the occupation of their choice than didstudents at Woodward and Waite.
On the Parent Survey, few parents who responded felt they had "a lot" ofinformation about the Career Exploration Program. In general, Pattersonparents who responded were more favorable toward the Career Exploration Programand its effect upon their children than were the parents of Woodward students.

TABLE OF CONTENTS
ABSTRACT
LIST OF TABLES
Chapter
I. INTRODUCTION, PROCEDURES AND HIGHLIGHTS 1
Introduction 1Procedures 2Highlights 6
II. INTERESTS 15
Hypothesis lA 15Hypothesis 18 18Hypothesis 1C 21Hypothesis ID 23Hypothesis lE 26
III. EDUCATIONAL AND VOCATIONAL PLANS AND GOALS 28
Hypothesis 2A 42Hypothesis 28 55
IV. SELF-CONCEPT 70
Hypothesis 3A 70Hypothesis 3B 72
V. PARENT OPINION 80
Hypothesis 4A 80
VI. CONCLUSIONS 88
Recommendations and Suggestions 95
PROJECT OR PROGRAM EXPENDITURES
APPRIDEL

I
LIST OF TABLES
Table
Page1. Number and Percentage of Students Taking Career Plans Survey . .-32. A Comparison of Changes in OVIS Scale Scores from Fall to
Spring16-17
3. A Comparison of Number of Students Whose OVIS Scale ClarityScores Went Up, Stayed the Same, or Went Down from Fall toSpring
19-20
4. A Comparison of the Neither of Students in Each LongitudinalGroup Who Had Scale Clarity Scores of H, F, or I in the FallVersus Spring
22
5. Change in First Choice Expressed Interest 24
6. Change in First Choice Inventoried Interest25
7. Inventoried Rank of First Choice Expressed Interest 27
8. Pretest and Posttest Percentages of Responses for all Groups forQuestion 1
29
9. Pretest and Posttest Percentages of Responses for all Groups forQuestion 2
10. Comparison of the Most Helpful Ways for Learning About Occupations
t_
1.12. Comparison of the People Who Were Most Helpful to the Student
at School
31
32
11. Rank, Based on Percentages of Responses, of Persons with WhomStudents Discussed Occupations
34-35
in Learning About Occupations36
13. Percentage of Students Working During the School Year 37
14. Percentage of Student Responses Concerning Adequacy of Infor-mation About Jobs
39
14A. Pretest, Posttest and Adjusted Means for all Groups on Question17
40
15. Pretest and Posttest Percentages of Responses for all Groups forQuestion 23
43
r
1-
is
LIST OF TABLES
(continued)
TablePage
16. Pretest and Posttest Percentages of Responses for all Groups forQuestion 2145
17. Pretest and Posttest Percentages of Responses for all Groups forQuestion 11
18. Pretest and Posttest Percentages of Responses for all Groups forQuestion 19
19. Pretest and Posttest Percentages of Responses for all Groups forQuestion 20
47
48
50
20. Pretest and Posttest Percentages of Responses for all Groups forQuestion 1251
21. Pretest and Posttest Percentages of Responses for all Groups forQuestion 22
22. Pretest and Posttest Percentages of Responses for all Groups forQuestion 16
23. Pretest and Posttest Percentages of Responses for all Groups forQuestion 14
24. Pretest and Posttest Percentages of Responses for all Groups forQuestion 9
24A. Pretest, Posttest and Adjusted Means for all Groups on Question 9
25. Pretest and Posttest Percentages of Responses for all Groups forQuestion 7
25A. Pretest, Posttest and Adjusted Means for all Groups on Question 7
52
53
56
58
59
60
62
26. Pretest and Posttest Percentages of Responses for all Groups forQuestion 5 A-Tr-
0327. Pretest and Posttest Percentages of Responses for all Groups forQuestion 4
64
27A. Pretest, Posttest and Adjusted Means for all Groups on Question 4.
28. Pretest and Posttest Percentages of Responses for all Groups forQuestion 6
28A. Pretest, Posttest and Adjusted Means for all Groups on Question 6
2's. Pretest, Posttest and Adjusted Means for all Groups Having aSignificant Difference on the Tennessee Self-Concept Scale. . . .
66
67
68
71
r
IT
LIST OF TABLES
(continued)
TablePage
30. Pretest and Posttest Percentages of Responses for all Groupsfor Question 8
30A. Pretest, Posttest and Adjusted Means for all Groups on Question 8
31. Pretest and Posttest Percentages of Responses for all Groups forQuestion 13 76
31A. Pretest, Posttest and Adjusted Means for all Groups on Question 13 77
32. Pretest and Posttest Percentages of Responses for all Groups forQuestion 15 78
32A. Pretest, Posttest and Adjusted Means for all Groups on Question 15 79
33. Reported Knowledge of the Career Exploration Program of Ninth andTenth Grade Parents at Patterson and Woodward . aaaa 81
73
74
34. Parents Reported Source of Knowledge of the Career ExplorationProgram at Patterson and Woodward 81
35. Parent Reaction to the Participation of His Child in the CareerExploration Program at Patterson and Woodward 83
36. Reactions of Parents of Patterson and Woodward Students to Itemson the Parent Survey
84
CHAPTER I
INTRODUCTION, PROCEDURES AND HICHLTcHTe
Introduction
Traditionally, a student in our school system has been called uponat several points in his school career to make educational and vocationaldecisions affecting the rest of his life. The student. for a variety ofreasons, often has been ill-equipped to make such decisions. In additionto a general lack of maturity, the student usually has not had an adenuateunderstanding of himself, his abilities, and his interests which is necessaryin order to make decisions having such far-reaching implications for hislife.
The Career Exploration Programs. planned on a pilot basis for the1970-71 and 1971-72 school years, are an attempt in Ohio to help all stu-dents in grades nine and ten to make better career decisions. In order toaccomplish this goal, students in selected schools are provided with extensiveexsloratory experiences in segments of the world of work. The findingspresented in this report resulted from an attempt to determine to whatextent the concept of Career Exploration Programs is successful in helninea student to learn more about himself and the world of work so that he canmake wise career decisions.
The specific objectives of the Career Exploration Programs which wereevaluated are:
1. To help the student to develop more appropriate career interestpatterns based upon knowledge of himself and the world of_work.
2. To help the student to develop more appropriate educational at'vocational plans and goals based upon knowledge of himself andthe world of work.
3. To help the student develop a positive self-image of himself asa nerson and as a potential worker.
4. To provide a program that will be considered worthwhile by theparents of the students in the program.
1

1
2
Procedures
Description of Experimental Schools
Dayton Patterson - Patterson is a four Year vocational hiehschool encomnassing grades 9-12. Students attending Patterson areselected to do so and are motivated to enter some vocational courseof study available at the school. Approximately 52% freshmen areselected to attend Patterson based unpn their interest in vocationalprograms, their abilities, their nrevious achievement and teacherrecommendation. Tenth graders participating in this study alsoattended Patterson as ninth graders the previous year. The nrogramthat thew participated in as ninth graders was almost identical tothe one offered to the ninth graders in 1970-71. The Career Explora-tion Program instituted in the 1970-71 school year was reouired ofall ninth and tenth grade students for two periods each day. Ninthgraders studied four different career areas for nine weeks each:tenth graders studied one area for the entire wear. The nroeramconsisted primarily of students getting hands-on experience in thelaboratory facilities available at the school. A limited number offield trips were taken by some students. In addition, some careermaterials including video-tapes of visits to local employers wereavailable to the students,
Toledo Woodward - Woodward is a general high school in thecity of Toledo. Its student body is primarily lower middle classand is an ethnic and racial mix. The Career Pxploration Program atWoodward was primarily an orientation program largely made un of twoweeks (one in winter and one in spring) in which the entire ninth andtenth grade student body concentrated on the study of careers. Duringthese two weeks, sneakers came to the school and some students tookfield trips to local industry.
Description of Control School
Toledo Waite - Waite High School is a slightly smaller schooland very similar to Woodward. There was no organized nrogram to studycareers this past year at Waite. There is, however, a vocationalcounselor available to work with the students.
The Sample,
The longitudinal sample studied consisted of all ninth and tenthgrade students who took any of the tests both in the fall and spring.A student was included in the longitudinal group for each test whichhe completed in the fall and spring. He did not have to complete theentire battery to be included. Since the number of students in thelongitudinal group could vary slightly from test to test the figurespresented in Table 1 are for the Career Plans Surges, only. Size of thesample for the other tests was very similar. Note that the percentageof students who took the tests in the fall who were included in thelongitudinal group ranged from a low of 74 percent for Waite ninth graders

r
1
I
1
1
i_
1
I
1
1
1
1
3
Table 1
NUMBER AND PERCENTAGE OF STUDENTS TAXINGCAREER PLANS SURVEY
Fall Total Lonsitudina1Grade 9 Number Number Percentage of
M F Total Fall Total
Woodward 448 234 273 507 77
IWaite 281 81 128 209 74
Patterson 453 178 235 413 91
Grade10
Woodward 483 165 217 382 79
Waite 426 144 201 345 81
Patterson 523 200 276 475 91

4
to 91 percent for Patterson ninth and tenth graders. At every school thepercentage of females participating was greater than males. The percentageof females was greatest for Waite grade 9 (61 percent) and leant for Wood-ward grade 9 (S4 percent).
Test Administration
In order to evaluate the effectiveness of the program, the followitfour instruments were used: Ohio Vocational Interest Survey (0V/S).Tennessee Self-Concept Scale (TSC), Career Plans Survey (CPS), and ParentSurvey (PS). The last two instruments, the Career Plans Survey and theParent Survey were developed by the investigators.
Tests were given to all students nresent in the ninth and tenth eradesof Patterson, Waite, and Woodward during the weeks of October 19-23, 1970.In the Spring tests were given to all Patterson students during the weekof May 3-7, 1971 and Waite and Woodward students during the week of May 17-21, 1971.Parent questionnaires were sent home with students at patterson in April andat Woodward in May, 1971.
At Patterson the tests were administered by the regular classroom teachersduring the periods regularly assigned to the Career Exploration program. AtWaite, the tests were administered by the counselors and some teachers to stu-dents in regular classrooms in both the fall and spring. At Woodward studentswere tested by the local Career Exploration Program coordinator, counselorsand some teachers in class sizes of approximately 90 students in the fall.In the spring the tests were administered in the same size groups but weresupervised by the Career Exploration Program coordinator assisted by aUniversity of Akron graduate student. Substitute teachers were hired andtrained to give the tests. They were assisted in proctoring the tests bysome classroom teachers. In all schools the tests took four or five classperiods to administer both in the fall and spring.
All answer sheets in the spring were precoded with the name and studentnumber of all students who participated in the fall testing. This was doneto assure the matching of the maximum number of students who took the testsboth times.
Data Analysis
Ohio Vocatiompl Interest Survey - A comparison was made of the chancesin each of the 24 scale scores from fall to spring. Analysis of covariancewas used to compare changes in each experimental school grade to the corres-ponding grade in the control school. In addition, each experimental schoolwas compared with the other by grade and ninth and tenth grade nerformanceswere compared by school.
Changes in scale clarity scores on each of 24 scales were calculated.The number of students in each group whosi-icale clarity score went up, down,or remained the same on each scale was computed. Chi square tests were thendone comparing the number of students whose score either went up, down, orremained the same for the following groups: Control vs. Txnerieental by trade,Experimentall vs. Experimestal2 by 'rade,. Experimental' ninth vs. tenth grade.and Exnerimental2 ninth vs. tenth grade.
5
Changes in scale clarity scores for each of the longitudinal groupswere determined by tallying the number of students in each prom who hadH. F, or I scores on the pre-test and post-test. Post-test results wereused as the observed distribution and pre-test results were used-as theexpected distribution in calculating chi souare. The assumption was madethat the fall or pre-test should serve as the base line and if the programmade no difference then there should be no change in the post-test orspring testing. The fall and sorine scores ofeach longitudinal groupwere compared in this fashion.
Finally, three comparisons were made utilizing students' first choiceexpressed and/or inventoried interests. First a "t" test was calculatedcomparing the change in the mean inventoried rank of the first choice ex-pressed interest comparing each longitudinal group with itself from fallto spring. Second, an analysis of covariance was done comparing the changefrom fall to spring in the inventoried rank of the first choice expressedinterest comparing the folloting groups: Control vs. Fxperimental by grade.Experimental' vs. Expertmental2 by grade, Experimental) ninth vs. tenthgrade, and Experimental2 ninth vs. tenth grade. Third, a tally was madeof the number in each longitudinal group whose first choice inventoriedinterest changed versus the number that remained the same for each group.Then chi salaam comoarisons were made between each experimental schoolwith the Control school by grade level, each experimental school with theother experimental school by grade level, and the two grade levels in eachschool. Fourth, the same chi square comnarisons were made for changes infirst choice expressed interests.
f.areq; Plans lurvev - The Career Plans Survey was a 25 itemmultiple choice questionnaire designed by the researchers to determinestudent career experiences, attitudes, and olans. Analysis of data fromthe Career Plans Survey was different for each of three groups of nuestions.
The first group, questions 1, 2, and 3, were designed simply to elicitdescriptive data about the status of students at the beginning and end ofthe year. Students could mark as many choices as applicable for these threequestions thus the percentages were calculated bv dividing the number ofstudents choosing a particular choice by the total number of students.This led to total percentage responses to the questions in excess of onehundred percent in some instances.
The second set of questions (4, 6, 7, 8, 9, 13, 15, 17) were actuallyrating scales and were treated as such. The mean response for each groupwas use is the basis of comparison for these groups. In each instancethe higl st rating a student could give to a question was 0, while thelowest ranged from 2 to 4. Analysis of covariance was used to comnarethe fall versus spring means for all three school. at each grade level.When an F significant at the .05 level or greater as found, the NewnanKeuls procedure was used to determine which of the groups differed signifi-cantly from one another.
For the remaining questions (5.23, 24, 25) two types of comparisons
group (ex.: ninth grade Patterson) acalculated by subtracting the number
10, 11, 12, 14, 16, 18, 19, 20. 21. 22.were made. first for each longitudinalchange score from fall to swine WWIof students choosing each resnonse for

6
each question in the fall from the number making that response in thespring. A constant equal to the total number in the largest group tobe compared was added to all change scores to be compared to removeminus numbers. Chi square comparisons of the char. scores were thencalculated comparing experimental and contre ,e grade level.In addition, each experimental group was Cab with the other bygrade and the two grades in each experimental school were compared witheach other. Sezond, using the change scores for each longitudinal groupand the adding of constants as previously described, the change scores foreach response to each question for the longitudinal groups were used asthe observed distribution for a chi square test. Zero plus the constantwere used as the expected frequency. The assumption was again made thatno change would be the expected outcome if there were in fact no changeas a result of the program. Significant change in these questions foreach longitudinal group was determined in this fashion.
Tennessee Self-Concept Scale - Analysis of covariance comparingchange in scores from fall to spring for stidents by grade for all threeschools was calculated for the following nine scales: Self-Esteem (TotalP), Identity (Row 1), Self-Satisfaction (Row 2) Behavior (Row 3). PhysicalSelf (Column A). Moral-Ethical Self (Column B), Personal Self (Column C),Family Self (Column D), Social Self (Column E). If an F significant atthe .05 level or greater was found between the three groups on any scale,a Newman-Keuls test was done to determine which means were significantlydifferent from the others.
Parent Survey - The Parent Survey was a brief rating scale designedby the researchers to determine patent attitudes toward the Career Explora-tion Program. Ouestionnaires were sent to the parents of all of the participantsin the two experimental schools. Results were tallied and reported only aspercentages. No statistical comparisons were made between schools.
Highlights
The investigators, in order to provide the reader with an overview ofthe findings, have deviated from the more traditional format for presentingthe summary of the study. Such a Lhauge was deemed desirable because of thewealth of data presented in the report. It is hoped that by first readinga very cursory presentation of the more Important findings in highlight form,that the reader will be better able to understand the total report. Thereader is cautioned against making any generalizations only on the basisof the data presented in Chapter I. A careful reading of the entire reportis essential if one is to comprehend the essence of the findings presentedin this chapter.
In order to determine the effectiveness of the program in meeting theobjectives, hypotheses related to the objectives were tested. The high-lights of the findings for a particular objective and its related hypothesesfollow the statement of the same. The instrument used to treat the hypothesisappears in parenthesis after each hypothesis.

Objective 1.
Hypotheses:
7
To help the student develop more appropriatecareer interest patterns based upon knowledgeof himself and the world of work.
1A. That the nature of the students' interestswill change significantly as a result ofparticipation in the Career ExplorationProgram. (OVIS)
1R. That students will be more consistent intheir expressed like or dislike for allactivities related to specific occupationalclusters as a result of their participationin the Career Exploration Program. (OVIS)
1C. That there will be greater change in students'expressed interests as a result of their211.11s121tion in the Career ExplorationProgram. (OVIS)
1D. That there will he rester change in stu-dents' inventoried interests as a result oftheir participation in the Career ExplorationProgram. (OVIS)
1E. That there will be greater correspondencebetween first choice expressed interest andfirst ranked inventoried interest as a resultof narticipation in the Career ExplorationProgram. (OVIS)
Highlights of Findings Related to Objective 1
(1) There were few significant differences in change in scale score fromfall to spring when the experimental and control schools were com-pared. When experimental schools were compared with each other bygrade again there were few changes.
(2) There was much greater change in scale score between grade levelswithin a school than between the same grade level in differente-hools.
(3) Grade level within participating school did not have any impact orsignificant change in scale clarity score.
(4) Patterson ninth grade had greater tendency for their scale claritygeores,to remain the same than did Waite and Woodward ninth graders.This same trend was also apparent, but to a lesser degree, in thetenth grade comparisons.
(5) The number of students in both grades q and 10 at Patterson whohad "I" (Inconsistent) scale clarity scores in the sprine wassignificantly greater than for the other groups.
de

8
(6) PattersOn tenth grade students were significantly more consistentin their expressed interests from fall to spring than Pattersonninth graders and Waite tenth graders.
(7) Patterson tenth graders were sienificantly more consistent intheir inventoried interests from fall to spring than wereWaite tenth graders, Woodward tenth graders. and Pattersonninth graders. The Career Exploration Program, thus, had lessimpact upon changing Patterson tenth graders' areas of interestthan the above mentioned group..
(8) Pltterson tenth grade students inventoried rank of their firstshasemresaed interest changed significantly more in the"- desired direction than did those of Patterson ninth gradestudents and Woodward tenth grade students.
Objective 2.
Hypotheses:
To help the student to develop more appropriateeducational and vocational plans and goals basedupon knowledge of himself and the world of work.
2A. That students' educational and vocationalplans and goals will change significantlyas a result of the Career Exploration pro-gram. (CPS)
2B. That a greater percentage of students willhive definite education and vocational plans
Explora-tion Program. (CPS)
Highlights of Findings Related to Objective 2
(1) "Field trips to observe people at work" and "talks at school bypeople who know about or work at the occupation" were most oftenreported by students from all three schools as onjaCttheyle.learned about occupations prior to the 1970-71 school year.(Ouestion 1)
(2) In general, iihigher perctntage of students.frogi the experimentalschools than the control school indicated on the spring surveythat "field trips to observe people at work," "information froma special class on careers," and "talks at school by people whoknow about or work at the occupation" were ways that they hadlearned at school about occupations during the 1970-11 schoolyear. A higher percentage of Patterson students than Woodwardor Waite students indicated in the spring the opportunity of"trying some of the training required for the occupation" and"getting information about occupations in their regular classes"as ways that they had learned at school about occupations.(fluestion 2)

9
(3) "Field trips to observe people at work" were selected as beingthe most helpful source at school for learning about occupationsby approximately one-third of the ninth and tenth grade studentsat Woodward and ninth grade students at Patterson at the timeof spring testing. (Question 10)
(4) Parents and friends were most often named by students from allthree schools as being the people with whom they had discussedthe occupations that were of most interest to them. When thestudent was asked to indicate the most helpful person to himin learning about occupations, parents were still ranked high,but friends and relatives tended to be ranked lower by allgroups. Only Patterson students ranked teachers as being morehelpful than parents in helping them learn about occupations. .
(Questions 3 and 18)
(5) When comparing changes from fall to spring within each of the sixgroups, all the groups with the exception of Waite tenth grade stu-dents reported increased job activity outside the home in thespring. Patterson students reported less job activity outsidetie home at the time of spring testing than did the studentsfrom Woodward and Waite. (Question 24)
(6) Forty percent or less of the Woodward and Waite studentsreported in the fall and spring that they had enough infor-mation about the lobs that interested them to choose theoccupation that they would like to enter. The only groupin which a majority of the students stated both in the falland spring that they felt that they had enough informationabout the jobs that interested them to choose an occupationwas the tenth grade group from Patterson. The Pattersonninth and_tenth grade groups, were significantly higher (towardhaving enough information about jobs to choose one) than werethe ninth and tenth grade groups from Woodward or Waite.The Woodward tenth grade group was significantly higher (towardhaving enough informati6n about jobs to choose one) than theWaite tenth grade group. (Question 17)
(7) Three of the six groups changed significantly from fall tospring in their selection of a high school course of studybased on their interests and abilities. The most apparentchange for all three, Woodward ninth grade and Pattersonninth and tenth grades was in the direction of a greaterpercentage of students selecting a "vocational or technical"course of study. There was also a significant, but randomchange, from fall to spring responses of the Waite tenth gradestudents. (Question 23)
(8) All the experimental groups changed significantly from fall tospring in reporting which course of study their parents wouldlike them to take in grades 11 and 12. The change of responsesfor the Woodward students were fairly evenly distributed overthe six possible choices, while the Patterson students tendedto place grester_eephamis on "vocational and technical" as thecourse of study favored by their parents. (Questiln 21)
t
f
10
4(9) The ninth grade RVoup from Waite was the only group that did
not change significantly from fall to spring when asked whatcourse of study they would take in grades 11 and 12 if theycould take env that they wanted. The change in resnonsesfor Woodward and Waite tenth grade students tended to hefairly evenly distributed among the six choices, while thechange in responses for Woodward ninth grade and Patterson ninthand tenth grade students tended to emphasize "vocational andtechnical" as the preferred course of study in grades 11 and12. (Ouestion 11)
(10) The ninth grade group from Waite was the onrii 'group that didnot change significantly from fall to Riming when asked whichcourse of study they planned to take in gradeR 11 and 12.The change in response for Woodward ninth grade studentstended to be fairly evenly distributed among the six possiblechoices. The most apparent change for the Woodward and Waitetenth grade students was in the increased percentage selectinga "general" curriculum. Finally, there was a noticeable increasein the percentage of Patterson ninth and tenth grade studentsselecting "vocational and technical" in the spring when cem-ented to the fall. (Question 19)
(11) Analysis of the data pertaining to the four its related topost-high school educational and vocational plans and goals interms of the Itudent's interests and abilities, his parents'wishes, his own desires. and his actual plans, revealed nosignificant changes in responses within or between groupsfrom fall to spring. The one choice receiving the highestpercentage of resadhse from all groups in the fall and springwas "go to -a college or university (4 years)." (fluestions12, 16, 20, 22)
(12) Although there were no significant differences within or betweenany of the groups in their responses to how much schooling theythought most young people need these days to get along well inthe world, some interesting trends were apparent. Between 26percent and 38 percent of the groups from Woodward and Waitestated in the fall and spring that a high school diploma wasenough school to get along well in the world. The choicereceiving the highest percentage of response from the Pattersongroups was "high school diploma including vocational and technicaleducation". Between 24 percent and 29 percent of the Pattersonstudents made this choice. In the spring, a total of 57 nercentof the Patterson ninth grade students and 58 percent of thePatterson tenth grade students stated that additional trainingbeyond high school was necessary, while between 41 percent and53 percent of the groups from Woodward and Waite responded ina similar manner. ((question 14)

11
(13) Approximately one-half to three-fourths of the students statedin the spring that they like school a lot or pretty well. ThePatterson ninth grade group was significantly higher (towardliking school a lot) than the Waite ninth grade group. Pattersontenth grade students were significantly higher (towardschool a loti than the tenth grade groups from Woodward orWaite. Woodward tenth grade students were significantly higher(toward liking school a lot) than Waite tenth grade students.All groups, however, tended to be less positive toward schoolin the spring than in the fall.
(14) The percentage of students stating in the fall tnat theydefinitely planned to graduate from high school ranged from85 percent of the Woodward ninth grade group to 99 percentof the Patterson tenth grade group. The Patterson ninth gradegroup was significantly higher (in the direction of definitelyplanning to graduate) than the Woodward ninth grade group.Patterson tenth grade students were significantly higher (inthe direction of definitely planning to graduate) than Woodwardor Waite tenth grade students. The percentage of studentsreporting that they definitely planned to graduate from highschool decreased in the spring when compared with the fall.(Question 7)
(15) The most popular choice of students when asked what one mainthing makes a job a "good job" was that the job has a goodfuture. The percentage of students selecting this choice inthe fall ranged from 25 percent of the Woodward ninth andtenth grade students to 37 percent of the Patterson ninthgrade students. The percentage of response for this choiceremained approximately the same for all groups with theexception of Woodward tenth grade. students and Pattersontenth grade students whose responses for this choice increasedto 37 percent and 42 percent respectively. The change ofresponses within the two groups was significant at the .01level. (Question 5)
(16) Approximately 25 to 30 percent more of the Patterson studentsthan the Woodward and Waite students reported at the time ofthe spring testing that they nad given matter of their pccu-pational choice a great deal of thought (nuestion 4) Themost apparent change within groups from fall to spring occurredin the response from the Patterson ninth grade group. Thepercentage of students from this group reporting that they hadgiven the matter a great deal of thought increased from 62percent in the fall to 79 percent in the spring. Pattersonninth and tenth grade grouns were significantly higher (towardhaving given the matter of an occupational choice more thougnt)than ninth and tenth grade students from Woodward or Waite.
12
(17) A significantly higher percentage of Patterson students thanWoodward and Waite students renorted that their mind was madeup or that they thought their mind was made un regarding theirchoice of an occupation. Analysis of the adjusted means indicatedthat the Patterson ninth and tenth grade students were significantlyhigher (toward being sure that their minds were made un repardinPan occupational choice) than the ninth and tenth grade studentsfrom Woodward or Waite. (estion 6)
Objective 3. To help the student develop a positive self -imageof himself as a person and as a potential worker.
Hypotheses: 3A. That psudents will have a more positiveglobal self -image as a result of theCareer Exploration Program. (TSC)
3B. That students will have a more positiveself -image of themselves as potentialworkers as a .esult of the Career Exnlora-tion Program. (01)
Highlights of Findings Related to Objective 3
(1) There were only two significant differences between groups on theTennessee Self-Concept Scale. Patterson tenth grade students'"identity" scores changed significantly more in the desired direc-tion than did Woodward tenth grade students. In addition, Waitetenth grade students' scores changed significantly more in thedesired direction than Patterson tenth grade students. Thisevidence indicates that the program had little if any impactupon the "global" sell concept of students in the experimentalschools.
(2) In general, Patterson students developed a significantly morepositive attitude toward their abilities and chances for gettingahead in the occupation of their choice than did students atWaite and Woodward. The response on the part of Patterson stu-dents indicates the Patterson program's success in improvingstudents"irocational" self-concept.
Ob ective 4. To provide a program that will he consideredworthwhile by parents of students in the CareerExploration Program.
Hypotheses: 4A. That attitudes toward,the program expressedtov parents will 4e generallv favorable. (ED
Highlights of Findings Related to Objective 4.
(1) Fewer than 10 nercent of the parents responding from Pattersonand Woodward believed that they knew "a lot" about the CareerExploration Program in their child's school. Most of these par-ents indicated that their source of information about the CEPwas their child.

13
(2) The o rtunit for their child to artici ate in the CEP wasevaluat as an excellent or a "good" exnerience by 91 percentof the Patterson parents and 82 percent of the Woodward parents.
(3) 82 percent of the Patterson parents and 74 percent of the Woodwardparents-"strongly agreed" or "agreed" that "this year in schoolmy child has learned about what lobs are available to him".
(4) 78 percent of the Patterson parents and 61 percent of the Woodwardparents "strongly disagreed" or "disagreed" that "this year inschool my child has not learned about what training is requiredfor different jobs".
(5) 58 percent of the Patterson parentrend 63 percent of the Woodwardparents "strongly agreed" or "agreed" that "this year in schoolmy child has learned what different jobs pay ".
(6) 89 percent of the Patterson parents and 79 percent of the Woodwardparents "strongly disagreed" or "disagreed" that "this year inschool my child has learned less about lobs than in past years".
(7) 72 percent of the Patterson parents and 43 percent of the Woodwardparents "strongly agreed" or "agreed" that "my child likes schoolbetter this year because he has had an opportunity to learn aboutjobs".
(8) 73 'ere:rat of the Patterson parents and 64 percent of the Woodwardparents "strongly disagreed" or "disagreed" that "my child hasdiscussed with me less this year than in past years what he wantsto do after completing his high school education".
(9) 86 percent of the Patterson parents and 60 nercent of the Woodwardparents "strongly agreed" or "agreed" that "because of studyingabout jobs in.school this Year, my child has a better idea of whatjobs he would like to do after completing his high school education".
(10) 79 percent of the Patterson parents and 47 percent of the Woodwardparents "strongly agreed" or "agreed" that "because of studyingabout lobs in school this year, my child has a better idea ofwhat jobs he can do well."
Organization of the Report
The reader is once again cautioned against making any generalizations onthe basis of only the findings presented in the prece6inn highlights. Thefollowing chapters should be studied for a more in-depth understandine ofthe data generated by the various instruments.
Chapter TI presents a detailed analysis of the data collected on theOhio Vocational Interest Survey (OVIS) for Objective 1. Chanter TIT »re-sents a wealth of data collected by means of the Career Plans Survey (CPS)for the purpose of determinin whether or not Objective 2 was met by theCareer Exploration Programs studied. Chanter TV nresents the data collectedby means of the Tennessee Self - Concept Scale (TSC) and the Career Plans
Survey (CPS) to determine if Objective 3 was attained. Chanter V presentsthe data collected by means of the parent Survey to determine if Objectivewas achieved. Finally, Chanter VI of the renort presents the conclusionsdrawn by the investleators on the balls of the data nresented in Chanters 7through V. In addition, recommendations for further study and for improve-ment of future Career Exploration Programs are nresented.

Objective 1:
Instrumentation
CHAPTER II
INTERESTS
To. help the student develop more appropriate careerinterest patterns based upon knowledge of himselfand the world of work.
The Ohio Vocational Interest Survey (OVIS) was given to all students inthe fall and spring. The OVIS consists of 280 items which describe activi-ties related to specific jobs. The items are distributed over 24 scales(several of the items are differentiated by sex, thus the additional items).Students are asked to respond to each item on a 5 point scale from "stronglylike" to "strongly dislike". Students may thus get a scale score from 11to 55 on each scale. In addition, students receive a scale clarity scoreon each scale of either "H" (highly consistent), "F" (fairly consistent),or "I" (inconsistent) to indicate how consistent they were in. narking allitems on a particular scale. For a more thorough description of the 24scales, see Appendix.
Hypothesis 1A: That the nature of the students' interestswill change significantly as a result ofparticipation in the Career ExplorationProgram.
Findings
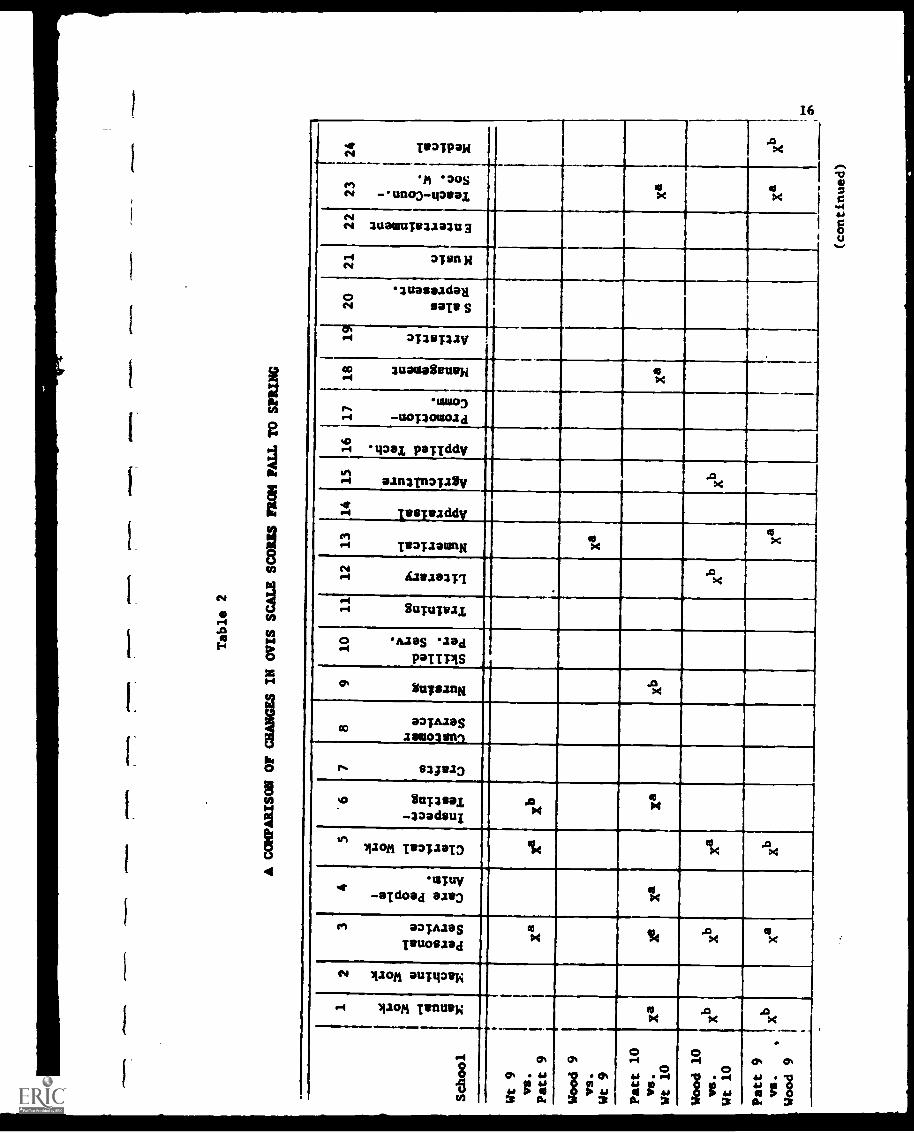
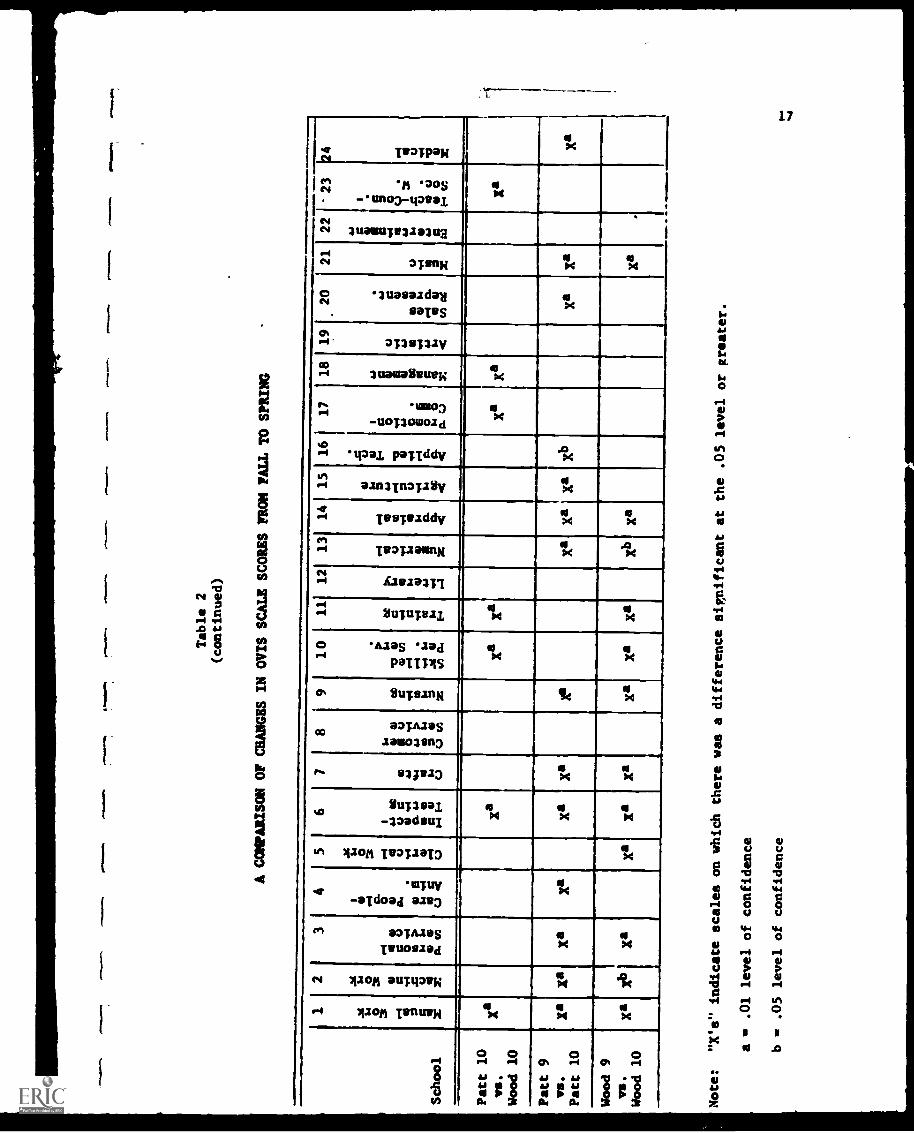
Table 2 illustrates areas in which an analysis of covariance revealedsignificant differences in the changes in OVIS Scale Scores between groupsfrom fall to spring. Three findings stand out in Table 2.
First, there were extremely few (1 to 3) significant differences inchange in scale scores between any grnie 9 control versus experimentalschools. There were only slightly more (5 to 7) significant differencesin change between control and experimental schools at grade 10. Most ofthese changes at grade 10 indicated that there was greater change in thecontrol schools than there was in the experimental schools.
Second, there were also few differences (6 in grade 9 and 7 in grade 10)in change when the two experimental schools were compared. At the ninthgrade level the mean score of Woodward students changed significantly morethan Patterson students in only three instances; and the reverse was also
15
1
I
wil 3 $ ri
ry .0 %.0
C C " g 8 I- 0. 0 C 1
C "il "so it
I- et 0 I- 0
C C "go 0
,0
l'a C Ai g " rt 4, 11:$
CA Pr 0 0 I-
.,........-,- x cr. x cr m
..- ......
Manual Work w
Machine Work po
ax x W ofh 14
a
Personal Service to
>4 °i
Care People -a. Anim.
x ci. x co
Clerical Work ko
14 s a
tot a'
Inspect-
Testing o.
Crafts ..I
Lusfamer co Service
x ix Nursing
u)
Skilled Per. Serv. o
Training
x cr
Literary 1-.
14
X a
Numerical to 1-.
Appraisal
Agriculture
Applied Tech.
Promotion- 1A ,1 Comm.
x a
-. Management co
Artistic to
S ales 1,4 em Represent.
ro M usic
Entertainment ha N
>4 01 01
Teach- Coun.- %)
W 1.10 SOC. W.
)4 cr
I
Medical .a Ka .
91
.101
1....
.
Table 2
(continued)
A COMPARISON OF CHANGES IN OVIS SCALE SCORES FROM FALL TOSPRING
School
1 it 14 0 " 12 ... 1 x
2 SA 0 3 03 24 ..... ) .
3
pI 0 6
g 4
0 b
t i;
a.
CM
4
0 a 66 1 0
a:4
1ii
C.)
5 m 0 3 I-1 0 4 14 A C.)
6
1 4.1
etV
.P4
0. 4
.1
Li :
-1 E
-1
'
7 2 104 z c../
8
140
i.: i
4.1
h,
I L
a0
v3
9 et TIC 44 t z
10
'0 0
A u
5.-
1 ..v14
,V
3 11
4
11
et 0 Is .4 Li
E-4
12' t 2 0 :j4 3
13
1-1 2 V 01 i Z
14
-1 2 Vs
14 at C
15
14 0 XI B 1 LI
*4
161
01 E v ,.I irl i
17
1 0 ..9 " g $4i
II C
.3
18 I a
o03 g 17:
19
.411
1 a 1 14' <
20 47
0 0 ae o
411
14
-4 I
.V
3
21
u ...4 a Z
22
4.) i T
III
"id
II) ta 123
-23
. g 8 .el m
U : s 1-0
10:
124 NU.
U. I 13 X
Patt 10
vs.
Wood 10
Xa
Xa
X*
Xaf
Xa
Xa
.
Xa
- Patt 9
VS.
Patt 10
Xa
,
Xa
Xa
Xa
.
Xa
Xa
.I
1
Xa
Xa
Xa
Xa
Xb
Xa
Xa
Xa
Wood 9
vs.
Wood 10
Xa
xbi
Xa
Xa
.
Xa
Xa
Xa
Xa
Xa
Xb
,
Xa
...,
Xa
.
.....----.
Note:
"X's" indicate scales on which there
was a difference significant at the .05 level or
greater.
a = .01 level of confidence
b = .05 level of confidence

18
true in three instances. At the tenth grade level Patterson studentsdemonstrated significantly greater change on all but two scales.
Third, the greatest number of significant changes came in instanceswhen the two grade levels within the experimental school were comparedwith each other. When Patterson ninth trade was coeeared with Pattersontenth grade, Patterson tenth grade had significantly more change thanPatterson ninth grade on all 14 of the scales on which there was significantchange. Woodward grade 9 changed significantly more than Wbodward grade 10on all 12 of the scales in which there was a significant difference.
Discussion
It appears that a career exploration program has relatively littleimpact upon student interests when change in scale score is used as thecriterion. The number of scale scores in which there was a significantchange was very limited when experimental and control schools were eye-pared. Most of the changes which did occur were in favor of the controlschool. There were also few significant differences in change when thetwo experimental schools were compared with each other by trade level.
Crade level and probably age seem to be a much more important factorin stability of interests than school program. This coincides withresearch on interests which shows that interests tend to stabilize withincreasing age. It appears that interests tend to become stable for moststudents in the tenth grade. A comparison of change by grade levels inthe control school should be done to verify this.
Hypothesis 18:
,Findings
That students will be more consistent intheir expressed like and dislike for allactivities related to specific occupationalclusters as a result of their participationin the Career Exploration Prottram.
Change in the scale clarity score it the OVIS was used to test thishypothesis. Students received one of three scale clarity scores (11=con-sistent, Fefairly consistent, Tinconsistent) to indicate how consistentthey were in their like or dislike of all activities associated with eachscale. Croups were coanared in two ways on their scale clarity scores.First a chi square test was run to determine if a significantly greaternumber of students' scale clarity scores changed in one *roue than another.Second, the number of students in each longitudinal group having each of"H", "F", or "T" scale clarity scores in the fall were comnared with thenumber of students in these same groups having each scale clarity score inthe spring.
To highlight the findings, the greatest number of significant-changes(un, same, down) occurred when Patterson ninth grade and Waite ninth grade(15 changes), and when Patterson grade 9 and Woodward grade 9 (16 changes)were compared by a chi square test (Table 3). In both cases the studentsfrom Patterson had a tendency for their scale clarity scores to remain thesame from ore to post test while those of the other schools tended to

Table 3
A COMPARISON OF NUMBEROF STUDENTS WHOSE OVIS
SCALE CLARITY SCORES
WENT UP, STAYED THE
SAME, OR WENT DOWN FROM FALLTO SPRING
Scho
ol
1 i! i
2 t * 4 g
3 8 . P i :a
4
.4 I A.
II.
di
a,.. 5 0 S 1 w
il a
6 . .. 10
u a
2 : I
14
AA
7 e 14'.;
cil
8
... i 8
Oa
:,
9 IT
+1 a
10 i
1 A
...-4 iz
11
OG
Pi ....0 4
12 t, 6 e
l'
:1
13 1 v4 1 z
,
14 I 1 I 1"
.0t8
i
15
a" .1 -d 4j4
16 0 1-
1 1 744
,
17 i I
18
4.1 ri
19
0404 :4 1 41 e
20 16
: El 0 a
v) A
21
44j I
22
4.1
v4 I. 4 I A
k
23
1 1M U
.fr A
Uit'
A
24
O 4.)
.14 .9 I
Patt 9
vs.
Wt 9
Xs
Xb
Xs
Xs
.
Xb
Xs
Xs
Xa
Xa
.
Xb
Xb
Xa
i
Xb
Xb
Xb
Patt 10
vs.
Wt 10
Xb
Xb
Xs
Xb
Xb
-
Xs
Xa
Xa
Xs
.
1
Xb A
Wood 9
vs.
Wt 9
4.
Xs
,I
,,
,.
..
Xb
-
I
,
Xb
Wood 10
vs.
Wt 10
.
xb
,
Patt 9
vs.
Wood 9
Xs
.
-
Xa
XS
*-
Xb
- -
Xa
Xa
Xa
Xb
Xa
Xa
Xa
Xa
Xb
Kb
.
Xb
Xa
(continued)
0.1.
1110
1

Table 3
(continued)
A COMPARISON OS NUMBER OF STUDENTS WHOSE OVISVALE CLARITY SCORES
WENT UP, STATED THE SAME, OR WENT DOWNFROM FALL TO SPRING
School
1 4 u o m °
2 a 14 o 3 0 4 t X
3
...a Ill W
8 .:1 t t WO
Re
VI
4 I W 1 a 0 0 A. 2!
.5 4Q.-
110_
0_11
U d
ic
5 a u o M r.1 0 0 vl t U
6
1 4.4
61/
00 01 v
l:L
Itli
0.1
E4
7 Is 48 tt 1 U
8
140
1014 it C
C.)
tel
9 00 0 44 E 0.14
1it
Z
10 t
0 11
/V
W'-4 71
4U
)A
d
11
OD a v4 0 V
12
t 1 4 $4 2 r1
13
...1
111 0 vI
14
1-4 10 a ..4 113 t. C.
15
w 0 44 1'1 Z U 11 0
16
w E4
'cal
.C
.
17
04.1
t
81
4 .4u
18
60 4 0 "
19
V vl 4.1 5 vi 4.1
20
6J a 4) W100 10
0.1
I-10
.Is
:
21
W vl C .
22
4.1 a w 1 T
o'
"SW 4 4.4 a 14
23
P 6 1 3 U CU
5 1.4
V1
24
.-4 U ri 'V z
Patt 10
VS.
Wood 10
Xa
Xa
Xa
Xa
Xb
Xb
Xa
Ra
Patt 9
vs.
Putt 10
Wood 9
vs.
Wood 10
Xb
Xb
xb
Note:
"X's" indicate scales
on which there was a difference
significant at the .05 level or
greater.
a.01 level of confidence
b.05 level of confidence
21
fluctuate more (Appendix A). This .rend was also noticeable to a lesserdegree in the comparison of Patterson tenth grade students to those in theother schools. In contrast to the scale scores, change in scale clarityscores did not seem to be effected by grade level.
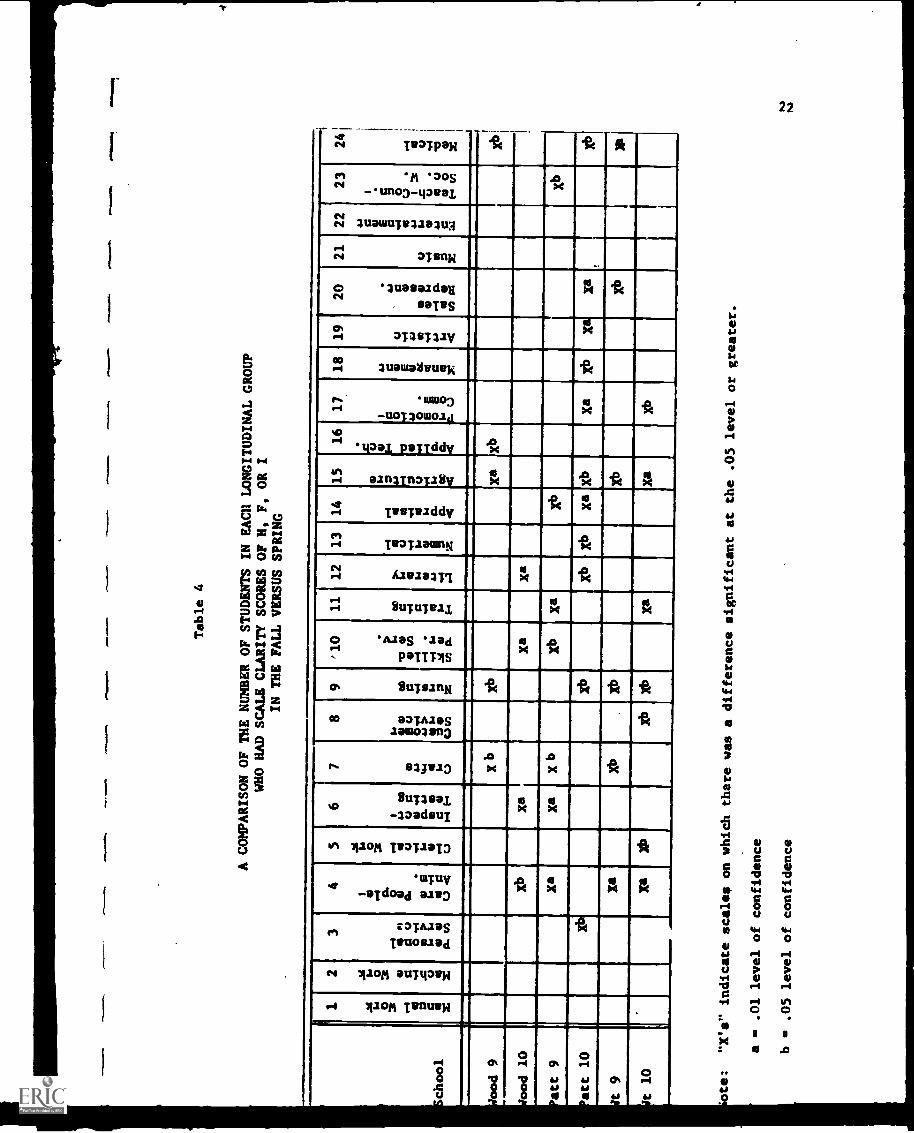
When the number of students in each longitudinal group earning eachscale clarity score ("H", "F", "I") were compared from fall to spring bya chi square test the distribution of scores of Dayton Patterson studentstended to change with slightly more frequency than the distribution ofstudent scores in the other groups (Table 4). Tenth grade students atPatterson demonstrated significant shifts in 11 scales; ninth grade Patt-erson students had significant change in 7 scales. Students in both grades9 and 10 at Waite had significant change on 6 and 7 scales respectively.It is interesting to note that the only discernable pattern of change inany group is that, in almost every instance, on those scales where there wasa significant difference, Patterson students tended to get more "I"(inconsistent) scale clarity scores-in the spring than the other groups(Appendix B).
Discussion
Student scale clarity scores of Patterson tended to remain the samefrom fall to spring to greater degree than students from the other schools.However, when Patterson students' scores did change they tended to changetoward becoming more inconsistent.
Let us examine each of these findings in more detail. First, it appearsthat students attending Patterson had a better understanding of the activitiesassociated with particular occupations at the beginning of the year and, thus,tended to charge little in their consistency of preference for all activitiesrelated to a particular career area during the year. Another possibility maybe that the Patterson program only provided students with limited experiences,i.e. only ones in areas with which they were already somewhat familiar and,thus, students did not get new information upon which to develop opinionsabout activities related to new occupational areas. A third and, probablythe best explanation, is that Patterson students seem to be more mature,informed, and goal direct .gd as evidenced by their applying and being admittedto a rather select vocational high school. These students may, by the natureof the selection process, just be less prone to change. This would explainthe seeming inconsistency between this finding and the one that follows.
The second finding, that the scale clarity scores of students at DaytonPatterson tended to change toward becoming more inconsistent when they didchange, seems to indicate that the hands-on experience at Patterson hashelped students to more clearly differentiate between those activities whichthey consider desirable froL those which are undesirable within a particularoccupation. By being inconsistent, students are saying that there aresome activities associated with an occupation which they like better thanothers. A hands-on experience designed to help students test themselvesagainst job demands should accomplish such a goal.
Hypothesis 1C: That there will be a significant change instudents' first choice ex Tossed interestas a result of their participation in theCareer Exploration Program.
,
Table 4
A COMPARISON OF THE NUMBER OF STUDENTS IN EACH LONGITUDINALGROUP
WHO HAD SCALE CLARITY SCORES OF H,
F, OR I
IN THE FALL VERSUS SPRING
chool
r-
1 .0 M 0 3 "0 S li
2 at Ir 0 3 0 0 704
li
_
3
1.4 0
0/0
0:1
i"g
4 t 11/
r4 0. 0 4/ Ild e 5 li
5 uM 0 3 .4 0 C./
"4 5
1-
6
I M 0
00
0ft
tA A
7 0 41 U
8
k0
I 0 ,at
4.)Bul
9 WI 0 V l
i
'10 14
'0 0
41 U
3r4 ii Iii
11
10 0 ..1 0 4
12 t. 0 t1
;
13
1.4 V p1 til !
14
1.4 : ,4 :So 4
15
0 0 ;LI 0 .4
14 4
16
4 U '0.°
141 "1 4.
12-
17
0 10 ai
P 8
1
18 0 0 i :A'
li
19
U 1/4 .4 li
20 41 0 0 0
: Z "cli
Oa
21
.r4 ;
22
4. 0 r4 41 .../
t14/ li
23
1 i 0 U 1 3 t A
li
241
11 0 X iT
.
ood 9
?
X b
4
. Xb
Xa
Kb
,
Xb
ood 10
Xb
H
xa
,xa
xa
I...
.,
,.
att 9
Xa
Xa
X b
Xb
Xa
1
Xb
Xb
att 10
.
Kb
Xb
Xb
Xb
Xa
X0
,
Xa
Xb
Xa
xa
Xb
t 9
Xa
Xb
-4
Xb
I
Xb
1
Xb
Ai
t 10
-.1 I
i
Xa
)6)
II
Xb
1
Xb
._
Xa
Xa
l1
ote:
"X's" indicate scales on which there
was a difference significant at the .05 level
or greater.
a IR .01 level of confidence
b gm .05 level of confidence
23
Findings
Only two groups showed significant shifts in their expressed interests(students were asked which of the 24 occupational areas they would most liketo do) when compared with the other groups (Table 5). When tenth gradestudents at Patterson and Waite Wen compared, Patterson tenth graderstended to change less in their first choice than those at Waite. Even atPatterson, almost 45 percent of the students selected a different firstchoice in the spring than in the fall (Appendix C).
The second significant difference was between ninth and tenth gradestudents at Patterson. In this instance only 42 percent of the ninth graders'choices remained the same compared with 56 percent of the tenth graders.Not more than 56 percent of any group nor less than 42 percent of anygroup held the same expressed choice in the spring as in the fall.
biscussion
The tenth grade students at Patterson demonstrated a greater degree ofconsistency in occupational choice than two other groups. Considering thatthese students had spent two years at a vocational high school it is some-what surprising that they did not significantly surpass all five other groupsin their occupational certainty. On the other hand, it is interesting tonote the greater inconsistency in thePatterson ninth graders comnared withthose in the tenth grade. One would expect that once the program is in fulloperation, tenth graders in a Career Exploration Program should tend to hemore consistent in their expressed choice than tenth graders not in theprogram and more consistent than all ninth graders.
An explanation for the Dayton finding may he that the ninth gradersat Patterson were exposed to four occupational areas during the Year andwere probably influenced to change their expressed choices 1w this exposurein many instances. (In the other hand, the Patterson tenth graders had beenforced to make a commitment to a single occupational area at the end of theninth grade and only studied in that single area as a tenth grader. Sincethe tenth graders had made a commitment and had been given little new infor-mation about other careers since then, it is easy to see why they reactedas they did.
Hypothesis 1D: That there will he a greater change instudents' inventoried interests as aresult of their narticination in theCareer Exploration Program.
Findings
The change in the ranking of the highest ranking inventoried interest(one with highest scale scare on the OVIS) area was also compared from fallto snring (Table 6). Again, the Patterson tenth graders demonstrated agreater nropensitv to have the same inventoried interest from fall to springthan most other grouns. A significantly greater percentage of Pattersontenth graders (44 percent) inventoried interest remained the same than didWaite tenth graders (34 percent), Woodward tenth graders (35 percent), and
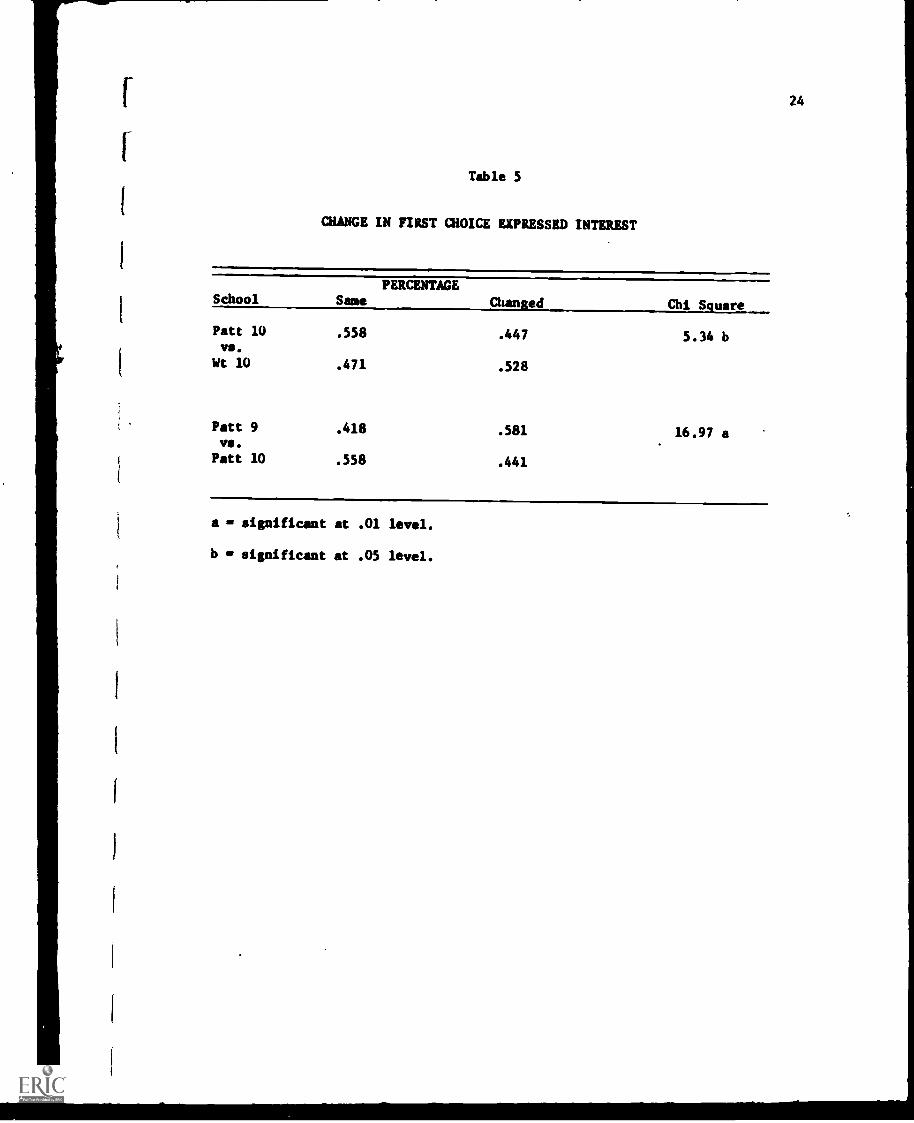
Table 5
CHANGE IN FIRST CHOICE EXPRESSED INTEREST
SchoolPERCENTAGE
Same Changed Chi Square
Patt 10vs.
.558 .447 5.34 b
Wt 10 .471 .528
Patt 9vs.
.418 .581 16.97 a
Patt 10 .558 .441
a significant at .01 level.
b significant at .05 level.
24
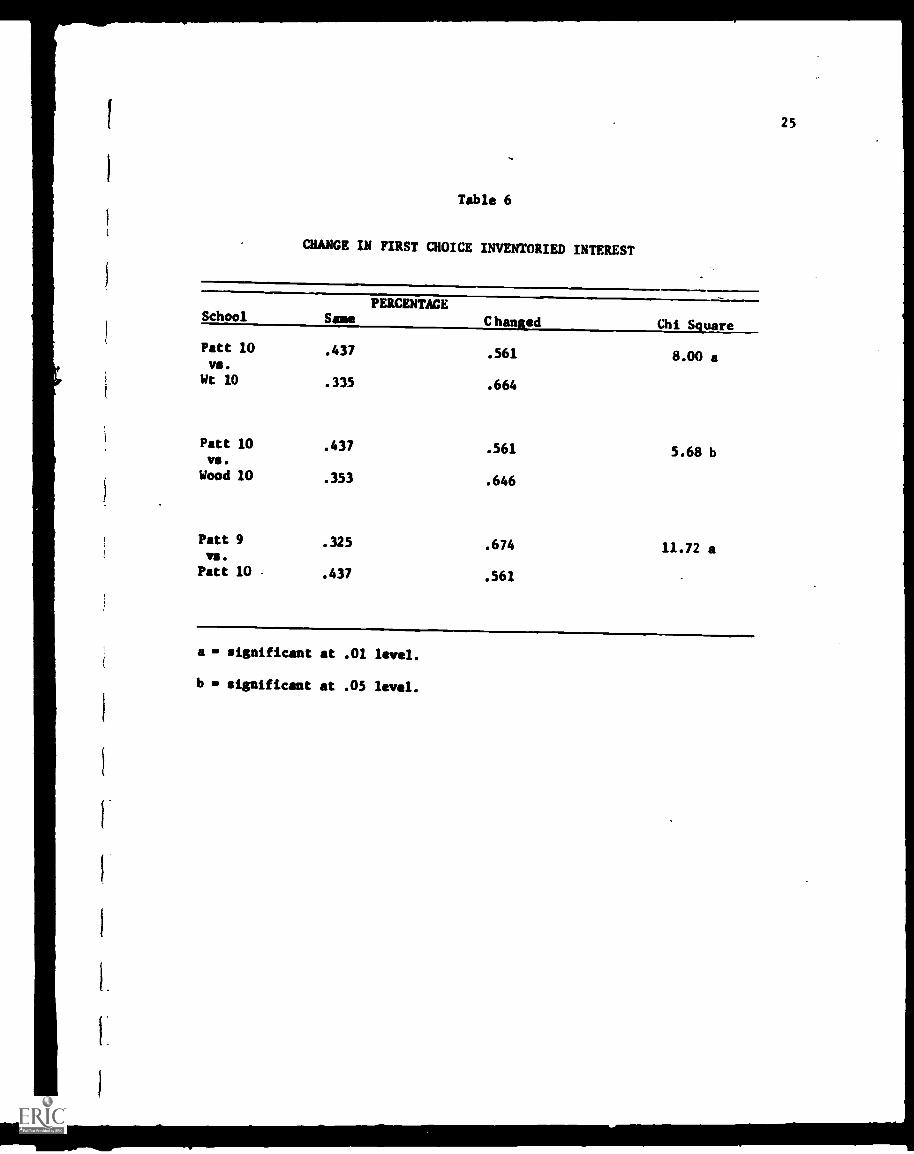
Table 6
CHANGE IN FIRST CHOICE INVENTORIED INTEREST
PERCENTAGESchool Same Changed Chi Square
Pitt 10 .437 .561 8.00 aVS.
Wt 10 .335 .664
Pitt 10 .437 .561 5.68 bVS.
Wood 10 .353 .646
Patt 9vs.
.325 .674 11.72 a
Patt 10 .437 .561
a significant at .01 level.
b significant at .05 level.
25

26
Patterson ninth graders (33 percent). The percentage of each group whoseinventoried interest remained the same from fall to spring ranred from alow of 31 percent to a high of 44 percent (Appendix 0).
Discussion
As in the previous hypothesis, it appears the students in the tenthgrade at Patterson had a clearer idea of what they wanted to do and of theactivities commensurate with that occupational area at the beginnin ofthe year than most groups of students in the other schools. Again, thismay be the result both of the selection process which these students wentthrough prior to being admitted to Patterson and the program that theyparticipated in at Patterson as ninth graders, since they had participatedin a program similar to the Career Exoloration Program as ninth graders.It appears that the Career Exploration Program had least impact uponPatterson tenth graders in changing their field of interest, but it didhave an impact upon them in their ability to differentiate between desir-able and undesirable activities associated with several career areas. Itis also possible that many of the Patterson students who were not sureabout their career choice dropped out of Patterson between the ninth andtenth grades. About 10 percent of the freshmen do not return for theirsophomore year.
Hypothesis 1E:
Findines,
That there will be greater correspondencebetween first choice expressed interestand first ranked inventoried interest asa result of participation in the CareerExploration Program.
A "t test" was done to compare the average inventoried rank of thefirst choice expressei interest for each longitudinal group in the fallvenue the spring. There was no significant difference in the rank fromfall to spring for any group.
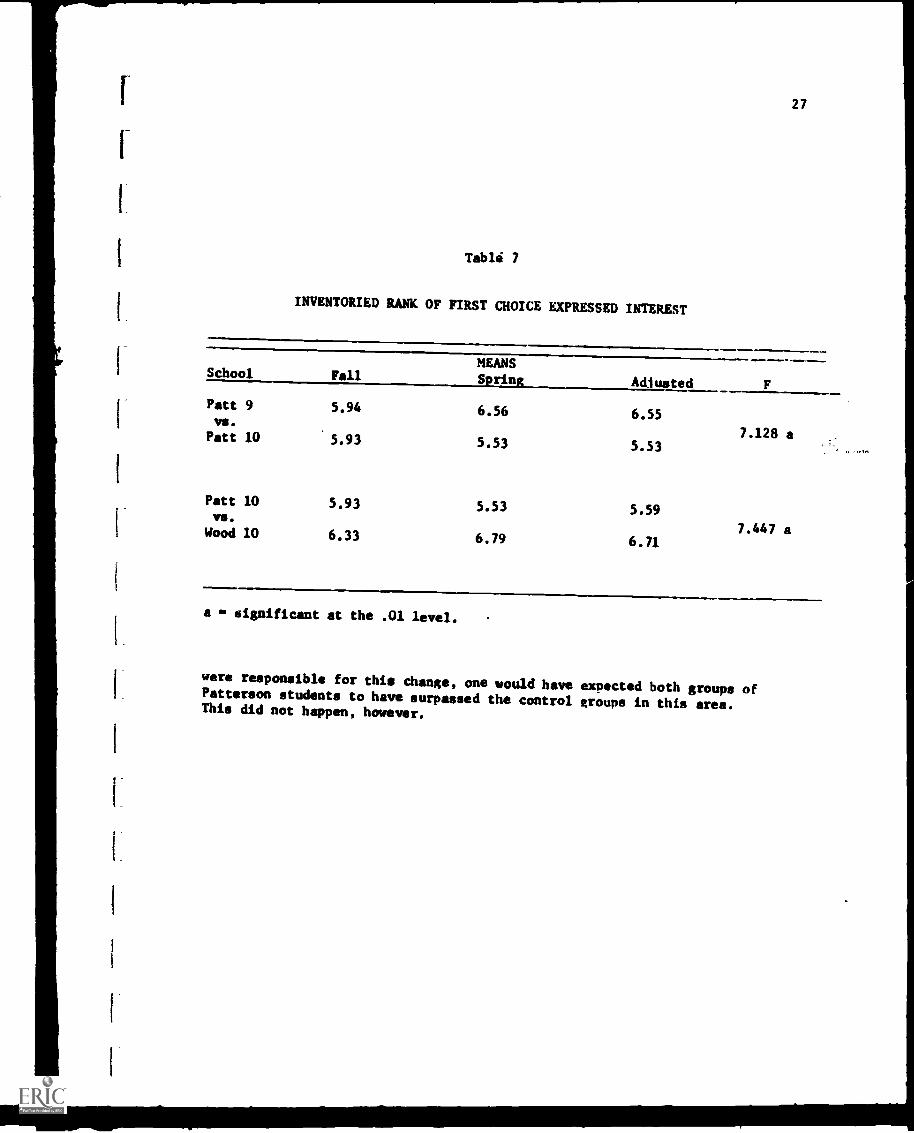
In addition to the "t" test, an analysis of covariance was done tocompare changes from fall to spring in inventoried rank of first choiceexpressed interest(Appendix E). Two changes were significant (Table 7).Patterson tenth grade students inventoried rank of their first choiceexpressed interest changed significantly more in the desired directionduring the program than did those of Patterson ninth grade students.Patterson tenth grade students also changed significantly more in thedesired direction than students in Woodward tenth grade.
Discussion
Originally, it was thought that, as students became more aware ofthe activities associated with a particular occupational area, there wouldbe a greater corresoondence between what the student said he would like todo (expressed interests) and his expressing a liking for the activitiesassociated with that occupational area (inventoried interests). This didhappen to a greater extent with Patterson tenth grade than with Pattersonninth grade or Woodward tenth grade. If the Career Exploration program
27
Tabli 7
INVENTORIED RANK OF FIRST CHOICE EXPRESSED INTEREST
School FallMEANSSpring Adjusted F
Patt 9 5.94 6.56 6.55vs.
7.128 aPatt 10 5.93 5.53 5.53IA
Patt 10 5.93 5.53 5.59vs.7.447 aWood 10 6.33 6.79 6.71
a significant at the .01 level.
were responsible for this change, one would have expected both groups ofPatterson students to have surpassed the control groups in this area.This did not happen, however.
CHAPTER III
EDUCATIONAL AND VOCATIONAL PLANS AND GOALS
Ob active 2: To help the student to develop more appropriateeducational and vocational plans and goalsbased upon knowledge of himself and theworld of work.
In order to determine whether or not Objective 2 was attLined, twohypotheses relating to the objective were written and tested by means ofthe data collected with the Career Plans Survey (CPS) which was developed
.
by the investigators specifically for the evaluation of the Career Explora-tion Programs. The CPS was designed to collect process and product datafrom the students enrolled in the experimental and control schools. Theprocess data concerned sources and adequacy of the career information andwere not directly related to the hypotheses. The product data were collectedin the areas of vocational and educational plans, attitude toward work andschool, work experience and self concept. The data pertaining to all ofthe above areas except self concept are presented in the following sections.
Sources and Adequacy of Career Information Available to Students-Selected items in the Career Plans Survey were designed to solicit studentresponses related to the source and adequacy of career information avail-able to them. These items, although not directly related to the two statedhypotheses, provide an excellent opportunity to learn about sources ofcareer information es viewed by students.
Questions 1 and 2 of the CPS asked the students to indicate the waysin which they had learned at school about occupations prior to the 1970-71school year and ways in which they learned at school about occupationsduring the 1970-71 school year.
Question 1 stated, "Indicate all the ways in which you have learnedat school about occupations before this (1970-71) school year." Analysisof the data from the fall, 1970 survey for Question 1 reported in Table 8suggests that "field trips to observe people at work" and "talks at schoolby people who know about or work at the occupation" were most often reportedby students in the six groups as ways that they had learned about occupationsprior to the 1970-71 school year. In addition to the above two choices,approximately 60 percent of the Patterson tenth grade students also selected"trying some of the training required by the occupation" and "taking specialcourse(s) dealing with occupations."
28

Table 8
PRETEST AND POSTTEST PERCENTAGES OF RESPONSESFOR ALL GROUPS FOR OUESTION 1
stion 1.
Indicate all the
ways in which you have learned
at school about occupations
before this (1970-71) school
year.
0.
Field trips to observe people
at work.
1.
Information from a special
class on careers.
2.
Talks at school by people who
know about or work at Oct.
3.
Trying some of the training
required f-r the occupation.
4.
Getting information about
occupations in your regular
academic classes.
5.
Reading about occupations
from information in the
school library or guidance
office.
6.
Talking to a guidance
counselor.
7.
Taking special courses)
dealing with occupations.
8.
Other.
9.
None of the above.
Testing
Date
PERCENTAGES
Woad
Vt
Pat t
Grade 9
N-506
Grade 10
N382
Grade 9
N206
Grade 10
No344
Grade 9
N-414
Grade 10
N-476
Fall
53
37
56
33
61
70
Spring
65
57
46
29
65
66
Fall
22
20
21
24
25
40
Spring
25
26
21
21
22
45
i
Fall
56
44
57
59
55
64
Spring
48
51
50
54
53
66
Fall
19
18
12
20
14
59
Spring
13
12
13
19
20
62
Fall
30
32
28
30
34
43
Spring
24
28
25
31
34
46
Fall
34
42
28
32
46
41
Spring
26
32
33
30
50
38
Fall
15
19
26
27
34
36
Spring
12
14
22
26
32
40
Fall
15
20
11
17
11
61
Spring
12
13
09
22
14
58
Fall
21
25
33
29
25
Spring
27
29
27
33
28
28
Fall
14
16
12
12
05
03
Spring
17
12
09
11
07
01

30
Ouestion 2 stated, "Indicate all the ways which you have learned atschool about occupations this (1970-71) school year," Data from Ouestion 2from fall and spring tests for the six groups are presented in Table Q.In general, a higher percentage of students from the experimental schoolsthan the control school indicated on the spring survey that "field trinsto observe people at work," "information from a special class on careers,"and "talks at school by people who know about or work at the occupation"were ways that they had learned at school about occunations during the1970-71 school year. A higher percentage of Patterson students thanWoodward or Waite students indicated in the fall and spring "trying someof the training required for the occupation," "getting information aboutoccupations in your regular classes," "reading about the occupations frominformation in the school library or guidance office", and taking a specialcourse dealing with occupations."
Table 10 presents the percentage of student responses from the falland spring longitudinal groups for Ouestion 10. The student was asked toindicate the sources at school which were most helpful to him in learning/about the occupation he was considering. Question 10 stated, "From thetime you were in the first grade until now, which one of the followingsources at school has been the most helpful to You in learning about theoccupation you are considering?" A significant number of students in theninth and tenth grades at Woodward and in the ninth grade at Pattersonanswered this question differently in the spring than in the fall. In thespring, an increase of ten percent or more of the students from each ofthe three groups named "field trips to observe people at work" in responseto Ouestion 10, while the percentamof response for "none of the shove"decreased. Responses for tenth grade Woodward students increased 5 ner-cent or more in the snring over the fall for "talks at school by people whoknow about or work at the occupation," and "other". "Trying some of thetraining required for the occupation" was listed by 7.percent more Pattersonninth grade students in the spring than in the fall, while "taking specialcourse(s) dealing with occupations" was named by 4 percent more of thesestudents in the spring.
In addition to the above differences, there was a significant differencein the change of responses from fall to spring on Ouestion 10 between theninth grade longitudinal group from Woodward and the ninth grade longitudinalgroup from Waite. The major difference in the responses of the two groupswas the increase of 17 percent of the ninth grade Woodward students choosing"Field trips to observe people at work" and the decrease of 10 percent ofthe group stating "None of the above", while responses of Waite studentschanged little. It is interesting to note that field trips were judged moreuseful than "hands-on" experience by ninth grade students at Patterson andthe two exnerienced were judged almost equal by tenth grade Patterson students.
In addition to the ways at school that he had learned about occupations,each student was asked to indicate with which people he had discussed theoccupations that were of most interest to him and which of the people werethe most helpful to him in learning about the occupations. A survey of theresponses on questions 3 and 1R suggest a similarity of responses for thesix groups. ly ranking the percentage of responses from highest to lowest.one can ascertain a pattern of communication by students in discussing withothers the occupations that are of most interest to them.

Table 9
PRETEST AND POSTTEST PERCENTAGES OF
RESPONSES FOR ALL GROUPS FORQUESTION 2
Question 2.
Indicate all the
ways which you have learned sl
school about occupations this
(1970-71) school year.
O.
Field trips to observe
people at work.
1.
Information from a
special class on careers.
2.
Talks at school by
people who know about or
work at the occupation.
3.
Trying some of the train-
ing required for the
occupation.
4.
Getting information about
occupations in your regular
academic classes.
5.
Reading about the occ. from
Information in the school
library or guid. off.
6.
Conversation with a guidance
counselor.
7.
Taking a special course
dealing with occupations.
8.
Other.
9.
None of the above.
Testing
Date
PERCENTAGES
Wood
Wt
Grade 9
N506
Grade 10
N382
Grade 9
N206
Grade 10
N=344
Grade
N414
Fall
18
13
16
14
27
Spring
83
81
23
14
78
Fall
14
16
16
16
46
Spring
40
43
28
20
58
Fall
25
26
20
43
55
Spring
75
76
33
44
68
Fall
15
21
07
19
57
Spring
11
16
18
18
73
Fall
24
25
23
23
31
Spring
28
28
27
30
40
Fall
19
21
19
23
33
Spring
27
29
35
24
52
Fall
13
12
14
16
11
Spring
16
19
19
24
24
Fall
15
23
15
18
58
Spring
14
16
13
22
58
Fall
18
17
15
21
13
Spring
23
25
22
23
18
Fall
38
32
39
26
03
Spring
06
04
19
17
00
Patt
9!
Grade 10
1N476
4
23
48
36
151
51
69
74
80
46
i59
31
40
24
43
59
67
20
-26
01
01

rrw
.0.1
1016
.0.1
0.
Table 10
CONPAR/SON OF THE MOST HELPFUL
WAYS FOR LEARNING ABOUTOCCUPATIONS AT SCHOOL
Question 10.
From the time you were
in the first grade until
now, which of
the following sources at schoolhas
been most helpful to
you in learning
About the occupationyou are consider-
ing.
Testing
Date
Wood
Grade 9
N*506ab
Grade 10
N*382a
PERCENTAGES
Wt
Grade 9
Grade 10
N*2061)
IN.344
Patt
Grade 9
N410
Grade 10
N476
0.
Field trips to observe people
at work.
1.
Information from a special
class on careers.
Fall
Spring
Pall
Spring
2.
Talks at school by people who
know
Fall
about or work at the occupation.
Spring
3.
Trying some of the training
required for the occupation.
4.
Information from your regular
academic classes.
Fall
Spring
Fall
Spring
5.
Reading about the occupation from
Fall
information in the school library
Spring
or guidance office.
6.
Conversat!;:e with a guidance
counselor.
7.
Taking special course(s)
dealing with occupations.
Fall
Spring
Fall
Spring
21
38
0506
15
16
06
04
07
04 10 07 01 02
05 01
16 28
02
03
14
22
08
03
1405
14
08
0203
07
04
18
18
01 05
19
16
04
05
12
07
13 11 04
06
02
06
10 09
02
03
19
22
08
06
09
12 11 07
0404
05
07
20
30
04
04
12 10 12
19
06
04 10 06
03 01 08
12
18
20
03
04 11 10 25
24
05
04
07
04
02
03 13
16
8.
Other.
Fall
07
07
09
12
12
10
Spring
09
13
09
13
08
11
9.
None of the above.
Fall
22
17
18
i19
13
06
Spring
1Z
11
16
17
06
11.4_
a * Difference between fall and
spring responses for this
group significant at the .01 level.
b a Difference in changeof responses from fall
to spring between Woodward ninth
grade and Waite ninth grade
significant at .01 level.
Is)

33
Table 11 present's a ranking of student responses from the fall andspring longitudinal groups for Question which asked, "With which of thefollowing people have you discussed the occupations that are of mostinterest to you?", and Question 18 which asked "Of those people von havediscussed occupations with, which one do you feel helped you most to learnabout the occupation?"
Examination of the data from Table 11 shows that there were fewchanges in rankings of persons from the fall to 'caring testine on(location 3. Parents were ranked #1 and friends #2 on both dates by alllongitudinal groups on Question 3. On (ocation IR, however, when thestudent was asked to indicate the most helpful merson to btpLin learnineabout occupations, both friends and relatives tended to be ranked lowerby all groups than on Question 3. Someone working in the occupation andteachers tended to be ranked higher. Only Patterson students rankedteachers higher than parents on nuestion 18. Changes in ranking ofnersons from fall to spring by all groups tended to be evenly distributed.
Table 12 provides additional data for Question 18 which asked, "ofthose people You have discussed occunations with, which one do you feelhelped you most to learn about the occupation?" A smaller nercentage ofstudents from all groups in the spring named "your parents" as being mosthelpful in learning about the occupation. The percentage of Woodward ninthand tenth grade students selecting "Someone other than the above who worksat the occupation" increased from 10 and 12 percent respectively in thefall to 18 percent for both groups in the spring. The most observablechange in the responses of the Patterson students was the increase in thenercentage of students selecting "your teachers" in the spring when comparedto the fall. The increase was from 22 percent to 38 percent for the ninthglade and 36 percent to 46 percent for the tenth grade Patterson students./1 change in responses for Question 18 from fall to spring within thenitb and tenth grade groups from Woodward and Patterson was significantat the .01 level. When considering the difference in the change of responsesfrom fall to spring between groups, a significant difference was foundbetween Woodward and Patterson ninth grade students (.01), between Wood-ward and Patterson tenth grade students (.01), and between Waite andPatterson ninth grade students (.05).
An important element in gaining knowledge of the world of work andin developing a positive attitude toward work is actual on-the-lob experience.Question 24 of the CPS attempted to determine the percentage of students ineach of the six groups having a Job at the time of pretesting and at thetime of oosttesting. This data not only reveals the percentage of studentsworking in the fall and spring, but allows for a comparison within andbetween each group from fall to spline, Data from the experimental andcontrol groups should be beneficial in determining if significant differences,which might be attributed to the Career Exploration Proprams, exist betweenthe groups.
Examination of the data presented in Table 13 reveals that 23 to 28percent of the students from all groups reported in the fall that they had"A regular lob outside the home where you work at least once every week andget paid for it." The percentage of response for "NO job outside the home"for the fall testing ranged from 43 percent Waite tenth grade students to
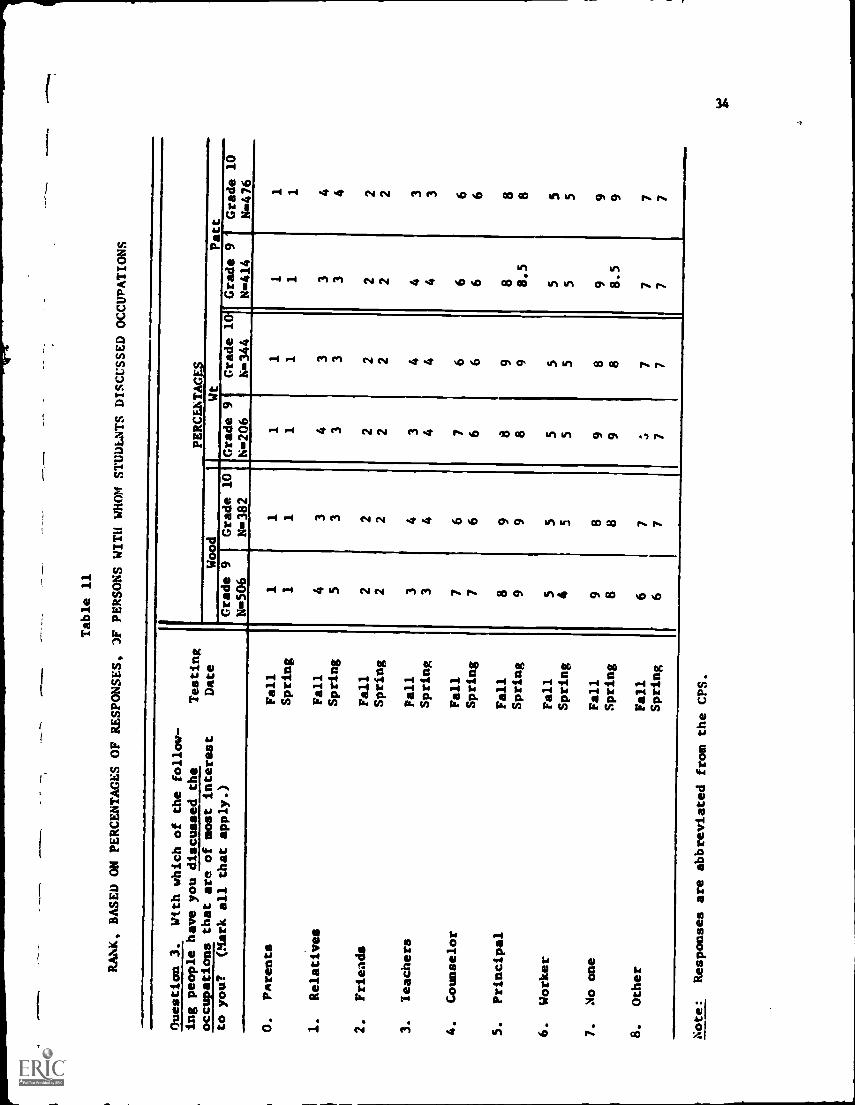
Table 11
RAM(, BASED ON PERCENTAGES OF RESPONSES, 3F PERSONS WITH
WHOM STUDENTS DISCUSSED OCCUPATIONS
Ouestion 3.
With which of the follow-
PERCENTAGES
ing people have you discussed the
Testing
occupations that are of most interest
Date
Wood
Wt
Pa tt
to you?
(."lark all that apply.)
4..Non506
Grade 9
Grade 10
N -382
382
Grade 9
N -206
Grade 10
N- 344
Grade 9'
N -414
Grade 10
N01476
O.
Parents
Fall
11
11
1Spring
11
11
11
1.
Relatives
Fall
43
43
34
Spring
53
33
34
2.
Friends
Fall
22
22
22
Spring
22
22
22
3.
leachers
Fall
34
34
43
Spring
34
44
43
4.
Counselor
Fall
76
76
66
Spring
76
66
66
5.
Principal
Fall
89
89
88
Spring
99
89
8.5
8
6.
Worker
Fall
55
55
55
Spring
45
55
55
7.
No one
Fall
98
98
99
Spring
88
98
8.5
9
8.
Other
Fall
67
77
7Spring
67
77
77
Note:
Responses are abbreviated from the CPS.
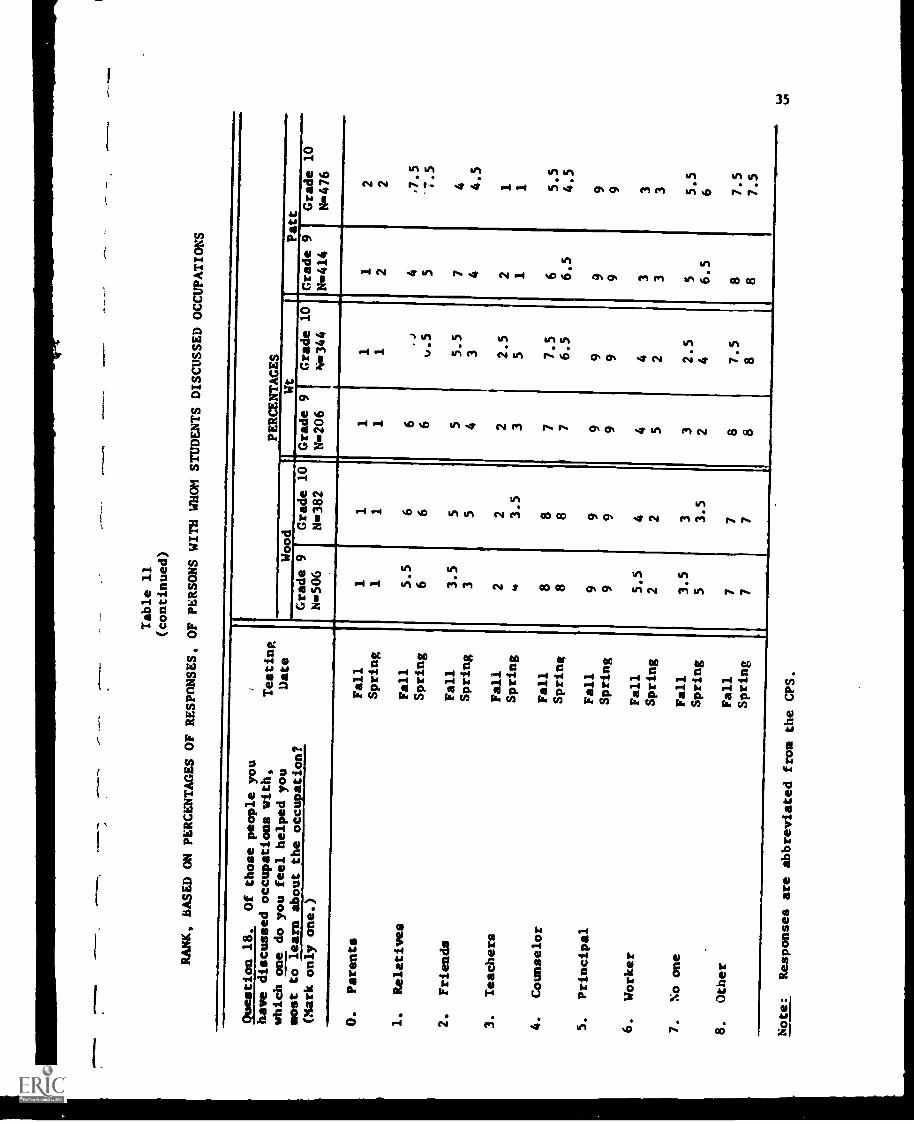
Table 11
(continued)
RANK, BASED ON PERCENTAGES OF
RESPONSES, OF PERSONS WITH WHOM
STUDENTS DISCUSSED OCCUPATIONS
Question 18.
Of those people you
PERCENTAGES
have discussed occupations with,
Testing
which one do you feel helpedyou
Date
Wood
Wt
Pa tt
most to learn about the occupation?
Grade 9
N -506
Grade 10
N382
'Grade 9
N206
Grade 10
N01344
Grade 9
Grade 10
N476
(Mark only one.)
0.
Parents
Fall
11
11
12
Spring
11
11
22
1.
Relatives
Fall
5.5
66
J4
7.5
Spring
66
6u.5
S7.5
2.
Friends
Fall
3.5
55
5.5
74
Spring
35
43
44.5
3.
Teachers
Fall
22
22.5
21
Spring
3.5
35
11
4.
Counselor
Fall
88
77.
56
5.5
Spring
88
76.5
6.5
4.5
5.
Principal
Fall
99
99
99
Spring
99
99
99
6.
Worker
Fall
5.5
44
43
3Spring
22
52
33
7.
No one
Fall
3.5
33
2.5
55.5
Spring
53.5
24
6.5
68.
Other
Fall
77
67.5
87.5
Spring
77
88
87.5
Note:
Responses are abbreviated from
the CPS.

Table 12
COMPARISON OF THE PEOPLE WHO WEREMOST HELPFUL TO THE STUDENT IN
LEARNING ABOUT OCCUPATIONS
Ouestion 18.,
Of those people you
have discussed occupations with,
which one do you feel helped
you
most to learn about the occupation?
0.
Your parents.
1.
Your relatives.
2.
Your friends.
3.
Your teachers.
4.
Your guidance counselor.
5.
Your principal.
6.
Someone other than the above who
works at the occupation.
7.
No one.
8.
Other.
aDifference
b =
c =
d = Difference
level.
.r61f11:2!!
Difference
.01 level.
between fall
in change of
in change of
in change of
Testing
Date
PERCENTAGES
Wood
Wt
Patt
Grade
9N506a
Grade 10
N.383ac
Grade 9
N=206d
Grade 10
N=344
Grade 2,
N=414a''
Grade 10
N=476ac
Fall
39
36
39
37
28'
21
Spring
32
23
38
34
22
15
Fall
10
07
07
10
09
05
Spring
07
07
07
06
06
04
Fall
11
08
09
10
06
07
Spring
12
12
11
13
08
08
Fall
14
17
14
12
22
36
Spring
11
15
12
10
38
46
Fall
01
02
04
04
07
06
Spring
05
03
06
06
05
08
Fall
00
00
01
01
00
00
Spring
01
01
00
01
00
00
Fall
10
12
10
11
14
13
Spring
18
18
08
14
13
09
Fall
11
13
13
12
08
06
Spring
09
15
15
12
05
05
Fall
05
04
03
04
05
05
Spring
06
05
03
04
03
04
and spring responses for
this
responses from fall to spring
responses from fall to snring
responses from fall to spring
group significant at .01 level.
between Woodward and Patterson
9th grade significant
at
between Woodward and Patterson
10th grade significant at
between Waite and Patterson9th grade significant
at .05
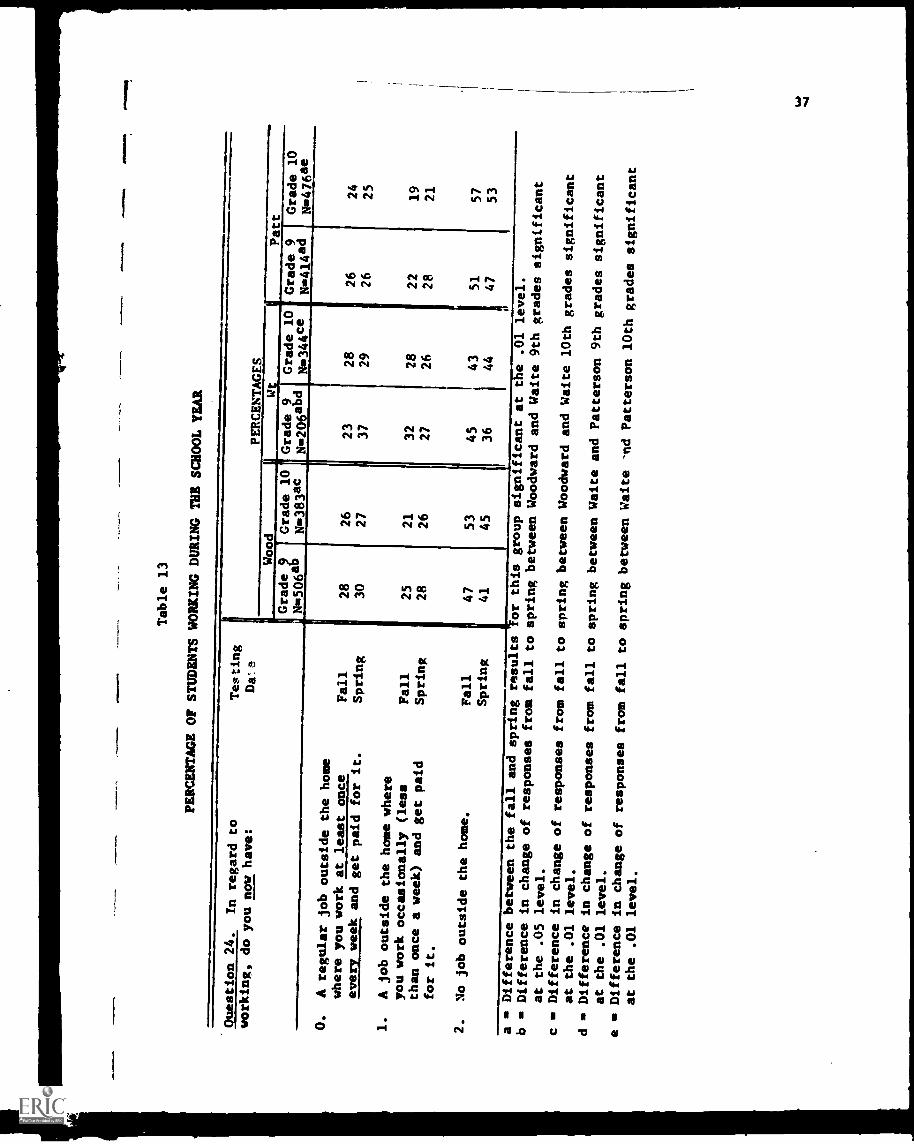
Table 13
PERCENTAGE OF STUDENTS WORKINGDURING THE SCHOOL YEAR
Question 24.
In regard to
working, do younow have:
Testing
Dce
PERCENTAGES
Wood
Grade p
N=506"
Grade 10
Namac
O.
A regular job outside the
home
where you work at least
once
Fall
every week and get paid for it.
Spring
1.
A job outside the home where
you work occasionally (less
Fall
than once a week) andget paid
Spring
for it.
2.
No job outside the home.
Fall
Spring
28
30
2528
47
41
26
27
21
26
53
45
Wt
Patt
Grade 9
Grade 10
Grade 9
Grade 10
N=206abd
N=344"
N=414ad
N=476aa
23
28
26
24
37
29
26
25
32
28
22
19
27
26
28
21
45
43
51
57
36
44
47
53
a = Difference
b = Difference
at the .05
c = Difference
at the .01
d = Difference
at the .01
e = Difference
at the .01
between the fall and spring results
or this group significant at the .01
level.
in change of responses from
fall to spring between
Woodward and Waite 9th grades
significant
level.
in change of responses from
fall to spring between Woodward
and Waite 10th grades
significant
level.
in change of responses from
fall to spring between Waite
and Patterson 9th grades
significant
level.
in change of responses from
fall to spring between Waite
'nd Patterson 10th grades
significant
level.

1
1i
38
57 percent for the Patterson tenth grade students. When comparine; changesfall to spring within each of the six groups, all the groups with theexception of Waite tenth grade students renorted increased job activityoutside the home in the spring. The differences between the fall andspring resnonses within groups were significant at the .01 level for theWoodward ninth and tenth grades, the Waite ninth grade, and the Pattersonninth and tenth grades. The differences in the change of responses fromfall to spring were significant between Woodward and Waite ninth grades(.05); between Woodward and Waite tenth grades (.01); between Waite andPatterson ninth grades (.01): and between Waite and Patterson tenth grades(.01).
The process of decision making presupposes that the decision makerhas available to him sufficient information concerning the subject to act.In order for one to make an occupational choice, he must nerceive that hehas enough information about the jobs that interest him to make a decision.Ouestion 17, which asked "In regard to your choice of an occupation, do Youfeel: "focused directly on the adequacy of the career information availableto the students in the threm schools." Table 14 presents the results ofOusation 17 for all six groups for the fall and spring testing. As onecan see from the data nresented, fewer than 40 percent of the Woodward orWaite students replied in the fall and spring that they had "...enoughinformation about the jobs that interest you to choose the occupation youwould like to enter." The only group in which a majority of the studentsstated both in the fall and spring that they felt that they had enough infor-mation about jobs that interest them to choose an occupation was the tenthgrade group from Patterson. The only change of more than a few percentagepoints within any group between the fall and spring results occurred for thePatterson ninth grade group. The percentage of Patterson ninth grade studentsagreeing that they had "...enough information about the jobs that interestyou to choose the occupation you would like to enter" increased from 31percent in the fall to 58 percent in the spring. The percentage of studentsfrom the same group stating that they had "...some information about thejobs that interest you, but not enough, for you to make up your mind" decreasedfrom 65 percent in the fall to 39 percent in the spring.
The F ratios and the pretest, Posttest, and adjusted means for all grounson fluestion 17 are presented in Table 14A. The F ratios indicate that therewere significant differences (.01 level) among the responses of both the ninthand tenth grade groups. Further analysis of the adjusted means of the responsesfor each group show that the Patterson groups were significantly higher(toward having enough information about johs to choose one) than the Wood-ward or Waite groups. The adjusted mean for the Woodward tenth grade groupwas significantly higher (toward having enough information about jobs to chooseone) than the Waite tenth grade group.
Discussion
The process of how an individual has learned about occupations duringhis school experience is important in assessing the value of career educationprograms. The findings reported in the previous section suggest that priorto the 1970-71 schoolyear, students in the experimental and control schoolswere exposed to occupational
information in a variety of ways. The ways mostoften recalled by all groups were field trios and talks at school by neople
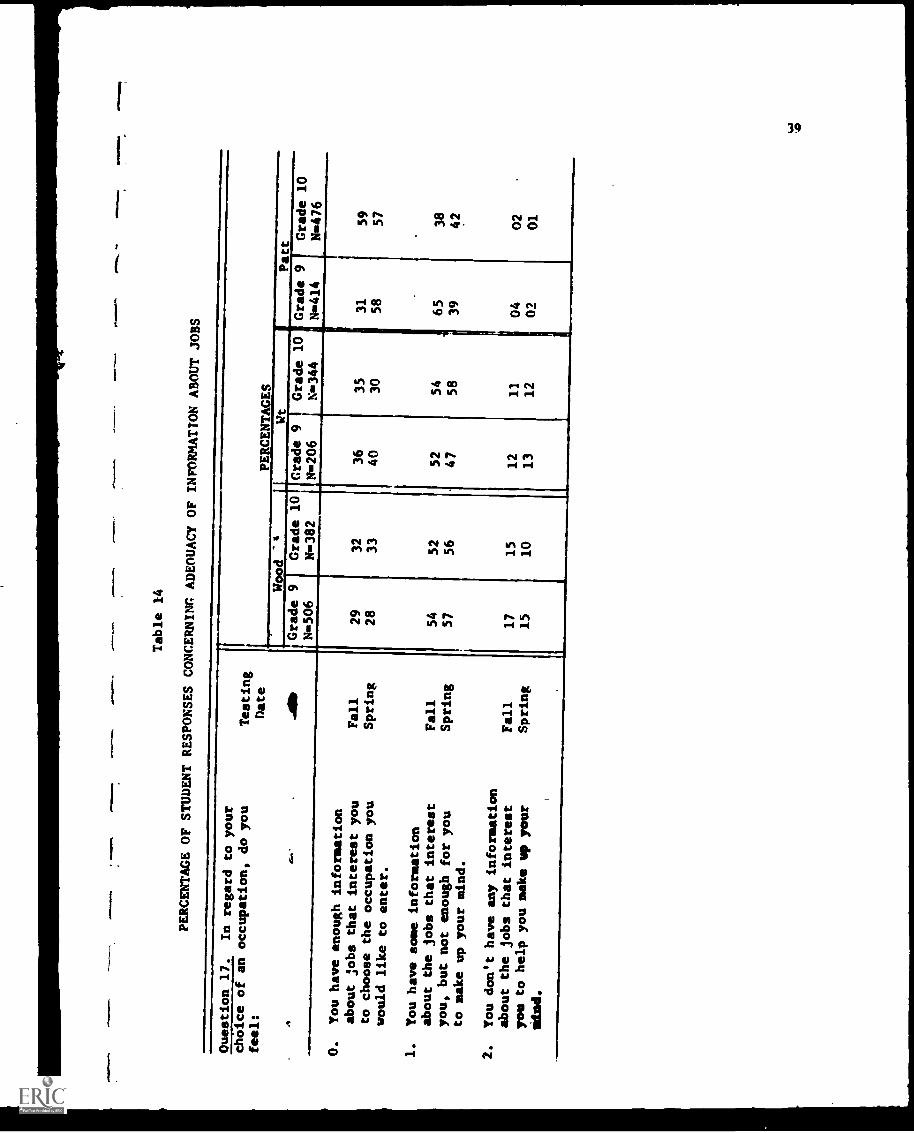
.1Table 14
PERCENTAGE OF STUDENT RESPONSES
CONCERN/Nn ADEOUACY OF INFORMATION
ABOUT JOBS
Ouestion 17.
In regard to
your
choice of an
occupation, do you
feel:
O.
You have enough information
about sobs that interest
you
to choose the occupation
you
would like to enter.
1.
You have some information
about the jobs that interest
you, but not enough for you
to make up your mind.
2.
You don't haveany information
about the jobs that interest
you to help you make upyour
laud.
Testing
Date
PERCENTAGES
Alb
Wood
-4Wt
Patt
Grade 9
N -506
Grade 10
W382
Grade 9
N206
Grade 10
N-344
Grade 9
N-414
Grade 10
N476
Fall
29
32
36
35
31
59
Spring
28
33
40
30
58
57
Fall
54
52
52
54
65
38
Spring
57
56
47
58
39
42
Fall
17
15
12
11
04
02
Spring
15
10
13
12
02
01
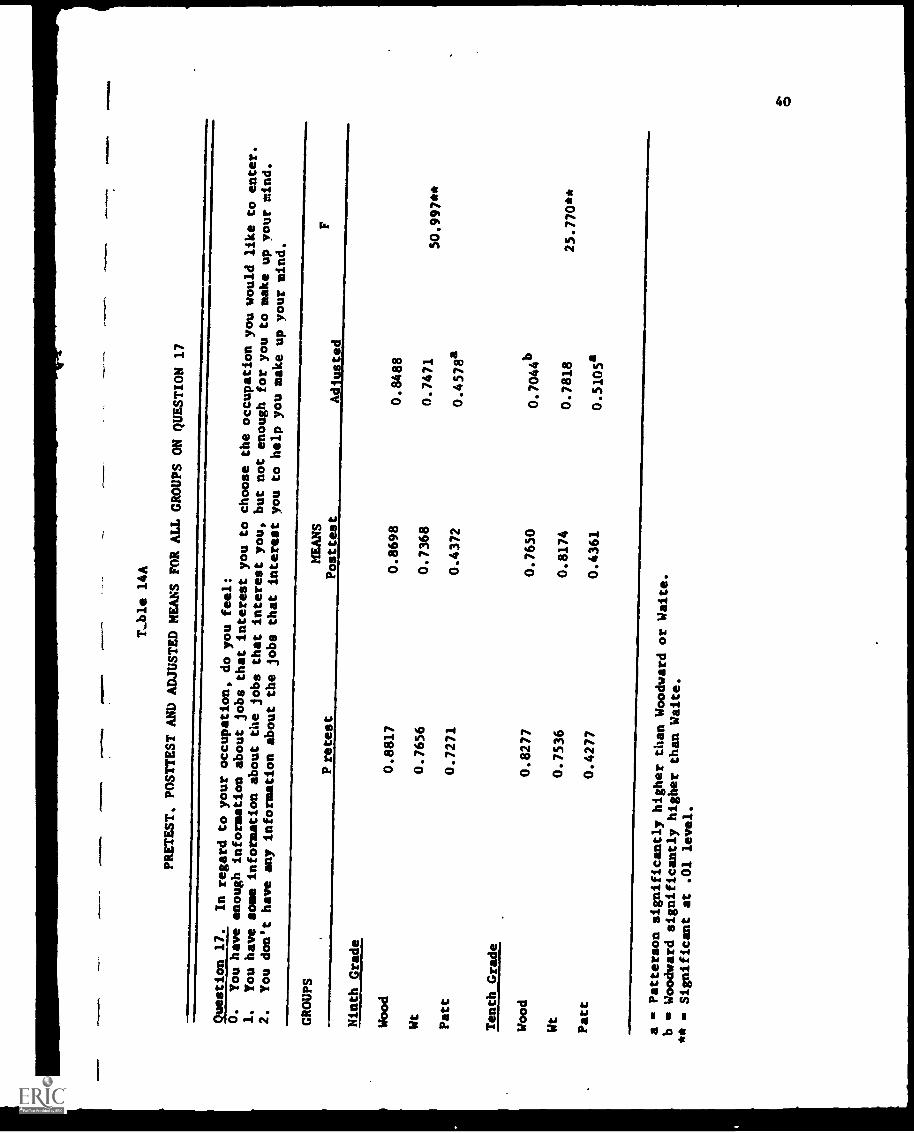
T..ble 14A
PRETEST. POSTTEST AND ADJUSTEDMEANS FOR ALL GROUPS ONQUESTION 17
Question 17.
In regard to your occupation,
do you feel:
O.
You have enough information
about jobs that interest
you to choose the occupation
you would like to enter.
1.
You have some information
about the jobs that interest
you, but not enough for
you to make up your mind.
2.
You don't have any information
about the jobs that
interest you to help
you make up your mind.
GROUPS
P retest
MEANS
Posttest
Adiusted
F
Ninth Grade
Wood
0.8817
0.8698
0.8488
Wt
0.7656
0.7368
0.7471
50.997**
Patt
0.7271
0.4372
0.4578a
Tenth Grade
Wood
0.8277
0.7650
0.7044b
Wt
0.7536
0.8174
0.7818
25.770**
Patt
0.4277
0.4361
0.5105a
aPatterson significantly higher
than Woodward or Waite.
bWoodward significantly higher
than Waite.
**
Significant at .01 level.
1111
0
41
familiar with the occupation. The high percentage of Patterson tenth gradestudents reporting truing some of the training required in the occupationand taking special courses dealing with occupations may he explained by thefact that these vocational school students had participated in a 'CareerFxnloration Program" as ninth graders even though the program did not carrya formal title.
The experiences provided for students in the exnerimental CareerFxploration Programs become evident when one compares the fall and shrineresponses of the experimental and control students. Field trins. talksat school by people familiar with the occupation, and to some extent,anecial classes on careers were cited as helpful by students of bothexnerimental schools to a greater degree in the spring than in the fall.In addition, a high percentage of Patterson students reeorted trying some ofthe training required by the occupation, getting information from regularacademic classes, reading about the occupation, and taking special coursesdealing with occupations. In general, it apnears that the Pattersonstudents were exposed to a greater variety of experiences designed tohelp them explore career opportunities than were the students from Wood-ward and Waite.
It is interesting to note the value that the students from the exneri-mental schools Placed upon the experiences provided in terms of heine helpfulin learning about occupations. The most popular choice of Woodward studentswas the field trip to observe people at work. Although resnonses by Pattersonstudents to Ouestion 2 indicated a variety of experiences had been nrovided,field trips were selected by the highest nercentaee of ninth erade studentsand by the second highest nercenteme of tenth grade students. The selectionof the most helpful means of learning about occupations suggest thet thestudents are interested in observing someone working at the occunation andtalking with him concerning the occupation. The importance of actuallytrvine some of the training renuired by the occunation is difficult toassess for any of the students other than those in the vocational schoolsetting. This may he due to the design of the Woodward CFP which did notpL'vide for "hands-on' experiences as a means of stimulating career education.
Emphasis of Patterson students on teachers as being most helpful inlearning about occupations may he the result of the teacher's vocationalorientation. Since the vocational education teacher's interest and skillsare so closely related to the occupational reauirements for which he istraining his students, he is more likely than a teacher in a general nroprapto relate the subject matter to snecific joh settings. A vocational studentwho has already made a commitment to occupational trainin0, would likelyperceive the vocational teacher AR ',eine most helpful in learning aboutthe occupation of his choice. In any cane, one cannot negate the imnortanceof significant others in the decision-making process when it comes to astudent choosing a career.
Vocational education students are often thought of as working part-timewhile attending school. Findings from Ouestion 24 indicate, however, thata higher percentage of Woodward and Waite than Patterson students workedoutside the home. It is also interesting to note that all three schoolsa greater percentage of ninth than tenth graders reported outside lobs.
Finally, the findings about the adequacy of the information aboutjobs of interest to the students indicate that more Patterson than Wood-ward or Waite students believed that they had sufficient information tomake a decision. These findings may have resulted from the vocationaleducation student's commitment to a training program in prenaration fora more or less specific occupation. Such a decision would have necessi-tated the narrowing of his focus to a selected number of jobs. A studentin a general high school, on the other hand, has not had to be as specificin selecting his course of study. Therefore, he may believe that he hasa larger field from which to select an occupation. If this hypothesis istrue, then the scope of a CEP for a general high school would have to bemore comprehensive than a similar program for a vocational school.
Hypothesis 2A:. That students' educational and vocationalplans and goals will change significantlyas a result of the Career ExplorationProgram.,
42
By testing Hypothesis 2A it was hoped to determine whether or not agreater percentage of students in the six groups had changed their educa-tional and vocational plans as a result of the Career Exploration Program.The items on the Career Plans Survey utilized to test this hypothesisconsisted of two parallel series of 4 questions each. One series,Questions 11, 19, 21, and 23, dealt with the student's educational plansfor grades 11 and 12. The second series, Ouestiona 12, 16, 20, and 22,concerned the student's plans for himself after leaving high school.Both series of questions sought the student's responses in terms of hisability, his parent's wishes, his own desires, and his actual plans.By examining these four factors, it was believed that one could cometo a better understanding of not only what influenced the student'sdecision (ability, parents, self), but also what his actual choice wasat the time of testing. By giving special attention to the "undecided"choice for each question, the investigators were able to determine whetheror not a greater percentage of students had definite education and vocationalplans and goals as a result of the Career Exploration Program.
By analyzing the results from fall and spring on these two series ofitems for each group, the investigators were able to determine if thegroups had changed significantly in their educational and vocational plansduring the time of the Career Exploration Program. By comparing the changein the results from fall to spring among groups, it was possible to determinewhether there was a significant change in resnonses between an exoerimentaland a control group, or between two experimental groups.
Findings
One factor which affects the decision-making process of an individualis his perception of his own interests and abilities. The purpose of (location23 was to have the student consider his selection of a course of study forgrades 11 and 12 in relation to his perceived interests and abilities.Question 23 asked, "Considering your interests and abilities, which highschool course of study do you think vou should take?" Table 15 presentsthe percentage of responses on this question for the six longitudinal groups
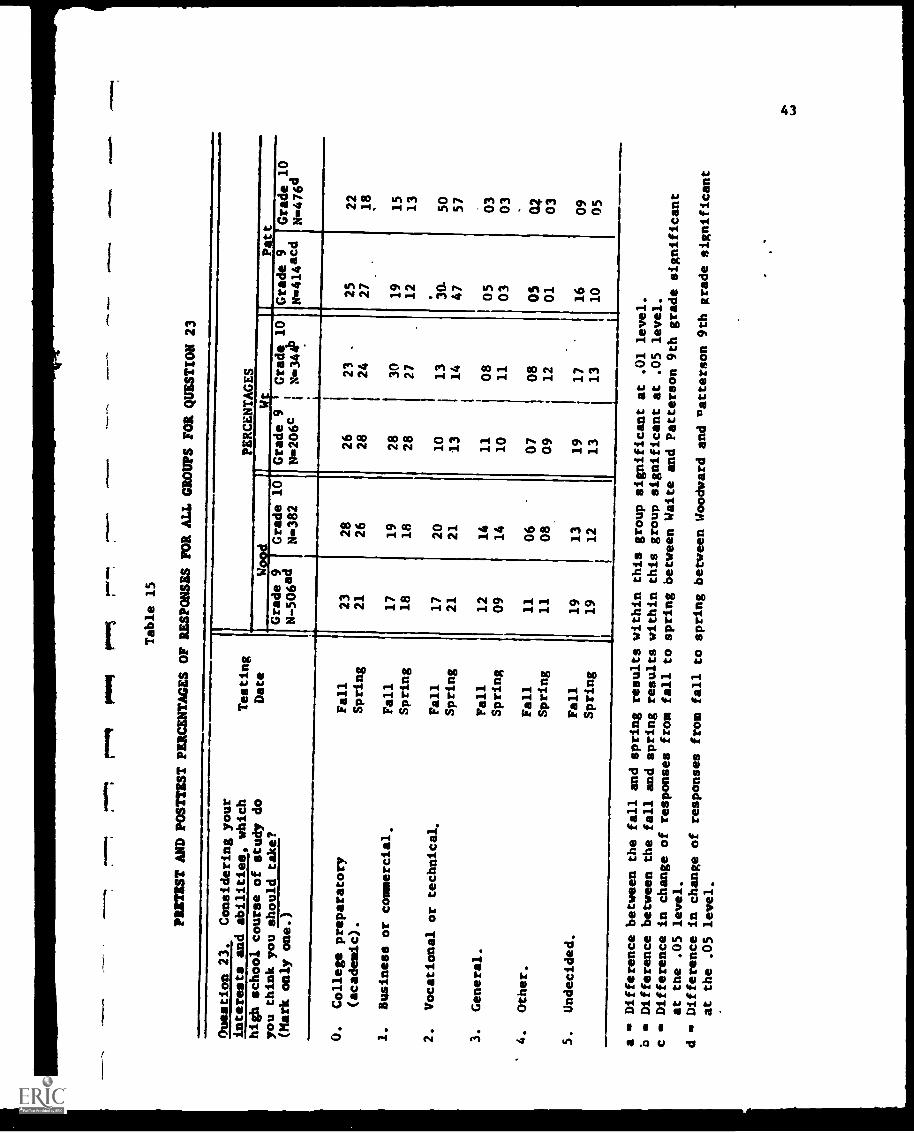
AM
*M
alI.
Pmml
Table 15
PRETEST AND POSTTEST PERCENTAGESOF RESPONSES FOR ALL GROUPSFOR QUESTION 23
roye
alw
o...e
.11
.10,
0*.
Ouestion 23.
Considering your
interests and abilities, which
high school course of study do
you think you should take?
(Mark only one.)
Testing
Date
Wo d
Grade 9
Grade 10
N-506ad
N=382
PERCENTAGES
Wt
Grade 9
1Grade 10
N=206c
iN=3441)
Patt
O.
College preparatory
(academic).
Fall
Spring
1.
Business or commercial,
Fall
Spring
2.
Vocational or technical.
Fall
Spring
3.
General.
Fall
Spring
4.
Other.
Fall
Spring
5.
Undecided.
Fall
Spring
23
28
21
26
17
19
18
18
17
20
21
21
12
14
09
14
11
11
06
08
19
13
19
12
26
23
.
28
24
28
I30
28
27
10
13
13
14
11
08
10
11
07
08
09
12
19
17
13
13
Grade 9
N.414acd
Grade 10
N=476d
25
22
27
18
19
15
12
13
30-
50
47
57
05
03
03
03
05
aZ01
03
16
09
10
05
a = Difference
b es Difference
c = Difference
at the .05
d = Difference
at the .05
between the fall and spring
results
between the fall and spring
results
in change of responses from fall
to
level.
in change of responses from
fall to
level.
within this group significant
at .01 level.
within this group significant
at .05 level.
spring between Waite and Patterson9th grade significant
spring between Woodward andpatterson 9th grade significant

44
for the fall and spring testing. Examination of the data presented inTable 15 shows that the Patterson tenth grade students had the highestpercentage of response for any one choice on Question 23 for the falltesting. "Vocational or technical" was the course of study chosen by50 percent of the Patterson tenth grade students, while 30 percent ofthe Patterson ninth grade students made the same selection. Otherselections of the six groups were fairly evenly distributed over thesix choices provided; with the greater emphasis in the area of "collegepreparatory". Three of the six groups changed significantly (.01 level)from fall to spring in their responses to Question 23. The most apparentchange for all three, Woodward ninth grade and Patterson ninth and tenthgrades, was in the direction of a greater percentage of students selectinga "Vocational or technical" course of study. There was also a significantdifference (.05 level) between the fall and spring responses of the Waitetenth grade students. The change for this group, however, seemed to berandomly distributed among several of the choices. The difference in thechange of responses from fall to spring were found to be significant atthe .05 level between Woodward and Patterson ninth grade students, andbetween Waite and Patterson ninth grade students. The differences inthe change of responses from fall to spring among the tenth grades fromthe three schools were not significant.
A second factor which may affect the decision-making process of anindividual is what he thinks his parents want him to do. Question 21 wasdesigned to determine what course of study the student thought his parentswanted him to pursue in grades 11 and 12. Question 21 asked, "Whichcourse of study would yourparents like for you to take in grades 11 and12?" Table 16 presents the percentage of responses on this question forthe six longitudinal groups for the fall and spring testing. The highestpercentage of students selecting a given choice in the fall was the 38percent of the Patterson tenth grade students who said that their parentswould like them to take a "Vocational or technical" course of study ingrades 11 and 12. The percentage of students selecting "College preparatory"as representing their parents' wishes ranged from 23 percent of the Wood-ward ninth grade students to 31 percent of the Woodward tenth grade stu-dents. "Business or commercial" and "Undecided" were other choicesreceiving approximately 20 percent or more of the responses for mostgroups. The responses of the four experimental groups Changed significantlyfrom fall to spring. Changes in the responses of Woodward ninth andtenth grade students were significant at the .05 level, while differencesin the responses of the Patterson rinth and tenth grade students weresignificant at the .01 level. The changes between the fall and springresponses of the Woodward groups tended to be fairly evenly distributedamong the six possible choices. A higher percentage of Patterson students,approximately 10 percent more in ninth and tenth grade, stated in thespring that their parents would like them to take a "Vocational or technical"course of study in grades 11 and 12. A number of the differences in thechange of responses from fall to spring between groups were found to besignificant. The difference in change of responses from fall to springbetween Waite ninth grade students and Patterson ninth grade studentswas significant at the .01 level. The differences in the change ofresponses from fall to spring between Waite and Patterson tenth gradestudents, Woodward and Patterson tenth grade students, and Pattersonninth and tenth grade students were significant at the .05 level.

,Table 16
PRETEST AND POSTTEST PERCENTAGES OF RESPONSES FORALL GROUPS FOR QUESTION 21
,011
40.0
,
Question 21.
Which course of
PERCENTAGES
study would your parents like
Testing
for you to take in grades 11
Date
and 12? (Mark only one.)
Wood
Wt
Patt
Grade 9
N506bf
Grade 10
N.382bef
Grade 9
N=204F
Grade 10
N=344d
Grade 9
N=414acg
Grade 10
N.475adeg
O.
College preparatory
Fdll
23
31
26
27
30
28
(academic.)
Snring
24
25
27
24
30
22
1.
Business or commercial.
Fall
18
19
24
26
17
12
Spring
17
18
27
25
09
14
2.
Vocational or technical.
Fall
15
16
08
14
27
38
Spring
19
18
09
14
39
49
3.
General.
Fall
08
10
09
06
01
03
Spring
08
09
07
10
01
03
4.
Other.
Fall
08
04
05
06
06
01
Spring
10
07
08
07
03
02
5.
Undecided.
Fall
27
20
27
20
20
18
Spring
23
21
22
20
17
11
a = Difference
b = Difference
cDifference
at the .01
d = Difference
at the .05
eDifference
at the .05
f = Difference
at the .05
g = Difference
at the .05
between the fall and spring
between the fall and
spring
in change of responses from
level.
in change of responses
from
level.
in change of
responses from
level.
in change of
responses from
level.
in change of responses
from
level.
results within this
group significant at .01 level.
results within this
group significant at .05 level.
fall to spring betweenWaite and Patterson 9th
grade significant
fall to spring betweenWaite and Patterson 10th
grade significant
fall to spring between
Woodward and Patterson 10th
grade significant
fall to spring between
Woodward 9th and 10th grade
significant
fall to spring between
Patterson 9th and 10thgrade significant
a.

The third question of the series was an attempt to determine whichcourse of study an individual would take in grades 11 and 12 if he couldtake any that he wanted. Question 11 asked "If you could take any courseof study you wanted in grades 11 and 12, which would you take?" Theresponses for the six longitudinal groups for the fall and spring testingcan be seen in Table 17. Once again, the highest percentage of responsefor any group on the fall testing was the 46 percent of the Pattersontenth grade students selecting a "Vocational or technical" course ofstudy. Popular choices for most of the groups on the fall testing were"College preparatory", "Business or commercial". "Vocational or technical",and "Undecided". Changes from fall to spring for Woodward ninth and tenthgrade students and Patterson ninth and tenth grade students were significantat the .01 level. The change in responses from fall to spring for Waitetenth grade students was significant at the .05 level. The changes inresponses for the Woodward students and the Waite tenth grade studentstended to be random in nature. The most apparent change in the responsesof the Patterson students was the increase from fall to spring of from30 percent to 44 percent of the ninth grade students and from 46 percentto 57 percent of the tenth grade students selecting a "Vocational ortechnical" course of study Significant differences (.05 level) werefound in the difference in he change of responses from fall to springbetween Waite and Pattersot ninth grade students and between the Waiteand Patterson tenth grade groups. The differences in the change ofresponses from fall to spring between Woodward and Patterson tenth gradegroups and between Woodward ninth and tenth grade groups were significantat the .01 level.
Question 19, the final one of the series, asked "Which course of studydo you plan to take in grades 11 and 12?" It was assumed by the investi-gators that the student's answer to this question would reflect his decisionbased not only on the influence considered in questions 11, 21, and 23,but also the other influences of which the student may or may not be aware.The responses for the six longitudinal groups for the fall and spring testingare presented in Table 18. As in the previous three questions, the highestpercentage of students selecting any one choice in the fall were the 52percent of the Patterson tenth grade students choosing "Vocational or technical"as the course of study they planned to take in erades 11 and 12. The same
.choice was made by 31 percent of the Patterson ninth grade students.Changes in responses within groups from fall to spring were significantat the .01 level for Woodward ninth and tenth grade students, Waite tenthgrade students, and Patterson ninth and tenth grade students. Two changesbetween the fall and spring responses within groups were apparent. One ofthese changes was the increase in the percentage of Patterson studentsselecting "Vocational or technical" as the course of study they plannedto take in grades 11 and 12. The second apparent change was the decreaseof 4 percent or more of the students from each group who stated that theywere "Undecided" about what they planned to take in grades 11 and 12. Thedifferences in the change of responses from fall to spring were significantat the .01 level between waite and Patterson ninth grades, Woodward andPatterson ninth grades, and Woodward and Patterson tenth grades. Thedifferences in the change of responses from fall to spring were significantat the .05 level betWeen Waite and Patterson tenth grades. and betweenWoodward ninth and tenth grades.

Table 17
PRETEST AND POSTTEST PERCENTAGES OFRESPONSES FOR ALL GROUPS FORQUESTION 11
Question 11.
If you could take any
PERCENTAGES
course of study you wanted in grades
Testing
11 and 12, which would you take?
Date
(Mark only one.)
Wood
Wt
Patt
Grade 2
N506e'
Grade
N382 e
Grade 9
N206c
Grade
0N344b
Grade 9
N414ac
Gradeal0
N476 e
O.
College preparatory
Fall
22
25
27
22
28
22
(academic.)
Spring
22
27
30
22
27
19
1.
Business or commercial.
Fall
17
18
23
30
18
15
Spring
18
17
26
26
13
13
2.
Vocational or technical.
Fall
16
25
11
15
30
46
Spring
24
22
16
15
44
57
3.
General.
Fall
1009
09
07
02
03
Spring
1111
06
12
0102
4.
Other.
Fall
13
1108
09
05
03
Spring
1110
07
09
03
03
5.
Undecided.
Fall
21
1122
17
17
11Spring
16
12
16
15
1105
aDifference between the fall and spring
results within this group significant
at .01 level.
bDifference between the fall and spring
results within this group significant
at .05 level.
cDifference in change of responses from fallto spring between Waite and Patterson 9th
grade significant
at .05 level.
dDifference in change of responses from fall
to spring between Waite and Patterson 10th grade
significant
at .05 level.
eDifference in change of responses from fall
to spring between Woodward and Patterson 10th
grade significant
at .01 level.
fDifference in change of responses from
fall to spring between Woodward 9th and
10th grade significant
at .01 level.
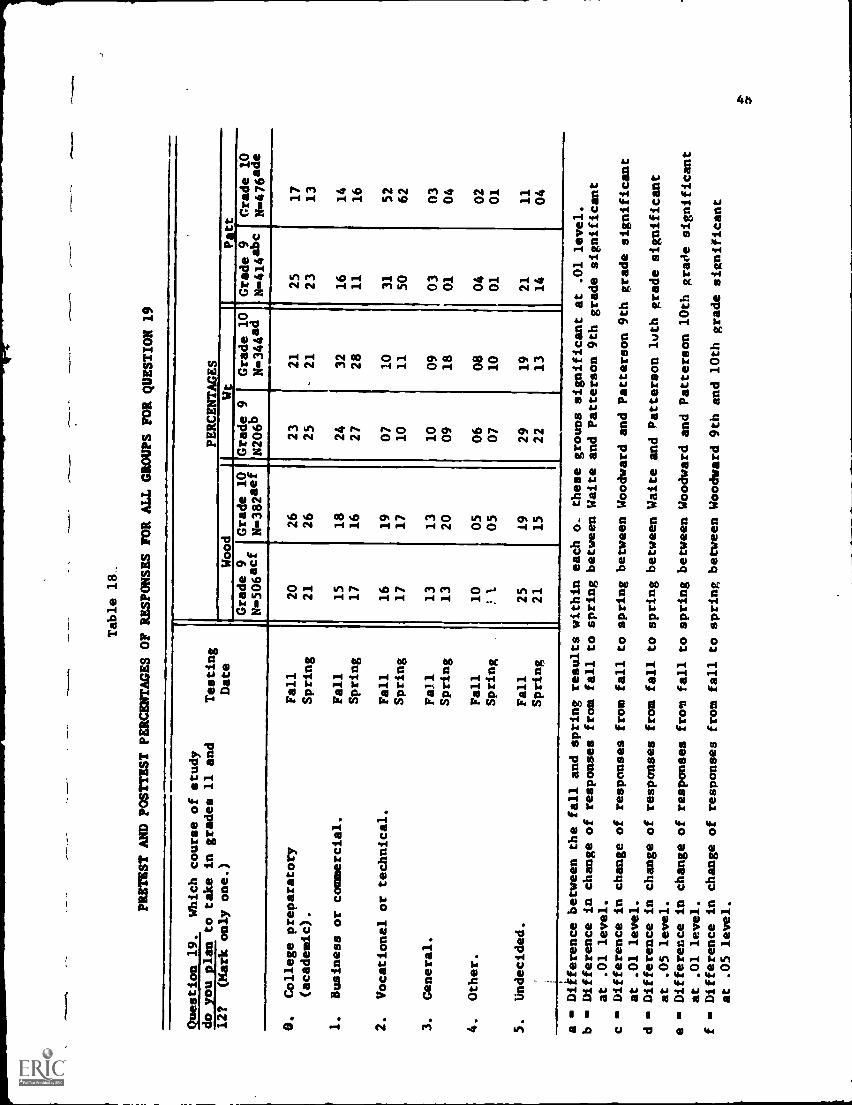
Table 18..
PRETEST AND POSTTEST PERCENTAGES OF RESPONSES FOR ALL GROUPS FORQUESTION 19
Question 19.
Which course of study
PERCENTAGES
do you plan to take in grades 11 and
Testing
12?
(Mark only one.)
Date
Wood
Wt
Patt
Grade 9
N506acf
Grade 10
N382aef
Grade 9
N206b
Grade 10
N_344ad
Grade 9
N414abc
Grade 10
N.476ade
0.
College preparatory
Fall
20
26
23
21
25
17
(academic).
Spring
21
26
25
-21
23
13
1.
Business or commercial.
Fall
15
18
24
32
16
14
Spring
17
16
27
28
11
16
2.
Vocational or technical.
Fall
16
19
07
10
31
52
Spring
17
17
10
11
50
62
3.
General.
Fa)1
13
13
10
09
03
03
Spring
13
20
09
18
01
04
4.
Other.
Fall
10
05
06
08
04
02
Spring
1.
05
07
10
01
01
5.
Undecided.
Fall
25
19
29
19
21
11
Spring
21
15
22
13
14
04
a mm Difference between the fall and spring
b . Difference in change of responses from
at .01 level.
cDifference in change of responses from
at .01 level.
d . Difference in change of responses from
at .05 level.
e u, Difference in change of responses from
at .01 level.
f - Difference in change of responses from
at .05 level.
results within each o- these groups significant at .01 level.
fall to spring between Waite and Patterson 9th grade significant
fall to spring between Woodward and Patterson 9th gradesignificant
fall to spring between Waite and Patterson luth grade significant
fall to spring between Woodward and Patterson 10th grade
significant
fall to spring between Woodward 9th and 10th grade significant
49
The first ttem of the second series of questions utilized to collectdata pertinent to Hypothesis 2A was concerned with the individual's post-high school plans in relation to his perceived interests and abilities.Question 20 asked "Considering your interests and abilities, which of thefollowing do you think you should do after leaving high school?" A,..alysisof the data presented in Table 19 yielded no significant differences inthe change of responses from fall to spring either within groups or betweengroups. Examination of the data for Question 20 did provide some inter-esting trends, With the exception of the spring results for Waite ninthgrade students, 25 percent or more of ell the groups on both the falland spring surveys selected "Go to college or university (4 years)" asbeing what they thought they should do after leaving high school. TheHighest percentage of students from any school selecting this choice inthe spring was the Patterson ninth grade group of whom 39 percent answeredin this manner. No more than 10 percent of the students from any groupin the fall or spring answered "Take a job that requires no additionaltraining". Between 9 percent and 17 percent of the students in the sixgroups stated in the spring that they were "Undecided".
A second factor which affects the student's decision of what he willdo after leaving high school is what his parents want him to do. Question 12,which asked "Which of the following would your parents like for you to doafter leaving high school?" Analysis of the data presented in Table 20yielded no significant differences in the change of responses from fall tospring within groups or between groups. The choices to Question 12 receivingthe highest percentage of responses from all groups were "Go to a collegeor university (4 years)" and "Undecided". Between 5 percent and 21 percentmore students selected "Go to a college or university (4 years)" on Question20. In other words, students tended to perceive their parents as wantingthem to go to college.
A third factor that affects the individual's choice of what he does iswhat he, himself, desires. Question 22 was an attempt to determine what thestudent would do after leaving high school provided he could do anything hewished. Question 22 asked "If you could do anything you wanted after leavinghigh school, which of the following would you do?" Analysis of the datapresented in Table 21 provided no significant differences in the change ofresponses from fall to spring within groups or between groups. Once again,as on the previous two Lams, the highest percentage of students within eachof the groups selected "Go to college or university (4 years)" in response tothe question. Approximately the same number of students as on the previoustwo items stated that they were "Undecided". Other responses were, ingeneral, similar to those for Questions 12 and 20.
The final question in the series was designed to solicit the individual'sactual plans for himself after leaving high school. Question 16 asked "Whichof the following do you actually plan to do after leaving high school?"Analysis of the data presented in Table 22 provided no significant differencesin the change of responses from fall to spring within groups or betweengroups. Once again, the choice receiving the highest percentage of responseswas "Go to a college or university (4 years)". A higher percentage of Patter-son students selected this choice than did students from Woodward and Waite.It is also interesting to note that the percentage of response for thischoice was very similar to the percentage of response for the same choice on

Table 19
PRETEST AND POSTTEST PERCENTAGESOF RESPONSES FOR ALL GROUPS FOR
QUESTION 20
Question 20.
Considering your
interests and abilities, which of
the following doyou think you
should do after leaving high
school?
(Mark only one.)
O.
Go to vocational or technical
school.
1.
Go to business school
(ron-college).
2.
Go to nursing school (college
or non-college).
3.
Go to junior or community
college (2 years).
4.
Go to college or university
(4 years).
5.
Go into military service.
6.
Go Into apprenticeship
or
other on-the-job
training.
7.
Take a job that
requires no
additional training.
8.
Other.
9.
Undecided.
Testing
Date
PERCENTAGES
Wood
Wt
Patt
Grade 9
N -506
Grade 10
N -382
Grade 9
N -206
Grade 10
N -344
Grade 9
N -414
Grade 10
Fall
07
09
03
07
08
12
Spring
09
12
04
07
09
10
Fall
08
11
11
17
08
06
Spring
12
09
13
14
06
05
Fall
OA
06
07
05
07
04
Spring
06
08
09
05
08
03
Fall
05
05
08
06
04
10
Spring
04
05
05
04
09
09
Fall
28
32
35
26
40
36
Spring
25
27
30
25
39
36
Fall
07
07
06
06
04
05
Spring
09
06
07
06
04
05
Fall
06
08
05
04
09
10
Spring
05
08
02
08
09
12
Fall
09
07
06
08
05
06
Spring
06
05
08
10
04
05
Fall
09
06
03
06
03
03
Spring
05
04
05
09
03
04
Fall
14
09
16
15
11
08
Spring
17
15
17
12
09
10
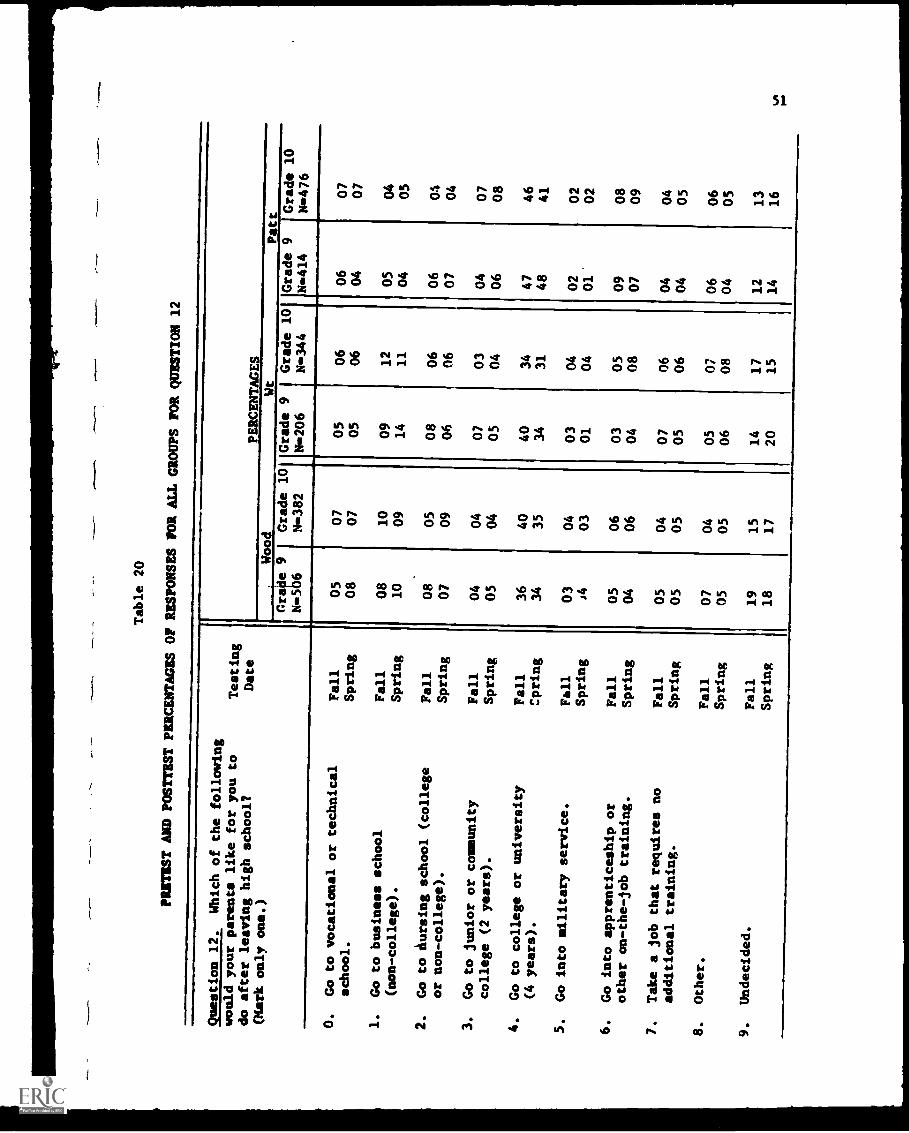
Table 20
PRETEST AND POSTTEST PERCENTAGES
OF RESPONSES FOR ALL GROUPS FORQUESTION 12
Question 12.
Which of the following
PERCENTAGES
would your parents like foryou to
Testing
do after leaving high school?
Date
(Mark only one.)
Wood
Wt
Patt
Gra e 9
N5 6
Grade 10
N -382
Grade 9
N-206
Grade 10
N -344
Grade 9
N414
Grade 10
N-476
O.
Go to vocational or technical
Fall
05
07
05
06
06
07
school.
Spring
08
07
05
06
04
07
1.
Go to business school
Fall
08
10
09
12
05
04
(non-college).
Spring
10
09
14
11
04
05
2.
Go to nursing school (college
Fall
08
05
08
06
06
Oi
or non-college).
Spring
07
09
06
06
07
04
3.
Go to junior or community
Fall
04
04
07
03
04
07
college (2 years).
Spring
05
04
05
04
06
08
4.
Go to college or university
Fall
36
40
40
34
47
46
(4 years).
Cpring
34
35
34
31
48
41
5.
Go into military service.
Fall
03
04
03
04
02
02
Spring
J4
03
01
04
01'
02
6.
Go into apprenticeship
or
Fall
05
06
03
05
09
08
other on-the-job training.
Spring
04
06
04
08
07
09
7.
Take a job that requiresno
Fall
05
04
07
06
04
04
additional training.
Spring
05
05
05
06
04
05
8.
Other.
Fall
07
04
05
07
06
06
Spring
05
05
06
08
04
05
9.
Undecided.
Fall
19
15
14
17
12
13
Spring
18
17
20
15
14
16
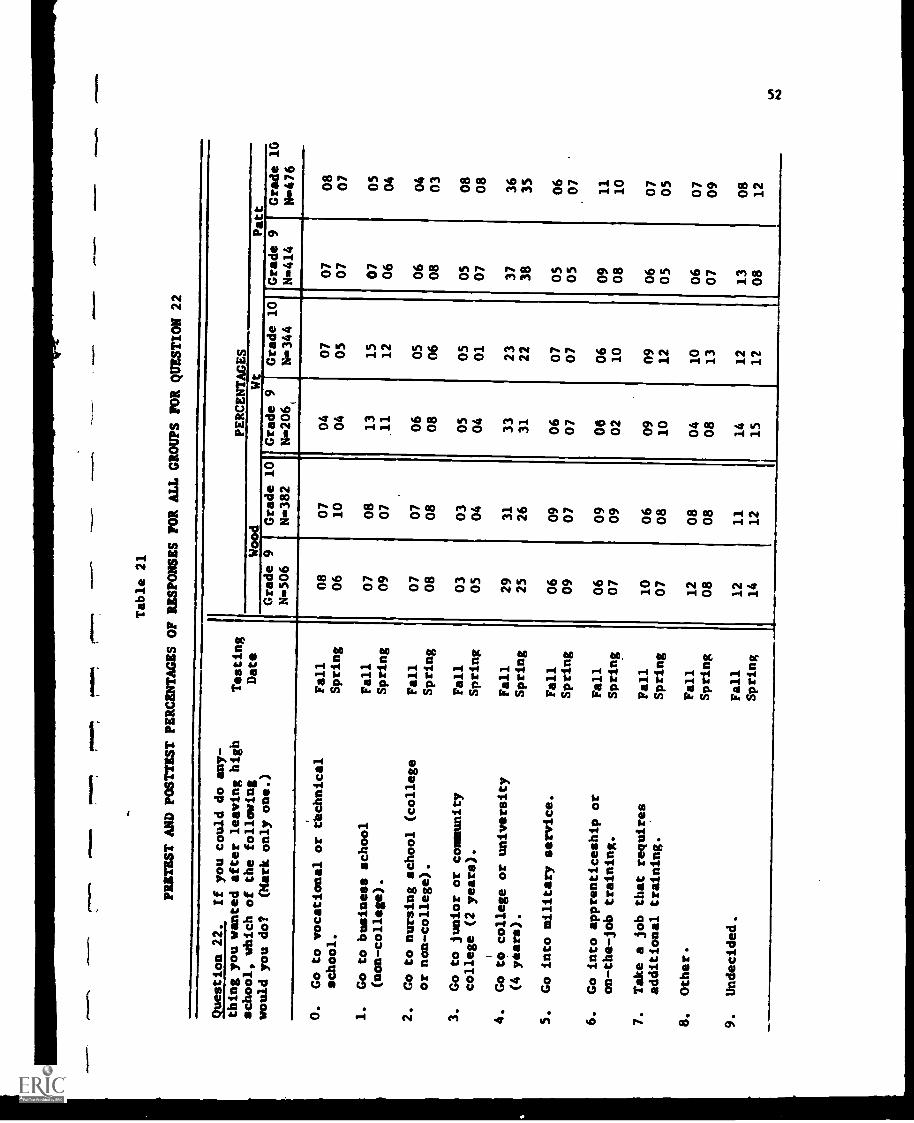
Table 21
PRETEST AND POSTTEST PERCENTAGES OF RESPONSES
FOR ALL GROUPS FOR QUESTION 22
M11
1
Question 22.
If you could do any-
Testing
Date
PERCENTAGES
thing you wanted after leaving high
school, which of the following
would you do?
(Mark only one.)
Wood
Wt
Patt
Grade 9
8506
Grade 10
8+382
Grade 9
8+206(
Grade 10
8+344
Grade 9
8+414
Grade 10
N-476
O.
Go to vocational or technical
Fall
08
07
04
07
07
08
school.
Spring
06
10
04
05
07
07
1.
Go to business school
Fall
07
08
13
15
07
05
(non-college).
Spring
09
07
.11
12
06
04
2.
Go to nursing school (college
Fall
07
07
06
05
06
04
or non-college).
Spring
08
08
08
06
08
03
3.
Go to junior or community
Fall
03
03
05
05
05
08
college (2 years).
Spring
05
04
04
01
07
08
4.
Go tO college or university
Fall
29
31
33
23
37
36
(4 years).
Spring
25
26
31
22
38
35
5.
Go into military service.
Fall
06
09
06
07
05
06
Spring
09
07
07
07
05
07
6.
Go into apprenticeship or
Fall
06
09
06
06
09
11
on-the-job training.
Spring
07
09
02
10
08
10
7.
Take a job that requires
Fall
10
06
09
09
06
07
additional training.
Spring
07
08
10
12
05
05
8.
Other.
Fall
12
08
04
10
06
07
Spring
08
08
08
13
07
09
9.
Undecided,
Fall
12
11
14
12
13
08
Spring
14
12
15
12
08
12
I
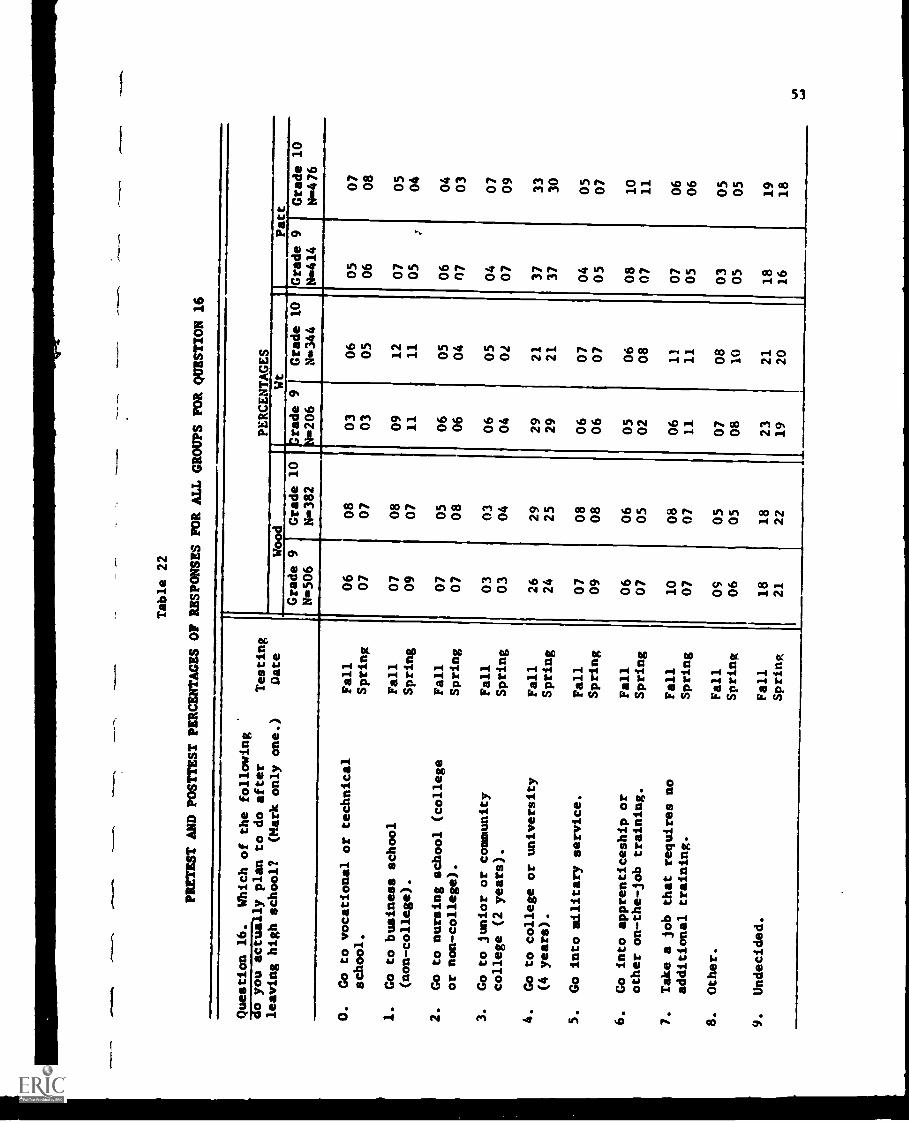
Table 22
PRETEST AND POSTTEST PERCENTAGES OFRESPONSES FOR ALL GROUPS FORQUESTION 16
Question 16.
Which of the following
PERCENTAGES
do you actually plan to do after
Testing
leaving high school?
(Mark only one.)
Date
Wood
Wt
Patt
Grade 9
N -506
Grade 10
N -382
.rade 9
N -206
Grade 10
N -344
Grade 9
N -414
Grade 10
Nms476
O.
Go to vocational or technical
Fall
06
08
03
06
05
07
school.
Spring
07
07
03
05
06
08
1.
Go to business school
Fall
07
08
09
12
07
05
(non-college).
Spring
09
07
11
11
05
04
2.
Go to nursing school (college
Fall
07
05
06
05
06
04
or non-college).
Spring
07
08
06
04
n7
03
3.
Go to junior or community
Fall
03
03
06
05
04
07
college (2 years).
Spring
03
04
04
01
07
09
4.
Go to college or university
Fall
26
29
29
21
37
33
(4 years).
Spring
24
25
29
21
37
30
5.
Go into military service.
Fall
07
08
06
07
04
05
Spring
09
08
06
07
05
07
6.
Go into apprenticeship or
Fall
06
06
05
06
08
10
other on-the-job training.
Spring
07
05
02
08
07
11
7.
Take a job that requires no
Fall
10
08
06
11
07
06
additional training.
Spring
07
07
11
11
05
06
8.
Other.
Fall
09
05
07
08
03
05
Spring
06
05
08
10
05
05
9.
Undecided.
Fall
18
18
23
21
18
19
Spring
21
22
19
20
16
18

54
Question 20 which asked the student to consider his interests and abilitiesin his decision. In addition, there was very little variation in thepercentage of students selecting the choice from fall to spring. The per-centage of students stating at the time of spring testing, that they were"undecided" about what they actually planned to do after leaving highschool ranged from 16 percent for the Patterson ninth grade students to22 percent for the Woodward tenth grade students. In general, the per-centage of students selecting "Undecided" was slightly higher on thisquestion than on the previous three in this series. There was very littlevariation on any of the choices from fall to spring for any of the sixgroups on Question 16.
Discussion
Hypothesis 2A stated, "The students' educational and vocational plansand goals will change significantly as a result of the Career ExplorationProgram". The findings used to test Hypothesis 2A were drawn from twoparallel series of four questions each. The first series, questions 11,19, 21, and 23, pertained to the student's educational plans and goals forgrades 11 and 12. The second series, questions 12, 16, 20, and 22, concernedthe student's plans for himself after leaving high school. Both series ofquestions sought the student's responses in terms of his ability, his parents'wishes, his own desires and his actual plans.
Analysis of the data presented reveals that significant changes withingroups from fall to spring were found for the Woodward and Patterson groupsin all but one instance on the series of items pertaining to educationalplans and goals for grades 11 and 12. On the most pertinent item of theseries, "Which course of study do you plan to take in grades 11 and 12?",the Waite ninth grade group was the only one which did not show a significantchange in response from fall to spring. In general, the direction of thechange in responses to the above items from fall to spring tended to betoward a "general" curriculum for Woodward and Waite students and a "Voca-tional or technical" curriculum for Patterson students.
Analysis of the data pertaining to the four items related to post-highschool educational and vocational plans and goals revealed no significantchanges in responses within or between groups from fall to spring. The onechoice receiving the highest percentage of response from all six groups inthe fall and spring was, "Go to a college or university (4 years) ". A higherpercentage of Patterson students than students from Woodward or Waite selectedthis choice on all four items.
The investigators concluded that the students' educational plans andgoals for grades 11 and 12 had changed significantly from fall to springin five of the six groups. Since one of these groups with significantchange (Waite tenth grade) was a control group, one must Question if thechange was a direct result of Career Exploration Programs. As was pointedout earlier, the pattern of curriculum selection for Woodward and Waitestudents was quite similar, with Patterson students deviating in thedirection of a vocational or technical curriculum choice.

55
When considering educational and vocational plans beyond high school,however, no significant differences were found within or between groups.In light of these results, the investigators were forced to rejectHypothesis 2A.
It seems that many students, whether as a direct result of the CEPor not, changed their educational plans for the last two years of highschool. What caused this change, the investigators are not in a positionto determine. One could conjecture that it was the result of influenceof significant others within or outside of each of the three schools involved.
ypothesis 2B: That a greater percentage of studentswill have definite educational andvocational plans and goals as a resultof the Career Exploration Program.
The purpose of Hypothesis 2B was to determine whether or not studentscomprising the six groups had more definite educational and vocational plansas a result of the Career Exploration Program. Questions on the CPS used totest the hypothesis focused on the individual's attitude toward school andjobs, the amount of thought he had given the need for an education in orderto get along in the world, and whether he had made a decision concerninghigh school graduation and occupational choice. The questions on the CPSused to test Hypothesis 211 consisted of two series of three questions each.One series, questions 7, 9, and 14, dealt with the student's attitude towardschool, his perceived need for an education, and whether or not he plannedto graduate from high school. The second series, questions 4, 5, and 6,concerned the student's idea of what makes a job a "good job", the aiountof thought he had given his choice of an occupation, and whether or nothe was sure that his mind was made up regarding an occupation.
A change in response from fall to spring on these two series of itemswithin each group provided the investigators with the necessary data todetermine if the groups had made more definite educational and vocationalplans during the time of the Career Exploration Program. By comparing thechange in results from fall to spring among groups, it was possible todetermine whether there was a significant change in responses between anexperimental group and a control group or between one experimental groupwhen compared to another experimental group.
Findings
!he investigators assumed that an individual's attitude toward schoolwas lopendent upon how important he perceived an education to be in gettingalong in the world. Question 14, which asked, "About how much schoolingdo you think most young people need these days to get along well in theworld?" was designed to gather data from the six longitudinal groupsconcerning their perception of educational needs. Table 23 presents thepercentage of responses for the six longitudinal groups for the fall andspring testing. Although there were no significant differences within orbetween any of the groups when the change in responses from fall to springfor each group were compared, some interesting trends were apparent. Between26 percent and 38 percent of the groups from Woodward and Waite stated in

Table 23
PRETEST AND POSTTEST PERCENTAGES OFRESPONSES FOR ALL GROUPS FOR
QUESTION 14
Question 14.
About how much schooling
Testing
Date
PERCENTAGES
do these
world?
you think most young people need
days to get along well in the
(Mark only one.)
Wood
Wt
Patt
Grade 9
N506
Grade 10
N382
Grade 9
N206
Grade 10
N344
Grade 9
N414
Grade 10
N476
O.
Elementary school.
Fall
01
00
00
01
00
00
Spring
02
01
00
01
00
00
1.
Some high school.
Fall
03
02
03
03
00
01
Spring
06
03
04
03
01
01
2.
High school diploma.
Fall
31
26
38
29
14
12
Spring
34
26
36
31
14
11
3.
High school diploma including
Fall
15
16
14
16
24
28
vocational or tech. education
Spring
17
17
15
17
27
29
4.
High school diploma + business
Fall
08
11
10
12
11
11
or technical school.
Spring
09
09
10
13
10
13
5.
Some college.
Fall
18
17
13
14
13
12
Spring
15
18
13
16
11
13
6.
Some college + business,
Fall
03
05
06
06
07
11
vocational or tech. school.
Spring
04
04
03
04
10
11
7.
College degree.
Fall
12
10
06
09
14
15
Spring
07
12
11
08
14
10
8.
College degree + additional
Fall
02
02
02
03
06
05
non-college training.
Spring
03
04
01
01
05
04
9.
College degree + graduate
Fall
07
10
08
07
11
05
school
Spring
I
04
06
07
06
07
07
L
57
the fall and spring that a "high school diploma" was enough schooling toget along well in the world. The choice receiving the highest percentageof response from the Patterson groups was "high school diploma includingvocational and technical education", which was chosen by 24 percent to 29percent of the students in the groups. In the spring, a total of 57percent of the Patterson ninth grade students and 58 percent of the Patter-son tenth grace students stated that additional training beyond high schoolwas necessary, while between 41 percent and 53 percent of the groups fromWoodward and Waite responded similarly. Changes in responses within eachgroup from fall to spring were minimal.
One would expect that students perceiving education as being importantfor getting along in the world would have a positive attitude toward school.One could further expect that a Career Exploration Program would have apositive effect upon a student's attitude toward school. Ouestion 9 of theCPS asked, "Which of the following phrases best describes your attitudetoward school?". Table 24 presents the percentage of responses on thisquestion for the six longitudinal groups for the fall and spring testing."I like school a lot" or "I like school pretty well" was chosen by 64 per-cent to 80 percent of the students in the six groups on the fall testing.Between 16 percent and 27 percent of the students in each of the six groupsin the fall responded, "I don't like or dislike school". At the time ofthe spring testing, the responses for "I like school a lot" and "I likeschool pretty well" ranged 50 percent for Waite tenth grade students to74 percent for Patterson ninth grade students. The percentage of studentsstating, "I don't like or dislike school" increased slightly for mostgroups in the spring. In general, the ninth and tenth grade students fromPatterson tended to express a more positive attitude toward school in thefall and spring than did the students from Woodward and Waite. All groups,however, tended to be less positive toward school in the spring than inthe fall.
The F ratios and the pretest, posttest, and adjusted means for allgroups on Ouestion 9 are presented in Table 24A. The F ratios indicate thatthere were significant differences (.01 level) among the responses of boththe ninth and tenth grade groups. Further analysis of the adjusted meansshows that the Patterson ninth grade group was significantly higher (towardliking school a lot) than the Waite ninth grade group. Patterson tenthgrade students were significantly higher (toward liking school a lot) thanWoodward or Waite tenth grade students. Finally, Woodward tenth grade stu-dents were significantly higher (toward liking school a lot) than Waitetenth grade students.
Question 7, which asked "Do you plan to graduate from high school?"was the third question related to the student's educational plans. Fromthe results obtained on Questions 14 and 9, one might expect that at leasta majority of the students in the groups would plan to graduate from highschool. From Table 25, one can see that the percentage of students statingin the fall that they "Definitely plan to graduate" ranged from 85 percentof the Woodward ninth grade group to 99 percent of the Patterson tenthgrade group. The percentage of students from all groups at the time ofspring testing stating that they "Definitely plan to graduate" decreasedwithin each group when compared to the fall. This trend on the spring text
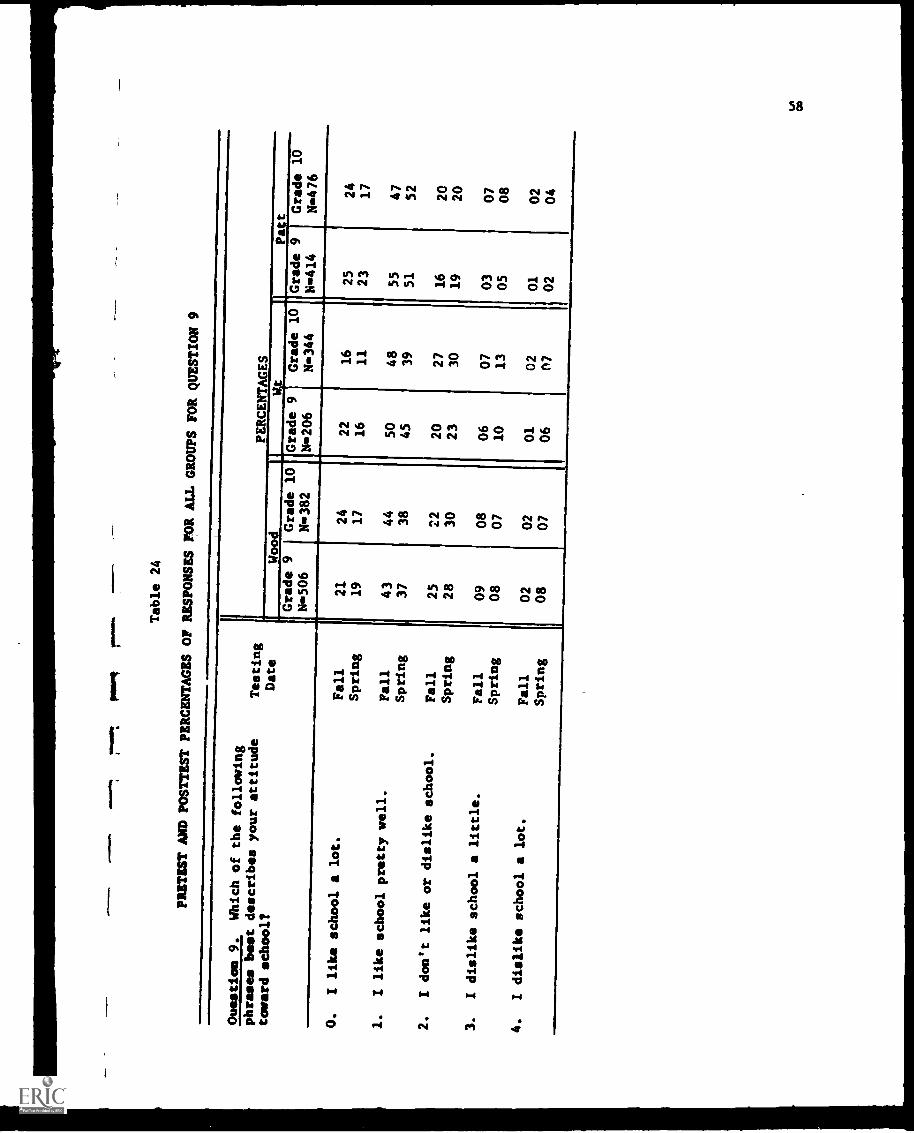
...
Table 24
PRETEST AND POSTTEST PERCENTAGES
OF RESPONSES FOR ALL
GROUPS FOR QUESTION 9
Question 9.
Which of the following
PERCENTAGES
phrases best describes
your attitude
Testing
toward school?
Date
Wood
Wt
Pa
tGrade 9
Ns506
Grade 10
Ns 382
Grade 9
N-'206
Grade 10
Ns344
Grade 9
N -414
Grade 10
N.476
0.
I like school a lot.
Fall
21
24
22
16
25
24
Spring
19
17
16
11
23
17
1.
I like school pretty well.
Fall
43
44
50
48
55
47
Spring
37
38
45
39
51
52
2.
I don't like or dislikeschool.
Fall
25
22
20
27
16
20
Spring
28
30
23
30
19
20
3.
I dislike school a little.
Fall
09
08
06
07
03
07
Spring
08
07
10
13
05
08
4.
I dislike school a lot.
Fall
02
02
01
02
01
02
Spring
08
07
06
07
02
04
00
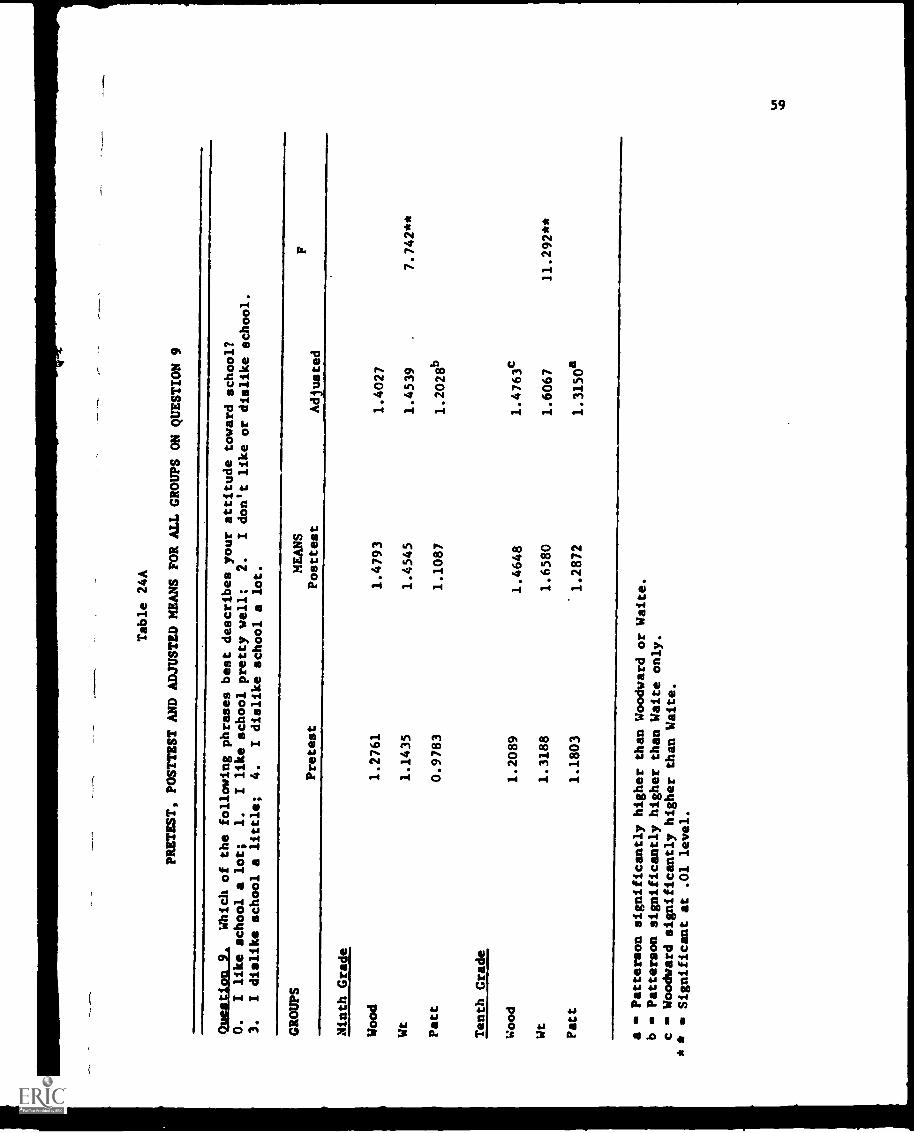
Table 24A
PRETEST, POSTTEST AND ADJUSTED MEANS FOR ALL GROUPS
ON QUESTION 9
Question 9.
Which of the following
phrases best describes your attitude toward school?
I like school pretty well;
2.
I don't like or dislike school.
4.
I dislike school a lot.
O.
I like school a lot;
1.
3.
I dislike school a little;
GROUPS
Pretest
MEANS
Posttest
Adjusted
F
Ninth Grade
Wood
1.2761
1.4793
1.4027
Wt
1.1435
1.4545
1.4539
7.742**
Patt
0.9783
1.1087
1.2028b
Tenth Grade
Wood
1.2089
1.4648
1.4763c
Wt
1.3188
1.6580
1.6067
11.292**
Patt
1.1803
1.2872
1.3150a
a = Patterson significantly higher than Woodward
or Waite.
b = Patterson significantly higher than Waite
only.
cWoodward significantly higher than Waite.
* *
Significant at .01 level.

T able 25
PRETEST AND POSTTZST PERCENTAGES OFRESPONSES FOR ALL GROUPS FORQUESTION 7
guestion 7.
Do you plan to
Testing
PERCENTAGES
graduate from high school?
Date
Wood
Wt
Patt
Grade 9
N506
Grade 10
N382
Grade 9
N206
Grade 10
N344
Grade 9
N414
Grade 10
8476
O.
Definitely plan to graduate.
Fall
85
92
91
89
97
99
Spring
81
86
87
85
96
95
1.
Probably will graduate.
Fall
10
04
06
07
03
01
Spring
09
06
06
1004
04
2.
Undecided.
Fall
03
03
02
02
00
00
Spring
06
04
05
03
00
01
3.
Probably will not graduate.
Fall
01
01
01
01
00
00
Spring
03
02
01
01
00
00
4.
Definitely do not plan to
Fall
01
00
00
01
00
00
graduate.
Spring
02
01
01
01
00
01

61
results was similar to those observed on the spring results of Question 9pertaining to the student's attitude toward school.
The F ratios and the pretest, posttest, and adjusted means for allgroups on Question 7 are presented in Table 25A. The F ratios indicate thatthere were significant differences (.01 level) among the responses of boththe ninth and tenth grade groups. Analysis of the adjusted means showsthat the Patterson ninth grade group was significantly higher (in thedirection of definitely planning to graduate) aan the Woodward ninth gradegroup. Patterson tenth grade students were significantly higher (in thedirection of definitely planning to graduate) than the Woodward or Waitetenth grade groups.
Tho second series of questions related to Hypothesis 2B were concernedwith the students' vocational plans and goals. Question 5 of this seriesasked, "When you say that a job is a 'good job', what do you think is theone main thing that makes it a 'good job'?" Table 26 presents the percentageof responses on this question for the six longitudinal groups for the falland spring testing. The choice receiving the highest percentage of responsesfrom all groups in the fall was "The job has a good future". The percentageof students selecting this choice ranged from 25 percent for Woodward ninthand tenth grade students to 37 percent for Patterson ninth grade students.Other responses in the fall for all groups were fairly evenly distributedamong: "The job pays well"; "The job is pleasant, safe, and easy"; "Thejob helps other people"; "The job requires high moral standards, honesty,and responsibility"; and "The job requires intelligence and ability".Approximately 10 percent to 15 percent of the students in each of the groansselected these responses. When one compares the responses from fall tospring within groups, the only significant changes (.01 level) were recordedby Woodward tenth grade students and by Patterson tenth grade students.The most apparent change within these two groups was the increase of 25percent to 37 percent of Woodward tenth grade students and the 33 percentto 42 percent of Patterson tenth grade students in the choosing, "The jobhas a good future". There were no significant differences in the change ofresponses from fall to spring between any of the groups on Question 5.
Before one can place any credence on an individual's statement that hismind is made up concerning his choice of an occupation, the amount of thoughtthat he has put into the decision must be considered. Question 4, whichasked "In regard to your choice of an occupation, have you:" was designedto elicit this information from the students. Table 27 presents the per-centage of responses on this question for the six longitudinal groups for thefall and spring testing. The higher percentage of responses in the falltended to be clustered on two choices for all groups. The percentage ofstudents replying "Given the matter a great deal of thought" ranged from44 percent for Waite ninth grade students to 79 percent for Patterson tenthgrade students. The percentage of students reporting in the fall that theyhad "Given the matter some thought", ranged from 20 percent fur the Patter-son tenth grade students to 45 percent for the Waite tenth grade students.The most apparent change within groups from fall to spring was that of thePatterson ninth grade students. The percentage of these students answering"Given the matter a great deal of thought" increased from 62 percent in thefall to 79 percent in the spring. Patterson students stating that they had"Given the matter some thought" decreased from 35 percent in the fall to 19

Table 25A
PRETEST, POSTTEST AND ADJUSTED MEANS FOR ALLGROUPS ON QUESTION 7
Question 7.
Do you plan to graduate from high school?
plan to graduate;
1.
Probably will graduate;
2.
Undecided;
will not graduate;
4.
Definitely do not plan to graduate.
O.
Definitely
3.
Probably
GROUPS
MEANS
Pretest
Posttest
Adjusted
F
Ninth Grade
Wood
0.2150
0.3432
0.3122
Wt
0.1388
0.2249
0.2236
14.364**
Patt
0.0362
0.0507
0.0894b
Tenth Grade
Wood
0.1332
0.2637
0.2475
Wt
0.1594
0.2406
0.2134
6.833**
Patt
0.0168
0.0734
0.1060a
a = Patterson significantly higher than Woodwardor Waite.
b = Patterson significantly
higher than Woodward.
** = Significant
at .01 level.
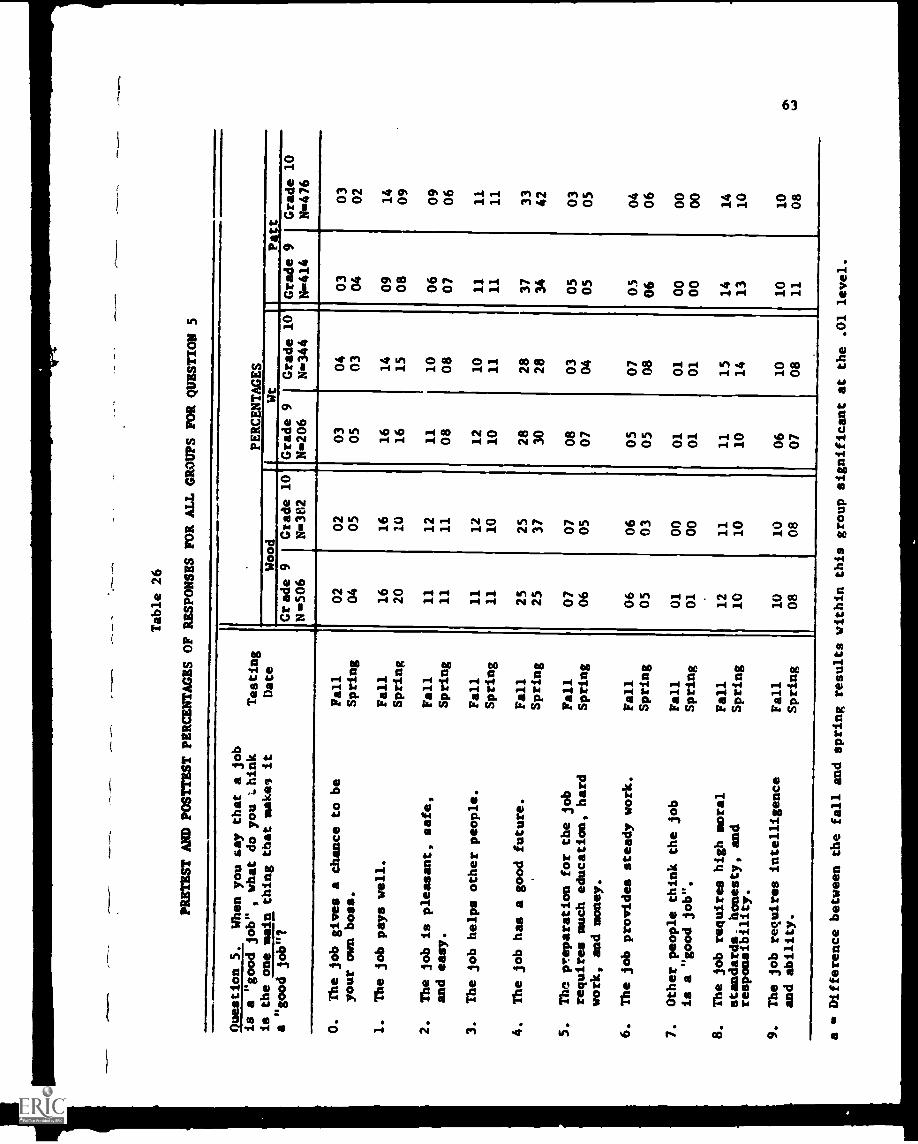
Table 26
PRETEST AND POSTTEST PERCENTAGES OF RESPONSES
FOR ALL GROUPS FOR QUESTION 5
Question 5.
When you say that a job
Testing
PERCENTAGES
is
is
a "good
a "good job" , what do you chink
the one main thing that makes it
Date
Wood
Wt
Patt
job"?
Grade 9
N=506
Grade 10
N=382
Grade 9
N=206
Grade 10
N=344
Grade 9
N=414
Grade 10
N=476
O.
The job gives a chance to be
Fall
02
02
03
04
03
03
your own boss.
Spring
04
05
05
03
04
02
1.
The job pays well.
Fall
16
16
16
14
09
14
Spring
20
10
16
15
08
09
2.
The job is pleasant, safe,
Fall
11
12
11
10
06
09
and easy.
Spring
11
11
08
08
07
06
3.
The job helps other people.
Fall
11
12
12
10
11
11
Spring
11
10
10
11
11
11
4.
The job has a good future.
Fall
25
25
28
28
37
33
Spring
25
37
30
28
34
42
5.
The preparation for the job
Fall
07
07
08
03
05
03
requires much education, hard
work, and money.
Spring
06
05
07
04
05
05
6.
The job provides steady work.
Fall
06
06
05
07
05
04
Spring
05
03
05
08
06
06
7.
Other people think the job
Fall
01
00
01
01
00
00
is a "good job".
Spring
01
00
01
01
00
00
8.
The job requires high moral
Fall
12
11
11
15
14
14
standards. honesty, and
responsibility.
Spring
10
10
10
14
13
10
9.
The job requires intelligence
Fall
10
10
06
10
10
10
and ability.
Spring
08
08
07
08
11
08
a = Difference between the fall and spring resultswithin this group significant at the .01 level.

Table 27
PRETEST AND POSTTEST PERCENTAGES OFRESPONSES FOR ALL GROUPS FOR
QUESTION 4
Question 4.
In regard to your
Testing
Date
PERCENTAGES
choice of an occupation, have
you:
Wood
Wt
Pat t
Grade 9
8506
Grade 10
N382
Grade 9
N206
Grade 10
N344
Grade 9
N414
Grade 10
N476
O.
Given the matter a great
Fall
AIM
48
57
44
54
62
79
deal of thought.
Spring
51
55
54
51
79
77
1.
Given the matter some thought.
Fall
40
37
45
36
35
20
Spring
37
34
36
38
19
22
2.
Given the matter little thvught.
Fall
11
06
10
09
03
02
Spring
09
08
08
08
02
01
3.
Given the matter no thought.
Fall
02
01
01
01
00
00
Spring
03
02
01
03
00
00

percent in the spring. Spring responses for "Given the matter a greatdeal of thought" were higher for Patterson ninth and tenth grade students thanfor students at Woodward or Waite. When comparing the changes withingroups from fall to spring, the greatest percentage of change was attainedby Patterson ninth grade students. The students in this group showed anincrease of 18 percent to 39 percent from fall to spring for "Sure yourmind is made up" and a decrease of 28 percent to 12 percent over the sameperiod for "Not sure that your mind is made up". Patterson tenth gradestudents in the fall and spring and Patterson ninth grade students in thespring tended to be more sure than students from Woodward and Waite thattheir minds were made up regarding a choice of an occupation.
The F ratios and the pretest, posttest, and adjusted means for allgroups on Question 4 are presented in Table 27A. The F ratios indicatethat there were significant differences (.01 level) among the responses ofboth the ninth and tenth grade groups. Analysis of the adjusted means showthat the Patterson students were significantly higher (toward having giventhe matter of an occupational choice more thought) than Woodward or Waitestudents.
Question 6, which asked "In regard to your choice of an occupation,are you:" was concerned with whether or not the student believed his mindto be made up in regard to his occupational choice. If a student's mindwas set prior to the Career Explorat n Program, one would expect him tobe somewhat closer to the experiences rovided by the program. On theother hand, one could expect an increa in the percentage of studentsin the experimental schools in the spri g stating that their mind is madeup, or st least they think their mind is made up. Table 28 presents thepercentage of responses on this question for the six longitudinal groupsfor the fall and spring testing. The choice receiving the highest per-centage of responses for most groups in the fall was "Not sure, but thinkyour mind is made up". The percentage of response for this choice in thefall ranged from 33 percent for Woodward ninth grade students to 44 per-cent for the Patterson ninth grade students. Two other choices, "Sureyour mind is made up" and "Not sure your mind is made up", was chosen inthe fall by approximately 25 percent of the students.
The F ratios and the pretest, posttest, and adjusted means for allgroups on Question 6 are presented in Table 28A. The F ratios indicatethat there were significant differences (.01 level) among the responsesof both the ninth and tenth grade groups. Analysis of the adjusted meansshow the Patterson students were significantly higher (toward being surethat their minds were made up regarding occupational choice) than Wood-ward or Waite students.
Discussion
Hypothesis 2B stated, "That a greater percentage of students willhave definite educational and vocational plans and goals as a result ofthe Career Exploration Program". The findings used to test Hypothesis 2Bwere drawn from two series of three questions each. Ouestions 7, 9, and14 dealt with the student's attitude toward school, his perceived need foran education, and whether or not he planned to graduate from high school.Although no significant differences were found among the groups as to how

Table 27A
PRETEST, POSTTEST AND ADJUSTED MEANS FOR ALL GROUPS ON QUESTION 4
Question 4.
In regard to your choice of an occupation,
have you:
O.
Given the natter a great deal of thought;
1.
Given the natter some thought;
2.
Given the matter little thought;
3.
Given the matter no thought
GIMPS
Pretest
MEANS
Posttest
4dlosted
F
Ninth Grade
Wood
0.6627
0.6410
0.6113
Wt
0.6746
0.5694
0.5356
31.550**
Patt
0.4203
0.2319
0.2854a
Tenth Grade
Wood
0.5065
0.5640
0.5265
Wt
0.5797
0.6290
0.5604
20.152**
Patt
0.2306
0.2369
0.3166a
aPatterson significantly higher than Woodward
or Waite.
**
Significant at .01 level.

,/,1
10.
011.
.011
.1
Table 28
PRETEST AND POSTTEST PERCENTAGES
OF RESPONSES FOR ALL GROUPSFOR QUESTION 6
Question 6.
In regard to your
Testing
PERCENTAGES
choice of an occupation,
are you:
Date
Wood
Wt
Pa
tGrade 9
N506
Grade 10
101382
Grade 9
N206
Grade 10
N344
Grade 9
N414
Grade 10
N476
O.
Sure your mind is made
up.
Fall
24
27
26
27
18
44
Spring
24
26
30
23
39
37
1.
Not sure, but thinkyour
Fall
33
38
36
40
44
41
mind is made up.
Spring
36
37
37
38
43
43
2.
Not sure that your mind is
Fall
26
21
28
22
28
12
made up.
Spring
27
25
26
27
12
15
3.
Sure your mind is not made
up.
Fall
17
14
10
11
10
03
Spring
13
12
08
13
05
05
cr
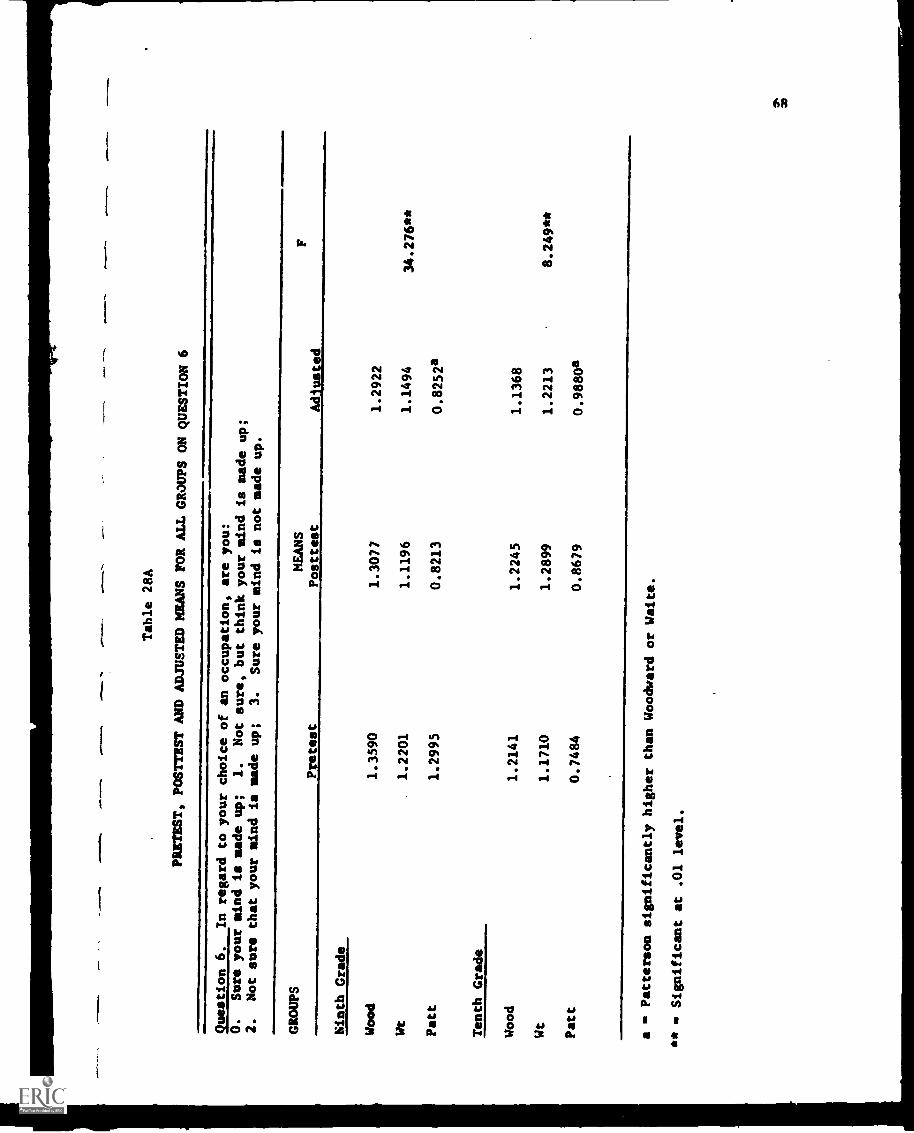
Table 28A
PRETEST, POSTTEST AND ADJUSTED MEANS FOR ALL GROUPS ONQUESTION 6
Question 6.
In regard to your choice of an
occupation, are you:
but think your mind is made
up;
Sure your mind is not made
up.
O.
Sure your mind is made up;
1.
Not sure,
2.
Not sure that your mind is made
up;
3.
GROUPS
Pretest
MEANS
Posttest
Adjusted
F
Ninth Grade
Wood
1.3590
1.3077
1.2922
Wt
1.2201
1.1196
1.1494
34.276**
Patt
1.2995
0.8213
0.8252a
Tenth Grade
Wood
1.2141
1.2245
1.1368
Wt
1.1710
1.2899
1.2213
8.249**
Patt
0.7484
0.8679
0.9880a
aPatterson significantly higher than Woodward
or Waite.
**
Significant at .01 level.
69
much schooling was thought to be necessary to get along well in the world,differences did exist in the areas of attitude toward school and plans tograduate from high school. Patterson ninth grade students tended to havea more positive attitude toward school than did Waite ninth grade students.Patterson tenth grade students tended to be more positive toward schoolthan Woodward or Waite students, while Woodward tenth grade students weremore positive than Waite tenth grade students. All groups, however, tendedto be less positive in their attitude toward school in the spring th.n inthe fall. Patterson ninth grade students were more definite in the springthat they planned to graduate from high school than Woodward ninth gradestudents. Patterson tenth grade students were more definite in their plansto graduate from high school than were Woodward and Waite tenth gradestudents.
Questions 4, 5, and 6 were concerned with the student's idea of whatmakes a job a "good job", the amount of thought he had given his choiceof an occupation, and whether or not he was sure that his mind was madeup regarding his occupational choice. Although there were significantdifferences within Patterson and Woodward tenth grade groups from fall tospring on the question of what makes a Job a "good job", there were nosignificant differences between any of the groups in the change of responsesfrom fall to spring on the same question.
The data pertaining to the amount of thought given to the matter ofoccupational choice was somewhat more conclusive in establishing differ-ences between groups. Patterson students were significantly higher(toward having given the matter of an occupational choice more thought)than Woodward and Waite students.
Finally, a significant difference was found between Patterson studentsand students from Woodward and Waite in the area of stated commitment tooccupational choice. Patterson students were more definite that theirminds were made up in regard to occupational choice.
Examination of the findings related to Hypothesis 2B showed that thePatterson students were more definite in their plans to graduate from highschool and in regard to their occupational choice than were students fromWoodward and Waite. From the results presented above, it mould seem thatthe Patterson students did experience significant changes in their edu-cational and vocational plans and goals as a result of the Career Explor-ation Program. These results could also be attributed to the fact thatPatterson is a vocational school and, therefore, the students are morehighly motivated because of expressed interest in the occupations for whichthey are training. Differences between Woodward and Waite students inthe area of setting definite educational and vocational plans an' goalswere minimal. The Career Exploration Program at Woodward had littleapparent effect in helping the students establish definite educationaland vocational plans and goals when compared to the Waite students.The fact that the program was in its first year of operation at Woodwardmay have contributed to these findings.
Objective 3:
lirpothesis 3A:
Instrumentation
CHAPTER IV
SELF-CONCEPT
To help the student develop a more positiveself-image of himself as a person and as apotential worker.
That students will have a more positiveglobal self-image as a result of theCareer Exploration Program.
In order to measure the global self-concept of students, the TennesseeSelf-Concept Scale was given to all students. The scale format was revisedslightly with the permission of the authors to facilitate students takingthe scale and machine scoring of it. No modification of the items or oftheir sequence was made, however. Students respond to each of the 100items on the Tennessee Self-Concept Scale on a 5 point scale from completelytrue to completely false. Student scores on the following nine scaleswere analyzed by the investigators: Self-Esteem (Total P Score), Identity(Row 1 P Score), Self-Satisfaction (Row 2 P Score), Behavior (Row 3 P Score),Physical Self (Column A), Moral-Ethical Self (Column B), Personal Self(Column C), Family Self (Column D), and Social Self (Column E).
Findings
An analysis of covariance was done comparing the change in the preand post test scores of students in the ninth and tenth grades at thethree schools on each of the 9 scales (Table 29). Scores for all of theninth grade students were almost identical, and the differences did notapproach statistical significance.
There were significant differences in change on two scales for tenthgrade students, however. On the first scale, "Identity", Patterson tenthgrade students changed significantly more than Woodward tenth gradestudents. The Manual for the Tennessee Self Concept Scale describes the"Identity" scale as those items that describe "what I me" " ,erson'sbasic identity-what he is as he sees himself morally, ph., s -ty, socially,etc. Thus, Patterson tenth grade students tended to chant,. toward seeingthemselves significantly more positively than Woodward tenth grade students.
On the second scale, "Behavior", Waite tenth grads students scoreschanged significantly more than Patterson tenth grade students. TheManual describes the "Behavior Scale" as indicating "this is what I door this is the way I act". This is the individual's perception of hisbehavior. Waite tenth grade students nes their behavior in a significantlymore positive vein than Patterson tenth grade students.
70

..,
Table 29
PRETEST, POSTTEST AND ADJUSTED MEANS FOR ALL GROUPS
HAVING A SIGNIFICANT DIFFERENCE ON
THE TENNESSEE SELF-CONCEPT SCALE
11.121
Identity - (Row 1)
GROUPS
Pretest
ME ANS
Posttest
Adiusted
F
Tenth Grade
90.6017
89.8797
90.3137
89.5515
89.7941
90.3916
89.4337
89.9289
90.3745a
4.010*
Wood
Wt
Patt
Scale:
Behavior - (Row 3)
Tenth Grade
85.8663
86.0642
85.9474
86.9331
87.6952
86.6905
86.9630
87.6615b
86.6944
4.092*
Wood
Wt
Patt
aPatterson significantly higher than Woodward
b = Waite significantly higher than Patterson
* = Significant at .05 level
72
Discussion
In general, the very minute differences in self-concept scoresbetween all the groups both at the beginning and end of the programand the very slight changes in scores from pre to post test (themean score on the majority of scales for each group increased slightlyfrom pre to post test) suggest that the Career Exploration Programhad little influence upon bow students saw themselves. Since allninth grade students were starting a new school program for the firsttime, one would have expected changes at that level if either CareerExploration Program had a significant impact upon them. Perhaps stu-dents in the CEP either did not get success experiences with which tobuild their self-concept, or they were unable to generalize the successexperiences of a vocational nature to the more broad aspects of self.
Even at the tenth grade level, where two significant differencesdid appear, there was not even an indication of a trend in favor ofany one school, since an experimental school group excelled on one ofthe two scales and a control school group excelled on the other scalewhere there was a significant difference.
One is forced to conclude that the Career Exploration Program hadlittle, if any, impact upon the "global" self-concept of the participantswhen analyzed by grade level groups.
Hypo then is 3B:
Instrumentation
That students will have a more positiveself-image of themselves as potentialworkers as a result of the Career Explora-tion Program.
Items 8, 13, and 15 on the Career Plans Survey were used to assessvocational self-concept. These items dealt with the student's per-ception of his ability as compared with others now working at the occu-pation, his chances for success as compared to his friends, and hischances for success as compared to those working at the occupation now,respectively. He was asked to respond to each of these items by ratinghimself on a 5 point scale from very much above average to very muchbelow average.
FindinV
An analysis of covariance was done comparing the pre and post testscores by grade level on each item. Tables 30 through 32A show the per-centage of students in each group making each choice and the mean scoreof each group for each question, respecpectively.
Significant differences were found within groups on all three questions.On the first question (Question 8, Tables 30 and 30A) asking students torate their ability for the job they were considering, Patterson studentsat both grades 9 and 10 changed significantly more than the comparablegroure at Waite.
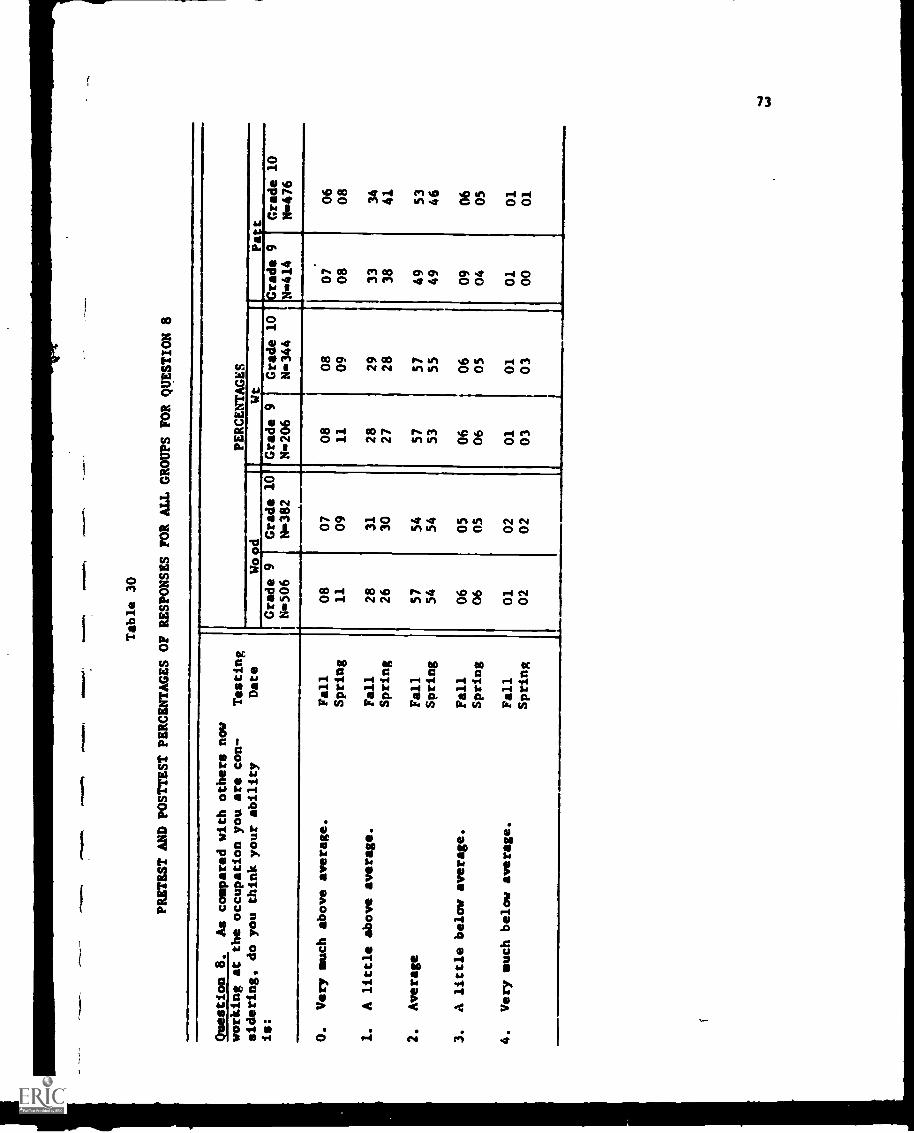
0111
11.1
101,
1
Table 30
PRETEST AND POSTTEST PERCENTAGES OF RESPONSES FOR ALL GROUPS FORQUESTION 8
Question 8.
As compared with others now
working at the occupation you are con-
sidering, do you think your ability
is:
O.
Very much above average.
1.
A little above average.
2.
Average
3.
A little below average.
4.
Very much below average.
Testing
Date
PERCENTAGES
Wood
Wt
Pa:t
Grade 9
N506
Grade 10
N382
Grade 9
N206
Grade 10
N 344
Grade 9
N414
Grade 10
8476
Fall
08
07
08
08
07
06
Spring
11
09
11
09
08
08
Fall
28
31
28
29
33
34
Spring
26
30
27
28
38
41
Fall
57
54
57
57
49
53
Spring
54
54
53
55
49
46
Fall
06
05
06
06
09
06
Spring
06
05
06
05
04
05
Fall
01
02
01
01
01
01
Spring
02
02
03
03
00
01
1

Table 30A
PRETEST, POSTTEST AND ADJUSTED MEANS FOR ALL GROUPS ON QUESTION
8
Question 8.
Compared with others now working at the occupation you are considering, doyou think your.
ability is
O.
Very much above average;
1.
A little above average;
2.
Average;
3.
atilittle below average;
4.
Very much below average.
GROUPS
Pretest
MEANS
Posttest
Adjusted
F
Ninth Grade
Wood
1.6292
1.6193
1.6205
Wt
1.6411
1.6268
1.6227
3.033*
Patt
1.6304
1.5097
1.5103b
Tenth Grade
1.6214
1.5953
1.5974
Wood
1.6406
1.6522
1.6465
4.189*
Wt
1.6205
1.5010
1.5035a
Patt
a go Patterson significantly higher than Waite.
bPatterson significantly higher than Waite and Woodward.
*Significant at .05 level.

When asked to evaluate their chances for being successful at anoccupation (Tables 31 and 31A), Patterson student. in the ninth gradechanged in the desired direction significantly ooze than did Woodwardninth grade students. Al the tenth grade level, Patterson students alsochanged in the desired direction significantly more than students atWaite, but not Woodward.
Finally, Patterson ninth grade students changed significantly morepositively in rating their chances for getting ahead in the occupationof their choice than students at Waite and Woodward (Tables 32 and 32A).There were no significant differences between groups at the tenth gradelevel.
Discussion
It appears that, in most instances, Patterson students had a signifi-cantly more positive outlook upon their abilities and chances for successin their chosen field than did students at Waite and, in one instance,Woodward. Since Patterson students were in a program designed to providethem with concrete experiences directly related to the careers theywere considering, this finding confirms the philosophy of the CareerExploration Program; i.e. that a student will see himself in a more posi-tive light when he has opportunities for success experiences in a fieldof interest.
15
A second possible explanation of this finding may be that, sincePatterson is a selective school, students have been indoctrinated bytheir faculty to consider themselves as "above average" and having greateropportunity than many non-college oriented students in the general highschool. In addition, Patterson students had success experiences in aspecific field of interest. Apparently, in this instance, a Career Exolora-tion Program in a general high school was unable to provide this samekind of support.

Table 31
PRETEST AND POSTTEST PERCENTAGES OF RESPONSES
FOR ALL GROUPS FORQUESTION 13
Question 13.
Compared with your friends,
do you tfiiik your chances forbeing
testing
successful in the occupation ofyour
Date
choice are:
1,11
11
O.
Very such above
average.
Fall
Spring
1.
A 1 -ttle aboveaverage.
Fall
Spring
2.
Average.
Fall
Spring
3.
A little below
average.
Fall
Spring
4.
Very much below average.
Fall
Spring
1
PERCENTAGES
Wood
Wt
Patt
nrade 9
Grade 10
Grade 9
Grade 10
Grade 9
Grade 10
N506
N382
N206
N344
N414
N476
19
16
17
18
18
16
21
24
20
16
21
19
33
31
32
33
36
39
29
28
33
35
42
41
44
39
48
45
44
42
45
41
41
44
35
37
34
03
03
03
02
03
03
04
05
03
02
02
00
01
00
01
00
00
02
01
02
G3
00
00
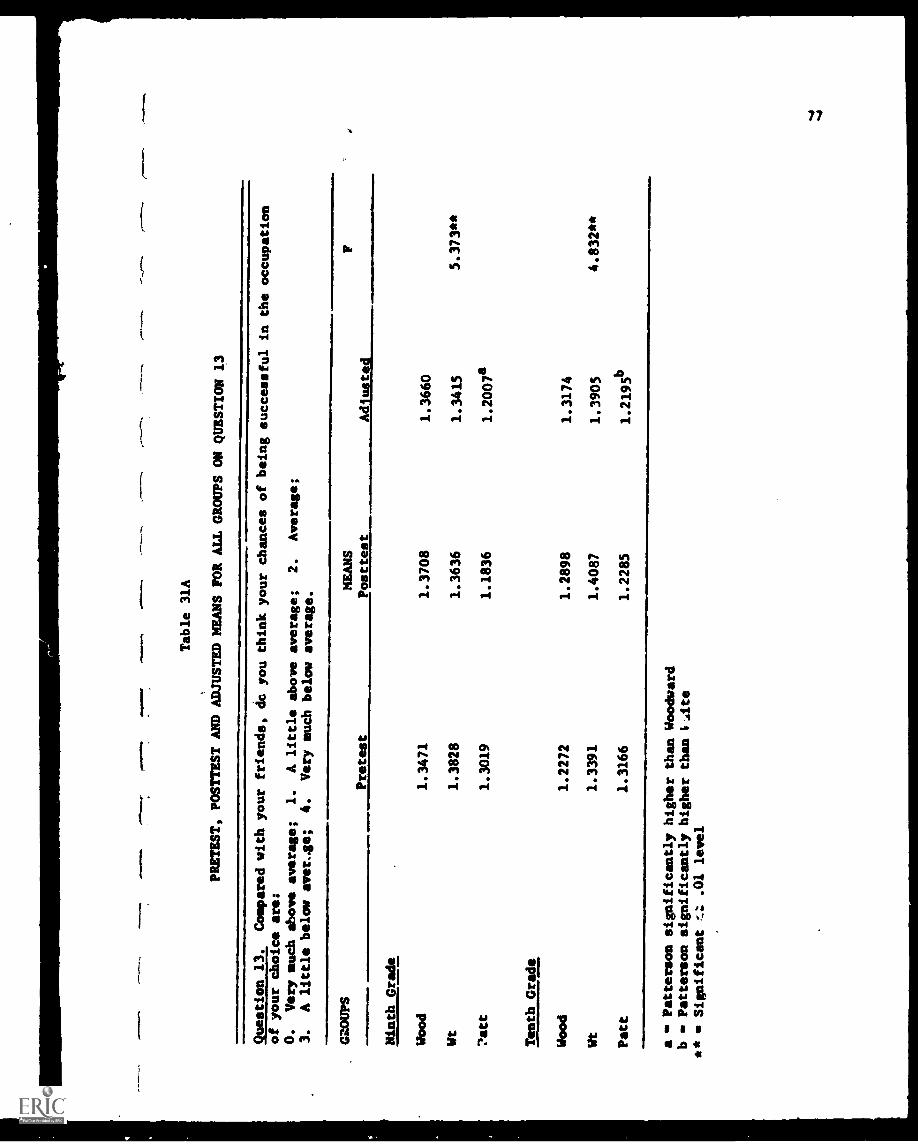
Table 31A
PRETEST, POSTTEST AND ADJUSTED MEANS FOR ALL GROUPS ON QUESTION 13
Question 13.
Compared with your friends, de you think your chances of being successfulin the occupation
of your choice are:
O.
Very much above average;
1.
A little above average;
2.
Average;
3.
A little below aver-ge;
4.
Very much below average.
GROUPS
Pretest
MEANS
Posttest
Adjusted
Ninth Grade
Wood
1.3471
1.3708
1.3660
Wt
1.3828
1.3636
1.3415
5.373**
?att
1.3019
1.1836
1.2007a
Tenth Grade
Wood
1.2272
1.2898
1.3174
Wt
1.3391
1.4087
1.3905
4.832**
Patt
1.3166
1.2285
1.2195b
aPatterson significantly higher than Woodward
b - Patterson significantly higher than Late
** - Significant
.01 level
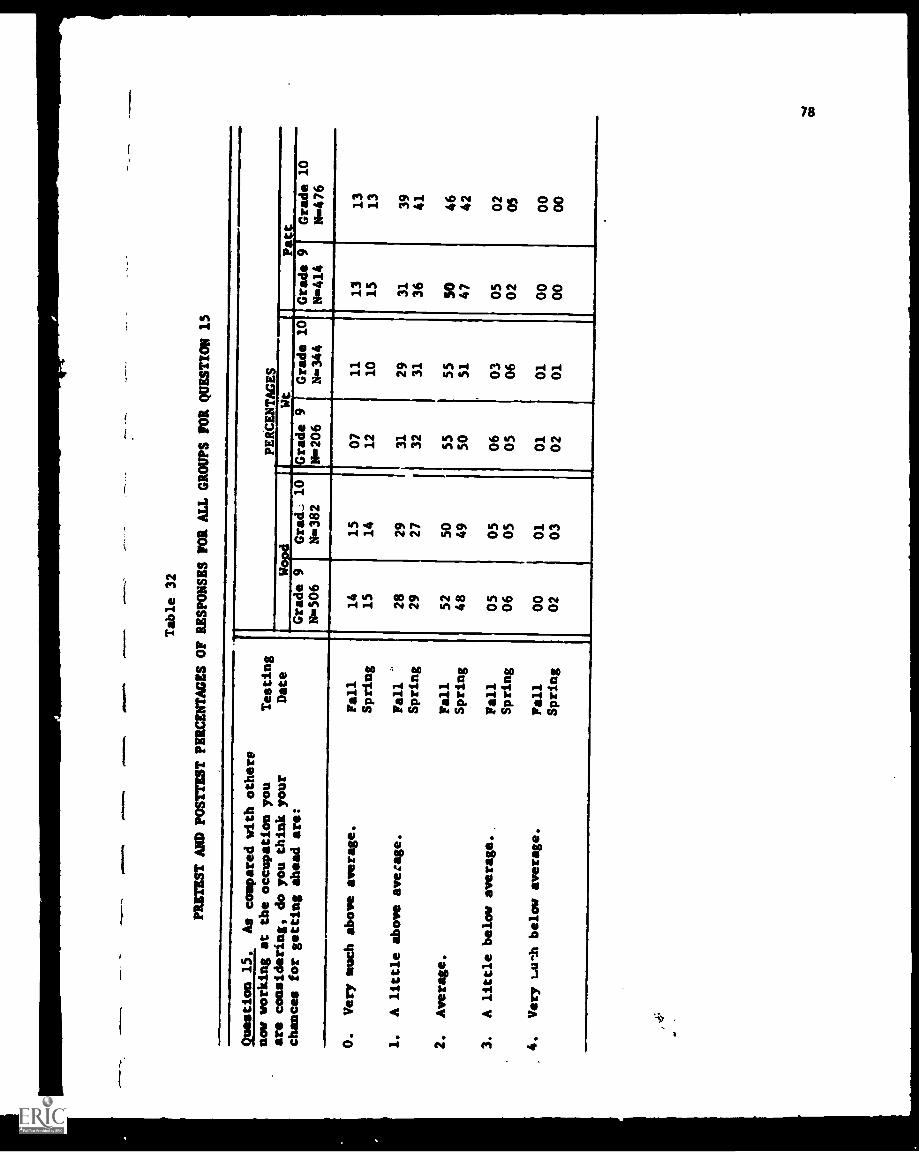
Table 32
PRETEST AND POSTTEST PERCENTAGES OF RESPONSES FOR ALLGROUPS FOR QUESTION 15
Question 15.
As compared with others
now working at the occupationyou
are considering, do you thinkyour
chances for getting ahead are:
O.
Very much above average.
1.
A little above
average.
2.
Average.
3.
A little below average.
4.
Very uuth below average.
Testing
Date
VPERCENTAGES
Wt
Patt
Grade 9
Grad.; 10
N-506
N -382
Grade 9 1
Grade 10
N-206
N-344
Grade 9' Grade 10
N-414
N-476
Fall
14
15
Spring
15
14
Fall
-
28
29
Spring
29
27
Fall
52
50
Spring
48
49
Fall
05
05
Spring
06
05
Fall
00
01
Spring
02
03
07
12
31
32
55
50
06
05
01
02
11
10
29
31
55
51
03
06
01
01
1315
31
36
50
47
0502
00
00
13
13
39
41
46
42
02
05
00
00

0111
1111
114
Table 32A
PRETEST, POSTTEST AND ADJUSTED MEANS
FOR ALL GROUPS ON QUESTION 15
1
Question 15,
Compared with others now working at theoccupation you are considering, doyou think your
chances for getting ahead are:
O.
Very much above average;
1.
A little above average;
2.
Average;
3.
A little below average;
4.
Very much belay average
GROUPS
Pretest
MEANS
Posttest
Adjusted
F
Ninth Grade
Wood
1.4872
1.5049
1.5119
Wt
1.6316
1.5502
1.5127
3.851*
Patt
1.4758
1.3647
1.3752a
aPatterson significantly higher thanWaite and Woodward
*Significant at .05 level
9jective 4:
CHAPTER V
PARENT OPINION
To provide a program that will be consideredworthwhile by parents of students in theCareer Exploration Program.
Hypothesis 4A: That attitudes toward the program expressedby parents will be generally favorable.
In order to teat Hypothesis 4A, a twelve item questionnaire was devel-oped by the investigators for distribution to the parents of Patterson andWoodward students enrolled in the Career Exploration Program during the1970-71 school year. The Parents Survey included items designed to collectdata pertaining to the source and degree of parent knowledge of the CEP,parent reaction to the program, and parent perception of the effect of theprogram on their child.
The Parent Surveys were distributed to the students at the experimentalschool in the spring with directions to deliver it to a parent or guardian.Parents were asked to react to the items on the survey, seal it in theenvelope provided, and return it to the school. Parents were assured thattheir responses would not be revealed to the personnel at the school.
Four hundred fifty-one (50 percent) of the approximately 900 ParentSurveys sent to the Patterson parents were returned. Two hundred seventy-five (31 percent) of the 900 Parent Surveys sent to the Wtvdward parentswere returned. It is interesting to note that returns from parents of girlsoutnumbered returns from parents of boys at Woodward by 202 to 73.
Items 1 and 2 of the Parent Survey sought to determine how much theparents thought they knew about the Career Exploration Program in theirchild's school, and to what source the parents attributed their knowledgeof the program. From Table 33, one can see that fewer than 10 percentof the responding parents from Patterson or Woodward believed that they knew"a lot" about the CEP in their child's school, while the majority of parentsfrom each school stated that they knew "some" or "a little" about theprograms. As can be seen from Table 34, "from my child" was selected asthe source of information about the CEP by 75 percent of the Pattersonparents and 85 percent of the Woodward parents.
80

Table 33
REPOSE= KNOWLEDGE OF THE CALMER EXPLORATION MGMOF NINTH AND TENTH GRADE PARENTS AT PATTERSON AND WOODWARD
PARENT RESPONSES PATTN -451
WOODN275
A.
B.
C.
D.
E.
I know a lot....
Percent
08
48
25
17
02
Percent
10
42
38
09
01
I know some....
I know a little....
I know nothing....
No response....
Table 34
PARENTS REPORTED SOURCE OF KNOWLEDGE OF THECAREER EXPLORATION PROGRAM AT PATTERSON AND WOODWARD
SOURCE OF KNOWLEDGE PATTN-451
WOODN275
A.
B.
C.
D.
E.
F.
From my child.
From oneone at the school.
From someone in the community.
Prom my job.
Other.
No response.
Percent
75
03
02
01
01
19
Percent
85
02
01
01
01
10
81

82
A student's reaction to an innovation in a school's curriculumis often a reflection of how a parent feels about the program. Whenasked to evaluate the opportunity for his child to participate in theCEP, the majority of parents responding from both schools were favor-able. Data presented in Table 35 shows that 91 percent of the Pattersonparents and 82 percent of the Woodward ps.7ents stated that the CEP intheir child's school was an "excellent" or a "good" experience for theirchild.
Table 36 presents the results for items 4 through 11 of the ParentSurvey. These items emphasized the learning opportunities, child'sattitude toward school and other benefits that may have resulted fromthe CEP. From the data presented in Table 36, the following statementscan be made concerning the parents' reactions to the items.
- -82 percent of the Patterson parents and 74 percent of theWoodward parents "strongly agreed" or "agreed" that "thisyear in school my child has learned about what jobs areavailable to him ".
--78 percent of the Patterson parents and 61 percent of the Wood-ward parents "strongly disagreed" or "disagreed" that "this year inschool my child has not learned about what training is requiredfor different jobs".
--58 percent of the Patterson parents and 63 percent of the Wood-ward parents "strongly agreed" or "agreed" that "this year inschool my child has learned what different jobs me.
--89 percent of the Patterson parents and 79 percent of the Woodwardparents "strongly disagreed" or "disagreed" that "this year inschool my child has learned less about jobs than in past years".
--72 percent of the Patterson parents and 43 percent of the Woodwardparents "strongly agreed" or "agreed" tLat "my child likes schoolbetter this year because he has had an opportunity to learn aboutjobs".
--73 percent of the Patterson parents and 64 percent of the Woodwardparents "strongly disagreed" or "disagreed" that "my child haddiscussed with me less this year than in past years what he wantsto do after completing his high school education".
--86 percent of the Patterson parents and 60 percent of the Woodwardparents "strongly agreed" or "agreed" that "because of studyingabout jobs in school this year, my child has a better idea of whatjobs he would like to do after completing his high school education".
--79 percent of the Patterson parents and 47 percent of the Woodwardparents "strongly agreed" or "agreed" that "because of studyingabout jobs in Winol this year, my child has a better idea of whatjobs he can do well".
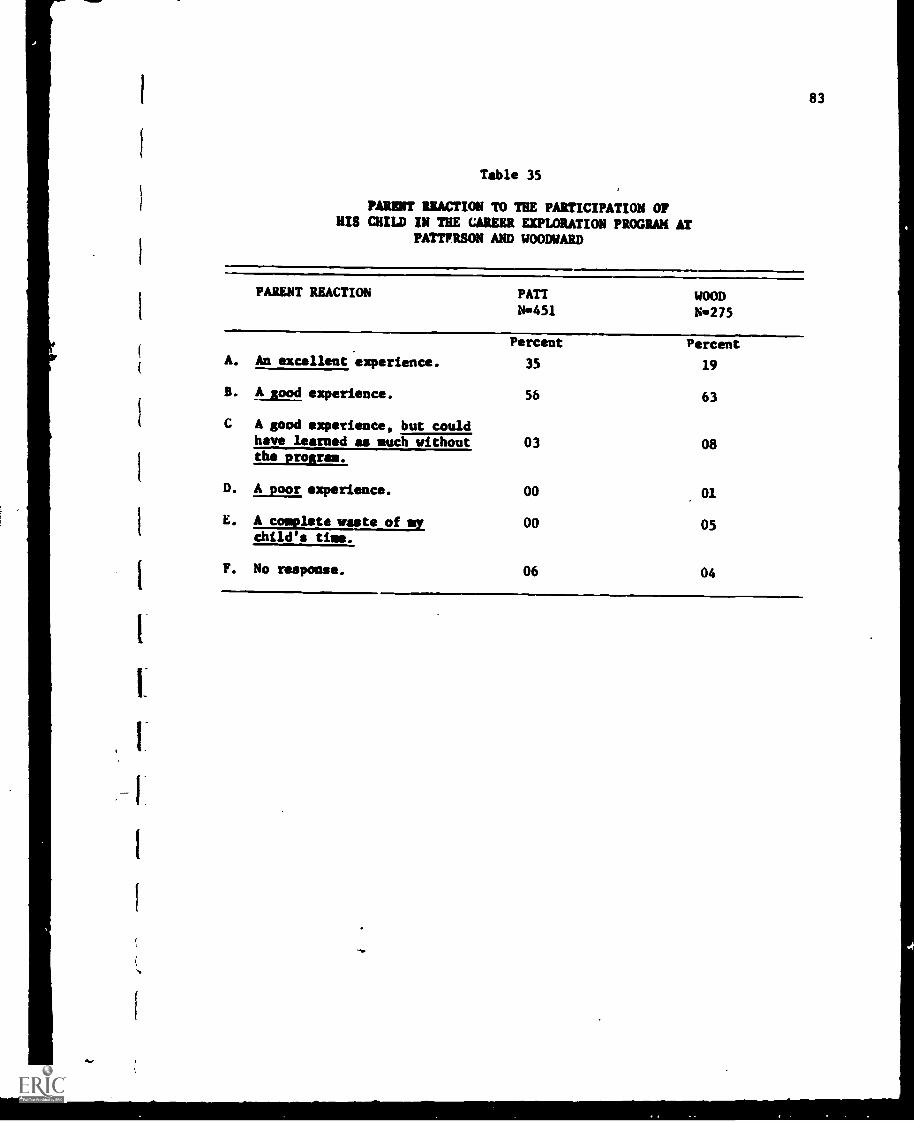
Table 35
PARENT REACTION TO THE PARTICIPATION OFHIS CHILD IN THE CAREER EXPLORATION PROGRAM AT
PATTPRSON AND WOODWARD
PARENT REACTION PATTN451
WOODN275
Percent PercentA. An excellent experience. 35 19
B. A good experience. 56 63
C A good experience, but couldhave learned as such without 03 08the program.
D. A poor experience. 00 01
E. Acietesteof sy 00 05child's time.
F. No response. 06 04
83
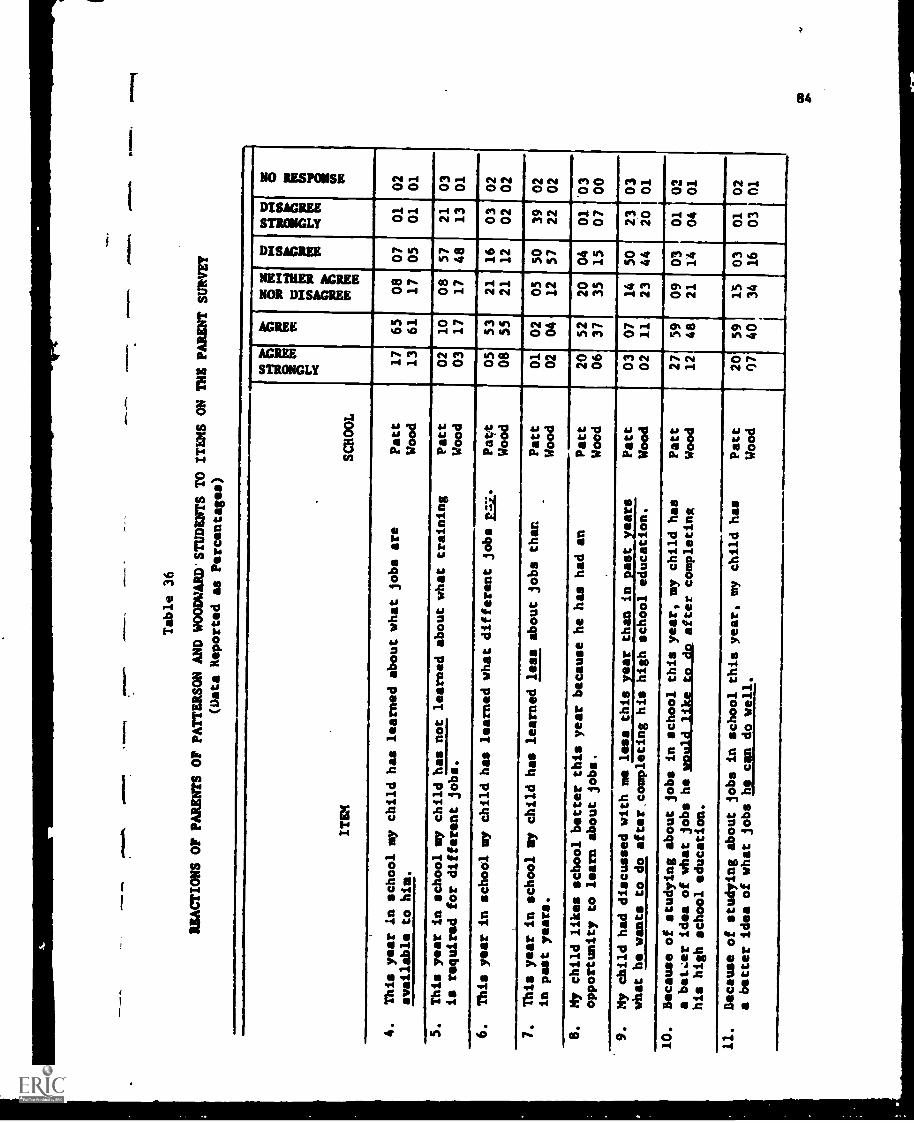
Table 36
REACTIONS OF PARENTS OF PATTERSON AND WOOMARD'STUDENTS
TO 'TIM ON THE PARENT SURVEY
(Data Reported as Percentages)
r. . PS
1-4
CA
ok
2 t. .4
CS
rat
I caITEM
SCHOOL
1IS
3
4.
This year In school my child has learned about what jobs
are
Patt
17
65
08
07
01
02
available to him.
Wood
13
61
17
05
01
01
5.
This year in school my child has not learned about what
training
Patt
02
10
08
57
21
03
is required for different jobs.
Wood
03
17
17
48
13
01
6.
This year in school my child has learned what
different jobs 2..21.
Patt
05
53
21
16
03
02
Wood
08
55
21
12
02
02
7.
This year in school my child has learned less
about jobs than.
Patt
01
02
05
50
39
02
.in past years.
Wood
02
04
12
57
22
02
8.
My child likes school better this year because hehas had an
Patt
20
52
20
04
01
03
opportunity to learn about jobs.
Wood
06
37
35
15
07
00
9.
My child had discussed with me less this
year than in past
year
sPatt
03
07
14
50
23
03
what he wants to do after, completing his highschool education.
Wood
02
11
23
44
201 01
10.
Because of studying about jobs in school thisyear, my child has
Patt
27
59
09
03
01
02
a better idea of what jobs he would like to do after completing
Wood
his high school education.
12
48
21
14
04
01
11.
Because of studying about jobs in school thisyear, my child has
Patt
20
59
15
03
01
02
a better idea of what jobs he can do well.
Wood
07
40
34
16
03
Al
ff

1 85
Item 12 of the Parent Survey Solicited "comments" from parents con-cerning the Career Exploration Program. Although not all parent statementspertained to the CEP, the following were considered by the investigators tobe representative of the comments made by the parents about the program.
Comments from Patterson Parents Regarding the CEP.
- "We have received no information about the Career Exploration Program."
-"My child has learned about future jobs from her pre-vocational courses butto her knowledge and nine, she has not participated in any Career ExplorationProgram."
- "I feel that this program is a very good idea; it gives the student achance to study different jobs so that asy can decide what they wouldlike to do before they get ready to graduate."
-"I think this Exploration Program is a very important par: of my child'seducation. All schools should participate in this type of program."
- "The program sounds very good and should prove helpful to a student indeciding on a career."
- "I believe this program is very helpful to students who are undecided aboutwhat vocation they would like to follow. I think it should be continuedand expanded in a way to prepare students for actual employment conditionsand experiences."
- "I strongly agree that this program is beautiful, and I do hope that thechildren are placed with all fairness on the job that they are qualified for."
- "I feel that this survey should be filled out by my child because she knowsbetter what she has learned than I do. We talk about her progress, but nother job choice."
- "My son seem to know nothing about this new program."
-"I would recommend this program to any student who wants to know more aboutcareers."
- "Keep parents better informed through seminars."
-"...liked trying different programs; ...liked doing actual work."
- "Enough is not being done to show the student, what jobs available are reallylike."
- "Never heard of CEP."
- "Foe & child to know about a job, he must have the opportunity to work firsthand, on the job, and with people. How can we as parents learn more aboutthis program ?"
86
Comments from Woodward Parents ReRardinR the CEP.
- "Never heard of the program."
-"More information should be given concerning the courses that are neededfor a specific occupation."
- "Good program. Gives opportunity for different fields."
-"I feel that this program should be voluntary for students who wish toparticipate. My daughter gained very little from it because she is quitesure what her profession is going to be and nothing of what she haslearned through this program will be of value to her."
-"Gives students a better idea of what they would like to do and what isbest for them."
-"Program not extensive enough. Bored with the classroom portion."
- "Visit more places."
- "Waste of time."
- "Good program and continue."
- "More information would be helpful to parents."
-"Better planning would help."
- "Boring and dull to my daughter."
- "There was too such time wasted between speakers."
- "Too long to just sit and listen."
-"Start with the 7th-8th grades."
The preceding statements tend to support the data obtained from theobjective portion of the Parent Survey. In general, the Patterson parentswere more positive toward the concept and results of the CEP.
Discussion
The percentage of returns of the Parent Survey from the parents ofstudents in the proves@ were low; 50 percent for Patterson and 31 percentfor Woodward. Realizing the limitation of such a small return, the investi-gators suggest caution in generalizing from the findings. The investigatorsbelieve, however, that the results of the Parent Survey do provide someindication of parent reactions to the Career Exploration Program and itseffect upon the children of those who responded.
When considering the parent responses concerning the amount of knowledgethey reported having about the CEP and the source of this knowledge, one

87
must question the communications effort of the schools in regard totheir programs. The fact that fewer than 1U percent of the parents statedthat they know "a lot" was made more alarming by the comments in item 12.Several parents at both schools claimed that neither they nor their childknew of the Career Exploration Program. Theflit-dings of the Survey suggestthat the only contact that most parents had with the programs at eitherschool was through their child. Only 3 percent of the Patterson parentsand 2 percent of the Woodward parents stated that they had learned muchabout the CEP from someone at school. It seems that for a program ofthis type to be successful, parents should be informed and involved.
The parents' reactions to having their child participate in theCEP tended to be positive. This is surprising when one considers thatthe majority of the parents were not very familiar with the programs. Itappears that the parents were implying by their responses to the Surveythat, "even though we do not know what it is all about, it seems that theschool is trying to do something positive in preparing my child for life".Granted, not all parents felt this way, but in general, this seemed tobe the mood.
Patterson parents tended to be more positive than Woodward parentsfn regard to the effect of the CEP on their child's attitude towardschool, learning opportunities and other benefits resulting from theprogram. A majority of the Patterson parents answered items 4 through11 in a positive manner. A majority of Woodward parents were positiveon all but items 8 and 11. These two items were concerned with thechild liking school better because of the opportunity to learn aboutjobs, and that the child having a better idea of what job he could dowell.
In conclusion, the parents of the Patterson and Woodward studentsenrolled in the Career Exploration Program expressed attitudes towardthe programs that were basically positive. Examination of the findingsand the personal comments made by the parents, however, caused theinvestigators to question many of the results because of the parents'reported lack of knowledge about the programs. It appeared that manyof the parents who took the time to respond to the Parent Survey answeredthe questions on the basis of the information provided in the openingparagraph of the Survey or on the basis of some information provided bytheir child. Because of this apparent lack in depth information of theprograms, the investigators must caution against any generalisation of thefindings. The findings definitely indicate the need for greater parent-school communication regarding the purpose and goals of the CareerExploration Program.

CHAPTER VI
CONCLUSIONS
In writing conclusions for a study such as this, conclusions mustbe drawn from the available data. This will be done here. However,as with most studies, the investigators recognize SOW: weaknesses inthe study that should be kept in mind when interpreting the data.
First, no attempt was made to relate change in particular studentswith the specific activities that they participated in. For example,there was no differentiation made in the analysis of change in theOVIS scale scores between students who had exploratory experiences inmachine work versus those who did not.
Second, no attempt was made to identify students with specificweaknesses to see if the program helped them to strengthen an aria ofneed. For example, students with low self-esteem in the fall werenot labeled and studied separately to see if the program helped themovercome this area of weakness.
Third, it may often be fallacious to say a pro rem has had noeffect based upon pre and post test analysis of gro p data. In reality,what may have happened is that the program has had an effect upon allstudents, but the positive effects upon some students and the negativeeffects upon others cancel each other. Without closer study ofindividual students through test data, interviews and case studies,this weakness will remain in future evaluation.
It is important for the reader to keep these limitations in mindwhen interpreting the conclusions that follow.
Interests
(1) In general, the Career Exploration Program had very littleeffect upon the general areas of student iuterest as expressed as changein scale score on the OVIS. There were very few differences betweencontrol and experimental schools in this respect. When experimentalschools were compared with each other; however, there were no differencesbetween Patterson and Woodward at the ninth grade level. At the tenthgrade level Patterson students changed on slightly more scales thanWoodward students. While little change was noted when students-An thesame grade level from any of the schools were compared, there were manymore changes when students in the same school were compared by era&level. Ninth grade students had a tendency to change scale scores agreat deal mot* on the OVIS than tenth grade students at both ' Woodwardand Patterson.
88

The fact that there were few differences between control andexperimental schools indicates that the Career Exploration Programhad little impact upon changing the general areas of interest ofthese students involved in the Career Exploration Program. Since.the Career Exploration Program at Patterson was an in-depth study offour career areas at the ninth grade level and one area at the tenthgrade level, one can understand why the interests of Patterson stu-dents changed little as a result of the program-i.e. they had littleexposure in school-to new career areas-that was not the purpose of theCareer Exploration Program. It would have been helpful to have identi-fied the occupational areas each youngster studied and to see if therewas significant change in interests in the area studied. This was aweakness in the research design which should be corrected in futureevaluations.
At Woodward, where the program the first year served as more ofan "orientation" program than as one for "in-depth" study of relativelyfew occupations, one might have expected greater change in generalareas of interest than at Patterson. One possible explanation of whythis change did not occur is that the exposure of Woodward students tonew career areas was so brief in any one career area that students mayhave had only an opportunity to become "curious", but not truly inter-ested. Interests do not just "happen"-they must be developed. Inaddition, in tha Woodward program. students had only a one week exposureeach semester. This may have had the effect of having students feelas if they were "starting all over again" each time with the priorexposure forgotten.
The fact that grade level, rather than school program seemed mostimportant in determining the propensity to change interests confirmsthe idea that the formation and stability of interests is "age-related".Our evidence on this potnt would be stronger if we had also comparedthe ninth and tenth grade in the control schools to see if greaterchange also took place at the ninth grade in the control schools. Basedupon the evidence which we have, however, two explanations seem mostfeasible. First, as previously stated, it may be that stability ofinterests is developmental and that interests do not stabilize priorto a certain age nor change much after that point in a person's liferegardless of the exposure which the person had to the world of work.An alternative explanation may be that the ninth grade programs inboth Patterson and Woodward tended to provide students with much greaterbreadth of exposure than the tenth grade programs, thus causing greaterchange at the ninest grade level. We know this to be true of the Pattersonprogram, but we are unaware of any differences in the experiences ofninth and tenth firade students at Woodward. A program in which studentshad depth of exposure in several areas both in the ninth and tenth gradewould have to be evaluated to determine if student interest patternscaa be appreciably modified by school programs after grade nine. Finally,identifying the specific careers studied with specific changes in interestarea is needed to test the true impact of the CEP upon the nature ofstudent interests.
89
90
(2) The student's consistency in stating a like or dislike for allactivities related to a particular career area as expressed by the scaleclarity score on the OVIS was unrelated to grade level. When schoolswere compared, there was little, if any, significant difference betweenWoodward and the control school. On the other hand, the scale clarityscores of Patterson students in both grades 9 and 10 tended to changeless from fall to spring than those of students in the other two schools.However, the number of students from Patterson at bo' grape levels whohad "I" (inconsistent) scale clarity scores in the sp ag was significantlygreater than either Woodward or Waite.
The fact that there tended to be less change in the consistency ofa student's expressed liking or disliking for occupations related to aparticular career area by Patterson students indicates that Pattersonstudents may have had a pretty good idea of what was involved in variouscareers at the beginning of the program and thus changed little. Themost interesting finding to the investigators is the final findingrelating to scale clarity scores-i.e. that when Patterson student'sscale clarity scores did change, there was a slight tendency for themto become more "inconsistent". Initially, one might interpret thisas a negative finding, but we feel the contrary is true. To be "in-consistent" in liking or disliking activities relating to a particularcareer can indicate an in-depth knowledge of a career to the point thatone can clearly differentiate between desirable and undesirable activitiesassociated with the career. To like or dislike all Ictivities associatedwith an occupation to the same degree may indicate a real lack of know-ledge of what many of the activities related to a particular job entail.It is rare that a person actually working at a particular job likes ordislikes all activities associated with his job to the same degree. Itis more common for persons to strongly prefer some activities over others.Thus, the investigators believe that this improved ability on the part ofPatterson students in the spring to differentiate between liked and dis-liked activities associated with occupational areas indicated one measureof success for the Patterson program.
(3) In the area of consistency of expressed interests and of rankof i%ventoried interests. Patterson tenth graders were more consistentfrom fall to spring than_Patterson ninth grade students and Waite tenthgrade students in every instance. In addition, Patterson tenth gradestudents were also more consistent from fall to spring than Woodwardtenth grade students in the rank of their inventoried interests. SincePatterson tenth graders had had an in-depth exposure to four careerareas as ninth graders and were currently working in a career area forthe whole year which was selected on the basis of this ninth grade ex-perience, it is not surprising that they were most consistent. They hadhad the least stimulation to change. It is interesting to note thechange in Patterson ninth grade students compared to Patterson tenthgrade students. This change shows that the Career Exploration Programin the ninth grade is having the desired effect of allowing studentsto test themselves against the training and work requirements of severalcareer areas and to modify their vocational plans accordingly. Thatthis ninth grade experience leads to more satisfaction as tenth gradersis shown by the fact that the Patterson tenth graders had had such anexploratory experience as ninth graders and were the most stable group

91
as tenth graders. On the other hand, if continued stimulation to re-examine interest during the sophomore year and to modify them accordinglywas a goal of the CEP the Patterson tenth grade program was ineffectiveand the Patterson ninth grade program was more effective than the tenthgrade program. There was no evidence, however, to suggest that theWoodward program at either the ninth or tenth grade level was any moreeffective than the control school in helping students change interestsas a result of new experiences during the year. It would be interestingto know whether or not this stability on the part of Patterson tenthgraders would have happened if, instead of studying one area as tenthgraders, they had had "hands-on" experiences in four different areasagain as sophomores.
(4) The inventoried rank of the first choice expressed interestof Patterson tenth grade students changed more in the desired directionthan Patterson ninth grade and Woodward tenth grade students. Theassumption was made that a student in the Career Exploration Programshould learn to associate his first choice expressed interest withthe activities demanded in it, and that this wculd be reflected by agreater consistency between that career area expressed as first choiceand the relative rank of that career area among all those for which herated the related activities. Again the Patterson tenth grade studentsdemonstrated some superiority, but they did not significantly exceed thecontrol school. They did, however, do significantly better than thePatterson ninth grade and Woodward tenth grade students. Since theyfailed to do better Caen the control school, one must question whetherthe differences which did appear in this area can be attributed to thePatterson tenth grade Career Exploration Program.
Career Plans Survey
(1) In general, Patterson students felt better informed to makea care, .r choice than students from the other schools. This finding isunderstandable, since the Patterson students were getting actual experiencein-training in a career area of their choice. It is interesting to notethat Patterson students did not unanimously choose "hands-on" experienceas being most helpful to them in making a career choice. Instead, "fieldtrips" were rated as being most helpful by the highest percentage of ninthgrade Patterson students, while "hands-on" experience was the secondmost popular choice. Patterson tenth grade students chose "hands-on"experience over "field trips" by a very narrow margin. These findingssuggest that "field trips" may be a viable alternative to "hands-on"experiences when the desired "hands-on" experiences are not feasible.No Woodward or Waite student had the opportUnity for the vocational train-ing or the "hands-on" experience. In addition, Patterson students choseto attend Patterson because of their interest in the vocational coursesavailable there. One could logically expect, therefore, that the Pattersonstudants would feel better infotaed than Woodward or Waite students aftera year of studying about careers that were of interest to them.
(2) Woodward and Waite students tended to be more oriented towardtaking the were. curriculum in grades 11 and 12, while Patterson studentstended more toward taking the vocational program in grades 11 and 12.

92
Again, since Patterson students had already committed themselves to
vocational education and had been admitted to a vocational high school,this result is not surprising. It was surprising, however, that 25percent of the Patterson students said they planned to take a collegepreparatory course in grades 11 and 12. Students at Woodward and Waitewere possibly responding to the Career Plans Survey in the directionof the curriculum that was available to then in their present school.Therefore, the general curriculum was probably selected because itoffered the most flexibility to the students in the general high school.
(3) There was no significant change from fall to spring withinor between groups relating to post-high school educational and vocationalplans. College was the most popular post-high school choice for allgroups in the fall and the spring. This finding was particularlysurprising when one considers that a much smaller percentage of studentsfrom the three schools declared that a college degree was necessaryto get along well in the world. From the findings, it appears thatthe Career Exploration Program had no observable effect on the post -
high school educational and vocational plans of the students.
(4) Patterson students were more positive in their attitudetoward school and more definite in their plans to graduate from highschool than were students from Woodward and Waite. All groups, however,tended to have a less positive attitude toward school in the springwhen compared to the fall. These findings suggest that students fromPatterson were more satisfied with the education they were receivingand, perhaps, could see how it would be of benefit following graduation.The investigators question, however, whether the difference was duesolely to the Career Exploration Program at Patterson, or whether itwas also influenced by the fact that the Patterson students had chosento attend Patterson and were receiving vocational training as aregular part of the curriculum.
(5) Patterson students had given the matter of occupational choicemore thought and felt their minds were made up as to career choice morefrequently than the students from Woodward or Waite. This finding supportsthe finding obtained on ,the OVIS. Once again, any change in the Pattersontenth grade students might be more accurately attributed to vocationalskill training since "exploration" was limited to one area.
(6) In specific instances on the Career Plans Survey, Woodwardstudents demonstrated changes significantly greater than the comparablecontrol school group. However. here was no definitive pattern ofdifferences in any area. Thus, one must conclude that the Woodwardprogram lacked impact beyond that of traditional "Career Day" or"orientation" type programs. It is also possible, however, that specificprogram activities did have significant positive impact upon specificindividuals. Such effects may have gone undetected in an evaluationsuch as this.
Self Concept
(1) There were only two significant differences on any of the ninescales of the Tennessee Self-Concept Scale examined, one in favor ofa tenth grade experimental school and one in favor of the tenth grade
93
control school. It is obvious that the Career Exploration Program madeno significant impact upon the "global self-concept" of the participants.If the Career Exploration Program or the type of school were to have asignificant impact upon the majority of students in a particular school.it would have been most logical to have detected such a change at theninth grade level since students at all three schools would be experiencingtheir first year in that school, and in the experimental schools, theirintroduction to the Career Exploration Program. There were no significantchanges in any of the areas of self-concept as measured on the Tennesseefor ninth grade students, thus one must conclude that neither the CareerExploration Program nor type of high school attended effected students'"global self-concept".
(2) When students were quizzed about their self-concept as itspecifically related to the world of work, there were significant differ-ences between groups. Patterson stud-nts developed a more positiveattitude toward their abilities and chances for getting ahead in theoccupation of their choice than did students at Waite and Woodward. SincePatterson students had adequate opportunities to test their skills withthose demanded of the job, or at least job creining, they were able todevelop self-confidence that they would be able to do well on the job.Since Woodward students did not have opportunities for "hands-on"experiences to actually compare their abilities with training and jobdemands, there was little opportunity for these students to develop con-fidence in their abilities and chances for getting ahead in the job oftheir choice.
These findings that Patterson students' concept of "self-as-a-worker"improved as a result of the Career Exploration Program definitely lendscredence to the value of the concept of giving students "reality testing"experiences. Unfortunately, it is much more difficult to provide suchexperiences in a general high school where the breadth of career areasin which such experiences are desired is so much greater than in a vocationalhigh school. The implementation of such a program which can meet thegreat variety of needs of the student body in a general high school remainsas one of the major unmet challenges of the Career Exploration Concept.
Parent Survey
(1) Few parents responding believed that they had "a lot" of infor-mation about the Career Exploration Program. In spite of not knowing muchabout the Career Exploration Program specifically, an overwhelming majorityof parents responding to the survey in both schools believed that studyingabout jobs was a good or excellent experience for their child.
(2) In general, Patterson parents who responded were more favorabletoward the Career Exploration Program and the effect it had on theirchildren than Woodward parents. The two schools apparently made littleattempt to inform parents about the program. It is not surprising, there-fore, that the parents stated that they knew little about the programs.In addition, since the Patterson Career Exploration Program was almostidentical to the unnamed program in effect the previous year at the school,studen** had little reason to identify it as a new program and discussit with parents.
One could expect the Patterson parents to be more favorable towardthe program since they usually had to give their expressed approval fortheir children to attend Patterson. An awareness on the part of theparent of the need of vocational education for their child sight pre-suppose an awareness of the need for career education as veil.
94
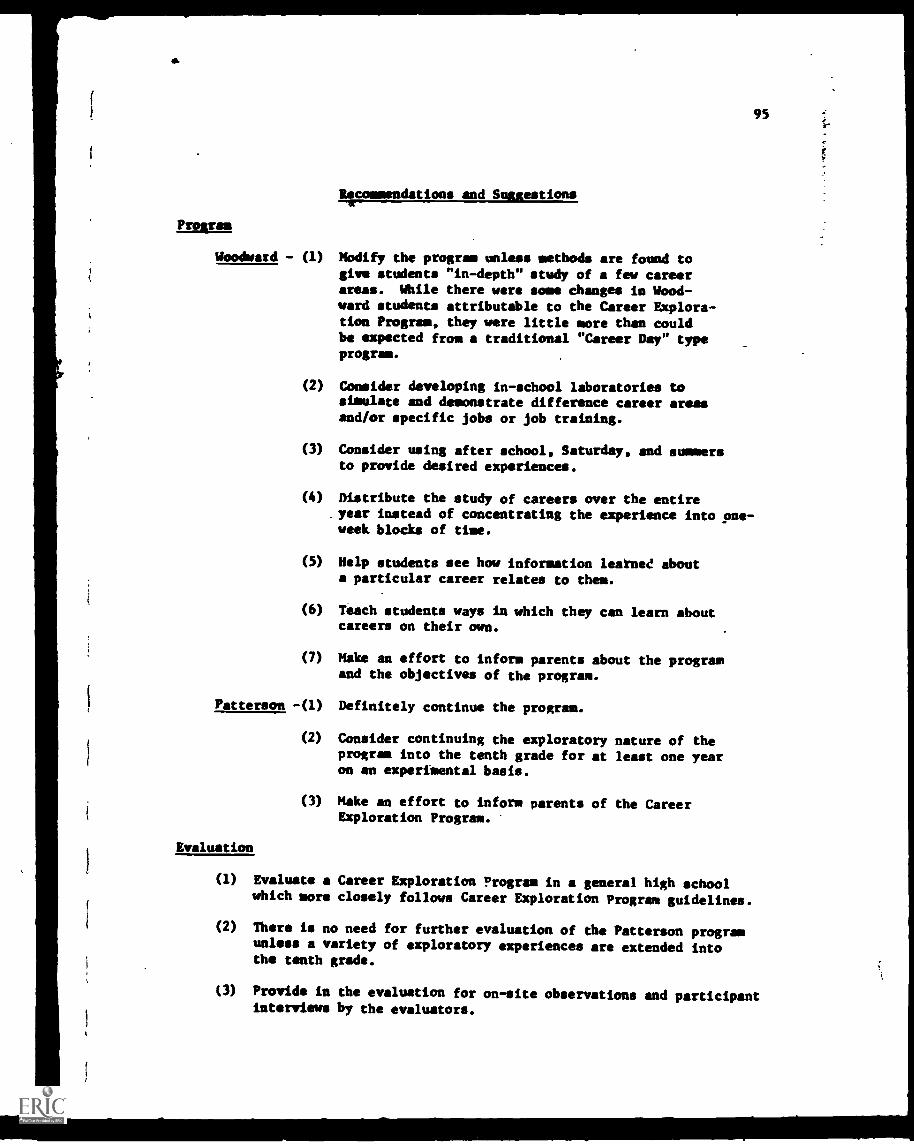
4.
95
Recommendations and Summations
Prelims
Woodward - (1) Modify the program unless methods are found togive students "in-depth" study of a few careerareas. While there were some changes in Wood-ward students attributable to the Career Explora-tion Program, they were little more than couldbe expected from a traditional "Career Day" typeprogram.
(2) Consider developing in-school laboratories tosimulate and demonstrate difference career areasand/or specific jobs or job training.
(3) Consider using after school, Saturday, and summersto provide desired experiences.
(4) Distribute the study of careers over the entireyear instead of concentrating the experience into one-week blocks of time.
(5) Help students see how information learner abouta particular career relates to them.
(6) Teach students ways in which they can learn aboutcareers on their own.
(7) Make an effort to inform parents about the programand the objectives of the program.
Patterson -(1) Definitely continue the program.
(2) Consider continuing the exploratory nature of theprogram into the tenth grade for at least one yearon an experimental basis.
(3)
Evaluation
Make an effort to inform parents of the CareerExploration Program.
(1) Evaluate a Career Exploration Program in a general high schoolwhich more closely follows Career Exploration Program guidelines.
(2) There is no need for further evaluation of the Patterson programunless a variety of exploratory experiences are extended intothe tenth grade.
(3) Provide in the evaluation for on-site observations and participantinterviews by the evaluators.
96
(4) Seduce the amount of testing for evaluation.
(5) Use short-term change as well as long-term pains to determinesuccess of the program.
(6) Identify students with particular weaknesses such as self-concept, then evaluate the program's success in helping justthose students in their area of weakness.
(7) Develop behavioral objectives for a Career Exploration Programprior to starting the program.
(8) Consider studying fewer students in greater depth so that specificactivities can be related to specific results.
(9) Consider involving the evaluators in the program planning so thatevaluation can be more closely aligned with program activities, etc.
(10) Have a person on-site keep an accurate diary of effects of programon particular individuals and of problems and successes in programimplementation.
(11) Ask students to rate the program.

(
1
APPENDIX

APPENDIX A
A COMPARISON OF THE PERCENTAGE OF STUDENTS WHOSE SCALECLARITY SCORES WENT UP, STAYED THE SAME, OR WENT DOWN IN
EACH GROUP FROM FALL TO SPRING
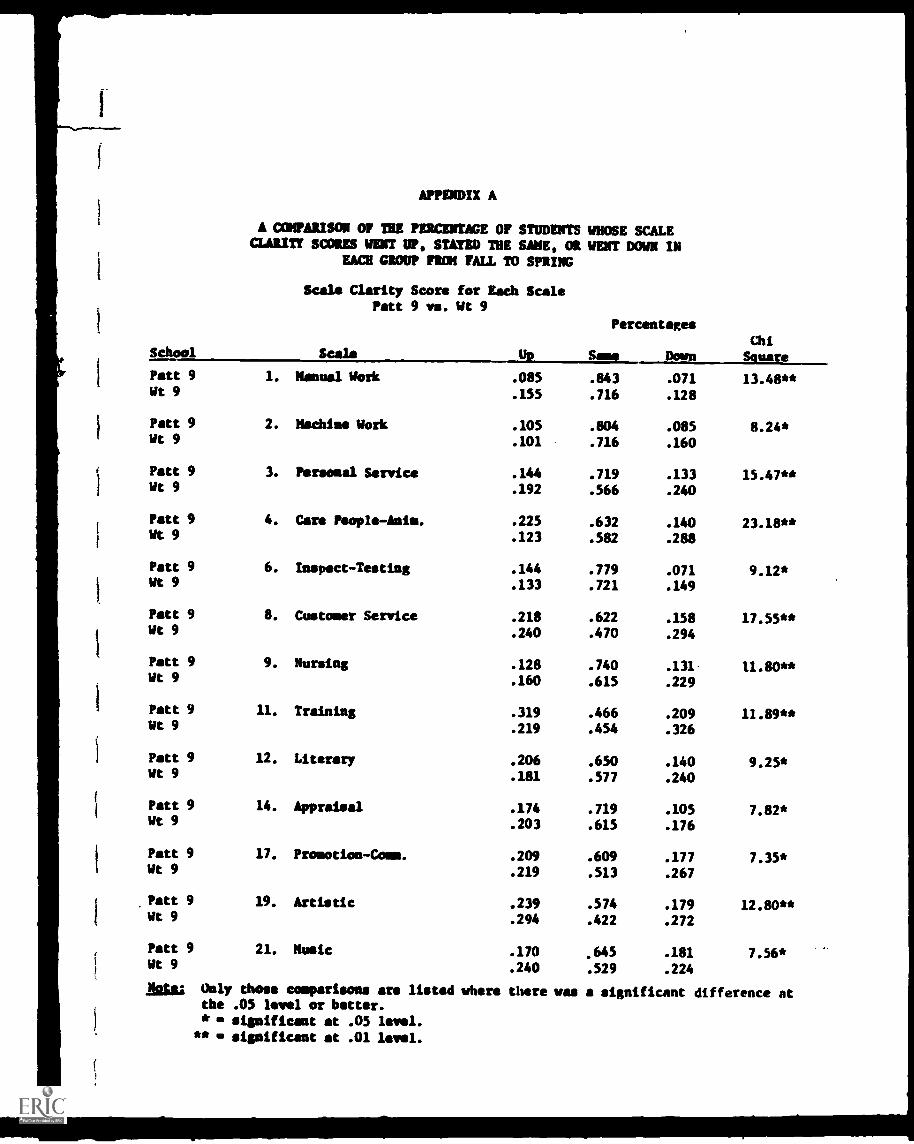
APPENDIX A
A COMPARISON OP THE nRairrAcz OP STUDENTS WHOSE SCALECLARITY SCORES WENT UP, STATED THE SAME, OR WENT DOWN IN
EACH GROUP FROM FALL TO SPRING
School
Scale Clarity Score for Each ScalePatt 9 vs. Wt 9
Scala Up
Percentages
Same DownChiSquare
Patt 9 1. Manual Work .085 .843 .071 13.48**Wt 9 .155 .716 .128
Patt 9 2. Machine Work .105 .804 .085 8.24*Wt 9 .101 .716 .160
Patt 9 3. Personal Service .144 .719 .133 15.47**Wt 9 .192 .566 .240
Patt 9 4. Care People-Anin. .225 .632 .140 23.18**Wt 9 .123 .582 .288
Patt 9 6. Inspect-Testing .144 .779 .071 9.12*Wt 9 .133 .721 .149
Patt 9 8. Customer Service .218 .622 .158 17.55**Wt 9 .240 .470 .294
Patt 9 9. Nursing .128 .740 .131- 11.80**Wt 9 .160 .615 .229
Patt 9 11. Training .319 .466 .209 11.89**Wt 9 .219 .454 .326
Patt 9 12. Literary .206 .650 .140 9.25*Wt 9 .181 .577 .240
Patt 9 14. Appraisal .174 .719 .105 7.82*Wt 9 .203 .615 .176
Patt 9 17. Promotion-Coma. .209 .609 .177 7.35*Wt 9 .219 .513 .267
Patt 9 19. Artistic .239 .574 .179 12.80**Wt 9 .294 .422 .272
Patt 9 21. Music .170 .645 .181 7.56*Wt 9 .240 .529 .224
Migl Only those comparisons are listed where there was a significant difference atthe .05 level or batter.*gm significant at .05 level.
** significant at .01 level.

APPENDIX A
Scale Clarity Score for Each ScalePatt 9 vs. Wt 9(continued)
School Scale UO
Percentages
Same DownChi
SquarePatt 9 23. Teach -Coun.-Soc. W. .250 .572 .177 6.14*Vt 9 .235 .497 .262
Patt 9 24. Medical .135 .731 .133 6.31*Wt 9 .144 .641 .208
Scale ClarityPatt 10 vs. Wt 10
Patt 10 1. Manual Work .086 .855 .058 7.92*Wt 10 .111 .779 .108
Patt 10 2. Machine Work .099 .834 .058 6.46*Vt 10 .077 .816 .108
Patt 10 3. Personal Service .151 .752 .092 21.46**Vt 10 .203 .606 .193
Patt 10 4. Care People-Anim. .201 .621 .174 9.10*Wt 10 .179 .552 .267
Patt 10 5. Clerical Work .188 .673 .136 7.44*Wt 10 .210 .586 .203
Patt 10 6. Inspect-Testing .072 .868 .056 36.99**Wt 10 .186 .691 .128
Patt 10 8. Customer Service .174 .689 .133 18.53**Wt 10 .169 .572 .267
Patt 10 9. Nursing .158 .723 .113 12.45**Wt 10 .193 .616 .196
Patt 10 15. Agriculture .142 .762 .086 16.45**Wt 10 .186 .644 .172
Patt 10 24. Medical .136 .750 .111 8.32*Wt 10 .186 .6S4 .159
* significant at .05 level.** significant at .01 level.

APPENDIX A
(continued)
Scale ClarityWood 9 vs. Wt 9
School Scale Up
Percentages
Same DownChi
Square
Wood 9 4. Care People-Amin. 237 .540 .224 10.78**Wt 9 .123 .582 .288
Wood 9 15. Agriculture .131 .656 .214 7.19*Wt 9 .085 .764 .149
Wood 9 24. Medical .237 .594 .167 6.92*Wt 9 .144 .641 .208
Scale ClarityWood 10 vs. Wt 10
Wood 10 2. Machine Work .118 .732 .148 5.98*Wt 10 .077 .816 .108
Wood 10 15. Agriculture .130 .7'5 .139 6.18*Wt 10 .186 .644 .172
Scale ClarityPatt 9 vs. Wood 9
Patt 9 1. Mammal Work .085 .843 .071 26.75**Wood 9 .175 .692 .131
Patt 9 3. Personal Service .144 .719 .133 12.97**Wood 9 .178 .609 .214
Patt 9 4. Care People -Mis. .225 .632 .140 11.04**Wood 9 .237 .540 .224
Patt 9 5. Clerical Work .190 .641 .165 6.73*Wood 9 .240 .555 .206
Patt 9 6. Inspect-Testing .144 .779 .071 11.51**Wood 9 .144 .715 .144
Patt 9 8. Customer Service .218 .622 .158 12.94**Wood 9 .191 .550 .260
Patt 9 9. Nursing .128 .740 .131 14.84**Wood 9 .160 .622 .219
* significant at .05 level** significant at .01 level.

4
APPENDIX A
Scale ClarityPr .:ood 9
th,.ed)
Schocl Scale Up
Percentages
Same DownChi
SquarePatt 9 10. Skilled Per. Serv. .218 .634 .147 8.84*Wood 9
.250 .540 .211
Patt 9 11. Training .319 .466 .209 14.76**Wood 9.206 .511 .279
Patt 9 12. Literary .206 .650 .140 16.49**Wood 9.253 .519 .227
Patt 9 14. Appraisal .174 .719 .105 10.39**Wood 9.204 .625 .173
Patt 9 15. Agriculture .110 .774 .114 17.31**Wood 9.131 .656 .214
Patt 9 17. Promotion- Corsi. .209 .609 .177 6.81*Wood 9.242 .527 .235
Patt 9 18. Management .195 .657 .147 7.03*Wood 9.237 .563 .191
Patt 9 23. Teach-Coun.-Soc. W. .250 .572 .177 7.25*Wood 9.232 .511 .253
Patt 9 24. Medical .135 .731 .133 19.00**Wood 9.237 .i94 .167
Scale ClarityPatt 10 vs. Wood 10
Patt 10 1. Manual Work .086 .855 .058 17.13**Wood 10.154 .735 .109
Patt 10 2. Machin' work .099 .834 .058 18.73**Wood 10.118 .732 .148
Patt 10 3. Personal Service .151 .752 .092 16.88**Wood 10.210 .626 .169
Patt 10 6. Inspect- Testi:tg .072 .868 .056 39.03**Wood 10.148 .691 .163
* 0 significant at .05 level.** significant at .01 level.

APPENDIX A
Scale ClarityPatt 10 vs. Wood 10
(continued)
School Scale Up
Percentages
Same DownChi
Square
Patt 10 7. Crafts .154 .741 .102 6.16*Wood 10 .175 .667 .154
Patt 10 8. Customer Service .174 .689 .133 7.21*Wood 10 .195 .611 .195
Patt 10 9. Nursing .158 .725 .113 17.99**Wood 10 .180 .605 .219
Patt 10 24. Medical .136 .750 .111 21.46**Wood 10 .172 .608 .219
Scale ClarityPatt 9 vs. Patt 10
Patt 9 6. Inspect-Testing .144 .779 .071 13.38**Patt 10 .072 .868 .056
Patt 9 18. Management .195 .657 .147 6.50*Patt 10 .235 .511 .188
Scale ClarityWood 9 vs. Wood 10
Wood 9 13. Numerical .240 .594 .170 7.31*Wood 10 .169 .685 .148
Wood 9 15. Agriculture .131 .656 .214 7.29*Wood 10 .130 .735 .139
Wood 9 24. Medical .237 .594 .167 6.30*Wood 10 .172 .608 .219
* significant at .05 level** significant at .01 level

4.1
APPENDIX B
A COMPARISON OF THE PERCENTAGE OF STUDENTS IN EACH LONGITUDINAL GROUPWHO HAD SCALE CLARITY SCORES OF H, F, OR I IN THE FALL VERSUS SPRING
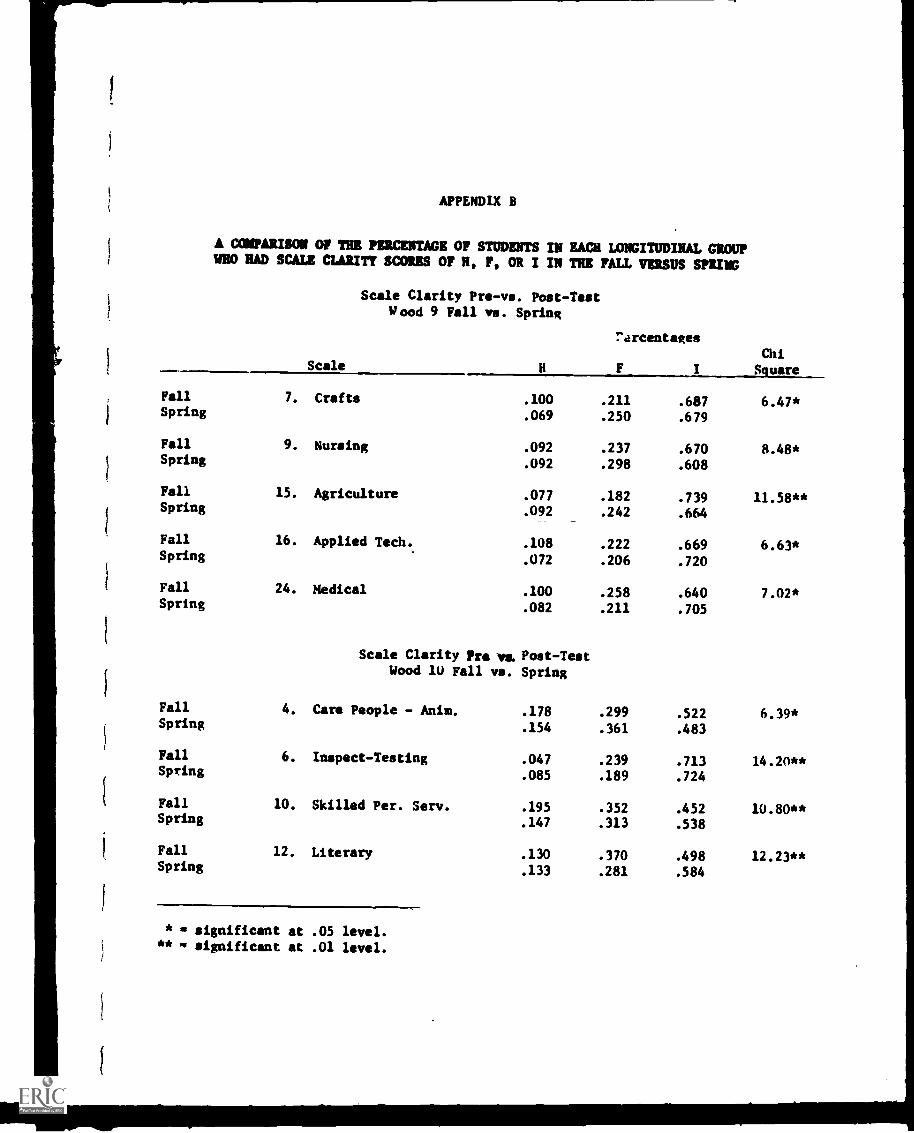
APPENDIX B
A COMPARISON OF THE PERCENTAGE OF STUDENTS IN EACH LONGITUDINAL GROUPWHO HAD SCALE CLARITY SCORES OF N, F, OR I IN THE FALL VERSUS SPRING
Scale Clarity Pre-vs. Post-TestWood 9 Fall vs. Spring
Scale H
rarcentages
F I
Chi
Square
Fall 7. Crafts .100 .211 .687 6.47*Spring .069 .250 .679
Fall 9. Nursing .092 .237 .670 8.48*Spring .092 .298 .608
Fall 15. Agriculture .077 .182 .739 11.58**Spring .092 .242 .664
Fall 16. Applied Tech. .108 .222 .669 6.63*Spring .072 .206 .720
Fall 24. Medical .100 .258 .640 7.02*Spring .082 .211 .705
Scale Clarity pre Post-TestWood 1U Fall vs. Spring
Fall 4. Cara People - Anim. .178 .299 .522 6.39*Spring .154 .361 .483
Fall 6. Inspect-Testing .047 .239 .713 14.20**Spring .085 .189 .724
Fall 10. Skilled Per. Serv. .195 .352 .452 10.80**Spring .147 .313 .538
Fall 12. Literary .130 .370 .498 12.23**Spring .133 .281 .584
* significant at .05 level.** m significant at .01 level.
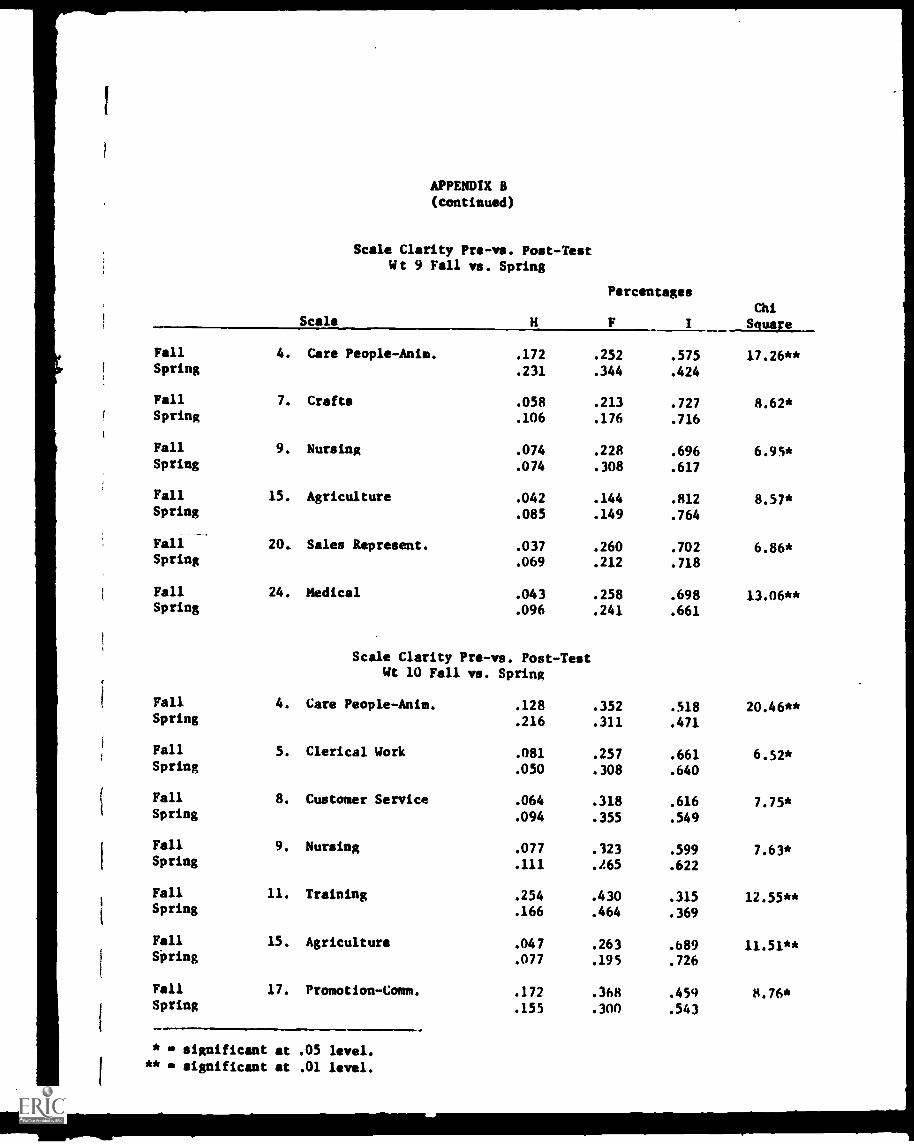
APPENDIX 8(continued)
Scale Clarity Pre-vs. Post-TestWt 9 Fall vs. Spring
Scale H
Percentages
F I
Chi
Square
Fall 4. Care People-Anim. .172 .252 .575 17.26**Spring .231 .344 .424
Fall 7. Crafts .058 .213 .727 8.62*Spring .106 .176 .716
Fall 9. Nursing .074 .228 .696 6.95*Spring .074 .308 .617
Fall 15. Agriculture .042 .144 .812 8.57*Spring .085 .149 .764
Fall 20. Sales Represent. .037 .260 .702 6.86*Spring .069 .212 .718
Fall 24. Medical .043 .258 .698 13.06**Spring .096 .241 .661
Scale Clarity Pre-vs. Post-TestWt 10 Fall vs. Spring
Fall 4. Care People-Anis. .128 .352 .518 20.46**Spring .216 .311 .471
Fall 5. Clerical Work .081 .257 .661 6.52*Spring .050 .308 .640
Fall 8. Customer Service .064 .318 .616 7.75*Spring .094 .355 .549
Fall 9. Nursing .077 .323 .599 7.63*Spring .111 .265 .622
Fall 11. Training .254 .430 .315 12.55**Spring .166 .464 .369
Fall 15. Agriculture .047 .263 .689 11.51**Spring .077 .195 .726
Fall 17. Promotion-Comm. .172 .368 .454) 8.76*Spring .155 .300 .543
* significant at .05 level.** significant at .01 level.
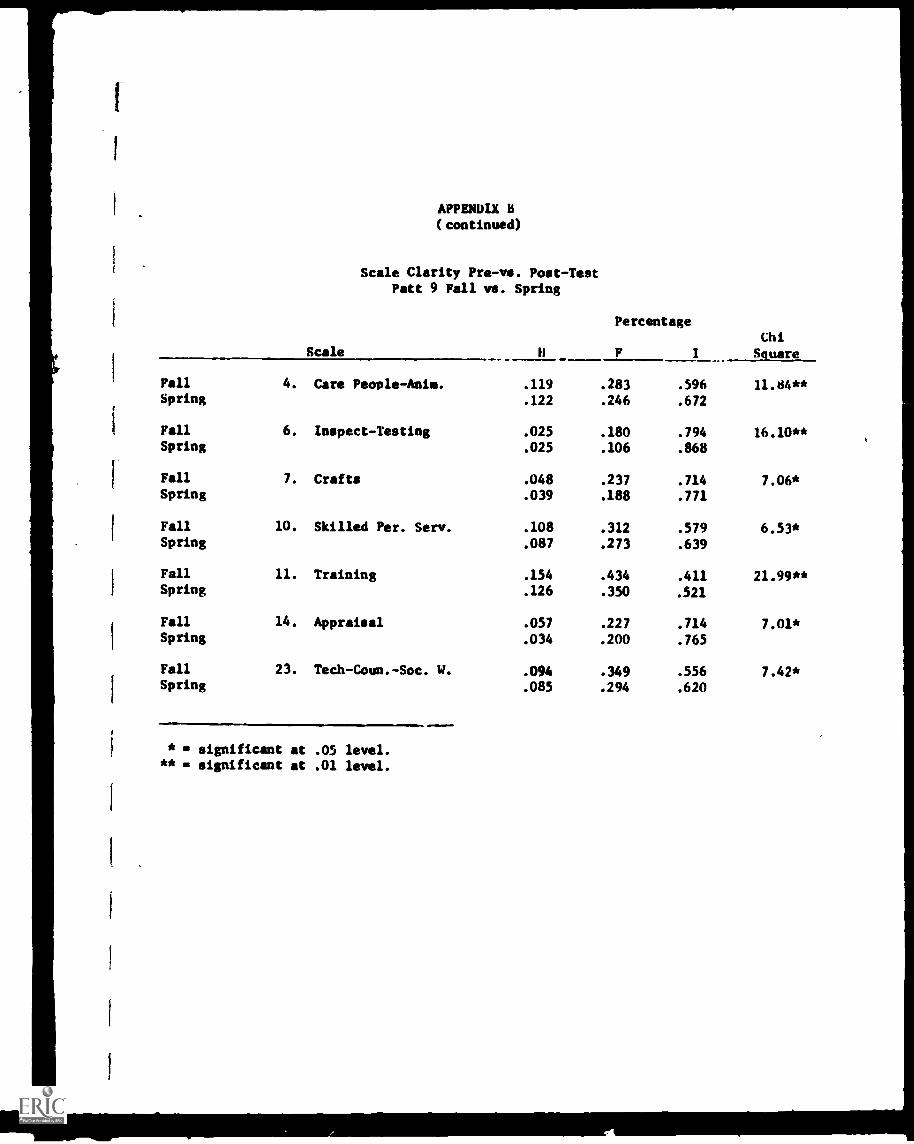
APPENDIX b(continued)
Scale Clarity Pre-vs. Post-TestPatt 9 Fall vs. Spring
H
Percentage
F I
ChiSquare
Fall 4. Care People-Anim. .119 .283 .596 11.84**Spring .122 .246 .672
Fall 6. Inspect-Testing .025 .180 .794 16.10**Spring .025 .106 .868
Fall 7. Crafts .048 .237 .714 7.06*Spring .039 .188 .771
Fall 10. Skilled Per. Serv. .108 .312 .579 6.53*Spring .087 .273 .639
Fall 11. Training .154 .434 .411 21.99**Spring .126 .350 .521
Fall 14. Appraisal .057 .227 .714 7.01*Spring .034 .200 .765
Fall 23. Tech -Coun. -Soc. W. .094 .349 .556 7.42*Spring .085 .294 .620
* - significant at .05 level.** significant at .01 level.

APPENDIX B(continued)
Scale Clarity Pre -vs. Post-TestPatt 10 Fall vs. Spring
Scale b
Percentages
F I
Chi
Square
Fall 3. Personal Service .050 .200 .750 7.26*Spring .034 .161 .804
Fall 9. Nursing .038 .230 .731 6.89*Spring .038 .177 .783
Fall 12. Literary .095 .344 .559 6.51*Spring .098 .287 .614
Fall 13. Numerical .066 .236 .697 6.35*Spring .050 .198 .751
Fall 14. Appraisal .066 .291 .642 12.92*Spring .034 .250 .715
Fall 15. Agriculture .038 .176 .784 8.31*Spring .022 .137 .839
Fall 17. Promotion-Comm. .098 .394 .506 14.07**Spring .105 .308 .586
Fall 18. Management-Supervision .059 .355 .585 8.63*Spring .075 .291 .633
Fall 19. Artistic .131 .356 .511 14.38*Spring .125 .277 .597
Fall 20. Sales Represent. .065 .229 .704 11.28*Spring .027 .254 .718
Fall 24. Medical .056 .172 .770 6.85*Spring .029 .193 .777
* significant at .05 level.** significant at .01 level.

APPENDIX C
A COMPARISON OF CHANGE IN FIRST CHOICE EXPRESSEDINTEREST ON THE OHIO VOCATIONAL INTEREST SURVEY

APPENDIX C
A COMPARISON OF CHANGE IN FIRST CHOICE EXPRESSEDINTEREST ON,TRE OHIO VOCATIONAL INTEREST SURVEY
School Grade Same
PercentagesChi
Changed Square
Patt 9 .418 .581 .04Wt 9 .426 .573
Patt 10 .558 .441 5.34*Wt 10 .471 .528
Wood 9 .438 .561 .08Wt 9 .426 .573
Wood 10 .498 .501 .45Wt 10 .471 .528
Patt 9 .418 .581 .35Wood 9 .438 .561
Patt 10 .558 .441 2.67Wood 10 .498 .501
Patt 9 .418 .581 16.97**Patt 10 .558 .441
Wood 9 .438 .561 2.49Wood 10 .498 .501
* significant at .05 level.** significant at .01 level.

A COMPARISON OF CHANCE IN FIRST CHOICE INVENTORIED INTERESTON THE OHIO VOCATIONAL INTEREST SURVEY
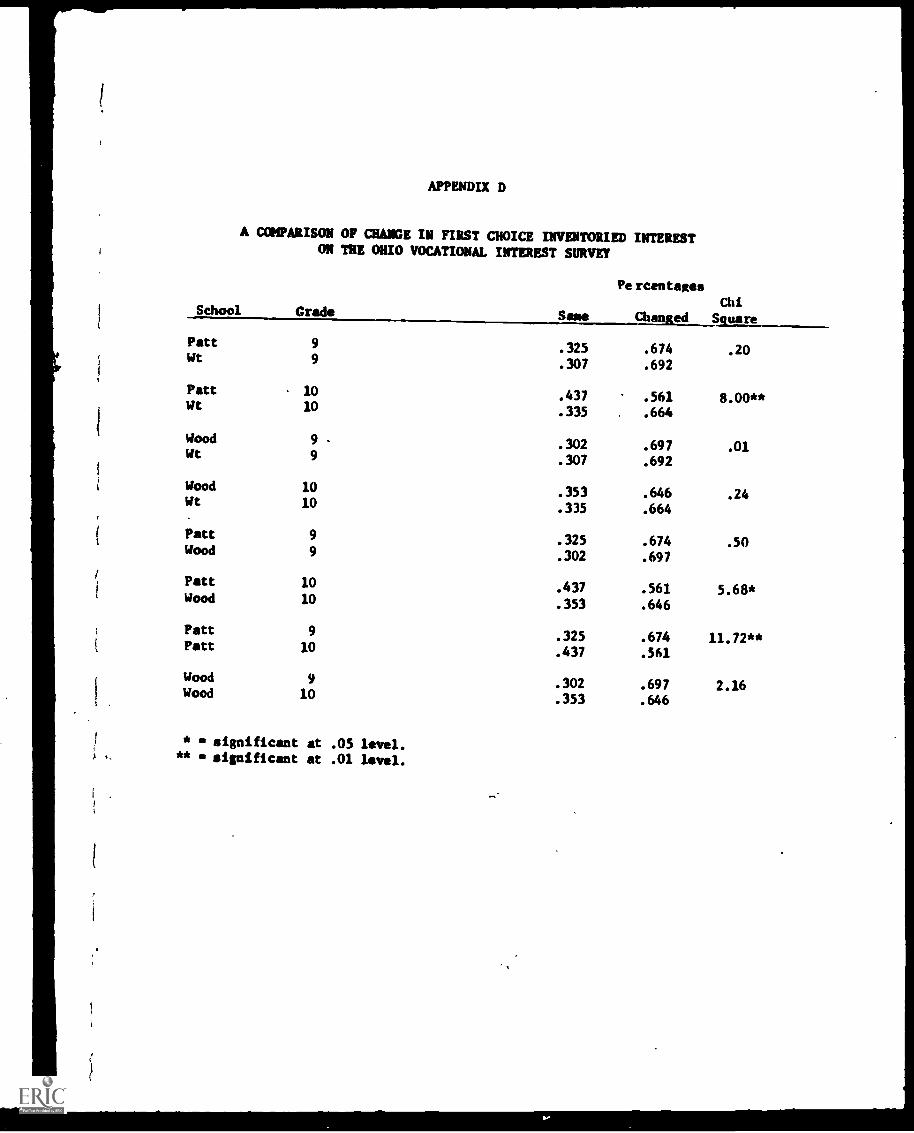
APPENDIX D
A COMPARISON OF CHANCE IN FIRST CHOICE INVENTORIED INTERESTON THE OHIO VOCATIONAL INTEREST SURVEY
School Grade Sane
Percentages
ChangedChi
Square
Patt 9 .325 .674 .20Wt 9 .307 .692
Patt 10 .437 .561 8.00**Wt 10 .335 .664
Wood 9 .302 .697 .01Wt 9 .307 .692
Wood 10 .353 .646 .24Wt 10 .335 .664
Patt 9 .325 .674 .50Wood 9 .302 .697
Patt 10 .437 .561 5.68*Wood 10 .353 .646
Patt 9 .325 .674 11.72**Patt 10 .437 .561
Wood 9 .302 .697 2.16Wood 10 .353 .646
* significant at .05 level.** significant at .01 level.

APPENDIX E
INVENTORIED RANK OF FIRST CHOICEEXPRESSED INTEREST - ANALYSIS OF COVARIANCE

APPENDIX E
INVENTORIED RANK OF FIRST CHOICEEXPRESSED INTEREST - ANALYSIS OF COVARIANCE
School FallMEANS
Sprint Adjusted F
Patt 9vs.
5.9393 6.5561 6.6199 0.567
Wt 9 6.6526 7.1684 7.0246
Patt 10vs.
5.9317 5.5308 5.6323 3.441
Wt 10 6.7893 6.5652 6.4161
Wood 9vs.
6.9043 7.5186 7.4904 0.210
Waite 9 6.6526 7.1684 7.2242
Wood 10vi.
6.3262 6.7877 6.8572 0.572
Wt 10 6.7893 6.5652 6.4897
Patt 9vs.
5.9393 6.5561 6.7207 1.911
Wood 9 6.9043 7.5186 7.3313
Pat 10vs.
5.9317 5.5308 5.5880 7.447**
Wood 10 6.3262 6.7877 6.7103
Patt 9vs.
5.9393 6.5561 6.5548 7.128**
Pitt 10 5.9317 5.5308 5.5320
Wood 9vs.
6.9043 7.5186 7.4157 1.141
Wood 10 6.3262 6.7877 6.9067
** Significant at .01 level.

APPENDIX F
A COMPARISON OF THE INVENTORIED RANK OF THE NUMBER ONE EXPRESSED CHOICEON THE OHIO VOCATIONAL INTEREST SURVEY TEST
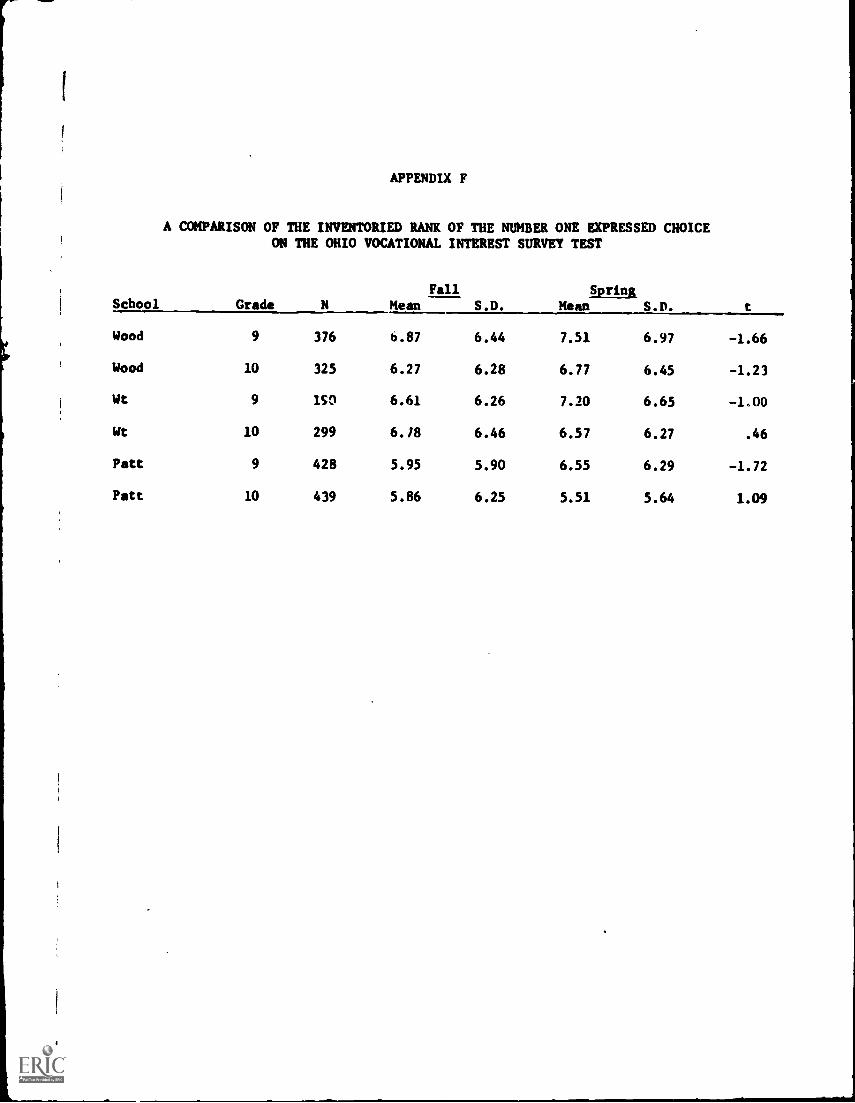
APPENDIX F
A COMPARISON OF THE INVENTORIED RANK OF THE NUMBER ONE EXPRESSED CHOICEON THE OHIO VOCATIONAL INTEREST SURVEY TEST
School Grade N MeanFall Spring
S.D. tS.D. Mean
Wood 9 376 b.87 6.44 7.51 6.97 -1.66
Wood 10 325 6.27 6.28 6.77 6.45 -1.23
Wt 9 1S0 6.61 6.26 7.20 6.65 -1.00
Wt 10 299 6.18 6.46 6.57 6.27 .46
Patt 9 428 5.95 5.90 6.55 6.29 -1.72
Patt 10 439 5.86 6.25 5.51 5.64 1.09

I
I
(
APPENDIX G
THE OVIS INTEREST SCALES
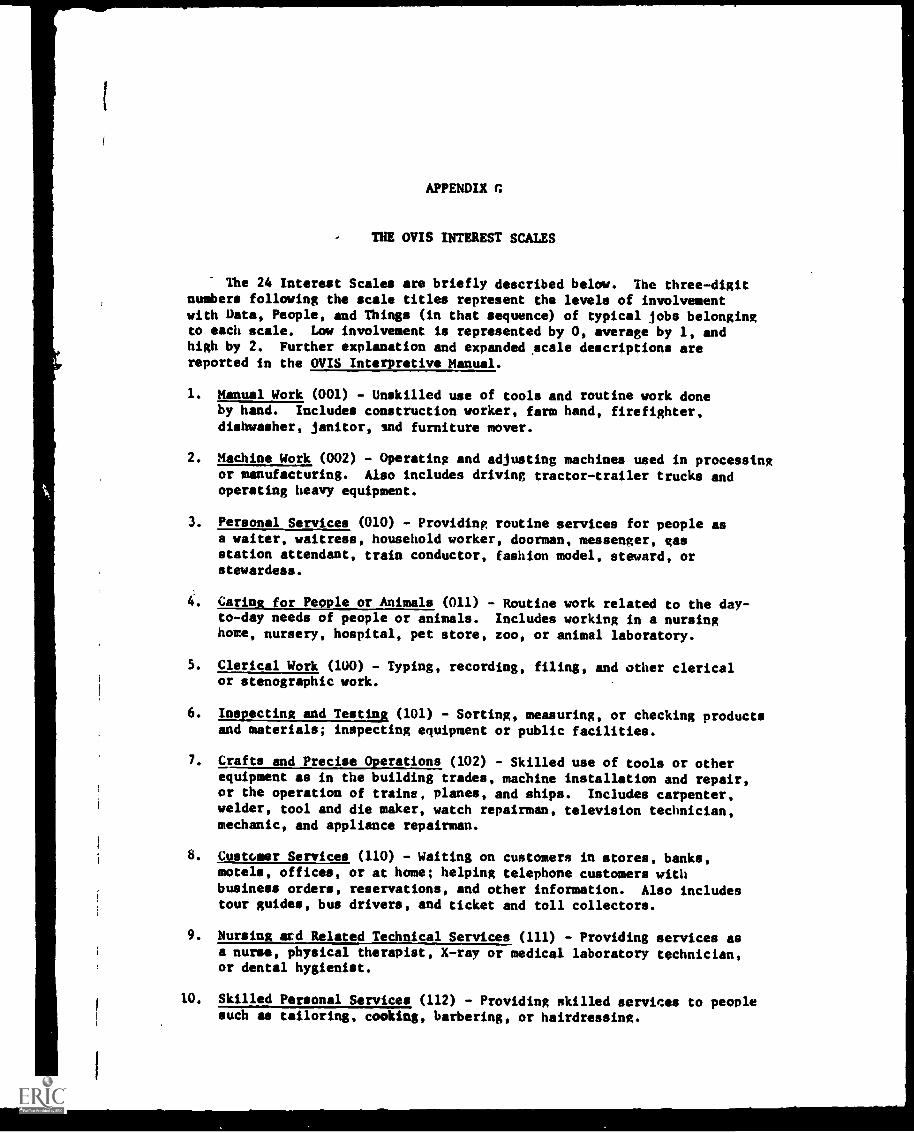
APPENDIX C
THE OVIS INTEREST SCALES
The 24 Interest Scales are briefly described below. The three-digitnumbers following the scale titles represent the levels of involvementwith Data, People, and Things (in that sequence) of typical jobs belongingto each scale. Low involvement is represented by 0, average by 1, andhigh by 2. Further explanation and expanded scale descriptions arereported in the OVIS Interpretive Manual.
1. Manual Work (001) - Unskilled use of tools and routine work doneby hand. Includes construction worker, farm hand, firefighter,dishwasher, janitor, snd furniture mover.
2. Machine Work (002) - Operating and adjusting machines used in processingor manufacturing. Also includes driving tractor-trailer trucks andoperating heavy equipment.
3. Personal Services (010) - Providing routine services for people asa waiter, waitress, household worker, doorman, messenger, gasstation attendant, train conductor, fashion model, steward, orstewardess.
4. Caring for People or Animals (011) - Routine work related to the day-to-day needs of people or animals. Includes working in a nursinghome, nursery, hospital, pet store, zoo, or animal laboratory.
5. Clerical Work (100) - Typing, recording, filing, and other clericalor stenographic work.
6. Inspecting and Testing (101) - Sorting, measuring, or checking productsand materials; inspecting equipment or public facilities.
7. Crafts and Precise Operations (102) - Skilled use of tools or otherequipment as in the building trades, machine installation and repair,or the operation of trains, planes, and ships. Includes carpenter,welder, tool and die maker, watch repairman, television technician,mechanic, and appliance repairman.
8. Customer Services (110) - Waiting on customers in stores, banks,motels, offices, or at home; helping telephone customers withbusiness orders, reservations, and other information. Also includestour guides, bus drivers, and ticket and toll collectors.
9. Nursing and Related Technical Services (111) - Providing services asa nurse, physical therapist, X-ray or medical laboratory technician,or dental hygienist.
10. Skilled Personal Services (112) - Providing skilled services to peoplesuch as tailoring, cooking, barbering, or hairdressing.
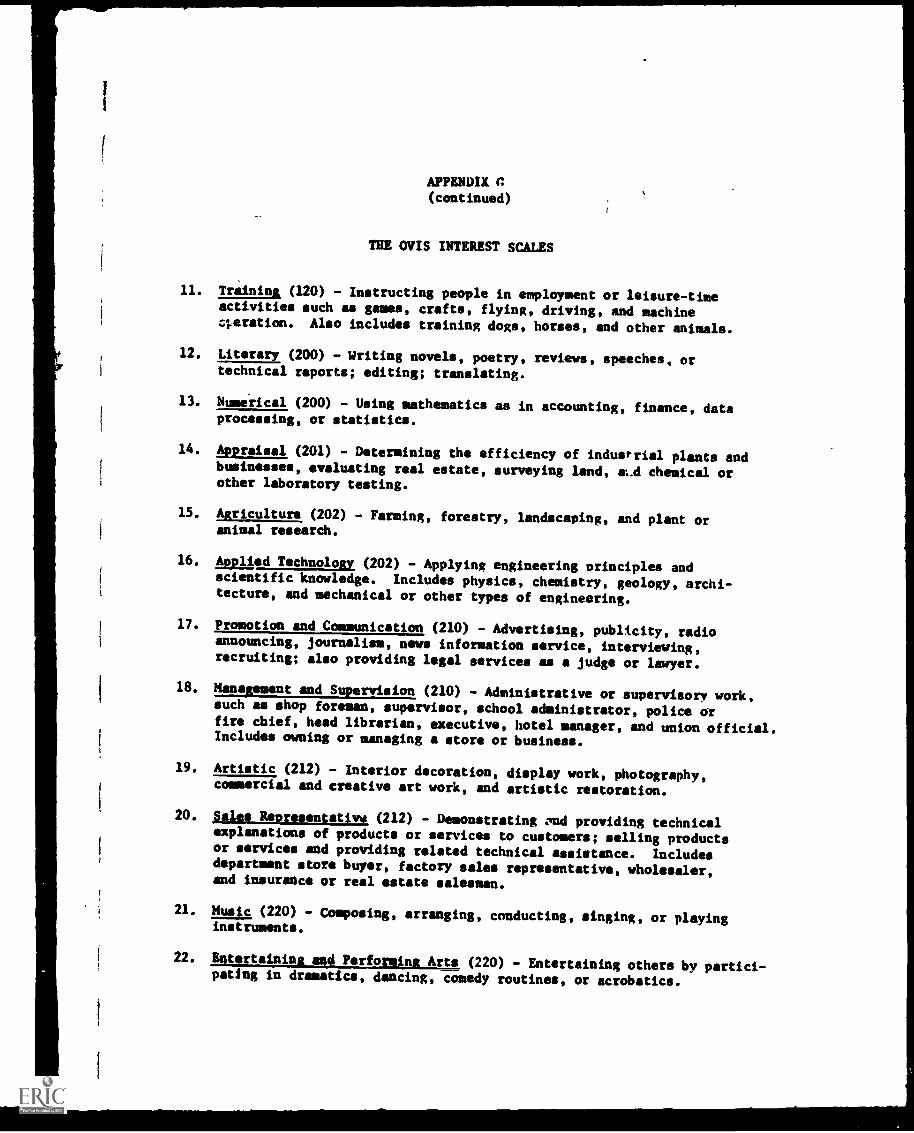
APPENDIX o(continued)
THE OVIS INTEREST SCALES
11. Training (120) - Instructing people in employment or leisure-timeactivities such as games, crafts, flying, driving, and machine:aeration. Also includes training dogs, horses, and other animals..t
12. Literary (200) - Writing novels, poetry, reviews, speeches, ortechnical reports; editing; translating.
13. Numerical (200) - Using mathematics as in accounting, finance, dataprocessing, or statistics.
14. Appraisal (201) - Determining the efficiency of industrial plants andbusinesses, evaluating real estate, surveying land, aLd chemical orother laboratory testing.
15. Agriculture (202) - Farming, forestry, landscaping, and plant oranimal research.
16. Applied Technology (202) - Applying engineering principles andscientific knowledge. Includes physics, chemistry, geology, archi-tecture, and mechanical or other types of engineering.
17. Promotion and Communication (210) - Advertising, publicity, radioannouncing, journalism, news information service, interviewing,recruiting; also providing legal services as a judge or lawyer.
18. Management and Supervision (210) - Administrative or supervisory work,such as shop foreman, supervisor, school administrator, police orfire chief, head librarian, executive, hotel manager, and union official.Includes owning or managing a store or business.
19. Artistic (212) - Interior decoration, display work, photography,commercial and creative art work, and artistic restoration.
20. §ales Representativw (212) - Demonstrating .'nd providing technicalexplanations of products or services to customers; selling productsor services and providing related technical assistance. Includesdepartment store buyer, factory sales representative, wholesaler,and insurance or real estate salesman.
21. Music (220) - Composing, arranging, conducting, singing, or playinginstruments.
22. Entertaining and Performing Arts (220) - Entertaining others by partici-pating in dramatics, dancing, comedy routines, or acrobatics.

APPENDIX G(continued)
TEE OVIS INTEREST SCALES
23. Teaching. Counseling. and Social Work (220) - Providingor other services in a school,, college, church, clinic,agency. Includes instruction in art, music, ballet, or
24. Medical (222) - Providing dental, medical, surgical, orservices for the treatment of people or animals.
instructionor welfareathletics.
related

OVIS
OHIOVOCATIONALINTERESTSURVEY
Authors:Ayres G. D'CostaDavid W. WinefordnerJohn G. OdgersPaul B Koons, Jr., Ph.D.
Copyright 1969 by HARCOURT-BRACE JOVANOVICH, INC.
(Not included in this document for reproduction purposes)

t
APPENDIX H
CAREER PLANS SURVEY AND ANSWER SHEET

I
I
,,
1
1
I
I
.
CAREER PLANS SURVEY
Ohio Division of Vocational Education 10-70
By John R. Cochran, Ph. D,David M. Weis, Ph. D.
Directions: Following are some questions that ask you about your plans, feelings, and attitudes.Your school hopes to use your answers to help improve the school program, there-fore, it is important that you answer all questions as honestly as possible. Eachquestion is different so be sure to read each one carefully. If you are not sureof an answer, choose the one that is closest to what you think right now. If you donot understand a question, you may ask the person giving the test to explain it toyou.
Do not make any marks on the test booklet. Make all marks on the separate, answersheet provided. You are to darken the number of the answer that you choose.Make broad dark marks that completely fill the brackets below the number. Donot mark beyond the lines. Completely erase any marks you wish to remove.Use only a number 2 pencil.
Now answer the questions.
FOR QUESTIONS 1, 2, AND 3 MARK ALL THAT AIPLY
1. Indicate all the ways in which you have learned at school about occupations before this(1970-71) school year. Notice that you are to indicate only the ways before this year.
(Mark all that apply.)0. Field Trips to observe people at work1. Information from a special class on careers2. Talks at school by people who know about or work at the occupation3. Trying some of the training required for the occupation4. Getting information about occupations in your regular academic classes5. Reading about the occupations from information in the school library or
guidance office6. Talking to a guidance counselor7. Taking special course(s) dealing with occupations8. Other9. None of the above
--Now Go To The Next Page--
(University of Akron)

Page 2
2. Indicate all the ways which you have learned at school about occupations this (1970-71)school year. Notice, answer for this school year only. (Mark all that apply.)
0. Field Trips to observe people at work1. Information from a special class on careers2. Talks at schools by people who know about or work at the occupation3. Trying some of the training required for the occupation4. Getting information about occupations in your regular academic classes5. Reading about the occupations from information in the school library or
guidance office6. Conversation with a guidance counselor7. Taking a special course dealing with occupations8. Other9. None of the above
3. With which of the following people have you discussed the occupations that ar- of mostinterest to you. (Mark all that apply.)
0. Your parents1. Your relatives2. Your friends3. Your teachers4. Your principal5. Your guidance counselor6. Someone other than the above who works at that occupation7. No one8. Other
FOR THE REST OF THE QUESTIONSx MARK ONLY ONE ANSWER FOR EACH QUESTION.EACH QUESTION IS DIFFERENT, SO BE SURE TO READ EACH ONE CAREFULLY. BESURE YOU ANSWER EVERY QUESTION.
4. In regard to your choice of occupation, have you: (Mark only one.)
0. Given the matter a great deal of thought1. Given the matter some thought2. Given the matter little thought3. Given the matter no thought
'J.
--Now Go To The Next Page--

5. When you say that a job is a "good job", what do you think is the ONE MAIN thing thatmakes it a "good job"? (Mark only one.)
0. The job gives a chance to "be your own boss"1. The job pays well2. The job is pleasant, safe, and easy3. The job helps other people4. The job has a good future5. The preparation for the job requires much education,hard work and money6. The job provides steady work7. Other people think the job is a "good job"8. The job requires high moral standards, honesty, and responsibility9. The job requires intelligence and ability
6. In regard to your choice of occupation, are you: (Mark only one.)
0. Sure that your mind is made up1. Not sure, but think your mind is made up2. Not sure that your mind is made up3. Sure that your mind is not made up
7. Do you plan to graduate from high school?
0. Definitely plan to graduate1. Probably will graduate2. Undecided3. Probably will not graduate4. Definitely do not plan to graduate
(Mark only one.)
8. As compared with others now working at the occupation you are considering do youthink your ability is: (Mark only one.)
0. Very much above average1. A little above average2. Avert ge3. A litt.c below average4. Very much below average
9. Which of the following phrases best describes your attitude toward school?(Mark only one.)
0. I like school a lot1. I like school prt well2. I don't like or dislike school3. I dislike school a little4. I dislike school a lot
--Now Go To The Next Page --
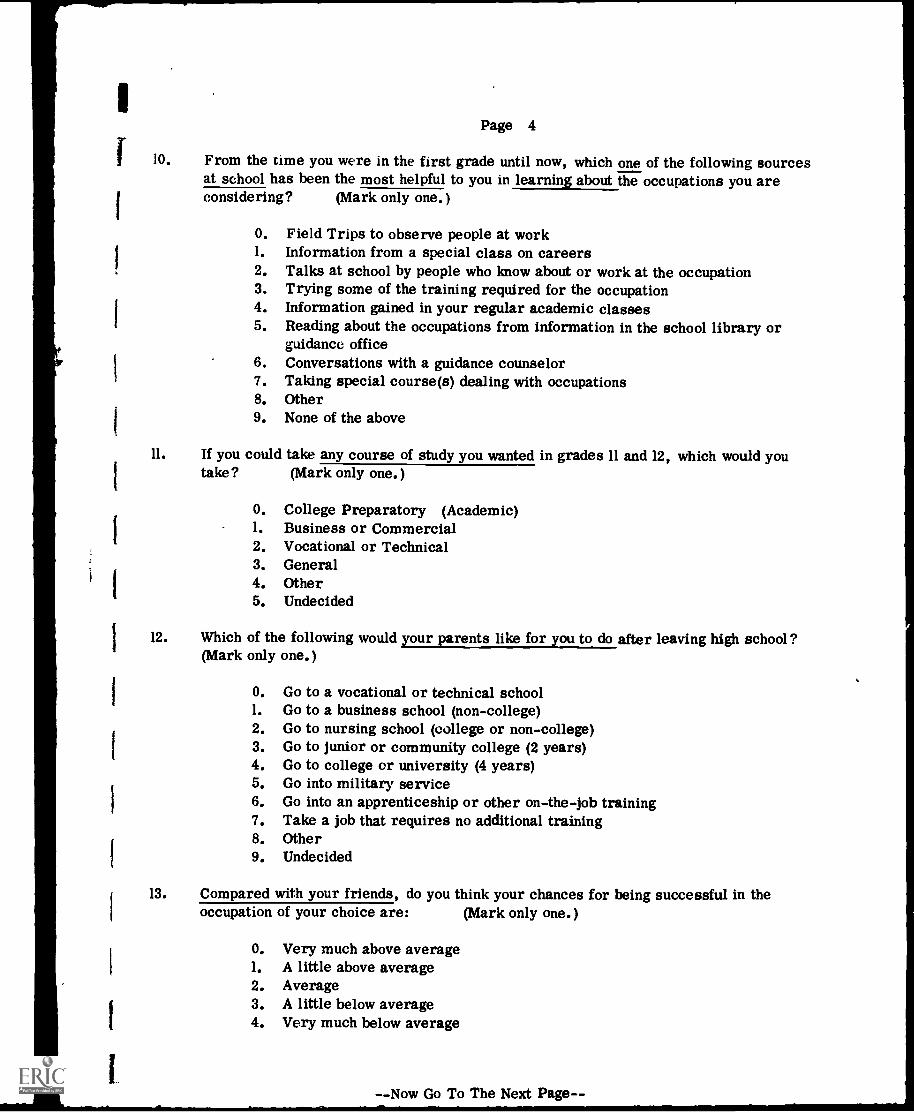
10. From the time you were in the first grade until now, which one of the following sourcesat school has been the most helpful to you in learning about the occupations you areconsidering? (Mark only one.)
0. Field Trips to observe people at work1. Information from a special class on careers2. Talks at school by people who know about or work at the occupation3. Trying some of the training required for the occupation4. Information gained in your regular academic classes5. Reading about the occupations from information in the school library or
guidance office6. Conversations with a guidance counselor7. Taking special course(s) dealing with occupations8. Other9. None of the above
11. If you could take any course of study you wanted in grades 11 and 12, which would youtake? (Mark only one.)
0. College Preparatory (Academic)1. Business or Commercial2. Vocational or Technical3. General4. Other5. Undecided
12. Which of the following would your parents like for you to do after leaving high school?(Mark only one.)
0. Go to a vocational or technical school1. Go to a business school (non-college)2. Go to nursing school (college or non-college)3. Go to junior or community college (2 years)4. Go to college or university (4 years)5. Go into military service6. Go into an apprenticeship or other on-the-job training7. Take a job that requires no additional training8. Other9. Undecided
13. Compared with your friends, do you think your chances for being successful in theoccupation of your choice are: (Mark only one.)
0. Very much above average1. A little above average2. Average3. A little below average4. Very much below average
--Now Go To The Next Page--

Page 5
I
14. About how mach schooling do you think most young people need these days to get alongwell in the world? (Mark only one.)
0. Elementary school1. Some high school2. High school diploma3. High school diploma including vocational or technical training4. High school diploma plus business or technical school5. Some college6. Some college plus business, vocational, or technical school
17. College degree8. College degree plus additional non-college training9. College degree plus graduate school
15. As compared with others now working at the occupation you are considering, do youthink your chances of getting ahead in the occupation are: (Mark only one.)
0. Very much above average1. A little above average2. Average3. A little below average4. Very much below average
16. Which of the following do_you actually plan to do after leaving high school?
1
(Mark only one.)
0. Go to vocational or technical school1. Go to business school (non-college)2. Go to nursing school (college or non-college)3. Go to junior or community college (2 years)4. Go to college or university (4 year)5. Go into military service6. Go into an apprenticeship or other on-the-job training7. Take a job that requires no additional training8. Other9. Undecided
17. In regard to your choice of an occupation, do you feel: (Mark only one.)
0. You have enough information about the jobs that interact you to choosethe occupation you w;,,Ald like to enter.
1. You have some information about the jobs that interest you, but notenough for you to make up your mind.
2. You don't have any information about the jobs that interest you tohelp you make up your mind.
I
--Now Go To The Next Page--
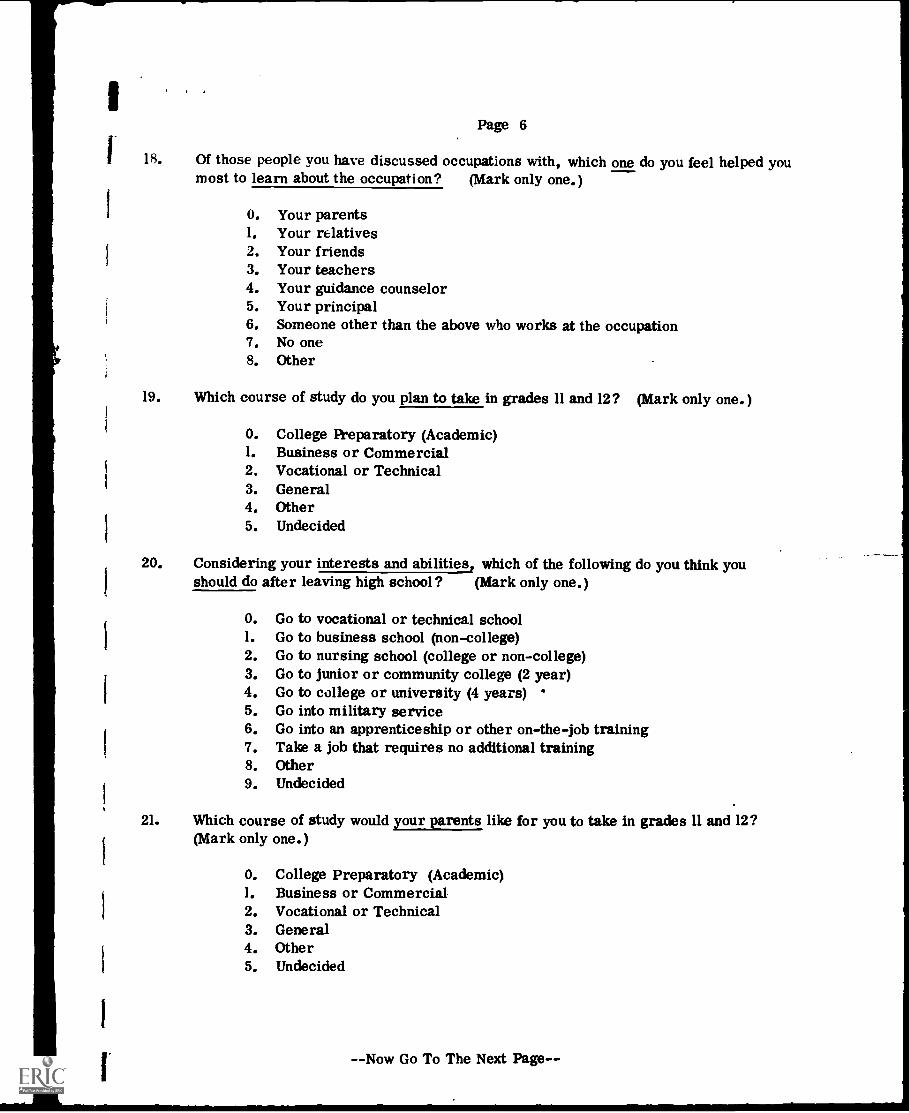
IPage 6
1 18. Of those people you have discussed occupations with, which one do you feel helped youmost to learn about the occupation? (Mark only one.)
1 0. Your parents1. Your relatives2. Your friends3. Your teachers4. Your guidance counselor5. Your principal6. Someone other than the above who works at the occupation7. No one8. Other
19. Which course of study do you plan to take in grades 11 and 12? (Mark only one.)
0. College Preparatory (Academic)1. Business or Commercial2. Vocational or Technical3. General4. Other5. Undecided
20. Considering your interests and abilities, which of the following do you think youshould do after leaving high school? (Mark only one.)
0. Go to vocational or technical school1. Go to business school (non-college)2. Go to nursing school (college or non-college)3. Go to junior or community college (2 year)4. Go to college or university (4 years)5. Go into military service6. Go into an apprenticeship or other on-the-job training7. Take a job that requires no additional training8. Other9. Undecided
21. Which course of study would your parents like for you to take in grades 11 and 12?(Mark only one.)
0. College Preparatory (Academic)1. Business or Commercial2. Vocational or Technical3. General4. Other5. Undecided
--Now Go To The Next Page--

Page 7
22. If you could do anything you wanted after leaving high school, which of the followingwould you do? (Mark only one.)
0. Go to vocational or technical school1. Go to business school (non-college)2. Go to nursing school (college or non-college)3. Go to junior or community college (2 year)4. Go to college or university (4 years)5. Go into military service6. Go into an apprenticeship or other on-the-job training7. Take a job that requires no additional training8. Other9. Undecided
23. Considering your interests and abilities, which high school course of study do youthink you should take? (Mark only one.)
0. College Preparatory (Academic)1. Business or Commercial2. Vocational or Technical3. General4. Other5. Undecided
24. In regard to working, do you now have:
0. A regular job outside the home where you work at least once every weekand get paid for it.
1. A job outside the home where you work ocasionally (less than once aweek) and get paid for it.
2. No job outside the home.
ONLY ANSWER QUESTION 25 IF YOU PLAN TO ENTER MILITARY SERVICE AFTER HIGHSCHOOL
25. If you plan to enter military service after high school, which of the following do youplan to do after your first military service is over? (Mark only one.)
0. Go to vocational or technical school1. Go to business school (non-college)2. Go to nursing school (college or non-college)3. Go to junior or community college (2 year)4. Go to college or university (4 years)5. Stay in the military service6. Go into an apprenticeship or other on-the-job training7. Take a job that requires no additional training8. Other9. Undecided
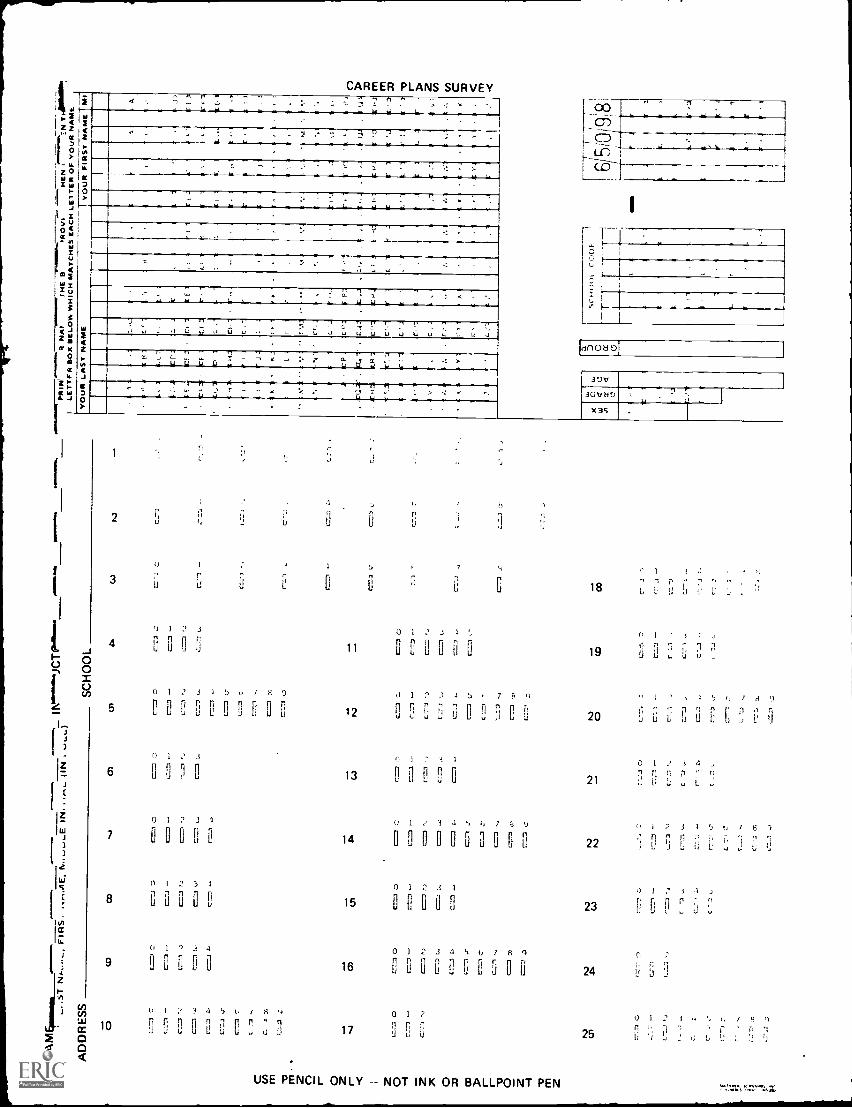
CAREER PLANS SURVEY3.
St at at
7 7
/ 41
3 Y .
J1
u U
r
AS.
Id n o
39V
3 C.I H
X 3%
2
3
4
00
5
6
11
9 1 3
0 0 0 5
O 1 2 3 1 5 3, 7 8 9
I:305300E00
O 1 .3
0 Jr
O 1 ? 4
7 000E0
I 2 3
8 P, 0 0
3
11
7
0 1 :1 3 -I 5 7 5 "I
12 0 5 5 0 0 5 11
13 0 0 1, r 0
0 1 1 3 4 5 I, 7 5 9
14 5 (1 0 5 3 03 [1,
0 1 2 3 1
1511 0 0
18
(1
19
3
G
' 3 1 I: / d 9
920 b L
21
22
23
0 1 3 4 0 1 2 3 4 '3 0 7 8
9 0 0 11 0 0 16 0 11 0 11 0 L 5 0 24
LI)LI) 0 1 3 4 '3, / 0 1 ?
10 0 0 U ri LI [1 17LI I; 1,)
n nCC00
USE PENCIL ONLY NOT INK OR BALLPOINT PEN
25
0 1
n
it
4"
0 I 7 3 1 5 t .1 1 8 -4
'13 11 n,J
0 1 1 J
11
0=
j
0 I :n 1-1
u
I
' b
1, 7
.,
8 9
'31
r'n,74=,:7'11,7t

APPENDIX I
TENNESSEE SELF-CONCEPT SCALE AND ANSWER SHEET
.,

TENNESSEE(Department of Mental Health)
SELF CONCEPT SCALE
BYWilliam H. Fitts, Ph.D.
Copyright byWilliam H. Fitts, Ph.D.
Form Designed and Printed by National Scanning, Incorporated
(Not included in this document for reproduction purposes)

APPENDIX J
PARENT SURVEY

DAYTON PATTERSONPARENT SURVEY
Ohio Division of Vocationll Ethiention
David M. Weis & John R. CochranThe University of Akron
DEAR PARENT:
THIS YEAR DAYTON PATTERSON HAS STARTED A CAREER EXPLORATION PROGRAM. THEPURPOSE OF THIS PrOm1A" IS TO E2Ln 9TH AND 10TH GRADE STUDENTS LEARN ABOUT JOBS.STUDENTS :'L "IELr TRIPS, TALKING ABOUT JOBS IN SCHOOL AND SOMETIMES,TRYING THE SPECIvIC TRAINING REQUIRED FOR SO"E JOBS. WE WOULD LIKE TO KNOW WHATYOU THINK OF THIS PROGRAM.
WE WOULD APPRECIATE IT IF YOU WOULD TAKE A FEW MINUTES TO FILL OUT ONE OFTHESE SURVEYS FOR EACH CHILD YOU HAVE IN THE 9TH OR 10TH GRADE AT DAYTONPATTERSON. DO NOT FILL OUT A SURVEY FOR ANY CHILD IN ANOTHER GRADE OR ANOTHERSCHOOL. WE WOULD LIKE YOUR HONEST OPINION. WE WILL REMOVE THE PAGE WITH YOURNAME ON THE SURVEY BEFORE SHARING YOUR COMMENTS WITH ANYONE AT THE SCHOOLPLEASE FILL OUT THE SURVEY, PUT IT IN THE ENVELOPE PROVIDED, PRINT YOUR CHILD'SNAME ON THE FRONT OF 1HE ENVELOPE, AND HAVE YOUR CHILD RETURN THE COMPLETEDSURVEY TO THE TEACHER WHO GAVE IT TO HIM.
WHAT YOU THINK Or THE DAYTON PATTERSON CAREER EXPLORATION PROGRAM ISIMPORTANT TO US.
A.
B.
C.
YOUR NAME
YOUR ADDRESS PHONE NUMBER
CHILD'S NAME (please print: last name, first name, middle initial)
FOR ITEMS D, E, AND F BELOW PUT AN "X" IN THE SPACE ON EACH LINE THAT DESCRIBESYOUR CHILD.
(1) (2)D. CHILD'S GRADE IN SCHOOL... 9TH 10TH (8)
(1) (2)E. CHILD'S SEX... BOY ^IRL (9)
F. DID YOUR CHILD ENROLL IN DAYTON PATTERSON BEFORE NEs'BER 1, 1970? (10)(1) (2)
YES NO
(Continue on the back of this page.)
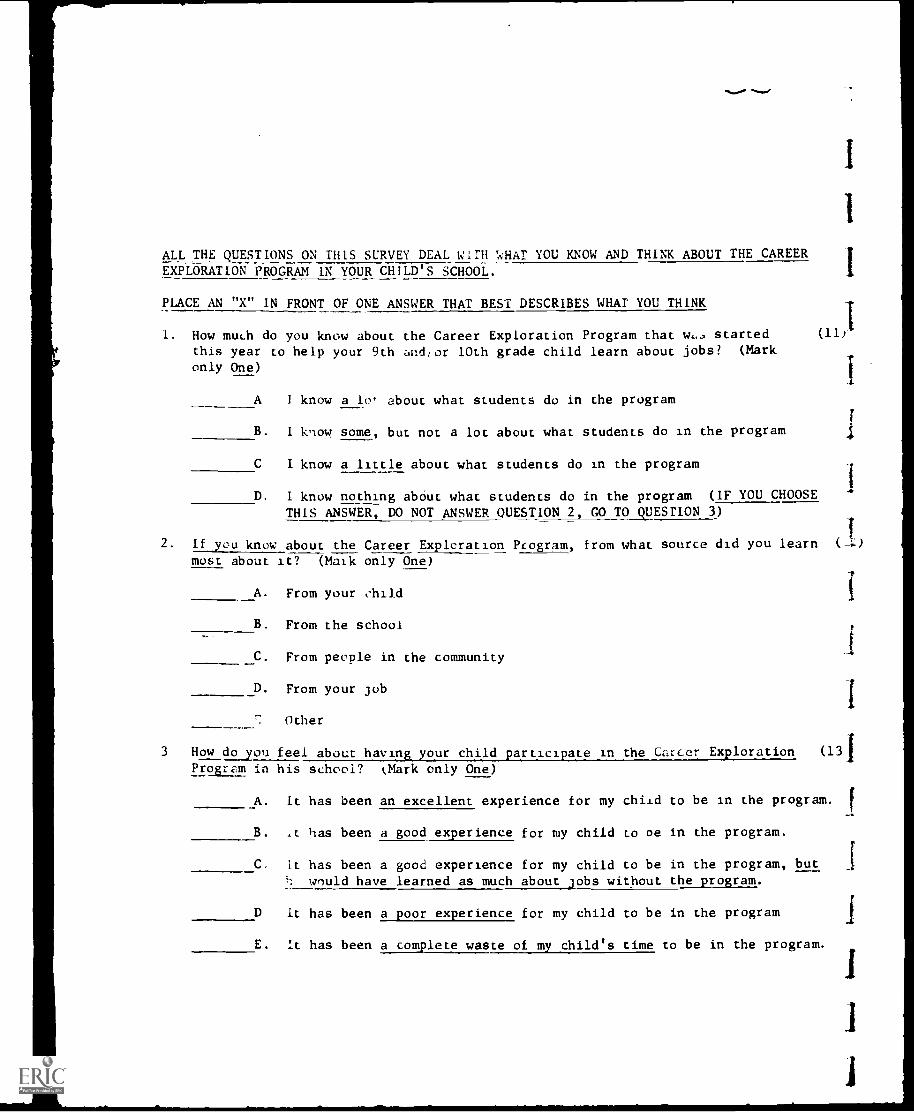
ALL THE QUESTIONS ON THIS SURVEY DEAL WITH MiAT YOU KNOW AND THINK ABOUT THE CAREEREXPLORATION PROGRAM IN YOUR CHILD'S SCHOOL.
PLACE AN "X" IN FRONT OF ONE ANSWER THAT BEST DESCRIBES WHAT YOU THINK
1. How much do you know about the Career Exploration Program that started
this year to help your 9th and,or 10th grade child learn about jobs? (Mark
only One)
A I know a lot about what students do in the program
B. I know some, but not a lot about what students do in the program
C I know a little about what students do in the program
I know nothing about what students do in the program (IF YOU CHOOSE
THIS ANSWER, DO NOT ANSWER QUESTION 2, GO TO QUESTION 3)
2. If you know about the Career Exploration Program, from what source did you learnmost about it? (Mark only One)
A. From your child
B. From the school
C. From people in the community
D. From your job
Other
3 How do you feel about having your child participate in the Carcer Exploration (13 1Program in his school? kMark only One)
A. It has been an excellent experience for my child to be in the program.
B. has been a good experience for my child to De in the program.
[C. it has been a good experience for my child to be in the program, butwould have learned as much about jobs without the program.
D it has been a poor experience for my child to be in the program
E. It has been a complete waste of my child's time to be in the program.
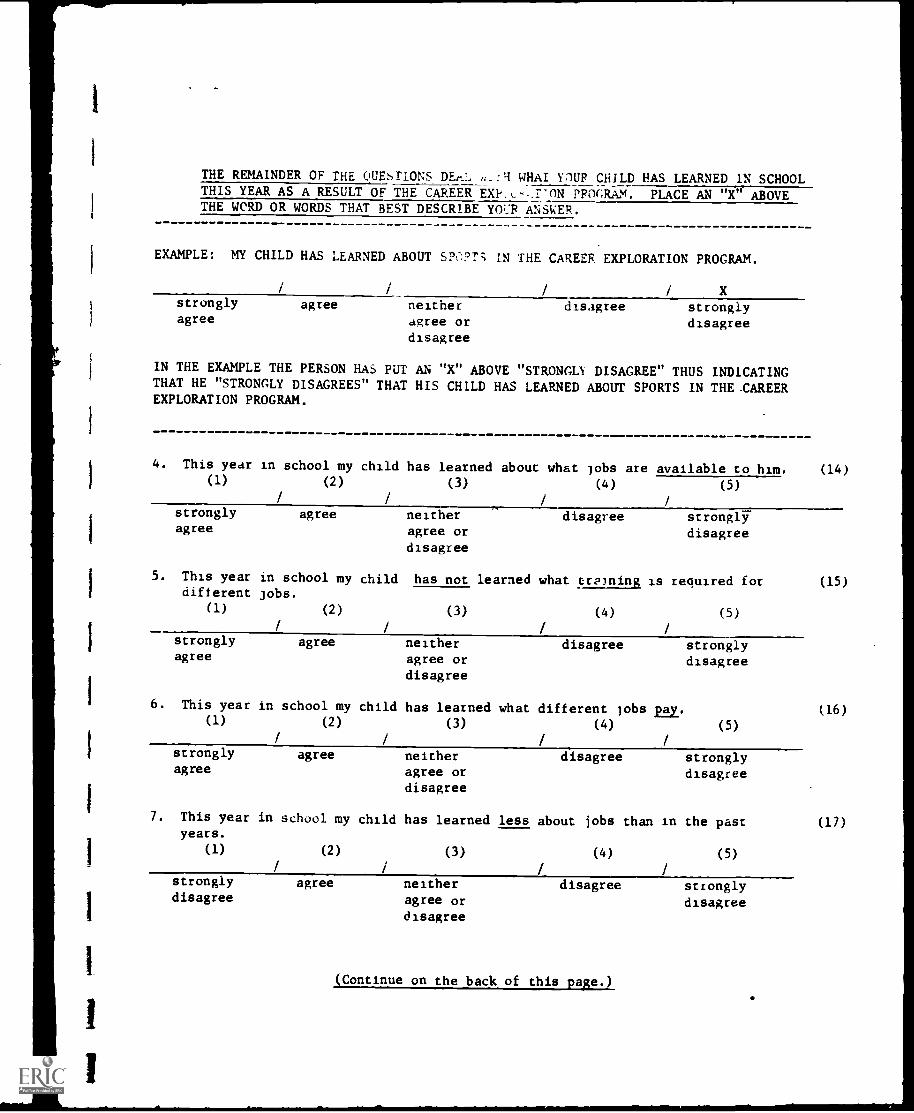
THE REMAINDER OF THE uUEsTIONS (,THAI \MR CHILD HAS LEARNED IN SCHOOLTHIS YEAR AS A RESULT OF THE CAREER EX? L-.:nisz PIWRAM. PLACE AN "X" ABOVETHE WORD OR WORDS THAT BEST DESCRIBE YOUR ANSWER.
EXAMPLE: MY CHILD HAS LEARNED ABOUT SP:PTS IN THE CAREER EXPLORATION PROGRAM.
stronglyagree
agree neither disagree stronglyagree or disagreedisagree
IN THE EXAMPLE THE PERSON HAS PUT AN "X" ABOVE "STRONGLY DISAGREE" THUS INDICATINGTHAT HE "STRONGLY DISAGREES" THAT HIS CHILD HAS LEARNED ABOUT SPORTS IN THE CAREEREXPLORATION PROGRAM.
4. This year in school my child has learned about what lobs are available to him. (14)(1) (2) (3) (4) (5)
stronglyagree
agree neitheragree or
disagree
disagree stronglydisagree
5. This year in school my child has not learned what training is required fordifferent jobs.
(1) (2) (3) (4) (5)/ / / /
stronglyagree
agree neitheragree or
disagree
disagree
6. This year in school my child has learned what different jobs pay.(I) (2) (3) (4)
stronglydisagree
(5)
stronglyagree
agree neitheragree or
disagree
disagree stronglydisagree
(15)
(16)
7. This year in school my child has learned less about jobs than in the past (17)years.
(1) (2) (3) (4) (5)/ / / /
strongly agree neither disagree stronglydisagree agree or disagree
disagree
(Continue on the back of this pap.)

8. My child likes school better this year be.:aLse he has had an opportunityto learn about lobs.
(1) (2) (3) (4) (5)
/ / / I
strongly agree neither disagree stronglyagree agree or disagree
disagree
I
9. My child had discussed with me less this year than in past years what he wants (19)
to do after completing his high school education.(1) (2) (3) (4) (5)
stronglyagree
agree neitheragree or
disagree
disagree stronglydisagree
10. Because of studying about jobs in school this year, my child has a betteridea of what jobs he would like to do after completing his high school education.
(1) (2) (3) (4) (5)
stronglyagree
agree neitheragree ordisagree
disagree stronglydisagree
11. Because of studying about jobs in school this year, my child has a betteridea of what jobs he can do well.
(1) (2) (3) (4) (5)
stronglyagree
12. COMMENTS:
agree neither
agree ordisagree
disagree strongly
disagree
(20)
(21)
1.
1
.1