An evaluation of the compound feeds manufactured in Tanzania
108
i ‘An evaluation of the compound feeds manufactured in Tanzania’ Alexander Geerts Dissertation prepared in partial fulfilment of the requirements for the Msc Agriculture and Development Ocbtober 23 2014
-
Upload
khangminh22 -
Category
Documents
-
view
3 -
download
0
Transcript of An evaluation of the compound feeds manufactured in Tanzania

i
‘An evaluation of the compound feeds manufactured in Tanzania’
Alexander Geerts
Dissertation prepared in partial fulfilment of the requirements for the Msc
Agriculture and Development
Ocbtober 23 2014

ii
Acknowledgements
I would like to extend my deepest gratitude to Dr. Ben Lukuyu for providing me the opportunity
to do this gratifying work. It has been a pleasure and great learning experience thanks to his and
guidance throughout the project. I would also like to thank my personal tutor not only for his
help in this dissertation, but for his invaluable help throughout the year. I am also extremely
thankful to Dr. Michael Blummel and Dr. KVSV Prasad for the tedious task of sample analysis.
Thank you to everyone who helped me throughout my time in Tanzania, including John-James,
Yusuph, Mary Ngowi, Leonard Marwa, Walter Mangesho and Fred Wassena. I extend a special
thank you to Wende Aaron from the TVLA for her tireless work in the lab. Thank you also to
Dieter and Mady for hosting me.
This study would not have been possible without all the respondents who kindly agreed to
participate, many thanks to all of you.
Thank you to my friends in Reading, who made this an enjoyable and unforgettable year. I
wouldn’t have made it through without you. Finally, I cannot thank my family enough.

iii
Contents page
Acknowledgements ......................................................................................................................................... ii
Contents page ................................................................................................................................................ iii
List of figure ...................................................................................................................................................... i
List of tables ..................................................................................................................................................... i
Abstract ........................................................................................................................................................... ii
List of Abbreviations ....................................................................................................................................... iii
1. INTRODUCTION ........................................................................................................................................ 1
1.1 Background ........................................................................................................................................ 1
1.2 Problem statement ............................................................................................................................ 2
1.3 Aims and objectives ........................................................................................................................... 2
1.4 Outline to the study ........................................................................................................................... 3
2. LITERATURE REVIEW ................................................................................................................................ 4
2.1 Political economy of Agriculture ....................................................................................................... 4
2.1.1 Agricultural growth and poverty reduction ................................................................................ 6
2.2 Description of livestock production systems ..................................................................................... 8
2.3 Feeds and Feeding ........................................................................................................................... 10
2.3.1 Importance of feeding .............................................................................................................. 10
2.3.2 Nutrient requirements in animal feeding ................................................................................. 13
2.4 Current status and challenges of the feed manufacturing industry ............................................... 16
2.4.1 Challenges faced by the industry .............................................................................................. 16
2.4.2 Role of the animal feed industry .............................................................................................. 18
2.4.3 Feed manufacturers association............................................................................................... 19
2.5 Value chain concept ........................................................................................................................ 20
3. METHODOLOGY ..................................................................................................................................... 22
3.1 Introduction ..................................................................................................................................... 22
3.2 Project background .......................................................................................................................... 22
3.3 Study sites. ....................................................................................................................................... 23

iv
3.4 Feed producer questionnaire .......................................................................................................... 24
3.4.1 Selection of participants ........................................................................................................... 24
3.5 Feed sampling protocol ................................................................................................................... 25
3.5.1 Feed selection ........................................................................................................................... 25
3.5.2 Procedure for sample collection ............................................................................................... 26
3.5.3 Sample handling and identification .......................................................................................... 27
3.5.4 Sample preparation: storage, grinding ..................................................................................... 27
3.5.5 DM determination .................................................................................................................... 28
3.6 Near-Infrared Reflectance Spectroscopy ......................................................................................... 30
3.7 Data analyses ................................................................................................................................... 31
4. RESULTS AND DISCUSSION .................................................................................................................... 32
4.1 Mapping the value chain ................................................................................................................. 32
4.2 Employment .................................................................................................................................... 35
4.3 Product distribution ......................................................................................................................... 37
4.4 Production ....................................................................................................................................... 38
4.4.1 The Production Process ............................................................................................................. 38
4.4.2 Total production ....................................................................................................................... 40
4.4.3 Production Capacity .................................................................................................................. 40
4.4.4 Production by species ............................................................................................................... 41
4.4.5 Raw material usage in the sector ............................................................................................. 43
4.6 Constraints in animal feed production ............................................................................................ 48
4.7 Product standards............................................................................................................................ 51
4.7.1 Feed analysis ............................................................................................................................. 51
4.7.2 Price and quality ....................................................................................................................... 53
4.7.3 Nutrient composition of compounds and ingredients ............................................................. 54
5. CONCLUSION .......................................................................................................................................... 58
5.1 Limitations of the study ............................................................................................................... 58
5.2Policy implications ............................................................................................................................ 59

v
REFERENCES .................................................................................................................................................. 62
APPENDICES .................................................................................................................................................. 74

i
List of figures
Figure 1 Growth rates of GDP, Industry, Services and Agriculture, 2004 -2013. ............................................ 7
Figure 2 Quartering technique ...................................................................................................................... 27
Figure 3 Map of the animal feeds in Tanzania. ............................................................................................. 33
Figure 4 Employment and level of qualification in the compound feeds sector............................................ 36
Figure 5 Product distribution ........................................................................................................................ 37
Figure 6 The production process ................................................................................................................... 39
Figure 7 Installed vs actual production ......................................................................................................... 41
Figure 8 Compound feed production by livestock species ............................................................................. 42
Figure 9 Breakdown of ingredient usage in feed compounding.................................................................... 46
Figure 10 production constraints identified by respondents. ........................................................................ 48
Figure 11 Ranking of constraints faced by feed producers ........................................................................... 50
Figure 12 Proximate analysis of compound feed and raw materials ............................................................ 51
Figure 13 CP and price of compound feeds ................................................................................................... 53

i
List of tables
Table 1Functions and sources of nutrients ................................................................................................... 14
Table 2 Raw material usage and origin ......................................................................................................... 44
Table 3 Mean (±SD) nutrient composition of compound feed samples ........................................................ 54
Table 4 Mean (±SD) nutrient composition of common ingredients used in the animal feeds sector in
Tanzania ........................................................................................................................................................ 55
ii
Abstract
Tanzania has recently embarked into a period of liberalisation which is undoubtedly having an
impact on the agricultural sector. The effects of liberalisation are feeding through to the animal
feeds sector, which is experiencing a period of vibrant growth and change, which is reflected by
the rapidly increasing number of feed manufacturers. This implies that this sector will play an
important role in meeting the increased demand for animal products. Animal production in
Tanzania is hindered by numerous constraints such as poor nutrition and management amongst
others (Nkya et al., 2007). However it is widely recognised that feed represents the highest cost
in livestock production, accounting for as much as 75% variable costs (Mupeta et al., 2003),
implying that the nutritional quality of feed has a profound impact on productivity and income
(Roy et al., 2004). Therefore, this study was undertaken to characterise compound feeds sector
and assess the quality of compound feeds sold to farmers in Tanzania – through a mixed
methods approach, 25 feed producers were surveyed in 4 different cities, to provide an overview
of the sector, whilst
chemical analysis using NIRS was used to assess the quality of 169 compounds feeds and 131 raw
materials. Compound feed production is dominated by poultry products (96.41%), whilst feed
mills operate below 50% capacity. Raw materials are sourced locally, and maize products make
up more than half of total tonnage. Product standards seem to be satisfactory, as the
components assessed fall within range of cross-country parameters used as guidance.

iii
List of Abbreviations AI - Artificial insemination
BSE - Bovine spongiform encephalopathy
Ca – Calcium
CAADP - Comprehensive Africa Agriculture Development Program
CF – Crude fibre
DEFRA - Department for Environment Food and Rural Affairs
FAO - Food and Agriculture Organization
GI – Gastrointestinal
IFAD - International Fund for Agriculture Development
ILRI - International Livestock Research Institute
IR – Interest Rates
LC - Least-cost
LDC - Less developed country
LP – Linear Programming
LSU - Livestock Units
MLB - Mineral lick block
MLFD - Ministry of Livestock and Fisheries Development
MOF – Ministry of Finance
N - Nitrogen
Na - Sodium
NEPAD - African Union’s New Partnership for Africa’s Development
NIRS - Near-infrared reflectance spectroscopy
NPN - Non-protein nitrogen
P – Phosphorous
SD - standard deviation
SFR - scavengeable feed resources
SSA - Sub-Saharan Africa
TAFMA - Tanzania Feed Manufacturers Association
TBS – Tanzania Bureau of Standards
TVLA -Tanzania Veterinary Laboratory Agency
VAT - Value Added Tax

1
INTRODUCTION
1.1 Background
As Tanzania experiences population growth, economic growth and increased
urbanisation, so food consumption patterns are changing and shifting to higher value products
such as animal products (UNIDO, 2012). Demand is growing both domestically and
internationally; domestically, demand is spurred by a growing population which is urbanising and
an emerging middle class made up of wealthier consumers who are more able to participate in
niche markets for quality meat. Internationally, meat demand is rising and producers are able to
fetch better prices by exporting their produce, largely to neighbouring countries such as Kenya,
Ethiopia, and The Democratic Republic of Congo as well as to countries in the middle-East such
as Kuwait, United Arab Emirates and Oman (MLFD, 2011; SNV, 2008). In general terms, the
events which are unfolding (and which will continue to do so) are common to livestock industries
in many developing countries, particularly in Sub-Saharan Africa (SSA), such that the term
“Livestock Revolution” has been coined to describe such changes (Delgado et al., 1999). These
demand driven factors present realistic opportunities for livestock sector growth which can
contribute to the provision of income, employment and better quality nutrition in Tanzania and
in other parts of the developing world (World Bank, 2005), thus improving the livelihoods of a
large portion of the population as well as meeting the Millennium Development Goals (MDG’s)
(ILRI, 2011). Furthermore, animal production presents numerous benefits such as; regular
income, improved nutrition, by-products such as skin for leather, and organic manure for
improved soil fertility amongst others. Tanzania stands in a promising position to capture these
favourable circumstances, as it is the third largest livestock-producing countries in Africa (MLFD
2011). However, the potential of the livestock industry is far from being realised and the sector

2
has not yet been capable of responding to the opportunities presented, such that slaughtering
facilities operate below 50% capacity (UNIDO, 2012). Despite vast agricultural resources,
Tanzania remains amongst the world poorest countries with a GDP per capita of US$695 (World
Bank, 2013). The agriculture accounts for roughly 27% of the GDP (ibid), 60% of the export
earnings, and about 70% of the population is involved in Agriculture (NBS, 2011). Therefore as a
low-income, agriculturally dependent economy, improving agricultural productivity will prove
vital for the macro-economic growth of the country and in achieving widespread poverty
alleviation.
1.2 Problem statement
Livestock productivity across East Africa is constrained by limited access and availability of high
quality concentrate feeds (Tolera et al., 2000), such that, despite mild efforts of developing feed
production and utilisation technologies, reported usage rates in Kenya, Uganda and Rwanda
were of 33%, 4% and 12% respectively (Lukuyu et al., 2009). In a recent study in Tanzania,
farmers reported that the amount of concentrate feeds purchased and fed to animals is low.
Furthermore, the study showed that farmers are faced with challenges with regards to; poor and
inconsistent quality of commercial feeds, limited capital, insufficient knowledge of costs and
nutritive value of commercial feeds, and rising feed prices (Laswai & Nandonde, 2013).
Furthermore, feeds account for up to 75% variable costs implying that the nutritional quality of
feed has a profound impact on productivity and income (Roy et al., 2004).
1.3 Aims and objectives
Based on the issues aforementioned, the main aim of this study is to evaluate the quality of
compounded feeds sold on the market, and check these quality parameters.
Specific objectives include;

3
Understand and map the animal feeds value chain in Tanzania, identifying the main
actors and the interactions between them.
Evaluate possible relationships between price and quality.
Assess variations in the nutrient content of feeds.
Document the different ingredients used in compound feed production and their origin.
Identify constraints faced by the animal feed sector, and if possible, suggest solutions.
1.4 Outline to the study
The dissertation is organised into five chapters. The first chapter introduced a background to this
study, the problem statement, and the main aims and specific objectives. The second chapter
provides an overview of the key literature, looking at livestock production in Tanzania, with an
emphasis on feeding. Chapter three details the methods of data collection and analysis, as well
as a detailed sampling protocol. Chapter four presents the results and discusses the key findings
in relation to existing literature, whilst the final chapter draws on the final conclusions and
provides policy implications.
4
2. LITERATURE REVIEW
2.1 Political economy of Agriculture
For several decades preceding national independence in 19611, German and British colonial rule
had set up a typical colonial configuration of exporting raw materials in order to control supply in
Western industries (Helleiner, 1976). Following independence, the newly formed Republic of
Tanzania was faced with the challenging task of transforming the country from its role as an
exporter of raw materials and importer of finished goods, to the creation of an industrial base
capable of self-sustaining the country (Bryceson, 1982). One of the key moments in the countries
recent history was the ‘Arusha Declaration’ launched by president Nyerere in 1967, which set
out economic and social organisation based on tight state control, where private sector
involvement almost inexistent (Temu and Due, 2000). Farmers effectively worked under
government contract as all produce was marketed through co-operatives or state owned crop
authorities. These rural collectivisation (or villagisation) schemes were known as ujamaa (IFAD,
2014). The environment was not business friendly and entrepreneurs were viewed with a
negative eye. As put by Temu and Due (2000), the anti-business environment was such that
‘hiding transactions, non-compliance with government directives, evading tax, and bribery to get
licences and permits became pre-requisite skills to do business in the country.’ Early post-
independence failed to achieve the rapid economic growth which was projected in the Arusha
Declaration, and following a famine in 1974 and a collapse of the coffee boom in 1978 the
country entered an economic crises which only worsened with the Uganda War and the OPEC oil
price shock in close succession (Bigsten & Danielsson, 1999).
1 The Republic of Tanzania is made up of former Tanganyika and Zanzibar. Mainland Tanzania was first under
German protectorate from 1885-1920, only to become a British-administered territory under a League of Nations mandate, whilst Zanzibar was under the Sultanate of Oman. Tanganyika gained independence in 1961 (Putzel and Lindemann, forthcoming).

5
During the crisis period (1979-1985), per capita income fell by 1.5% per year,2 and much of this
can be attributed to the poor performance of the agricultural sector (Bigsten & Danielsson,
1999); rewards for peasant production were reduced which led to production inefficiencies and
low producer prices. Low peasant commodity production proved critical in exposing the
weakness of the system; firstly, because export commodities are a source of foreign exchange
reserve, and secondly the non-food population relies on peasant production surplus for
administrative and industrial growth (Bryceson, 1982). In fact, during the late 70’s and early 80’s,
Tanzania became dependent on the import of major grains maize and rice (Skarstein, 2005).
The events during the crisis led to the resignation of President Nyerere and called for immediate
structural transformation. Under pressure from donors, Tanzania began liberalising its economy
in 1986 and has since introduced a broad range of economic reforms such as the Economic
Recovery Programmes I and II which were supported by the International Monetary Fund (IMF)
and the World Bank (WB) (IFAD, 2014; Temu and Due, 2000). Economic liberalisation was seen
as a fundamental tool to liberate private economic initiative and fix the price distortions such
that prices would represent relative scarcities and ensure optimal resource allocation (Skarstein,
2005). With almost immediate effect, competition between the private sector and the
cooperative system was legalised in order to adjust the price distortions that had been created
by state-owned marketing boards who bought agricultural products (Kape et al., 1994). By 1992
the grain market was almost completely controlled by the private sector (Skarstein, 2005).
Furthermore, procurement and distribution of agricultural inputs were liberalised and
agricultural subsidies on inputs and outputs were removed, in order to incentivise specialisation
and innovation, governed by forces of supply and demand (Ngowi, 2007), and in 1995 the
2 Figure is uncertain because of a lack of reliable data and many economic activities took place in the parallel
economy.

6
National Land Policy (NLP) of Tanzania was developed, which entitled property ownership (Lugoe,
2011).
2.1.1 Agricultural growth and poverty reduction
Less than three decades have gone by from when the economy had collapsed, and since then
the Republic has undergone sweeping socio-economic changes. Although there have been many
challenges, the overall outlook is positive; firstly, whilst surrounding countries have experienced
unrest and political instability, Tanzania has remained out of conflicts and can be seen as a
peaceful haven in a region where violence is not uncommon (Bigsten & Danielsson, 1999). While
this is not represented in economic indicators, it should not be underestimated and may prove
vital in offering a friendly environment for future growth and investment. Secondly, Tanzania is
an emerging economy with a high growth potential (TAFSIP, 2011), which has been represented
by the continuous growth in GDP, averaging a 7% increase per year over the last 10 years (World
Bank, 2014). However, this strong economic growth has not been translated into widespread
poverty reduction, as the proportion of people living below the food poverty line in 2007 was
16.6%, down from 22% in 1990 (HDR, 2014). Furthermore, from the Reform period to 2011, per
capita incomes grew by a modest average of 0.6% per year (Lugoe, 2011). This can be explained
by the fact that agricultural growth has stagnated, and economic growth in the last decade has
been driven by the service and industry sectors (Mashindano et al., 2011), as shown in the figure
below.

7
Figure 1 Growth rates of GDP, Industry, Services and Agriculture, 2004 -2013.
Source: Computed using World Bank Data (http://data.worldbank.org)
Given that agriculture supports 70% of the population, particularly in rural areas, (Mashindano
et al., 2011) it becomes clear that agricultural sector growth on a national scale a vital ingredient
in achieving widespread poverty reduction and food security. Agriculture sector growth has
averaged 4.2% annual growth over the last decade, whilst services and industry has grown at 7.9%
and 8.5% per annum over the same time period (Figure 1). This is only marginally above by the
average annual population growth of 2.9% (World Bank, 2014). There does seem to be a
concerted effort to drive agricultural growth on behalf on the government and stakeholders,
who have come to recognise that strong agricultural growth is a necessity to make significant
reductions in rural poverty and food insecurity (Sarris et al., 2006). In fact, de Janvry and
Sadoulet (2010), estimated that overall growth originating from agriculture is at least three times
as effective in reducing poverty compared to overall growth originating in the rest of the
economy. The URT (with the help of donors and public sector) is committed to allocate a
minimum of 10% of its budget in order to achieve the CAADP3 target of 6 per cent annual growth
in agriculture (TAFSIP, 2011). The main aim of the 10 year Tanzania Agriculture and Food Security
3 The CAADP is an initiative of the African Union’s New Partnership for Africa’s Development (NEPAD)
0
2
4
6
8
10
12
2004 2005 2006 2007 2008 2009 2010 2011 2012 2013
An
nu
al g
row
th r
ate
(%
)
GDP
Industry
Services
Agriculture

8
Investment Plan (TAFSIP), is to address core national problems of poverty and food insecurity, by
promoting agricultural growth in Tanzania under the CAADP framework (TAFSIP, 2011). In order
to achieve this, a number of key policies and strategic instruments have been introduced, such
as Kilimo Kwanza (Agriculture First), in order to address the multi-sectorial challenges and
capture the opportunities to transform agriculture in Tanzania (Ngaiza, 2012). As discussed in
section 2.1, agricultural sector growth has the largest impact on poverty reduction (Sarris et al.,
2006), implying that livestock will prove critical in the future socio-economic health of the
country.
2.2 Description of livestock production systems
Tanzania has an immense resource which is yet to be tapped; recent estimates from the 2012
Economic Survey estimated that the livestock population consists of about 22.8 million cattle,
15.6 million goats, 7.0 million sheep, 2.01 million pigs and 60.0 million chickens (URT, 2013).
Poultry - Traditional poultry management remains dominant in Tanzania (especially in rural
areas), in which local chicken breeds roam freely in search of their own food, and are kept
indoors at night within the household (Minga et al., 2000). Indigenous chicken, commonly
referred to as local chicken, are the most numerous poultry species and are reared under a low
input/low output management system, where their diets mainly consist of scavengeable feed
resources (SFR) and household feed waste. As stated by Minga et al. (2000),the low productivity
(in terms of meat and eggs) of local chicken are low due to poor nutrition, poor or no housing,
no targeted breeding, and no veterinary interventions. Nonetheless, this system is an important
component of smallholder farming communities in Tanzania, as it is often the only affordable
poultry system for rural households (Goromela, 2009). Commercial poultry production is
becoming more common in Tanzania, which presents an opportunity for feed producers to

9
absorb this demand. This system is very distinct from the traditional sector in that capital
investment and management is far more intensive, and high nutrient density feeds ensure rapid
turnovers and maximum productivity (Parr, 1988). Feed costs typically constitute roughly 75% of
variable costs of poultry production (Mupeta et al., 2003), implying that the diet of chicken has a
profound impact on productivity and income (Roy et al., 2004).
Cattle - As for cattle, the majority are reared for beef by pastoralists and agro-pastoralists in arid
and semi-arid areas of the country (Mlote et al; 2013). Milk and meat production from the
indigenous cattle is generally low, which is why Tanzania is a net importer of cattle products
(Mwambene et al., 2014). In mainland Tanzania, as in most less developed countries (LDC’s),
smallholder dairy production is common in urban and peri-urban settings, and is especially
important in supplying the increased demand of dairy products from urban residents, since rural
dairy production is very low (Mlay et al., 2005). In this production system, farmers usually keep a
small number of cattle, which are typically crossbred European dairy cattle and Shorthorn Zebu
(Chang’a et al., 2010). Due to rapid urbanisation, small-holder dairying has grown immensely, yet
it is constrained by several factors including low genetic potential and high cost of feeding (Gillah
et al., 2013). Most milk is sold as raw milk through informal channels.
Others – Sheep and goat are mainly raised for meat production in smallholder, extensive
production systems which rely on grazing natural pastures for the supply of feeds (Shija et al.,
2013), whereas pigs kept under indoor systems and are fed by-products and kitchen waste (Swai
and Lyimo, 2014).

10
2.3 Feeds and Feeding
2.3.1 Importance of feeding
Animal performance, regardless of whether it is expressed as yield (meat or milk), growth
rate or disease resistance, is dependent on the quality of nutrition. However, nutrition is often
the most limiting factor of productivity in ruminants and non-ruminants (Corson et al., 1999).
With the increase in size and wealth of the population, and the subsequent increase in demand
for products of animal origin (as previously discussed), increasing the quantity and quality and
quantity of feeds ought to be considered an important duty for the economy of Tanzania (Babić
and Perić, 2011). Feed costs typically represent the highest cost item in smallholder production
systems, implying that both quantity and quality of feed have a significant effect in determining
profitability (Muller et al., 2007; Roy et al., 2004). Furthermore, when concentrates are fed, it is
provided in small quantities, and therefore low returns are achieved from their inputs (Biwott et
al., 1998). The effect of feeding concentrate supplementation on animal performance is
relatively well known and has been documented by several authors; for example, Ebro et al.
(1998) showed that supplementing grazing goats with concentrate increased live weight gain by
23.6% compared to un-supplemented goats, whilst other research has shown that milk yield
increases at higher levels of concentrate feeding (Biwott et al., 1998; Muller et al., 2007).
Supplementary feeding with nutrient rich feeds is especially important in small-holder systems in
East Africa because animal diets mainly consist of fibrous crop residues and low quality hay and
pastures, which are low in protein and energy. Thus, increasing the protein supply through
supplementation helps to build the microbial population to better digest and extract the
nutrients in poor quality feedstuffs (Tolera et al., 2000). Furthermore, supplementation is
important to compensate for low availability and nutritional value of forage during dry periods
(Bosing et al., 2014).
11
With an increasing human population, land holdings are decreasing whilst animal numbers are
increasing (Githinji et al., 2009). At present, 70% of the 88.6 million ha of land in Tanzania are
rangelands (Mwilawa et al., 2008) with a carrying capacity of 20 million livestock units (LSU), and
this land is capable of providing over 90% of feed resources to livestock (Njombe et al., 2011).
However, due to several constraints such as high stocking rates and a growing human population,
these communal pastures typically have a low nutritional value, especially during the dry season
(Mwilawa et al., 2008). As of 2010, the contribution of the livestock sub-sector to the GDP was of
3.8% (NBS, 2011), yet it is the biggest land user of the economy, using 60 million hectares.
Therefore, 68% of the land contributes to 3.8% of the GDP (Lugoe, 2011). In reversing this trend,
more efficient feeding can alleviate land pressure due to reduced stocking rates, without
compromising total animal mass output per unit area of land (Bosing et al., 2014). However, the
efficiency of supplementation will depend on the quality of the supplement (ibid), highlighting
the importance of feed manufacturers in alleviating such pressures.
As previously discussed, the new growing demand propelled by the ‘livestock revolution’
provides opportunities for development in many regards. At a national level high protein foods
can ensure wide-spread food security, whilst livestock producers can benefit from increased
income, provision of employment, draught power, by-products such as skin for leather, and
organic manure for improved soil fertility (Delgado, 2003). However, in order to achieve this, it is
necessary for the nation to commercialise smallholder agriculture, as highlighted by the Tanzania
Agriculture Policy 1997 and the Livestock Policy 2006 (Kurwijila et al., 2011). Currently, practices
such as beef fattening are not common in Tanzania (Mlote et al., 2013). Although there is no
data for Tanzania, reported usage rates of feed production and utilisation technologies in
neighbouring Kenya, Uganda and Rwanda were of 33%, 4% and 12% (Lukuyu et al., 2009). It is in

12
this context that compound animal feeds can play an active role in supporting national
development, as the production of high quality animal feed is important for both feed
manufacturers and livestock keepers. An optimal combination of ingredients ensures a rational
use of available resources whilst meeting the nutritional requirements of the animal. Therefore,
the feed manufacturer can reduce costs and the livestock keeper can maximize profitability
through increased productivity (Babic and Peric, 2011). Optimizing ingredient blends can be
achieved quickly and efficiently using mathematical linear programming (LP) methods, but for
this to be of any value, it is vital that the nutrient content of the available feed resources are fully
known and are crop, location and season specific. However, this is not an overnight process, and
requires the coming together of numerous stakeholders. For example, funds and expertise at a
national level are needed to carry out studies to determine the local feed resource base (and
explore non-conventional sources of feed), whilst reliable laboratory facilities for chemical
analysis are essential to determine the nutrient composition of feedstuffs on a frequent basis
(Safalaoh, 2002).
Concurrently it is equally important to characterize the genetic resources such that the nutrient
requirements of the animals can be precisely established. The large livestock numbers means
that there are immense genetic resources of different livestock species. The a wide variation of
genotypes and genetic heterogeneity in livestock populations in Tanzania, offers unique genetic
attributes such as adaptation to heat and drought and a more efficient utilisation of low-quality
forages (Mwambene et al., 2014). Although this does provide an opportunity for breeding and
selection, there is an urgent need to clearly define breeds in Tanzania, which would enable feed
manufacturers to produce feeds which are accurately formulated to match the nutritional
requirements of the target animal.

13
2.3.2 Nutrient requirements in animal feeding
It is beyond the scope of this research to provide a detailed account of livestock nutrition,
especially because this is a very specific subject area. Information regarding animal nutrition is
well documented and there are several text books which provide extensive material of
livestock’s digestive physiology and metabolism (see for example D’Mello, 2000; Dryden, 2008
McDonald et al., 2011). Nonetheless, there are several underlying principles which must be given
due attention when discussing the nutrient requirements and for different types of livestock in
terms of energy, protein, minerals and vitamins (Parr, 1988). Table 1 below summarises these
basic principles whilst keeping in mind the differences between ruminants and non-ruminants.

14
Table 1Functions and sources of nutrients
Nutrients Description and key functions Main sources
Fats
Fats are high in energy and provide about 2.25 times more energy than the same amount of carbohydrates, thus
acting as a useful source of stored energy. Fat soluble vitamins are present in the lipid content of feeds, and therefore
must be present in the feed, however excess fat lowers feed intake. Essential fatty acids within the oil fraction of feed
ingredients are necessary for chick growth, egg production and milk with an adequate fat content. Stored fat also acts
as a thermal insulator therefore maintaining body temperature (McDonald et al., 2011). Typically, fats are sufficiently
present in most feed ingredients and inclusion as true fat or oil is not common.
Oilseed by-products such as soya bean, cottonseed and
sunflower.
Carbohydrates
Soluble carbohydrates consist of starch and sugars, which are easily digested, and are the main source of energy in
animal feeds (Kellems and Church, 2010). Digestibility of starch and sugars is high and animals are able to utilize them
well. Excess energy is stored as body fat (Lukuyu et al., 2009). In cereal grains, starch and sugars comprise up to 80%,
serving as the main source of energy for maintenance and production.
Crude Fibre (CF) consists of cellulose, hemi-cellulose and lignin and is found in the fibrous parts of plant material
(Lukuyu et al., 2009). Ruminants are very efficient are very efficient at digesting fibrous carbohydrates, and CF is
essential for rumen functions and for the production of good quality milk (Parr, 1988)Contrarily, care must be taken
with swine and poultry, as these are capable of digesting very little of the fibrous component in feedstuffs (Kellems
and Church, 2010).
Soluble carbohydrates Starches: Cereals, cereal by-
products, tubers, roots. Sugars: Molasses
Crude Fibre Cereal by-products, maize
stover, straw.
Protein
Proteins are one of the most important feed components and are an essential nutrient. Proteins are necessary for
several functions within the animal body, and are a major constituent of most body tissues. Proteins are composed of
amino acids which contain nitrogen (N), Protein is required every day for growth and development, maintenance,
reproduction and lactation. Protein requirements tend to decline with age, nonetheless, requirements for amino acids
are generally high. For non-ruminants, essential amino acids (e.g. lysine and methionine) cannot be adequately
synthesised within the body and deficiencies limit the synthesis of proteins, which is why pre-mixes are commonly
used in compounded feeds. This is not an issue for ruminants; rumen microbes are capable of converting non-protein
nitrogen (NPN) into proteins, which are made available to the animal (Lukuyu et al., 2009; Parr, 1988).
Oilseed by-products
Fish meal
Blood meal.

15
Minerals
Mineral components should be considered individually during feed formulation, as these are important in body and tissue structure, digestion and absorption of nutrients and egg shell development. They can be classified into macro and micro-elements. Micro-elements are typically supplied as pre-mixes to be included in the ration, whilst the most important limiting macro-elements such as phosphorous (P), calcium Ca and sodium (Na), are typically supplied through the inclusion of inorganic material (Parr, 1988). Although the exact role that every mineral plays in an animal’s metabolism is not clear, it is known that deficiencies of certain minerals cause symptoms which are relieved
by adding the element to the diet (McDonald et al., 2011). Minerals are commonly referred to as Ash, which is the inorganic material which remains after burning a feed sample (Lukuyu et al., 2009).
Bone meal (P, Ca)
Cereal grain (P)
Fish meal (Ca)
Limestone (Ca)
Common salt (Na)
Dicalcium phosphate (Ca,P)
Vitamins
As with minerals, the natural dietary supply of vitamins provided by the raw materials must be considered before
supplementing (Lonsdale, 1989). Although vitamins are required in relatively small quantities, they are very important
in maintaining good animal health, especially because costs are low in relations to the consequences of a deficiency
(such as a disordered metabolism and eventually disease) (McDonald et al., 2011). Vitamin deficiency is less likely in
ruminants, as they are capable of producing water-soluble vitamins within the gastrointestinal (GI) tract, whilst non-
ruminants rely solely on feed for the supply of fat-soluble vitamins, meaning that vitamin supplementation is essential
in non-ruminant feeding (Parr, 1988).
Cereals
Oilseed by-products
Manufactured pre-mixes

16
2.4 Current status and challenges of the feed manufacturing
industry
2.4.1 Challenges faced by the industry
The role of the industry should be that of providing high quality livestock feeds which meet the
nutrient requirements of livestock in different stages of growth or production, whilst the
production of such feeds remains economical, attainable only through the optimal blending of
ingredients (Babic & Peric, 2011; Pathumnakul et al., 2010). However, as it stands, the feed
industry in Tanzania faces several constraints which ought to be addressed.
The lack of infrastructure means that there are few accredited laboratories which carry out
chemical analysis of feeds. As a consequence, there is a little reliable data and information which
results in animal agriculture being less competitively priced as compared to developed countries
(de Jonge, & Jackson, 2013). The low confidence in the nutritional information of feed provided
by suppliers’ means that buyers (livestock farmers) are not guaranteed high quality feed. In itself,
this suggests that the industry is under-developed, which can in part be explained by its infancy.
As proposed by Safalaoh and Chapotera (2006), the absence of baseline data from which to
anchor recommendations or development strategies, makes public and/or private sector
interventions extremely difficult. Although this research was not set out to fill this information
gap, it can be regarded as an important starting point in characterising commercial animal feed
production in Tanzania.
Furthermore, formal quality control in Tanzania is uncommon both at the production site and at
the selling point, a situation which is exacerbated by the reported presence of counterfeit
labelling in the informal sector (Kurwijila et al., 2011). This situation creates a lack of trust

17
between the various stakeholders. The agricultural sector in Tanzania is characterised by a high
degree of informality (Skof, 2008), and it is assumed that the animal feed sector is no
different. Although the informal sector typically has a strong presence in most of SSA, a recent
study by Schneider et al. (2010) found that Tanzania is amongst a handful of countries which
indicated a high level of informality, as it accounts for about 56% of the gross national income,
18% above the SSA average. However, the distinction between the formal and informal sector is
not clear-cut, especially for smaller industries which are not closely monitored. Nelson & Bruijn
(2005) define an informal activity as one which “has a formal counterpart” and “does not comply
with the requirements of the regulatory system.” Therefore, for the purpose of this research,
feed producers represented by the Tanzania Feed Manufacturers Association (TAFMA) will be
considered formal, whilst those producers who are not part of the TAFMA will be considered
informal.
As for the farmer, optimal feeding requires accurate information on the nutritional value of
feeds in order to develop appropriate feeding strategies for different animals at various growth
stages (Babic & Peric, 2011). A recent study by El-Sayed (2014) on the Egyptian aquaculture feed
industry revealed some of problems which characterise animal feed sectors in developing
countries, that is; over half of the feed producers do not carry out proximate analysis, 60% of
producers do not receive quality control inspections, and less than half the samples analysed
matched the values recorded on the labels. In addition to this, marketing supply chains are
fragmented and underdeveloped. Transport systems are unreliable and inefficient which
increases transaction costs and reduces the quality of perishable agricultural products (Mkenda
& Van Campenhout, 2011). To further exacerbate matters, Tanzania covers a large area with

18
uneven population distribution, which makes it difficult for feed manufacturers to obtain the
necessary inputs required for feed production.
2.4.2 Role of the animal feed industry
Despite being an important link in the livestock production chain, the animal feed industry is
important to help ensure the safety of food for human consumption, and in order to achieve this,
producers must adhere to good manufacturing practices in the procurement, handling, storage,
processing and distribution of animal feed (FAO and WHO, 2008). Recent outbreaks such as
bovine spongiform encephalopathy (BSE), Escherichia coli and Salmonella have highlighted the
importance of the animal feed industry in public health, and although some curative measures
may simply be improving staff training in feed mills (FAO and WHO, 2008), other measures are
more complex require a strong and active institutional presence. For example, government
bodies should be responsible for quality assurance and setting industry standards to be adhered
to. Other more complex and long term duties may involve carrying out research on feed to attain
an all-inclusive knowledge base of the nutritional characteristics of available feed ingredients,
which also leads to the restriction or limited use of certain ingredients.
Developing the feed industry also presents an opportunity for the crop and livestock sectors to
benefit from each other’s production activities. Livestock and crop production have often been
treated as mutually exclusive activities which compete for the same resources, and national
development efforts have failed to integrate the two (Lwoga & Urio, 1987). However, the two
sectors can go hand in hand. For example, feed manufacturers, through the use of crop
residues, can add value to some of the major crops used for animal feed
production. Furthermore, as a general rule, the animal feed industry cannot compete with the
industries which produce food for human consumption, who pay higher prices for raw materials,

19
and only the remaining industry by-products which have satisfied their requirements, can be
used in the animal feed industry (Shipton and Hecht, 2005). Thus, both crop producers and food
manufacturing industries can benefit from the value addition generated from animal feed
production.
The feed manufacturing industry also plays an important role in the socio-economic
development in the country, making important contributions to employment, income-
generation, and to linkages within the value chain. Furthermore, an efficient animal feed
industry, producing affordable feed of high quality, can help ensure that smallholder livestock
keepers are not excluded from the market opportunities presented by the socio-economic
transformation taking place in Tanzania.
2.4.3 Feed manufacturers association
Although literature and information regarding the Tanzania Feed Manufacturers Association
(TAFMA) is almost non-existent, a scoping study carried out by ILRI (REF), found that the TAFMA,
which had been previously set up, has been dormant for many years, but recently there has
been growing interest to revive the association. A strong presence of the association is essential
in protecting the interests of the animal feed industry within the country, and is also responsible
in ensuring the quality and safety of compound feeds (FEFAC, 2013), which is achieved by setting
clear rules and good manufacturing guidelines which ensure self-regulation and improved
government regulation throughout the supply chain (Louw et al., 2013). Furthermore,
associations are useful in providing missing or inadequate services, improving bargaining
strength with suppliers, and allowing a greater co-ordination of the flow of input supplies
(Schmidt et al., 2014). A feed manufacturers association is also required to address the

20
knowledge gaps within the sector, thereby setting the agenda for research and development
(R&D) in order to enhance competitiveness and capacity to innovate, so as to ensure sustainable
and resource efficient livestock production systems (FEFAC, 2013). Overall, the association has
the duty to play a central role in the decision making process within the animal feeds industry
(Louw et al., 2013), acting as a link between all stakeholders in the sector, both public and
private.
2.5 Value chain concept
The value chain approach, which was first developed in the 60’s and 70’s (Kaplinsky, 2000), is
increasingly being used in development research and practice in order to understand the
interactions and relationships which occur in the dynamic and complex agricultural
environments in developing countries (Rich et al., 2011). A value chain includes all links, actors
and activities that begin from the conception of a product through the intermediary phases of
production and delivery through to when the product is consumed (Kaplinsky, 2000; Rich et al.,
2011). This process involves physical transformation and value addition. Although value chains
are extremely complex and lack quantitative analyses, they provide a useful means of
qualitatively characterising the interactions within livestock systems (Rich et al., 2011), therefore
providing a platform for key intervention areas. In relation to this study, an understanding of the
value chain approach offers an opportunity for evaluating integrated intervention initiatives
within the animal feeds sector. The use of the value chain makes this possible by recognising
that compound feeds only form a single component of the value chain, whilst improved animal
productivity through feed improvement depends on the efficacy of the entire value chain (Ayele
et al., 2012). Although this research will attempt to map the compound animal feed value chain,
it makes no attempt to provide analysis of other sectors or actors within the value chain. This is

21
because there are many actors involved in the compound feed chain including farmers, raw
material suppliers, manufacturers, distributors and farmers. All these actors influence the quality
of a feedstuff but they also face their own individual challenges (Bishop, 2013), therefore each
component merits individual analysis, which is far beyond reach of this research. This research
will focus on the manufacturers’ role, whilst taking into account broad considerations of the
more general aspects regarding the compound animal feed value chain.

22
3. METHODOLOGY
3.1 Introduction
The following section specifies how the research was conducted, including the methods of data
collection and analysis. Firstly, the project background and study areas are described, followed
by the research design for both the feed producer questionnaire and the feed sampling protocol.
The procedure for chemical analysis is then explained, followed by the limitations of the
methodology used in the study. It is worth noting that the data collection can be separated in
two distinct parts; a feed producer questionnaire was used to characterise the animal feed
industry in Tanzania, looking at issues such as production capacity and output, raw materials
used, constraints faced etc. In this section, a mixed method approach is used to combine both
qualitative and quantitative data. The second part of data collection describes the feed sampling
protocol, which provides an account of the sampling procedure and chemical analyses.
3.2 Project background
The research was conducted on behalf of the International Livestock Research Institute (ILRI).
The project on “enhancing dairy-based livelihoods in India and Tanzania through feed innovation
and value chain development approaches” began in 2012, with the support of the International
Fund for Agriculture Development (IFAD). The project is commonly known as MilkIT and falls
under the CGIAR Research Program on Livestock and Fish, “more meat, milk and fish by and for

23
the poor” (CRP 3.7)4. The main aim of the project is to enhance dairy-based livelihoods in
Tanzania by intensifying smallholder agriculture. The focus is on enhancing feeds and using
innovation and value chain approaches (Diep Pham et al., 2014)5.
3.3 Study sites.
The study was conducted in the cities of Morogoro, Tanga, Arusha, and Dar es Salaam (DSM).
The sites were selected by the MilkIT project based on several criteria:
High cattle density
High poverty level
High population density
Good access to market
High production potential
Deficit areas with the potential for increasing supply through feed interventions;
Potential partners/stakeholders
Because Tanzania is a very extensive country with diverse people, cultures and agro-ecologies,
the sites chosen for the project cannot be considered representative and as such it would be
misleading and superficial to draw conclusions or make generic assumptions relating to Tanzania
or East Africa. Instead, as explained by Sumberg (1996), due to the exploratory nature of the
research, the aim was to use these areas to highlight the key issues which could be considered
more generally. Having said this, the cities in which the study was carried out greatly differ in
size and geographic location, which offers the opportunity to explore issues relating to scale, raw
material availability, markets and prices.
4 For more information about “more meat, milk and fish by and for the poor”, visit http://livestockfish.cgiar.org/
5 For more information about MilkIT, visit http://milkit.wikispaces.com/,

24
It is also worth noting that although the focus of MilkIT is on dairy based livelihoods, any
intervention in the feed manufacturing sector must consider all animal feeds produced,
especially because dairy feed constitutes a small percentage of manufactured feeds (Brown,
2013). Therefore, this project looks at the feed manufacturing sector from a holistic perspective.
3.4 Feed producer questionnaire
In each study site, a facilitator was present in order to assist with translation. The facilitators
were contacted (through project partners) several days before arrival in each location, and they
were provided with a copy of the questionnaire and details about the project. This gave them
the opportunity to familiarise themselves with the project and discuss any issues before
proceeding with the interviews and sample collection. The questionnaire was piloted with one
feed manufacturer and modified as necessary.
3.4.1 Selection of participants
The snowball sampling technique was used to conduct the interviews. This is a non-random
sampling technique where “survey subjects are selected based on referral from other survey
respondents” (Black, 2011). As stated by Katz (2006), “this sampling technique is often used in
hidden populations which are difficult for researchers to access.” Although animal feed
manufacturers who are represented by TAFMA are not hidden and are relatively easily located,
the number and location of informal animal feed producers was unknown prior to the study.
Therefore this technique was used to capture both the formal and informal producers. However,
snowball sampling is non-random and subject to biases, as respondents who have larger
networks are more likely to be recruited into the sample (Katz, 2006). In each of the four study
sites, the first questionnaire was arranged, through contacts of the facilitator, with a respondent

25
which fitted the profile of the subject required for the study (i.e. animal feed manufacturers).
Starting from the first respondent in each location, the subject was asked to provide the name,
contact and location of other feed producers. A total of 14 formal and 11 informal producers
were surveyed.
3.5 Feed sampling protocol
The following protocol provides details of the feed sampling and analysis, which was developed
following internationally accredited scientific guidelines for feed sampling and analysis (AOAC,
1990; FAO, 2011). The samples were collected from Morogoro, Tanga, Arusha and DSM.
3.5.1 Feed selection
The samples collected for this study can be divided into two distinct categories, raw materials
and compound feeds.
Compound feeds: It is important that samples are representative of the whole, i.e. that the
samples taken reflect the truth of what livestock farmers are buying. Therefore, the information
provided by the feed producer surveys regarding product distribution, was used to track down
the finished feeds to the final selling point. Where producers stated that they sell feeds directly
from the point of production, samples were collected directly from the manufacturer.
Furthermore, raw materials were collected for sampling both from the animal feed
manufacturers and from outlets such as general animal feed shops and veterinary shops. The
compound feeds selected for sampling include all types of compound feed used in livestock
production, thereby excluding domestic and aquatic species. Therefore in each outlet and
production site, one sample of each compounded feed for livestock production was collected. It
is worthwhile mentioning that the number of different types of compound feeds for sale varied
across producers and outlets.

26
Raw materials: The raw materials selected for sampling were the main ingredients, of plant and
animal origin, used in compound feed production. It was not possible to define the target
population prior to the study, as the raw materials used in the animal feed industry were not
known. The feed producer questionnaire was used to provide information regarding raw
material usage. The final sample set consisted of 169 compound feeds and 131 raw materials.
3.5.2 Procedure for sample collection
Compound feeds: Where the feeds were sold in small packages (<2kg), the whole package was
bought, and the quartering technique was used to reach the desired sample size (figure 2).
Where feeds where sold by the kilo from a 50kg batch, several increment (hand grab) samples
were taken from the open bag and combined in a clean container. Once again, the quartering
technique was used to reach the desired size of the composite sample. Because settling of feed
is common, handfuls were taken from the lower and upper end of the sack. It is important to
take a sufficient number of increments in order to obtain a sample representative of the lot
sampled. In some outlets, feed is only sold in 50kg bags, therefore a probe was used in order to
avoid damaging the bag (appendix 6). Both the price per kg and the price per 50kg bag were
recorded.
Raw materials: When samples of raw materials were taken from feed manufacturers, the
random sampling technique was used and several increments (4-5) were taken from different
bags using a probe. However, it must be noted that bags were sometimes stacked in piles,
meaning it was only possible to take increments from the outer bags. When raw material
samples were taken from outlet stores, in which they are sold in small quantities from open
bags, several hand grabs were taken, as explained above.

27
The sample weight for both categories was of approximately 200g, which allows for sufficient
material for analyses and back up, as well ease of storage and handling.
Figure 2 Quartering technique
1) Mix the sample and pour it into a pile, creating a cone. 2) Divide into four equal parts, saving the opposite quarters and discarding the rest. Repeat the process until the desired sample size is reached.
3.5.3 Sample handling and identification
This stage is very important in order to allow the samples to reach the laboratory as quickly as
possible, without deterioration. Upon collection, the samples were placed in a polyethylene
press-seal bags, of a size so that they are almost completely filled by the sample; the air is then
removed by squeezing and sealing tightly, such that the laboratory can determine a dry matter
concentration similar to that in the sample when it was collected. Samples were accurately
labelled with a unique code using a permanent marker pen immediately after collection. In a
separate log book, specific details of the samples were recorded (Appendix 3).
3.5.4 Sample preparation: storage, grinding
Sample preparation is required in order to achieve a homogeneous and consistent the sample
for further analysis. To achieve good analytical data, sample integrity must be safeguarded

28
during transport to the laboratory and during preparation (drying and grinding) in order for the
samples to remain representative of the whole and reduce the chance of chemical damage. The
samples were stored in dry, cool facilities at the TVLA prior to DM determination. A mechanical
mill was used to grind the samples (Appendix 4), until the particle size was such that it passes
through a sieve with a 1mm aperture. This procedure was performed as fast as possible in order
to minimise atmospheric exposure and to avoid generating excessive heat. After each sample
was ground, the grinding machine was carefully cleaned to avoid contamination.
3.5.5 DM determination
Dry matter (DM) content, which is the non-moisture portion of the feed, was determined by
heating a weighed sample of feed (3g per sample) in a drying oven at 103oC, until a constant
weight is reached.
The DM tests were performed by trained personnel at the Tanzania Veterinary Laboratory
Agency (TVLA) in DSM. Subsequent nutrient contents of feeds will be appropriately compared on
a DM basis. Each step in the DM procedure is explained below:
i. Number the crucibles, rinse in water and dry the crucibles at 103 ± 2 °C for at least 2
hours.
ii. Place the crucibles in a desiccator and immediately cover desiccator and allow dishes to
cool to room temperature. (Do not allow dishes to remain in the desiccator for more than
2 hours).
iii. Weigh the empty crucibles to nearest 0.1 mg and record the weight on the work sheet as
W1 (Appendix 5), removing each crucible one at a time from the desiccator and keeping
the desiccator closed between dish removals.

29
iv. Use tongs to handle crucibles and weigh about 3.0000g of sample into the tare weighed
crucible to the nearest 0.1 mg. Record this as W2. Shake the dish gently to uniformly
distribute the sample and expose it to the maximum surface area for drying.
v. Insert samples into a preheated oven at 103 ± 2 °C and dry for at least 2 hours, start
timing once oven has reached the required temperature (dry to constant weight, may
need to check this for various sample types once confirmed use that drying time).
vi. Place samples in a desiccator and close the desiccator in order to allow cooling to room
temperature. Do not allow samples to remain in the desiccator for more than 2 hours.
vii. Weigh the dish with the dried sample (recorded as W3), recording the weight to nearest
0.1 mg.
viii. DM is then calculated as:
% DM = (W3 – W1) x 100 / (W2 – W1)
Where,
W1 = weight of empty dish (g),
W2 = weight of dish and sample (g), and
W3 = weight of dish and sample after drying (g).
The dried portion was then returned to polyethylene press-seal freezer bags with the rest of the
sample. The final step of sample preparation was that of reducing the sample size to be sent for
NIRS analysis. Each sample was thoroughly mixed and the quartering technique was used to
reduce each sample to two samples of 30g each. The duplicate samples were required as a risk
mitigation in case any sample is lost or ruined during transport, and were stored at the TVLA in
DSM.

30
3.6 Near-Infrared Reflectance Spectroscopy
The samples were dispatched from the TVLA on the 6th of August using an express courier
service. The Near-Infrared Reflectance Spectroscopy (NIRS) Method (AOAC, 1990) was used to
estimate the composition of feeds, in Hyderabad, India. This methodology is increasingly used as
it requires minimal sample preparation, it is rapid and non-destructive, allows for simultaneous
measurements of multiple parameters, and enables a large quantity of sample analysis at a low
cost per sample (Corson et al., 1999; De Boever et al., 1993; Kellems & Church, 2010; McDonald
et al., 2011). NIRS is based on the absorption of electro-magnetic radiation in organic
compounds present in the sample, in the wavelength region of 1100-2500 nm (Corson et al.,
1999; McDonald et al., 2011). All samples were analysed and calibrated against conventional
laboratory analyses. The NIRS instrument used was a FOSS Forage Analyzer 5000 with software
package WinISI II. Out of a total of 294 samples6, 147 were selected for calibration and 147 for
validation procedures using the WinISI II samples selection programs. Validation procedures
were based on blind-predictions of laboratory measurements by the NIRS equations developed
in the calibration procedures. Relationships between blind-predicted and measured variables
were described by R2 and standard error of prediction (SEP) (see appendix 7 for calibration
statistics). The NIRS analyses was used to determine Crude protein (CP) (which was by
multiplying the N content by 6.25), ash, fat and In Vitro organic matter digestibility (IVOMD). It is
important to note that IVOMD was calculated using in vitro prediction equations which relate to
ruminants and most of the feeds in this project feeds concern monogastrics, particularly chicken.
For this reason, this component will be excluded from the data analysis.
6 Includes samples collected from a project on animal feeds in Ethiopia.

31
3.7 Data analyses
Microsoft Excel (2013) will be used to produce simple descriptive statistics with the data
generated from the feed producer survey. In order to gain a more complete and coherent
understanding of the animal feeds sector, qualitative data will be mixed with the quantitative
data within the analysis. GenStat 17th Edition was used to analyse data relating to product
quality. Due to the unbalanced design generated by random feed sampling, the restricted
maximum likelihood (REML) method was used to estimate variance components in order to
estimate the effects of source of feed supply (market or feed producer), type of producer
(formal and informal), and frequency of feed analysis, on feed quality parameters. REML was
used as it is a preferred method of estimation as it is a mixed effects model well suited for
unbalanced data (Blanche et al., 2006; Marchenko, 2006). A regression analysis was performed
in order to establish possible price quality relationships per unit of CP in compound feeds. P
values of < 0.05 were considered as significant.

32
4. RESULTS AND DISCUSSION
4.1 Mapping the value chain
The information and understanding gathered during the entirety of this project has been used to
map the value chain of the compound feeds sector in Tanzania, as shown in Figure 3. However, it
must be noted that this is a simplistic representation which is specific to this study. This will
serve as an introduction to several themes which will be discussed in greater detail further on.
The flow of processes in the chain are presented horizontally, with the direction of the arrows
indicating linkages and functions.

33
Figure 3 Map of the animal feeds in Tanzania.
Note: Everything outside the dotted line represents external factors which have an impact in the industry. These are structures and institutions beyond direct control of
participants in the animal feed chain (Legese et al., 2008).

34
Figure 3 provides a snapshot of the animal feeds industry in Tanzania. Most plant and animal
based ingredients are sourced in Tanzania, with the exception of soybean, which is in part
imported from Zambia and India. Producers do not commonly deal directly with farmers. Brokers
(locally known as dalalis’s) act as middlemen and negotiate transactions between farmers and
feed manufacturers. The dalali’s are key actors and do not share market information. They form
loyal relationships with feed producers and are an important form of quality control. Large
companies (mainly in DSM) which process materials for human consumption supply by-products
to the animal feed sector. Premixes, additives and minerals are mainly imported (e.g. Belgium,
Holland, China and Tunisia), but there a few companies who produce in Tanzania. There are very
few importers of premixes, feed additives and minerals, who distribute throughout the country.
Manufacturers buy these micro-ingredients from veterinary input shops.
Most producers use small, locally produced mixers, with an output of 1 to 1.5 t/hour. Only two
of the larger companies use imported mixers (from India and the UK) whilst one company uses
pelleters (from China). Several companies use a least-cost (L-C) computer programmes from
Holland. Quality inspection and certification schemes are the responsibility of the Tanzania
Bureau of Standards (TBS), whilst the manufacturers that analyse their feeds do so at the TVLA
and the TBS (a few use laboratories in South Africa). Some companies outsource veterinarians
for feed formulation, whilst others have veterinarians within the company. It is also common for
mills mix on request, where farmers either bring their own ingredients (and formula
specifications), or buy the raw materials from the manufacturer, paying a fee for the mixing
service. Few companies market their product by handing out leaflets and conducting seminars
with farmers on appropriate feeding practices.

35
Once the finished feed is produced, producers tend to integrate forward into the value chain by
delivering feed directly to farmers (usually only in quantities >10 bags=500kg), as profit margins
are higher. The final product is also distributed to various outlets for sale. Some larger
companies operate their own distribution system with appointed agents throughout the country.
A number of feed producers also run their own commercial poultry operations, therefore
producing feed for on-farm use and for sale.
Once the farmer uses the product, they provide feedback to the manufacturers. If they have
complaints, they phone the number labelled on the bag. Farmers often complain about poor
quality feeds, but feed manufacturers claim that farmers dilute the finished feed with cheap
energy sources such as maize bran. For this reason, it is common for feed manufacturers to
provide one-to-one support to farmers, carrying out personal farm visits when necessary and
providing knowledge about animal nutrition and management.
4.2 Employment
The following section discusses the employment in the compound feeds sector. This only relates
to those directly employed by the feed producing companies. The total number of people
employed by the feed companies surveyed is 375.

36
Figure 4 Employment and level of qualification in the compound feeds sector
Note: Administrative jobs include directors, managers, assistants and supervisors (relating to production, sales and supply). Technical jobs include technicians, engineers and mechanics. Total respondents of 24, as one respondent was unable to provide employment information.
As shown in Figure 4, the dominant form of employment is labour (61% of total). Manual
labourers are commonly referred to as day labourers, performing duties such as loading raw
materials. This unskilled labour explains why almost half of the total workforce in this study are
not qualified. Although this does show that the sector is labour intensive and characterised by a
low degree of mechanisation, it also highlights the importance of the industry in job creation.
Furthermore, these figures only refer to those directly by the feed manufacturing companies,
however the compound feeds sector indirectly creates additional jobs to other actors in the
value chain (e.g. suppliers, traders, distributors etc.)
It is also worth noting that there appears to be a shortage of qualified experts with the sector.
This is clear when looking at the level of qualification within the sector. The lack of expertise
within the sector was also reported by a few respondents, not in terms of numbers but in terms
of availability. According to one respondent, there are plenty of highly qualified experts, but
61.07
19.2
5.87 4.8 4.27 3.47 1.33
0
10
20
30
40
50
60
70P
erc
en
tage
of
tota
l em
plo
yme
nt
Job description
48.8
10.4
31.47
5.07 2.4
0.53 0.8
0
10
20
30
40
50
60
Pe
rce
nta
ge o
f to
tal e
mp
loym
en
t
Level of qualification

37
most of them have been absorbed by the government. Although there is no recent evidence to
support this, Minga et al., (2000) found that of the 400 veterinarians available at the time, most
are employed by the government, whilst others are private practitioners or own drug
distribution businesses. The results from this study supports this as only 3.7% of the total
employment are veterinarians.
4.3 Product distribution
Product distribution (fig. 5) describes how companies get their products to the final consumer.
The majority of compound feeds are sold through distribution channels (73.2%). Some
companies operate their own distribution system whilst other pass their products through a
retailer before being sold to the consumer.
Figure 5 Product distribution
The fact that several companies are vertically integrating within the value chain by selling
directly to farmers may indicate that feed production in Tanzania is becoming increasingly
market-oriented. Strong customer relationships are an important source of market-related
knowledge, whilst at the same time producers are more service oriented, offering consultancy to
0
10
20
30
40
50
60
70
80
Distribution channels Direct sale to farmers On farm use
Per
cen
t o
f to
tal

38
farmers with regards to animal nutrition and husbandry (Bröring, 2010), which seems to be an
attempt to establish loyal relationships with the client base.
4.4 Production
4.4.1 The Production Process
The representation below highlights the main flows in the production process of animal feeds
(Figure 6). However, this schematic depiction is that of a typical animal feed producer. This
cannot be generalised to say that all companies follow the same production process. For a few of
the producers that were surveyed, it was clear that the production process was more complex
and elaborate than what is presented below.

39
Mixing
Raw materials are delivered by truck and handled in 100kg bags.
Upon arrival, a few bags of any material are checked for quality
(mainly for moisture) are weighed upon arrival using a beam scale
(See appendix). Fish meal is passed through a sieve to check for
impurities (sand) and the price is adjusted accordingly (Appendix 9).
PRODUCT
Packaging
All the raw materials are mixed in a mechanical vertical
mixer(Appendix 12) to produce a homogenous products. The
machines are locally produced and are simple to operate. This relies
on continuous tumbling and intermingling of ingredients, as they
move in a fountain type action caused by a vertical screw running
through the centre of the cone shaped mixer (Parr, 1988).
RAW MATERIALS
The mixed feed is expelled directly into 50 kg bags. The bags
are sealed using a sewing machine.
The final product is now ready to be sold. The entire process
typically takes about 1 hour although feeds for chicks require
extra time mixing or a second mix in order to achieve a fine
particle size. The final product may be delivered to farmers or
to outlet points.
Storage
Weighing and
Grinding
Once materials have been weighed, they are stored on elevated
wooden platforms (Appendix 10/11). Very few manufacturers have
storage bins or grain silos. Most commonly, storage and production
facilities are not separated. Producers typically store for short periods
(up to 2 weeks). Producers with higher capital and storage space store
for up to 2 months.
Prior to grinding and mixing, materials must be weighed in exact
proportions, once again, using a beam scale. The raw materials are
then passed through a hammer mill grinder, (Appendix 12). The
grinder is attached to a central shaft which feeds through to the
mixer. Materials which do not require grinding can be fed directly into
the mixer.
Figure 6 The production process

40
4.4.2 Total production
This study revealed that the 25 manufacturers surveyed produce an average of 227.2 t/working
day, and the average production per manufacturer was of 9.09 t/day. Although this study by no
means attempts to of quantify national production of compound feeds, a global feed summary
compiled by Alltech (2013), suggests that the production of feed in 2012 in Tanzania totalled
258,000 tonnes, ranking the country 98th out of the 134 countries assessed. Although Alltech
does recognise that “numbers for developing countries may be less accurate” (Alltech, 2013),
the figures do indicate that animal feed production in the country is relatively low, especially
when compared to neighbouring Kenya, which is a country of similar history, geography and
population (Miguel, 2004), yet produced 955,000 tonnes of animal feed in 2012 (Alltech, 2013),
almost four times more than Tanzania.
4.4.3 Production Capacity
Figure 7 shows the installed and actual production of all the feed companies surveyed. It was
found that on average, feed mills operate at 48.9% of their installed capacity, whilst hardly any
companies operate close to full capacity. Although not presented below, the average quantity
produced per company is of 9.1t/day.

41
Figure 7 Installed vs actual production
Note: figures are estimates because most manufacturers were not able to provide accurate output figures.
The results presented in figure 7 highlight a phenomenon which is common in Tanzania. That is
that livestock sub-sectors operate far below full capacity. In the dairy sub-sector, most of the
processing plants operate at less than 30% of the installed capacity (TAMPA, 2011), whilst
slaughtering facilities also operate below 50% capacity (UNIDO, 2012). Similarly,
Egbunike and Ikpi (1988) found that feed mills in Nigeria were operating at 36.52% of the
installed capacity, whilst a more recent study of the feed milling industry in neighbouring Kenya
found that feed mills operate at 44.8% of the installed capacity (Githinji et al., 2009). Although
this is a cause for concern as it implies production inefficiencies, it also offers an opportunity for
growth in the use of animal feeds, as feed millers would be able to absorb extra demand.
4.4.4 Production by species
The section below presents the production of compound feeds according to livestock species. It
was revealed that the compound feeds sector in Tanzania is dominated by poultry feed products.
Avg Total
0
10
20
30
40
50
60
70
80
Qu
anti
ty (
t/d
ay)
Company
Installed capacity
Average quantityproduced

42
Figure 8 Compound feed production by livestock species
Note: Figures are estimates. Three of the 25 respondents were unable to provide estimates as they reported a large
amount of seasonal variation.
As shown in Figure 8 combined poultry products (broiler and layer feeds), make up 96.41% of
animal feed products, whilst dairy and pork products are almost absent, and beef compounds
are completely non-existent. Once again, these findings are comparable to neighbouring Kenya,
where poultry feeds form roughly 90% of feed mill products (Githinji et al., 2009). These findings
further confirm the trend which characterises East Africa, as the low usage rates of dairy feed
production and utilisation technologies in neighbouring Kenya, Uganda and Rwanda were of 33%,
4% and 12% (Lukuyu et al., 2009). In contrast, recent data published by the Department for
Environment Food and Rural Affairs (DEFRA) paints a different picture regarding the production
of animal feeding stuffs in a developed country. In Britain, cattle and calf feed products make up
39.8% of the total production followed by poultry, pig and sheep feed at 31.3, 16.4 and 6.8%
respectively (DEFRA, 2014), whilst in 2006, Poultry represented 32% of global feed production
(Bröring, 2010).
[CELLRANGE]
[VALUE]
[CELLRANGE] [CELLRANGE]
0
10
20
30
40
50
60
Broilers Layers Dairy Swine
Per
cen
tage
43
This findings above the dissimilarities in feeding and management systems between SSA and
Western Europe. Despite the large cattle population in Tanzania, it is clear that very few farmers
provide their cattle with compounded feeds for both beef and dairy cattle. Informal
conversations with farmers at a milk collection centre in Tanga revealed that farmers do not feed
compounds because of the high cost. The farmers stated they supplement their cattle mainly
with maize bran, cottonseed cake and sunflower seed cake, whilst the mineral requirements are
met through the provision of mineral lick blocks (MLB’s)7. As stated by Mlay et al., (2005),
farmers use these raw materials as they are widely available and low cost sources of energy and
protein. Moreover, the dairy farmers claim that their cattle are of low genetic potential, due to
the fact that artificial insemination (AI) is costly and unreliable. These findings are consistent
with those of Gillah et al. (2013), who found that AI services are not commonly used for the
same reasons mentioned above, and that supplementation of dairy cows in Morogoro and DSM
occurs with protein rich concentrates during times of low feed availability. It is likely that the low
genetic potential perceived by farmers’ implies they do not justify the returns to investment of
feeding dairy meal.
4.4.5 Raw material usage in the sector
The following section presents details on raw material usage in compound feed production, and
when possible respondents also provided information regarding the source of ingredients used.
Respondents were also asked in what quantities they use each ingredient (per week). This was
used to show levels of incorporation in compound feeds.
7 MLB’s contain several minerals, and are provided with the assumption that animals will regulate their mineral
intake thereby avoiding deficiencies (Zervas et al., 2001).

44
Table 2 Raw material usage and origin
Ingredient Quantity used
(t/week) Number of mills
using the ingredient
Level of incorporation in formulation (%)
Source of ingredient
Average Min Max
Energy sources
Maize grain 98.1 24 39.87 14.68 80.90 Dodoma, Mbeya, Tanga, Iringa, Manyara, Songea
Maize bran 23.908 24 10.33 2.39 25.69 Local maize millers
Wheat pollard 1.31 8 3.59 0.76 6.96 Flour milling industry DSM
Wheat bran 1.936 6 5.49 1.47 15.25 Flour milling industry DSM
Chick wheat 0.82 3 4.76 2.94 8.25 Flour milling industry DSM
Rice polishing 5.086 15 5.34 0.49 16.38 Rice milling industry Morogoro
Broken rice 0.82 2 0.36 0.07 0.65 Rice milling industry Morogoro
Rice bran 2.2 1 14.12 14.12 14.12 Rice milling industry Morogoro
Sorghum 0.732 2 6.23 0.18 12.27 NA
Cassava flour 0.006 1 0.07 0.07 0.07 NA
Protein sources
Fish meal 20.392 22 8.14 1.46 19.06 Mwanza, Musona
Cottonseed cake 17.608 22 7.14 1.28 17.70 Mwanza, Shinyanga, Kahama
Sunflower seed cake 20.94 23 11.19 0.52 30.95 Dodoma, Singida
Soybean meal (toasted) 9.966 17 5.69 1.26 13.40 Mbeya, Morogoro, Uganda, India (processed in DSM).
Soybean meal (full fat) 1.56 3 4.37 2.82 7.15 NA
Blood meal 3.42 17 2.95 0.40 8.56 Mazizini processors (DSM)
Coconut cake 1.08 2 4.12 1.10 7.13 NA
Palm oil cake 0.058 1 0.79 0.79 0.79 NA
Lentil bran 0.2 1 0.55 0.55 0.55 NA
Brewery yeast 0.2 1 0.94 0.94 0.94 Brewery industry (Arusha & DSM)
Minerals, additives and premixes
Bone meal 4.448 22 2.91 0.16 11.01 Mazizini processors (DSM)
Limestone 7.328 23 4.51 1.20 11.93 Coast region
DCP 2.602 21 1.03 0.13 7.70 Holland, Germany, India, China, Tunisia
Methionine 0.642 24 0.41 0.03 5.16 Holland, Tunisia
Lysine 0.492 24 0.31 0.03 3.87 Holland, Tunisia
Common salt 0.732 21 0.41 0.02 2.58 Coast region

45
Oyster shells 0.766 5 2.15 0.09 3.67 Coast region
Poultry premix 1.564 23 0.77 0.06 3.67 DSM, Thailand, Tunisia, Arusha, DSM.
Toxin binders 0.134 7 0.13 0.03 0.38 Holland, Belgium
Enzymes 0.026 5 0.06 0.01 0.17 India, China
Growth promoters 0.026 3 0.32 0.03 0.84 India
Molasses 0.126 3 0.31 0.15 0.47 Sugar refineries (Morogoro, DSM)
Coccidiosat 0.002 1 0.09 0.09 0.09 NA
Carotenoids 0.01 1 0.03 0.03 0.03 NA
Note: The above data was gathered from 24 feed manufacturers. 1 respondent was unable to provide estimates. Several respondents claimed that they only deal with suppliers and are unaware of the source of certain ingredients.

46
Figure 9 provides a visual breakdown of the various products used in feed compounding. Maize products
were by far the most used ingredients (53.20% of the total).
Figure 9 Breakdown of ingredient usage in feed compounding
It is by no means a surprise that maize is by far the most used input in the animal feeds sector in
Tanzania. In fact, maize products (maize grain and maize bran), represent 53.20% of all inputs
used by feed compounders, which is very similar to the South African and Kenyan feed industry,
where maize represented 54% and 50 to 65 % of inputs used respectively (Githinji et al., 2009;
Louw et al. 2013). In Tanzania, maize accounts for 32% of total food production and it serves as a
source of income for 85% of the population (Chile and Talukder, 2014). Similarly, this study
shows that the compound feed industry relies heavily on maize. One key issue is that Tanzania is
dependent on rain-fed maize production as a source of national supply (Cooksey, 2011), leading
to large variations in price and supply. This situation is likely to be exacerbated by the expected
increase in climate variability in the future (Rowhani et al., 2011). This this is an issue which the
animal feed industry ought to address, possibly through exploring the use of non-traditional and
locally available feed sources.
Maize products 53.20%
[CATEGORY NAME] and meals
[VALUE]
Fish meal 8.89%
Rice products 3.53%
Limestone 3.20%
Bone meal 1.94%
Wheat products 1.77%
Blood meal 1.49% Others
1.08%
Vitamins, minerals and additives
3.06%

47
The use of soya in Tanzania does merit significant consideration. Despite the promising potential
of soya bean for its use in human and livestock feeding mainly due to the high protein and oil
content compared to other plant protein sources (Foley et al., 2013; Friedman & Brandon, 2001;
Oliva-Teles et al., 1994; Palić et al., 2011), soybean has remained a minor crop in Tanzania and
production has been far below its potential, which has been attributed to the lack of knowledge
on its use in animal feeding (Malema, 2005). The fact that soya bean is not widely used in the
animal feed industry is made clear by the fact that 17 out of 24 manufacturers use it in
formulating diets (70.83%). This is low when compared to South Africa, where 60% of the
national crop is used in the animal feeds sector (Dlamini et al., 2014). On a global scale, soybean
demand for the animal feed industry has been driving worldwide expansion of this crop
(Steinfeld et al., 2006), such that soybean meal is the most dominant of all animal protein
sources globally. In 1999 soybean meal accounted for 46% of the total volume of protein used in
the EU animal feed sector (Brookes, 2001). However, the situation in Tanzania is different, as this
study revealed that the use of fish meal is almost double that of soybean meal (table 2).
The relatively low usage rates of soybean in Tanzania is likely due to a shortage of supply within
the country, as the availability and price of raw materials is most important in influencing
ingredient use (Brookes, 2001). In fact, it is interesting to note soybean is the only imported raw
material (excluding minerals, additives and premixes) in the animal feed industry. This is an issue
which requires consideration as the increased national production of soybean would help
overcome the shortage and lower prices, whilst reducing the dependency on fishmeal, which is a
highly volatile product in terms of both price and supply (Sitjà-Bobadilla et al., 2005).
Furthermore, Chianu Jonas et al. (2008) reported that fishmeal from Mwanza is variable and the
protein content can be as low as 32%, and contamination with inorganic materials (sand) is
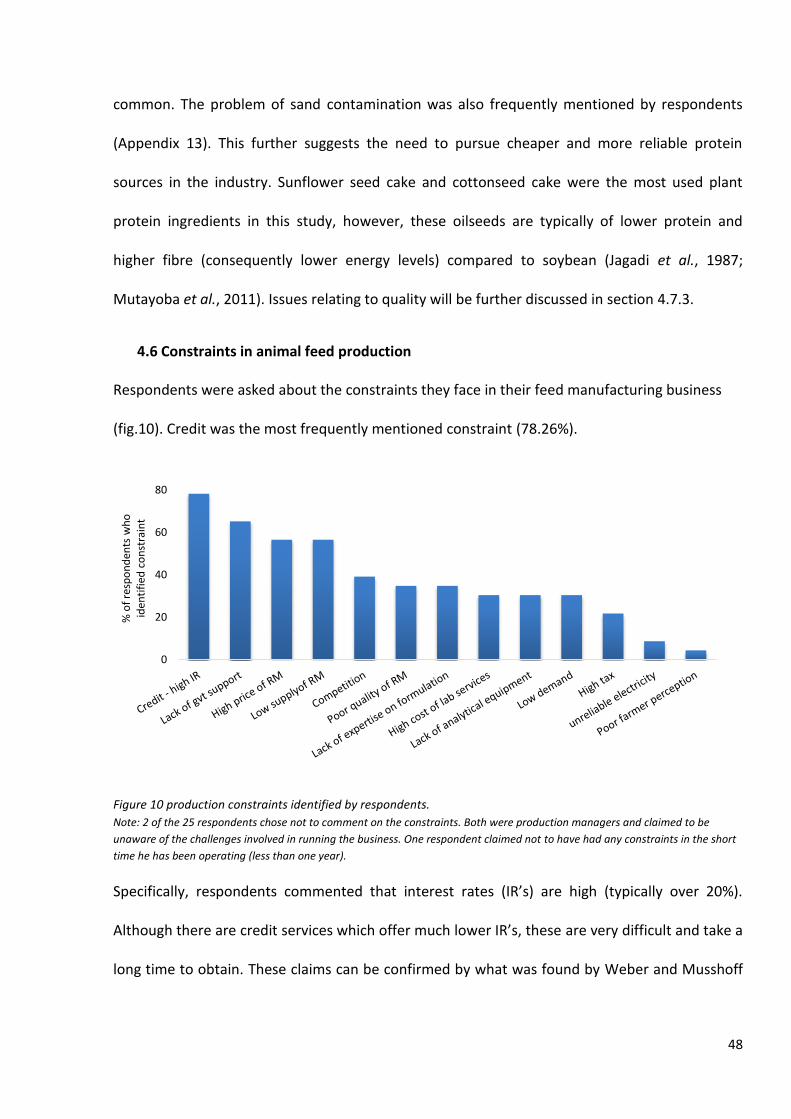
48
common. The problem of sand contamination was also frequently mentioned by respondents
(Appendix 13). This further suggests the need to pursue cheaper and more reliable protein
sources in the industry. Sunflower seed cake and cottonseed cake were the most used plant
protein ingredients in this study, however, these oilseeds are typically of lower protein and
higher fibre (consequently lower energy levels) compared to soybean (Jagadi et al., 1987;
Mutayoba et al., 2011). Issues relating to quality will be further discussed in section 4.7.3.
4.6 Constraints in animal feed production
Respondents were asked about the constraints they face in their feed manufacturing business
(fig.10). Credit was the most frequently mentioned constraint (78.26%).
Figure 10 production constraints identified by respondents.
Note: 2 of the 25 respondents chose not to comment on the constraints. Both were production managers and claimed to be
unaware of the challenges involved in running the business. One respondent claimed not to have had any constraints in the short
time he has been operating (less than one year).
Specifically, respondents commented that interest rates (IR’s) are high (typically over 20%).
Although there are credit services which offer much lower IR’s, these are very difficult and take a
long time to obtain. These claims can be confirmed by what was found by Weber and Musshoff
0
20
40
60
80
% o
f re
spo
nd
ents
wh
o
iden
tifi
ed c
on
stra
int

49
(2012), that is, that although micro-finance institutions do exist, agricultural firms do face higher
obstacles to get credit. Lack of government support, was the second most mentioned constraint,
and all of the respondents claimed that they have never received any form of government
support such as extension services, training of feed formulation, or subsidies.
Respondents were then asked to rank the constraints they identified in descending order of
importance. What is important to notice is that although high tax was only mentioned five times
as a constraint, it ranked as the most important constraint four of the five times (figure 11). As
an agricultural input, animal feed companies are exempt from Value Added Tax (VAT) (MOF,
2005), but several respondents voiced their concern that VAT exemption on agricultural inputs
may be removed. It is therefore likely that those who mentioned high tax as a constraint were
referring to the threat of the introduction of VAT in the animal feeds sector.

50
Figure 11 Ranking of constraints faced by feed producers
Note: n indicates the number of responses, which differs due to the fact that the number of total constraints mentioned varied between respondents. For example, two
respondents identified only one constraint whilst five respondents identified 8 constraint
0
1
2
3
4
5
6
7
1st most important 2nd most important 3rd most important 4th most important 5th most important 6th most important 7th most important 8th most important
n=22 n=20 n=20 n=16 n=13 n=8 n=7 n=5
Tim
es r
anke
d
High price of RM
Low supplyof RM
High tax
Lack of gvt support
Competition
Credit - high IR
Low quality of RM
High cost of lab services
Lack of analytical equipment
Low demand for feeds
Lack of expertise on formulation
Poor farmer perception
Unreliable electricity

51
4.7 Product standards
4.7.1 Feed analysis
Figure 12 below shows how often feed manufacturers perform proximate analysis of their
finished products and raw materials. Seven manufacturers never analyse their compound feeds,
and it was often stressed that farmer feedback is the most important form of quality control, and
15 manufacturers never analyse raw materials. It is worth noting that all of the companies that
never analyse their feeds produce 3 t/day or less. On the other end of the scale, the three
companies that analyse their feeds most frequently (once a week) produce 10 t/day or more.
Nonetheless, even several of those who do carry out proximate analysis claimed that farmer
feedback is an important part of quality control.
Figure 12 Proximate analysis of compound feed and raw materials
Note: number of respondents was 24, as one respondents were unable to respond as the subject claimed that only the company
owners are aware quality control.
These findings indicate that many small scale manufacturers do not justify the cost of feed
analysis (at 15,000 TSH = 9 USD per sample at the TVLA laboratory), as it is clear that small
0
2
4
6
8
10
12
14
16
Freq
uen
cy o
f an
alys
is
Compound Feeds
Raw materials

52
producers incur a disproportionate increase in unit costs relative to larger producers. Another
problem which emerged was the fact that the TVLA (which is the main laboratory used for feed
analysis) do not perform analysis of raw materials, although there is a plan to calibrate the NIRS
with raw materials, so that in can be deployed in the animal feed industry (Maulaga, personal
communication, 2014). Furthermore, it is clear that the industry lacks statutory regulation and
monitoring as only 3 out of 25 respondents had received one quality control inspection, whilst
none of the producers label the nutrient contents of their feeds. Manufacturers seem to have no
legal obligation to monitor the quality of their feeds, an issue which is brought about by the lack
of enforcement of regulations. It was revealed that the TBS, which is the national standards body
responsible for quality control, has outdated quality standards which have not kept up with
international standards and ought to be reviewed. However, setting appropriate standards
requires significant research in order to establish the nutritional requirements according to
species, inherent genetic potential, environment, raw material availability, stage of livestock
production and management factors (Mandal et al., 2005; Vaidya, 2001).
This study showed that 9 of the 25 interviewed use L-C computer programs, 10 use feed tables
and 6 formulate rations solely based on experience. For feed products to be competitively priced
and for manufacturers to maximise profit, L-C ration formulation software is very important.
Considering the fact that that feed can constitute up to 80% of total costs, it becomes clear that
L-C formulation can provide manufacturers with an opportunity to minimise the cost of inputs
used, whilst farmers can be guaranteed efficient feed at a minimum diet cost (Kellems & Church,
2010; Pesti & Miller, 1993).

53
4.7.2 Price and quality
A linear regression analysis, which plotted price as the response variable, showed that there is a
significant positive correlation between price per kg and CP (p<0.01), however, a low R2 value
(0.17) shows a poor predictive value of the data (fig. 13).
Figure 13 CP and price of compound feeds
These findings indicate that despite the lack of statutory control product labelling, and large
amount of variability, there appears to be a system self-regulation within the industry, which
may be explained by the competitive nature within the industry, meaning that manufacturers
are forced to competitively price their products in order to retain their clientele. In order to
explore issues relating to product quality. Although competition was mentioned as a constraint
by 39% of the respondents, farmers may be benefitting from the competitive environment as
producers strive to maintain the quality of their products.
Because several respondents had mentioned the fact that adulteration of feeds with maize bran,
and counterfeit packaging has been a problem in the past, a REML analysis was run in order to
establish whether there are differences in CP further down the supply chain. The results showed
that despite there being a significant difference (p<0.01) between the supplier type (point of
400
500
600
700
800
900
1000
1100
12.00 17.00 22.00 27.00 32.00
Pri
ce/k
g (T
Sh)
Crude protein (%dm)

54
manufacturer and open market), there was no significant difference between the mixed effect of
supplier type and sample type on cp. This is due to the fact that different categories of
compound vary in their optimal nutrient composition, for example, the protein requirement for
layers is lower than that for broilers. The REML was also used to look at differences in CP
between formal and informal producers. Once again, the factors were significant on their own,
but there was no interaction between the factors. The same outcome was again attained in
assessing whether there are difference in CP between producers who never analyse their feeds
and those who do.
4.7.3 Nutrient composition of compounds and ingredients
Table 3 Mean (±SD) nutrient composition of compound feed samples
Feed type N %
DM Fat Ash CP IVOMD
Broiler Starter 36 89.95(0.52) 2.46(1.49) 10.27(1.34) 20.68(3.01) NA
Broiler finisher 41 90.01(0.49) 2.99(2.12) 8.75(1.27) 20.25(2.35) NA
Chick feed 17 89.56(0.66) 3.29(2.65) 10.53(1.48) 20.80(3.22) NA
Growers mash 19 90.14(0.43) 3.23(1.87) 10.62(1.40) 18.72(1.96) NA
Layers mash 35 89.94(0.53) 2.79(1.86) 10.93(1.73) 19.52(2.01) NA
Dairy meal 6 90.71(0.46) 3.90 1.80) 12.16(1.72) 19.61(2.03) 62.62(3.07)
N = number of samples; DM = dry matter; CP = crude protein; IVOMD = In vitro organic matter digestibility; NA = not analysed. Note: all parameters (except DM) are expressed on a dry matter basis.

55
Table 4 Mean (±SD) nutrient composition of common ingredients used in the animal feeds sector in Tanzania
Feed type N %
DM Fat Ash CP
Cottonseed cake 27 91.15(0.39) 5.54(2.83) 7.97(1.19) 31.38(4.92)
Sunflower seed cake 27 91.98(0.28) 10.94(2.97) 7.83(0.84) 28.64(2.36)
Fish meal (Mwanza) 32 90.14(0.67) 5.13(2.65) 14.21(2.90) 49.23(3.45)
Fish meal (sea) 9 88.36(0.70) 1.72(1.52) 19.47(2.85) 39.45(1.94)
Soybean meal (toasted) 15 91.17(0.28) 6.15(5.08) 9.82(2.42) 39.34(5.56)
Soybean meal (FF) 5 91.11(0.11) 15.58(0.88) 9.86(0.48) 37.46(1.38)
Maize bran 36 90.22(0.45) 6.11(3.08) 7.94(1.26) 14.58(1.40)
Maize grain 33 88.95(0.31) 3.50(1.41) 4.53(1.31) 11.17(1.40)
Wheat bran 7 90.31(0.25) 1.85(0.67) 9.42(1.02) 18.81(0.98)
Wheat pollard 6 90.15(0.24) 1.97(0.63) 8.55(1.31) 17.46(1.67)
Rice polishing 10 90.26(0.65) 5.01(2.91) 14.86(3.28) 14.87(3.25)
Lentil bran 8 90.72(0.70) 2.09(3.65) 10.67(1.87) 19.21(4.71)
N = number of samples; DM = dry matter; CP = crude protein; IVOMD = In vitro organic matter digestibility; NA = not analysed. Note: all parameters (except DM) are expressed on a dry matter basis.
The DM content of all compound feeds and raw materials were within acceptable ranges, and
had a low standard deviation. As stated by Kaijage et al. (2014), this suggests that all feeds
analysed are appropriate for use and storage in animal feeds. High DM contents control the
growth of mould in feeds (Akande et al., 2006), thereby reducing deterioration which is
particularly important in tropical countries (Kaijage et al., 2014).
The high levels of ash recorded in the fish meal may indicate a high mineral content, however
further analysis would be required in order to determine the proportion of acid insoluble ash
(RAO and Xiang, 2009), so as to detect the presence of undesirable materials such as sand, as
this was a problem frequently mentioned by feed producers.
Crude protein (CP) is the most important quality indicator in animal feeding (Dale et al., 2012)
and therefore merits considerable attention. At a glance, the figures related to CP in Table 3 are

56
twofold; whilst the mean CP of all compound feed categories can be considered satisfactory,
there appears to be large variation, as indicated by the standard deviation (SD). The satisfactory
levels of CP can be appreciated when the means of CP are compared to statutory requirements
in other countries. For example, the mean CP of Broiler finisher feeds in this study was of 20.68%,
whereas the minimum recommended levels of CP in Broiler Starter feed in Kenya, Malawi, and
India are of 22%, 22%, and 20% respectively (De Groote et al., 2010; Safalaoh & Chapotera, 2006;
Vaidya, 2001), and the typical value of CP in broiler starter feeds is of 23% (Bregendahlet al.,
2002; Miller, 2004). Although there are a limited amount of studies which have assessed the
quality of compound feed in SSA, these results do contradict what has been revealed by several
authors. For example, Safalaoh & Chapotera (2006) found that the mean CP in broiler starter,
growers mash and dairy meal was of 16.96%, 12.54% and 11.34% respectively, several
percentage points below the averages presented in table 3. El-Sayed (2014) and Eze (2011) have
also suggested sub-optimal protein contents in compound feed products in Egypt and Nigeria
respectively. On the contrary, the results show that the mean CP in dairy meal (19.61) fall within
the ranges reported by Lukuyu and Blummel (2010) of 18-23% in neighbouring Kenya. All other
quality parameters in this study also show acceptable values in various countries (for examples
of such measures, see Carew et al., 2005; De Groote et al., 2010; Safalaoh & Chapotera, 2006;
Vaidya, 2001)
As for raw materials, despite the high CP content of fish meal (49.23% from Mwanza) relative to
other protein sources, several other studies have shown that fish meal CP can be as high as 60%
Nadeem et al., 2005; Nalwanga et al., 2009). Nonetheless, the high CP in fish meal relative to
other protein sources does justify the high rate of inclusion within the industry (discussed in

57
section 4.4.5). The average CP in both full-fat and toasted8 soybean meal was of 37.46 and 39.34%
respectively, which is lower than the typical ranges of between 40 to 50%DM (Foley et al., 2013;
Friedman & Brandon, 2001). Furthermore, studies conducted in Tanzania by Jagadi et al. (1987)
and Mutayoba et al. (2011) revealed higher CP values in soybean meals (52.4% and 46.26%
respectively). In addition to this, soybean meal (toasted) had a large amount of variation, as the
standard deviation of CP in was the highest amongst all samples, but this is likely due to the fact
that the product is sourced from different countries (e.g. India and Uganda) and is likely to have
been subject to different processing methods. The other oilseeds (cottonseed cake and
sunflower seed cake) had mean CP of 31.38 and 28.64% respectively. As for sunflower, Mlay et al.
(2005), found that the CP of sunflower seed cake in Morogoro was of 23.6%, whilst a feed
database collated by ASARECA suggests that cottonseed cake values in Tanzania range from 24,9
to 48,6% (Mgheni et al., 2013).
Rather than providing extensive discourse on each raw material, it is clear that raw materials
greatly vary in their composition, as is clear by the high SD’s in table 4. This is by no means an
abnormality, as composition is affected by a range of factors including cultivar, soil type, growing
conditions and processing method (Dale, 1996). Although variation in raw material composition
is inevitable, it is clear that feed manufacturers encounter difficulties in achieving consistency in
product quality, a problem which is exacerbated by the fact that 62.5 percent of the company’s
surveyed never analyse raw materials.
8 Toasted soybean meal has undergone processing for the removal of oil either mechanically or by using solvents.
Full-fat soybean meal is where the oil contained has not been extracted. Both products must undergo heat processing to reduce the presence of anti-nutritive factors such as Trypsin inhibitors (MacIsaac et al., 2005; Subuh et al., 2002).

58
5. CONCLUSION
Overall, it seems that there is a concerted effort by producers to provide quality feeds, but it
appears that producing a product of consistent quality is not easy to achieve, as the composition
of the raw materials is what ultimately determines the quality of the finished feed. The results
from the feed analyses showed that despite the fact that the sector is characterised by a high
degree of informality, few expertise, the lack of government regulation, and very few
laboratories for feed analysis, the compound feeds produced are of satisfactory quality.
However, it can also be concluded that there is a large amount of variability in the compound
feeds, which means that farmers are still not guaranteed a high quality feed on a frequent basis.
This places a greater emphasis on the importance of raw material analyses, both for the
producer and at a national level, in order to vast database of the available feed resources. The
increased confidence about nutritional quality would allow farmers to use this information in
order to develop feeding strategies for improved animal performance and income. However, this
could not be successfully achieved without improving knowledge and training on livestock
nutrition management.
5.1 Limitations of the study
Although this research does provide valuable insight and data relevant to the compound feed
sector, the data must be treated with caution for several reasons;
One limitation of the study is the short time period in which the data was collected. The feeds
were sampled over a 20 day period which therefore does not address issues relating to seasonal
variation both in terms of quality and quantity. Furthermore, the samples were collected
towards the end of the rainy season, which coincides with the beginning of harvest. This means
that the strong seasonality of available quality and quantity of feeds which is typical in Tanzania,

59
is likely to translate into better than average marketed feed products during the time of sample
collection, with likely effects on price. This warrants further research into the effect of seasonal
variation on raw material availability and composition feed in Tanzania.
The most significant limitations of this study was the lack of several nutritional components. Due
to the fact that the IVOMD and ME were calculated using in vitro prediction equations which
relate to ruminants, they are not applicable to the majority of compound feeds, which were
mainly poultry products. The lack of accurate energy components is severely limiting due to the
fact that energy is one of the most important indicators of feed quality, since it is required for
the execution of metabolic processes and animal activity, essential for maintenance and
production (McDonald et al., 2011; Palić et al., 2012). This means that knowledge of this
parameter is extremely important in diet formulation and in assessing the quality of a given feed.
In addition to this, a break-down of mineral components present in the ash component of the
feed would have been useful providing regarding the mineral supply within feeds in Tanzania
(Kaijage et al., 2014), whilst at the same time it may have offered an opportunity to explore
issues relating to adulteration.
Another problem which was encountered was the small number of samples for different feed
types. This made it difficult to achieve statistical significance when performing REML variance
analyses. This problem may have been avoided by collecting more samples, or by replicating the
initial samples, in order to improve the quality of the input data (Rowhani et al., 2011).
5.2Policy implications
The findings of this research suggest at least 4 overarching policy implications, intertwined
around the absence or deficiency of institutions at various levels.

60
First, credit has been found to be the most common constraint to production in Tanzania. In
order to address the credit issue, policy needs to first assess what are drivers behind the lack of
viable access to credit, and act accordingly by developing customised solutions. Microfinance has
for long represented a valuable and effective tool to enhance credit accessibility – being known
for bringing benefits that expands beyond credit, such as empowerment and promotion of
gender equality. Yet, this research found that microfinance in the Tanzanian context may not be
the best solution to address credit constraints, and there is need for developing credit and
savings models that provide flexibility, responsiveness and self-direction.
This issue, in particularly impellent as the possible introduction of VAT tax on agricultural inputs
may further exacerbate the limited finances of the producers in Tanzania, in turn negatively
affecting production operation and outcomes. Ultimately, the benefits resulting from the
enhancement of the status-quo of livestock feed production in Tanzania would not be confined
to this only sector, but contribute to pro-poor growth and following spill-over effects positively
influence the wider well-being.
Widespread lack of laboratories facilities hampers systemic and frequent analysis of feeds,
especially for smaller producers who cannot incur in large costs, which would jeopardise their
situation. As a result, the potential for ameliorating the sector performance is significantly
hindered. Therefore, policy should address the lack of infrastructure, perhaps by public-private
partnerships.
Extensive lack of statutory regulation within the sector implies the pressing need to develop a
system of formal regulations and guidance, which comply with internationally accredited

61
standards. This would have to be monitored through on-going research on quality and safety
issues in animal feeds.
It is self-evident that all this issues are embedded in the lack of institutional presence, and
accountability. Governance poses the basis of a sound system both economically and socially,
and therefore could benefit animal feed production, and ultimately the farmers, through a wide
range of trajectories and means.
These all-encompassing remarks inform a multi-dimensional and holistic approach, which should
aim at strengthening research, availing credit to the industry, and create, monitor and enforce
rules and regulation to govern the industry.
The role of TAFMA will prove critical in bringing together the stakeholders needs and capabilities.
In addition to pragmatically offer advisory services to the producers, TAFMA should also provide
voice and momentum to the producers’ perspectives across the boundaries of institutions and
organisations. TAFMA represent a grassroots informed actor, with the great potential of merging
the public and the private sector, and contribute to both by lobbying for legislative framework,
and by increasing market opportunity, which will ultimately engender development in Tanzania.

62
REFERENCES
Akande, K. Abubakar, M. Adegbola, T. and Bogoro, S. (2006). Nutritional and health implications
of mycotoxins in animal feeds: A review.Pakistan Journal of Nutrition, 5:5, pp. 398-403.
Alltech (2012). 2012 Global Feed Summary. Alltech, Nicholasville. Available from:
http://www.alltech.com/sites/default/files/2013-feed-tonnage-report.pdf (last accessed
23/09/2014)
AOAC (1980). Official Methods of Analysis. AOAC (Association of Official Analytical Chemists),
Washington, DC, USA. 1018 pp
AOAC (Association of Official Analytical Chemists). (1990). Official methods of analysis. Vol. I,
15th ed. AOAC, Arlington, VA.
Ayele, S. Duncan, A. Larbi, A. and Khanh, T. (2012). Enhancing innovation in livestock value chains
through networks: Lessons from fodder innovation case studies in developing
countries. Science and public policy, 39:3, pp. 333-346.
Babić, Z. Perić, T. (2011) Optimization of livestock feed blend by use of goal programming.
International Journal of Production Economics, 130:2, pp. 218–223
Bigsten, A. Danielsson, A. (1999) Is Tanzania an emerging economy? Is Tanzania an emerging
economy. Report to the OECD, Gothenburg and Lund, Sweden.
Bishop, R. (2013). The manufacturers' role in feed quality and safety: A discussion on methods
used in feed manufacturing processes to assure feed hygiene and safety. Equine Applied
and Clinical Nutrition: Health, Welfare and Performance, pp 381 – 389.
Biwott, K. Kaitho, R. Gachuiri, C. Wahome, R. and Tanner, J. (1998). Effects of levels of
concentrate supplementation on milk production and body weights of lactating dairy
cows. ILRI conference paper. Available from:
https://cgspace.cgiar.org/bitstream/handle/10568/1584/Biwott%20et%20al%201998-
Concentrate%20supplementation-UON.pdf?sequence=1 (Last accessed 07/04/2014)
Black, K. (2011). Business statistics: for contemporary decision making. 7th ed. NJ, John Wiley &
Sons.
Blanche, K. Ludwig, J. and Cunningham, S. (2006). Proximity to rainforest enhances pollination
and fruit set in orchards. Journal of applied ecology, 43:6, pp. 1182-1187.
Bosing, B. Susenbeth, A. Hao, J. Ahnert, S. Ohm, M. and Dickhoefer, U. (2014). Effect of
concentrate supplementation on herbage intake and live weight gain of sheep
grazing a semi-arid grassland steppe of North-Eastern Asia in response to different
63
grazing management systems and intensities. Livestock Science. In press.
http://dx.doi.org/10.1016/j.livsci.2014.03.026 (Last accessed 02/05/2014)
Bregendahl, K. Sell, J. and Zimmerman, D. (2002). Effect of low-protein diets on growth
performance and body composition of broiler chicks. Poultry Science, 81:8, pp. 1156-1167.
Brookes, G. (2001). The EU animal feed sector: protein ingredient use and the implications of the
ban on use of meat and bonemeal. Canterbury, UK: Brookes West.
Bröring, S. (2010). Moving Toward Market Orientation in Agri-food Chains: Challenges for the
Feed Industry. In: Market orientation: transforming food and agribusiness around the
customer (Lindgreen, A. Ed.), Ashgate, Gower Publishing, Ltd., pp. 53-67.
Brown, P. (2013). Tanzania Dairy feed Scoping visit to assess the concentrate feed chain for the
dairy industry in Tanzania & the potential for the establishment of a dairy feed
certification scheme. Scoping report, November 4-8 (unpublished).
Bryceson, D. (1982). Peasant commodity production in post-colonial Tanzania. African Affairs,
81:325, pp 547-567
Carew, S. Oluremi, O. and Wambutda, E. (2006). The quality of commercial poultry feeds in
Nigeria: a case study of feeds in Makurdi, Benue State. Nigerian Veterinary Journal, 26:1,
47-50.
Chang’a, J. Mdegela, R. Ryoba, R. Løken, T. and Reksen, O. (2010). Calf health and management
in smallholder dairy farms in Tanzania. Tropical animal health and production, 42:8, pp.
1669-1676.
Chianu Jonas, N. Vanlauwe, B. Myaka, F. Katungi, E. Akech, C. Mairura, F. Chianu Justina, N. and
Sanginga, N. (2008). Soybean situation and outlook analysis: the case of Tanzania.
Available from: http://www.icrisat.org/what-we-do/impi/projects/tl2-
publications/regional-situation-outlook-reports/rso-sbean-tanzania.pdf (last accessed
29/09/2014)
Chile, L and Talukder, D. (2014). The Paradox of Agricultural Trade Liberalization in Bangladesh
and Tanzania. American Journal of Trade and Policy, 1:1, pp. 23-31.
Cooksey, B. (2011). Marketing reform? The rise and fall of agricultural liberalisation in
Tanzania. Development Policy Review, 29:s1, s57-s81.
Corson, D. Waghorn, G. Ulyatt, M. and Lee, J. (1999). NIRS: Forage analysis and livestock feeding.
Proceedings of the New Zealand Grassland Association, 61, pp. 127–132.
D’Mello, J. (ed) (2000). Farm Animal Metabolism and Nutrition. Wallingford, CABI.

64
Dale, L. Fernandez, J. Vermeulen, P. Lecler, B. Bogdan, A. Pacurar, F. and Baeten, V. (2012).
Research on crude protein and digestibility of Arnica montana L. using conventional NIR
spectrometry and hyperspectral imaging NIR. Journal of Food, Agriculture &
Environment, 10:1.
Dale, N. (1996). Variation in feed ingredient quality: oilseed meals. Animal feed science and
technology, 59:1, 129-135.
De Boever, J. Cottyn, B. Vanacker, J. and Boucque, C. (1993). Recent developments in the use of
NIRS for evaluating compound feeds and raw materials for ruminants. In: NIR
Spectroscopy Developments in Agriculture and Food. Proceedings of the International
Conference, October 12, 1993, Birmingham, UK.
De Groote, H. Nyanamba, T. and Wahome, R. (2010). Quality protein maize for the feed industry
in Kenya. Outlook on Agriculture, 39:4, pp. 291-298.
de Janvry, A. and Sadoulet, E. (2010) Agricultural growth and poverty reduction: Additional
evidence. World Bank Research Observer, 25, pp. 1-20. Available from:
http://wbro.oxfordjournals.org/content/25/1/1.full.pdf+html (last accessed 01/09/2014)
de Jonge, L. and Jackson, F. (2013). The feed analysis laboratory: Establishment and quality
control. Setting up a feed analysis laboratory, and implementing a quality assurance
system compliant with ISO/IEC 17025:2005. H.P.S. Makkar, ed. Animal Production and
Health Guidelines No. 15. Rome, FAO.
DEFRA (2014). Retail Production of Animal Feeding stuffs in Great Britain. Available from:
https://www.gov.uk/government/uploads/system/uploads/attachment_data/file/35034
2/animalfeed-statsnotice-04sep14.pdf (last accessed 17/09/104)
Delgado, C. (2003). Rising Consumption of Meat and Milk in Developing Countries Has Created a
New Food Revolution. The Journal of Nutrition, 133:11, pp. 3907-3910.
Delgado, C. Rosegrant, M. Steinfield, H. Ehui, S. and Courbois, C. (1999). Livestock to 2020. The
Next Food Revolution. Food, Agriculture, and the Environment Discussion Paper 28.
Available from:
http://www.ifpri.org/sites/default/files/publications/pubs_2020_dp_dp28.pdf (Last
accessed 25 Mar 2013)
Diep Pham, N. Maass, B. and Cadilhon, J. (2014). Enhancing dairy based livelihoods in Tanzania:
Mid-term progress report of the MilkIT project. CGIAR Research Program on Livestock
and Fish, Brief 6. Available from:
https://cgspace.cgiar.org/bitstream/handle/10568/35029/L%26F_brief6_feb2014.pdf?se
quence=7 (last accessed 02/09/2014)

65
Dlamini, T. Tshabalala, P. and Mutengwa, T. (2014). Soybeans production in South
Africa. Oilseeds and fats, Crops and Lipids (OCL), 21:2, D207, 11 pp.
Dryden, G. (2008). Animal Nutrition Science. Wallingford, CABI.
Egbunike, G. and Ikpi, A. (1988). Can agro-industrial by-products and crop residues save the
Nigerian livestock industry. In: Utilization of research results on Forage and Agricultural
By-Product Materials as Animal Feed Resources in Africa. Proceedings of the first joint
workshop held in Lilongwe, Malawi, December 5 – 9, 1988. PANESA/ARNAB, Addis Ababa,
Ethiopia, pp. 477 – 488.
El-Sayed, A. (2014). Value chain analysis of the Egyptian aquaculture feed industry. WorldFish,
Penang, Malaysia. Project Report: 2014-22
Eze, A. (2011). A Review on Techniques of Avoiding Protein Deficiency in Monogastric Diets.
Journal of Innovative Research in Education, 1:1, pp. 1-6.
FAO (2001). Human energy requirements. Report of a Joint FAO/WHO/UNU Expert Consultation.
Rome, October 17–24. Food and Agriculture organization of the United Nations, Food
and Nutrition Technical Report Series 1.
FAO (2011). Quality assurance for animal feed analysis laboratories. FAO Animal Production and
Health Manual No. 14. Rome, Italy.
FAO and WHO (2008). Animal Feed Impact on Food Safety. Report of the FAO/WHO Expert
Meeting. October 8-12, 2007, Rome. Available from:
http://www.who.int/foodborne_disease/resistance/Report_AnimalFeed_Oct07.pdf (last
accessed 02/09/2014)
Fapohunda, O. (2012). Evaluation of Processed Soybean Meal in the Feeding of Clarias
Gariepinus Fingerlings. Journal of Animal Science advances, 2:2, pp. 244-49.
FEFAC (2013). Role and importance of financial instruments for the economic viability of the EU
livestock chain: the perspective of the EU feed industry. The European Feed
Manufacturers' Federation. Available from:
http://ec.europa.eu/agriculture/cereals/commodity-expert-group/2013-06-
18/fefac_en.pdf (last accessed 10/09/2014)
Foley, J. Rosentrater, K. Lamsal, B. and Poovaiah, N. (2013). Processing Approaches to Improve
Functionality and Value of Soybean Products. ASABE Paper No. 131592967, St. Joseph,
Mich., 26 pp.
Friedman, M. and Brandon, D. (2001). Nutritional and health benefits of soy proteins. Journal of
Agricultural and Food Chemistry, 49:3, pp. 1069-1086.

66
Githinji, V. Olala, M. and Maritim, W. (2009). Report. Feed Milling Industry Survey. Ministry of
Livestock Development & AKEFEMA. 49 pp.
Goromela, E. (2009). Feeding and management strategies for rural poultry production in central
Tanzania. Ph.D. Thesis. Wagenigen University: The Netherlands.
HDR (2014). Tanzania Human Development Report 2014. Economic Transformation for Human
Development. Concept Note. Available from:
http://www.thdr.or.tz/docs/Concept_Note_Final.pdf (last accessed 21/08/2014)
Helleiner, G. (1976). Economic Development and Cultural Change, 25:1, pp 177-183.
IFAD (2014). United Republic of Tanzania Country Programme Evaluation Approach Paper.
International Fund for Agricultural Development, Rome, Italy.
ILRI. (2011). Livestock: A pathway out of poverty. Interim strategy of the International Livestock
Research Institute, 2011–2012. Nairobi, Kenya, ILRI
ISO 6497 (2002). Animal feeding stuffs – Sampling. Geneva, Switzerland.
Jagadi, M. Rundgren, M. and Ogle, R. (1987). Chemical composition and protein quality of
Tanzanian cottonseed expeller cakes. ILCA Bulletin (ILCA).
Kaijage, J. Mutayoba, S. and Katule, A (2014). Chemical composition and nutritive value of
Tanzanian grain sorghum varieties. Livestock Research for Rural development, 26:10.
Kape, H. Peters, N. and Sankhayan, P. (1994) The Impact of Structural Adjustment Programmes
on Natural Resource Use Pattern at a Household Level in Tanzania: The Case of manga
District. UTAFITI (New Series), 1:2, pp. 59-70.
Kaplinsky, R. (2000). Globalisation and unequalisation: What can be learned from value chain
analysis? Journal of development studies, 37:2, pp. 117-146.
Katz, H. (2006). Global Surveys or multi-national surveys? On sampling for global surveys.
In: Thoughts for the Globalization and Social Science Data Workshop UCSB. Available
from: http://www.global.ucsb.edu/orfaleacenter/conferences/ngoconference/Katz_for-
UCSB-data-workshop.pdf (last accessed 03/09/2014)
Kellems, R and Church, D. (2010). Livestock Feeds and Feeding. 6th ed. Upper Saddle River, NJ:
Prentice Hall
Kurwijila, L. Mwingira, J. Karimuribo, E. Shirima, G. Lema, B. Ryoba, R. and Kilima, B. (2011).
Safety of Animal Source Foods in Tanzania: A Situational Analysis. Prepared for the Safe
food, fair food project. International Livestock Research Institute. Nairobi, Kenya.

67
Laswai, G. and Nandone, S. (2013). Report on Participatory Rural Appraisal to inform the three
project of MoreMilkIT, Safe Food Fair Food and MilkIT project in Morogoro and Tanga.
ILRI, Nairobi.
Legese, G. Teklewold, H. Alemu, D. and Negassa, A. (2008). Live animal and meat export value
chains for selected areas in Ethiopia. Constraints and opportunities for enhancing meat
exports. Improving Market Opportinities. Discussion Paper No. 12. ILRI (International
Livestock Research Institute), Nairobi, Kenya. 56 pp.
Lonsdale, C. (1989). Straights: Raw materials for Animal Feed Compounders and farmers. Marlow:
Chalcombe Publications
Louw, A. Schoeman, J. and Geyser, M. (2013). Pork and broiler industry supply chain study with
emphasis on feed and feed-related issues. Journal of Agricultural Economics and
Development, 2:4, pp. 134-146.
Lugoe, F. (2011). Aligning and Harmonizing the Livestock and Land Policies of Tanzania. The
Economic and Social Research Foundation. ESRF Discussion Paper no. 35.
Lukuyu and Blummel (2010). Supplementary/compounded feeding in Kenyan and Indian dairy
systems – why so little? FAP Symposium on Feed in Smallholder Systems, Luang Prabang,
Laos, Nov 18-19.
Lukuyu BA, Kitalyi A, Franzel S, Duncan A and Baltenweck I. (2009). Constraints and options to
enhancing production of high quality feeds in dairy production in Kenya, Uganda and
Rwanda. ICRAF Working Paper no. 95. Nairobi, Kenya: World Agroforestry Centre.
Lwoga, A. and Urio, N. (1987). An inventory of livestock feed resources in Tanzania. In: Animal
feed resources for small-scale livestock producers. Proceedings of the second PANESA
Workshop held in Nairobi, Kenya, November 11-15, 1985. International Development
Research Centre (IDRC), Ottawa, pp. 23-34.
Maass, B. Lukuyu, B. Fakih, A. Suleiman, H. Khatib, S. Wassena, F. and Bacigale-Bashizi, S.
(2013). Assessing Feeds and Feed Availability for Dairy Cattle on Pemba Island of Zanzibar,
Tanzania. “Agricultural development within the rural-urban continuum” Tropentag,
Stuttgart-Hohenheim
MacIsaac, J. Burgoyne, K. Anderson, D. and Rathgeber, B. (2005). Roasted full-fat soybeans in
starter, grower, and finisher diets for female broiler turkeys. The Journal of Applied
Poultry Research, 14:1, pp. 116-121.
Malema, 2005. Soya Bean Production and Utilisation in Tanzania. Ministry of Agriculture, Food
Security and Cooperatives. 101 pp. ISBN: 9987-8970-5-3.

68
Mandal, A. Paul, S. Mandal, G. Kannan, A. and Pathak, N. (2005). Deriving nutrient requirements
of growing Indian goats under tropical condition. Small Ruminant Research, 58:3, pp.
201-217.
Marchenko, Y. (2006). Estimating variance components in Stata. Stata Journal, 6:1, pp. 1-21.
McDonald, P. Edwards, R. Greenhalgh, J. Morgan, C. Sinclair, L. and Wilkinson, R. (2011). Animal
Nutrition. 7th ed. Essex, Pearson.
Mgheni, D. Laswai, G. Mtenga, L. Ndikumana, J. and Zziwa, E. (2013).Chemical Composition and
Nutritional Values of Feed Resources for Ruminants: Eastern and Central Africa (ECA)
Table for Ruminants 2013. ASARECA (Association for Strengthening Agricultural Research
in Eastern and Central Africa), Entebbe.
Miguel, E. (2004). Tribe or nation? Nation building and public goods in Kenya versus
Tanzania. World Politics, 56:03, pp. 328-362.
Miller, E. (2004). Protein nutrition requirements of farmed livestock and dietary supply.
In: Protein sources for the animal feed industry. FAO Expert Consultation and Workshop,
Bangkok, Thailand, 29 April-3 May 2002. Food and Agriculture Organization of the United
Nations (FAO).
Minga, U. Mtambo, M. Katule, A. Mutoyaba, S. Mwalusanya, N. Lawrence, P. Mdegela, R. and
Olsen, J. (2000) Improving the Health and Productivity of the Rural Chicken in Africa:
Research and Development Efforts in Tanzania. In: ACIAR Proceedings. SADC planning
workshop on Newcastle disease control in village chickens, 6-9 March,
2000, Maputo. 2001 pp. 134-139.
Mlay, P. Pereka, A. Balthazary, S. Phiri, E. Hvelplund, T. Weisbjerg, M. and Madsen, J. (2005). The
effect of maize bran or maize bran mixed with sunflower cake on the performance of
smallholder dairy cows in urban and peri-urban area in Morogoro, Tanzania. Livestock
research for Rural Development, 17:1. Available from:
http://www.lrrd.org/lrrd17/1/mlay17002.htm (last accessed 05/09/2014)
Mlay, P. Pereka, A. Balthazary, S. Phiri, E. Hvelplund, T. Weisbjerg, M. and Madsen, J. (2005). The
effect of maize bran or maize bran mixed with sunflower cake on the performance of
smallholder dairy cows in urban and peri-urban area in Morogoro, Tanzania. Livestock
Research for Rural Development, 17:1.
MLFD (2011). Investment Opportunities in Livestock Industry. United Republic of Tanzania
Ministry of Livestock and Fisheries Development. Available from:
http://www.mifugouvuvi.go.tz/wp-content/uploads/2013/06/Livestock-Investment
Opportunities.pdf (last accessed 30/08/2014)

69
Mlote, S. Mdoe, N. Isinika, A. and Mtenga, L. (2013). Profitability analysis of small scale beef
cattle fattening in the Lake Zone in Tanzania. Journal of Agricultural Economics and
Development, 2:5, pp. 203-216.
MOF (2005). Value Added Tax. Ministry of Finance (MOF). Available from:
http://www.mof.go.tz/mofdocs/revenue/exemptvat.htm (last accessed 10/09/2014)
Msuya, D. (2013). Farming systems and crop-livestock land use consensus. Tanzanian
perspectives. Open Journal of Ecology, 3:7, 9 pp. DOI:10.4236/oje.2013.37055
Muller, C. Botha, J. and van Niekerk, W. (2007). The effect of concentrate supplementation on
the milk yield of Jersey cows on a pasture based diet. Elsenburg Joernaal, 4, pp. 10-12.
Mupeta, B. Coker, R. and Zaranyika, E. (2003). The added value of sunflower: performance of
indigenous chicken fed a reduced-fibre sunflower cake diet in pens and on free-range.
Available from: http://r4d.dfid.gov.uk/PDF/outputs/R7524e.pdf (last accessed
02/09/2014)
Mutayoba, S. Dierenfeld, E. Mercedes, V. Frances, Y. and Knight, C. (2011). Determination of
chemical composition and ant-nutritive components for Tanzanian locally available
poultry feed ingredients. International Journal of Poultry Science, 10:5, pp. 350-357.
Mwambene, P. Chawala, A. Illatsia, E. Das, S. Tungu, B. and Loina, R. Selecting indigenous cattle
populations for improving dairy production in the Southern Highlands and Eastern
Tanzania. Livestock Research for Rural Development, 26:3.
Mwilawa, A. Komwihangilo, D. and Kusekwa, M. (2008). Conservation of forage resources for
increasing livestock in traditional forage reserves in Tanzania. African Journal of Ecology,
46, pp. 85-89
Nadeem, M. Gilani, A. and Khan, A. and Mahr-Un-Nisa. (2005). True metabolizable energy values
of poultry feedstuffs in Pakistan. International Journal of Agriculture and Biology, 7:6, pp.
990-994.
NBS (2011). National Accounts of Tanzania Mainland 2000 – 2010. National Bureau of Statistics,
Ministry of Finance. Available from:
http://www.nbs.go.tz/takwimu/na/TzMainland_NA_2000-2010.pdf (last accessed
01/09/2014)
Nelson, E. and De Bruijn, E. (2005). The voluntary formalization of enterprises in a developing
economy—the case of Tanzania. Journal of International Development, 17:4, pp. 575-
593.
Ngaiza, R. (2012) FAO-University of Nairobi -Regional Workshop on an Integrated Policy
Approach to Commercializing Smallholder Maize Production, June 6-7, 2012, Nairobi,

70
Kenya. Available from:
http://www.fao.org/fileadmin/templates/esa/Workshop_reports/Smallholders_2012/Pre
sentations_1/Ngaiza_Kilimo_Kwanza_Tanzania.pdf (last accessed 28/08/2014)
Ngowi, H. (2007). Economic development and change in Tanzania since independence: the
political leadership factor. African Association for Public Administration and Management.
29th AAPAM Annual Roundtable Conference, September 3-7, 2007, Mbabane, Swaziland.
23 pp.
Njombe, A. Msanga, Y. Mbwambo, N. and Makembe, N. (2011). The Tanzania Dairy Industry:
Status, Opportunities and Prospects. Paper Presented to the 7th African Dairy Conference
and Exhibition, May 25 – 27, Dar es Salaam, Tanzania.
Nkya, R. Kessy, B. Lyimo, Z. Msangi, B. Turuka, F. and Mtenga, K. (2007). Constraints on
smallholder market oriented dairy systems in the north eastern coastal region of
Tanzania. Tropical animal health and production,39:8, pp. 627-636.
Oliva-Teles, A. Gouveia, A. Gomes, E. and Rema, P. (1994). The effect of different processing
treatments on soybean meal utilization by rainbow trout, Oncorhynchus
mykiss. Aquaculture, 124:1, pp. 343-349.
Palić, D. Modika, K. Oelofse, A. Morey, L. and Coetzee, S. (2011). The protein dispersibility index
in the quality control of heat-treated full-fat soybeans: an inter-laboratory study. South
African Journal of Animal Science, 41:4, pp. 413-419.
Palić, D. Okanović, D. Psodorov, D. Džinić, N. Lilić, S. Zekić, V. and Milić, D. (2014). Prediction of
metabolisable energy of poultry feeds by estimating in vitro organic matter
digestibility. African Journal of Biotechnology, 11:28, pp. 7313-7317.
Parr, W.H. (1988) The small-scale manufacture of compound animal feed (ODNRI Bulletin No.
9). Working Paper. Available from: http://gala.gre.ac.uk/11051 (last accessed
03/09/2014)
Pathumnakul
Pesti, G. and Miller, B. (1993). Animal Feed Formulation. Economics and Computer Applications.
New York, Chapman and Hall.
Rao, Y. and Xiang, B. (2009). Determination of total ash and acid-insoluble ash of Chinese herbal
medicine Prunellae spica by near infrared spectroscopy. Yakugaku Zasshi, 129(7), pp.
881-886.
Rowhani, P. Lobell, D. Linderman, M. and Ramankutty, N. (2011). Climate variability and crop
production in Tanzania. Agricultural and Forest Meteorology, 151:4, pp. 449-460.

71
Roy, B. Ranvig, H. Chowdhury, S. Rashid, M. and Chwalibog, A. (2004). Evaluation of compound
broiler feeds manufactured in Bangladesh. Livestock Research for Rural
Development, 16:11. Available from: http://www.lrrd.org/lrrd16/11/roy16093.htm (last
accessed 03/09/2014)
Safalaoh, A. (2002). Livestock production, protein supplies and the animal feed industry in
Malawi, in Proceedings of the FAO Animal Production and Health Expert Consultation and
Workshop – Protein Sources for the Animal Feed industry, April 29 - May 3, 2002,
Bangkok, pp. 311-320. Food and Agriculture Organization of the United Nations, Rome.
Safalaoh, A. and Chapoteta, J. (2006). A preliminary evaluation of the stock feed industry in
Malawi. Malawi Journal of Agricultural sciences, 3:1, pp. 32 – 39.
Sarris, A. Savastano, S. and Christiaensen, L. (2006). The role of agriculture in reducing poverty in
Tanzania: A household perspective from rural Kilimanjaro and Ruvuma. FAO Commodity
and Trade Policy Research Working Paper No. 19.
Schmidt, S. Magigi, W. and Godfrey, B. (2014). The organization of urban agriculture: Farmer
associations and urbanization in Tanzania. Cities. Corrected Proof. DOI:
10.1016/j.cities.2014.05.013
Schneider, F. Buehn, A. and Montenegro, C. (2010). New Estimates for the Shadow Economies all
over the World. International Economic Journal, 24:4, pp. 443-461.
Shija, D. Mtenga, L. Kimambo, A. Laswai, G. Mushi, D. Mgheni, D. and Safari, J. (2013). Chemical
Composition and Meat Quality Attributes of Indigenous Sheep and Goats from Traditional
Production System in Tanzania. Asian-Australasian Journal of Animal Sciences, 26:2, pp.
295-302.
Shipton, T. A., & Hecht, T. (2005). A review of the animal and aquafeed industries in South
Africa. In: A synthesis of the formulated animal and aquafeed industry in sub-Saharan
Africa (Moehl, J. Halwart, M. eds.). No. 26. Food and Agricultural Organization of the
United States, 2005.
Sitjà-Bobadilla, A. Peña-Llopis, S. Gómez-Requeni, P. Médale, F. Kaushik, S. and Pérez-Sánchez, J.
(2005). Effect of fish meal replacement by plant protein sources on non-specific defence
mechanisms and oxidative stress in gilthead sea bream (Sparus
aurata). Aquaculture, 249:1, pp. 387-400
Skarstein, R. (2005). Economic Liberalization and Smallholder Productivity in Tanzania. From
Promised Success to Real Failure, 1985–1998. Journal of Agrarian Change, 5:3, pp. 334–
362.
Skof, A. (2008). The Informal Economy. In: Sustaining and sharing economic growth in
Tanzania (Utz, R. ed). World Bank Publications, 2008.

72
Steinfeld, H. Gerber, P. Wassenaar, T. Castel, V. Rosales, M. and De Haan, C. (2006). Livestock's
long shadow. Rome: FAO.
Stichting Nederlandse Vrijwilligers (SNV) (2008). Red Meat for Local and Export Markets Sub
Sector Analysis Tanzania Draft Report. Available from:
http://www.tzdpg.or.tz/uploads/media/Red_Meat_value_chain_for_local_and_export_
markets_-SSA_Final__Report_June_2008.pdf (last accessed 20/08/2014)
Subuh, A. Motl, M. Fritts, C. and Waldroup, P. (2002). Use of various ratios of extruded full fat
soybean meal and dehulled solvent extracted soybean meal in broiler diets. International
Journal of Poultry Science, 1:9, pp. 9 -12.
Sumberg, J. (1996). Livestock production in peri-urban areas of Africa: an analysis of Dar es
Salaam, Mwanza and Shinyanga, Tanzania. Overseas Development Group, UEA for RNRRS
LPP grant X0290.
TAFSIP (2011). Tanzania Agriculture and Food Security Investment Plan (TAFSIP) 2011-12 to
2020-21. Main Document.
TAMPA (2011). Harmonization of regulatory framework in the dairy sector. Tanzania Milk
processors Association Policy Brief, 10 pp. Available from:
file:///C:/Users/bt019186/Downloads/TAMPA_POLICY_BRIEF_FINAL.pdf (last accessed
05/10/2014)
Temu, A. and Due, J. (2000) The business environment in Tanzania after socialism: challenges of
reforming banks, parastatals, taxation and the civil service’, The Journal of Modern
African Studies (38)4: 683-712.
Tolera, A. Merkel, R. Goetsch, A. Tilahun, S and Negesse, T. (2000). Nutritional constraints and
future prospects for goat production in East Africa. In: The opportunities and challenges
of enhancing goat production in East Africa. A conference held at Awassa College of
Agriculture, Debub University, Langston University, Langston, Oklahoma, USA.
UNIDO (2012). Tanzania’s Red Meat Value Chain: A diagnostic. Africa Agribusiness and
Agroindustry Development Initiative (3ADI) Reports. United Nations Industrial
Development Organization (UNIDO). Vienna, Austria.
URT (2013). The Economic Survey 2012. The United republic of Tanzania. Produced by the
Ministry of Finance. Available from:
http://www.mof.go.tz/mofdocs/Micro/2012/ECONOMIC%20SURVEY%20BOOK%202012.
pdf (last accessed 31/08/2014)
Vaidya, S. (2001). The Indian Feed Industry. AGRIPPA, FAO Rome. Available from:
http://www.fao.org/docrep/article/agrippa/x9500e01.htm (last accessed 15/09/2014)

73
Weber, R. and Musshoff, O. (2012). Microfinance for Agricultural Firms-Credit Access and Loan
Repayment in Tanzania. In 123rd Seminar, February 23-24, 2012, Dublin, Ireland (No.
122552). European Association of Agricultural Economists.
World Bank (2005). Managing the livestock revolution: Policy and technology impacts to address
a fast-growing sector. Agriculture and Rural Development Department, Report No.
32725-GLB. Washington DC.
World Bank (2013a). World development Indicators (WDI). Online database. Available from:
http://data.worldbank.org/indicator (last accessed 09/14)
Zervas, G., Rissaki, M., & Deligeorgis, S. (2001). Free-choice consumption of mineral lick blocks by
fattening lambs fed ad libitum alfalfa hay and concentrates with different trace mineral
content. Livestock Production Science, 68(2), 251-258.

74
APPENDICES
Appendix 1 – Ethical clearance

75

76

77

78

79

80
Appendix 2 - Feed Producers Questionnaire
Feed producer survey
1. General Information
Company name: .
Website .
Cell-Phone(s) .
Landline .
Name of respondent .
Title of respondent .
Ownership (tick appropriate):
Sole proprietor Limited liability Co-operative Group
Others (specify) .
Key Contact person (Managing Director, Marketing manager, others) Name .
2. History of the company
i) When did the company start business in the feed milling industry? ________________
ii) For how long has the company been in the business? __________________________
iii) Does the company have other branches? ___________________
If yes, how many branches does the company have? ___________________
iv) List the branches (if more than one) in the descending order of production capacities
v) Do you consider other feed producers as competitors for a limited market or is the demand for
feed greater than the ability to supply?
__________________________________________________________________________
__________________________________________________________________________
No Branch name Branch location Contact person Cell No.
1 2 3

81
vi) Can you list any other feed manufacturers in the area?
3. Employment
i) What is your total staff? ___________________________________________________
ii) What are their qualifications in numbers?
a) Master’s degree________ (b) Bachelor’s degree________ c)
Diploma________ (d) Certificate ________ (e) No qualification________
Other qualifications (please specify) ______________________________
______________________________
iii) What is the following employment in numbers?
a) Administrative job________ (b). Technical jobs (Technicians, engineers, etc) ________ (c)
Labourers _____________ (d) Others (mention) _____________
_____________
Additional comments____________________________________________________________
_____________________________________________________________________________
4. Production Capacity
i) What is the company/branch’s average installed capacity? Tonnes per day?
ii) What is the company’s average actual production? Tonnes per day?
iii) Can you comment on the production trend over the last? Has it been increasing/decreasing?
__________________________________________________________________________
__________________________________________________________________________
No Branch name Branch location Contact person Cell No.
1 2 3 4 5

82
5. Product distribution.
Adopted distribution system
(circle appropriate)
% of company’s
products
1. Distributors Yes No
2. Direct to farmers Yes No
Others – please specify below
1.
2.
i) Where is the final product sold?
6. Production
i) Products produced by the
company/branch.
Area of feed product
distribution
% of total Region District 1. 1.
2.
3.
4.
2. 1.
2.
3.
4.
Poultry Price/k
g
Pigs Price/k
g
Cattle Price/k
g
Others Price/k
g Products
T/ week Products
T/ week Products
T/
we
ek
Products T/
week
Chick mash Sow &
weaner
Dairy meal
Growers
mash
Finisher
Layers mash
Creep
Broiler starter

83
ii) List the raw material usage.
Ingredient
Avg.
quantity
used
(t/week)
Source of supply (e.g.
farmers, suppliers)
Source of ingredient
(e.g. local,
imported)
Maize grain
Maize bran
Wheat bran
Wheat pollard
Broken Rice
Rice polishings
Sorghum
Cassava flour
Cottonseed cake
Soybean cake
Sunflower cake
Blood meal
Bone meal
Fish meal
Limestone
Molasses
Oyster/sea shells
Premixes
Common salt
Methionine
Lysine
DCP
Others
iii) In what quantities do you sell compound feeds? ____________
Broiler
finisher
Layer pellets
Broiler pellets

84
Additional comments____________________________________________________________
_____________________________________________________________________________
_____________________________________________________________________________
_____________________________________________________________________________
7. Price
i) Does the price of ingredients vary seasonally? __________.
If yes, how?
______________________________________________________________________________
________________________________________________________________________
______________________________________________________________________________
________________________________________________________________________
ii) What are the most important factors in determining the price of feed?
(Price of ingredients, traders/wholesalers, machinery, livestock farmers, other factors (specify). Arrange in
descending order of importance)
_____________________________________________________________________________
_____________________________________________________________________________
iii) Are feed products subject to governmental price control?
_____________________________________________________________________________
_____________________________________________________________________________
Additional comments____________________________________________________________
_____________________________________________________________________________
_____________________________________________________________________________
8. Product standards
i) How do you formulate rations (least-cost computer programs, or using preset formulae, feed
composition tables)?
85
_____________________________________________________________________________
_____________________________________________________________________________
ii) Do you perform regular proximate analyses of raw materials ______ and compound
feeds______.
If not; If not, why? And what provisions are made for quality control?
______________________________________________________________________________
______________________________________________________________________________
_____________________________________________________________________
If yes; How often? Compound feeds ____________ Raw materials ____________
iii) Do you have your own lab or use external labs?
___________________________________________
iv) Can you comment on the analytical service in terms of a) credibility of results (b) time taken (c)
price.
a) _____________________________________________________________________________
b) ____________________________________________________________________________
c) ____________________________________________________________________________
v) Is the chemical composition of your products labelled on the packaged feed?
______________
vi) Do you use sensory techniques to assess the quality of raw ingredients when they are delivered?
____________
If yes, describe the techniques used and if you reject orders?
________________________________________________________________________
________________________________________________________________________
________________________________________________________________________
vii) How do you ensure that the product quality is maintained throughout the supply chain?
______________________________________________________________________________
______________________________________________________________________________
___________________________________________________________________
viii) Do you receive any support from governmental or non-governmental organisations (such as
extension support, training of feed production practices, quality control subsidies etc.)? If yes,
86
describe the type of service, and how often.
_____________________________________________________________________
_____________________________________________________________________
_____________________________________________________________________
__________________
ix) Have you ever received a quality control inspection from the government? _____________
If yes how often? __________________________________
x) Are you a member of TFMA? ____________
xi) Are your feed products TBS certified? ____________
Additional comments____________________________________________________________
_____________________________________________________________________________
_____________________________________________________________________________
_____________________________________________________________________________
_____________________________________________________________________________
9. Machinery and storage
i) What machinery do you use to produce feeds and for how long have you used them?
_______________________ __________years
_______________________ __________years
_______________________ __________years
_______________________ __________years
ii) Can you comment on the services available for the machines? (i.e. spare parts, trained
engineers, servicing etc.)
_____________________________________________________________________________
_____________________________________________________________________________
iii) Is the energy supply reliable? ______________________________________________
iv) Do you use a generator? ____________________________________________________
v) Do you store raw materials as a mitigation strategy against high prices? ____________
If no, please state why? (I.e. storage facilities, cash flow etc.)
________________________________________________________________________
________________________________________________________________________
87
If yes, briefly describe the storage facilities.
________________________________________________________________________
________________________________________________________________________
________________________________________________________________________
Additional comments____________________________________________________________
_____________________________________________________________________________
_____________________________________________________________________________
_____________________________________________________________________________
10. Constraints
What are the major constraints in your feed manufacturing business?
No. Constraints Tick
Constraint
Rate importance (1= most
important and 10 = least
important) 1 Lack of analytical equipment 2 High cost of lab services 3 Low/inconsistent supply of ingredients 4 Low quality ingredients 5 High price of ingredient 6 Low demand for feeds 7 Lack of technical expertise on feed formulation 8 Credit 9 Lack of government support Other (specify) 10 11 12 13
Do you have any suggested solutions for the constraints listed above?
1. ___________________________________________________________________________
_____________________________________________________________________________
_____________________________________________________________________________
2. ___________________________________________________________________________
_____________________________________________________________________________
_____________________________________________________________________________
3. ___________________________________________________________________________
_____________________________________________________________________________

88
_____________________________________________________________________________
4. ___________________________________________________________________________
_____________________________________________________________________________
_____________________________________________________________________________
5. ___________________________________________________________________________
_____________________________________________________________________________
_____________________________________________________________________________
6. ___________________________________________________________________________
_____________________________________________________________________________
_____________________________________________________________________________
7. ___________________________________________________________________________
_____________________________________________________________________________
_____________________________________________________________________________
8. ___________________________________________________________________________
_____________________________________________________________________________
_____________________________________________________________________________
10. __________________________________________________________________________
_____________________________________________________________________________
_____________________________________________________________________________

89
Appendix 3 - Sample information form
Sample name:
Collected by:
Date Sampled:
Sample code: 060 063
Type of feed:
Name of supplier:
Price paid per kg (Tzs):
Supplier type: (e.g. open market/vet shop etc.)
Sample name:
Collected by:
Date Sampled:
Sample code: 061 064
Type of feed:
Name of supplier:
Price paid per kg (Tzs):
Supplier type: (e.g. open market/vet shop etc)
Sample name:
Collected by:
Date Sampled:
Sample code: 062 065
Type of feed:
Name of supplier:
Price paid per kg (Tzs):
Supplier type: (e.g. open market/vet shop etc.)

90
Appendix 4 – Grinder at the TVLA
Appendix 5 – Dry matter worksheet
S/N LAB
SAMPLE ID
CRC
No:
CRCWT SAMPLEWT DRY-WT
CRC +
SAMPLE
DM %DM
A B C C-A/B C-A/B*100

91
Appendix 6 - Sample collection using a probe
Appendix 7 -Calibration equation statistics for chemistry and NIRS variables
(n = 294) Calibration samples statistics Calibration equation statistics
Variable (%dm) Min Max Mean Std. Dev SEC R2 SECV
Dm 89.61 94.55 92.21 0.81 0.15 0.96 0.16 Ash 0.03 39.92 7.60 3.57 0.57 0.95 0.61 Crude Protein 1.12 41.62 17.85 7.86 0.51 0.99 0.56 ME 5.83 10.19 8.60 1.12 0.09 0.99 0.11 IVOMD 39.02 71.20 60.84 7.47 0.92 0.98 1.23
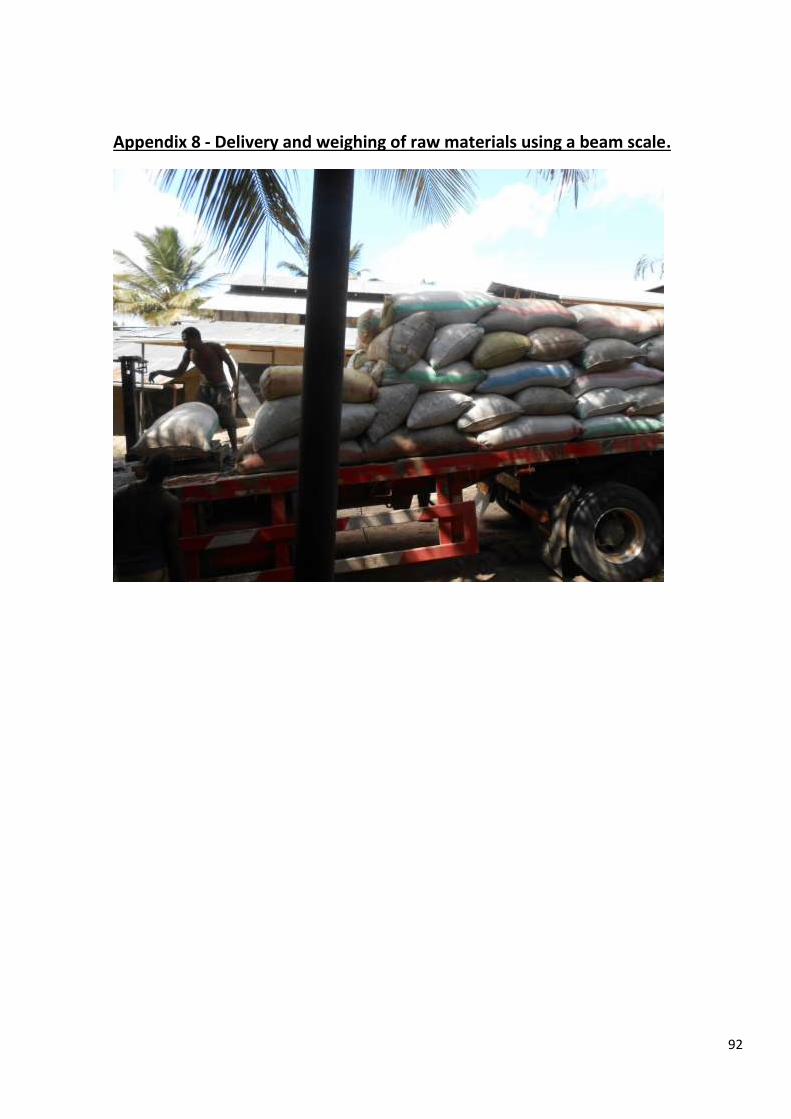
92
Appendix 8 - Delivery and weighing of raw materials using a beam scale.

93
Appendix 9 - Sieving of fish meal to check for impurities
Appendix 10 - Example of a typical small-scale production and storage facility.

94
Appendix 11 - Example of storage facilities
Example of poor storage conditions which is not kept clean
Example of clean storage facility

95
Appendix 12 – Example of mixers
Locally produced vertical mixers (and grinders) commonly used by feed manufacturers
1. Materials are loaded into the hammer mill, which grinds the materials and feeds through to the
mixer.
2. Materials which are already ground or do not require grinding (e.g. minerals and premixes), can
be loaded directly into the mixer.
3. The mixer homogenises all the ingredients.
4. The mixed feed is ejected from this point, where 50kg’s of compound feed is bagged.
2 1
4 2
4
3 3

96
Appendix 13 - Example of impurities after sieving fish meal.

97
Appendix 14 – Linear regression output
Appendix: Linear Regression
Regression analysis
Response variate: Price_kg Fitted terms: Constant, CP_dm
Summary of analysis
Source d.f. s.s. m.s. v.r. F pr. Regression 1 262042. 262042. 24.65 <.001 Residual 161 1711775. 10632. Total 162 1973817. 12184. Percentage variance accounted for 12.7 Standard error of observations is estimated to be 103.
Appendix 15 - REML Output
Variance CP outlet Compounds
REML variance components analysis
Response variate: CP_dm Fixed model: Constant + Sample_name + Type_of_supplier + Sample_name.Type_of_supplier Random model: Sample_name.Rep Number of units: 159 Sample_name.Rep used as residual term Sparse algorithm with AI optimisation Analysis is subject to the restriction on CP_dm
Residual variance model Term Model(order) Parameter Estimate s.e. Sample_name.Rep Identity Sigma2 5.420 0.648
Tests for fixed effects
Sequentially adding terms to fixed model Fixed term Wald statistic n.d.f. F statistic d.d.f. F pr Sample_name 48.86 9 5.43 140.0 <0.001 Type_of_supplier 11.18 1 11.18 140.0 0.001 Sample_name.Type_of_supplier 7.49 8 0.94 140.0 0.488

98
Dropping individual terms from full fixed model Fixed term Wald statistic n.d.f. F statistic d.d.f. F pr Sample_name.Type_of_supplier 7.49 8 0.94 140.0 0.488
Variance CP outlet Raw materials
REML variance components analysis
Response variate: CP_dm Fixed model: Constant + Sample_name + Type_of_supplier + Sample_name.Type_of_supplier Random model: Sample_name.Rep Number of units: 231 Residual term has been added to model Sparse algorithm with AI optimisation All covariates centred
Estimated variance components
Random term component s.e. Sample_name.Rep 0.00 0.00
Residual variance model Term Model(order) Parameter Estimate s.e. Residual Identity Sigma2 10.60 1.07
Tests for fixed effects
Sequentially adding terms to fixed model Fixed term Wald statistic n.d.f. F statistic d.d.f. F pr Sample_name 4459.33 21 209.07 118.6 <0.001 Type_of_supplier 1.78 1 1.78 196.8 0.183 Sample_name.Type_of_supplier 15.24 10 1.52 196.2 0.133 Dropping individual terms from full fixed model Fixed term Wald statistic n.d.f. F statistic d.d.f. F pr Sample_name.Type_of_supplier 15.24 10 1.52 196.2 0.133
Message: denominator degrees of freedom for approximate F-tests are calculated using
algebraic derivatives ignoring fixed/boundary/singular variance parameters.

99
Proximate analyses of feeds
REML variance components analysis
Response variate: CP_dm Fixed model: Constant + Sample_name + Times_analysed + Sample_name.Times_analysed Random model: Sample_name.Rep Number of units: 154 Residual term has been added to model Sparse algorithm with AI optimisation All covariates centred
Estimated variance components
Random term component s.e. Sample_name.Rep -0.001 0.000
Residual variance model Term Model(order) Parameter Estimate s.e. Residual Identity Sigma2 5.155 0.632
Tests for fixed effects
Sequentially adding terms to fixed model Fixed term Wald statistic n.d.f. F statistic d.d.f. F pr Sample_name 15.65 7 2.22 90.2 0.039 Times_analysed 23.78 2 11.89 131.3 <0.001 Sample_name.Times_analysed 7.27 9 0.81 131.9 0.611 Dropping individual terms from full fixed model Fixed term Wald statistic n.d.f. F statistic d.d.f. F pr Sample_name.Times_analysed 7.27 9 0.81 131.9 0.611
Message: denominator degrees of freedom for approximate F-tests are calculated using algebraic derivatives ignoring fixed/boundary/singular variance parameters.