An evaluation of business solutions in manufacturing enterprises
24
Int. J. Int. J. Business Intelligence and Data Mining, Vol. x, No. x, xxxx 1 Copyright © 200x Inderscience Enterprises Ltd. Evaluation of Business Solutions in Manufacturing Enterprises Yudistira Asnar*, Paolo Giorgini Dipartimento di Ingegneria e Scienza dell'Informazione, University of Trento, Italy {yudis.asnar, paolo.giorgini}@disi.unitn.it * Corresponding author Paolo Ciancarini, Rocco Moretti Department of Information and Communication Technology, University of Bologna, Italy {ciancarini, moretti}@cs.unibo.it Maurizio Sebastianis Think3 Inc. [email protected] Nicola Zannone Department of Computer Science, University of Toronto, Canada [email protected] Abstract: Evaluating business solutions before being deployed is essential for any organization. Risk is emerging as one of the most preeminent and accepted metrics for the evaluations of business solutions. In this paper, we present a comprehensive case study where the Tropos Goal-Risk framework is used to assess and treat risk on the basis of the likelihood and severity of failures within organizational settings. We present an analysis and an evaluation of business solutions within manufacturing enterprises. Keywords: Risk, Dependability, Metrics, Organization Biography Notes: Yudistira Asnar is a PhD student in ICT School at University of Trento, Italy. He received his degree in Informatics Engineering from Institut Teknologi Bandung, Indonesia in 2002. His research interests lie in the area of requirement engineering, agent systems, and security-dependability risk management. Paolo Giorgini is researcher at University of Trento. He received his Ph.D. degree from Computer Science Institute of University of Ancona (Italy) in 1998. He has worked on the development of requirements and design languages for agent-based systems, he is one of the founder of Tropos, an agent-oriented software engineering methodology. His publication list includes more than 140 refereed journal and conference proceedings papers and eight edited books. He is Co-editor in Chief of the International Journal of Agent-Oriented Software
Transcript of An evaluation of business solutions in manufacturing enterprises
Int. J. Int. J. Business Intelligence and Data Mining, Vol. x, No. x, xxxx 1
Copyright © 200x Inderscience Enterprises Ltd.
Evaluation of Business Solutions in Manufacturing Enterprises
Yudistira Asnar*, Paolo Giorgini
Dipartimento di Ingegneria e Scienza dell'Informazione,
University of Trento, Italy
{yudis.asnar, paolo.giorgini}@disi.unitn.it
* Corresponding author
Paolo Ciancarini, Rocco Moretti Department of Information and Communication Technology,
University of Bologna, Italy
{ciancarini, moretti}@cs.unibo.it
Maurizio Sebastianis Think3 Inc.
Nicola Zannone
Department of Computer Science,
University of Toronto, Canada
Abstract: Evaluating business solutions before being deployed is essential for
any organization. Risk is emerging as one of the most preeminent and accepted
metrics for the evaluations of business solutions. In this paper, we present a
comprehensive case study where the Tropos Goal-Risk framework is used to
assess and treat risk on the basis of the likelihood and severity of failures within
organizational settings. We present an analysis and an evaluation of business
solutions within manufacturing enterprises.
Keywords: Risk, Dependability, Metrics, Organization
Biography Notes:
Yudistira Asnar is a PhD student in ICT School at University of Trento, Italy.
He received his degree in Informatics Engineering from Institut Teknologi
Bandung, Indonesia in 2002. His research interests lie in the area of
requirement engineering, agent systems, and security-dependability risk
management.
Paolo Giorgini is researcher at University of Trento. He received his Ph.D.
degree from Computer Science Institute of University of Ancona (Italy) in
1998. He has worked on the development of requirements and design languages
for agent-based systems, he is one of the founder of Tropos, an agent-oriented
software engineering methodology. His publication list includes more than 140
refereed journal and conference proceedings papers and eight edited books. He
is Co-editor in Chief of the International Journal of Agent-Oriented Software
Y. Asnar et al. 2
Engineering (IJAOSE).
Paolo Ciancarini is full professor in Computer Science at the University of
Bologna (Italy). His research interests lie in the area of software engineering
and formal methods.
Rocco Moretti received a Ph.D. in Computer Science at University of Bologna
in 2005. He is currently a post-doctoral researcher in the area of Software
Engineering affiliated to the Department of Computer Science of the University
of Bologna (Italy). His research interests include software quality, software
metrics, requirements engineering, system and software modeling languages.
Maurizio Sebastianis received a degree in Civil Engineering at University of
Bologna in 1981. He is currently technical R&D manager in the PDM/PLM
area of Think3 Inc.
Nicola Zannone received a Ph.D. in Computer Science at University of Trento
in 2007. He is currently a Postdoc in the Department of Computer Science at
the University of Toronto. His research interests include computer security and
formal verification and focus on the modeling and verification of security and
trust aspects during the early requirements analysis in software engineering.
1. Introduction
Analysis and evaluation of business solutions is essential for every organization in order
to develop and implement successful business strategies. This has spurred the definition
of several metrics, such as in Cambridge Advanced Learner, where metrics are defined as
a system of measurement. Maizlitsh & Handler (2005) refine IT metrics into value
delivery (e.g., cost reduction, increase in revenue, and reduction of risk) and process
improvement. Value delivery metrics are intended to measure the quantity value, while
metrics for process improvement (e.g., Capability Maturity Model) measure the
continuity and quality of a process.
The last years have seen the emergence of risk as a metric for prioritizing events; see
for instance DoD (1980). Risk, defined as the combination of the likelihood of an event
and its consequences (ISO/IEC Guide 73, 2002), depicts the criticality of an event in
disrupting the system. Typically, analysts assess the risk level of events toward the
system and allocate the resources for safeguards according to their criticality. Risk is also
used to perform cost-benefit analysis among available solutions, and choose the most
cost-effective solution (i.e., the highest ratio between risk reduction and cost).
Many frameworks have been proposed for risk management (e.g., Bedford & Cooke
(2001), Butler & Fischbeck (2001), den Braber et al. (2003), DoD (1980)). However,
most of them overlook to analyze the organizational setting where the system operates.
An organization can be conceived as a network of actors where an actor depends on
others actors for fulfilling its goals. Risks are propagated between actors over
dependencies and it may happen that different actor may associate a different level of risk
to their duties. As a consequence, additional safeguards should be adopted to make
acceptable the level of risk for every actor of the organization.
In this paper, we present a comprehensive case study of the application of the Tropos
Goal-Risk (GR) framework (Asnar & Giorgini, 2006, Asnar et al., 2008) for the analysis
and evaluation of business solutions within manufacturing Small Medium Enterprises
Evaluation of Business Solutions in Manufacturing Enterprises 3
(SMEs). We present a modeling and an analysis process tailored to tool-supported risk
assessment and treatment/safeguard selection within organizational settings. The
framework extends the Tropos Goal Model (Giorgini et al., 2005) by adopting the idea of
the three layers analysis introduced by Feather et al. (2005) in their Defect Detection and
Prevention (DDP) framework. The three layers allow us to reason about uncertain events
that may obstruct business goals and to evaluate the effectiveness of treatments in
mitigating such events.
In this paper, we also evaluate the expressiveness of the modeling language and
validate the formal framework against an industrial case study. We analyze the intra-
manufacturing integration model defined in the course of the TOCAI.IT project1 in
collaboration with Think3,2 a consultancy company that provides business solutions (e.g.,
product development solutions, consulting services, and customer cares) for optimizing
the product development processes of SMEs. In particular, starting from the core
requirements of manufacturing SMEs elicited in the course of the project (Kiyavitskaya
et al., 2007), we have identified the risks affecting intra-manufacturing SMEs, and
analyzed and evaluated the treatments that are usually adopted in industry practices. In
(Asnar et al., 2008), we have analyzed this application domain using a qualitative
approach. In this paper, we employ a quantitative approach to assess the risk.
The paper is organized as follows. Next, we present the intra-manufacturing
integration model of SMEs that is used as a running example throughout the paper (§2).
Afterward, we discuss related work (§3), and continue with a brief introduction of the GR
framework (§4). We present the risk management process and illustrate step-by-step its
application to the intra-manufacturing integration model (§5). Finally, we discuss our
experience in applying the GR framework to the case study (§6) and conclude the paper
(§7).
2. Intra-Manufacturing SMEs
An intra-enterprise integration model is characterized by different divisions within the
same organization (or of several organizations with strong synergies) collaborating for
reaching common objectives or for executing specific processes. In the manufacturing
domain, the objective is the realization of a specific product. According to their business
model, manufacturing SMEs can be distinguished into two main categories: product-
oriented companies and order-oriented companies. The first category is mainly involved
in the production of a “relatively” fixed set of products that aim to fulfill the needs of a
large market. Typically, SMEs, in this category, aim to manufacture a competitive
product by trading-off its quality. In this setting, time-to-market is the main aspect to be
considered. The second category concerns the production of a variable set of products
depending on the specific requirements given by customers. The main objectives for
these companies are that products shall meet the customer needs. We refer to a detailed
presentation of the core requirements for manufacturing SMEs to Kiyavitskaya et al.
(2007), whereas in the rest of the paper we mainly focus on the risk affecting such
organizations.
Though both categories of SMEs have a similar organizational structure and are
1FIRB-TOCAI.IT RBNE05BFRK – http://www.dis.uniroma1.it/~tocai/
2The official web site is http://www.think3.com
Y. Asnar et al. 4
exposed to similar risks, they require different business solutions. This is because of the
different level of risks (i.e., likelihood and severity) due to the different business model
as well as to the different business objectives. For instance, the event engineering change
request of a product occurs more often in the order-oriented setting comparing at the
product-oriented one. Conversely, the risk of late for product delivery is more severe for
the product-oriented companies because the goal of reduce time-to-market is valued more
than in the order-oriented one.
In product-oriented companies, risk analysis has to deeply investigate aspects
concerning how to “produce the product right”, whereas in order-oriented companies the
analysis considers the issues of producing the “right product” for a client. From a
software engineering perspective, such concerns are similar to the concepts of
verification and validation of a product, respectively. Verification considers the
compliance of the final product with its requirements, whereas validation focuses on the
acceptance of the final product by the client. In a product-oriented company, the
acceptance process of the products by clients is not feasible due to the large set of
products and clients to be considered. Similarly, it is meaningless for an order-oriented
company to evaluate the compliance with the requirements of a product without
considering its acceptance by a specific client.
3. State of the Art
Many approaches have been proposed for identifying products and systems enabling the
coordination and cooperation in the intra-enterprise integration model for SMEs. For
instance, Lindsey et al. (1990) have studied the relationship between the organizational
strategy and the effect of IT. Their work points out that a responsive infrastructure
enabling to adapt and accept changes is essential to the strategic effectiveness of IT.
According to McFarlan (1984), IT might influence the competition by introducing
barriers to the entrance of new competitors, changing the relationship between customers
and suppliers, enlarging the basis of potential suppliers or strengthening the existent
relationships, or even by creating new businesses. Pooley & Wilcox (2000) have
analyzed the application of IT for supporting the coordination of geographically-
distributed teams. The development of such distributed environments can support
decision making processes by means of the exchange of ideas and discussion.
However, the solution (e.g., products or systems) identification process must be
followed up by an evaluation step. In the area of IT metrics, there are several mature
metrics that have been proposed to evaluate business solutions. Goodman (2004) defines
a set of metrics for evaluating software solutions. The set spans from measuring the
complexity of software (e.g., function point) to cost-estimation metrics. The author also
presents guidelines to customize metrics with respect to the needs of specific
organizations. Rico (2004) puts more emphasis in the economical aspects of alternatives
proposing metrics, such as Return-of-Investment, Net Present value, and Break-even
point. The motivation behind these metrics is that the solution is part of the investment
and must generate values to the organization. Jaquith (2007) specifies some criteria for
the definition of good security metrics (e.g., without subjective criteria, cheap to conduct,
expressed in terms of a cardinal number or percentage, and not qualitative values with at
least one unit of measure, and specific/relevant enough for decision-making). Based on
such criteria, the authors propose security metrics that are intended to measure the
Evaluation of Business Solutions in Manufacturing Enterprises 5
security of a system and relate them to business values.
In the risk analysis domain, there are several models that attempt to assess uncertain
events together with their likelihood and severity. For instance, Probabilistic Risk
Analysis (PRA) (Bedford & Cooke, 2001) is widely used to assess risks quantitatively,
and FMECA (DoD, 1980) proposes qualitative values (i.e., frequent, reasonable probable,
occasional, remote, and extremely unlikely). Events are prioritized using the notion of
“loss expectancy” which is computed over the likelihood of events and their severity.
This priority represents the criticality of an event. When resources are limited, analysts
can decide to adopt countermeasures for mitigating events on the basis of their priority.
Butler & Fischbeck (2001) recognize that many factors (e.g., reliable, available, safe,
etc.) can be critical for a system and each of them has its own risks. Based on this
intuition, they propose Multi-Attribute Risk Assessment to improve the risk analysis
process by considering multi-attributes. The framework simultaneously considers many
factors like reliability, availability, safety and confidentiality by enabling analysts to find
the right trade-off among these factors. The capability of choosing cost-effective
countermeasures to deal with existing security threats using Multi-Attribute Risk
Assessment is presented in (Butler, 2002). Feather (Feather, 2004) proposes Defect
Detection and Prevention (DDP). DDP consists of a three layers model: Objectives,
Risks, and Mitigation. Each objective has a weight that represents its importance; each
risk has a likelihood of occurrence; whereas mitigation has a cost for its accomplishment
(mainly resource consumption). Severity of a risk impacting an objective can be
represented by an impact relation between the objective and the risk. A DDP model also
specifies how to compute the level of objective achievement and the cost of mitigation.
This calculation allows the evaluation of the impact of adopted countermeasures to better
support the decision making process. DDP has also been integrated with other
quantitative frameworks (e.g., FMECA (DoD, 1980), FTA (Stamatelatos et al., 2002)) to
model and assess risks/failures. Though these proposals are adequate to estimate the level
of risk of a system, they consider the risk of technical system and lack in modeling and
analyzing social/organizational aspects of the system. Finally, the CORAS
methodology (den Braber et al., 2003) combines UML and Unified Process to support a
model-based risk assessment. In particular, it proposes an integrated system development
and risk management process for security critical systems.
4. Tropos Goal-Risk
The Tropos Goal-Risk (GR) framework (Asnar et al., 2008) has been designed to assess
the risk of uncertain events over organization strategies and to evaluate the effectiveness
of treatments. It consists of a modeling framework, which is explained in this section, and
a risk assessment and treatment process, which is detailed in the next section.
The modeling framework consists of three conceptual layers:
Asset layer captures strategic interests of the stakeholders and what are the means to
achieve them;
Event layer represents uncertain events along their impacts to the asset layer;
Treatment layer depicts treatments to be adopted in order to mitigate the risk of the
event layer over the asset layer.
Y. Asnar et al. 6
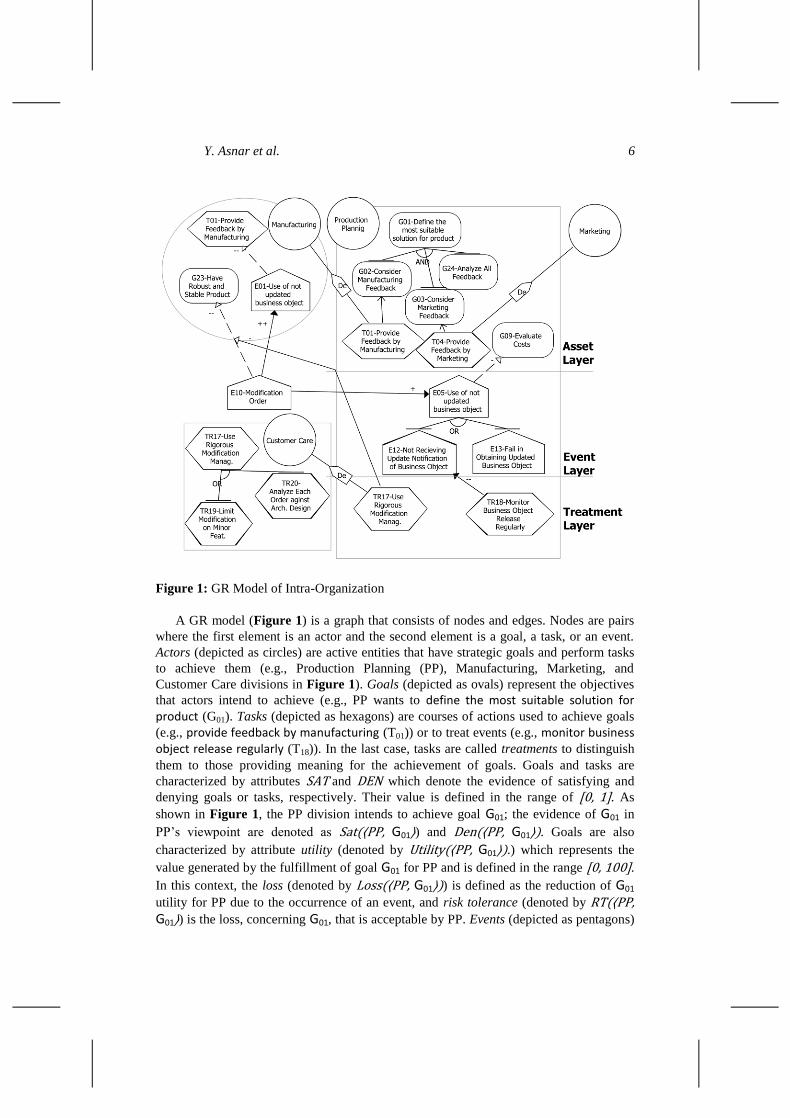
Figure 1: GR Model of Intra-Organization
A GR model (Figure 1) is a graph that consists of nodes and edges. Nodes are pairs
where the first element is an actor and the second element is a goal, a task, or an event.
Actors (depicted as circles) are active entities that have strategic goals and perform tasks
to achieve them (e.g., Production Planning (PP), Manufacturing, Marketing, and
Customer Care divisions in Figure 1). Goals (depicted as ovals) represent the objectives
that actors intend to achieve (e.g., PP wants to define the most suitable solution for product (G01). Tasks (depicted as hexagons) are courses of actions used to achieve goals
(e.g., provide feedback by manufacturing (T01)) or to treat events (e.g., monitor business object release regularly (T18)). In the last case, tasks are called treatments to distinguish
them to those providing meaning for the achievement of goals. Goals and tasks are
characterized by attributes SAT and DEN which denote the evidence of satisfying and
denying goals or tasks, respectively. Their value is defined in the range of [0, 1]. As
shown in Figure 1, the PP division intends to achieve goal G01; the evidence of G01 in
PP‟s viewpoint are denoted as Sat(⟨PP, G01⟩) and Den(⟨PP, G01⟩). Goals are also
characterized by attribute utility (denoted by Utility(⟨PP, G01⟩).) which represents the
value generated by the fulfillment of goal G01 for PP and is defined in the range [0, 100].
In this context, the loss (denoted by Loss(⟨PP, G01⟩)) is defined as the reduction of G01
utility for PP due to the occurrence of an event, and risk tolerance (denoted by RT(⟨PP, G01⟩) is the loss, concerning G01, that is acceptable by PP. Events (depicted as pentagons)
Evaluation of Business Solutions in Manufacturing Enterprises 7
are used to represent uncertain circumstances that can affect goals and tasks in the asset
layer. An event is characterized by attribute likelihood, which represents the probability
that an event occur, and its severity affecting the asset layer (captured by impact
relations).
Edges consist of decomposition, contribution, means-end, impact, alleviation, and
dependency relations. Two types of decomposition relation are possible: AND and OR
decomposition. AND decomposition is used to refine goals, tasks, or events into more
refined structures. For example, goal G01 is AND decomposed into subgoals G02, G03, and
G24. This relation implies that all subgoals must be achieved to achieve G01. OR
decomposition is used to model the alternatives to achieve a goal, to execute a task, or for
the occurrence of an event. For instance, treatment TR17 has two alternatives of execution
(OR-decomposition), either TR19 or TR20. Impact relations connect events to goals and
tasks. These relations capture the severity of events over the asset layer and are
distinguished into four types: + and + + to model opportunities (i.e., events with positive
impacts), and − and −− to model risks (i.e., events with negative impacts). For example,
Event E05 obstructs goal G09. Means-end relations link goals to the tasks used to satisfy
them. In Figure 1, T04 is the means to achieve G03. Contribution relations denote the
side-effects of goals/tasks to the other goals/tasks/events. These relations are categorized
into 4 types as impact relations. Additionally, these relations are also used to model the
effect of treatments on the likelihood of events. For example, treatment TR18 is used to
reduce the likelihood of event E12. Alleviation relations model the mitigation of the
(negative) impact of events due to the adoption of some treatment. Alleviation relations
are distinguished into: − and − − which represent the extent in mitigating the severity of
events. In Figure 1, TR17 mitigates the severity of E10 obstructing G23. The formal
semantics of these relations have been presented in (Asnar & Giorgini, 2007).
The inter-dependencies among actors are modeled through dependency relations
which denote the dependency an actor (the depender) to another actor (the dependee) for
fulfilling a goal or executing a task (the dependum). In Figure 1, PP depends on
Marketing for the execution of TR04. Intuitively, the evidence of TR04 in the PP‟s
viewpoint is calculated from the evidence of Marketing about the same task. By means of
the modeling language, one can assess the risks along the organization objectives and
assets analysis. Next section presents the risk management process that includes the steps
for eliciting GR models as well as for risk assessment.
5. Tropos Risk Management Process
In the previous section, we have presented a conceptual framework for risk identification,
description, estimation, and treatment identification, within organizations. Here, we
present step-by-step the risk management process (Figure 2) using themanufacturing
SME example to illustrate the application of its phases. In this context, we will perform
an of operationalization activity to refine an impricise concept to be measurable in
specific observations.
The examples presented in this section are illustrator examples of the different steps
of our approach in the context of the organizational domain for SMEs. The general
scenario represented by these examples can be instantiated tailoring the steps included in
the proposed approach for a specific organization. This can be done acquiring the
organizational knowledge by interviewing the managers of the selected organization.
Y. Asnar et al. 8
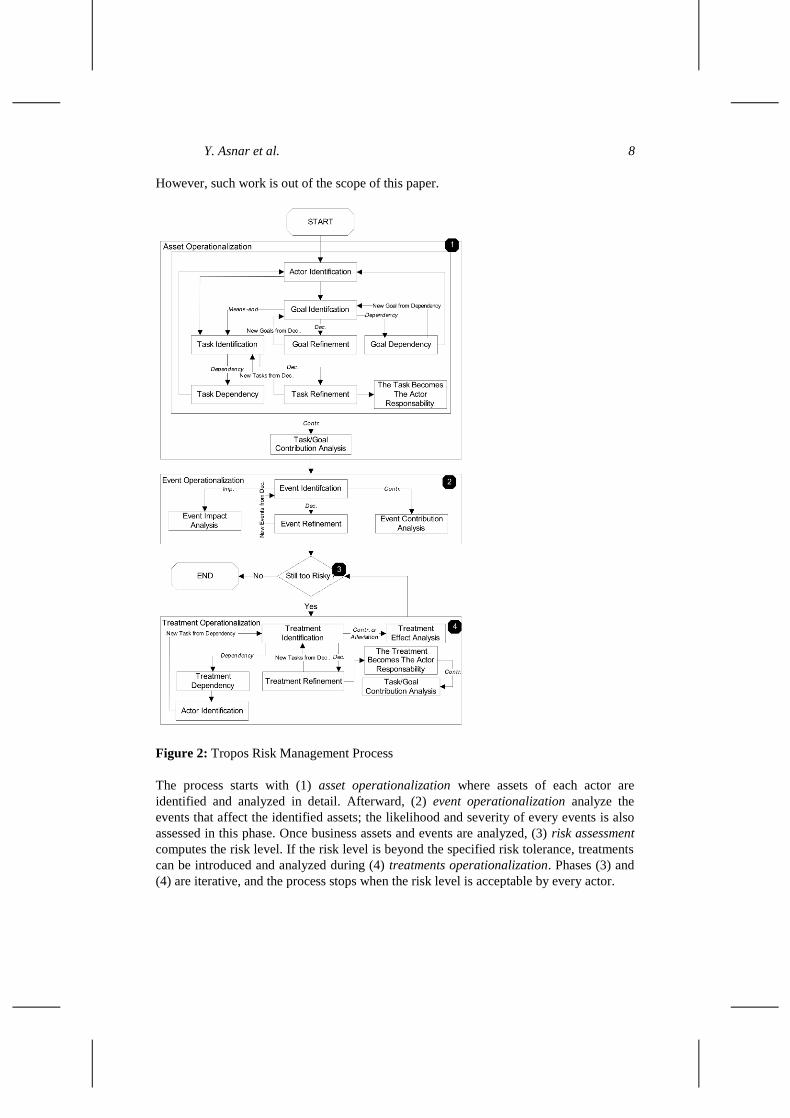
However, such work is out of the scope of this paper.
Figure 2: Tropos Risk Management Process
The process starts with (1) asset operationalization where assets of each actor are
identified and analyzed in detail. Afterward, (2) event operationalization analyze the
events that affect the identified assets; the likelihood and severity of every events is also
assessed in this phase. Once business assets and events are analyzed, (3) risk assessment
computes the risk level. If the risk level is beyond the specified risk tolerance, treatments
can be introduced and analyzed during (4) treatments operationalization. Phases (3) and
(4) are iterative, and the process stops when the risk level is acceptable by every actor.
Evaluation of Business Solutions in Manufacturing Enterprises 9
5.1 Asset Operationalization
Asset operationalization starts by identifying the actors relevant to the application
domain. Actors are not only internal the organization, but also include external actors
participating to the business activities of the organization such as clients and suppliers.
Example 1 - In the manufacturing SME domain, we have identified 9 main actors:
The Chief Executive Officer (CEO) is responsible to ensure the global
efficiency of the organization.
The Customer Care division interacts with the customer.
The Manufacturing division plans manufacturing activities and builds the
products.
The Marketing division defines the contents of the products and providing
sales tools.
The Production Planning division finds the most suitable solution for a
product.
The Purchase division defines and evaluates alternative purchase strategies.
The Research and Development division develops new technologies and
improves existing products.
The Quality Assurance division tests products.
The Sales division sells products to customers and supports them in the
buying process.
The asset operationalization process may require the introduction of new actors to whom
goals (or tasks) are delegated leading to a new iteration of actor identification.
For each identified actor, the analyst identifies its goals. Actors may not be able to
fully achieve their goals by themselves. They can either appoint other actors to fulfill
them entirely, or decompose them and assign part of them to other actors. Identified goals
are thus used as input for goal refinement or goal dependency.
Y. Asnar et al. 10
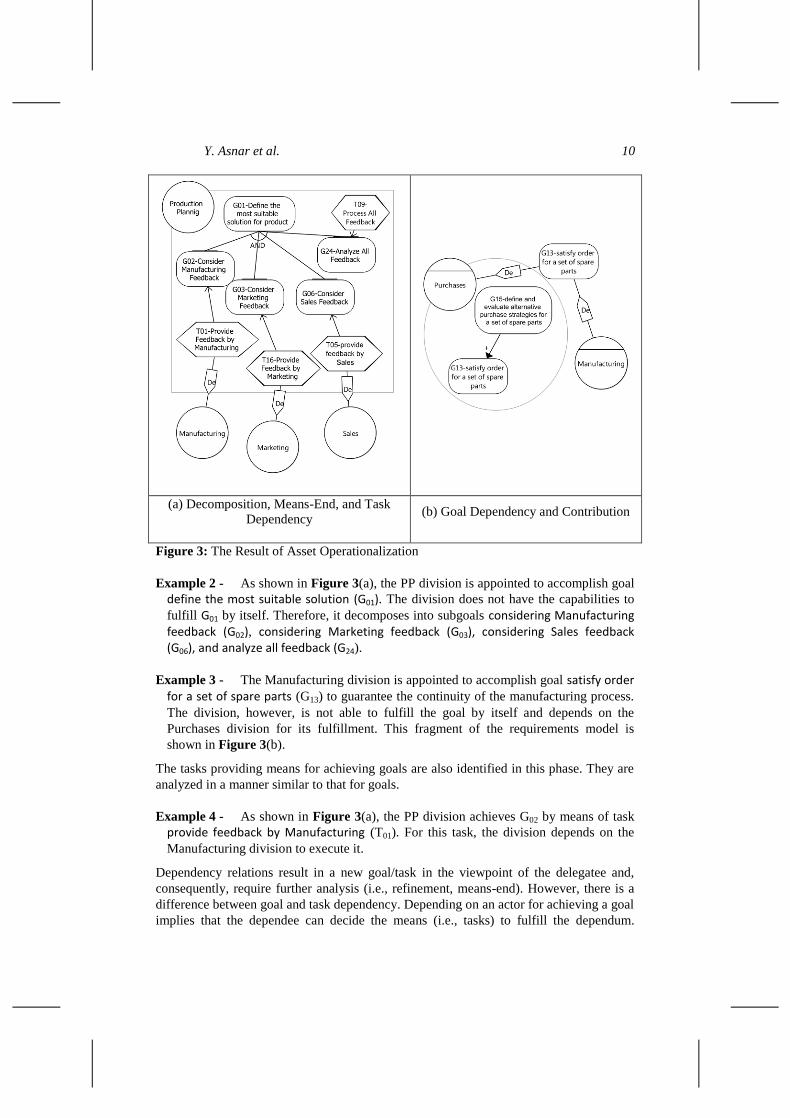
(a) Decomposition, Means-End, and Task
Dependency (b) Goal Dependency and Contribution
Figure 3: The Result of Asset Operationalization
Example 2 - As shown in Figure 3(a), the PP division is appointed to accomplish goal
define the most suitable solution (G01). The division does not have the capabilities to
fulfill G01 by itself. Therefore, it decomposes into subgoals considering Manufacturing feedback (G02), considering Marketing feedback (G03), considering Sales feedback (G06), and analyze all feedback (G24).
Example 3 - The Manufacturing division is appointed to accomplish goal satisfy order for a set of spare parts (G13) to guarantee the continuity of the manufacturing process.
The division, however, is not able to fulfill the goal by itself and depends on the
Purchases division for its fulfillment. This fragment of the requirements model is
shown in Figure 3(b).
The tasks providing means for achieving goals are also identified in this phase. They are
analyzed in a manner similar to that for goals.
Example 4 - As shown in Figure 3(a), the PP division achieves G02 by means of task
provide feedback by Manufacturing (T01). For this task, the division depends on the
Manufacturing division to execute it.
Dependency relations result in a new goal/task in the viewpoint of the delegatee and,
consequently, require further analysis (i.e., refinement, means-end). However, there is a
difference between goal and task dependency. Depending on an actor for achieving a goal
implies that the dependee can decide the means (i.e., tasks) to fulfill the dependum.
Evaluation of Business Solutions in Manufacturing Enterprises 11
Conversely, depending on an actor for executing a task means that the depender has
determined the exact procedure to be followed by the dependee for executing the task. In
other words, the depender specifies “how-to” perform the assigned duty.
The first step of the asset operationalization process ends when the goals of every
actor have been assigned to the capable actors. Next step consists in analyzing the side-
effects of a goal/task over other goals/tasks using contribution analysis.
Example 5 - As shown in Figure 3(b), the satisfaction of define and evaluate alternative purchase strategies for a set of spare parts (G15) positively contributes to
the achievement of G13.
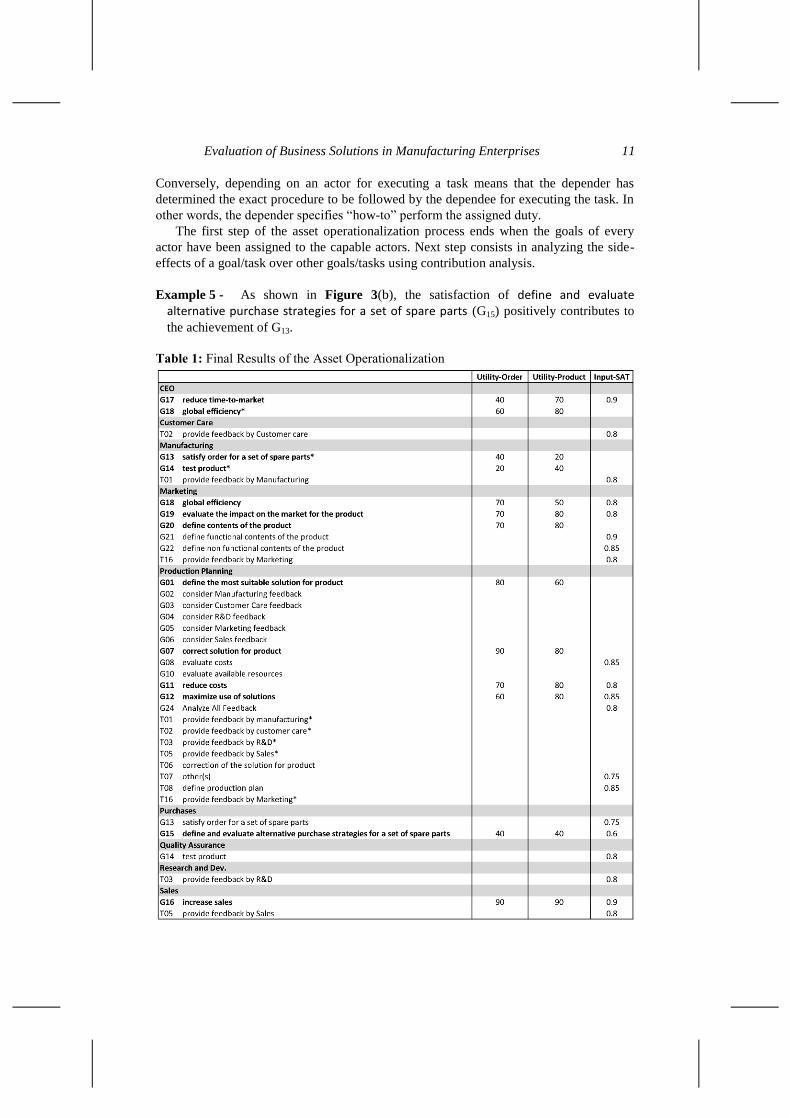
Table 1: Final Results of the Asset Operationalization
Y. Asnar et al. 12
Table 1 presents the identified actors together with their goals and the tasks employed to
fulfill them. The symbol “*” indicates that the asset is delegated to another actor.
Business (top) goals (indicated in bold in the table) are described along their utility with
respect to the perspective of the corresponding actor. The utility represent how much a
goal is critical for an actor. As suggested by Think3, asset utility can change depending
on the business strategy adopted by the organization.
Example 6 - As shown in Table 1, goal reduce time-to-market (G17) has a higher
value for product-oriented companies, whereas goal define the most suitable solution for product (G01) has a higher value for order-oriented companies. Accordingly, G17 is
more critical in product-oriented companies than in order-oriented companies and vice-
versa for G01.
Goals and tasks can also be described in terms of their SAT and DEN evidence. In this
case, we have specified SAT evidence (column Input-SAT in Table 1) based on the
Think3‟s past experiences. This evidence is used, together with relations among goals
and tasks, and dependency relations, by the risk assessment process (Section 5.3) to
assess the final evidence of the business goals.
5.2 Event Operationalization
Event operationalization is intended to analyze events and their impact on the asset layer.
First, the process identifies the events relevant for the application domain and models
them in the event layer. In this work, we have followed the guidelines defined in
(Landwehr et al., 1994, Carr et al., 1993, Stamatelatos et al., 2002, Lee et al., 2006,
Holton, 2004) for the identification of the events whose occurrence is critical to
organizations, beside exploiting the knowledge of Think3 about the application domain.
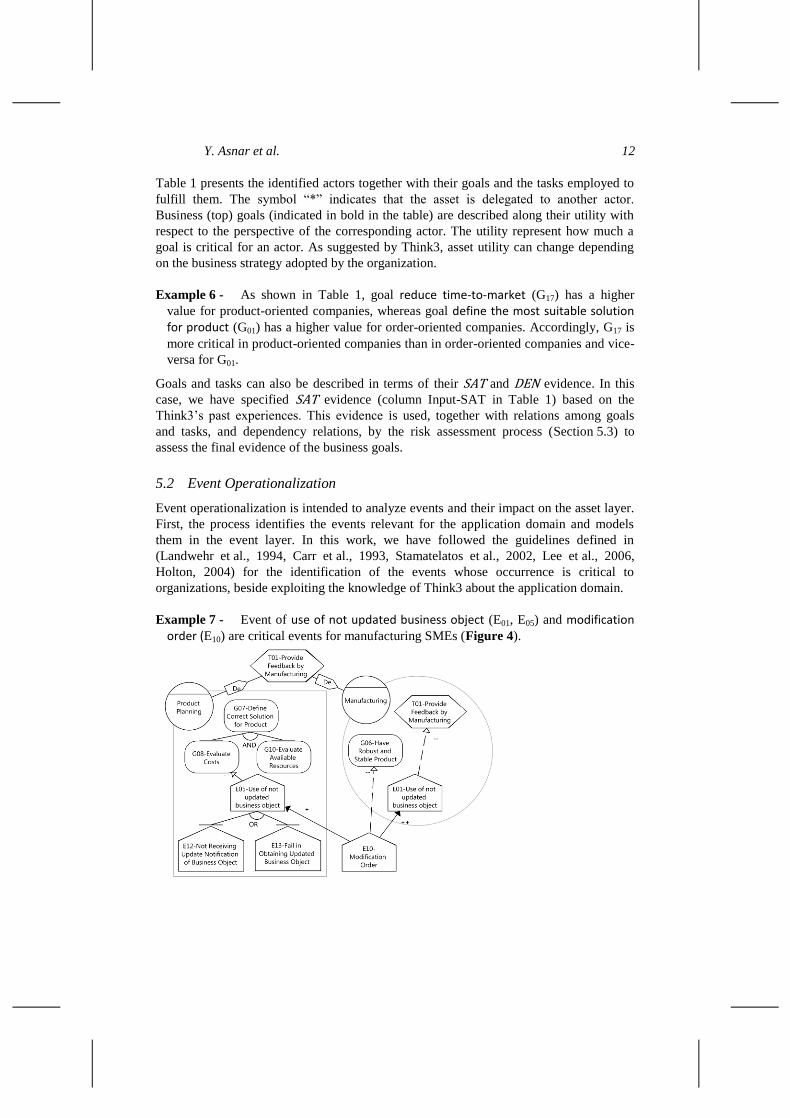
Example 7 - Event of use of not updated business object (E01, E05) and modification order (E10) are critical events for manufacturing SMEs (Figure 4).
Evaluation of Business Solutions in Manufacturing Enterprises 13
Figure 4: The Result of Event Operationalization
The reader may notice that events E01 and E05 have the same name. We noticed that the
likelihood of events are different depending on in which actors it happens. Thus, the
framework treats them as distinct events to avoid misunderstanding in the value of
evidences. Conversely, all actors within the organization expose to E10 with the same
likelihood. To distinguish events on the basis of their behavior, we call local events for
the events whose likelihood is related to an actor, and global events the events whose
likelihood is independent from a single actor. In graphical models, local events are
modeled inside the rational of actors; whereas global events are modeled outside the
rational of actors (see Figure 4).
Events can be refined into finer events using decomposition relations (AND/OR). The
refinement process stops when all leaf-events are tangible (i.e., can be easily assessed or
their decomposition is negligible). This is similar to the proposal by Stamatelatos et al.
(2002) who refine failure-modes/events until reaching basic events for which the data
about their reliability is available and further refinement does not make meaningful
difference.
Example 8 - Event E05 is refined into events not receiving update notification of business object (E12) and fail in obtaining updated business object (E13). Conversely,
E01 is not refined because Manufacturing does not distinguish E01 in finer events.
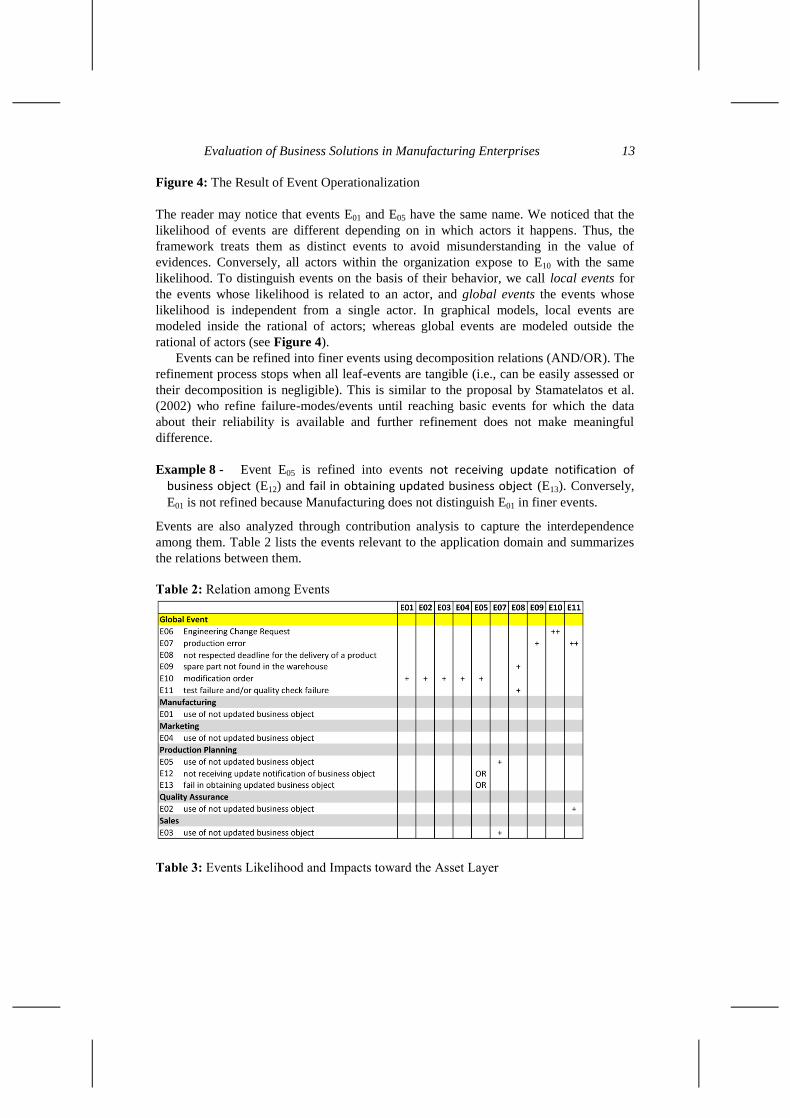
Events are also analyzed through contribution analysis to capture the interdependence
among them. Table 2 lists the events relevant to the application domain and summarizes
the relations between them.
Table 2: Relation among Events
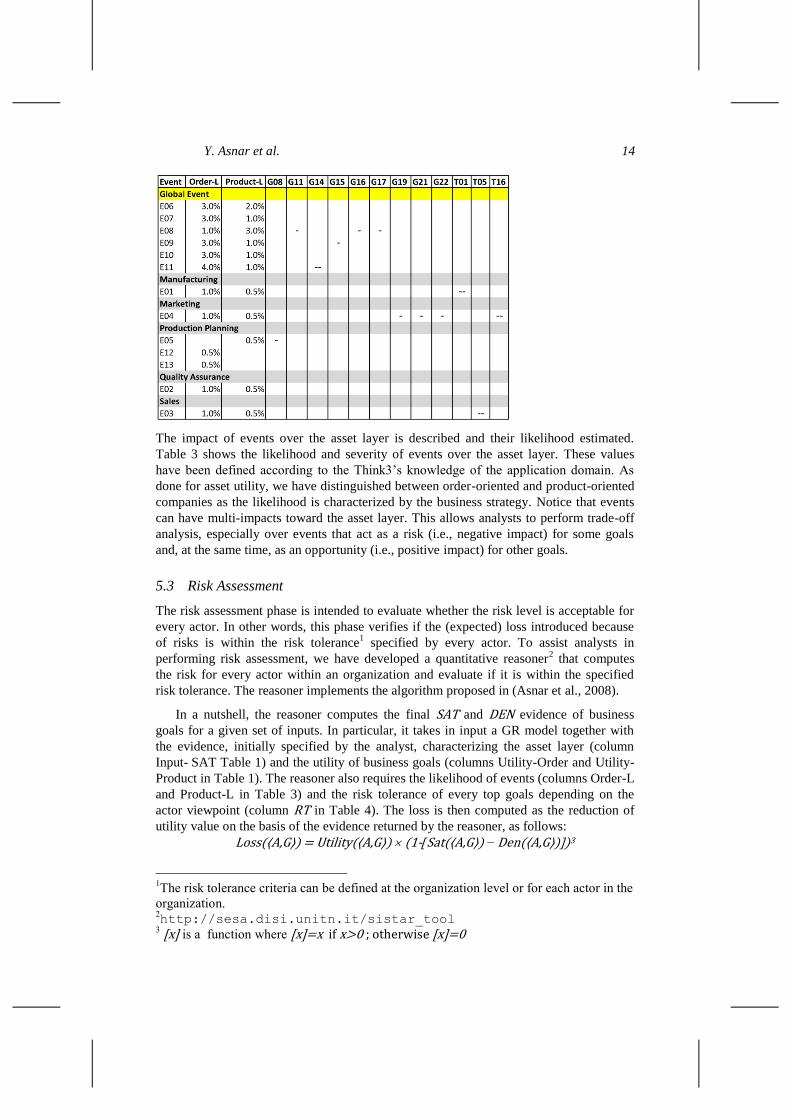
Table 3: Events Likelihood and Impacts toward the Asset Layer
Y. Asnar et al. 14
The impact of events over the asset layer is described and their likelihood estimated.
Table 3 shows the likelihood and severity of events over the asset layer. These values
have been defined according to the Think3‟s knowledge of the application domain. As
done for asset utility, we have distinguished between order-oriented and product-oriented
companies as the likelihood is characterized by the business strategy. Notice that events
can have multi-impacts toward the asset layer. This allows analysts to perform trade-off
analysis, especially over events that act as a risk (i.e., negative impact) for some goals
and, at the same time, as an opportunity (i.e., positive impact) for other goals.
5.3 Risk Assessment
The risk assessment phase is intended to evaluate whether the risk level is acceptable for
every actor. In other words, this phase verifies if the (expected) loss introduced because
of risks is within the risk tolerance1 specified by every actor. To assist analysts in
performing risk assessment, we have developed a quantitative reasoner2 that computes
the risk for every actor within an organization and evaluate if it is within the specified
risk tolerance. The reasoner implements the algorithm proposed in (Asnar et al., 2008).
In a nutshell, the reasoner computes the final SAT and DEN evidence of business
goals for a given set of inputs. In particular, it takes in input a GR model together with
the evidence, initially specified by the analyst, characterizing the asset layer (column
Input- SAT Table 1) and the utility of business goals (columns Utility-Order and Utility-
Product in Table 1). The reasoner also requires the likelihood of events (columns Order-L
and Product-L in Table 3) and the risk tolerance of every top goals depending on the
actor viewpoint (column RT in Table 4). The loss is then computed as the reduction of
utility value on the basis of the evidence returned by the reasoner, as follows:
Loss(⟨A,G⟩) = Utility(⟨A,G⟩) (1-Sat(⟨A,G⟩) − Den(⟨A,G⟩))3
1The risk tolerance criteria can be defined at the organization level or for each actor in the
organization. 2http://sesa.disi.unitn.it/sistar_tool
3 [x] is a function where [x]=x if x>0 ; otherwise [x]=0
Evaluation of Business Solutions in Manufacturing Enterprises 15
where Utility(⟨A,G⟩) is the value specified by the analyst for business goal G with respect
to actor A, and Sat(⟨A,G⟩) and Den(⟨A,G⟩) are the evidence returned by the reasoner.
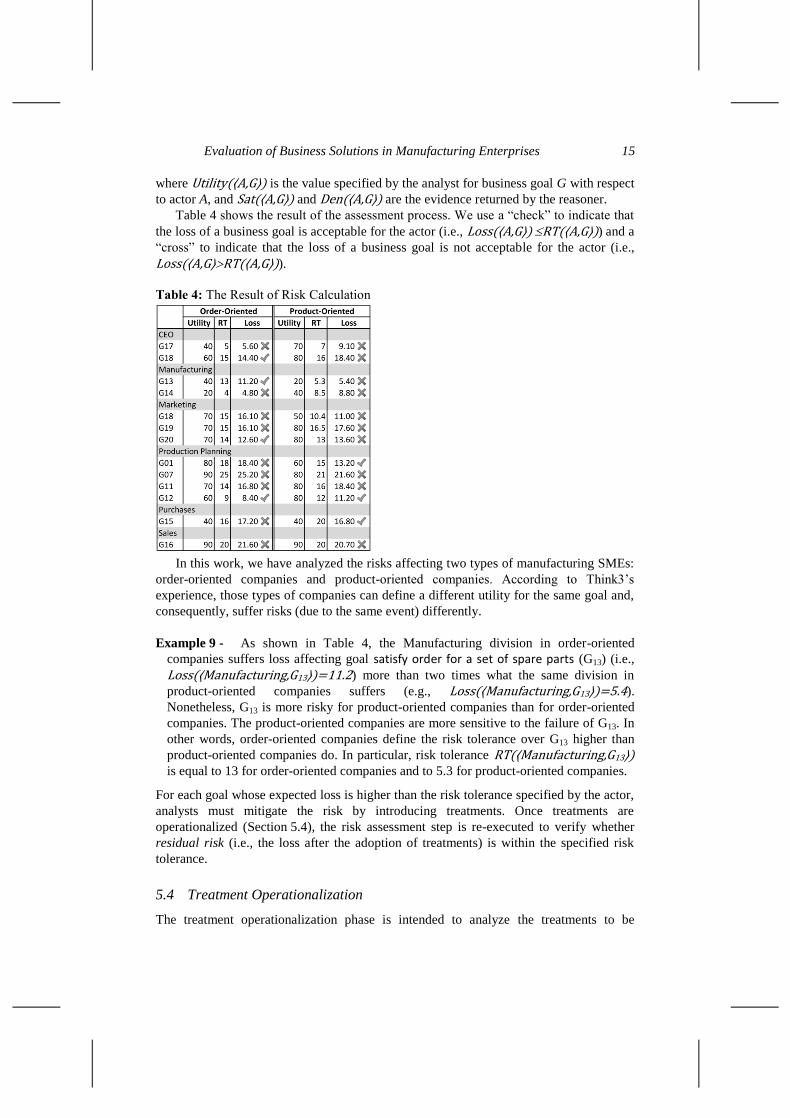
Table 4 shows the result of the assessment process. We use a “check” to indicate that
the loss of a business goal is acceptable for the actor (i.e., Loss(⟨A,G⟩) RT(⟨A,G⟩)) and a
“cross” to indicate that the loss of a business goal is not acceptable for the actor (i.e.,
Loss(⟨A,G⟩RT(⟨A,G⟩)).
Table 4: The Result of Risk Calculation
In this work, we have analyzed the risks affecting two types of manufacturing SMEs:
order-oriented companies and product-oriented companies. According to Think3‟s
experience, those types of companies can define a different utility for the same goal and,
consequently, suffer risks (due to the same event) differently.
Example 9 - As shown in Table 4, the Manufacturing division in order-oriented
companies suffers loss affecting goal satisfy order for a set of spare parts (G13) (i.e.,
Loss(⟨Manufacturing,G13⟩)=11.2) more than two times what the same division in
product-oriented companies suffers (e.g., Loss(⟨Manufacturing,G13⟩)=5.4).
Nonetheless, G13 is more risky for product-oriented companies than for order-oriented
companies. The product-oriented companies are more sensitive to the failure of G13. In
other words, order-oriented companies define the risk tolerance over G13 higher than
product-oriented companies do. In particular, risk tolerance RT(⟨Manufacturing,G13⟩) is equal to 13 for order-oriented companies and to 5.3 for product-oriented companies.
For each goal whose expected loss is higher than the risk tolerance specified by the actor,
analysts must mitigate the risk by introducing treatments. Once treatments are
operationalized (Section 5.4), the risk assessment step is re-executed to verify whether
residual risk (i.e., the loss after the adoption of treatments) is within the specified risk
tolerance.
5.4 Treatment Operationalization
The treatment operationalization phase is intended to analyze the treatments to be
Y. Asnar et al. 16
adopted by an organization in order to mitigate assessed risks. This step shares the same
conceptual and methodological approach used to analyze tasks during the asset
operationalization. First, treatments are identified along the actors responsible to execute
them; then treatments can be either delegated to other actors or refined. During this
phase, new actors can be identified. Afterward, analysts assess the effect of treatments in
mitigating the risk (either reducing the likelihood of events or reducing their severity).
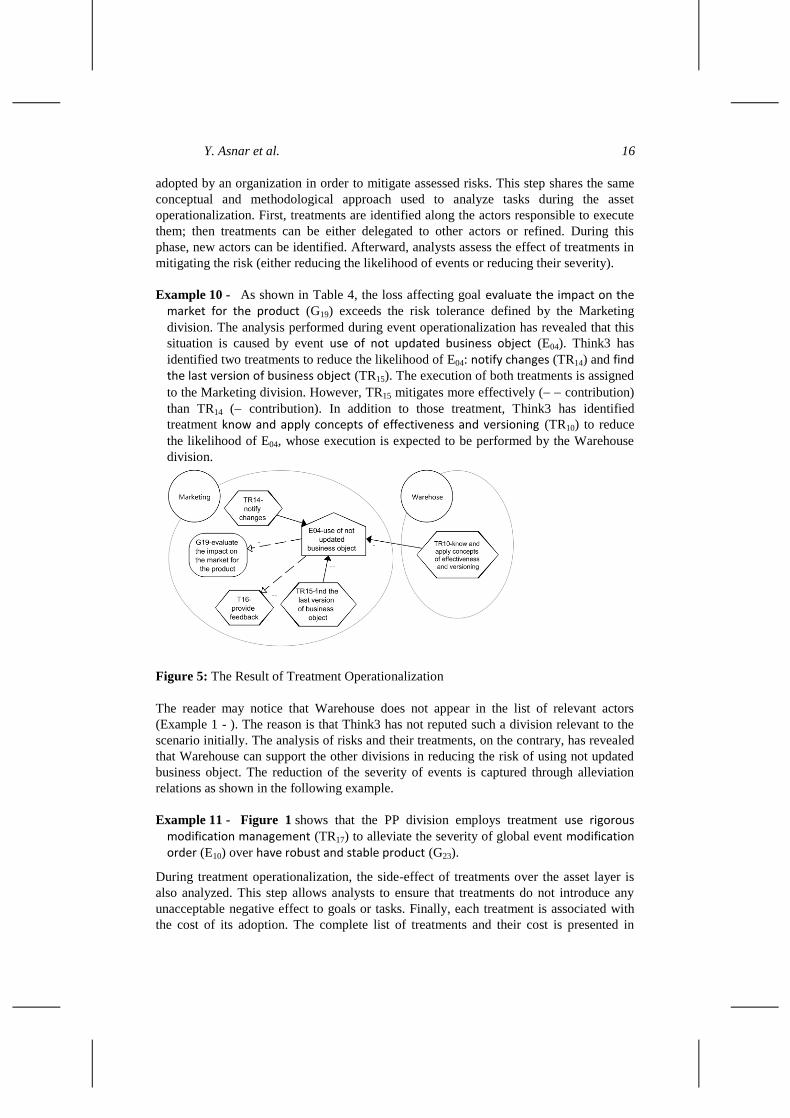
Example 10 - As shown in Table 4, the loss affecting goal evaluate the impact on the market for the product (G19) exceeds the risk tolerance defined by the Marketing
division. The analysis performed during event operationalization has revealed that this
situation is caused by event use of not updated business object (E04). Think3 has
identified two treatments to reduce the likelihood of E04: notify changes (TR14) and find the last version of business object (TR15). The execution of both treatments is assigned
to the Marketing division. However, TR15 mitigates more effectively ( contribution)
than TR14 ( contribution). In addition to those treatment, Think3 has identified
treatment know and apply concepts of effectiveness and versioning (TR10) to reduce
the likelihood of E04, whose execution is expected to be performed by the Warehouse
division.
Figure 5: The Result of Treatment Operationalization
The reader may notice that Warehouse does not appear in the list of relevant actors
(Example 1 - ). The reason is that Think3 has not reputed such a division relevant to the
scenario initially. The analysis of risks and their treatments, on the contrary, has revealed
that Warehouse can support the other divisions in reducing the risk of using not updated
business object. The reduction of the severity of events is captured through alleviation
relations as shown in the following example.
Example 11 - Figure 1 shows that the PP division employs treatment use rigorous modification management (TR17) to alleviate the severity of global event modification order (E10) over have robust and stable product (G23).
During treatment operationalization, the side-effect of treatments over the asset layer is
also analyzed. This step allows analysts to ensure that treatments do not introduce any
unacceptable negative effect to goals or tasks. Finally, each treatment is associated with
the cost of its adoption. The complete list of treatments and their cost is presented in

Evaluation of Business Solutions in Manufacturing Enterprises 17
Table 5. Notice that we have not distinguished the cost of treatments with respect to
order-oriented and product-oriented companies. According to Think3, the cost is
independent from the business strategy adopted by a company.
Table 5: List of Available Treatment Along with Two Strategies (A1 & A2)
Once treatment operationalization is completed, analysts re-assess risks as illustrated in
Section 5.2. In particular, they can analyze and evaluate different strategies (i.e., sets of
treatments) to mitigate risks. Here, we have considered two strategies - A1 and A2 - as
defined in Table 51. Each strategy is associated with a cost (Total Cost in Table 5) which
is defined as the sum of the cost of the treatments that compound it. In our example, A1
costs 525 and A2 costs 485.
For each strategy, analysts determine if the residual risk is within the risk tolerance
defined by actors. In other words, analysts evaluate the effectiveness of the treatments
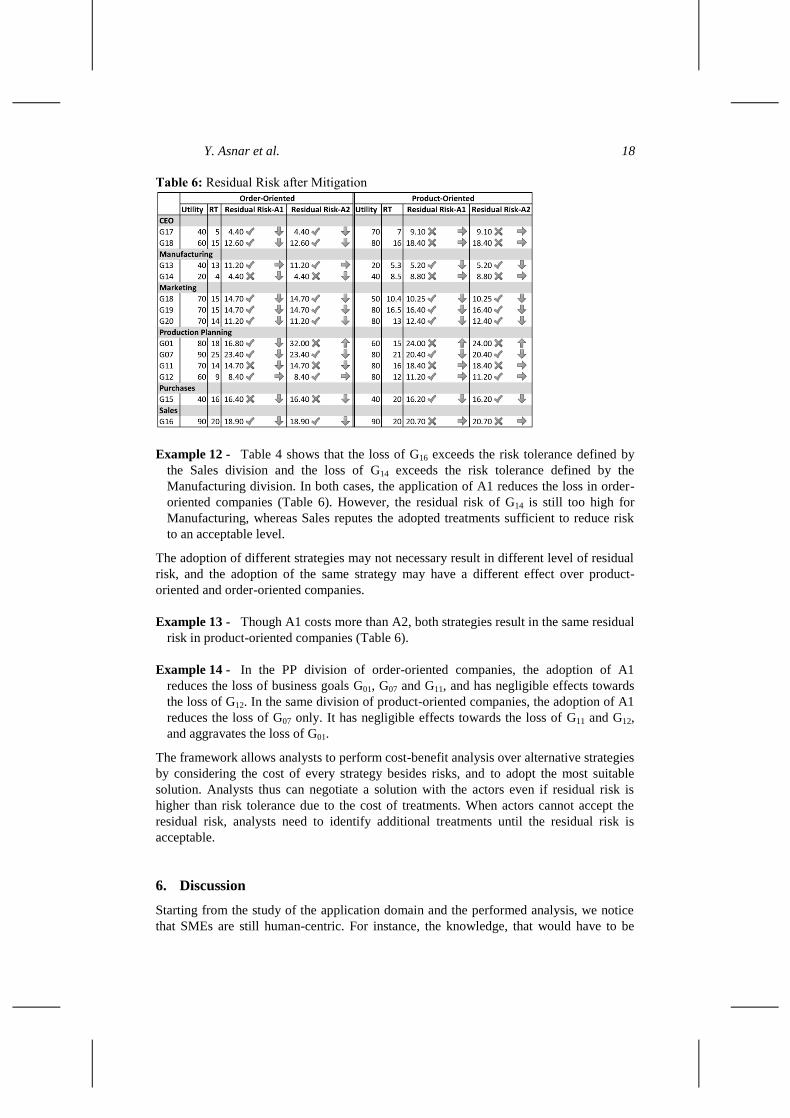
employed. Table 6 presents the residual risk calculated for different sets of treatments. As
in Table 5, we use a “check”, as in Table 4, if the residual risk is acceptable (e.g., G18 for
Marketing), and a “cross” if not (e.g., G11 for Production Planning). Moreover, we use a
down arrow to indicate that the residual risk is lower than the loss calculated before
employing treatments, with the intended meaning that treatments have mitigated risks
successfully; a right arrow to indicate that the residual risk is equal to the loss, with the
intended meaning that treatments have no effect on risks; and a up arrow to indicate that
the residual risk is higher than the initial loss, with the intended meaning that treatments
have aggravated risks.
1 “X” refers to the treatment that is adopted to the system.
Y. Asnar et al. 18
Table 6: Residual Risk after Mitigation
Example 12 - Table 4 shows that the loss of G16 exceeds the risk tolerance defined by
the Sales division and the loss of G14 exceeds the risk tolerance defined by the
Manufacturing division. In both cases, the application of A1 reduces the loss in order-
oriented companies (Table 6). However, the residual risk of G14 is still too high for
Manufacturing, whereas Sales reputes the adopted treatments sufficient to reduce risk
to an acceptable level.
The adoption of different strategies may not necessary result in different level of residual
risk, and the adoption of the same strategy may have a different effect over product-
oriented and order-oriented companies.
Example 13 - Though A1 costs more than A2, both strategies result in the same residual
risk in product-oriented companies (Table 6).
Example 14 - In the PP division of order-oriented companies, the adoption of A1
reduces the loss of business goals G01, G07 and G11, and has negligible effects towards
the loss of G12. In the same division of product-oriented companies, the adoption of A1
reduces the loss of G07 only. It has negligible effects towards the loss of G11 and G12,
and aggravates the loss of G01.
The framework allows analysts to perform cost-benefit analysis over alternative strategies
by considering the cost of every strategy besides risks, and to adopt the most suitable
solution. Analysts thus can negotiate a solution with the actors even if residual risk is
higher than risk tolerance due to the cost of treatments. When actors cannot accept the
residual risk, analysts need to identify additional treatments until the residual risk is
acceptable.
6. Discussion
Starting from the study of the application domain and the performed analysis, we notice
that SMEs are still human-centric. For instance, the knowledge, that would have to be
Evaluation of Business Solutions in Manufacturing Enterprises 19
corporate assets, concentrates in few and irreplaceable people. Moreover, the intrinsic
complexity level of organizations is growing, though we are aware that there is no clear-
cut correspondence between the economic size of the company and its organizational
complexity. This setting raises the scalability issues of the organization-size and,
frequently, limits the dynamism needed for competing in a global market. Therefore, the
tactical and strategic coordination choices among divisions are constrained by the people
capability of synthesizing information that they have. As consequence, such information
may not be complete and up-to-date. This makes it difficult to identify new opportunities,
leading to the stagnation of organization growth.
The result of this work can be considered also in terms of the definition and
application of Key Performance Indicators (KPIs) (Parmenter, 2007). They are metrics
used to define and measure the progress toward organizational goals. For instance,
considering the goal G17 reduce time-to-market in Table 1, a corresponding KPI is time-
to-market. In order to instantiate our approach in a specific SME organization, we need to
identify the KPIs of this organization. In this context, the aspects to consider essentially
concern the definition of the organizational business processes meant as a collection of
ordered tasks achieving a goal. Once these business processes have been defined,
evaluation criteria of their performance must be identified and applied to compare them.
In order to automatize the business processes based on KPIs, we need to define a
requirements engineering methodology enabling to move from organizational
requirements to system/software requirements (Abeti et. al., 2008). The presentation of
this methodology is out of the scope of this paper.
The attempt to capture and analyze these challenges has allowed us to evaluate the
expressiveness and usability of the GR framework and prove its applicability in industry.
In particular, this study has pointed out a number of difficulties and benefits. The first
difficulty concerns the selection of the most appropriate relations (i.e., alleviation,
contribution, etc.) meant to capture and model the activities of an organization as well as
their relationships with risks. Even though the semantics of such relations is well-defined,
there are different ways to express the same scenarios of interest by using different
combinations of relations as shown in the following example.
Y. Asnar et al. 20
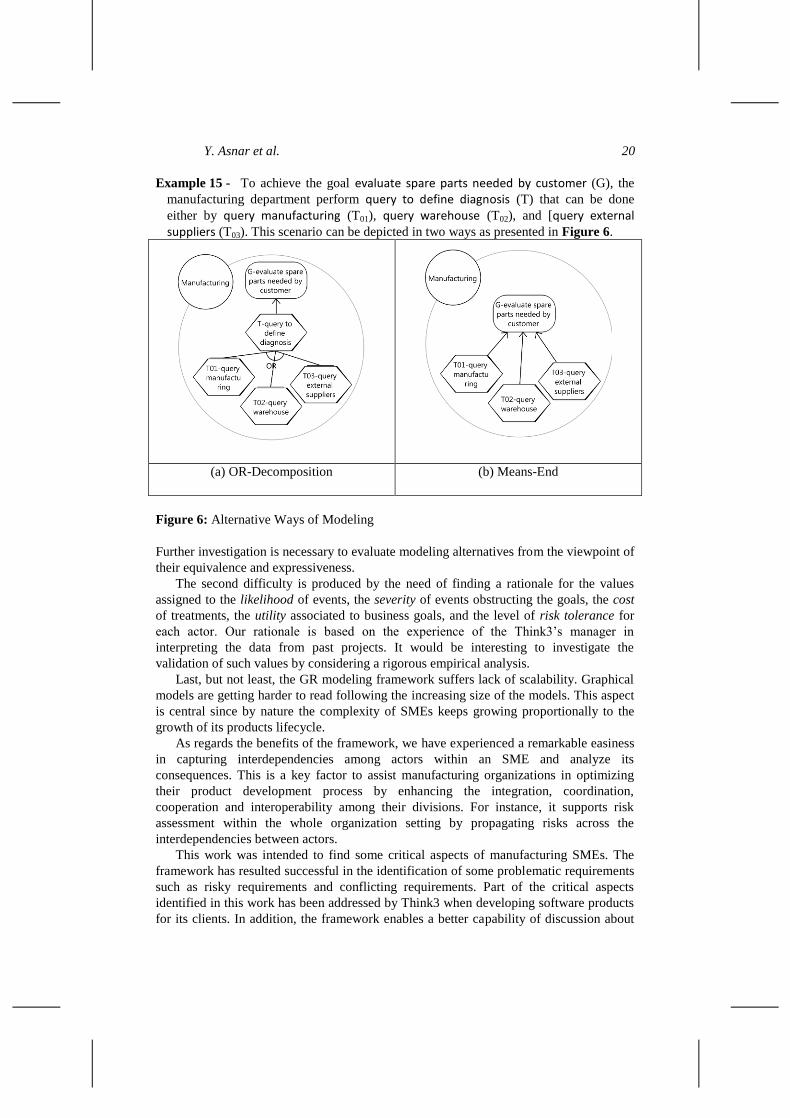
Example 15 - To achieve the goal evaluate spare parts needed by customer (G), the
manufacturing department perform query to define diagnosis (T) that can be done
either by query manufacturing (T01), query warehouse (T02), and [query external suppliers (T03). This scenario can be depicted in two ways as presented in Figure 6.
(a) OR-Decomposition (b) Means-End
Figure 6: Alternative Ways of Modeling
Further investigation is necessary to evaluate modeling alternatives from the viewpoint of
their equivalence and expressiveness.
The second difficulty is produced by the need of finding a rationale for the values
assigned to the likelihood of events, the severity of events obstructing the goals, the cost
of treatments, the utility associated to business goals, and the level of risk tolerance for
each actor. Our rationale is based on the experience of the Think3‟s manager in
interpreting the data from past projects. It would be interesting to investigate the
validation of such values by considering a rigorous empirical analysis.
Last, but not least, the GR modeling framework suffers lack of scalability. Graphical
models are getting harder to read following the increasing size of the models. This aspect
is central since by nature the complexity of SMEs keeps growing proportionally to the
growth of its products lifecycle.
As regards the benefits of the framework, we have experienced a remarkable easiness
in capturing interdependencies among actors within an SME and analyze its
consequences. This is a key factor to assist manufacturing organizations in optimizing
their product development process by enhancing the integration, coordination,
cooperation and interoperability among their divisions. For instance, it supports risk
assessment within the whole organization setting by propagating risks across the
interdependencies between actors.
This work was intended to find some critical aspects of manufacturing SMEs. The
framework has resulted successful in the identification of some problematic requirements
such as risky requirements and conflicting requirements. Part of the critical aspects
identified in this work has been addressed by Think3 when developing software products
for its clients. In addition, the framework enables a better capability of discussion about
Evaluation of Business Solutions in Manufacturing Enterprises 21
requirements among the involved stakeholders (i.e., managers, engineers, customers,
etc.).
The complexity growth of SME product lifecycle makes the management of products
and their related data more and more strategic in gaining the market. Consequently, many
SMEs pay attention to research and development. To give an illustration, the design part
of a product may involve the 15-20% of the company staff, especially for companies that
deal with new custom-made markets. In these SMEs, the Research and Development
division influences highly the time-to-market of a product. The design of products also
determines the cost of the production process (e.g., 20% of costs can be affected
because of the different production policies). In such situations, the GR framework can
support analysts in analyzing alternative solutions to the design. Moreover, the
framework can be applied in the early phase of solution development process, reducing
the time-to-market for a new product.
The result of this work is currently driving the development of a Think3‟s Product
Lifecycle Management (PLM) application with the aim of exploiting profitable
organizational strategies pointed out by means of this approach. In particular, the
acquired knowledge is used in the requirements engineering methodology (mentioned in
Section 6) aiming to bridge the gap between the organizational requirements and the
system/software requirements by preserving the benefits of the selected organizational
strategies. As a result, we can exploit the tight relation between the tasks and treatments
included in the selected strategies and the design and production processes that the PLM
application enables to define.
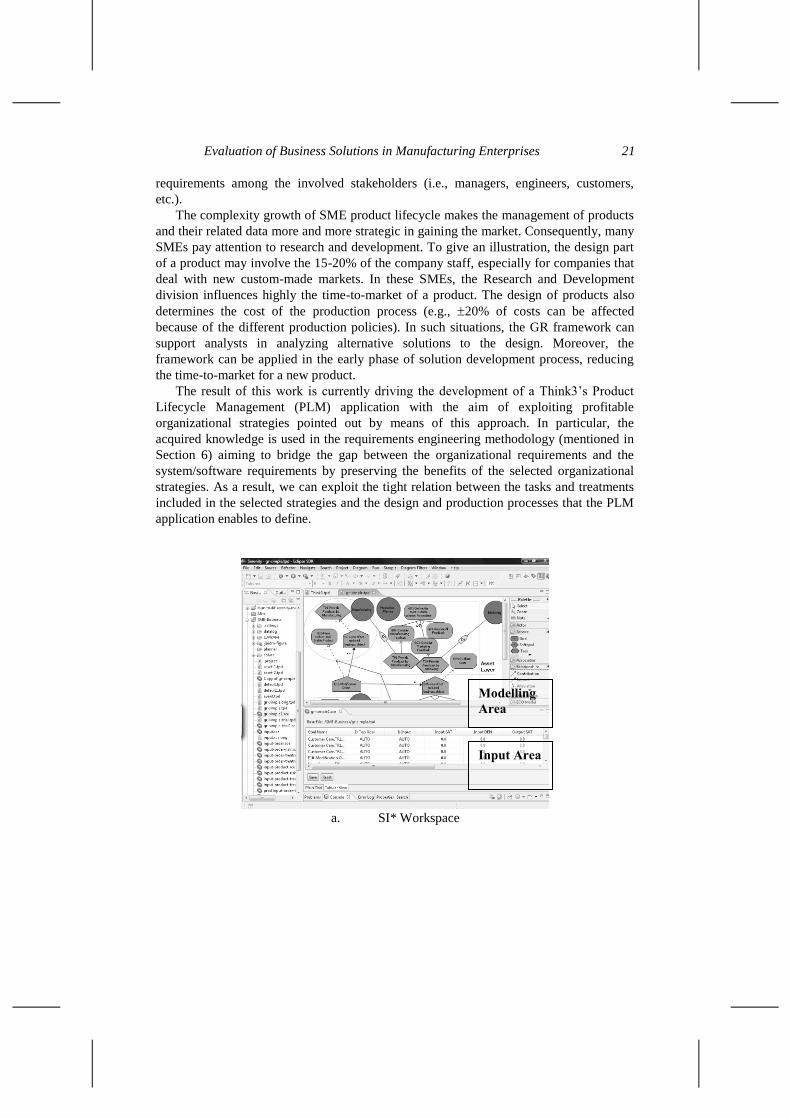
a. SI* Workspace
Input Area
Modelling
Area
Y. Asnar et al. 22
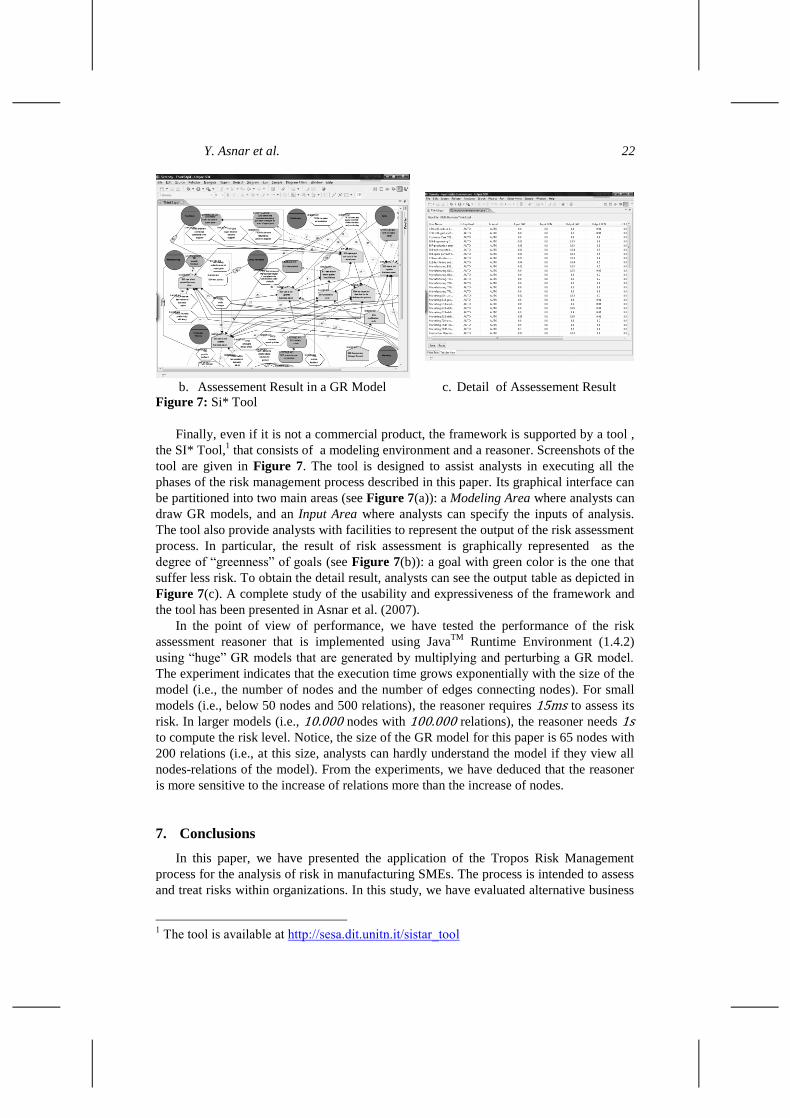
b. Assessement Result in a GR Model c. Detail of Assessement Result
Figure 7: Si* Tool
Finally, even if it is not a commercial product, the framework is supported by a tool ,
the SI* Tool,1 that consists of a modeling environment and a reasoner. Screenshots of the
tool are given in Figure 7. The tool is designed to assist analysts in executing all the
phases of the risk management process described in this paper. Its graphical interface can
be partitioned into two main areas (see Figure 7(a)): a Modeling Area where analysts can
draw GR models, and an Input Area where analysts can specify the inputs of analysis.
The tool also provide analysts with facilities to represent the output of the risk assessment
process. In particular, the result of risk assessment is graphically represented as the
degree of “greenness” of goals (see Figure 7(b)): a goal with green color is the one that
suffer less risk. To obtain the detail result, analysts can see the output table as depicted in
Figure 7(c). A complete study of the usability and expressiveness of the framework and
the tool has been presented in Asnar et al. (2007).
In the point of view of performance, we have tested the performance of the risk
assessment reasoner that is implemented using JavaTM
Runtime Environment (1.4.2)
using “huge” GR models that are generated by multiplying and perturbing a GR model.
The experiment indicates that the execution time grows exponentially with the size of the
model (i.e., the number of nodes and the number of edges connecting nodes). For small
models (i.e., below 50 nodes and 500 relations), the reasoner requires 15ms to assess its
risk. In larger models (i.e., 10.000 nodes with 100.000 relations), the reasoner needs 1s to compute the risk level. Notice, the size of the GR model for this paper is 65 nodes with
200 relations (i.e., at this size, analysts can hardly understand the model if they view all
nodes-relations of the model). From the experiments, we have deduced that the reasoner
is more sensitive to the increase of relations more than the increase of nodes.
7. Conclusions
In this paper, we have presented the application of the Tropos Risk Management
process for the analysis of risk in manufacturing SMEs. The process is intended to assess
and treat risks within organizations. In this study, we have evaluated alternative business
1 The tool is available at http://sesa.dit.unitn.it/sistar_tool
Evaluation of Business Solutions in Manufacturing Enterprises 23
solutions, and chosen the most appropriate one according to the risk tolerance specified
by stakeholders and its cost. However, the evaluation can be extended by including other
criteria, such as time consumption. From this experience, we learned that “impact
analysis” is the most critical step in the Tropos Risk Management process. It is because
the result of this step drives both the outcome of risk assessment and treatment, and the
business solution selection. Impact analysis is prone to subjective inputs that can lead to
inappropriate decisions. Therefore, exploiting the past experience of SMEs (e.g.,
enterprise statistics, Log analysis etc.) is fundamental to assist analysts in performing this
step correctly.
Acknowledgments
This work has been partially funded by the EU-SERENITY and EU-MASTER
project, by the FIRB TOCAI.IT project, by the PRIN-MENSA project, and by the
Canada‟s NSERC Hyperion project.
References
Abeti, L., Ciancarini, P., & Moretti, R. (2008), „Business process modeling for organizational
knowledge management‟. In Concurrency, Graphs and Models, volume 5065 of LNCS, (pp.
301–311). Springer.
Asnar, Y., Bonato, R., Giorgini, P., Massacci, F., Meduri, V., Riccucci, C., and Saidane, A.
(2007),‟ Secure and Dependable Patterns in Organizations: An Empirical Approach‟. In Proc.
of the 15th IEEE International Requirements Engineering Conference (RE '07), IEEE Press.
Asnar, Y. & Giorgini, P. (2006) „Modelling Risk and Identifying Countermeasures in
Organizations‟, In Proc. of 1st Int. Workshop on Critical Inform. Infrastructures Sec. (CRITIS
’06), volume 4347 of LNCS, (pp. 55–66). Springer.
Asnar, Y. & Giorgini, P. (2007) „Risk Analysis as part of the Requirements Engineering Process‟ ,
Report DIT-07-014, DIT - University of Trento.
Asnar, Y., Moretti, R., Sebastianis, M., & Zannone, N. (2008) „Risk as Dependability Metrics for
the Evaluation of Business Solutions: A Model-driven Approach‟, In Proc. Of 3rd Int.
Workshop on Dependability Aspects on Data Warehose & Mining Application (DAWAM ’08).
Bedford, T. & Cooke, R. (2001), Probabilistic Risk Analysis: Foundations and Methods,
Cambridge University Press.
Butler, S. & Fischbeck, P. (2001), Multi-Attribute Risk Assessment, Technical Report CMU-CS-01-
169, Carnegie Mellon University.
Butler, S. A. (2002), „Security Attribute Evaluation Method: a Cost-Benefit Approach‟, In Proc. of
ICSE’02, (pp. 232–240)., New York, NY, USA. ACM Press.
Carr, M. J., Konda, S. L., Monarch, I., Ulrich, F. C., & Walker, C. F. (1993), Taxonomy-Based Risk
Identification, Technical Report CMU/SEI-93-TR-6, SEI-CMU.
den Braber, F., Dimitrakos, T., Gran, B. A., Lund, M. S., Stølen, K., & Aagedal, J. Ø. (2003), „The
CORAS Methodology: Model-Based Risk Assessment using UML and UP‟, In UML and the
Unified Process (pp. 332–357). Idea Group Publishing.
DoD (1980), Military Standard, Procedures for Performing a Failure Mode, Effects, and Critical
Analysis, MIL-STD-1629A.
Feather, M. S. (2004), „Towards a Unified Approach to the Representation of, and Reasoning with,
Probabilistic Risk Information about Software and its System Interface‟, In Proc. of the 15th
IEEE Int. Symp. on Soft. Soft. Reliability Eng., (pp. 391–402). IEEE CS Press.
Y. Asnar et al. 24
Feather, M. S., Cornford, S. L., Hicks, K. A., & Johnson, K. R. (2005), ‟Applications of Tool
Support for Risk-Informed Requirements Reasoning‟, Computer Systems Science &
Engineering, 20(1).
Giorgini, P., Mylopoulos, J., & Sebastiani, R. (2005), „Goal-Oriented Requirements Analysis and
Reasoning in the Tropos Methodology‟, Engineering Applications of Artificial Intelligence,
18(2), 159–171.
Goodman, P. (2004), Software Metrics: Best Practices for Successful IT Management, Rothstein
Associates Inc., Publisher.
Holton, G. A. (2004), „Defining Risk‟, Financial Analyst Journal, 60(6), 1925.
ISO/IEC Guide 73 (2002), Risk Management-Vocabulary-Guidelines for Use in Standards,
ISO/IEC Guide 73.
Jaquith, A. (2007), Security Metrics: Replacing Fear, Uncertainty, and Doubt, Addison Wesley.
Kiyavitskaya, N., Moretti, R., Sebastianis, M., & Zannone, N. (2007), Project Report on the Initial
Analysis of (Early) Requirements of Domain, TOCAI Deliverable D2.1.
Landwehr, C. E., Bull, A. R., McDermott, J. P., & Choi, W. S. (1994), „Taxonomy of Computer
Program Security Flaws‟, ACM Comp. Surveys, 26(3), 211–254.
Lee, S.-W., Gandhi, R., Muthurajan, D., Yavagal, D., & Ahn, G.-J. (2006), „Building Problem
Domain Ontology from Security Requirements in Regulatory Documents‟, In Proc. of the
2006 Workshop on Soft. Eng. for Secure Sys. Building Trustworthy Applications, (pp. 43–50).,
New York, NY, USA. ACM Press.
Lindsey, D., Cheney, P., Kasper, G. M., & Ives, B. (1990, „TELCOT: An application of
information technology for competitive advantage in the cotton industry‟, MIS Quarterly,
14(4), 347–357.
Maizlitsh, B. & Handler, R. (2005), IT Portfolio Management: Step by Step, Wiley & Sons.
McFarlan, W. E. (1984), „Information technology changes the way you compete‟, Harvard
Business Review, 62(3), 98–103.
Parmenter, D. (2007), Key Performance Indicators. Wiley & Sons.Pooley, R. & Wilcox, P. (2000),
„Distributing decision making using Java simulation across the World Wide Web‟, Journal of
the Operational Research Society, 51(4), 395–404.
Rico, D. F. (2004), ROI of Software Process Improvement: Metrics for Project Managers and
Software Engineers, Ross Publishing.
Stamatelatos, M., Vesely, W., Dugan, J., Fragola, J., Minarick, J., & Railsback, J. (2002), Fault
Tree Handbook with Aerospace Applications, NASA.