An empirical analysis on the weak form market efficiency in ...
26
Munich Personal RePEc Archive An empirical analysis on the weak form market efficiency in the Bangladeshi pharmaceutical industry- A case study of Renata Ltd Ehsan, Zaeem-Al East West University May 2021 Online at https://mpra.ub.uni-muenchen.de/109726/ MPRA Paper No. 109726, posted 20 Sep 2021 20:28 UTC
-
Upload
khangminh22 -
Category
Documents
-
view
1 -
download
0
Transcript of An empirical analysis on the weak form market efficiency in ...

Munich Personal RePEc Archive
An empirical analysis on the weak form
market efficiency in the Bangladeshi
pharmaceutical industry- A case study of
Renata Ltd
Ehsan, Zaeem-Al
East West University
May 2021
Online at https://mpra.ub.uni-muenchen.de/109726/
MPRA Paper No. 109726, posted 20 Sep 2021 20:28 UTC

An empirical analysis on the weak form market efficiency in the Bangladeshi pharmaceutical
industry- A case study of Renata Ltd
Zaeem-Al Ehsan1
The paper aims to assess the market efficiency of Renata Ltd in the weak form by analyzing
monthly returns ranging from December 2007 to April 2021. Past literature on the same topic
uncovered the non-existence of efficiency in the weak form in the Dhaka Stock Exchange. Initially,
a descriptive analysis was done using the 4 moments of Renata Ltd and the Dhaka Stock Exchange
broad market exchange. A graphical analysis using P-P and Q-Q plots rejected the assumption
that the returns of Renata Ltd come from a normal distribution. This was further supported by
Jarque-Bera and Shapiro-Wilk tests of normality which also rejects the null hypothesis of the
returns of Renata Ltd having come from a normal distribution. Graphical tests of autocorrelation
were made to uncover the presence of any correlation between returns of Renata Ltd, which was
found to not exist. Thus, we can assert that there is no presence of serial correlation, and
therefore, the market is efficient in the weak form according to the graphical analysis of
correlograms. To quantifiably test the presence of a random walk effect, the Durbin-Watson,
Breusch Godfrey, Portmanteau, runs, Augmented Dickey-Fuller (ADF) and variance root tests were
undertaken. All tests support the fact that Renata Ltd.’s return does follow a random-walk
process, implying the existence of weak form market efficiency.
Keywords: EMH, random-walk, variance-root, structural break
1 MSS in Economics student, East West University
1 INTRODUCTION
The conundrum for policymakers as Bangladesh ventured into the last year of its 7th FYP was to
harness the momentum in GDP growth for FY2020 which would put Bangladesh on course of
achieving the Upper Middle Income Country (UMIC) status by 2031. Having relied on the
domestic market to usher in rampant economic growth over the last decade, Bangladesh had to
seek out foreign markets to ensure sustainable increase in GDP growth with LDC graduation
possibly on the horizon.
Global trade has strengthened Bangladesh’s foothold as a rapidly developing country. Capitalism
sits on the premise of free market mechanisms guided by the “invisible hand”. Automatic
stabilizers built into non-discretionary fiscal policies have thwarted economic demise to some
extent time and time again. However, the global economy has been brought to an abrupt
standstill due to the newfound “invisible enemy”- COVID 19; what started off as China’s headache
has paralyzed and crippled the world economy in a matter of months. Despite the initial dismissal
of a possible coronavirus onslaught, Bangladesh's gross domestic product may contract by as
much as 1.1 per cent in the hypothetical worst-case scenario of a significant outbreak of
coronavirus in the country, as per an Asian Development Bank (ADB) analysis in April 2020.
Global stock markets saw almost a V-shaped recovery during the coronavirus pandemic.
However, Bangladesh's stock market is an exception. The local market did not rebound even after
the government rolled out a massive stimulus package amounting to Tk 103,117 crore, which is
3.7 per cent of the GDP, to pull the economy out of the wreckage. From February 27, 2020 to
June 10, 2020, the market value of equities tumbled by 11.50 per cent along with daily market
volatility (standard deviation) of 2.20 per cent (in annualized term it becomes as large as 98.30
per cent). Few weeks before the lockdown was imposed, the Bangladesh Securities and Exchange
Commission (BSEC) introduced floor prices for all the listed securities to recover the normally-
declining market trends. However, that doesn't appear to help much so far as trade volume
trends to decline, and the emergence of the COVID-19 pandemic adds to the injuries through
adverse micro and macro-level impacts. After resuming the market, investors appear shaky and

worried about overall economic and financial uncertainty, reflected by a sharp decline in trading
activities.
Possibly the most controversial issue in finance is whether the financial market is efficient in
allocating or using economic resources and information or not. The Bangladeshi stock market has
been the subject of scrutiny for years. The pharmaceutical industry in Bangladesh has been
growing at a consistent pace over the years. With LDC graduation around the corner, there needs
to be major restructuring in this sector to ensure global competitiveness. However, this paper
solely focuses on an investigation of the weak form market efficiency of Renata Ltd by carrying
out econometric analyses that are outlined in the subsequent sections.
2 OBJECTIVES
The Dhaka Stock Exchange has been notoriously riddled with wild speculations and been dubbed
risky by investors. Following the 2010 stock market crash, there have been reforms and pressure
on regulatory bodies to properly monitor the stock market. Therefore, this paper aims to examine
the weak-form market efficiency of the Renata Ltd stock. In the weak-form of market efficiency,
no investor can predict the future movement of the stock/market by using past price movement
because the stock/market accounts for all historical price movements/information. In layman’s
terms, past prices have no correlation with the current stock price. In its essence, this implies
that investors cannot use technical analysis to exploit supernormal returns.
3 LITERATURE REVIEW
Since the groundbreaking work of Fama (1965) that investigated the degrees of efficiency in
financial markets, a plethora of study have attempted to uncover the nature of market efficiency
in developed and in emerging markets using various techniques.
With regard to studying the market efficiency, Harvey (1995) studied volatility of returns of 6
Latin-American, 8 Asian, 3 European and 2 African emerging stock markets. The study uncovered
the presence of strong serial correlation in the stock returns.
To assess the market efficiency of two promising markets, Malaysia and Singapore, Laurence
(1986) applied both the runs and autocorrelation test on the Kuala Lumpur Stock Exchange (KLSE)
and the Stock Exchange of Singapore (SES) from the period 1973-78 for both KLSE and the SES.
The results of both tests suggest that both markets are not weak form efficient. Opposing the
findings of Laurence (1986), Barnes (1986) found KLSE to be weak form efficient. He assessed 30
companies and 6 sector indexes for the six years period ended 1980. The study shows that the
KLSE exhibit a high degree of efficiency in the weak-form.
Butler and Malaikah (1992) examined the weak-form efficiency for the Kuwait and Saudi Arabian
stock markets. The study incorporated the use of autocorrelation test by using daily stock returns
of two stock markets for the period of 1985-89. Their analyses uncovered that the Kuwait stock
market was efficient in the weak form, but the Saudi Arabian market was not.
Similar to the aforementioned study, Abraham et al. (2002) assessed weak-form efficiency in
three major Gulf stock markets including Kuwait, Saudi Arabia, and Bahrain using the variance
ratio and runs tests for the period of 1992-98. The study rejects the random walk hypothesis in
all markets.
A study on weak form efficiency test of twenty one stocks listed based on weekly price from
the Nigerian stock exchange for 1978 to 1979 was done by Samuels & Yacout (1981) using
autocorrelation tests. The result did not find the existence of random walk behavior of the stock
price and concluded that the Nigerian stock market is weak-form efficient.
Stock markets of Turkey and Jordan also showed the absence of weak form efficiency
in the study of El-Erian and Kumar (1995). In China, to uncover the existence of random walk
behavior of Shanghai stock exchange & Shenzhen stock exchange, research was conducted by

Darrat and Zhong (2000). The study used variance ratio test and the model comparison method.
They found that variance ratio test & model comparison method did not follow a random walk
and are not weak form efficient.
A study on South Asian securities exchanges of Bangladesh, India, Pakistan, and Sri Lanka was
done by Cooray and Wickermaisgle, (2005) by using the unit root tests and Elliot-Rothenber-
Stock (ERS) test. The result indicated that Bangladesh stock market was not weak form
efficient. Mobarek and Keavin (2000) also applied various tests on the Dhaka Stock Exchange for
the period 1988 to 1997. The study used parametric and non-parametric tests to reveal
autocorrelation at different lags. Hence, the study has grounds to dismiss the existence of weak
form efficiency. Autocorrelation test, Augmented Dickey Fuller test, Phillips-Perron test, ARIMA
models & GARCH models were applied by Hossain and Uddin (2011) to test the weak form
efficiency on index of Dhaka Stock Exchange This study found the absence of weak form
efficiency. Studies done by Siddik and Azam (2011), Ali (2012), Alom and Raquib (2014) also
found the stock exchange of Bangladesh has absence of weak form efficient.
Based on the extensive literature review, the study attempts to concoct the different statistical
measures incorporated by different academics over the years, the details of which are elaborated
in the following section.
4 DATA AND METHOD
4.1 DATA
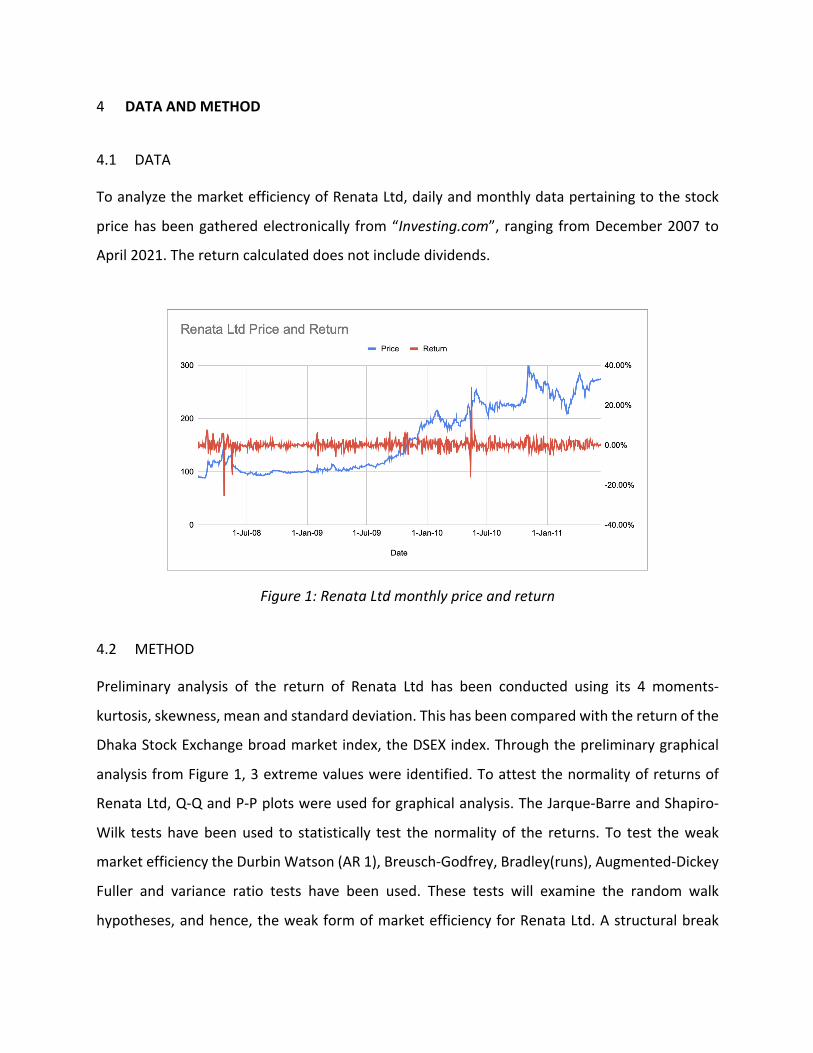
To analyze the market efficiency of Renata Ltd, daily and monthly data pertaining to the stock
price has been gathered electronically from “Investing.com”, ranging from December 2007 to
April 2021. The return calculated does not include dividends.
Figure 1: Renata Ltd monthly price and return
4.2 METHOD
Preliminary analysis of the return of Renata Ltd has been conducted using its 4 moments-
kurtosis, skewness, mean and standard deviation. This has been compared with the return of the
Dhaka Stock Exchange broad market index, the DSEX index. Through the preliminary graphical
analysis from Figure 1, 3 extreme values were identified. To attest the normality of returns of
Renata Ltd, Q-Q and P-P plots were used for graphical analysis. The Jarque-Barre and Shapiro-
Wilk tests have been used to statistically test the normality of the returns. To test the weak
market efficiency the Durbin Watson (AR 1), Breusch-Godfrey, Bradley(runs), Augmented-Dickey
Fuller and variance ratio tests have been used. These tests will examine the random walk
hypotheses, and hence, the weak form of market efficiency for Renata Ltd. A structural break
test has been conducted to understand whether there has been any breaks in the sample, as can
be expected due to stock market crashes. Lastly, a month-on-month effect has been tested to
assess whether any particular month had any significantly different return than the rest.
4.3 VARIABLES USED
Based on the monthly returns of Renata Ltd and the DSEX, returns for each has been computed
and been used for further statistical analysis.
4 𝑅𝑒𝑛𝑎𝑡𝑎!"#$!% = 𝐿𝑜𝑔( 𝑝𝑟𝑖𝑐𝑒#𝑝𝑟𝑖𝑐𝑒#&')
5
(1)
𝐷𝑆𝐸𝑋!"#$!% = 𝐿𝑜𝑔 4 𝐷𝑆𝐸𝑋#𝐷𝑆𝐸𝑋#&'5 (2)
Where DSEX is the Dhaka Stock Exchange broad market index, 𝑝𝑟𝑖𝑐𝑒# and 𝐷𝑆𝐸𝑋# are prices at
time t, and 𝑝𝑟𝑖𝑐𝑒#&'and 𝐷𝑆𝐸𝑋#&' are prices at time t-1. The log transformation is suggested in
Praetz (1969, p.126) to reduce skewness in the often positively skewed return distribution.
5 RESULTS & DISCUSSION
5.1 DESCRIPTIVE STATISTICS
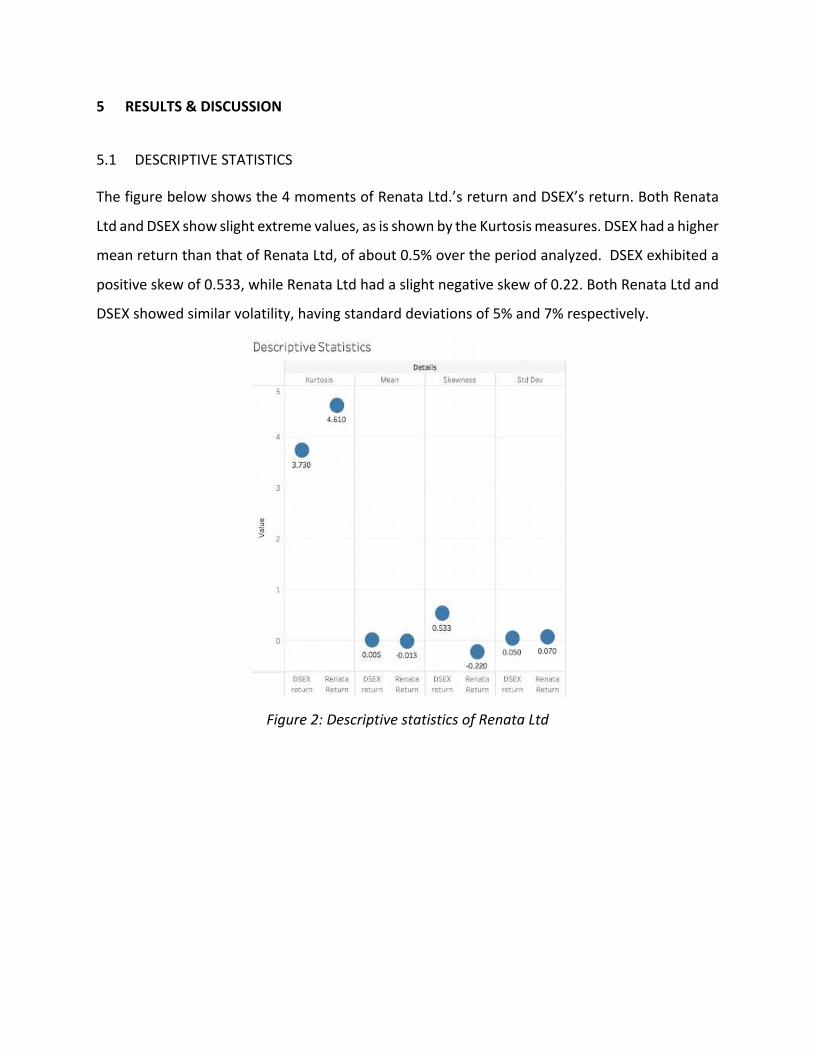
The figure below shows the 4 moments of Renata Ltd.’s return and DSEX’s return. Both Renata
Ltd and DSEX show slight extreme values, as is shown by the Kurtosis measures. DSEX had a higher
mean return than that of Renata Ltd, of about 0.5% over the period analyzed. DSEX exhibited a
positive skew of 0.533, while Renata Ltd had a slight negative skew of 0.22. Both Renata Ltd and
DSEX showed similar volatility, having standard deviations of 5% and 7% respectively.
Figure 2: Descriptive statistics of Renata Ltd
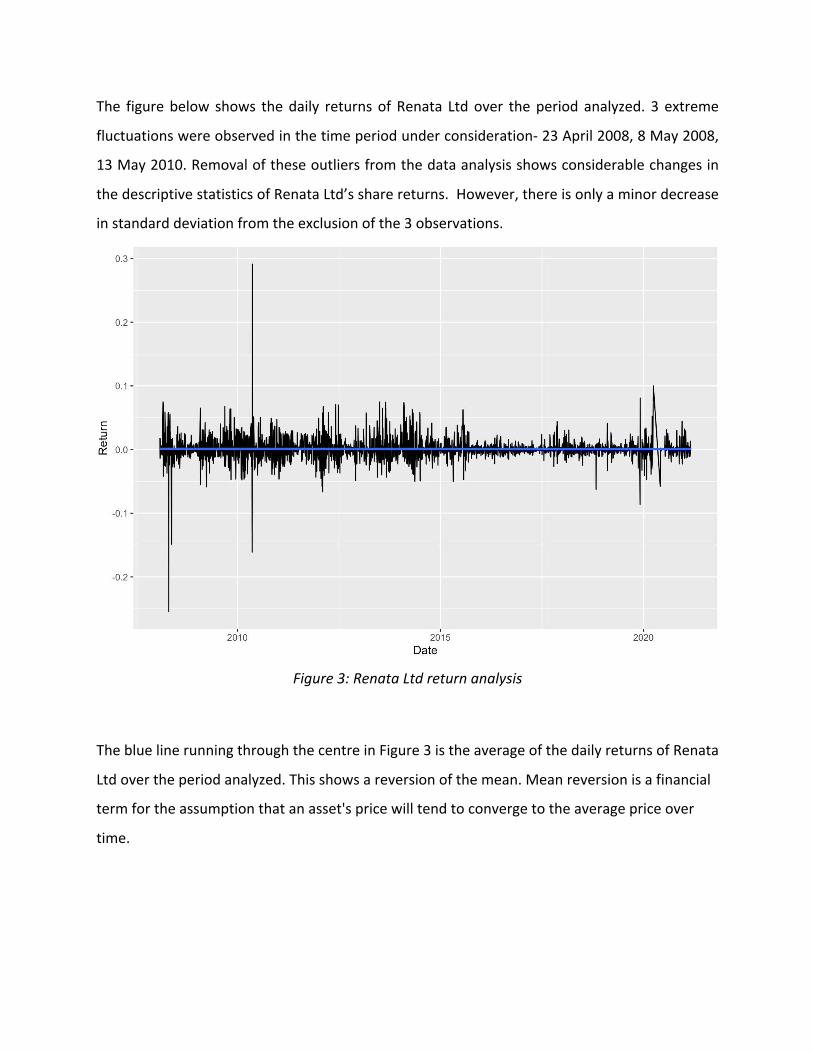
The figure below shows the daily returns of Renata Ltd over the period analyzed. 3 extreme
fluctuations were observed in the time period under consideration- 23 April 2008, 8 May 2008,
13 May 2010. Removal of these outliers from the data analysis shows considerable changes in
the descriptive statistics of Renata Ltd’s share returns. However, there is only a minor decrease
in standard deviation from the exclusion of the 3 observations.
Figure 3: Renata Ltd return analysis
The blue line running through the centre in Figure 3 is the average of the daily returns of Renata
Ltd over the period analyzed. This shows a reversion of the mean. Mean reversion is a financial
term for the assumption that an asset's price will tend to converge to the average price over
time.
5.2 TESTING FOR NORMALITY
5.2.1 GRAPHICAL NORMALITY TESTS
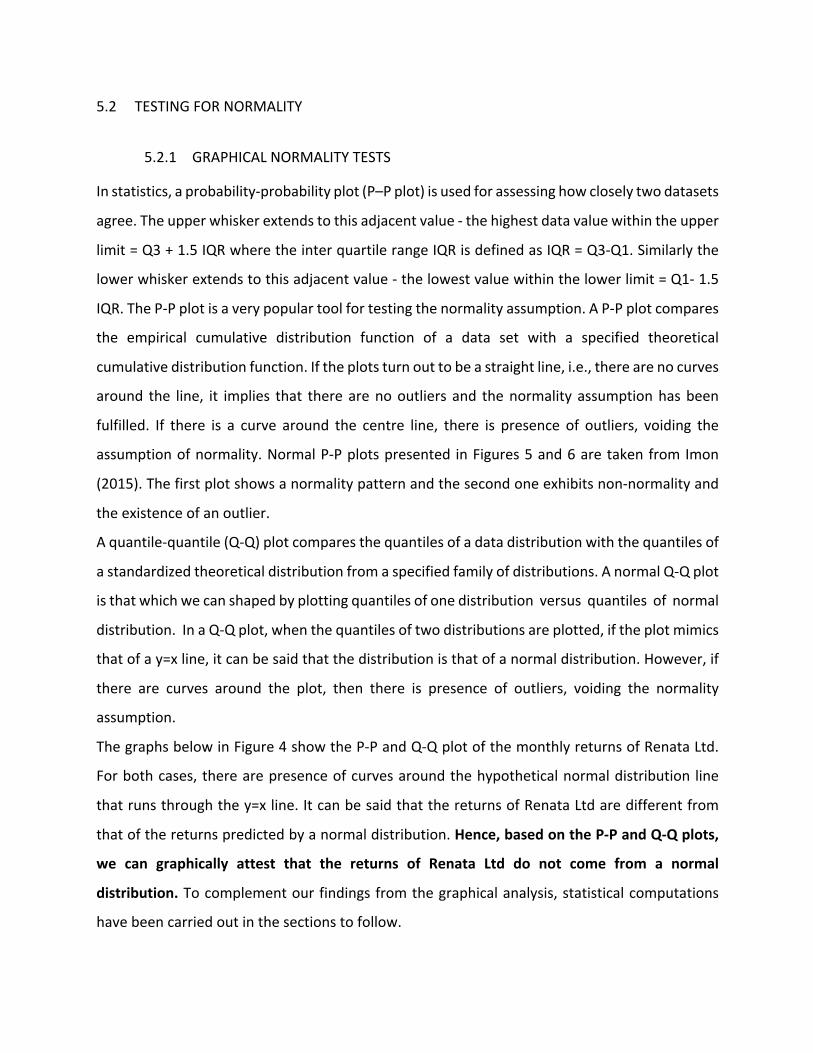
In statistics, a probability-probability plot (P–P plot) is used for assessing how closely two datasets
agree. The upper whisker extends to this adjacent value - the highest data value within the upper
limit = Q3 + 1.5 IQR where the inter quartile range IQR is defined as IQR = Q3-Q1. Similarly the
lower whisker extends to this adjacent value - the lowest value within the lower limit = Q1- 1.5
IQR. The P-P plot is a very popular tool for testing the normality assumption. A P-P plot compares
the empirical cumulative distribution function of a data set with a specified theoretical
cumulative distribution function. If the plots turn out to be a straight line, i.e., there are no curves
around the line, it implies that there are no outliers and the normality assumption has been
fulfilled. If there is a curve around the centre line, there is presence of outliers, voiding the
assumption of normality. Normal P-P plots presented in Figures 5 and 6 are taken from Imon
(2015). The first plot shows a normality pattern and the second one exhibits non-normality and
the existence of an outlier.
A quantile-quantile (Q-Q) plot compares the quantiles of a data distribution with the quantiles of
a standardized theoretical distribution from a specified family of distributions. A normal Q-Q plot
is that which we can shaped by plotting quantiles of one distribution versus quantiles of normal
distribution. In a Q-Q plot, when the quantiles of two distributions are plotted, if the plot mimics
that of a y=x line, it can be said that the distribution is that of a normal distribution. However, if
there are curves around the plot, then there is presence of outliers, voiding the normality
assumption.
The graphs below in Figure 4 show the P-P and Q-Q plot of the monthly returns of Renata Ltd.
For both cases, there are presence of curves around the hypothetical normal distribution line
that runs through the y=x line. It can be said that the returns of Renata Ltd are different from
that of the returns predicted by a normal distribution. Hence, based on the P-P and Q-Q plots,
we can graphically attest that the returns of Renata Ltd do not come from a normal
distribution. To complement our findings from the graphical analysis, statistical computations
have been carried out in the sections to follow.
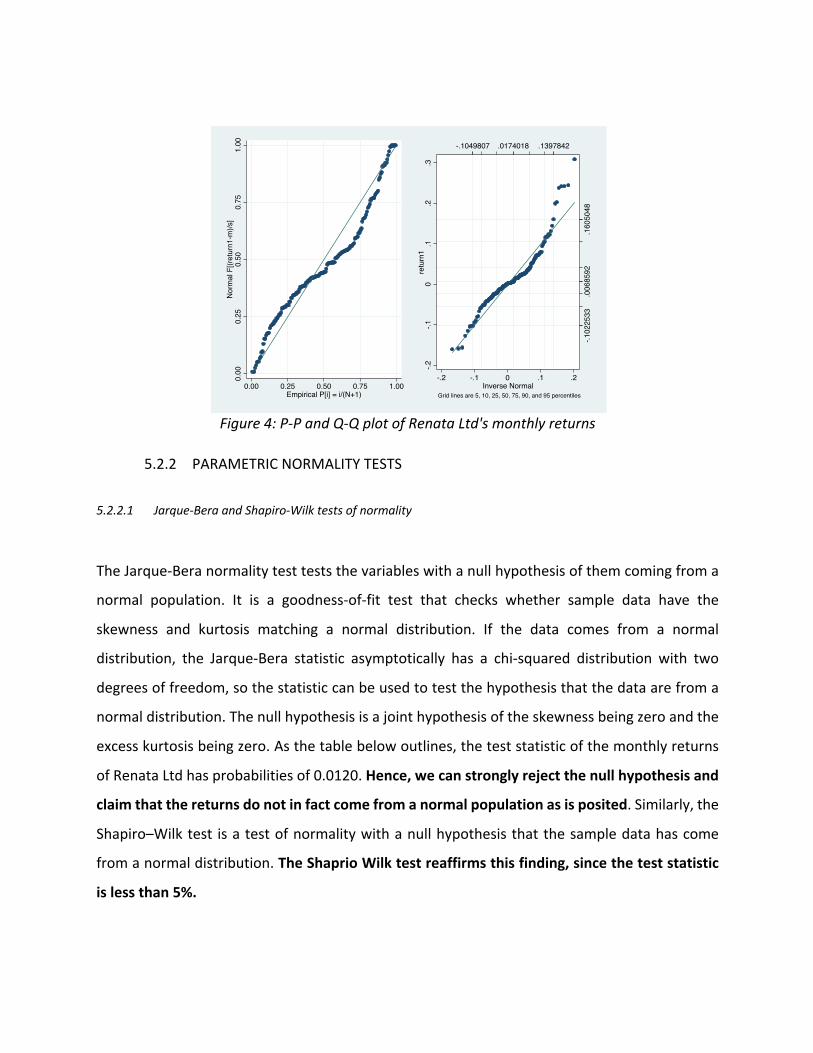
Figure 4: P-P and Q-Q plot of Renata Ltd's monthly returns
5.2.2 PARAMETRIC NORMALITY TESTS
5.2.2.1 Jarque-Bera and Shapiro-Wilk tests of normality
The Jarque-Bera normality test tests the variables with a null hypothesis of them coming from a
normal population. It is a goodness-of-fit test that checks whether sample data have the
skewness and kurtosis matching a normal distribution. If the data comes from a normal
distribution, the Jarque-Bera statistic asymptotically has a chi-squared distribution with two
degrees of freedom, so the statistic can be used to test the hypothesis that the data are from a
normal distribution. The null hypothesis is a joint hypothesis of the skewness being zero and the
excess kurtosis being zero. As the table below outlines, the test statistic of the monthly returns
of Renata Ltd has probabilities of 0.0120. Hence, we can strongly reject the null hypothesis and
claim that the returns do not in fact come from a normal population as is posited. Similarly, the
Shapiro–Wilk test is a test of normality with a null hypothesis that the sample data has come
from a normal distribution. The Shaprio Wilk test reaffirms this finding, since the test statistic
is less than 5%.
0.0
00
.25
0.5
00
.75
1.0
0N
orm
al F
[(re
turn
1-m
)/s]
0.00 0.25 0.50 0.75 1.00Empirical P[i] = i/(N+1)
-.1
02
25
33
.0068592
.1605048
-.2
-.1
0.1
.2.3
retu
rn1
.0174018 .1397842-.1049807
-.2 -.1 0 .1 .2Inverse Normal
Grid lines are 5, 10, 25, 50, 75, 90, and 95 percentiles

Table 1: Jarque-Bera test for normality
Skewness/Kurtosis tests for Normality of daily and monthly return
Variable Probability
Skewness
Probability
Kurtosis
χ2
Prob>χ2
Monthly Return 0.2427 0.0035 8.85 0.0120
Table 2: Shapiro-Wilk test for normality
5.3 TESTING FOR EFFICIENCY IN THE WEAK FORM
In weak-form efficiency, future prices cannot be predicted by analyzing prices from the past.
Excess returns cannot be earned in the long run by using investment strategies based on historical
share prices or other historical data. Technical analysis techniques will not be able to consistently
produce excess returns, though some forms of fundamental analysis may still provide excess
returns. Share prices exhibit no serial dependencies, meaning that there are no “patterns” to
asset prices. This implies that future price movements are determined entirely by information
not contained in the price series. Hence, prices must follow a random walk.
Shapiro-Wilk W test for normal data of monthly return
Variable z Prob>z
Monthly Return 4.060 0.00002
Random walk theory suggests that changes in stock prices have the same distribution and are
independent of each other. Therefore, it assumes the past movement or trend of a stock price or
market cannot be used to predict its future movement. In short, random walk theory proclaims
that stocks take a random and unpredictable path that makes all methods of predicting stock
prices futile in the long run.
𝑅𝑒𝑛𝑎𝑡𝑎(!)*"(#) =𝜌𝑅𝑒𝑛𝑎𝑡𝑎(!)*"(#&') + 𝜀 (3)
Where t is the time variable.
5.3.1 Graphical tests
5.3.1.1 Correlogram and partial correlogram
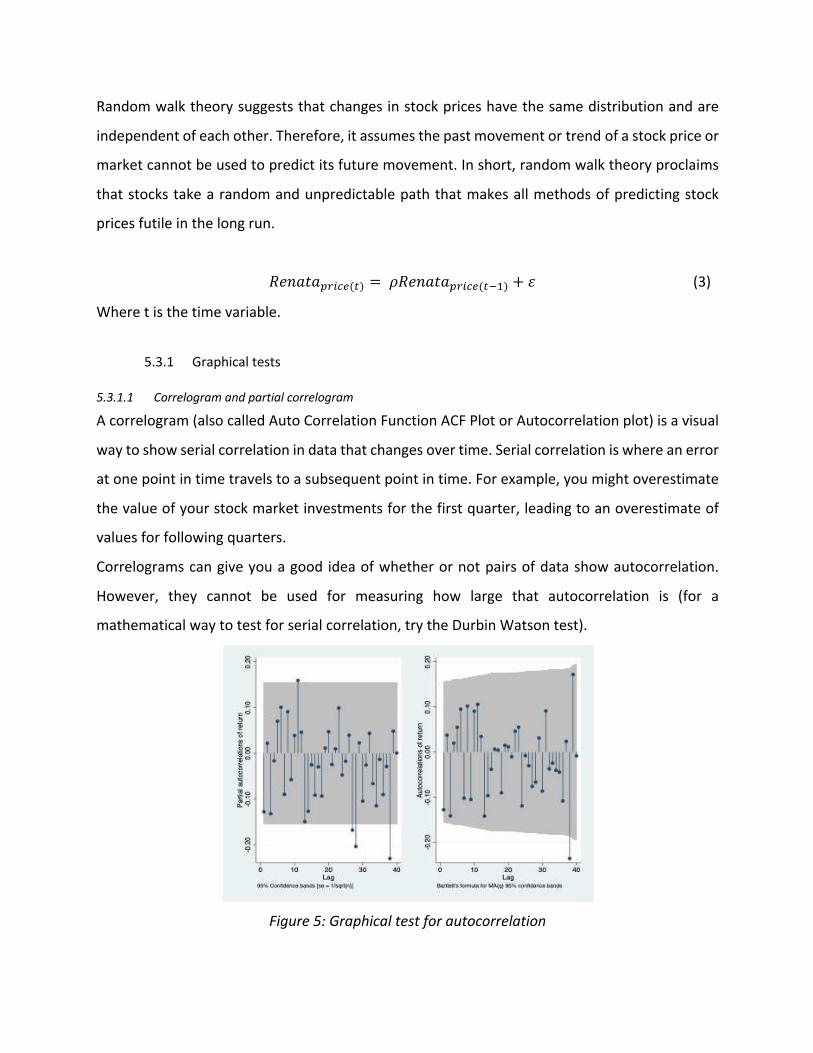
A correlogram (also called Auto Correlation Function ACF Plot or Autocorrelation plot) is a visual
way to show serial correlation in data that changes over time. Serial correlation is where an error
at one point in time travels to a subsequent point in time. For example, you might overestimate
the value of your stock market investments for the first quarter, leading to an overestimate of
values for following quarters.
Correlograms can give you a good idea of whether or not pairs of data show autocorrelation.
However, they cannot be used for measuring how large that autocorrelation is (for a
mathematical way to test for serial correlation, try the Durbin Watson test).
Figure 5: Graphical test for autocorrelation

A correlogram gives a summary of correlation at different periods of time. The figure above
shows both the correlogram and partial correlogram for the monthly returns of Renata Ltd across
the time period analyzed. It is evident from the figure above that almost none of the lagged
returns of Renata Ltd have any impact on future returns of Renata Ltd, i.e., no returns have a
statistically significant impact on returns in future time periods. Thus, we can assert that there
is no presence of serial correlation, and therefore, the market is efficient in the weak form.
5.3.2 Durbin-Watson Test
The Durbin Watson Test is a measure of autocorrelation in residuals from regression analysis.
Autocorrelation is the similarity of a time series over successive time intervals. It can lead to
underestimates of the standard error and can cause you to think predictors are significant when
they are not. The Durbin Watson test looks for a specific type of serial correlation, the AR(1)
process.
The Durbin Watson test reports a test statistic, with a value from 0 to 4, where:
• 2 is no autocorrelation.
• 0 to <2 is positive autocorrelation
• >2 to 4 is negative autocorrelation
The Hypotheses for the Durbin Watson test are:
• 𝐻-= no first order autocorrelation.
• 𝐻' = first order correlation exists.
Table 3: Durbin-Watson test
Lower bound Upper bound d-statistic Comment
1.720 1.747 1.97661 Fail to reject null
The Durbin-Watson test statistic for Renata Ltd is 1.97, which is approximately 2. This gives the
premature impression that the returns are indeed not correlated. The table showing the critical
values also show that the d-statistic lies outside the critical region. Therefore, we fail to reject
the null- hypothesis, i.e. the returns of Renata Ltd are indeed not autocorrelated as per the
Durbin Watson Test. This implies that the returns of Renata Ltd are efficient in the weak form.
5.3.3 BREUSCH GODFREY TEST
The Breusch–Godfrey test is used to assess the validity of some of the modelling assumptions
inherent in applying regression-like models to observed data series. In particular, it tests for the
presence of serial correlation that has not been included in a proposed model structure.
Presence of serial correlation would entail past returns do have an impact on current returns of
Renata Ltd, and hence there may be supernormal returns for shrewd investors.
The Breusch-Godfrey test overcomes the lacking of the Durbin Watson test. This allows us to test
for serial correlation at greater levels. The table below shows the autocorrelation tests till lag 24,
i.e., the autocorrelation of Renata Ltd’s current return with that of 2 years ago.
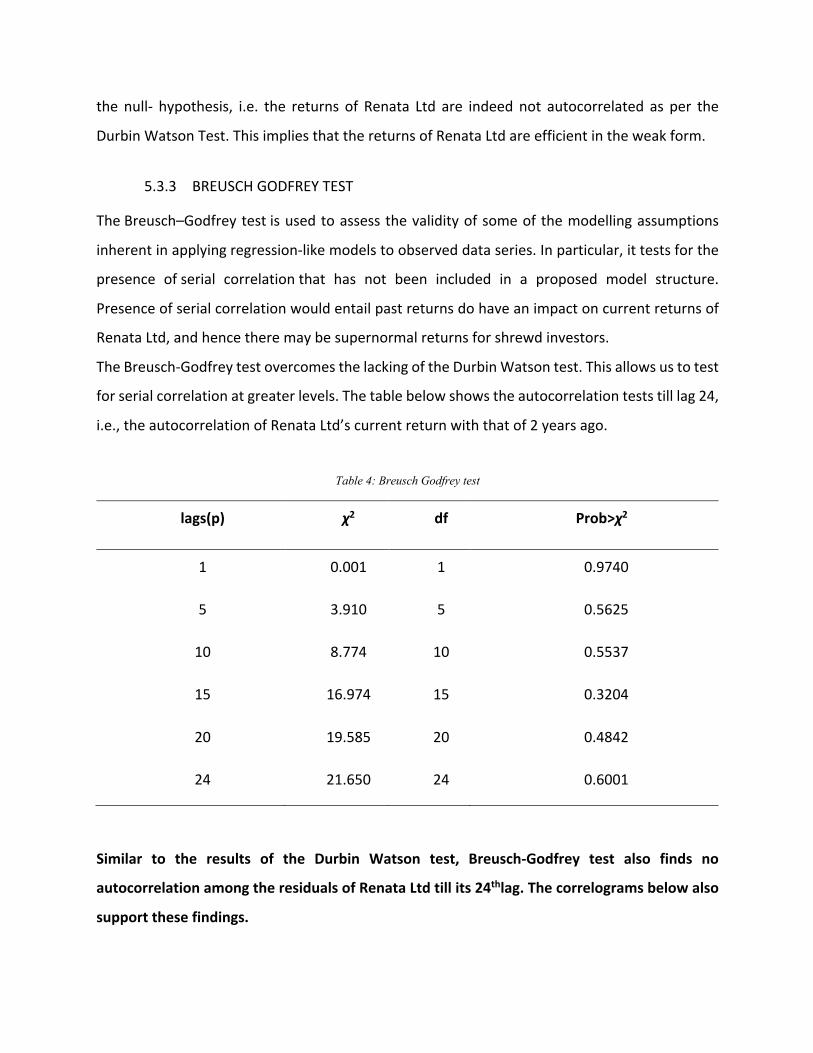
Table 4: Breusch Godfrey test
lags(p) χ2 df Prob>χ2
1 0.001 1 0.9740
5 3.910 5 0.5625
10 8.774 10 0.5537
15 16.974 15 0.3204
20 19.585 20 0.4842
24 21.650 24 0.6001
Similar to the results of the Durbin Watson test, Breusch-Godfrey test also finds no
autocorrelation among the residuals of Renata Ltd till its 24thlag. The correlograms below also
support these findings.
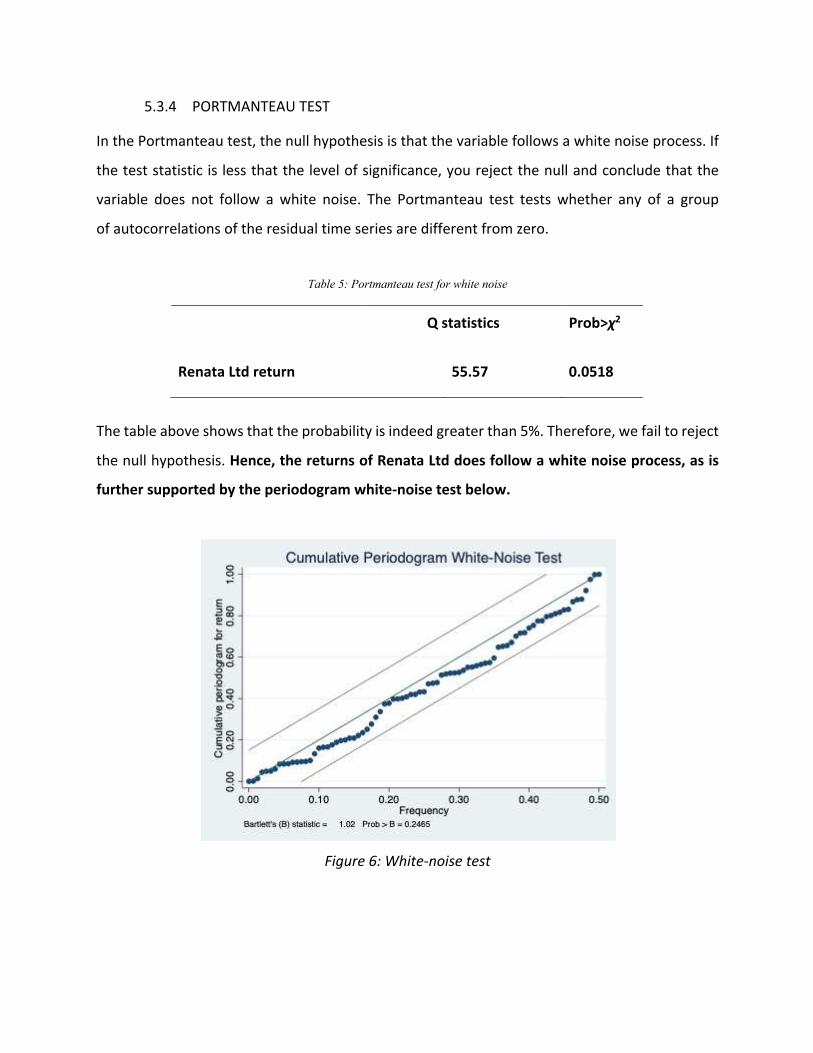
5.3.4 PORTMANTEAU TEST
In the Portmanteau test, the null hypothesis is that the variable follows a white noise process. If
the test statistic is less that the level of significance, you reject the null and conclude that the
variable does not follow a white noise. The Portmanteau test tests whether any of a group
of autocorrelations of the residual time series are different from zero.
Table 5: Portmanteau test for white noise
The table above shows that the probability is indeed greater than 5%. Therefore, we fail to reject
the null hypothesis. Hence, the returns of Renata Ltd does follow a white noise process, as is
further supported by the periodogram white-noise test below.
Figure 6: White-noise test
Q statistics Prob>χ2
Renata Ltd return 55.57 0.0518
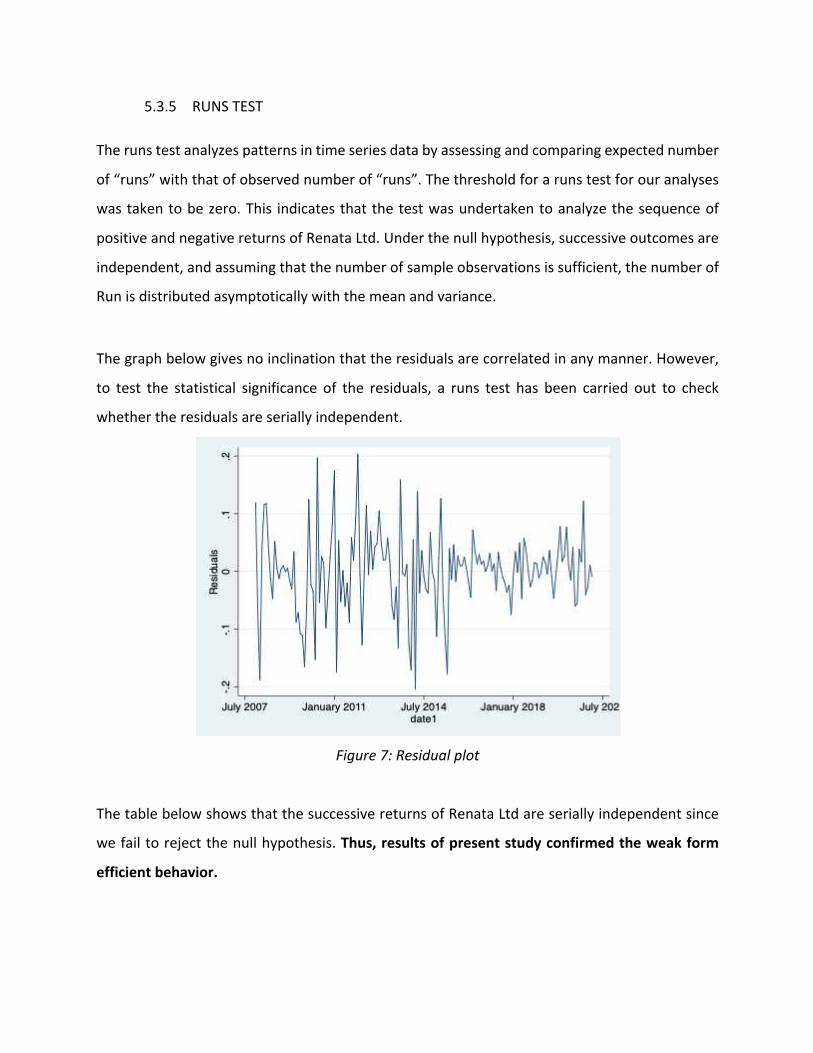
5.3.5 RUNS TEST
The runs test analyzes patterns in time series data by assessing and comparing expected number
of “runs” with that of observed number of “runs”. The threshold for a runs test for our analyses
was taken to be zero. This indicates that the test was undertaken to analyze the sequence of
positive and negative returns of Renata Ltd. Under the null hypothesis, successive outcomes are
independent, and assuming that the number of sample observations is sufficient, the number of
Run is distributed asymptotically with the mean and variance.
The graph below gives no inclination that the residuals are correlated in any manner. However,
to test the statistical significance of the residuals, a runs test has been carried out to check
whether the residuals are serially independent.
Figure 7: Residual plot
The table below shows that the successive returns of Renata Ltd are serially independent since
we fail to reject the null hypothesis. Thus, results of present study confirmed the weak form
efficient behavior.
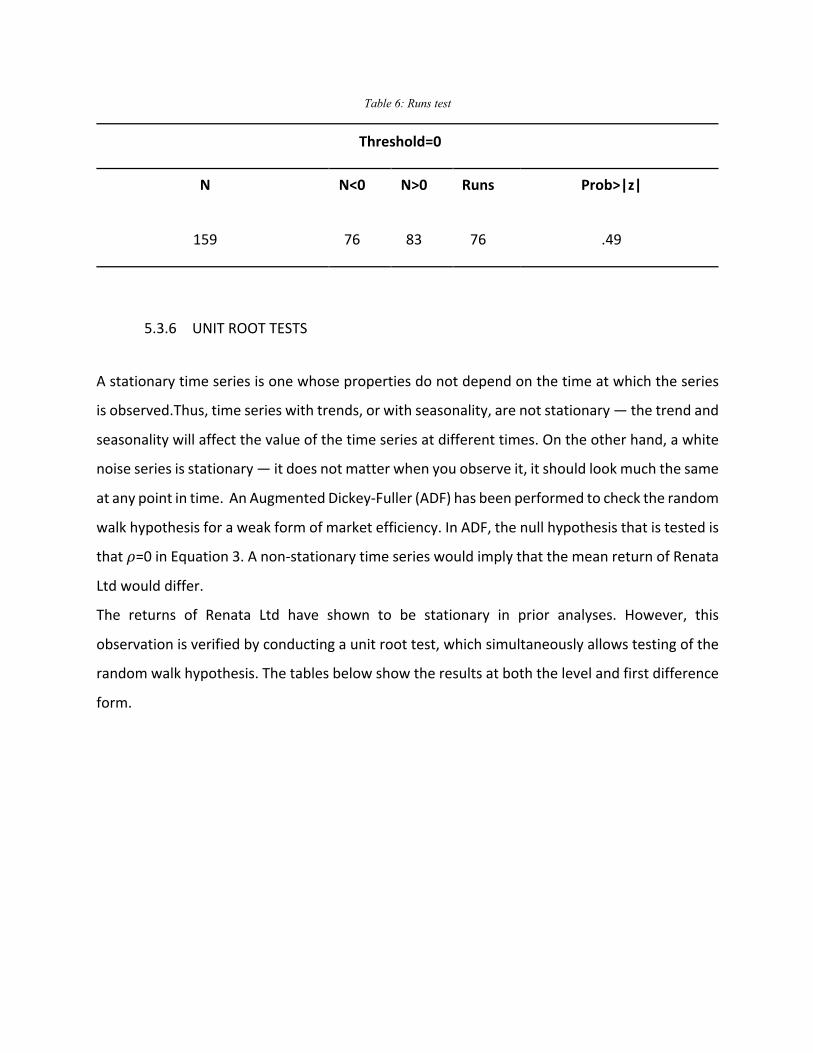
Table 6: Runs test
Threshold=0
N N<0 N>0 Runs Prob>|z|
159 76 83 76 .49
5.3.6 UNIT ROOT TESTS
A stationary time series is one whose properties do not depend on the time at which the series
is observed.Thus, time series with trends, or with seasonality, are not stationary — the trend and
seasonality will affect the value of the time series at different times. On the other hand, a white
noise series is stationary — it does not matter when you observe it, it should look much the same
at any point in time. An Augmented Dickey-Fuller (ADF) has been performed to check the random
walk hypothesis for a weak form of market efficiency. In ADF, the null hypothesis that is tested is
that 𝜌=0 in Equation 3. A non-stationary time series would imply that the mean return of Renata
Ltd would differ.
The returns of Renata Ltd have shown to be stationary in prior analyses. However, this
observation is verified by conducting a unit root test, which simultaneously allows testing of the
random walk hypothesis. The tables below show the results at both the level and first difference
form.
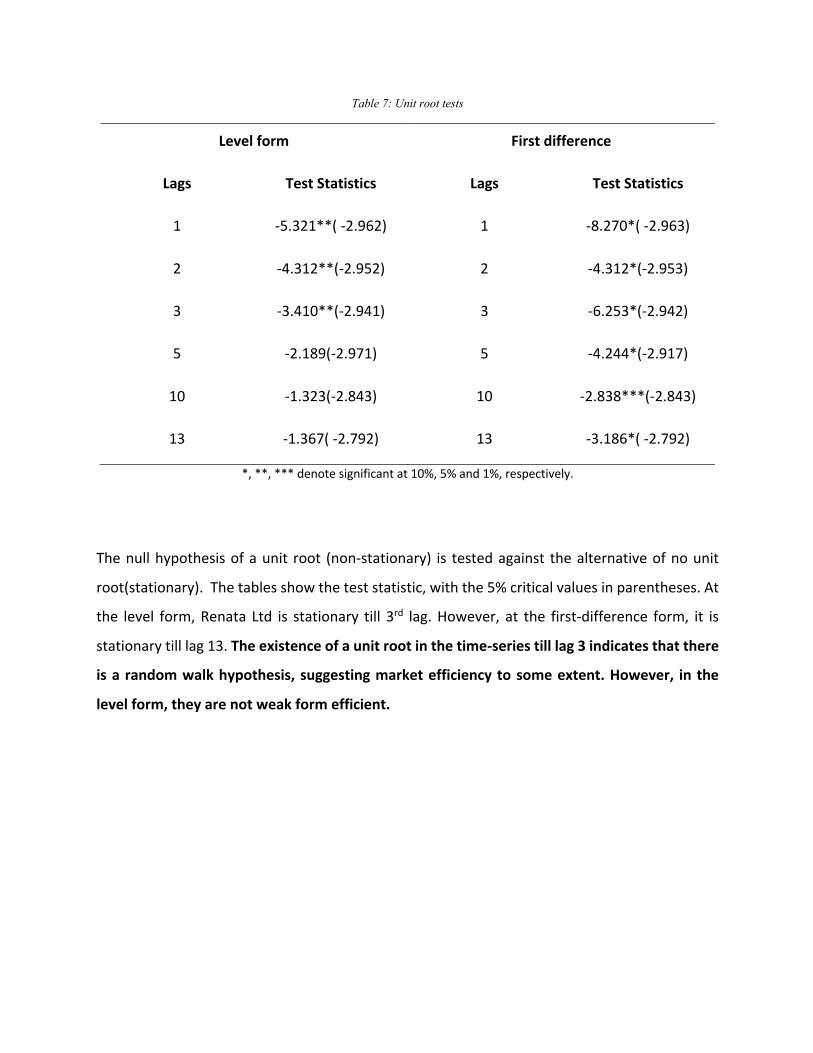
Table 7: Unit root tests
Level form First difference
Lags Test Statistics Lags Test Statistics
1 -5.321**( -2.962) 1 -8.270*( -2.963)
2 -4.312**(-2.952) 2 -4.312*(-2.953)
3 -3.410**(-2.941) 3 -6.253*(-2.942)
5 -2.189(-2.971) 5 -4.244*(-2.917)
10 -1.323(-2.843) 10 -2.838***(-2.843)
13 -1.367( -2.792) 13 -3.186*( -2.792)
*, **, *** denote significant at 10%, 5% and 1%, respectively.
The null hypothesis of a unit root (non-stationary) is tested against the alternative of no unit
root(stationary). The tables show the test statistic, with the 5% critical values in parentheses. At
the level form, Renata Ltd is stationary till 3rd lag. However, at the first-difference form, it is
stationary till lag 13. The existence of a unit root in the time-series till lag 3 indicates that there
is a random walk hypothesis, suggesting market efficiency to some extent. However, in the
level form, they are not weak form efficient.

5.3.7 CHECKING FOR STRUCTURAL BREAKS
The Dhaka stock market crash of 2010 may have created a structural break in the time series data
of Renata Ltd. It's called a structural break when a time series abruptly changes at a point in time.
Since we are analyzing the weak form of market efficiency in Renata Ltd’s return, it is imperative
to detect when any such structural break might have occurred. Structural break tests help us to
determine when and whether there is a significant change in our data.
The null hypothesis for such a test is that there is no structural break in the time series data. The
table below shows that we fail to reject the null hypothesis, and can conclude that there is no
structural break. However, the estimated break date coincides closely to the 2010 stock market
crash. Therefore, a “known-date” structural break test has been carried out.
Table 8: Structural break test (unknown date)
Estimated break date December 2009
Test Test-statistic p-value
swald 10.1517 0.0891
Table 9: Structural break test (known date)
Break date December 2009
Test Test-statistic p-value
swald 10.1517 0.006
The “known-date” structural break test rejects the null hypothesis. Thus, we can conclude that
the stock market crash of 2010 indeed created a structural break in the time series data of Renata
Ltd.
This date will be used to create the “crash” dummy variable in the variance-root tests that follow
this section.
5.3.8 VARIANCE-ROOT TESTS
Variance ratio test has been employed to examine the predictability of asset returns proposed
by Lo and Mackinlay (1988). According to this test, variance of difference of time series has
compared over dissimilar intervals. The variance-root test is based on one of the properties of
the random walk process, namely that the variance of the random walk increments must be
a linear function of a time interval. In a random walk of a time series, variance of p periods
must be p times the variance of single period difference. Based on the structural break tests
performed in the previous section, a dummy variable, “crash”, has been generated
corresponding to that time period. Based on this, a variance-root test has been carried out.
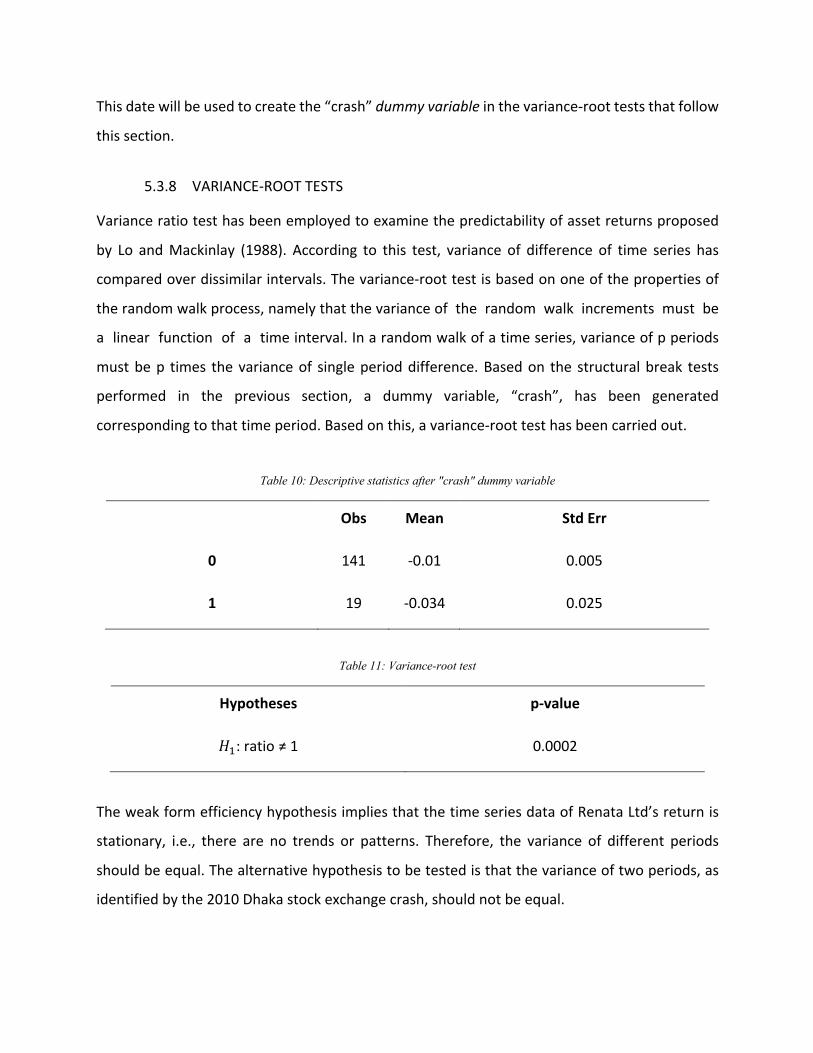
Table 10: Descriptive statistics after "crash" dummy variable
Obs Mean Std Err
0 141 -0.01 0.005
1 19 -0.034 0.025
Table 11: Variance-root test
Hypotheses p-value
𝐻': ratio ≠ 1 0.0002
The weak form efficiency hypothesis implies that the time series data of Renata Ltd’s return is
stationary, i.e., there are no trends or patterns. Therefore, the variance of different periods
should be equal. The alternative hypothesis to be tested is that the variance of two periods, as
identified by the 2010 Dhaka stock exchange crash, should not be equal.
The table above shows that the f-statistic yields a p-value less than 5%. Therefore, we can reject
the alternative hypothesis that the variance ratio of the two different time periods is not equal
to 1, i.e., they are equal to one. This implies that there is weak form efficiency present in Renata
Ltd’s returns.
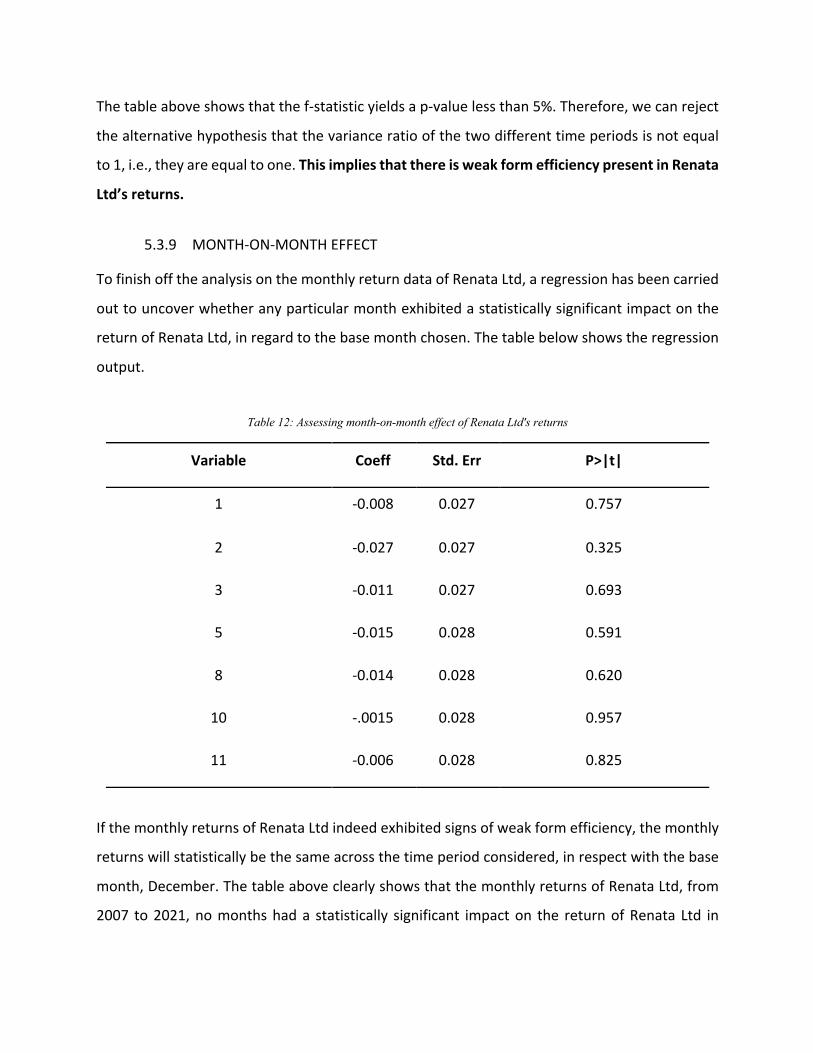
5.3.9 MONTH-ON-MONTH EFFECT
To finish off the analysis on the monthly return data of Renata Ltd, a regression has been carried
out to uncover whether any particular month exhibited a statistically significant impact on the
return of Renata Ltd, in regard to the base month chosen. The table below shows the regression
output.
Table 12: Assessing month-on-month effect of Renata Ltd's returns
Variable Coeff Std. Err P>|t|
1 -0.008 0.027 0.757
2 -0.027 0.027 0.325
3 -0.011 0.027 0.693
5 -0.015 0.028 0.591
8 -0.014 0.028 0.620
10 -.0015 0.028 0.957
11 -0.006 0.028 0.825
If the monthly returns of Renata Ltd indeed exhibited signs of weak form efficiency, the monthly
returns will statistically be the same across the time period considered, in respect with the base
month, December. The table above clearly shows that the monthly returns of Renata Ltd, from
2007 to 2021, no months had a statistically significant impact on the return of Renata Ltd in
comparison to December. The weak form of market efficiency holds in this regard due to the
fact that the returns were not abnormal.
6 SUMMARY AND CONCLUSION
The paper aimed to assess the market efficiency of Renata Ltd in the weak form by analyzing
monthly returns ranging from December 2007 to April 2021. Initially, a descriptive analysis was
done using the 4 moments of Renata Ltd and the Dhaka Stock Exchange broad market exchange.
A graphical analysis using P-P and Q-Q plots rejected the assumption that the returns of Renata
Ltd come from a normal distribution. This was further supported by Jarque-Bera and Shapiro-
Wilk tests of normality which also rejects the null hypothesis of the returns of Renata Ltd having
come from a normal distribution. Graphical tests of autocorrelation were made to uncover the
presence of any correlation between returns of Renata Ltd, which was found to not exist. Thus,
we can assert that there is no presence of serial correlation, and therefore, the market is efficient
in the weak form according to the graphical analysis of correlograms. To quantifiably test the
presence of a random walk effect, the Durbin-Watson, Breusch Godfrey, Portmanteau, runs,
Augmented Dickey-Fuller (ADF) and variance root tests were undertaken. All tests support the
fact that Renata Ltd.’s return does follow a random-walk process, implying the existence of weak
form market efficiency.
A strong and robust equity market instills confidence on the economy at large and signals the
strength of policies implemented by the government. In times of volatility, it signals investors to
divulge their portfolios in order to minimize downside risk. Based on the analyses carried out for
the returns of Renata Ltd, it can be asserted that the stock prices of Renata Ltd do indeed reflect
all historical information relevant to Renata Ltd. Hence, the returns of Renata Ltd are indeed
efficient in the weak form. The finding of the paper contradicts many of the past studies
conducted on the Dhaka Stock Exchange securities. This may be an indication of an improvement
in disclosures made by publicly listed companies following increased regulatory scrutiny over the
financial sector.
References
Basher, S. A., Hassan, M. K., & Islam, A. M. (2007). Time-varying volatility and equity returns in
Bangladesh stock market. Applied Financial Economics, 17(17), 1393–1407.
https://doi.org/10.1080/09603100600771034
Bose, T.K., Uddin, M.R., and Islam, M.W. (2014). Measuring and Comparing the Efficiency of
Dhaka Stock Exchange and Chittagong Stock Exchange. International Journal of Scientific
and Research Publications. Volume 4, Issue 3.
Chaity, N. S., & Sharmin, S. (2011). Efficiency Measures of Capital Market: A Case of Dhaka Stock
Exchange. International Journal of Business and Management, 7(1).
https://doi.org/10.5539/ijbm.v7n1p102
Dsouza, J. J., & Mallikarjunappa, T. (2015). Does the Indian Stock Market Exhibit Random
Walk? Paradigm, 19(1), 1–20. https://doi.org/10.1177/0971890715585197
Fama, E. F. (1965). The Behavior of Stock-Market Prices. The Journal of Business, 38(1), 34.
https://doi.org/10.1086/294743
Fama, E. F. (1970). Efficient Capital Markets: A Review of Theory and Empirical Work. Journal of
Finance, 25, 383-417.
Fama, E. F. (1995). Random Walks in Stock Market Prices. Financial Analysts Journal, 51(1), 75–
80. https://doi.org/10.2469/faj.v51.n1.1861
Gimba, V. K. (2012). Test of Weak Form Efficiency and Nigerian Foreign Exchange Market
Volatility. Research Journal of Finance and Accounting. https://doi.org/10.7176/rjfa/11-
16-14
Gupta, R., & Basu, P. K. (2011). Weak Form Efficiency In Indian Stock Markets. International
Business & Economics Research Journal (IBER), 6(3).
https://doi.org/10.19030/iber.v6i3.3353
Hameed, A., & Ashraf, H. (2006). Stock Market Volatility and Weak-form Efficiency: Evidence
from an Emerging Market. The Pakistan Development Review, 45(4II), 1029–1040.
https://doi.org/10.30541/v45i4iipp.1029-1040
Harvey, C. (1995). Predictable Risk and Returns in Emerging Markets. The Review of Financial
Studies, 8(3), 773-816. Retrieved June 15, 2021, from
http://www.jstor.org/stable/2962239
Khaled, M., and Islam, A. (2005). Test of Weak-Form Efficiency of the Dhaka Stock Exchange.
Journal of Business Finance & Accounting, vol. 32, no. 7 & 8, 1613-1624.
Hasan, M. A. (2015). Testing Weak-Form Market Efficiency of Dhaka Stock Exchange. Global
Disclosure of Economics and Business, 4(2), 79–90.
https://doi.org/10.18034/gdeb.v4i2.137
Khandoker, M.S.H., Siddik, M.N.A., and Azam, M. (2011). Tests of Weak-form Market Efficiency
of Dhaka Stock Exchange: Evidence from Bank Sector of Bangladesh. Interdisciplinary
Journal of Research in Business, Vol. 1, Issue. 9, (pp.47- 60).
Laurence, M, M. (1986). Weak-form efficiency in the Kuala Lumpur and Singapore Stock
Markets. Journal of Banking and Finance, vol. 10, 431- 445.
Lo, A.W., MacKinlay C. (1988). Stock Market Prices Do Not Follow Random Walks: Evidence
from a Simple Specification Test. Review of Financial Studies, 1, 41- 66.
Mollik, A. T., & Bepari, M. K. (2009). Weak-Form Market Efficiency of Dhaka Stock Exchange
(DSE), Bangladesh. SSRN Electronic Journal. https://doi.org/10.2139/ssrn.1460536
Moustafa, M. A. (2004). Testing the Weak-Form Efficiency of the United Arab Emirates Stock
Market. International Journal of Business, vol. 29, no. 3, 310-325.
Zaman, S. (2019). Weak form market efficiency test of Bangladesh Stock Exchange: an empirical
evidence from Dhaka Stock Exchange and Chittagong Stock Exchange. Journal of
Economics, Business & Accountancy Ventura, 21(3), 285.
https://doi.org/10.14414/jebav.v21i3.1615