An Efficient Transportation Network—Case Study - MDPI
14
sustainability Article Sustainable Transport: An Efficient Transportation Network—Case Study Marek Ogryzek 1, * , Daria Adamska-Kmie´ c 2 and Anna Klimach 1 1 Department of Land Management and Geographic Information Systems, Faculty of Geoengineering, University of Warmia and Mazury in Olsztyn, Prawochenskiego street 15, 10-720 Olsztyn, Poland; [email protected] 2 Faculty of Geoengineering, University of Warmia and Mazury in Olsztyn, Prawochenskiego street 15, 10-720 Olsztyn, Poland; [email protected] * Correspondence: [email protected] Received: 10 September 2020; Accepted: 30 September 2020; Published: 8 October 2020 Abstract: The article describes sustainable transport principles and guides that can lead cities towards a more efficient transportation network. The authors also show good practice used in different urban areas, such as London and Copenhagen. Furthermore, Vilnius was analyzed for its sustainable transport rules and mobility. The authors took into consideration components such as public transport indicators, car use and the number of trips made by bicycle and by pedestrians. Additionally, solutions such as shared space, developing cycle routes and public transportation networks, dividing different transport modes, reducing distance and the need to travel, policy shifts and technological innovation are proposed. Moreover, already taken actions are also verified. The article, additionally, shows guidance for Vilnius, so it could be possible to develop a sustainable traffic network in the city. All analyses and guidance were based on using geographic information system (GIS) tools which allowed the authors to obtain the most reliable results. The artefacts are presented by means of a combination of graph theory algorithms in order to obtain sustainable transport using the example of a part of Vilnius City. Keywords: road network; sustainable; transport policy; GIS; graph theory 1. Introduction Properly designed transportation systems should meet mobility and people requirements and also provide safety and eco-friendly vehicles [1]. According to the World Commission on Environment and Development, mankind should strive for sustainable development to meet the needs of the present without compromising the ability in order to meet the requirements of future generations [2,3]. An important role in the sustainable development of space is played by the transport system. It plays a role in the sustainable development of space, because transport provides access to economic and social opportunities for all communities [4]. People living in the individual areas shall aim to develop sustainable transport systems, in particular road networks, which will enable them to achieve appropriate level of growth both in the economic, social and environmental spheres [5,6]. However, we have to admit that it is the environmental aspect and the related need to overcome natural barriers that is one of the challenges we face when creating a transport network [7]. Moreover, Lithuanian researchers emphasize that modernization of transport infrastructure “should ensure sustainable mobility, communication of individuals and establish effective relations of business agents while providing support for the national economy” [8]. Transport (communication) accessibility is considered to be an important determinant of sustainable development for agglomerations and cities [9–11]. Not only clearly technical and surface aspects should be considered in the field of Sustainability 2020, 12, 8274; doi:10.3390/su12198274 www.mdpi.com/journal/sustainability
-
Upload
khangminh22 -
Category
Documents
-
view
1 -
download
0
Transcript of An Efficient Transportation Network—Case Study - MDPI

sustainability
Article
Sustainable Transport: An Efficient TransportationNetwork—Case Study
Marek Ogryzek 1,* , Daria Adamska-Kmiec 2 and Anna Klimach 1
1 Department of Land Management and Geographic Information Systems, Faculty of Geoengineering,University of Warmia and Mazury in Olsztyn, Prawochenskiego street 15, 10-720 Olsztyn, Poland;[email protected]
2 Faculty of Geoengineering, University of Warmia and Mazury in Olsztyn, Prawochenskiego street 15,10-720 Olsztyn, Poland; [email protected]
* Correspondence: [email protected]
Received: 10 September 2020; Accepted: 30 September 2020; Published: 8 October 2020�����������������
Abstract: The article describes sustainable transport principles and guides that can lead citiestowards a more efficient transportation network. The authors also show good practice used indifferent urban areas, such as London and Copenhagen. Furthermore, Vilnius was analyzed for itssustainable transport rules and mobility. The authors took into consideration components such aspublic transport indicators, car use and the number of trips made by bicycle and by pedestrians.Additionally, solutions such as shared space, developing cycle routes and public transportationnetworks, dividing different transport modes, reducing distance and the need to travel, policy shiftsand technological innovation are proposed. Moreover, already taken actions are also verified.The article, additionally, shows guidance for Vilnius, so it could be possible to develop a sustainabletraffic network in the city. All analyses and guidance were based on using geographic informationsystem (GIS) tools which allowed the authors to obtain the most reliable results. The artefacts arepresented by means of a combination of graph theory algorithms in order to obtain sustainabletransport using the example of a part of Vilnius City.
Keywords: road network; sustainable; transport policy; GIS; graph theory
1. Introduction
Properly designed transportation systems should meet mobility and people requirements andalso provide safety and eco-friendly vehicles [1]. According to the World Commission on Environmentand Development, mankind should strive for sustainable development to meet the needs of thepresent without compromising the ability in order to meet the requirements of future generations [2,3].An important role in the sustainable development of space is played by the transport system. It playsa role in the sustainable development of space, because transport provides access to economicand social opportunities for all communities [4]. People living in the individual areas shall aimto develop sustainable transport systems, in particular road networks, which will enable them toachieve appropriate level of growth both in the economic, social and environmental spheres [5,6].However, we have to admit that it is the environmental aspect and the related need to overcomenatural barriers that is one of the challenges we face when creating a transport network [7]. Moreover,Lithuanian researchers emphasize that modernization of transport infrastructure “should ensuresustainable mobility, communication of individuals and establish effective relations of business agentswhile providing support for the national economy” [8]. Transport (communication) accessibilityis considered to be an important determinant of sustainable development for agglomerations andcities [9–11]. Not only clearly technical and surface aspects should be considered in the field of
Sustainability 2020, 12, 8274; doi:10.3390/su12198274 www.mdpi.com/journal/sustainability

Sustainability 2020, 12, 8274 2 of 14
transport, economic conditions of the area; peoples’ expectations and optimal solutions that would beenvironmentally friendly and would direct the transportation towards sustainability should be alsotaken into account. In the field of planning the most important feature is road safety, especially forcyclists and pedestrians. Safe infrastructure has to be provided for those types of transport and thatmeans the physical separation of people from the road area and, if this is not possible, car speeds haveto be reduced and education about road safety has to be provided from an early age. Urban plannerswho are taking care of transport have to have not only technical knowledge, but also, they need todemonstrate ingenuity and innovation. Moreover, the way the transport looks in a specific city alsodepends on the efficiency of local government units [12,13]. This form of city planning practice canlead to sustainable transport.
On the other hand, the sustainability of transport in the cities is linked to high-qualityimplementation of innovative systems and to the need to gain public trust [14]. Planning ofnon-motorized transport depends on combining infrastructure improvement with education [15].The perspective of the social dilemma sees the trend of continuous increase in the use and density ofcars (more vehicles with fewer people covering longer distances on proportionally shorter roads) asa result of the unfortunate preference for short-term profits by car users at the expense of long-termlosses to society [16]. A transport system can increase the efficiency and quality of life of a communityif it is properly planned and managed, while at the same time the development stimulates transportdemand [17]. Environmental protection requirements currently applied by companies promoteimprovements to already established systems [18].
The main goal of the article is to show the development of the transportation network in Vilniusand compare it with two chosen models (London and Copenhagen). Moreover, the authors would alsolike to analyze the studied city in relation to sustainable transport assumptions. The developmentof a transportation network is inevitably connected with the city’s development [19]. Its growthmeans the same for a transportation system that can be implemented according to the higheststandards. The transportation network can be also changed and modified in older parts of the city.This improvement should not only concern surface replacement but also a change in traffic, so it can beadjusted to peoples’ needs [20]. The authors will indicate how it can be done in Vilnius.
2. Literature Review
Firstly, the idea of sustainable development [21] was focused on multi-annual problems [22]associated with environment and climate change [23]. The debate considering sustainable citydevelopment is today based on the idea of creating compact cities to provide them with balanceddevelopment [24]. In the case of passenger transport, social requirements are the main factorsinfluencing sustainable transport indicators. [4]. On the other hand, Goldmana and Gorhamb [25]Goldmana and Gorhamb claim that, in order to be effective, a sustainable transport policy has to avoidthe trap of the common transport policy of ignoring the larger systems in which transport activitiesare located.
A sustainable transport system mainly focuses on planning, politics and used technologies.Its main objective is to ensure efficient transit of goods and the high quality of transportation services.Besides, sustainable transport development is based on such city planning which would create urbanareas free from cars and friendly for pedestrians and cyclists. Bike-sharing systems are gettingmore and more popular in large cities.17] as they are one of the most sustainable mean of transportin the urban area [20]. They are viewed as a cheap, efficient and healthy means of navigatingdense urban environments [26]. Furthermore, transport in those cities should be based on publictransportation means [27]. Professor David Banister, from the University of Oxford, has developed aparadigm, which presents sustainable transport rules that should be obtained in city planning [14].Those principles are:
1. Reduced travel needs2. Transport policy shift

Sustainability 2020, 12, 8274 3 of 14
3. Distance reduction4. Technological innovation that would increase efficiency [14].
The first sustainable transport principle—reduced travel need—means that travelling has to besubstituted by providing such technological solutions that could reduce these needs to a minimum.In this rule Banister notes the importance of the relationship between transportation and ICT(information and communicationstechnology), especially the growing importance of online shopping.The second sustainable transport principleimplies a strategy change (Table 1) which means that caruse levels should be reduced in favor of walking and cycling. An increasing number of communitiesin the United States are trying to improve the sustainability of their transport systems by shiftingroutine vehicle trips to walking and bike usage. [28]. Furthermore, Banister [14] proposes a newroad hierarchy where pedestrians and cyclists are at the top of the sustainable transport pyramid,then in the middle there is public transport and car users at the bottom. This goal can be achieved byslowing down the city traffic and creating a separate area adjusted for public transport. Additionally,road payments should be also implemented (for example: paid entrance to the city centre and the oldtown). Moreover, the change of the roadway definition is also part of this principle that says the streetis not only a car area. It should be perceived as a space with green modules which is also used bypeople (cyclists and pedestrians) and public transport means. This maxim encourages creative streetuse at different times of the day. For instance, during the weekend some roads can be transformedto street markets or can become fun zones. Those ideas encourage people to change their way ofperceiving transport and they should be combined with a properly designed strategy for the best spaceuse. The bicycle is a desirable form of transport, because it’s environmentally friendly and economic inmaintenence. Also, bikes have other positive effects: they are seen as a mean to stay healthy and in agood shape [29].
Table 1. Contrasting Approaches in Transport Planning. Source: [14].
The Coventional Approach(Transport Planning and Engineering)
An Alternative Approach(Sustainable Mobility)
Physical dimensions Social dimensionsMobility Accessibility
Traffic focus, particularly on the car People focus, either in (or on) a vehicle or on footLarge in scale Local in scale
Street as a road Street as a space
Motorized transport All modes of transport often in a hierarchy with pedestrians andcyclists at the top and car users at the bottom
Forecasting traffic Visioning on citiesModeling approaches Scenario development and modeling
Economic evaluation Multicriteria analysis to take account of environmental andsocial concerns
Travel as a derived demand Travel as a values activity as well as a derived demandDemand based Management based
Speeding up traffic Slowing movement downTravel time minimization Reasonable travel times and travel time reliability
Segregation of people and traffic Integration of people and traffic
The third sustainable transport principle is about distance reduction. Its intention is to createmobility inside city districts that can lead to a shift in use of transportation modes for those that areenvironmentally friendly (vehicles), but also walking and cycling. Districts should be planned in away that enables residents to use different services (housing, commerce, recreation, education) whichcan decrease the need to travel. It is recommended, in accordance with the principles of sustainablespace development, to create “green urban islands“ without car traffic, and to link them with eachother to enable safe foot and bicycle traffic [30].

Sustainability 2020, 12, 8274 4 of 14
The fourth sustainability rule states that new technologies must be implemented which can maketransport more efficient. Transport is responsible for 26% of global CO2 emissions and is one of thefew industrial sectors where emissions continue to rise [31]. The role of technology is incrediblyimportant and is inextricably linked to transportation, because it has a direct impact on its performance.The most sustainable solution would be if each transport mode would use the latest technologies,innovative engine construction, alternative fuels and renewable energy sources [32–34]. The priorityin the glorious quest for sustainable is the development of green cities [35]. New solutions shouldalso include reduction of noise generated by vehicles and ensure easy access to every part of the cityin reasonable time. New vehicles should be environmentally friendly. Moreover, this principle is acombination of efficiency and drivers’ behavior change towards more rational behavior; eco drivingcombined with following the traffic rules— especially the speed limits.
To sum up, the idea of sustainable transport is to keep the hierarchy of traffic participants. The mostprivileged group should be pedestrians, because they are the most defenseless and endangeredgroup. The second group is cyclists, then the public transport network. The inclusion of bikes in acomprehensive planning framework seems to be a favourable approach which may lead to changes inurban transport [36]. At the very bottom of the classification are car users, because they are the mostproblematic community—it is they who often cause traffic jams and block the streets (Figure 1).
Figure 1. Sustainable Transport Pyramid.
Sustainable transport rules that are described above are the key to make the change in the way ofthinking about spatial planning which is attractive for residents. Transport planning should involvepeople in creating and decision making processes so that they would understand occurring changes.It has to be remembered that social acceptation is a fundamental value to implement any reformsuccessfully. GIS software can be used to achieve this goal.
3. Materials and Methods
Sustainable transport is seen as a global concept [37–39]. Its main idea is to strive for efficientcommunication which is economically advantageous and minimizes the harmful impact of vehicles onthe environment. It focuses on both the control of harmful emissions and the promotion of sustainablemeans of transport such as public transport, bicycles or car sharing [40]. This type of transport and itsparadigms assumes the reduction of the destruction of urban space due to the dominance of individualcar transportation [41].
To reach these goals, the authors conducted their studies on many levels. At first, model citieswith sustainable transport networks were presented. Then Vilnius the transportation system wasanalyzed, and finally the authors indicated sustainable transport solutions for this city.
While creating the proposed solutions for Vilnius, the authors used GIS tools that allow fortransportation network modeling [42,43]. Thanks to that it was possible to create maps that show howthe existing transportation system can be transformed into a more sustainable form. The researchcovered the city of Vilnius, which is the capital of Lithuania. In Figure 2 the research area on the map of

Sustainability 2020, 12, 8274 5 of 14
Europe is marked. ArcMap software was used to visualize the test results. The graphical algorithm [44]from the graphic theory was used to develop a model of optimal and decongested transport on aselected part of Vilnius City. The algorithmic solutions used to develop the graph concept were usedto design new bicycle routes and stations. The authors used a set of combinations of new roads andstations in order to obtain an optimal combination that solves the problem of finding the shortest routes(Fleury Algorithm), the Chinese letter carrier (Dijkso Algorithm) and the salesman (Hamilton cycle)issue and also network reliability situation. Sustainable transport using graph theory algorithms hasbeen used by many scientists [45–53].
Figure 2. Research Area.
4. Results and Discussion
4.1. Examples of Model Transport Networks
Public transport development: in Copenhagen the number of public transport modes wasincreased by 1200 bus stops, 40 train and S-train stations. Furthermore, there was also a new metroline built. Moreover, public transport means have priority over car users. That kind of approach gavethe result of increasing by 8% the number of metro passengers between years 2008 and 2009. When thenumber of stops was increased, the number of passengers has grown as well [54].
Bicycle paths development—in Copenhagen the number of cycling tracks was increased to350 km [55]. Additionally, the city has many cycling facilities such as green “waves”—which enablesbike users to move around the town during rush hours without stopping—and green cycle routeswhich divide cyclists from infrastructure. Additionally, many intersections were redesigned to givepriority to cyclists—stop lines for cars were moved 5 m behind. Furthermore, blue cycling routeswere implemented in places with the biggest number of accidents to reduce the risk [56]. In London,thanks to creating a public transport and city bike network (Barclays Cycle Hire), the use of cars waslimited. This result was also achieved by many social campaigns [57]. Sudden changes in horizontaland vertical geometry and cross-section are ominous for cyclists. Such risks can be minimised by safetyaudits or by using good design practice in the initial design phase [58].

Sustainability 2020, 12, 8274 6 of 14
Shared space—on Kensington High Street (London), although it is one of the busiest places(40,000 vehicles drive there daily), street signs, barriers for pedestrians and any other limits wereremoved. The central part of the area was used as parking for cyclists, which encouraged KensingtonHigh Street users to move around freely. In Covent Garden, thanks to Seven Dials MonumentTrust activity, which fought in the 1990s for restoration of one of the most characteristic monuments(Seven Dials), not only was the monument restored, but also a space not limited by any signs orregulations was created, although it is a very busy place. Traffic is slow here, and jams are seen rarely.What is more, for 16 years there have been no serious accidents [59].
Paid entry to the city center: in London the amount of greenhouse gases was reduced thanks topaid entry to the city center which discouraged car users. In turn, cheap public transport encouragespeople. Moreover, Prime Minister Boris Johnson’s campaign, called Charge Point, encourages citizensto use electric cars, because there are free charging points in London. That action caused an increasednumber of sales and registered electric cars. The results from the Transportation Report for London2013, presented in Figure 3, confirm the above creatures [57].
Figure 3. Number of Journeys Made in London Using Different Means of Transport Between Years1993 and 2012. Source: Report [57].
In many European cities support for public transport and cycling in daily mobility is considered tobe an effective way to reduce air pollution, traffic jams and carbon dioxide emissions [60]. Planning andtransport experts encourage various sustainable transport alternatives, such as using public transport,walking and cycling as affordable transport options to counteract the negative effects of car use forall [61]. The development of more sustainable transport requires the adequate establishment of fourpillars: efficient land-use and transport management; fair, efficient and sustainable financing; strategicinfrastructure investment; and attention to neighbourhood design [62]. Urban planning can createmore efficient and environmentally friendly municipal freight transport systems. The use of innovativeICT (information and communication technologies) and ITS (intelligent transport systems), a change inthe mentality of logistics managers and public-private partnerships can promote urban logistics policy

Sustainability 2020, 12, 8274 7 of 14
measures [63]. Worldwide, several cities are striving for more sustainable urban transport systemsin order to reduce accidents, congestion, air and noise pollution, and to improve social interaction,the ability to live and the value of amenities [64].
Figures 4 and 5 show the benefits from the solutions used in Copenhagen. Growth in the numberof people cycling to work or educational institutions and feeling safe in traffic can be observed.
Figure 4. Percentage of People Cycling to Work or Educational Institutions in Copenhagen BetweenYears 1998 and 2010 and the Goal for 2015. Source: Report [55].
Figure 5. Percentage of People Cycling to Work or Educational Institutions in Copenhagen BetweenYears 1998 and 2010 and the Goal for 2015. Source: Report, [55].
Thanks to an efficient network of public transport and cycling routes in Copenhagen, car use hasdecreased so much that in 2010 up to 47% of citizens did not own car and 58% rode their bike to workor school on a daily basis [65].
4.2. Transport in Vilnius
Can sustainable transport be found in Vilnius? Peripheral regions in post-socialist countries appearto be particularly underinvested in terms of their transport, including at the local and regional level [7].The authors focused on analyzing Vilnius for use of sustainable transport principles. Both alreadytaken actions and problematic areas were analyzed. Additionally, new solutions were proposed,because efficiency of the transportation system is extremely important due to the growing scale ofdemands concerning mobility. Primarily, it has to be said that the main problem in Vilnius, from whichdifficulties in the transport department result, is the urban sprawl (uncontrolled growth of urban areas)
Sustainability 2020, 12, 8274 8 of 14
that is inconsistent with a compact cities strategy promoted by the EU [66,67]. An attempt to showplaces (areas) with problematic transportation zones was taken by the scientists from Vilnius GediminasTechnical University. By using GIS tools they have managed to elaborate a model, which divides thecity into 51 TAZ (traffic analysis zones) and specifies their efficiency [68]. During creation of this model,accessibility from the city center to different zones, population density and the number of jobs in thezones, density of public communication network and the number of daily trips in each zone weretaken into consideration. To perform the necessary calculations, scientists used a modified Bogart andFerry model [69].
The research results carried out by Jakimavicius and Burinskiene [68] in search of sustainablecommunication in Vilnius show that there are efficient communication zones, but there are only twoof them: Santariškes and ŽemiejiPaneriai. In contrast, zones like Centras I, Centras II, Lazdynai,Karoliniškes, Antakalnis, Senamiestis, Šnipiškes and Naujamiestis were considered as zones havingserious problems such as a lack of parking space and constant traffic jams. Abnormalities were alsoidentified in Verkiai, Dvarcionys, Valakupiai, A. Paneriai and Tarande zones. Moreover, sustainabletransport principles about reducing the number of cars and promoting walking and cycling alongwith using public transport means are not completely implemented in Vilnius. Jakimavicius andBurinskiene [70] in one of their articles proposed a scenario saying that despite a growing numberof cars in Vilnius, it would be possible to introduce a certain degree of sustainable transport rules ifcars would be more efficient and use alternative energy sources. However, as they admit themselves,that kind of scenario is hard to accomplish. At Lithuanian motorway intersections, various trafficand safety engineering solutions are applied intensively [71]. On the other hand Klibavicius andPaliulis [72] demonstrated that the number of vehicles is similar to the statistical distribution of thedata defined as such: the arrival of different vehicles at roundabouts is close to Poisson distribution.
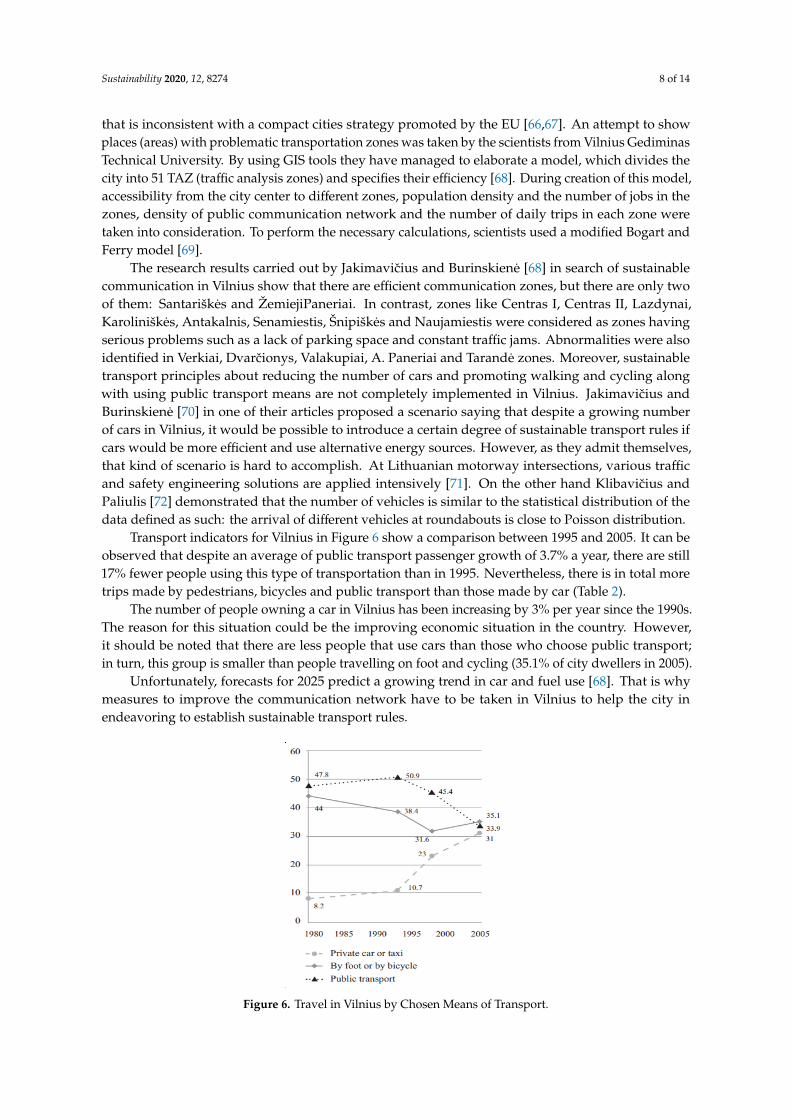
Transport indicators for Vilnius in Figure 6 show a comparison between 1995 and 2005. It can beobserved that despite an average of public transport passenger growth of 3.7% a year, there are still17% fewer people using this type of transportation than in 1995. Nevertheless, there is in total moretrips made by pedestrians, bicycles and public transport than those made by car (Table 2).
The number of people owning a car in Vilnius has been increasing by 3% per year since the 1990s.The reason for this situation could be the improving economic situation in the country. However,it should be noted that there are less people that use cars than those who choose public transport;in turn, this group is smaller than people travelling on foot and cycling (35.1% of city dwellers in 2005).
Unfortunately, forecasts for 2025 predict a growing trend in car and fuel use [68]. That is whymeasures to improve the communication network have to be taken in Vilnius to help the city inendeavoring to establish sustainable transport rules.
Figure 6. Travel in Vilnius by Chosen Means of Transport.

Sustainability 2020, 12, 8274 9 of 14
Table 2. Transport System Indicators in Vilnius. Source [68].
Indicator 1999 2005
Street network density (km/km2) 1.9 2.4Public transport density (km/km2) 0.55 0.62
Bicycle paths networks density (km/km2) 0.10 0.16Average traffic flow in peak hours (aut./h) 1275 1521
Percentage of trucks in average flow 3.4 2.4Average speed in peek traffic flow (km/h) 37.5 29.3
Modal split-pedestrian trips % 31.3 34.8-trips by bicycles % 0.3 0.3
-trips by public transport % 45.4 34.2-trips by car % 23.0 30.7
Maximum number of public transport passengers in peak hours 5300 3600Transit of trucks in peak hours % 21.3 13.2
Number of traffic accidents for 1000 inhabitants 1.07 1.77
4.3. Sustainable Transport Solutions for Vilnius
Metro lines construction: Vilnius is supported by 456 km of trolleybus lines that carry 400,000passengers per day. Besides that, citizens use buses which carry 300,000 passengers daily. This meansthat 33.9% of people from urban and suburban areas, consisting of 900,000 residents (540,000 living inVilnius), use public transport. However, because of the overload in the city center, average speed inthis area is about 20 km/h, which successfully scares people away from using public transport [68].That is why the city government decided to study the usefulness of new means of transport, includinga metro (Figure 7). Research conducted in the years 2006–2008 shows that 57% of responders opted forcreating a metro while only 20% of them supported tram building. For the metro case, an organizationcalled Vilnius Metro was created. The association is active in informing people about new solutionsand held negotiations with investors so that a metro could be built from private resources [73].
Figure 7. Metro Construction Plan in Vilnius. Source: [73].
After the analysis of model solutions in selected cities and presenting the sustainable transportassumptions, the authors introduce possible solutions thanks to which transport in Vilnius can betreated as sustainable.
The map below presents a possible solution for the expansion of a bicycle network in a selectedlocation in Vilnius. It is a neighborhood with a large transportation route, residential buildings and apark/forest. The possibility of linking the places where housing is located with the traffic routes willallow residents to easily change from bicycle to bus. Designation of bicycle paths and places fromwhich bicycles can be rented in recreational areas should encourage the use of green spaces.
What is important in the proposed solution (Figure 8) is that it combines walking, cycling andpublic transport. The use of public transport is often uncomfortable due to the long distance to the stop.The connection between the stop and the place from which people can rent a bicycle can encourage

Sustainability 2020, 12, 8274 10 of 14
them to use public transport. Parking in cities is associated with looking for a place and parking fees.That is why choosing public transport or bicycles relieves the traveler from looking for a place to leavethe car. Some bike sharing systems reward their users if they leave the bike at the station. This savesthem a fee for using a bicycle. Therefore, it is necessary to make bicycle stations available in attendedplaces, as well as in places close to the living areas.
Figure 8. Results of the Analysis.
As shown in the maps above, changes can be made to the existing transport system, thanks towhich it can be said that the transport in Vilnius would be sustainable. In presenting these proposals,the rules of sustainable transport contained in the Pyramid of Sustainable Transport (Figure 1) wererespected. Finding the optimal solution for the Fleury, Dijkso, Hamilton cycle algorithm whilemaintaining apex and edge consistency required the development of many variants and testing themin order to achieve a system where algorithms have solutions. In this way, we minimized costs andmaximized functionality and usability. The limitations include natural and cost barriers. We canassume that we are looking for the cheapest possible network with a predetermined reliability, or weare looking for a network with a fixed cost and the highest possible reliability. Of course, the more lines(edges), the greater the reliability. On the other hand, however, building any connection costs money.Additionally, it is assumed that the solution you are looking for has an Euler cycle, which means thatthere is a road that starts and ends at the same point and requires you to walk on each street exactlyonce. The graph is a full graph, which means it has at least one Hamilton cycle. Since the graph has afinite number of vertices, there is one (not necessarily the only one) in the set of Hamilton cycles thathas a minimum sum of edge weights. We start from any vertex. Each successive edge we pass onis selected from the edges coming from the vertex we are currently in. If it is possible, removing theselected edge should not cut the graph into two “pieces”. If we manage to reach the vertex from whichwe started and go through all the edges, the resulting path is an Euler cycle. The problem of findingHamilton’s cycle is similar to the problem of the combo-chainer being ”difficult” due to the longtimeof known algorithms. If the Hamilton cycle does not exist in the tested graph, then in that case we may

Sustainability 2020, 12, 8274 11 of 14
even have to check all possible permutations of the vertex set to make sure that such a cycle does notexist. We want to design a network with the required reliability, the cost of which will be as low aspossible. So, we are looking for a graph with n vertices and as few edges as possible, whose vertexconsistency or edge consistency is k.
5. Conclusions
In Hamilton–Baillie’s opinion, a different and better solution is creating shared and integratedspaces that bind different forms of transport in one piece [59]. This means the removal of signs,lanes, traffic lights, etc. and letting people spontaneously shape the traffic rules. However, it has tobe remembered that this kind of solution may be achieved only by cooperation of people and localgovernment combined with an approach change. There is a common opinion that residents of thesuburbs are bound to use individual forms of transportation, and public transport does not meet theirneeds [74].
To sum up, Vilnius is a place where two city models (compact and traditional urban sprawl model)collide. This is because Vilnius is developing both in terms of sustainable transport (Santariškes andŽemieji Paneriai zones), but there are also zones like Centras I, Centras II, Lazdynai, Karoliniškes,Antakalnis, Senamiestis, Šnipiškes and Naujamiestis that have serious problems with traffic.
However, change in city transportation characteristics towards more sustainability, like in theBanister paradigm, is a long process. Both the model and infrastructure for traditional transportsystems were developed many years ago. That is why the whole infrastructure and land use planningin Vilnius require gradual changes. Moreover, the starting point for every city should be different,because it depends on individual factors such as the political situation, local conditions and availablefunds. This is the reason why Vilnius has to work on its own solutions (based on those alreadyexisting and functioning efficiently in the world, e.g., Copenhagen and London) leading towardssustainable transport.
Author Contributions: Conceptualization, M.O. and D.A.-K.; methodology, M.O. and D.A.-K.; software, M.O.;validation, M.O.; formal analysis, A.K.; investigation, M.O. and D.A.-K.; data curation, M.O.; writing—originaldraft preparation, M.O. and D.A.-K., writing—review and editing, M.O. and A.K.; visualization, M.O.; supervision,M.O.; project administration, M.O. All authors have read and agreed to the published version of the manuscript.
Funding: This research received no external funding.
Conflicts of Interest: The authors declare no conflict of interest. The funders had no role in the design of thestudy; in the collection, analyses, or interpretation of data; in the writing of the manuscript, or in the decision topublish the results.
References
1. UNESCAP. Gender and Transport; Report Congestion Combatting No. 76, No.82; Economic and SocialCommission for Asia and the Pacific Transport and Communications Bulletin for Asia and the Pacific:Bangkok, Thailand, 2013.
2. Greene, D.L.; Wegener, M. Sustainable transport. J. Transp. Geogr. 1997, 5, 177–190. [CrossRef]3. De Gruyter, C.; Currie, G.; Rose, G. Sustainability measures of urban public transport in cities: A world
review and focus on the Asia/Middle East Region. Sustainability 2017, 9, 43. [CrossRef]4. Richardson, B.C. Sustainable transport: Analysis frameworks. J. Transp. Geogr. 2005, 13, 29–39. [CrossRef]5. Ogryzek, M.; Wisniewski, R.; Kauko, T. On Spatial Management Practices: Revisiting the «optimal» Use of
Urban Land. Real Estate Manag. Valuat. 2018. [CrossRef]6. Miller, P.; de Barros, A.G.; Kattan, L.; Wirasinghe, S.C. Public transportation and sustainability: A review.
KSCE J. Civ. Eng. 2016, 20, 1076–1083. [CrossRef]7. Wolny, A.; Ogryzek, M.; Zróbek, R. Towards Sustainable Development and Preventing
Exclusions—Determining Road Accessibility at the Sub-Regional and Local Level in Rural Areas of Poland.Sustainability 2019, 11, 4880. [CrossRef]
8. Griskeviciute-Geciene, A.; Griškeviciene, D. The Influence of Transport Infrastructure Development onSustainable Living Environment in Lithuania. Procedia Eng. 2016, 134, 215–223. [CrossRef]
Sustainability 2020, 12, 8274 12 of 14
9. Linneker, B.J.; Spence, N.A. An Accessibility Analysis of the Impact of the M25 London Orbital Motorwayon Britain. Reg. Stud. 1992, 26, 31–47. [CrossRef]
10. Taylor, M.A.P.; Sekhar, S.V.C.; D’Este, G.M. Application of accessibility based methods for vulnerabilityanalysis of strategic road networks. Netw. Spat. Econ. 2006, 6, 267–291. [CrossRef]
11. López, E.; Gutiérrez, J.; Gómez, G. Measuring regional cohesion effects of large-scale transport infrastructureinvestments: An accessibility approach. Eur. Plan. Stud. 2008, 16, 277–301. [CrossRef]
12. Marks-Bielska, R.; Kurowska, K. Institutional Efficiency of Communes in Poland in Respect of SpaceManagement. In Proceedings of the International Multidisciplinary Scientific GeoConference SurveyingGeology and Mining Ecology Management, SGEM, Albena, Bulgaria, 29 June–5 July 2017.
13. Oliveira, E. Land Ownership and Land Use Development: The Integration of Past, Present, and Future inSpatial Planning and Land Management Policies. Landsc. J. 2017. [CrossRef]
14. Banister, D. The sustainable mobility paradigm. Transp. Policy 2008, 15, 73–80. [CrossRef]15. Tolley, R. Sustainable Transport, 1st ed.; Elsevier: Amsterdam, The Netherlands, 2003; ISBN 9781855736146.16. Steg, L.; Gifford, R. Sustainable transportation and quality of life. J. Transp. Geogr. 2005. [CrossRef]17. Valiantis, M. Sustainable urban transport. In Sustainability behind Sustainability; Nova Science: Hauppauge,
NY, USA, 2014; ISBN 9781633215955.18. Roth, A.; Kåberger, T. Making transport systems sustainable. J. Clean. Prod. 2002. [CrossRef]19. Kowalczyk, C.; Kil, J.; Kurowska, K. Dynamics of development of the largest cities—Evidence from Poland.
Cities 2019, 89, 26–34. [CrossRef]20. Pucher, J.; Buehler, R. Cycling towards a more sustainable transport future. Transp. Rev. 2017, 37, 689–694.
[CrossRef]21. Ogryzek, M.; Klimach, A.; Niekurzak, D.; Pietkiewicz, M. Using cartographic documents to provide
geoinformation on the rights to real estate—Taking Poland as an example. ISPRS Int. J. Geo-Inf. 2019, 8, 530.[CrossRef]
22. Kowalczyk, C. Dynamics of Changes in the Urban Space. In Proceedings of the 9th International Conferenceon Environmental Engineering, ICEE 2014, Vilnius, Lithuania, 22–24 May 2014.
23. Litman, T. Sustainable Transportation Indicators: A Recommended Research Program for DevelopingSustainable Transportation Indicators and Data. In Proceedings of the Transportation Research Board,Washington, DC, USA, 11–15 January 2009.
24. Livingstone, K.; Rogers, R. Housing for a Compact City; Greater London Authority: London, UK, 2003.25. Goldman, T.; Gorham, R. Sustainable urban transport: Four innovative directions. Technol. Soc. 2006, 28,
261–273. [CrossRef]26. O’Brien, O.; Cheshire, J.; Batty, M. Mining bicycle sharing data for generating insights into sustainable
transport systems. J. Transp. Geogr. 2014. [CrossRef]27. Badland, H.; Hickey, S.; Bull, F.; Giles-Corti, B. Public transport access and availability in the RESIDE study:
Is it taking us where we want to go? J. Transp. Health 2014, 1, 45–49. [CrossRef]28. Schneider, R.J. Theory of routine mode choice decisions: An operational framework to increase sustainable
transportation. Transp. Policy 2013. [CrossRef]29. Zhang, L.; Zhang, J.; Duan, Z.Y.; Bryde, D. Sustainable bike-sharing systems: Characteristics and
commonalities across cases in urban China. J. Clean. Prod. 2015. [CrossRef]30. Ogryzek, M. NoSustainable transport as a tool for the implementation of stable communication development.
In Some Aspects of the Warmia-Mazury Road Safety System; Chmielinski, B., Zukowska, J., Eds.; Publisher UWM:Olsztyn, Poland, 2017.
31. Chapman, L. Transport and climate change: A review. J. Transp. Geogr. 2007. [CrossRef]32. Leung, D.Y.C.; Caramanna, G.; Maroto-Valer, M.M. An overview of current status of carbon dioxide capture
and storage technologies. Renew. Sustain. Energy Rev. 2014, 39, 426–443. [CrossRef]33. Fallahpour, A.; Udoncy Olugu, E.; Nurmaya Musa, S.; Yew Wong, K.; Noori, S. A decision support model for
sustainable supplier selection in sustainable supply chain management. Comput. Ind. Eng. 2017. [CrossRef]34. Luthra, S.; Govindan, K.; Kannan, D.; Mangla, S.K.; Garg, C.P. An integrated framework for sustainable
supplier selection and evaluation in supply chains. J. Clean. Prod. 2017. [CrossRef]35. Kenworthy, J.R. The eco-city: Ten key transport and planning dimensions for sustainable city development.
Environ. Urban 2006. [CrossRef]36. Gössling, S. Urban transport transitions: Copenhagen, city of cyclists. J. Transp. Geogr. 2013. [CrossRef]

Sustainability 2020, 12, 8274 13 of 14
37. Köhler, J. Globalization and Sustainable Development: Case Study on International Transport and SustainableDevelopment. J. Environ. Dev. 2014, 23, 66–100. [CrossRef]
38. Pojani, D.; Stead, D. Sustainable urban transport in the developing world: Beyond megacities. Sustainability2015, 7, 7784. [CrossRef]
39. Hickman, R.; Hall, P.; Banister, D. Planning more for sustainable mobility. J. Transp. Geogr. 2013. [CrossRef]40. Bamwesigye, D.; Hlavackova, P. Analysis of sustainable transport for smart cities. Sustainability 2019, 11,
2140. [CrossRef]41. Malasek, J. ScienceDirect A set of tools for making urban transport more sustainable. Transp. Res. Procedia
2016, 14, 876–885. [CrossRef]42. Loidl, M.; Wallentin, G.; Cyganski, R.; Graser, A.; Scholz, J.; Haslauer, E. GIS and transport
modeling-strengthening the spatial perspective. ISPRS Int. J. Geo-Infor. 2016, 5, 84. [CrossRef]43. Ogryzek, M.; Ciski, M. Cartographic Methods of Presentation the Average Transaction Prices of the
Undeveloped Land. Civ. Environ. Eng. Rep. 2018. [CrossRef]44. Gardner, M. Fractal Music, Hypercards, and More . . . : Mathematical Recreations from Scientific American; W.H.
Freeman & Co.: New York, NY, USA, 1992.45. Derrible, S.; Kennedy, C. Applications of graph theory and network science to transit network design.
Transp. Rev. 2011. [CrossRef]46. Mattsson, L.G.; Jenelius, E. Vulnerability and resilience of transport systems—A discussion of recent research.
Transp. Res. Part A Policy Pract. 2015. [CrossRef]47. Rodrigue, J.-P.; Comtois, C.; Slack, B. Graph theory: Measures and indices. In The Geography of Transport
Systems, 4th ed.; Routledge: London, UK, 2013.48. Kininmonth, S.J.; De’ath, G.; Possingham, H.P. Graph theoretic topology of the Great but small Barrier Reef
world. Theor. Ecol. 2010. [CrossRef]49. Tovar, B.; Hernández, R.; Rodríguez-Déniz, H. Container port competitiveness and connectivity: The Canary
Islands main ports case. Transp. Policy 2015. [CrossRef]50. Tsekeris, T.; Souliotou, A.Z. Graph-theoretic evaluation support tool for fixed-route transport development
in metropolitan areas. Transp. Policy 2014. [CrossRef]51. Patarasuk, R. Road network connectivity and land-cover dynamics in Lop Buri province, Thailand. J. Transp.
Geogr. 2013. [CrossRef]52. Etherington, T.R. Mapping organism spread potential by integrating dispersal and transportation processes
using graph theory and catchment areas. Int. J. Geogr. Inf. Sci. 2012. [CrossRef]53. Sadavare, A.B.; Kulkarni, R.V. A Review of Application of Graph Theory for Network. Int. J. Comput. Sci.
Inf. Technol. 2012.54. Torslov, N. Traffic in Copenhagen 2009; Copenhagen Traffic Department: Copenhagen, Denmark, 2010.55. The City of Copenhagen. Copenhagen’s Green Accounts; The City of Copenhagen: Copenhagen, Denmark, 2010.56. The City of Copenhagen. City of Cyclists—Copenhagen Bicycle Life; City of Copenhagen: Copenhagen,
Denmark, 2009.57. Transport for London. Travel in London Report; Transport for London: London, UK, 2013.58. Britton, E.; Gant, R.; Matthews, B. World Transport Policy & Practice World Transport Policy & Practice.
World Transp. Policy Pract. 2002, 2, 6–27.59. Hamilton-Baillie, B. Urban design: Why don’t we do it in the road? Modifying traffic behavior through
legible urban design. J. Urban Technol. 2004, 11, 43–62. [CrossRef]60. Jäppinen, S.; Toivonen, T.; Salonen, M. Modelling the potential effect of shared bicycles on public transport
travel times in Greater Helsinki: An open data approach. Appl. Geogr. 2013. [CrossRef]61. Bachand-Marleau, J.; Lee, B.; El-Geneidy, A. Better understanding of factors influencing likelihood of using
shared bicycle systems and frequency of use. Transp. Res. Rec. 2012. [CrossRef]62. Kennedy, C.; Miller, E.; Shalaby, A.; MacLean, H.; Coleman, J. The four pillars of sustainable urban
transportation. Transp. Rev. 2005. [CrossRef]63. Taniguchi, E. Concepts of City Logistics for Sustainable and Liveable Cities. Procedia Soc. Behav. Sci. 2014.
[CrossRef]64. Gössling, S. Urban transport justice. J. Transp. Geogr. 2016. [CrossRef]65. Cullinae, K.; Cosgrove, T. Smarter Travel in Six European Cities; University of Limerick: Limerick, Ireland, 2010.

Sustainability 2020, 12, 8274 14 of 14
66. Tanczos, K.; Torok, A. Linear optimization model of urban areas’ operating efficiency. Transport 2007, 22,225–228. [CrossRef]
67. Turskis, Z.; Zavadskas, E.K.; Zagorskas, J. Sustainable City Compactness Evaluation on the Basis of Gis andBayes Rule. Int. J. Strateg. Prop. Manag. 2006, 10, 185–207. [CrossRef]
68. Jakimavicius, M.; Burinskiene, M. Susisiekimo sistemos analize ir rangavimas vilniaus miesto transportorajonuose naudojant gis. Technol. Econ. Dev. Econ. 2009, 15, 39–48. [CrossRef]
69. Bogart, W.T.; Ferry, W.C.; Bogart, W.T.; Ferry, W.C. Employment Centres in Greater Cleveland: Evidence ofEvolution in a Formerly Monocentric City. Urban Stud. 1999, 36, 2099–2110. [CrossRef]
70. Jakimavicius, M.; Burinskiene, M. Assessment of Vilnius city development scenarios based on transportsystem modelling and multicriteria analysis. J. Civ. Eng. Manag. 2009, 15, 361–368. [CrossRef]
71. Abukauskas, N.; Sivilevicius, H.; Puodžiukas, V.; Lingyte, I. Road safety improvement on at-gradeintersections. Balt. J. Road Bridg. Eng. 2013, 8, 212–219. [CrossRef]
72. Klibavicius, A.; Paliulis, G.M. Increasing the capacity of intersections by short traffic lanes. Transport 2012,27, 67–72. [CrossRef]
73. Vilnius Metro. Available online: www.vilniausmetro.lt (accessed on 4 October 2020).74. Wolny, A.; Ogryzek, M.; Zróbek, R. Challenges, Opportunities and Barriers to Sustainable Transport
Development in Functional Urban Areas. In Proceedings of the 10th International Conference onEnvironmental Engineering, ICEE 2017, Vilnius, Lithuania, 27–28 April 2017.
© 2020 by the authors. Licensee MDPI, Basel, Switzerland. This article is an open accessarticle distributed under the terms and conditions of the Creative Commons Attribution(CC BY) license (http://creativecommons.org/licenses/by/4.0/).