
An Efficient Framework for Prediction in Healthcare Data Using Soft Computing Techniques
12
An Efficient Framework for Prediction in Healthcare Data using Soft Computing Techniques Veena H Bhat 1,2 , Krishna S 1 , Prasanth G Rao 3 , P Deepa Shenoy 1 , Venugopal K R 1 , L M Patnaik 4 , 1 Department of Computer Science and Engineering, University Visvesvaraya College of Engineering, Bangalore, India 2 IBS-Bangalore, Bangalore, India 3 Research Scholar, Bangalore, India 4 Vice Chancellor, Defense Institute of Advanced Technology, Pune, India {veena.h.bhat, krishna.somandepalli, prasanthgrao}@gmail.com, [email protected] Abstract. Healthcare organizations aim at deriving valuable insights employing data mining and soft computing techniques on the vast data stores that have been accumulated over the years. This data however, might consist of missing, incorrect and most of the time, incomplete instances that can have a detrimental effect on the predictive analytics of the healthcare data. Preprocessing of this data, specifically the imputation of missing values offers a challenge for reliable modeling. This work presents a novel preprocessing phase with missing value imputation for both numerical and categorical data. A hybrid combination of Classification and Regression Trees (CART) and Genetic Algorithms to impute missing continuous values and Self Organizing Feature Maps (SOFM) to impute categorical values is adapted in this work. Further, Artificial Neural Networks (ANN) is used to validate the improved accuracy of prediction after imputation. To evaluate this model, we use PIMA Indians Diabetes Data set (PIDD), and Mammographic Mass Data (MMD). The accuracy of the proposed model that emphasizes on a preprocessing phase is shown to be superior over the existing techniques. This approach is simple, easy to implement and practically reliable. Keywords: Imputation, soft computing, categorical data, continuous data. 1 Introduction Quality of the data under study plays a pivotal role in the accuracy of modeling using data mining techniques and predictive analytics. The objective of data mining is to find patterns in the data that gives accurate outcomes with newer, unseen cases. In healthcare databases, a huge number of recorded samples are used to analyze characteristic hidden patterns; the validity of the model is verified by comparing the outcome of the model for an unseen case and its corresponding medical expert opinion. In the real world, data has a cost attached to it, especially in the field of medical diagnostics. The medical experiments conducted to record data are expensive, often repetitive and invasive in nature, which sometimes might increase the threat on the
-
Upload
icfaibusiness -
Category
Documents
-
view
2 -
download
0
Transcript of An Efficient Framework for Prediction in Healthcare Data Using Soft Computing Techniques
An Efficient Framework for Prediction in Healthcare
Data using Soft Computing Techniques
Veena H Bhat1,2, Krishna S1, Prasanth G Rao
3, P Deepa Shenoy1,
Venugopal K R1, L M Patnaik
4,
1 Department of Computer Science and Engineering, University Visvesvaraya College of
Engineering, Bangalore, India 2 IBS-Bangalore, Bangalore, India
3Research Scholar, Bangalore, India 4 Vice Chancellor, Defense Institute of Advanced Technology, Pune, India
{veena.h.bhat, krishna.somandepalli, prasanthgrao}@gmail.com, [email protected]
Abstract. Healthcare organizations aim at deriving valuable insights employing
data mining and soft computing techniques on the vast data stores that have
been accumulated over the years. This data however, might consist of missing,
incorrect and most of the time, incomplete instances that can have a detrimental
effect on the predictive analytics of the healthcare data. Preprocessing of this
data, specifically the imputation of missing values offers a challenge for reliable
modeling. This work presents a novel preprocessing phase with missing value
imputation for both numerical and categorical data. A hybrid combination of
Classification and Regression Trees (CART) and Genetic Algorithms to impute
missing continuous values and Self Organizing Feature Maps (SOFM) to
impute categorical values is adapted in this work. Further, Artificial Neural
Networks (ANN) is used to validate the improved accuracy of prediction after
imputation. To evaluate this model, we use PIMA Indians Diabetes Data set
(PIDD), and Mammographic Mass Data (MMD). The accuracy of the proposed
model that emphasizes on a preprocessing phase is shown to be superior over
the existing techniques. This approach is simple, easy to implement and
practically reliable.
Keywords: Imputation, soft computing, categorical data, continuous data.
1 Introduction
Quality of the data under study plays a pivotal role in the accuracy of modeling using
data mining techniques and predictive analytics. The objective of data mining is to
find patterns in the data that gives accurate outcomes with newer, unseen cases. In
healthcare databases, a huge number of recorded samples are used to analyze
characteristic hidden patterns; the validity of the model is verified by comparing the
outcome of the model for an unseen case and its corresponding medical expert
opinion.
In the real world, data has a cost attached to it, especially in the field of medical
diagnostics. The medical experiments conducted to record data are expensive, often
repetitive and invasive in nature, which sometimes might increase the threat on the

patient’s life, hence not repeatable. Therefore it is of utmost importance to have
reliable and cost efficient methods to reuse data and give an opinion to the patient
without much medical re-experimentation but using simple software that holds the
simulated statistical model.
Cabena et al., [1] in their work estimate that about 20% of the efforts are spent on
problem identification, about 60% on data preparation and data preprocessing while
the rest about 20% for data mining and knowledge discovery; which definitely
upholds the importance of data preprocessing. Missing values or missing data in any
database, especially in a healthcare data set is often an indelible hurdle for efficient
analyses. Such missing values can occur due to non response or a simple missed
entry. This reduces the representativeness of the sample thus distorting the inferences
drawn. The presence of missing values at rates less than 1% are generally considered
trivial, 1-5% manageable, 5-15% require sophisticated methods to handle the missing
values and more than 15% severely affect any kind of interpretation [2].
Soft computing techniques aim at improving quality of data by reducing
imprecision and uncertainty employing approximate reasoning and logic, in order to
achieve tractability, robustness and low cost solutions. Popular methods include
neural networks, swarm intelligence, rough sets, fuzzy logic and genetic algorithms.
This work proposes a novel modeling methodology, specifically for healthcare data
which is chosen so as to contain continuous, categorical, numeric alongside textual
data as variables in the several attributes considered. The data is chosen so as include
instances of missing values which are imputed using separate approaches for
continuous and categorical data. The proposed methodology for imputation is
validated for prediction accuracy, using Artificial Neural Networks (ANN) as the
classifier. Results show considerable improvement in the accuracy of the proposed
model as against other techniques in vogue.
Section 2 outlines the related work. The motivation to carry out this work is
explained in section 3. To make this paper self-contained we have described the data
set details in section 4. The framework proposed for data preprocessing is explained
in detail in section 5. Section 6 describes the implementation of the entire model – the
preprocessing framework along with the prediction model. Results and performance
analyses are described in section 7. Conclusions and future work is given in section 8.
2 Literature Survey
Reference [3] details the three rules any effective imputation model should follow –
retaining the data distribution, the relationship between the attributes and cost-time
efficiency. Some of the predominant methods for imputation include Mean
Imputation (MI), Regression Imputation, C4.5 and k-Nearest Neighbor (k-NN) [1, 4,
5, 6, 14]. The PIMA data set has been explored by researchers, applying many data
mining techniques. In the previous works adopting neural networks [7,8,9] and other
classifiers [12, 13, 15] in the prediction modeling stage, the accuracy in predicting the
diabetes status ranges from 66% to 82.29%. Works related with Mammographic Mass
Data (MMD) have reported prediction accuracy upto 80.9% [10]. Most of the
research works either work on complete instances or ignore the tuples with attribute
values set to zero [7, 8] while [9] considers data instances of PIDD (to predict
continuous values) with an equal mix of patients who had diabetes onset and patients
who were non-diabetic, but with attributes that contained missing/incorrect values.
In this work, the data sets selected have missing value range (incorrect value) of
4% to 48%. The proposed framework is aimed at achieving a cost effective
imputation method to assess the accuracy of the imputed values at each iteration. A
prediction model is then constructed which works on the corrected data, which now
neither has missing values or incorrect values. Further the accuracy of the model is
established and analyzed using various parameters as explained in section 7.
3 Motivation
Today, healthcare information systems amass a large volume of digital data in various
forms, but the analyses of such data for preventive diagnosis; prediction of disease
transmission and epidemic outbreaks is not frequent. Analyzing healthcare data for an
efficient patient-care and tracking the patients’ records that include critical parameters
such as medicine intake or dosage may give a peek into the long term effects that
could be caused by a particular diagnostic tool or treatment. An intelligent, robust and
reliable prediction model could help in the identification of this kind of analyses and
predicting long-term probable health issues. This could also help the doctors or other
health coordinators who oversee the treatment of a certain patient to give quality
diagnosis and help identify the changes in the lifestyle that may be necessary in the
patient’s routine to prevent short and long term health complexities caused by an
illness. Though several models for such prediction and analyses are in vogue, a robust
and reliable model that predicts with a good accuracy even when the attributes include
missing and erroneous values is a challenge. In this work we propose a solution to
such analyses by employing various soft computing techniques in preprocessing the
data to impute both categorical and numerical missing values that further improves
accuracy of the prediction.
4 Data Set Details
The data sets selected for building the predictive model are PIMA Indian Diabetes
Data (PIDD) set and the Mammographic Mass Data (MMD) from the Machine
Learning Database Repository at the University of California, Irvine. These data sets
may be downloaded from [11].
As per previous studies, Pima Indians may be genetically predisposed to diabetes
and it was noted that their diabetic rate was 19 times that of any typical town. The
National Institute of Diabetes and Digestive and Kidney Diseases of the NIH
originally owned the PIDD and was received by UC-Irvine Machine Learning
Repository in 1990. The data set contains 768 patient data records and each record is
described by 8 attributes, while the 9th attribute associates the class attribute that is a
label indicating the onset of diabetes within 5 years. A ‘0’ indicates the onset and ‘1’
indicates non-occurrence of diabetes. This data constitutes of female patients of age
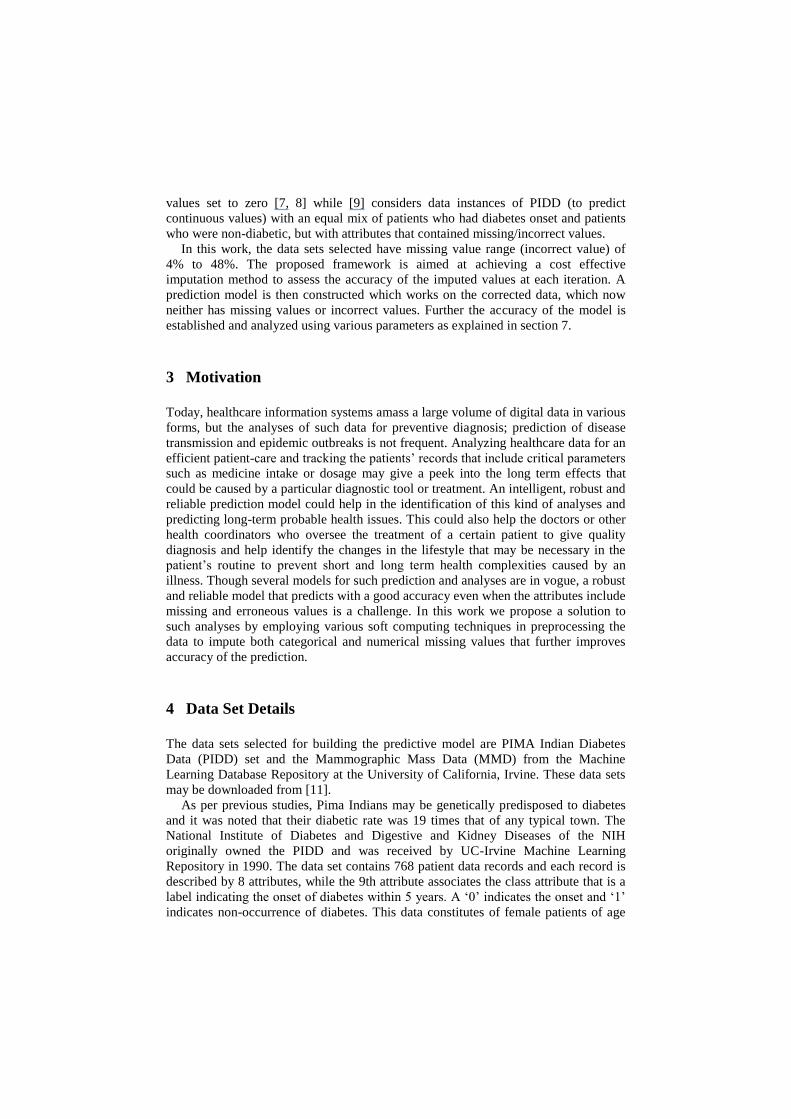
21 years and above belonging to the Pima Indian heritage. This population lives near
Phoenix, Arizona, USA.
(a) (b)
Fig. 1. Boxplots of the PIDD attribute values before and after soft computing preprocessing.
The Mammographic Mass Data (MMD) was received by UC-Irvine Machine
Learning Repository in 2007. This data set contains the Breast Imaging–Reporting
and Data Systems (BI-RADS) assessment and the patient’s age related data for 916
instances that have been identified on full field digital mammograms collected at the
Institute of Radiology of the University Erlangen-Nuremberg between 2003 and 2006.
The data is categorical in nature with BI-RADS assessment ranging from 1 (definitely
benign) to 5 (highly suggestive malignancy) assigned in a double-review process by
physicians. The data has a total of 5 attributes with the 6th attribute being the severity
(benign = 0, malignant = 1). The age of the patient is an integer (maximum value
being 96 and minimum 18), the shape of the mass takes values ranging from 1 to 4
(where round=1 oval=2 lobular=3 irregular=4), the mass margin takes values from 1
to 5 (where circumscribed=1 microlobulated=2 obscured=3 ill-defined=4
spiculated=5) and mass density being ordinal, takes values from 1 to 4 (high=1 iso=2
low=3 fat-containing=4).
Data sets are usually explored either graphically or analytically. The quality of data
being explored is an important aspect considering presence of missing and/or outlier
values. These affect the pattern recognition and predictive analyses of the data being
mined. Several methods are used to handle the noisy and missing data like replacing
the incorrect values with ‘mean’ of the variables in the attribute, its ‘median’ or
sometimes user defined values. The visualization methodology adopted in this work
for data exploration is illustrated in Fig. 1(a) employing boxplots that are obtained
from PIDD. This boxplot indicates the quartiles, median besides the outlier values for
each attribute.
The Pima Indian Diabetes Data (PIDD) set when examined manually, is observed
to contain few incorrect values for specific attributes, as listed in Table 1. PIDD
includes 500 non-diabetic patients (class = negative; ‘0’) and 268 diabetic patients
(class = positive; ‘1’) giving an incidence rate of 34.9%. Thus if a random classifier is
used for prediction for all instances as belonging to negative class (that is all instances
being predicted negative) then accuracy of such a model would be 65.1% (or an error
rate of 34.9%). Using this simple strategy of selecting tuples that contain complete
and correct data values, we statistically represent the data selected, using the boxplot

to aid analysis of the data.
Table 1. Attribute-value study outcome, indicating attributes with incorrectly present values
for PIDD set.
Sl. No. Attribute Name
No. of `Zero’ value
instances for attributes
listed, present out of 768
tuples.
1 Plasma glucose concentration, in 2 hours, in
an oral glucose tolerance test
5
2 Diastolic blood pressure (mm Hg) 35
3 Triceps skin fold thickness (mm) 227
4 2-hour serum insulin (mu U/ml) 374
5 Body mass index (weight in kg/(height in
m)2)
11
Mammographic Mass Data (MMD), consists of 916 instances, that include 516
instances of benign (class = negative; ‘0’) and 445 instances of malignant masses
(class = positive; ‘1’), with an incidence rate of 48.58%. In this particular data set,
the attribute that requires imputation is ‘density’ as this attribute shows the highest
number of missing or erroneous value shown in Table 2.
Table 2. Attribute-value study outcome, indicating attributes with incorrectly present values for
MMD.
Sl.No. Attribute Name
No. of `-1’ value
instances for attributes
listed, present out of
961 tuples.
1. BI-RADS assessment 2
2. Age 5
3. Shape 31
4. Margin 48
5. Density 76
5 Proposed Data Preprocessing Framework
The data imputation framework provides a reliable solution to both continuous and
categorical missing values. This makes the proposed model unique and self-
contained. PIDD data is used to demonstrate the imputing of continuous values where
as MMD set is identified to impute categorical values.

5.1 Proposed approach to impute continuous missing values
A regression model, using Classification and Regression Trees (CART), is
developed, using tuples that have complete and correct values for all its attributes.
These tuples constitute the training set for the model. Further, the instances that would
need values to be imputed are input to this model. The set of outliers of the original
data is compared with the set of generated outlier values.
A second order quadratic error function is generated. Genetic Algorithms is used to
optimize the error function in any given domain. Using a Genetic Algorithm function
call, we find a local unconstrained minimum, x, to the objective function, fitnessfcn.
x = ga(fitnessfcn, nvars) (1)
nvars is the dimension (number of design variables) of fitnessfcn. The objective
function, fitnessfcn, accepts a vector x of size 1-by-nvars, and returns a scalar
evaluated at x. The predicted value for the incorrect or missing value is corrected
using this optimization through genetic algorithms. The proposed module to impute
categorical values is illustrated in Fig. 2.
Fig. 2. Module to impute continuous values.
PIDD set contains missing/incorrect value ranging from 4% (taking only the
records or instance containing zero values to the attribute –‘diastolic blood pressure’)
to 48% (taking only the records or instances containing zero values to the attribute –
‘2 hour serum insulin presence’). This work implements the proposed data
preprocessing framework, to impute continuous values, for the attribute ‘2-hour
serum insulin’ (with 48% incorrect values). A box-plot is once again employed to
inspect the mean and the outliers in the data, for any further improvement shown as
shown in Fig 1(b). The attribute ‘2-hour serum insulin’ is represented by column five
Select data-subset
without any
missing values
out
Build regression
model to impute
missing values
Compute error
function for
predicted values
Optimize error
function using
Genetic Algorithm
Impute value
correction
Completed
data set, imputing
continuous values
in the boxplots which indicates the differences before and after the imputation
process.
The now ‘complete’ data set (with respect to the attribute ‘2 hour serum insulin
presence’) with an optimized error is ready to be used for predictive analytics.
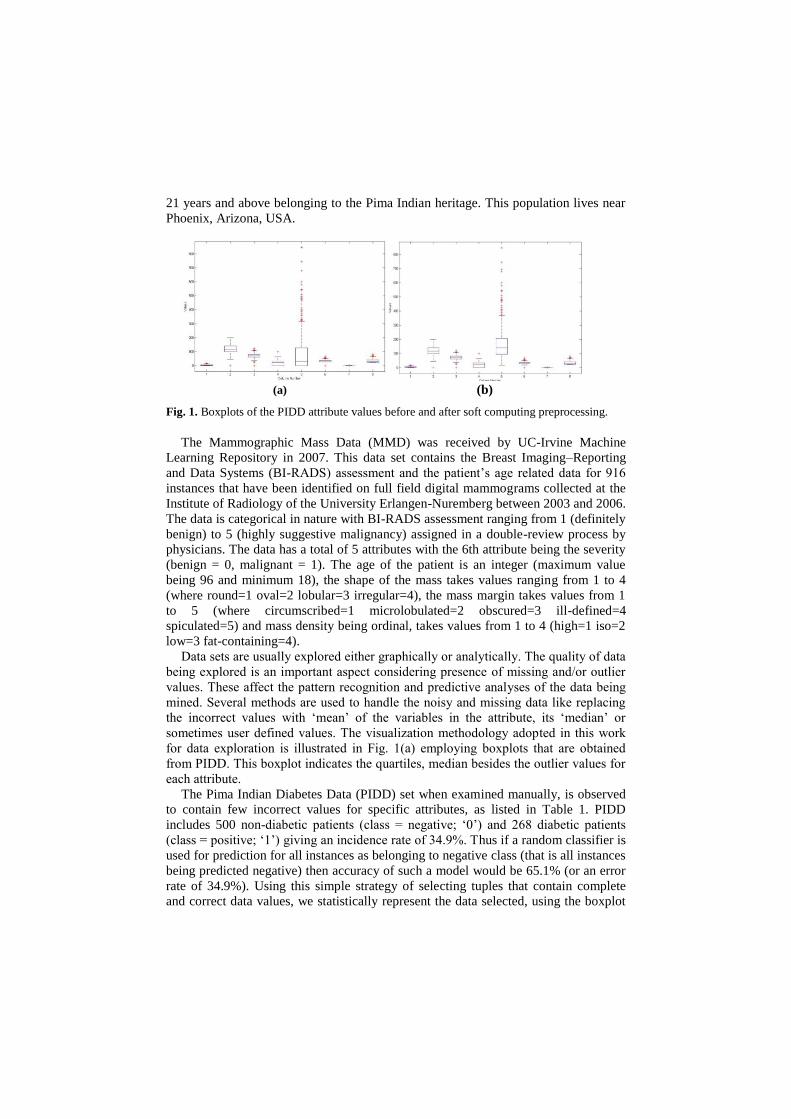
5.2 Proposed approach to impute categorical missing values
With the exception of the attribute ‘age’ (continuous), the nature of all other
attributes of MMD is categorical. Hence a model that identifies and detects the
regularities and correlations between these input functions is one of the crucial steps
of this framework.
Fig. 3. Module to impute categorical values.
The technique of Self Organizing Feature Maps (SOFM) is selected to model the
complete instances of the MMD, as the neurons of the competitive network learn to
recognize the groups of similar vector inputs. SOFM is trained using the complete
tuples. Learning Vector Quantization (LVQ) method is used for supervised training of
the competitive layers. The instances that include erroneous values are input to the
thus simulated model, for classification. The co-ordinates of the classification,
deduced from the simulated SOFM, is used to map the value to be imputed, using the
mode of the values. The proposed module to impute categorical values is illustrated in
Fig. 3.
The imputation of categorical data was experimented using MMD, wherein the
data set contains missing/erroneous value ranging from 0.2% to 7.9%. The attribute
selected from imputation is ‘density of the mass’, which had the highest error
percentage in the data of 7.9%. The MMD data is input to the proposed framework to
impute categorical values, using the SOFM concept.
The completed data set where the data was imputed for the attribute ‘density of the
mass’ alone, is now ready to be tested on the prediction model, where multi-layer
perceptron neural network is selected as the classifier.
Select data-subset
without any
missing values
out
Build SOFM
model to impute
missing values
Classify the
instances with
incorrect values
using the SOFM
model
Get the
coordinates of the
classified
instances
Impute value
correction using
the mode
Completed
data set, imputing
categorical values

6 Prediction Model
The architecture of the proposed model is depicted in Fig. 4. Artificial Neural
Networks (ANN), a supervised learning data mining approach, is selected as the
classifier as it is sensitive to non-linear input values and high on prediction efficiency.
The preprocessed data, worked on: as per the proposed preprocessing framework is
input to the prediction model. The output statistics from the proposed model is
discussed in section 7.
Fig. 4. Overview of the Prediction Model with Preprocessing Implemented.
7 Performance Analysis
The parameters used to evaluate the performance of the prediction model are the
accuracy, sensitivity and specificity, Receiver Operating Characteristic (ROC) and
Area under ROC (AUR). Accuracy measures the proportion of true results in a test.
Sensitivity or true positive rate, measures the proportion of actual positives which are
correctly identified while specificity, the true negative rate, measures the proportion
of negatives which are correctly identified. Receiver Operating Characteristic (ROC)
curves have been used to compare the performances of different predictive models
based on the input data set. Comparison in terms of the AUR, gives an insight to the
performance of the classifier over an entire range of values and is independent of the
GA + error
correction
used to
impute values
Identify the data type of the attribute to be
imputed
Data source
(PIDD/MMD)
Neural Network
Prediction
Model
Prediction
model output
on the imputed data
Categorical Continuous
Values Values
Use SOFM
to impute
values Complete
Data set
prevalence of the condition unlike the accuracy, which weights sensitivity and
specificity in proportion to their prevalence.
The PIDD set, when used without any preprocessing, as input to a neural networks
prediction model exhibits an accuracy of 75.82%.
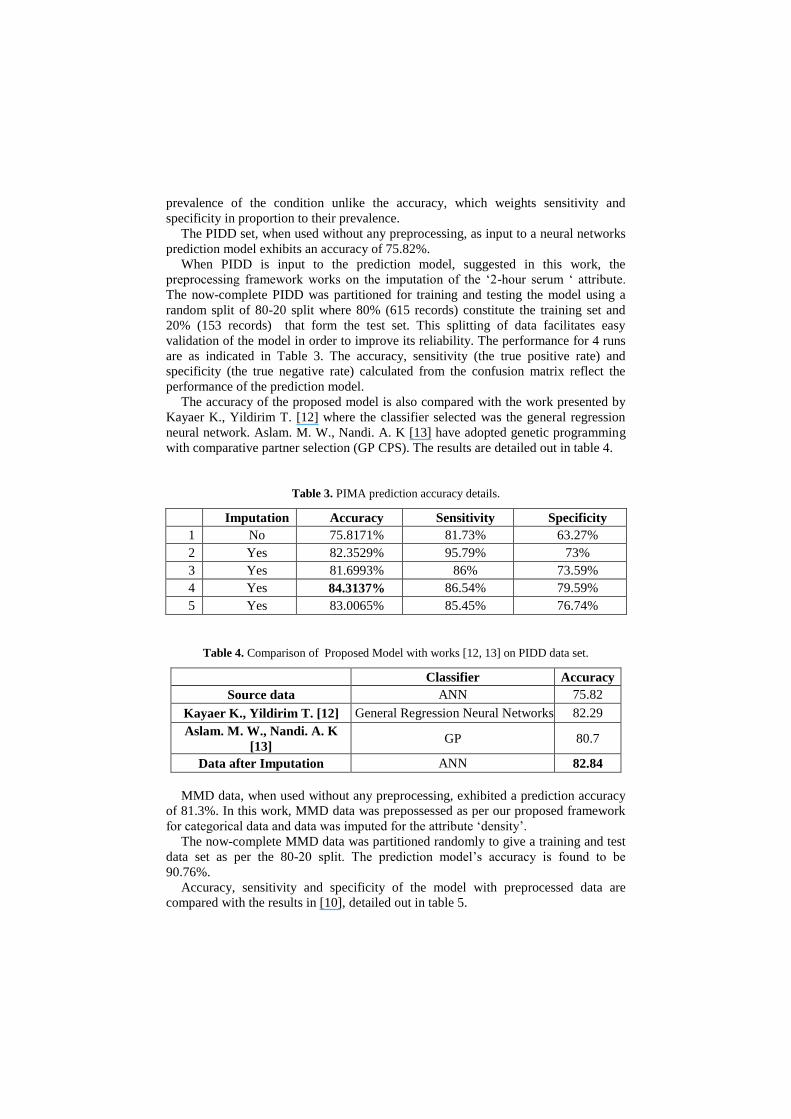
When PIDD is input to the prediction model, suggested in this work, the
preprocessing framework works on the imputation of the ‘2-hour serum ‘ attribute.
The now-complete PIDD was partitioned for training and testing the model using a
random split of 80-20 split where 80% (615 records) constitute the training set and
20% (153 records) that form the test set. This splitting of data facilitates easy
validation of the model in order to improve its reliability. The performance for 4 runs
are as indicated in Table 3. The accuracy, sensitivity (the true positive rate) and
specificity (the true negative rate) calculated from the confusion matrix reflect the
performance of the prediction model.
The accuracy of the proposed model is also compared with the work presented by
Kayaer K., Yildirim T. [12] where the classifier selected was the general regression
neural network. Aslam. M. W., Nandi. A. K [13] have adopted genetic programming
with comparative partner selection (GP CPS). The results are detailed out in table 4.
Table 3. PIMA prediction accuracy details.
Imputation Accuracy Sensitivity Specificity
1 No 75.8171% 81.73% 63.27%
2 Yes 82.3529% 95.79% 73%
3 Yes 81.6993% 86% 73.59%
4 Yes 84.3137% 86.54% 79.59%
5 Yes 83.0065% 85.45% 76.74%
Table 4. Comparison of Proposed Model with works [12, 13] on PIDD data set.
Classifier Accuracy
Source data ANN 75.82
Kayaer K., Yildirim T. [12] General Regression Neural Networks 82.29
Aslam. M. W., Nandi. A. K
[13] GP 80.7
Data after Imputation ANN 82.84
MMD data, when used without any preprocessing, exhibited a prediction accuracy
of 81.3%. In this work, MMD data was prepossessed as per our proposed framework
for categorical data and data was imputed for the attribute ‘density’.
The now-complete MMD data was partitioned randomly to give a training and test
data set as per the 80-20 split. The prediction model’s accuracy is found to be
90.76%.
Accuracy, sensitivity and specificity of the model with preprocessed data are
compared with the results in [10], detailed out in table 5.
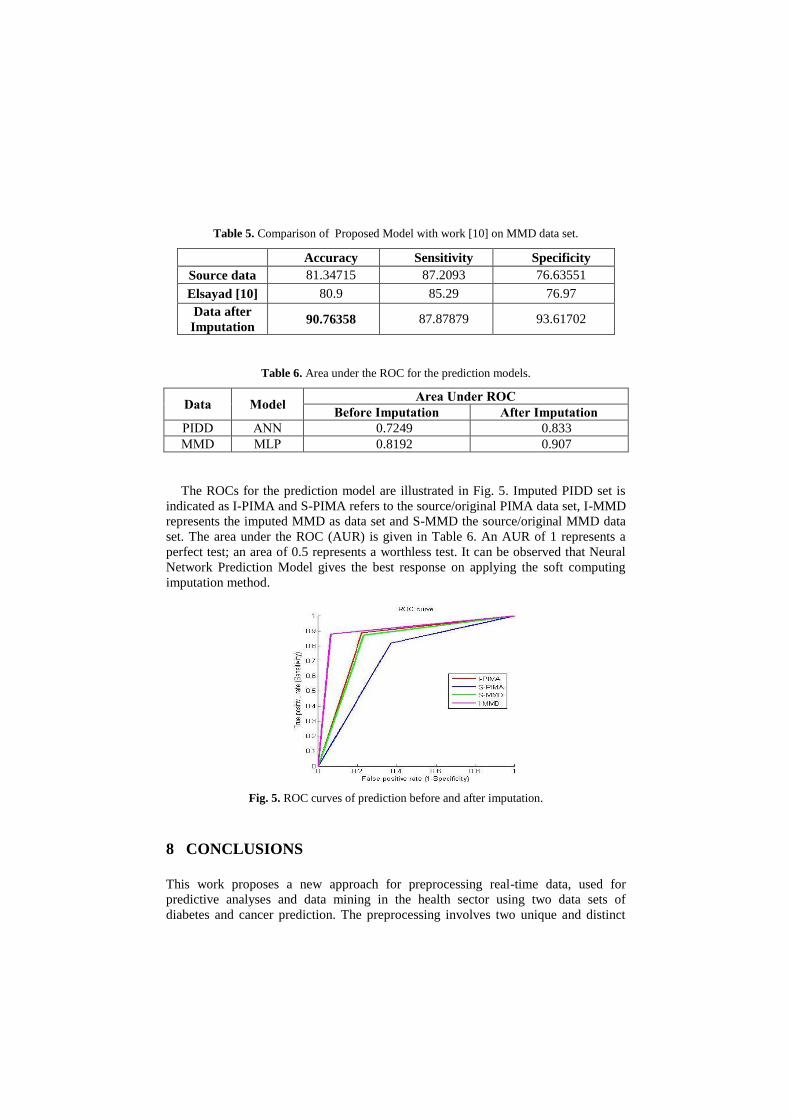
Table 5. Comparison of Proposed Model with work [10] on MMD data set.
Accuracy Sensitivity Specificity
Source data 81.34715 87.2093 76.63551
Elsayad [10] 80.9 85.29 76.97
Data after
Imputation 90.76358 87.87879 93.61702
Table 6. Area under the ROC for the prediction models.
Data Model Area Under ROC
Before Imputation After Imputation
PIDD ANN 0.7249 0.833
MMD MLP 0.8192 0.907
The ROCs for the prediction model are illustrated in Fig. 5. Imputed PIDD set is
indicated as I-PIMA and S-PIMA refers to the source/original PIMA data set, I-MMD
represents the imputed MMD as data set and S-MMD the source/original MMD data
set. The area under the ROC (AUR) is given in Table 6. An AUR of 1 represents a
perfect test; an area of 0.5 represents a worthless test. It can be observed that Neural
Network Prediction Model gives the best response on applying the soft computing
imputation method.
Fig. 5. ROC curves of prediction before and after imputation.
8 CONCLUSIONS
This work proposes a new approach for preprocessing real-time data, used for
predictive analyses and data mining in the health sector using two data sets of
diabetes and cancer prediction. The preprocessing involves two unique and distinct
processes, based on the data set considered for imputation. In case of continuous
values, CART along with optimization of the error function using a Genetic
Algorithm, maps the imputed values in a valid domain of values for each attribute.
The proposed model when tested with Pima Indian Diabetes Data set (PIDD) shows
an average accuracy of 82.84%, as against the accuracy of the prediction model when
built on data without preprocessing which is 75.816%. This improved prediction
accuracy fares superior to some of the other models in vogue. In case of categorical
values, Self Organizing Feature Maps is used to impute the selected attribute’s
incorrect values. The thus completed data is used to build the multi-layer-perceptron
model for prediction. The accuracy of the proposed model, when tested with the Mass
Mammographic Data (MMD) increased from 81.35% to 90.76%.
This framework has to be tested on similar health sector data, which tracks
ailments and the factors that influence the occurrence or recurrence of a particular
disease. The prepossessing steps that have been discussed here can be used on any
prediction model development framework, to impute missing, incorrect and
incomplete values. This approach being simpler to implement and results that are easy
to comprehend provides a reliable solution to real-time predictive analyses or other
problems that require imputation that could further contribute to the improvement of
performance of the model.
References
1. Cabena, P., Hadjinian, P., Stadler, R., Verhees, J., Zanasi, A.: Discovering Data Mining:
from Concepts to Implementation. Prentice Hall (1998).
2. Acuna, E., Rodriguez, C.: The Treatment of Missing Values and its Effect in the Classifier
Accuracy. In: Multiscale Methods in Science and Engineering, LNCS, pp. 639-647.
Springer Heilelberg (2004).
3. Peng, L., Lei, L.: A Review of Missing Data Treatment Methods. In: Intelligent
Information Management Systems and Technologies, vol. 1, no. 3, pp. 412-419 (2005).
4. Bhat, V. H., Rao, P. G., Shenoy, P. D., Venugopal, K. R., Patnaik, L. M. : An Efficient
Prediction Model for Diabetic Database using Soft Computing Techniques. LNCS, vol.
5908/2009, pp. 328-335. Springer Heilelberg (2009).
5. Mehala, B., Ranjit, J. T. P., Vivekanandan, K.: Selecting Scalable Algorithms to Deal with
Missing Values. In: International Journal of Recent Trends in Engineering, vol. 1, no. 2
(2009).
6. Batista, G. E. A. P. A., Monard, M. C.: K-Nearest Neighbour as Imputation Method.
Experimental Results. Tech. Report 186, ICMC-USP (2002)
7. Breault, J. L.: Data Mining Diabetic Databases: Are Rough Sets a Useful Addition?. In:
Artificial Intelligence in Medicine, Elsevier, vol. 27, pp. 227-236 (2003).
8. King, M. A., Elder IV J. F., et al.: Evaluation of Fourteen Desktop Data Mining Tools. In:
Proc. of IEEE International Conference on Systems, Man and Cybernetics, San Diego, CA
(1998).
9. Khan, A. H.: Multiplier-free Feedforward Networks. In: Proc. of the IEEE International
Joint Conference on Neural Networks (IJCNN), Honolulu, Hawaii, vol. 3, pp. 2698-2703
(2002).
10. Elsayad, A. M.: Predicting the Severity of Breast Masses with Ensemble of Bayesian
Classifiers. In: Journal of Computer Science, 6 (5), pp. 576-584 (2010).

11. Machine Learning Database Repository at the University of California, Irvine,
www.ics.uci.edu/mlearn/ MLRepository.
12. Kayaer, K., Yildirim, T.: Medical Diagnosis on Pima Indian Diabetes using General
Regression Neural Networks. In: Proc. of the International Conference on Artificial Neural
Networks/International Conference on Neural Information Processing, Istanbul, Turkey,
pp: 181-184 (2003).
13. Aslam., M. W., Nandi., A. K.: Detection of Diabetes using Genetic Programming. In: 18th
European Signal Processing Conference, Denmark, August, pp.1184-1188 (2010)
14. Magnani, M.: Techniques for Dealing with Missing Data in Knowledge Discovery Tasks.
By Department of Computer Science, University of Bologna (2004).
15. Est´ebanez, C., Aler, R., Jos´e, M.: Method Based on Genetic Programming for
Improving the Quality of Data Sets in Classification Problems. In: International Journal of
Computer Science and Applications, vol. 4, no. 1, pp. 69-80 (2007).