An East Asian Community? - Regional and Global Dynamics: What Do the Numbers Say
27
An East Asian Community? - Regional and Global Dynamics: What Do the Numbers Say? Subana Shanmuganathan Visiting Research Fellow Ritsumeikan Asia Pacific University RCAPS Working Paper No.07-2 August 2007 Ritsumeikan Center for Asia Pacific Studies (RCAPS), Ritsumeikan Asia Pacific University, URL: http://www.apu.ac.jp/rcaps/
Transcript of An East Asian Community? - Regional and Global Dynamics: What Do the Numbers Say

An East Asian Community? - Regional and
Global Dynamics: What Do the Numbers Say?
Subana Shanmuganathan Visiting Research Fellow
Ritsumeikan Asia Pacific University
RCAPS Working Paper No.07-2
August 2007
Ritsumeikan Center for Asia Pacific Studies (RCAPS), Ritsumeikan Asia Pacific University,
URL: http://www.apu.ac.jp/rcaps/

An East Asian Community? - Regional and
Global Dynamics: What Do the Numbers Say?
Subana Shanmuganathan
Abstract: The idea of developing an East Asian Economic Caucus or East Asian Community (EAC), first hatched in the late 1980s by the then Malaysian Prime Minster Mahathir Mohamed is yet to be realised. Until last year, the task of building an EAC through trade and investment remained elusive, hampered by a number of issues, however, at the fifth summit of the Asian Plus Three (APT), a vision for such a community was articulated. The APT leaders agreed that East Asia moves “from a region of nations to a bona fide regional community with shared challenges, common aspirations, and a parallel destiny”, underlying motivation for this stance being, a need for establishing a regional identity in view of the other existing regional arrangements, such as the European Union (EU), and North American nations. The obstacles in building an EAC are briefly outlined. Consequently, the paper elaborates upon the exploratory data analysis results achieved through clustering EA as well as other countries based on the World Bank and ASEAN Financial and Macroeconomic Surveillance Unit indicators to see how the numbers stack up with regards to the EAC building progress, its impact at individual country, regional and global levels as today’s society is becoming more familiar with quantitative measures, perhaps making one wonder if this is a reflection of the digital era we live in. The SOM country cluster results that are similar to that of the UN groupings based on millennium development goals (MDGs) are investigated by studying the SOM cluster profiles.
Introduction The idea of developing an “East Asian Economic Caucus”, first hatched in the late 1980s by the then Malaysian Prime Minster Mahathir Mohamed (Asian Economic News 2003) is yet to be realised. Up until November 2004 the task of building an East Asian Community (EAC) through trade and investment remained elusive, hampered by a number of obstacles. In sorting themselves out of the obstacles the East Asian (EA) countries involved lost the momentum and drive needed to form a strong alliance within the region. Nonetheless, since 2004 there has been some progress in this regard. Analysts see the latest developments involving China, India and the pacific nations, Australia and New Zealand, as promising (Blanchard 2002; Soesastro 2003, Teo 2003, 2005).
2

The United States and EA countries are seen to be equally responsible in impeding the EAC forming process. The Malaysian premier’s initial proposal to create an EAC drew a sharp opposition from the first Bush administration which also ensured that Japanese and Korean foreign ministers rejected the EAC initiative (Shorrock 2002). Later, in August 1997, Japan astounded the international policy community by announcing its proposal to create a US $ 100 billion Asian Monitory Fund (AMF) in order to stabilise the exchange rates from any currency crisis within the region. The Japan’s attempt was again thwarted by the United States (US), this time through China and the International Monitory Fund. Consequently we all witnessed 1997 economy crisis and the EAC building stalemate situation continued to prevail until last year. It is interesting note that the current situation places the EA countries as well among the world’s few nations that lack any regional identity. The reasons for this are found to be complex and historical. Han (in Shorrock 2002) pointed out that in addition to the overwhelming US influence, Japan’s violent attempts to dominate the area in the 1930s and 1940s as well contributed to the current critical scenario, i.e., lack of any cooperative mechanisms within the region. Drysdale (2003) and Soesastro (2001) reintegrated the fact by looking into the history of North and East Asian countries that lacked any integration whatsoever owing to their size, power and deep scepticism within these individual countries. Soesastro (2003) observed of ASEAN`s latest inclination towards developing bilateral initiatives, instead of opting for region-wide negotiations. Literature in this field clearly reveals the events and reactions that have taken place since the Malaysian premier’s first announcement for a regional grouping in East Asia, elaboration of which is beyond the scope of this paper. However, two major ASEAN and related summits of recent past (2001 and 2004) are briefly outlined to give some background on the need for a regional identity, following which the performance of EA countries concerned at regional and global arena are elaborated upon.
ASEAN Plus Three (2001) At the fifth summit of the ASEAN Plus Three (APT) held in 2001, a vision for a strong grouping in the East Asia region was once again articulated. The APT leaders agreed that East Asia moves “from a region of nations to a bona fide regional community with shared challenges, common aspirations, and a parallel destiny” (Soesastro 2003:1). The underlying motivations for this stance were:
3

1. to establish a regional (institutional) identity in view of the other existing and imminent similar arrangements, such as the European Union (EU), and North American.
2. a need to strengthen its views and raise a common voice on regional and global developmental issues, and
3. to promote peace and prosperity within the region through cooperation in view of its own internal dynamics.
Trade, investment and finance have been the driving forces in building an EAC. However, this has not been as an easy task. Of the many obstacles in building a strong regional community in East Asia, the following have been the three main identified ones by many analysts:
1. great diversities and huge gaps in the levels of economic development, 2. lack of a multilateral mechanism for cooperation in the Northeast Asia and 3. politico-security problems within the region
(Japan Center for International Exchange 2003; Shorrock 2002; Soesastro 2003; Teo 2005).
Asian and Pacific Integration (2004) Three years later, in November 2004 ASEAN countries met in Vientiane, Laos at their 10th summit with high optimism. Since this summit the task of Asian integration and community building is seen as a viable task with China taking a centre role in accelerating the process also supported by India. The ASEAN’s ground breaking summit and back-to-back high level meetings with its Asian-Pacific partners China, Japan, South Korea, India, Australia and New Zealand, have led to decisive measures in building a favourable future for EAC. The summit is described as a major turning point at which ASEAN leaders formalised their intention to bind themselves more closely to the two giants within the region, China and India (Teo 2005). The six main initiatives formalised at this summit in building an EAC are elaborated in the next section, following which the World Bank indicators are analysed to see how the numbers stack up. Selected indicators are analysed to see the progress, advantages and drawbacks these EA countries have experienced in establishing a regional identity they over the years. The paper also compares the status of other well established regional communities against that of this region, based on the World Bank’s economic indicators and two other pressing
4

issues (from the environmental and Millennium Development Goals or MDG) to give a comprehensive comparison in this regard.
New ASEAN Initiatives (2004) Teo (2005) described the new developments of ASEAN Vientiane Summit (of 2004) as significant. Furthermore, stated that China’s influence would be a key factor in the years to follow especially, towards the progress of East Asian economic integration. At the summit ASEAN countries signed Free Trade Agreements (FTAs) among them and between that of from the Pacific to act on the following,
1. to speed up ASEAN’s own economic linkages in setting up an ASEAN Economic Community (AEC),
2. to narrow the wealth gap between the original ASEAN five (Indonesia, Malaysia, the Philippines, Singapore and Thailand) and Brunei, and the four new ASEAN countries (Vietnam, Cambodia, Laos, and Myanmar)
3. the official induction of India into ASEAN’s economic integration process, 4. to begin FTA negotiations with Japan and South Korea to increase the trade
flows between the two countries and ASEAN. 5. to extend invitations to Australia and New Zealand in preparation of initiating
FTA negotiations with the two pacific nations, which is seen as a significant move. Despite Australia’s earlier refusal to sign the ASEAN Treaty of Amity and Cooperation (TAC) the two heads of state have agreed for this with the possibilities of joining ASEAN in an Asian regional political and economic grouping.
6. to adopt a concept for a larger Asian economic bloc with a big boost. The Philippines president called for ASEAN to push forward its efforts in integrating the group by 2020 or earlier with China, Japan, South Korea and India.
5

Figure 1: Regional trade agreements in the Asia Pacific region. Source: (United Nations Economic and Social Commission for Asia and the Pacific 2005:6)
6

With significant progress being made on the initiatives stated above, ASEAN countries are considered to be performing well in seeing themselves as a strong entity in itself for future negotiations with the other established and emerging entities, such as US, the European Union (EU) Latin American, the Middle East and African. There have been crucial developments in transforming the APT framework into an East Asian Summit (EAS) with the possibilities of more countries from the Pacific, such as Australia and New Zealand, joining in (see figures 1 - 3 for current and possible regional negotiations in the Asia Pacific region).
Figure 2: Regional trade agreements in the commonwealth independent states. Source: (United Nations Economic and Social Commission for Asia and the Pacific 2005:18)
7

Figure 3: Possible RTAs within the Asia Pacific region. Source: (United Nations Economic and Social Commission for Asia and the Pacific 2005:19) Meanwhile, the following commonwealth independent states (CIS) as well have been working on signing bilateral FTAs to promote regionalism in the central Asia (figure 4).
8

Figure 4; Source; In United Nations Economic and Social Commission for Asia and the Pacific (2005:23)
What Do the Numbers Say? Data from the World Bank tables and ASEAN’s Financial and Macroeconomic Surveillance Unit reports are analysed individually and collectively, in order to investigate the progress within ASEAN and other EA counties. Conventional statistical methods, such as 2 D graphs and an artificial neural network (ANN) based multidimensional explorative data analysis methodologies are used to see how these countries have performed during this period. The latter is performed by clustering the countries based on the data from the above stated tables and reports. The following are the observations made from the analyses. Within the ASEAN countries the wealth gap found between its old members (Indonesia, Malaysia, the Philippines, Singapore and Thailand) and Brunei, and the four new ones (Vietnam, Cambodia, Laos, and Myanmar) is seen to be considerably wide and this can be observed in their GDP growth and per capita values (see figures 4 & 5). Thailand’s 1997 currency crisis, its impact in 1998 on the whole region as well could be seen in the GDP growth rate graph of all ASEAN countries (see figure 5). The World Bank data on GDP annual average growth (AAG) 1980-1990 and 1990-2000 along with their components, such as Agriculture, Industry, Manufacture, Services, for
9
the same year periods were analysed to study the country groupings. Self-organising map (SOM) techniques within the connectionist paradigms of ANNs were used for this.
0
5,000
10,000
15,000
20,000
25,000
30,000
Brune
i
Cambod
ia
Indon
esia
Lao,
PDR
Malays
ia
Myanm
ar
Philip
pines
Singa
pore
Thail
and
Viet N
am
year 1996 y 1997 y 1998 y 1999
y 2000 y 2001 y 2002 y 2003
Figure 5: GDP per capita of ASEAN counties. Source: ASEAN Finance and Macroeconomic Surveillance Unit (FMSU) Database
- 15.00
- 10.00
- 5.00
0.00
5.00
10.00
15.00
20.00
Brune
i
Cambod
ia
Indon
esia
Lao,
PDR
Malays
ia
Myanm
ar
Philip
pines
Singa
pore
Thail
and
Viet N
amASE
AN
ASEAN 52
/
BCLM
V3/
y1996 y1997 y1998 1999 y2000 y2001y2002 y2003 y2004
Figure 6: GDP per capita of ASEAN counties. Source: ASEAN Finance and Macroeconomic Surveillance Unit (FMSU) Database
10

A SOM is a feed forward artificial neural network with an unsupervised algorithmic training developed from late 20th century’s understandings of the human brain cortex cell functioning (Kohonen 1997). Since its introduction, the algorithm has been applied to analysing multidimensional datasets across a wide spectrum of disciplines producing significant success. SOMs are excellent tools for explorative data analysis that can be used for projecting complex disparate datasets onto low dimensional displays while preserving any useful information within the raw data (Simula and et al. 1999).
GDPaagm bodia
90-00Indones ia
80-90M alay s ia
90-00Singapore
80-90*Singapore
90-00
China80-90
*Ch ina90-00
reaRep.80-90
*KoreaRep.90-00
*J apan80-90hai land
80-90ie tnam90-00
*M alay s ia80-90
*Thai land90-00
*J apan90-00
nm ar-00
ongKongChina_ 80-90 *LaoPDR_ 90-00
*LaoPDR_80-90
*Indones ia90-00
*Ind ia_80-90Ind ia_90-00
*M y anm ar80-90
*NewZea land90-00
*Ph i l ippines80-90
*Vie tnam80-90
*Ph il ippines90-00
*NewZealand80-90*Aus tral ia
80-90*Aus tral ia
90-00*HongKongChina_90 00
-6.3 -2.4 1.5 5.4 9.4
Agm bodia
90-00Indones ia
80-90M alay s ia
90-00Singapore
80-90*Singapore
90-00
China80-90
*Ch ina90-00
reaRep.80-90
*KoreaRep.90-00
*J apan80-90hai land
80-90ie tnam90-00
*M alay s ia80-90
*Thai land90-00
*J apan90-00
nm ar-00
ongKongChina_ 80-90 *LaoPDR_ 90-00
*LaoPDR_80-90
*Indones ia90-00
*Ind ia_80-90Ind ia_90-00
*M y anm ar80-90
*NewZea land90-00
*Ph i l ippines80-90
*Vie tnam80-90
*Ph il ippines90-00
*NewZealand80-90*Aus tral ia
80-90*Aus tral ia
90-00*HongKongChina_90 00
-5 -2 0 2 4 6 9 11
Industryam bodia90-00
Indones ia80-90
M alay s ia90-00
Singapore80-90
*Singapore90-00
China80-90
*Ch ina90-00
reaRep.80-90
*KoreaRep.90-00
*J apan80-90Thai land
80-90Vietnam90-00
*M alay s ia80-90
*Thai land90-00
*J apan90-00
nm ar-00
ongKongChina_ 80-90 *LaoPDR_ 90-00
*LaoPDR_80-90
*Indones ia90-00
*Ind ia_80-90Ind ia_90-00
*M y anm ar80-90
*N ew Ze al an d9 0-0 0
*Ph i l ippines80-90
*Vie tnam80-90
*Ph i l ippines90-00
*NewZealand80-90*Aus tral ia
80-90*Aus tral ia
90-00*HongKongChina_90 00
-7 -4 -2 1 4 7 10 13
Manufacturem bodia
90-00*Indones ia
80-90*M alay s ia
90-00*Singapore
80-90*Singapore
90-00
China80-90
*Ch ina90-00
reaRep.80-90
*KoreaRep.90-00
*J apan80-90hai land
80-90ie tnam90-00
*M alay s ia80-90
*Thai land90-00
*J apan90-00
nm ar-00
ongKongChina_ 80-90 *LaoPDR_ 90-00
*LaoPDR_80-90
*Indones ia90-00
*Ind ia_80-90Ind ia_90-00
*M y anm ar80-90
*NewZea land90-00
*Ph i l ippines80-90
*Vie tnam80-90
*Ph il ippines90-00
*NewZealand80-90*Aus tral ia
80-90*Aus tral ia
90-00*HongKongChina_90-00
-9 -5 -1 2 6 10 14 17
Servicesm bodia
90-00*Indones ia
80-90*M alay s ia
90-00*Singapore
80-90*Singapore
90-00
China80-90
*Ch ina90-00
reaRep.80-90
*KoreaRep.90-00
*J apan80-90hai land
80-90ie tnam90-00
*M alay s ia80-90
*Thai land90-00
*J apan90-00
nm ar-00
ongKongChina_ 80-90 *LaoPDR_ 90-00
*LaoPDR_80-90
*Indones ia90-00
*Ind ia_80-90Ind ia_90-00
*M y anm ar80-90
*NewZea land90-00
*Ph i l ippines80-90
*Vie tnam80-90
*Ph il ippines90-00
*NewZealand80-90*Aus tral ia
80-90*Aus tral ia
90-00*HongKongChina_90-00
-6 -3 -1 1 4 6 8 10
*Cambodia 90-00
*Indonesia 80-90
*Malaysia 90-00
*Singapore 80-90
*Singapore 90-00
*China 80-90 *China 90-00
*KoreaRep. 80-90
*Korea Rep. 90-00
*Japan 80-90 *Thailand
80-90 *Vietnam
90-00 *Malaysia
80-90 *Thailand
90-00 *Japan 90-00
*Myanmar 90-00
*HongKongChina_ 80-90
*LaoPDR_ 90-00
*LaoPDR_ 80-90
*Indonesia 90-00
*India_ 80-90 *India_ 90-00
*Myanmar 80-90
*NewZealand 90-00
*Philippines 80-90
*Vietnam 80-90
*Philippines 90-00
*NewZealand 80-90 *Australia
80-90 *Australia
90-00 *HongKongChina_ 90-00
11

Figure 7 a: SOM and components of GDP annual average growth 1980-1990 and1990-2000 along with their components, such as Agriculture, Industry
, Manufacture,
of the
are
gure 7 (AAG) during 1980/90 and
1990 01)
1990/2000, non
2) Malaysia seem to show high GDP
4) the rest do not show any significant progress in the two time periods analysed.
Services with ASEAN countries By studying the SOM clustering and their components implicit knowledge within the disparate data sets even from multiple sources, could be visualised in the form of novelpatterns, such as structures, trends and correlations, found to be impossible otherwise. Viscovery, commercial data depiction software is used to create SOM displays multidimensional data on EA and the other countries to see their performance, individually and within their own region. SOM components from Viscovery planesanalysed to learn about the correlations within the attributes analysed, such as GDP, population, and others. The following are the observations made from a SOM (fia & b) created with GDP annual average growth data
/200 timeframes from the World Bank tables: ASEAN countries Vietnam, the Philippines, Hong Kong, Thailand andMyanmar show significant increase in GDP AAG for agriculture based whereas, Japan show a decrease. Singapore, India, China, Lao PDR andAAG for both time periods analysed
3) New Zealand’s growth appears to be agriculture based. As far as EU countries are concerned except for Ireland Turkey and Poland
**Lithuania_90-00
**Estonia_90-00
**Hungary_90-00
**Sweden90-00
**Finland_80-90
**Slovenia_90-00
**Greece_90-00**Italy80-90
**Portugal90-00
**Turkey_80-90
**UnitedKingdom90-00
**Latvia_90-00
**Ireland_90-00
**Poland_90-00
**Ireland_80-90
**Turkey_90-00
**Spain_90-00**Finland_
90-00**Portugal
80-90
**Austria80-90
**France90-00
**Italy90-00
**Latvia_80-90
**UK80-90
**Sweden80-90
**France80-90
**Germany80-90
**Netherlands90-00
**Greece_80-90
**SlovakRepublic90-00
**SlovakRep80-90
**Belgium80-90
**Belgium90-00
***US90-00
**Spain_80-90
**Austria90-00
**Netherlands80-90
**Hungary_80-90
**Germany90-00
**Bolivia90-00
***US80-90
**CzechRepublic_90-00
**Estonia_80-90
**Bolivia80-90
GDPaag* * L it h u a n ia _
9 0 - 0 0
s t o a _
9 0 - 0 0
* * H u n g a r y _
9 0 - 0 0
* * S w e d e n
9 0 - 0 0
* * F in la n d _
8 0 - 9 0
* S lo v e n ia _
9 0 - 0 0
* * G r e e c e _
9 0 - 0 0
* * I t a ly
8 0 - 9 0
* * P o r t u g a
9 0 - 0 0* * T u r k e y _
8 0 - 9 0
* * U n it e d K in g d o m
9 0 - 0 0
* * L a
9 0 -
r e la n d _
9 0 - 0 0
* * P o la n d _
9 0 - 0 0
* * I r e la n d _
8 0 - 9 0
* T u r k e y _
9 0 - 0 0
* S p a in _
9 0 - 0 0* * F in la n d _
9 0 - 0 0
* * P o r t u g a
8 0 - 9 0
* * A u s t r ia
8 0 - 9 0
* * F r a n c e
9 0 - 0 0
* * I t a ly
9 0 - 0 0* * L a t v ia _
8 0 - 9 0
* * U n it e d K in g d o m
8 0 - 9 0
* * S w e d e n
8 0 - 9 0
* * F r a n c e
8 0 - 9 0
* * G e r m a n y
8 0 - 9 0
* * N e t h e r la n d s
9 0 - 0 0
* * G r e e c e _
8 0 - 9 0
* * S lo v a k R e p u b lic
9 0 - 0 0
* * S lo v a k R e p u b lic
8 0 - 9 0* * B e lg iu m
8 0 - 9 0
* * B e lg iu m
9 0 - 0 0* * * U n it e d S t a t e s
9 0 - 0 0
* * S p a in _
8 0 - 9 0
* * A u s t r ia
9 0 - 0 0
* * N e t h e r la n d s
8 0 - 9 0
* * H u n g a r y _
8 0 - 9 0
* * G e r m a n y
9 0 - 0 0
* * B o liv ia
9 0 - 0 0
* * * U n it e d S t a t e s
8 0 - 9 0* * C z e c h R e p u b lic _
9 0 - 0 0* * E s t o n ia _ * * B o liv ia
-6.3 9.4
Ag* * L it h u a n ia _
9 0 - 0 0
s t o a _
9 0 - 0 0
* * H u n g a r y _
9 0 - 0 0
* * S w e d e n
9 0 - 0 0
* * F in la n d _
8 0 - 9 0
* S lo v e n ia _
9 0 - 0 0
* * G r e e c e _
9 0 - 0 0
* * I t a ly
8 0 - 9 0
* * P o r t u g a
9 0 - 0 0* T u r k e y _
8 0 - 9 0
* * U n it e d K in g d o m
9 0 - 0 0
* * L a
9 0 -
r e la n d _
9 0 - 0 0
* * P o la n d _
9 0 - 0 0
* * I r e la n d _
8 0 - 9 0
* T u r k e y _
9 0 - 0 0
* S p a in _
9 0 - 0 0* * F in la n d _
9 0 - 0 0
* * P o r t u g a
8 0 - 9 0
* * A u s t r ia
8 0 - 9 0
* * F r a n c e
9 0 - 0 0
* * I t a ly
9 0 - 0 0* * L a t v ia _
8 0 - 9 0
* * U n it e d K in g d o m
8 0 - 9 0
* * S w e d e n
8 0 - 9 0
* * F r a n c e
8 0 - 9 0
* * G e r m a n y
8 0 - 9 0
* * N e t h e r la n d s
9 0 - 0 0
* * G r e e c e _
8 0 - 9 0
* * S lo v a k R e p u b lic
9 0 - 0 0
* * S lo v a k R e p u b lic
8 0 - 9 0* * B e lg iu m
8 0 - 9 0
* * B e lg iu m
9 0 - 0 0* * * U n it e d S t a t e s
9 0 - 0 0
* * S p a in _
8 0 - 9 0
* * A u s t r ia
9 0 - 0 0
* * N e t h e r la n d s
8 0 - 9 0
* * H u n g a r y _
8 0 - 9 0
* * G e r m a n y
9 0 - 0 0
* * B o liv ia
9 0 - 0 0
* * * U n it e d S t a t e s
8 0 - 9 0* * C z e c h R e p u b lic _
9 0 - 0 0* * E s t o n ia _ * * B o liv ia
-5 3 11
Industry* * L it h u a n ia _
9 0 - 0 0
s t o a _
9 0 - 0 0
* * H u n g a r y _
9 0 - 0 0
* * S w e d e n
9 0 - 0 0
* * F in la n d _
8 0 - 9 0
* S lo v e n ia _
9 0 - 0 0
* * G r e e c e _
9 0 - 0 0
* * I t a ly
8 0 - 9 0
* * P o r t u g a
9 0 - 0 0* T u r k e y _
8 0 - 9 0
* * U n it e d K in g d o m
9 0 - 0 0
* * L a
9 0 -
r e la n d _
9 0 - 0 0
* * P o la n d _
9 0 - 0 0
* * I r e la n d _
8 0 - 9 0
* T u r k e y _
9 0 - 0 0
* S p a in _
9 0 - 0 0* * F in la n d _
9 0 - 0 0
* * P o r t u g a
8 0 - 9 0
* * A u s t r ia
8 0 - 9 0
* * F r a n c e
9 0 - 0 0
* * I t a ly
9 0 - 0 0* * L a t v ia _
8 0 - 9 0
* * U n it e d K in g d o m
8 0 - 9 0
* * S w e d e n
8 0 - 9 0
* * F r a n c e
8 0 - 9 0
* * G e r m a n y
8 0 - 9 0
* * N e t h e r la n d s
9 0 - 0 0
* * G r e e c e _
8 0 - 9 0
* * S lo v a k R e p u b lic
9 0 - 0 0
* * S lo v a k R e p u b lic
8 0 - 9 0* * B e lg iu m
8 0 - 9 0
* * B e lg iu m
9 0 - 0 0* * * U n it e d S t a t e s
9 0 - 0 0
* * S p a in _
8 0 - 9 0
* * A u s t r ia
9 0 - 0 0
* * N e t h e r la n d s
8 0 - 9 0
* * H u n g a r y _
8 0 - 9 0
* G e r m a n y
9 0 - 0 0
* * B o liv ia
9 0 - 0 0
* * * U n it e d S t a t e s
8 0 - 9 0* * C z e c h R e p u b lic _
9 0 - 0 0* * E s t o n ia _ * * B o liv ia
-7 3 13
Manufacture* * L it h u a n ia _
9 0 - 0 0
s t o a _
9 0 - 0 0
* * H u n g a r y _
9 0 - 0 0
* * S w e d e n
9 0 - 0 0
* * F in la n d _
8 0 - 9 0
* * S lo v e n ia _
9 0 - 0 0
* * G r e e c e _
9 0 - 0 0
* * I t a ly
8 0 - 9 0
* * P o r t u g a
9 0 - 0 0* T u r k e y _
8 0 - 9 0
* * U n it e d K in g d o m
9 0 - 0 0
* * L a
9 0 -
r e la n d _
9 0 - 0 0
* * P o la n d _
9 0 - 0 0
* * I r e la n d _
8 0 - 9 0
* T u r k e y _
9 0 - 0 0
* S p a in _
9 0 - 0 0* * F in la n d _
9 0 - 0 0
* P o r t u g a l
8 0 - 9 0
* * A u s t r ia
8 0 - 9 0
* * F r a n c e
9 0 - 0 0
* * I t a ly
9 0 - 0 0* * L a t v ia _
8 0 - 9 0
* * U n it e d K in g d o m
8 0 - 9 0
* * S w e d e n
8 0 - 9 0
* * F r a n c e
8 0 - 9 0
* * G e r m a n y
8 0 - 9 0
* * N e t h e r la n d s
9 0 - 0 0
* * G r e e c e _
8 0 - 9 0
* * S lo v a k R e p u b lic
9 0 - 0 0
* S lo v a k R e p u b lic
8 0 - 9 0* * B e lg iu m
8 0 - 9 0
* * B e lg iu m
9 0 - 0 0* * * U n it e d S t a t e s
9 0 - 0 0
* * S p a in _
8 0 - 9 0
* * A u s t r ia
9 0 - 0 0
* * N e t h e r la n d s
8 0 - 9 0
* * H u n g a r y _
8 0 - 9 0
* G e r m a n y
9 0 - 0 0
* * B o liv ia
9 0 - 0 0
* * * U n it e d S t a t e s
8 0 - 9 0* * C z e c h R e p u b lic _
9 0 - 0 0* * E s t o n ia _ * * B o liv ia
-9 4 17
Services* * L it h u a n ia _
9 0 - 0 0
s t o a _
9 0 - 0 0
* * H u n g a r y _
9 0 - 0 0
* * S w e d e n
9 0 - 0 0
* * F in la n d _
8 0 - 9 0
* * S lo v e n ia _
9 0 - 0 0
* * G r e e c e _
9 0 - 0 0
* * I t a ly
8 0 - 9 0
* * P o r t u g a
9 0 - 0 0* T u r k e y _
8 0 - 9 0
* * U n it e d K in g d o m
9 0 - 0 0
* * L a
9 0 -
r e la n d _
9 0 - 0 0
* * P o la n d _
9 0 - 0 0
* I r e la n d _
8 0 - 9 0
* T u r k e y _
9 0 - 0 0
* S p a in _
9 0 - 0 0* * F in la n d _
9 0 - 0 0
* P o r t u g a l
8 0 - 9 0
* * A u s t r ia
8 0 - 9 0
* * F r a n c e
9 0 - 0 0
* * I t a ly
9 0 - 0 0* * L a t v ia _
8 0 - 9 0
* * U n it e d K in g d o m
8 0 - 9 0
* * S w e d e n
8 0 - 9 0
* * F r a n c e
8 0 - 9 0
* * G e r m a n y
8 0 - 9 0
* * N e t h e r la n d s
9 0 - 0 0
* * G r e e c e _
8 0 - 9 0
* * S lo v a k R e p u b lic
9 0 - 0 0
* S lo v a k R e p u b lic
8 0 - 9 0* * B e lg iu m
8 0 - 9 0
* * B e lg iu m
9 0 - 0 0* * * U n it e d S t a t e s
9 0 - 0 0
* * S p a in _
8 0 - 9 0
* * A u s t r ia
9 0 - 0 0
* * N e t h e r la n d s
8 0 - 9 0
* * H u n g a r y _
8 0 - 9 0
* G e r m a n y
9 0 - 0 0
* * B o liv ia
9 0 - 0 0
* * * U n it e d S t a t e s
8 0 - 9 0* * C z e c h R e p u b lic _
9 0 - 0 0* E s t o n ia _ * * B o liv ia
-6 2 10
12

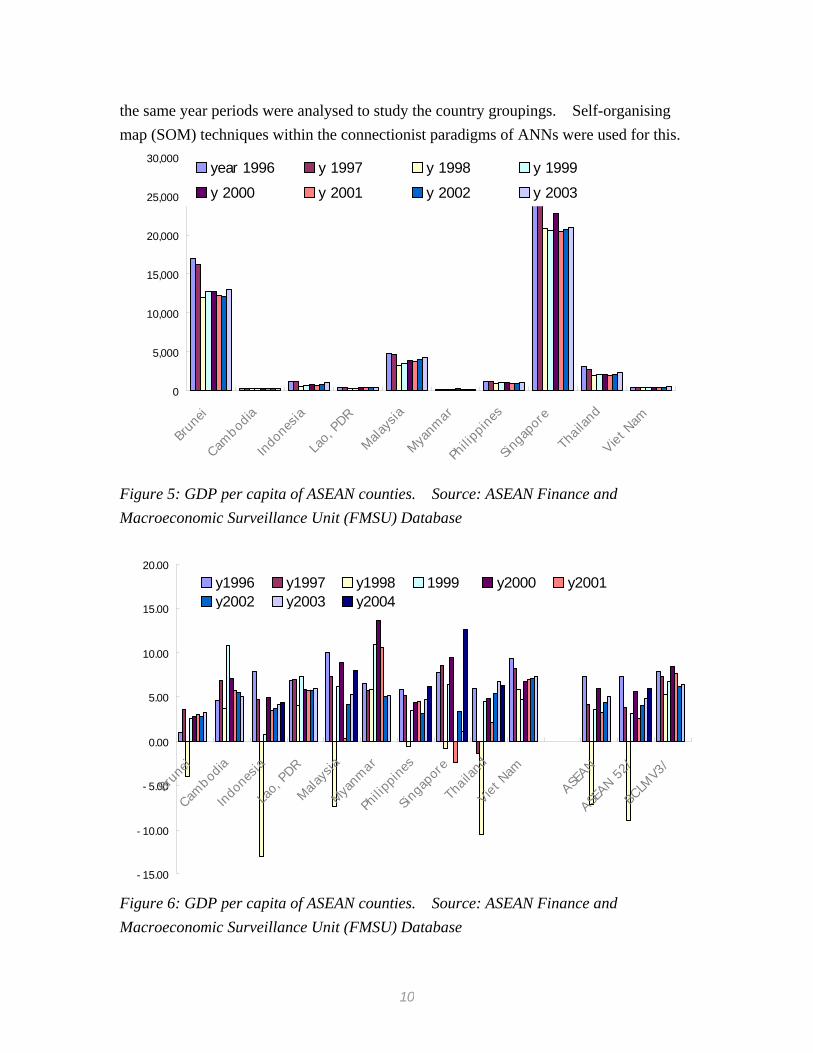
Figure 7 b: SOM and components of GDP annual average growth during 1980-90 and 1990/2000 along with their components, such as Agriculture, Industry, Manufacture, Services with EU countries
**Greece_
*LaoPDR_ *Vietnam **Austria **Belgium **Czech
Republic
**Ireland_ ***US *Australia
&Sub- Saharan
Africa LatinAmerica
Carib
* ambodiaC &MiddleEast&NAfrica *New
Zealand *Philippines
*Myanmar **Slovak Republic
**Bolivia
High GDP
AAG
90-00
**Netherlands
**Finland_&SouthAsia *India_
**Spain **Portugal &Europe &Central
Asia **Hungary_**Sweden
&EuropeEMU **Germany **France
**Italy
*Hong Kong
*Malaysia
**Poland_ *Indonesia*Thailand
&East As cific a ia&Pa*Chin
**Latvia_ *Japan
**Estonia_
**Slovenia_**United Kingdom
**Lithuania_ **Turkey_ *Singapore*Korea Rep.
GDPaag90-00*Kor eaRep.*Singapor e **Turkey_**Lit huania_ **Est onia_
**Slovenia_**Unit edKingdom
**Lat via_*Japan
ia&Pacif ichina
**Poland_* I ndonesia*Thailand
*M alaysia *HongKong **Spaina **Por t ugal&Eur ope
&Cent ralAsia
hAsiadia_ **Finland_
**Hungar y_**Sweden
&EuropeEM U**France** I t aly
**G erm any
**Net her lands
*LaoPDR_ *Viet nam
**Aust r ia **Belgium **CzechRepublic
** I r eland_ ***US*Aust r alia
&Sub-Sahar anAf r ica
Lat inAm er icaCar ib
**G r eece_
*Cam bodia &M iddleEast &NAf r ica*NewZealand
*Philippines
*M yanm ar **SlovakRepublic **Bolivia
-3.8 1.6 7.0
Ag90-00*Kor eaRep.*Singapore **Tur key_**Lit huania_ **Est onia_
**Slovenia_**Unit edKingdom
**Lat via_*Japan
ia&Pacif ichina
**Poland_*I ndonesia*Thailand
*M alaysia *HongKong **Spaina **Por t ugal&Europe
&Cent r alAsia
t hAsiandia_ **Finland_
**Hungar y_**Sweden
&Eur opeEM U**Fr ance**I t aly
**G er m any
**Net her lands
*LaoPDR_ *Viet nam
**Aust r ia **Belgium **CzechRepublic
** I r eland_ ***US*Aust r alia
&Sub-Sahar anAf r ica
Lat inAm er icaCar ib
**G reece_
*Cam bodia &M iddleEast &NAf r ica*NewZealand
*Philippines
*M yanm ar **SlovakRepublic **Bolivia
-4.3 1.0 6.4
Industry90-00*KoreaRep.*Singapor e **Tur key_**Lit huania_ **Est onia_
**Slovenia_**Unit edKingdom
**Lat via_*Japan
ia&Pacif ichina
**Poland_* I ndonesia*Thailand
*M alaysia *HongKong **Spaina **Por t ugal&Eur ope
&Cent r alAsia
hAsiandia_ **Finland_
**Hungar y_**Sweden
&Eur opeEM U**Fr ance** I t aly
**G er m any
**Net her lands
*LaoPDR_*Viet nam
**Aust r ia **Belgium **CzechRepublic
** I r eland_ ***US*Aust r alia
&Sub-Sahar anAf r ica
Lat inAm er icaCar ib
**G r eece_
*Cam bodia &M iddleEast &NAf r ica*NewZealand
*Philippines
*M yanm ar **SlovakRepublic **Bolivia
-5 1 7 13
Manufacture90-00*Kor eaRep.*Singapor e **Tur key_**Lit huania_ **Est onia_
**Slovenia_**Unit edKingdom
**Lat via_*Japan
ia&Pacif ichina
**Poland_* I ndonesia*Thailand
*M alaysia *HongKong **Spaina **Por t ugal&Eur ope
&Cent r alAsia
hAsiadia_ **Finland_
** Hung ar y_** Swed en
&Eur opeEM U**Fr ance** I t aly
**G er m any
**Net her lands
*LaoPDR_*Viet nam
**Aust r ia **Belgium **CzechRepublic
**I r eland_ ***US*Aust ralia
&Sub-Sahar anAf r ica
Lat inAm er icaCar ib
**G r eece_
*Cam bodia &M iddleEast &NAf r ica*NewZealand
*Philippines
*M yanm ar **SlovakRepublic **Bolivia
-8 0 8 16
Services90-00*Kor eaRep.*Singapor e **Tur key_**Lit huania_ **Est onia_
**Slovenia_**Unit edKingdom
**Lat via_*Japan
ia&Pacif ichina
**Poland_* I ndonesia*Thailand
*M alaysia *HongKong **Spaina **Por t ugal&Eur ope
&Cent r alAsia
t hAsiandia_ **Finland_
**Hungar y_**Sweden
&Eur opeEM U**Fr ance** I t aly
* Ger man y
**Net her lands
*LaoPDR_ *Viet nam
**Aust r ia ** Belgiu m **CzechRepublic
** I r eland_ ***US*Aust r alia
&Sub-Sahar anAf r ica
Lat inAm er icaCar ib
**G r eece_
*Cam bodia &M iddleEast &NAf r ica*NewZealand
*P hilippin e
*M yanm ar **SlovakRepublic **Bolivia
-3.7 2.4 8.5
GDPaag80-90*Kor eaRep.*Singapor e **Turkey_**Lit huania_ **Est onia_
**Slovenia_**Unit edKingdom
**Lat via_*Japan
ia&Pacif ichina
**Poland_* I ndonesia*Thailand
*M alaysia *HongKong **Spaina **Por t ugal &Eur ope&Cent ralAsia
hAsiadia_ **Finland_
**Hungar y_**Sweden
&EuropeEM U**France** I t aly
**G erm any
**Net her lands
*LaoPDR_ *Viet nam
**Aust r ia **Belgium **CzechRepublic
** I r eland_ ***US*Aust r alia
&Sub-Sahar anAf r ica
Lat inAm er icaCar ib
**G r eece_
*Cam bodia &M iddleEast &NAf r ica*NewZealand
*Philippines
*M yanm ar **SlovakRepublic **Bolivia
-4.5 2.0 8.5
Ag80-90*Kor eaRep.*Singapore **Tur key_**Lit huania_ **Est onia_
**Slovenia_**Unit edKingdom
**Lat via_*Japan
ia&Pacif ichina
**Poland_*I ndonesia*Thailand
*M alaysia *HongKong **Spaina **Por t ugal &Europe&Cent r alAsia
t hAsiandia_ **Finland_
**Hungar y_**Sweden
&Eur opeEM U**Fr ance**I t aly
**G er m any
**Net her lands
*LaoPDR_ *Viet nam
**Aust r ia **Belgium **CzechRepublic
** I r eland_ ***US*Aust r alia
&Sub-Sahar anAf r ica
Lat inAm er icaCar ib
**G reece_
*Cam bodia &M iddleEast &NAf r ica*NewZealand
*Philippines
*M yanm ar **SlovakRepublic **Bolivia
0.5 5.1 9.8
Industry80-90*KoreaRep.*Singapor e **Tur key_**Lit huania_ **Est onia_
**Slovenia_**Unit edKingdom
**Lat via_*Japan
ia&Pacif ichina
**Poland_* I ndonesia*Thailand
*M alaysia *HongKong **Spaina **Por t ugal &Eur ope&Cent r alAsia
hAsiandia_ **Finland_
**Hungar y_**Sweden
&Eur opeEM U**Fr ance** I t aly
**G er m any
**Net her lands
*LaoPDR_*Viet nam
**Aust r ia **Belgium **CzechRepublic
** I r eland_ ***US*Aust r alia
&Sub-Sahar anAf r ica
Lat inAm er icaCar ib
**G r eece_
*Cam bodia &M iddleEast &NAf r ica*NewZealand
*Philippines
*M yanm ar **SlovakRepublic **Bolivia
-3 2 6 11
Manufacture80-90*Kor eaRep.*Singapor e **Tur key_**Lit huania_ **Est onia_
**Slovenia_**Unit edKingdom
**Lat via_*Japan
ia&Pacif ichina
**Poland_* I ndonesia*Thailand
*M alaysia *HongKong **Spaina **Por t ugal &Eur ope&Cent r alAsia
hAsiadia_ **Finland_
** Hung ar y_** Swed en
&Eur opeEM U**Fr ance** I t aly
**G er m any
**Net her lands
*LaoPDR_*Viet nam
**Aust r ia **Belgium **CzechRepublic
**I r eland_ ***US*Aust ralia
&Sub-Sahar anAf r ica
Lat inAm er icaCar ib
**G r eece_
*Cam bodia &M iddleEast &NAf r ica*NewZealand
*Philippines
*M yanm ar **SlovakRepublic **Bolivia
-3 3 9 14
Services80-90*Kor eaRep.*Singapor e **Tur key_**Lit huania_ **Est onia_
**Slovenia_**Unit edKingdom
**Lat via_*Japan
ia&Pacif ichina
**Poland_* I ndonesia*Thailand
*M alaysia *HongKong **Spaina **Por t ugal &Eur ope&Cent r alAsia
t hAsiandia_ **Finland_
**Hungar y_**Sweden
&Eur opeEM U**Fr ance** I t aly
* Ger man y
**Net her lands
*LaoPDR_ *Viet nam
**Aust r ia ** Belgiu m **CzechRepublic
** I r eland_ ***US*Aust r alia
&Sub-Sahar anAf r ica
Lat inAm er icaCar ib
**G r eece_
*Cam bodia &M iddleEast &NAf r ica*NewZealand
*P hilippin e
*M yanm ar **SlovakRepublic **Bolivia
-1.5 4.1 9.8
13

Figure 8 a & b: SOM national GDP AAG during 1980-90 and 1990/2000 along with their components, such as Agriculture, Industry, Manufacture, Services with EU countries
C6
C3
C1
C2 C7
C5
C4
Figure 9 a; SOM of country population, surface area, population density, GNI, GNI per capita, GDP, PPP, PPP per capita and national GDP AAG for 1980-1990 & 1990-2000.
EA countries, Lao PDR, Viet Nam, Cambodia and Myanmar show high GDP AAG along with EU’s Ireland for 1990-2000 (figures 8 a & b). However, when GDP AAG was analysed with country population, surface area, GNI and PPP figures, EA countries get clustered together in the right bottom corner (C5), and developed countries on the top right (C3) (see figures 9 a). Different SOM country clustering (figure 9 a) and their details (figures 9 b – e) can be summarised as follows:
1) The EA countries (*) could be seen in clusters C1, C3, C4, C5 and C6, whereas EU countries (**) are seen in clusters C1 and C3 with Turkey in C5 which may become a member of EU in the near future. This shows the wide gaps, in size, population and economy within the EA countries. The details
14

of the two sets of clusters can be seen in the SOM cluster profile graphs (figures 9 d & e).
2) Singapore and Hong Kong are in the one node cluster C7 owing to similarities in their population density and economic status. However based on the other factors analysed, the two countries share similar values to that of clusters C3 and C7 (i.e., developed counties). The GDP AAG of developed countries for the two time periods are more dependent on non agriculture based factors.
3) Within cluster C5 China and India are seen in one node owing to their population
4) Central Asian and a few EU countries (namely, Estonia, Lithuania, Czech Republic, Greece, Hungary, Portugal, Slovenia, and Poland) are grouped together in cluster C1.
5) Most of the African counties are grouped in cluster C1 , however, a few are grouped in C2 and C4 (figure 10)
pop2003
5 852
s_area
21 7873
p_density
29 6072
G_n_income
2 5684
I_rank
2 169
GNIperCapita
207 33457
GNI_rank
8 195
PPP
7 5417
PPPperC
955 31400
PPP_rank
13 193
GDP
-13 11
GDPperC
-15 11
GDPaag80-90
-4.8 9.1
Ag80-90
-4.3 9.0
Industry80-90
-2 5 11
Manufacture80-90
-2 6 14
Services80-90
0 5 10
GDPaag90-00
-3.8 6.7
Ag90-00
-3.0 5.8
Industry90-00
-5 3 12
Manufacture90-00
-6 4 14
Services90-00
-2.7 7.5
15

Figure 9 b: Components of figure 9 a SOM - country population, surface area, population density, GNI, GNI per capita, GDP, PPP, PPP per capita and national GDP AAG 1980-1990 and 1990-2000
C 1: Macedonia FYR, **Latvia Belarus Kazakhstan, Croatia Romania, Russian Federation, Saudi
Arabia, *Korea Dem Rep. Kuwait, Armenia Azerbaijan Turkmenistan, Jamaica
Serbia and Montenegro, Colombia Uruguay, **Estonia **Lithuania Trinidad and
Tobago, **Czech Republic **Greece **Hungary, Ecuador Gabon, Venezuela,, Somalia
South Africa, Argentina, Mexico, Afghanistan, Lebanon, Algeria, Brazil, **Portugal,
Nigeria, Bolivia El Salvador Guatemala Peru Philippines, Namibia Panama, Iran
Islamic Rep., Slovak Republic, **Slovenia Israel, Albania, Georgia, Jordan Morocco,
Chile Costa Rica, **Poland, Bosnia and Herzegovina Dominican Republic, Tunisia
C 2: Guinea-Bissau Zimbabwe, Congo Rep. Malawi Rwanda, Madagascar Uzbekistan
Zambia, Paraguay, Angola Papua New Guinea, Kenya, C’ed'Ivoire Central African
Republic Nicaragua Niger, Cameroon, Mauritania Togo, Burkina Faso Tanzania,
Cuba Honduras United Arab Emirates, Iraq Liberia Libya, Guinea, Ethiopia
Gambia Ghana Mali, Benin Sudan Yemen Rep
C 3: **United Kingdom, *New Zealand, **France **Germany **Italy **Netherlands, **United
States *Japan, **Spain, *Australia Canada, **Belgium, **Austria **Denmark
**Finland **Ireland **Sweden Norway Switzerland
C 4: Lesotho Senegal, Syrian Arab Republic, Puerto Rico, Sri Lanka, *Myanmar Eritrea,
*Cambodia *Lao PDR Mozambique Uganda, Chad, *Vietnam Bangladesh Nepal, Egypt Arab
Rep. Pakistan
C 5: **Turkey *Malaysia, Mauritius, *Thailand Swaziland, *Korea Rep. Botswana Oman,
*Indonesia, *China *India
C 6: Congo Dem Rep Haiti Moldova Sierra Leone Tajikistan Ukraine, Bulgaria, Burundi
Mongolia West Bank and Gaza, Kyrgyz Republic
C 7: *Hong Kong China *Singapore
Figure 9 c: Table showing the different SOM clusters (figure 9 a) and the countries within them. It is interesting to see that the UN grouping and that of SOM analysis using MDG indicators used in this paper (figure 10) are similar. Both the groupings reflect the natural regionalism without any such data on location being included. However, SOM
16

clustering shows further classification within the African and EA countries. The marked differences within EA countries discussed earlier are also depicted in the SOM
clustering.
0
5000
10000
15000
20000
25000
30000
35000
pop2003 s_area p_densit y G_n_income I_rank GNIperCapita GNI_rank PPP PPPperC
C 1
C 2
C 3
C 4
C 5
C 6
C 7
- 6
- 4
- 2
0
2
4
6
8
10
12
14
GDP
GDPperC
GDPaag8
0-90
Ag80-
90
Indus
try80
- 90
Manufa
cture8
0-90
Servi
ces8
0-90
GDPaag9
0-00
Ag90-
00
Indus
t ry90
- 00
Manufa
cture9
0-00
Service
s90-
00
C 1C 2C 3C 4C 5C 6C 7
- 8
17

Figure 9 d & e: Graphs showing SOM cluster profiles (figure 9 a).
Figure 10: Country grouping of MDG indicators and that of SOM using national GDP, GNI, population related data.
18

Source: http://unstats.un.org/unsd/mi/mi_worldmillennium_new.asp
a & b: and components of environmenta tors, HIV prevalence % f adults 2003, tuberculosis 2003 (1 in 1000), CO2 emission 1990 and 2000, improved
Singapore Australia Estonia United States Korea,
Dem. Rep.
Finland Germany
Netherlands United Kingdom
Belgium Cambodia
Ireland Japan Austria Greece
Italy Slovak Republic Poland
Hong Kong, China Sweden
Korea, Rep. Slovenia New Zealand
France Portugal Spain
Lao PDR
Hungary Latvia
Lithuania Malaysia Turkey Myanmar
Indonesia
Thailand Bolivia Vietnam
Cuba Philippines China India
South Africa Botswana Zimbabwe Swaziland Zambia
HIV%adult
0
TBp100,000
9 457 905
CO2EpcapMT90
0 8 16 24
CO2_2000
0 7 13 20
water%pop_90
30 611 22 5 10033
19
Figure 11 SOM l indicao
water%pop 0020
23 100
San_pop90
9 55 100
san_2000
10 55 100
phoneper1000
11 152361

water 1990 and 2002, Improved sanitary in 1990 and 2002, unemployment and phone er 1000. p
0
20
40
60
80
100
120
C 1: Myanmar, Indonesia,Bolivia, Vietnam, Philippines,
China, India
C 2: Korea, Dem. Rep., Poland,Latvia Lithuania, Malaysia,
Turkey, Thailand, Cuba
C 3: Cambodia, Lao PDR C 4: Singapore, Australia Estonia, United States, Finland Germany Netherlands UnitedKingdom, Belgium, Ireland,Japan, Austria Greece Italy,Slovak Republic, Hong Kong,China Sweden, Korea, Rep.
Slovenia, New Zealand, France Portugal Spain, Hung
C 5: So Africa, Botswana,Zimbabwe, Swaziland, Zambia
uth
HIV%adult CO2EpcapMT90 CO2_2000 water%pop_90 water%pop2000 San_pop90 san_2000
0
200
400
600
800
1000
1200
1400
C 1 C 2: C 3: C 4: C 5:
TBp100,000 phoneper1000
Figure 11 c & d: Graphs showing SOM cluster average environmental indicators
20

SOM analysis results on environmental issues using MDG world development indicators (figures 11 a - c) clearly show the wide gaps between the developed, developing and the world’s other impoverished countries. The significant gaps within EA countries as well could be seen clearly on the SOM (figures 11 c & d) and the 2D graphs of SOM cluster profile. In the SOM, cluster 4 consists of Singapore, Australia Estonia, United States, Finland Germany Netherlands United Kingdom, Belgium, Ireland, Japan, Austria Greece Italy, Slovak Republic, Hong Kong, China Sweden, Korea, Rep. Slovenia, New Zealand, France Portugal Spain, Hungary with the highest values for access to an improved water source, sanitation facilities (% of population), fixed-line and mobile phone subscribers (per 1,000) as well as low figures for HIV prevalence (% of adults) and the incidence of tuberculosis (per 100,000 people). Except for Latvia and Lithuania all other EU along with Japan are in this cluster. Please note cluster 4 also shows high CO2 emission (per capita metric ton). Of the EA countries Cambodia, Lao PDR in cluster 3, lie close to African countries with same worst values for environmental MDG indicators except for HIV prevalence. African countries in cluster 5 show the worst figures for the variables analysed. Cluster 2 countries, Korea, Dem. Rep., Poland, Latvia Lithuania,
econd ighest values for CO emission. Cluster 2 countries Myanmar, Indonesia, Bolivia,
s t
ea
1980 to 2003 with a steady growth (figure 13). This could be considered as a
Malaysia, Turkey, Thailand and Cuba with the second best values as well has the sh 2
Vietnam, Philippines, China and India are in between clusters 2 and 3. SOM results of science and technology MDG indicators (figure 11 a & b) show the country standings on the international stage. Cluster 1 consisting of China Unites Stateand Japan (figures 11 c & d) exhibits the highest values for all indicators analysed excepfor technicians for research and development (per million people 1996-2002). The highest value for technicians is shown by Cluster 2 countries Italy, Finland, Slovenia, Belgium, Czech Republic, Sweden, Austria, Netherlands, Spain, France, Germany, KorRep., United Kingdom, Singapore and Ireland. The cluster 2 counties exhibit the second highest values for all other indicators and the highest for non resident patent applications. Given that status on issues relating to forming an EA community and its implications at regional and global scales, the next section takes a closer look at the economic growth within EA. Looking at the intra trade within EA, ASEAN/AFTA has the highest percentage from
21

favourable sign in moving forward as a strong regional entity. Figure 14 on export growth of EA, South East, newly industrialised economies and China, shows that the EA
rowth has implications not just on the countries within the region but the ones
igur 12 a & b: SOM of country data on researchers in research and development r m eople (pmp), s in R&D- pmp, scientific and technical
gsurrounding it, such as the South Asian Association for Regional Cooperation (SAARC)/SAFTA.
F e (R&D-pe illion p technician
RR&DpM
0 5875
TR&DpM
0 3146
SciTechJApM
13 166432
ExR&D%GDP
0.0 2.4 4.7
HgihTExM
0 148770
HighTEx%ME
0 35 69
R&LfeesRecM
0 39272
R&LfeesPayM
0 17328
PatAppsR
0 317783
PatAppsNR
0 250719
TMappsR
0 260454
TMappsNR
0 47213
**Italy
**Portugal
**Greece
**Turkey
**Finland
**Slovenia
**SlovakRepublic
**Belgium
**CzechRepublic
**Estonia
**Lithuania
**Latvia
*Indonesia
**Sweden
**Austri *Indi *Vietna*Kore
a a m a DemRep.
**Netherlands
**Poland
**German
**Spaina
*Australia
*NewZealand
**France
y *KoreaRep.
*HongKongChina
**UnitedKingdom
*Cambodia
*China
*Singapore
**Hungary
*LaoPDR
***United State
s *Japan
*Malaysia
*Myanmar
**Ireland
*Philippines
*Thailand
**Bolivia
22

journal articles-pmp, expenditure for R&D-% GDP, high technology exports-millions, yalty and license fees receipts, payments in millions, patent applications filed and ademark applications filed by residents and non residents in 2002. .
igure 13: Intra-trade of trade groups as a percentage of total exports of each trade rouping. Source: UNCTAD Handbook of Statistics 2004 in (United Nations Economic nd Social Commission for Asia and the Pacific 2005)
rotr
Figure 12 c: Graphs showing SOM cluster details of MDG indicators of science and technology.
0
50000
100000
150000
200000
0000
RR&Dp
M
TR&Dp
M
chJA
pM
&D%GDP
ihTEx
M
TEx%
ME
eesR
ecM
eesP
ayM
atAp
psR
tApp
sNR
TMap
psR
app
C 1: **Portugal, **Greece, **Turkey, **Slovak Republic,
**Estonia, **Lithuania, **Latvia, *Indonesia, *India, *Vietnam, *Korea Dem Rep., **Poland, *Australia, *New Zealand, *Hong Kong China, *Cambodia, **Hungary, *Lao PDR, *Malaysia, *Myanmar,
*Philippines, *Thailand, **Bolivia
C 2: **Italy, **Finland, **Slovenia, **Belgium,
**Czech Republic, **Sweden, **Austria,
**Netherlands, **Spain, **France, **Germany, *Korea Rep., **United Kingdom, *Singapore,
**Ireland
C 3: *China, ***United States, *Japan 25
sNR
SciT
eEx
R HgHigh
R&Lf
R&Lf P Pa TM
0
5
10
15
20
25
Y1980 Y1990 Y2003
ASEAN/AFTA
Bangkok Agreement
ECO
MSG
SAARC/SAPTA
Fga
23

Figure 14 a: EA country export growth. Source:http://siteresources.worldbank.org/INTEAPHALFYEARLYUPDATE/Resources/EAP-Brief-final.pdf Figttp://siteresources.worldbank.org/INTEAPHALFYEARLYUPDATE/Resources/EAP-Brie
f-final.pdf
ure 14 b: Shares in global trade h
24

Finally, looking at the shares in global trade (%) for 2002-2004, EU, US, Japan and Canada contribute for over 60 %, low & middle income countries 25 %, EA less than
5%. Low & middle and EA shares have increased during 2002-2004 period when ompared with that of 1994-1996. This could be considered as a favourable sign owever, EA has a long way to go in reaping the actual benefits of regionalism within the gion.
Conclusion
summary, it could be stated that the EA countries could not only avert any future conomy crisis within the region (i.e., 1997), but benefit from forming a strong alliance, e numbers as well confirm this. Due to their geographical positioning these countries
re destined to share each others’ failure and success. The country clustering of SOM of e World Bank indicators are similar to the UN country groupings of MDG indicators. the SOM clustering, EU countries are grouped in C1 and C3 even with dissimilar GDP AG whereas, EA countries spread across C1-C6 showing extensive dissimilarities
es with a regional arrangement are able to sustain
pirations aimed at improving coordinated efforts within the region, EA ountries could also establish a significantly better stature by increasing their leverage
her ,
e
ly caused for negative GDP growth rates in the whole region. Currently, EA is between the low & middle income and African economies, more close to the former in
the global trade shares. Hence, based r numbers stack up, forming an EAC cluding Asia’s two major emerging economies (China and India) does not seem to be
1chre
InethathInAamong them. This shows that countrieach other’s instability in terms of economic growth. In this context, as a community with common ascagainst the other well established and emerging regional economies, such as the EU, North American, South American and the Caribbean. Failure to do so will cause furtweakening of the economically less stable countries, for example Cambodia and Laoscould be forced slip into the status of African countries and it could in turn affect thstronger economies within the EA. For instance, 1997 Thailand’s currency crisis eventualin
on the manneinan option but a major impetus for counterbalancing the power exerted by the other established and emerging regional arrangements, especially in this era of increasing global interaction never seen before in human civilisation.
25

Acknowledgements This research was carried out as part of the Japan Society for the Promotion of Science Fellowship 2005 -7 programme. The author wishes to thank Professor Monte CassiPresident of Asia Pacific University (APU) and staff for their support to conduct researat APU.
References Asian Economic News (2003). 'ASEAN-plus-3' should be called E. Asia Economic
2005. http://www.atimes.com/asia-crisis/DC14Db02.html. Blanchard, J.-M. F. (2002). Brighter prospects for East Asian cooperation, Online Asia
Times. http://www.atimes.com/asia-crisis/DC14Db02.html. Drysdale, P. (2003). Japan and East Asia: Economic Prospects and Challenges.
http://www.globalmovements.monash.edu.au/globe/articles/peterdrysdale.pdf http://www.globalmovements.monash.edu.au/events/ak.html#Drysdale. Japan Center for International Exchange (2003). ASEAN-Ja
m, ch
Group.
pan Cooperation in East Asia
Community Building Joint Statement on East Asian Community Building. Kisarazu Workshop.
ohonen, T. (1997). Kohonen Tuevo Justification of Neural Modelling, Berlin; New York : Springer.
horrock, T. (2002). East Asian community remains elusive, Online Asia Times 5
hniques for Intelligent Information Systems. N. Kasabov and R. Kosma. Germany, Physica-Verlag: 3-22.
oesastro, H. (2001). Whither ASEAN Plus 3? PECC Trade Forum June12-13, 2001 Bangkok, Thailand: 17.
Soesa
Teo, wn
K
SFebruary 2002. http://www.atimes.com/china/DB05Ad02.html.
Simula, O., J. Vesanto, et al. (1999). Analysis and modeling of complex systems using the self-organizing map. Studies in Fuzziness and Soft Computing Neuro-Fuzzy Tec
S
http://www.pecc.org/publications/papers/trade-papers/2_PAE/7-soesastro.pdf. stro, H. (2003). Building an East Asian community through trade and investment integration, CSIS publications. http://www.csis.or.id/publications_paper_view.asp?id=26&tab=0 and http://www.csis.or.id/paper_view.asp?tab=0&code=wpe067. E. (2005). New challenges for building an East Asian community, The JamestoFoundation. 2005. http://www.asianresearch.org/articles/2493.html.
26

United Nations Economic and Social Commission for Asia and the Pacific (2005) Experiences with Regionalism and Bilateralism in Asia and the Pacific with Focus on Central Asia. International Conference on Strengthening Regional Cooperation
for Managing Globalization, Moscow 23.
27