An attempt of a crystal ball for hotels in a gaming destination, Macao
14
International Journal of Tourism Cities An attempt of a crystal ball for hotels in a gaming destination, Macao Cindia Ching-Chi Lam Clara Weng-Si Lei Article information: To cite this document: Cindia Ching-Chi Lam Clara Weng-Si Lei , (2015),"An attempt of a crystal ball for hotels in a gaming destination, Macao", International Journal of Tourism Cities, Vol. 1 Iss 2 pp. 139 - 151 Permanent link to this document: http://dx.doi.org/10.1108/IJTC-08-2014-0006 Downloaded on: 02 July 2015, At: 20:39 (PT) References: this document contains references to 29 other documents. To copy this document: [email protected] The fulltext of this document has been downloaded 14 times since 2015* Users who downloaded this article also downloaded: Svetlana Stepchenkova, Mikhail I. Rykhtik, Elena Shichkova, Hany Kim, Olga Petrova, (2015),"Segmentation for urban destination: gender, place of residence, and trip purpose: a case of Nizhni Novgorod, Russia", International Journal of Tourism Cities, Vol. 1 Iss 1 pp. 70-86 http://dx.doi.org/10.1108/IJTC-08-2014-0013 Greg Richards, Ilie Rotariu, (2015),"Developing the eventful city in Sibiu, Romania", International Journal of Tourism Cities, Vol. 1 Iss 2 pp. 89-102 http://dx.doi.org/10.1108/IJTC-08-2014-0007 Magdalena Florek, (2015),"Application of the concept of destination brand equity: the example of two Polish cities", International Journal of Tourism Cities, Vol. 1 Iss 2 pp. 152-161 http://dx.doi.org/10.1108/IJTC-08-2014-0009 Access to this document was granted through an Emerald subscription provided by emerald-srm:533626 [] For Authors If you would like to write for this, or any other Emerald publication, then please use our Emerald for Authors service information about how to choose which publication to write for and submission guidelines are available for all. Please visit www.emeraldinsight.com/authors for more information. About Emerald www.emeraldinsight.com Emerald is a global publisher linking research and practice to the benefit of society. The company manages a portfolio of more than 290 journals and over 2,350 books and book series volumes, as well as providing an extensive range of online products and additional customer resources and services. Emerald is both COUNTER 4 and TRANSFER compliant. The organization is a partner of the Committee on Publication Ethics (COPE) and also works with Portico and the LOCKSS initiative for digital archive preservation. *Related content and download information correct at time of download. Downloaded by Institute for Tourism Studies At 20:39 02 July 2015 (PT)
Transcript of An attempt of a crystal ball for hotels in a gaming destination, Macao

International Journal of Tourism CitiesAn attempt of a crystal ball for hotels in a gaming destination, MacaoCindia Ching-Chi Lam Clara Weng-Si Lei
Article information:To cite this document:Cindia Ching-Chi Lam Clara Weng-Si Lei , (2015),"An attempt of a crystal ball for hotels in a gaming destination, Macao",International Journal of Tourism Cities, Vol. 1 Iss 2 pp. 139 - 151Permanent link to this document:http://dx.doi.org/10.1108/IJTC-08-2014-0006
Downloaded on: 02 July 2015, At: 20:39 (PT)References: this document contains references to 29 other documents.To copy this document: [email protected] fulltext of this document has been downloaded 14 times since 2015*
Users who downloaded this article also downloaded:Svetlana Stepchenkova, Mikhail I. Rykhtik, Elena Shichkova, Hany Kim, Olga Petrova, (2015),"Segmentation for urbandestination: gender, place of residence, and trip purpose: a case of Nizhni Novgorod, Russia", International Journal ofTourism Cities, Vol. 1 Iss 1 pp. 70-86 http://dx.doi.org/10.1108/IJTC-08-2014-0013Greg Richards, Ilie Rotariu, (2015),"Developing the eventful city in Sibiu, Romania", International Journal of Tourism Cities,Vol. 1 Iss 2 pp. 89-102 http://dx.doi.org/10.1108/IJTC-08-2014-0007Magdalena Florek, (2015),"Application of the concept of destination brand equity: the example of two Polish cities",International Journal of Tourism Cities, Vol. 1 Iss 2 pp. 152-161 http://dx.doi.org/10.1108/IJTC-08-2014-0009
Access to this document was granted through an Emerald subscription provided by emerald-srm:533626 []
For AuthorsIf you would like to write for this, or any other Emerald publication, then please use our Emerald for Authors serviceinformation about how to choose which publication to write for and submission guidelines are available for all. Please visitwww.emeraldinsight.com/authors for more information.
About Emerald www.emeraldinsight.comEmerald is a global publisher linking research and practice to the benefit of society. The company manages a portfolio ofmore than 290 journals and over 2,350 books and book series volumes, as well as providing an extensive range of onlineproducts and additional customer resources and services.
Emerald is both COUNTER 4 and TRANSFER compliant. The organization is a partner of the Committee on PublicationEthics (COPE) and also works with Portico and the LOCKSS initiative for digital archive preservation.
*Related content and download information correct at time of download.
Dow
nloa
ded
by I
nstit
ute
for
Tou
rism
Stu
dies
At 2
0:39
02
July
201
5 (P
T)

An attempt of a crystal ball for hotelsin a gaming destination, Macao
Cindia Ching-Chi Lam and Clara Weng-Si Lei
Dr Cindia Ching-Chi Lam isAssistant Professor at theTourism College, Institute forTourism Studies, Macao,China. Dr Clara Weng-Si Lei isbased at the Tourism College,Institute for Tourism Studies,Macao, China.
Abstract
Purpose – The purpose of this paper is to consider the issue of forecasting hotel room rate with data from2004 onwards and the forecast horizons of 91 observations.Design/methodology/approach – This study employs a set of time series data (91 observations) onaverage monthly hotel room rates to generate an Autoregressive Integrated Moving Average Models (ARIMA)forecasting model.Findings – Through the employment of 74 percent observations, with 26 percent withhold for evaluationchecking, six best models are identified from 50 models under study. The final model reports a high level ofpredictive accuracy and provides useful insights for hoteliers to form business strategies.Originality/value – This research provides a well-defined model to forecast the room rate of three-starhotels in the city. The research findings provide good ground for strategic management of the industry, inwhich there is an imbalance between demand and supply of hotel accommodations. In addition, being thefirst of its kind in one of the largest gaming revenue generation city in the world, this research providesvaluable information for further research of its kind in the future.
Keywords Forecasting, Time series, Gaming, ARIMA, Macao, Hotel occupancy rate
Paper type Research paper
Introduction
The Central Chinese Government has implemented Individual Visit Scheme since 2003. Thescheme allows residents of 49 mainland China cities to visit Macao in their individual capacities,whereas previously visits were confined to tour group visits only. Macao has benefited from thescheme and has received millions of Chinese mainlanders ever since (DSEC, 2011). In addition,the number of hotels established has increased dramatically since the gaming liberalization takenplace in 2002. A 225 percent increase in five-star hotels in Macao was recorded and 50 percentincrease in four-star and three-star hotels between 2002 and 2011. With these unique marketphenomena, the Macao hotel industry is among the minority of destinations where businessburgeons. Lam and Lei (2010) revealed that the overall accommodation capacity of the Macaohotel industry is still behind market demand and there is room to increase average room rate.In addition, more hotel rooms are continuously being built. The overall available hotel roomsis expected to increase significantly up to 25,000 available rooms in the next few years(Choi, 2013). Thus, it is crucial to conduct a forecast of the hotel industry based on the lastdecade of performance in order to develop a forecasting model to predict the hotel room rate.In addition, the study is also aimed to contribute to the literature of applying forecasting techniqueon hospitality industry.
In this paper, we consider the issue of forecasting hotel room rate with data from 2004 onwardsand the forecast horizons of 91 observations. We employed Autoregressive Integrated MovingAverage Models (ARIMA) type of forecasting to develop an empirical formula that relates thevalue to be forecasted with the recent data. This paper is organized as follows. In the second
© International Tourism StudiesAssociation
Earlier version of this paper waspresented at the SecondInterdisciplinary Tourism ResearchConference, Fethiye, Turkey, 24th-29th April 2012 and published inthe conference proceedings. Theauthors would like to expresssincere thanks to all delegates atthe conference for their valuablecomments and suggestions.
DOI 10.1108/IJTC-08-2014-0006 VOL. 1 NO. 2 2015, pp. 139-151, Emerald Group Publishing Limited, ISSN 2056-5607 j INTERNATIONAL JOURNAL OF TOURISM CITIES j PAGE 139
Dow
nloa
ded
by I
nstit
ute
for
Tou
rism
Stu
dies
At 2
0:39
02
July
201
5 (P
T)
section, we review literature concerning the importance of forecasting in the hotel industry,and forecasting method used. In the third section, we discuss research methodology and followby research results. In the final section, we conclude the study, identify the limitations and discussfuture research path. The main contributions of this study are: being the first of its kind for Macao,a gaming destination; propose a forecasting model with good forecasting accuracy and; provideinsightful information for the incumbents of the Macao hotel industry.
Literature review
Forecasting and hotel revenue management
Revenue management system is very advanced nowadays when comparing in a few decadesago for the hotel industry. Effective revenue management system requires accurate input offorecasting on room rate and occupancy rate. Accurate forecasting of hotel occupancy rate iscritical to hotel business performance. Fixed capacity, perishable inventory, reservation made inadvance, appropriate cost structure, variable demand and segementable markets (Kimes, 2003)are hotel business characteristics, which offer immerse challenge to hoteliers. Hotel offers intangibleservice, overbooking or under-booking are very costly to the operation. More importantly, accurateforecasting is fundamental and essential to an effective revenue management (Weatherford andKimes, 2003a) and it also facilitates the planning on human resources, supplies and facilities.Detailed and accurate forecasts are thus indispensable for hotel revenue manager. In addition,accurate forecast allows revenue manager to yield the best possible room rate. Forecasting isrevealed as one of the most important strategies for hoteliers to manage revenue in the future(Kimes, 2011).
Pricing control and inventory control are two main research areas under revenue management inthe last few decades (Kimes, 2003). Different forecasting techniques were employed. Previousstudies on pricing control (development and improvement management of pricing strateties); forexample studies conducted by Andrew et al. (1990), Weatherford et al. (2001) and Wu et al.(2008) seem not as popular as studies on inventory control (improved management of customerarrival and use pattern); for example studies conducted by Gayar et al. (2011), Law (1998, 1999,2004) and Yüksel (2007). In other words, many previous studies forecasted hotel occupancy rate(Andrew et al., 1990; Law, 1998; Yüksel, 2007); while a forecasting model to predict hotel roomrate is rarely seen. As mentioned earlier, the Macao hotel industry has experienced a relativelyprosperous market environment, in which supply is catching up the enormous demand drivenby the millions of tourist arrivals annually. However, supply has been unable to meet up withdemand. As a result, maximizing revenue becomes a priority. In order to maximize hotel roomrevenue, hotel revenue management serves as an important managerial tool for the attempt inselling each hotel room to the customer who is willing to pay the highest price so as to achieve thehighest revenue (Gayar et al., 2011). This study is formed particularly to produce a forecastingmodel to predict the hotel room rate because of the exceptional market condition, demandexceeding supply in the Macau hotel industry.
Forecasting method
Weatherford et al. (2001) conducted a test of four different approaches to obtain a forecast andrevealed that a purely disaggregated forecast strongly outperformed the best aggregatedforecast. Furthermore, another study made by Weatherford and Kimes (2003a) attempted toidentify the best forecasting method with data from Choice Hotels and Marriott Hotels. The studyresults using the Marriott Hotel data showed that exponential smoothing, pickup and movingaverage models were the most robust (Weatherford and Kimes, 2003b). Previous literaturereveals the importance of forecasting the direction of change of a data series instead of the actualmagnitude (Witt and Witt, 1995). More recently, Law (2004) studied extrapolative time seriesforecasting technique in computing future hotel occupancy rates and made an initial testing on aforecasting technique – Improved Extrapolative Room Occupancy Rate Forecasting Model anddemonstrated the unique feature of the model that it uses an incremental approach to calculatethe growth rate in the last trend of the data series. It combats the disadvantage of time-seriesmodel in which it captures either the information of a few numbers towards the ending period of
PAGE 140 j INTERNATIONAL JOURNAL OF TOURISM CITIES j VOL. 1 NO. 2 2015
Dow
nloa
ded
by I
nstit
ute
for
Tou
rism
Stu
dies
At 2
0:39
02
July
201
5 (P
T)
the data series or the entire data series is used for projecting future values. Nevertheless,a comprehensive review of 121 studies on tourism demand modeling and forecasting since2000 was conducted by Song and Li (2008). Time-series models, econometric approach andemerging methods, e.g. AI techniques are the latest development of forecast technique.However, the review concludes that no clear-cut evidence shows that any one model canconsistently outperform other models in the forecasting competition (Song and Li, 2008, p. 217).As a result, time series models, simple ARIMA are used for the current study.
A time series model forecasts the trends and patterns of a series through the investigation of thehistoric trends and patterns of the time series under study (Brown, 1959; Holt, 2004; Winters,1960). An univariate time series is a sequence of observations on one variable ordered in time.Time series models have been widely used for tourism demand forecasting (Song and Li, 2008).They are able to generate valuable results in tourism and hospitality forecasts (Athiyaman andRobertson, 1992; Witt and Witt, 1995). In this study, simple ARIMA modeling is used to determinethe forecasting model on the room rates of three-star hotels in Macao. The ARIMA model hasadvantages over the common time series analysis methods, including the simple and exponentialsmoothing with or without growth, decomposition, as well as the multivariate regressions. ThroughARIMA, the future values are forecasted based on the past values of the variable under study,instead of an exploratory value that may impose influence on the system. ARIMA models are morecapable at using error residuals found to predict the dependent variables, through the predictionof current error residuals. They are also able to adjust the regression estimates generated bylagged dependent variables, if they are set as regressors. Moreover, the error residuals found incommon time series analysis and multivariate regression normally are self-correlated with theirlag values, resulting in serial correlation. This violated the assumption for regression theorythat individual disturbances should not be affected or correlated by other disturbances(Real Options Valuation, 2011).
Methodology
This study applies the time series ARIMA model proposed by Box and Jenkins (1970) to forecastthe room rate of three-star hotels in Macao. The data on the average monthly room rates of ninethree-star hotels in Macao has been applied. This represents 75 percent of the entire three-starhotel sector in 2013 (DSEC, 2013). The data collected covered the period from January 2004onwards and constituted 91 observations. A minimum of 50 observations is required for thedevelopment of an efficient forecast model through the use of ARIMA process. The need of a largesample is a result of the nature of the ARIMA process, when past values of the independent variableunder study are applied. As forecast data are related with past values, correlation is therefore anissue. Though this can be reduced through the process, cannot be eliminated (McGough andTsolacos, 1995). This research study covered four major stages, including, identification of theforecasting model; estimation of the model; validation of the model and; development ofthe forecasting equation by the estimated model. A total of five steps to cover these four stageswere carried out to ensure the establishment of a parsimonious model. The details of the five stepsare described as below.
In step one, the raw data were deflated by the Consumer Price Index (CPI) and converted fromnominal dollars to constant dollars. This stabilized the variance and enabled the generation of atrue forecast in nominal terms. The real inflation rate of Macao was applied (DSEC, 2013) for thedeflation process, which was also be applied in the set of forecast data to inflate the constantforecast rates to nominal rates. In step two, the data series was checked on stationarity. This wascarried out through the use of line graph to display the trend of time series, the augmentedDickey-Fuller (ADF) test to check on the unit root, together with the autocorrelation function (ACF)and partial autocorrelation function (PACF) plots. Through this step, the general idea on the levelof differencing (I) required to produce a stationary time series, the probable autoregressive (AR)and moving average (MA) terms necessary for an appropriate model were determined.
The feature that the time series being stationary is a fundamental principle governing thedevelopment of ARIMA models (Pankratz, 2009). The ARIMA process applies past data ofthe variable under study to forecast future time series data. Therefore, if the mean of each period
VOL. 1 NO. 2 2015 j INTERNATIONAL JOURNAL OF TOURISM CITIES j PAGE 141
Dow
nloa
ded
by I
nstit
ute
for
Tou
rism
Stu
dies
At 2
0:39
02
July
201
5 (P
T)
in the time series is different, it will be inappropriate to estimate the means. As there will thenleave behind only one observation at each time period (t) to estimate the mean at time (t) andmulti-collinearity problems will exist through the use of non-stationary values. The situation will beworsen if the variance of the time periods also variate through time.
The Dickey-Fuller (ADF) test is more superior when compared to the t-statistics andF-statistics at determining the existence of a unit root within the time series. It is because theADF test determines if a time series includes a unit root, a unit root with drift or a unit rootwith drift and trend (Dickey et al., 1986). If the residuals of a unit root process are nothomogeneous, then the Phillips-Perron test can be applied. One should also be cautiousthat structural breaks may result in the non-rejection of a unit root for both Dickey-Fullerand Phillips-Perron tests.
With the information generated from step two, ARIMAmodels were developed through the usageof two statistical programs, the SPSS and Eviews in step three. The models developed werediagnosed on adequacy and compared based on a list of statistical factors to identify the mostappropriate ones. The factors included the stationary and adjusted R2, root mean square error(RMSE), mean absolute percentage error (MAPE), maximum absolute percentage error(MaxAPE), maximum absolute error (MAE), Schwarz’s Bayesian Criterion (BIC) and Ljung-Box QStatistics. Amongst which, the best six models were included in this report and were proceededto the stage of validation. Models with lower values on statistics based on forecast errorsare normally more preferable. This is because they have been determined according to eitherabsolute, percentage of actual or squared bases on the sum of absolute forecast errors.Therefore, lower values will generally indicate a comparatively lower average error thanother models.
The six best models found were further analyzed and compared in step four. The stationarityand invertibility of the coefficients for each parameter were checked, together with the t-values.During this step, the ACF and PACF were plotted and the forecast data series was comparedwith the actual observations that have been reserved for validation. Amid the 91 observationsin the time series, 26.4 percent (24 observations that represent 24 months or two years) werereserved for this purpose. The full set of time series (91 observations) was applied to the set offinalized models in order to identify the best fit. The best model was then redeveloped basedon the full set of time series data. Based on the best model parameters, the forecasting equationwas generated in step five. Forecast was generated from the best model and again comparedwith the actual data values to reconfirm the validity of the model. A well-established ARIMA modelshould be parsimonious; has stationary AR coefficients and/or invertible moving average (MA)coefficients; with residuals that approximate a white-noise process; fits well with the time series;has stable coefficients over the period of the time series and has appropriate out-of-sampleforecasts (Pankratz, 2009). In the next section, the research results are discussed as well asresearch limitations and further research path.
Results
Data examination and testing for stationarity
The original time series measured the average room rate of three-star hotels in Macao.To stabilize the variance, in step one, all the data was deflated by the CPIof the respectiveperiods, so the nominal dollars were converted to constant dollars. A basic principle for runningan efficient ARIMA process is to have a stationary time series. A time series was consideredstationary if the underlying generating process was based on both constant mean andvariance, together with the being maintained constant through time. The autocorrelation andPACF demonstrated the coefficients of correlation and partial correlation between the time seriesand the lags of itself, respectively (Pankratz, 2009). In step two, the stationary of series waschecked and requirement on level of differencing was determined.
From Figure 1, the trend of the time series with zero order of differencing obviously demonstratedan upward trend, indicating that the time series is non-stationary. An investigation on theACF plots in Figure 2 showed a very slow but linear decay pattern, which was typical of anon-stationary series. Simultaneously, the partial autocorrelation plot (PACF) shows two
PAGE 142 j INTERNATIONAL JOURNAL OF TOURISM CITIES j VOL. 1 NO. 2 2015
Dow
nloa
ded
by I
nstit
ute
for
Tou
rism
Stu
dies
At 2
0:39
02
July
201
5 (P
T)

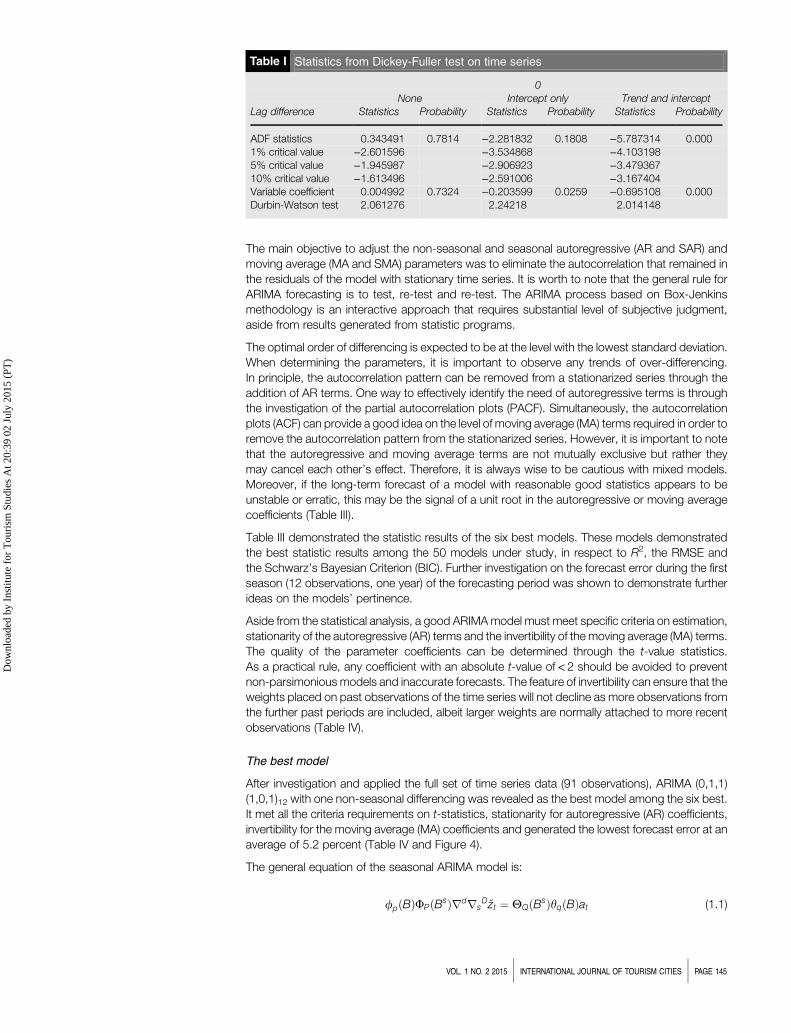
significant spikes, with no sharp cut-off at lag-1. This demonstrated that the autocorrelations atlags 2 and above in the ACF plots were not a result on the propagation of the autocorrelationat lag 1. The non-stationary situation was further confirmed by the statistics of the Dickey-Fullertest (Table I).
The null hypothesis (H0) assumes that the variable was not stationary and unit root existed. Basedon the statistics, the null hypothesis was rejected only under the situation when there was trendand intercept in the time series. Therefore, the null hypothesis was accepted when the time serieswas at zero differencing, indicating a unit root existed.
There was an obvious need for at least one order of differencing to stationarize the series. Afterone non-seasonal difference, the trend of the time series (Figure 1), the ADF and PACF plots(Figure 3), as well as the Dickey-Fuller test (Table II) was again carried out.
Based on a further investigation of the line graph on original time series (Figure 1), it was clear thatthe series appeared comparatively more stationary at one level of non-seasonal differencing thanat zero level. The series also exhibited a definite tendency to return to its mean, though in asomewhat slow manner. Through examining the ACF and PACF plots in Figure 3, the seriesalso looked comparatively more stationary, however, there was a strong autocorrelation at theseasonal period (lag 12). Owing to this, an order of seasonal differencing in the model mayberequired. Further analysis on the Dickey-Fuller test (Table II) though suggested that the nullhypothesis was rejected with one level of non-seasonal differencing, indicating the time seriesbecame stationary. In the succeeding process, the parameters of the model were estimated.
Model estimation
Based on the rules and principles for determining the parameters of the ARIMA model, in stepthree, a list of around 40 models were investigated and studied. The investigation was carriedout with respect to the diagnostic statistics checking and the autocorrelation and partialautocorrelation plots. Finally, a list of best models was chosen and results are discussed followed.
Figure 1 Comparison on the stationarity of the time series with zero level (upper) and withone level of non-seasonal differencing (lower)
800.00
JAN
2004F
EB
2004
MA
Y 2004
AU
G 2004
NO
V 2004
FE
B 2005
MA
Y 2005
AU
G 2005
NO
V 2005
FE
B 2006
MA
Y 2006
AU
G 2006
NO
V 2006
FE
B 2007
MA
Y 2007
AU
G 2007
NO
V 2007
FE
B 2008
AU
G 2008
NO
V 2008
FE
B 2009
MA
Y 2009
MA
Y 2008
AP
R 2004
JUL 2004
OC
T 2004
JAN
2005
AP
R 2005
OC
T 2005
AP
R 2006
JUL 2006
OC
T 2006
AP
R 2007
JUL 2007
OC
T 2007
JAN
2008
JUL 2008
AP
R 2008
OC
T 2008
JAN
2009
AP
R 2009
JUL 2009
JAN
2007
JAN
2006
JUL 2005
700.00
600.00
500.00
400.00
300.00
200.00
100.00
0.00
–100.00
–200.00
VOL. 1 NO. 2 2015 j INTERNATIONAL JOURNAL OF TOURISM CITIES j PAGE 143
Dow
nloa
ded
by I
nstit
ute
for
Tou
rism
Stu
dies
At 2
0:39
02
July
201
5 (P
T)

Figure
2The
autoco
rrelation(ACF)(le
ft)an
dpa
rtiala
utoc
orrelatio
nplots(PACF)(right)of
theoriginal
timese
ries
1.0
0.5
0.0
–0.5
–1.0
1.0
0.5
0.0
–0.5
–1.0
12
34
56
78
910
1112
1314
1516
1718
1920
2122
231
23
45
67
89
1011
1213
1415
1617
1819
2021
2223
PAGE 144 j INTERNATIONAL JOURNAL OF TOURISM CITIES j VOL. 1 NO. 2 2015
Dow
nloa
ded
by I
nstit
ute
for
Tou
rism
Stu
dies
At 2
0:39
02
July
201
5 (P
T)
The main objective to adjust the non-seasonal and seasonal autoregressive (AR and SAR) andmoving average (MA and SMA) parameters was to eliminate the autocorrelation that remained inthe residuals of the model with stationary time series. It is worth to note that the general rule forARIMA forecasting is to test, re-test and re-test. The ARIMA process based on Box-Jenkinsmethodology is an interactive approach that requires substantial level of subjective judgment,aside from results generated from statistic programs.
The optimal order of differencing is expected to be at the level with the lowest standard deviation.When determining the parameters, it is important to observe any trends of over-differencing.In principle, the autocorrelation pattern can be removed from a stationarized series through theaddition of AR terms. One way to effectively identify the need of autoregressive terms is throughthe investigation of the partial autocorrelation plots (PACF). Simultaneously, the autocorrelationplots (ACF) can provide a good idea on the level of moving average (MA) terms required in order toremove the autocorrelation pattern from the stationarized series. However, it is important to notethat the autoregressive and moving average terms are not mutually exclusive but rather theymay cancel each other’s effect. Therefore, it is always wise to be cautious with mixed models.Moreover, if the long-term forecast of a model with reasonable good statistics appears to beunstable or erratic, this may be the signal of a unit root in the autoregressive or moving averagecoefficients (Table III).
Table III demonstrated the statistic results of the six best models. These models demonstratedthe best statistic results among the 50 models under study, in respect to R2, the RMSE andthe Schwarz’s Bayesian Criterion (BIC). Further investigation on the forecast error during the firstseason (12 observations, one year) of the forecasting period was shown to demonstrate furtherideas on the models’ pertinence.
Aside from the statistical analysis, a good ARIMAmodel must meet specific criteria on estimation,stationarity of the autoregressive (AR) terms and the invertibility of the moving average (MA) terms.The quality of the parameter coefficients can be determined through the t-value statistics.As a practical rule, any coefficient with an absolute t-value of<2 should be avoided to preventnon-parsimonious models and inaccurate forecasts. The feature of invertibility can ensure that theweights placed on past observations of the time series will not decline as more observations fromthe further past periods are included, albeit larger weights are normally attached to more recentobservations (Table IV).
The best model
After investigation and applied the full set of time series data (91 observations), ARIMA (0,1,1)(1,0,1)12 with one non-seasonal differencing was revealed as the best model among the six best.It met all the criteria requirements on t-statistics, stationarity for autoregressive (AR) coefficients,invertibility for the moving average (MA) coefficients and generated the lowest forecast error at anaverage of 5.2 percent (Table IV and Figure 4).
The general equation of the seasonal ARIMA model is:
fp Bð ÞFP Bsð ÞrdrsDžt ¼ YQ Bsð Þyq Bð Þat (1.1)
Table I Statistics from Dickey-Fuller test on time series
0None Intercept only Trend and intercept
Lag difference Statistics Probability Statistics Probability Statistics Probability
ADF statistics 0.343491 0.7814 −2.281832 0.1808 −5.787314 0.0001% critical value −2.601596 −3.534868 −4.1031985% critical value −1.945987 −2.906923 −3.47936710% critical value −1.613496 −2.591006 −3.167404Variable coefficient 0.004992 0.7324 −0.203599 0.0259 −0.695108 0.000Durbin-Watson test 2.061276 2.24218 2.014148
VOL. 1 NO. 2 2015 j INTERNATIONAL JOURNAL OF TOURISM CITIES j PAGE 145
Dow
nloa
ded
by I
nstit
ute
for
Tou
rism
Stu
dies
At 2
0:39
02
July
201
5 (P
T)

Figure
3The
autoco
rrelation(ACF)(le
ft)an
dpa
rtiala
utoc
orrelatio
nplots(PACF)(right)of
thetim
ese
rieswith
oneleve
lofno
n-se
ason
aldiffe
renc
ing
1.0
0.5
0.0
–0.5
–1.0
1.0
0.5
0.0
–0.5
–1.0
12
34
56
78
910
1112
1314
1516
1718
1920
2122
231
23
45
67
89
1011
1213
1415
1617
1819
2021
2223
PAGE 146 j INTERNATIONAL JOURNAL OF TOURISM CITIES j VOL. 1 NO. 2 2015
Dow
nloa
ded
by I
nstit
ute
for
Tou
rism
Stu
dies
At 2
0:39
02
July
201
5 (P
T)

where:
fp Bð Þ ¼ 1�f1 Bð Þ � . . .. . .fp Bð Þp
FP Bsð Þ ¼ 1�F1 Bsð Þ � . . .:: FP BsP� �
yq Bð Þ ¼ 1–y1 Bð Þ � . . .. . . yq Bqð Þ
YQ Bsð Þ ¼ 1–Y1 Bsð Þ � . . .. . . YQðBsQÞ
Table II Statistics from Dickey-Fuller test on time series with one level of non-seasonaldifferencing
1None Intercept only Trend and intercept
Lag difference Statistics Probability Statistics Probability Statistics Probability
ADF statistics −9.571501 0.000 −9.547227 0.000 −9.52118 0.0001% critical value −2.601596 −3.536587 −4.1079475% critical value −1.945987 −2.90766 −3.48159510% critical value −1.613496 −2.591396 −3.168695Variable coefficient −1.933684 0.000 −1.941336 0.000 −1.945043 0.000Durbin-Watson test 2.057406 2.063403 2.072539
Table III Statistical result for the six best models
ARIMA model(0,1,1)(0,1,0)
(1,1,1)(1,0,0)
(1,1,1)(2,0,0)
(0,1,1)(1,1,0)
(0,1,1)(1,1,1)
(0,1,1)(1,0,1)
Stationary R2 0.796 0.821 0.823 0.851 0.826 0.631R2 0.849 0.916 0.918 0.891 0.875 0.816RMSE 33.215 26.609 26.451 28.816 30.832 38.263MAPE 5.404 4.337 4.265 4.642 4.807 5.939MaxAPE 17.109 15.292 16.394 15.664 15.493 39.343MAE 25.806 19.927 19.450 21.882 22.539 27.148MaxAE 82.465 73.709 79.018 68.163 80.744 132.644Normalized BIC 7.449 7.197 7.249 7.313 7.448 7.733Ljung-Box Q Statistics 23.458 12.603 13.352 14.113 16.134 13.029Ljung-Box Q Sig 0.135 0.633 0.499 0.590 0.373 0.600Forecast error (1st season) (%) −12.2 −30.4 −29.8 −10.1 −8.8 −11.5
Note: Based on 67 observations (24 observations withhold for evaluation checks)
Table IV The best ARIMA (0,1,1)(1,0,1)12 model specifications and statistical data
Estimate SE t Sig.
Constant 0.003 0.015 0.190 0.850Difference 1MA Lag 1 0.521 0.107 4.868 0.000AR, Seasonal Lag 1 0.995 0.013 73.988 0.000MA, Seasonal Lag 1 0.797 0.238 3.352 0.001Stationary R2 0.747 MAE 24.429R2 0.888 MaxAE 151.900RMSE 34.536 Normalized BIC 7.495MAPE 5.161 Ljung-Box Q Statistics 15.709MaxAPE 45.054 Ljung-Box Q Sig 0.402
Note: Based on 91 observations (full time series)
VOL. 1 NO. 2 2015 j INTERNATIONAL JOURNAL OF TOURISM CITIES j PAGE 147
Dow
nloa
ded
by I
nstit
ute
for
Tou
rism
Stu
dies
At 2
0:39
02
July
201
5 (P
T)

ϕp(B) is the non-seasonal AR operator, ΦP(Bs) the seasonal AR operator, θq(B) is the
non-seasonal MA operator and ΘQ(Bs) is the seasonal MA operator, where žt is differenced d
(length one) times and D (length s) times. ∇d ∇sD are the differencing operators and at is the
random shocks.
In backshift form , the general equation (1.1) for the best model ARIMA (0,1,1)(1,0,1)12 is written as:
1�F1Bð Þ 1– Bð Þžt ¼ 1 –Y12B12� �
1– y1Bð Þat (1.2)
žt ¼ zt�1þF zt�1–zt�2ð Þ–y1 at�1–Y12 at�12þY12 y1at�13 (1.3)
Substituting the ARIMA parameters from Table IV into Equation (1.3), the best model to forecastthe room rate of three-star hotels in Macao was represented as:
žt ¼ zt�1þ0:995 zt�1 – zt�2ð Þ – 0:521at�1 – 0:797at�12þ1:318at�13:
Applicability and prediction power of the forecasting model
The applicability of the forecast model was explored beyond the three-star hotel to two other starrating hotels, the four-star and five-star hotels. Based on the results in Tables V and VI, it is foundthat the model yielded a similar closeness of fit when applied on four-star hotels, with the sameRMSE. The RMSE is a measure on closeness of fit based on the differences between valuespredicted by the model and the actual values observed (Pankratz, 2009). Moreover, the meanabsolute percent error (MAPE) that used to determine the closeness of fit based on a practicalperspective was also examined, which was slightly higher at 5.6 percent as compared to 5.2percent when the model was applied on three-star hotels. For five-star hotels, although the modelresulted in a higher RMSE but the MAPE was lower at 4.2 percent.
A further comparison was made on the actual and forecast average room rates of the three hotelsegments for the five months after the observation period, from August to December, until theend of the year. As shown in Table VII, for three-star hotels, the average forecast error is −6.3percent, while that for four-star hotels is −7.2 percent. These correspond to the statistical
Figure 4 Comparion of observed, actual and forecast time series based on the best model
Jan 2004A
pr 2004Jul 2004O
ct 2004Jan 2005A
pr 2005Jul 2005O
ct 2005Jan 2006A
pr 2006Jul 2006O
ct 2006Jan 2007A
pr 2007Jul 2007O
ct 2007Jan 2008A
pr 2008Jul 2008O
ct 2008Jan 2009A
pr 2009Jul 2009O
ct 2009Jan 2010A
pr 2010Jul 2010O
ct 2010Jan 2011A
pr 2011Jul 2011O
ct 2011
AvR
3Star-M
odel_1
LCLUCLFitObserved
Forecast
Table V Model fit statistics on four -star hotels
Stationary R2 0.829 MAE 23.776R2 0.754 MaxAE 117.979RMSE 34.536 Normalized BIC 7.535MAPE 5.585 Ljung-Box Q Statistics 12.731MaxAPE 35.493 Ljung-Box Q Sig 0.623
PAGE 148 j INTERNATIONAL JOURNAL OF TOURISM CITIES j VOL. 1 NO. 2 2015
Dow
nloa
ded
by I
nstit
ute
for
Tou
rism
Stu
dies
At 2
0:39
02
July
201
5 (P
T)

forecast error. The average forecast error for five-star hotels, however, shows a betterperformance than the statistical error, which is nil at –0.4 percent. This is resulted from aminimumerror of −6.5 percent to a maximum of 6.6 percent during the period.
Conclusion and implications
The current study is the first of its kind in Macao, which applied the time series data of 75 percentthree-star hotels in Macao since 2004 through a period of 91 months to generate a forecastingmodel on the hotel room rate. A rigorous forecasting method, autoregressive integrated movingaverage (ARIMA), was applied through four major stages of identification, estimation, evaluationand forecasting before the final forecasting model was generated. Amongst all the observations inthe time series, 73.6 percent was applied to identify the forecast model, while 26.4 percent waswithheld for evaluation checking. The latter represented 24 observations or two years. When thelist of six best models was identified from the 50 models under study, the full set of time serieswas applied to generate the final forecast model, having a maximum average forecast error of5.2 percent.
Macao is a city with about half a million (556 thousands) population but with the liberalization ofthe gaming industry in 2002, it has turned into a gaming gorilla and the gaming revenue hassurpassed that of Las Vegas since 2007 (Devoss, 2008). The gaming industry has attracted hugeamount of tourists to the city and the shortage of hotel accommodation has been a continuousissue for the tourism and hospitality industry during the recent years. This research provides awell-defined model to forecast the room rate of three-star hotels in the city, as well as four-starand five-star. The model could be utilized to generate reference pricing for hoteliers in room ratesetting. Overpricing of hotel room rate easily becomes a trap to hoteliers with the existingimbalance of demand and supply, which has a long term impact to the hotel’s reputation (Öğütand Onur Taş, 2011). A 5.2 percent forecast error provides a satisfactory model; however,managers should be well aware of different star rating hotel room rate of neighboring cities, forexample, Hong Kong and Guangzhou. Particularly, Macau receives majority tourists fromChinese mainland who always visit Hong Kong as well. The research findings provide goodground for strategic management of the industry, in which there is an imbalance betweendemand and supply of hotel accommodations. In addition, being the first of its kind in one of thelargest gaming revenue generation city in the world, this research provides valuable informationfor further research of its kind in the near future.
Table VI Model fit statistics on five-star hotels
Stationary R2 0.526 MAE 41.326R2 0.761 MaxAE 189.202RMSE 56.738 Normalized BIC 8.377MAPE 4.235 Ljung-Box Q statistics 17.988MaxAPE 23.558 Ljung-Box Q Sig 0.263
Table VII Comparison on the forecast accuracy of the model for three, four and five-star hotels during the five months afterthe observation period
Star rating Three-star Four-star Five-star(MOP) Forecast Actual Difference (%) Forecast Actual Difference (%) Forecast Actual Difference (%)
August 913.809 957.493 −4.6 761.810 822.388 −7.4 1,516.735 1,622.974 −6.5September 881.423 898.407 −1.9 729.814 755.534 −3.4 1,532.786 1,516.129 1.1October 990.197 1,117.805 −11.4 832.617 935.567 −11.0 1,594.490 1,666.626 −4.3November 929.628 979.075 −5.1 791.550 820.560 −3.5 1,549.805 1,511.950 2.5December 962.161 1,036.843 −7.2 808.322 895.312 −9.7 1,584.643 1,486.512 6.6Average 935.444 997.925 −6.3 784.823 845.872 −7.2 1,555.692 1,560.838 −0.3
VOL. 1 NO. 2 2015 j INTERNATIONAL JOURNAL OF TOURISM CITIES j PAGE 149
Dow
nloa
ded
by I
nstit
ute
for
Tou
rism
Stu
dies
At 2
0:39
02
July
201
5 (P
T)

Albeit the significant contributions, there are certain limitations. The ARIMA model, though wasdeveloped under a rigorous method, might have suffered from over-differencing. For any futureresearch of its similar kind, researchers should be precautious to ensure that the model has notbeen overfit during the identification stage, since ARIMA can really be considered as a statisticalprocess of art, rather than simple statistical process alone. In forecasting model generated, theseasonal autoregressive (SAR) term has a coefficient of 0.995. This coefficient, though significantand meets the criteria of <1, is still very close to 1. Further analysis may be required to identifythe factors behind. Furthermore, this study only covers hotels of three-star rating. Future studiesshould expand the scope to cover more comprehensive star segments that may allowbenchmarking of the industry.
References
Andrew, W.P., Cranage, D.A. and Lee, C.K. (1990), “Forecasting hotel occupancy rates with time seriesmodels: an empirical analysis”, Journal of Hospitality & Tourism Research, Vol. 14 No. 2, pp. 173-82.
Athiyaman, A. and Robertson, R.W. (1992), “Time series forecasting techniques: short-term planning intourism”, International Journal of Contemporary Hospitality Management, Vol. 4 No. 4, pp. 8-11.
Box, G.E.P. and Jenkins, G.M. (1970), Time Series Analysis, Forecasting and Control, Holden Day,San Francisco, CA.
Brown, R.G. (1959), Statistical Forecasting for Inventory Control, McGraw Hill, New York, NY.
Choi, S. (2013), “New hotels provide new chances and challenges for workers”, available at: www.macau-dailytimes.com.mo/macau/41678-new-hotels-provide-new-chances-and-challenges-for-workers.html(accessed June 21, 2013).
Devoss, D. (2008), “Macau hits the jackpot”, Smithsonian Magazine, available at: www.smithsonianmag.com/travel/macau-jackpot.html?c¼y&page¼4
Dickey, D.A., Bell, W.R. and Miller, R.B. (1986), “Unit roots in time series models: tests and implications”,The American Statistician, Vol. 40 No. 1, pp. 12-26.
DSEC (2011), “Statistics”, available at: www.dsec.gov.mo/TimeSeriesDatabase.aspx (accessedOctober 14, 2012).
DSEC (2013), “Statistics”, available at: www.dsec.gov.mo/TimeSeriesDatabase.aspx (accessedFebruary 18, 2014).
Gayar, N.F.E., Saleh, M., Atiya, A., El-Shishiny, H., Zakhary, A.A.Y.F. and Habib, H.A.A.M. (2011),“An integrated framework for advanced hotel revenue management”, International Journal of ContemporaryHospitality Management, Vol. 23 No. 1, pp. 84-98.
Holt, C.C. (2004), “Forecasting seasonals and trends by exponentially weighted moving averages”,International Journal of Forecasting, Vol. 20 No. 1, pp. 5-10.
Kimes, S.E. (2003), “Revenue management: a retrospective”, The Cornell Hotel and RestaurantAdministration Quarterly, Vol. 44 No. 5, pp. 131-8.
Kimes, S.E. (2011), “The future of hotel revenue management”, J Revenue Pricing Manag, Vol. 10 No. 1,pp. 62-72.
Lam, C.C. and Lei, W.S. (2010), “Hotel occupancy rate in a gambling destination: a longitudinal study of themacao hotel industry 2004–2007”, Journal of Hospitality and TourismManagement, Vol. 17 No. 1, pp. 34-43.
Law, R. (1998), “Room occupancy rate forecasting: a neural network approach”, International Journal ofContemporary Hospitality Management, Vol. 10 No. 6, pp. 234-44.
Law, R. (1999), “Demand for hotel spending by visitors to Hong Kong”, Journal of Hospitality & LeisureMarketing, Vol. 6 No. 4, pp. 17-29.
Law, R. (2004), “Initially testing an improved extrapolative hotel room occupancy rate forecasting technique”,Journal of Travel & Tourism Marketing, Vol. 16 Nos 2-3, pp. 71-7.
McGough, T. and Tsolacos, S. (1995), “Forecasting commercial rental values using ARIMA models”, Journalof Property Valuation and Investment, Vol. 13 No. 5, pp. 6-22.
PAGE 150 j INTERNATIONAL JOURNAL OF TOURISM CITIES j VOL. 1 NO. 2 2015
Dow
nloa
ded
by I
nstit
ute
for
Tou
rism
Stu
dies
At 2
0:39
02
July
201
5 (P
T)

Öğüt, H. and Onur Taş, B.K. (2011), “The influence of internet customer reviews on the online sales and pricesin hotel industry”, The Service Industries Journal, Vol. 32 No. 2, pp. 197-214.
Pankratz, A. (2009), Forecasting with Univariate Box-Jenkins Models: Concepts and Cases, Vol. 224,John Wiley & Sons, Chichester.
Real Options Valuation (2011), “Advance forecasting techniques and models: ARIMA”, available at: www.realoptionsvaluation.com/attachments/ShortApplications-Forecasting-ARIMA.pdf (accessed January 25, 2012).
Song, H. and Li, G. (2008), “Tourism demand modelling and forecasting— a review of recent research”,Tourism Management, Vol. 29 No. 2, pp. 203-20.
Weatherford, L.R. and Kimes, S.E. (2003a), “A comparison of forecasting methods for hotel revenuemanagement”, International Journal of Forecasting, Vol. 19 No. 3, pp. 401-15.
Weatherford, L.R. and Kimes, S.E. (2003b), “A comparison of forecasting methods for hotel revenuemanagement”, International Journal of Forecasting, Vol. 19 No. 30, pp. 401-15.
Weatherford, L.R., Kimes, S.E. and Scott, D.A. (2001), “Forecasting for hotel revenue management: testingaggregation against disaggregation”, The Cornell Hotel and Restaurant Administration Quarterly, Vol. 42No. 4, pp. 53-64.
Winters, P.R. (1960), “Forecasting sales by exponentially weighted moving averages”,Management Science,Vol. 6 No. 3, pp. 324-42.
Witt, S.F. and Witt, C.A. (1995), “Forecasting tourism demand: a review of empirical research”, InternationalJournal of Forecasting, Vol. 11 No. 3, pp. 447-75.
Wu, W.-y., Hsiao, S.-w. and Tsai, C.-h. (2008), “Forecasting and evaluating the tourist hotel industryperformance in Taiwan based on Grey theory”, Tourism and Hospitality Research, Vol. 8 No. 2, pp. 137-52.
Yüksel, S. (2007), “An integrated forecasting approach to hotel demand”, Mathematical and ComputerModelling, Vol. 46 No. 7, pp. 1063-70.
Corresponding author
Dr Cindia Ching-Chi Lam can be contacted at: [email protected]
For instructions on how to order reprints of this article, please visit our website:www.emeraldgrouppublishing.com/licensing/reprints.htmOr contact us for further details: [email protected]
VOL. 1 NO. 2 2015 j INTERNATIONAL JOURNAL OF TOURISM CITIES j PAGE 151
Dow
nloa
ded
by I
nstit
ute
for
Tou
rism
Stu
dies
At 2
0:39
02
July
201
5 (P
T)