An Assessment of the Relative Efficiency of a Facilitator-Driven Requirements Collection Process...
10
An Assessment of the Relative Efficiency of a Facilitator-Driven Requirements Collection Process With Respect to the Conventional Interview Method Dr. Rick Hubbard BEA Systems, Inc. [email protected] Dr. Charles N. Schroeder Colorado Technical University [email protected] Dr. Nancy R. Mead Software Engineering Institute, Carnegie Mellon University [email protected] Abstract A case is made for the use of “Facilitator-Driven” requirements collection processes—within suitable parameters—as opposed to the “Conventional Interview Method.” Based on the principal author’s professional experience, this experience-based report presents a comparative and normalized analysis of eight Facilitator-Led requirements collection sessions with respect to four Conventional Interview Method requirements collection processes. The relative efficiency of the two methods is compared statistically, and conclusions are drawn regarding the improvements in the requirements collection process attributable to the use of the Facilitator-Driven approach. 1. Introduction The collection and use of requirements for the construction of software deliverables has been recognized as a key and essential activity of nearly all software development approaches and in essence all software development projects. Software engineers use a number of methods and techniques to elicit and collect requirements. Goguen [1] has compiled a survey of several of the most frequently used elicitation techniques. Each approach is suitable in various settings and each offers its own advantages and disadvantages. The approach of interest to this research is the Unstructured Group-Oriented technique. 1.1. Practical and Research Problems Collecting Requirements There have been, and remain, persistent and interesting problems attributed to the requirements stage of software development projects. For example, while it remains difficult to objectively measure the quality of requirements, the quality of requirements has been described for some time ( e.g., Dr. Alan M. Davis has compiled a very useful means for describing requirements quality [2]). With respect to the focus of this paper, it is recognized that there are also persistent problems encountered regarding research and exploratory aspects of requirements collection process investigation. An example of such a problem is the difficulty of meaningfully comparing requirements practices across multiple projects of varying sizes based on the application of varying requirements techniques and methods. 1.2. An Opportunity: Increased Efficiency in Requirements Collection Within such problems lies a need and an opportunity to improve the requirements collection and management process. The intent of this work is two-fold: 1. To illustrate the efficiency of a specific facilitator- driven requirements collection technique relative to the conventional Unstructured Interview Method, and 2. To report on an apparently unique method to comparatively evaluate various requirements 0-7695-0565-1/00 $10.00 ã 2000 IEEE
-
Upload
independent -
Category
Documents
-
view
5 -
download
0
Transcript of An Assessment of the Relative Efficiency of a Facilitator-Driven Requirements Collection Process...
An Assessment of the Relative Efficiency of a Facilitator-Driven Requirements Collection Process With Respect to the Conventional Interview Method
Dr. Rick Hubbard BEA Systems, Inc.
Dr. Charles N. Schroeder Colorado Technical University
Dr. Nancy R. Mead Software Engineering Institute, Carnegie Mellon University
Abstract A case is made for the use of “Facilitator-Driven”
requirements collection processes—within suitable parameters—as opposed to the “Conventional Interview Method.” Based on the principal author’s professional experience, this experience-based report presents a comparative and normalized analysis of eight Facilitator-Led requirements collection sessions with respect to four Conventional Interview Method requirements collection processes. The relative efficiency of the two methods is compared statistically, and conclusions are drawn regarding the improvements in the requirements collection process attributable to the use of the Facilitator-Driven approach.
1. Introduction The collection and use of requirements for the
construction of software deliverables has been recognized as a key and essential activity of nearly all software development approaches and in essence all software development projects. Software engineers use a number of methods and techniques to elicit and collect requirements. Goguen [1] has compiled a survey of several of the most frequently used elicitation techniques.
Each approach is suitable in various settings and each offers its own advantages and disadvantages. The approach of interest to this research is the Unstructured Group-Oriented technique.
1.1. Practical and Research Problems Collecting Requirements
There have been, and remain, persistent and interesting
problems attributed to the requirements stage of software development projects. For example, while it remains difficult to objectively measure the quality of requirements, the quality of requirements has been described for some time (e.g., Dr. Alan M. Davis has compiled a very useful means for describing requirements quality [2]).
With respect to the focus of this paper, it is recognized that there are also persistent problems encountered regarding research and exploratory aspects of requirements collection process investigation. An example of such a problem is the difficulty of meaningfully comparing requirements practices across multiple projects of varying sizes based on the application of varying requirements techniques and methods.
1.2. An Opportunity: Increased Efficiency in Requirements Collection
Within such problems lies a need and an opportunity
to improve the requirements collection and management process. The intent of this work is two-fold:
1. To illustrate the efficiency of a specific facilitator-driven requirements collection technique relative to the conventional Unstructured Interview Method, and
2. To report on an apparently unique method to comparatively evaluate various requirements
0-7695-0565-1/00 $10.00 � 2000 IEEE
collection techniques conducted across multiple
and dissimilar projects.
The scope of this paper is restricted to commercially-
oriented software development projects intended to produce an application for use within the sponsoring enterprise, and for which safety is not a material consideration. (Please note: this paper draws extensively from work completed as part of the principal author’s doctoral dissertation [3].)
2. Methods Described This paper is based on practical, field-based research
conducted regarding the relative efficiency of two specific requirements collection methods. They are: a specific facilitator-led requirements collection technique, and, in comparison, the conventional, Unstructured Interview Method. Each method is briefly described below. (Note that the purpose of this paper is to describe the relative efficiency of this specific facilitated method—it is not to describe the details of the method. The detailed description of the facilitated method is quite extensive and is beyond the scope of this work). 2.1. Unstructured Interview Method
Unstructured interviews are somewhat exploratory in
nature. This type of requirements collection approach tends to be less guided, and is characterized by a series of ad hoc questions such as “what do you want the new system to do?” The breadth and depth of the questioning is largely dependent on the skill and experience of the individual interviewer (or on guidance obtained from resources such as checklists). Responses also tend to be unbounded, lack categorical definition, and are unstructured. While this technique incurs minimal direct cost—and can be implemented very quickly—it has many shortcomings (which may inject considerable hidden costs later in the life cycle of the project). This technique frequently harvests a large amount of uncorrelated information (requirements, business objectives, non-functional requirements, and design decisions)—which further burdens the interviewers, analysts, designers, and developers with the need to make interpretations and
decisions regarding the interviewee’s envisioned requirements.
2.2. Facilitated Requirements Collection Method
The following brief overview of the facilitated
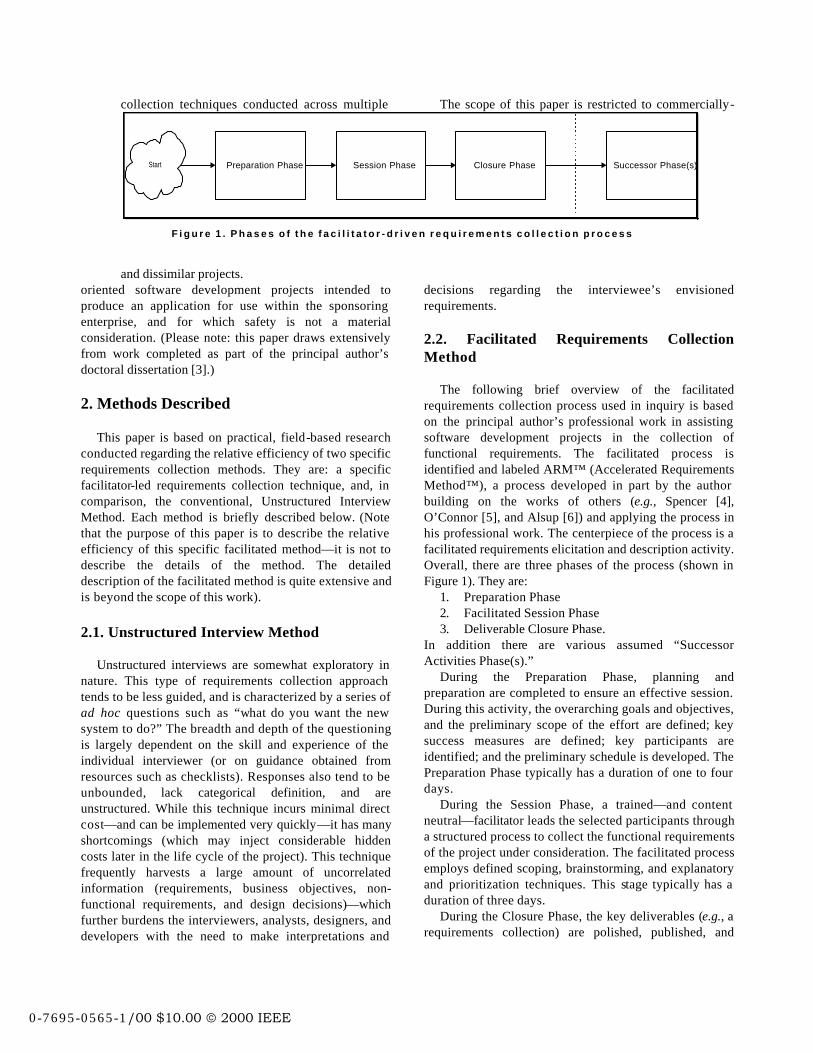
requirements collection process used in inquiry is based on the principal author’s professional work in assisting software development projects in the collection of functional requirements. The facilitated process is identified and labeled ARM™ (Accelerated Requirements Method™), a process developed in part by the author building on the works of others (e.g., Spencer [4], O’Connor [5], and Alsup [6]) and applying the process in his professional work. The centerpiece of the process is a facilitated requirements elicitation and description activity. Overall, there are three phases of the process (shown in Figure 1). They are:
1. Preparation Phase 2. Facilitated Session Phase 3. Deliverable Closure Phase.
In addition there are various assumed “Successor Activities Phase(s).”
During the Preparation Phase, planning and preparation are completed to ensure an effective session. During this activity, the overarching goals and objectives, and the preliminary scope of the effort are defined; key success measures are defined; key participants are identified; and the preliminary schedule is developed. The Preparation Phase typically has a duration of one to four days.
During the Session Phase, a trained—and content neutral—facilitator leads the selected participants through a structured process to collect the functional requirements of the project under consideration. The facilitated process employs defined scoping, brainstorming, and explanatory and prioritization techniques. This stage typically has a duration of three days.
During the Closure Phase, the key deliverables (e.g., a requirements collection) are polished, published, and
Preparation Phase Session Phase Closure Phase Successor Phase(s)Start
F i g u r e 1 . P h a s e s o f t h e f a c i l i t a t o r - d r i v e n r e q u i r e m e n t s c o l l e c t i o n p r o c e s s
0-7695-0565-1/00 $10.00 � 2000 IEEE
disseminated, and the various following activities are planned.
This facilitator-driven process is similar to the JAD (Joint Application Development or Joint Application Design) process attributed to Morris and Crawford of IBM Canada in the late 1970s (see Wood [7]). This facilitator-drive process also has certain significant differences with respect to the baseline JAD technique, which contributes to its uniqueness (e.g., in this process, the facilitators are content-neutral, the group dynamic techniques used are different from those used in JAD, the brainstorming techniques used are different, and the requirements are recorded and organized using different conceptual models).
3. Analysis Framework In order to achieve the two objectives of this paper, an
analysis framework is needed that can quickly convey the perceived efficiency of the facilitated process as well as offer a means to compare the requirements processes applied to projects of various types, sizes, and complexities. An additional aspect of the offered analysis framework is specifically included to support the claims made by this research by statistical analysis (i.e., the non-parametric Mann-Whitney U Test, referenced in MINITAB [8] and Sinich [9]).
The general analysis framework is based on two key aspects:
1. Collecting objective measures regarding a requirements collection process (in the case of the 12 projects examined in support of this paper, the measures collected were requirements yield, effort, and duration), and
2. Normalizing the collected data to conduct comparative analysis.
3.1. Normalization Technique
In order to meaningfully comp are the results of multiple
requirements collection, engineering, or management processes, it is argued that a normalization approach is necessary. Ideally the normalization process would permit valid comparison of datasets that transcend any aspect of the project type or requirements process used (e.g., the normalization technique would normalize datasets irrespective of such qualities as size of the project, technical environment, cultural considerations, skill of analysts, and the like). While it is not claimed here that the chosen normalization technique used in this investigation can transcend all such factors, the chosen technique has been used on 12 projects of similar type (i.e., commercial
software development for projects used solely within the enterprise and for which safety factors are of negligible consideration).
The normalization technique used for the comparative analysis is based on the use of a repeatable estimate of the size of the project; specifically Function Point Analysis (FPA, occasionally referred to as Albrecht’s Metrics), version 4.0. While measures of software size are inherently difficult and experience many known deficiencies (e.g., what is being measured?), FPA in comparison to many other measurement techniques (e.g., Halstead’s Metrics [10], DeMarco’s BANG [11], Putnam’s metrics [12], McCabe’s metrics [13], Booch’s metrics [14], SLOC (Source Lines of Code, in all forms), and the COCOMO Model [15]), is more widely applicable to broad numbers of contemporary project types, offers a more significant basis for comparison, and has the mechanical advantage of being stated as a number that can be used as a numerator in a ratio. However, it is important to note that FPA does have certain inherent limitations and drawbacks and cannot be construed as providing a wholly independent size measure of a project (e.g., variances in individual analysts’ judgments about certain inputs, and adjustment factors input into the FPA computations, can yield results that vary moderately).
To obtain the highest degree of comparability for this investigation—the International Function Point User Group’s Counting Practices 4.0 spreadsheet (downloadable from the group’s Web site) was used to normalize each of the 12 datasets collected for the envisioned comparative analysis.
4. Analysis Results For this investigation, 12 commercially oriented
software development projects—with a similar problem type and technology adoption—were examined. It is important to note that this investigation focused on the requirements collection process, and intentionally excluded consideration of all other aspects of the software development life cycle. For each of the 12 projects examined, objective data were collected regarding each project’s yield, effort, and duration. Of the 12 projects examined, eight applied facilitator-driven requirements collection processes and four applied the conventional Unstructured Interview Method. The experimental model used for this investigation is shown below in Figure 2 and describes the suspected relationship between the three examined factors of yield, effort, and duration. Each is explained in the following sections.
0-7695-0565-1/00 $10.00 � 2000 IEEE

4.1 Duration The duration of the requirements collection approaches
used by each of the examined projects was measured. For
purposes of this investigation, “duration” was defined as the number of regularly scheduled working days between the initiation of the requirements collection process until the end of the requirements collection process.
Adjustments were made for days when no requirements collection process participants were occupied with the requirements collection process. This measurement was collected by actual measurement of the facilitated sessions coupled with examination of various project records (e.g., journals, timesheets) for the control group. (In each case, the control group data were validated with participants to ensure that the reported data represented at least the minimum duration and effort—that is, while the experimental group’s data were based on “actuals” the control group’s data were construed to be “not less than” the reported value).
4.2. Effort The measure of effort was based on computing the
number of staff hours expended on the requirements collection process by all of the directly affected participants (specifically excluded were non-contributing observers of all types; contributing observers were included only with respect to the experimental method). This measurement was collected by actual measurement of the facilitated sessions coupled with examination of various project records (e.g., journals, timesheets) for the control group. (In each case, the control group data were
RequirementsCollectionProcess
Structured Process
Structured Questions
Content-neutral Facilitator
Collection Software & Technology
Expert & Authoritative Participants
Structural Preparation
Project Goals, Objectives, Scope
Process Participant Selection
Duration
Effort
Yield
Session-specific aspects:
Process-specific aspects:
Project-specific aspects:
F i g u r e 2 . E x p e r i m e n t a l m o d e l o f i n v e s t i g a t i o n
Plotted Comparative Yield by MethodNormal ized by Funct ion Point
0 . 0 0 0 0
0 . 1 0 0 0
0 . 2 0 0 0
0 . 3 0 0 0
0 . 4 0 0 0
0 . 5 0 0 0
0 . 6 0 0 0
0 . 7 0 0 0
0 . 8 0 0 0
0 . 9 0 0 0
1 2 3 4 5 6 7 8
O b s e r v a t i o n
Nor
mal
ize
Yie
ld b
y F
unct
ion
Poi
nt
E x p e r i m e n t a l G r o u p
Cont ro l Group
F i g u r e 3 . P l o t t e d c o m p a r a t i v e y i e l d b y m e t h o d n o r m a l i z e d b y f u n c t i o n p o i n t0-7695-0565-1/00 $10.00 � 2000 IEEE
validated with participants to ensure that the reported data represented at least the minimum duration and effort—that is, while the experimental group’s data were based on “actuals” the control group’s data were construed to be “not less than” the reported value).
4.3. Yield
The measure of yield was based on counting the
number of uniquely identified requirements collected by each examined process. Similar to the exclusion of measures of requirements quality—for purposes of this inquiry—there was no attempt to measure the relative density or complexity of any individually identified requirement (at this time, there does not exist a useful measurement nor a measuring system to measure density or complexity of an expressed requirement). For each subject project, all individually identified requirements
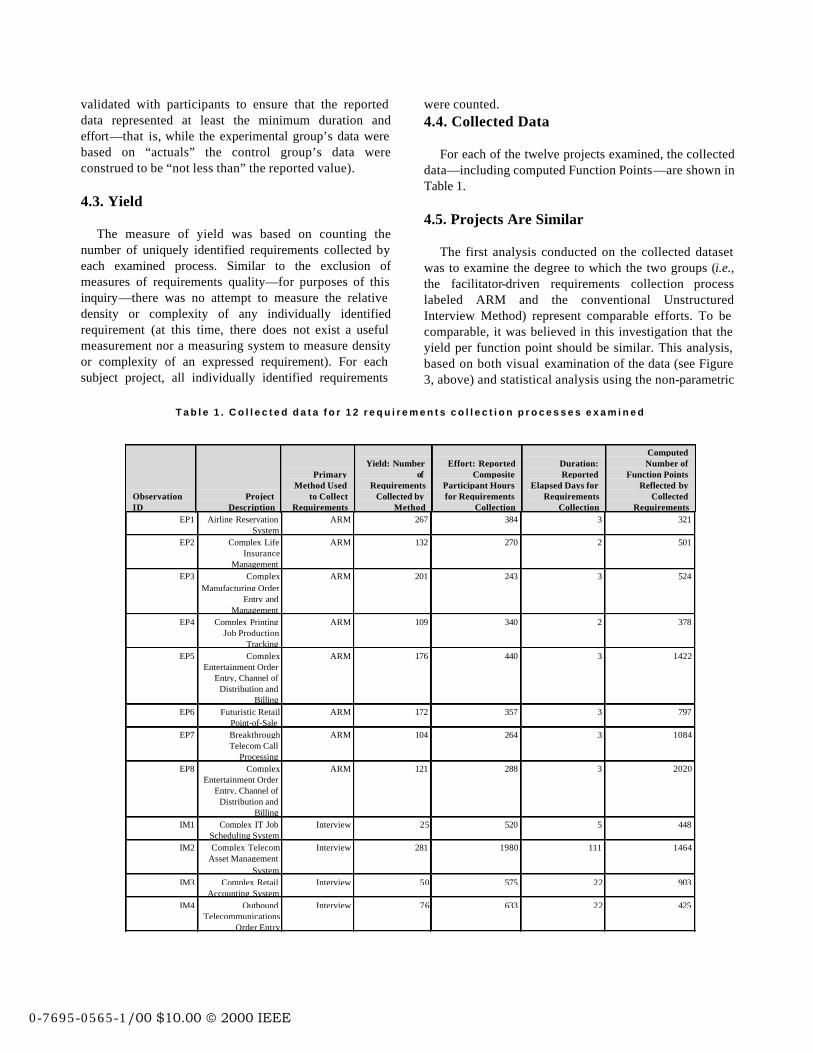
were counted. 4.4. Collected Data
For each of the twelve projects examined, the collected
data—including computed Function Points—are shown in Table 1.
4.5. Projects Are Similar
The first analysis conducted on the collected dataset
was to examine the degree to which the two groups (i.e., the facilitator-driven requirements collection process labeled ARM and the conventional Unstructured Interview Method) represent comparable efforts. To be comparable, it was believed in this investigation that the yield per function point should be similar. This analysis, based on both visual examination of the data (see Figure 3, above) and statistical analysis using the non-parametric
T a b l e 1 . C o l l e c t e d d a t a f o r 1 2 r e q u i r e m e n t s c o l l e c t i o n p r o c e s s e s e x a m i n e d
ObservationID
ProjectDescription
PrimaryMethod Used
to CollectRequirements
Yield: Numberof
RequirementsCollected by
Method
Effort: ReportedComposite
Participant Hoursfor Requirements
Collection
Duration:Reported
Elapsed Days forRequirements
Collection
ComputedNumber of
Function PointsReflected by
CollectedRequirements
EP1 Airline ReservationSystem
ARM 267 384 3 321
EP2 Complex LifeInsurance
Management
ARM 132 270 2 501
EP3 ComplexManufacturing Order
Entry andManagement
ARM 201 243 3 524
EP4 Complex PrintingJob Production
Tracking
ARM 109 340 2 378
EP5 ComplexEntertainment Order
Entry, Channel ofDistribution and
Billing
ARM 176 440 3 1422
EP6 Futuristic RetailPoint-of-Sale
ARM 172 357 3 797
EP7 BreakthroughTelecom Call
Processing
ARM 104 264 3 1084
EP8 ComplexEntertainment Order
Entry, Channel ofDistribution and
Billing
ARM 121 288 3 2020
IM1 Complex IT JobScheduling System
Interview 25 520 5 448
IM2 Complex TelecomAsset Management
System
Interview 281 1980 111 1464
IM3 Complex RetailAccounting System
Interview 50 575 22 903
IM4 OutboundTelecommunications
Order Entry
Interview 76 633 22 425
0-7695-0565-1/00 $10.00 � 2000 IEEE
Mann-Whitney U Test, confirms that the two groups are comparable. (A note regarding the use of a non-parametric approach and statistical method for this investigation: The amount of data available for this inquiry is deemed insufficient to establish conclusions regarding the nature of the distribution of the samples or population; that is, the normal distribution is not assumed to be valid for this dataset. Therefore, parametric methods (e.g., Chi Square, Student t) are deemed to be inappropriate in support of the analysis objectives of this paper. Of the frequently used non-parametric methods (e.g., Wilcoxon Signed Rank Test, Kruskal-Wallis H Test, Friedman Fr Test) the Mann-Whitney U Test was chosen as it offers the strongest measure of the equality or inequality of two population medians—similar in intent to the parametric, Student t test.)
The two groups were examined statistically with the hypothesis that the facilitator-driven normalized yield was not equal to the Unstructured Interview Method. At alpha = 5%, the null hypothesis could not be rejected, and it is therefore concluded that the two groups are similar with respect to yield. These results are shown in Figure 4, following.
STATISTICAL TEST 1. EG Yield to CG Yield. H(a) There is a difference between EG and CG. Mann-Whitney Confidence Interval and Test EG Yield N = 8 Median = 0.2397 CG Yield N = 4 Median = 0.1173 Point estimate for ETA1-ETA2 is 0.0906 96.6 Percent CI for ETA1-ETA2 is (-0.0828,0.6400) W = 62.0 Test of ETA1 = ETA2 vs ETA1 not = ETA2 is significant at 0.1066 Cannot reject at alpha = 0.05
Figure 4. Statistical analysis results of comparative, normalized yields
4.6. Efficiency Analysis For purposes of this paper, two types of efficiency
measures are examined: • Yield Efficiency by Effort, and • Yield Efficiency by Duration.
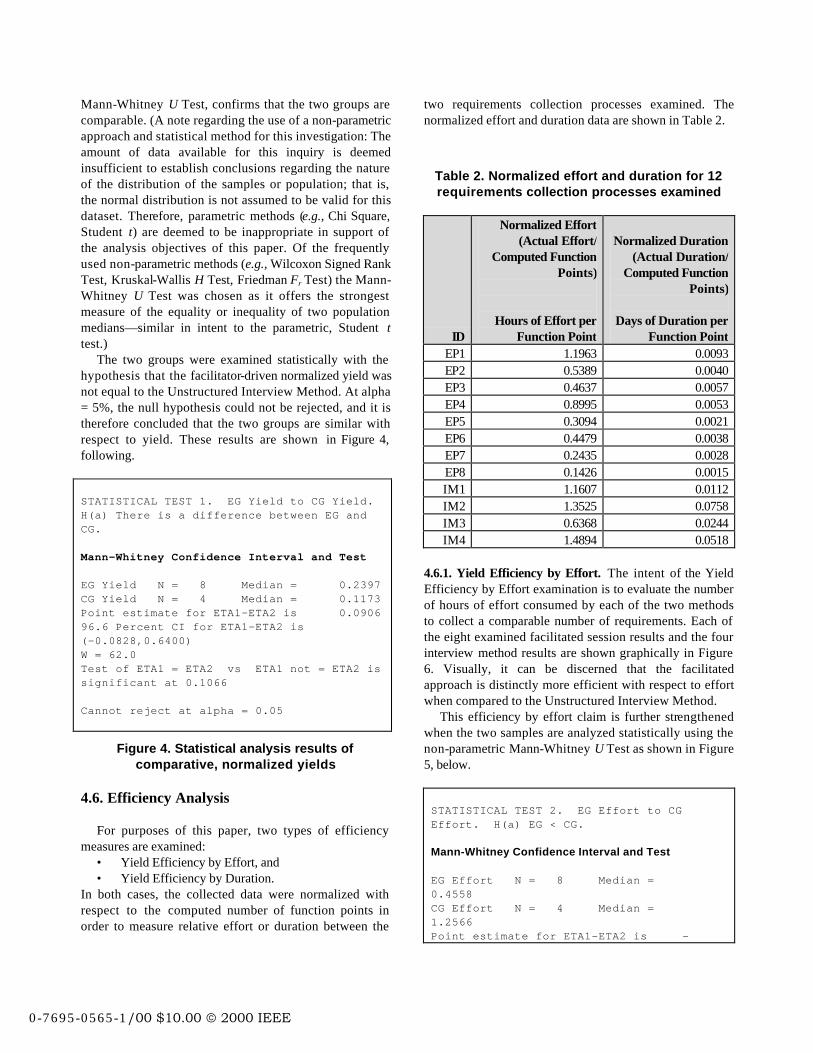
In both cases, the collected data were normalized with respect to the computed number of function points in order to measure relative effort or duration between the
two requirements collection processes examined. The normalized effort and duration data are shown in Table 2.
Table 2. Normalized effort and duration for 12 requirements collection processes examined
ID
Normalized Effort (Actual Effort/
Computed Function Points)
Hours of Effort per Function Point
Normalized Duration (Actual Duration/
Computed Function Points)
Days of Duration per
Function Point EP1 1.1963 0.0093 EP2 0.5389 0.0040 EP3 0.4637 0.0057 EP4 0.8995 0.0053 EP5 0.3094 0.0021 EP6 0.4479 0.0038 EP7 0.2435 0.0028 EP8 0.1426 0.0015 IM1 1.1607 0.0112 IM2 1.3525 0.0758 IM3 0.6368 0.0244 IM4 1.4894 0.0518
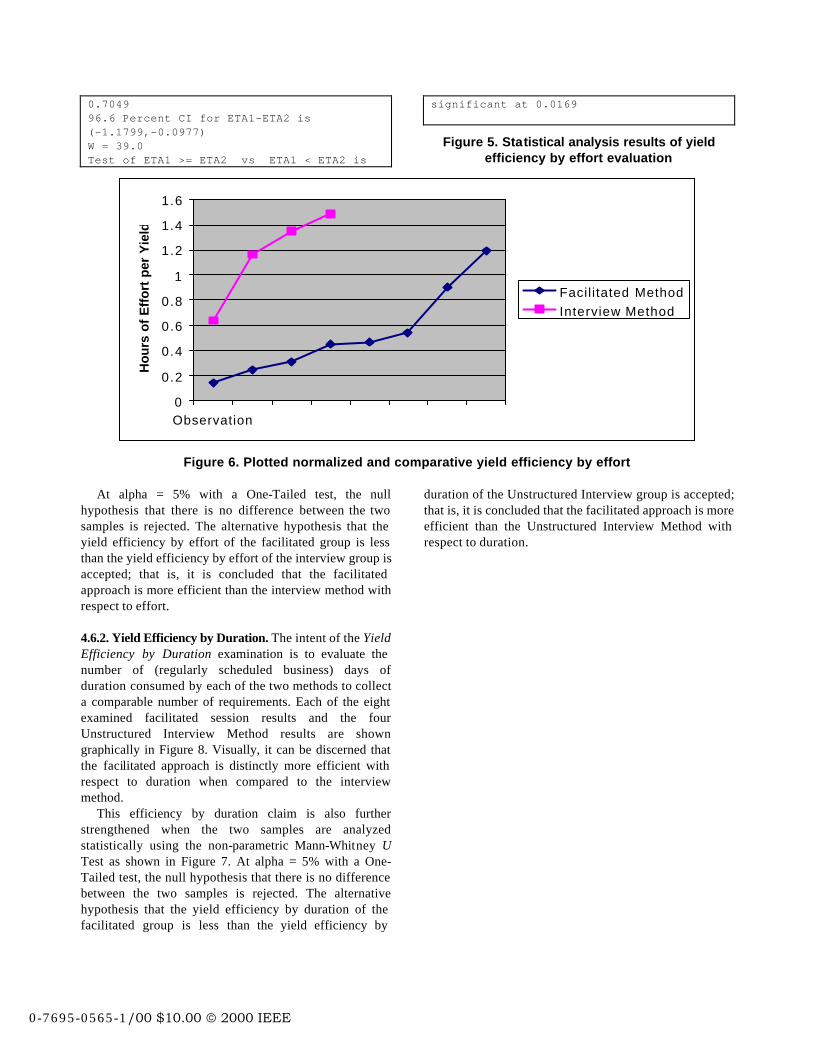
4.6.1. Yield Efficiency by Effort. The intent of the Yield Efficiency by Effort examination is to evaluate the number of hours of effort consumed by each of the two methods to collect a comparable number of requirements. Each of the eight examined facilitated session results and the four interview method results are shown graphically in Figure 6. Visually, it can be discerned that the facilitated approach is distinctly more efficient with respect to effort when compared to the Unstructured Interview Method.
This efficiency by effort claim is further strengthened when the two samples are analyzed statistically using the non-parametric Mann-Whitney U Test as shown in Figure 5, below.
STATISTICAL TEST 2. EG Effort to CG Effort. H(a) EG < CG. Mann-Whitney Confidence Interval and Test EG Effort N = 8 Median = 0.4558 CG Effort N = 4 Median = 1.2566 Point estimate for ETA1-ETA2 is -
0-7695-0565-1/00 $10.00 � 2000 IEEE
0.7049 96.6 Percent CI for ETA1-ETA2 is (-1.1799,-0.0977) W = 39.0 Test of ETA1 >= ETA2 vs ETA1 < ETA2 is
significant at 0.0169
Figure 5. Statistical analysis results of yield efficiency by effort evaluation
0
0.2
0.4
0.6
0.8
1
1.2
1.4
1.6
Observation
Hou
rs o
f Eff
ort p
er Y
ield
Facil itated MethodInterview Method
Figure 6. Plotted normalized and comparative yield efficiency by effort
At alpha = 5% with a One-Tailed test, the null hypothesis that there is no difference between the two samples is rejected. The alternative hypothesis that the yield efficiency by effort of the facilitated group is less than the yield efficiency by effort of the interview group is accepted; that is, it is concluded that the facilitated approach is more efficient than the interview method with respect to effort.
4.6.2. Yield Efficiency by Duration. The intent of the Yield Efficiency by Duration examination is to evaluate the number of (regularly scheduled business) days of duration consumed by each of the two methods to collect a comparable number of requirements. Each of the eight examined facilitated session results and the four Unstructured Interview Method results are shown graphically in Figure 8. Visually, it can be discerned that the facilitated approach is distinctly more efficient with respect to duration when compared to the interview method.
This efficiency by duration claim is also further strengthened when the two samples are analyzed statistically using the non-parametric Mann-Whitney U Test as shown in Figure 7. At alpha = 5% with a One-Tailed test, the null hypothesis that there is no difference between the two samples is rejected. The alternative hypothesis that the yield efficiency by duration of the facilitated group is less than the yield efficiency by
duration of the Unstructured Interview group is accepted; that is, it is concluded that the facilitated approach is more efficient than the Unstructured Interview Method with respect to duration.
0-7695-0565-1/00 $10.00 � 2000 IEEE

STATISTICAL TEST 3. EG Duration to CG Duration. H(a) EG < CG. Mann-Whitney Confidence Interval and Test EG Duration N = 8 Median = 0.00390 CG Duration N = 4 Median = 0.03810 Point estimate for ETA1-ETA2 is -0.03270 96.6 Percent CI for ETA1-ETA2 is (-0.07200,-0.00720) W = 36.0 Test of ETA1 >= ETA2 vs ETA1 < ETA2 is significant at 0.0042
Figure 7. Statistical analysis results of yield efficiency by duration evaluation
5. Conclusions and Recommendations In this paper, an analysis framework that enables the
comparison of multiple requirements collection processes is offered. The analysis framework is based on a normalization process further enriched by statistical analysis. The developed framework was used as the means to evaluate the relative efficiency of a specific facilitator-driven requirements collection process (labeled ARM™) with respect to the conventional, Unstructured Interview Method.
The evaluation was based on a comparative examination of the results of eight facilitator-driven requirements collection processes and four interview method processes with respect to three measures: yield, effort, and duration. The evaluation of these 12 subjects leads to the conclusion that the facilitator-driven approach is considerably more efficient than the interview
0
0.01
0.02
0.03
0.04
0.05
0.06
0.07
0.08
Observation
Day
s of
Dur
atio
n pe
r Y
ield
Facilitated MethodInterview Method
Figure 8. Plotted normalized and comparative yield efficiency by duration
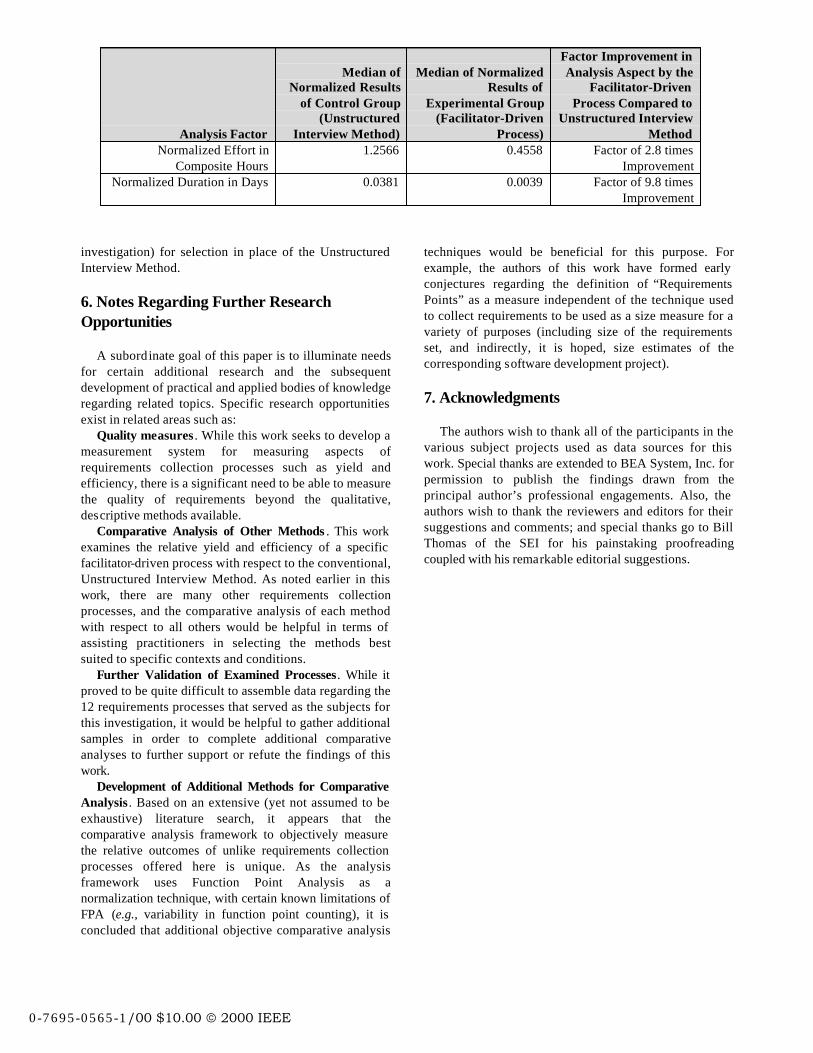
method with respect to two measures of efficiency: (a) yield efficiency by effort and (b) yield efficiency by duration.
These results are summarized in Table 3. Within the defined scope of this investigation (i.e.,
commercially oriented software development projects intended to produce an application for use within the sponsoring enterprise and for which safety is not a material consideration), the benefits to business of these findings can be significant. For projects similar in scope and nature to the commercial development ones examined in this inquiry—the facilitator-driven method appears to offer considerable time-savings advantages as compared
to the conventional interview method (with comparable yields). These advantages can have material commercial-related, as well as project-related, effects in settings where “time-to-market” and efficient use of key staff and executive resources are essential. (It is important to note that, in some instances, these benefits could be overcome by the additional skill—and therefore extra cost—needed to engage the services of a trained and experienced facilitator.)
In summary, it is recommended that facilitator-driven approaches be evaluated by software development project teams (for projects within the defined scope of this
0-7695-0565-1/00 $10.00 � 2000 IEEE
investigation) for selection in place of the Unstructured Interview Method.
6. Notes Regarding Further Research Opportunities
A subordinate goal of this paper is to illuminate needs
for certain additional research and the subsequent development of practical and applied bodies of knowledge regarding related topics. Specific research opportunities exist in related areas such as:
Quality measures . While this work seeks to develop a measurement system for measuring aspects of requirements collection processes such as yield and efficiency, there is a significant need to be able to measure the quality of requirements beyond the qualitative, descriptive methods available.
Comparative Analysis of Other Methods . This work examines the relative yield and efficiency of a specific facilitator-driven process with respect to the conventional, Unstructured Interview Method. As noted earlier in this work, there are many other requirements collection processes, and the comparative analysis of each method with respect to all others would be helpful in terms of assisting practitioners in selecting the methods best suited to specific contexts and conditions.
Further Validation of Examined Processes. While it proved to be quite difficult to assemble data regarding the 12 requirements processes that served as the subjects for this investigation, it would be helpful to gather additional samples in order to complete additional comparative analyses to further support or refute the findings of this work.
Development of Additional Methods for Comparative Analysis . Based on an extensive (yet not assumed to be exhaustive) literature search, it appears that the comparative analysis framework to objectively measure the relative outcomes of unlike requirements collection processes offered here is unique. As the analysis framework uses Function Point Analysis as a normalization technique, with certain known limitations of FPA (e.g., variability in function point counting), it is concluded that additional objective comparative analysis
techniques would be beneficial for this purpose. For example, the authors of this work have formed early conjectures regarding the definition of “Requirements Points” as a measure independent of the technique used to collect requirements to be used as a size measure for a variety of purposes (including size of the requirements set, and indirectly, it is hoped, size estimates of the corresponding software development project).
7. Acknowledgments The authors wish to thank all of the participants in the
various subject projects used as data sources for this work. Special thanks are extended to BEA System, Inc. for permission to publish the findings drawn from the principal author’s professional engagements. Also, the authors wish to thank the reviewers and editors for their suggestions and comments; and special thanks go to Bill Thomas of the SEI for his painstaking proofreading coupled with his remarkable editorial suggestions.
Analysis Factor
Median ofNormalized Results
of Control Group(Unstructured
Interview Method)
Median of NormalizedResults of
Experimental Group(Facilitator-Driven
Process)
Factor Improvement inAnalysis Aspect by the
Facilitator-DrivenProcess Compared to
Unstructured InterviewMethod
Normalized Effort inComposite Hours
1.2566 0.4558 Factor of 2.8 timesImprovement
Normalized Duration in Days 0.0381 0.0039 Factor of 9.8 timesImprovement
0-7695-0565-1/00 $10.00 � 2000 IEEE
References
[1] Goguen, Joseph, A., Linde, Charlotte, “Techniques for Requirements Elicitation,” Proc. Int’l Symp. Requirements Engineering, 1993, pp. 152-164. [2] Davis, A., Overmyer, S., Jordan, K., Caruso, J., Dandashi, F., Dinh, A., Kincaid, G., Ledeboer, G., Reynolds, P., Srimani, P., Ta, A., Theofanos., M., “Identifying and Measuring Quality in Software Requirements Specification,” First Int’l Software Metrics Symp , 1993. [3] R. Hubbard, Design, Implementation and Evaluation of a Process to Structure the Collection of Software Project Requirements, Doctoral Dissertation, Colorado Technical University, 1999. [4] L. J. Spencer, Winning Through Participation. Dubuque, IA: Kendall/Hunt Publishing Co., 1989. [5] J. O’Connor and J. Seymour, Introducing NLP Neuro -Linguistic Programming, Revised Edition ed. London, England: Aquarian Press, 1993. [6] F. Alsup and R. Hubbard, Conclusions from Exploratory Discussion Regarding Software Requirements Elicitation (Results recorded in individual notes, not a published work). [7] J. Wood and D. Silver, Joint Application Development, 2nd ed. New York, NY: John Wiley & Sons, Inc., 1995. [8] Student Edition of MINITAB for Windows, Release 12. MINITAB, Inc., State College, PA., 1998. [9] T. Sincich, Statistics by Example. San Francisco, CA: Dellen Publishing Co., 1987. [10] M. H. Halstead, Elements of Software Science. New York: Elsevier Press, 1977. [11] T. DeMarco, Controlling Software Projects. Englewood Cliffs, NJ: Prentice-Hall, Inc., 1982. [12] L. H. Putnam, W. Myers, Measures for Excellence: Reliable Software On Time, Within Budget. Englewood Cliffs, NJ: Yourdon Press. [13] T. J. McCabe, “A Complexity Measure,” IEEE Trans. On Software Engineering, Vol. SE-2, No. 4, December 1976. [14] G. Booch, Object-Oriented Analysis and Design—with Applications, 2nd Ed, Redwood City, CA: Benjamin/Cummings Publishing Company, Inc., 1994. [15] B. W. Boehm, Software Engineering Economics. Englewood Cliffs, NJ: Prentice-Hall, 1981.
0-7695-0565-1/00 $10.00 � 2000 IEEE