An Assessment of the Economic Impact of the United States
66
An Assessment of the Economic Impact of the United States - Vietnam Bilateral Trade Agreement This report represents STAR-Vietnam's professional analysis in cooperation with appropriate government counterparts based on available information. It does not in any way represent an official interpretation of the BTA or monitoring of the BTA implementation process by either the United States or Vietnamese governments.
-
Upload
khangminh22 -
Category
Documents
-
view
0 -
download
0
Transcript of An Assessment of the Economic Impact of the United States

An Assessment of the Economic Impact of the United States - Vietnam Bilateral Trade
Agreement
This report represents STAR-Vietnam's professional analysis in cooperation with appropriate government counterparts based on available information. It
does not in any way represent an official interpretation of the BTA or monitoring of the BTA implementation process by either the United States or
Vietnamese governments.

An Assessment of the Economic Impact of the United States - Vietnam Bilateral Trade Agreement
84
TABLE OF CONTENTS
Acknowledgements 85 Executive Summary 87 I. Introduction 91 II. Vietnam’s International Trade and Foreign Investment: Policy and
Performance 93 1. Protecting import-competing industry 93 2. Promoting exports 97 3. Vietnam’s recent macroeconomic performance 100 4. International trade performance 103 5. International investment 106 III. The BTA and the Bilateral Economic Relationship 110 1. The BTA and the principle of reciprocity 110 2. Key characteristics of the BTA: obligations and BTA-related policy
reforms 111 3. Bilateral trade and investment: trends and recent developments 117 4. The U.S. market for Vietnamese exports 124 IV. Exporting to the U.S. Under the BTA: The Perspective of Vietnamese
Businesses 131 1. Clothing exporters 131 2. Footwear and leather goods exporters 132 3. How the U.S. business community in Vietnam views the BTA 134 4. Summing up the survey of businesses 135 V. Conclusion 136 VI. Postscript 138 References 143
Executive Summary
85
Tables
Table 1: Products Subject to Quantitative Restriction 94 Table 2: Nominal Tariffs in Vietnam 95 Table 3: Nominal and Effective Tariff Rates by Sector in Vietnam: 1997 and 2002 96 Table 4: Sectoral Growth Rates, Contributions to GDP and Shares in GDP 101 Table 5: Total and Manufacturing GDP by Ownership: 1995 and 2001 102 Table 6: The Number of Private Companies by Type and Sector 102 Table 7: Newly Established Firms since the Enterprise Law 103 Table 8: Export and Import Growth Rates, Shares in GDP and the Trade Deficit 104 Table 9: The Commodity Composition of Exports and Imports: 1995-2002 106 Table 10: FDI and the Capital Account 108 Table 11: The Sector Composition of Foreign Direct Investment Disbursements 109 Table 12: Bilateral Trade Between Vietnam and the US: 1996 to 2002 118 Table 13: MFN and General U.S. Tariff Rates, and Shares in Exports to the EU,
Japan and the U.S. 119 Table 14: The Composition of Vietnamese Exports to the US: 1996 to 2002* 120 Table 15: The composition of Vietnamese Imports from the US: 1996 to 2002* 121 Table 16: Foreign Direct Investment in Vietnam as of December 20, 2002 122 Table 17: US Foreign Direct Investment in Vietnam by Sector as of June 20, 2002 123 Table 18: U.S. Imports of Textiles and Clothing by Country of Origin, 2000 125 Table 19: Asian Exports to the US and the EU in 2000 128 Table 20: Clothing Exports of Selected Asian Countries in 2000 129 Table 21: The Rate of Growth of Vietnamese Exports to the U.S.
by Commodity in the First Months of 2003 141 Table 22: The Rate of Growth of Vietnamese Imports from the U.S.
by Commodity Category in the First Months of 2003 143 Table 23: U.S. Foreign Direct Investment in the First Months of 2003 143 Figures Figure 1: Trade Taxes as a Share of Tax Revenue 96 Figure 2: Effective Rates of Protection in Manufacturing: Selected Southeast Asian
Countries 97 Figure 3: GDP Growth and Inflation: 1996-2002 100 Figure 4: The Share of East and Southeast Asia in Vietnam's Exports and Imports 104 Figure 5: Anti-dumping duty orders in effect on 31 December 2000 126 Figure 6: Countervailing duty orders in effect on 31 December 2000 127

NOTE BY THE PUBLISHER
he Bilateral Trade Agreement between the United States of America and the Socialist Republic of Vietnam, herein called the United States - Vietnam Bilateral Trade Agreement came into force on December 10, 2001 and has
advanced the bilateral trade and investment relations between the United States and Vietnam to new heights. The United States - Vietnam Bilateral Trade Agreement creates opportunities for Vietnamese enterprises to enter into the vast markets of the United States, helping to develop traditional products in which Vietnam has comparative advantage. Implementing the commitments made in the United States - Vietnam Bilateral Trade Agreement, as well, helps Vietnam to improve its business environment in conformity with international best practices and to accede to World Trade Organization. At the same time, however, it presents new competitive challenges that are strong and complex.
In an effort to provide an initial assessment of the positive benefits as well as
remaining challenges and the need for timely adjustments following the first year of BTA implementation, STAR Vietnam in co-operation with the Central Institute of Economic Management has prepared an annual economic report for 2002 with the title of An Assessment of the Economic Impact of the United States - Vietnam Bilateral Trade Agreement.
The National Political Publishing House hopes that this publication will provide
readers who are interested in this area with important, up-to-date and useful information.
Hanoi, June 2003 THE NATIONAL POLITICAL PUBLISHING HOUSE
T
An Assessment of the Economic Impact of the United States - Vietnam Bilateral Trade Agreement
84
ACKNOWLEDGEMENTS
his Report was prepared by Professor James Riedel, Senior Economic Advisor, and Mr. Steve Parker, Project Director, of the USAID-funded STAR-Vietnam Project, working in cooperation with the Vietnam Central Institute of Economic
Management (CIEM). The report was prepared at the request of the Vietnamese Government Steering Committee for Technical Assistance on BTA Implementation and USAID. Funding for this report was provided by the U.S. Agency for International Development (O6
The authors were assisted by the staff of the STAR project, including: Mr. Phan Vinh Quang, Assistant Project Director; Ms. Do Hoang Anh, Policy and Training Specialist; Ms. Trinh Kieu Trang, Administrative Assistant; and, Mr. Nguyen Duy Minh, Translator. The report benefited from a number of insightful comments and suggestions on an earlier draft and from guidance by Mr. Nguyen Thu Do of our Government Steering Committee and Ms. Jean Gilson, Country Manager of USAID, Vietnam. A preliminary draft of the report was presented at a workshop organized and hosted by CIEM, at which many participants offered comments and suggestions, including: Dr. Dinh Van An, President of CIEM; Dr. Le Xuan Ba, Vice President of CIEM; Dr. Le Dang Doanh, Senior Advisor to MPI; Dr. Vo Tri Thanh, CIEM and, Mr. Vo Van Thuy, Vietnam Institute for Trade of the Ministry of Trade. In addition we are grateful for the written comments and suggestions of: Dr. Susan Adams, IMF; Dr. Ramesh Adhikari, ADB; Mr. John Bentley, Mr. Hank Baker and Ms. Helle Weeke of the STAR-Vietnam Project; Mr. Fred Burke, Baker & McKenzie and Legal Advisor to STAR; Ms. Pham Thi Le Dung, USAID; Mr. Demetrios Marantis, U.S.-Vietnam Trade Council; and, Ms. Claire Pierangelo and Ms. Jessica Adkins, U.S. Embassy and Mr. Michael Cavanaugh, U.S. Consulate in Ho Chi Minh City.
As well, the Report has benefited greatly from the efforts of: Ms. Phan Thanh Ha CIEM and the main coordinator for STAR/CIEM cooperation; Ms. Nguyen Thi Kim Chi, CIEM; Mr. Pham Hoang Ha, CIEM; and Ms. Tran Thi Kim Chi, translator. All remaining errors and omissions, and of course the interpretations and opinions expressed in the Report, are the sole responsibility of the authors.
T
EXECUTIVE SUMMARY
his is the first annual assessment of the economic impact of the United States - Vietnam Bilateral Trade Agreement (hereafter BTA or the Agreement) conducted by STAR-Vietnam in cooperation with Vietnam’s Central Institute of
Economic Management. The BTA came into force on 10 December 2001 (“entry into force”). The BTA serves two purposes: (1) it establishes the rules that apply to trade and investment relations between the contracting parties, and (2) it enumerates the trade and investment commitments made by each party (agreed upon reductions or elimination of barriers to trade and investment). Much of the work of STAR-Vietnam over the past year has been the provision of technical assistance to the Government of Vietnam on legal issues related to the implementation of the BTA.1 A further responsibility of STAR-Vietnam is to conduct ongoing analysis of the economic impact of the Agreement, to which aim this report contributes.
Reciprocity is a fundamental principle of every trade agreement, and so too is it fundamental to the BTA. In the more than 100 pages of text and annexes that comprise the Agreement, both parties make numerous and significant commitments with respect to their trade and investment regimes and their legal systems, which in many cases are similar to those required by the WTO. The commitments made by the U.S. and Vietnam, however, are quite different for each party in terms of its scope and timing, largely because of the different levels of development of their legal systems and trade regimes. As a result, the scope and timing of the economic impact on each country from full implementation of the BTA will differ as well.
Because the U.S. is a founding member of the WTO and was a member of the GATT long before the WTO came into being, its legal system and trade regime already had been adjusted to meet the BTA commitments at the time of entry into force. Thus, the principal change made by the U.S. was to grant Vietnam Normal Trade Relations (NTR) or Most Favored Nation (MFN) access to the U.S. market immediately upon entry into force of the Agreement—in other words, to treat Vietnam no less favorably than it treats any of its other trading partners. With the granting of MFN status, U.S. tariffs on imports from Vietnam fell dramatically and immediately, on average from around 40 percent to around 3-4 percent, for the first time opening up the U.S. market
1. The STAR-Vietnam Project, which is funded by the U.S. Agency for International
Development, began operations in Vietnam in mid-October 2001 with the objective of providing technical assistance to support Vietnam’s effective and timely implementation of the BTA. STAR Project activities completed in 2002 and planned for 2003 are described in the Workplan for 2003, which was approved by the Government Steering Committee for Technical Assistance on BTA Implementation. The development of the STAR Project is documented in the Project Document submitted to the Vietnamese government for project approval.
T
An Assessment of the Economic Impact of the United States - Vietnam Bilateral Trade Agreement
86
for many products in which Vietnam has a strong comparative advantage (in particular, labor-intensive manufactures).
In response to the new opportunities afforded by the BTA, Vietnamese exports to the U.S. increased by 128 percent in 2002 compared to 2001, while over the same time Vietnam’s exports to the world as a whole increased by only 10 percent. Indeed, about 90 percent of the incremental increase in Vietnamese total exports in 2002 was attributable to the increase in exports to the United States. Not surprisingly, exports of manufactures, which had been most severely restrained by high U.S. tariffs before the BTA, grew disproportionately at an impressive rate of over 500 percent on an annual basis. Within manufacturing, the biggest gainer was clothing exports, which increased to around $900 million in 2002, an 18-fold increase over the amount exported in 2001. While clothing became Vietnam’s single largest export to the United States, dramatic increases in exports of many other manufactured products were also recorded in 2002, such as electrical appliances (270%), furniture (499%), travel goods (5422%) and miscellaneous manufactures (847%). The findings of this report suggest that Vietnam’s exports to the U.S. should continue to grow strongly well into the future, spurred over time by expected increases in investment in export-oriented sectors resulting both from increased demand for exports to the U.S. market and from an improved investment environment in part resulting from full implementation of the BTA.
For Vietnam, although the scope of commitments made in the BTA is extensive, with a number of important changes required upon entry into force of the Agreement, consideration is given to Vietnam’s status as a developing country by allowing for a number of other commitments to be phased in over time. Although the bulk of Vietnam’s commitments are scheduled for implementation within three to four years after entry into force (by December 2004 or 2005), the phasing in of a few commitments extends out to as long as ten years (by December 2011). Many BTA commitments made by Vietnam will require substantial changes in its laws, regulations and administrative procedures and its institutional capacity to implement those changes. These commitments will bring Vietnam much more closely into conformity with international trade norms and standards, and the “applicable rules of customary international law” in many realms of commercial relations, including with regard to the transparency of laws and regulations, intellectual property rights protection, commercial dispute settlement, market access for trade in services, foreign investment regulation, customs procedures and business facilitation.
Most of the impact of the phased-in implementation of Vietnam’s BTA commitments on U.S. trade and investment is expected to be realized over a number of years – noting in particular that Vietnam applied MFN-level tariffs on imports from the U.S. well before entry into force of the BTA. Nevertheless, U.S. exports to Vietnam in 2002, the first year under the BTA, increased by 26 percent, remaining on trend from the previous years even though overall U.S. exports and global trade in general weakened in 2002. Furthermore, U.S. FDI (commitments) in Vietnam increased in 2002, albeit from a relatively low base. As Vietnam’s full obligations under the BTA are implemented, one can expect that bilateral trade and the role of U.S. investment in Vietnam will expand even further to the mutual benefit of both countries.
Carrying out the BTA commitments will contribute importantly to Vietnam’s stated goal of integration into the world economy. The BTA is, however, not the only
Executive Summary
87
instrument Vietnam is using to liberalize international trade and investment policy. It has been engaged for years in trade and investment liberalization unilaterally, and has recently liberalized regionally through participation in the ASEAN Free Trade Area. Vietnam has also stated an intention to make the reforms that will be required to join the WTO, many of which mirror similar commitments in the BTA.
It is useful, therefore, to consider the BTA and its economic effects not in isolation but rather within the context of the overall efforts of the government to integrate into the world economy. This report begins, therefore, with an assessment of Vietnam’s overall international trade and investment policy and performance. It then goes on to review the content of the BTA and to assess its impact on bilateral trade and investment flows. This assessment relies not only on the officially published trade and investment statistics of the two countries, but also on the experiences of Vietnamese businessmen/women engaged in exploiting the commercial opportunities created by the BTA, whose viewpoints were obtained through a series of interviews conducted by STAR in conjunction with CIEM. Since the relative impact of the first year’s implementation of the BTA will be stronger on the Vietnamese economy than on the U.S. economy, this first report on the economic impact of the BTA focuses almost exclusively on the Vietnamese economy.
The review of overall international trade and investment policy and performance clearly reveals a policy of liberalization toward the goal of integration into the world economy. In recent years, trading rights have been expanded and most quantitative restrictions on trade have been eliminated. Although the average tariff rate has not been reduced, the dispersion of tariff rates has declined somewhat, albeit remaining relatively high. As a result, although the average nominal tariff of about 16 percent is not especially high as compared to other developing countries, the average effective tariff (about 70 percent) is quite high. In many respects, the effective tariff is more important than the nominal tariff because it reveals how the overall tariff structure affects the distribution of resources in the direction of industries in which the country lacks a comparative advantage. Previous studies of the effective rate of protection in Vietnam have also concluded that the trade regime contains a strong “anti-export bias.” In this report, we question that conclusion, suggesting instead that whatever anti-export bias there is stems more importantly from the overall policy framework and the relatively high cost of infrastructure services than from the trade regime per se.
Our review of the trade sector and the economy more broadly indicates a structure of production and trade that is somewhat anomalous for a country with Vietnam’s resource endowment and level of development. One anomaly is the relatively small share of manufacturing in domestic production and exports. Within manufacturing, another anomaly is the relatively small share contributed by small and medium sized (SMEs), export-oriented companies, particularly private ones. Although there are these anomalies, it is also apparent that the manufacturing sector is growing in importance and that the role of export-oriented SMEs is expanding, especially in the last few years. This is in part the result of measures taken by the government to make the “playing field” for private companies more level, such as the adoption of the new Enterprise Law. However, it is our contention that another important obstacle to export-oriented manufacturing has been the lack of MFN access to the world’s largest market for labor-
An Assessment of the Economic Impact of the United States - Vietnam Bilateral Trade Agreement
88
intensive manufactures, the United States. With the implementation of the BTA, a major obstacle to export-oriented industrialization, and thus most likely also private-sector development, has been eliminated.
The BTA, by conferring the right to export to the U.S. on an MFN basis, has opened up enormous opportunities for Vietnam to expand exports, especially those exports that were most severely restrained by the high level of non-MFN tariffs that applied prior to the BTA, mainly labor-intensive manufactured products. In spite of these opportunities, a great deal of pessimism about the prospects for Vietnamese companies to expand exports to the U.S. prevailed when the BTA was ratified and brought into force in 2001. A commonly held view was that Vietnamese companies lacked the experience, know-how, and information needed to penetrate the large, sophisticated and distant market of the United States.
Vietnam’s strong export response to the BTA in 2002 suggests that much of this pessimism was overstated. The same story told by the trade statistics was revealed by the Vietnamese business managers we interviewed in two important sectors, clothing and footwear. Almost all managers interviewed recognized that the BTA created enormous opportunities for expanding production and exports. Contrary to the often-expressed pessimism, almost none of those interviewed found it particularly difficult to locate customers in the United States. Indeed, most indicated that they had more demand in the U.S. market than they could satisfy. Instead, the main constraint that they face in expanding exports further is insufficient production capacity, a constraint they are working hard to remove through ambitious plans for investments to expand and upgrade plant and equipment.
While the trade statistics and interviews with exporters give a glowing picture of market opportunities in the U.S. opened up by the BTA, another form of pessimism emerged in Vietnam over the course of the first year of BTA implementation, stemming mainly from the publicity surrounding the U.S. anti-dumping case against Vietnamese “catfish” and the negotiations with the U.S. on clothing and textile export quotas. Anti-dumping duties on Vietnamese fish, should they be imposed at the conclusion of the investigation, may well constrain the industry, and it is also possible that the growth in clothing exports will be limited by the U.S. export quotas when they are imposed.
The fact remains, however, that the U.S. is the world’s single largest and perhaps the most open market for manufactures exports from developing countries. U.S. imports of most manufactured products from developing countries, including clothing and textiles, exceed by fifty percent or more the imports of similar products by the European Union, in spite of the fact that the gross income of the EU exceeds that of the United States. “Catfish” and clothing are concerns for Vietnamese producers and government officials, as such concerns are for producers and officials in many other countries that have had similar disputes with the U.S., but the fact remains that the U.S. market offers the greatest opportunity for Vietnam to expand exports.
A Postscript is appended to this Report to provide an update of trade and investment flows for the first two months of 2003 and to respond to several important comments made by reviewers of earlier drafts of this Report.
Vietnam's International Trade and Foreign Investment: Policy and Performance
89
I. INTRODUCTION
This report is the first annual assessment of the economic impact of the United States - Vietnam Bilateral Trade Agreement (hereafter BTA) to be conducted by the STAR-Vietnam Project in cooperation with Vietnam’s Central Institute of Economic Management. Coming as it does just a year after the BTA went into effect, this assessment is necessarily tentative, since the economic impact of the BTA is for the most part yet to be observed.
The BTA serves two purposes. First, it establishes, and makes legally binding, the rules that apply to trade and investment between the contracting parties. Second, it serves as an instrument of trade liberalization, since in the process of negotiating the BTA each country made “concessions” (promises to reduce or eliminate certain barriers to trade) to the other on a reciprocal basis. The BTA includes an extensive set of commitments by both parties with regard not only to tariffs and quotas on trade in goods, but also to the transparency of laws and regulations, intellectual property rights protection, commercial dispute settlement, market access for trade in services, foreign investment regulation, customs procedures and business facilitation.
The BTA is not, of course, the only instrument Vietnam has employed to liberalize trade. It has been implementing trade liberalization unilaterally for more than a decade and more recently regionally through participation in the ASEAN Free Trade Area (AFTA). Vietnam, as well, has committed to join the WTO. It is, therefore, useful at this stage to begin our analysis with a review of Vietnam’s overall economic performance with an emphasis on international trade and investment policy and performance, which we do in Chapter II.
Chapter III provides a summary of the BTA and reviews some of the BTA-related legal and policy reforms made by Vietnam. The chapter also reviews the level and rate of growth of bilateral trade and investment flows from the mid-1990s to the end of 2002, showing that overall Vietnamese exports to the U.S. more than doubled in 2002 in response to the opportunities opened by the BTA, while exports of manufactures grew by more than 500 percent. It concludes with an assessment of the obstacles and opportunities to the expansion of manufactured exports to the U.S. market.
Even though the BTA has been in effect for little more than one year, many Vietnamese companies—state-owned, private and foreign-invested—are responding to the opportunities opened up by the BTA, some more successfully than others. Chapter IV reports the findings of an initial series of interviews undertaken by STAR, in conjunction with the CIEM, of Vietnamese firms exporting, or planning to export, to the United States. We find that many of the early concerns shared by both business managers and government officials in Vietnam about the difficulty of accessing the U.S.
An Assessment of the Economic Impact of the United States - Vietnam Bilateral Trade Agreement
90
market have proved unwarranted for a number of sectors where Vietnam has a strong comparative advantage. The views of a sample of American businessmen/women working in Vietnam on how the BTA has influenced the business environment in Vietnam and business prospects for the future is also reported in Chapter IV. We conclude in Chapter V with a summary of findings and suggestions for future research and analysis of the impact of the BTA as more and more provisions of the Agreement come into effect over time. A postscript is added that assesses bilateral trade and investment in the first two months of 2003.
Vietnam's International Trade and Foreign Investment: Policy and Performance
91
II. VIETNAM’S INTERNATIONAL TRADE AND FOREIGN INVESTMENT: POLICY AND PERFORMANCE
Vietnam has a stated goal of integrating into the world economy, and has taken measures unilaterally and within regional and bilateral trade agreements to achieve that goal. International economic integration implies a policy of liberalization of international trade and investment, and certainly the overall direction of trade policy in Vietnam is one of liberalization. Nevertheless, while many restrictions on international trade and investment have been removed in the recent past, others remain in effect, and will continue to do so in the foreseeable future. Trade policy in Vietnam, like that in most countries, serves multiple purposes, some of which are mutually incompatible.
1. Protecting import-competing industry
In spite of the overall trend of trade policy toward liberalization, the government’s trade and investment regime remains biased toward protecting a number of import-competing sectors, sectors most typically dominated by state-owned enterprises (SOEs). However, while SOEs remain the principal beneficiaries of trade restrictions, the level and scope of the restrictions that protect them have been progressively reduced over the past decade and will be reduced further in the years to come as Vietnam fulfills its obligations to AFTA, the BTA and eventually the WTO.
a. Restrictions on trading rights have been significantly loosened
Before 1989, SOEs had a monopoly on international trade. In 1989, this monopoly was broken, but the ability of non-SOEs to engage in trade was severely restricted because export and import licenses were required and conditions for obtaining such licenses were onerous (including requiring a contract to export or import in advance, having minimum working capital, and having appropriate “skills”). Since 1998, the licensing requirements for exporting and importing have been largely abolished. Although some restrictions on the products permitted to be traded remain, they are being progressively loosened. In 2001, all legal entities (companies and individuals) were permitted to export most goods without license.2
b. Products with import quotas have been significantly reduced
In the past, import quotas were an important instrument of protection in Vietnam. SOEs dominate in every sector that has been protected by quantitative restrictions. Moreover, SOEs received the bulk of import quota allocations, although in recent years
2. See the implementing decree of the Commercial Law, Decree 44/2001/ND-CP, August 2, 2001.
An Assessment of the Economic Impact of the United States - Vietnam Bilateral Trade Agreement
92
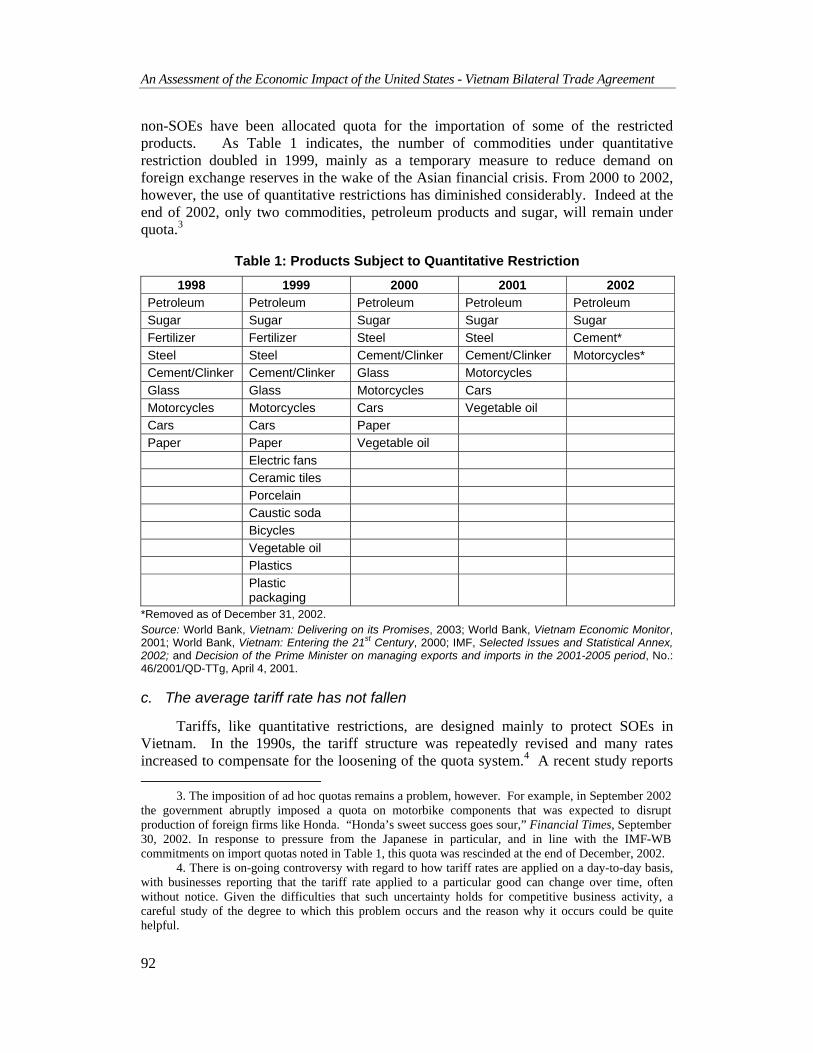
non-SOEs have been allocated quota for the importation of some of the restricted products. As Table 1 indicates, the number of commodities under quantitative restriction doubled in 1999, mainly as a temporary measure to reduce demand on foreign exchange reserves in the wake of the Asian financial crisis. From 2000 to 2002, however, the use of quantitative restrictions has diminished considerably. Indeed at the end of 2002, only two commodities, petroleum products and sugar, will remain under quota.3
Table 1: Products Subject to Quantitative Restriction
1998 1999 2000 2001 2002 Petroleum Petroleum Petroleum Petroleum Petroleum Sugar Sugar Sugar Sugar Sugar Fertilizer Fertilizer Steel Steel Cement* Steel Steel Cement/Clinker Cement/Clinker Motorcycles* Cement/Clinker Cement/Clinker Glass Motorcycles Glass Glass Motorcycles Cars Motorcycles Motorcycles Cars Vegetable oil Cars Cars Paper Paper Paper Vegetable oil Electric fans Ceramic tiles Porcelain Caustic soda Bicycles Vegetable oil Plastics Plastic
packaging
*Removed as of December 31, 2002. Source: World Bank, Vietnam: Delivering on its Promises, 2003; World Bank, Vietnam Economic Monitor, 2001; World Bank, Vietnam: Entering the 21st Century, 2000; IMF, Selected Issues and Statistical Annex, 2002; and Decision of the Prime Minister on managing exports and imports in the 2001-2005 period, No.: 46/2001/QD-TTg, April 4, 2001.
c. The average tariff rate has not fallen
Tariffs, like quantitative restrictions, are designed mainly to protect SOEs in Vietnam. In the 1990s, the tariff structure was repeatedly revised and many rates increased to compensate for the loosening of the quota system.4 A recent study reports
3. The imposition of ad hoc quotas remains a problem, however. For example, in September 2002 the government abruptly imposed a quota on motorbike components that was expected to disrupt production of foreign firms like Honda. “Honda’s sweet success goes sour,” Financial Times, September 30, 2002. In response to pressure from the Japanese in particular, and in line with the IMF-WB commitments on import quotas noted in Table 1, this quota was rescinded at the end of December, 2002.
4. There is on-going controversy with regard to how tariff rates are applied on a day-to-day basis, with businesses reporting that the tariff rate applied to a particular good can change over time, often without notice. Given the difficulties that such uncertainty holds for competitive business activity, a careful study of the degree to which this problem occurs and the reason why it occurs could be quite helpful.
Vietnam's International Trade and Foreign Investment: Policy and Performance
93
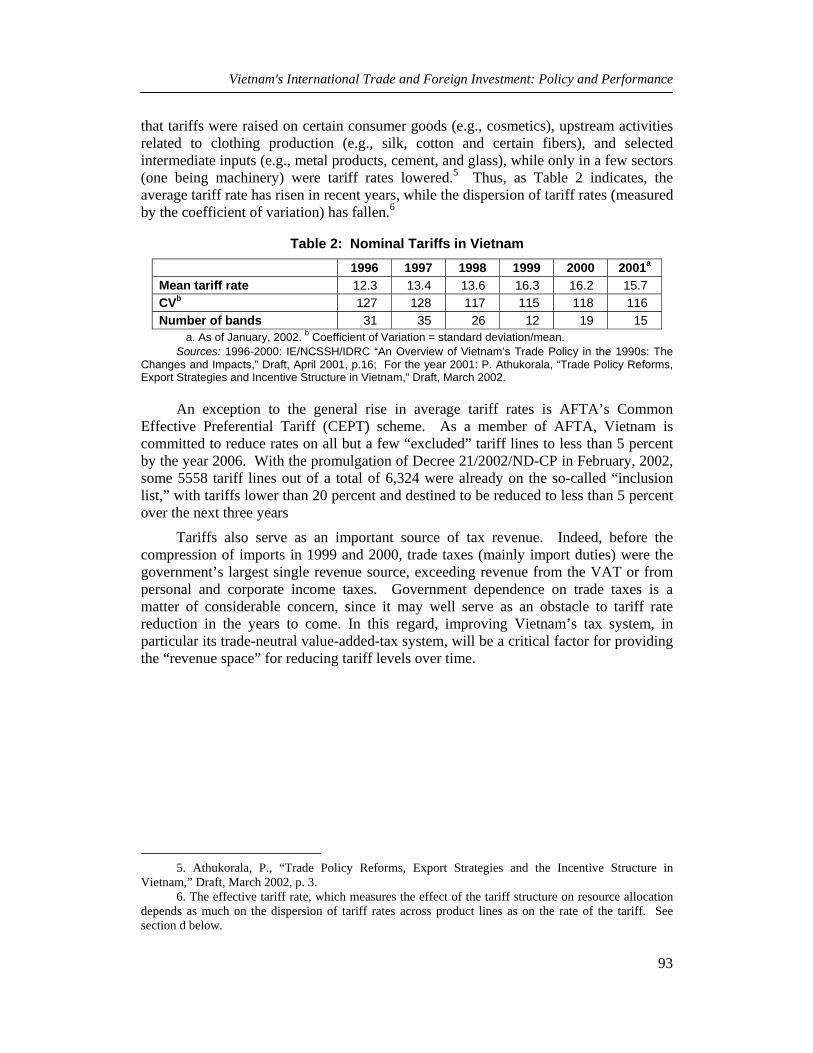
that tariffs were raised on certain consumer goods (e.g., cosmetics), upstream activities related to clothing production (e.g., silk, cotton and certain fibers), and selected intermediate inputs (e.g., metal products, cement, and glass), while only in a few sectors (one being machinery) were tariff rates lowered.5 Thus, as Table 2 indicates, the average tariff rate has risen in recent years, while the dispersion of tariff rates (measured by the coefficient of variation) has fallen.6
Table 2: Nominal Tariffs in Vietnam
1996 1997 1998 1999 2000 2001a
Mean tariff rate 12.3 13.4 13.6 16.3 16.2 15.7 CVb 127 128 117 115 118 116 Number of bands 31 35 26 12 19 15
a. As of January, 2002. b Coefficient of Variation = standard deviation/mean. Sources: 1996-2000: IE/NCSSH/IDRC “An Overview of Vietnam’s Trade Policy in the 1990s: The
Changes and Impacts,” Draft, April 2001, p.16; For the year 2001: P. Athukorala, “Trade Policy Reforms, Export Strategies and Incentive Structure in Vietnam,” Draft, March 2002.
An exception to the general rise in average tariff rates is AFTA’s Common Effective Preferential Tariff (CEPT) scheme. As a member of AFTA, Vietnam is committed to reduce rates on all but a few “excluded” tariff lines to less than 5 percent by the year 2006. With the promulgation of Decree 21/2002/ND-CP in February, 2002, some 5558 tariff lines out of a total of 6,324 were already on the so-called “inclusion list,” with tariffs lower than 20 percent and destined to be reduced to less than 5 percent over the next three years
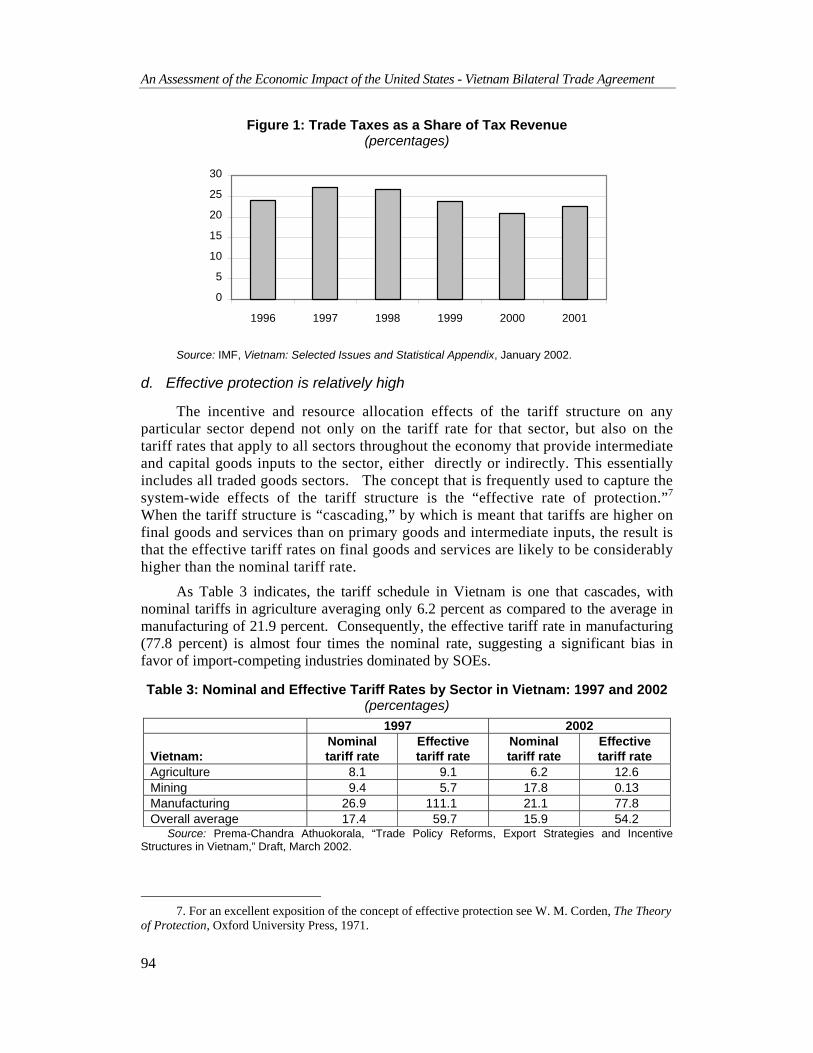
Tariffs also serve as an important source of tax revenue. Indeed, before the compression of imports in 1999 and 2000, trade taxes (mainly import duties) were the government’s largest single revenue source, exceeding revenue from the VAT or from personal and corporate income taxes. Government dependence on trade taxes is a matter of considerable concern, since it may well serve as an obstacle to tariff rate reduction in the years to come. In this regard, improving Vietnam’s tax system, in particular its trade-neutral value-added-tax system, will be a critical factor for providing the “revenue space” for reducing tariff levels over time.
5. Athukorala, P., “Trade Policy Reforms, Export Strategies and the Incentive Structure in
Vietnam,” Draft, March 2002, p. 3. 6. The effective tariff rate, which measures the effect of the tariff structure on resource allocation
depends as much on the dispersion of tariff rates across product lines as on the rate of the tariff. See section d below.
An Assessment of the Economic Impact of the United States - Vietnam Bilateral Trade Agreement
94
Figure 1: Trade Taxes as a Share of Tax Revenue (percentages)
0
5
10
15
20
25
30
1996 1997 1998 1999 2000 2001
Source: IMF, Vietnam: Selected Issues and Statistical Appendix, January 2002.
d. Effective protection is relatively high
The incentive and resource allocation effects of the tariff structure on any particular sector depend not only on the tariff rate for that sector, but also on the tariff rates that apply to all sectors throughout the economy that provide intermediate and capital goods inputs to the sector, either directly or indirectly. This essentially includes all traded goods sectors. The concept that is frequently used to capture the system-wide effects of the tariff structure is the “effective rate of protection.”7 When the tariff structure is “cascading,” by which is meant that tariffs are higher on final goods and services than on primary goods and intermediate inputs, the result is that the effective tariff rates on final goods and services are likely to be considerably higher than the nominal tariff rate.
As Table 3 indicates, the tariff schedule in Vietnam is one that cascades, with nominal tariffs in agriculture averaging only 6.2 percent as compared to the average in manufacturing of 21.9 percent. Consequently, the effective tariff rate in manufacturing (77.8 percent) is almost four times the nominal rate, suggesting a significant bias in favor of import-competing industries dominated by SOEs.
Table 3: Nominal and Effective Tariff Rates by Sector in Vietnam: 1997 and 2002 (percentages)
1997 2002 Vietnam:
Nominal tariff rate
Effective tariff rate
Nominal tariff rate
Effective tariff rate
Agriculture 8.1 9.1 6.2 12.6 Mining 9.4 5.7 17.8 0.13 Manufacturing 26.9 111.1 21.1 77.8 Overall average 17.4 59.7 15.9 54.2
Source: Prema-Chandra Athuokorala, “Trade Policy Reforms, Export Strategies and Incentive Structures in Vietnam,” Draft, March 2002.
7. For an excellent exposition of the concept of effective protection see W. M. Corden, The Theory
of Protection, Oxford University Press, 1971.
Vietnam's International Trade and Foreign Investment: Policy and Performance
95
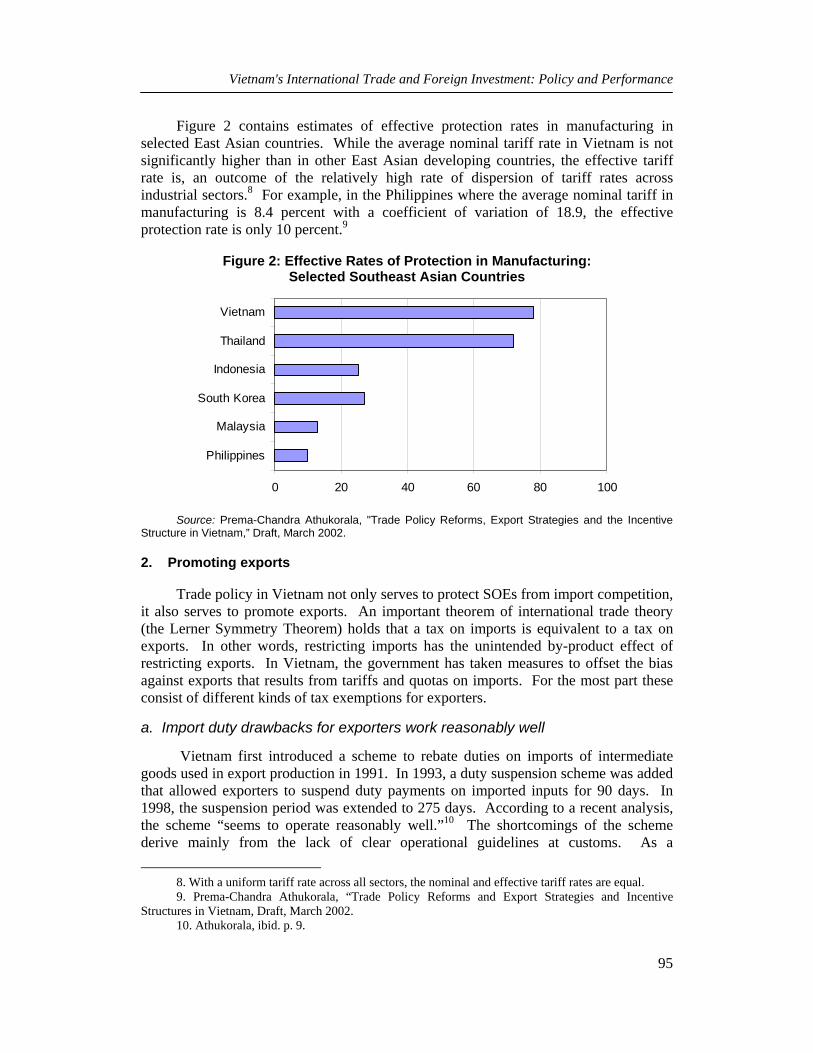
Figure 2 contains estimates of effective protection rates in manufacturing in selected East Asian countries. While the average nominal tariff rate in Vietnam is not significantly higher than in other East Asian developing countries, the effective tariff rate is, an outcome of the relatively high rate of dispersion of tariff rates across industrial sectors.8 For example, in the Philippines where the average nominal tariff in manufacturing is 8.4 percent with a coefficient of variation of 18.9, the effective protection rate is only 10 percent.9
Figure 2: Effective Rates of Protection in Manufacturing: Selected Southeast Asian Countries
0 20 40 60 80 100
Philippines
Malaysia
South Korea
Indonesia
Thailand
Vietnam
Source: Prema-Chandra Athukorala, "Trade Policy Reforms, Export Strategies and the Incentive
Structure in Vietnam,” Draft, March 2002.
2. Promoting exports
Trade policy in Vietnam not only serves to protect SOEs from import competition, it also serves to promote exports. An important theorem of international trade theory (the Lerner Symmetry Theorem) holds that a tax on imports is equivalent to a tax on exports. In other words, restricting imports has the unintended by-product effect of restricting exports. In Vietnam, the government has taken measures to offset the bias against exports that results from tariffs and quotas on imports. For the most part these consist of different kinds of tax exemptions for exporters.
a. Import duty drawbacks for exporters work reasonably well
Vietnam first introduced a scheme to rebate duties on imports of intermediate goods used in export production in 1991. In 1993, a duty suspension scheme was added that allowed exporters to suspend duty payments on imported inputs for 90 days. In 1998, the suspension period was extended to 275 days. According to a recent analysis, the scheme “seems to operate reasonably well.”10 The shortcomings of the scheme derive mainly from the lack of clear operational guidelines at customs. As a
8. With a uniform tariff rate across all sectors, the nominal and effective tariff rates are equal. 9. Prema-Chandra Athukorala, “Trade Policy Reforms and Export Strategies and Incentive
Structures in Vietnam, Draft, March 2002. 10. Athukorala, ibid. p. 9.
An Assessment of the Economic Impact of the United States - Vietnam Bilateral Trade Agreement
96
consequence, it is reported, customs officials sometimes make arbitrary and unpredictable decisions about what import duties may be rebated or suspended, which of course undermines the incentive effects of the scheme and creates conditions conducive to corruption. Since SOEs typically fare better in this kind of environment than smaller private companies, SMEs tend to rely on SOEs for imported inputs.
b. Other tax exemptions
In addition to rebates of import duties, exporters are exempted from the value-added tax (VAT) and are given concessions on profit taxes, the amount of concession depending on the degree of export-orientation and location (e.g., in rural areas or in industrial and export-processing zones). Foreign-invested firms receive particularly generous tax incentives, typically including duty-free access for machinery and other capital goods imports.11
c. Export subsidies
Vietnam does not provide direct subsidies to exports to any significant extent. However, like many other countries in the region, it does have special facilities to provide credit to exporters. The government has established a Development Assistance Fund and recently a Credit Fund for Supporting Exports. However, a recent assessment of these credit facilities notes that they mainly serve SOEs, which because of their privileged access to commercial bank financing are the least in need of credit assistance.12 Moreover, these funds are mainly limited to investment loans, when in fact exporting firms report that working capital is often of more immediate need.13
d. Export taxes
Export taxes do not usually count as a measure to promote exports, at least not directly. However, to the extent that export taxes apply to intermediate inputs, they may serve that purpose indirectly. This occurs because an export tax tends to reduce the domestic price of the taxed product, which if used as an input in the production of a downstream product, may serve to “subsidize” the export of that product by reducing its input costs. Rice is one product that has been subject to an export tax, albeit at low rates, while metal scrap is subject to a much higher export tax, presumably to promote domestic producers of steel products.
e. Anti-export bias?
Does Vietnam’s trade regime, which serves both to protect SOEs and promote exports, contain an overall bias against exports? Several recent studies argue that in spite of the export promotion measures surveyed above, overall the system remains heavily biased against exports.14 A recent report of the EU Multilateral Trade Policy
11. MPI, Viet Nam: A Destination for Foreign Investment: A guide for business and investment in
Viet Nam, 2002. 12. Athukorala, ibid., p. 14. 13. See Chapter IV below, which reports the findings of interviews with exporting firms. 14. E. Ianchovinchina E. Fukase and W. Martin, “The Effects of the US Vietnam Trade
Agreement,” World Bank, 2000; P. Athukorala, op. cit. and MUTRAP, EU Multilateral Trade Policy
Vietnam's International Trade and Foreign Investment: Policy and Performance
97
Assistance Program (MUTRAP) concludes that “Despite the large role of export production in Vietnam’s economy, its trade regime asymmetrically favors domestic production over export production.”15 A recent World Bank study concludes that “The upshot of this analysis is that, while various indirect measures to counterbalance the anti-export bias of the protectionist regime seem to have some effect, they are unlikely to achieve the desired neutrality in the incentive structure even if the efficiency of their implementation is substantially improved.”16
The analysis on which these assessments are based is the application of the effective rate of protection concept. A high effective rate of protection implies that selling in the domestic market is more profitable than selling in export markets. Of course, account must be taken of duty drawbacks and other tax exemptions that apply to exporting but not for selling in the domestic market. However, even after such adjustments are made, these analyses find that there is a strong bias in favor of the domestic market over exporting, even in sectors in which Vietnam has recorded rapid export growth in recent years, such as seafood, food processing, footwear, and clothing.
These analyses lead one to an obvious question, albeit one that none of the studies attempts to answer. That is, how did Vietnam achieve rapid export growth in sectors where the profitability from selling domestically is presumably 50 to 100 percent higher than from selling in the world market?17 The likely answer is that these analyses are misleading because of problems that arise from aggregation. Even within a well-defined sector like clothing, there is great variation across firms in terms of product variety, product quality, the scale of operation and the technology of production. The relatively small firms that produce the variety of clothing favored by local consumers bear little resemblance to the large-scale clothing manufacturers that often use advanced technology to produce a limited variety of clothing items under contract to buyers in the world market. Are the small-scale clothing makers more profitable by virtue of tariffs on clothing imports than the large-scale firms that produce for the world market? There is no evidence that they are. Would the lowering of tariffs on clothing imports negatively affect many small producers supplying the domestic market? Likely so. Would the resources released from import-competing firms be readily absorbed in export production? If what constrains production for export is the overall economic environment, and not the supply of labor and other domestic resources, then probably not.
There may, however, be a potential bias against exports from what could be called “the adding-up” or “resource-pull” constraint. If an economy’s resources are limited, the more resources that are allocated to one sector (e.g., import-competing sectors), the fewer are available to be allocated to other sectors (e.g., export-oriented sectors). Policies that protect and favor the import-competing firms, accordingly, may unprotect and disadvantage the export-oriented firms. In the Vietnamese context, however, this argument is perhaps less applicable than for other countries. In Vietnam some key resources for export production are seemingly unlimited under existing conditions, Assistance Program, “Vietnam’s Industrial Competitiveness under International Economic Integration,” Hanoi, July 18, 2002.
15 . EU Multilateral Trade Policy Assistance Program, op. cit. 16. Athukorala, ibid., p. 21. 17. As noted in Table 3, Vietnam’s average effective rate of protection for manufactures in 2002 is
78 percent. Taken literally, this implies that the profitability for selling manufactures on the domestic market is 78 percent higher than for selling the same product for export.
An Assessment of the Economic Impact of the United States - Vietnam Bilateral Trade Agreement
98
principally labor. The trade regime makes capital goods and imported raw materials available at close to world market prices, hence the heavy reliance of exporters on imported materials and capital goods. The adding up constraint, where it applies in Vietnam, is mainly in regard to credit, which is limited in availability and allocated unevenly in favor of SOEs. Since private companies are more export-oriented than SOEs, the system of credit allocation may constitute an anti-export bias. If so, then the bias derives more from the overall policy framework, especially those favoring SOEs, than from trade policy per se.
One constraint on exports not related to the trade policy regime is the insufficient availability and high cost of infrastructure services. Port services are reported to be more than twice as expensive in Vietnam than in neighboring countries. Telecommunications rates are among the highest in the world, and electricity tariffs, while reasonably priced, do not compensate for the cost of power cuts. According to a recent report, in spite of relatively low wages, “higher costs for telecommunications, electricity, transportation and other infrastructure services make Vietnamese products 20 to 30 percent more expensive than those produced in other countries.”18
3. Vietnam’s recent macroeconomic performance
a. Growth and stability
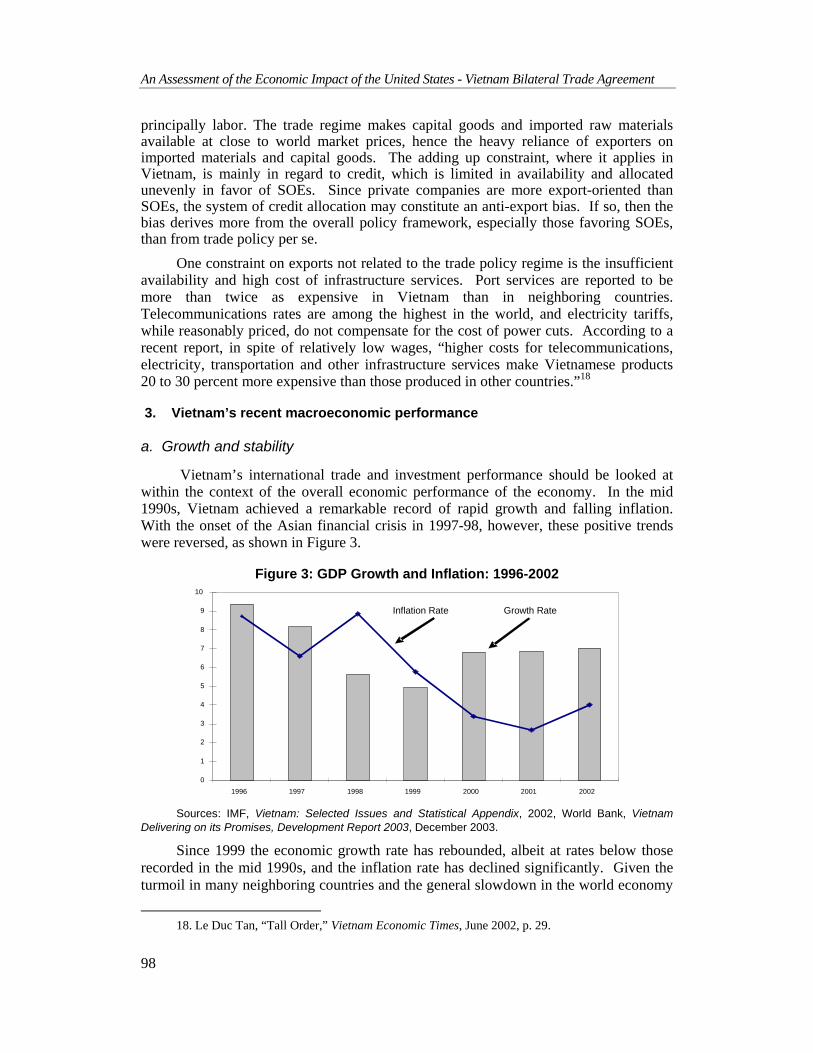
Vietnam’s international trade and investment performance should be looked at within the context of the overall economic performance of the economy. In the mid 1990s, Vietnam achieved a remarkable record of rapid growth and falling inflation. With the onset of the Asian financial crisis in 1997-98, however, these positive trends were reversed, as shown in Figure 3.
Figure 3: GDP Growth and Inflation: 1996-2002
0
1
2
3
4
5
6
7
8
9
10
1996 1997 1998 1999 2000 2001 2002
Inflation Rate Growth Rate
Sources: IMF, Vietnam: Selected Issues and Statistical Appendix, 2002, World Bank, Vietnam
Delivering on its Promises, Development Report 2003, December 2003.
Since 1999 the economic growth rate has rebounded, albeit at rates below those recorded in the mid 1990s, and the inflation rate has declined significantly. Given the turmoil in many neighboring countries and the general slowdown in the world economy
18. Le Duc Tan, “Tall Order,” Vietnam Economic Times, June 2002, p. 29.
Vietnam's International Trade and Foreign Investment: Policy and Performance
99
in recent years, the economy of Vietnam must be judged to have performed reasonably well, if not quite the “beacon of light” that it has been described as.19
b. Structural change
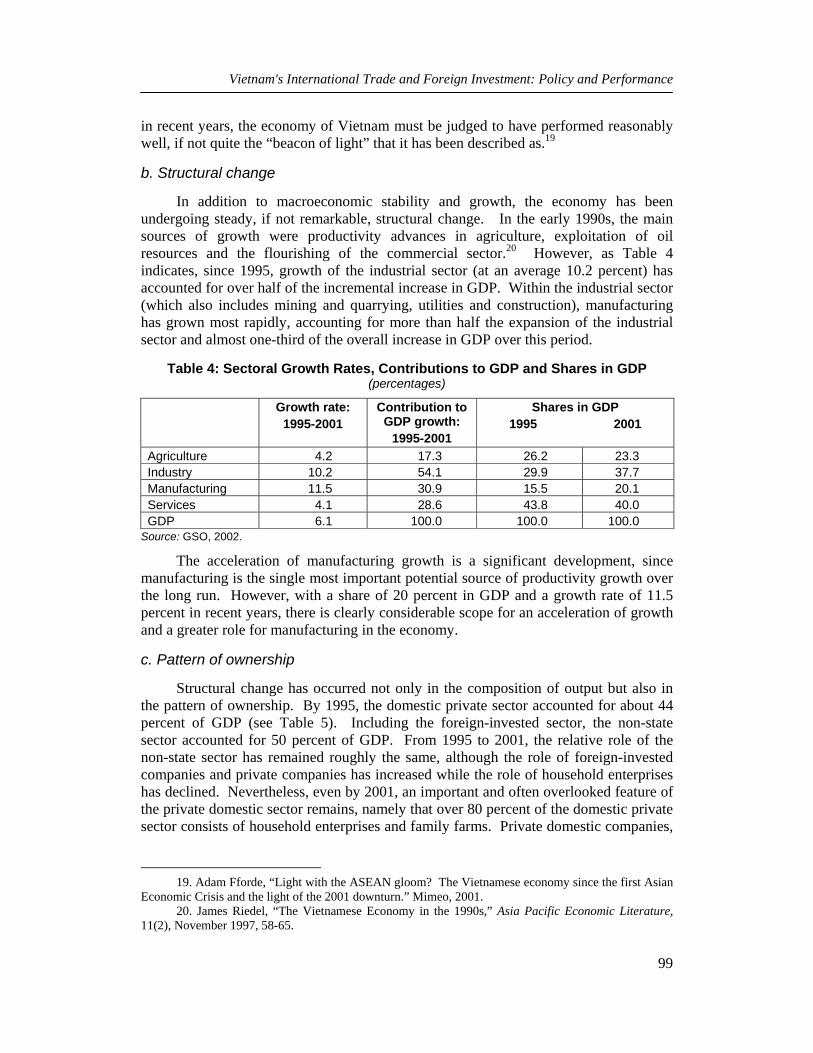
In addition to macroeconomic stability and growth, the economy has been undergoing steady, if not remarkable, structural change. In the early 1990s, the main sources of growth were productivity advances in agriculture, exploitation of oil resources and the flourishing of the commercial sector.20 However, as Table 4 indicates, since 1995, growth of the industrial sector (at an average 10.2 percent) has accounted for over half of the incremental increase in GDP. Within the industrial sector (which also includes mining and quarrying, utilities and construction), manufacturing has grown most rapidly, accounting for more than half the expansion of the industrial sector and almost one-third of the overall increase in GDP over this period.
Table 4: Sectoral Growth Rates, Contributions to GDP and Shares in GDP (percentages)
Growth rate: 1995-2001
Contribution to GDP growth:
1995-2001
Shares in GDP 1995 2001
Agriculture 4.2 17.3 26.2 23.3 Industry 10.2 54.1 29.9 37.7 Manufacturing 11.5 30.9 15.5 20.1 Services 4.1 28.6 43.8 40.0 GDP 6.1 100.0 100.0 100.0
Source: GSO, 2002.
The acceleration of manufacturing growth is a significant development, since manufacturing is the single most important potential source of productivity growth over the long run. However, with a share of 20 percent in GDP and a growth rate of 11.5 percent in recent years, there is clearly considerable scope for an acceleration of growth and a greater role for manufacturing in the economy.
c. Pattern of ownership
Structural change has occurred not only in the composition of output but also in the pattern of ownership. By 1995, the domestic private sector accounted for about 44 percent of GDP (see Table 5). Including the foreign-invested sector, the non-state sector accounted for 50 percent of GDP. From 1995 to 2001, the relative role of the non-state sector has remained roughly the same, although the role of foreign-invested companies and private companies has increased while the role of household enterprises has declined. Nevertheless, even by 2001, an important and often overlooked feature of the private domestic sector remains, namely that over 80 percent of the domestic private sector consists of household enterprises and family farms. Private domestic companies,
19. Adam Fforde, “Light with the ASEAN gloom? The Vietnamese economy since the first Asian
Economic Crisis and the light of the 2001 downturn.” Mimeo, 2001. 20. James Riedel, “The Vietnamese Economy in the 1990s,” Asia Pacific Economic Literature,
11(2), November 1997, 58-65.
An Assessment of the Economic Impact of the United States - Vietnam Bilateral Trade Agreement
100
where capital accumulation and productivity growth is most likely to occur, accounted for only about 7 to 8 percent of GDP in 2001.
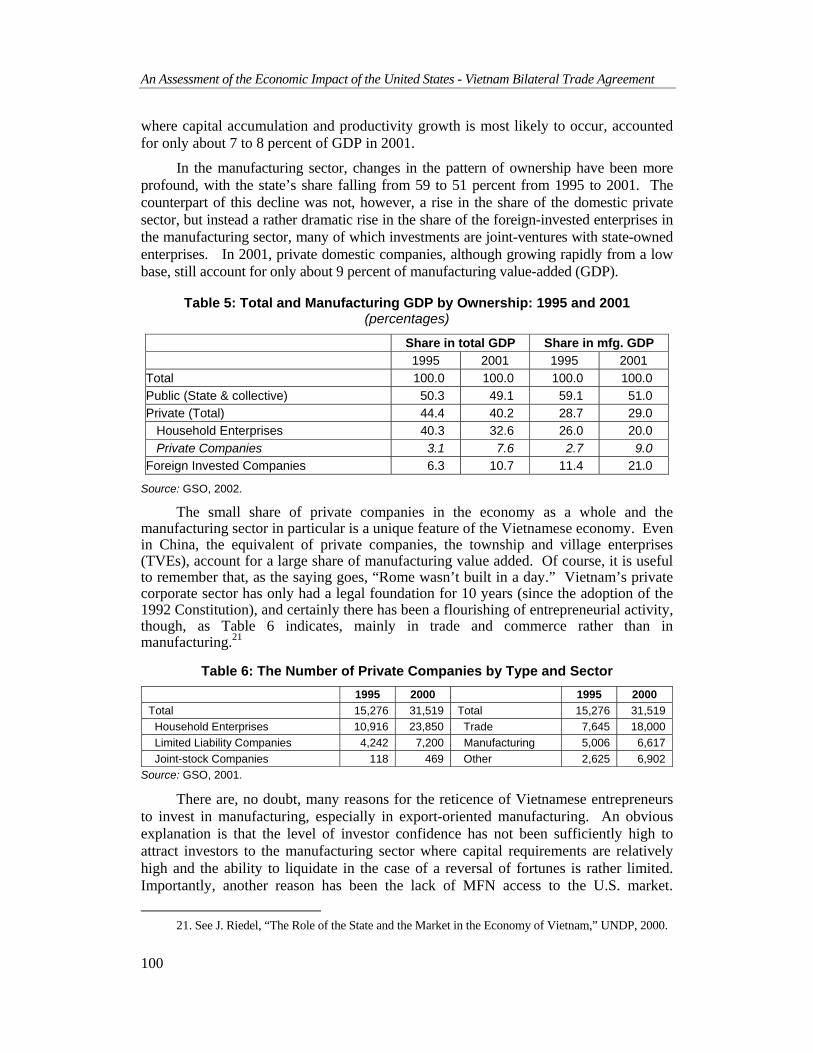
In the manufacturing sector, changes in the pattern of ownership have been more profound, with the state’s share falling from 59 to 51 percent from 1995 to 2001. The counterpart of this decline was not, however, a rise in the share of the domestic private sector, but instead a rather dramatic rise in the share of the foreign-invested enterprises in the manufacturing sector, many of which investments are joint-ventures with state-owned enterprises. In 2001, private domestic companies, although growing rapidly from a low base, still account for only about 9 percent of manufacturing value-added (GDP).
Table 5: Total and Manufacturing GDP by Ownership: 1995 and 2001 (percentages)
Share in total GDP Share in mfg. GDP 1995 2001 1995 2001 Total 100.0 100.0 100.0 100.0 Public (State & collective) 50.3 49.1 59.1 51.0 Private (Total) 44.4 40.2 28.7 29.0 Household Enterprises 40.3 32.6 26.0 20.0 Private Companies 3.1 7.6 2.7 9.0 Foreign Invested Companies 6.3 10.7 11.4 21.0
Source: GSO, 2002.
The small share of private companies in the economy as a whole and the manufacturing sector in particular is a unique feature of the Vietnamese economy. Even in China, the equivalent of private companies, the township and village enterprises (TVEs), account for a large share of manufacturing value added. Of course, it is useful to remember that, as the saying goes, “Rome wasn’t built in a day.” Vietnam’s private corporate sector has only had a legal foundation for 10 years (since the adoption of the 1992 Constitution), and certainly there has been a flourishing of entrepreneurial activity, though, as Table 6 indicates, mainly in trade and commerce rather than in manufacturing.21
Table 6: The Number of Private Companies by Type and Sector 1995 2000 1995 2000
Total 15,276 31,519 Total 15,276 31,519 Household Enterprises 10,916 23,850 Trade 7,645 18,000 Limited Liability Companies 4,242 7,200 Manufacturing 5,006 6,617 Joint-stock Companies 118 469 Other 2,625 6,902
Source: GSO, 2001.
There are, no doubt, many reasons for the reticence of Vietnamese entrepreneurs to invest in manufacturing, especially in export-oriented manufacturing. An obvious explanation is that the level of investor confidence has not been sufficiently high to attract investors to the manufacturing sector where capital requirements are relatively high and the ability to liquidate in the case of a reversal of fortunes is rather limited. Importantly, another reason has been the lack of MFN access to the U.S. market.
21. See J. Riedel, “The Role of the State and the Market in the Economy of Vietnam,” UNDP, 2000.
Vietnam's International Trade and Foreign Investment: Policy and Performance
101
Obviously, export-oriented firms are at a distinct disadvantage when the world’s largest market is effectively closed to them. That issue, the topic of the following chapter, has been effectively resolved with the signing of the BTA. As for the business environment, that too has seen some significant improvements in recent years, in particular with the implementation of the new Enterprise Law in 2000.
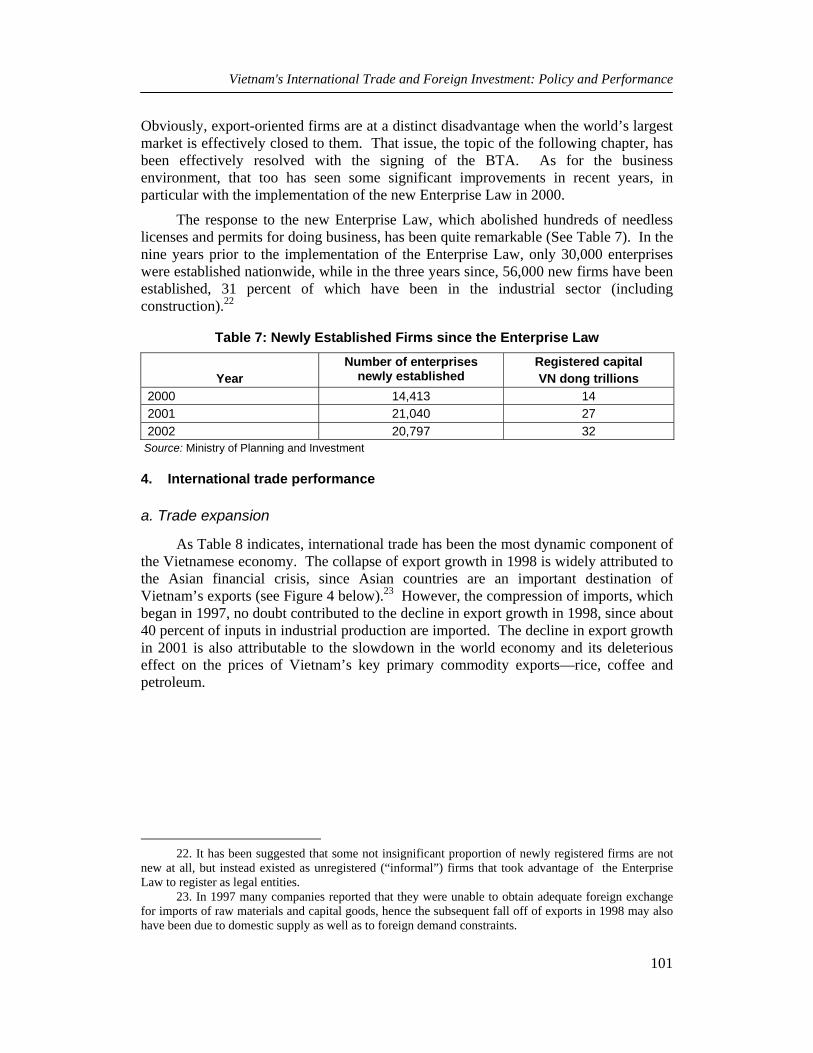
The response to the new Enterprise Law, which abolished hundreds of needless licenses and permits for doing business, has been quite remarkable (See Table 7). In the nine years prior to the implementation of the Enterprise Law, only 30,000 enterprises were established nationwide, while in the three years since, 56,000 new firms have been established, 31 percent of which have been in the industrial sector (including construction).22
Table 7: Newly Established Firms since the Enterprise Law
Year
Number of enterprises newly established
Registered capital VN dong trillions
2000 14,413 14 2001 21,040 27 2002 20,797 32
Source: Ministry of Planning and Investment
4. International trade performance
a. Trade expansion
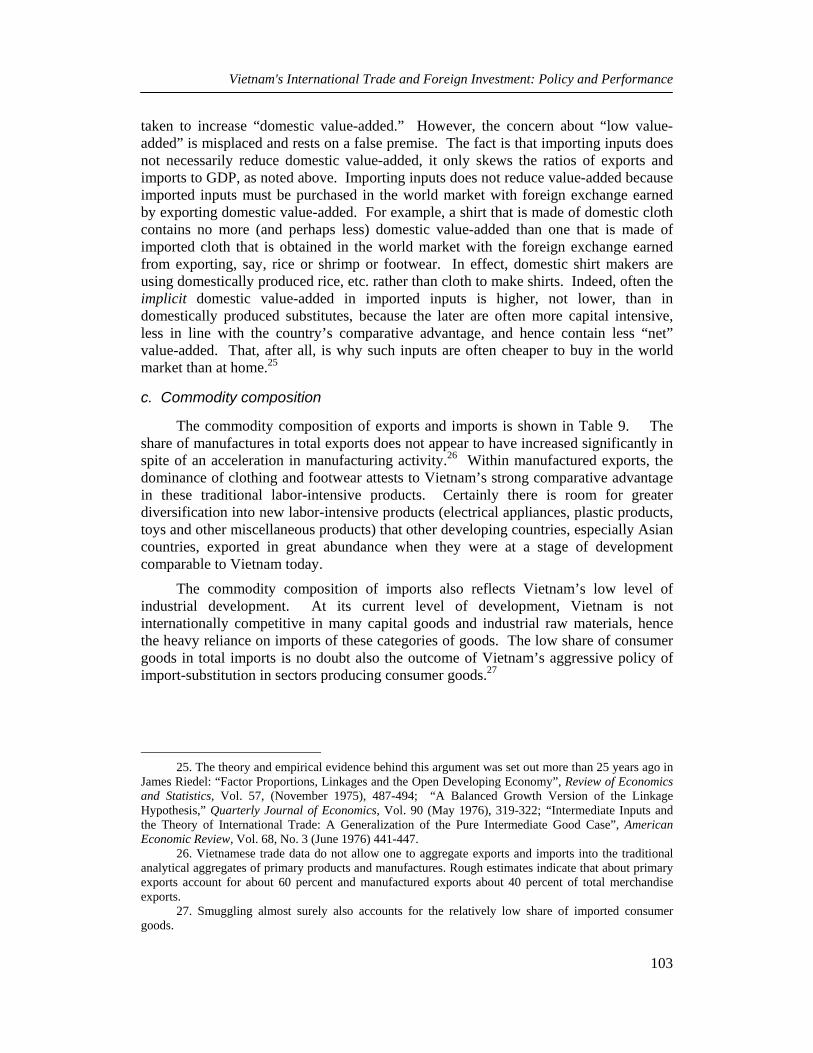
As Table 8 indicates, international trade has been the most dynamic component of the Vietnamese economy. The collapse of export growth in 1998 is widely attributed to the Asian financial crisis, since Asian countries are an important destination of Vietnam’s exports (see Figure 4 below).23 However, the compression of imports, which began in 1997, no doubt contributed to the decline in export growth in 1998, since about 40 percent of inputs in industrial production are imported. The decline in export growth in 2001 is also attributable to the slowdown in the world economy and its deleterious effect on the prices of Vietnam’s key primary commodity exports—rice, coffee and petroleum.
22. It has been suggested that some not insignificant proportion of newly registered firms are not
new at all, but instead existed as unregistered (“informal”) firms that took advantage of the Enterprise Law to register as legal entities.
23. In 1997 many companies reported that they were unable to obtain adequate foreign exchange for imports of raw materials and capital goods, hence the subsequent fall off of exports in 1998 may also have been due to domestic supply as well as to foreign demand constraints.
An Assessment of the Economic Impact of the United States - Vietnam Bilateral Trade Agreement
102
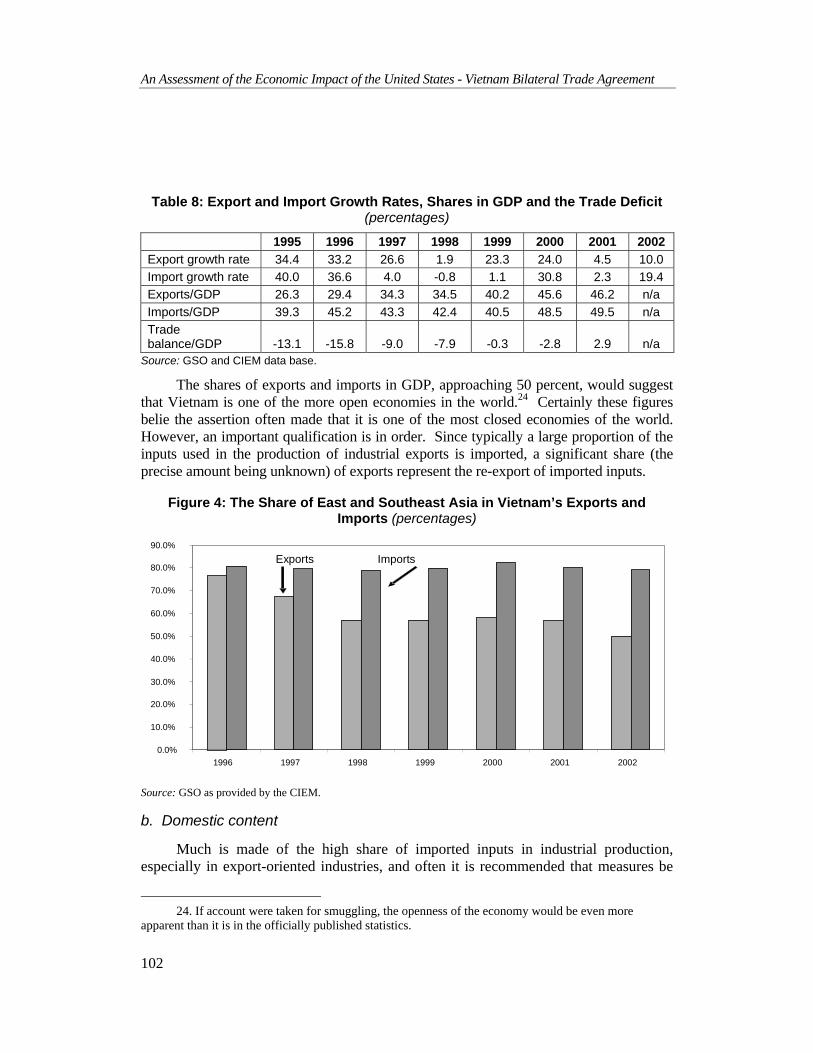
Table 8: Export and Import Growth Rates, Shares in GDP and the Trade Deficit (percentages)
1995 1996 1997 1998 1999 2000 2001 2002 Export growth rate 34.4 33.2 26.6 1.9 23.3 24.0 4.5 10.0 Import growth rate 40.0 36.6 4.0 -0.8 1.1 30.8 2.3 19.4 Exports/GDP 26.3 29.4 34.3 34.5 40.2 45.6 46.2 n/a Imports/GDP 39.3 45.2 43.3 42.4 40.5 48.5 49.5 n/a Trade balance/GDP -13.1 -15.8 -9.0 -7.9 -0.3 -2.8 2.9 n/a
Source: GSO and CIEM data base.
The shares of exports and imports in GDP, approaching 50 percent, would suggest that Vietnam is one of the more open economies in the world.24 Certainly these figures belie the assertion often made that it is one of the most closed economies of the world. However, an important qualification is in order. Since typically a large proportion of the inputs used in the production of industrial exports is imported, a significant share (the precise amount being unknown) of exports represent the re-export of imported inputs.
Figure 4: The Share of East and Southeast Asia in Vietnam’s Exports and Imports (percentages)
0.0%
10.0%
20.0%
30.0%
40.0%
50.0%
60.0%
70.0%
80.0%
90.0%
1996 1997 1998 1999 2000 2001 2002
Exports Imports
Source: GSO as provided by the CIEM.
b. Domestic content
Much is made of the high share of imported inputs in industrial production, especially in export-oriented industries, and often it is recommended that measures be
24. If account were taken for smuggling, the openness of the economy would be even more
apparent than it is in the officially published statistics.
Vietnam's International Trade and Foreign Investment: Policy and Performance
103
taken to increase “domestic value-added.” However, the concern about “low value-added” is misplaced and rests on a false premise. The fact is that importing inputs does not necessarily reduce domestic value-added, it only skews the ratios of exports and imports to GDP, as noted above. Importing inputs does not reduce value-added because imported inputs must be purchased in the world market with foreign exchange earned by exporting domestic value-added. For example, a shirt that is made of domestic cloth contains no more (and perhaps less) domestic value-added than one that is made of imported cloth that is obtained in the world market with the foreign exchange earned from exporting, say, rice or shrimp or footwear. In effect, domestic shirt makers are using domestically produced rice, etc. rather than cloth to make shirts. Indeed, often the implicit domestic value-added in imported inputs is higher, not lower, than in domestically produced substitutes, because the later are often more capital intensive, less in line with the country’s comparative advantage, and hence contain less “net” value-added. That, after all, is why such inputs are often cheaper to buy in the world market than at home.25
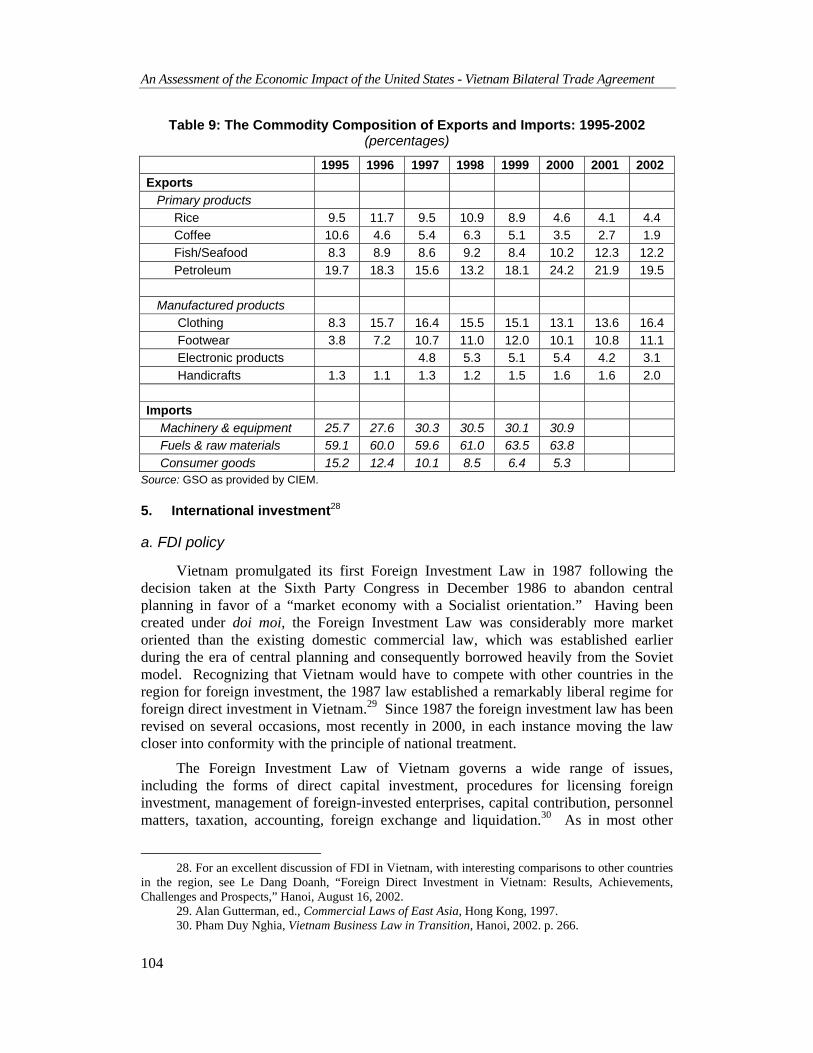
c. Commodity composition
The commodity composition of exports and imports is shown in Table 9. The share of manufactures in total exports does not appear to have increased significantly in spite of an acceleration in manufacturing activity.26 Within manufactured exports, the dominance of clothing and footwear attests to Vietnam’s strong comparative advantage in these traditional labor-intensive products. Certainly there is room for greater diversification into new labor-intensive products (electrical appliances, plastic products, toys and other miscellaneous products) that other developing countries, especially Asian countries, exported in great abundance when they were at a stage of development comparable to Vietnam today.
The commodity composition of imports also reflects Vietnam’s low level of industrial development. At its current level of development, Vietnam is not internationally competitive in many capital goods and industrial raw materials, hence the heavy reliance on imports of these categories of goods. The low share of consumer goods in total imports is no doubt also the outcome of Vietnam’s aggressive policy of import-substitution in sectors producing consumer goods.27
25. The theory and empirical evidence behind this argument was set out more than 25 years ago in
James Riedel: “Factor Proportions, Linkages and the Open Developing Economy”, Review of Economics and Statistics, Vol. 57, (November 1975), 487-494; “A Balanced Growth Version of the Linkage Hypothesis,” Quarterly Journal of Economics, Vol. 90 (May 1976), 319-322; “Intermediate Inputs and the Theory of International Trade: A Generalization of the Pure Intermediate Good Case”, American Economic Review, Vol. 68, No. 3 (June 1976) 441-447.
26. Vietnamese trade data do not allow one to aggregate exports and imports into the traditional analytical aggregates of primary products and manufactures. Rough estimates indicate that about primary exports account for about 60 percent and manufactured exports about 40 percent of total merchandise exports.
27. Smuggling almost surely also accounts for the relatively low share of imported consumer goods.
An Assessment of the Economic Impact of the United States - Vietnam Bilateral Trade Agreement
104
Table 9: The Commodity Composition of Exports and Imports: 1995-2002 (percentages)
1995 1996 1997 1998 1999 2000 2001 2002 Exports Primary products Rice 9.5 11.7 9.5 10.9 8.9 4.6 4.1 4.4 Coffee 10.6 4.6 5.4 6.3 5.1 3.5 2.7 1.9 Fish/Seafood 8.3 8.9 8.6 9.2 8.4 10.2 12.3 12.2 Petroleum 19.7 18.3 15.6 13.2 18.1 24.2 21.9 19.5 Manufactured products Clothing 8.3 15.7 16.4 15.5 15.1 13.1 13.6 16.4 Footwear 3.8 7.2 10.7 11.0 12.0 10.1 10.8 11.1 Electronic products 4.8 5.3 5.1 5.4 4.2 3.1 Handicrafts 1.3 1.1 1.3 1.2 1.5 1.6 1.6 2.0 Imports Machinery & equipment 25.7 27.6 30.3 30.5 30.1 30.9 Fuels & raw materials 59.1 60.0 59.6 61.0 63.5 63.8 Consumer goods 15.2 12.4 10.1 8.5 6.4 5.3
Source: GSO as provided by CIEM.
5. International investment28
a. FDI policy
Vietnam promulgated its first Foreign Investment Law in 1987 following the decision taken at the Sixth Party Congress in December 1986 to abandon central planning in favor of a “market economy with a Socialist orientation.” Having been created under doi moi, the Foreign Investment Law was considerably more market oriented than the existing domestic commercial law, which was established earlier during the era of central planning and consequently borrowed heavily from the Soviet model. Recognizing that Vietnam would have to compete with other countries in the region for foreign investment, the 1987 law established a remarkably liberal regime for foreign direct investment in Vietnam.29 Since 1987 the foreign investment law has been revised on several occasions, most recently in 2000, in each instance moving the law closer into conformity with the principle of national treatment.
The Foreign Investment Law of Vietnam governs a wide range of issues, including the forms of direct capital investment, procedures for licensing foreign investment, management of foreign-invested enterprises, capital contribution, personnel matters, taxation, accounting, foreign exchange and liquidation.30 As in most other
28. For an excellent discussion of FDI in Vietnam, with interesting comparisons to other countries
in the region, see Le Dang Doanh, “Foreign Direct Investment in Vietnam: Results, Achievements, Challenges and Prospects,” Hanoi, August 16, 2002.
29. Alan Gutterman, ed., Commercial Laws of East Asia, Hong Kong, 1997. 30. Pham Duy Nghia, Vietnam Business Law in Transition, Hanoi, 2002. p. 266.

Vietnam's International Trade and Foreign Investment: Policy and Performance
105
Asian countries, foreign investment is prohibited where it is deemed to have adverse effects on national defense, culture and historical heritage, or the natural environment. Otherwise foreign investment is permitted in most sectors, although it must be approved and licensed by the authorities. In the case of “sensitive projects,” approval is required by the Prime Minister himself. Amendments to the law in 2000 allow for some “less sensitive” projects to be implemented without the licensing scrutiny of the Ministry of Planning and Investment, with such projects being limited mainly to export-oriented investments.31
The existing Law on Foreign Investment requires a minimum foreign participation of 30% in joint ventures, but does allow 100 percent foreign ownership, except for sectors where FDI is limited to the joint venture form.32 Foreign investors in Vietnam receive a number of special incentives, such as customs duty exemptions in export processing zones and various tax exemptions.33 In addition, as in other countries in the region, the law provides an explicit pledge against expropriation or nationalization and guarantees the right to repatriate capital and profits.34 Foreign investors are subject to higher prices for certain services, though these forms of discrimination are gradually being eliminated as the country moves ever closer to national treatment of foreign investors, as required the BTA and ultimately the WTO. In March 2003 the government further liberalized the foreign investment law (Decree 27 amending Decree 24), moving further toward a registration (vs. licensing) regime and making the process of registration and licensing more transparent. Furthermore, in April 2003, the Prime Minister lifted the compulsory sale of foreign currency for both foreign and domestic enterprises.35
b. FDI performance
Data on Vietnamese FDI vary widely, with different FDI definitions and sources often providing conflicting pictures of reality. 36 The two most common statistics published by the Ministry of Planning and Investment are: 1) FDI commitments; and, 2) FDI disbursements. Disbursements obviously provide a better indicator of net capital inflows for balance of payments purposes, and also should more accurately reflect the impact of FDI on the domestic economy.
In the mid 1990s, Vietnam attracted large inflows of foreign capital, relative to the size of the economy, equivalent to 11.2 percent of GDP in 1995, mostly in the form of FDI. With the onset of the Asian financial crisis, however, foreign capital of
31. It is worth noting that the BTA calls for Vietnam to rely increasingly on registration rather than
licensing of FDI. 32. In practice, a number of foreign-invested firms have 100 percent foreign ownership. Note that
the BTA requires that Vietnam reduce the number of sectors where U.S. ownership is limited, particularly for a number of service sectors.
33. For a useful summary of incentives for FDI see MPI, Vietnam: Destination for Foreign Investment: A guide for business and investment in Viet Nam, 2002.
34. Again, these provisions are to be strengthened with the implementation of the BTA. 35. Decision number 46/2003/QD-TTg, published in the Official Gazette on 22 April 2003. 36. FDI statistics are notoriously inaccurate. Not surprisingly, the statistics reported by the
Government of Vietnam and those reported by the IMF (which net out domestic equity) are often different by a large order of magnitude.
An Assessment of the Economic Impact of the United States - Vietnam Bilateral Trade Agreement
106
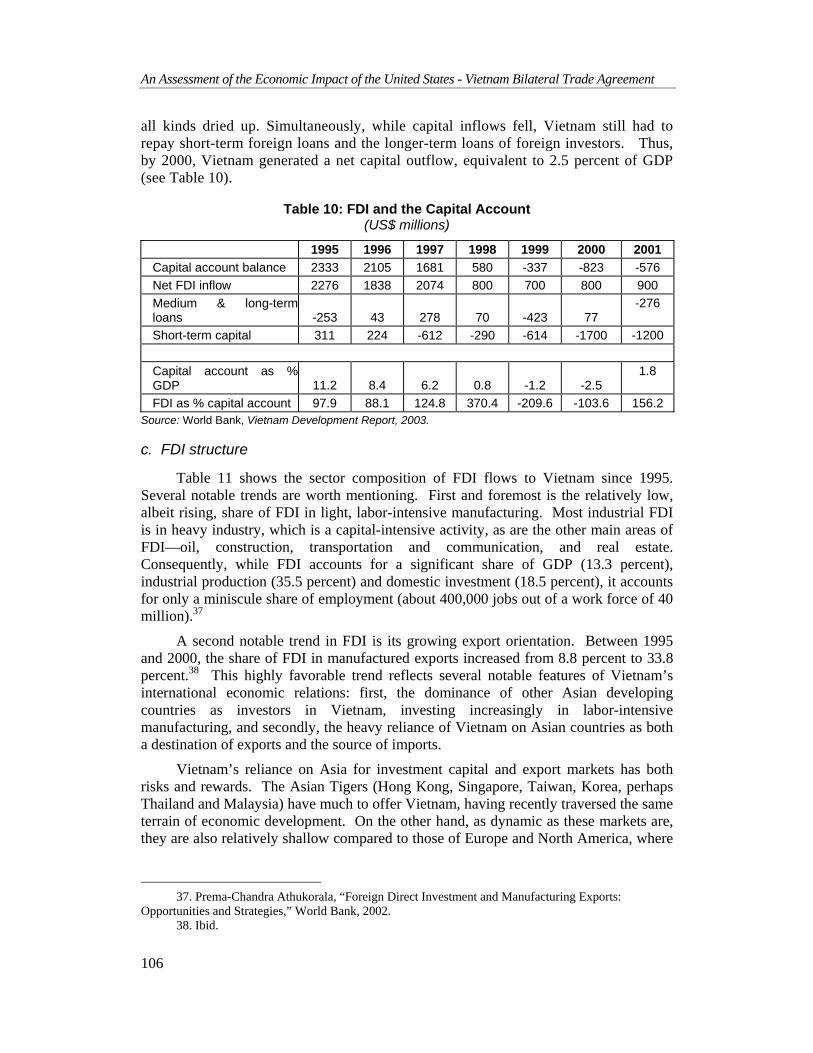
all kinds dried up. Simultaneously, while capital inflows fell, Vietnam still had to repay short-term foreign loans and the longer-term loans of foreign investors. Thus, by 2000, Vietnam generated a net capital outflow, equivalent to 2.5 percent of GDP (see Table 10).
Table 10: FDI and the Capital Account (US$ millions)
1995 1996 1997 1998 1999 2000 2001 Capital account balance 2333 2105 1681 580 -337 -823 -576 Net FDI inflow 2276 1838 2074 800 700 800 900 Medium & long-term loans -253 43 278 70 -423 77
-276
Short-term capital 311 224 -612 -290 -614 -1700 -1200
Capital account as %GDP 11.2 8.4 6.2 0.8 -1.2 -2.5
1.8
FDI as % capital account 97.9 88.1 124.8 370.4 -209.6 -103.6 156.2 Source: World Bank, Vietnam Development Report, 2003.
c. FDI structure
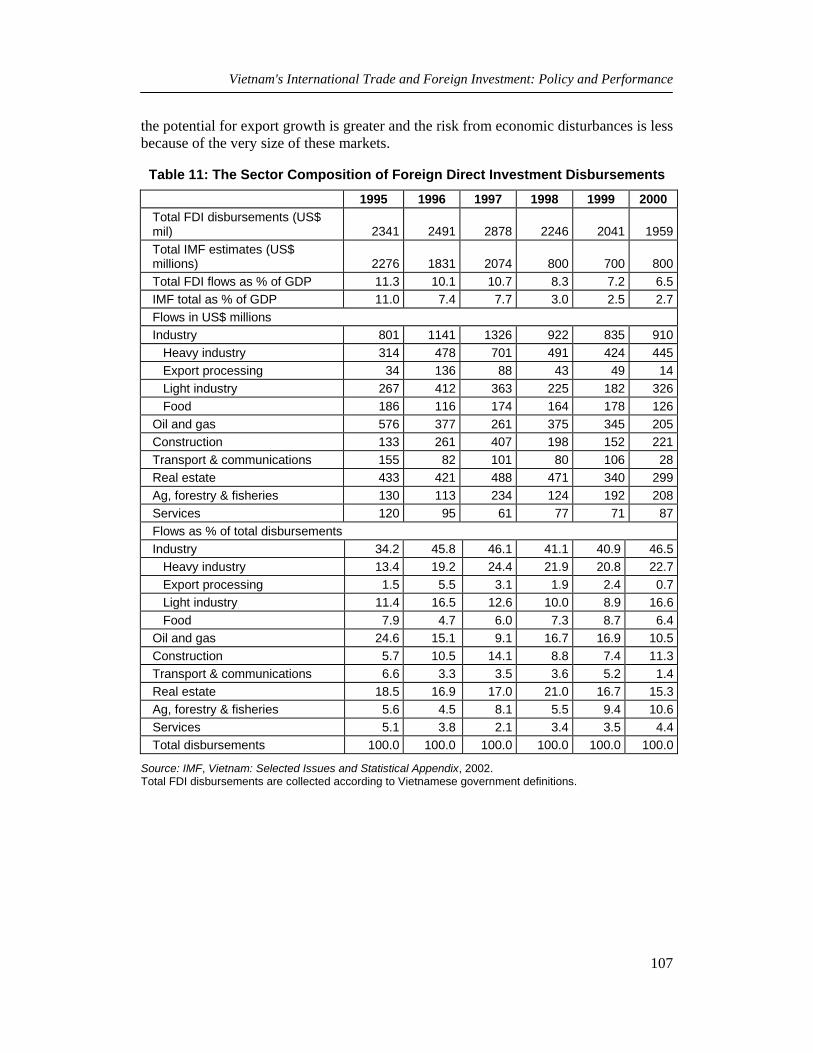
Table 11 shows the sector composition of FDI flows to Vietnam since 1995. Several notable trends are worth mentioning. First and foremost is the relatively low, albeit rising, share of FDI in light, labor-intensive manufacturing. Most industrial FDI is in heavy industry, which is a capital-intensive activity, as are the other main areas of FDI—oil, construction, transportation and communication, and real estate. Consequently, while FDI accounts for a significant share of GDP (13.3 percent), industrial production (35.5 percent) and domestic investment (18.5 percent), it accounts for only a miniscule share of employment (about 400,000 jobs out of a work force of 40 million).37
A second notable trend in FDI is its growing export orientation. Between 1995 and 2000, the share of FDI in manufactured exports increased from 8.8 percent to 33.8 percent.38 This highly favorable trend reflects several notable features of Vietnam’s international economic relations: first, the dominance of other Asian developing countries as investors in Vietnam, investing increasingly in labor-intensive manufacturing, and secondly, the heavy reliance of Vietnam on Asian countries as both a destination of exports and the source of imports.
Vietnam’s reliance on Asia for investment capital and export markets has both risks and rewards. The Asian Tigers (Hong Kong, Singapore, Taiwan, Korea, perhaps Thailand and Malaysia) have much to offer Vietnam, having recently traversed the same terrain of economic development. On the other hand, as dynamic as these markets are, they are also relatively shallow compared to those of Europe and North America, where
37. Prema-Chandra Athukorala, “Foreign Direct Investment and Manufacturing Exports:
Opportunities and Strategies,” World Bank, 2002. 38. Ibid.
Vietnam's International Trade and Foreign Investment: Policy and Performance
107
the potential for export growth is greater and the risk from economic disturbances is less because of the very size of these markets.
Table 11: The Sector Composition of Foreign Direct Investment Disbursements
1995 1996 1997 1998 1999 2000 Total FDI disbursements (US$ mil) 2341 2491 2878 2246 2041 1959Total IMF estimates (US$ millions) 2276 1831 2074 800 700 800Total FDI flows as % of GDP 11.3 10.1 10.7 8.3 7.2 6.5IMF total as % of GDP 11.0 7.4 7.7 3.0 2.5 2.7Flows in US$ millions Industry 801 1141 1326 922 835 910 Heavy industry 314 478 701 491 424 445 Export processing 34 136 88 43 49 14 Light industry 267 412 363 225 182 326 Food 186 116 174 164 178 126Oil and gas 576 377 261 375 345 205Construction 133 261 407 198 152 221Transport & communications 155 82 101 80 106 28Real estate 433 421 488 471 340 299Ag, forestry & fisheries 130 113 234 124 192 208Services 120 95 61 77 71 87Flows as % of total disbursements Industry 34.2 45.8 46.1 41.1 40.9 46.5 Heavy industry 13.4 19.2 24.4 21.9 20.8 22.7 Export processing 1.5 5.5 3.1 1.9 2.4 0.7 Light industry 11.4 16.5 12.6 10.0 8.9 16.6 Food 7.9 4.7 6.0 7.3 8.7 6.4Oil and gas 24.6 15.1 9.1 16.7 16.9 10.5Construction 5.7 10.5 14.1 8.8 7.4 11.3Transport & communications 6.6 3.3 3.5 3.6 5.2 1.4Real estate 18.5 16.9 17.0 21.0 16.7 15.3Ag, forestry & fisheries 5.6 4.5 8.1 5.5 9.4 10.6Services 5.1 3.8 2.1 3.4 3.5 4.4Total disbursements 100.0 100.0 100.0 100.0 100.0 100.0
Source: IMF, Vietnam: Selected Issues and Statistical Appendix, 2002. Total FDI disbursements are collected according to Vietnamese government definitions.
An Assessment of the Economic Impact of the United States - Vietnam Bilateral Trade Agreement
108
III. THE BTA AND THE BILATERAL ECONOMIC RELATIONSHIP
1. The BTA and the principle of reciprocity
a. The principle of reciprocity
Trade and investment agreements between countries, whether bilateral, regional or multilateral, serve two purposes. First, they establish, and make legally binding, the rules that apply to trade and investment between the contracting parties, which are especially important because of the inevitable intrusion of domestic politics into international trade policy and the likelihood of trade disputes. Secondly, trade agreements serve as an instrument of trade liberalization, since in the process of negotiating a trade agreement each country, as a rule, offers commitments (promises to reduce or eliminate certain barriers to trade) to the other on a reciprocal basis. Where these commitments involve a requirement that a country change its policies at the request of another country, such commitments are sometimes called “concessions.”
“Reciprocity” is a key principle of all trade agreements, since it is the promise of greater access to the other country’s market that is the political rationale for the parties to negotiate a trade agreement with each other. From an economics perspective, reciprocity is not significant, since the main beneficiary of trade barrier reductions is the country reducing its own barriers. The principle of reciprocity makes sense from a political perspective, however, since trade agreements have to be “sold” to domestic political constituents who often mistakenly consider the favorable effect on exports of other countries’ “concessions” to be the main source of benefit from trade liberalization agreements. Most of the benefit of trade and investment reform, however, flow from the more efficient allocation of resources in the country making those reforms, resulting in more productive industries that contribute to higher levels of productivity and sustained economic development.
b. Reciprocity in the BTA
The BTA, like other trade agreements, establishes legally binding rules that henceforth will govern trade and investment relations between the two countries, and it specifies the reciprocal commitments that each country will make to reduce barriers to bilateral trade and investment flows. In the more than 100 pages of text and tables that comprise the Agreement, both countries make numerous and significant commitments with respect to their trade and investment regimes and their legal systems, in large part mirroring similar requirements in the WTO. In reading the extensive BTA document, one may be struck by the fact that the BTA commitments require Vietnam to make many more changes to its trade and investment regime and its legal system than is required to be made by the United States. For the U.S., the principal BTA commitment requiring change in its legal and trade regime was to grant Vietnam NTR/MFN access to the U.S. market immediately upon entry into force of the Agreement.
The principle of reciprocity is, however, alive and well in the BTA. The United States, an advanced economy that has been engaged in multilateral trade liberalization for decades, has already eliminated most barriers to trade and investment on a MFN
The BTA and the Bilateral Economic Relationship
109
basis. With the granting of MFN status, Vietnam immediately becomes the beneficiary of the commitments (concessions) that the United States has made to other countries on a MFN (now NTR) basis over the past fifty years. Vietnam, on the other hand, as a developing economy, is allowed to retain certain trade and investment barriers that the WTO prohibits in developed countries, and is permitted to phase-in the concessions it made in the BTA over a number of years.
The BTA, nevertheless, is quite demanding in terms of the commitments Vietnam has agreed to make. As a latecomer to international trade negotiations, Vietnam has been required to meet standards that are higher than were demanded of developing countries in the past. While meeting the BTA commitments will impose an adjustment burden on sectors that in the past have been highly protected from international competition, it will also encourage efficient resource allocation and prepare Vietnam for accession to the WTO.39
2. Key characteristics of the BTA: obligations and BTA-related policy reforms
a. BTA obligations
The BTA is the most comprehensive bilateral trade agreement ever negotiated by either Vietnam or the United States, with extensive obligations for both Parties. The Agreement consists of well over 100 pages of text and tables and is elaborated in seven Chapters: I) Trade in Goods; II) Intellectual Property Rights; III) Trade in Services; IV) Development of Investment Relations; V) Business Facilitation; VI) Transparency-Related Provisions and Right to Appeal; and, VII) General Articles.40 Many of the obligations in the BTA reflect the internationally recognized rules, regulations and administrative procedures that are incorporated in the WTO and other international conventions and agreements that have been developed to govern global trade and investment relations.
The BTA specifically recognizes Vietnam’s status as a developing country. Accordingly, while a number of Vietnam’s commitments in the BTA were due immediately upon entry into force of the Agreement (December 10, 2001), others will be phased in over various time periods from one to ten years, with most key commitments due within three to four years after entry into force of the Agreement. The U.S. met all its obligations when the Agreement came into effect by providing NTR/MFN trade status for Vietnam. This reduced the average U.S. tariff rate for Vietnamese exports to the United States from around 40 percent to around 3-4 percent.
The BTA, much like the WTO, is a modern “trade” agreement, in the sense that it includes extensive obligations related not just to import tariffs and quotas, but also to transparency, dispute settlement, investment, intellectual property protection, market access for services, and business facilitation. In fact, the BTA requires that Vietnam cut
39. Much the same situation holds for Vietnam’s accession to the WTO. Standards for those countries recently entering the WTO are far more stringent than standards for developing economies joining the GATT in previous decades.
40. The English text of the BTA, with accompanying side letters, is available on the USTR webpage (www.ustr.gov). The Vietnamese language text is published in the Official Gazette of the Vietnamese Government.
An Assessment of the Economic Impact of the United States - Vietnam Bilateral Trade Agreement
110
tariffs, typically by 25 to 50 percent, on only around 250 tariff lines (out of more than 6,000 total tariff lines), mostly in agricultural products. As well, although the Agreement has an extensive list of quantitative restrictions on imports that must be eliminated, typically four to six years after entry into force of the Agreement, almost all of these have been eliminated well ahead of schedule as part of a IMF/World Bank Agreement. As shown in Table 1, all import quotas except for sugar and petroleum products were eliminated by the beginning of 2003.41 It is important to note, however, that the elimination of these quotas through the IMF/WB Agreement is “bound” only for the duration of the IMF/WB Agreement (through 2005), whereas the BTA restrictions on quotas are “bound” permanently.42
Vietnam’s BTA commitments go far beyond the requirements for reducing import tariffs and quotas just mentioned, as follows:43
1) Most-Favored Nation (NTR/MFN) and National Treatment Accorded to U.S. Companies and Nationals. The BTA commitments require Vietnam to provide NTR/MFN and national treatment (NT) for most trade in goods and services and for investment relations, except for a moderate number of exemptions listed in various provisions and annexes of the Agreement. National treatment is provided for protecting intellectual property rights. In some cases, MFN and NT is phased in over time according to detailed timetables specified in the BTA.
2) Customs System and Procedures Reformed. The BTA commitments require Vietnam to meet international/WTO standards for customs procedures, including: a) shifting its tariff procedures from a system based on reference prices to a system using transaction values (by December 2003); b) undertaking every reasonable effort to comply with international standards on harmonized system of tariff classifications (by December 2002); and, c) limiting all fees on customs procedures to not exceed the costs of the services rendered (by December 2002).
3) Administrative Procedures and Technical Regulations Cannot Be Used for Protective Purposes. Upon entry into force (December 2001), the BTA commits Vietnam not to use administrative procedures and technical regulations to “create unnecessary obstacles to international trade,” including specifically technical regulations and standards for goods, and sanitary and phytosanitary measures.
41. The IMF/WB Agreement does not require elimination of quotas on sugar and petroleum
imports. The BTA, however, does require that import quotas on petroleum products be phased out after seven years and on sugar after ten years from entry into force of the BTA.
42. See Decision of the Prime Minister on managing exports and imports in the 2001-2005 period, No.: 46/2001/QD-TTg, April 4, 2001
43. The following is not intended to provide a comprehensive review of BTA obligations, but rather it provides a summary of key obligations to highlight the breadth and depth of the types of policies affected by the BTA. See the “Summary of the U.S.-Vietnam Trade Agreement” produced by the U.S. Vietnam Trade Council’s Education Forum and the Vietnamese Ministry of Trade for a more comprehensive summary of BTA obligations.
The BTA and the Bilateral Economic Relationship
111
4) Liberalize and Streamline Trading Rights. The BTA commitments require Vietnam, upon entry into force (December 2001), to liberalize and streamline licensing procedures for import and export activities, subject to certain phased in sectoral limitations, with substantial liberalization in such trading rights for U.S.-invested firms phased in from year 3 (December 2004) to year 7 (December 2008) after entry into force. State trading activities must be conducted on a commercial basis upon entry into force (December 2001).
5) Commercial Dispute Settlement Procedures Upgraded. Upon entry into force, the BTA commits Vietnam to allow commercial disputes to be settled by internationally-recognized arbitration rules and provide for effective means to recognize and enforce arbitral awards.
6) Intellectual Property Rights Protection Substantially Enhanced. The BTA commitments require Vietnam to enhance substantially its legal framework, judicial procedures and enforcement mechanisms in order to improve protection of intellectual property rights, including for copyright and related rights, patents, trademarks, trade secrets, industrial designs, encrypted satellite signals, layout designs of integrated circuits, and plant varieties. Vietnam agreed to enforce its existing laws on IPR upon entry into force of the Agreement. Additional IPR obligations, which largely mirror those contained in key international conventions44 and in the WTO Agreement on Trade-Related Aspects of Intellectual Property Rights (TRIPs), are to be met over a period of time from month 12 (December 2002) to month 30 (June 2004) following entry into force of the BTA.
7) Liberalizing Trade in Services. Vietnam commits to improve substantially market access for U.S. service providers in more than 20 sectors, including: a) business services such as legal services, accounting/auditing, tax consulting, architectural, engineering, computer and related services, advertising, market research and management consulting services; b) communication services such as telecommunication (value-added and internet, basic, and voice) and audio-visual services; c) construction and related engineering services; d) distribution services such as wholesale, retail and franchising services; e) education services; f) financial services, such as insurance, banking and related financial services; g) health-related services; and h) tourism and travel-related services. Most of these commitments are phased in over a period from year 2 (December 2003) through year 7 (December 2008), although one extends to year 10 (December 2011). To ensure that such reforms are meaningful, the BTA calls for transparent and objective domestic regulations for services, with limitations on abuse by monopoly suppliers and buyers. It also includes many key obligations of the WTO General Agreement on Trade in Services (GATS) and incorporates in full
44. Specifically referred to in the BTA, these conventions are: The Paris Convention on for the
Protection of Industrial Property (1967); The Berne Convention for the Protection of Literary and Artistic Works (1971); The Convention for the Protection of Phonograms Against Unauthorized Duplication of their Phonograms (Geneva Convention) (1971); The Convention Relating to the Distribution of Program-Carrying Signals Transmitted by Satellite (Brussels Convention) (1974); The International Convention for the Protection of New Varieties of Plants (UPOV) (1978 or 1991). To date Vietnam is a member of only the Paris Convention.
An Assessment of the Economic Impact of the United States - Vietnam Bilateral Trade Agreement
112
the GATS Annex on Telecommunications, the WTO Telecommunications Reference Paper, GATS Annex on Financial Services and the GATS Annex on the Movement of Natural Persons.
8) Liberalizing and Safeguarding Foreign Investment. The BTA commitments require Vietnam to make a number of reforms that should encourage greater U.S. investment in Vietnam, including: a) providing the better of MFN or NT for U.S. investors with national treatment phased in over time with respect to corporate governance, pricing for certain fees and services and the mortgage of land use rights; b) streamlining investment licensing procedures, in particular shifting over time toward a registration system of investment licensing rather than an evaluation regime; c) non-discriminatory pricing; d) a range of safeguards for foreign investors, including guarantees against expropriation without due process and prompt and effective compensation and for the repatriation of earnings; e) the elimination over time of trade-related investment measures (TRIMs) regarding trade balancing, local content and foreign-exchange requirements; f) the elimination of export performance and technology transfer requirements; g) the right to chose key personnel regardless of nationality, and the movement of management personnel; and, h) providing investors with a choice of means and procedures for resolving disputes with the government, including arbitration. Many of these obligations are due upon entry into force, while others are phased in over a number of years, in one case up to nine years after entry into force.
9) Business Facilitation. Upon entry into force of the Agreement (December 2001), the BTA commitments require Vietnam to facilitate bilateral trade and investment relationships by providing non-discriminatory and direct access to basic business activities, such as advertising, conducting market studies, renting offices, and so on.
10) Increased Transparency for Laws, Regulations and Administrative Procedures. Upon entry into force (December 2001), the BTA requires prompt, regular publication in an official journal of all laws, regulations and administrative procedures of general application, together with contact information, made readily available to the public before they can be enforced. In addition, it requires that Vietnam provide the opportunity to U.S. Nationals and the U.S. Government to comment on draft laws, regulations and administrative procedures. This requirement applies at both the national and local level.
11) Developing the System for Appealing Administrative Actions. Upon entry into force (December 2001), the BTA commitments require Vietnam to develop and maintain a system of administrative and judicial tribunals to provide the opportunity for prompt review and correction of administrative action related to matters covered by the Agreement. Administrative actions should be appealable to a court and the parties should be notified in writing of decisions on such appeals together with the reasons therefore.
BTA obligations not only facilitate bilateral trade and investment relations and provide improved market access for U.S. goods and services in Vietnam and Vietnamese
The BTA and the Bilateral Economic Relationship
113
goods and services in the United States, they also place significant demands on Vietnam’s legal system. Effective implementation of the BTA presumes a legal framework and judicial system that can resolve commercial disputes in line with international standards, similar to those prescribed by the WTO. In particular, BTA obligations with regard to commercial arbitration, to the extensive legal procedures specified for enforcing intellectual property rights, to guaranteeing investors rights and resolving investment disputes, to the right to appeal administrative actions, and to transparency in general, all place important legal, procedural, institutional and human resource development demands on the legal system of Vietnam.45 In this way, just as the BTA serves as a major stepping stone for Vietnam’s accession to the WTO, it also serves as a major catalyst for systematic reforms in the Vietnamese legal and governance systems that should serve to promote Vietnam’s socio-economic objectives with regard to establishing a socialist rule-of-law state and a socialist-oriented market economy, including importantly within this context, promoting private-sector development.
b. BTA-related policy and legal changes
In this section, we present examples of areas where Vietnam has made changes in their laws and institutional capabilities that include elements required in the BTA and that bring Vietnam more closely in line with the BTA and WTO requirements. Important commitments that were due upon entry into force (December 2001) include the general application of MFN and NT, commercial arbitration and investment dispute settlement processes, transparency requirements, right to appeal, streamlining licensing procedures, liberalization of legal services, conformance to much of the GATS and to GATS Annexes (particularly for telecommunications and financial services), investment safeguards, elimination of trade balancing and technology transfer requirements for investment, enforcement of existing IPR regulations, and business facilitation.
By early 2003, new laws, ordinances and decrees addressing key BTA requirements that were due upon entry into force had been promulgated, or were on the verge of approval, by the Vietnamese government.46 These include major amendments to the Law on the Promulgation of Legal Normative Documents to require that legal normative documents (LNDs) issued by most State agencies do not become effective until 15 days after their publication in the Official Gazette. Adoption of related implementing regulations is being expedited and these regulations are expected to include not only national but also local government LNDs and provisions related to other important BTA transparency commitments. New ordinances on MFN and NT and on Commercial Arbitration have been approved by the National Assembly, and the Government is beginning to develop implementing regulations on commercial arbitration. A recently approved decree has helped to improve foreign investment procedures, and a final draft decree on foreign legal services has been prepared for
45. In parallel with and in mutual reinforcement to the implementation of the BTA and accession
to the WTO, the Government of Vietnam has committed to implement over this decade systematic reform and institutional capacity programs in legal development (the Legal Needs Assessment) and public administration.
46. This section is not intended to provide a formal or comprehensive assessment or monitoring of BTA implementation, but rather it provides general examples of BTA-related legal reforms. The two governments are responsible for formally monitoring BTA implementation.
An Assessment of the Economic Impact of the United States - Vietnam Bilateral Trade Agreement
114
submittal to the Prime Minister for approval. These legal changes move Vietnam toward, but well from full, compliance with its BTA obligations that were due upon entry into force.
A number of important BTA obligations become due over the course of 2003, including those related to customs, intellectual property rights, investment registration, and market access in a number of service sectors. A new Customs Law greatly improves the general legal framework for meeting BTA obligations, but implementing regulations and enforcement capabilities require further attention. Although the current legal framework for intellectual property protection provides some of the minimum standards contained in the international intellectual property conventions, further strengthening will be required. Furthermore, the capacity to enforce the protection of intellectual property rights will require substantial improvements, both with regard to administrative enforcement and to judicial dispute settlement procedures. In these regards, efforts are under way to amend the Civil Code, which provides the primary legal framework for IPR, as well as the key related legal documents affecting enforcement, such as a Civil Procedure Code, a law on the enforcement of court judgments, and decrees on civil remedies and penalties. Liberalization of service sectors are being dealt with in sector-specific laws, including amendments to the Law on Credit Institutions (for banking and other credit activities), a new Law on Construction (for architectural, engineering and construction services), and implementing regulations for a newly approved Ordinance on Telecommunications, and through MPI regulations on limits to foreign ownership.
The effective and timely implementation of the BTA by the Vietnamese government will require a continuing and dedicated effort, especially over the next two to three years. This effort will need to be focused not just on making changes in laws, regulations and administrative procedures, but also on improving the capacity to enforce and implement the new laws, which will require important and sustained institutional and human resource development in the judicial system, in the national and local governments, in the business sector, and among key professions such as lawyers and financial experts.
The Vietnamese and U.S. Governments are responsible for implementing the BTA and for monitoring its compliance. Reports from the two governments suggest that serious efforts and clear progress have been made in implementing the BTA, although important challenges remain. In a recent speech, for example, the U.S. Ambassador to Vietnam states: “As we reach the one-year mark of the BTA entry-into-force, Vietnam is making a good effort on implementation despite some serious challenges. There has been increased interest in Vietnam by U.S. firms, but some investors are still cautious, waiting to see how Vietnam implements its commitments under the BTA. In particular, they are concerned about Vietnam fulfilling its commitments in the critical areas of transparency, investment, and protection of intellectual property rights […].”47 At a recent major conference in Hanoi, Vietnam’s Minister of Trade “confirmed that the Vietnamese government has made every effort to implement commitments made in the BTA, with some areas, such as investment and open-door policies, completed ahead of time.” He predicted that growth in Vietnamese
47. Speech presented by U.S. Ambassador Raymond Burghardt at The Asia Society, Washington D.C. Chapter, January 21, 2003, reported on the U.S. Embassy, Vietnam webpage.
The BTA and the Bilateral Economic Relationship
115
exports would continue to accelerate in response to the opportunities opened by the BTA, and that the “BTA will be implemented on a wider scale in 2003, 2004 and 2005,” serving as a favorable force for “Vietnam in the process to [accede] to the World Trade Organization.”48
3. Bilateral trade and investment: trends and recent developments
a. Overview of bilateral trade flows
Trade and investment relations between the United States and Vietnam commenced in 1994 after President Clinton lifted the 19-year-old trade embargo on Vietnam. Every year since 1998, Vietnam has been granted a waiver from the Jackson-Vanik Amendment, which is necessary for socialist countries such as Vietnam to have access to U.S. government supported export credits and investment guarantees. Normal trade relations between the two countries, the key element of which is reciprocal most-favored-nations status, have existed only since December 2001 with entry into force of the BTA. Little wonder then that Vietnam has only just begun to tap the enormous U.S. market.
As Table 12 indicates, from 1996 to 2001, Vietnamese exports to the U.S. grew 27 percent per year, on average, while total exports grew at the lower rate of about 20 percent (see Table 8). Nevertheless, by 2001 just before the BTA came into force, the U.S. market accounted for only about seven percent of Vietnam’s exports. Furthermore, at about one billion U.S. dollars in 2001, Vietnam’s exports amounted to only 0.2 percent of U.S. imports from developing countries. In 2002, the first year under the BTA, exports to the U.S. more than doubled (a 128 percent increase for the year), while total exports grew at a rate of about 10 percent.49 In fact, about 90% of the increase in overall Vietnamese exports in 2002 can be attributed to the surge in exports to the U.S. As a result, in just one year under the BTA, the share of the U.S. market in total exports doubled, rising to 14 percent.50
U.S. exports to Vietnam grew at a rate of 26 percent in 2002, in line with such growth in previous years but considerably faster than overall U.S. exports and faster than the overall growth of 20% in Vietnamese imports in 2002 (see Table 8).51 Of course it is not surprising that Vietnam’s exports to the U.S. grew more rapidly under the BTA than the U.S.’s exports to Vietnam, since the tariff concessions granted by the U.S. to Vietnam are of much greater significance to Vietnam than those made by
48. Excerpts reported by the Vietnam News Agency on March 26, 2003 for a speech made by Minister
of Trade Truong Dinh Tuyen at a major Asia Society Conference held in Hanoi on March 7, 2003. 49. Here we rely on trade data published by the U.S. International Trade Commission. Although
we have not yet conducted a careful examination, differences between the U.S. and Vietnamese trade data do not appear substantial. Data on bilateral trade flows can be substantially different, for example, see, K.C. Feng and Lawrence J. Lau, “China-United States Bilateral Trade Balances 1990-2000,” HKCER Economic Letters, Dec. 2001.
50. Note that from July to December 2002, Vietnamese exports to the U.S. accounted for almost 18 percent of total exports.
51. U.S. exports to Vietnam in 1996 are disproportionately large due to the one-off export of $231 million of aircraft.
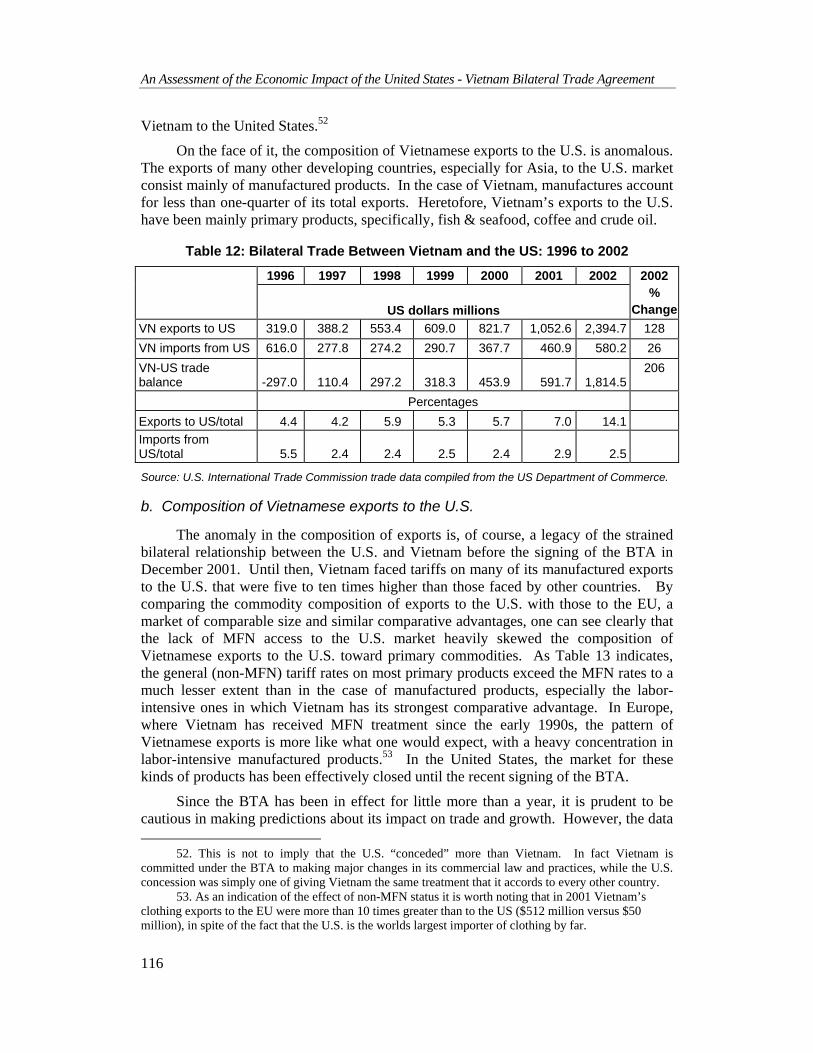
An Assessment of the Economic Impact of the United States - Vietnam Bilateral Trade Agreement
116
Vietnam to the United States.52
On the face of it, the composition of Vietnamese exports to the U.S. is anomalous. The exports of many other developing countries, especially for Asia, to the U.S. market consist mainly of manufactured products. In the case of Vietnam, manufactures account for less than one-quarter of its total exports. Heretofore, Vietnam’s exports to the U.S. have been mainly primary products, specifically, fish & seafood, coffee and crude oil.
Table 12: Bilateral Trade Between Vietnam and the US: 1996 to 2002
1996 1997 1998 1999 2000 2001 2002
US dollars millions
2002 %
ChangeVN exports to US 319.0 388.2 553.4 609.0 821.7 1,052.6 2,394.7 128 VN imports from US 616.0 277.8 274.2 290.7 367.7 460.9 580.2 26 VN-US trade balance -297.0 110.4 297.2 318.3 453.9 591.7 1,814.5
206
Percentages Exports to US/total 4.4 4.2 5.9 5.3 5.7 7.0 14.1 Imports from US/total 5.5 2.4 2.4 2.5 2.4 2.9 2.5
Source: U.S. International Trade Commission trade data compiled from the US Department of Commerce.
b. Composition of Vietnamese exports to the U.S.
The anomaly in the composition of exports is, of course, a legacy of the strained bilateral relationship between the U.S. and Vietnam before the signing of the BTA in December 2001. Until then, Vietnam faced tariffs on many of its manufactured exports to the U.S. that were five to ten times higher than those faced by other countries. By comparing the commodity composition of exports to the U.S. with those to the EU, a market of comparable size and similar comparative advantages, one can see clearly that the lack of MFN access to the U.S. market heavily skewed the composition of Vietnamese exports to the U.S. toward primary commodities. As Table 13 indicates, the general (non-MFN) tariff rates on most primary products exceed the MFN rates to a much lesser extent than in the case of manufactured products, especially the labor-intensive ones in which Vietnam has its strongest comparative advantage. In Europe, where Vietnam has received MFN treatment since the early 1990s, the pattern of Vietnamese exports is more like what one would expect, with a heavy concentration in labor-intensive manufactured products.53 In the United States, the market for these kinds of products has been effectively closed until the recent signing of the BTA.
Since the BTA has been in effect for little more than a year, it is prudent to be cautious in making predictions about its impact on trade and growth. However, the data
52. This is not to imply that the U.S. “conceded” more than Vietnam. In fact Vietnam is committed under the BTA to making major changes in its commercial law and practices, while the U.S. concession was simply one of giving Vietnam the same treatment that it accords to every other country.
53. As an indication of the effect of non-MFN status it is worth noting that in 2001 Vietnam’s clothing exports to the EU were more than 10 times greater than to the US ($512 million versus $50 million), in spite of the fact that the U.S. is the worlds largest importer of clothing by far.
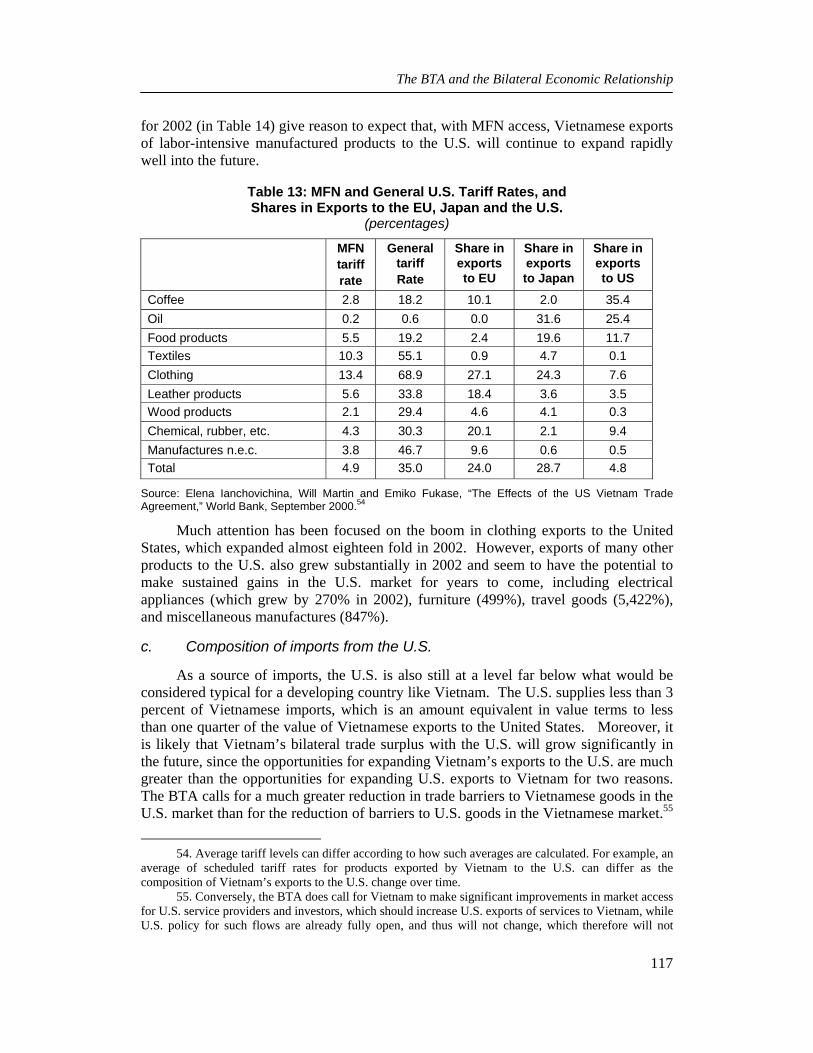
The BTA and the Bilateral Economic Relationship
117
for 2002 (in Table 14) give reason to expect that, with MFN access, Vietnamese exports of labor-intensive manufactured products to the U.S. will continue to expand rapidly well into the future.
Table 13: MFN and General U.S. Tariff Rates, and Shares in Exports to the EU, Japan and the U.S.
(percentages)
MFN tariff rate
General tariff Rate
Share in exports to EU
Share in exports to Japan
Share in exports to US
Coffee 2.8 18.2 10.1 2.0 35.4 Oil 0.2 0.6 0.0 31.6 25.4 Food products 5.5 19.2 2.4 19.6 11.7 Textiles 10.3 55.1 0.9 4.7 0.1 Clothing 13.4 68.9 27.1 24.3 7.6 Leather products 5.6 33.8 18.4 3.6 3.5 Wood products 2.1 29.4 4.6 4.1 0.3 Chemical, rubber, etc. 4.3 30.3 20.1 2.1 9.4 Manufactures n.e.c. 3.8 46.7 9.6 0.6 0.5 Total 4.9 35.0 24.0 28.7 4.8
Source: Elena Ianchovichina, Will Martin and Emiko Fukase, “The Effects of the US Vietnam Trade Agreement,” World Bank, September 2000.54
Much attention has been focused on the boom in clothing exports to the United States, which expanded almost eighteen fold in 2002. However, exports of many other products to the U.S. also grew substantially in 2002 and seem to have the potential to make sustained gains in the U.S. market for years to come, including electrical appliances (which grew by 270% in 2002), furniture (499%), travel goods (5,422%), and miscellaneous manufactures (847%).
c. Composition of imports from the U.S.
As a source of imports, the U.S. is also still at a level far below what would be considered typical for a developing country like Vietnam. The U.S. supplies less than 3 percent of Vietnamese imports, which is an amount equivalent in value terms to less than one quarter of the value of Vietnamese exports to the United States. Moreover, it is likely that Vietnam’s bilateral trade surplus with the U.S. will grow significantly in the future, since the opportunities for expanding Vietnam’s exports to the U.S. are much greater than the opportunities for expanding U.S. exports to Vietnam for two reasons. The BTA calls for a much greater reduction in trade barriers to Vietnamese goods in the U.S. market than for the reduction of barriers to U.S. goods in the Vietnamese market.55
54. Average tariff levels can differ according to how such averages are calculated. For example, an average of scheduled tariff rates for products exported by Vietnam to the U.S. can differ as the composition of Vietnam’s exports to the U.S. change over time.
55. Conversely, the BTA does call for Vietnam to make significant improvements in market access for U.S. service providers and investors, which should increase U.S. exports of services to Vietnam, while U.S. policy for such flows are already fully open, and thus will not change, which therefore will not
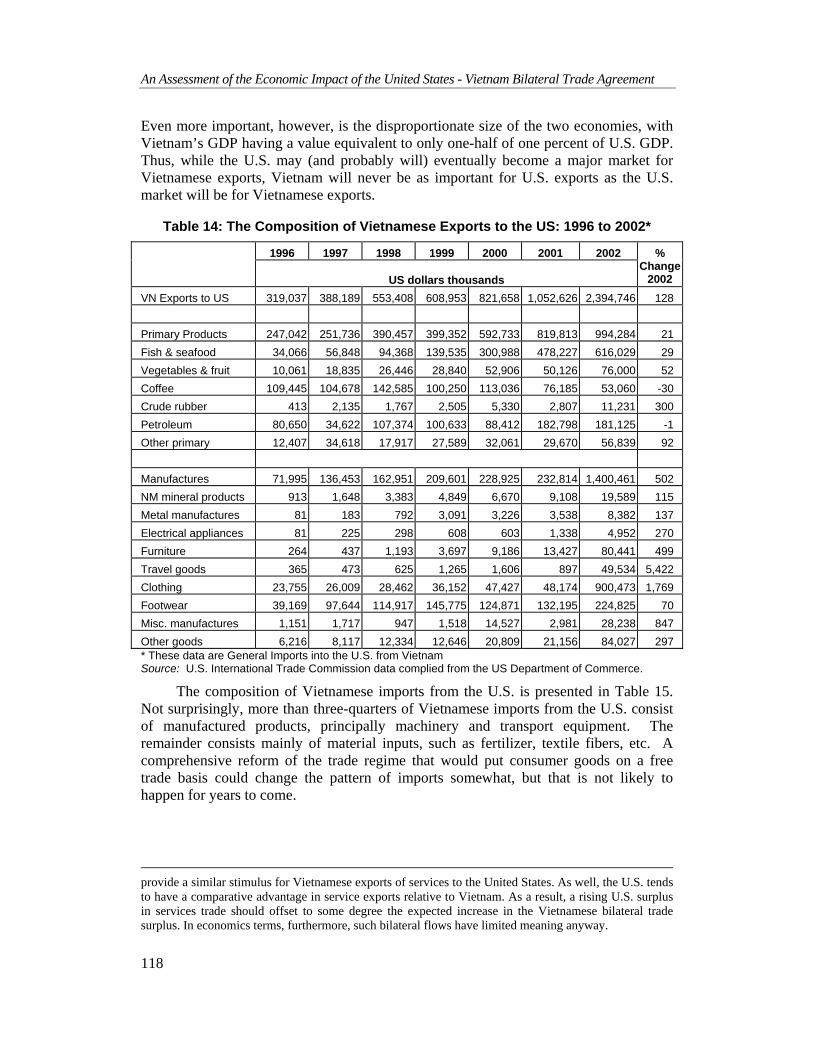
An Assessment of the Economic Impact of the United States - Vietnam Bilateral Trade Agreement
118
Even more important, however, is the disproportionate size of the two economies, with Vietnam’s GDP having a value equivalent to only one-half of one percent of U.S. GDP. Thus, while the U.S. may (and probably will) eventually become a major market for Vietnamese exports, Vietnam will never be as important for U.S. exports as the U.S. market will be for Vietnamese exports.
Table 14: The Composition of Vietnamese Exports to the US: 1996 to 2002*
1996 1997 1998 1999 2000 2001 2002
US dollars thousands
% Change
2002 VN Exports to US 319,037 388,189 553,408 608,953 821,658 1,052,626 2,394,746 128 Primary Products 247,042 251,736 390,457 399,352 592,733 819,813 994,284 21 Fish & seafood 34,066 56,848 94,368 139,535 300,988 478,227 616,029 29 Vegetables & fruit 10,061 18,835 26,446 28,840 52,906 50,126 76,000 52 Coffee 109,445 104,678 142,585 100,250 113,036 76,185 53,060 -30 Crude rubber 413 2,135 1,767 2,505 5,330 2,807 11,231 300 Petroleum 80,650 34,622 107,374 100,633 88,412 182,798 181,125 -1 Other primary 12,407 34,618 17,917 27,589 32,061 29,670 56,839 92 Manufactures 71,995 136,453 162,951 209,601 228,925 232,814 1,400,461 502 NM mineral products 913 1,648 3,383 4,849 6,670 9,108 19,589 115 Metal manufactures 81 183 792 3,091 3,226 3,538 8,382 137 Electrical appliances 81 225 298 608 603 1,338 4,952 270 Furniture 264 437 1,193 3,697 9,186 13,427 80,441 499 Travel goods 365 473 625 1,265 1,606 897 49,534 5,422 Clothing 23,755 26,009 28,462 36,152 47,427 48,174 900,473 1,769 Footwear 39,169 97,644 114,917 145,775 124,871 132,195 224,825 70 Misc. manufactures 1,151 1,717 947 1,518 14,527 2,981 28,238 847 Other goods 6,216 8,117 12,334 12,646 20,809 21,156 84,027 297 * These data are General Imports into the U.S. from Vietnam Source: U.S. International Trade Commission data complied from the US Department of Commerce.
The composition of Vietnamese imports from the U.S. is presented in Table 15. Not surprisingly, more than three-quarters of Vietnamese imports from the U.S. consist of manufactured products, principally machinery and transport equipment. The remainder consists mainly of material inputs, such as fertilizer, textile fibers, etc. A comprehensive reform of the trade regime that would put consumer goods on a free trade basis could change the pattern of imports somewhat, but that is not likely to happen for years to come.
provide a similar stimulus for Vietnamese exports of services to the United States. As well, the U.S. tends to have a comparative advantage in service exports relative to Vietnam. As a result, a rising U.S. surplus in services trade should offset to some degree the expected increase in the Vietnamese bilateral trade surplus. In economics terms, furthermore, such bilateral flows have limited meaning anyway.
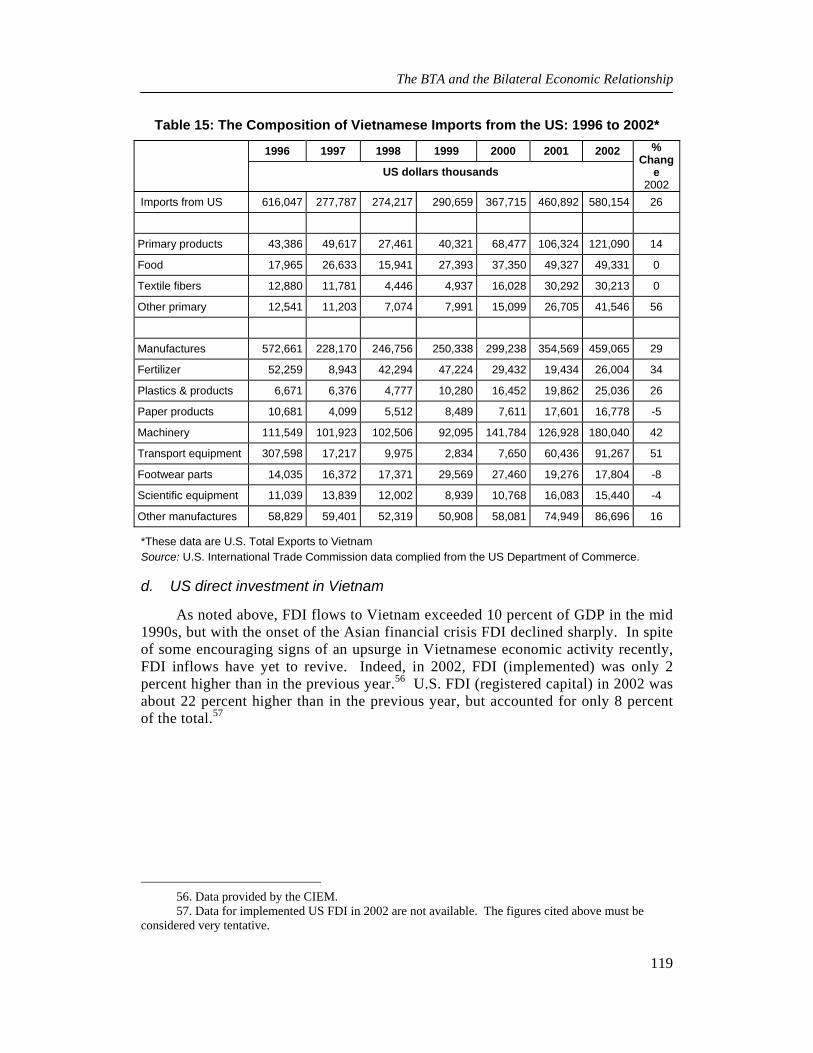
The BTA and the Bilateral Economic Relationship
119
Table 15: The Composition of Vietnamese Imports from the US: 1996 to 2002*
1996 1997 1998 1999 2000 2001 2002
US dollars thousands
% Chang
e 2002
Imports from US 616,047 277,787 274,217 290,659 367,715 460,892 580,154 26
Primary products 43,386 49,617 27,461 40,321 68,477 106,324 121,090 14
Food 17,965 26,633 15,941 27,393 37,350 49,327 49,331 0
Textile fibers 12,880 11,781 4,446 4,937 16,028 30,292 30,213 0
Other primary 12,541 11,203 7,074 7,991 15,099 26,705 41,546 56
Manufactures 572,661 228,170 246,756 250,338 299,238 354,569 459,065 29
Fertilizer 52,259 8,943 42,294 47,224 29,432 19,434 26,004 34
Plastics & products 6,671 6,376 4,777 10,280 16,452 19,862 25,036 26
Paper products 10,681 4,099 5,512 8,489 7,611 17,601 16,778 -5
Machinery 111,549 101,923 102,506 92,095 141,784 126,928 180,040 42
Transport equipment 307,598 17,217 9,975 2,834 7,650 60,436 91,267 51
Footwear parts 14,035 16,372 17,371 29,569 27,460 19,276 17,804 -8
Scientific equipment 11,039 13,839 12,002 8,939 10,768 16,083 15,440 -4
Other manufactures 58,829 59,401 52,319 50,908 58,081 74,949 86,696 16
*These data are U.S. Total Exports to Vietnam Source: U.S. International Trade Commission data complied from the US Department of Commerce.
d. US direct investment in Vietnam
As noted above, FDI flows to Vietnam exceeded 10 percent of GDP in the mid 1990s, but with the onset of the Asian financial crisis FDI declined sharply. In spite of some encouraging signs of an upsurge in Vietnamese economic activity recently, FDI inflows have yet to revive. Indeed, in 2002, FDI (implemented) was only 2 percent higher than in the previous year.56 U.S. FDI (registered capital) in 2002 was about 22 percent higher than in the previous year, but accounted for only 8 percent of the total.57
56. Data provided by the CIEM. 57. Data for implemented US FDI in 2002 are not available. The figures cited above must be
considered very tentative.
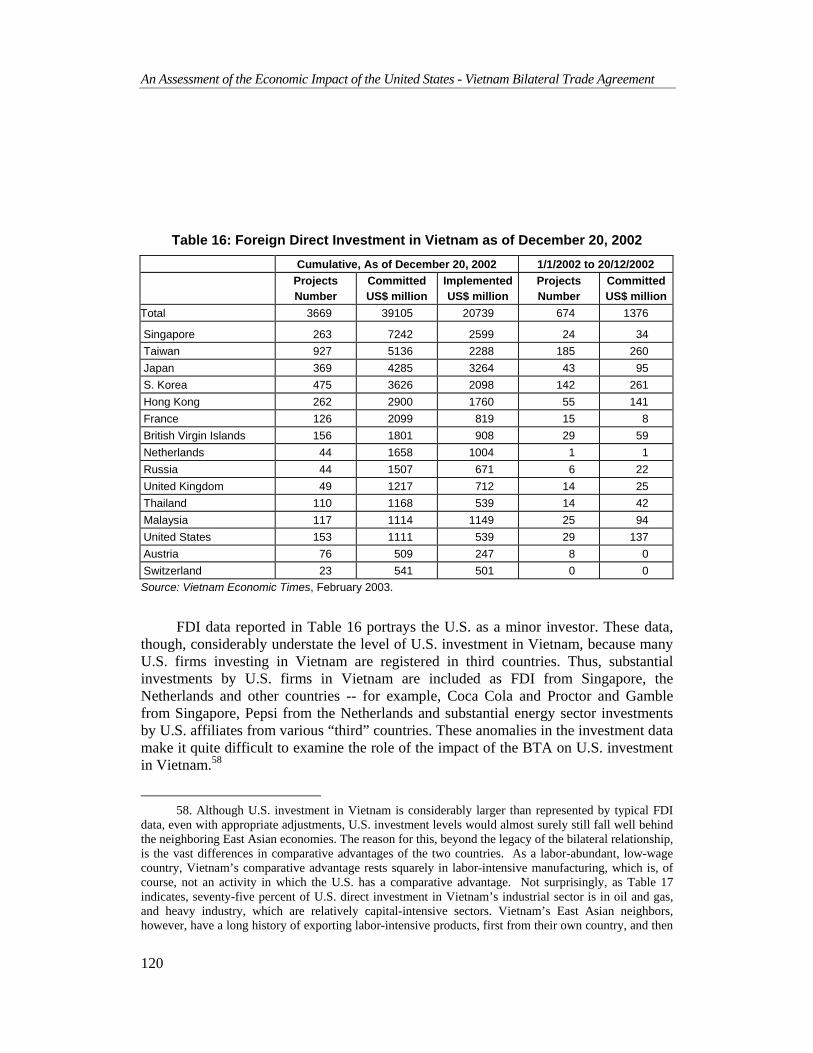
An Assessment of the Economic Impact of the United States - Vietnam Bilateral Trade Agreement
120
Table 16: Foreign Direct Investment in Vietnam as of December 20, 2002 Cumulative, As of December 20, 2002 1/1/2002 to 20/12/2002
Projects Number
Committed US$ million
ImplementedUS$ million
Projects Number
Committed US$ million
Total 3669 39105 20739 674 1376
Singapore 263 7242 2599 24 34 Taiwan 927 5136 2288 185 260 Japan 369 4285 3264 43 95 S. Korea 475 3626 2098 142 261 Hong Kong 262 2900 1760 55 141 France 126 2099 819 15 8 British Virgin Islands 156 1801 908 29 59 Netherlands 44 1658 1004 1 1 Russia 44 1507 671 6 22 United Kingdom 49 1217 712 14 25 Thailand 110 1168 539 14 42 Malaysia 117 1114 1149 25 94 United States 153 1111 539 29 137 Austria 76 509 247 8 0 Switzerland 23 541 501 0 0 Source: Vietnam Economic Times, February 2003.
FDI data reported in Table 16 portrays the U.S. as a minor investor. These data, though, considerably understate the level of U.S. investment in Vietnam, because many U.S. firms investing in Vietnam are registered in third countries. Thus, substantial investments by U.S. firms in Vietnam are included as FDI from Singapore, the Netherlands and other countries -- for example, Coca Cola and Proctor and Gamble from Singapore, Pepsi from the Netherlands and substantial energy sector investments by U.S. affiliates from various “third” countries. These anomalies in the investment data make it quite difficult to examine the role of the impact of the BTA on U.S. investment in Vietnam.58
58. Although U.S. investment in Vietnam is considerably larger than represented by typical FDI
data, even with appropriate adjustments, U.S. investment levels would almost surely still fall well behind the neighboring East Asian economies. The reason for this, beyond the legacy of the bilateral relationship, is the vast differences in comparative advantages of the two countries. As a labor-abundant, low-wage country, Vietnam’s comparative advantage rests squarely in labor-intensive manufacturing, which is, of course, not an activity in which the U.S. has a comparative advantage. Not surprisingly, as Table 17 indicates, seventy-five percent of U.S. direct investment in Vietnam’s industrial sector is in oil and gas, and heavy industry, which are relatively capital-intensive sectors. Vietnam’s East Asian neighbors, however, have a long history of exporting labor-intensive products, first from their own country, and then
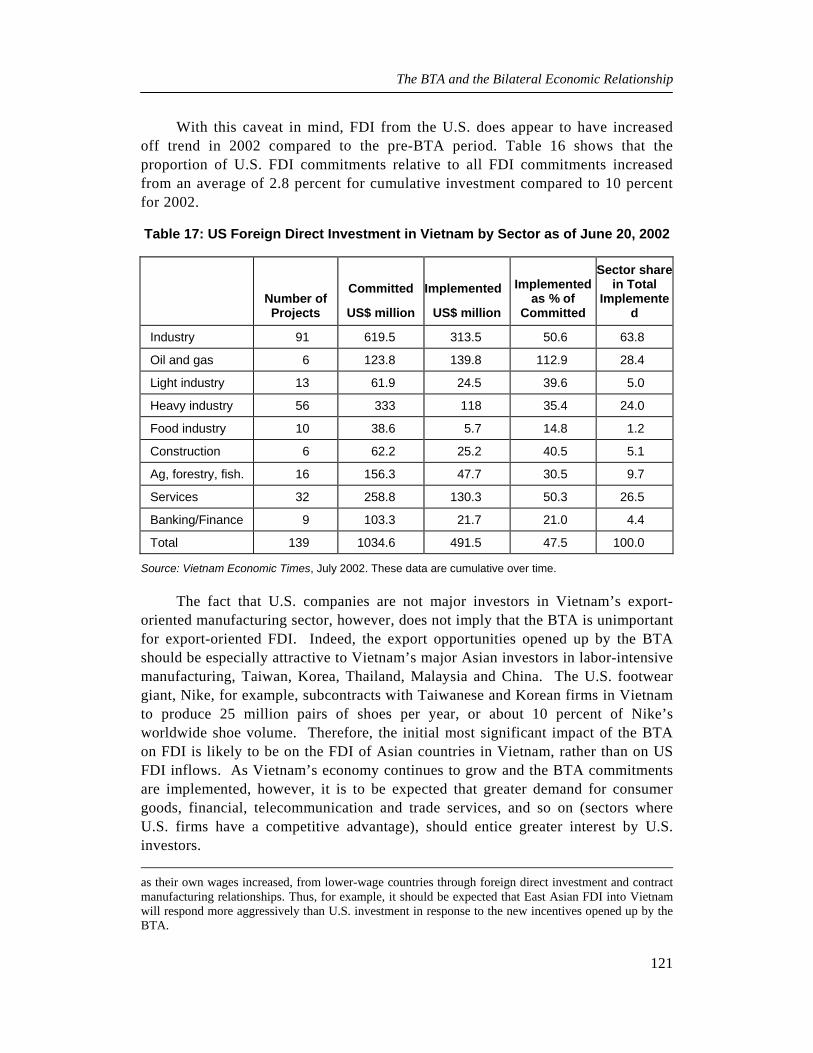
The BTA and the Bilateral Economic Relationship
121
With this caveat in mind, FDI from the U.S. does appear to have increased off trend in 2002 compared to the pre-BTA period. Table 16 shows that the proportion of U.S. FDI commitments relative to all FDI commitments increased from an average of 2.8 percent for cumulative investment compared to 10 percent for 2002.
Table 17: US Foreign Direct Investment in Vietnam by Sector as of June 20, 2002
Number of Projects
Committed
US$ million
Implemented
US$ million
Implemented as % of
Committed
Sector share in Total
Implemented
Industry 91 619.5 313.5 50.6 63.8
Oil and gas 6 123.8 139.8 112.9 28.4
Light industry 13 61.9 24.5 39.6 5.0
Heavy industry 56 333 118 35.4 24.0
Food industry 10 38.6 5.7 14.8 1.2
Construction 6 62.2 25.2 40.5 5.1
Ag, forestry, fish. 16 156.3 47.7 30.5 9.7
Services 32 258.8 130.3 50.3 26.5
Banking/Finance 9 103.3 21.7 21.0 4.4
Total 139 1034.6 491.5 47.5 100.0
Source: Vietnam Economic Times, July 2002. These data are cumulative over time.
The fact that U.S. companies are not major investors in Vietnam’s export-oriented manufacturing sector, however, does not imply that the BTA is unimportant for export-oriented FDI. Indeed, the export opportunities opened up by the BTA should be especially attractive to Vietnam’s major Asian investors in labor-intensive manufacturing, Taiwan, Korea, Thailand, Malaysia and China. The U.S. footwear giant, Nike, for example, subcontracts with Taiwanese and Korean firms in Vietnam to produce 25 million pairs of shoes per year, or about 10 percent of Nike’s worldwide shoe volume. Therefore, the initial most significant impact of the BTA on FDI is likely to be on the FDI of Asian countries in Vietnam, rather than on US FDI inflows. As Vietnam’s economy continues to grow and the BTA commitments are implemented, however, it is to be expected that greater demand for consumer goods, financial, telecommunication and trade services, and so on (sectors where U.S. firms have a competitive advantage), should entice greater interest by U.S. investors. as their own wages increased, from lower-wage countries through foreign direct investment and contract manufacturing relationships. Thus, for example, it should be expected that East Asian FDI into Vietnam will respond more aggressively than U.S. investment in response to the new incentives opened up by the BTA.

An Assessment of the Economic Impact of the United States - Vietnam Bilateral Trade Agreement
122
4. The U.S. market for Vietnamese exports
No sooner was the BTA signed and put into effect than a trade dispute between Vietnam and the U.S. erupted over the labeling of Vietnamese “catfish.” U.S. producers argued that the Vietnamese fish being exported to the U.S. were improperly labeled as “catfish.” Subsequently, the U.S. Congress took action in the U.S. Farm Act of 2002 to prohibit non-ictaluridae catfish, including the catfish family grown in Vietnam (basa and tra of the pangasius family), from being marketed as “catfish” in the U.S. In June 2002, the Catfish Farmers of America filed an anti-dumping suit against Vietnamese exporters of basa and tra fish, which is currently under investigation.59 In Vietnam, these actions have been portrayed as grossly unfair and the perception has become widespread that exporting to the U.S. is susceptible to political interference and the ad hoc imposition of trade barriers.
It is of course true that there are barriers to trade in the U.S. and that anti-dumping and countervailing duties have been applied to imports of selected products from selected partners.60 However, the general perception of the U.S. as a relatively closed and unreliable market for Vietnamese exports is unwarranted, as the following review of U.S. trade policy makes clear. Furthermore, it is evident from the volume and growth of U.S. imports from developing countries, and from the disproportionate share of the U.S. in the exports of most developing countries, that the U.S. is perhaps the most open and reliable market for developing country exports in the world.
a. Trade restrictions in the U.S.
Tariffs
In 2000, the average MFN tariff rate in the U.S. was 5.4 percent for all goods, 10.6 for agricultural goods and 4.5 for manufactured goods.61 More than one-third of all tariff lines carry a zero rate. Significant tariff barriers apply to only a few products in agriculture (e.g., tobacco), food (peanuts and sugar) and to textiles and clothing. In the case of textile and clothing, the average tariff rate in 2000 was 11 percent.
Quantitative restrictions
Textiles and clothing are the only products subject to quantitative import restrictions in the United States for commercial reasons. All other quantitative restrictions are designed “to ensure national safety, safeguard consumer health, protect public morals or are maintained for environmental purposes”62.
59. On January 24, 2003 the U.S. Department of Commerce (DOC) issued a preliminary
determination assessing dumping duties. Final determinations by the DOC and the U.S. International Trade Commission (ITC) are expected in June 2003.
60. Anti-dumping and countervailing duties are applied following an extensive administrative investigation based on a transparent and consistent set of technical procedures that are consistent with WTO standards. Anti-dumping cases are essentially disputes between private producers that are worked through a government administrative tribunal. Resolution of these disputes can be appealed through the U.S. court system, and if both countries are a member of the WTO, can be appealed through a WTO dispute settlement process.
61. WTO, Trade Policy Review: United States, WT/TPR/S/88, August 15, 2001. 62. WTO, ibid. p.42.
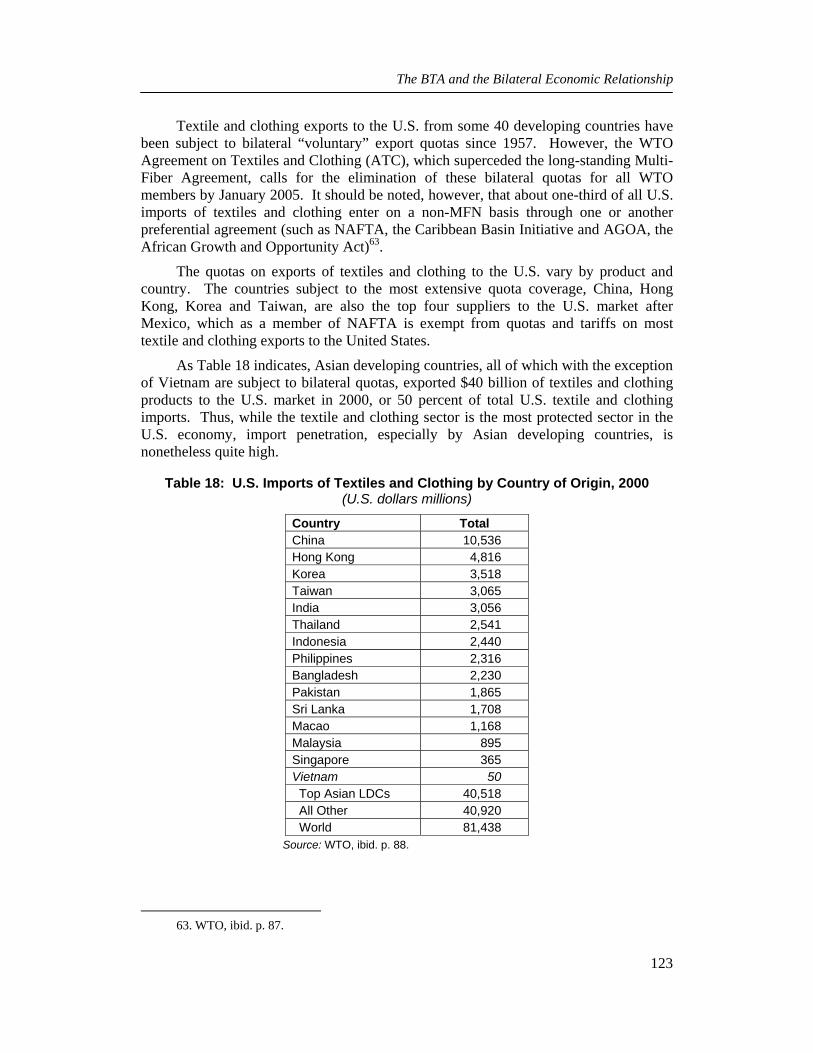
The BTA and the Bilateral Economic Relationship
123
Textile and clothing exports to the U.S. from some 40 developing countries have been subject to bilateral “voluntary” export quotas since 1957. However, the WTO Agreement on Textiles and Clothing (ATC), which superceded the long-standing Multi-Fiber Agreement, calls for the elimination of these bilateral quotas for all WTO members by January 2005. It should be noted, however, that about one-third of all U.S. imports of textiles and clothing enter on a non-MFN basis through one or another preferential agreement (such as NAFTA, the Caribbean Basin Initiative and AGOA, the African Growth and Opportunity Act)63.
The quotas on exports of textiles and clothing to the U.S. vary by product and country. The countries subject to the most extensive quota coverage, China, Hong Kong, Korea and Taiwan, are also the top four suppliers to the U.S. market after Mexico, which as a member of NAFTA is exempt from quotas and tariffs on most textile and clothing exports to the United States.
As Table 18 indicates, Asian developing countries, all of which with the exception of Vietnam are subject to bilateral quotas, exported $40 billion of textiles and clothing products to the U.S. market in 2000, or 50 percent of total U.S. textile and clothing imports. Thus, while the textile and clothing sector is the most protected sector in the U.S. economy, import penetration, especially by Asian developing countries, is nonetheless quite high.
Table 18: U.S. Imports of Textiles and Clothing by Country of Origin, 2000 (U.S. dollars millions)
Country Total China 10,536 Hong Kong 4,816 Korea 3,518 Taiwan 3,065 India 3,056 Thailand 2,541 Indonesia 2,440 Philippines 2,316 Bangladesh 2,230 Pakistan 1,865 Sri Lanka 1,708 Macao 1,168 Malaysia 895 Singapore 365 Vietnam 50 Top Asian LDCs 40,518 All Other 40,920 World 81,438
Source: WTO, ibid. p. 88.
63. WTO, ibid. p. 87.
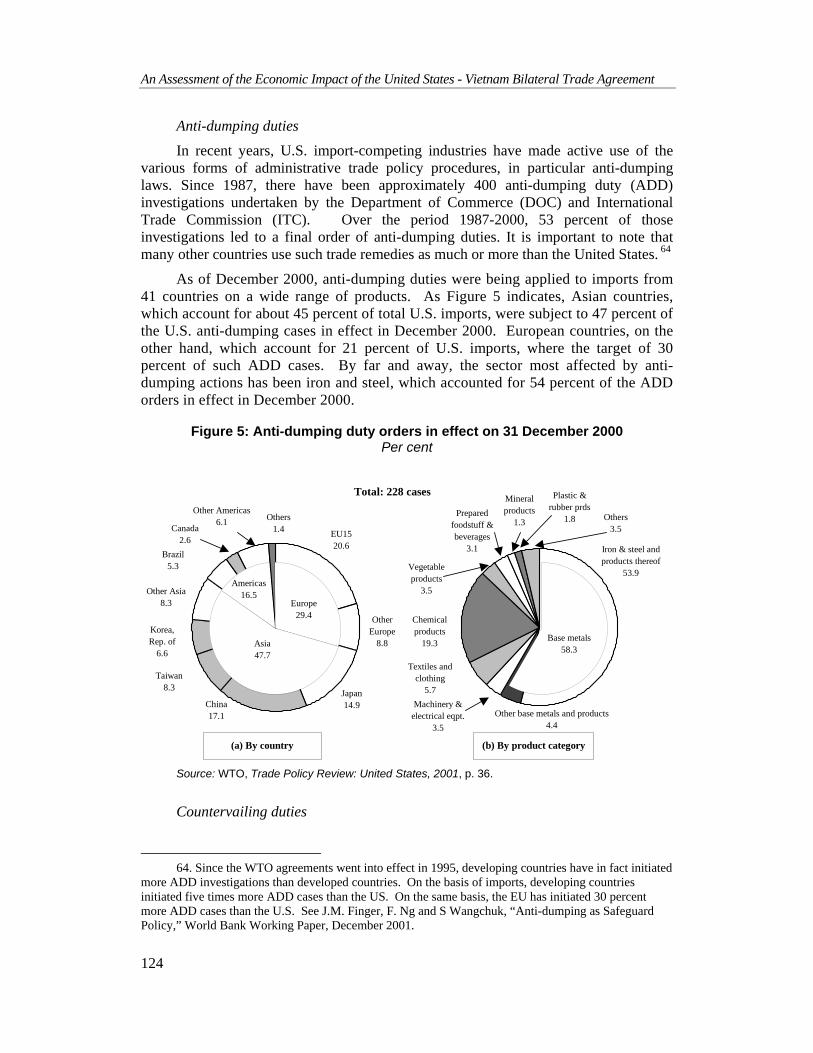
An Assessment of the Economic Impact of the United States - Vietnam Bilateral Trade Agreement
124
Anti-dumping duties
In recent years, U.S. import-competing industries have made active use of the various forms of administrative trade policy procedures, in particular anti-dumping laws. Since 1987, there have been approximately 400 anti-dumping duty (ADD) investigations undertaken by the Department of Commerce (DOC) and International Trade Commission (ITC). Over the period 1987-2000, 53 percent of those investigations led to a final order of anti-dumping duties. It is important to note that many other countries use such trade remedies as much or more than the United States. 64
As of December 2000, anti-dumping duties were being applied to imports from 41 countries on a wide range of products. As Figure 5 indicates, Asian countries, which account for about 45 percent of total U.S. imports, were subject to 47 percent of the U.S. anti-dumping cases in effect in December 2000. European countries, on the other hand, which account for 21 percent of U.S. imports, where the target of 30 percent of such ADD cases. By far and away, the sector most affected by anti-dumping actions has been iron and steel, which accounted for 54 percent of the ADD orders in effect in December 2000.
Figure 5: Anti-dumping duty orders in effect on 31 December 2000 Per cent
Source: WTO, Trade Policy Review: United States, 2001, p. 36.
Countervailing duties
64. Since the WTO agreements went into effect in 1995, developing countries have in fact initiated
more ADD investigations than developed countries. On the basis of imports, developing countries initiated five times more ADD cases than the US. On the same basis, the EU has initiated 30 percent more ADD cases than the U.S. See J.M. Finger, F. Ng and S Wangchuk, “Anti-dumping as Safeguard Policy,” World Bank Working Paper, December 2001.
Total: 228 cases
(a) By country (b) By product category
Europe29.4
Asia47.7
Americas16.5
EU1520.6
Other Europe
8.8
Japan14.9China
17.1
Korea, Rep. of
6.6
Other Asia8.3
Canada2.6
Others1.4
Other Americas6.1
Base metals58.3
Iron & steel and products thereof
53.9
Machinery & electrical eqpt.
3.5Other base metals and products
4.4
Vegetable products
3.5
Prepared foodstuff & beverages
3.1
Others3.5
Textiles and clothing
5.7Taiwan
8.3
Brazil5.3
Chemical products
19.3
Mineral products
1.3
Plastic & rubber prds
1.8
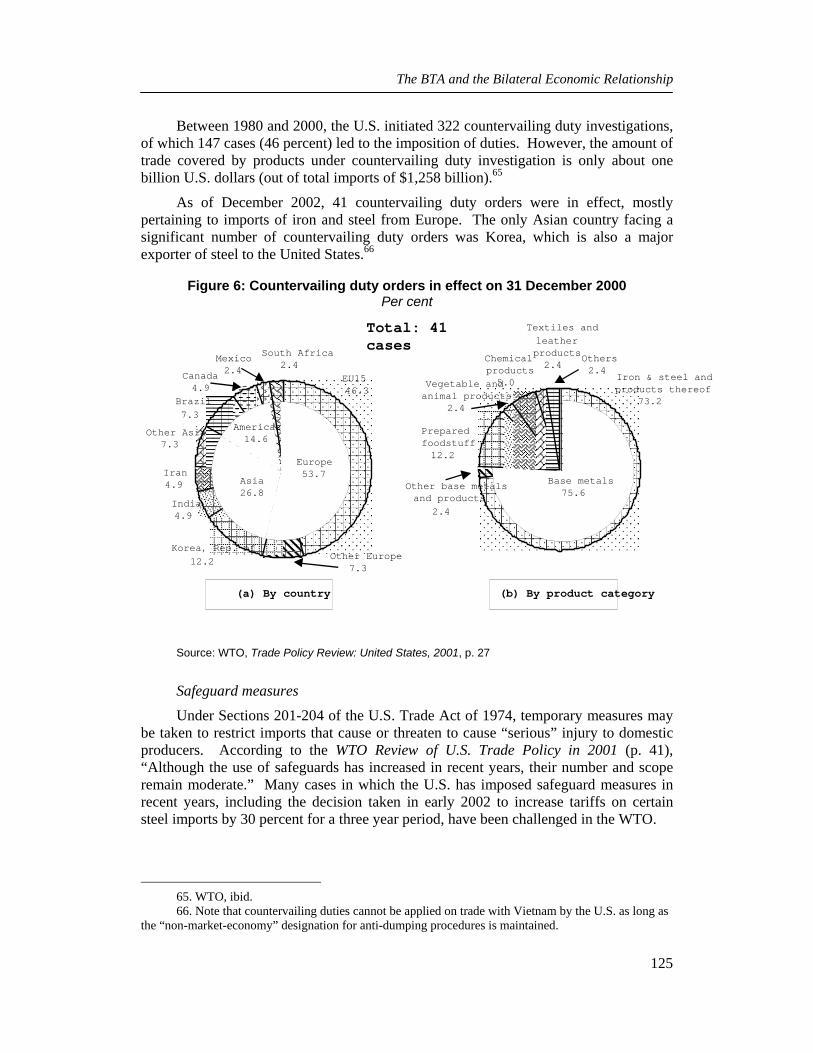
The BTA and the Bilateral Economic Relationship
125
Between 1980 and 2000, the U.S. initiated 322 countervailing duty investigations, of which 147 cases (46 percent) led to the imposition of duties. However, the amount of trade covered by products under countervailing duty investigation is only about one billion U.S. dollars (out of total imports of $1,258 billion).65
As of December 2002, 41 countervailing duty orders were in effect, mostly pertaining to imports of iron and steel from Europe. The only Asian country facing a significant number of countervailing duty orders was Korea, which is also a major exporter of steel to the United States.66
Figure 6: Countervailing duty orders in effect on 31 December 2000 Per cent
Source: WTO, Trade Policy Review: United States, 2001, p. 27
Safeguard measures
Under Sections 201-204 of the U.S. Trade Act of 1974, temporary measures may be taken to restrict imports that cause or threaten to cause “serious” injury to domestic producers. According to the WTO Review of U.S. Trade Policy in 2001 (p. 41), “Although the use of safeguards has increased in recent years, their number and scope remain moderate.” Many cases in which the U.S. has imposed safeguard measures in recent years, including the decision taken in early 2002 to increase tariffs on certain steel imports by 30 percent for a three year period, have been challenged in the WTO.
65. WTO, ibid. 66. Note that countervailing duties cannot be applied on trade with Vietnam by the U.S. as long as
the “non-market-economy” designation for anti-dumping procedures is maintained.
Total: 41cases
(a) By country (b) By product category
Europe53.7
Asia 26.8
Americas 14.6
EU1546.3
Other Europe7.3
Korea, Rep. of 12.2
India 4.9
Iran 4.9
Brazil 7.3
Canada 4.9
South Africa2.4 Mexico
2.4
Base metals 75.6
Iron & steel andproducts thereof
73.2
Preparedfoodstuff12.2
Other base metalsand products
2.4
Vegetable andanimal products
2.4
Chemicalproducts5.0
Others 2.4
Textiles and leather products 2.4
Other Asia 7.3
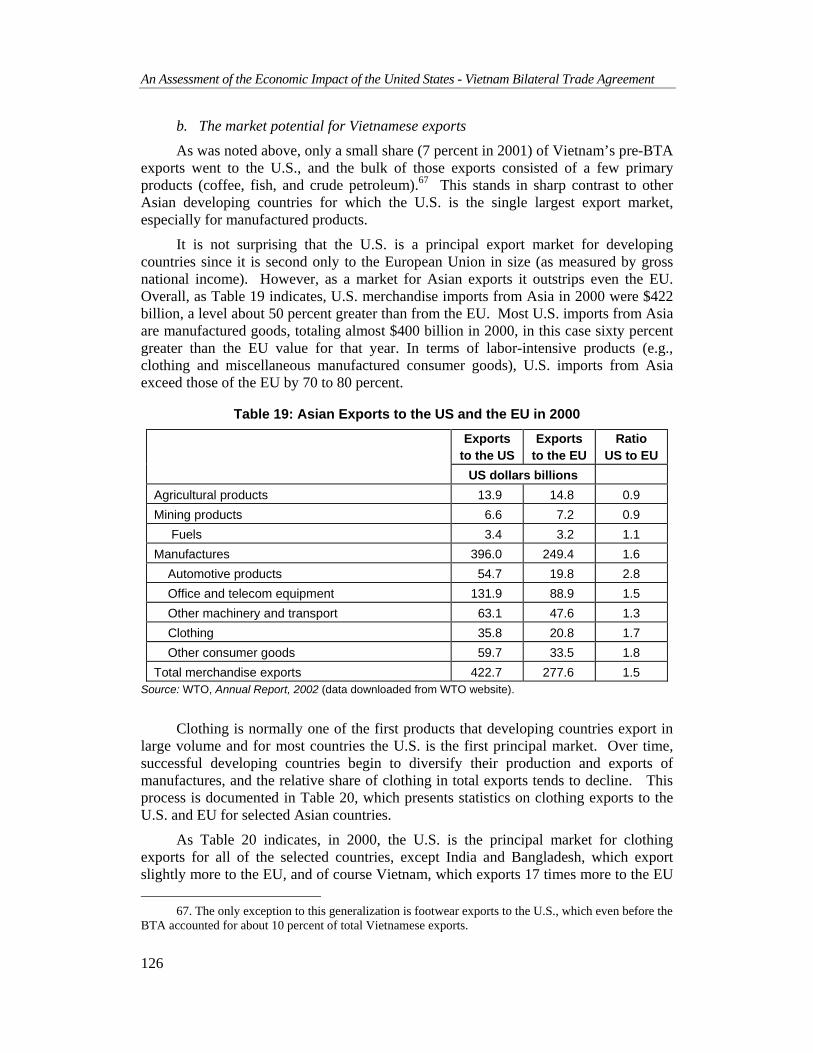
An Assessment of the Economic Impact of the United States - Vietnam Bilateral Trade Agreement
126
b. The market potential for Vietnamese exports
As was noted above, only a small share (7 percent in 2001) of Vietnam’s pre-BTA exports went to the U.S., and the bulk of those exports consisted of a few primary products (coffee, fish, and crude petroleum).67 This stands in sharp contrast to other Asian developing countries for which the U.S. is the single largest export market, especially for manufactured products.
It is not surprising that the U.S. is a principal export market for developing countries since it is second only to the European Union in size (as measured by gross national income). However, as a market for Asian exports it outstrips even the EU. Overall, as Table 19 indicates, U.S. merchandise imports from Asia in 2000 were $422 billion, a level about 50 percent greater than from the EU. Most U.S. imports from Asia are manufactured goods, totaling almost $400 billion in 2000, in this case sixty percent greater than the EU value for that year. In terms of labor-intensive products (e.g., clothing and miscellaneous manufactured consumer goods), U.S. imports from Asia exceed those of the EU by 70 to 80 percent.
Table 19: Asian Exports to the US and the EU in 2000
Exports to the US
Exports to the EU
Ratio US to EU
US dollars billions Agricultural products 13.9 14.8 0.9 Mining products 6.6 7.2 0.9 Fuels 3.4 3.2 1.1 Manufactures 396.0 249.4 1.6 Automotive products 54.7 19.8 2.8 Office and telecom equipment 131.9 88.9 1.5 Other machinery and transport 63.1 47.6 1.3 Clothing 35.8 20.8 1.7 Other consumer goods 59.7 33.5 1.8 Total merchandise exports 422.7 277.6 1.5
Source: WTO, Annual Report, 2002 (data downloaded from WTO website).
Clothing is normally one of the first products that developing countries export in large volume and for most countries the U.S. is the first principal market. Over time, successful developing countries begin to diversify their production and exports of manufactures, and the relative share of clothing in total exports tends to decline. This process is documented in Table 20, which presents statistics on clothing exports to the U.S. and EU for selected Asian countries.
As Table 20 indicates, in 2000, the U.S. is the principal market for clothing exports for all of the selected countries, except India and Bangladesh, which export slightly more to the EU, and of course Vietnam, which exports 17 times more to the EU
67. The only exception to this generalization is footwear exports to the U.S., which even before the BTA accounted for about 10 percent of total Vietnamese exports.
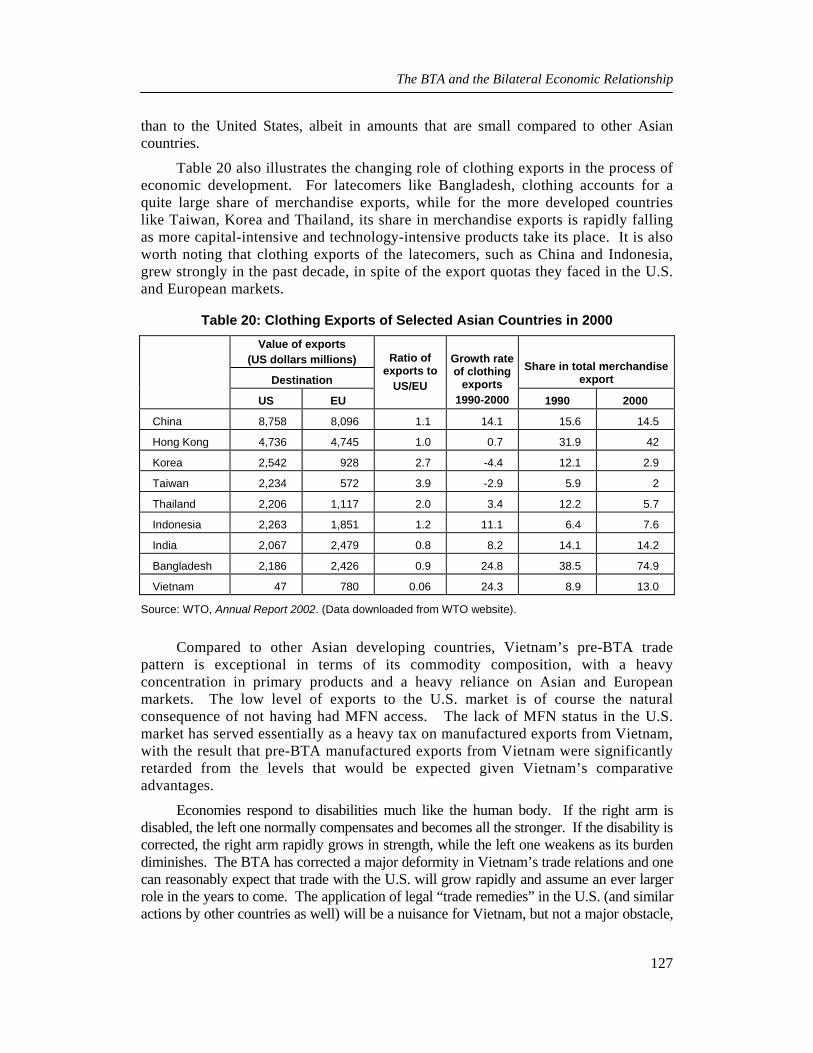
The BTA and the Bilateral Economic Relationship
127
than to the United States, albeit in amounts that are small compared to other Asian countries.
Table 20 also illustrates the changing role of clothing exports in the process of economic development. For latecomers like Bangladesh, clothing accounts for a quite large share of merchandise exports, while for the more developed countries like Taiwan, Korea and Thailand, its share in merchandise exports is rapidly falling as more capital-intensive and technology-intensive products take its place. It is also worth noting that clothing exports of the latecomers, such as China and Indonesia, grew strongly in the past decade, in spite of the export quotas they faced in the U.S. and European markets.
Table 20: Clothing Exports of Selected Asian Countries in 2000 Value of exports
(US dollars millions)
Destination Share in total merchandise
export
US EU
Ratio of exports to
US/EU
Growth rate of clothing
exports 1990-2000 1990 2000
China 8,758 8,096 1.1 14.1 15.6 14.5
Hong Kong 4,736 4,745 1.0 0.7 31.9 42
Korea 2,542 928 2.7 -4.4 12.1 2.9
Taiwan 2,234 572 3.9 -2.9 5.9 2
Thailand 2,206 1,117 2.0 3.4 12.2 5.7
Indonesia 2,263 1,851 1.2 11.1 6.4 7.6
India 2,067 2,479 0.8 8.2 14.1 14.2
Bangladesh 2,186 2,426 0.9 24.8 38.5 74.9
Vietnam 47 780 0.06 24.3 8.9 13.0
Source: WTO, Annual Report 2002. (Data downloaded from WTO website).
Compared to other Asian developing countries, Vietnam’s pre-BTA trade pattern is exceptional in terms of its commodity composition, with a heavy concentration in primary products and a heavy reliance on Asian and European markets. The low level of exports to the U.S. market is of course the natural consequence of not having had MFN access. The lack of MFN status in the U.S. market has served essentially as a heavy tax on manufactured exports from Vietnam, with the result that pre-BTA manufactured exports from Vietnam were significantly retarded from the levels that would be expected given Vietnam’s comparative advantages.
Economies respond to disabilities much like the human body. If the right arm is disabled, the left one normally compensates and becomes all the stronger. If the disability is corrected, the right arm rapidly grows in strength, while the left one weakens as its burden diminishes. The BTA has corrected a major deformity in Vietnam’s trade relations and one can reasonably expect that trade with the U.S. will grow rapidly and assume an ever larger role in the years to come. The application of legal “trade remedies” in the U.S. (and similar actions by other countries as well) will be a nuisance for Vietnam, but not a major obstacle,

An Assessment of the Economic Impact of the United States - Vietnam Bilateral Trade Agreement
128
as we have learned from the example of many other developing countries that have successfully increased exports to the U.S. market even though they have faced similar types of trade restrictions. Indeed, as we have documented above, the normalization of trade relations is already well underway. 68
68. As history has repeatedly shown, as bilateral trade and investment flows accelerate, trade
disputes grow as well. Effectively resolving trade disputes, therefore, are a part of normal trade relations.
The BTA and the Bilateral Economic Relationship
129
IV. EXPORTING TO THE U.S. UNDER THE BTA: THE PERSPECTIVE OF VIETNAMESE BUSINESSES
Will the rapid expansion of exports to the U.S. market in 2002 be sustained? The answer depends of course on the actions taken by Vietnamese business managers. How do they perceive opportunities in the U.S. market? What obstacles do they face doing business in the U.S.? Can they efficiently expand production to meet the new demand from the U.S.? Are they prepared to make the investments required to gain access and expand sales in the U.S.? What are the perceived risks in the U.S. market and how do they compare with the risks in other major markets, in particular in Europe and Japan?
To find answers to these questions, STAR and CIEM have begun interviewing Vietnamese manufacturing companies who are successfully exporting to the U.S. market. Here we report on the results of our initial interviews with companies in two sectors, clothing and footwear.69 Although our sample of firms is still small, we have found some consistent responses to a number of the key issues. We do not purport to suggest that our sample of companies is in any sense statistically representative of the universe of companies. Indeed, our aim is not to do a survey of firms and obtain statistically significant results, but rather simply to gain insights into the perspectives of company managers.
1. Clothing exporters
Three clothing manufacturers and exporters were interviewed, one State-owned company in Hanoi (Company A), one recently equitized SOE in Ho Chi Minh City (company B), and one private company in Ho Chi Minh City (Company C).
a. Pre-BTA efforts to access the U.S. market
All three companies were, of course, well aware of the potential opportunities of the U.S. market well before the BTA went into effect in December 2001. The manager of Company A mentioned that she had attended a trade fair in Jakarta in 1989, while Vietnam was still under the U.S. embargo, and was interested to learn from managers in other Southeast Asian countries that the U.S. was their major export market. After diplomatic relations were normalized with the U.S. in 1994, she began to explore the U.S. market. In 1995, she visited the U.S. and had contact with companies that
69. This is a work in progress. Additional interviews are planned over the course of the year for companies in these two sectors and other sectors as well. Obviously, not all firms and not all sectors have been able to expand exports to the United States. Importantly, though, the sectors that have successfully exported to the U.S. market in 2002 under the BTA have been those that appear to fit Vietnam’s comparative advantage in labor-intensive manufactures, showing that the market forces unleashed by the BTA work strongly in Vietnam.
An Assessment of the Economic Impact of the United States - Vietnam Bilateral Trade Agreement
130
expressed a willingness to do business if Vietnam had MFN status. In 1999, she returned to the states once again, but the BTA was still on hold and no business could be concluded. In July 2001, six months prior to the implementation of the BTA, she visited the U.S. again and had contact with two companies with which she would ultimately sign contracts immediately upon the initiation of the BTA. Company B and Company C also reported that they had made contact with US buyers in anticipation of the BTA, but that these contacts bore no fruit and indeed involved a waste of time and money because of the delays and postponements in signing and implementing the Agreement.
b. Accessing the U.S. market after BTA
None of the three export-oriented companies we interviewed in the clothing sector reported difficulty accessing the U.S. market once the BTA came into effect. Company A signed its first contract with an American buyer the day after the BTA came into effect. A second contract shortly followed. Company B, which had exports in 2001 of $6.8 million -- 40 percent to the EU, 40 percent to Taiwan and 20 percent to Korea and Japan -- expects this year to sell 50% of its exports to the U.S. In the years to come, according to the manager of Company B, they expect the U.S. to be their principle market. Company C, a relatively small private company, also indicated that it has had many contacts with U.S. buyers since the BTA had come into effect, and that currently its biggest contract is with an American company, contacted through a Los Angeles-based trading company. All three companies reported that they have more business in the U.S. than they can currently handle.
c. Problems exporting to the U.S.
The problems that the three textile companies have encountered in the U.S. have resulted mainly from their efforts to use the U.S. market to break out of the “CMT” model, whereby orders are obtained from Taiwanese and Korean (or other) middlemen who make all the marketing and financial arrangements and provide the designs and material to the Vietnamese firm, which then sews the final product and ships it onward. The companies foresee greater profit in the “FOB” model, whereby the Vietnamese firm would contract directly with the U.S. buyer, and would be responsible for obtaining material inputs and doing the financing of working capital themselves. The FOB model has the potential for making a greater profit, but also requires developing expertise in a number of extra steps in the value-added chain, and importantly, also requires carrying a greater financial burden between production and final payment, which increases the importance of financing working capital and, thus, the need to use letters of credit as collateral for borrowing from banks.
Company A signed its first contract with an American buyer on an FOB basis, but immediately ran into a technical problem downloading the product designs sent to them via the internet. With its second contract, Company A ran into a severe problem of financing working capital to buy material inputs because Vietnamese banks would not accept the standby letter of credit issued by the American buyer. The problem was eventually resolved by the American buyer agreeing to purchase the material in China and shipping it to Company A. Company B has avoided these kinds of problems by relying entirely on the CMT model, having accessed the U.S. market exclusively
Exporting to the U.S. Under the BTA: the Perspective of Vietnamese Businesses
131
through Taiwanese and Korean middlemen. Company C also encountered problems getting letters of credit to be accepted by Vietnamese banks, without which it could not finance working capital. In addition, Company C noted that in order to get established in the U.S. market they are required initially to accept low prices. All three companies expressed concern about the prospect of export quotas being imposed by the U.S. in the coming year.
d. Advantages of the U.S. market
All three companies interviewed expressed an intention to make the U.S. their principal export market in the future. The attraction of the U.S. market stems from the market’s substantial size and the problems these companies have encountered in other major markets, mainly Europe and Japan. As already noted, exports to the U.S. by Company B will within this year alone go from zero to 50 percent of total sales. The company revealed its plan to completely reorient its production to the U.S. market. The reason for this strategy is that orders from the U.S. are typically much larger than other markets. With larger orders the company can reduce costs by limiting the number of different production lines in operation and running each line for a longer duration. Although the EU is as large a market as the U.S., the European market is segmented country-by-country and the orders are therefore smaller than those they can get from the U.S. In addition, Vietnamese exporters face quotas in Europe that limit the size and number of orders they can obtain there. Orders from Japan, Company B noted, are also relatively small, and demand is weak because of the economic slowdown in Japan.
Company C, the small private company, also cited the size advantage of the U.S. market. Company C sees its advantage in producing and exporting to “niche” markets, and because the U.S. market is large overall, the niches are also relatively large and stable. As a small private company, Company C said it is particularly vulnerable to problems associated with obtaining export quotas for the European market. If they have an order from Europe and lack quota, they typically have to try to buy quota from a SOE or subcontract to the SOE to fulfill the order. This of course greatly limits the profit on such contracts. The manager of Company C noted the irony of the EU policy of promoting the private sector with one hand and destroying it with the other (via the export quotas).
e. Investment response to opportunities in the U.S. market
How do exporters in the clothing sector plan to achieve their stated goal of expanding exports to the U.S.? Do they intend to divert sales from other markets to the U.S. or are they planning to expand production capacity to serve the U.S. market while maintaining their sales to existing customers? To this question, all the companies interviewed answered that they are planning to expand capacity, and indeed all three are already in the process of implementing these plans.
Company A, which currently employs 1,300 workers, is in the process of building another factory that will expand employment by 600 workers. Company A noted that it had asked Nike, an important future customer, to review their plans for a new factory to make sure that they conform to U.S. standards. Company B is also building a large, new, state-of-the-art factory in Cu Chi that will be in operation in a year and a half.
An Assessment of the Economic Impact of the United States - Vietnam Bilateral Trade Agreement
132
Company B’s plan is that once the new factory is operational, they will close down their factories in Ho Chi Minh City, which they said are too small to be efficient and not up to the standards required by U.S. buyers. Likewise, Company C reported that it has plans to expand capacity by 100 percent next year and cited opportunities created by the BTA as the reason for their expansion plans.
2. Footwear and leather goods exporters
Four footwear and leather goods firms were interviewed -- one large private company in Ho Chi Minh City (Company D), two state-owned companies in Ho Chi Minh City (Company E and Company F), and one relatively small private company in Hanoi (Company G). Unlike the clothing companies interviewed, current and prospective involvement of the footwear companies in the U.S. market differed widely from firm to firm.
a. Pre-BTA efforts to access the U.S. market
Company D, like its counterparts in the clothing sector, made efforts to access the U.S. market prior to the BTA. It’s experience was similarly unsuccessful. From 1999 to 2001, the company got several small orders on a trial basis, but when the BTA was not ratified as expected in 2000, these initiatives collapsed and the firm was forced to start over from scratch when the BTA came into effect at the end of 2001. Company E also lined up contracts in the U.S. prior to implementation of the BTA, but when the Agreement was not signed these initiatives, including one with Reebok, were terminated.70 Neither companies F or G made any serious effort to enter the US market prior to the BTA.
b. Accessing the U.S. market after BTA
None of the four companies interviewed has yet made a significant shift to the U.S. market. With the exception of Company G, which is a small, private company selling most of its product (leather handbags, backpacks, etc.) domestically, however, all have big plans to enter the U.S. market. Company D already has a representative office in New York and plans to set up a new one in San Francisco. The company also has good working relationships with traders in the U.S. and the company sends personnel to U.S. trade fairs. Company E is still tied to the European market, but has plans to make the U.S. its major market.
c. Perceived advantages of the U.S. market under the BTA
The BTA was critical to the footwear sector because, as several managers noted, non-MFN tariffs in the U.S. were high. The non-MFN tariff for flip-flop sandals was 25 percent compared to zero under MFN. For more fashionable products, the non-MFN tariffs were as high as 75 percent. The BTA not only brought down tariffs on Vietnamese products, it also ensures copyright and trademark protection, which is
70. In fact, Company E noted that Reebok pulled out of Vietnam entirely due to the failure of the
BTA to be signed.
Exporting to the U.S. Under the BTA: the Perspective of Vietnamese Businesses
133
important to Company D since it wants to begin marketing its product in the U.S. under its own name.
Company D sees the U.S. market as an opportunity to reverse the decline in its export sales in recent years. Company D claims that competition from China has been a major factor in slowing down export growth. The only respite it has gotten from Chinese competition was as a result of anti-dumping duties applied against China in Europe. However, even this had its down side, as the Chinese shifted sales to the U.S. and undermined the companies’ initial efforts to enter the U.S. market. As a general matter, Company D sees the U.S. market as a good opportunity to diversify its markets and reduce the risk from foreign competition and unforeseen shifts in market conditions.
Company E currently exports 95 percent of its output (about 3 million pairs of shoes), mostly to Europe. However, the manager of Company E wants to make the U.S. its main market. Company E prefers the U.S. market because it is larger and more stable than the European market. Stability is especially important to Company E because its production is highly labor-intensive, and when there is a seasonal downturn, the company must bear the cost of maintaining the income of workers. The size of the U.S. market was also cited by Company F, which emphasized that because the U.S. market is large, the “niches” in the market are well defined.
Company E also mentioned the problem of exchange rate variation in Europe. The fall in the dollar value of the Euro (until recently) reduced the profitability of selling to the European market. This problem is exacerbated by the mismatch of revenues denominated in Euros and imported input costs that are typically denominated in U.S. dollars, which can create a negative terms-of-trade effect for the company.
Whether it is true or not, several managers expressed the opinion that U.S. buyers and companies are more willing to transfer technology and provide working capital than their European counterparts. The manager of Company E expressed the view that the Americans were more concerned about the local workforce. The Europeans, he said, just want as low a price as possible, though other managers indicated that American buyers were similarly motivated.
d. Investment plans to take advantage of opportunities in the U.S. market
Company D began expanding in anticipation of the BTA before it was signed. It has recently opened a new, modern plant in Dong Nai province and another in the form of a joint-venture with a Taiwanese company. Company D’s strategy is not to divert sales from other destinations, but instead to create new capacity to exploit the U.S. market.
Company E has already begun construction on a new, large state-of-the-art factory in Dong Nai through a joint-venture with a Korean company. Everything will be top of the line, including dormitories for workers. Company E’s problem, according to the manger, is its status as a state-owned company. The manager acknowledged that as a state-owned company it benefits from various SOE preferences in the government’s economic policy, in particular in terms of access to credit. However, the manager maintained that these advantages are more than offset by interference in business matters from the ministries. The company has a good deal of land in Ho Chi Minh City that it would like to sell and reinvest in new plants in Binh Duong and Dong Nai, but as a state-owned company, it is not
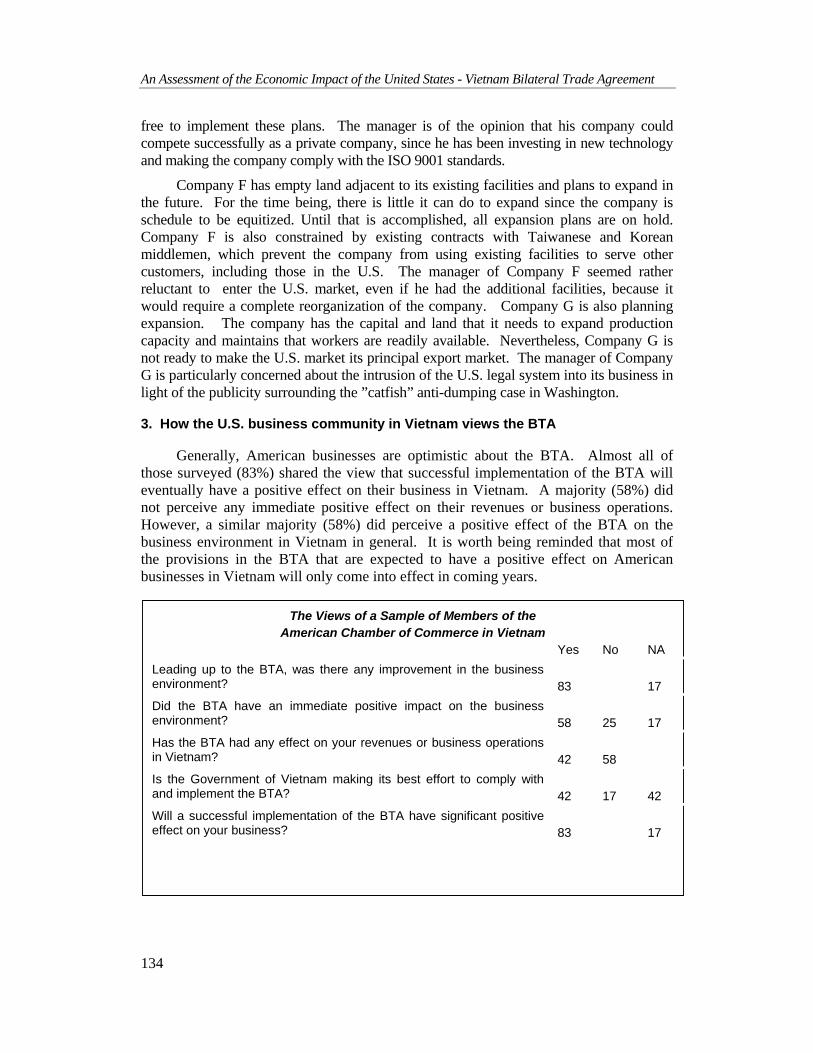
An Assessment of the Economic Impact of the United States - Vietnam Bilateral Trade Agreement
134
free to implement these plans. The manager is of the opinion that his company could compete successfully as a private company, since he has been investing in new technology and making the company comply with the ISO 9001 standards.
Company F has empty land adjacent to its existing facilities and plans to expand in the future. For the time being, there is little it can do to expand since the company is schedule to be equitized. Until that is accomplished, all expansion plans are on hold. Company F is also constrained by existing contracts with Taiwanese and Korean middlemen, which prevent the company from using existing facilities to serve other customers, including those in the U.S. The manager of Company F seemed rather reluctant to enter the U.S. market, even if he had the additional facilities, because it would require a complete reorganization of the company. Company G is also planning expansion. The company has the capital and land that it needs to expand production capacity and maintains that workers are readily available. Nevertheless, Company G is not ready to make the U.S. market its principal export market. The manager of Company G is particularly concerned about the intrusion of the U.S. legal system into its business in light of the publicity surrounding the ”catfish” anti-dumping case in Washington.
3. How the U.S. business community in Vietnam views the BTA
Generally, American businesses are optimistic about the BTA. Almost all of those surveyed (83%) shared the view that successful implementation of the BTA will eventually have a positive effect on their business in Vietnam. A majority (58%) did not perceive any immediate positive effect on their revenues or business operations. However, a similar majority (58%) did perceive a positive effect of the BTA on the business environment in Vietnam in general. It is worth being reminded that most of the provisions in the BTA that are expected to have a positive effect on American businesses in Vietnam will only come into effect in coming years.
The Views of a Sample of Members of the American Chamber of Commerce in Vietnam
Yes No NA Leading up to the BTA, was there any improvement in the business environment?
83
17
Did the BTA have an immediate positive impact on the business environment?
58
25
17
Has the BTA had any effect on your revenues or business operations in Vietnam?
42
58
Is the Government of Vietnam making its best effort to comply with and implement the BTA?
42
17
42
Will a successful implementation of the BTA have significant positive effect on your business?
83
17
Exporting to the U.S. Under the BTA: the Perspective of Vietnamese Businesses
135
4. Summing up the survey of businesses
It is reassuring that the picture of bilateral economic relations that comes out of the official statistics and that expressed by Vietnamese businesses are in accord with one another. Both the statistics and the business viewpoints suggest that the BTA has created great opportunities and that Vietnamese companies have not been slow to exploit them.
The problems that confront Vietnamese businesses looking for opportunities in the U.S. are not what some might expect. Contrary to popular opinion, Vietnamese companies, at least those we interviewed, do not find it particularly difficult to locate customers in the United States. Most of the companies have more business than they can satisfy. The main constraint they face is domestic production capacity and almost all of them are implementing ambitious plans to expand and upgrade production capacity.
An Assessment of the Economic Impact of the United States - Vietnam Bilateral Trade Agreement
136
V. CONCLUSION
Bilateral trade and investment is not normally a topic of much interest or relevance to economists, but the case of bilateral trade and investment between Vietnam and the United States is special. It is special because of the importance for Vietnam of a successful export-oriented industrialization strategy and because of the particular importance of the U.S. market as an export destination for labor-intensive manufactures of developing countries. The lack of MFN access to the U.S. market prior to the implementation of the BTA was a major impediment to Vietnam’s efforts to pursue export-oriented industrialization and promote the small and medium sized (typically private) companies that normally play such an important role in export-oriented industrialization.
The BTA, by conferring the right to export to the U.S. on an MFN basis, has opened up enormous opportunities for expanding exports, especially those exports that were most severely restrained by the high level of non-MFN tariffs that applied prior to the BTA, mainly labor-intensive manufactured products. In spite of these opportunities, a great deal of pessimism about the prospects for Vietnamese companies to expand exports to the U.S. prevailed when the BTA was ratified and brought into force in 2001. A commonly held view was that Vietnamese companies lacked the experience, know-how, and information needed to penetrate the large, sophisticated and distant market of the United States.
The export response to the BTA in 2002 suggests that much of this pessimism was misplaced. In 2002, Vietnamese exports to the U.S. increased by 128 percent compared to 2001, while over the same time exports to the world as a whole increased by only 10 percent. Not surprisingly, exports of manufactures, which had been most severely restrained by high U.S. tariffs before the BTA, grew disproportionately at an impressive rate of over 500 percent on an annual basis. Within manufacturing, the biggest winner was clothing exports, which increased to around $900 million in 2002, an 18-fold increase over the amount exported in 2001. While clothing became Vietnam’s single largest export to the United States, dramatic increases in exports of many other manufactured products were also recorded in 2002, such as electrical appliances (270%), furniture (499%), travel goods (5422%) and miscellaneous manufactures (847%).
The same story told by these statistics was revealed by the Vietnamese business managers we interviewed in two important sectors, clothing and footwear. Almost all managers interviewed recognized that the BTA created enormous opportunities for expanding production and exports. Contrary to the often expressed pessimism, almost none of those interviewed found it particularly difficult to locate customers in the United States. Indeed, most indicated that they had more demand in the U.S. market
Conclusion
137
than they could satisfy. Instead, the main constraint that they face in expanding exports further is insufficient production capacity, a constraint they are working hard to remove through ambitious plans for investments to expand and upgrade plant and equipment.
While the trade statistics and interviews with exporters give a glowing picture of market opportunities in the U.S. opened up by the BTA, another form of pessimism emerged in Vietnam over the course of the first year of BTA implementation, stemming mainly from the publicity surrounding the U.S. anti-dumping case against Vietnamese “catfish” and the negotiations with the U.S. on clothing and textile export quotas. Anti-dumping duties, should they be imposed by the U.S. on Vietnamese fish, may constrain the industry, and it is also possible that the growth in clothing exports may be limited by the U.S. export quotas when they are imposed. However, the fact remains that the US is the world’s single largest and perhaps the most open market for manufactures exports from the developing countries. U.S. imports of most manufactured products from developing countries, including clothing and textiles, exceed by fifty percent or more the imports of similar products by the European Union, in spite of the fact that the gross income of the EU exceeds that of the United States. “Catfish” and clothing are concerns for Vietnamese producers and government officials, as such concerns are for producers and officials in many other countries that have had similar disputes with the U.S., but the fact remains that the U.S. market offers the greatest opportunity for Vietnam to expand exports.
The Vietnamese market is of course small compared to that of the U.S. and for that reason it is unlikely that the BTA will have a proportional impact on the aggregate levels of trade and investment in the United States. The BTA has, however, had a positive, although far less dramatic, effect on U.S. exports to and investment in Vietnam, even though most of the provisions in the Agreement that directly affect U.S. exporting and investing firms have yet to be implemented. U.S. exports to Vietnam in 2002, the first year under the BTA, increased by 26 percent, which remained on trend from the previous years, even though overall U.S. exports and global trade in general weakened in 2002. Furthermore, U.S. FDI (commitments) in Vietnam increased in the year 2002, albeit from a relatively low base. As Vietnam’s obligations under the BTA to liberalize investment procedures, protect intellectual property rights, grant national treatment to U.S. companies in service sectors and provide viable dispute settlement procedures are phased in, one can expect that the role of U.S. investment in Vietnam will expand even further to the mutual benefit of both countries.
While the presumption of mutual benefit from the future expansion of bilateral trade and investment between the U.S. and Vietnam is well founded, it is also certain that this will require economic adjustments and entail social costs. The aim of our ongoing analysis of the economic impact of the BTA is to assess both the benefits and the costs that will arise as more and more of Vietnam’s obligations under the Agreement come into effect. In the coming year, we anticipate substantial progress in the implementation of BTA provisions regarding intellectual property rights, and so this will become a focus of our analysis and a major theme in our next annual report. Provisions in the Agreement on trade in services and investment relations will also assume greater importance in the coming year and hence will also become a focus of our analysis.
An Assessment of the Economic Impact of the United States - Vietnam Bilateral Trade Agreement
138
VI. POSTSCRIPT
From the outset, our analysis of the first-year effects of the BTA has been limited by the fact that the economic impact of the Agreement, even the impact of those provisions in the Agreement that went into force immediately, will take considerably more than a year to be fully observed. Indeed, the only impact that is readily observable at this point in time (16 months after implementation) is the impact on bilateral trade and investment. The more profound effects stemming from the expansion of bilateral trade and investment on domestic investment, employment, output, income, economic structure, growth and poverty are not yet observable. These effects figure prominently in our current and future research agenda. Even though we are not able to say anything definitive on these issues at this point, it may be useful in this postscript to suggest several hypotheses that will be considered in our upcoming research. Beforehand, however, this postscript provides an update of the bilateral trade and investment flows for the first two months of 2003. STAR-Vietnam in co-operation with CIEM will supplement this postscript with quarterly reports on bilateral trade and investment flows, starting in May 2003.
1. Vietnamese exports to the U.S. in January and February 2003
A key question is whether the momentum of export expansion to the U.S. was sustained in the first months of 2003. A lead article in the Vietnam Economic Times (1/3/2003) recently asserted that “export momentum to the U.S. accelerated” in the first two months of 2003.71 The basis for that assertion is the Ministry of Trade figures for exports to the U.S. in January and February, which at $590 million were 350 percent higher than in the first two months of 2002. Since exports to the U.S. in 2002 were “only” 128 percent higher than in the previous year, the interpretation given is that export growth to the U.S. in the first months of 2003 accelerated. A similar interpretation is given in a Financial Times article (May 7, 2003) titled: “Vietnam’s exports to US up 238.7% in Jan-Apr.”
The two articles just cited follow the conventional practice of reporting year-on-year percentage changes for sub-annual time periods. That is, for example, comparing the first two months of the current year with the first two months of the previous year. There is, however, no compelling reason for choosing to compare the first two months of the current year with the first two months of the previous year rather than the last two months of the previous year. Indeed, if the aim is to assess whether the momentum of trade is accelerating or decelerating, there are good reasons for making the comparison with the previous two months, as the data reported in Table 20 indicate.72
71. “Laáy ñaø nay maïnh xuaát khaåu,” Thôøi baùo Kinh Teá Vieät nam, No. 52(1087). 72. The only reason one might prefer comparing the same months for different years if there is
significant seasonality in the data. Our preliminary analysis indicates that seasonality is not significant.
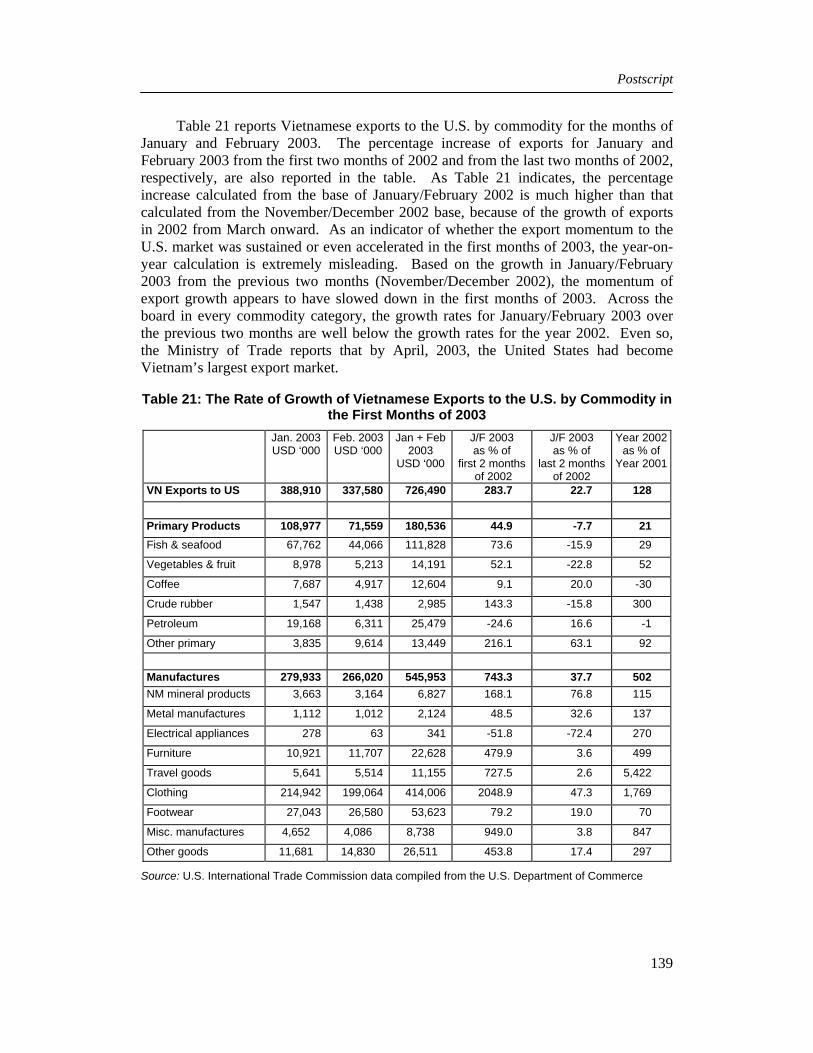
Postscript
139
Table 21 reports Vietnamese exports to the U.S. by commodity for the months of January and February 2003. The percentage increase of exports for January and February 2003 from the first two months of 2002 and from the last two months of 2002, respectively, are also reported in the table. As Table 21 indicates, the percentage increase calculated from the base of January/February 2002 is much higher than that calculated from the November/December 2002 base, because of the growth of exports in 2002 from March onward. As an indicator of whether the export momentum to the U.S. market was sustained or even accelerated in the first months of 2003, the year-on-year calculation is extremely misleading. Based on the growth in January/February 2003 from the previous two months (November/December 2002), the momentum of export growth appears to have slowed down in the first months of 2003. Across the board in every commodity category, the growth rates for January/February 2003 over the previous two months are well below the growth rates for the year 2002. Even so, the Ministry of Trade reports that by April, 2003, the United States had become Vietnam’s largest export market.
Table 21: The Rate of Growth of Vietnamese Exports to the U.S. by Commodity in the First Months of 2003
Jan. 2003 USD ‘000
Feb. 2003USD ‘000
Jan + Feb 2003
USD ‘000
J/F 2003 as % of
first 2 months of 2002
J/F 2003 as % of
last 2 months of 2002
Year 2002as % of
Year 2001
VN Exports to US 388,910 337,580 726,490 283.7 22.7 128 Primary Products 108,977 71,559 180,536 44.9 -7.7 21 Fish & seafood 67,762 44,066 111,828 73.6 -15.9 29
Vegetables & fruit 8,978 5,213 14,191 52.1 -22.8 52
Coffee 7,687 4,917 12,604 9.1 20.0 -30
Crude rubber 1,547 1,438 2,985 143.3 -15.8 300
Petroleum 19,168 6,311 25,479 -24.6 16.6 -1
Other primary 3,835 9,614 13,449 216.1 63.1 92 Manufactures 279,933 266,020 545,953 743.3 37.7 502 NM mineral products 3,663 3,164 6,827 168.1 76.8 115
Metal manufactures 1,112 1,012 2,124 48.5 32.6 137
Electrical appliances 278 63 341 -51.8 -72.4 270
Furniture 10,921 11,707 22,628 479.9 3.6 499
Travel goods 5,641 5,514 11,155 727.5 2.6 5,422
Clothing 214,942 199,064 414,006 2048.9 47.3 1,769
Footwear 27,043 26,580 53,623 79.2 19.0 70
Misc. manufactures 4,652 4,086 8,738 949.0 3.8 847
Other goods 11,681 14,830 26,511 453.8 17.4 297
Source: U.S. International Trade Commission data compiled from the U.S. Department of Commerce
An Assessment of the Economic Impact of the United States - Vietnam Bilateral Trade Agreement
140
What is behind the apparent slowdown in growth of Vietnamese exports to the U.S. in early 2003?73 Obviously it is either the result of a decline in the growth of U.S. demand or Vietnamese supply, or some combination of the two. Without an econometric model of export supply and demand it is impossible to disentangle these relative effects. However, the supposition is that it mainly reflects the tightening of export supply constraints in Vietnam. This supposition is supported by basic economic logic as well as by statements of Vietnamese exporters themselves. The economic logic for this supposition follows from the vast difference in the scale of Vietnamese production of exportables relative to the size of the U.S. market, which implies that Vietnam can be considered a “small (i.e., price-taking) country” facing a virtually infinitely elastic demand in most product markets in the U.S. As such, it is supply, not demand, that mainly determines export growth, at least over the medium term. The supposition is, however, also supported by comments of Vietnamese exporters interviewed for this Report, who almost invariably reported that they foresaw their main constraint to be production capacity, not the availability of buyers.
2. Vietnamese Imports from the U.S. in the First Months of 2003
The issue of choosing a base for calculating the growth rate of Vietnamese imports from the U.S. is the same as for exports to the U.S., but the magnitude of the problem is much smaller because the growth of imports from the U.S. was much lower than the growth of exports to the U.S. in 2002. The data in Table 22 clearly indicate that the rate of growth of imports from the U.S., like that of exports to the U.S., declined in the first months of 2003. It may well be that the apparent slowdown in imports from the U.S. is directly related to the slowdown in exports to the U.S. because of the heavy import content of Vietnamese exports, as noted above. However, we caution against reading too much into these figures, since many imports from the U.S., in particular in machinery and transport, are very lumpy. In the case of imports, it is very difficult to predict on the basis of a couple of months of data what the annual figures are likely to look like. If the Vietnamese economy performs in 2003 as is currently expected, it is likely that imports from the U.S. will grow no slower in 2003 than they did in 2002.
73. For further analysis of the dynamics of Vietnamese exports, based on monthly data, see J.
Riedel, “On the Dynamics of Vietnam’s Exports to the U.S.,” STAR-VIETNAM Technical Brief Number 1/03, forthcoming.
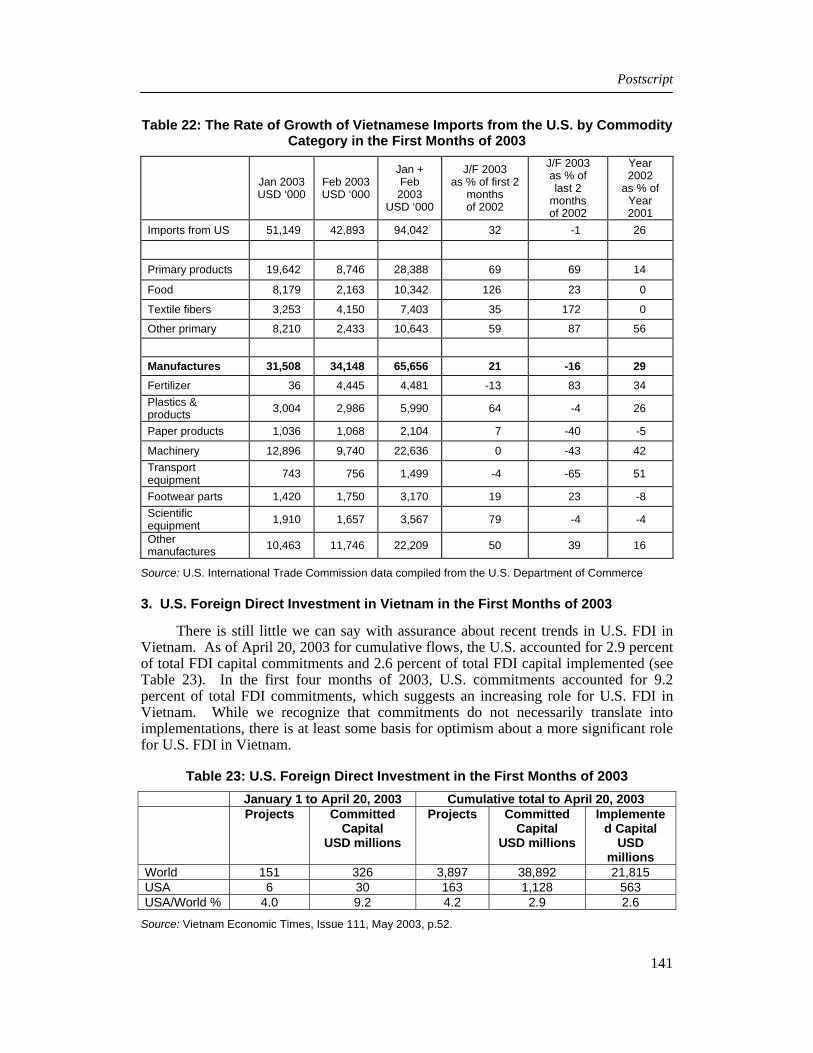
Postscript
141
Table 22: The Rate of Growth of Vietnamese Imports from the U.S. by Commodity Category in the First Months of 2003
Jan 2003 USD ‘000
Feb 2003 USD ‘000
Jan + Feb 2003
USD ‘000
J/F 2003 as % of first 2
months of 2002
J/F 2003 as % of last 2
months of 2002
Year 2002
as % of Year 2001
Imports from US 51,149 42,893 94,042 32 -1 26
Primary products 19,642 8,746 28,388 69 69 14
Food 8,179 2,163 10,342 126 23 0
Textile fibers 3,253 4,150 7,403 35 172 0
Other primary 8,210 2,433 10,643 59 87 56
Manufactures 31,508 34,148 65,656 21 -16 29 Fertilizer 36 4,445 4,481 -13 83 34 Plastics & products 3,004 2,986 5,990 64 -4 26
Paper products 1,036 1,068 2,104 7 -40 -5
Machinery 12,896 9,740 22,636 0 -43 42 Transport equipment 743 756 1,499 -4 -65 51
Footwear parts 1,420 1,750 3,170 19 23 -8 Scientific equipment 1,910 1,657 3,567 79 -4 -4
Other manufactures 10,463 11,746 22,209 50 39 16
Source: U.S. International Trade Commission data compiled from the U.S. Department of Commerce
3. U.S. Foreign Direct Investment in Vietnam in the First Months of 2003
There is still little we can say with assurance about recent trends in U.S. FDI in Vietnam. As of April 20, 2003 for cumulative flows, the U.S. accounted for 2.9 percent of total FDI capital commitments and 2.6 percent of total FDI capital implemented (see Table 23). In the first four months of 2003, U.S. commitments accounted for 9.2 percent of total FDI commitments, which suggests an increasing role for U.S. FDI in Vietnam. While we recognize that commitments do not necessarily translate into implementations, there is at least some basis for optimism about a more significant role for U.S. FDI in Vietnam.
Table 23: U.S. Foreign Direct Investment in the First Months of 2003 January 1 to April 20, 2003 Cumulative total to April 20, 2003 Projects Committed
Capital USD millions
Projects Committed Capital
USD millions
Implemented Capital
USD millions
World 151 326 3,897 38,892 21,815 USA 6 30 163 1,128 563 USA/World % 4.0 9.2 4.2 2.9 2.6
Source: Vietnam Economic Times, Issue 111, May 2003, p.52.
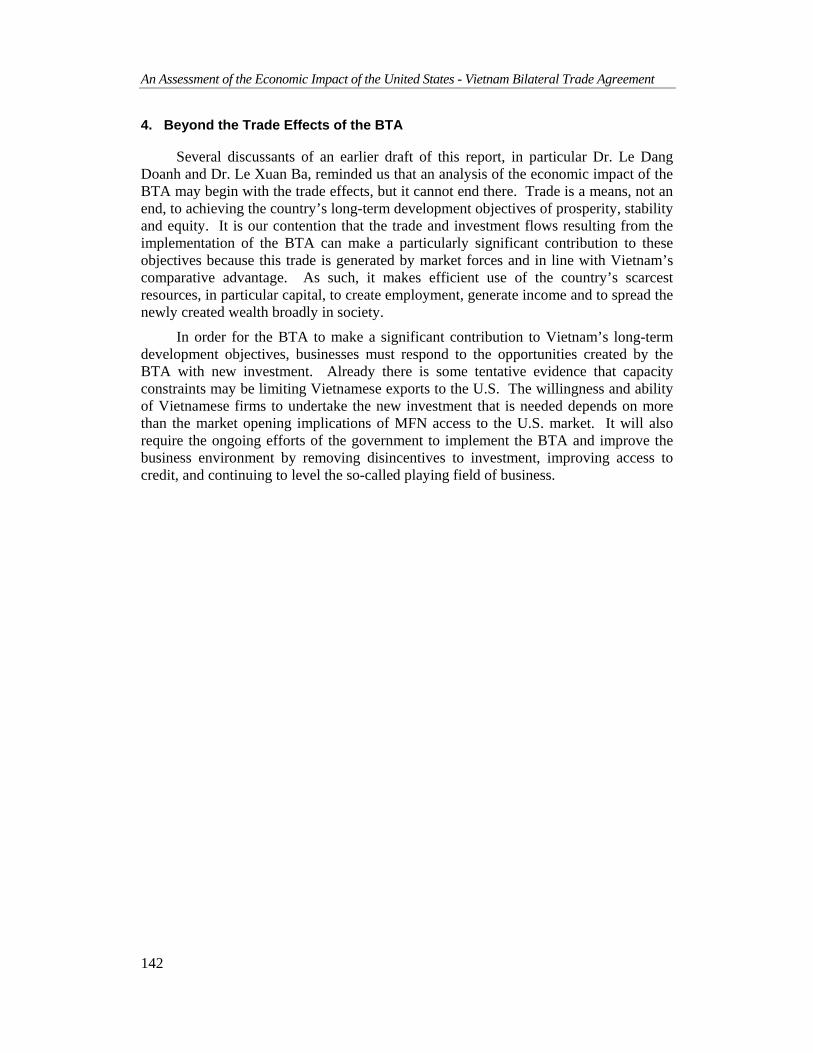
An Assessment of the Economic Impact of the United States - Vietnam Bilateral Trade Agreement
142
4. Beyond the Trade Effects of the BTA
Several discussants of an earlier draft of this report, in particular Dr. Le Dang Doanh and Dr. Le Xuan Ba, reminded us that an analysis of the economic impact of the BTA may begin with the trade effects, but it cannot end there. Trade is a means, not an end, to achieving the country’s long-term development objectives of prosperity, stability and equity. It is our contention that the trade and investment flows resulting from the implementation of the BTA can make a particularly significant contribution to these objectives because this trade is generated by market forces and in line with Vietnam’s comparative advantage. As such, it makes efficient use of the country’s scarcest resources, in particular capital, to create employment, generate income and to spread the newly created wealth broadly in society.
In order for the BTA to make a significant contribution to Vietnam’s long-term development objectives, businesses must respond to the opportunities created by the BTA with new investment. Already there is some tentative evidence that capacity constraints may be limiting Vietnamese exports to the U.S. The willingness and ability of Vietnamese firms to undertake the new investment that is needed depends on more than the market opening implications of MFN access to the U.S. market. It will also require the ongoing efforts of the government to implement the BTA and improve the business environment by removing disincentives to investment, improving access to credit, and continuing to level the so-called playing field of business.
Postscript
143
REFERENCES
- Athukorala, Prema-Chandra. “Trade Policy Reform, Export Strategies and the Incentive Structure in Vietnam,” Draft, World Bank, March 2002.
- Athukorala, Prema-Chandra, “Foreign Direct Investment and Manufacturing Exports: Opportunities and Strategies,” Draft, World Bank, 2002.
- Corden, W.M., The Theory of Protection, Oxford, 1971,
- EU Multilateral Trade Policy Assistance Program (MUTRAP), “Vietnam’s Industrial Competitiveness under International Economic Integration,” Unpublished, Hanoi, July 2002.
- Fforde, Adam. “Light within the ASEAN Gloom? The Vietnamese Economy Since the First Asian Economic Crisis and the light of the 2002 downturn,” Mimeo. 2001.
- Finger, J.M., Ng, F. and S. Wangchuk, “Anti-dumping as Safeguard Policy,” World Bank Working Paper, December 2001.
- Gutterman, Alan, ed., Commercial Laws of East Asia, Hong Kong, 1997.
- Ianchovinchina, E, Fukase, E. and W. Martin, “The Effects of the U.S. Vietnam Trade Agreement,” World Bank Working Paper, 2000.
- IMF, Selected Issues and Statistical Appendix, 2002.
- Le Dang Doanh, “Foreign Direct Investment in Vietnam: Results, Achievements, Challenges, and Prospects,” State Bank of Vietnam and IMF Conference on Foreign Direct Investment, Hanoi, August 16, 2002.
- Le Duc Tan, “Tall Order,” Vietnam Economic Times, June 2002.
- Lau, Lawrence J. and K.C. Feng, “China-United States Bilateral Trade Balances 1990-2000,” HKCER Economic Letters, December 2001.
- Pham Duy Nghia, Vietnam Business Law in Transition, Hanoi, 2002.
- Riedel, James. “On the Dynamics of Vietnam’s Exports to the U.S.,” STAR-VIETNAM Technical Brief Number 1/03, forthcoming.
- Riedel, James, The Role of the State and the Market in the Economy of Vietnam, UNDP, 2000.
- Riedel, James, “The Vietnamese Economy in the 1990s,” Asia Pacific Economic Literature, 11(2), November 1997, 58-65.
144
- Riedel, James. “Factor Proportions, Linkages and the Open Developing Economy, Review of Economics and Statistics, 57, November 1975, 319-322.
- U.S.-Vietnam Trade Council’s Education Forum and the Vietnamese Ministry of Trade, “Summary of the U.S.-Vietnam Trade Agreement.”
- Vietnam Ministry of Planning and Investment, A Destination for Foreign Investment: A guide for business and investment in Viet Nam, 2002.
- World Bank, Vietnam: Delivering on its Promises, Development Report 2003, December 2002.
- World Bank, Vietnam Economic Monitor, Autumn 2001. November 2001.
- World Bank, Vietnam 2010: Entering the 21st Century, Development Report 2001, December 2000.
- World Bank, Vietnam: Export Performance and Beyond, June 2000.
- WTO, Trade Policy Review: United States, WT/TPR/5/88, August 2001.