An Analysis of Learning Behavior and Academic Achievement: A Case Study of Bahauddin Zakariya...
12
Pakistan Journal of Social Sciences (PJSS) Vol. 34, No. 1 (2014), pp. 193-204 An Analysis of Learning Behavior and Academic Achievement: A Case Study of Bahauddin Zakariya University Multan Shahzad Farid M.Phil Scholar (Sociology) Bahauddin Zakariya University, Multan [email protected] Muhammad Luqman M.Phil Scholar (Sociology) Bahauddin Zakariya University, Multan [email protected] Shahnaz Tariq, PhD Head of the Department of Sociology [email protected] Imtiaz Ahmad Warraich Assistant Professor, Department of Sociology Email: [email protected] Abstract: The present study aimed to analyze the learning behavior of students and academic achievement in relation with the comparative analysis of formulated strata of faculties and gender. The study used the multi- stage stratified sampling techniques and selected four hundred and twenty four respondents as a true representative of the population. The core objective of the study is to identify the gender and departmental based differences in learning behavior which lead towards the identification of preferred learning behavior and its relationship with academic achievement. The suggestions are departmental based because the differences regarding learning behaviors of students varied from department to department. The study explored that there is no significant differences and correlation between learning styles and academic achievement of the students, whereas, learning style preferences have been identified at department based analysis. The study suggests that teachers should not adopt same method of teaching for male and female students because they have different learning preferences. Keywords: Learning Styles; Academic Achievement; Gender; Higher Education I. Introduction The notion of differences in intellectual ability is found in Greek literature (Zhang, Sternberg, & Rayner, 2012) which provided the philosophical roots of distinctive patterns of learning. The legacy of differences in cognitive ability gave birth to the scientific notion of IQ level, personality types and learning differences. The emergence of learning styles could be related with the study of Carl Gustav Jung (1875-1961) who determined the psychological distinctiveness of individuals (Zhang, 2001) that reflected how one
Transcript of An Analysis of Learning Behavior and Academic Achievement: A Case Study of Bahauddin Zakariya...
Pakistan Journal of Social Sciences (PJSS) Vol. 34, No. 1 (2014), pp. 193-204
An Analysis of Learning Behavior and Academic Achievement: A Case Study of Bahauddin Zakariya University Multan
Shahzad Farid
M.Phil Scholar (Sociology) Bahauddin Zakariya University, Multan
Muhammad Luqman M.Phil Scholar (Sociology)
Bahauddin Zakariya University, Multan [email protected]
Shahnaz Tariq, PhD Head of the Department of Sociology
Imtiaz Ahmad Warraich Assistant Professor, Department of Sociology
Email: [email protected]
Abstract: The present study aimed to analyze the learning behavior of students and academic achievement in relation with the comparative analysis of formulated strata of faculties and gender. The study used the multi-stage stratified sampling techniques and selected four hundred and twenty four respondents as a true representative of the population. The core objective of the study is to identify the gender and departmental based differences in learning behavior which lead towards the identification of preferred learning behavior and its relationship with academic achievement. The suggestions are departmental based because the differences regarding learning behaviors of students varied from department to department. The study explored that there is no significant differences and correlation between learning styles and academic achievement of the students, whereas, learning style preferences have been identified at department based analysis. The study suggests that teachers should not adopt same method of teaching for male and female students because they have different learning preferences.
Keywords: Learning Styles; Academic Achievement; Gender; Higher Education I. Introduction The notion of differences in intellectual ability is found in Greek literature (Zhang, Sternberg, & Rayner, 2012) which provided the philosophical roots of distinctive patterns of learning. The legacy of differences in cognitive ability gave birth to the scientific notion of IQ level, personality types and learning differences. The emergence of learning styles could be related with the study of Carl Gustav Jung (1875-1961) who determined the psychological distinctiveness of individuals (Zhang, 2001) that reflected how one

194 Pakistan Journal of Social Sciences Vol. 34, No. 1
strives to learn. Adding on his theory, Allport, G. (1897-1967) coined the term “style”
(cognitive style) referring it as a way to identify the different types of behavior or personality of individuals (Zhang, Sternberg and Rayner, 2012; Zhang, 2001). Afterwards, researches on learning styles surged and several scholars (e.g., Witkin, Myers-Briggs, Kolb and Gardner) appeared as expanders and producers of learning styles theories, models and inventories. Factors affecting academic achievement The success of students during their formal learning process has been measured by assigned scores, grades or marks that, in return, reflect the level of learning progress of students. This learning or academic performance is also associated with the previous learning achievements(Dooley, Payne, & Robb, 2012). Such association predicts the positive correlation between previous and forthcoming academic performance (Bratti & Staffolani, 2002). The previous performance is also associated with pervious schooling to determine the forthcoming academic performance of students (Considine & Zappalà, 2002). The schooling itself, irrespective to forthcoming schooling, has strong influence on the academic performance of students(Altonji, Elder, & Taber, 2000; Coleman, Hoffer, & Kilgore, 1982; Cullen, Jacob, & Levitt, 2003;Cullen, Jacob, & Levitt, 2005). The previous status of students as a determinant of academic achievement also encompasses the socio-economic status, gender, race and peer group. Several studies identified positive correlation between socio-economic status and academic achievement (Caldas & Bankston, 1997; Jeynes, 2002; Ma & Klinger, 2000; Tomul & Savasci, 2012). Those parents who have higher socio-economic status including better qualification are influential for children to increase their performance by providing them better environment for study (Barnard, 2004; Fantuzzo, Tighe, & Childs, 2000; Henderson, 1988; Krashen, 2005; Shumow & Lomax, 2002; Trusty, 1999)while, lower socio-economic status is associated with loweracademic achievement(Eamon, 2005; Hochschild, 2003) because it also effects the selection of educational institute for study which, in return, effects the academic achievement. In the context of Pakistan, qualification of parents has higher priority than their professional status to influence the academic achievement of their children (Farooq, Chaudhry, Shafiq, & Berhanu, 2011). Findings regarding gender as a factor of academic achievement are diverse and extensive (Jabor, Kungu, Nordin, Machtmes, & Buntat, 2011). It has been identified that males scored higher than females (DeBaz, 1994) and some contrary findings are also known(Chambers* & Schreiber, 2004; Coley, 2001) because gender based bias in grading has been reported (Bradley, 1984, 1993). Several scholars also studied the academic achievement associating it with multiage (Anderson & Pavan, 1993; Gutierrez & Slavin, 1992; Pratt, 1986), cross age(Slavin, 1987), race (Fryer Jr & Levitt, 2004; Fryer & Levitt, 2006) and time spent on study (Gibbons, 1998; Gose, 1998). It was found that academic achievement has positive correlation with multiage (Gutierrez & Slavin, 1992), cross age (Slavin, 1987)and time spent on study (McFadden & Dart, 1992; Nonis & Hudson, 2006). Learning styles as a factor Learning styles are one of the major factors that influence the academic achievement(Graham, Garton, & Gowdy, 2001). Learning styles and characteristics of students varied(Entwistle, 2013; Kolb, 1976; Litzinger, Lee, & Wise, 2005; Rudd, Baker, & Hoover, 2000; Schmeck, 1988) that correlated with variation of academic achievement
Shahzad Farid, Muhammad Luqman, Shahnaz Tariq, Imtiaz Ahmad Warraich 195
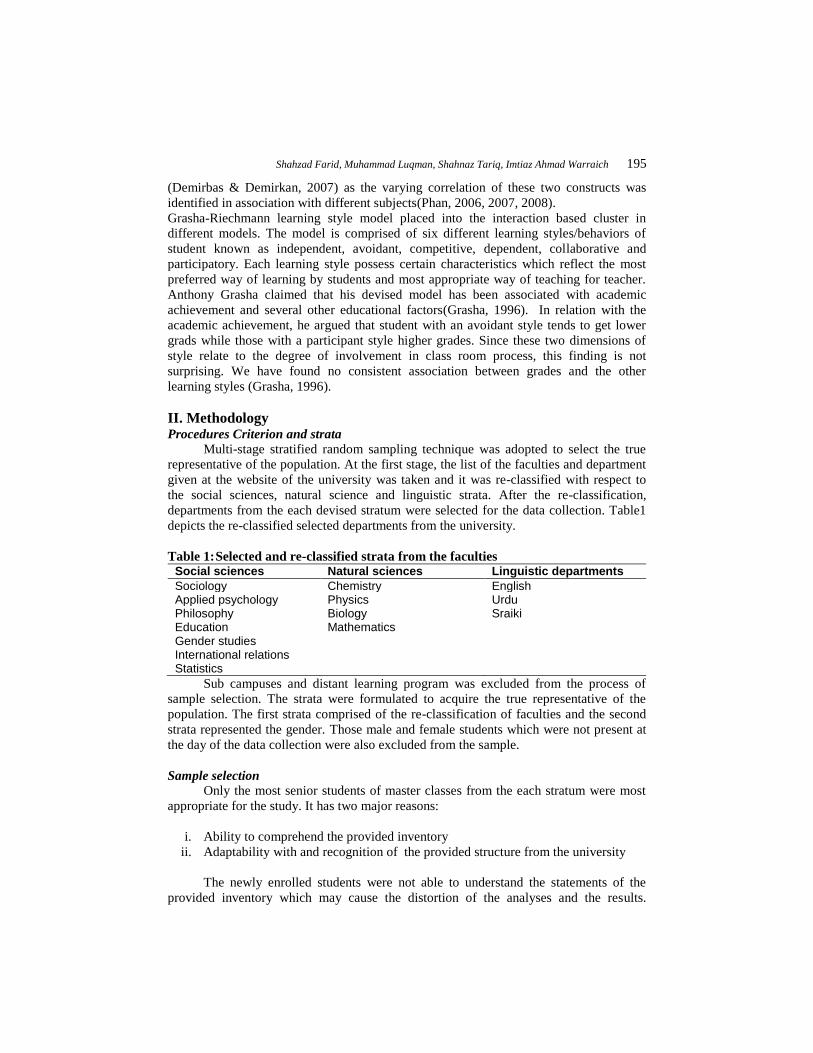
(Demirbas & Demirkan, 2007) as the varying correlation of these two constructs was identified in association with different subjects(Phan, 2006, 2007, 2008). Grasha-Riechmann learning style model placed into the interaction based cluster in different models. The model is comprised of six different learning styles/behaviors of student known as independent, avoidant, competitive, dependent, collaborative and participatory. Each learning style possess certain characteristics which reflect the most preferred way of learning by students and most appropriate way of teaching for teacher. Anthony Grasha claimed that his devised model has been associated with academic achievement and several other educational factors(Grasha, 1996). In relation with the academic achievement, he argued that student with an avoidant style tends to get lower grads while those with a participant style higher grades. Since these two dimensions of style relate to the degree of involvement in class room process, this finding is not surprising. We have found no consistent association between grades and the other learning styles (Grasha, 1996). II. Methodology Procedures Criterion and strata Multi-stage stratified random sampling technique was adopted to select the true representative of the population. At the first stage, the list of the faculties and department given at the website of the university was taken and it was re-classified with respect to the social sciences, natural science and linguistic strata. After the re-classification, departments from the each devised stratum were selected for the data collection. Table1 depicts the re-classified selected departments from the university. Table 1: Selected and re-classified strata from the faculties
Social sciences Natural sciences Linguistic departments Sociology Chemistry English Applied psychology Physics Urdu Philosophy Biology Sraiki Education Mathematics Gender studies International relations Statistics
Sub campuses and distant learning program was excluded from the process of sample selection. The strata were formulated to acquire the true representative of the population. The first strata comprised of the re-classification of faculties and the second strata represented the gender. Those male and female students which were not present at the day of the data collection were also excluded from the sample. Sample selection Only the most senior students of master classes from the each stratum were most appropriate for the study. It has two major reasons:
i. Ability to comprehend the provided inventory ii. Adaptability with and recognition of the provided structure from the university
The newly enrolled students were not able to understand the statements of the provided inventory which may cause the distortion of the analyses and the results.
196 Pakistan Journal of Social Sciences Vol. 34, No. 1
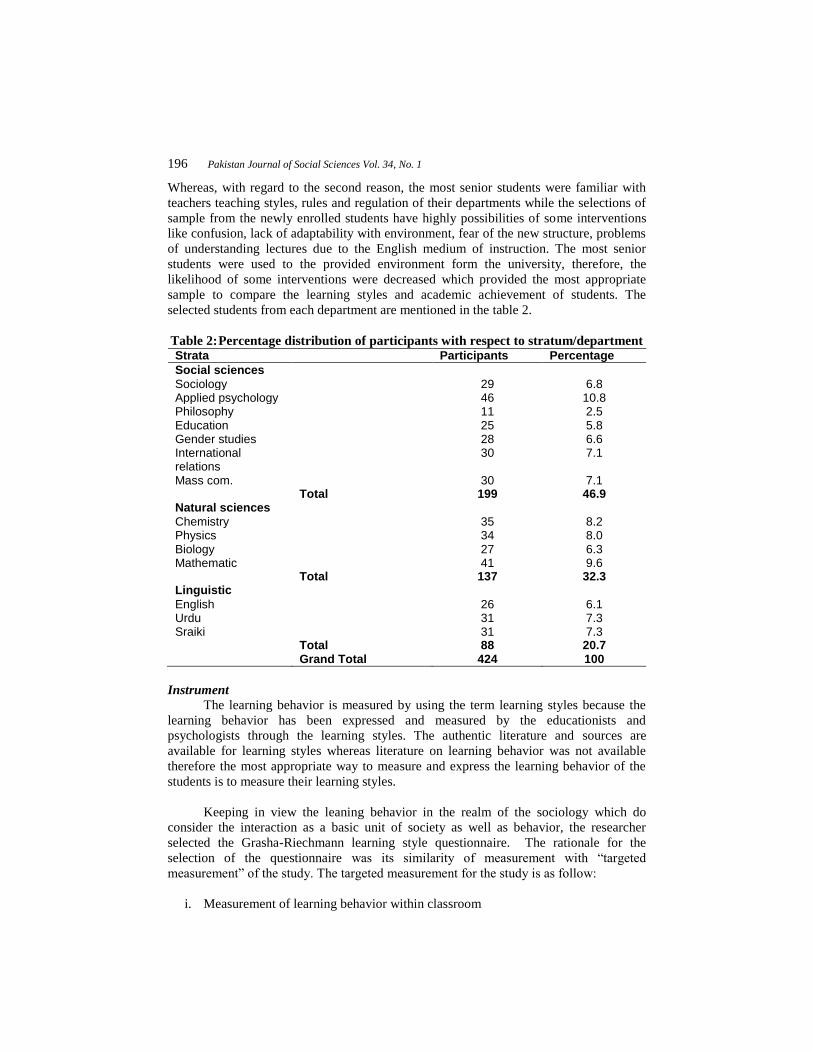
Whereas, with regard to the second reason, the most senior students were familiar with teachers teaching styles, rules and regulation of their departments while the selections of sample from the newly enrolled students have highly possibilities of some interventions like confusion, lack of adaptability with environment, fear of the new structure, problems of understanding lectures due to the English medium of instruction. The most senior students were used to the provided environment form the university, therefore, the likelihood of some interventions were decreased which provided the most appropriate sample to compare the learning styles and academic achievement of students. The selected students from each department are mentioned in the table 2. Table 2: Percentage distribution of participants with respect to stratum/department Strata Participants Percentage Social sciences Sociology 29 6.8 Applied psychology 46 10.8 Philosophy 11 2.5 Education 25 5.8 Gender studies 28 6.6 International relations
30 7.1
Mass com. 30 7.1 Total 199 46.9 Natural sciences Chemistry 35 8.2 Physics 34 8.0 Biology 27 6.3 Mathematic 41 9.6 Total 137 32.3 Linguistic English 26 6.1 Urdu 31 7.3 Sraiki 31 7.3 Total 88 20.7 Grand Total 424 100
Instrument The learning behavior is measured by using the term learning styles because the learning behavior has been expressed and measured by the educationists and psychologists through the learning styles. The authentic literature and sources are available for learning styles whereas literature on learning behavior was not available therefore the most appropriate way to measure and express the learning behavior of the students is to measure their learning styles. Keeping in view the leaning behavior in the realm of the sociology which do consider the interaction as a basic unit of society as well as behavior, the researcher selected the Grasha-Riechmann learning style questionnaire. The rationale for the selection of the questionnaire was its similarity of measurement with “targeted
measurement” of the study. The targeted measurement for the study is as follow:
i. Measurement of learning behavior within classroom
Shahzad Farid, Muhammad Luqman, Shahnaz Tariq, Imtiaz Ahmad Warraich 197
ii. Learning behavior must be measured through process of interaction Grasha-Riechmann learning style questionnaire was most appropriate to measure the targeted measurement of the study because it was formulated on the basis of interaction among students within class to learn. The questionnaire measured the six learning behaviors: independent, avoidant, competitive, dependent, collaborative and participative learning styles. The measurement of learning styles by the questionnaire expressed the most and the least preferred style of students’ learning which denotes the
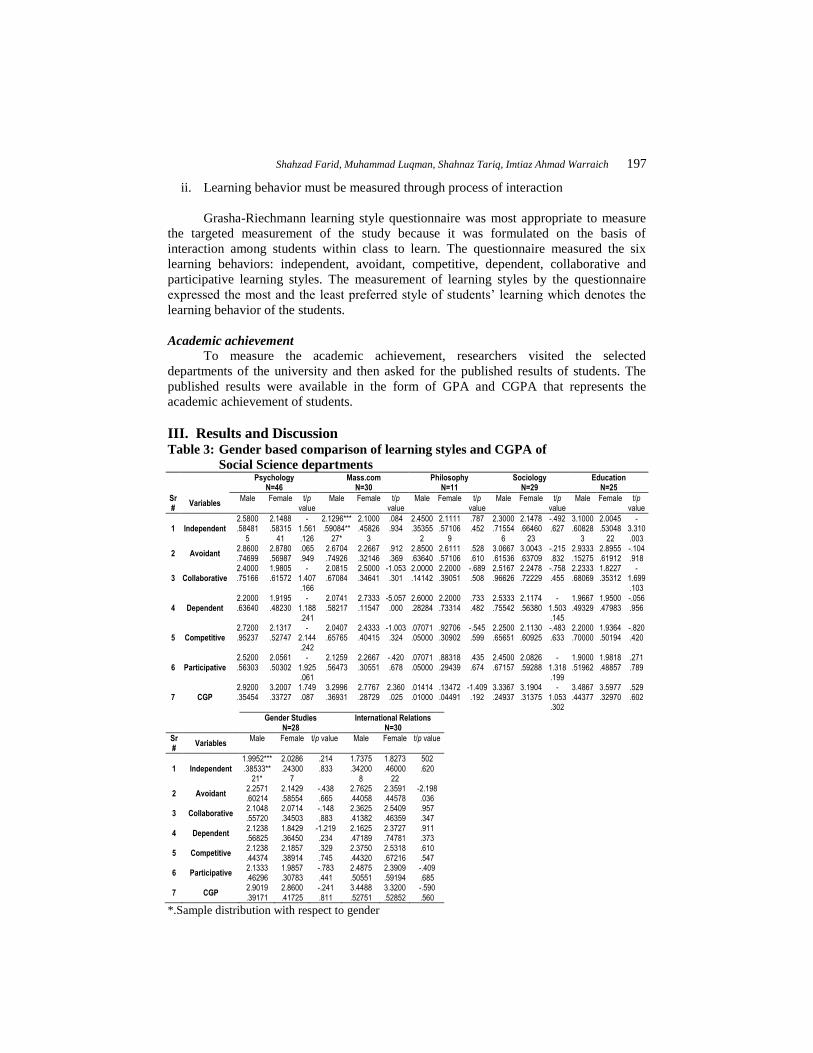
learning behavior of the students. Academic achievement To measure the academic achievement, researchers visited the selected departments of the university and then asked for the published results of students. The published results were available in the form of GPA and CGPA that represents the academic achievement of students. III. Results and Discussion Table 3: Gender based comparison of learning styles and CGPA of Social Science departments
Psychology
N=46 Mass.com
N=30 Philosophy
N=11 Sociology
N=29 Education
N=25
Sr #
Variables Male Female t/p
value Male Female t/p
value Male Female t/p
value Male Female t/p
value Male Female t/p
value
1 Independent 2.5800 .58481
5
2.1488 .58315
41
-1.561 .126
2.1296*** .59084**
27*
2.1000 .45826
3
.084
.934
2.4500 .35355
2
2.1111 .57106
9
.787
.452 2.3000 .71554
6
2.1478 .66460
23
-.492 .627
3.1000 .60828
3
2.0045 .53048
22
-3.310 .003
2 Avoidant 2.8600 .74699
2.8780 .56987
.065
.949 2.6704 .74926
2.2667 .32146
.912
.369 2.8500 .63640
2.6111 .57106
.528
.610 3.0667 .61536
3.0043 .63709
-.215 .832
2.9333 .15275
2.8955 .61912
-.104 .918
3 Collaborative 2.4000 .75166
1.9805 .61572
-1.407 .166
2.0815 .67084
2.5000 .34641
-1.053 .301
2.0000 .14142
2.2000 .39051
-.689 .508
2.5167 .96626
2.2478 .72229
-.758 .455
2.2333 .68069
1.8227 .35312
-1.699 .103
4 Dependent 2.2000 .63640
1.9195 .48230
-1.188 .241
2.0741 .58217
2.7333 .11547
-5.057 .000
2.6000 .28284
2.2000 .73314
.733
.482 2.5333 .75542
2.1174 .56380
-1.503 .145
1.9667 .49329
1.9500 .47983
-.056 .956
5 Competitive 2.7200 .95237
2.1317 .52747
-2.144 .242
2.0407 .65765
2.4333 .40415
-1.003 .324
.07071
.05000 .92706 .30902
-.545 .599
2.2500 .65651
2.1130 .60925
-.483 .633
2.2000 .70000
1.9364 .50194
-.820 .420
6 Participative 2.5200 .56303
2.0561 .50302
-1.925 .061
2.1259 .56473
2.2667 .30551
-.420 .678
.07071
.05000 .88318 .29439
.435
.674 2.4500 .67157
2.0826 .59288
-1.318 .199
1.9000 .51962
1.9818 .48857
.271
.789
7 CGP 2.9200 .35454
3.2007 .33727
1.749 .087
3.2996 .36931
2.7767 .28729
2.360 .025
.01414
.01000 .13472 .04491
-1.409 .192
3.3367 .24937
3.1904 .31375
-1.053 .302
3.4867 .44377
3.5977 .32970
.529
.602
Gender Studies
N=28 International Relations
N=30
Sr #
Variables Male Female t/p value Male Female t/p value
1 Independent 1.9952*** .38533**
21*
2.0286 .24300
7
.214
.833 1.7375 .34200
8
1.8273 .46000
22
502 .620
2 Avoidant 2.2571 .60214
2.1429 .58554
-.438 .665
2.7625 .44058
2.3591 .44578
-2.198 .036
3 Collaborative 2.1048 .55720
2.0714 .34503
-.148 .883
2.3625 .41382
2.5409 .46359
.957
.347
4 Dependent 2.1238 .56825
1.8429 .36450
-1.219 .234
2.1625 .47189
2.3727 .74781
.911
.373
5 Competitive 2.1238 .44374
2.1857 .38914
.329
.745 2.3750 .44320
2.5318 .67216
.610
.547
6 Participative 2.1333 .46296
1.9857 .30783
-.783 .441
2.4875 .50551
2.3909 .59194
-.409 .685
7 CGP 2.9019 .39171
2.8600 .41725
-.241 .811
3.4488 .52751
3.3200 .52852
-.590 .560
*.Sample distribution with respect to gender
198 Pakistan Journal of Social Sciences Vol. 34, No. 1
**. Standard deviation ***. Mean The first section of Table 3depicts the mean differences of learning styles and CGPA between male and female students who were studying in department of psychology. The portion shows no significant mean differences between male and female students’ learning styles and CGPA. The same results are denoted in department of
Philosophy, Sociology and Gender. It means that there was no significant difference found between male and female students’ learning style preferences and CGPA, whereas,
the results from the departments of Mass Communication, Education and International Relations vary. The second portion of the table depicts the results of Mass Communication department. The p-value (from the department of Mass Communication –in the fourth row) shows that there is a significant difference in male and female students’ dependent learning styles. The seventh row of the same portion also depicts that there is a significant difference between male and female students’ CGPA. In other word,
the results from the portion denotes that the female students prefers more dependent leaning style than male while the CGPA of male students is higher than female student. The t-statistics of the Education department shows significant difference between male and female students’ independent learning styles, whereas, there was no significant
difference found between male and females students’ CGPA and other learning styles. In
other word, the portion depicts that male students prefers more independent learning styles than female students in the department of Education. The t-statistics from the Department of International Relations depicts that there is a significant difference between male and female students’ avoidant learning styles. The mean difference reveals
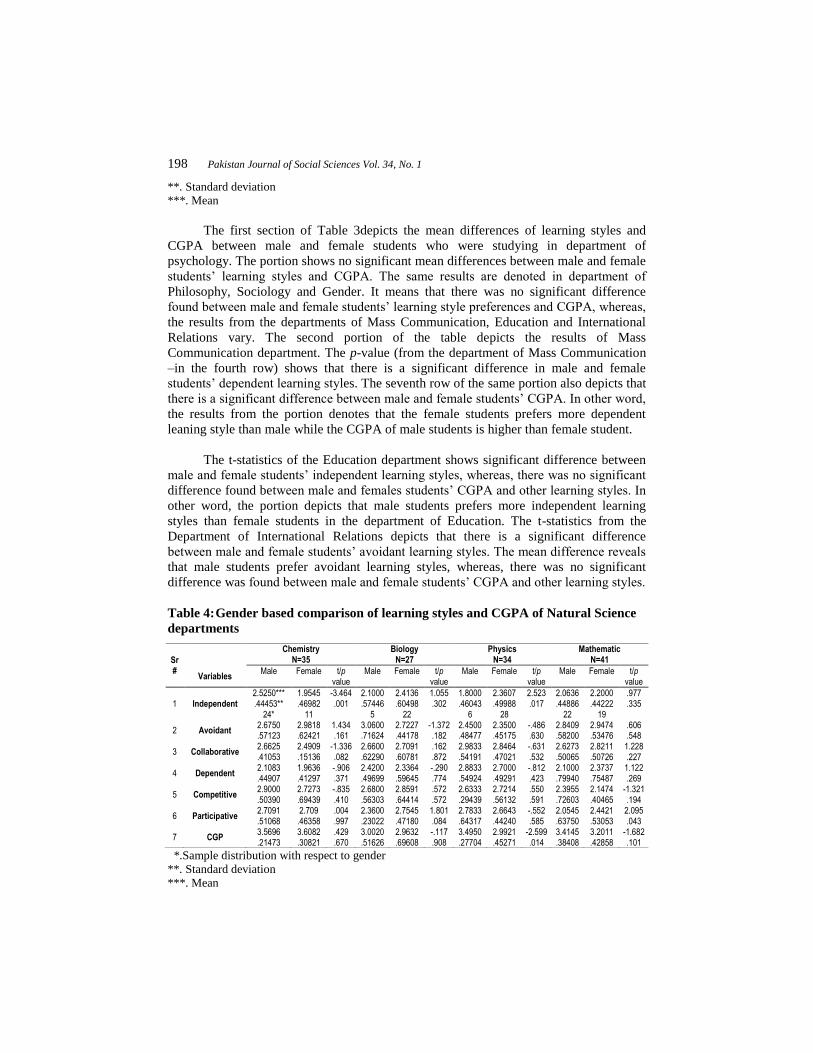
that male students prefer avoidant learning styles, whereas, there was no significant difference was found between male and female students’ CGPA and other learning styles. Table 4: Gender based comparison of learning styles and CGPA of Natural Science departments
*.Sample distribution with respect to gender **. Standard deviation ***. Mean
Sr #
Chemistry
N=35 Biology
N=27 Physics
N=34 Mathematic
N=41
Variables Male Female t/p
value Male Female t/p
value Male Female t/p
value Male Female t/p
value
1 Independent 2.5250*** .44453**
24*
1.9545 .46982
11
-3.464 .001
2.1000 .57446
5
2.4136 .60498
22
1.055 .302
1.8000 .46043
6
2.3607 .49988
28
2.523 .017
2.0636 .44886
22
2.2000 .44222
19
.977
.335
2 Avoidant 2.6750 .57123
2.9818 .62421
1.434 .161
3.0600 .71624
2.7227 .44178
-1.372 .182
2.4500 .48477
2.3500 .45175
-.486 .630
2.8409 .58200
2.9474 .53476
.606
.548
3 Collaborative 2.6625 .41053
2.4909 .15136
-1.336 .082
2.6600 .62290
2.7091 .60781
.162
.872 2.9833 .54191
2.8464 .47021
-.631 .532
2.6273 .50065
2.8211 .50726
1.228 .227
4 Dependent 2.1083 .44907
1.9636 .41297
-.906 .371
2.4200 .49699
2.3364 .59645
-.290 .774
2.8833 .54924
2.7000 .49291
-.812 .423
2.1000 .79940
2.3737 .75487
1.122 .269
5 Competitive 2.9000 .50390
2.7273 .69439
-.835 .410
2.6800 .56303
2.8591 .64414
.572
.572 2.6333 .29439
2.7214 .56132
.550
.591 2.3955 .72603
2.1474 .40465
-1.321 .194
6 Participative 2.7091 .51068
2.709 .46358
.004
.997 2.3600 .23022
2.7545 .47180
1.801 .084
2.7833 .64317
2.6643 .44240
-.552 .585
2.0545 .63750
2.4421 .53053
2.095 .043
7 CGP 3.5696 .21473
3.6082 .30821
.429
.670 3.0020 .51626
2.9632 .69608
-.117 .908
3.4950 .27704
2.9921 .45271
-2.599 .014
3.4145 .38408
3.2011 .42858
-1.682 .101
Shahzad Farid, Muhammad Luqman, Shahnaz Tariq, Imtiaz Ahmad Warraich 199
Table 4 depicts the comparative analysis of male and female students who were studying in the selected departments of faculty of natural sciences with respect to learning styles and CGPA. The first row and the column with the label of t/p value denote that there is a significant difference between male and female students’ independent
learning style who were studying in Chemistry department. It reflects that male students prefer more independent learning style than female student, whereas, there was no significant difference found between male and female students’ other learning styles and
CGPA in the department of chemistry. The second portion labeled with biology illustrates that there is no significant difference between male and female students’
learning styles and CGPA.
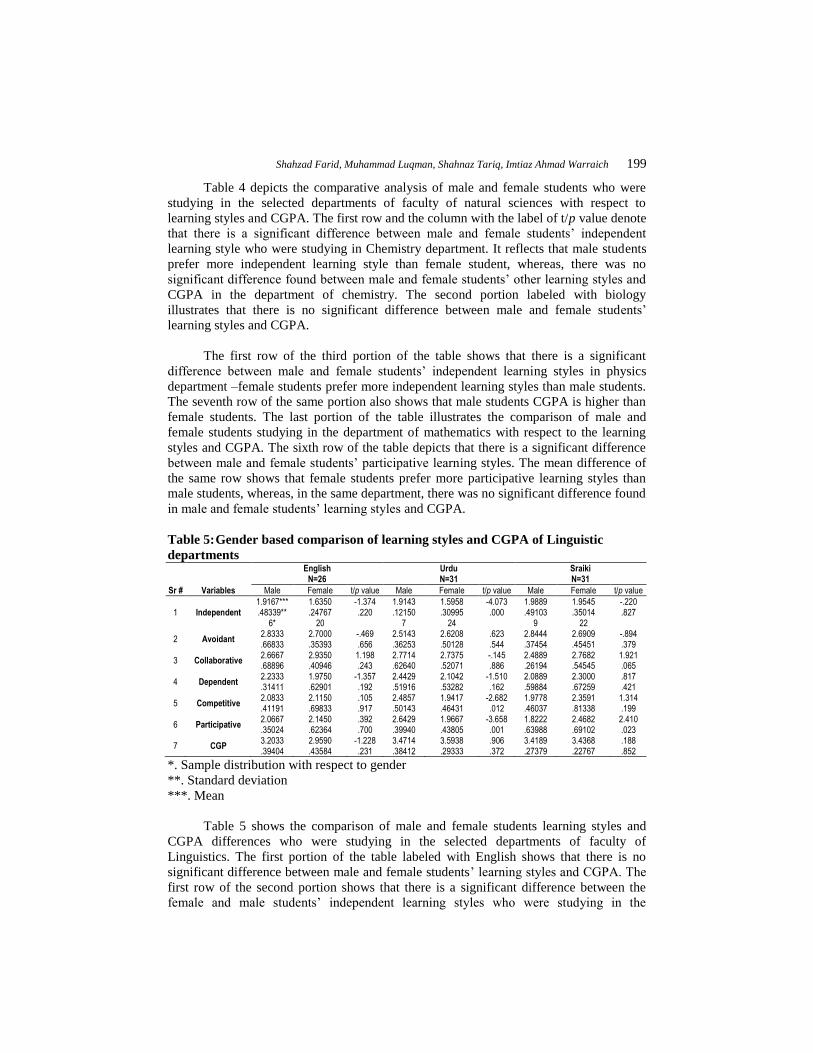
The first row of the third portion of the table shows that there is a significant difference between male and female students’ independent learning styles in physics department –female students prefer more independent learning styles than male students. The seventh row of the same portion also shows that male students CGPA is higher than female students. The last portion of the table illustrates the comparison of male and female students studying in the department of mathematics with respect to the learning styles and CGPA. The sixth row of the table depicts that there is a significant difference between male and female students’ participative learning styles. The mean difference of the same row shows that female students prefer more participative learning styles than male students, whereas, in the same department, there was no significant difference found in male and female students’ learning styles and CGPA. Table 5: Gender based comparison of learning styles and CGPA of Linguistic departments
English N=26
Urdu N=31
Sraiki N=31
Sr # Variables Male Female t/p value Male Female t/p value Male Female t/p value
1 Independent 1.9167*** .48339**
6*
1.6350 .24767
20
-1.374 .220
1.9143 .12150
7
1.5958 .30995
24
-4.073 .000
1.9889 .49103
9
1.9545 .35014
22
-.220 .827
2 Avoidant 2.8333 .66833
2.7000 .35393
-.469 .656
2.5143 .36253
2.6208 .50128
.623
.544 2.8444 .37454
2.6909 .45451
-.894 .379
3 Collaborative 2.6667 .68896
2.9350 .40946
1.198 .243
2.7714 .62640
2.7375 .52071
-.145 .886
2.4889 .26194
2.7682 .54545
1.921 .065
4 Dependent 2.2333 .31411
1.9750 .62901
-1.357 .192
2.4429 .51916
2.1042 .53282
-1.510 .162
2.0889 .59884
2.3000 .67259
.817
.421
5 Competitive 2.0833 .41191
2.1150 .69833
.105
.917 2.4857 .50143
1.9417 .46431
-2.682 .012
1.9778 .46037
2.3591 .81338
1.314 .199
6 Participative 2.0667 .35024
2.1450 .62364
.392
.700 2.6429 .39940
1.9667 .43805
-3.658 .001
1.8222 .63988
2.4682 .69102
2.410 .023
7 CGP 3.2033 .39404
2.9590 .43584
-1.228 .231
3.4714 .38412
3.5938 .29333
.906
.372 3.4189 .27379
3.4368 .22767
.188
.852
*. Sample distribution with respect to gender **. Standard deviation ***. Mean Table 5 shows the comparison of male and female students learning styles and CGPA differences who were studying in the selected departments of faculty of Linguistics. The first portion of the table labeled with English shows that there is no significant difference between male and female students’ learning styles and CGPA. The
first row of the second portion shows that there is a significant difference between the female and male students’ independent learning styles who were studying in the
200 Pakistan Journal of Social Sciences Vol. 34, No. 1
department of Urdu. In other words, male students prefer more independent learning style than female student in the department of Urdu. The fifth row of the second portion shows that there is a significant difference between male and female students’ competitive
learning style –male students prefer more participative learning style than female students. The sixth row of the same portion also depicts a significant difference between male and female students’ participative learning style–male also prefer more participative learning style than female students of the same department, whereas, there was no significant difference found between male and female students’ other learning styles and
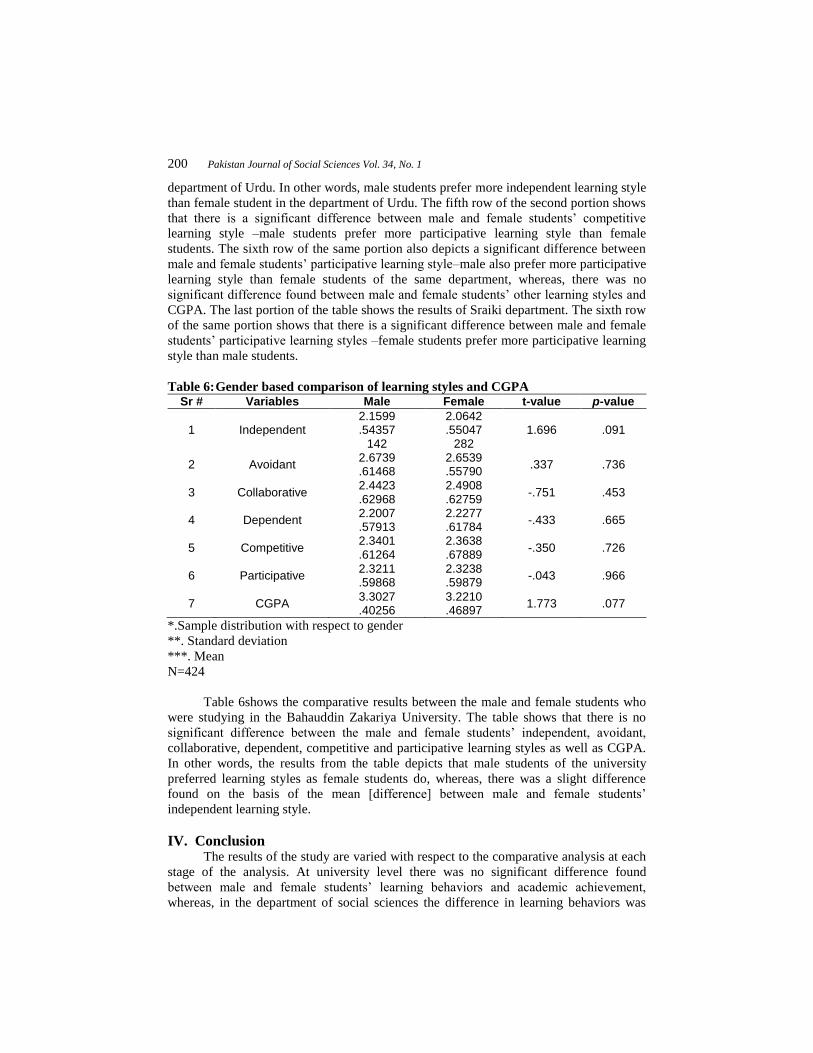
CGPA. The last portion of the table shows the results of Sraiki department. The sixth row of the same portion shows that there is a significant difference between male and female students’ participative learning styles –female students prefer more participative learning style than male students. Table 6: Gender based comparison of learning styles and CGPA
Sr # Variables Male Female t-value p-value
1 Independent 2.1599 .54357
142
2.0642 .55047
282 1.696 .091
2 Avoidant 2.6739 .61468
2.6539 .55790
.337 .736
3 Collaborative 2.4423 .62968
2.4908 .62759
-.751 .453
4 Dependent 2.2007 .57913
2.2277 .61784
-.433 .665
5 Competitive 2.3401 .61264
2.3638 .67889
-.350 .726
6 Participative 2.3211 .59868
2.3238 .59879
-.043 .966
7 CGPA 3.3027 .40256
3.2210 .46897
1.773 .077
*.Sample distribution with respect to gender **. Standard deviation ***. Mean N=424 Table 6shows the comparative results between the male and female students who were studying in the Bahauddin Zakariya University. The table shows that there is no significant difference between the male and female students’ independent, avoidant,
collaborative, dependent, competitive and participative learning styles as well as CGPA. In other words, the results from the table depicts that male students of the university preferred learning styles as female students do, whereas, there was a slight difference found on the basis of the mean [difference] between male and female students’
independent learning style. IV. Conclusion The results of the study are varied with respect to the comparative analysis at each stage of the analysis. At university level there was no significant difference found between male and female students’ learning behaviors and academic achievement,
whereas, in the department of social sciences the difference in learning behaviors was

Shahzad Farid, Muhammad Luqman, Shahnaz Tariq, Imtiaz Ahmad Warraich 201
identified. In the department of mass communication, female students preferred more dependent learning styles than male students, whereas, male students from the department of education preferred more independent learning style than female students. In the department of International Relations, male students preferred more avoidant learning styles than female students and in other departments of social sciences, there were no differences identified between learning styles of male and female students. In the departments of natural sciences, male students from chemistry department preferred more independent learning styles whereas the results from the physics department are contrary. In the department of mathematics, female students preferred more participative learning style than male students, while, no significant differencewas identified between male and female students from the other departments of natural sciences. In the departments of linguistic, male students from Urdu department preferred more independent, competitive and participative learning styles than female students, whereas, in Sraiki department, female students preferred more participative leaning style than male students. On the whole, there was no difference found between learning styles of male and female students studying in Bahauddin Zakariya University. It was also identified that there is no correlation between learning styles and academic achievement of the students studying in the same university except collaborative learning style (see appendix 1). V. Suggestions and recommendations The study proposed that to adopt a single teaching method for male and female students will distort the academic performance of them because their preferences of learning behavior vary. Although, the learning differences have been identified between male and female students but the differences are less than the similarities as it has been explored that there is no difference in six learning styles of male and female students of Psychology, Sociology, Gender and Philosophy departments. It doesn’t mean that the
teacher has to adopt the single teaching method to teach students that will enhance their academic performance whereas it suggested that students simultaneously have different learning behaviors therefore to teach them with one single method would disturb their learning performance that in return would affect their academic achievement. To manage the students learning environment, teachers must have to focus on the learning behavior of students instead to pay attention on their pre-occupied teaching styles. It means that teachers should modify their method beyond the chalk, walk and talk method to recognized learning behavior of students. Another suggestible method for teacher is to move away from their authoritative behavior because most of the students, regardless of gender differences, prefer independent learning which denotes that they do not only rely on the provided material and lectures while they prefer to learn on their own. Otherwise, teacher ought to use authoritative behavior for avoidant learning that do not prefer to be and participation in class room. Such student would even influence other or at least could be an irritated for those students who have participative and collaborative learning behavior. With regard to the green places, the present study provided new rooms to extend the same study for instance, the study could be re-measured in the field of health, pharmacy, ecology, medical sciences and several other disciplines which did not incorporates the study. The scale could be used at school, college and university levels of
202 Pakistan Journal of Social Sciences Vol. 34, No. 1
the proposed disciplines. The present study provided the most important room to identify the extraneous variable which influence the academic achievement of the students in three mentioned levels because if there is no correlation between those learning behaviors which are used in the present study then, in fact, there is any sort of extraneous variable influencing the academic achievement of the students. References Altonji, J. G., Elder, T. E., & Taber, C. R. (2000). Selection on observed and unobserved
variables: Assessing the effectiveness of Catholic schools: National bureau of economic research.
Anderson, R. H., & Pavan, B. N. (1993). Nongradedness: Helping It To Happen: ERIC.
Barnard, W. M. (2004). Parent involvement in elementary school and educational attainment. Children and Youth Services Review, 26(1), 39-62.
Bradley, C. (1984). Sex bias in the evaluation of students. British Journal of Social Psychology, 23(2), 147-153.
Bradley, C. (1993). Sex bias in student assessment overlooked? Assessment & Evaluation in Higher Education, 18(1), 3-8.
Bratti, M., & Staffolani, S. (2002). Student time allocation and educational production functions: Università di Ancona, Dipartimento di economia.
Caldas, S. J., & Bankston, C. (1997). Effect of school population socioeconomic status on individual academic achievement. The Journal of Educational Research, 90(5), 269-277.
Chambers*, E. A., & Schreiber, J. B. (2004). Girls’ academic achievement: varying
associations of extracurricular activities. Gender and Education, 16(3), 327-346.
Coleman, J. S., Hoffer, T., & Kilgore, S. (1982). High school achievement: Public, Catholic, and private schools compared: Basic Books New York.
Coley, R. J. (2001). Differences in the Gender Gap: Comparisons across Racial/Ethnic Groups in Education and Work. Policy Information Report.
Considine, G., & Zappalà, G. (2002). The influence of social and economic disadvantage in the academic performance of school students in Australia. Journal of Sociology, 38(2), 129-148.
Cullen, J. B., Jacob, B. A., & Levitt, S. (2003). The effect of school choice on student outcomes: Evidence from randomized lotteries: National Bureau of Economic Research.
Cullen, J. B., Jacob, B. A., & Levitt, S. D. (2005). The impact of school choice on student outcomes: an analysis of the Chicago Public Schools. Journal of Public Economics, 89(5), 729-760.
DeBaz, T. P. (1994). A meta-analysis of the relationship between students’
characteristics and achievement and attitudes toward science. The Ohio State University.
Shahzad Farid, Muhammad Luqman, Shahnaz Tariq, Imtiaz Ahmad Warraich 203
Demirbas, O. O., & Demirkan, H. (2007). Learning styles of design students and the relationship of academic performance and gender in design education. Learning and Instruction, 17(3), 345-359.
Dooley, M. D., Payne, A. A., & Robb, A. L. (2012). Persistence and academic success in university. Canadian Public Policy, 38(3), 315-339.
Eamon, M. K. (2005). Social-demographic, school, neighborhood, and parenting influences on the academic achievement of Latino young adolescents. Journal of youth and adolescence, 34(2), 163-174.
Entwistle, N. J. (2013). Styles of learning and teaching: An integrated outline of educational psychology for students, teachers and lecturers: Routledge.
Fantuzzo, J., Tighe, E., & Childs, S. (2000). Family Involvement Questionnaire: A multivariate assessment of family participation in early childhood education. Journal of educational psychology, 92(2), 367.
Farooq, M., Chaudhry, A., Shafiq, M., & Berhanu, G. (2011). Factors affecting students’
quality of academic performance: a case of secondary school level. Journal of Quality and Technology Management, 7(2), 01-14.
Fryer Jr, R. G., & Levitt, S. D. (2004). Understanding the black-white test score gap in the first two years of school. Review of Economics and Statistics, 86(2), 447-464.
Fryer, R. G., & Levitt, S. D. (2006). The black-white test score gap through third grade. American Law and Economics Review, 8(2), 249-281.
Gibbons, M. (1998). Higher Education Relevance in the 21st Century.
Gose, B. (1998). More freshmen than ever appear disengaged from their studies, survey finds. The Chronicle of Higher Education.
Graham, J. C., Garton, B. L., & Gowdy, M. (2001). The Relationship Between Student’s
Learning Styles, Instructional Performance, and Student Learning in a Plant Propagation Course. NACTA JOURNAL, 45(4), 30-35.
Grasha, A. F. (1996). Teaching with style: A practical guide to enhancing learning by understanding teaching and learning styles: Alliance Publishers.
Gutierrez, R., & Slavin, R. E. (1992). Achievement effects of the nongraded elementary school: A best evidence synthesis. Review of educational research, 62(4), 333-376.
Henderson, A. (1988). Good news: An ecologically balanced approach to academic improvement. Educational Horizons, 66(2), 60-62.
Hochschild, J. L. (2003). Social class in public schools. Journal of social issues, 59(4), 821-840.
Jabor, K., Kungu, K., Nordin, M. S., Machtmes, K., & Buntat, Y. (2011). The Influence of Age and Gender on the Students’ Achievement in Mathematics. International Proceedings of Economics Development & Research, 5(2).
Jeynes, W. H. (2002). Examining the effects of parental absence on the academic achievement of adolescents: the challenge of controlling for family income. Journal of family and Economic Issues, 23(2), 189-210.
204 Pakistan Journal of Social Sciences Vol. 34, No. 1
Kolb, D. A. (1976). Learning style inventory technical manual: McBer Boston.
Krashen, S. (2005). The Hard Work Hypothesis: Is Doing Your Homework Enough to Overcome the Effects of Poverty? Multicultural Education, 12(4), 16.
Litzinger, T. A., Lee, S. H., & Wise, J. C. (2005). A study of the reliability and validity of the Felder-Soloman Index of Learning Styles. Education, 113, 77.
Ma, X., & Klinger, D. A. (2000). Hierarchical linear modelling of student and school effects on academic achievement. Canadian Journal of Education, 25(1), 41-55.
McFadden, K., & Dart, J. (1992). Time management skills of undergraduate business students. Journal of Education for Business, 68(2), 84-88.
Nonis, S. A., & Hudson, G. I. (2006). Academic performance of college students: Influence of time spent studying and working. Journal of Education for Business, 81(3), 151-159.
Phan, H. P. (2006). Examination of student learning approaches, reflective thinking, and epistemological beliefs: A latent variables approach. Electronic Journal of Research in Educational Psychology, 4(3), 577-610.
Phan, H. P. (2007). An examination of reflective thinking, learning approaches, and self efficacy beliefs at the University of the South Pacific: A path analysis approach. Educational Psychology, 27(6), 789-806.
Phan, H. P. (2008). Unifying different theories of learning: Theoretical framework and empirical evidence. Educational Psychology, 28(3), 325-340.
Pratt, D. (1986). On the merits of multiage classrooms. Research in Rural Education, 3(3), 111-115.
Rudd, R., Baker, M., & Hoover, T. (2000). Undergraduate Agriculture Student Learning Styles and Critical Thinking Abilities: Is there a relationship? Journal of agricultural education, 41(3), 2-12.
Schmeck, R. R. E. (1988). Learning strategies and learning styles: Plenum Press.
Shumow, L., & Lomax, R. (2002). Parental efficacy: Predictor of parenting behavior and adolescent outcomes. Parenting: Science and Practice, 2(2), 127-150.
Slavin, R. E. (1987). Developmental and motivational perspectives on cooperative learning: A reconciliation. Child development, 1161-1167.
Tomul, E., & Savasci, H. S. (2012). Socioeconomic determinants of academic achievement. Educational Assessment, Evaluation and Accountability, 24(3), 175-187.
Trusty, J. (1999). Effects of eighth-grade parental involvement on late adolescents’
educational expectations. Journal of Research & Development in Education.
Zhang, L.-F. (2001). Perspectives on thinking, learning, and cognitive styles: Routledge.
Zhang, L.-f., Sternberg, R. J., & Rayner, S. (2012). Handbook of intellectual styles: Preferences in cognition, learning, and thinking: Springer Publishing Company.