
An adaptive communications protocol for network computers (extended abstract
17
35 An Adaptive Communications Protocol for Network Computers * Hussein G. Badr Department of Computer Science, State University of New York at Stony Brook, Stony Brook, NY 11794-4400, U.S.A, David Gelernter Department of Computer Science, Yale University, 101 Hillhouse Avenue, New Haven, CT 06520, U.S.A. Sunil Podar Department of Applied Mathematics, State University of New York at Stony Brook, Stony Brook, N Y 11794-3600, U.S.A. Received March 1985 Revised October 1985 We study the performance of a new network communica- tion protocol designed specifically for network computers-col- lections of memory-disjoint computer nodes intended to func- tion as single machines. Staged circuit switching is intended to combine the benefits of circuit switching at low traffic loads with the benefits of message switching at heavy loads, and to serve, in addition, as the basis for communication systems that continually reconfigure the network at runtime of optimize for observed traffic patterns. Our simulation results support our favorable conjectures about the behavior of staged circuit switching. These results, and a saturation analysis, are pre- sented. Keywords: Communication Architecture, Communication Protocol, Network Computer, Reconfigurable Network, Simulation Study. Hussein G. Badr is Assistant Professor of Computer Science at the State Uni- versity of New York at Stony Brook, His undergraduate studies were under- taken at the University of Edinburgh, Edinburgh, Scotland, U.K., with post- graduate studies at the Pennsylvania State University, University Park, Pennsylvania. His research interests include performance modeling and analysis of computer systems, stochas- tic processes and queueing theory, and simulation techniques. * This research was presented at the 1985 ACM SIGMET- R1CS Conference on Measurement and Modeling of Computer Systems, Austin, TX, August 26-29, 1985, and is one of the three SIGMETRICS award papers, which all appear in this issue. North-Holland Performance Evaluation 6 (1986) 35-51 1. Introduction A network computer is a collection of com- puters designed to function as one machine; on a network computer, as opposed to a multi- processor, constituent subcomputers are memory- disjoint and communicate by some form of mes- sage exchange only. Ensemble architectures like multiprocessors and network computers are of growing interest because of their capacity to sup- port parallel programs, where a parallel program is one that is made up of many simultaneously active, communicating processes. Parallel pro- grams should run faster (on an appropriate archi- tecture) than sequential programs, and good speed-ups have been reported in parallel program- ming experiments in several domains, amongst them AI (see, for example, Fehling and Erman [8]), numerical problems (e.g., Logan [13]) and system simulation (e.g., Deutsch and Newton [7]). Both network computers and multiprocessors have been implemented: the BBN Butterfly [17], for example, is a multiprocessor; Bell Labs' S/Net [1], David Gelernter received his Ph.D. in Computer Science from the State Uni- versity of New York at Stony Brook in 1982, and is currently Assistant Pro- fessor in the Department of Computer Science at the Yale University, New Haven, Connecticut. His research in- terests include communication soft- ware, the parallel programming lan- guage LINDA, symmetric programming languages and medical expert systems. Sunil Podar received his B. Tech. de- gree in Mechanical Engineering from the Indian Institute of Technology, New Delhi, India in 1980, the M.S. degree in Operations Research in 1982 and the M.S. degree in Computer Sci- ence in 1985, both from the State Uni- versity of New York at Stony Brook. Presently, he is pursuing the Ph.D. degree in the area of performance evaluation of computer systems. His research interests include computer communication and interconnection networks, communication protocols and performance modeling and analysis of computer systems. 0166-5316/86/$3.50 © 1986, Elsevier Science Publishers B.V. (North-Holland)
Transcript of An adaptive communications protocol for network computers (extended abstract
35
An Adaptive Communications Protocol for Network Computers *
Hussein G. Badr Department of Computer Science, State University of New York at Stony Brook, Stony Brook, NY 11794-4400, U.S.A,
David Gelernter Department of Computer Science, Yale University, 101 Hillhouse Avenue, New Haven, CT 06520, U.S.A.
Sunil Podar Department of Applied Mathematics, State University of New York at Stony Brook, Stony Brook, NY 11794-3600, U.S.A.
Received March 1985 Revised October 1985
We study the performance of a new network communica- tion protocol designed specifically for network computers-col- lections of memory-disjoint computer nodes intended to func- tion as single machines. Staged circuit switching is intended to combine the benefits of circuit switching at low traffic loads with the benefits of message switching at heavy loads, and to serve, in addition, as the basis for communication systems that continually reconfigure the network at runtime of optimize for observed traffic patterns. Our simulation results support our favorable conjectures about the behavior of staged circuit switching. These results, and a saturation analysis, are pre- sented.
Keywords: Communication Architecture, Communication Protocol, Network Computer, Reconfigurable Network, Simulation Study.
Hussein G. Badr is Assistant Professor of Computer Science at the State Uni- versity of New York at Stony Brook, His undergraduate studies were under- taken at the University of Edinburgh, Edinburgh, Scotland, U.K., with post- graduate studies at the Pennsylvania State University, University Park, Pennsylvania. His research interests include performance modeling and analysis of computer systems, stochas- tic processes and queueing theory, and simulation techniques.
* This research was presented at the 1985 ACM SIGMET- R1CS Conference on Measurement and Modeling of Computer Systems, Austin, TX, August 26-29, 1985, and is one of the three SIGMETRICS award papers, which all appear in this issue.
North-Holland Performance Evaluation 6 (1986) 35-51
1. Introduction
A network computer is a collection of com- puters designed to function as one machine; on a network computer, as opposed to a multi- processor, constituent subcomputers are memory- disjoint and communicate by some form of mes- sage exchange only. Ensemble architectures like multiprocessors and network computers are of growing interest because of their capacity to sup- port parallel programs, where a parallel program is one that is made up of many simultaneously active, communicating processes. Parallel pro- grams should run faster (on an appropriate archi- tecture) than sequential programs, and good speed-ups have been reported in parallel program- ming experiments in several domains, amongst them AI (see, for example, Fehling and Erman [8]), numerical problems (e.g., Logan [13]) and system simulation (e.g., Deutsch and Newton [7]). Both network computers and multiprocessors have been implemented: the BBN Butterfly [17], for example, is a multiprocessor; Bell Labs' S/Net [1],
David Gelernter received his Ph.D. in Computer Science from the State Uni- versity of New York at Stony Brook in 1982, and is currently Assistant Pro- fessor in the Department of Computer Science at the Yale University, New Haven, Connecticut. His research in- terests include communication soft- ware, the parallel programming lan- guage LINDA, symmetric programming languages and medical expert systems.
Sunil Podar received his B. Tech. de- gree in Mechanical Engineering from the Indian Institute of Technology, New Delhi, India in 1980, the M.S. degree in Operations Research in 1982 and the M.S. degree in Computer Sci- ence in 1985, both from the State Uni- versity of New York at Stony Brook. Presently, he is pursuing the Ph.D. degree in the area of performance evaluation of computer systems. His research interests include computer communication and interconnection
networks, communication protocols and performance modeling and analysis of computer systems.
0166-5316/86/$3.50 © 1986, Elsevier Science Publishers B.V. (North-Holland)
36 H.G. Badr et al. / A n adaptive communications protocol
the Caltech Cosmic Cube [18] and the Inmos Transputer Network [5,9,10] are network com- puters. Both architectural classes are subjects of ongoing research.
Multiprocessors and network computers each have their advantages, summarized by Seitz [18, p. 23]:
"Message-passing machines (network com- puters) are simpler and more economical than shared-storage machines; the greater the number of processors, the greater this advantage. How- ever, the more tightly coupled shared-storage machine is more versatile, since it is able to support code and data sharing ( . . . ) We conjec- ture that shared-storage organizations will be preferred for systems with tens of processors, and message-passing organizations for systems with hundreds or thousands of processing nodes. Hybrid forms ... may well prove to be the most attractive option for systems having intermediate numbers of processors."
Our topic here is network computers; we are particularly interested in networks that range from several hundred nodes large to several thousand.
Network computers may be organized in either of two basic ways: their nodes may communicate over a shared bus or series of buses (as in S/Net), or over point-to-point links (as in Cosmic Cube and the Transputer Network). Both classes, again, are of interest and are topics of current investiga- tion. The work presented here deals with the point-to-point class, the elements of which we shall refer to as 'linked networks'.
Linked networks face a fundamental communi- cation problem. Unless they are completely con- nected (which is rarely possible), two communicat- ing nodes will not necessarily be connected by a single link. Messages between nodes must there- fore, in general, travel over several links and be processed by several intermediate nodes. Com- munication delays increase with the length of the traveled path; network computer designers there- fore provide networks whose diameters are small relative to their size, and network operating sys- tems will place communicating processes as close to each other as possible. Distant nodes must nonetheless be allowed to communicate through the network. Existing linked networks generally provide a store-and-forward protocol for this pur- pose: intermediate nodes accept and buffer arriv- ing messages (or fixed-length packets), and queue them for eventual output over an appropriate
next-link. This protocol was suggested by com- munication practices over geographically distrib- uted networks; the ARPA network, for example, uses a store-and-forward protocol [11]. On long- haul networks, though, communication links are slow, expensive and relatively sparse. On network computers, the opposite, generally speaking, should be true. We therefore discuss, in the follow- ing, a communication protocol for linked net- works that was designed specifically for network computers. Our early simulation results suggest that this new protocol may perform better on network computers than conventional long-haul protocols. In Section 2 we describe the protocol, and in Section 3 we discuss our simulation experi- ments. Section 4 presents conclusions.
2. Staged circuit switching
Staged circuit switching [2,3,4] is a communica- tion protocol that combines aspects of store-and- forwarding (or 'message switching', MS for short) with aspects of circuit switching (or CS), where circuit switching refers to a class of protocols in which a communicating source and destination first construct a dedicated path or circuit between them, then communicate directly over this path. The path may be a physical connection, as in space-switched circuit-switching, or a series of dedicated slots in time-division multiplexing switches, as in time-switching protocols. The staged-circuit-switching design encompasses both the protocol itself and a communication architec- ture to support it. This architecture may be imple- mented in many ways; we are interested only in its logical characteristics. Below, we first describe the protocol, and then the architecture.
2.1. The staged circuit switching protocol
In staged circuit switching (or SCS), each mes- sage constructs for itself the longest possible physical circuit without waiting for links. When a message is to be sent, a header that records the message's source and destination is sent propagat- ing through the network towards the destination node; the header seizes each free link along its path and incorporates it into a growing circuit. When it meets a busy link, or arrives at its destination, circuit-building stops, the message's
1-1. G. Badr et aL / An adaptive communications protocol 37
data portion is transmitted and acknowledged over the existing circuit, a nd the circuit is released. A message that is not arrived at its destination then gathers itself together and plunges onward in the same fashion. In an empty network then, SCS is the same as circuit switching: each message is transmitted over a direct circuit from source to destination. In a heavily loaded network, SCS is the same as store-and-forwarding: each next-link is busy, each circuit is therefore only one link long, and the message proceeds hop by hop.
The protocol is designed to provide the benefits of circuit switching without the risks. When net- work load is light (and messages are not too short for circuit-building to be worthwhile), circuit switching is faster than message switching because a message's data portion uses all the links along its path simultaneously, instead of serially. But cir- cuit switching degrades rapidly as load increases: a circuit that is blocked by a busy link must either abort and be retried later ( 'retry-mode' CS), or must hold is existing links inactive until it can be completed ( 'hold-mode' CS). Message switching, accordingly, performs much better under heavy load.
The SCS protocol is intended to behave like circuit switching under light loads and adapt itself into message switching under heavy ones. When an SCS network is lightly loaded, the probability of building complete source-to-destination circuits is high. In building circuits the protocol effectively seize idle capacity and converts it into lower net- work delays. However, as network traffic increases headers would be blocked earlier, yielding accord- ingly shorter circuits, and SCS should degrade gracefully into message switching instead of de- teriorating catastrophically the way circuit switch- ing does. Our simulation results to date support these conjectures.
2.2. The SCS architecture
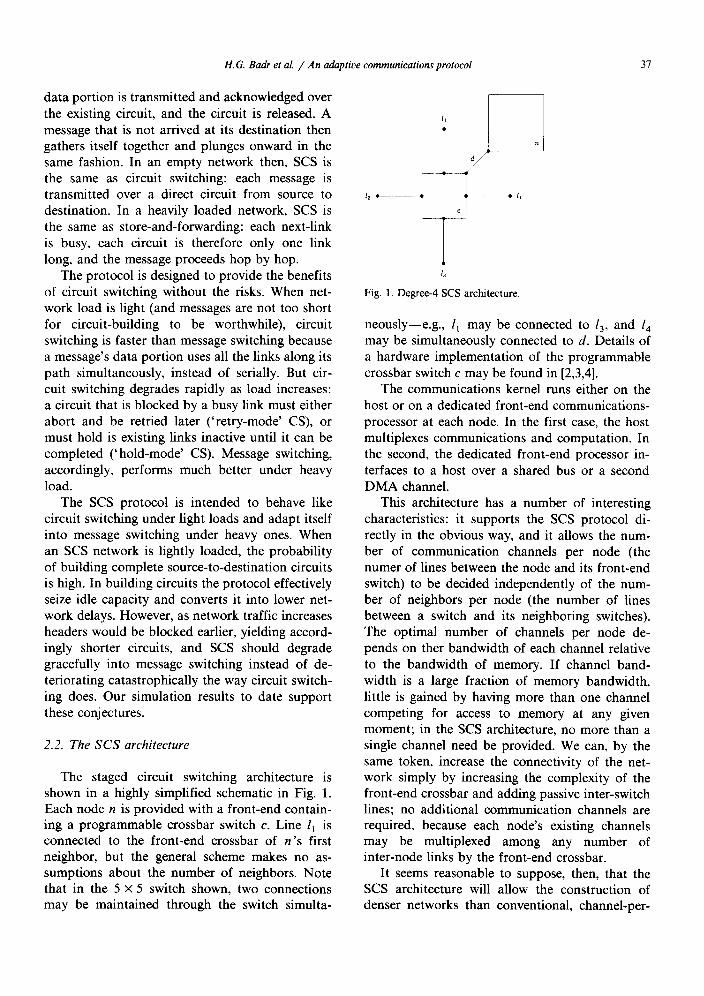
The staged circuit switching architecture is shown in a highly simplified schematic in Fig. 1. Each node n is provided with a front-end contain- ing a programmable crossbar switch c. Line /1 is connected to the front-end crossbar of n 's first neighbor, but the general scheme makes no as- sumptions about the number of neighbors. Note that in the 5 x 5 switch shown, two connections may be maintained through the switch simulta-
T d//
n
13
Fig. 1. Degree-4 SCS architecture.
neously--e.g., l~ may be connected t o 13, and l 4 may be simultaneously connected to d. Details of a hardware implementation of the programmable crossbar switch c may be found in [2,3,4].
The communications kernel runs either on the host or on a dedicated front-end communications- processor at each node. In the first case, the host multiplexes communications and computation. In the second, the dedicated front-end processor in- terfaces to a host over a shared bus or a second DMA channel.
This architecture has a number of interesting characteristics: it supports the SCS protocol di- rectly in the obvious way, and it allows the num- ber of communication channels per node (the numer of lines between the node and its front-end switch) to be decided independently of the num- ber of neighbors per node (the number of lines between a switch and its neighboring switches). The optimal number of channels per node de- pends on ther bandwidth of each channel relative to the bandwidth of memory. If channel band- width is a large fraction of memory bandwidth, little is gained by having more than one channel competing for access to memory at any given moment; in the SCS architecture, no more than a single channel need be provided. We can, by the same token, increase the connectivity of the net- work simply by increasing the complexity of the front-end crossbar and adding passive inter-switch lines; no additional communication channels are required, because each node's existing channels may be multiplexed among any number of inter-node links by the front-end crossbar.
It seems reasonable to suppose, then, that the SCS architecture will allow the construction of denser networks than conventional, channel-per-

38 H.G. Badr et al. / An adaptive communications protocol
neighbor architectures permit, and densely-con- nected network graphs are desirable in network computers for several reasons. Dense networks maximize available communications capacity and minimize network diameter. The SCS protocol itself provides further incentive for highly-con- nected topologies: on a sufficiently dense network, the communications kernel might make use of the SCS crossbar switches as a 'distributed communi- cation cache'. In this case, every switch connection is left in place until the two links it joins are expressly required for some other circuit. A cache hit corresponds to a randomly-distributed source and destination finding each other adjacent. Self- configuring SCS networks are a major topic for future work.
3. S i m u l a t i o n m o d e l a n d r e s u l t s
The three protocols, MS, CS, and SCS, were investigated using a sophisticated simulation model which implemented a uniform environment for all three. The model creates a network computer of N homogeneous 'nodes' configured in a torus topol- ogy (i.e., a regular v ~ X ~ square grid with wrap-around at the ends; a torus of 16 nodes is shown in Fig. 2. By 'node' we hereafter mean a complex consisting of a host processor for compu- tation work and the generation of messages, and a MC68000-type dedicated front-end communica- tions-processor connected to the host by means of a DMA link. It should be noted that, in our simulations, the units of exchange over this link
. - . . . .
i
i i
i f
Fig. 2. Torus of 16 nodes.
i
i i
' I i
_)
are fixed-size packets rather than variable-sized messages. In terms of the ISO Reference Model [19] the simulator implements the communication- subnet protocol layers (viz. the network, data-link, and physical layers). Decomposition of messages into packets, and their subsequent recomposition, are functions of higher layers which fall outside the focus of our attention. They are assumed to be undertaken by the host processors which are simulated only to the extent of generating source packets for delivery to, and accepting arrived de- stination-packets from, their front-ends. No at- tempt is made to model the 'bulk' generation of packets due to message decomposition. A host generates individual packets according to a Pois- son distribution at rate X which is uniform across all nodes. Each packets is individually assigned a destination node. As such, MS should hereafter be understood to refer to pure store-and-forward packet-, rather than message-, switching.
For the CS and SCS protocols, the front-end communication-processor is further linked to a (programmable) crossbar switch. In this case then, we may view n in Fig. 1 as the front-end com- munication-processor and c as the switch with links l 1, l 2, 13, and l 4 tO the corresponding switches of its four neighboring nodes, the host processor itself not appearing in the figure. Each link lj consists of a serial data line and a control line. It should be noted that the link d between front-end and switch was implemented as a software-driven serial link and not a DMA link. Indeed, with the single exception of the DMA link between a host and its front-end, all communications in our model are software driven. For MS, n in Fig. 1 would represent the host processor and c the front-end processor, with serial links to the corresponding front-ends of the four neighboring nodes; d would be the DMA link between host and front-end.
3.1. Analysis of the topology
The toroidal topology was chosen for its regu- larity, multiplicity of paths and large communica- tion capacity. While a three dimensional torus processes excellent performance characteristics, we preferred a two-dimensional structure for its in- herent simplicity. We refer the reader to [15] for a detailed comparison of performance under various topologies.
For any source in a two-dimensional, N-node

H.G. Badr et al. / An adaptive communications protocol 39
torus, consider a node i rows and j columns away. The multiplicity of just the minimal-distance paths between the two nodes is as follows, assum- ing 7~- even:
( i j j ) forO<i+j<½¢~,O<~j<½v~,
2 for lv/-N< i + j < v ~ -, j=½v/N or
i=½ ,
4 for i + j = vCN, j = ½v~-.
The longest minimal path-distance is v~-, the diameter of the torus; there is just one node that distant from a source. Thus, the growth rate of the diameter is O(v/-N-). For v~- odd, the situation is slightly less advantageous:
(i/) for 0 < i + j < v ~ - - 1,
0 ~<j < ½(v~-- 1),
4 for i + j = V~- - 1, i = j = ½ (v/-N - - 1).
The diameter is now v ~ - 1, with four nodes that distant from a source. The growth rate of the diameter is, of course, still O(v/N-).
As mentioned above, a newly-generated packet gets assigned a destination node randomly, i.e., the distribution of destination addresses from a given source--excepting, of course, the source ad- dress itself--is uniform. The loose degree of local- ity imposed by such a distribution permits us to investigate the performance boundaries of the communication subnetwork under general, de- manding, but not unrealistic, assumptions regard-
ing the nature of traffic patterns in a distributed computing environment [16].
Shortest-path routing is used. The number of nodes at a given distance from a fixed source, along shortest-paths, is distributed as shown in Table 1. It is then straightforward to calculate that, if all other nodes are uniformly addressed from the fixed source, the mean number of source- to-destination hops for packets generated at the source is given by
N 3 / 2 hE ho= ¢
2 ( N - 1 ) '
where /~E and h o are the mean values for ~ - even and odd, respectively. From this we may derive the following result. For packets at any point along shortest-path routes to their destina- tions, the mean number of possible directions for the next hop is given by
2N 2v~- de ( N - l ) ' d° v/N-+I '
where dE and do are the mean values for v/N even and odd, respectively.
The simulation results we shall present are for a torus of 1024 nodes (32 x 32). For N = 1024, the combination of uniform address-assignment and shortest-path routing yields the relative frequency distribution of source-to-destination distances shown in Fig. 3, in which the ordinate is expressed as a percentage. The distribution is symmetric about the value 16 for the range of hop values 1 ~< h ~< 31, peaking at h = 16 for a value of 6.06%, with a small 'tail' at h = 32 of value 0.1%. The mean number of hops, hE, is 16.0156, and the coefficient of variation (the ratio of the standard deviation to the mean) is given by 0.4084. The
Table 1 The number of nodes at a given distance from a fixed source (h is the distance in hops, and n is the number of nodes h hops away (along shortest-paths))
ON even v ~ o d d
h n h n
I ~< h < 12t/N 4h I~ h < 12(V~-I) 4h
h =~2Vrfi 4h - 2
~2t/N ~< h < t/N 4(V~ - h) 12(~/N - I) ~< h 4(t/N - h)
~<V~-I h = N 1
8
c i y
½ ~ 6 8 l~l i'2 i~ 116 1'8 2'0 2'2 2'4 2'6 2'8 3'0 312
Number of Hops
Fig. 3. Packet source-to-destination distances.
40 H.G. Badr et al. / An adaptive communications protocol
mean number of possible directions for the next hop, d E, is 2.00196.
3.2. Implementat ion
A packet, when generated, will be delivered burst mode by the host over the DMA link to the front-end, if the latter is free. Should it be busy, the packet is buffer internally at the host for later pick up by the front-end at a suitable moment of its choosing. In the former case, once the DMA transfer is completed, the front-end immediately proceeds to analyze the packet header and process the packet for routing and onward transmission. The header consists of six bytes, two each for the source and destination addresses, and two other for miscellaneous control information. Using effi- cient routing tables that enable it to determine all possible shortest-path directions in constant time, the front-end communications-kernel sweeps these directions in turn. For each direction, the kernel attempts to seize the appropriate link l j, if it is not in use. Once the link is appropriated, a hand-shak- ing protocol with the neighboring communica- tions-kernel k j on that link is initiated. A response is expected from ks. within a short timeout, in the absence of which kj is assumed to be unavailable and the sweep continues onto the next eligible direction, if there is one. As noted above, our protocols are software-driven. In MS, where all packet transmissions occur over a single hop at a time under direct kernel control, all links must necessarily be available to a kernel during its sweep; checking for link availability is, therefore, not implemented.
In MS, once the hand-shaking protocol is established with a k j, the entire packet, header and data portion, is transmitted to the neighbor- ing front-end. In CS and SCS, only the header is forwarded. In either case, ks analyzes the header when transmission is completed. If the packe t / header requires onward transmission, a directions- sweeping cycle, similar to the one described above, is initiated. For CS and SCS, if the sweep is successful, the header is sent on, after which kj has the crossbar switch link the data and control lines over which the header had initially arrived, to the ones over which it was propagated onwards, establishing a direct through-circuit from which the front-end is cut out (except that the front-end continues to monitor the control lines of all its
links on a latched-interrupt basis) and permitting it to undertake other duties. For MS, the entire packet is sent on, as previously described. After a successful transmission, kj enters the 'cleanup' subcycle described below.
In SCS, whenever a directions-sweep on behalf of a header fails, the control lines of the existing circuit over which it arrived are used to request transmission of the data portion, upon the receipt of which the control lines are used again, this time to effectuate a breakdown of the circuit and free its links. In CS the lines are used immediately to notify the node at the origin of the circuit (always the source node in this case) of failure and to break the circuit down. The header is discarded and the source attempts a retransmission of the packet after an appropriate delay ( 'retry-mode' cs).
For a packet /header that is found, upon re- ceipt, to have reached its destination, MS will immediately deliver the packet to the host, burst mode over the DMA link. SCS and CS will first arrange for transmission of the data portion, in the manner described above for SCS, and then deliver the reconstituted packet to the host.
A directions-sweep which fails will cause the data portion of a packet to be rejoined with its header in SCS, as explained above, if the two happen to be at different nodes. Thereafter, both MS and SCS handle the 'failed' packet in the following fashion. The packet is queued (if need be; as will be seen, it might already be queued). The kernel enters a 'cleanup' subcycle during which it examines its queue, in a round-robin fashion, for a packet to transmit. If no ap- propriate candidate is found, the host is polled for a packet off its queue which, if present, is de- livered to the front-end over the DMA link and is thereupon treated as for a newly-generated packet that finds the front-end free.
The kernel keeps track, at all times, of the link directions attempted for transmission, regardless of the success or failure of the attempts. Once all four directions are tried, the cycles of 'attempt-a- send' / 'c leanup' are terminated. The kernel will then schedule itself to initiate a fresh 'cleanup' subcycle after a predetermined delay and enter a receptive mode in which it is free to accept packets/headers from neighboring nodes or from its hosts (this entry into a receptive mode will also occur when a received packet has the node for
H.G. Badr et al. / An adaptive communications protocol 41
destination and is delivered to the host). A self- scheduled 'cleanup' that finds the kernel busy is ignored.
Finally, some flow control was also imple- mented. The communications kernels refuse re- ceipt of packets/headers from neighboring kernels (in MS and SCS), or from the hosts, if availability of queueing buffer-space cannot be assured; queueing will be required if onward transmission is not immediately achievable. Thus, no loss of packets due to buffer overflow occurs and all packets accepted into the communications net from the hosts are guaranteed eventual delivery.
As there is no existing hardware system against which we could calibrate our simulator, a signifi- cant amount of care and painstaking detail went into the simulator implementation, from the ran- dom-number generators upwards. Much effort was devoted in trying to ensure that it was as accurate as is reasonably possible. MC68000 assembly code was written to implement the routing table schemes, directions-sweeping, hardware-linked buffering and hand-shaking protocols, DMA transfers, queue manipulations, header processing,
and so on. The delays driving our events were abstracted from this code, as well as from details of DMA designs and protocols, serial/parallel links, etc. The atomic event-units built into the simulator were kept at a fine level of granularity in an effort to capture as much of the dynamics of interaction between asynchronous events as possi- ble, closely emulating those one would expect to see in the real system. The full details of the implementation may be found in [14].
It should be mentioned, though, that our aims in undertaking this simulation study were, prim- arily, to put our conjectures concerning the viabil- ity of SCS to the test, and to study its basic characteristics in relation to other point-to-point protocols. It was not our intention to produce a finished product that would be immediately im- plementable. Our simulation model consequently sets aside several important capabilities that all working protocols must uniformly share, e.g., de- tection of downed nodes, routing around such nodes should they lie along a unique shortest path, error checking and retransmission, and so on.
150
135
120
N
m 105 a I i ~ 90 d
L 75 i f e t i 6o m s
45
30
15
a
® ................ ® .......... @.... ,@... • .@ ....... .@-[.@@~
L ~ -- 7. - ~ ' ~ "81~1
100 I I I I i I I I I I 1 8 0 0 6 0 0 4 0 0 2 0 0 0
Interarrival Times (msec.)
N o
~t l i $ e d
50
45
40
35
30
25
20-
15
10
5
........'@"
@ ............. @ ............. @...
@
!
0 0 : I i i I i I i I l0 800 600 400 200
Interarrival Times (msec.)
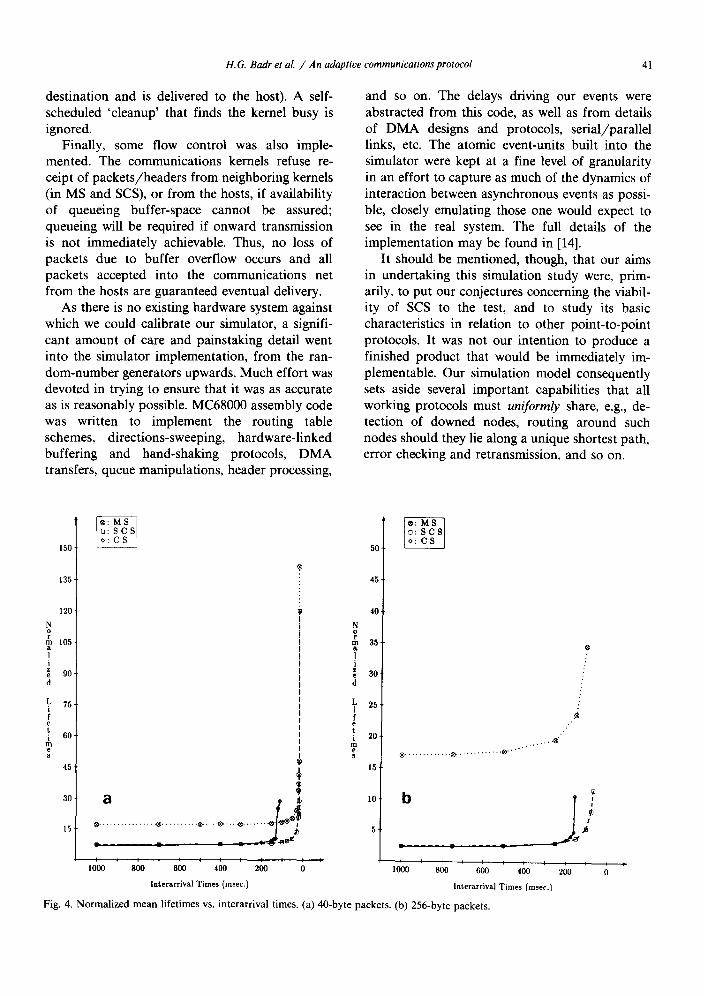
Fig. 4. N o r m a l i z e d m e a n l i fe t imes vs. i n t e ra r r iva l t imes. (a) 40 -by t e packe t s . (b) 256-by te packe t s .
0
42 H.G. Badr et al. / A n adaptive communications protocol
3.3. Results and discussion
The simulations were run using the indepen- dent replications method [12]. Most runs were for a duration of 20 000 packets arriving at their de- stination nodes; the results we present come from sampling the last 5000 of these. Pilot studies showed the system apparently quite stable by the time the first 15000 arrivals occurred (except at very heavy loads).
Two classes of fixed-size packets were imple- mented: 40 bytes and 256 bytes, inclusive of the 6-byte header. All packets in a given, individual run were of the same size, not a mixture from the two classes. Similarly, a single run implemented a single protocol. While many aspects of the simu- lated network's behavior were monitored and stat- istically analyzed, we shall only attempt to present some of the more salient features of the results recorded.
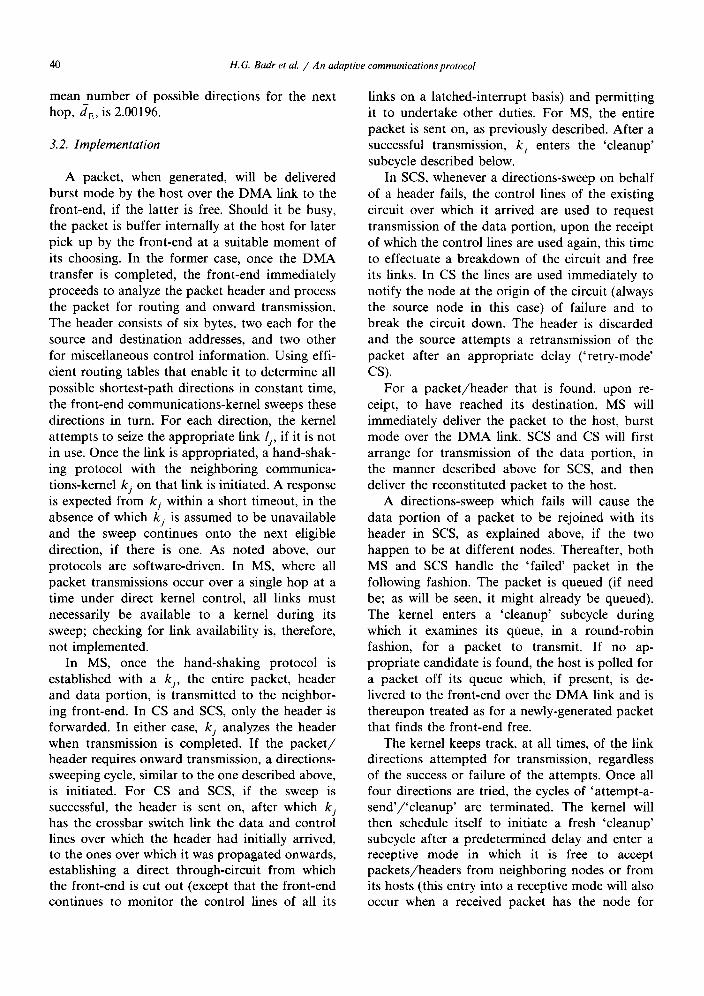
The means of the packets' source-to-destination lifetimes (i.e., from generation time at the source host, till delivery-completion time at the destina- tion host) are given in Fig. 4(a), (b), for the 40-byte and 256-byte packets, respectively. The abcissae represent 1/2~, the mean packet inter- generation times for each host (or 'interarrival' times, where an arrival is the 'birth ' of a packet at a host). The ordinates yield the mean lifetimes in a normalized form for ease of interpretation. The normalization constants chosen were the times, under the MS protocol, that a packet would expe- rience from the moment of its receipt-completion at a front-end, and assuming it requires onward transmission, till the next such moment at a neighboring front-end (one hop away) in a com- pletely empty system in which all resources are available to the packet immediately on demand. Their values are 291 ~tsec for 40-byte, and 1643 ~sec for 256-byte, packets. These constants do not include the DMA transfer times between front- ends and hosts at source and destination nodes (a
Table 2 Normalized mean lifetimes at light loads (,~ values)
40-byte packets 256-byte packets
1/?~ = oo 1000 msec oo 1000 msec
MS 16.30 16.88 units 16.21 17.02 units SCS 6.53 7.35 2.13 2.45 CS 6.53 7.06 2.13 2.38
total of 82 ~sec and 324 ~tsec, respectively). The units of the ordinates may thus be adequately, though somewhat verbosely, described as 'mini- mal-time MS hop-equivalent's, hereafter denoted 71. This normalization scheme has several ad- vantages: it permits us to express the mean life- times in a time-independent fashion; it highlights a comparative view of the dynamics of the three protocols, rather than the raw, technology-depen- dent delay times (though, of course, even relative performance cannot be fully characterized inde- pendently of implementation); and it permits us to abstract the effects of congestion, and the gains achievable by not having to buffer packet data- portions at each intermediate node in SCS and CS, in a straightforward manner.
• Table 2 tabulates the normalized mean life- times at light system loads. The entries under 1 / ~ = oo are for an empty system and take account of the DMA times at source and destination nodes, as do all our mean lifetimes. Thus, while the mean number of source-to-destination hops for a packet is 16.0156, for MS in an empty system the normal- ized mean lifetime is 16.30h. For CS and SCS, values are higher for 40-byte packets than for 256-byte ones because the 6-byte header, which must be buffered and analyzed at each inter- mediate node in transit, forms a large proportion of total packet size for shorter packets than for longer ones. The relative gains achieved over MS by not buffering the data portions at all inter- mediate nodes are consequently smaller.
Fig. 4 shows that SCS achieves all the advantages of CS for light and moderate loads. Its characteristics are load increases are of special interest. The heavy-load portions of Fig. 4 are shown to larger abcissae scales in Fig. 5. As load increases, CS suffers a sudden, catastrophic breakdown. SCS, on the other hand, degrades gracefully into MS behavior, as intended, ap- proaching the MS values from below. Even for small values of 1/X when the system is near saturation, SCS continues to significantly outper- form MS. For the 256-byte packets, for example, the situation is as follows. CS suffers its break- down around 1 /~ = 150 msec, while SCS and MS seem to have saturated for values of 1/?~ ap- proaching 50 msec; in the range 75 < 1/?~ ~ 150, SCS outperforms MS by a factor of 6 or more; for 1/2~ = 75 msec, the normalized mean-lifetime val- ues for SCS are an order of magnitude better than
H.G. Badr et al. / An adaptive communications protocol 43
t0 !
60-
r 50- m a
1
40-
L "
30- e t i
m e s
20 ~
1 0
: S C S / : C B ~
a
. . @ :
.@. - ...®" i ® . . . . . . . . . . . . . . . . . . . . . . . . . . . . . . . . . . ® . . . . . . . . . . @, ," "~
45 ̧
40'
N 35' o
m ~ &
1 30. i s e d
25 .
L i f 20- e t i m s e 15-
10-
b
@ . . . . . . . . . . . . . . . . .
i i i i i i i i i i 510 i i i 1 300 250 200 1 5 0 1 0 0 0 400
I n t e r a r r i v a l T i m e s (msec.)
D
I I
500
f
.®
. . . . . . . . . . . @"
A /
~g s
I i I i I i
300 200 1 0 0
I n t e r a r r i v a l T i m e s (msec. )
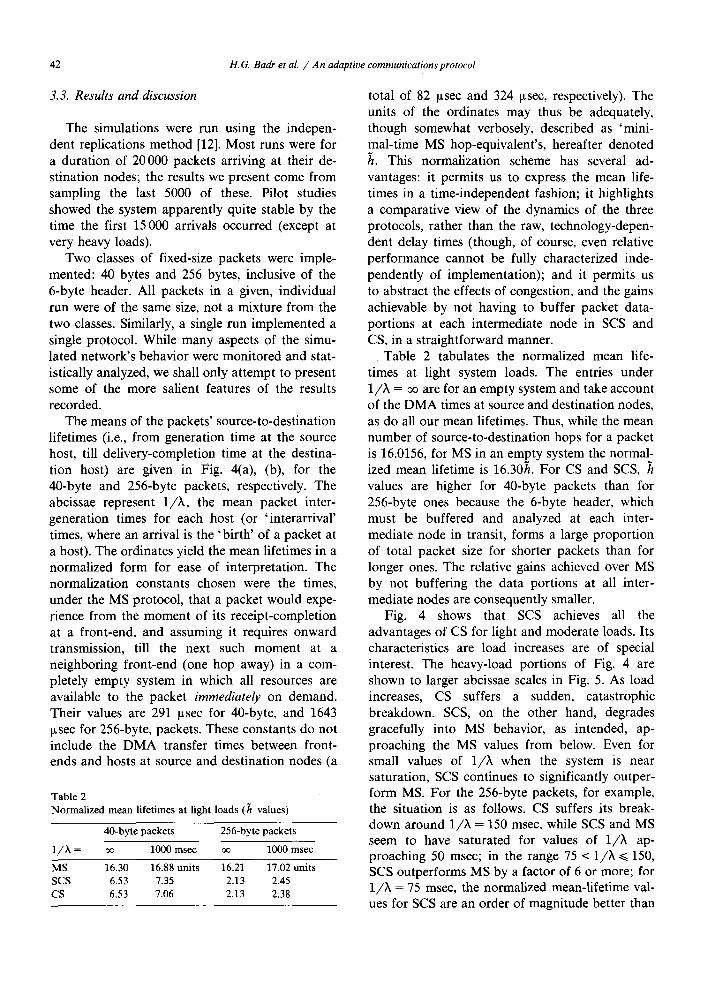
Fig. 5. N o r m a l i z e d m e a n l i f e t i m e s vs. in terarr iva l t imes . (a ) 4 0 - b y t e p a c k e t s . (b) 2 5 6 - b y t e p a c k e t s .
s
0
those for MS (8.39h vs. 75.12h); furthermore, SCS is still performing better than MS would in a completely empty system! (The MS value for 1 / k = 75 msec is not shown in either Fig. 4(b) or Fig. 5(b), being too large to fit to scale without exces- sive compression of the lower parts of the graphs. There is a value of 92.74h for SCS at 1 /X = 50 msec which is also not shown in these figures.)
Even for small packets, the disparities in perfor- mance between MS and SCS are worth noticing: CS breaks down for values of 1/X approaching 100 msec, while SCS and MS saturate as the mean intergeneration intervals decrease to 15 msec; for the range 15 < 1 / k ~< 100, SCS is outperforming MS by factors of between 1.65 and 2.1. Virtually, all our mean lifetime results, with the notable
95 o @ 95 % 9 % 9
C 8 C 8
g ,0 o r 7 a ~ t 7 b i ® i d 6 d 6
n o c c e 5 e 5
o I 4 o o I 4 ° o n ® n o o t o t e o [3
o ¢ o ®
o o o s o o o @ 0 @ o @ @
1 1 ® ® @ @ ® ® o
I I I I I I i I l I I == I I I I I I I l I I
I000 800 600 400 200 0 I000 800 600 400 200
Interarrival Times (msec.) [nter&rrivM Times (msec.)
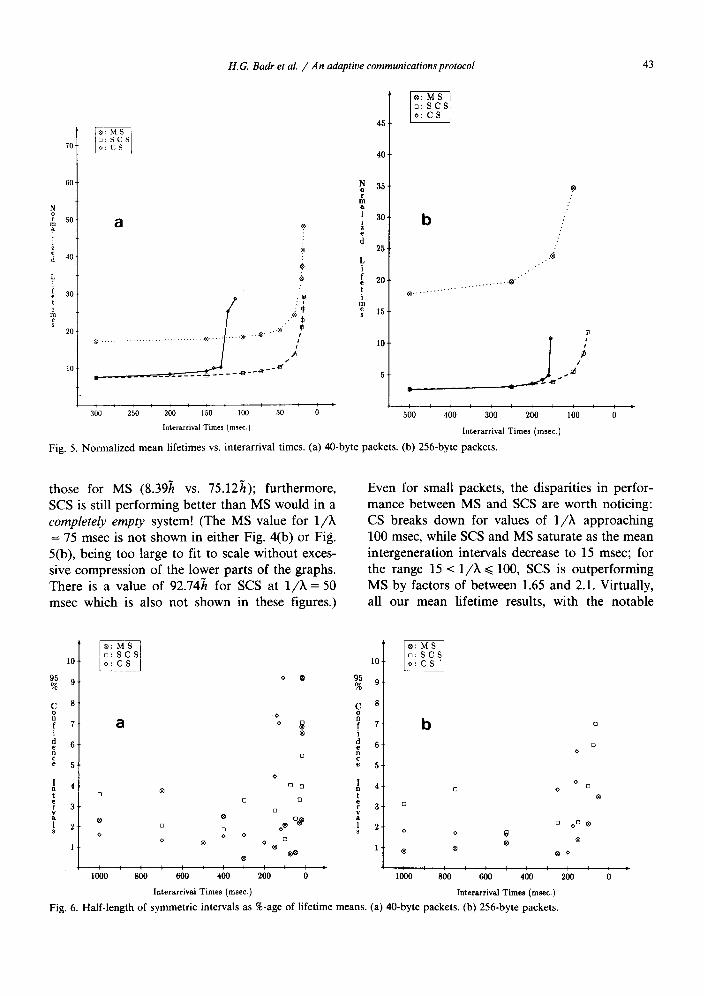
Fig. 6. Half-length of symmetric intcrvals as %-age of lifetime means. (a) 40-byte packets. (b) 256-byte packets.
o
o o
44 H.G. Badr et al. / An adaptive communications protocol
1.75
1.50
1.35 C O e
f 1.20 f i C
i 1.05
t
0.90
V 0.75 & r
i 0.60
i O n
0.45 ~
0.30"
0 .15 a
10100 i
O
O
O
0
0
®
®
7 oOO
o V o &
r
0 t
o ® n
I I I I I I I I I P
800 600 400 200 0
InterarrivM Times (msec.)
1.75
1.50
1.35
1.20
1.05 o
0.90 o
0.75
0.601
0.45 i ®
0.30-
0.15- b
lOlO0 I
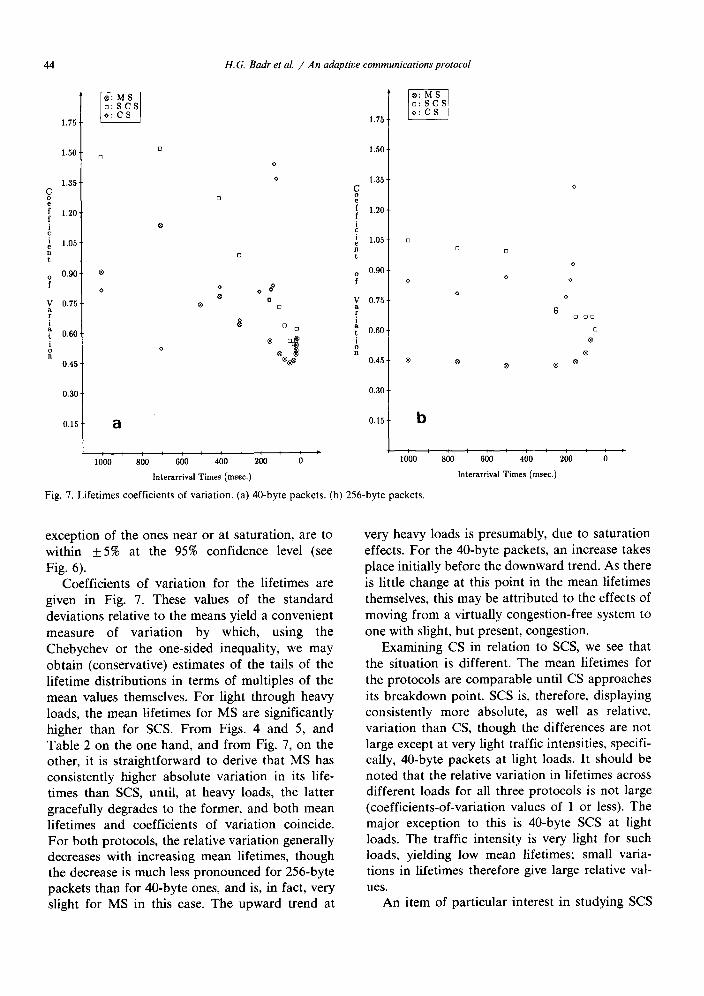
F ig . 7. L i f e t i m e s c o e f f i c i e n t s o f v a r i a t i o n . (a) 4 0 - b y t e p a c k e t s . (b) 2 5 6 - b y t e p a c k e t s .
800
o D
O
O O
O O
® ®
0 0 o
0
®
®
®
I I I ~ I I I I P
600 400 200 0
Interarrival Times (msec.)
exception of the ones near or at saturation, are to within +5% at the 95% confidence level (see Fig. 6).
Coefficients of variation for the lifetimes are given in Fig. 7. These values of the standard deviations relative to the means yield a convenient measure of variation by which, using the Chebychev or the one-sided inequality, we may obtain (conservative) estimates of the tails of the lifetime distributions in terms of multiples of the mean values themselves. For light through heavy loads, the mean lifetimes for MS are significantly higher than for SCS. From Figs. 4 and 5, and Table 2 on the one hand, and from Fig. 7, on the other, it is straightforward to derive that MS has consistently higher absolute variation in its life- times than SCS, until, at heavy loads, the latter gracefully degrades to the former, and both mean lifetimes and coefficients of variation coincide. For both protocols, the relative variation generally decreases with increasing mean lifetimes, though the decrease is much less pronounced for 256-byte packets than for 40-byte ones, and is, in fact, very slight for MS in this case. The upward trend at
very heavy loads is presumably, due to saturation effects. For the 40-byte packets, an increase takes place initially before the downward trend. As there is little change at this point in the mean lifetimes themselves, this may be attributed to the effects of moving from a virtually congestion-free system to one with slight, but present, congestion.
Examining CS in relation to SCS, we see that the situation is different. The mean lifetimes for the protocols are comparable until CS approaches its breakdown point. SCS is, therefore, displaying consistently more absolute, as well as relative, variation than CS, though the differences are not large except at very light traffic intensities, specifi- cally, 40-byte packets at light loads. It should be noted that the relative variation in lifetimes across different loads for all three protocols is not large (coefficients-of-variation values of 1 or less). The major exception to this is 40-byte SCS at light loads. The traffic intensity is very light for such loads, yielding low mean lifetimes; small varia- tions in lifetimes therefore give large relative val- ues.
An item of particular interest in studying SCS
H.G. Badr et al. / An adaptive communications protocol 45
M e n
o : 40-byte packets ] * 256-byte packets]
2 0
18
16
14
12
10
8
6
4
2
10100
C i r c u
i t
L e n g t h
I I I I I I I I I
800 600 400 200 0
Interarrival Times (msec.)
F i g . 8. S C S : m e a n c i r c u i t l eng th .
1.0-
C o 0.9. f f 0.8- i
¢
i 0.7- e n
t 0.6-
0.5-
V 0.4-
i 0.3- a
t i 0.2- o
0.1-
o : 40-byte packets * : 256-byte packets
* " S "fi"
I 0 ~ I I I I I I
10 0 800 600 400
lnterarrival Times (msec.)
F i g . 9. S C S - c i r c u i t s c o e f f i c i e n t s - o f - v a r i a t i o n .
200 0
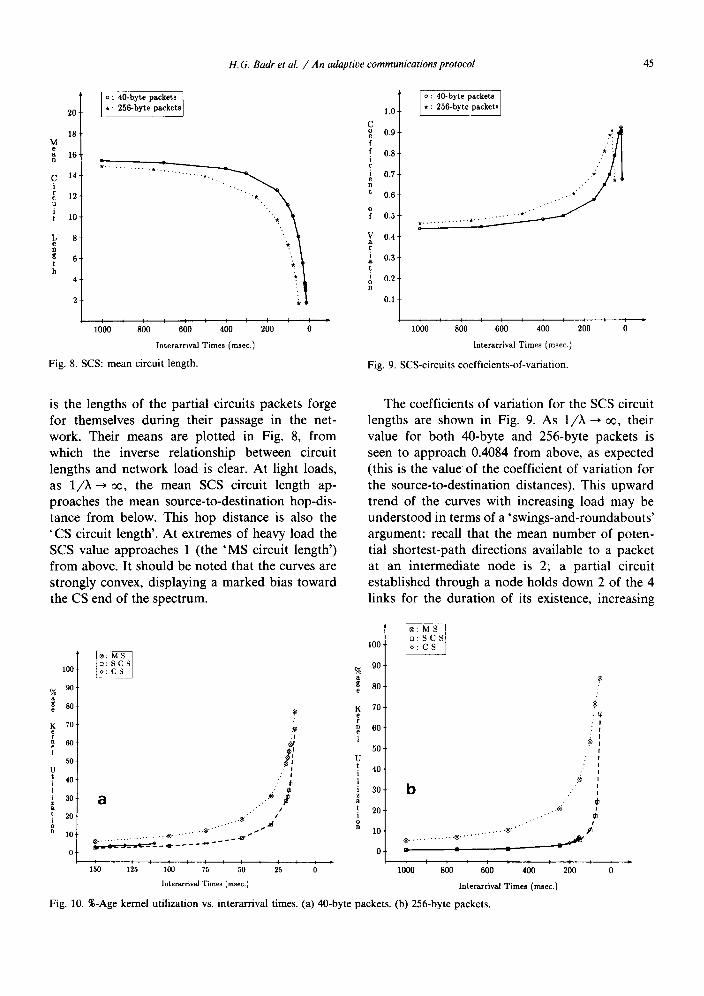
is the lengths of the partial circuits packets forge for themselves during their passage in the net- work. Their means are plotted in Fig. 8, from which the inverse relationship between circuit lengths and network load is clear. At light loads, as 1/X--> o0, the mean SCS circuit length ap- proaches the mean source-to-destination hop-dis- tance from below. This hop distance is also the 'CS circuit length'. At extremes of heavy load the SCS value approaches 1 (the 'MS circuit length') from above. It should be noted that the curves are strongly convex, displaying a marked bias toward the CS end of the spectrum.
The coefficients of variation for the SCS circuit lengths are shown in Fig. 9. As 1/X ~ oo, their value for both 40-byte and 256-byte packets is seen to approach 0.4084 from above, as expected (this is the value of the coefficient of variation for the source-to-destination distances). This upward trend of the curves with increasing load may be understood in terms of a 'swings-and-roundabouts' argument: recall that the mean number of poten- tial shortest-path directions available to a packet at an intermediate node is 2; a partial circuit established through a node holds down 2 of the 4 links for the duration of its existence, increasing
100
% 90.
80. e
K 70-
n 60- T
50- U t 40- i I i 30-
t 20 ~ i o n 10
a
. . . . . "
. . . . . . . . . . . . . . . . . ® . . . . . . . . . . ®" •
P I ~ I I I 715 b I 0 IS0 125 100 5
? :1
~t
. ' I ¢
• '" ®
. " /
25 0
Interarrival Times (msec.)
100
90 % ~ 80 e
K 70 e r n 60 1
50 U t 40 i l i 30 I
t 20 i
10
sl ~ S s J
b . . . . ~
0 I I I I t I I I q 10 0 800 600 400 200
Interarrival Times (msec.)
?
F i g . 10. % - A g e k e r n e l u t i l i z a t i o n vs . i n t e r a r r i v a l t imes . (a ) 4 0 - b y t e p a c k e t s . (b ) 2 5 6 - b y t e p a c k e t s .
46 H.G. Badr et al. / A n adaptive communications protocol
the likelihood of propagation failure for other packets wishing to traverse the node, the partial circuits of which are then torn down. As the network load increases, there will be a growing tendency for longer-than-excepted partial circuits to 'generate' a subclass of shorter-than-expected ones. Viewed within the context of decreasing mean lengths for the partial circuits, the increasing coefficient of variation values become understan- dable. Nevertheless, in the limit as 1/?~ ~ 0, cir- cuit lengths must uniformly become of unit length, yielding a coefficient of variation of 0. Were we to drive the network at higher loads than shown in Fig. 9, we should expect to see a precipitous drop of the curves to 0. The rightmost point for each of the 40-byte and 256-byte packets in the figure provides corroborative evidence that this is, in- deed, what would happen. Given that the perfor- mance of SCS is sensitive, not only to the mean lengths of the circuits established at a given load, but also to the amount of variance in these lengths, the figure also provides an explanation for the higher variation of lifetimes in SCS, as compared to CS, mentioned with relation to Fig. 7.
For a software-driven communications net- work, the proportion of time the communications kernels are busy provides an accurate measure of the work expended in the network. Fig. 10 gives the front-end-kernel utilization, averaged over the nodes in the network, and expressed as a per- centage. Since we must have kernels occasionally idle, i.e., in a receptive mode so that neighboring nodes can successfully establish a hand-shaking protocol and deliver packets, it is neither possible nor desirable to drive the kernels at anything near full utilization. For MS and SCS, as load escalates, an increasing proportion of marginal utilization becomes devoted to unsuccessful attempts at securing a diminishingly available bandwidth. On the other hand, new work, in the form of packets flowing into the front-end decreases, since neigh- bors and host are unable to deliver to the busy front-end. This process balances itself out in the neighborhood of the 75%-utilization level. Note that SCS kernel utilization is both of the order of the CS utilization, and somewhat lower than MS. The situation for CS is different. The kernel utili- zations up to the breakdown point are quite low (around 5% at most), reflecting the fact that CS fails, not as a result of any excessive work-load on the kernels, but because of a 'thrashing' effect
with respect to communication links, resulting from the proliferation of unsuccessful, incomplete circuits in the network.
Finally, note that, for light to moderate loads, the kernel utilization for SCS is very low (below 5%). For a network that is being driven at these loads, with perhaps occasional bursts of heavy activity, it should be quite feasible to have the host processor itself supporting the communica- tions kernel and dispense with the front-end processor entirely.
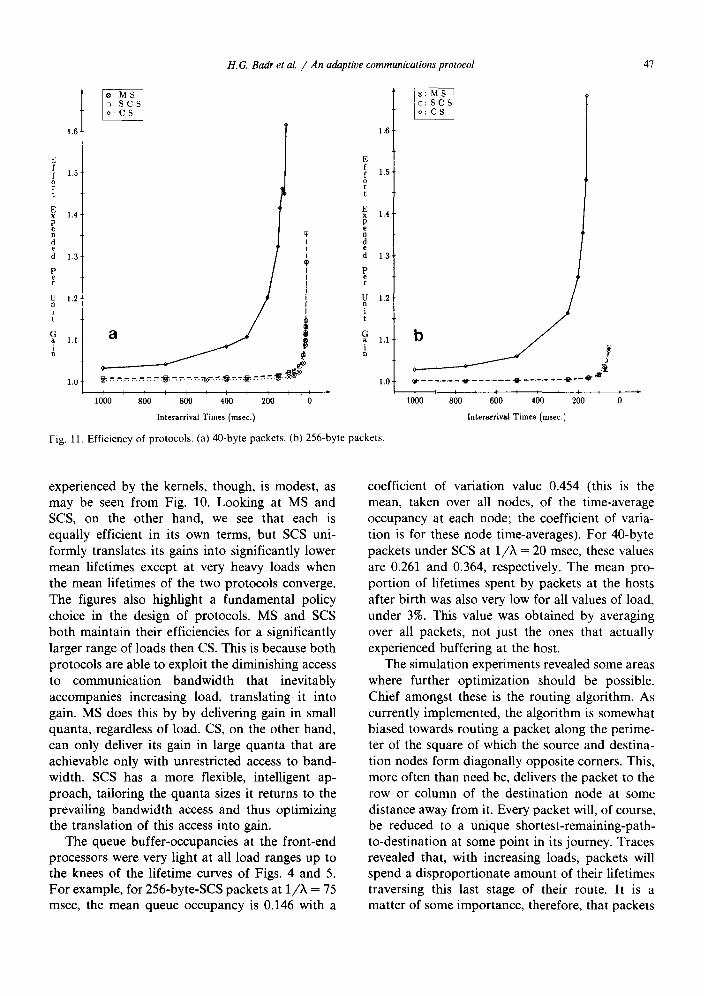
A measure of the overall efficiencies of the three protocols, may be obtained by considering the total time devoted by the kernels to all packets during their lifetimes, across all points in their paths, versus the amount of that total time that actually resulted in the packets making progress. The difference between these two quantities is the total time kernels devoted to unsuccessful propa- gation-attempts on behalf of packets, as well as all other work directly consequent from such failures. For CS, this difference also includes the total time spent in propagating partial circuits that never reach the destination node. The ratio of the two quantities is the effort expended per unit gain, averaged out over all packets (i.e., the mean of the network-effort per unit gain, as opposed to the mean of the packet-individualized ratios). This ratio is given in Fig. 11.
We should be clear about what these figures show. The do not purport to measure relative efficiencies, since unit gain under one protocol is not equivalent to unit gain under another. A unit gain of CS and SCS at light loads, for example, is worth much more than an MS unit gain, since the former translate their gains at that level of load into much faster packet delivery times. The figures do give a measure for the efficiency of each proto- col taken in its own right. Furthermore, viewed side by side with the mean lifetime curves of Figs. 4 and 5, they yield some interesting information about relative performance.
At light loads, while CS and SCS achieve com- parable mean lifetimes, SCS does this with less effort. As the load increases, the performance of the two protocols, as measured by mean lifetimes, is still comparable, but CS attains its results through an increasingly profligate expenditure of effort as compared to SCS, until it finally breaks down. When this occurs, its efficiency, as seen from the figures, is poor; the total work load
H.G. Badr et al. / An adaptive communications protocol 47
16t 1.5-
1.4
1.3
1.2
1.1
1.0
J1 1 0 1 0 0 I q * I I I I I I I
800 600 400 200 0
lnterarrival Times (msec.)
E f f 1.5- o r
t
E x 1.4 P e
e
d 1.3
P e i"
U 1.2 n
i t
G a 1.1 i
n
1.0 P
Fig. 11. Ef f ic iency of p ro toco l s . (a) 40 -by te packe t s . (b) 256-by te packe t s .
b / , Io I I I I I ~ I I * I
10 0 800 600 400 200 0
lnterarrival Times (msec.)
experienced by the kernels, though, is modest, as may be seen from Fig. 10. Looking at MS and SCS, on the other hand, we see that each is equally efficient in its own terms, but SCS uni- formly translates its gains into significantly lower mean lifetimes except at very heavy loads when the mean lifetimes of the two protocols converge. The figures also highlight a fundamental policy choice in the design of protocols. MS and SCS both maintain their efficiencies for a significantly larger range of loads then CS. This is because both protocols are able to exploit the diminishing access to communication bandwidth that inevitably accompanies increasing load, translating it into gain. MS does this by by delivering gain in small quanta, regardless of load. CS, on the other hand, can only deliver its gain in large quanta that are achievable only with unrestricted access to band- width. SCS has a more flexible, intelligent ap- proach, tailoring the quanta sizes it returns to the prevailing bandwidth access and thus optimizing the translation of this access into gain.
The queue buffer-occupancies at the front-end processors were very light at all load ranges up to the knees of the lifetime curves of Figs. 4 and 5. For example, for 256-byte-SCS packets at 1/~, = 75 msec, the mean queue occupancy is 0.146 with a
coefficient of variation value 0.454 (this is the mean, taken over all nodes, of the time-average occupancy at each node; the coefficient of varia- tion is for these node time-averages). For 40-byte packets under SCS at 1/2~ -- 20 msec, these values are 0.261 and 0.364, respectively. The mean pro- portion of lifetimes spent by packets at the hosts after birth was also very low for all values of load, under 3%. This value was obtained by averaging over all packets, not just the ones that actually experienced buffering at the host.
The simulation experiments revealed some areas where further optimization should be possible. Chief amongst these is the routing algorithm. As currently implemented, the algorithm is somewhat biased towards routing a packet along the perime- ter of the square of which the source and destina- tion nodes form diagonally opposite corners. This, more often than need be, delivers the packet to the row or column of the destination node at some distance away from it. Every packet will, of course, be reduced to a unique shortest-remaining-path- to-destination at some point in its journey. Traces revealed that, with increasing loads, packets will spend a disproportionate amount of their lifetimes traversing this last stage of their route. It is a matter of some importance, therefore, that packets
48 H.G. Badr et al. / An adaptive communications protocol
attain this stage as close as possible to their destination. A solution that suggests itself is the following: a packet that arrives at a node along a row should, whenever the choice exists, be for- warded onwards along a column, and vice versa. This would favor a zig-zag, shortest-path route along the diagonal joining source and destination nodes. Moreover, a packet with unique shortest- path should be afforded priority over others for onward transmission whenever a kernel seizes the appropriate link. It is our conjecture that this combined strategy is optimal. The scheme increases availability of alternative directions and, while all three protocols stand to benefit, relative gains for SCS and CS should be more than for MS in as much as the probability of circuit propagation is increased.
In closing this section, it is worth commenting on the degree of uniformity in the behavior of individual nodes in the network. This in itself is, of course, not surprising, given the uniformly dis- tributed input loads we generate. The torus, how- ever, also plays a significant role in inducing such a pattern of behavior, due to the regularity and absence of boundaries of its topology~ Simulation experiments of the size and detail we have under- taken are both cumbersome and expensive. An environment that provides scalability with accu- racy and predictability is of obvious value. For the modeling process, and setting aside its other merits and demerits, the toroidal topology should pro- vide such an environment. Simulation studies with smaller-size networks seem to confirm this.
4, Saturation analysis
We present an approximate analysis of network saturation based on flow equivalencing and mean values. The analysis is for MS, but given that SCS converges to MS, it should be equally applicable, in the limit, to SCS.
A front-end processor alternates between idle and busy periods, the mean lengths of which we denote by i and B, respectively. We assume that there is always a sufficient number of packets on the front-end queue such that each of the four directions is covered by one or more packets. From previous discussion, packets have a mean of (marginally more than) two eligible direction by which to continue their shortest-paths journeys. A
busy period is initiated by the arrival of a packet, either off one of the four links, or from the host. Let p H be the probability that a birth at the host intercepts an idle period, and is consequently im- mediately forwarded to the front-end over the DMA link; and let PL be the probability of the idle period being terminated, instead, by an arrival on any of the for links. The births at the host occur according to a Poisson distribution at rate ?~; assuming the combined arrival process of the links is also Poisson, we have,
pH = ~ki.
Consequently,
P L = ] - - P H = l - - ~ k L
Consider a long interval of time T. The total number of packets injected into the network by the hosts in time T is ~TN, where N is the number of nodes. Packets have mean source-to- destination distance h hops. The total amount of new work introduced into the network, measured in hops, is thus,
)~TNh. (1)
Let pu be the probability that a front-end is busy. Then,
Pu I + B" (2)
During a busy period, a kernel will sweep all four directions, attempting to send packets. For each direction, it will find the corresponding neighbor- ing kernel busy with this same probability PB. The distribution of the number of available directions over which packets will be successfully trans- mitted in a busy period is then given by b(k ; n, p), the binomial distribution with number of indepen- dent trials n = 4, and probability of success p = 1 - P B . The mean number of packets thus disposed of is np = 4 ( 1 - P B ) . The mean number of busy p_eriods a kernel will undergo in time T is T / ( i + B). Therefore, the total amount of work, in hops, as measured by onward transmission of packets by the network, executed in time T, is given by
NT4(a --PB) I + B (3)
On the other hand, each busy period at a kernel is initiated by the arrival of one packet. The total number of arrivals at a front-end in time T is then T / ( I + B). Of these, PL = (1 - ?~i) will be arrivals
H.G. Badr et al. / An adaptive communications protocol 49
from neighboring nodes, each arrival representing a hop of work executed. The total amount of work, as measured by receipt of packets from neighbors, executed over the network in time T, is then
NT(1 - h i ) i + B (4)
Taking limits as T ~ o¢, we may equate new work created, (1), network hops transmitted, (3), and network hops received, (4), obtaining
h h - 4(1 -PB) (1 - h i ) (5) I + B I + B
From this, equating the first and third terms, we may derive
h = 1 (6)
Using (2) in the above, we have
h i = - 1 - P B (7) h+ l - p B .
On the other hand, equating the second and third terms in (5), substituting (7), and rearranging, we have
4p 2 - (4h + 8)p B + (3h + 4) = 0
pB = 1 [(4h + 8) _+ ~(4h + 8 )2 - 16(3h + 4) ].
For our source-to-destination distribution, h = 16.0156; whence, PB = 0.7538 (which accords quite well with the 75% kernel utilization obtained from simulation at very heavy loads).
From (6) we seek the value of h at which system saturation occurs. Having established the value P B = 0.7538 at saturation, we may, from (2), obtain I in terms of B. Substituting this in (6) we
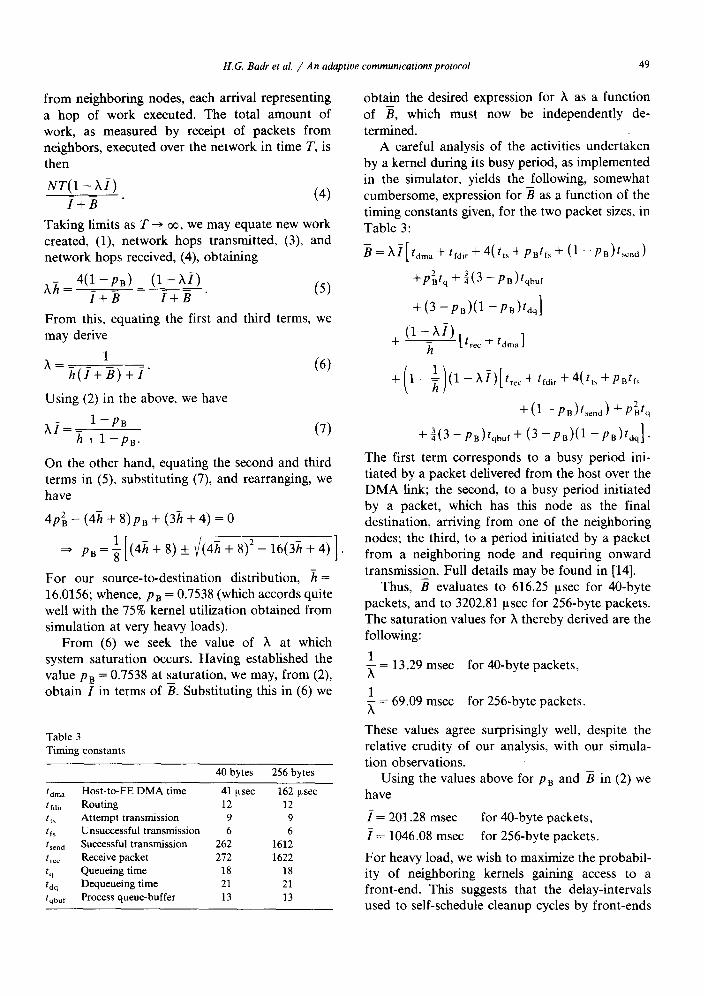
Table 3 Timing constants
40 bytes 256 bytes
tdm a Host-to-FE DMA time 41 p.sec 162 p.sec tfdir Routing 12 12 tts Attempt transmission 9 9 tfs Unsuccessful transmission 6 6 tsena Successful transmission 262 1612 t~¢¢ Receive packet 272 1622 tq Queueing time 18 18 tdq Dequeueing time 21 21 tqbuf Process queue-buffer 13 13
obtain the desired expression for h as a function of B, which must now be independently de- termined.
A careful analysis of the activities undertaken by a kernel during its busy period, as implemented in the simulator, yields the following, somewhat cumbersome, expression for B as a function of the timing constants given, for the two packet sizes, in Table 3:
= h I [ / d m a + /fdir + 4(t t~ +pBtfs + (1 -- pB)t~cna)
+p2tq + -34(3 --p B) tqbuf
+ (3- -pa) (1 -- pa)tdq ]
(1 - h i ) + t ma] +
+(1 - ps)tsend) +p2atq
+3(3 - -p , ) t qbu f+ ( 3 - p . ) ( 1 - p s ) t a q ].
The first term corresponds to a busy period ini- tiated by a packet delivered from the host over the DMA link; the second, to a busy period initiated by a packet, which has this node as the final destination, arriving from one of the neighboring nodes; the third, to a period initiated by a packet from a neighboring node and requiring onward transmission. Full details may be found in [14].
Thus, B evaluates to 616.25 ~sec for 40-byte packets, and to 3202.81 ~tsec for 256-byte packets. The saturation values for X thereby derived are the following:
1 = 13.29 msec for 40-byte packets,
1 = 69.09 msec for 256-byte packets.
These values agree surprisingly well, despite the relative crudity of our analysis, with our simula- tion observations.
Using the values above for p B and B in (2) we have
[ = 201.28 msec for 40-byte packets,
[ = 1046.08 msec for 256-byte packets.
For heavy load, we wish to maximize the probabil- ity of neighboring kernels gaining access to a front-end. This suggests that the delay-intervals used to self-schedule cleanup cycles by front-ends
50 H.G. Badr et al. / An adaptive communications protocol
should be greater, to take account of variances, than the values for i obtained above. Virtually, all our simulations were run with delay intervals of 250 ~sec for 40-byte packets, and 1500 ~sec for 250-byte ones. The only exceptions were for CS at the breakdown loads, where we found that a little more could be squeezed out of the system by switching off self-scheduled cleanups entirely. By the same token, it should be possible to reduce lifetimes somewhat at light loads for all three protocols, though not by uniform amounts, if we drive the system harder, using more frequent self-scheduled cleanup cycles.
The MC68000 code from which our simulation delays are abstracted drives the transmission lines at the rate of 1 byte every 50 clock cycles. Assum- ing an 8 MHz clock, this is equivalent to 1.28 Mbits /sec. The maximum effective network band- width may be estimated from the saturation values of ?~ derived above and is equal to ?,NhP h bytes /msec, where Pb is the packet size. For the 256-byte packets, this gives 486.14 Mbits /sec. The maximum effective source-to-destination delivery rate of course depends on the degree of communi- cations locality. In our case, h - 16.0156 hops. Our maximum effective network delivery band- width at destination is therefore 1 /h of the effec- tive bandwidth itself, i.e., 30.35 Mbits /sec!
The level of detail undertaken in the above analysis represents a conscious effort at obtaining sufficiently accurate results, rendering a convinc- ing corroboration of some aspects of our simula- tion implementation possible. We refer the reader to [16] for a more generalized treatment of asymptotic performance applicable across various classes of interconnection topologies.
5. Conclusions
SCS seems promising and we are continuing to investigate it. More work is needed in several important areas.
(1) Simulation results for different message source-to-destination distributions, particularly for distributions with a high degree of locality; simu- lation results with faster communication hard- ware; and experiments that compare the behavior of SCS to the behavior of bus-based protocols at uniform levels of hardware technology. All are now in progress.
(2) The SCS architecture may well make the construction of relatively dense networks practi- cal; we therefore plan to investigate the behavior of denser networks than those we have considered thus far; for example, 8- and 16-nearest-neighbor tori and binary hypercubes.
(3) The most interesting potential application of SCS lies in networks that respond intelligently to their traffic-load patterns by reconfiguring themselves dynamically. A dynamically-reconfig- uring communication system would tend to leave heavily used circuits in place over longer periods than a single message transmission; in this way the system constantly rearranges the network topology in order to bring heavily-communicating distant nodes closer together. Future simulation experiments will aim at developing heuristics that allow the communication system to use the SCS switches as a 'communication cache' of this sort.
Acknowledgment
The authors would like to thank Todd Morgan for his work in developing our simulator in its early phases and, most especially, Mauricio Arango whose work on the SCS architecture was central to the project.
References
[1] S. Ahuja, S/Net: A high-speed interconnect for multiple computers, IEEE Selected Areas in Communication (1983) 751-756.
[2] M. Arango, H.G. Badr and D. Gelernter, Staged circuit switching, IEEE Trans. Comput. C-34 (2) (1985) 174-180.
[3] M. Arango, D. Gelernter, H.G. Badr and A. Bernstein, Staged circuit switching for network computers, Proc. ACM Symp. on Communications Architecture and Proto- cols (1983) 94-100.
[4] M. Arango, Staged circuit switching for SBN, Tech. Rept., Dept. of Computer Science, State University of New York, Stony Brook, 1982.
[5] I. Barron et al., Transputer does 5 or more MIPS even when not used in parallel, Electronics (1983) 109-105.
[6] J. Deminet, Experience with multiprocessor algorithms, 1EEE Trans. Comput. C-31 (4) (1982) 278-287.
[7] J.T. Deutsch and A.R. Newton, MSPLICE: A multi- processor-based circuit simulator, Proc. 1984 lnternat. Conf. on Parallel Processing (1984) 207-214.
[8] M. Fehling and L. Erman, Report on the third annual workshop on distributed artificial intelligence, SIGART (1983) 3-12.

H.G. Badr et al. / An adaptive communications protocol 51
[9] Inmos Ltd., OCCAM Programming Manual (Prentice- Hall, Englewood Cliffs, NJ, 1984).
[10] Inmos Ltd., IMS T424 Transputer Reference Manual (Inmos Ltd., 1984).
[11] L. Kleinrock, W.E. Taylor and H. Operdeck, A study of line overhead in the ARPAnet, Comm. ACM 19 (1) (1976) 3-12.
[12] S. Lavenberg, ed., Computer Performance Modeling Handbook (Academic Press, New York, 1983).
[13] D. Logan, C. Maples, D. Weaver and W. Rathbun, Adapt- ing scientific programs to the MIDAS multiprocessor system, Proc. 1984 Internat. Conf. on Parallel Processing (1984) 15-24.
[14] S. Podar, Performance study of an adaptive communica- tion protocol for network computers, M.S. Thesis, Dept. of Computer Science, State University of New York, Stony Brook, 1985.
[15] D.A. Reed and H.D. Schwetman, Cost-performance bounds for multimicrocomputer networks, IEEE Trans. Comput. C-32 (1) (1983) 83-95.
[16] D.A. Reed, Queueing network models of multimicrocom- puter networks, Proc. 1983 ACM SIGMETRICS Conf. on Measurement and Modelling of Computer Systems, Per- formance Evaluation Review (Special Issue) (1983) 190-197.
[17] R. Rettberg et al., Development of a voice funnel system: Design report, in: Bolt, Beranek and Newman, eds., BBN TR 4098, 1979.
[18] C.L. Seitz, The cosmic cube, Comm. ACM 28 (1) (1985) 22-83.
[19] A.S. Tanenbaum, Computer Networks (Prentice-Hall, En. glewood Cliffs, NJ, 1981).