Control does not involve movement – Pretty clear evidence from German (rev. v. 15/08/15)
Upload
independentCategory
view
0download
0
Amplitude histogram-based method of analysis of patch clamprecordings that involve extreme changes in channel activity levels
Daniel Yakubovich,Department of Physiology and Pharmacology, Sackler School of Medicine, Tel Aviv University, TelAviv 69978, Israel
Ida Rishal,Weizmann Institute of Science, Rehovot, Israel
Carmen W. Dessauer, andDepartment of Integrative Biology and Pharmacology, Medical School, University of Texas,Houston, TX 77030, USA
Nathan DascalDepartment of Physiology and Pharmacology, Sackler School of Medicine, Tel Aviv University, TelAviv 69978, Israel
AbstractMany ion channels show low basal activity which is increased hundreds fold by the relevant gatingfactor. A classical example is the activation G protein activated K+ channels (GIRK) by Gβγ subunitdimer. The extent of activation (relative to basal current), Ra, is an important physiological parameter,usually readily estimated from whole cell recordings. However, calculation of Ra often becomes non-trivial in multichannel patches, because of extreme changes in activity upon activation, from aseemingly single-channel pattern to a macroscopic one. In such cases calculation of the net currentflowing through the channels in the patch, Ī, before and after activation may require different methodsof analysis. To address this problem, we utilized neuronal GIRK channels activated by purifiedGβγ in excised patches of Xenopus oocytes. Channels were expressed at varying densities, from afew to several hundreds per patch. We present a simple and fast method of calculating Ī usingamplitude histogram analysis, and establish its accuracy by comparing with Ī calculated from eventlists.This method allows the analysis of extreme changes in Ī in multichannel patches, that would beimpossible using the standard methods of idealization and event list generation.
Keywordsion channel; Kir3; patch clamp; G protein; amplitude histogram
IntroductionSingle channel recordings yield important information about ion channels. The analysis ofsingle channel recordings is based either on time-course fitting or event list analysis (Bauer etal., 1987; Jackson, 1992). Event list analysis requires implementation of idealization criterion(the most popular one is the so-called “50 % threshold crossing”) and subsequenttransformation of recorded data into list of dwell times which are classified as open and closedevents (Sachs et al., 1982). In a patch containing a single channel, open probability (Po) can
Corresponding author: Nathan Dascal. e-mail: [email protected].
NIH Public AccessAuthor ManuscriptJ Mol Neurosci. Author manuscript; available in PMC 2010 March 4.
Published in final edited form as:J Mol Neurosci. 2009 March ; 37(3): 201–211. doi:10.1007/s12031-008-9117-z.
NIH
-PA Author Manuscript
NIH
-PA Author Manuscript
NIH
-PA Author Manuscript

be calculated from the above list. In addition, histograms of open and closed times distributionscan be generated and fitted with exponential functions. These procedures render valuableinformation about minimal number of channel's open and closed states and about the rates oftransitions between the states, based on assumptions of a Markov process (Colquhoun andHawkes, 1977; Vivaudou et al., 1986; Bauer et al., 1987; Colquhoun and Hawkes, 1995; Bluncket al., 1998; Traynelis and Jaramillo, 1998). However, such analysis becomes more and morecomplex with the increase of number of channels in the patch, until it becomes impossible forrecordings in which nearly-macroscopic activity is observed. In this case single open and closedevents cannot be detected. Several methods for analysis of such high activity recordings exist(Colquhoun and Hawkes, 1977; Hosoya et al., 1996). For instance, fitting of power densityspectra obtained from the recording with Lorenzian functions renders information about thenumber of states that the channel assumes and the transition rates between them (Colquhounand Hawkes, 1977; Hosoya et al., 1996). However, with multi-channel recordings, theextraction of kinetic parameters using such methods becomes time-consuming and requires agreat deal of correction in order to overcome problems such as erroneous shortening of closedtimes (Colquhoun and Hawkes, 1981). Therefore, multi-channel recordings are rarelyemployed for detailed kinetic analysis. Yet, analysis of average currents (Ī ) or total openprobability (NPo, where N denotes the number of channels) in such recordings is oftenunavoidable, for instance when effects of channel modulators are being studied. In theserecordings, NPo may change dramatically from a low-NPo, seemingly single-channel behavior,to a macroscopic one, or vice versa. Consequently, reliable and sufficiently simple methods ofcalculation of NPo and Ī in multi-channel recordings are needed. A classical example of extremechanges in NPo is demonstrated by the G protein activated potassium channels (GIRK), whichare activated by Gβγ subunits of heterotrimeric G proteins (Dascal, 1997). When studied inexcised patches of cardiac cells, neurons, or heterologous expression systems such asXenopus oocytes, GIRK channels usually show low basal NPo which is increased several tensto hundreds fold after addition of purified Gβγ protein (Grigg et al., 1996; Jelacic et al.,1999; Yakubovich et al., 2000).
We have previously used estimates of Ī and NPo from idealized event lists before activationby Gβγ, and from amplitude histograms after activation, and calculated the activation ratio,Ra, as the ratio of these estimates (Peleg et al., 2002). This method is fast and apparently solvesthe problem of calculating Ra upon extreme changes in Ī and NPo, but its validity has not beenso far tested rigorously. In the present work we describe the method in full, test the applicabilityof the calculations of average currents from amplitude histograms under different conditionsand channel activity levels, and demonstrate it applicability in a wide range of NPo values ofthe GIRK channel. We show that calculation of Ī, NPo and Ra under different experimentalconditions can be done directly without the estimation of number of channels in multi-channelpatches and thus renders important quantitative measure of the effect under study (in this case,channel activation by Gβγ).
Materials and MethodsElectrophysiology
All experiments were carried out in accordance with the Tel Aviv University InstitutionalAnimal Care and Use Committee (permits no. 11-99-47 and 11-05-064). Xenopus laevis frogswere maintained and operated, and oocytes were collected, defolliculated, and injected withRNA as described. Oocytes were injected with 10–100 pg/oocyte RNA of GIRK1 and GIRK2subunits to obtain low density of channels in the patch, and with 1–2 ng RNA to obtain highdensity (Peleg et al., 2002). After RNA injection, oocytes were incubated for 3 to 5 days at 20–22°C in ND96 solution (96 mM NaCl, 2 mM KCl, 1 mM MgCl2, 1 mM CaCl2, 5 mM HEPES,pH 7.5), supplemented with 2.5 mM Na Pyruvate and 50 µg/ml gentamycine. All experiments
Yakubovich et al. Page 2
J Mol Neurosci. Author manuscript; available in PMC 2010 March 4.
NIH
-PA Author Manuscript
NIH
-PA Author Manuscript
NIH
-PA Author Manuscript
were done at 20–22°C. Patch clamp experiments were done as described (Schreibmayer et al.,1996; Yakubovich et al., 2000). Currents were recorded at −80 or −120 mV, filtered at 2 kHz,and sampled at 5 or 10 kHz. Patch pipettes had resistances of 0.8 – 2.5 MΩ. Pipette solutioncontained, in mM: 144 KCl, 2 NaCl, 1 MgCl2, 1 CaCl2, 1 GdCl3, 10 Hepes/KOH, pH 7.5.GdCl3 completely inhibited the stretch-activated channels. Bath solution contained, in mM:130 KCl, 2 MgCl2, 1 EGTA, 2 Mg-ATP, 10 Hepes/KOH, pH 7.5. After seal formation, thepatches were excised and exposed to air to prevent the formation of closed membrane vesiclesat the tip. Purified recombinant Gβ1γ2 was prepared and used as described (Schreibmayer etal., 1996; Yakubovich et al., 2000). Stock solutions of Gβγ were diluted into 50 µl of the bathsolution to a final concentration of 200 or 400 nmol/L, added to the 500 µl solution in the bath,and stirred.
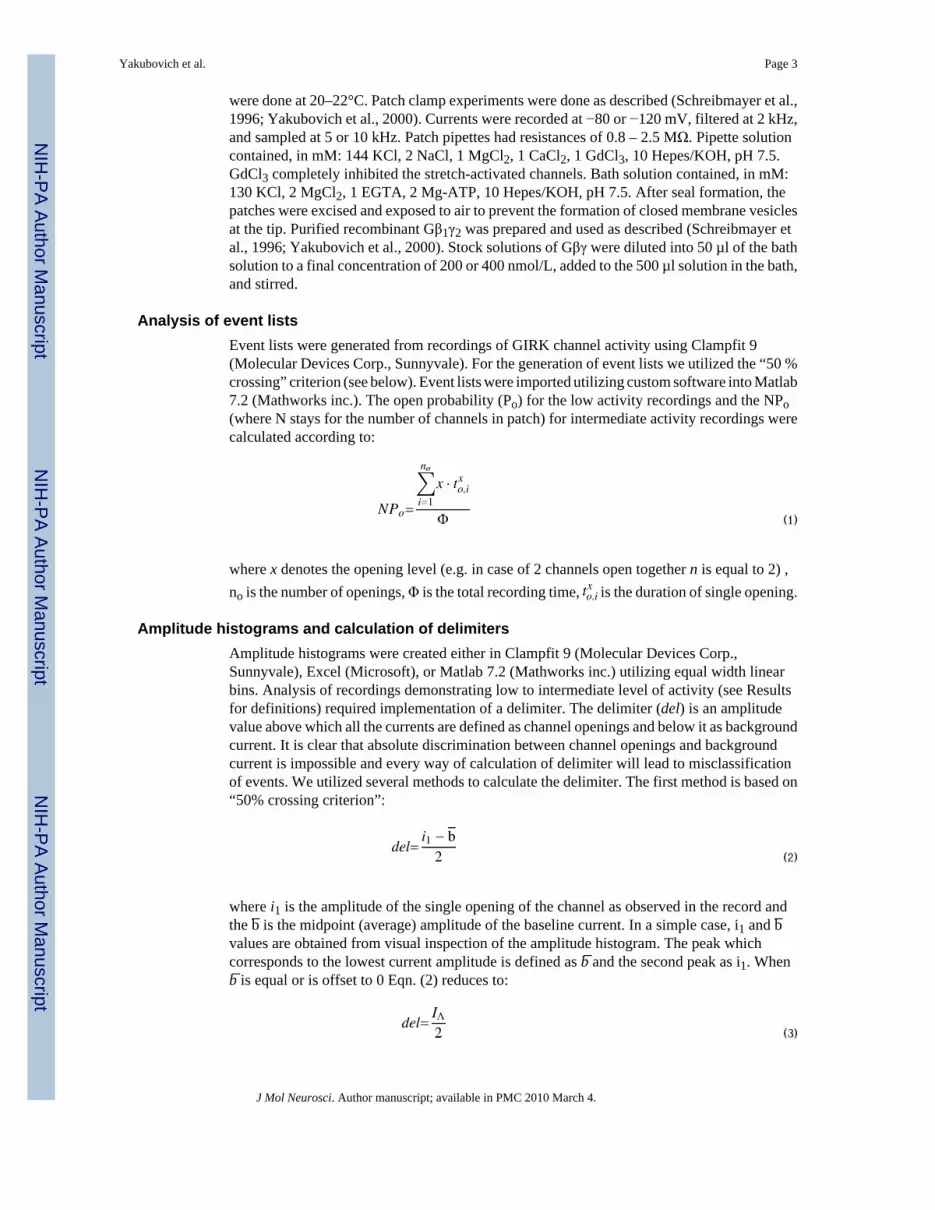
Analysis of event listsEvent lists were generated from recordings of GIRK channel activity using Clampfit 9(Molecular Devices Corp., Sunnyvale). For the generation of event lists we utilized the “50 %crossing” criterion (see below). Event lists were imported utilizing custom software into Matlab7.2 (Mathworks inc.). The open probability (Po) for the low activity recordings and the NPo(where N stays for the number of channels in patch) for intermediate activity recordings werecalculated according to:
(1)
where x denotes the opening level (e.g. in case of 2 channels open together n is equal to 2) ,no is the number of openings, Φ is the total recording time, is the duration of single opening.
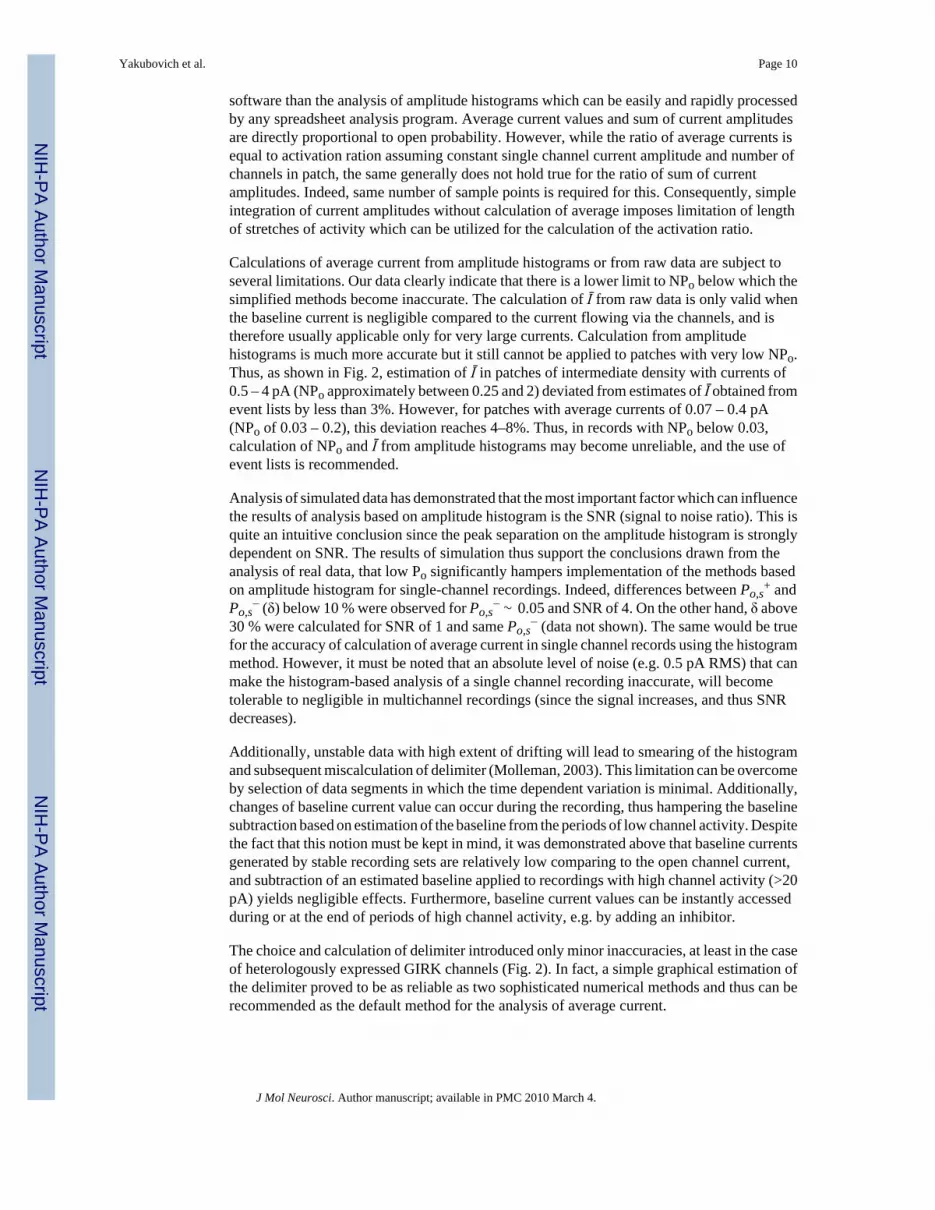
Amplitude histograms and calculation of delimitersAmplitude histograms were created either in Clampfit 9 (Molecular Devices Corp.,Sunnyvale), Excel (Microsoft), or Matlab 7.2 (Mathworks inc.) utilizing equal width linearbins. Analysis of recordings demonstrating low to intermediate level of activity (see Resultsfor definitions) required implementation of a delimiter. The delimiter (del) is an amplitudevalue above which all the currents are defined as channel openings and below it as backgroundcurrent. It is clear that absolute discrimination between channel openings and backgroundcurrent is impossible and every way of calculation of delimiter will lead to misclassificationof events. We utilized several methods to calculate the delimiter. The first method is based on“50% crossing criterion”:
(2)
where i1 is the amplitude of the single opening of the channel as observed in the record andthe b̅ is the midpoint (average) amplitude of the baseline current. In a simple case, i1 and b̅values are obtained from visual inspection of the amplitude histogram. The peak whichcorresponds to the lowest current amplitude is defined as b̅ and the second peak as i1. Whenb̅ is equal or is offset to 0 Eqn. (2) reduces to:
(3)
Yakubovich et al. Page 3
J Mol Neurosci. Author manuscript; available in PMC 2010 March 4.
NIH
-PA Author Manuscript
NIH
-PA Author Manuscript
NIH
-PA Author Manuscript

where IΛ is the single opening amplitude (Colquhoun and Hawkes, 1995). Alternatively, i1 andb̅ can be estimated by fitting the amplitude histogram to a sum of Gaussian functions accordingto:
(4)
where f(x) is the number of points in a bin with current amplitude x, while μi ,σI and Ai arerespectively the mean, standard deviation and the total number of points belonging to the ithcomponent (consequently, μ1=b̅ and μ2= i1).
The second method of defining the delimiter is described in detail in the work of Howe et al.(Howe et al., 1991). This method takes into account the fact that imposition of any kind ofdelimiter leads to misclassification of certain number of points. Namely, some points of therecord, which contain no channel openings, are defined as belonging to an opening, and viceversa. Such misclassification results from random fluctuations of the amplitudes of channelopenings, baseline and also the effects of sampling and filtering. Consequently, delimiter isdefined as the amplitude that minimizes the total area which is misclassified, i.e. erroneouslydefined as either the noise or the open channel amplitude. Thus, del according to Howe et al.is a solution of quadratic equation of the form
(5)
(6)
(7)
(8)
while μi, σI and Ai are defined as above in Eqn. (4).
Calculation of average currentAverage current was calculated either from raw data, amplitude histogram or event list. In eachcase a delimiter (see above) is introduced. In general the average current is calculated accordingto:
(9)
Yakubovich et al. Page 4
J Mol Neurosci. Author manuscript; available in PMC 2010 March 4.
NIH
-PA Author Manuscript
NIH
-PA Author Manuscript
NIH
-PA Author Manuscript

where Ī is the average channel current value, id is the amplitude of an acquisition point (fori>del only) – points with amplitude above the delimiter, and l is the number of points in therecording. Eqn. (9) allows the calculation of average current directly from raw data if del isknown or estimated.
Average current based on amplitude histogram is calculated according to:
(10)
where fi is the number of points in the bin with amplitude i > del.
Simulation and analysis of simulated dataIn order to simulate single channel data we utilized 2 state scheme:
Scheme 1
where α and β are, respectively, the opening and closing transition rates (in s−1).
According to this scheme the open probability (Po) and frequency of openings (fo) can becalculated according to:
(11)
(12)
We calculated the α and β values for Po of .05 and 0.5 and fo of 10, 100. Single channel datawas generated utilizing QUB software (Qin et al., 1996,1997, 2000a, b). We assumed that b̅ is0 and the IΛ is 1 pA, with standard deviation of both equal to 0. Simulated data was importedto Matlab 7.2 (Mathworks inc.) and processed there. In particular, in order to simulate therandom fluctuations of the current, we utilized the algorithm shown in the attached ASCII file(see Supplementary material). This algorithm introduces a noise component which is normallydistributed with a mean of zero and a given standard deviation. The ratio of the currentamplitude to the standard deviation of noise (defined as signal to noise ratio (SNR)) wassimulated as 10, 5 and 2.5.
ResultsPresentation of the problem
We recorded the activity of non-stimulated or Gβγ-stimulated GIRK1/2 channels (composedof GIRK1 and GIRK2 subunits) in cell-attached or excised patches of Xenopus oocytes. Ingeneral, 3 types of activity can be observed in such recordings. In patches containing one tothree channels, single openings and closures can be readily discerned, and a complete kineticanalysis is often possible (e.g. Fig. 2b). With increase in channel density, overlaps
Yakubovich et al. Page 5
J Mol Neurosci. Author manuscript; available in PMC 2010 March 4.
NIH
-PA Author Manuscript
NIH
-PA Author Manuscript
NIH
-PA Author Manuscript

corresponding to simultaneous openings of several channels can be observed, although singleopenings are occasionally seen (not shown). In high channel density patches, neither singlechannel openings nor closures can be observed and so-called “pseudomacroscopic” behavioris observed (Fig. 1c).
Typically, two or even all three types of activity are often observed in a single recording in acomplete experiment, as shown in Figure 1a. A relatively high level of basal activity is observedin the cell-attached mode. After excision into GTP- and Na+-free solution, the activity runsdown by 80–90% (Peleg et al., 2002), to a level where the creation of an event list is oftenpossible (Fig. 1b). However, following the addition of 20 nM Gβγ a pseudo-macroscopiccurrent ensues which cannot be analyzed in this way (Fig. 1c). Figures 1d and 1e, respectively,show amplitude histograms of representative 20–60 s intervals of activity in excisedconfiguration before (Fig. 1b) and after (Fig. 1c) addition of 20 nM Gβγ. It can be seen thatlow to intermediate activity recordings render amplitude histograms with several peaks ofwhich the leftmost peak corresponds to b̅ (the background or “leak” current), and the next peakto i1. On the other hand, high activity recordings render amplitude histogram with a singlepeak.
It is clear that trace idealization and event list analysis are applicable for calculation of totalopen probability (NPo) or of the net average current in recordings of Figure 1b, but impossiblefor recordings of the kind shown in Figure 1c. Moreover, quantitative description of activitychanges such as Ra (fold activation by Gβγ) which occur on a wide amplitude scale, such asdemonstrated in Figure 1a, are impossible utilizing solely event list analysis.
Analysis procedureCalculation of the net average current flowing through the open channels ( Ī ) for low tointermediate activity level recordings involves 3 steps. The first step is the detection of baseline(leak) current value. This can be achieved in several ways. The simplest way is a graphicalestimation (e.g. using cursors on the display screen). A numerical calculation of the averagecurrent value of a sufficiently long closed period also yields a good estimation of the baselinecurrent value, assuming that no baseline drift is observed. A more accurate estimate is obtainedby creating an amplitude histogram of the record and selecting the first (corresponding to thelowest current) peak either graphically or by fitting the amplitude histogram with a sum ofGaussian functions (see Fig. 2a). After estimation of the baseline current value, the latter canbe subtracted from all amplitude values in order to offset the baseline to zero.
The second step is the calculation of the delimiter (See Fig. 2b). As described in Methods, thedelimiter is a current value which discriminates between the open and closed events. Allamplitude points above the delimiter are assigned as belonging to open events distribution,while the points below the delimiter represent closed states of the channel; any non-zero pointbelow the delimiter is thus assigned to noise.
The third step is the calculation of Ī, which can be calculated either from the analysis of theevent list, or from the amplitude histogram, or directly from the raw data without the creationof histograms, as will be explained below.
Calculation of average currentsThe total average current ( Īt ) is given by:
(13)
Yakubovich et al. Page 6
J Mol Neurosci. Author manuscript; available in PMC 2010 March 4.
NIH
-PA Author Manuscript
NIH
-PA Author Manuscript
NIH
-PA Author Manuscript

where b̅ is the mean value of the background (leak) current and Ī is the average current flowingvia open channels.
Having calculated Ī by subtracting b̅ from the total current, one can calculate the activationratio (Ra) which we define as the ratio of net current flowing through the channels afterperturbation (e.g. activation by agonist or another activator, such as Gβγ in the case of GIRK)to the basal current before perturbation:
(14)
where subscripts a and b denote the values of Ī before and after the perturbation, respectively.
Note that Ī is directly proportional to Po according to:
(15)
where the IΛ is the single channel amplitude and the N is the number of the channels carryingthe current (Neher and Stevens, 1977; Traynelis and Jaramillo, 1998; Alvarez et al., 2002).From this equation, it can be directly deduced that, in a common case, when the perturbationinvolves mainly changes in channel open probability (Po) rather than single channel current(IΛ) or the number of channels (N), Ra reflects the change in Po:
(16)
An example of a standard calculation of the average current in a low/intermediate NPo recordis shown in Figure 2. Initially, an amplitude histogram is created (Fig. 2a). Then the amplitudevalues of the two leftmost peaks is determined graphically (the positions of the peaks were setby eye), and the delimiter is calculated by halving the difference between the two amplitudevalues, according to equations (2) and (3). This delimiter can be utilized to create an event listfrom the record. A representative 1 s interval with superimposed idealized data is shown inFigure 2b.
We have also estimated the delimiter either numerically or according to Howe et al. (Howe etal., 1991) (see Methods). To do this, we used equations (2) or (5)–(8), respectively, after fittingthe amplitude histogram to Gaussian function (in the case shown in Fig. 2a, with 3 Gaussiancomponents). The delimiters calculated in these ways, and that determined graphically asexplained above, were almost identical (Fig. 2c). The average single channel current, IΛ, was2.2 pA in this recoding.
Subsequently, average current (Ī ) values were calculated from the amplitude histogram usingequations (9), (10) and (13), assuming that the first peak in the amplitude histogram representedthe background current. The estimates of the average current by this method, obtained with thedelimiters calculated in either of the three ways described above, were practically identical.We find that a simple visual (graphical) estimation of the delimiter from histograms of the typeshown in Fig. 2a, gives results practically indistinguishable from those obtained withsophisticated numerical methods. Most importantly, all estimates of Ī obtained from thehistogram were also indistinguishable from the average current calculated in the classical wayfrom the event list (Fig. 2d).
Yakubovich et al. Page 7
J Mol Neurosci. Author manuscript; available in PMC 2010 March 4.
NIH
-PA Author Manuscript
NIH
-PA Author Manuscript
NIH
-PA Author Manuscript

To confirm the accuracy of the method of calculation of Ī based on amplitude histogramanalysis, we analyzed 8 low and 11 intermediate activity recordings of Gβγ-activated GIRK1/2channels, utilizing the above procedures. The results of these analyses are shown in Figure 2e,f. In all cases, the histogram-based method gave similar estimates of Ī, independently of themethod chosen to calculate the delimiter. The absolute values of deviation of Ī obtained fromamplitude histograms from that calculated from the standard event list were small for low-activity patches (∼ 5.5 ± 1 %) and even smaller (∼2%) for patches with intermediate activity(insets in Figs. 2e, f). Interestingly, in patches with low activities the current values estimatedfrom histograms were usually slightly lower, when compared to the event list method. Thereasons for this tendency have not been investigated, as the differences were small and did notaffect the main conclusion (see below). In patches with intermediate activity the current valuesestimated by all methods were practically indistinguishable. We conclude that the histogrammethod provides reliable estimates of total current in a wide range of channel activity levelsexcept in records with extermely low NPo (see below).
Analysis of recordings demonstrating pseudomacroscopic behaviorSeveral specific problems have to be faced while analyzing recordings withpseudomacroscopic behavior (Fig. 1c). Imposition of a delimiter is quite useless, since currentamplitudes of each point represent simultaneous opening of several channels and will exceedany delimiter calculated utilizing the methods described above. In addition, the amplitude ofthe baseline current cannot be estimated from amplitude histogram since no actual baseline isobserved. In such cases, the baseline value can be extracted from the analysis of a low tointermediate level activity period of the same recording (such as a stretch of record of basalactivity in the excised patch before the addition of Gβγ in Fig. 1). A less satisfactoryapproximation, applicable in cases of high stability in different recordings from the same dayunder same recording conditions and with similar seal resistances, is to extract an averagebackground noise level from patches with fewer channels. In our hands, when GIRK channelwas expressed at high density, basal average currents after patch excision often reachedamplitudes above 20 pA, whereas in lowdensity patches basal activity of 0.5–3 pA wereobserved. The latter easily allowed the calculation of the baseline which usually did not exceed2 pA in our experiments. In records of pseudomacroscopic currents, two additional methodsof calculation of average current can be utilized: (1) averaging all amplitudes (raw data) in theselected record without building an amplitude histogram (i.e. amplitudes of all points withinthe selected section of the record are summarized and divided by the number of points in thesegment); (2) fitting the amplitude histogram with Gaussian function (1 component), asexemplified in Fig. 3a. The position of the peak of the histogram on the X-axis, determinedgraphically or from Gaussian fit, corresponds to the total average current. Ī is obtained bysubtracting the baseline current estimated from low-density patches as explained above. Figure3b compares these two methods to the previously analyzed method of calculating the averagecurrent from the amplitude histogram, in 16 different patches of Gβγ-activated GIRK1/2expressed at high levels. It is clear that all three methods yield very close results.
It must be emphasized that for Po values close to 1 the form of amplitude histogram becomesprogressively asymmetrical due to the properties of binomial distribution and thus fitting itwith a single Gaussian is inappropriate. In GIRK channels, where Po is usually below 0.1 evenat saturating doses of Gβγ, this problem is never encountered.
Analysis of simulated dataIn order to test the limits of the method proposed above we utilized simulated data. We testedseveral factors which can influence the accuracy of implementation of the method. In particular,we tested the influence of Po, frequency of openings and signal to noise ratio (SNR). Anexample of simulated data with and without noise component is shown in Figure 4a and b. The
Yakubovich et al. Page 8
J Mol Neurosci. Author manuscript; available in PMC 2010 March 4.
NIH
-PA Author Manuscript
NIH
-PA Author Manuscript
NIH
-PA Author Manuscript

presence of simulated data without the noise component made the estimation of Postraightforward.
(17)
where Po, s− is open probability of simulated data before the imposition of noise component,
to,tot is total open time and Φ is the total recording time. For each record we calculated thePo,s
− and also the Po,s+ value (the latter stays for the open probability after noise component
imposition and consequently was estimated utilizing the method described above). The δ valuewas defined as
(18)
It can be seen in Figure 4 that the major contributing factor to the extent of deviation betweenthe Po,s
− and Po,s+ is the signal to noise ratio (SNR). For all open probabilities the δ value
changes up to 60 fold for a 4 fold change of SNR. Additionally, assuming adequate samplingrate, the fo has almost no effect on δ (for the simulation we have chosen the sampling rate of400–4000 Hz, respectively, in order to provide at least 2 sampling points for each openingevent). Furthermore, there was no significant difference between the δ values calculated byeither of the 3 methods of estimation of delimiter described in the present work.
DiscussionIn this work we present a simple and reliable method to assess very large changes in channelactivity in multichannel patches through the calculation of average current, Ī. We demonstratethat Ī can be calculated with high accuracy from amplitude histograms, or (at very high channeldensities) directly from raw data. The procedure is very simple and does not require the use ofany special software. Most importantly, we have shown that the calculation of average currentfrom amplitude histograms renders results very similar (within 2–6 %) to those obtained usingthe standard procedure of generation of event lists. The accuracy of calculation of averagecurrent from amplitude histograms or raw data was demonstrated here using records thatshowed low to intermediate channel activity, where calculation of Ī both from event lists andfrom amplitude histograms was possible. This finding allows the combined or alternative useof calculations of average current from event list and/or from amplitude histograms. In ouranalyzes of activation of GIRK by Gβγ, such combined use of the two methods wasindispensable in recordings that contained segments where the channel population behavedeither in a pseudo single channel manner (basal activity), where the event list was often theonly way to accurately calculate NPo, or in a pseudomacroscopic manner (after activation)where the construction of an event list was impossible. This pattern is frequently observed inpatch clamp recordings of GIRK channel activity in Xenopus laevis oocytes (Fig. 1), cardiaccells (Schreibmayer et al., 1996;Nemec et al., 1999) and neurons (Grigg et al., 1996) uponactivation by agonist or Gβγ. Similar kind of analysis has been previously implemented fordescription of GIRK channel activation by Gβγ and sodium (Ho and Murrell-Lagnado,1999;Peleg et al., 2002;Rishal et al., 2003;Ivanina et al., 2004) but its validity has not beenexplicitly tested.
Both methods mentioned above are directly related to integration of current amplitudes. It mustbe emphasized that integration of current amplitude requires manipulation of vast amount ofunprocessed data and consequently demands much more computer power and more specialized
Yakubovich et al. Page 9
J Mol Neurosci. Author manuscript; available in PMC 2010 March 4.
NIH
-PA Author Manuscript
NIH
-PA Author Manuscript
NIH
-PA Author Manuscript
software than the analysis of amplitude histograms which can be easily and rapidly processedby any spreadsheet analysis program. Average current values and sum of current amplitudesare directly proportional to open probability. However, while the ratio of average currents isequal to activation ration assuming constant single channel current amplitude and number ofchannels in patch, the same generally does not hold true for the ratio of sum of currentamplitudes. Indeed, same number of sample points is required for this. Consequently, simpleintegration of current amplitudes without calculation of average imposes limitation of lengthof stretches of activity which can be utilized for the calculation of the activation ratio.
Calculations of average current from amplitude histograms or from raw data are subject toseveral limitations. Our data clearly indicate that there is a lower limit to NPo below which thesimplified methods become inaccurate. The calculation of Ī from raw data is only valid whenthe baseline current is negligible compared to the current flowing via the channels, and istherefore usually applicable only for very large currents. Calculation from amplitudehistograms is much more accurate but it still cannot be applied to patches with very low NPo.Thus, as shown in Fig. 2, estimation of Ī in patches of intermediate density with currents of0.5 – 4 pA (NPo approximately between 0.25 and 2) deviated from estimates of Ī obtained fromevent lists by less than 3%. However, for patches with average currents of 0.07 – 0.4 pA(NPo of 0.03 – 0.2), this deviation reaches 4–8%. Thus, in records with NPo below 0.03,calculation of NPo and Ī from amplitude histograms may become unreliable, and the use ofevent lists is recommended.
Analysis of simulated data has demonstrated that the most important factor which can influencethe results of analysis based on amplitude histogram is the SNR (signal to noise ratio). This isquite an intuitive conclusion since the peak separation on the amplitude histogram is stronglydependent on SNR. The results of simulation thus support the conclusions drawn from theanalysis of real data, that low Po significantly hampers implementation of the methods basedon amplitude histogram for single-channel recordings. Indeed, differences between Po,s
+ andPo,s
− (δ) below 10 % were observed for Po,s− ∼ 0.05 and SNR of 4. On the other hand, δ above
30 % were calculated for SNR of 1 and same Po,s− (data not shown). The same would be true
for the accuracy of calculation of average current in single channel records using the histogrammethod. However, it must be noted that an absolute level of noise (e.g. 0.5 pA RMS) that canmake the histogram-based analysis of a single channel recording inaccurate, will becometolerable to negligible in multichannel recordings (since the signal increases, and thus SNRdecreases).
Additionally, unstable data with high extent of drifting will lead to smearing of the histogramand subsequent miscalculation of delimiter (Molleman, 2003). This limitation can be overcomeby selection of data segments in which the time dependent variation is minimal. Additionally,changes of baseline current value can occur during the recording, thus hampering the baselinesubtraction based on estimation of the baseline from the periods of low channel activity. Despitethe fact that this notion must be kept in mind, it was demonstrated above that baseline currentsgenerated by stable recording sets are relatively low comparing to the open channel current,and subtraction of an estimated baseline applied to recordings with high channel activity (>20pA) yields negligible effects. Furthermore, baseline current values can be instantly accessedduring or at the end of periods of high channel activity, e.g. by adding an inhibitor.
The choice and calculation of delimiter introduced only minor inaccuracies, at least in the caseof heterologously expressed GIRK channels (Fig. 2). In fact, a simple graphical estimation ofthe delimiter proved to be as reliable as two sophisticated numerical methods and thus can berecommended as the default method for the analysis of average current.
Yakubovich et al. Page 10
J Mol Neurosci. Author manuscript; available in PMC 2010 March 4.
NIH
-PA Author Manuscript
NIH
-PA Author Manuscript
NIH
-PA Author Manuscript

While we present only results with GIRK channel, it is clearly possible to generalize and extendthe use of the proposed methods to any other ion channel. This is particularly useful whensingle channel recordings are unavailable, for example in cells or cell areas where the densityof a certain type of channel in the plasma membrane is high, and/or when there is no intentionto conduct in-depth kinetic analysis calculations of single channel parameters. Calculations ofaverage current are highly suitable for the analysis of robust changes in channel activity causedby activators, inhibitors, or blockers of ion channels, to provide essential, physiologicallyrelevant information such as relative efficiency of such agents, extent of activation (Ra) orinhibition compared to basal activity.
Supplementary MaterialRefer to Web version on PubMed Central for supplementary material.
AcknowledgmentsThis work was supported by grants from NIH (GM68493 (N.D.) and GM60419 (C.W.D.)) and US-Israel BinationalScience Foundation (01-122, N.D. and C.W.D). The authors report no conflicts of interest.
ReferencesAlvarez O, Gonzalez C, Latorre R. Counting channels: a tutorial guide on ion channel fluctuation analysis.
Adv Physiol Educ 2002;26:327–341. [PubMed: 12444005]Bauer RJ, Bowman BF, Kenyon JL. Theory of the kinetic analysis of patch-clamp data. Biophys J
1987;52:961–978. [PubMed: 2447973]Blunck R, Kirst U, Riessner T, Hansen U. How powerful is the dwelltime analysis of multichannel
records? J Membr Biol 1998;165:19–35. [PubMed: 9705979]Colquhoun D, Hawkes AG. Relaxation and fluctuations of membrane currents that flow through drug-
operated channels. Proc R Soc Lond B Biol Sci 1977;199:231–262. [PubMed: 22856]Colquhoun D, Hawkes AG. On the stochastic properties of single ion channels. Proc R Soc Lond B Biol
Sci 1981;211:205–235. [PubMed: 6111797]Colquhoun, D.; Hawkes, AG. The principles of the stochastic interpretation of ion-channel mechanisms.
In: Sakmann, B.; Neher, E., editors. Single-Channel Recording. New-York: Plenum Press; 1995. p.397-482.
Dascal N. Signalling via the G protein-activated K+ channels. Cell Signal 1997;9:551–573. [PubMed:9429760]
Grigg JJ, Kozasa T, Nakajima Y, Nakajima S. Single-channel properties of a G-protein-coupled inwardrectifier potassium channel in brain neurons. J Neurophysiol 1996;75:318–328. [PubMed: 8822560]
Ho IH, Murrell-Lagnado RD. Molecular mechanism for sodium-dependent activation of G protein-gatedK+ channels. J Physiol 1999;520(Pt 3):645–651. [PubMed: 10545132]
Hosoya Y, Yamada M, Ito H, Kurachi Y. A functional model for G protein activation of the muscarinicK+ channel in guinea pig atrial myocytes. Spectral analysis of the effect of GTP on single-channelkinetics. J Gen Physiol 1996;108:485–495. [PubMed: 8972387]
Howe JR, Cull-Candy SG, Colquhoun D. Currents through single glutamate receptor channels in outside-out patches from rat cerebellar granule cells. J Physiol 1991;432:143–202. [PubMed: 1715916]
Ivanina T, Varon D, Peleg S, Rishal I, Porozov Y, Dessauer CW, et al. Gα1 and Gαi3 differentially interactwith, and regulate, the G protein-activated K+ channel. J Biol Chem 2004;279:17260–17268.[PubMed: 14963032]
Jackson MB. Ion channels. Single-channel analysis. Methods Enzymol 1992;207:729–746. [PubMed:1382210]
Jelacic TM, Sims SM, Clapham DE. Functional expression and characterization of G-protein-gatedinwardly rectifying K+ channels containing GIRK3. J Membr Biol 1999;169:123–129. [PubMed:10341034]
Molleman, A. Patch clamping: an introductory guide to patch clamp electrophysiology. J. Wiley; 2003.
Yakubovich et al. Page 11
J Mol Neurosci. Author manuscript; available in PMC 2010 March 4.
NIH
-PA Author Manuscript
NIH
-PA Author Manuscript
NIH
-PA Author Manuscript

Neher E, Stevens CF. Conductance fluctuations and ionic pores in membranes. Annu Rev Biophys Bioeng1977;6:345–381. [PubMed: 68708]
Nemec J, Wickman K, Clapham DE. Gβγ binding increases the open time of IKACh: kinetic evidencefor multiple Gβγ binding sites. Biophys J 1999;76:246–252. [PubMed: 9876138]
Peleg S, Varon D, Ivanina T, Dessauer CW, Dascal N. Gαi controls the gating of the G protein-activatedK+ channel, GIRK. Neuron 2002;33:87–99. [PubMed: 11779482]
Qin F, Auerbach A, Sachs F. Estimating single-channel kinetic parameters from idealized patch-clampdata containing missed events. Biophysical Journal 1996;70:264–280. [PubMed: 8770203]
Qin F, Auerbach A, Sachs F. Maximum likelihood estimation of aggregated Markov processes.Proceedings of the Royal Society of London. Series B: Biological Sciences 1997;264
Qin F, Auerbach A, Sachs F. A direct optimization approach to hidden Markov modeling for singlechannel kinetics. Biophysical Journal 2000a;79:1915–1927. [PubMed: 11023897]
Qin F, Auerbach A, Sachs F. Hidden Markov modeling for single channel kinetics with filtering andcorrelated noise. Biophysical Journal 2000b;79:1928–1944. [PubMed: 11023898]
Rishal I, Keren-Raifman T, Yakubovich D, Ivanina T, Dessauer CW, Slepak VZ, et al. Na+ promotesthe dissociation between Gα-GDP and Gβγ, activating G-protein-gated K+ channels. Journal ofBiological Chemistry 2003;278:3840–3845. [PubMed: 12488455]
Sachs F, Neil J, Barkakati N. The automated analysis of data from single ionic channels. Pflugers Arch1982;395:331–340. [PubMed: 6296760]
Schreibmayer W, Dessauer CW, Vorobiov D, Gilman AG, Lester HA, Davidson N, et al. Inhibition ofan inwardly rectifying K+ channel by G-protein α-subunits. Nature 1996;380:624–627. [PubMed:8602262]
Traynelis SF, Jaramillo F. Getting the most out of noise in the central nervous system. Trends Neurosci1998;21:137–145. [PubMed: 9554720]
Vivaudou MB, Singer JJ, Walsh JV Jr. An automated technique for analysis of current transitions inmultilevel single-channel recordings. Pflugers Arch 1986;407:355–364. [PubMed: 2430256]
Yakubovich D, Pastushenko V, Bitler A, Dessauer CW, Dascal N. Slow modal gating of single G protein-activated K+ channels expressed in Xenopus oocytes. J Physiol 2000;524(Pt 3):737–755. [PubMed:10790155]
Yakubovich et al. Page 12
J Mol Neurosci. Author manuscript; available in PMC 2010 March 4.
NIH
-PA Author Manuscript
NIH
-PA Author Manuscript
NIH
-PA Author Manuscript

Fig. 1.A representative recording of activation of GIRK1/2 channels by Gβγ. a, the complete record,starting with recording in the cell-attached mode, then excision into bath solution, and finallythe addition of 20 nM Gβγ. Periods of excision/air exposure and addition of Gβγ wereaccompanied by large electrical noise and are blanked. b, c zoom on two selected stretches ofthe record at higher resolution. Zero current level is indicated by arrow, and by a dotted linein the right trace. The numbers above recordings are the calculated values of Ī. Low tointermediate activity is observed before addition of Gβγ (b), and high level activity is observedafter the addition of 20 nM Gβγ (c). d and e show amplitude histograms corresponding to therecord shown in b and c, respectively.
Yakubovich et al. Page 13
J Mol Neurosci. Author manuscript; available in PMC 2010 March 4.
NIH
-PA Author Manuscript
NIH
-PA Author Manuscript
NIH
-PA Author Manuscript

Fig. 2.Analysis of Ī from amplitude histograms of GIRK1/2 activity in the presence of Gβγ. a showsan amplitude histogram of a 1 min interval of recording from an excised patch with intermediatedensity of GIRK1/2. Solid line corresponds to the fit of histogram with Gaussian (3 componentsaccording to equation 3, A1=6.4×10⁴ , A2=1.6×10⁴ , A3= 1870, μ1=.53, μ2=3.19, μ3=5.77,σ1=.38, σ2=.74, σ3=.94). The vertical dotted line represents the position of the delimiterdetermined from the above fit. A representative stretch of this record in shown in b, where thesolid line delineates idealized data, and dashed line shows the 50 % crossing amplitude utilizedfor idealization. c compares the net values of delimiters (after subtraction of the baselinecurrent) calculated using the three methods (graphical, numerical from Gaussian fit, and by
Yakubovich et al. Page 14
J Mol Neurosci. Author manuscript; available in PMC 2010 March 4.
NIH
-PA Author Manuscript
NIH
-PA Author Manuscript
NIH
-PA Author Manuscript

Howe et al. (Howe et al., 1991)) The threshold for the calculations utilizing 50 % crossingcriterion (from event list) was set as the graphical delimiter value. d presents a comparison ofĪ calculated from the amplitude histogram using delimiters shown in C, and Ī calculated fromthe from event list (left bar). e and f demonstrate the application of the methods illustrated ina–d to calculate Ī in 8 single channel patches where no overlaps were observed during entirerecording time (e) and 11 patches demonstrating intermediate level of activity (f). In each patchthe results are presented in the same way as in d. Insets show the average absolute deviationof Ī values calculated from the histograms using 3 different delimiters, from Ī derived from theevent list.
Yakubovich et al. Page 15
J Mol Neurosci. Author manuscript; available in PMC 2010 March 4.
NIH
-PA Author Manuscript
NIH
-PA Author Manuscript
NIH
-PA Author Manuscript

Fig. 3.Comparison of different methods of calculation of average current in patches withpseudomacroscopic behavior (Ī >20 pA). a exemplifies a 1-component Gaussian fit (solid line)to an amplitude histogram of a 1 min segment from the recording shown in Fig. 1c (close tothe end of record). b compares the values of Ī calculated in 16 representative high-activitypatches using three different methods: mean value of the amplitude histogram, Gaussian fit ofthe histogram and mean of raw data.
Yakubovich et al. Page 16
J Mol Neurosci. Author manuscript; available in PMC 2010 March 4.
NIH
-PA Author Manuscript
NIH
-PA Author Manuscript
NIH
-PA Author Manuscript

Fig. 4.Analysis of simulated data. a shows a representative 10 s interval of simulated activity, α= 10s−1 , β = 200 s−1 , b̅ =0, IΛ = 1, no noise component imposed, b shows the same record as inA but with a superimposed noise component with mean 0 and standard deviation of 0.2. c,calculation of differences between Po,s
+ and Po,s−, δ (%), for Po =0.05 and fo = 10 Hz. d,
calculation of δ (%) for Po =0.5 and fo = 10 Hz. e, calculation of δ (%) for Po =0.05 and fo =100 Hz. f, calculation of δ (%) for Po = 0.5 and fo = 100 Hz. Each point is an average of 5simulations (10 s each). Filled circles are for SNR of 10, inverted triangles for SNR of 4, filledsquares for SNR of 2.5.
Yakubovich et al. Page 17
J Mol Neurosci. Author manuscript; available in PMC 2010 March 4.
NIH
-PA Author Manuscript
NIH
-PA Author Manuscript
NIH
-PA Author Manuscript
Copyright © 2022 FDOKUMEN