Altruism or Money? Reducing Teacher Sorting using ...
53
Altruism or Money? Reducing Teacher Sorting using Behavioral Strategies in Peru * Nicolás Ajzenman † Eleonora Bertoni ‡ Gregory Elacqua § Luana Marotta ¶ Carolina Méndez Vargas || August 2020 Abstract Inequality in access to high-quality teachers is an important driver of student socioeconomic achievement gaps. We experimentally evaluate a novel nation-wide low-cost government pro- gram aimed at reducing one of its causes: teacher sorting. Specifically, we tested two behav- ioral strategies designed to motivate teachers to apply to job vacancies in disadvantaged schools. These strategies consisted of an "Altruistic Identity" treatment arm, which primed teachers’ al- truistic identity by making it more salient, and an "Extrinsic Incentives" arm, which simplified the information and increased the salience of an existing government monetary-incentive scheme rewarding teachers who work in underprivileged institutions. We show that both strategies are successful in triggering teacher candidates to apply to such vacancies, as well as make them more likely to be assigned to a final in-person evaluation in a disadvantaged school. The effect among high-performing teachers is larger, especially in the "Altruistic" arm. Our results imply that low- cost behavioral strategies can enhance the supply and quality of professionals willing to teach in high-need areas. JEL classification: I24, D91, I25 Keywords: Identity, Monetary incentives, Priming, Altruism, Prosocial behavior, Teacher sorting * AEARCTR-0004676. We thank Ruben Durante, Fernanda Estevan, Martin Fiszbein, Alejandro Ganimian, Guil- herme Linchand, Maria Lombardi, Veronica Montalva, Anne Sofie Olsen, Vladimir Ponczek, participants of the APPAM Conference, the IDB-Education BBL, the IDB Behavioral Group, and the IDB regional seminar on teacher assignment for their valuable comments. We thank the Ministry of Education of Peru for their willingness to collaborate, especially Anna Balbuena, Karim Boccio, Luz Jaramillo, Gelsys Meza, Cynthia Neira, and Carlos Venturini. We thank Ingrid Olea for the graphic component of the intervention. We gratefully acknowledge the Inter-American Development Bank for funding the research presented in this paper. The opinions expressed in this publication are those of the authors and do not necessarily reflect the views of the Inter-American Development Bank, its Board of Directors, or the countries they represent. The authors have no conflicts of interest or financial and material interests in the results. All errors are our own. † São Paulo School of Economics-FGV. E-mail: [email protected]. ‡ Inter-American Development Bank. E-mail: [email protected]. § Inter-American Development Bank. E-mail: [email protected]. ¶ Inter-American Development Bank. E-mail: [email protected]. || Inter-American Development Bank. E-mail: [email protected].
-
Upload
khangminh22 -
Category
Documents
-
view
0 -
download
0
Transcript of Altruism or Money? Reducing Teacher Sorting using ...

Altruism or Money? Reducing Teacher Sorting using
Behavioral Strategies in Peru*
Nicolás Ajzenman† Eleonora Bertoni‡ Gregory Elacqua§ Luana Marotta¶
Carolina Méndez Vargas||
August 2020
Abstract
Inequality in access to high-quality teachers is an important driver of student socioeconomicachievement gaps. We experimentally evaluate a novel nation-wide low-cost government pro-gram aimed at reducing one of its causes: teacher sorting. Specifically, we tested two behav-ioral strategies designed to motivate teachers to apply to job vacancies in disadvantaged schools.These strategies consisted of an "Altruistic Identity" treatment arm, which primed teachers’ al-truistic identity by making it more salient, and an "Extrinsic Incentives" arm, which simplifiedthe information and increased the salience of an existing government monetary-incentive schemerewarding teachers who work in underprivileged institutions. We show that both strategies aresuccessful in triggering teacher candidates to apply to such vacancies, as well as make them morelikely to be assigned to a final in-person evaluation in a disadvantaged school. The effect amonghigh-performing teachers is larger, especially in the "Altruistic" arm. Our results imply that low-cost behavioral strategies can enhance the supply and quality of professionals willing to teach inhigh-need areas.
JEL classification: I24, D91, I25
Keywords: Identity, Monetary incentives, Priming, Altruism, Prosocial behavior, Teacher sorting
*AEARCTR-0004676. We thank Ruben Durante, Fernanda Estevan, Martin Fiszbein, Alejandro Ganimian, Guil-herme Linchand, Maria Lombardi, Veronica Montalva, Anne Sofie Olsen, Vladimir Ponczek, participants of the APPAMConference, the IDB-Education BBL, the IDB Behavioral Group, and the IDB regional seminar on teacher assignmentfor their valuable comments. We thank the Ministry of Education of Peru for their willingness to collaborate, especiallyAnna Balbuena, Karim Boccio, Luz Jaramillo, Gelsys Meza, Cynthia Neira, and Carlos Venturini. We thank Ingrid Oleafor the graphic component of the intervention. We gratefully acknowledge the Inter-American Development Bank forfunding the research presented in this paper. The opinions expressed in this publication are those of the authors and donot necessarily reflect the views of the Inter-American Development Bank, its Board of Directors, or the countries theyrepresent. The authors have no conflicts of interest or financial and material interests in the results. All errors are our own.
†São Paulo School of Economics-FGV. E-mail: [email protected].‡Inter-American Development Bank. E-mail: [email protected].§Inter-American Development Bank. E-mail: [email protected].¶Inter-American Development Bank. E-mail: [email protected].||Inter-American Development Bank. E-mail: [email protected].

1 Introduction
Public education is fundamental to providing equality of opportunity for students of different socio-
economic backgrounds. Yet, in many countries, the widespread problem of teacher sorting (Jackson
2009, Lankford et al. 2002, Boyd et al. 2013, Pop-Eleches and Urquiola 2013) threatens this role:
low-income students are more likely to attend schools with less qualified teachers (or understaffed
schools), thus exacerbating potential achievement gaps (Sass et al. 2012, Thiemann 2018). This
problem is not only detrimental in terms of equity, but also in terms of efficiency, as the systems
become congested, the market does not clear and many teachers end up being unemployed. Although
this problem has been well-documented in the literature, policy responses have primarily focused
on providing monetary incentives, which not only tend to be expensive but do not always have a
significant effect on teachers’ employment decisions (Glazerman et al. 2012, Rosa 2017, Elacqua
et al. 2019).
In this paper, we present the results of an experimental evaluation of a low-cost nation-wide govern-
ment program designed to reduce the sorting of candidates in the teacher selection process in Peru.1
This novel program consisted of two behavioral strategies aimed at motivating teacher candidates to
apply to job openings in disadvantaged schools, which are typically low-performing and understaffed.
The strategies were designed based on insights from the behavioral economics and psychology liter-
ature, particularly with regard to psychological frictions and the determinants of altruistic behavior.
The decision to work in a disadvantaged school could be seen as a prosocial behavior, as the intent
is to benefit others (i.e. students most in need). Prosociality is commonly fostered by a variety of
motivations, which can be extrinsic (e.g., monetary incentives) and intrinsic (e.g., feelings of satis-
faction derived from helping others in a purely altruistic way, Ariely et al. 2009).2 Likewise, identity
factors can also matter: teachers who perceive themselves as prosocial or altruistic (i.e., agents of
social change) may apply to work in a disadvantaged school in an effort to align their behavior with
the norms associated with their perceived identity (Akerlof and Kranton 2000, Kessler and Milkman
2016).
Relying on such insights, candidates in Peru’s centralized 2019 teacher selection process (Concurso
de Nombramiento)– where participants apply for positions through an online platform after having
passed a qualifying exam (Prueba Única Nacional - PUN)–were randomly assigned to one of two
treatments implemented by the government to either make altruistic identity or external rewards more
1 The experiment was conducted in every region of Peru, with the exception of the metropolitan area of Lima andthe Constitutional Province of Callao. It covered 86% of the teachers applying to positions and 73% of teachersselecting vacancies in 2019.
2 This is not an exhaustive list. Intrinsic motivations could include, for instance, a sentiment of fulfillment fromworking in a challenging environment. Image motivation might also be a factor.
2

salient. Both strategies caused a shift in teachers’ preferences and allocation patterns (on average and
among high-performing teachers) towards disadvantaged schools, thus contributing to a reduction in
teacher sorting.
In the "Altruistic Identity" (henceforth "Identity") treatment arm, the program sought to make teach-
ers’ prosocial/altruistic identity salient through a combination of three elements: (a) a five-minute
"introspection exercise" that asked teachers to reflect and write about their motivations for choosing
teaching as a career, (b) a set of text-messages priming their prosocial/altruistic identity (e.g., "Thank
you for being an agent of social change"), and (c) pop-ups on the online application platform designed
to prime this facet of their identity.3
In the "Extrinsic Incentives" (henceforth "Extrinsic") treatment arm, the program made the monetary
incentives for teachers working in disadvantaged schools 4 simpler and easier to understand through a
combination of three elements: (a) a five-minute exercise that asked teachers to reflect and write about
the potential benefits associated with these monetary incentives (e.g., higher salaries or career path
advantages from working in disadvantaged schools), (b) a set of text-messages reminding them about
the rewards associated with these schools, and (c) pop-ups on the online application platform that
showed simplified information related to the extrinsic rewards. In simplifying the way the information
was presented and highlighting the incentives, the strategy aimed to capture candidates’ attention
while also reducing the psychological frictions associated with the informational complexity of the
process and the structure of the incentives.
Finally, the control/placebo arm replicated a similar structure as in the treatment arms: a neutral
reflection exercise, complemented by a set of neutral text-messages (the same number of commu-
nications, but providing general information about the application process, without any components
related to altruism, social change, or monetary rewards), and neutral pop-ups on the online application
platform. Note that in all of the conditions, “disadvantaged” schools were labeled on the platform,
making them easily identifiable by the candidates. To this end, we placed indicative icons next to
each disadvantaged school that were identical in each of the three conditions (see Figure 1).
We find that both strategies were similarly effective in shaping teachers’ preferences. Candidates in
the treatment arms were significantly more likely to apply to vacancies in disadvantaged schools and,
in the case of the "Identity" treatment, to complete the final stage of the teacher selection process in
that school.5 In particular, we find that the proportion of disadvantaged schools included in teachers’
3 The phrasing of the text messages and pop-ups followed Bryan et al. 2011. That is, they were mostly framed asthe enactment of a personal identity (e.g., “being an agent of social change”) as opposed to a simple action (e.g.,“someone who creates change”).
4 Emphasizing the monetary or career-related benefits of a job has recently also been employed in other contexts, suchas the public sector, as shown by Ashraf et al. 2018.
5 We provide a detailed description of the teacher selection process in Section 2.
3

choice sets was respectively 1.9 and 2 pp higher in the "Identity" and "Extrinsic" arms (versus the
control, from a baseline of 46%). Furthermore, the likelihood of being assigned to the final in-person
evaluation in a disadvantaged school was 2.7 pp higher in the "Identity" treatment (from a baseline of
49%).
Interestingly, we find suggestive evidence of the effects being driven by male teachers. Indeed, the
effect on the proportion of disadvantaged schools included in male teachers’ choice set was 3.4 and
3 pp higher in the "Identity" and "Extrinsic" arms, respectively. Similarly, the likelihood of being
assigned to the final in-person evaluation in a disadvantaged school was 6 pp higher in the "Identity"
treatment among male teacher candidates. This result is perhaps unsurprising considering that female
teachers are usually less likely to select schools with longer commuting times (such as those targeted
in the intervention) and are thus less likely to be affected by the treatment.6
Finally, we find that the effect of both of the strategies on the probability of being assigned to the
final in-person evaluation in a disadvantaged school was larger among high-performing teachers, in
particular in the "Identity" arm. The probability that a high-performing teacher (that is, a teacher
who scored above the median on the qualifying exam) is assigned to the final in-person evaluation in
a disadvantaged school was 4.7 pp higher in the "Identity" arm and 3.3 pp higher in the "Extrinsic"
arm, versus the control group. This is an important result, as it suggests that such strategies might help
to successfully mitigate the widespread problem of teacher sorting in education, and the consequent
widening of the socioeconomic achievement gap (Thiemann 2018).7 8
Our paper relates to several strands of the literature in behavioral economics and education. First, it
builds on research on teacher sorting and inequality. A vast literature shows that low-income and low-
performing students are more likely to attend schools with less qualified teachers (Boyd et al. 2006,
Dieterle et al. 2015, Feng and Sass 2018, Lankford et al. 2002, Jackson 2009, Sass et al. 2012) and
that limited access to better teachers has a negative impact on their educational outcomes (Aaronson
et al. 2007, Sass et al. 2012, Thiemann 2018). However, relatively little work has been conducted on
the strategies that might mitigate teacher sorting. Moreover, most of these studies focus on monetary
incentives, which have been found to have a small or non-significant impact on teachers’ preferences
for disadvantaged schools (Clotfelter et al. 2008a, Falch 2011, Glazerman et al. 2012, Springer et al.
6 See for instance Bertoni et al. 2019.7 Because the targeted schools (i.e., "disadvantaged schools") are typically less prone to being selected by candidates,
the Peruvian government provides additional incentives for teachers who decide to work in these institutions: mon-etary rewards and the possibility of more rapid professional advancement. Since this external rewards incentivescheme is in place in all three conditions, the results of this experiment should be interpreted as the effect of the twointerventions on teachers’ preferences and allocation patterns.
8 While we also document an increase of approximately 1 pp in the probability of ultimately being assigned to adisadvantaged school (2.5 pp among high-performers and 3.1 pp among male teachers), the point estimates are notprecise enough to detect a significant effect. The p-values for high-performing and male teachers is 0.11. This is tobe expected, given that the final allocation depends on more discretionary factors, making the process more noisy.
4

2016, Rosa 2017, Bueno and Sass 2018, Feng and Sass 2018, Elacqua et al. 2019). We add to this
literature by showing how a novel low-cost behavioral intervention can complement and improve the
effectiveness of extrinsic rewards.
Second, our paper intersects with a growing literature on the economics of identity. Numerous studies
in economics and psychology show that identity is malleable and that the facets of one’s sense of self
(gender, profession, ethnicity, religion) can be salient at different moments (Nolan et al. 2008). Since
deviating from the prescriptions associated with one’s identity is costly (Akerlof and Kranton 2000),
people endeavor to adjust their behavior to align with their own identity. Interventions that prime
specific facets of individuals’ identity and thus make them salient have accordingly proven to be
effective in influencing behavior in a number of contexts.
For instance, Kessler and Milkman 2016 show that priming the facet of individuals’ identity asso-
ciated with a generosity norm significantly increased donations. Similarly, Benjamin et al. 2010
demonstrate that making ethnic identity salient affects individuals’ risk aversion in a way that is con-
sistent with stereotypes. Meanwhile, Benjamin et al. 2016 provide evidence that priming religious
identity affects key economic decisions, such as the contribution to public goods. We complement
these papers in several ways. First, unlike most of the experimental literature on this topic (Kessler
and Milkman 2016 being a remarkable exception), our setting is a large-scale field experiment, as
opposed to a lab experiment. Second, we show how identity priming affects real-life decision making
in a high-stake context. In particular, our study provides experimental evidence that identity affects a
relevant yet little explored economic domain: individuals’ employment decisions.
Our paper is also related to the literature on the ways external rewards affect prosocial or altruis-
tic behavior (Deci 1975, Bénabou and Tirole 2006). The empirical evidence thus far is mixed. In
some contexts, scholars document a crowding-out effect (Gneezy and Rustichini 2000, Frey and
Oberholzer-Gee 1997 and Mellström and Johannesson 2008), while others show a positive effect of
economic incentives on prosocial behavior (Lacetera et al. 2012, Goette and Stutzer 2020, Lacetera
et al. 2014). We complement such studies by showing that, even without varying the real economic
incentives, making them more salient has a significant positive effect on prosocial behavior. This
means that, if there was crowding-out, it was offset by the effect of the external rewards.
Finally, our paper builds on the literature that shows how subtle reductions in psychological frictions
can improve take-up rates in diverse settings, from student applications for financial aid (Bettinger
et al. 2012), to social benefits claims (Bhargava and Manoli 2015). With specific regard to incentives
for teachers, empirical evidence suggests that the eligibility criteria and differential compensation
schemes often appear complex to teachers (Clotfelter et al. 2008b). Our study contributes to this lit-
erature by showing how a subtle intervention that makes information on monetary rewards both more
5

salient and easier to understand can significantly increase the effectiveness of financial incentives
programs.
Furthermore, the potential policy implications of these insights is substantial. The strategies we eval-
uate here were designed to address a fundamental problem in education and, more generally, in de-
velopment: teacher sorting and teacher shortage in vulnerable areas. From the perspective of the
teachers, diversifying their options could be very beneficial, as they can increase their chances of
getting a job. When most teachers apply to few job vacancies, the system becomes very congested
and many candidates end up without a position (in 2018, for instance, out of the 22,000 teaching
candidates that applied to vacancies after passing the qualifying exam, only 46% were assigned to a
full-time permanent position).
Moreover, reducing teacher sorting is very relevant for equity purposes. Indeed, teachers are a crucial
input in the education production function as they have a significant effect on students’ test scores
(Rivkin et al. 2005, Kane and Staiger 2008), non-cognitive outcomes such as absenteeism and school
suspension (Ladd and Sorensen 2017, Jackson 2018), as well as long-term outcomes, including col-
lege attendance, earnings, and teenage pregnancy (Chetty et al. 2014). Importantly, teachers’ impact
has been found to be larger among low-performing and low-income students (Aaronson et al. 2007,
Araujo et al. 2016, Marotta 2019, Elacqua and Marotta 2020). Yet, disadvantaged schools experience
more severe shortages of teachers and often fail to attract higher quality professionals (Sutcher et al.
2016, Dee and Goldhaber 2017, Bertoni et al. 2020).9 The concentration of teacher shortages and lack
of high-quality instructors in more vulnerable schools has serious implications for social inequalities
in education.
Our paper shows that low-cost, easy to scale, behavioral strategies can help to improve the equity and
efficiency of the system, by mitigating teacher shortages in disadvantaged schools and increasing the
flow of qualified teachers to low-performing institutions.
We proceed as follows. Section 2 provides background information on the teacher selection process
in the Peruvian public school system. Section 3 describes the characteristics of the disadvantaged
schools and the external rewards scheme. Section 4 presents the experiment while Section 5 intro-
duces the data and the empirical strategy. Section 6 provides the main results and interpretation.
Finally, Section 7 concludes.
9 According to the literature, teachers have stronger preferences for specific school characteristics. In general, theyprefer to work close to where they live or to where they grew up, as well as prefer to teach in urban schools (Boydet al. 2005, Reininger 2012, Rosa 2017, Bertoni et al. 2019). Moreover, teachers tend to avoid schools with higherconcentrations of low-income and low-performing students (Carroll et al. 2000, Engel et al. 2014, Bertoni et al.2019).
6

2 Institutional Context
2.1 Government efforts to reduce teacher sorting in Peru
In Peru, teacher sorting has always been a concern for the central government, for its harmful impli-
cation for students in disadvantaged schools and for its inefficiency (that is, in a "congested" market
like Peru’s teacher allocation system, many teachers end up without a position, while many vacancies
remain unfilled). Many of the government policies are, thus oriented towards alleviating this prob-
lem. Among those, probably the most important one is a policy that rewards teachers who work in
disadvantaged and understaffed schools with a salary enhancement and faster career progression.
The government has also been working to improve the efficiency of the teacher allocation system,
for instance, adjusting the algorithm that assign teachers to school vacancies, improving the usabil-
ity of the application platform, and increasing information about school vacancies so that teaching
candidates can make more informed choices. In this context, and given budget constraints in the last
few years, Peru’s Ministry of Education has been working on several low-cost strategies to improve
educational policies10.
The government policies evaluated in this paper aimed at improving the quality and transparency
of information provided throughout the teacher application process with an objective to motivate
teachers to apply to understaffed schools, while not restricting their choices. To achieve this goal, the
messages used in the treatment were tested in focus groups organized by the government with local
teachers in order to ensure that the information was clear and not misleading. Moreover, the platform
clearly stated that none of the exercises involved in the treatment were mandatory and that they would
not have any consequences to the application results.
2.2 Teacher selection process in the Peruvian public school system
The government program under analysis was implemented during the 2019 teacher selection process,
which followed the standard procedures that have governed the system since 2015.11 To be eligible
to apply for a teaching position in the public system, candidates must hold a bachelor’s degree in
education as well as pass two consecutive evaluation stages: a national-level assessment and then a
final in-person evaluation.
10 For instance, in 2016, Peru launched the "MineduLAB", an innovation laboratory that promotes innovation andlearning through the design, implementation, and evaluation of cost-effective educational policy interventions. Seehttp://www.minedu.gob.pe/minedulab/.
11 The most relevant change being that from 2017 onward teachers could select an unlimited number of vacancies oftheir choice, while in 2015 they could select a maximum of 5.
7
The first stage is carried out by the Ministry of Education (MINEDU) and includes a standardized
written test (the Prueba Única Nacional - PUN) comprising three sub-tests: logical reasoning (25%),
reading comprehension (25%), and pedagogical knowledge of the specialization (50%). Applicants,
are evaluated within a specific area of specialization in terms of school level (pre-primary/primary/secondary)
and subject (e.g. secondary sciences), and must answer at least 60% of the questions correctly on each
sub-test in order to pass on to the next stage. The PUN passing rate has been consistently low in each
teacher selection process: 13% in 2015, 11% in 2017, 12% in 2018 and 7% in 2019.
Only those candidates who score above the required threshold are eligible to apply to school vacancies
within their area of specialization and within one of the 26 regions of Peru (our sample covers 24 out
of the 26 regions).12 In this stage, candidates select and rank their preferred vacancies, choosing
as many available posts as they like. The MINEDU uses an algorithm that takes into account the
PUN score and the candidates’ ranked preferences, ultimately assigning them up to two vacancies.
Candidates who missed the first round of vacancy selection or who were assigned to only one or
no vacancy can participate in a second round of vacancy selection. Each vacancy can have up to 6
candidates.13
Once candidates have been assigned to up to 2 of their preferred school vacancies, they are assessed
through a final in-person evaluation, which is carried out by the school or by the local education
administrative unit (Unidad de Gestión Educativa Local - UGEL) in the case of a single-teacher
institution. This final stage of the selection process includes an examination of the teacher’s résumé
(25%), a personal interview (25%), and a classroom observation (50%). To pass this final evaluation,
candidates need a score of 30 points (out of 50) on the classroom observation component.
Finally, the MINEDU uses the weighted sum of the scores obtained at the national stage and for the
final in-person evaluation (the former has a weight of 67% on the final score) to allocate teachers
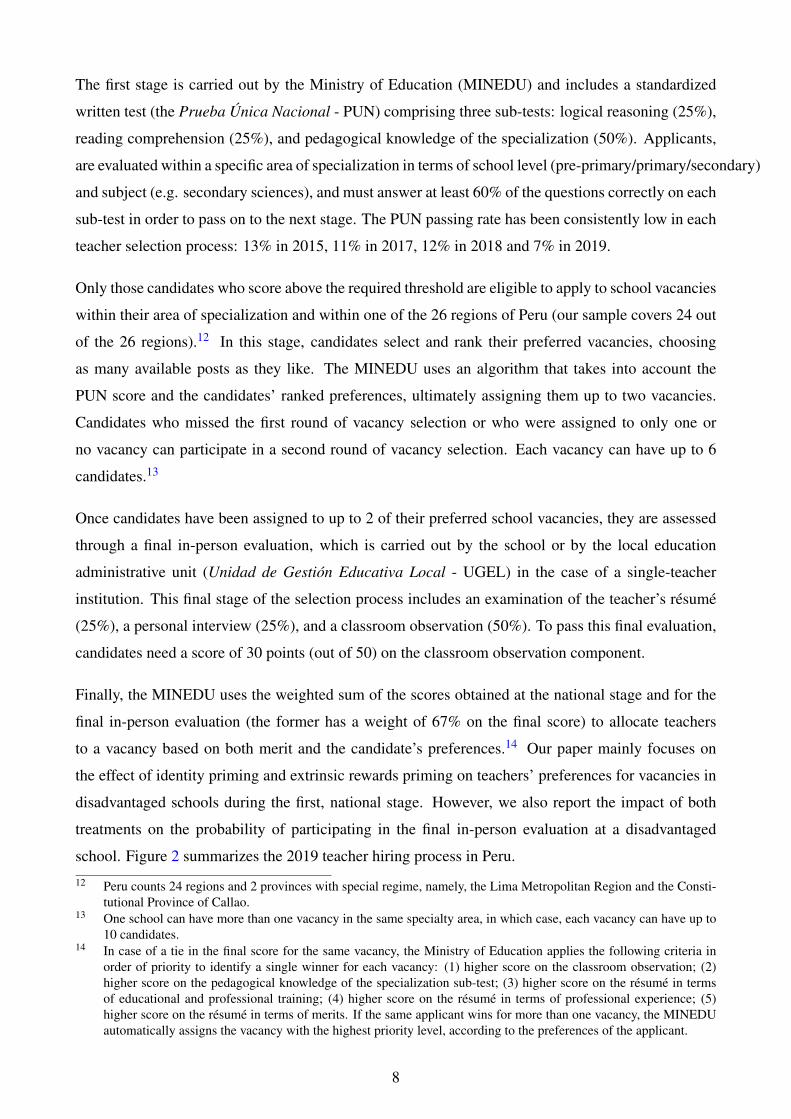
to a vacancy based on both merit and the candidate’s preferences.14 Our paper mainly focuses on
the effect of identity priming and extrinsic rewards priming on teachers’ preferences for vacancies in
disadvantaged schools during the first, national stage. However, we also report the impact of both
treatments on the probability of participating in the final in-person evaluation at a disadvantaged
school. Figure 2 summarizes the 2019 teacher hiring process in Peru.
12 Peru counts 24 regions and 2 provinces with special regime, namely, the Lima Metropolitan Region and the Consti-tutional Province of Callao.
13 One school can have more than one vacancy in the same specialty area, in which case, each vacancy can have up to10 candidates.
14 In case of a tie in the final score for the same vacancy, the Ministry of Education applies the following criteria inorder of priority to identify a single winner for each vacancy: (1) higher score on the classroom observation; (2)higher score on the pedagogical knowledge of the specialization sub-test; (3) higher score on the résumé in termsof educational and professional training; (4) higher score on the résumé in terms of professional experience; (5)higher score on the résumé in terms of merits. If the same applicant wins for more than one vacancy, the MINEDUautomatically assigns the vacancy with the highest priority level, according to the preferences of the applicant.
8

3 Disadvantaged schools and the external rewards scheme
In order to address teacher sorting, the program targeted disadvantaged schools. Indeed, such insti-
tutions tend to be avoided by teachers and are therefore more likely to suffer instructor shortages as
well as have a higher proportion of temporary and low-performing teachers. Not surprisingly, these
schools are often concentrated in the most vulnerable areas.
To this regard, Table 1 shows that out of the 12,300 basic education schools that had vacancies in
the 24 regions of Peru in 2019, 6,424 (52%) were not selected by any candidate at the national stage.
The difference in terms of observable characteristics between these two groups of schools is striking
and illustrates teacher preferences for more advantaged institutions: those not selected are notably
more rural, farther from the province capital, with less access to basic services, and with a greater
proportion of low-performing students (these preferences are consistent with the findings in other
papers; see, for instance, Bertoni et al. 2019).
In light of such patterns and preferences, in 2013 the Peruvian government implemented a reward
scheme to attract teachers to disadvantaged schools. Regardless of the type of contract, teachers’
monthly salaries are composed of a basic wage (Remuneración Integral Mensual - RIM), incentives,
benefits, and bonuses. The RIM is determined according to the teacher salary scale and working
hours. The salary scale is composed of 8 levels, where the (8th) highest level corresponds to 210%
of the lowest salary level. All new teachers in the public system receive the first (lowest) salary level
of S/2200 (approx. $650).15 Permanent teachers can increase their salary through public contests
after completing the time requirements in each level, while temporary teachers only receive the salary
amount corresponding to the lowest level.
The monetary incentives are offered to teachers who work in schools in certain locations and with
specific characteristics (see Table 2). Locations include: (1) rural areas, spanning from 3% to 23% of
the basic salary according to the “gradient of rurality,” defined at the central level based on population
size and accessibility to the nearest provincial capital (i.e., Rural 1, Rural 2, and Rural 3, where Rural
1 defines the most remote schools); (2) frontier areas, corresponding to 5% of the basic salary; and
(3) the Valle de los Ríos Apurímac, Ene y Mantaro (VRAEM), a remote area with high levels of
poverty, corresponding to 14% of the basic salary. School characteristics include: (1) single-teacher
institution, corresponding to 9% of the basic salary; (2) multi-grade school, corresponding to 6%
of the basic salary; and (3) bilingual school, corresponding to 7% of the basic salary. Teachers can
receive up to 5 incentives if they are not mutually exclusive, and permanent and temporary teachers
receive the same amounts. Alva et al. 2017 analyze Peru’s teacher compensation scheme and find
15 This amount increased to S/2300 in 2020.
9

that offering higher wages for teachers in Rural 1 schools increases the probability that vacancies are
filled by 10 percentage points.
In addition to monetary rewards, there are also non-monetary incentives for permanent teachers who
work in disadvantaged schools. For example, working in a rural or frontier area increases permanent
teachers’ reallocation opportunities and shortens the time of service required before being eligible to
apply for a higher salary scale. In other words, teachers in these schools can advance their careers at
a faster pace.
The schools targeted by the government–referred to as “disadvantaged schools”–are those institutions
that fall under this incentive scheme (rural of any type, in the VRAEM area, in frontier regions, bilin-
gual, single-teacher and/or multi-grade). Two premises guided the implementation of the behavioral
intervention. First, that the choice of school by the government is based on an objective criterion
(i.e., real needs of the government/education system). Second, that we would test the two strategies
targeting exactly the same schools. Since one of the strategies endeavors to prime existing extrinsic
rewards, the other strategy could target only those schools that were eligible for both the monetary
and non-monetary scheme.
There is consequently an important caveat to the interpretation of our findings. Since the evaluation
targeted schools that were eligible for the governments’ reward scheme, we consequently interpret
the results of the "Identity" treatment as the effects of making altruistic identity salient on teachers’
preferences only when an extrinsic reward is already in place.
Figure 3 presents the distribution of disadvantaged schools across the 24 regions of Peru, while Figure
4 shows that the targeted (“disadvantaged”) schools are notably poorer, farther away from the province
capitals, and more likely to be under-staffed and have temporary and low-performing teachers. Thus,
by definition, if the treatments are effective, they can reduce the sorting of teachers across schools.
4 Experimental design
The experiment was implemented in the 2019 Peruvian national teacher selection process. The eval-
uation involved 11,568 teacher candidates who successfully passed in the national assessment stage
of the selection process in all regions of Peru with the exception of those in the Lima Metropoli-
tan Region and the Constitutional Province of Callao (our sample represents approximately 86% of
the total pool of applicants in Peru).16 Note that these candidates are at the top of the performance
16 The experiment excluded these areas as their schools do not provide the same scheme of incentives as those thatapply to the rest of the country.
10

distribution given that the national assessment stage is highly selective: in 2019, out of the 183,569
participating teacher candidates, only 11,568 (6%) passed the PUN and could participate in the final
evaluation stage. Out of these 11,568 candidates, 9,690 (84%) actually ranked their preferences while
the remaining 16% dropped out of the process.
We randomly assigned these 11,568 teacher candidates to three groups, stratified by region: 3,861
(33%) were assigned to a control group (henceforth, Control - C) and received the “Neutral”/placebo
intervention, 3,852 (33%) were assigned to the "Identity" treatment group, and 3,855 (33%) were
assigned to the "Extrinsic" treatment group. Finally, we excluded from the sample the candidates
located in districts where there was no variation in vacancies in terms of disadvantaged schools.
In other words, either districts where all of the available vacancies were located in disadvantaged
schools or districts where there were no vacancies in disadvantaged schools (this restriction excludes
2,085 individuals). We also excluded teacher candidates who were applying to special and alternative
education programs (167 individuals). Our final sample comprises 7,217 individuals. The experiment
was conducted between August and September 2019 and combined three components – text messages,
an online exercise, and pop-ups – described in detail below. Every effort was made to ensure that
structure was as similar as possible across the three groups.
The "Identity" treatment arm takes inspiration from studies in behavioral economics, cognitive psy-
chology, and the economics of identity. While teachers’ identities have multiple facets, a vast litera-
ture shows that norms or prescriptions related to altruism and prosocial behavior are notably present
in instructors’ motivation and sense of self. Such norms include the importance of helping children to
thrive, making a contribution to society or, more generally, assisting others (Brookhart and Freeman
1992, Saban 2003, OECD 2005, Richardson and Watt 2006, Thomson et al. 2012). This treatment arm
was designed to make these prescriptions more salient right before teacher candidates chose specific
school vacancies.
The "Extrinsic" treatment arm was guided by two strands of the behavioral economics literature. First,
a number of papers emphasize the power of salience in capturing individuals’ attention (Taylor and
Thompson 1982, Kahneman 2003). Even when the necessary information is readily available, making
a particular feature of the latter more or less apparent has been shown to drastically affect choices
in different settings, particularly in the presence of limited attention or cognitive overload (see for
instance Chetty et al. 2009, DellaVigna and Pollet 2009, Ajzenman and Durante 2020). Although the
external rewards scheme was present in every condition, this arm aimed to make it prominent at a
targeted moment. Second, this "Extrinsic" strategy draws on the behavioral economics literature on
psychological frictions (Bhargava and Manoli 2015, Mani et al. 2013). Such studies demonstrate that
psychological frictions associated with informational complexity can affect individuals’ economic
11

decisions (Bettinger et al. 2012, Hoxby et al. 2013, Bhargava and Manoli 2015). By simplifying
the way information was presented, this treatment aimed to reduce informational complexity and
confusion.
Finally, the control/placebo arm replicated the structure of the treatment arms, providing more general
information that did not prime either individual’s intrinsic or extrinsic motivations.
4.1 Component I (8/2/2019 - 9/7/2019): Text messages
A total of 10 text messages, summarized in Table 3 (reported in original language in Table A1), were
delivered to the candidates in each group during the application process. 17 Although the number and
frequency of the messages were identical in each condition, their content varied in order to emphasize
either the altruistic identity facet, extrinsic rewards, or neither in the case of the control.
Component I - "Identity" treatment arm
The “Identity” text messages were based on the idea, as shown in several papers, that prosocial be-
havior can be fostered in different settings using priming techniques that make altruistic identity more
salient. For instance, Kessler and Milkman 2016 demonstrate that priming altruistic identity with sim-
ple reminders in donation request letters (such as “date of last donation” or “community belonging”)
significantly increased the likelihood of previous donors contributing again. In our setting, general
reminders (e.g., "In a few days, you will be able to select your preferred vacancies") were sent along
with messages aimed specifically at priming teachers’ altruistic identity, such has, “Thank you for im-
proving lives” (message #1), “Thank you for being an agent of social change” (message #2) or “Thank
you for choosing to improve lives” (message #6). Another text emphasized their “teacher vocation”
(#3), similar to the approach used in Kessler and Milman’s (2016) letters. Lastly, in light of prior
research (Aaronson et al. 2007, Araujo et al. 2016), the text messages sent in this treatment arm also
underscored that, in certain schools, teachers could have a greater impact on student learning. The idea
being to remind teachers that they belong to a group of people characterized by norms/prescriptions
involving a commitment to social change. The 10 text messages can be summarized as follows:
1. Identity: 6 messages containing tailored information for the treatment group, which empha-
sized teachers’ altruistic identity.
2. General information: 4 general reminders messages, identical for all teachers (treatments and
control). These texts provided basic information relevant for all the candidates: information
17 We were able to verify that 97% of the candidates in both treatment arms received the text messages, whereas textmessages were successfully delivered to 100% of the candidates in the control group.
12

about the application rounds, extension dates, and reminders to make a selection (if they hadn’t
already done so).
Component I - "Extrinsic" treatment arm
Messages in this condition were designed to make the incentive benefits (salary enhancement and
faster career progression) provided to teachers who work in disadvantaged schools more salient and
easier to understand. For instance, message 1 reminded candidates that working in disadvantaged
schools could increase their salary by up to S/1150 (nearly $350) and message 3 pointed out that they
could advance faster in their careers if they worked in a disadvantaged school. The 10 texts consisted
of:
1. External rewards: 6 messages containing tailored information for the treatment group, which
emphasized monetary incentives and the possibility of a more rapid career advancement when
working in a disadvantaged school.
2. General information: 4 general reminder messages, identical for all teachers (treatments and
control). These texts provided basic information relevant for all the candidates: information
about the application rounds, extension dates, and reminders to make a selection (if they hadn’t
already done so).
Component I - "Control/Placebo" arm
All 10 messages in this condition were general and neutral, and made no reference to either the altru-
istic facet of teachers’ identity or to the external rewards scheme. They provided basic information
relevant for all candidates: information about the application rounds, extension dates, and reminders
to make a selection (if they hadn’t already done so).
4.2 Component II (8/7/2019 - 9/7/2019): Online exercise
The second component was implemented on the online platform, just before candidates made their
choice as to the vacancies to which they preferred to apply. At this crucial moment, they were asked
(in both the treatment arms and the control) to complete a voluntary written exercise. While the
structure of the exercise was the same for all groups, the question asked varied in each condition. The
complete set of questions is presented in Table 4, and in its original language in Table A2.
Component II - "Identity" treatment arm
13

Individuals in this group were asked to complete an “introspection exercise,” designed to prime teach-
ers’ altruistic identity. Specifically, the platform asked them to take five minutes to share the main
reasons why they had chosen to become teachers.
This component draws on other papers that have used similar techniques to prime facets of individu-
als’ identity. A prototypical example is Cohn et al. 2014, in which the authors prime bank employees’
professional identities by asking questions about their professional background (e.g., “At which bank
are you presently employed?”, “What is your function at this bank?”). Using a similar procedure, Ben-
jamin et al. 2010 make ethnic identity salient by asking questions such as “What languages do you
know?”, “Do your parents or grandparents speak any language other than English?”, “What language
do you speak at home?”, while LeBoeuf et al. 2010 ask questions such as “Where were you born?” or
“What is your favorite Chinese holiday?” To maximize the effectiveness of this type of intervention,
the exercise implemented here varied in two ways. First, a single question required teachers to pro-
vide a comparatively more elaborated answer (as opposed to responses to multiple, simple questions).
Second, teacher candidates had five minutes to complete this exercise, thus allowing for time to reflect
before answering.18
Component II - "Extrinsic" treatment arm
The online platform asked this group to complete an identically structured introspective exercise as
that implemented in the "Identity" arm, but in response to a different question: "In what way do you
think monetary incentives promote teachers’ welfare?" The goal being to make the extrinsic rewards
(particularly the monetary incentives) more salient precisely when teachers had to select vacancies.
Specifically, the question aimed to encourage teachers to think more concretely about how they could
benefit from earning a higher salary. 19
Component II - "Control/placebo" arm
The platform asked this group to complete an identical introspective exercise as that used in the
"Identity" and "Extrinsic" arms, but asked a different, more neutral, question: "What is your opinion
about the registration process for the 2019 teacher selection competition?" The goal being to motivate
candidates to reflect on aspects completely unrelated to extrinsic rewards or altruism.
18 A simple text analysis of their answers shows that, as expected, the treatment was effective in directing their thoughtstowards altruistic identity norms. Of those who completed the exercise (around 80% of our sample), 50% used wordsassociated with an altruistic identity: “society,” “social,” “change,” “help,” “need,” “change lives,” “future,” “serve,”“transform.”
19 A simple text analysis of the teachers’ answers shows that, as expected, the treatment was effective in makingthem think in these terms. Of those who completed the exercise (around 65% of our sample), almost 60% usedwords associated with money, professional career, or monetary expenditures: "quality of life," "solvent," "family,""masters," "professional," "economic."
14

Figure 5 presents the results of a basic text analysis of the different groups’ responses. We observe
that in the "Identity" treatment arm, the answers often included words more closely related to social
change, such as “vocation,” “change,” “society,” and “values.” In the "Extrinsic" treatment arm, sev-
eral candidates mentioned "improving quality of life." Finally, candidates in the control group used
words related specifically to the teacher selection process itself, such as "information," "vacancies,"
and "easy."
4.3 Component III (8/7/2019 - 9/7/2019): Pop-ups
Like the introspective exercise, the final component was also implemented through the online appli-
cation platform. When using the platform (across the conditions), teacher candidates viewed a list
of schools within their region and specific field (e.g., secondary-sciences) and needed to select and
rank their preferred vacancies. Furthermore, across the groups, the applicants had access to a basic
set of information about each school: its local education administrative unit (Unidad de Gestión Ed-
ucativa Local - UGEL), school ID, name, type, and management (public with public management or
public with private management). They also saw all the characteristics related to the monetary incen-
tives (i.e., whether the school is rural of any type, in the VRAEM area, a frontier region, bilingual,
single-teacher and/or multi-grade).
In order to facilitate the easy identification on the platform of the disadvantaged institutions tar-
geted by the government, the schools were labeled with icons highlighting their associated incentive
scheme. Specifically, these consisted of a money bag in reference to the monetary incentives, a ladder
icon highlighting the opportunity for faster career progression, and a school within a heart indicating
places where teachers could have a greater social impact. These icons were shown to all teachers,
regardless of the treatment condition (see Figure 1). All disadvantaged schools were labeled with the
three icons–that is, both the extrinsic and identity rewards were accentuated.
Importantly, in all three arms, when teachers hovered their mouse cursor over the icon, a small pop-up
was displayed with a description of the icon. Although all groups saw the same general information
(monetary incentives, faster career progression, and high social impact), there were subtle differences
in the phrasing of these pop-ups across the arms so as to make either altruism or external rewards
more salient. Teachers in the control group viewed only objective information.
Component III - "Identity" treatment arm
For this group (Figure 6), the pop-up linked to the "heart" icon included subtle cues aimed at priming
the altruistic facet of teacher candidates’ identity. Specifically, the pop-up text read that such schools
15

with greater needs require “teachers like you” (thus suggesting that the teacher candidate belongs
to a particular group of people that want to help more vulnerable students). In addition, the pop-up
included a message in bold (“do not miss the opportunity to be an impactful teacher”), reinforcing the
idea that teachers who care more about social impact tend to select these schools. Finally, the pop-up
also contained an image evoking the norm of generosity/prosociality that we endeavored to trigger.
Note that both the text messages and pop-ups were intentionally phrased in such a way as to make
“altruistic identity” even more salient. Following Bryan et al. 2011, we framed most of the messages
for this group as the enactment of a personal identity (e.g., “being an agent of change”) as opposed
to a simple action (e.g., “generate a change”). Indeed, use of a self-relevant noun instead of a verb is
important, as nouns have been proven to encourage people to see attributes as more representative of
their own characteristics (i.e., identity) across different settings (Gelman and Heyman 1999, Walton
and Banaji 2004).20
Component III - "Extrinsic" treatment arm
For this group (Figure 7), the two pop-ups linked to the external rewards icons were designed to be
particularly salient. First, the pop-up linked to the "money bag" icon contained specific information
about the amount of the monetary reward–e.g., "In this school you could receive up to X monthly
additional soles" (where X varied depending on the type of school)–and a note in bold adding, "Don’t
miss the opportunity to increase your monthly salary!" The idea being not only to emphasize the exis-
tence of the monetary incentives but also to simplify the provided information by displaying a specific
amount of money. Although the information about the monetary incentives is publicly available, the
pop-up providing candidates with the exact monetary reward associated with each school was a means
of saving them the cognitive cost of doing the calculations themselves. This strategy was guided by
the premise that small cognitive costs can represent substantial psychological friction (Bhargava and
Manoli 2015, Mani et al. 2013).
Second, the pop-up linked to the "ladder" icon showed an image of a person walking up stairs along
with a heading indicating that "In this school you could advance faster in your teaching career" and a
note in bold reading"Do not miss the opportunity to boost your professional career!"
Component III - "Control/Placebo" arm
In the control arm (Figure 8), the pop-ups were informative but written in a comparatively neutral tone.
In the case of the "money bag" icon, the pop-up text simply read "School with monetary incentives";
that related to the "ladder" icon indicated "School that provides faster career progression"; and the
20 A few exceptions were made in the text messages where using a noun rather than a verb sounded unnatural (such asmessage # 10 in Table 3).
16

pop-up linked to the "heart" icon said "School where you can generate greater change in student
learning."
It should be noted that the teacher candidates were exposed to all three intervention components,
according to their treatment condition. Thus, while all of the components have the same objective
(e.g., making teachers’ identity salient), we are not able to isolate each component.21
5 Empirical strategy, data, and balance tests
This paper uses administrative data from the 2019 public school teacher selection process in Peru.
The data include candidates’ application by school level (pre-primary/primary/secondary) and sub-
ject, demographic characteristics (gender and age), teacher education program attended, years of
public/private teaching experience, teacher scores at every stage of the competition, ranked school
preferences within a region, assigned final in-person evaluations, and, finally, the school where they
were appointed a position. Moreover, for each school that opened a vacancy, the data include school
characteristics such as location (region, province, district, UGEL), area (urban/any type of rural), type
(multi-teacher, multi-grade or single teacher), and an indicator of whether the school is bilingual, in
the VRAEM area, or in a frontier region. Finally, we also have information on poverty rates at the
district level from the 2013 Province and District Poverty Map generated by the National Institute of
Information and Statistics (INEI), allowing to identify whether schools are located in poor areas.
Table 5 presents a summary of the candidate-level variables used in the model estimation. The group
of teacher candidates considered in our analysis is 64% female, 36 years old on average, and scored
144/200 on average on the PUN (where the passing score is 120/200). Less than 1% of the candi-
dates are disabled, while 51% scored below the PUN median (henceforth, "low-performing"). Of
the candidates that participated in the national assessment stage, 79% were assigned a final in-person
evaluation. The average choice set is composed of 47% vacancies labeled with an icon on the online
platform ("disadvantaged" vacancies); 81% of candidates included at least one disadvantaged vacancy
in his/her preference set, and 53% of these individuals were assigned to a disadvantaged school in the
final in-person evaluation.
Table 6 presents balance tests for the candidates in our sample that selected vacancies in the regions
of the experiment. As expected, given the random assignment, candidates in each treatment arm and
21 The texts used in all the three components were validated in two focus groups (organized by the Promotion of Welfareand Teacher Recognition Division in the Ministry of Education) with teachers in the regions of Ayacucho and Loreto.The components were tested to verify that teachers understood the text messages and the written exercise and thatlanguage was not perceived as hostile or threatening (so to avoid triggering stress, a sense of stigma, guilt, or loss ofautonomy among teaching candidates). User experience on the platform was also tested in the Lima MetropolitanRegion. Documentation of the focus groups is available upon request.
17

in the control group are very similar in every observable characteristic.
5.1 Empirical strategy
To measure the overall impact of the information provision on different teachers’ selection outcomes,
we run regressions of the following form:
yi = αTi + Xiβ + εi (1)
where yi is a “preference” or “assignment” outcome for teacher candidate i. The choice set for each
candidate is the set of available vacancies within one of the regions (24 in our sample) and a specific
area of specialization (educational level and subject, e.g., Secondary-Sciences). Ti is a dummy that
indicates whether candidate i received either one of two treatments, and Xi is a vector including a
constant and candidate control variables, namely age, gender, disability, and score on the PUN.
The analysis includes two outcomes of teacher preference: the % of disadvantaged schools selected
by teacher candidate i and a dummy indicating whether she applied for at least one vacancy in a
disadvantaged school. Our "assignment" outcome refers to whether teacher candidate i was assigned
to a disadvantaged school for the final in-person evaluation.
In the appendix, we show the treatment effect on the preference for and assignment to "most remote
schools" (located in the rural 1 areas) and "poor schools" (located in a district in the bottom 20% of
the income distribution according to the 2013 Province and District Poverty Map). Compared to the
rest of the disadvantaged schools, "most remote schools" are, on average, 26 km farther away from
the province capital, 10 pp poorer, and have a higher proportion of temporary teachers (16 pp higher
considering the last three years). They are also harder to staff: in the 2019 selection process, the likeli-
hood of being selected by at least one teacher was around 18 pp lower for these institutions, compared
to the rest of the disadvantaged schools. While "poor schools" are not necessarily "disadvantaged,"
they show whether the intervention was effective in attracting teachers to higher-need areas beyond
the targeted schools.
In the appendix, we also show the impact of the treatment on the probability of ultimately being
assigned to a disadvantaged school. Note, however, that the final allocation is influenced by more
discretionary factors (e.g., subjective evaluation of schools and administrators during interviews and
classroom observation), making its outcome more noisy.
18

6 Results and interpretation
Tables 7a through 8 show the estimations for the main outcomes. For each outcome we present six
columns: the main model without interactions (models 1 and 2), the main model plus an interaction
of the treatment variable and a "female teacher" dummy (models 3 and 4), and the main model plus
an interaction of the treatment variable and a "low performance" dummy that take a value of one if
the teacher is at the bottom half of the PUN distribution (models 5 and 6). Furthermore, we show the
estimations without and with teacher-level controls (i.e., teachers candidates’ sex, age, PUN score,
and whether disabled; models 2, 4 and 6). In the models with interactions ("female teacher" or "low
performance"), we also include interactions with each of the controls (e.g., "female teacher" and
"age").
The two heterogeneous effects analyzed are particularly relevant for several reasons. First, teachers’
preferences tend to be systematically different between men and women, the latter being significantly
less likely to teach in poorer and remote regions. This may be due to different levels of labor flex-
ibility for these groups. Such patterns, which have already been documented in the literature (see
Bertoni et al. 2019), are confirmed in our sample.22 Given how remote the disadvantaged schools are
(approximately four times farther away from the province capital than the rest of the schools), it is
plausible that the treatments were not effective among individuals with lower mobility (e.g., those for
whom commuting longer distances is more costly), who are more often women.
The second heterogeneity analysis (high- vs. low-performing teachers) is also relevant, especially
from a policy perspective. All the teachers who participated in our experiment are, by definition, top-
performers, since they are among the 7% who passed the qualifying PUN exam. Thus, attracting any
of these teachers to disadvantaged schools–even if they are at the bottom of this distribution–would
be a positive outcome. Though certainly, the higher the quality of applicants and winners of vacancies
in disadvantaged schools, the more effective the treatment would be in alleviating teacher sorting.
We separate our outcomes into two dimensions: (a) teachers’ preferences (the types of schools to
which they applied) and (b) teachers’ assignment to schools where they participate in the final in-
person evaluation.
22 For instance, when assessing teachers’ preferences in the control group, we observe that female teachers are muchless likely to apply to vacancies in disadvantaged schools. The share of disadvantaged schools included in an averagemale choice set is around 50% while, for females, the share is around 42%.
19
6.1 Main estimates
Teacher preferences
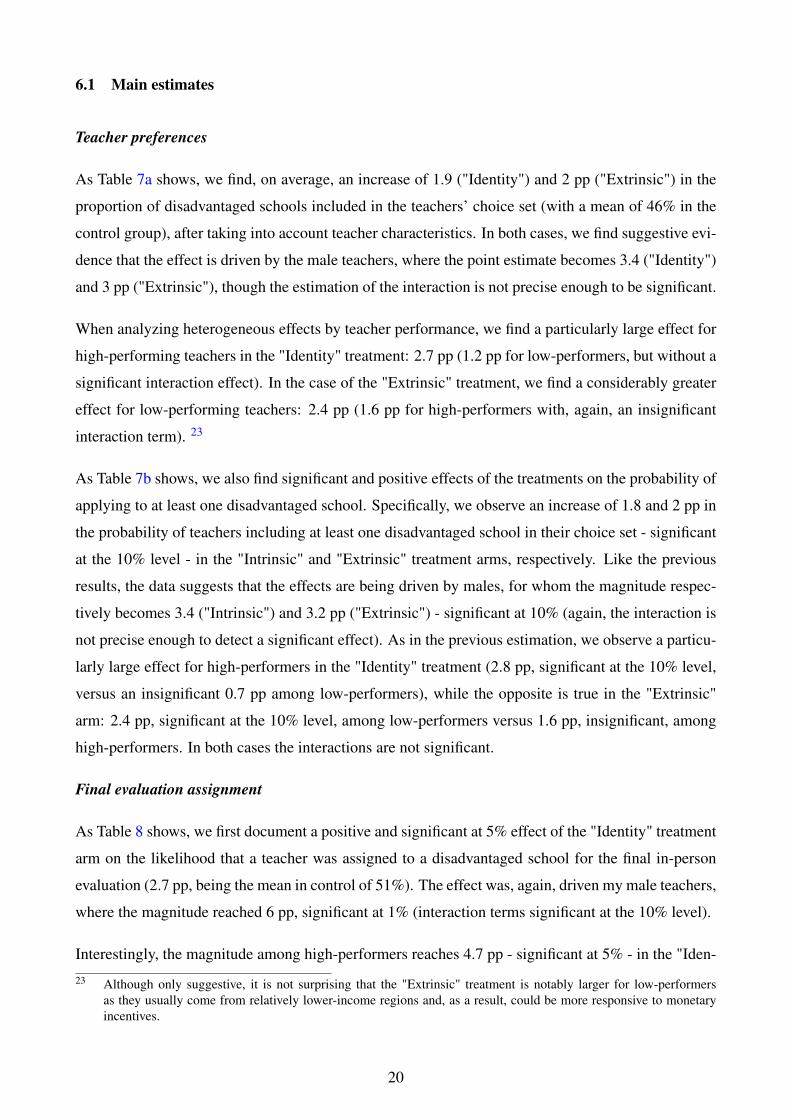
As Table 7a shows, we find, on average, an increase of 1.9 ("Identity") and 2 pp ("Extrinsic") in the
proportion of disadvantaged schools included in the teachers’ choice set (with a mean of 46% in the
control group), after taking into account teacher characteristics. In both cases, we find suggestive evi-
dence that the effect is driven by the male teachers, where the point estimate becomes 3.4 ("Identity")
and 3 pp ("Extrinsic"), though the estimation of the interaction is not precise enough to be significant.
When analyzing heterogeneous effects by teacher performance, we find a particularly large effect for
high-performing teachers in the "Identity" treatment: 2.7 pp (1.2 pp for low-performers, but without a
significant interaction effect). In the case of the "Extrinsic" treatment, we find a considerably greater
effect for low-performing teachers: 2.4 pp (1.6 pp for high-performers with, again, an insignificant
interaction term). 23
As Table 7b shows, we also find significant and positive effects of the treatments on the probability of
applying to at least one disadvantaged school. Specifically, we observe an increase of 1.8 and 2 pp in
the probability of teachers including at least one disadvantaged school in their choice set - significant
at the 10% level - in the "Intrinsic" and "Extrinsic" treatment arms, respectively. Like the previous
results, the data suggests that the effects are being driven by males, for whom the magnitude respec-
tively becomes 3.4 ("Intrinsic") and 3.2 pp ("Extrinsic") - significant at 10% (again, the interaction is
not precise enough to detect a significant effect). As in the previous estimation, we observe a particu-
larly large effect for high-performers in the "Identity" treatment (2.8 pp, significant at the 10% level,
versus an insignificant 0.7 pp among low-performers), while the opposite is true in the "Extrinsic"
arm: 2.4 pp, significant at the 10% level, among low-performers versus 1.6 pp, insignificant, among
high-performers. In both cases the interactions are not significant.
Final evaluation assignment
As Table 8 shows, we first document a positive and significant at 5% effect of the "Identity" treatment
arm on the likelihood that a teacher was assigned to a disadvantaged school for the final in-person
evaluation (2.7 pp, being the mean in control of 51%). The effect was, again, driven my male teachers,
where the magnitude reached 6 pp, significant at 1% (interaction terms significant at the 10% level).
Interestingly, the magnitude among high-performers reaches 4.7 pp - significant at 5% - in the "Iden-
23 Although only suggestive, it is not surprising that the "Extrinsic" treatment is notably larger for low-performersas they usually come from relatively lower-income regions and, as a result, could be more responsive to monetaryincentives.
20

tity" treatment, and 3.3 pp - significant at 10% - in the "Extrinsic" treatment (although the interactions
are not estimated precisely enough to detect a significant effect).
Particularly with regard to the "Identity" arm, our intervention was successful, not only in encouraging
teachers to select disadvantaged schools, but also in increasing their probability of being assigned
to one of these schools for the final in-person evaluation. Moreover, the fact that the impact was
significant (and of large magnitude) among high-performers is insightful from a policy perspective.
6.2 Additional results
In the appendix, we use different school characteristics to formally test whether treated teachers were
more likely to prefer (and be assigned a final evaluation in) lower-income and more remote schools.
As Table A3 shows, we find an increase of 1.2 pp and 1.3 pp ("Identity" and "Extrinsic" arms) in the
proportion of most remote schools in teachers’ choice set, significant at 10% and 5%, respectively.
The heterogeneous effect by sex in this case is more noisy and thus less conclusive. We did not find
any significant effect on the probability of selecting at least one remote vacancy (Table A4). When
analyzing the heterogeneous effect by high versus low-performing teachers, we find a very similar
pattern to that described above: suggestive evidence that the effect was noticeably larger among high
performers for the "Identity" arm, while the opposite was true for the "Extrinsic" arm.
We then analyze teacher candidates’ preferences for the poorest schools. Although all the point
estimates go in the right (positive) direction (Tables A5 and A6), we only find a significant effect of
the "Identity" treatment on the proportion of vacancies in poor regions for high-performing teachers:
1.2 pp, significant at 5%.
As we show in Table A7, we find an average significant effect on the likelihood of being assigned
to complete the final evaluation in a remote school for the "Extrinsic" treatment (2.2 pp, significant
at 5%). Again, this is mostly driven by men (5.1 pp, significant at 5%; the interaction with women
being negative and significant). While, on average, we don’t find a significant effect of the "Identity"
treatment arm, we do find a positive and significant effect for high-performing teachers (3.6 pp).
Table A8 shows that the "Identity" treatment arm had a significant 1.5 pp average increase in the
likelihood of being assigned to a final evaluation in a poor school. Interestingly from a policy point
of view, the effect among high-performers was 2.6 pp, significant at the 5% level.
In Table A9, in the appendix, we also show that the "Identity" treatment led to an increase of approx-
imately 1 pp in the probability of ultimately being assigned to a disadvantaged school (2.5 pp among
21

high-performers and 3.1 pp among male teachers), but the point estimates are not precise enough to
detect a significant effect. The p-values for high-performing and male teachers is 0.11. This is not
surprising, given that the final allocation depends on more discretionary factors, making the process
more noisy.
7 Conclusions
In this study, we provide novel evidence on the impact of making salient certain facets of identity–
altruistic and extrinsic–on employment choices. We examine this question in a high-stake setting
in which teacher candidates apply for jobs in specific schools with different levels of vulnerability.
The government program we evaluate aimed to prime either teacher candidates’ altruistic identity or
external rewards, in an effort to encourage them to apply to vacancies in more disadvantaged schools
(typically understaffed and with lower-performing students). To assess the impact of this intervention,
we conducted a three-arm large-scale randomized controlled trial in Peru with the 11,568 teacher
candidates who participated in the 2019 teacher selection process.
We find that teachers in both treatment arms ("Identity" and "Extrinsic") are significantly more likely
to apply to vacancies in disadvantaged schools and, in the case of the "Identity" treatment, we observe
a significant effect on the likelihood of being assigned to disadvantaged schools in the final stage of the
evaluation process. We also find suggestive evidence that the effects are driven by male teachers, who
are arguably more mobile and thus more willing to work in remote areas. Importantly, our estimates
reveal that the effect of both treatments on the probability of being assigned to a disadvantaged school
in the final in-person evaluation is larger among high-performing teachers, particularly for those in
the "Altruistic Identity" arm. This result provides crucial insight for efforts aimed at reducing teacher
sorting.
Broadly, our paper shows how a well-designed low-cost behavioral strategy can enhance the resources
of disadvantaged schools, fundamental to improving the equity of the education system. The results of
our first treatment arm suggest that making teachers’ altruistic identity salient at the right moment can
be a powerful tool to reduce teacher sorting. One caveat of this study is that the "Altruistic Identity"
treatment was implemented in a setting where teachers could also receive extrinsic rewards (i.e., salary
increases and career advancement opportunities) to work in disadvantaged schools. Further research
is needed to assess the effectiveness of priming teachers’ altruistic identity in the absence of monetary
incentives.
The results of our second arm show that simplifying and making more salient information about
extrinsic rewards has a notable effect on employment choices. This is an important finding given the
22

varying outcomes of differential compensation schemes and the failure of some monetary incentives
to attract teachers to hard-to-staff schools (Clotfelter et al. 2008b, Maranto 2013). In other contexts,
psychological frictions associated with informational complexity and confusion over incentives have
been shown to influence the effectiveness of social programs (Bettinger et al. 2012, Hoxby et al. 2013,
Bhargava and Manoli 2015). Our research demonstrates that low-cost interventions can reduce these
cognitive barriers by providing individuals with more simplified and customized information about
extrinsic rewards.
Finally, the magnitude and the scope of our results call for more comprehensive policies that improve
the working conditions of teachers employed in disadvantaged schools (e.g. better infrastructure, ed-
ucational inputs, transportation, and housing). Interventions such as that described in this paper can
complement and improve the effectiveness of these policies. We estimate that the cost of filling a
teaching vacancy in a disadvantaged school using either of the two strategies evaluated in this paper
is approximately $13 per vacancy. Moreover, while any teacher in Peru who works in a disadvan-
taged school receives extrinsic rewards (including uncertified and temporary teachers), the program
we evaluate targets more qualified teachers who passed a rigorous selection process. In a time when
government budgets in many developing countries are being cut, low-cost interventions that prime
candidates’ intrinsic or extrinsic motivations provide a cost-effective way to further encourage teach-
ers to apply to disadvantaged schools, thus reducing the shortage of credentialed teachers in places
with high staffing needs.
23

8 Tables and figures
Figure 1: Icons appearing in online vacancy selection platform
Note: Icons in the "Incentives" column signify the following: the green icon represents the first extrinsic reward(i.e. monetary incentives), the black icon represents the second extrinsic reward (i.e. the possibility of more rapidprofessional career advancement), and the red icon represents altruistic identity (i.e. being an agent of social change).
Figure 2: 2019 Teacher hiring process in Peru
Note: Ministry of Education (Ministerio de Educación - MINEDU). National Teacher Test (Prueba Única Nacional- PUN). Regional Education Directorates (Dirección Regional de Educación - DRE). Local Education ManagementUnits (Unidad de Gestión Educativa Local - UGEL)
Source: Authors own elaboration.
24

Figure 3: Distribution of disadvantaged schools across regions
Source: MINEDU 2019
Note: The schools targeted by the government–referred to as “disadvantaged schools”–are those institutions that fallunder the government’s incentive scheme (i.e., rural of any type, in the VRAEM area, in frontier regions, bilingual,single-teacher, and/or multi-grade).
25

Table 1: Selected versus unselected schools
All
schools
Selected
schools (S)
Unselected
schools (U)
p-value
S=U
N.
Characteristics associated to monetary incentives
Most Rural (Rural 1) 0.51 0.37 0.64 0.000 12,300
Moderate Rural (Rural 2) 0.22 0.22 0.22 0.604 12,300
Least Rural (Rural 3) 0.08 0.12 0.05 0.000 12,300
VRAEM 0.08 0.06 0.11 0.000 12,300
Frontier regions 0.12 0.07 0.17 0.000 12,300
Bilingual 0.47 0.24 0.68 0.000 12,300
Single-teacher 0.28 0.19 0.36 0.000 12,300
Multigrade 0.25 0.20 0.29 0.000 12,300
Mean monetary incentives (S/) 424.16 308.85 529.63 0.000 12,300
Other characteristics
Urban 0.19 0.30 0.09 0.000 12,300
Poverty (%) 0.50 0.46 0.53 0.000 12,172
Enrollment (100s) 111.9 155.0 72.4 0.000 12,286
Basic services 0.51 0.68 0.35 0.000 12,300
Distance from prov. capital (km) 36.8 24.4 48.1 0.000 12,262
Student test scores in Math 2018 (standardized) -0.15 0.12 -0.58 0.000 4,820
N. 12,300 5,876 6,424
Source: Authors own elaboration.
26

Table 2: Structure of incentives
Characteristics associated to monetary incentives Amount
(S/)
% of ba-
sic salary
(S/ 2200)
Location
Most Rural (Rural 1) 500 23%
Moderate Rural (Rural 2) 100 5%
Least Rural (Rural 3) 70 3%
Frontier regions 100 5%
VRAEM 300 14%
Type of school
Bilingual 150 7%
Single-teacher 200 9%
Multigrade 140 6%
Source: MINEDU 2019.
27

Figure 4: Disadvantaged versus non-disadvantaged schools
(a) Distance from prov. capital(km)
(b) District poverty rate
(c) % Temporary teachers 2016-2018
(d) % Unselected schools 2019
(e) PUN score 2019
Source: Authors own elaboration.
28

Table 3: Text messages by treatment group
N. Date sent Sent to Text message
1 8/2/2019 Control Congratulations [NAME]! You have passed the PUN. In a few days
you will be able to select all the vacancies of your choice.
Extrinsic Congratulations [NAME]! You have passed the PUN. In a few days
you will be able to select all the vacancies of your choice. Consider
that in some schools you can receive up to $343 additional to your
basic salary.
Identity Congratulations [NAME]! You have passed the PUN. In a few days
you will be able to select all the vacancies of your choice. In the
online platform you can identify the schools where you can generate
greater changes in learning. Thank you for choosing to improve
lives!
2 8/6/2019 Control [NAME], tomorrow you will be able to select all the vacancies of
your choice in your preferred region.
Extrinsic [NAME], tomorrow you will be able to select all the vacancies of
your choice in your preferred region. Remember that schools with
monetary incentives guarantee you a higher monthly income.
Identity [NAME], tomorrow you will be able to select all the vacancies of
your choice in your preferred region. Thank you for being an agent
of social change. In the online platform we will point out the schools
where you can have a greater impact on the learning of your stu-
dents.
3 8/7/2019* Control [NAME], you can now select all the vacancies of your choice in the
teacher evaluation.
Extrinsic [NAME], you can now select all the vacancies of your choice in the
teacher evaluation. Do not miss the opportunity to select rural or
frontier schools that may allow you to reach a higher salary scale 1
year in advance.
Identity [NAME], you can now select all the vacancies of your choice in
the teacher evaluation. We recognize your teacher vocation. In the
online platform you can identify the schools where you can generate
greater changes in student learning.
4 8/13/2019 Control [NAME], remember to select all the vacancies of your choice in the
teacher evaluation.
Extrinsic [NAME], remember to select all the vacancies of your choice in the
teacher evaluation. Be one of the teachers who, in some schools,
already receive up to 5 monetary incentives.
Identity [NAME], remember to select all the vacancies of your choice in the
teacher evaluation. You can have a great impact on your students,
especially in areas with greater needs.
Note: * Start date of vacancy selection process, closing date on 8/28/2019. Text messages in original language inTable A1). Standardized written test (Prueba Única Nacional – PUN)
29

Table 3 (cont.): Text messages by treatment group
N. Date sent Sent to Text message
5 8/15/2019 All teachers who have not
yet selected vacancies
[NAME], you have not yet selected the vacancies of your choice in
the online platform. This is a necessary step of the teacher evaluation
process.
6 8/18/2019 Control [NAME], in 4 days the vacancies’ selection process of the teacher
evaluation will be closed.
Extrinsic [NAME], in 4 days the vacancies’ selection process of the teacher
evaluation will be closed. Remember that schools which provide
incentives allow you a higher monthly income and the possibility to
reach a higher salary scale in less time.
Identity [NAME], in 4 days the vacancies’ selection process of the teacher
evaluation will be closed. Remember that a lot of students need you
to improve their learning. Thank you for choosing to improve lives!
7 8/22/2019 All teachers that passed
the PUN
The vacancies’ selection process of the 2019 teacher evaluation has
been extended! More information on this process has been sent to
your email.
8 8/26/2019 All teachers who have not
yet selected vacancies
You have not yet selected the vacancies of your choice in the on-
line platform of the teacher evaluation. Remember that if you don’t
complete the selection before August 28, your candidacy will be re-
moved from the evaluation.
9 9/5/2019 Teachers with less than 2
assigned vacancies
Until September 9 you can select here: http://bit.ly/2krT0QL some
vacancies of your choice among the ones that are still available for
the 2019 teacher evaluation.
10 9/7/2019 Control [NAME], until September 9 you have an additional opportunity to
select vacancies of your choice in the teacher evaluation.
Extrinsic [NAME], until September 9 you have an additional opportunity to
select vacancies of your choice in the teacher evaluation. Remember
that you can select schools with monetary incentives as indicated in
the online platform.
Identity [NAME], until September 9 you have an additional opportunity to
select vacancies of your choice in the teacher evaluation. Remem-
ber that you can select schools where you have the possibility to
generate greater changes in learning.
Note: * Start date of vacancy selection process, closing date on 8/28/2019. Text messages in the original languagein Table A1). Standardized written test (Prueba Única Nacional – PUN)
30

Table 4: Voluntary written exercise on the online selection platform
Group Voluntary written exercise
Control Thank you for participating in the 2019 Teacher Evaluation. What do you think about the evaluation registration
process?
Treatment Extrinsic Thank you for participating in the teacher evaluation. How do monetary incentives promote the welfare of
teachers? We would like you to take a few minutes to analyze this question and then share with us your ideas
about it.
Treatment Identity Thank you for choosing to be a teacher and help generate changes in student learning! We would like you to
share with us the reasons that motivated you to become a teacher. We would like you to take a few minutes to
think and then share with us the main reasons that motivated you to choose this profession.
All Note: Your answer is very valuable to us and it will only be used for Minedu informational purposes. The answer
you provide will not affect your score in the evaluation. Thanks for participating.
Note: Written exercise in original language in Table A2. Ministry of Education (Ministerio de Educación -MINEDU).
Figure 5: Text analysis of voluntary written exercise
(a) Control (b) Extrinsic
(c) Identity
Note: The response rate was 66% for the Control group, 66% for the Extrinsic group and 74% for the Identity group.
Source: Authors own elaboration.
31

Figure 6: Pop-up on online vacancy selection platform - Identity
Note: Pop-up in original language in Figure A1.
Figure 7: Pop-up on online vacancy selection platform - Extrinsic
(a) Monetary incentive (b) Career progression
Note: Pop-up in original language in Figure A1.
Figure 8: Pop-up on online vacancy selection platform - Control
Note: Pop-up in original language in Figure A1.
32

Table 5: Summary of model variables, candidate-level
Obs Mean Std. Dev. Min Max
Candidate’s attributes
Female 7,217 0.64 0.48 0 1
Age 7,217 35.99 6.76 21 63
PUN score 7,217 144.57 11.88 120 190
Disabled 7,217 0.00 0.06 0 1
Low-performing 7,217 0.51 0.50 0 1
Outcomes
Assigned to at least 1 vacancy 7,217 0.79 0.40 0 1
% Disadvantaged vacancies selected 7,217 0.47 0.34 0 1
Selected at least 1 disadvantaged vacancy 7,217 0.81 0.40 0 1
Assigned to a disadvantaged vacancy 7,217 0.53 0.50 0 1
% Most remote vacancies selected 7,217 0.15 0.23 0 1
Selected at least 1 most remote vacancy 7,217 0.41 0.49 0 1
Assigned to a most remote vacancy 7,217 0.21 0.41 0 1
% Poor vacancies selected 7,217 0.18 0.27 0 1
Selected at least 1 poor vacancy 7,217 0.41 0.49 0 1
Assigned to a poor vacancy 7,217 0.22 0.41 0 1
Source: Authors own elaboration.
33

Table 6: Balance test
Control Extrinsic p-val Control Identity p-val Extrinsic Identity p-val
C=E C=I E=I
Age 35.96 36.16 0.292 35.96 35.84 0.543 36.16 35.84 0.095
Female 0.64 0.63 0.339 0.64 0.66 0.288 0.63 0.66 0.043
Teaching experience in public schools
None 0.17 0.14 0.005 0.17 0.17 0.624 0.14 0.17 0.018
< 2 years 0.15 0.16 0.284 0.15 0.16 0.402 0.16 0.16 0.811
2-5 years 0.35 0.35 0.825 0.35 0.35 0.807 0.35 0.35 0.982
6-10 years 0.26 0.28 0.130 0.26 0.26 0.733 0.28 0.26 0.238
> 10 years 0.07 0.07 0.764 0.07 0.07 0.548 0.07 0.07 0.367
Teaching experience in private schools
None 0.30 0.32 0.228 0.30 0.32 0.228 0.32 0.32 0.994
< 2 years 0.17 0.17 0.904 0.17 0.17 0.570 0.17 0.17 0.655
2-5 years 0.33 0.31 0.273 0.33 0.32 0.501 0.31 0.32 0.667
6-10 years 0.14 0.14 0.990 0.14 0.14 0.895 0.14 0.14 0.905
> 10 years 0.06 0.06 0.986 0.06 0.06 0.947 0.06 0.06 0.961
Education
Studien in an Institute 0.44 0.45 0.463 0.44 0.47 0.019 0.45 0.47 0.108
Studied in a University 0.52 0.51 0.378 0.52 0.49 0.017 0.51 0.49 0.132
Studien in an Institute and in a University 0.04 0.04 0.700 0.04 0.04 0.883 0.04 0.04 0.810
PUN score
Reading Comprehension 39.11 39.29 0.189 39.11 39.31 0.147 39.29 39.31 0.892
Logical Reasoning 35.79 35.65 0.341 35.79 35.60 0.188 35.65 35.60 0.733
Pedagogical Knowledge of Specialization 69.44 69.92 0.039 69.44 69.60 0.484 69.92 69.60 0.171
Total 144.35 144.86 0.139 144.35 144.51 0.622 144.86 144.51 0.312
N. 2,390 2,385 2,390 2,442 2,385 2,442
Source: Authors own elaboration.
34
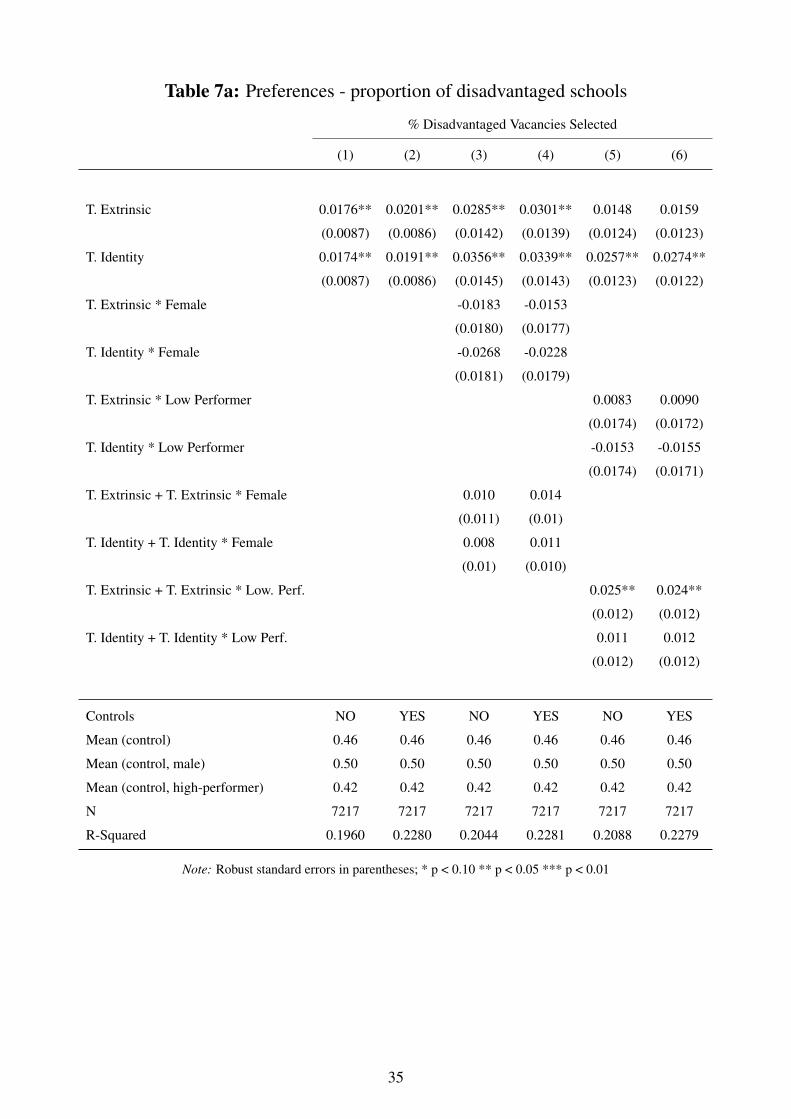
Table 7a: Preferences - proportion of disadvantaged schools
% Disadvantaged Vacancies Selected
(1) (2) (3) (4) (5) (6)
T. Extrinsic 0.0176** 0.0201** 0.0285** 0.0301** 0.0148 0.0159
(0.0087) (0.0086) (0.0142) (0.0139) (0.0124) (0.0123)
T. Identity 0.0174** 0.0191** 0.0356** 0.0339** 0.0257** 0.0274**
(0.0087) (0.0086) (0.0145) (0.0143) (0.0123) (0.0122)
T. Extrinsic * Female -0.0183 -0.0153
(0.0180) (0.0177)
T. Identity * Female -0.0268 -0.0228
(0.0181) (0.0179)
T. Extrinsic * Low Performer 0.0083 0.0090
(0.0174) (0.0172)
T. Identity * Low Performer -0.0153 -0.0155
(0.0174) (0.0171)
T. Extrinsic + T. Extrinsic * Female 0.010 0.014
(0.011) (0.01)
T. Identity + T. Identity * Female 0.008 0.011
(0.01) (0.010)
T. Extrinsic + T. Extrinsic * Low. Perf. 0.025** 0.024**
(0.012) (0.012)
T. Identity + T. Identity * Low Perf. 0.011 0.012
(0.012) (0.012)
Controls NO YES NO YES NO YES
Mean (control) 0.46 0.46 0.46 0.46 0.46 0.46
Mean (control, male) 0.50 0.50 0.50 0.50 0.50 0.50
Mean (control, high-performer) 0.42 0.42 0.42 0.42 0.42 0.42
N 7217 7217 7217 7217 7217 7217
R-Squared 0.1960 0.2280 0.2044 0.2281 0.2088 0.2279
Note: Robust standard errors in parentheses; * p < 0.10 ** p < 0.05 *** p < 0.01
35

Table 7b: Preferences - at least one disadvantaged school
At Least 1 Disadvantaged Vacancy Selected
(1) (2) (3) (4) (5) (6)
T. Extrinsic 0.0179* 0.0204* 0.0312* 0.0321* 0.0142 0.0161
(0.0107) (0.0106) (0.0171) (0.0169) (0.0161) (0.0160)
T. Identity 0.0166 0.0177* 0.0354** 0.0335* 0.0270* 0.0282*
(0.0107) (0.0106) (0.0173) (0.0172) (0.0161) (0.0159)
T. Extrinsic * Female -0.0215 -0.0182
(0.0219) (0.0217)
T. Identity * Female -0.0284 -0.0244
(0.0220) (0.0219)
T. Extrinsic * Low Performer 0.0097 0.0087
(0.0215) (0.0213)
T. Identity * Low Performer -0.0195 -0.0203
(0.0214) (0.0213)
T. Extrinsic + T. Extrinsic * Female 0.009 0.014
(0.014) (0.013)
T. Identity + T. Identity * Female 0.007 0.009
(0.013) (0.013)
T. Extrinsic + T. Extrinsic * Low. Perf. 0.025* 0.024**
(0.014) (0.014)
T. Identity + T. Identity * Low Perf. 0.007 0.007
(0.014) (0.014)
Controls NO YES NO YES NO YES
Mean (control) 0.79 0.79 0.79 0.79 0.79 0.61
Mean (control, male) 0.80 0.80 0.80 0.80 0.80 0.80
Mean (control, high-performer) 0.76 0.76 0.76 0.76 0.76 0.76
N 7217 7217 7217 7217 7217 7217
R-Squared 0.1274 0.1437 0.1294 0.1434 0.1333 0.1443
Note: Robust standard errors in parentheses; * p < 0.10 ** p < 0.05 *** p < 0.01
36

Table 8: Assignment to disadvantaged schools
Assigned to a Disadvantaged School
(1) (2) (3) (4) (5) (6)
T. Extrinsic 0.0217 0.0199 0.0363 0.0357 0.0336* 0.0334*
(0.0136) (0.0136) (0.0221) (0.0220) (0.0199) (0.0199)
T. Identity 0.0263* 0.0266** 0.0614*** 0.0600*** 0.0440** 0.0466**
(0.0136) (0.0135) (0.0221) (0.0221) (0.0196) (0.0196)
T. Extrinsic * Female -0.0243 -0.0248
(0.0280) (0.0280)
T. Identity * Female -0.0527* -0.0519*
(0.0279) (0.0279)
T. Extrinsic * Low Performer -0.0247 -0.0263
(0.0273) (0.0272)
T. Identity * Low Performer -0.0350 -0.0391
(0.0271) (0.0270)
T. Extrinsic + T. Extrinsic * Female 0.012 0.011
(0.017) (0.017)
T. Identity + T. Identity * Female 0.008 0.008
(0.017) (0.017)
T. Extrinsic + T. Extrinsic * Low. Perf. 0.008 0.007
(0.019) (0.019)
T. Identity + T. Identity * Low Perf. 0.007 0.007
(0.019) (0.019)
Controls NO YES NO YES NO YES
Mean (control) 0.51 0.51 0.51 0.51 0.51 0.51
Mean (control, male) 0.56 0.56 0.56 0.56 0.56 0.56
Mean (control, high-performer) 0.51 0.51 0.51 0.51 0.51 0.51
N 7217 7217 7217 7217 7217 7217
R-Squared 0.116 0.118 0.116 0.119 0.113 0.12
Note: Robust standard errors in parentheses; * p < 0.10 ** p < 0.05 *** p < 0.01
37

References
Daniel Aaronson, Lisa Barrow, and William Sander. Teachers and student achievement in the chicago
public high schools. Journal of Labor Economics, 25(1):95–135, 2007.
Nicolas Ajzenman and Ruben Durante. Salience and accountability: School infrastructure and last-
minute electoral punishment. 2020.
George A Akerlof and Rachel E Kranton. Economics and identity. The Quarterly Journal of Eco-
nomics, 115(3):715–753, 2000.
Camila Alva, Matteo Bobba, Gianmarco Leon, Christopher A. Neilson, and Marco Nieddu. Teacher
wages, the recruitment of talent, and academic achievement in rural peru. 2017.
M Caridad Araujo, Pedro Carneiro, Yyannú Cruz-Aguayo, and Norbert Schady. Teacher quality and
learning outcomes in kindergarten. The Quarterly Journal of Economics, 131(3):1415–1453, 2016.
Dan Ariely, Anat Bracha, and Stephan Meier. Doing good or doing well? image motivation and
monetary incentives in behaving prosocially. American Economic Review, 99(1):544–55, 2009.
Nava Ashraf, Oriana Bandiera, and Scott Lee. Losing prosociality in the quest for talent? sorting,
selection, and productivity in the delivery of public services. 2018.
Roland Bénabou and Jean Tirole. Incentives and prosocial behavior. American Economic Review, 96
(5):1652–1678, 2006.
Daniel J Benjamin, James J Choi, and A Joshua Strickland. Social identity and preferences. American
Economic Review, 100(4):1913–28, 2010.
Daniel J Benjamin, James J Choi, and Geoffrey Fisher. Religious identity and economic behavior.
Review of Economics and Statistics, 98(4):617–637, 2016.
Eleonora Bertoni, Gregory Elacqua, Diana Hincapié, Carolina Méndez, and Diana Paredes. Teachers’
preferences for proximity and the implications for staffing schools: Evidence from peru. Technical
report, IDB Working Paper Series, 2019.
Eleonora Bertoni, Gregory Elacqua, L. Marotta, V. Montalva, S. Soares, and H. Santos. Escasez de
docentes en latinoamérica. Technical report, Inter-American Development Bank, 2020.
Eric P Bettinger, Bridget Terry Long, Philip Oreopoulos, and Lisa Sanbonmatsu. The role of applica-
tion assistance and information in college decisions: Results from the h&r block fafsa experiment.
The Quarterly Journal of Economics, 127(3):1205–1242, 2012.
38

Saurabh Bhargava and Dayanand Manoli. Psychological frictions and the incomplete take-up of social
benefits: Evidence from an irs field experiment. American Economic Review, 105(11):3489–3529,
2015.
Donald Boyd, Hamilton Lankford, Susanna Loeb, and James Wyckoff. Explaining the short careers
of high-achieving teachers in schools with low-performing students. American Economic Review,
95(2):166–171, 2005.
Donald Boyd, Pamela Grossman, Hamilton Lankford, Susanna Loeb, and James Wyckoff. How
changes in entry requirements alter the teacher workforce and affect student achievement, 2006.
Donald Boyd, Hamilton Lankford, Susanna Loeb, and James Wyckoff. Analyzing the determinants
of the matching of public school teachers to jobs: Disentangling the preferences of teachers and
employers. Journal of Labor Economics, 31(1):83–117, 2013.
Susan M Brookhart and Donald J Freeman. Characteristics of entering teacher candidates. Review of
educational research, 62(1):37–60, 1992.
Christopher J Bryan, Gregory M Walton, Todd Rogers, and Carol S Dweck. Motivating voter turnout
by invoking the self. Proceedings of the National Academy of Sciences, 108(31):12653–12656,
2011.
Carycruz Bueno and Tim R Sass. The effects of differential pay on teacher recruitment and retention.
Andrew Young School of Policy Studies Research Paper Series, (18-07), 2018.
Stephen Carroll, Robert Reichardt, Cassandra Guarino, and Andrea Mejia. The distribution of teach-
ers among california’s school districts and schools. Technical report, RAND CORP SANTA MON-
ICA CA, 2000.
Raj Chetty, Adam Looney, and Kory Kroft. Salience and taxation: Theory and evidence. American
Economic Review, 99(4):1145–77, 2009.
Raj Chetty, John N Friedman, and Jonah E Rockoff. Measuring the impacts of teachers ii: Teacher
value-added and student outcomes in adulthood. American economic review, 104(9):2633–79,
2014.
Charles Clotfelter, Elizabeth Glennie, Helen Ladd, and Jacob Vigdor. Would higher salaries keep
teachers in high-poverty schools? evidence from a policy intervention in north carolina. Journal of
Public Economics, 92(5-6):1352–1370, 2008a.
Charles T Clotfelter, Elizabeth J Glennie, Helen F Ladd, and Jacob L Vigdor. Teacher bonuses and
teacher retention in low-performing schools: Evidence from the north carolina $ 1,800 teacher
bonus program. Public Finance Review, 36(1):63–87, 2008b.
39

Alain Cohn, Ernst Fehr, and Michel André Maréchal. Business culture and dishonesty in the banking
industry. Nature, 516(7529):86, 2014.
EL Deci. Intrinsic motivation. new york, ny, us, 1975.
Thomas S Dee and Dan Goldhaber. Understanding and addressing teacher shortages in the united
states. The Hamilton Project, 2017.
Stefano DellaVigna and Joshua M Pollet. Investor inattention and friday earnings announcements.
The Journal of Finance, 64(2):709–749, 2009.
Steven Dieterle, Cassandra M Guarino, Mark D Reckase, and Jeffrey M Wooldridge. How do prin-
cipals assign students to teachers? finding evidence in administrative data and the implications for
value added. Journal of Policy Analysis and Management, 34(1):32–58, 2015.
Gregory Elacqua and Luana Marotta. Is working one job better than many? assessing the impact of
multiple school jobs on teacher performance in rio de janeiro. Economics of Education Review, 78,
2020.
Gregory Elacqua, Diana Hincapie, Isabel Hincapié, and Veronica Montalva. Can financial incentives
help disadvantaged schools to attract and retain high-performing teachers?: Evidence from chile.
Technical report, IDB Working Paper Series 1080, Inter-American Development Bank November,
2019.
Mimi Engel, Brian A Jacob, and F Chris Curran. New evidence on teacher labor supply. American
Educational Research Journal, 51(1):36–72, 2014.
Torberg Falch. Teacher mobility responses to wage changes: Evidence from a quasi-natural experi-
ment. American Economic Review, 101(3):460–65, 2011.
Li Feng and Tim R Sass. The impact of incentives to recruit and retain teachers in “hard-to-staff”
subjects. Journal of Policy Analysis and Management, 37(1):112–135, 2018.
Bruno S Frey and Felix Oberholzer-Gee. The cost of price incentives: An empirical analysis of
motivation crowding-out. The American Economic Review, 87(4):746–755, 1997.
Susan A Gelman and Gail D Heyman. Carrot-eaters and creature-believers: The effects of lexical-
ization on children’s inferences about social categories. Psychological Science, 10(6):489–493,
1999.
Steven Glazerman, Ali Protik, Bing-ru Teh, Julie Bruch, Neil Seftor, et al. Moving high-performing
teachers implementation of transfer incentives in seven districts. Technical report, Mathematica
Policy Research, 2012.
40

Uri Gneezy and Aldo Rustichini. Pay enough or don’t pay at all. The Quarterly Journal of Economics,
115(3):791–810, 2000.
Lorenz Goette and Alois Stutzer. Blood donations and incentives: Evidence from a field experiment.
Journal of Economic Behavior & Organization, 2020.
Caroline Hoxby, Sarah Turner, et al. Expanding college opportunities for high-achieving, low income
students. Stanford Institute for Economic Policy Research Discussion Paper, 12:014, 2013.
C Kirabo Jackson. Student demographics, teacher sorting, and teacher quality: Evidence from the
end of school desegregation. Journal of Labor Economics, 27(2):213–256, 2009.
C Kirabo Jackson. What do test scores miss? the importance of teacher effects on non–test score
outcomes. Journal of Political Economy, 126(5):2072–2107, 2018.
Daniel Kahneman. Maps of bounded rationality: Psychology for behavioral economics. American
Economic Review, 93(5):1449–1475, 2003.
Thomas J Kane and Douglas O Staiger. Estimating teacher impacts on student achievement: An
experimental evaluation. Technical report, National Bureau of Economic Research, 2008.
Judd B Kessler and Katherine L Milkman. Identity in charitable giving. Management Science, 64(2):
845–859, 2016.
Nicola Lacetera, Mario Macis, and Robert Slonim. Will there be blood? incentives and displacement
effects in pro-social behavior. American Economic Journal: Economic Policy, 4(1):186–223, 2012.
Nicola Lacetera, Mario Macis, and Robert Slonim. Rewarding volunteers: A field experiment. Man-
agement Science, 60(5):1107–1129, 2014.
Helen F Ladd and Lucy C Sorensen. Returns to teacher experience: Student achievement and moti-
vation in middle school. Education Finance and Policy, 12(2):241–279, 2017.
Hamilton Lankford, Susanna Loeb, and James Wyckoff. Teacher sorting and the plight of urban
schools: A descriptive analysis. Educational Evaluation and Policy Analysis, 24(1):37–62, 2002.
Robyn A LeBoeuf, Eldar Shafir, and Julia Belyavsky Bayuk. The conflicting choices of alternating
selves. Organizational Behavior and Human Decision Processes, 111(1):48–61, 2010.
Anandi Mani, Sendhil Mullainathan, Eldar Shafir, and Jiaying Zhao. Poverty impedes cognitive
function. Science, 341(6149):976–980, 2013.
Robert Maranto. How do we get them on the farm? efforts to improve rural teacher recruitment and
retention in arkansas. The Rural Educator, 34(1), 2013.
41

Luana Marotta. Teachers’ contractual ties and student achievement: The effect of temporary and
multiple-school teachers in brazil. Comparative Education Review, 63(3), 2019.
Carl Mellström and Magnus Johannesson. Crowding out in blood donation: was titmuss right? Jour-
nal of the European Economic Association, 6(4):845–863, 2008.
Jessica M Nolan, P Wesley Schultz, Robert B Cialdini, Noah J Goldstein, and Vladas Griskevicius.
Normative social influence is underdetected. Personality and social psychology bulletin, 34(7):
913–923, 2008.
OECD. Teachers matter. attracting, developing and retaining effective teachers, 2005.
Cristian Pop-Eleches and Miguel Urquiola. Going to a better school: Effects and behavioral re-
sponses. American Economic Review, 103(4):1289–1324, 2013.
Michelle Reininger. Hometown disadvantage? it depends on where you’re from: Teachers’ location
preferences and the implications for staffing schools. Educational Evaluation and Policy Analysis,
34(2):127–145, 2012.
Paul W Richardson and Helen MG Watt. Who chooses teaching and why? profiling characteristics
and motivations across three australian universities. Asia-Pacific Journal of Teacher Education, 34
(1):27–56, 2006.
Steven G Rivkin, Eric A Hanushek, and John F Kain. Teachers, schools, and academic achievement.
Econometrica, 73(2):417–458, 2005.
Leonardo Rosa. Teacher preferences in developing countries. 2017.
Ahmet Saban. A turkish profile of prospective elementary school teachers and their views of teaching.
Teaching and Teacher Education, 19(8):829–846, 2003.
Tim R Sass, Jane Hannaway, Zeyu Xu, David N Figlio, and Li Feng. Value added of teachers in
high-poverty schools and lower poverty schools. Journal of Urban Economics, 72(2-3):104–122,
2012.
Matthew G Springer, Walker A Swain, and Luis A Rodriguez. Effective teacher retention bonuses:
Evidence from tennessee. Educational Evaluation and Policy Analysis, 38(2):199–221, 2016.
Leib Sutcher, Linda Darling-Hammond, and Desiree Carver-Thomas. A coming crisis in teaching?
teacher supply, demand, and shortages in the us, 2016.
Shelley E Taylor and Suzanne C Thompson. Stalking the elusive" vividness" effect. Psychological
review, 89(2):155, 1982.
42

Petra Thiemann. Inequality in education outcomes: The role of sorting among students, teachers, and
schools. Technical report, Working Paper, 2018.
Margareta Maria Thomson, Jeannine E Turner, and John L Nietfeld. A typological approach to
investigate the teaching career decision: Motivations and beliefs about teaching of prospective
teacher candidates. Teaching and teacher education, 28(3):324–335, 2012.
Gregory M Walton and Mahzarin R Banaji. Being what you say: The effect of essentialist linguistic
labels on preferences. Social Cognition, 22(2):193–213, 2004.
43

Appendix - Tables
Table A1: Text messages in original language by treatment group
N. Date sent Sent by Sent to Text message (Original)
1 8/2/2019
IDB
Control ¡Felicitaciones [NOMBRE]! Has aprobado la PUN. En pocos días podrás seleccionar
todas las plazas de tu preferencia.
Extrinsic ¡Felicitaciones [NOMBRE]! Has aprobado la PUN. En pocos días podrás seleccionar
todas las plazas de tu preferencia. Considera que en algunas instituciones educativas
puedes recibir asignaciones mensuales de hasta 1150 soles adicionales a tu remu-
neración.
Identity ¡Felicitaciones [NOMBRE]! Has aprobado la PUN. En pocos días podrás seleccionar
todas las plazas de tu preferencia. En el aplicativo podrás ver las instituciones educa-
tivas donde puedes generar mayores cambios en los aprendizajes. ¡Gracias por elegir
mejorar vidas!
2 8/6/2019Control [NOMBRE], mañana ya podrás seleccionar todas las plazas de tu interés en la región
de tu preferencia.
Extrinsic [NOMBRE], mañana ya podrás seleccionar todas las plazas de tu interés en una región
del Perú. Recuerda que las instituciones educativas con asignaciones te garantizan un
mayor ingreso mensual.
Identity [NOMBRE], mañana ya podrás seleccionar todas las plazas de tu interés en la región
de tu preferencia. Gracias por ser un agente de cambio social. En el aplicativo te
señalaremos las instituciones educativas donde podrás lograr mayor impacto en los
aprendizajes de tus estudiantes.
3 8/7/2019*Control [NOMBRE], ya puedes seleccionar todas las plazas de tu interés en el concurso de
nombramiento.
Extrinsic [NOMBRE], ya puedes seleccionar todas las plazas de tu interés en el concurso de
nombramiento. No pierdas la oportunidad de seleccionar instituciones educativas ru-
rales o de frontera que te pueden permitir subir de escala magisterial 1 año antes.
Identity [NOMBRE], ya puedes seleccionar todas las plazas de tu interés en el concurso de
nombramiento. Reconocemos tu vocación docente. En el aplicativo podrás identificar
las instituciones educativas donde puedes generar mayores cambios en los aprendiza-
jes de los estudiantes.
4 8/13/2019Control [NOMBRE], recuerda seleccionar todas las plazas de tu interés en el concurso de
nombramiento.
Extrinsic [NOMBRE], recuerda seleccionar todas las plazas de tu interés en el concurso de
nombramiento. Sé uno de los docentes que ya reciben hasta 5 asignaciones monetarias
en algunas instituciones educativas.
Identity [NOMBRE], recuerda seleccionar todas las plazas de tu interés en el concurso de
nombramiento. Tú puedes tener un gran impacto en tus estudiantes, especialmente en
ámbitos con mayores necesidades.
5 8/15/2019 All teachers who have not
yet selected vacancies
[NOMBRE], aun no has seleccionado las plazas de tu interes en el aplicativo. Este es
un paso fundamental para continuar participando del concurso de nombramiento.
Note: * Start date of vacancy selection process, closing date 8/28/2019. Inter-American Development Bank (IDB),Ministry of Education (Ministerio de Educación - MINEDU), standardized written test (Prueba Única Nacional –PUN).
44

Table A1 (cont.): Text messages in original language by treatment group
N. Date sent Sent by Sent to Text message (Original)
6 8/18/2019Control [NOMBRE], en 4 días culminará la etapa de selección de plazas en el concurso de
nombramiento.
IDB Extrinsic [NOMBRE], [NOMBRE], en 4 días culminará la etapa de selección de plazas en
el concurso de nombramiento. Recuerda que las instituciones educativas con asig-
naciones te permiten un mayor ingreso mensual y la posibilidad de subir de escala
magisterial en menos tiempo.
Identity [NOMBRE], en 4 días culminará la etapa de selección de plazas en el concurso de
nombramiento. Recuerda que hay muchos estudiantes que te necesitan para mejorar
sus aprendizajes. ¡Gracias por elegir mejorar vidas!
7 8/22/2019 MINEDU All teachers that passed the
PUN
¡Se amplio la etapa de seleccion de plazas del Concurso de Nombramiento 2019! Mas
informacion de su interes para esta etapa en su correo electronico.
8 8/26/2019 IDB All teachers who have not
yet selected vacancies
Aun no has seleccionado las plazas de tu interes en el aplicativo del concurso de
nombramiento. Recuerda que de no hacerlo hasta el 28 de agosto, quedarás fuera del
concurso
9 9/5/2019 MINEDU Teachers with less than 2
assigned vacancies
Hasta el 9 set puede seleccionar aqui: http://bit.ly/2krT0QL alguna plaza de su interes
con espacio disponible para el Concurso de Nombramiento 2019.
10 9/7/2019 IDBControl [NOMBRE], hasta el 9 de set tienes una nueva oportunidad para seleccionar plazas
de tu interes en el aplicativo del concurso.
Extrinsic [NOMBRE], hasta el 9 de set tienes una nueva oportunidad para seleccionar plazas de
tu interes en el concurso. Recuerda que puedes seleccionar escuelas con asignaciones
monetarias señaladas en el aplicativo.
Identity [NOMBRE], hasta el 9 de set tienes una nueva oportunidad para seleccionar plazas
de tu interes en el aplicativo del concurso. Recuerda que puedes seleccionar escuelas
donde tienes la posibilidad de generar mayores cambios en los aprendizajes.
Note: * Start date of vacancy selection process, closing date 8/28/2019. Inter-American Development Bank (IDB),Ministry of Education (Ministerio de Educación - MINEDU), standardized written test (Prueba Única Nacional –PUN).
Table A2: Voluntary written exercise on the online selection platform in originallanguage
Group Voluntary written exercise (Original)
Control Gracias por participar en el Concurso de Nombramiento Docente 2019. ¿Qué opinas sobre el proceso de inscrip-
ción al concurso?
Extrinsic Gracias por participar en el concurso de nombramiento. ¿De qué manera las asignaciones monetarias promueven
el bienestar de los docentes? Nos gustaría que te tomes unos minutos para analizar esta pregunta y luego com-
partas con nosotros tus ideas al respecto.
Identity ¡Gracias por elegir ser docente y ayudar a generar cambios en los aprendizajes de los estudiantes! Quisiéramos
que compartas con nosotros las razones por las que elegiste ser docente. Nos gustaría que te tomes unos minutos
para pensar y luego compartas con nosotros las principales razones que te motivaron a elegir esta profesión.
All Nota: Tu respuesta es muy valiosa para nosotros y solo se utilizará para fines informativos del Minedu. La
respuesta que brindes no afectará tu puntaje en el concurso. Gracias por participar.
45

Table A3: Preferences - proportion of most remote schools
% Most Remote Vacancies Selected
(1) (2) (3) (4) (5) (6)
T. Extrinsic 0.0123* 0.0132** 0.0212** 0.0224** 0.0094 0.0093
(0.0063) (0.0062) (0.0108) (0.0107) (0.0081) (0.0080)
T. Identity 0.0104* 0.0117* 0.0118 0.0111 0.0191** 0.0207**
(0.0062) (0.0061) (0.0109) (0.0108) (0.0083) (0.0082)
T. Extrinsic * Female -0.0155 -0.0144
(0.0132) (0.0130)
T. Identity * Female -0.0010 0.0009
(0.0132) (0.0131)
T. Extrinsic * Low Performer 0.0073 0.0081
(0.0125) (0.0123)
T. Identity * Low Performer -0.0164 -0.0168
(0.0124) (0.0122)
T. Extrinsic + T. Extrinsic * Female 0.006 0.008
(0.08) (0.007)
T. Identity + T. Identity * Female 0.01 0.011
(0.007) (0.0073)
T. Extrinsic + T. Extrinsic * Low. Perf. 0.018* 0.017*
(0.009) (0.009)
T. Identity + T. Identity * Low Perf. 0.004 0.004
(0.009) (0.009)
Controls NO YES NO YES NO YES
Mean (control) 0.13 0.13 0.13 0.13 0.13 0.13
Mean (control, male) 0.16 0.16 0.16 0.16 0.16 0.16
Mean (control, high-performer) 0.11 0.11 0.11 0.11 0.11 0.11
N 7217 7217 7217 7217 7217 7217
R-Squared 0.1309 0.1651 0.1485 0.1653 0.1408 0.1654
Note: Robust standard errors in parentheses; * p < 0.10 ** p < 0.05 *** p < 0.01
46

Table A4: Preferences - at least one most remote school
At Least 1 Most Remote Vacancy Selected
(1) (2) (3) (4) (5) (6)
T. Extrinsic 0.013 0.0157 0.0305 0.033 0.0064 0.007
(0.0135) (0.0132) (0.0220) (0.0217) (0.0189) (0.0186)
T. Identity 0.0125 0.0151 -0.0035 -0.0050 0.0141 0.0165
(0.0134) (0.0132) (0.0222) (0.0220) (0.0190) (0.0188)
T. Extrinsic * Female -0.0301 -0.0271
(0.0277) (0.0273)
T. Identity * Female 0.0266 0.0310
(0.0277) (0.0275)
T. Extrinsic * Low Performer 0.0170 0.0169
(0.0267) (0.0264)
T. Identity * Low Performer -0.0018 -0.0029
(0.0266) (0.0264)
T. Extrinsic + T. Extrinsic * Female 0.00 0.006
(0.02) (0.016)
T. Identity + T. Identity * Female 0.02 0.025
(0.016) (0.016)
T. Extrinsic + T. Extrinsic * Low. Perf. 0.025 0.023
(0.018) (0.018)
T. Identity + T. Identity * Low Perf. 0.013 0.013
(0.018) (0.018)
Controls NO YES NO YES NO YES
Mean (control) 0.40 0.40 0.40 0.40 0.40 0.24
Mean (control, male) 0.45 0.45 0.45 0.45 0.45 0.29
Mean (control, high-performer) 0.36 0.36 0.36 0.36 0.36 0.11
N 7217 7217 7217 7217 7217 7217
R-Squared 0.1073 0.1403 0.1203 0.1405 0.1203 0.1398
Note: Robust standard errors in parentheses; * p < 0.10 ** p < 0.05 *** p < 0.01
47

Table A5: Preferences - proportion of schools in poor districts
% Vacancies in Poor Districts Selected
(1) (2) (3) (4) (5) (6)
T. Extrinsic 0.0034 0.0037 0.0111 0.0112 0.0022 0.0026
(0.0043) (0.0043) (0.0079) (0.0079) (0.0056) (0.0056)
T. Identity 0.0049 0.0052 0.0127 0.0121 0.0118** 0.0121**
(0.0043) (0.0043) (0.0080) (0.0080) (0.0058) (0.0058)
T. Extrinsic * Female -0.0125 -0.0120
(0.0093) (0.0093)
T. Identity * Female -0.0117 -0.0110
(0.0094) (0.0094)
T. Extrinsic * Low Performer 0.0028 0.0024
(0.0085) (0.0085)
T. Identity * Low Performer -0.0133 -0.0134
(0.0085) (0.0085)
T. Extrinsic + T. Extrinsic * Female -0.001 -0.005
(0.004) (0.005)
T. Identity + T. Identity * Female 0.0 0.0012
(0.005) (0.05)
T. Extrinsic + T. Extrinsic * Low. Perf. 0.005 0.005
(0.006) (0.006)
T. Identity + T. Identity * Low Perf. -0.0013 -0.0013
(0.006) (0.006)
Controls NO YES NO YES NO YES
Mean (control) 0.07 0.07 0.07 0.07 0.07 0.07
Mean (control, male) 0.08 0.08 0.08 0.08 0.08 0.08
Mean (control, high-performer) 0.06 0.06 0.06 0.06 0.06 0.06
N 7217 7217 7217 7217 7217 7217
R-Squared 0.1513 0.1542 0.1526 0.1543 0.1524 0.1545
Note: Robust standard errors in parentheses; * p < 0.10 ** p < 0.05 *** p < 0.01
48

Table A6: Preferences - at least one school in poor district
At Least 1 Vacancy in Poor Districts Selected
(1) (2) (3) (4) (5) (6)
T. Extrinsic 0.0027 0.0042 0.0182 0.0189 0.0030 0.0046
(0.0114) (0.0113) (0.0199) (0.0198) (0.0156) (0.0155)
T. Identity 0.0097 0.0105 0.0314 0.0297 0.0229 0.0236
(0.0114) (0.0114) (0.0203) (0.0202) (0.0157) (0.0157)
T. Extrinsic * Female -0.0250 -0.0240
(0.0242) (0.0241)
T. Identity * Female -0.0329 -0.0302
(0.0245) (0.0244)
T. Extrinsic * Low Performer 0.0013 -0.0009
(0.0227) (0.0227)
T. Identity * Low Performer -0.0253 -0.0258
(0.0227) (0.0226)
T. Extrinsic + T. Extrinsic * Female -0.006 -0.004
(0.013) (0.013)
T. Identity + T. Identity * Female -0.0015 0
(0.013) (0.013)
T. Extrinsic + T. Extrinsic * Low. Perf. 0.004 0.004
(0.016) (0.016)
T. Identity + T. Identity * Low Perf. -0.002 -0.002
(0.016) (0.016)
Controls NO YES NO YES NO YES
Mean (control) 0.24 0.24 0.24 0.24 0.24 0.24
Mean (control, male) 0.27 0.27 0.27 0.27 0.27 0.27
Mean (control, high-performer) 0.21 0.21 0.21 0.21 0.21 0.21
N 7217 7217 7217 7217 7217 7217
R-Squared 0.1703 0.1757 0.1716 0.1759 0.1729 0.1768
Note: Robust standard errors in parentheses; * p < 0.10 ** p < 0.05 *** p < 0.01
49

Table A7: Assignment to most remote schools
Assigned to a Most Remote School
(1) (2) (3) (4) (5) (6)
T. Extrinsic 0.0222** 0.0224** 0.0503** 0.0515*** 0.0338** 0.0330**
(0.0112) (0.0111) (0.0196) (0.0195) (0.0155) (0.0154)
T. Identity 0.0161 0.0177 0.0224 0.0216 0.0337** 0.0359**
(0.0111) (0.0111) (0.0195) (0.0194) (0.0155) (0.0154)
T. Extrinsic * Female -0.0462* -0.0459*
(0.0238) (0.0237)
T. Identity * Female -0.0081 -0.0064
(0.0236) (0.0236)
T. Extrinsic * Low Performer -0.0211 -0.0208
(0.0224) (0.0222)
T. Identity * Low Performer -0.0336 -0.0355
(0.0222) (0.0221)
T. Extrinsic + T. Extrinsic * Female 0.004 0.006
(0.013) (0.013)
T. Identity + T. Identity * Female. 0.014 0.0155
(0.013) (0.013)
T. Extrinsic + T. Extrinsic * Low. Perf. 0.013 0.007
(0.016) (0.016)
T. Identity + T. Identity * Low Perf. 0 0
(0.015) (0.015)
Controls NO YES NO YES NO YES
Mean (control) 0.20 0.20 0.20 0.20 0.20 0.20
Mean (control, male) 0.23 0.23 0.23 0.23 0.23 0.23
Mean (control, high-performer) 0.17 0.17 0.17 0.17 0.17 0.17
N 7217 7217 7217 7217 7217 7217
R-Squared 0.116 0.118 0.116 0.119 0.113 0.12
Note: Robust standard errors in parentheses; * p < 0.10 ** p < 0.05 *** p < 0.01
50

Table A8: Assignment to schools in poor districts
Assigned to a School in Poor Districts
(1) (2) (3) (4) (5) (6)
T. Extrinsic -0.0012 -0.0013 0.0117 0.0113 0.0001 0.0010
(0.0084) (0.0084) (0.0153) (0.0153) (0.0122) (0.0121)
T. Identity 0.0145* 0.0146* 0.0235 0.0224 0.0255** 0.0257**
(0.0086) (0.0086) (0.0160) (0.0160) (0.0127) (0.0127)
T. Extrinsic * Female -0.0208 -0.0208
(0.0183) (0.0182)
T. Identity * Female -0.0138 -0.0127
(0.0189) (0.0189)
T. Extrinsic * Low Performer -0.0032 -0.0045
(0.0168) (0.0168)
T. Identity * Low Performer -0.0216 0.0222
(0.0222) (0.0221)
T. Extrinsic + T. Extrinsic * Female -0.009 -0.009
(0.009) (0.009)
T. Identity + T. Identity * Female. 0.009 0.01
(0.01) (0.01)
T. Extrinsic + T. Extrinsic * Low. Perf. -0.003 -0.003
(0.01) (0.01)
T. Identity + T. Identity * Low Perf. 0.003 0.003
(0.012) (0.012)
Controls NO YES NO YES NO YES
Mean (control) 0.10 0.10 0.10 0.10 0.10 0.10
Mean (control, male) 0.12 0.12 0.12 0.12 0.12 0.12
Mean (control, high-performer) 0.10 0.10 0.10 0.10 0.10 0.10
N 7217 7217 7217 7217 7217 7217
R-Squared 0.116 0.118 0.116 0.119 0.113 0.12
Note: Robust standard errors in parentheses; * p < 0.10 ** p < 0.05 *** p < 0.01
51

Table A9: Final allocation to a disadvantaged school
Finally Allocated to a Disadvantaged School
(1) (2) (3) (4) (5) (6)
T. Extrinsic 0.01 0.010 -0.00 0.00 0.00 0.01
(0.01) (0.01) (0.019) (0.02) (0.016) (0.01)
T. Identity 0.012 0.013 0.032 0.031 0.024 0.025
(0.01) (0.01) (0.02) (0.019) (0.016) (0.016)
T. Extrinsic * Female 0.016 0.016
(0.023) (0.023)
T. Identity * Female -0.03 -0.028
(0.018) (0.02)
T. Extrinsic * Low Performer 0.002 0.002
(0.02) (0.02)
T. Identity * Low Performer -0.02 -0.02
(0.02) (0.02)
T. Extrinsic + T. Extrinsic * Female 0.015 0.016
(0.014) (0.014)
T. Identity + T. Identity * Female 0.002 0.003
(0.01) (0.01)
T. Extrinsic + T. Extrinsic * Low. Perf. 0.012 0.011
(0.016) (0.016)
T. Identity + T. Identity * Low Perf. 0.001 0.001
(0.01) (0.016)
Controls NO YES NO YES NO YES
Mean (control) 0.20 0.20 0.20 0.20 0.20 0.20
Mean (control, male) 0.23 0.23 0.23 0.23 0.23 0.17
Mean (control, high-performers) 0.17 0.17 0.17 0.17 0.17 0.17
N 7217 7217 7217 7217 7217 7217
R-Squared 0.1960 0.2280 0.2044 0.2281 0.2088 0.2279
Note: Robust standard errors in parentheses; * p < 0.10 ** p < 0.05 *** p < 0.01
52

Appendix - figures
Figure A1: Pop-ups on online vacancy selection platform in original language
(a) Control (b) Monetary incentive
(c) Career progression (d) Identity
53