
Alternative Approaches to Health Workforce Planning
61
Alternative Approaches to Health Workforce Planning Final Report April 2011 Prof. Anthony Scott and Dr. Peter Sivey Melbourne Institute of Applied Economic and Social Research, University of Melbourne Dr. Catherine Joyce Department of Epidemiology and Preventive Medicine, Monash University Prof. Deborah Schofield NHMRC Clinical Trials Centre, University of Sydney Prof. Phillip Davies School of Population Health, University of Queensland.
Transcript of Alternative Approaches to Health Workforce Planning
Alternative Approaches to Health Workforce Planning Final Report
April 2011
Prof. Anthony Scott and Dr. Peter Sivey
Melbourne Institute of Applied Economic and Social Research, University of Melbourne
Dr. Catherine Joyce
Department of Epidemiology and Preventive Medicine, Monash University
Prof. Deborah Schofield
NHMRC Clinical Trials Centre, University of Sydney
Prof. Phillip Davies
School of Population Health, University of Queensland.


© Health Workforce Australia This work is Copyright. It may be reproduced in whole or part for study or training purposes. Subject to an acknowledgement of the source, reproduction for purposes other than those indicated above, or not in accordance with the provisions of the Copyright Act 1968, requires the written permission of Health Workforce Australia (HWA). Enquiries concerning this report and its reproduction should be directed to: Health Workforce Australia Information, Analysis and Planning GPO Box 2098 Adelaide SA 5001
Telephone: 1800 707 351 Email: [email protected] Internet: www.hwa.gov.au
Suggested citation: National Health Workforce Planning and Research Collaboration 2011: Alternative Approaches to Health Workforce Planning Final Report.

ntinued)
ii
Contents
Preface 6
1 Executive summary 10
2 Introduction 13
2.1 Background 13
2.2 Aims 13
2.3 What is health workforce planning? 14
3 Current approaches to forecasting health workforce demand and supply: a critique 16
3.1 Conceptual framework: the role of the health workforce in the health care system 16
3.2 Existing reviews of health workforce planning 18
3.3 National approaches used in Australia 19
3.4 Forecasting health workforce supply 20
3.5 Forecasting health workforce demand 22
4 A roadmap for improving health workforce planning in Australia 27
4.1 Introduction 27
4.2 Handling uncertainty and sensitivity analysis 27
4.3 Recognising that ‘demand’ is based on the resources available (willingness to pay). 28
4.4 Using survey or small area data to model and forecast health care utilisation 29
4.5 Using survey or small area data to model and forecast health workforce supply 30
4.6 The effect of health workforce policies on population health and health care costs 31
4.7 Microsimulation 31
4.8 Improvements in the quality and range of data collected 31
5 An example of modelling utilisation using the National Health Survey 35
5.1 Data and methods 35
5.2 Statistical analysis 37
5.3 Results 38
5.4 Forecasts 39
5.5 Discussion 42
6 Conclusions 44
7 References 45
Appendices
Appendix A Results of utilisation regression models 53


Alternative Approaches to Health Workforce Planning 5

Alternative Approaches to Health Workforce Planning 6
Preface In 2006 the Council of Australian Governments (COAG) agreed to a significant national health workforce reform package to enable the health workforce to better respond to the evolving care needs of the Australian community, while maintaining the quality and safety of health services. The COAG package included the establishment of the National Health Workforce Taskforce (NHWT) to undertake project-based work and advise on and develop workable solutions for workforce innovation and reform. The NHWT ceased operation with the establishment of Health Workforce Australia, which assumed responsibility for the ongoing commitments and work program of the Taskforce in 2010. HWA was established by COAG through its 2008 National Partnership Agreement on Hospital and Health Workforce Reform and tasked with facilitating more effective and integrated clinical training for health professionals, provide effective and accurate information and advice to guide health workforce policy and planning, and promote, support and evaluate health workforce reform.
The National Health Workforce Planning and Research Collaboration (‘the Collaboration’) was established by the former Taskforce. The Collaboration is a tri-partite partnership between the Australian Health Workforce Institute, PricewaterhouseCoopers (PwC) and the NHWT (now HWA), and was created to undertake a significant body of national health workforce research over a three-year period.
The ‘Alternative Approaches to Health Workforce Planning’ project was undertaken by the Collaboration to critically examine current approaches to national health workforce planning in Australia, with a view to identifying possible ways to improve on these approaches.

Alternative Approaches to Health Workforce Planning 7
Alternative Approaches to Health Workforce Planning 8
Acknowledgements This project was funded by the National Health Workforce Taskforce and conducted as part of the National Health Workforce Planning and Research Collaboration. The Australian Health Workforce Institute also provided funding.

Alternative Approaches to Health Workforce Planning 9
Alternative Approaches to Health Workforce Planning 10
1 Executive summary
The aim of this report is to critically examine the role of quantitative approaches to national health workforce planning. Health care is a labour intensive industry with between 60% and 70% of health care expenditures devoted to the health workforce. The decisions made by the health workforce have large effects on population health, health care costs, and access to health care. Health workforce planning exercises, and the decisions made using their findings, can therefore have a major impact on the operation of the health care system, health care costs, and health outcomes.
The findings of this report relate largely to the fact that the existing quantitative approaches used in health workforce planning have ignored the interaction of the health workforce with the broader health system. These models have focussed on quantifying the size of the problem rather highlighting cost-effective solutions. Furthermore, health workforce planning models consider each workforce (e.g. doctors) in isolation from other workforces and from the rest of the health care system. They ignore the effect of more doctors and nurses on health outcomes and costs.
The health workforce is embedded in the provision of services to patients which ultimately try to improve health outcomes of the population using the resources available. It is essential to be able to analyse health workforce requirements in the context of the broader health care system. This thinking should flow through to the type of quantitative approaches being used in health workforce planning, and the type of data being used to support it.
A key issue in determining the future direction of health workforce planning is the clear articulation of the types of policy questions it should address. This would help to guide the collection and use of data and modelling beyond the current forecasting approaches, towards being able to help address a wider range of more pertinent policy questions.
Current approaches
Current quantitative approaches have been limited to forecasting the supply and demand for specific groups of health professionals, which has in turn been used to estimate the size of the shortage or surplus.
Forecasting future requirements have dominated health workforce planning exercises, yet are relatively narrow in terms of the policy questions they address (i.e. how many training places should be funded), and have tended to shift the focus away from the evaluation of the effects of health workforce policy and developing a better understanding of the labour markets for health professionals.
For example, forecasting demand and supply and an overall shortage or surplus ignores the issue that the ‘problem’ is not always about the size of an overall shortage or surplus. Demand could equal supply, but there may still be problems in terms of the wrong distribution of health professionals across public and private sectors, across geographical areas, and across specialties. Distributional issues are not solved by increasing the number of training places.
Current approaches ignore the effects of health workforce policy on population health and health care costs.
Forecasts are unlikely to ever ‘get it right’. Forecasting and prediction are inherently uncertain even with very sophisticated models. Despite attempts in many countries to
Alternative Approaches to Health Workforce Planning 11
plan the health workforce using forecasting models, most countries have experienced continuing cycles of significant surplus and shortage with unpredictable timing. Evidence from comparing forecasts with actual numbers suggests that the margin or error is at least between -10% and +10%, which increases with the length of forecasts.
Current forecasting models make a number of assumptions that have been criticised in the literature for a number of years, but have yet to be addressed.
Demand is not the same as utilisation which is not the same as need. Models currently use utilisation which is a function of demand, supply and need. These terms are currently misunderstood and misused, and the economic underpinnings and definitions rarely applied. Ultimately, this makes the results of forecasting models difficult to interpret.
Current approaches assume that factors influencing utilisation, such as disease prevalence, education, income, health beliefs and preferences, do not change in the future.
Current approaches assume that factors influencing hours worked and productivity of health professionals, such as technology, preferences for work-life balance, earnings, interactions with other health professionals, do not change in the future.
Current forecasting models do not routinely undertake sensitivity analysis, which is important for quantifying the amount of uncertainty around forecasts.
Current forecasting models rarely recommend how current data collections should be improved.
Possible ways forward
Development of current forecasting approaches
Current approaches to forecasting in Australia can be made more robust by routinely incorporating sensitivity analysis to quantify the level of uncertainty around estimates of future requirements, and help to prioritise future data collection. The use of stochastic models, such as Markov models, should be in routine use.
Current approaches, and those suggested below, can also be used as the basis for microsimulation models which simulate the effects of changes in key variables on workforce requirements, which can in turn provide a focus for the development of policy.
New approaches to modelling demand and supply the health workforce
Consideration should be given to the development of modelling the national demand for health care using forecasts of government health care expenditures, rather than utilisation. This overcomes the silo-based approach to workforce planning, and recognises that the costs of training and different health workforce policies are important determinants of demand.
Examining the drivers of demand and supply would assist greatly with predicting the effects of changes in key drivers (e.g. changes in disease prevalence). This would be important for the development of evidence-based policy, and also provide a useful framework for the development of modelling approaches to policy evaluation and microsimulation.
Alternative Approaches to Health Workforce Planning 12
More attention should be given to modelling the determinants of health care demand and utilisation, including individuals’ decisions to seek health care. The modelling of health care utilisation should control for the effect of supply on utilisation.
More attention should be given to modelling the determinants of recruitment, retention, mobility, hours worked, productivity and quality of care provided of the health workforce.
As an example of how modelling can relax some of the assumptions of the current approach, we examine the determinants of GP and hospital utilisation using individual-level data from the National Health Survey and burden of disease projections. This is used to simulate future utilisation based on changes in disease prevalence, ageing, and population growth. The findings suggest:
- Projected changes in the burden of disease are associated with lower utilisation, whereas population ageing is associated with higher utilisation.
- For GP utilisation, these effects almost cancel each other out, such that over a 30 year period utilisation is 0.4% lower as a result of the combined effect of the changing burden of disease and ageing. For hospital care, the net effect is an 8.7% fall in utilisation, which is associated mainly with a predicted fall in the prevalence of cancers and injuries.
- Population growth is the main driver of utilisation, with both GP and hospital utilisation predicted to rise by 43.5% between 2003 and 2033.
- Although these estimates represent an advance on current methods by incorporating data on changing patterns of disease, they assume that supply-side factors such as technology and productivity do not change, and are based on cross-sectional data such that results may be biased.
Improvements in the quality and range of data collected
A plan for improving the quality and comprehensiveness of data collections should be determined.
The collection of health workforce data in isolation from other health care data collections is problematic. This should include the linkage of health workforce datasets to other health care datasets (e.g. hospital, Medicare, and survey data), providing a crucial empirical link between inputs (health workforce) and costs, outputs, and health outcomes. It should also involve persuading other health data collections to collect data on the health workforce (for example, hospital separations data to be linked to the referring GP or specialist, or the mix of staffing in a specialty). This is essential to enable the modelling and evaluation of the effect of health workforce policies on health care costs, productivity and health outcomes.
Data collection should move away from just being able to count and describe the workforce, to being able to understand the key drivers of health workforce behaviour. Moving away from forecasting to microsimulation and modelling the behaviour of health professionals and patients will require a wider range of variables to be collected through regular panel and cohort longitudinal surveys or an expanded compulsory element of data collection within the registration process.
There is a need to build capacity in research infrastructure and data, and also building capacity amongst health workforce planners and academic researchers to enable the effective analysis, modelling and access to the data.
Alternative Approaches to Health Workforce Planning 13
2 Introduction
2.1 Background In Australia, there has been significant activity in the past in the area of health workforce planning (www.awho.gov.au). Each state and territory have conducted their own health workforce planning exercises for a number of years, in addition to much work conducted by the various national health workforce committees (e.g. the Australia Health Workforce Advisory Committee). These national committees were disbanded in 2005 around the same time as the landmark report by the Productivity Commission which suggested and led to a number of changes endorsed by COAG in 2006, and implemented by the National Health Workforce Taskforce, which evolved into Health Workforce Australia in 2010. This has included an emphasis on national co-ordination and regulation to better facilitate changes to health workforce flexibility and policy.
The use of quantitative models to forecast health workforce supply and demand have continued to be the main form of empirical evidence used during this period and for a range of health professionals, but there is now an increased recognition of the role of health workforce innovation, changes in roles, and other policies to improve the use of the health workforce.
However, the evidence base and data infrastructure to inform health workforce planning remains weak, and changes to the quality and range of data collected have been minimal to date. To be able to develop and inform workforce policy, a much better understanding of the dynamics of health professionals’ labour markets is required, in addition to a better understanding of factors influencing the demand for health care services.
2.2 Aims The aim of this report is to critically examine current approaches to national health workforce planning in Australia, with a view to identifying possible ways to improve on these approaches. The focus of this report is on existing quantitative approaches to forecasting health workforce demand and supply that help to determine how many health professionals of different types are required at some point in the future.
The report will address the following questions:
1) What are the main assumptions underpinning current national forecasting models used in Australia?
2) What implications do these assumptions have for the validity and reliability of
supply and demand forecasts?
3) What extensions and alternatives to current modelling approaches are possible or exist that could address the above assumptions?
4) How would data collections need to change to effectively implement these
approaches?
The report focuses on the development of a national approach to health workforce planning. Approaches that are used by local health care planners, for example when planning what workforce is required for a new hospital, are not explicitly considered here, though many of the issues raised in this report are relevant to sub-national approaches.
Alternative Approaches to Health Workforce Planning 14
2.3 What is health workforce planning? Health workforce planning is necessary because markets in health care fail. Labour markets for health professionals, especially doctors, are more inflexible than other labour markets because of the long time it takes to train a doctor, up to 15 years, the way that training is organised and funded through the medical colleges, the requirement of licensing and registration of many health workers, and that wages and subsidies (e.g. through Medicare) paid by the public sector are inflexible due to strong union power and state-level pay bargaining agreements (Elliott, 2003). This leads to considerable inflexibilities in the labour market, such that the overall numbers and distribution of health care workers across geographic areas, specialties, and sectors, cannot respond quickly in response to changes in demand and health care needs. The need to ‘plan’ and conduct national workforce planning exercises is also partly driven by policy makers who would like to have evidence to support decisions about the allocation of public funding to the training of health care workers.
Health workforce planning is a broad term that can describe the full range of approaches to health workforce policy, including regulation, education/training content and infrastructure, incentives, role changes, the provision of appropriate and accessible care, and more generally ensuring that an appropriate health workforce exists to meet health care needs. Health workforce planning can be long term and strategic, or can be short term and focused on immediate issues, with the latter likely to dominate most health workforce planning exercises (WHO, 2010). Health workforce planning approaches also differ between countries ((Dussault et al., 2010, House of Commons Select Committee, 2007). The broad strategic approach has recently been summarised by the World Health Organisation (WHO, 2010, Dussault et al., 2010) and may include long terms plans for education and training, new models of care, changes in regulation, and integration with broad objectives for the health care system (Productivity Commission, 2005), which may also require fundamental structural and cultural change.
The more usual and narrow definition of health workforce planning, which is often used to support the more broad approach, is concerned with the forecasting of health workforce demand and supply in an effort to determine the appropriate numbers of health care workers required. Most health workforce planning exercises are based around two steps (Roberfroid et al., 2009): i) estimating health workforce requirements (the gap, i.e. a shortage or surplus),
using various data sources including methods to forecasting trends in supply and demand for each type of health professionals at a given number of years into the future, and;
ii) the development of policy interventions to address the gap.
For the first step, quantitative forecasting models are used based on the changing demographics of the population and of the health workforce. In Australia, the National Health Workforce Taskforce developed the Health Workforce Planning Tool (HWPT) that produces such projections and estimates of requirements. Other such tools also exist and are based on similar demographic approaches (Greenberg and Cultice, 1997, WHO, 2010, Denton et al., 1994). The recent review by the World Health Organisation summarises and provides details of some of these tools (e.g. http://www.capacityproject.org/hris/suite/ihris_plan.php), some of which are specific to achieving objectives such as the Millennium Development Goals for a limited range of ‘priority interventions’ and are designed to be used across countries (Dreesch et al.,
Alternative Approaches to Health Workforce Planning 15
2005). Some tools are useful at a country level, whilst others are more suitable to a local level. The first step also focuses the national policy ‘problem’ in terms of an overall shortage or surplus. However, the ‘problem’ is not always about the size of an overall shortage or surplus. Demand could equal supply overall, but there may still be problems in terms of the wrong distribution of health professionals across sectors, geographical areas, specialties. A ‘shortage’ experienced by a public hospital may in fact be a distributional issue if there is a ‘surplus’ in the private sector. Training more health professionals without accompanying policies to also change their distribution, will re-enforce the existing mal-distribution. The policy solution is therefore not to train more professionals, but to alter their distribution and increase the flexibility with which the distribution can be changed (Goodman and Grumbach, 2008). With the exception of rural and remote distribution in Australia, issues of distribution are often ignored by policy makers. For example, distribution across specialties is an issue, with increasing sub-specialisation and narrower sets of skills leading to a more inflexible medical workforce which cannot be re-deployed to other areas if a shortage occurs (Goodman and Fisher, 2008). If the demand for cardio-thoracic surgeons falls due to the increasing use of stents, then can these surgeons be used in specialties where shortages exist? Flexibility in the use of skills within and between different health professionals is a key issue that is heavily influenced by the nature of education and training.
In terms of the second step, estimates of future requirements are often interpreted by policymakers as additional training places that need to be funded, but this ignores a range of other policies that can be used to increase the quality, productivity, distribution, recruitment and retention of the existing health workforce (Dussault et al., 2010). For example, a substantial proportion of individuals with nursing qualifications do not work as nurses. Though funding additional training often remains the dominant policy, there is an increasing recognition of the value of other policies that increase supply and productivity (Productivity Commission, 2005, House of Commons Select Committee, 2007). These policies include changes to regulation, educational programs, improving the quality of jobs, different models of care and changes in roles, financial incentives, and methods to increase productivity such as implementing evidence-based clinical guidelines.
The long term dynamics are also very relevant. Current shortages (or surpluses) are responded to by policy makers by increasing the number of training positions, which only has an impact many years later. If a shortage exists it is usually already too late to fix it by increasing training places. By the time new health professionals become trained (up to 15 years for doctors) the situation may be radically different. For example, in the UK large increases in numbers of health professionals from 1997 were followed a few years later by retrenchments, which are continuing in the current UK recession (House of Commons Select Committee, 2007). These short-term politically-expedient policy responses lead to periodical large expansions (or contractions) of the health workforce, which can exacerbate future shortages and surpluses in unpredictable ways. Despite attempts in many countries to plan the health workforce using forecasting models, most countries have continued to experience cycles of significant surplus and shortage which occur with unpredictable timing (Bloor and Maynard, 2003).
Alternative Approaches to Health Workforce Planning 16
3 Current approaches to forecasting health workforce demand and supply: a critique
The aim of this section is review current approaches to health workforce planning. The focus is on quantitative approaches that can be used at a national level. First, a conceptual framework is presented that helps to set the context for health workforce planning exercises, and also helps to determine a way forward. This highlights a number of broad assumptions that highlight the factors that current approaches ignore. These are mainly concerned with the interaction of the health workforce with the rest of the health care system. There have been a number of existing reviews of the literature, which will then be summarised. The current approach in Australia is then described and its assumptions discussed.
3.1 Conceptual framework: the role of the health workforce in the health care system
It is important to first of all examine the role of the health workforce in the health care system. Health workforce policy is a means to an end, and making decisions about the health workforce in isolation from the rest of the health care system is problematic. Similarly, modelling and forecasting health workforce requirements without also modelling the rest of the health care system is also problematic.
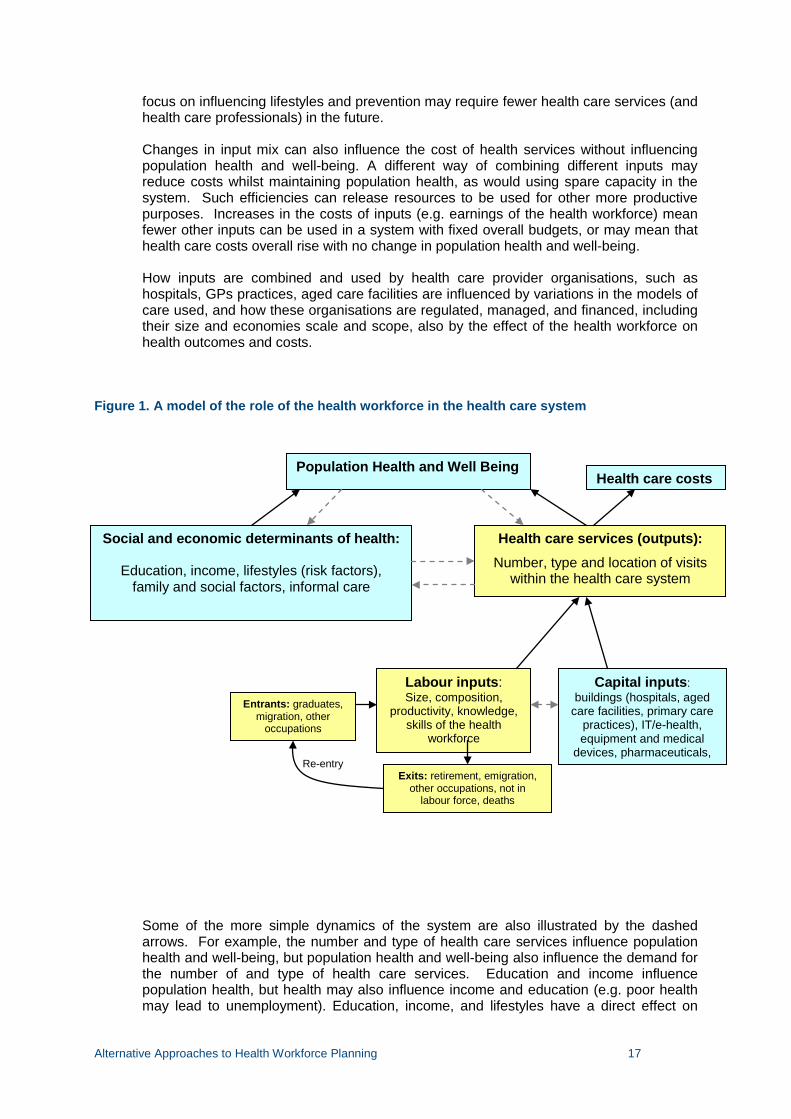
Figure 1 below shows the role of the health workforce in the health care system using a simple ‘production function’ framework that specifies inputs, outputs, outcomes and costs. Current health workforce modelling approaches only consider the boxes coloured yellow: health care services produced (utilisation) ‘matched’ with the health workforce, and usually only for one specific health profession. The key issue is that the adequacy of the health workforce can only be properly examined by accounting for all factors in Figure 1. Being able to empirically model these relationships using good quality data sources helps to define how the methods and data sources of health workforce planning should be developed into the future.
The framework in Figure 1 recognises that population health and well-being is influenced by a variety of inter-related and dynamic factors, of which the health workforce is but one (Dussault et al., 2010). The framework recognises that the ultimate aims of health workforce planning are to improve population health with limited resources. However, current approaches ignore the effects of increasing health workforce supply on health care costs and population health. At the moment, there is an assumption that changes in health workforce policy (e.g. increasing supply), will improve population health. Since a large proportion of health care services have no evidence-base for their effects on health or on costs, then more health professionals undertaking the same potentially ineffective interventions may not lead to improvements in population health but substantially increase health care costs (Maynard, 2006).
In considering inputs into the production of health care services, changes in the mix of inputs, including different types of health professional or advances in IT and other technologies are likely to change the number, type and cost of health services produced (outputs), which in turn is likely to change population health and well-being. Some may increase utilisation and others may reduce it, with the net effect unknown. In addition a
Alternative Approaches to Health Workforce Planning 17
focus on influencing lifestyles and prevention may require fewer health care services (and health care professionals) in the future.
Changes in input mix can also influence the cost of health services without influencing population health and well-being. A different way of combining different inputs may reduce costs whilst maintaining population health, as would using spare capacity in the system. Such efficiencies can release resources to be used for other more productive purposes. Increases in the costs of inputs (e.g. earnings of the health workforce) mean fewer other inputs can be used in a system with fixed overall budgets, or may mean that health care costs overall rise with no change in population health and well-being.
How inputs are combined and used by health care provider organisations, such as hospitals, GPs practices, aged care facilities are influenced by variations in the models of care used, and how these organisations are regulated, managed, and financed, including their size and economies scale and scope, also by the effect of the health workforce on health outcomes and costs.
Figure 1. A model of the role of the health workforce in the health care system
Some of the more simple dynamics of the system are also illustrated by the dashed arrows. For example, the number and type of health care services influence population health and well-being, but population health and well-being also influence the demand for the number of and type of health care services. Education and income influence population health, but health may also influence income and education (e.g. poor health may lead to unemployment). Education, income, and lifestyles have a direct effect on
Population Health and Well Being
Social and economic determinants of health:
Education, income, lifestyles (risk factors), family and social factors, informal care
Health care services (outputs): Number, type and location of visits
within the health care system
Health care costs
Capital inputs: buildings (hospitals, aged
care facilities, primary care practices), IT/e-health, equipment and medical
devices, pharmaceuticals,
Labour inputs: Size, composition,
productivity, knowledge, skills of the health
workforce
Entrants: graduates, migration, other
occupations
Exits: retirement, emigration, other occupations, not in
labour force, deaths
Re-entry
Alternative Approaches to Health Workforce Planning 18
population health and well-being, but also influence the demand for health care services. Health care services also play a role in modifying lifestyles and reducing risk factors for disease. Equity can be examined in the framework by examining the distribution of population health and well-being, health care services, inputs (hospitals and primary care services) and the determinants of health across different population groups (e.g. rural-urban, high and low income).
The particular issue for health workforce planning is to be able to gather evidence and data to populate Figure 1. The Figure is presented in a simple way, but the complexity increases once issues of short and long term dynamics and causality are introduced. Complex problems require complex solutions and comprehensive and high quality data. Current modelling and forecasting approaches only focus on the yellow areas. Though it is important to be able to improve methods and data collection for these areas, it is equally important to do the same for the other areas in Figure 1.
3.2 Existing reviews of health workforce planning There have been a number of reviews of health workforce planning and forecasting (AMWAC, 2000, Australian Health Workforce Advisory Committee, 2005c, Australian Health Workforce Advisory Committee, 2005a, Birch et al., 2007, Birch et al., 2003, Bloor and Maynard, 2003, Dreesch et al., 2005, Dussault et al., 2010, Gavel, 2004, House of Commons Select Committee, 2007, Jeffers et al., 1971, Joyce et al., 2004, Lavis and Birch, 1997, Lomas et al., 1985, Maynard, 2006, Maynard and Walker, 1997, O'Brien-Pallas et al., 2001, Parsons, 2010, Productivity Commission, 2005, Roberfroid et al., 2009, Scheffler, 2008, Scott, 2009, Segal and Bolton, 2009, Weiner, 2002, WHO, 2010, Zurn et al., 2004, Tomblin-Murphy, 2002). Many of the criticisms of health workforce planning made in this report have been made before. These reviews have, to varying extents, summarised the advantages and disadvantages of health workforce planning and recognised that the success of the exercise depends on the objectives of the exercise and the quality and nature of data used. Most reviews have emphasised the need for a ‘whole of system’ approach, which includes the basic forecasting model. Approaches used have usually varied across countries depending on data availability. Countries with poor data may rely on more simple measures (e.g. staff to population ratios and benchmarking), but which make the validity of the estimates of requirements questionable, thus potentially providing the wrong advice to policy makers. Only one of these reviews has conducted a comprehensive literature review focused on developed countries (Roberfroid et al., 2009). For literature and models applied to developing countries see WHO (2010). Our aim is not to repeat these reviews, but to use their findings and literature to critique and examine the situation in Australia.
Furthermore, reviews point out that the focus of health workforce planning is largely on issues about the forecasting of requirements, and largely ignore the complex relationships between the range of variables that influence health workforce supply and demand, and how these influence population health and equity (Figure 1). This is crucial to understand if effective policies are to be designed to change health workforce supply and distribution (Birch et al., 2003, Segal and Bolton, 2009, Joyce et al., 2004, Adams, 1992, Masnick and McDonnell, 2010). Variables influencing supply and demand need to be not only identified and measured, but their inter-relationships and causal effects need to be clearly understood. This ‘behavioural’ modelling is a feature entirely absent from the existing literature on health workforce planning and from current and past approaches used in Australia. Rather than a continuing focus on the size of the shortage or surplus it would be worthwhile to re-focus effort on the most cost-effective ways to address it.
Alternative Approaches to Health Workforce Planning 19
There is a perception that Australia has been ’good’ at health workforce planning, compared to other countries, though this view may reflect the volume rather than quality of health workforce planning activity undertaken in Australia. For example:
“Australia has for years been at the forefront of developing medical workforce planning approaches. However, it has only recently been acknowledged that the Australian workforce planning has so far not taken into account the full range of dynamic variables that are involved, nor accounted for their inherent uncertainty and complex interactions (Joyce et al., 2004). Subsequently, Joyce et al. have emphasized the importance of an effective monitoring of all key factors affecting supply and demand, i.e. an effective systematic collection of good-quality data to monitor trends over time, as well as the need for a dynamic approach, i.e. to undertake workforce planning in a planned cyclical fashion, with stochastic models to account for the uncertainty inherent in health systems” (Roberfroid et al., 2009)
A more sceptical summary of health workforce planning is provided by Maynard (2006):
“While…. workforce planning is essential, it is generally deeply flawed methodologically and often wrong in the conclusions it reaches. It is usually based on an unquestioning assumption that more health care inputs automatically result in more health and that the efficient and unique way to produce improved population health is through increased investments in the health care workforce. Such an approach should be dealt with sceptically in an industry in which patient outcomes are neither measured nor managed and where a significant proportion of health care in common use has no evidence base.”
Often, health workforce planning models have been simplified to make them easier to use, rather than made more complex to properly understand health workforce dynamics. Conceptual and theoretical frameworks, such as the economic theory of labour demand and supply, and production function approaches (See Figure 1) that exist to aid understanding of these relationships and that help to generate hypotheses, are largely ignored in the workforce planning literature. A thorough understanding how health care labour markets work is fundamental to solving health workforce imbalances.
3.3 National approaches used in Australia The current approach to forecasting demand and supply of the health workforce is the Health Workforce Planning Tool (HWPT), developed by the National Health Workforce Taskforce (http://www.ahwo.gov.au/researchtool.asp). The tool has built on previous approaches and has an easy-to-use graphical user interface (GUI), and is designed to be used by national as well as jurisdictional health workforce planners. The aim was to attempt to provide some consistency across the use of data and the methodology used. The tool has built in flexibility with respect to the import of data and the construction of scenarios. It has been used by some jurisdictions, and also by the National Health Workforce Taskforce (now Health Workforce Australia) to produce forecasts for specific workforces, and in the recently announced National Training Plan. The tool has not yet been used to its full potential due mainly to data limitations.
The tool uses a simple demographic approach (see below) for forecasting supply, which is the same approach used in many other models of this type and in many other countries. This basic modelling approach is deterministic and is usually conducted in a spreadsheet-based application, in that it allows for a single number to be calculated for each year in the future. However, there is inherent uncertainty present in these
Alternative Approaches to Health Workforce Planning 20
projections that a deterministic model ignores. This is due to a range of assumptions underpinning the projections.
The forecasting of demand is regarded as the most problematic largely due to the data requirements. The tool has been reviewed several times, with the most recent review recommending the routine use of sensitivity analysis to quantify the level of uncertainty around forecasts of requirements (Scott and Sivey, 2010).
3.4 Forecasting health workforce supply
3.4.1 How is it done?
The HWPT and other models used elsewhere calculate supply projections based on demographic change of the health workforce over time, which takes the current stock of the health workforce and accounts for new entries to the workforce (graduates, training completions, immigration, and those returning to work after an absence) less exits (temporary absences, retirements, those seeking other employment, emigration). The stock/number of trained health professionals (S) in a future year (t+1, t+2 etc, where t is the current year) is dependent on the stock in the current year (St) plus those that join the workforce (Jt+1) and minus those that leave (Lt+1):
St+1 = St + Jt+1 – Lt+1
St+2 = St+1 + Jt+2 – Lt+2
If the data allows, each of these groups can be broken down further by hours of work, gender, and other characteristics. This allows for different time trends in the age-gender mix, working hours, and other workforce characteristics to be accounted for. The effects of changes in the level of entries and exits over time can be also modelled. This approach may also express supply in terms of health workforce to population ratios, thus partly accounting for changes in demand through changes in the size of the population (Joyce CM and McNeil JJ, 2006).
The link between forecasts of supply and forecasts of utilisation is usually made by translating estimated utilisation (number of services provided) into time and FTEs (Dreesch et al., 2005). This requires some estimate of how much time it takes a specific professional to deliver the service, and the ability to translate this into FTEs workers. Estimating the time taken to perform tasks may be relatively simple in terms of estimating the number of patients that can be treated per unit of time for a FTE. Alternatively, estimation of time can be based on more detailed time and motion studies or task analysis (Dreesch et al., 2005, Schoo et al., 2008, Ridoutt et al., 2006). This requires more detailed data collection and also the ability to explain variations in the time it takes to conduct tasks. This can also be used to determine the training and competencies required to undertake tasks effectively (Dreesch et al., 2005). To conduct such an exercise for all types of health care interventions would not be possible. National exercises are more likely to require broad brush approaches to the measurement of workload and productivity as more detailed data are often unavailable (Scott and Cheng, 2010).
Alternative Approaches to Health Workforce Planning 21
3.4.2 What are the assumptions?
1. No changes in the roles of health professionals in the future.
A major drawback is that the approach relies on a ‘silo’ approach and considers only one profession or speciality at a time, and ignores their interaction with other professions (Dreesch et al., 2005). The ‘silo’ based approach is not compatible with current policy directions for the health system, which emphasise team working and interdisciplinary care across different settings. Figure 1 emphasises the role of changing the mix of the health workforce on health outcomes and costs. There are major trends in the use of non-medical health professionals in most countries, with changes in the mix of health professionals potentially having an important impact on productivity, costs and health outcomes (Laurant et al., 2004, Horrocks et al., 2002, Richardson et al., 1998). Failure to take this into account reinforces existing models of care and input mixes. Current deterministic models cannot take this explicitly into account in their forecasts. In some instances, scenarios can be used to make general assumptions about how the increased use of for example, practice nurses, might require fewer GPs in the future, or allow them to treat more people, but it is difficult to base these scenarios on reliable quantitative data. Furthermore, non-medical health professionals maybe complements to, rather than substitutes for, medical practitioners (Kernick and Scott, 2002). Though some tasks may be delegated to non-medical health professionals, it is rarely the case that doctors reduce their hours of work or become unemployed (Maynard, 2006). This is especially the case where there is excess demand and waiting lists. More patients are usually treated at additional cost.
2. Hours worked remain the same into the future.
Though the models account for changes in hours worked that are driven by changes in age and gender mix of the workforce, it does not account for other changes in the number of hours worked, such as the recent trend in shorter working hours by both male and female doctors of all ages, the preferences of younger cohorts of workers for a better work-life balance, and the effect of changes in other factors on hours worked. These trends can have significant effects on future supply and productivity (Watson et al., 2006). If average working hours continue to fall, workforce planning models are likely to overestimate future supply, and underestimate future workforce requirements.
3. No changes in technology or other inputs.
Productivity (the number of patients seen or the workload of a health worker) will change over time as technology changes. Changes in technology can have important and long lasting effects on productivity, costs and health outcomes (Australian Health Workforce Advisory Committee, 2005c). New drugs, medical devices, and also different and more efficient ways of working including changing the tasks of health workers, can increase the number of patients seen per worker and per unit of time, in addition to influencing health outcomes, costs and access to health care. For example, the use of vascular stents has reduced the need for cardio-thoracic surgeons. This has the effect of reducing requirements for health workers in the future. Other technologies developed to treat diseases that previously could not be treated (e.g. pharmaceuticals) are likely to increase utilisation by lowering the treatment thresholds of doctors. However, it is difficult to empirically incorporate these changes into health workforce planning models as there is often no data or evidence on the impact of changes in technology on productivity in the future (Australian Health Workforce Advisory Committee, 2005c). Often these effects are
Alternative Approaches to Health Workforce Planning 22
unpredictable. Broad assumptions could be used based on past trends, but these are not usually incorporated into health workforce planning models. Assuming the same productivity of today in future projections is likely to lead to an overestimate of health workforce requirements.
4. No effects of specific recruitment and retention policies or financial incentives.
Recruitment and retention policies that influence entry and exit, including regulation, financial incentives and return to work bonuses, are likely to have an impact on future supply that are not accounted for in demographic supply projection models. For example, increases in funding for General Practice, including capital grants, new Medicare rebates, and other incentive schemes, are likely to influence hours worked and also GP supply through more doctors choosing general practice as a specialty. Regulation restricting the numbers of overseas trained health professionals is another example. For example, a previous report found that the results of the demographic health workforce planning model currently being used by HWA was very sensitive to changes in exit rates (Scott and Sivey, 2010). This suggests that policies that influence retention are likely to have a significant impact on future supply. Current models do not examine the likely impact of such policies on the size of the workforce requirements.
4. Changes in the earnings and working conditions of other occupations
For nurses and other occupations who work in the health care sector, including managers, relative earnings and working conditions in occupations that compete for the skills of health workers will influence recruitment and retention in health care workers’ labour markets. This is especially the case for those health professionals who are employees in the public sector and covered by employer wage bargaining agreements. In these situations, wages and working conditions are relatively inflexible compared to the private sector, where wages can adjust more freely to solve recruitment and retention problems. Any changes to bargaining agreements or wages in the public sector may therefore influence recruitment and retention, through changes in competition in the labour market.
3.5 Forecasting health workforce demand
3.5.1 How is it done?
Current approaches use utilisation as a measure of demand, such as the number of hospital separations, or the number of visits to GPs. . However, there are a number of issues and assumptions underlying this approach (Jeffers et al., 1971). Utilisation is determined by both demand and supply. The term ‘demand’ is often misused in existing health workforce planning models.
Demand for health care reflects the preferences of patients of whether to visit a health care provider, which is determined by their income, education, lifestyles, health beliefs etc (‘social and economic determinants of health’ in Figure 1). In a market setting demand is reflected by an individual’s willingness to pay (a measure of strength of preference) assuming that the individual has full information about what is being bought, and a range of other assumptions most of which do not hold in health care. Measuring this in health care is difficult due to extensive market failures which mean that prices, if they exist, do not reflect preferences or willingness to pay. Patients do not have the same information as doctors, and so patients do not know what tests and investigations are necessary to
Alternative Approaches to Health Workforce Planning 23
obtain a diagnosis. Nor do they know what treatments are available, and their relative effectiveness, once a diagnosis has been made. Some individuals will not know they have a health problem or may not consider it to be a ‘problem’, and so may not visit the doctor. They have a ‘need’ for health care but do not ‘demand it’. Others may not have a health problem, yet think that something might be wrong and so visit the doctor anyway. They demand health care but have no ‘need’. Both patients’ preferences and health professionals’ preferences’ are also likely to change over time, altering the dynamics of the relationship between demand, need, utilisation and supply.
The concept of ‘need’ has been extensively used in health care, given the difficulties in measuring demand for health care services. Need can be a subjective measure of what type of health care interventions patients require, their capacity to benefit from treatment, as it is usually determined by the views of experts and health care providers, which may or not be based on evidence of which treatments are effective, if such evidence exists.
There are a number of different measures of need that can be used in health workforce planning models (Tomblin-Murphy, 2002, Lavis and Birch, 1997, O'Brien-Pallas et al., 2001).
1. Population growth
This is the most basic measure of the need for health care services. The number and age-gender composition of the population, and how this changes over time, is the major factor influencing health care utilisation and expenditures. Population projections by the ABS are readily available and so population growth is relatively easy to measure and to forecast. The growth and change in the age-gender composition of the population is usually used in combination with other measures of need outlined below (e.g. age-gender specific measures of health care utilisation or disease prevalence).
2. Epidemiological approaches
This measures the burden of disease using data on disease prevalence in populations. Disease prevalence is ideally measured through screening of a sample of the population for the presence of a disease. This would be able to capture both met need (where a visit to a health professional has occurred) and unmet need (individuals with disease who do not visit a health professional). However, in practice epidemiological approaches often measure need or burden of disease on the basis of a diagnosis by a health professional at a health care visit, and so is essentially a utilisation-based measure of need (see below) (Begg et al., 2007). There is no comprehensive data on the prevalence of all diseases. For example, cancer and other disease registries provide data on prevalence, but only include cancers that have been diagnosed and so do not include those who have cancer but who have not been diagnosed (unmet need).
Health economists have frequently criticised the use of burden of disease data as a basis for allocating resources, as it ignores whether there exists a cost-effective treatment for a disease. The epidemiological approach assumes all needs can and should be met (Dreesch et al., 2005). If there is no cost-effective treatment, then allocating resources to that disease will not improve population health, and may be better targeted at another disease with a lower ‘burden’ but with more cost-effective treatment options. Health economists have therefore defined need as ‘capacity to benefit’ from treatment, though this is also difficult to measure.
3. Health care utilisation
Utilisation is used as a proxy for need that has been met through contact with the health system. Utilisation data are regularly used in health workforce, and in health care
Alternative Approaches to Health Workforce Planning 24
planning, models more generally (Morris et al., 2005). As mentioned earlier, these data are also used in burden of disease studies (Begg et al., 2007). Utilisation in terms of whether an individual visits a health care provider is partly determined by the preferences of patients (demand) and partly determined by the availability of and access to a health care provider (the location of health providers, i.e. supply), and the views of health care providers as to what health care the patient and the population need (supply). Once a patient is in the health care system, how much they use health care (e.g. length of stay and number of visits) is determined largely by the preferences of doctors rather than patients, though health care providers may account for patients’ preferences when choosing treatment options. Utilisation represents the result of the interaction between demand, need and supply. Having health workforce planning models that forecast supply and forecast utilisation (which depends on supply) assumes that utilisation is independent of supply when it is not.
The utilisation of health care (‘health care services’ in Figure 1) is therefore determined by both demand (patients’ preferences) and supply (the preferences, views, experience, skills, and geographic location of health care providers). The preferences of the population for health care visits are combined with the willingness of health care providers to provide the appropriate services.
4. Service-based workforce planning
This links workforce planning to the provision of specific health care services at a local level. ‘Need’ is defined on the basis of what staffing an organisation would require to operate effectively. Assessing the need for staffing may include the use of hospital bed to staff ratios, or projections of changes in an organisation’s future case-mix, and incorporate changes in the population, burden of disease. An organisation would also need to take account of their expected budget in deciding how many of what mix of staff it could employ (Segal et al., 2008). This approach is usually used at a local level. It may incorporate (2) and (3) above.
5. Task-based workforce planning
Related to the above, workforce planning and staff requirements can be based on an estimate of the tasks a typical professional can undertake in a given time period (Schoo et al., 2008, Ridoutt et al., 2006, Cooper, 2004, Dreesch et al., 2005). This method is also linked to competency-based workforce planning. Need is therefore proxied by a set of specific tasks that are required, thus having implications for how the health workforce is trained and skills developed. This approach could be useful for very localised approaches to health workforce planning (e.g. at a ward or department level), but to do this effectively at the national level requires an enormous amount of data on tasks covering all disease areas and professions.
6. ‘Best practice’ or ‘models of care’ approaches to health workforce planning.
This approach defines need in terms of evidence-based ‘best practice’ guidelines for care in specific disease areas, and matches these with the appropriate mix of staff to deliver this best practice care (Australian Health Workforce Advisory Committee, 2005b). A recent example of this approach in Australia is by Segal et al. (2008). So for diabetes patients, there exist evidence-based guidelines of what tasks, tests and counselling should be performed, this is translated into a skills/task requirement for each type of health professional and the time taken for each task, and the translate this into the number of FTEs. This is then compared against existing supply and budgets. Again, this may be a feasible approach for a specific group of patients at a local level. However, it would not be possible to do this at a national level and for all diseases as often there is insufficient evidence in health care to establish ‘best practice’, as major gaps in the
Alternative Approaches to Health Workforce Planning 25
evidence exists, and there is wide variation in the views of health professionals as to what constitutes ‘best practice’ (Dreesch et al., 2005, Maynard, 2006). Furthermore, it is a subjective measure of what patients “ought to have” that does not measure demand at all. Even if such evidence did exist, this would require a large amount of information on every disease that would need to be aggregated.
7. Benchmarking and targets.
This approach encompasses the relatively simple approach of using health workforce to population ratios as proxies for need (Dreesch et al., 2005, Goodman et al., 1996). The use of health workforce to population ratios has been heavily criticised as it is not evidence which ‘ratio’ is optimal (O’Brien-Pallas et al., 2001, Segal and Bolton, 2009). Comparing such ratios across regions or countries to imply the existence of a ‘shortage’ or ‘surplus’ compared to the average, or with historical ratios, is misleading as the average or benchmark used may not be optimal.
A more sophisticated approach using benchmarking was undertaken by Schofield and colleagues. This approach measures the demand for services based on patients preparedness to buy and use services in an area that is deemed to have an adequate supply of services(Schofield et al., 2008, Schofield et al., 2010). The authors used the 2005 National Health Survey to develop a microsimulation model to determine the distribution of GP services that would occur if all Australians had adequate access to health services. Adequate access was defined as that available in Australia’s capital cities. Using this approach total demand nationally and unmet demand at the national level and by certain groups was estimated. Unmet demand of about 10% nationally was estimated with significant unmet demand as high as 20% in some vulnerable groups. This method has the advantages of estimating national demand and identifying where demand is not currently met making it a good basis for adequate and equitable workforce planning. The most challenging aspect is the definition of the benchmark for adequacy which assumes that the benchmark supply is adequate to meet demand.
3.5.2 What are the assumptions?
1. Utilisation is assumed to be independent of supply.
Health workforce planning models assume that utilisation is independent of supply. They assume that changes in supply do not influence utilisation. However, the number, activities, and distribution of health professionals have a clear effect on health care utilisation. This is through the following mechanisms.
Prices. The influence of prices and costs of attending health care services. An increase in supply can cause an increase in utilisation, even if the size and characteristics of the population do no change. This is because of the role of prices. Where prices are charged by health care providers, then when a provider increases (reduces) their price utilisation falls (increases), and this has been the case for GP utilisation in Australia (McRae, 2008, Scott, 2006). To separate out demand from supply requires more complex economic and econometric models not currently used in health workforce planning (McRae, 2008).
Location choice and distribution of the health workforce. The accessibility of health care services, or the time and travel costs of attending, is determined by the where health professionals and facilities are located. The further away a health care provider, the less likely individuals are to visit (lower utilisation). A more unequal distribution of the health workforce over time, or reductions in hours worked will therefore reduce utilisation even
Alternative Approaches to Health Workforce Planning 26
when the preferences of patients or ‘need’ for health care does not change or is increasing (Scott, 2006). Similarly, a more equal distribution of the health workforce or increases in the numbers or hours worked of health professionals will increase utilisation, even if patients’ preferences or need for health care has not changed. Some of these issues were reviewed in an earlier report by the Australian Health Workforce Committee (Australian Health Workforce Advisory Committee, 2005a).
Changes in hours worked by health professionals. The fewer hours worked by a doctor, the fewer patients they can see (lower utilisation) (Scott, 2006).
Medical practice variation. Variations in the preferences of health professionals for different treatments and tests in the absence of good evidence on what is most effective, can lead to variations in the level of utilisation (Maynard, 2006).
Supplier-induced demand. The potential for supplier-induced demand. Health professionals providing services that are not ‘needed’ to maintain their incomes (higher utilisation), though there is little good evidence about this.
2. Changes in factors influencing the demand for health professionals are ignored.
Prevention and other determinants of health. Health care services are only one input into the demand for health (see Figure 1). The demand for health professionals is therefore derived from the demand for health care services, which is in turn derived from the demand for health. Health can also be improved through lifestyle changes (exercise, healthy diet etc), changes in incomes, education, environmental policies, self-care, social and community support. These other inputs can be substitutes for health care services (and therefore health professionals). A focus on public health and prevention is usually assumed to reduce the prevalence of disease in the longer term, whilst increasing self-care and information might reduce demand. However, evidence of these effects is not strong.
Changes in the relative earnings between different groups of health professionals. Changes in the relative prices of inputs (the wages of health professionals and the prices of capital equipment) influence the demand for health professionals where budgets are fixed (e.g. in public hospitals). A wage rise for public hospital doctors in public hospitals means fewer other staff can be employed or less equipment can be purchased.
Alternative Approaches to Health Workforce Planning 27
4 A roadmap for improving health workforce planning in Australia
4.1 Introduction Figure 1 provides a roadmap and broad guidance on how the quantitative modelling of health workforce requirements can be improved. It shows where the current gaps are and provides an idea of where we want to be, both in terms of policy, data collection, and the focus of quantitative analysis. The issue is how we get there. Current modelling and forecasting approaches only focus on the yellow areas. Though it is important to be able to improve methods and data collection for these areas, it is equally important to do the same for the other areas in Figure 1.
This section focuses on the further development of existing approaches to the quantitative forecasting of health workforce requirements in Australia, such as the HWPT. Assuming there remains a need for such modelling, there are ways in which current approaches can be improved. However, it is important to recognise that even if the best data were available, the ability to predict and forecast into the future will always depend on assumptions of likely future scenarios. This introduces considerable uncertainty around forecasts that needs to be quantified and reduced.
4.2 Handling uncertainty and sensitivity analysis In the presence of uncertainty and absence of good and complete data, and the general uncertainty of predicting into the future, it is good practice to conduct a sensitivity analysis of these models (Scott and Sivey, 2010, Tomblin-Murphy, 2002, Birch et al., 2007). Birch et al (2007) provide an example of how the current demographic approach can be built on by incorporating explicit tests of assumptions and simulation of a range of policy changes (Birch et al., 2007).
Sensitivity analysis is currently not routinely built into health workforce planning models in Australia. Sensitivity analysis changes the quantitative parameters (e.g. exit rates, number of graduates, migration, and other assumptions) of the models where there is uncertainty about how these will change in the future or where there is uncertainty due to poor quality data, and examines the effect of such changes on future supply projections. In doing this, systematic sensitivity analysis can be used to examine which parameters are most important (i.e. have the largest impact on projections), and so help to prioritise data collection and improve the quality of data used. This can also be used to simulate the effects of policy changes that influence these parameters (Birch et al., 2007).
Previous research has shown the extent to which models can be sensitive to the parameter values used (Birch et al., 2007, Scott and Sivey, 2010). Roberfroid et al (2009) examined evidence of the external and internal validity of health workforce planning models. External validity refers to the stability of results where different types of models are used in the same setting. Internal validity is how sensitive models are to variations of key parameter estimates. Unsurprisingly, the results of models were sensitive to these issues, suggesting that it is important to characterise and quantify the extent of uncertainty in estimates of requirements. In addition, comparing models projections to actual data a number of years later is also a way of examining the accuracy of models’ forecasts. Margins of error through comparing previous forecasts with actual numbers ranged between -7.4% and 9% for studies using deterministic, stochastic and regression-based approaches (Roberfroid et al., 2009). This is a relatively high margin of error. Given the high costs of training health professionals, the economic consequences of such errors can be large.

Alternative Approaches to Health Workforce Planning 28
There are a number of different methods of sensitivity analysis. Deterministic sensitivity analysis changes one or a number of parameters at the same time. One-way sensitivity analysis examines the impact of changing just one parameter at a time (e.g. changes in exit rates as shown in Scott and Sivey, 2010). Multi-way sensitivity analysis changes a number of parameters at the same time, which may correspond to the modelling of a specific future scenario (e.g. an increase in graduates all working fewer hours and with lower migration).
Probabilistic sensitivity analysis incorporates uncertainty into these models using the sampling variation in the data, resulting in stochastic rather than deterministic workforce planning models. This gives a range of plausible parameter values and enables models to include confidence intervals and the testing of the statistical significance of different estimates (Song and Rathwell, 1994, Joyce CM and McNeil JJ, 2006, Lipscomb et al., 1995). One method to do this is to use Markov modelling (Joyce CM and McNeil JJ, 2006, Roberfroid et al., 2009). This uses probabilities to model the transitions of the workforce into and out of various employment states over time. This was used in an study on Australian doctors (Joyce CM and McNeil JJ, 2006) and has been recommended in the literature for a number of years (O’Brien-Pallas et al., 2001), but is not currently being used in health workforce planning in Australia. Others have also shown that stochastic simulation approaches perform better than deterministic approaches (Song and Rathwell, 1994).
4.3 Recognising that ‘demand’ is based on the resources available (willingness to pay).
Health workforce planning models currently ignore the costs (and effectiveness) of policies to increase health workforce supply. Resources are scare and limited and priorities need to be set about the most effective ways to improve population health within the resources available. For example, for health professionals who are employees, demand for their services is made by their employer. For example, a public hospital with a fixed budget must decide how many and what mix of health professionals and other inputs they must employ. They will take account of the characteristics of the patients that are referred to them, or who enter through the ED, but will also need to take account of the relative earnings of health professionals and the prices of other inputs such as equipment, and medical devices etc. High pay for nurses, means fewer other health professionals can be employed. The decision of a government is similar.
If demand is reflected in an individuals’ willingness to pay, then aggregate demand can be proxied by government’s willingness to pay for health care, through the growth in governments’ health expenditure. This is therefore a more direct measure of demand based on governments’ willingness to pay. This broad approach has been used in a number of studies (Scheffler et al., 2008, Scheffler, 2008, Cooper, 2004, Lomas and Stoddart, 1985, Australian Health Workforce Advisory Committee, 2005a), including a report on demand by AHMAC in 2005. Government health expenditures combine the total utilisation of health care with the cost of providing that health care (Goss, 2008). This approach links the demand for health care services to the growth in the economy and affordability, and importantly recognises the existence of scare resources, which are ignored in current approaches. This therefore relaxes the assumption used in needs-based approaches that all needs should be met (O'Brien-Pallas et al., 2001, Lomas et al., 1985). The advantage of this approach over just examining utilisation, is that government health expenditure captures population growth, changes in economic growth resulting in higher per capita incomes, relative price changes, and changes in the costs and volume of services. A weakness is that government health expenditure is also determined by supply-side factors, and some items of expenditure, such as Medicare and PBS are uncapped, with any budgetary control by government exercised through the regulation of
Alternative Approaches to Health Workforce Planning 29
Medicare and PBS subsidies. Nevertheless, the use of government expenditure as a measure of aggregate demand is frequently used by economists.
To translate a given level of health expenditure into the requirements for health professionals requires data on the number and earnings of health professionals, and information on the current proportions of each type of professional and how these proportions might change over time. The relative growth in earnings of different types of health professionals into the future is therefore an important determinant of aggregate demand. For a given level of expenditure, and increase in the cost of medical practitioners (e.g. through an increase in fees charged or changes in Medicare rebates) would mean that fewer other health care workers could be employed. The collection of data on earnings is therefore very important in the modelling of the demand for the health workforce.
This approach has a key advantage of being able to explicitly incorporate different types of health professionals, and so avoid the ‘silo’ based approach to health workforce planning.
4.4 Using survey or small area data to model and forecast health care utilisation
Using survey data to model utilisation has the advantage that it includes data not only on health care utilisation (e.g. number of visits), but also the characteristics of individuals who use health care services. This relaxes the assumption made in current approaches that the characteristics of individuals that influence demand, including education, income, and prevalence of disease are fixed into the future. Multiple regression models can then be used to predict changes in utilisation when the characteristics of individuals change (Goss, 2008, Morris et al., 2005, Pohlmeier and Ulrich, 1995, Sarma and Simpson, 2006, van Doorslaer et al., 2004, Wagstaff, 1986).
For example, the National Health Survey includes questions on hospital, GP, dentist, and allied care utilisation, and also on factors influencing demand, including age, gender, disease prevalence, income and education levels. The regression model can be used to predict for each year into the future based on ABS age and gender population estimates, future changes in the prevalence of disease and population health based on epidemiological data, and future changes in income and socio-economic status. Using the NHS has the potential advantages of incorporating the effects of changes in disease prevalence and socio-economic status (income), over and above age and gender, on future utilisation. Other surveys, such as the HILDA survey, also collect data on health care utilisation and individual and household characteristics (Wilkins. et al., 2010).
The use of longitudinal survey data, rather than cross-sectional data at a single point in time, also has the strong advantage that the effects of changes over time in key variables on utilisation can also be examined. HILDA is a longitudinal survey of households and individuals which plans to repeat its questions about health care utilisation over time, whilst the NHS is a cross-sectional survey that uses different individuals each year. Other longitudinal surveys also exist which include health care utilisation, but these are restricted to either older or younger parts of the population, and so are not complete in the coverage of the population (45 and Up Study Collaborators, 2008, Lee, 2001).
Modelling individual-level utilisation also allows the modelling of individuals’ behaviour regarding health care utilisation where the data allows (Deb and Trivedi, 1997, Deb and Trivedi, 2002, Pohlmeier and Ulrich, 1995). Given that utilisation is also a function of supply, data on supply side factors (e.g. number and access to health facilities) can also be included in these models where the data allow. This provides a way of predicting utilisation independent of supply, and so can potentially address an important limitation of
Alternative Approaches to Health Workforce Planning 30
the current utilisation approach. This requires the linkage of data on utilisation to data on the supply of health care services.
Other countries such as the UK have used data aggregated to small areas to model the determinants of health care utilisation and costs (Morris et al., 2005). This has also been undertaken in Australia to a limited extent (McRae, 2008, AMWAC, 2005), and is useful where individual-level data are not available or cannot be linked to data on supply.
Section 5 in this report presents a detailed example of how this approach can be used to inform health workforce planning.
At an individual or small area level, modelling of health care costs is also an approach that has been used in geographical resource allocation and risk-adjustment studies in other countries. The advantage over the modelling of utilisation is that an individuals’ total health care costs in a year is a way of combining all of the different types of utilisation (i.e. GP visits hospital visits etc), which is important if the objective is to model overall utilisation rather than focus on the utilisation of a specific type of health professional. However, this requires the national linkage of data on hospital separations, GPs and specialist visits, PBS, allied health etc. This type of data linkage is feasible but some way off.
4.5 Using survey or small area data to model and forecast health workforce supply
This approach relaxes the assumptions made in current approaches that factors influencing hours worked, productivity, and labour force participation of health professionals are fixed in the future. The demographic approach to modelling supply can be supplemented by explicitly modelling the determinants of hours worked, productivity, exit rates, and using these models to predict future supply. This introduces a behavioural element into the modelling that can also be used to simulate and evaluate the effects of policy changes on the parameters of the workforce planning model, and subsequently on the future projections of supply.
For example, the economic theory of labour supply suggests that the number hours worked depends on the wage rate, other job characteristics, family characteristics such as household income and number of children, in addition to age and gender. Empirical estimation of this model uses a regression-based approach that introduces uncertainty into the model, and allows for predictions of hours worked to be based not only on age and gender, but also on other job characteristics, wages and family circumstances. Labour supply models such as this have been estimated for doctors and nurses but none have yet been estimated for Australia (Antonazzo et al., 2003, Askildsen et al., 2003, Baltagi et al., 2005, Ikenwilo and Scott, 2007, Shields, 2004). The simulation of changes in job characteristics and wages as a result of policy changes can then be used to predict the effect of policy changes on hours worked, which could be fed back into the workforce planning model. This approach is also known as ‘behavioural microsimulation’, and is used extensively in other areas of economic forecasting and policy evaluation.
The determinants of exit rates, productivity and other labour market decisions (e.g. distribution and mobility across geographic areas) can be modelled in a similar way and predictions from these models used to determine the parameters of health workforce planning models, and the effects of policy changes on the parameters of health workforce planning models.
These models do require a range of additional data to be collected, over and above age, gender, and hours worked, to be able to model the effects of policy change. They require
Alternative Approaches to Health Workforce Planning 31
more detailed surveys of health workforces than are currently conducted alongside registration (e.g. MABEL and Nurses e-cohort).
4.6 The effect of health workforce policies on population health and health care costs
This type of research is rarely undertaken due to limited data availability, especially the linkage of data on the health workforce, to data on health status and costs. However, a number of examples of models that attempt to examine the effect of increasing the numbers of doctors on population health exist (Goodman, 2005, Goodman and Fisher, 2008, Goodman and Grumbach, 2008). For example, two studies have examined the effect of an increased number of General Practitioners on population health. Gravelle et al (2008) found that a higher number of GPs in the UK led to improvements in individuals’ self-reported health status and health-related quality of life (EQ5D) whilst explicitly controlling for the endogeneity of primary care physician supply (Gravelle et al., 2008). This is in contrast to a study using an arguably stronger study design. Aakvik and Holmås, using 16 years of data from Norway, use a dynamic panel data model that accounts for endogeneity and time persistence, and finds no statistically significant effect of the number of the GPs in an area on a range of mortality rates (Aakvik and Holmas, 2006).
In Australia, using longitudinal small area (e.g. SLA) data that includes data on the number of different health professionals from the census, could be linked to other SLA-level data on mortality rates, and area characteristics. This would expand the work of McRae to include a broader range of health professionals than only GPs (McRae, 2008).
Little is known about the costs of training a health professional. This information would be useful in deciding how many health professionals to train, and for comparison with the costs of other policies to increase supply. Combining this with the effects of different policies to increase supply on population health and access would provide useful information to policy makers on the most cost-effective health workforce policies. These issues are never mentioned in health workforce planning exercises.
4.7 Microsimulation Microsimulation is a broad technique that enables the modelling of ‘what if’ scenarios based on current data. In a similar vein to sensitivity analysis, it can be used to examine the effect of a key parameter that can be influenced by policy, on the outcomes of the model, such as health workforce requirements. This has been used extensively in other areas of policy evaluation and simulation, and also in health workforce planning (Song and Rathwell, 1994, Birch et al., 2007, O'Brien-Pallas et al., 2001, Schofield et al., 2008, Schofield et al., 2010). Current deterministic forecasting models, and stochastic markov and regression-based models, can all used to simulate the effect of a policy change. This does not however remove the need for assumptions to be made, nor should it substitute for rigorous prospective controlled evaluations where feasible. Often, such evaluations are essential to uncover the actual size of the effect of a policy, which can then be used in a microsimulation model.
4.8 Improvements in the quality and range of data collected A major change that would strengthen the evidence of health workforce planning would be investment in improving the quality and range of data (O'Brien-Pallas et al., 2001). The
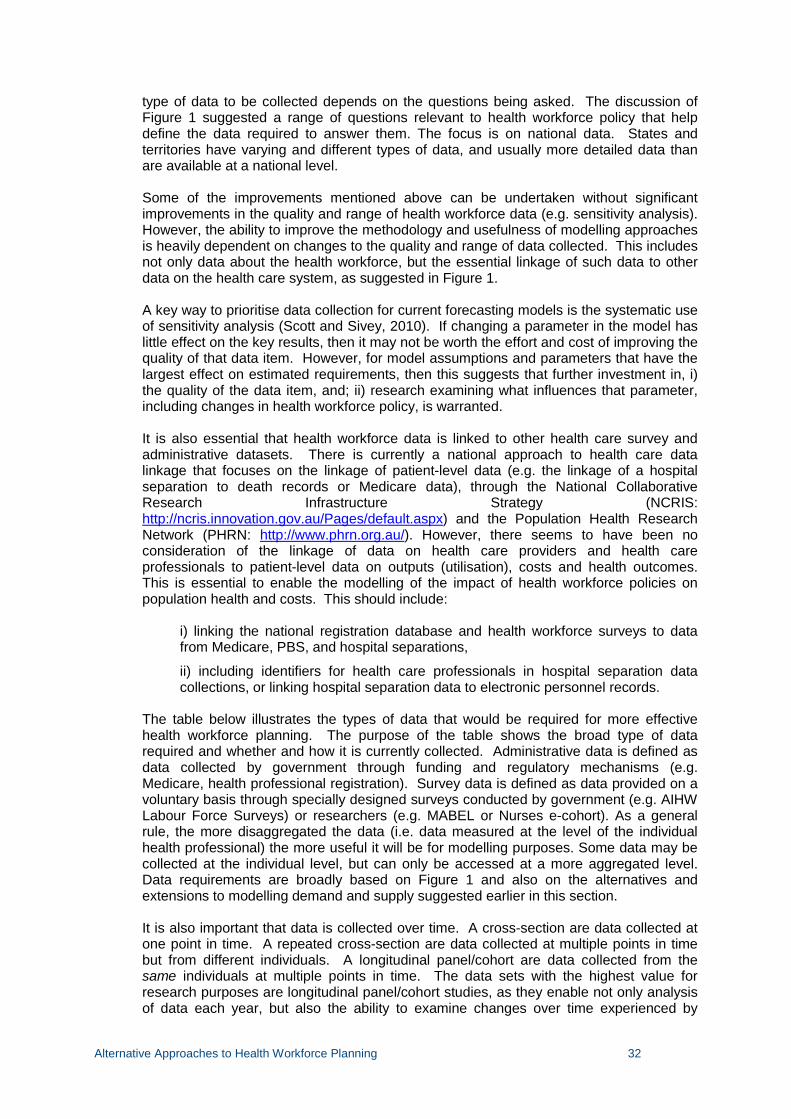
Alternative Approaches to Health Workforce Planning 32
type of data to be collected depends on the questions being asked. The discussion of Figure 1 suggested a range of questions relevant to health workforce policy that help define the data required to answer them. The focus is on national data. States and territories have varying and different types of data, and usually more detailed data than are available at a national level.
Some of the improvements mentioned above can be undertaken without significant improvements in the quality and range of health workforce data (e.g. sensitivity analysis). However, the ability to improve the methodology and usefulness of modelling approaches is heavily dependent on changes to the quality and range of data collected. This includes not only data about the health workforce, but the essential linkage of such data to other data on the health care system, as suggested in Figure 1.
A key way to prioritise data collection for current forecasting models is the systematic use of sensitivity analysis (Scott and Sivey, 2010). If changing a parameter in the model has little effect on the key results, then it may not be worth the effort and cost of improving the quality of that data item. However, for model assumptions and parameters that have the largest effect on estimated requirements, then this suggests that further investment in, i) the quality of the data item, and; ii) research examining what influences that parameter, including changes in health workforce policy, is warranted.
It is also essential that health workforce data is linked to other health care survey and administrative datasets. There is currently a national approach to health care data linkage that focuses on the linkage of patient-level data (e.g. the linkage of a hospital separation to death records or Medicare data), through the National Collaborative Research Infrastructure Strategy (NCRIS: http://ncris.innovation.gov.au/Pages/default.aspx) and the Population Health Research Network (PHRN: http://www.phrn.org.au/). However, there seems to have been no consideration of the linkage of data on health care providers and health care professionals to patient-level data on outputs (utilisation), costs and health outcomes. This is essential to enable the modelling of the impact of health workforce policies on population health and costs. This should include:
i) linking the national registration database and health workforce surveys to data from Medicare, PBS, and hospital separations,
ii) including identifiers for health care professionals in hospital separation data collections, or linking hospital separation data to electronic personnel records.
The table below illustrates the types of data that would be required for more effective health workforce planning. The purpose of the table shows the broad type of data required and whether and how it is currently collected. Administrative data is defined as data collected by government through funding and regulatory mechanisms (e.g. Medicare, health professional registration). Survey data is defined as data provided on a voluntary basis through specially designed surveys conducted by government (e.g. AIHW Labour Force Surveys) or researchers (e.g. MABEL or Nurses e-cohort). As a general rule, the more disaggregated the data (i.e. data measured at the level of the individual health professional) the more useful it will be for modelling purposes. Some data may be collected at the individual level, but can only be accessed at a more aggregated level. Data requirements are broadly based on Figure 1 and also on the alternatives and extensions to modelling demand and supply suggested earlier in this section.
It is also important that data is collected over time. A cross-section are data collected at one point in time. A repeated cross-section are data collected at multiple points in time but from different individuals. A longitudinal panel/cohort are data collected from the same individuals at multiple points in time. The data sets with the highest value for research purposes are longitudinal panel/cohort studies, as they enable not only analysis of data each year, but also the ability to examine changes over time experienced by
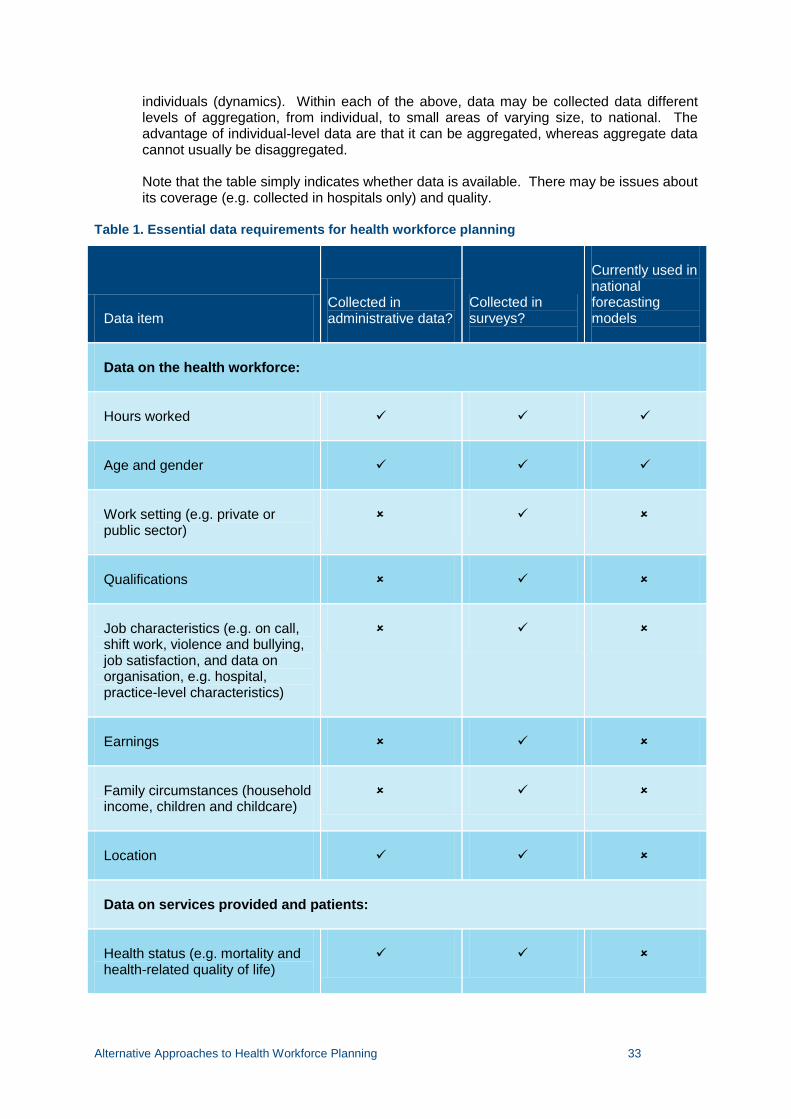
Alternative Approaches to Health Workforce Planning 33
individuals (dynamics). Within each of the above, data may be collected data different levels of aggregation, from individual, to small areas of varying size, to national. The advantage of individual-level data are that it can be aggregated, whereas aggregate data cannot usually be disaggregated.
Note that the table simply indicates whether data is available. There may be issues about its coverage (e.g. collected in hospitals only) and quality.
Table 1. Essential data requirements for health workforce planning
Data item Collected in administrative data?
Collected in surveys?
Currently used in national forecasting models
Data on the health workforce:
Hours worked
Age and gender
Work setting (e.g. private or public sector)
Qualifications
Job characteristics (e.g. on call, shift work, violence and bullying, job satisfaction, and data on organisation, e.g. hospital, practice-level characteristics)
Earnings
Family circumstances (household income, children and childcare)
Location
Data on services provided and patients:
Health status (e.g. mortality and health-related quality of life)
Alternative Approaches to Health Workforce Planning 34
Data item Collected in administrative data?
Collected in surveys?
Currently used in national forecasting models
Output: number of services provided
Costs of services provided
Age and gender of patients/population
Types of diseases/conditions treated
Socio-economic status of patients/population (education, income)
Prices charged
Alternative Approaches to Health Workforce Planning 35
5 An example of modelling utilisation using the National Health Survey
The aim of this section is to present an approach to modelling health care utilisation using survey data, and to use this to predict and forecast changes in demand in the future. The microsimulation approach uses a regression-based method using individual-level data on health care utilisation from the National Health Survey. This approach was chosen because of its ability to predict changes in utilisation due to changes in disease prevalence, education, income and age structure, over and above population growth, which are all assumed to remain the same in the forecasts of current deterministic models such as the HWPT.
5.1 Data and methods
Our main data source for the utilization models is the Australian Bureau of Statistics National Health Survey 2004-05 (Australian Bureau of Statistics, 2006a).1 The main advantages of this dataset are that is a large, representative sample of Australians and asks detailed questions about respondents’ health care utilisation, health status, and socio-economic characteristics. A disadvantage is that the data is a cross-section, not a longitudinal panel, and so we can only observe associations across the population rather than effects of variables changing over time. The NHS measures a number of different types of health care utilisation. For illustrative purposes, we use (1) whether an individual visited a General Practitioner, and how many visits they made and (2) whether an individual was admitted to a hospital and for how many nights they stayed. The GP visits measure is specific to the labour demand for GPs whereas the hospital admission measure is a broader indicator of health care demand for hospital and specialist services. Our main dependent variable for measuring GP utilization is “DOCQ2CB” which measures the answer to the following two questions:
“[Apart from [previously reported actions] during any hospital or day clinic visits,] In the last 2 weeks, have you consulted a general practitioner for your own health? 1 Yes 5 No (go to DOC_Q03) How many times in the last 2 weeks, did you consult a general practitioner?” Our dependent variable for measuring length of hospital admission is “HDCNGHCB” which measures the answer to the following two questions: “I would now like to ask you about all the times you have been admitted to hospital in the last 12 months. I would now like to talk about your admission/most recent admission to hospital. (On the most recent visit,) Was this an overnight stay? 1 Yes 5 No (go to HOSP_Q05)
1 Data from the most recent 2005/6 NHS was not currently available from the ABS.
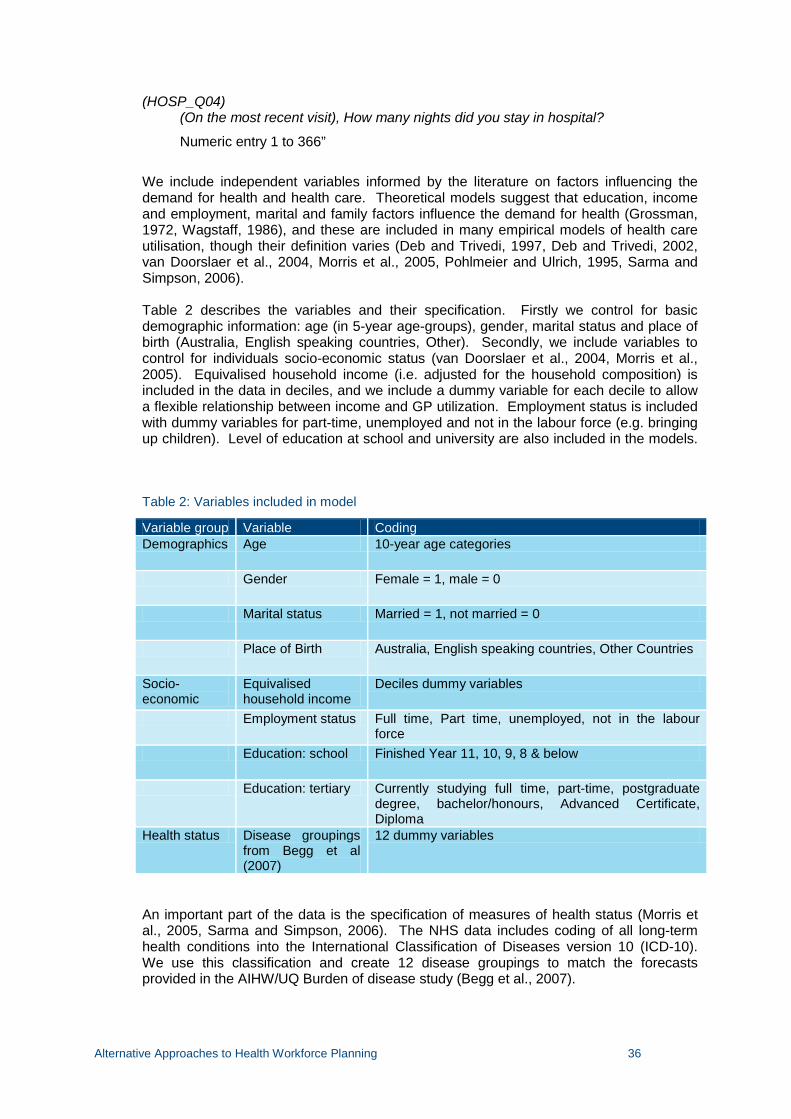
Alternative Approaches to Health Workforce Planning 36
(HOSP_Q04) (On the most recent visit), How many nights did you stay in hospital?
Numeric entry 1 to 366”
We include independent variables informed by the literature on factors influencing the demand for health and health care. Theoretical models suggest that education, income and employment, marital and family factors influence the demand for health (Grossman, 1972, Wagstaff, 1986), and these are included in many empirical models of health care utilisation, though their definition varies (Deb and Trivedi, 1997, Deb and Trivedi, 2002, van Doorslaer et al., 2004, Morris et al., 2005, Pohlmeier and Ulrich, 1995, Sarma and Simpson, 2006). Table 2 describes the variables and their specification. Firstly we control for basic demographic information: age (in 5-year age-groups), gender, marital status and place of birth (Australia, English speaking countries, Other). Secondly, we include variables to control for individuals socio-economic status (van Doorslaer et al., 2004, Morris et al., 2005). Equivalised household income (i.e. adjusted for the household composition) is included in the data in deciles, and we include a dummy variable for each decile to allow a flexible relationship between income and GP utilization. Employment status is included with dummy variables for part-time, unemployed and not in the labour force (e.g. bringing up children). Level of education at school and university are also included in the models.
Table 2: Variables included in model
Variable group Variable Coding Demographics Age 10-year age categories
Gender Female = 1, male = 0
Marital status Married = 1, not married = 0
Place of Birth Australia, English speaking countries, Other Countries
Socio-economic
Equivalised household income
Deciles dummy variables
Employment status Full time, Part time, unemployed, not in the labour force
Education: school Finished Year 11, 10, 9, 8 & below
Education: tertiary Currently studying full time, part-time, postgraduate degree, bachelor/honours, Advanced Certificate, Diploma
Health status Disease groupings from Begg et al (2007)
12 dummy variables
An important part of the data is the specification of measures of health status (Morris et al., 2005, Sarma and Simpson, 2006). The NHS data includes coding of all long-term health conditions into the International Classification of Diseases version 10 (ICD-10). We use this classification and create 12 disease groupings to match the forecasts provided in the AIHW/UQ Burden of disease study (Begg et al., 2007).
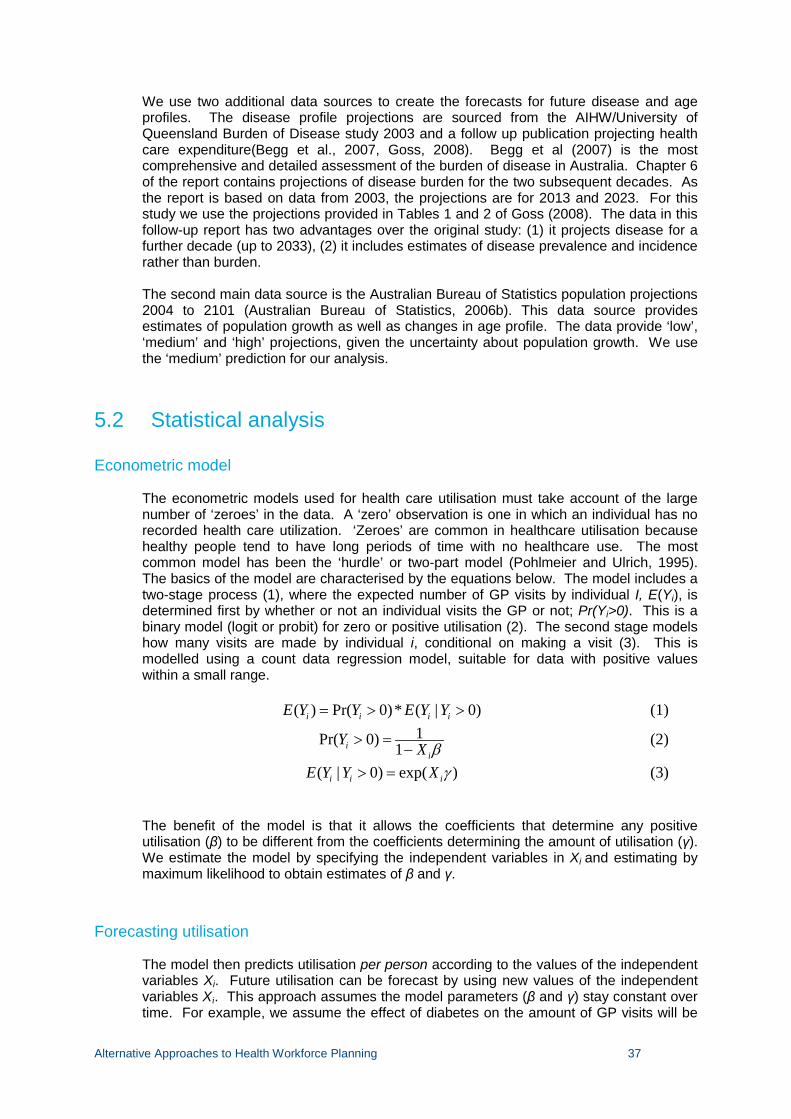
Alternative Approaches to Health Workforce Planning 37
We use two additional data sources to create the forecasts for future disease and age profiles. The disease profile projections are sourced from the AIHW/University of Queensland Burden of Disease study 2003 and a follow up publication projecting health care expenditure(Begg et al., 2007, Goss, 2008). Begg et al (2007) is the most comprehensive and detailed assessment of the burden of disease in Australia. Chapter 6 of the report contains projections of disease burden for the two subsequent decades. As the report is based on data from 2003, the projections are for 2013 and 2023. For this study we use the projections provided in Tables 1 and 2 of Goss (2008). The data in this follow-up report has two advantages over the original study: (1) it projects disease for a further decade (up to 2033), (2) it includes estimates of disease prevalence and incidence rather than burden.
The second main data source is the Australian Bureau of Statistics population projections 2004 to 2101 (Australian Bureau of Statistics, 2006b). This data source provides estimates of population growth as well as changes in age profile. The data provide ‘low’, ‘medium’ and ‘high’ projections, given the uncertainty about population growth. We use the ‘medium’ prediction for our analysis.
5.2 Statistical analysis
Econometric model
The econometric models used for health care utilisation must take account of the large number of ‘zeroes’ in the data. A ‘zero’ observation is one in which an individual has no recorded health care utilization. ‘Zeroes’ are common in healthcare utilisation because healthy people tend to have long periods of time with no healthcare use. The most common model has been the ‘hurdle’ or two-part model (Pohlmeier and Ulrich, 1995). The basics of the model are characterised by the equations below. The model includes a two-stage process (1), where the expected number of GP visits by individual I, E(Yi), is determined first by whether or not an individual visits the GP or not; Pr(Yi>0). This is a binary model (logit or probit) for zero or positive utilisation (2). The second stage models how many visits are made by individual i, conditional on making a visit (3). This is modelled using a count data regression model, suitable for data with positive values within a small range.
( ) Pr( 0)* ( | 0)i i i iE Y Y E Y Y= > > (1)
1Pr( 0) 1ii
Y X β> =−
(2)
( | 0) exp( )i i iE Y Y X γ> = (3)
The benefit of the model is that it allows the coefficients that determine any positive utilisation (β) to be different from the coefficients determining the amount of utilisation (γ). We estimate the model by specifying the independent variables in Xi and estimating by maximum likelihood to obtain estimates of β and γ.
Forecasting utilisation
The model then predicts utilisation per person according to the values of the independent variables Xi. Future utilisation can be forecast by using new values of the independent variables Xi. This approach assumes the model parameters (β and γ) stay constant over time. For example, we assume the effect of diabetes on the amount of GP visits will be
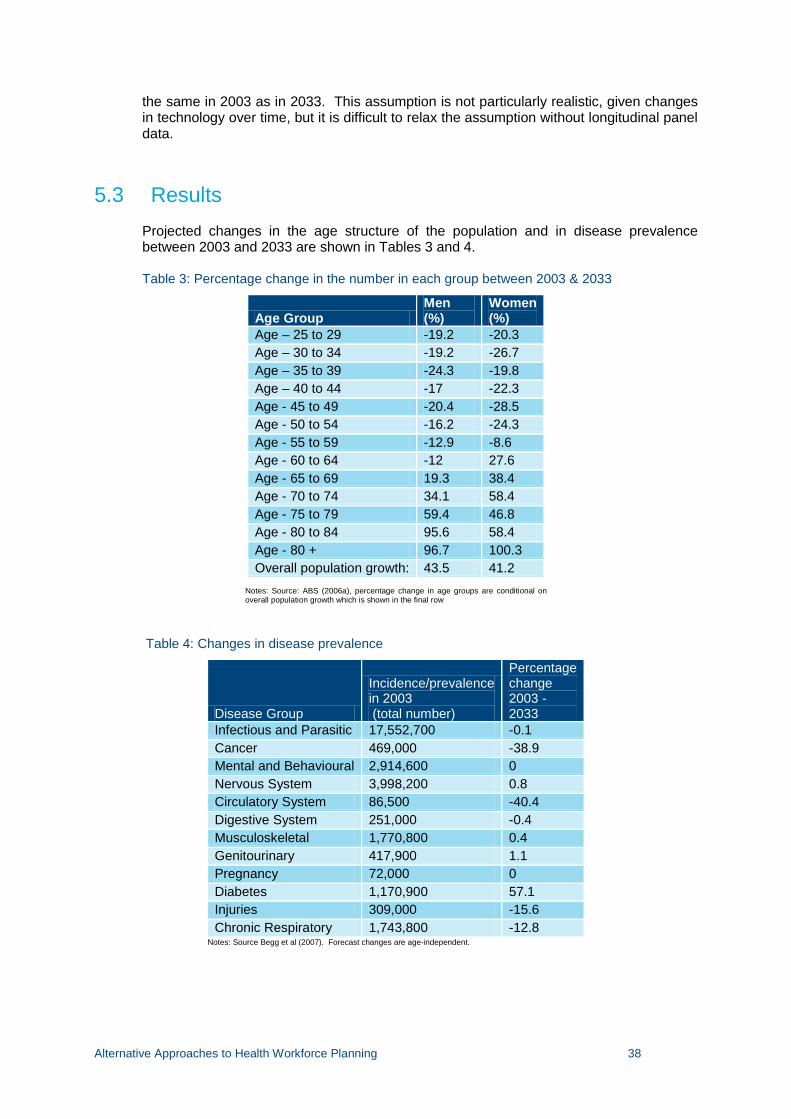
Alternative Approaches to Health Workforce Planning 38
the same in 2003 as in 2033. This assumption is not particularly realistic, given changes in technology over time, but it is difficult to relax the assumption without longitudinal panel data.
5.3 Results Projected changes in the age structure of the population and in disease prevalence between 2003 and 2033 are shown in Tables 3 and 4.
Table 3: Percentage change in the number in each group between 2003 & 2033
Age Group Men (%)
Women (%)
Age – 25 to 29 -19.2 -20.3 Age – 30 to 34 -19.2 -26.7 Age – 35 to 39 -24.3 -19.8 Age – 40 to 44 -17 -22.3 Age - 45 to 49 -20.4 -28.5 Age - 50 to 54 -16.2 -24.3 Age - 55 to 59 -12.9 -8.6 Age - 60 to 64 -12 27.6 Age - 65 to 69 19.3 38.4 Age - 70 to 74 34.1 58.4 Age - 75 to 79 59.4 46.8 Age - 80 to 84 95.6 58.4 Age - 80 + 96.7 100.3 Overall population growth: 43.5 41.2
Notes: Source: ABS (2006a), percentage change in age groups are conditional on overall population growth which is shown in the final row
Table 4: Changes in disease prevalence
Disease Group
Incidence/prevalence in 2003 (total number)
Percentage change 2003 - 2033
Infectious and Parasitic 17,552,700 -0.1 Cancer 469,000 -38.9 Mental and Behavioural 2,914,600 0 Nervous System 3,998,200 0.8 Circulatory System 86,500 -40.4 Digestive System 251,000 -0.4 Musculoskeletal 1,770,800 0.4 Genitourinary 417,900 1.1 Pregnancy 72,000 0 Diabetes 1,170,900 57.1 Injuries 309,000 -15.6 Chronic Respiratory 1,743,800 -12.8
Notes: Source Begg et al (2007). Forecast changes are age-independent.
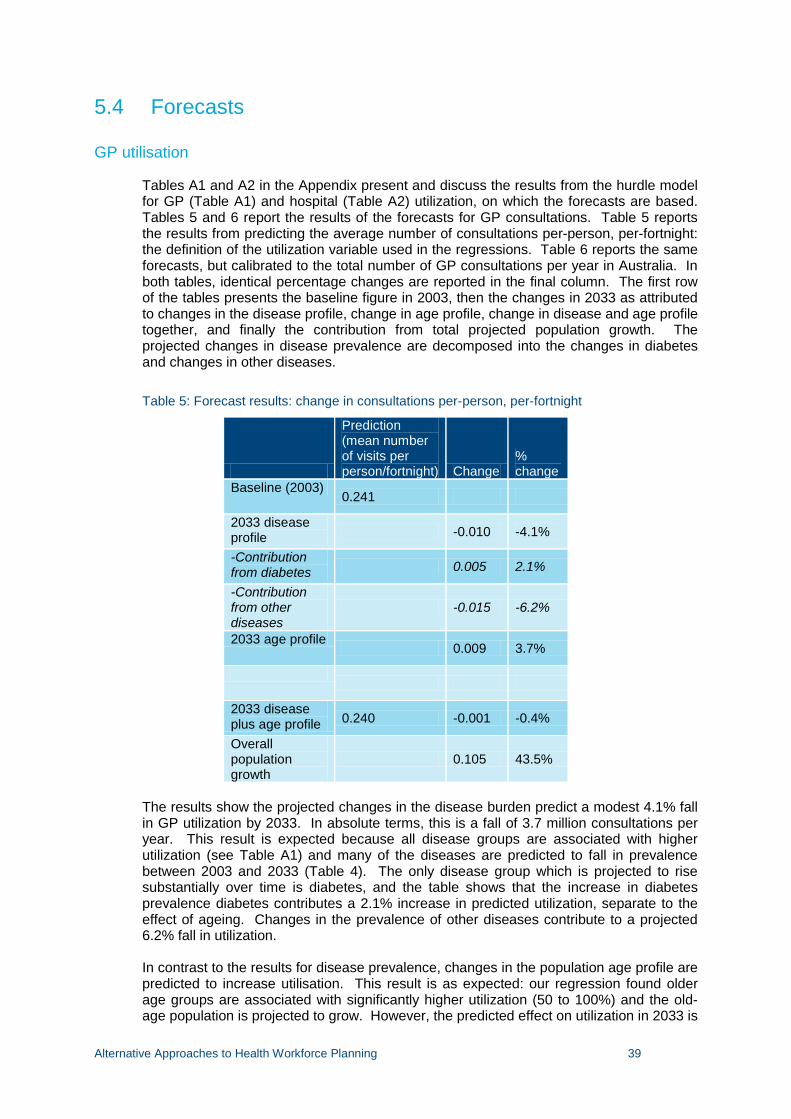
Alternative Approaches to Health Workforce Planning 39
5.4 Forecasts
GP utilisation
Tables A1 and A2 in the Appendix present and discuss the results from the hurdle model for GP (Table A1) and hospital (Table A2) utilization, on which the forecasts are based. Tables 5 and 6 report the results of the forecasts for GP consultations. Table 5 reports the results from predicting the average number of consultations per-person, per-fortnight: the definition of the utilization variable used in the regressions. Table 6 reports the same forecasts, but calibrated to the total number of GP consultations per year in Australia. In both tables, identical percentage changes are reported in the final column. The first row of the tables presents the baseline figure in 2003, then the changes in 2033 as attributed to changes in the disease profile, change in age profile, change in disease and age profile together, and finally the contribution from total projected population growth. The projected changes in disease prevalence are decomposed into the changes in diabetes and changes in other diseases.
Table 5: Forecast results: change in consultations per-person, per-fortnight
Prediction (mean number of visits per person/fortnight) Change
% change
Baseline (2003) 0.241
2033 disease profile -0.010 -4.1%
-Contribution from diabetes 0.005 2.1%
-Contribution from other diseases
-0.015 -6.2%
2033 age profile 0.009 3.7%
2033 disease plus age profile 0.240 -0.001 -0.4%
Overall population growth
0.105 43.5%
The results show the projected changes in the disease burden predict a modest 4.1% fall in GP utilization by 2033. In absolute terms, this is a fall of 3.7 million consultations per year. This result is expected because all disease groups are associated with higher utilization (see Table A1) and many of the diseases are predicted to fall in prevalence between 2003 and 2033 (Table 4). The only disease group which is projected to rise substantially over time is diabetes, and the table shows that the increase in diabetes prevalence diabetes contributes a 2.1% increase in predicted utilization, separate to the effect of ageing. Changes in the prevalence of other diseases contribute to a projected 6.2% fall in utilization. In contrast to the results for disease prevalence, changes in the population age profile are predicted to increase utilisation. This result is as expected: our regression found older age groups are associated with significantly higher utilization (50 to 100%) and the old-age population is projected to grow. However, the predicted effect on utilization in 2033 is
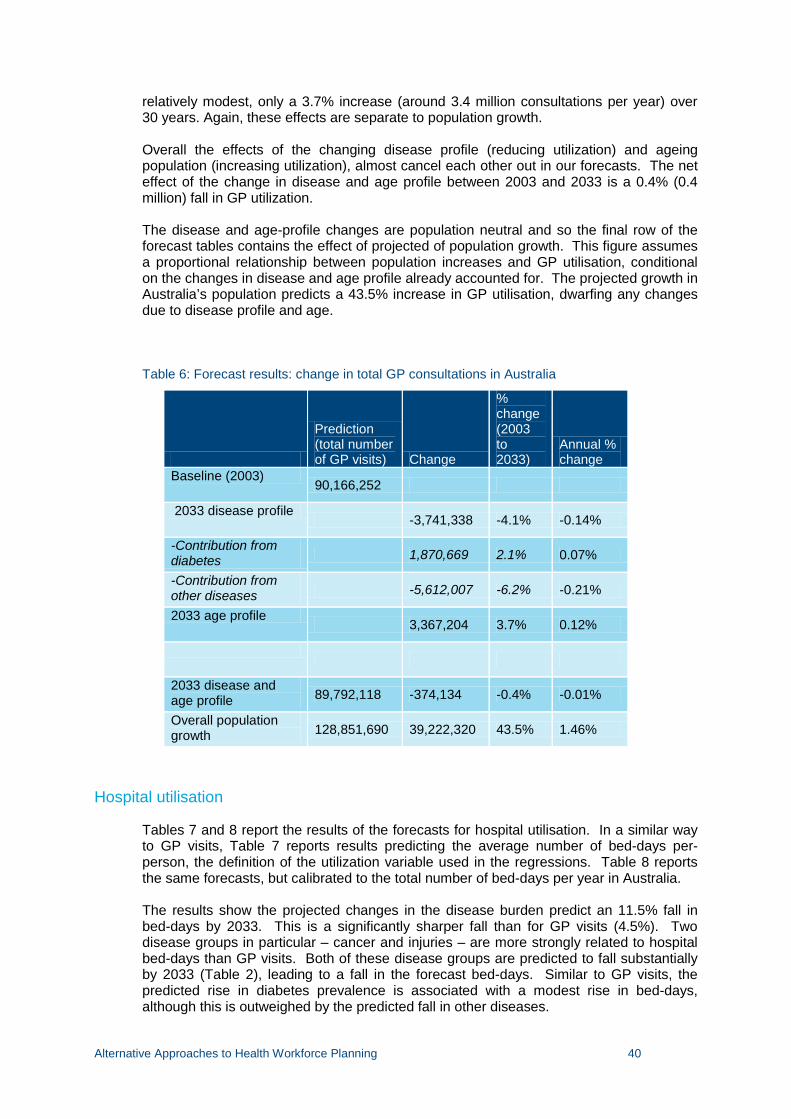
Alternative Approaches to Health Workforce Planning 40
relatively modest, only a 3.7% increase (around 3.4 million consultations per year) over 30 years. Again, these effects are separate to population growth. Overall the effects of the changing disease profile (reducing utilization) and ageing population (increasing utilization), almost cancel each other out in our forecasts. The net effect of the change in disease and age profile between 2003 and 2033 is a 0.4% (0.4 million) fall in GP utilization. The disease and age-profile changes are population neutral and so the final row of the forecast tables contains the effect of projected of population growth. This figure assumes a proportional relationship between population increases and GP utilisation, conditional on the changes in disease and age profile already accounted for. The projected growth in Australia’s population predicts a 43.5% increase in GP utilisation, dwarfing any changes due to disease profile and age.
Table 6: Forecast results: change in total GP consultations in Australia
Prediction (total number of GP visits) Change
% change (2003 to 2033)
Annual % change
Baseline (2003) 90,166,252
2033 disease profile -3,741,338 -4.1% -0.14%
-Contribution from diabetes 1,870,669 2.1% 0.07%
-Contribution from other diseases -5,612,007 -6.2% -0.21%
2033 age profile 3,367,204 3.7% 0.12%
2033 disease and age profile 89,792,118 -374,134 -0.4% -0.01%
Overall population growth 128,851,690 39,222,320 43.5% 1.46%
Hospital utilisation
Tables 7 and 8 report the results of the forecasts for hospital utilisation. In a similar way to GP visits, Table 7 reports results predicting the average number of bed-days per-person, the definition of the utilization variable used in the regressions. Table 8 reports the same forecasts, but calibrated to the total number of bed-days per year in Australia. The results show the projected changes in the disease burden predict an 11.5% fall in bed-days by 2033. This is a significantly sharper fall than for GP visits (4.5%). Two disease groups in particular – cancer and injuries – are more strongly related to hospital bed-days than GP visits. Both of these disease groups are predicted to fall substantially by 2033 (Table 2), leading to a fall in the forecast bed-days. Similar to GP visits, the predicted rise in diabetes prevalence is associated with a modest rise in bed-days, although this is outweighed by the predicted fall in other diseases.

Alternative Approaches to Health Workforce Planning 41
As for the GP visits forecast, changes in the population age profile are predicted to increase hospital bed-days, however the effect is only 2.8% smaller than for GP visits (3.7%). This is explained by the smaller association between older age groups and hospital bed-days than between older age groups and GP visits.
Table 7: Forecast results: change in hospital nights per-person, per-year
Prediction (mean number of hospital nights per person) Change
% change
Baseline (2003) 0.436
2033 disease profile -0.050 -11.5%
-Contribution from diabetes 0.012 2.8%
-Contribution from other diseases -0.062 -14.2%
2033 age profile 0.012 2.8%
2033 disease and age profile 0.398 -0.038 -8.7%
Overall population growth 0.190 43.5%
Table 8: Forecast results: change in total bed days in Australia
Prediction (total number of hospital bed-days) Change
% change (2003-2033)
Annual % change
Baseline (2003) 23,583,213
2033 disease profile -2,704,497 -11.5% -0.38%
-Contribution from diabetes 649,079 2.8% 0.09%
-Contribution from other diseases -3,353,576 -14.2% -0.47%
2033 age profile 649,079 2.8% 0.09%
2033 disease and age profile 21,527,795 -2,055,418 -8.7% -0.29%
Overall population growth 30,892,386 10,258,698 43.5% 1.46%
Alternative Approaches to Health Workforce Planning 42
In contrast to the results for GP visits, overall the effects of the changing disease profile (reducing utilisation) and ageing population (increasing utilisation), do not cancel each other out. The fall in utilization predicted by the disease profile is substantially bigger than the rise predicted by population ageing. The net effect of the change in disease and age profile between 2003 and 2033 is an 8.7% (2.1 million) fall in hospital utilisation.
5.5 Discussion The analysis of the National Health Survey predicts that population growth is by far the most important factor influencing the future utilisation of GP and hospital services. Though the ageing of the population will have a small positive effect on GP visits, this is more than offset by the effect of changes in the prevalence of disease, such that the net effect of population ageing and disease prevalence is to reduce GP utilisation slightly. The prevalence of many disease groups (e.g. cardiovascular disease, cancer) is predicted to fall, whilst the prevalence of diabetes particularly is predicted to rise substantially.
For hospital bed-days, the effect of population growth is also the overwhelming influence on utilisation. However, the effect of population growth is tempered (reduced by approximately 20%) by a predicted fall in utilisation from the predicted changes in disease and age profile. This is particularly due to the projected fall in key disease groups such as cancer and injuries which have a strong association with hospital bed-days.
This approach improves over current methods of forecasting utilisation in health workforce planning models as it can separate out the effects of population ageing, changes in disease prevalence, population growth, and other factors. It also uses a stochastic regression modelling approach that includes uncertainty. The model could also be extended to include the impact of lifestyle factors, such as smoking status, on health care utilisation (Sarma and Simpson 2006, Balia and Jones 2009).
There, however, a number of drawbacks with this approach. Further work is required to fully test the sensitivity of these estimates. This includes testing the stability of the regression coefficients over time by using different versions of the NHS, and in using different specifications of the regression model. The approach also relies on the accuracy of population projections and predictions of disease prevalence. The predictions of changes in the prevalence of disease are only available for Australia in 2013 and 2033, and so growth in utilisation must be assumed to be linear. The NHS data also do not contain any data on the supply of health services, so it is not possible to account for the influence of supply on utilisation.
Another important assumption in our forecasts is that ‘current’ coefficients, e.g. the current relationship between disease prevalence and utilisation, can predict future health care utilisation. In other words, we must assume the relationship between diseases such as diabetes and health care utilisation will be the same in 2033 as in 2003. This does not allow for increases in the intensity of treatment or the introduction of new treatment technologies which may increase the effectiveness of treatment or reduce the number of visits required to treat the disease. Projections of future health care expenditure (e.g. Goss 2008) cite intensity of treatment and new technologies as a source of growth for future health care expenditure. For this reason we must interpret the results of our utilisation forecasts as a lower-bound, or as an illustration of an incomplete approach.

Alternative Approaches to Health Workforce Planning 43
A major issue is the lack of a national longitudinal panel dataset on health care utilisation in Australia. The NHS is a cross section, and so can only be used to examine associations between ageing, disease prevalence, and income on utilisation, and not causal effects or effect of changes in these factors on utilisation. This influences the validity of being able to make forecasts using potentially biased regression coefficients. For example, although there is little of income in the cross-section, this does not necessarily mean that changes in income over time is not associated with utilisation. .The HILDA longitudinal panel survey is the only example of such a dataset that plans to collect utilisation regularly and which covers a large age range.
Alternative Approaches to Health Workforce Planning 44
6 Conclusions
Current approaches to health workforce planning in Australia are limited due to lack of data. There are a range of methodologies that can be applied. These are more sophisticated than current methods but rely on more extensive and better quality data. Without significant investments in data collection, the situation is unlikely to change.
In terms of workforce planning effort, resources should be refocused away from estimating the size of problem towards the simulation and evaluation of cost-effective policies to reduce health workforce shortages.
Some gains can be made in estimating the size of the problem through extensive sensitivity analysis of forecasts that can also be used to prioritise future data collection. More robust modelling of demand, such as the approach suggested in Section 5, can also be further developed.
In addition, understanding the key drivers of changes in demand and supply of the health workforce can only be achieved through more detailed modelling of the behaviour of the health workforce and the behaviour of the population in seeking health care. This requires detailed longitudinal panel survey data that collects information on the range of likely factors influence labour supply decisions and decisions to use health services.
Alternative Approaches to Health Workforce Planning 45
7 References 45 AND UP STUDY COLLABORATORS 2008. Cohort Profile: The 45 and Up Study. International
Journal of Epidemiology 37 941-947.
AAKVIK, A. & HOLMAS, T. H. 2006. Access to primary health care and health outcomes: the relationships between GP characteristics and mortality rates. J Health Econ, 25, 1139-53.
ADAMS, O. 1992. Management of human resources in health care: the Canadian experience. Health Econ, 1, 131 - 143.
AMWAC 2000. Medical workforce planning in Australia. Aust Health Rev, 23, 8 - 26.
AMWAC 2005. The General Practice Workforce in Australia. Supply and Requirements Until 2013. In: COMMITTEE, A. M. W. A. (ed.). Sydney: AMWAC.
ANTONAZZO, E., SCOTT, A., SKATUN, D. & ELLIOTT, R. F. 2003. The labour market for nursing: a review of the labour supply literature. Health Economics, 12, 465-478.
ASKILDSEN, J. E., BALTAGI, B. H. & HOLMÅS, T. H. 2003. Wage policy in the health care sector: a panel data analysis of nurses' labour supply. Health Economics, 12, 705-719.
AUSTRALIAN BUREAU OF STATISTICS 2006a. National Health Survey - Confidentialised Unit Record Files. Canberra: Australian Bureau of Statistics.
AUSTRALIAN BUREAU OF STATISTICS 2006b. Population Projections 2004-2101. Canberra: Australian Bureau of Statistics.
AUSTRALIAN HEALTH WORKFORCE ADVISORY COMMITTEE 2005a. Demand For Health Services and the Health Workforce. Sydney.
AUSTRALIAN HEALTH WORKFORCE ADVISORY COMMITTEE 2005b. A Models of Care Approach to Workforce Planning. Sydney.
AUSTRALIAN HEALTH WORKFORCE ADVISORY COMMITTEE 2005c. Technology and Health Workforce Planning. Sydney.
BALTAGI, B., BRATBERG, E. & HOLMAS, T. 2005. A panel data study of physicians' labour supply: the case of Norway. Health Economics, 14, 1035-1045.
BEGG, S., VOS, T., BARKER, B., STEVENSON, C., STANLEY, L. & LOPEZ, A. 2007. Burden of disease and injury in Australia, 2003.
BIRCH, S., KEPHART, G., TOMBLIN-MURPHY, G., O'BRIEN-PALLAS, L., ALDER, R. & MACKENZIE, A. 2007. Human Resources Planning and the Production of Health: A Needs-Based Analytical Framework. Canadian Public Policy, 33, S1-S16.
BIRCH, S., O'BRIEN-PALLAS, L., ALKSNIS, C., MURPHY, G. T. & THOMSON, D. 2003. Beyond Demographic Change in Human Resources Planning: An Extended Framework and Application to Nursing. Sydney: Centre for Health Economics Research and Evaluation.
BLOOR, K. & MAYNARD, A. 2003. Planning human resources in health care: towards an economic approach. An international comparative
review. Ottawa: Canadian Health Services Research Foundation.
Alternative Approaches to Health Workforce Planning 46
COOPER, R. A. 2004. Weighing the Evidence for Expanding Physician Supply. Annals of Internal Medicine, 141, 705-714.
DEB, P. & TRIVEDI, P. K. 1997. Demand for medical care by the elderly: a finite mixture approach. Journal of Applied Econometrics, 12, 313-336.
DEB, P. & TRIVEDI, P. K. 2002. The structure of demand for health care: latent class versus two-part models. Journal of Health Economics, 21, 601-626.
DENTON, F., GAFNI, A. & SPENCER, B. 1994. System for Health Area Resource Planning (SHARP): an application to Ontario medical school enrolment. Canadian Medical Association Journal, 151, 39-45.
DREESCH, N., DOLEA, C., DAL POZ, M. R., GOUBAREV, A., ADAMS, O., AREGAWI, M., BERGSTROM, K., FOGSTAD, H., SHERATT, D., LINKINS, J., SCHERPBIER, R. & YOUSSEF-FOX, M. 2005. An approach to estimating human resource requirements to achieve the Millennium Development Goals. Health Policy Plan., 20, 267-276.
DUSSAULT, G., BUCHAN, J., SERMEUS, W. & PADAIGA, Z. 2010. Assessing future health workforce needs. Geneva: European Obserrvatory on Health Systems and Policies, World Health Organisation.
ELLIOTT, B. 2003. Labour markets in the NHS: an agenda for research. Health Economics, 12, 797-801.
GAVEL, P. 2004. Medical workforce planning in Australia: process, methodology and technical issues. Cah Sociol Demogr Med, 44, 7 - 42.
GOODMAN, D. 2005. The Physician Workforce Crisis. Where is the evidence? Health Affairs, Web Exclusive, W5-W108.
GOODMAN, D., FISHER, E., BUBOLZ, T., MOHR, J., POAGE, J. & WENNBERG, J. 1996. Benchmarking the US physician workforce. An alternative to needs-based or demand-based planning. JAMA, 276, 1811 - 1817.
GOODMAN, D. & GRUMBACH, K. 2008. Does having more physicians lead to better health system performance? JAMA, 299, 335.
GOODMAN, D. C. & FISHER, E. S. 2008. Physician workforce crisis? Wrong diagnosis, wrong prescription. New England Journal of Medicine, 358, 1658.
GOSS, J. R. 2008. Projection of Australian health care expenditure by disease, 2003 to 2033, Australian Institute of Health and Welfare.
GRAVELLE, H., MORRIS, S. & SUTTON, M. 2008. Are family physicians good for you? Endogenous doctor supply and individual health. Health Serv Res, 43, 1128-44.
GREENBERG, L. & CULTICE, J. M. 1997. Forecasting the need for physicians in the United States: the Health Resources and Services Administration's physician requirements model. Health Services Research, 31, 723.
GROSSMAN, M. 1972. On the concept of health capital and the demand for health. The Journal of Political Economy, 80, 223-255.
HORROCKS, S., ANDERSON, E. & SALISBURY, C. 2002. Systematic review of whether nurse practitioners working in primary care can provide equivalent care to doctors. BMJ, 324, 819-823.
Alternative Approaches to Health Workforce Planning 47
HOUSE OF COMMONS SELECT COMMITTEE 2007. Workforce Planning. Fourth report of Session 2006-7. London: The Stationery Office.
IKENWILO, D. & SCOTT, A. 2007. The effects of pay and job satisfaction on the labour supply of hospital consultants. Health Economics, 16, 1303-1318.
JEFFERS, J. R., BOGNANNO, M. F. & BARTLETT, J. C. 1971. On the demand versus need for medical services and the concept of "shortage". American Journal of Public Health, 61, 46-63.
JOYCE CM & MCNEIL JJ 2006. Participation in the workforce by Australian medical graduates. Medical Education, 40, 333-339.
JOYCE, C. M., MCNEIL, J. J. & STOELWINDER, J. U. 2004. Time for a new approach to medical workforce planning. Medical Journal of Australia, 180, 343-346.
KERNICK, D. & SCOTT, A. 2002. Economic approaches to doctor/nurse skill mix: problems, pitfalls, and partial solutions. British Journal of General Practice, 52, 42-46.
LAURANT, M., REEVES, D., HERMENS, R., BRASPENNING, J., GROL, R. & SIBBALD, B. 2004. Substitution of doctors by nurses in primary care, Chichester, UK, John Wiley & Sons, Ltd.
LAVIS, J. & BIRCH, S. 1997. The answer is ......., now what was the question? Applying alternative approaches to estimating nurse requirements. Can J Nurs Adm, 10, 24 - 44.
LEE, C. (ed.) 2001. Women's Health Australia: What do we know? What do we need to know? Progress on the Australian Longitudinal Study of Women's Health 1995-2000., Canberra: Australian Academic Press.
LIPSCOMB, J., KILPATRICK, K., LEE, K. & PIEPER, K. 1995. Determining VA physician requirements through empirically based models. Health Serv Res, 29, 697 - 717.
LOMAS, J. & STODDART, G. 1985. Estimates of the potential impact of nurse practitioners on future requirements for physicians in office-based general practice. Can J Public Health, 76, 119 - 123.
LOMAS, J., STODDART, G. L. & BARER, M. L. 1985. Supply projections as planning: A critical review of forecasting net physician requirements in Canada. Social Science & Medicine, 20, 411-424.
MASNICK, K. & MCDONNELL, G. 2010. A model linking clinical workforce skill mix planning to health and health care dynamics. Human Resources for Health, 8, 11.
MAYNARD, A. 2006. Medical Workforce Planning: Some Forecasting Challenges. Australian Economic Review, 39, 323-329.
MAYNARD, A. & WALKER, A. 1997. The physician workforce in the United Kingdom. Issues, prospects and policies.: The Nuffield Trust: London.
MCRAE, I. 2008. Doctors at work. Determinasnts of supply and demand in the Australian GP market. PhD, Australian Natioinal University.
MORRIS, S., SUTTON, M. & GRAVELLE, H. 2005. Inequity and inequality in the use of health care in England: an empirical investigation. Social science & medicine, 60, 1251-1266.
O'BRIEN-PALLAS, L., BAUMANN, A., DONNER, G., MURPHY, G., LOCHHAAS-GERLACH, J. & LUBA, M. 2001. Forecasting models for human resources in health care. J Adv Nurs, 33, 120 - 129.
Alternative Approaches to Health Workforce Planning 48
O’BRIEN-PALLAS, L., BAUMANN, A., DONNER, G., MURPHY, G. T., LOCHHAAS-GERLACH, J. & LUBA, M. 2001. Forecasting models for human resources in health care. Journal of Advanced Nursing, 33, 120-129.
PARSONS, D. 2010. Medical-workforce planning: an art or science?: The difficult problem of matching supply and demand. Human Resources Management Digest International, 18, 36 - 38.
POHLMEIER, W. & ULRICH, V. 1995. An econometric model of the two-part decisionmaking process in the demand for health care. Journal of Human Resources, 30, 339-361.
PRODUCTIVITY COMMISSION 2005. Australia’s Health Workforce. Canberra: Productivity Commission.
RICHARDSON, G., MAYNARD, A., CULLUM, N. & KINDIG, D. 1998. Skill mix changes: substitution or service development? Health Policy, 45, 119-132.
RIDOUTT, L., SCHOO, A. & SANTOS, T. 2006. Workload capacity measures for use in allied health workforce planning. . Melbourne: Department of Human Services, Victoria.
ROBERFROID, D., LEONARD, C. & STORDEUR, S. 2009. Physician supply forecast: better than peering in a crystal ball? Human Resources for Health, 7, 10.
SARMA, S. & SIMPSON, W. 2006. A microeconometric analysis of Canadian health care utilization. Health economics, 15, 219-239.
SCHEFFLER, R. 2008. Is there a doctor in the house? Market signals and tomorrow’s supply of doctors., Stanford, CA, Stanford University Press.
SCHEFFLER, R. M., LIU, J. X., KINFU, Y. & DAL POZ, M. R. 2008. Forecasting the global shortage of physicians: an economic- and needs-based approach. Bulletin of the World Health Organisation, 86, 497-576.
SCHOFIELD, D., MCRAE, I. & SHRESTHA, R. 2008. Modelling demand for medical services in Australia. . International Medical Workforce Collaborative Conference. Edinburgh.
SCHOFIELD, D., SHRESTHA, R. & CALLANDER, E. 2010. Access to GP services: How underserved are geographically disadvantaged Australians? . (submitted).
SCHOO, A., BOYCE, R., RIDOUTT, L. & SANTOS, T. 2008. Workload capacity measures for estimating allied health capacity requirements. Australian Health Review, 32, 548-558.
SCOTT, A. 2006. The productivity of the health workforce. Australian Economic Review, 39, 312.
SCOTT, A. & CHENG, T. C. 2010. Workload Measures for Allied Health Professionals. Final Report. Adelaide: National Health Workforce Planning and Research Collaboration.
SCOTT, A. & SIVEY, P. 2010. Refining the National Workforce Planning Model. Melbourne: National Health Workforce Research and Planning Collaboration, National Health Workforce Taskforce.
SCOTT, I. A. 2009. Health care workforce crisis in Australia: too few or too disabled? The Medical Journal of Australia, 190, 689-692.
SEGAL, L. & BOLTON, T. 2009. Issues facing the future health care workforce: the importance of demand modelling. Australia and New Zealand Health Policy, 6, 12.
SEGAL, L., DALZIEL, K. & BOLTON, T. 2008. A work force model to support the adoption of best practice care in chronic diseases; a missing piece in clinical guideline implementation. Implementation science, 3, 35.
Alternative Approaches to Health Workforce Planning 49
SHIELDS, M. A. 2004. Addressing nurse shortages: what can policy makers learn from the econometric evidence on nurse labour supply?*. The Economic Journal, 114, F464-F498.
SONG, F. & RATHWELL, T. 1994. Stochastic simulation and sensitivity analysis: estimating future demand for health resources in China. World Health Stat Q, 47, 149 - 156.
TOMBLIN-MURPHY, G. 2002. Methodological issues in health human resources planning: cataloguing assumptions and controlling for varibales in needs-based modelling. Canadain Journal of Nursing Research, 33, 51-70.
VAN DOORSLAER, E., KOOLMAN, X. & JONES, A. M. 2004. Explaining income related inequalities in doctor utilisation in Europe. Health economics, 13, 629-647.
WAGSTAFF, A. 1986. The demand for health: Some new empirical evidence. Journal of Health Economics, 5, 195-233.
WATSON, D. E., SLADE, S., BUSKE, L. & TEPPER, J. 2006. Intergenerational Differences In Workloads Among Primary Care Physicians: A Ten-Year, Population-Based Study. Health Aff, 25, 1620-1628.
WEINER, J. P. 2002. A Shortage Of Physicians Or A Surplus Of Assumptions? Health Affairs, 21, 160-162.
WHO 2010. Models and Tools for Health Workforce Planning and Projections. Human Resources for Health Observer, 3. Geneva: World Health Organisation.
WILKINS., R., WARREN., D., HAHN., M. & HOUNG., B. 2010. Families, Incomes and Jobs, Volume 5: A Statistical Report on Waves 1 to 7 of the Household, Income and Labour Dynamics in Australia (HILDA) Survey Melbourne: Melbourne Institute of Applied Economic and Social Research, The University of Melbourne.
ZURN, P., DAL POZ, M., STILWELL, B. & ADAMS, O. 2004. Imbalance in the health workforce. Hum Resour Health, 2, 13.

Alternative Approaches to Health Workforce Planning 51
Appendices
Appendix A Results of utilisation regression models 53

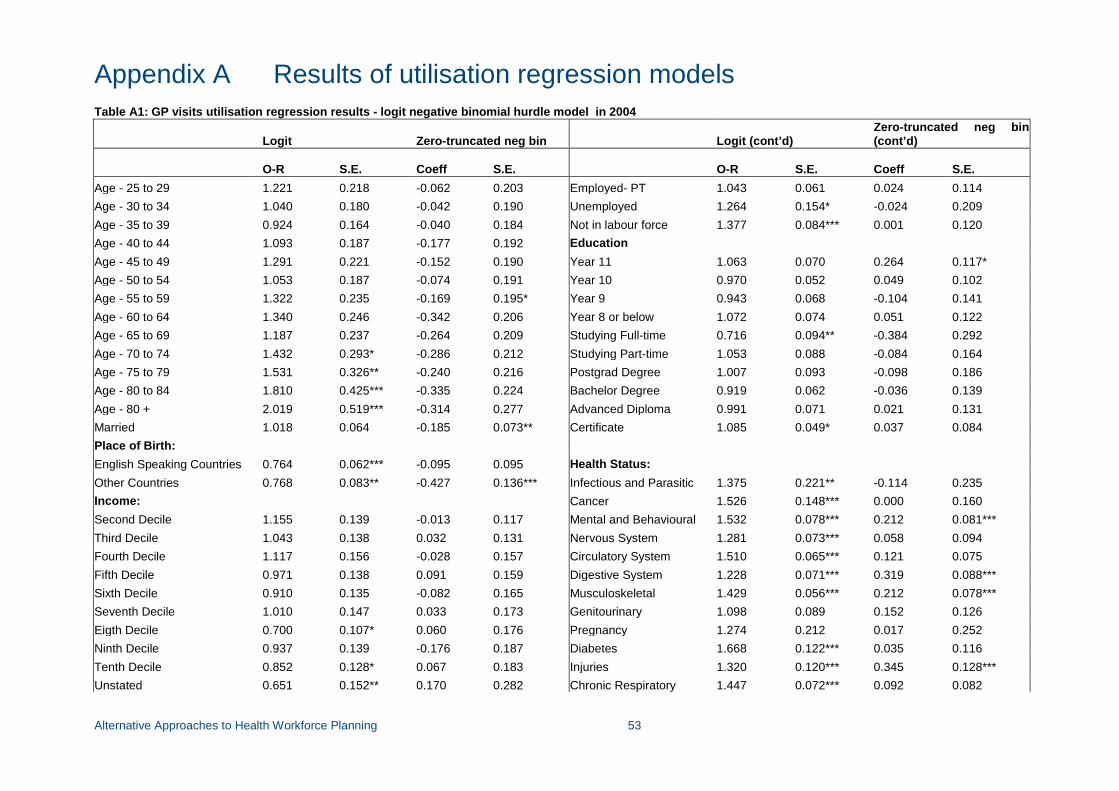
Alternative Approaches to Health Workforce Planning 53
Appendix A Results of utilisation regression models Table A1: GP visits utilisation regression results - logit negative binomial hurdle model in 2004
Logit Zero-truncated neg bin Logit (cont’d) Zero-truncated neg bin (cont’d)
O-R S.E. Coeff S.E. O-R S.E. Coeff S.E.
Age - 25 to 29 1.221 0.218 -0.062 0.203 Employed- PT 1.043 0.061 0.024 0.114 Age - 30 to 34 1.040 0.180 -0.042 0.190 Unemployed 1.264 0.154* -0.024 0.209 Age - 35 to 39 0.924 0.164 -0.040 0.184 Not in labour force 1.377 0.084*** 0.001 0.120 Age - 40 to 44 1.093 0.187 -0.177 0.192 Education Age - 45 to 49 1.291 0.221 -0.152 0.190 Year 11 1.063 0.070 0.264 0.117* Age - 50 to 54 1.053 0.187 -0.074 0.191 Year 10 0.970 0.052 0.049 0.102 Age - 55 to 59 1.322 0.235 -0.169 0.195* Year 9 0.943 0.068 -0.104 0.141 Age - 60 to 64 1.340 0.246 -0.342 0.206 Year 8 or below 1.072 0.074 0.051 0.122 Age - 65 to 69 1.187 0.237 -0.264 0.209 Studying Full-time 0.716 0.094** -0.384 0.292 Age - 70 to 74 1.432 0.293* -0.286 0.212 Studying Part-time 1.053 0.088 -0.084 0.164 Age - 75 to 79 1.531 0.326** -0.240 0.216 Postgrad Degree 1.007 0.093 -0.098 0.186 Age - 80 to 84 1.810 0.425*** -0.335 0.224 Bachelor Degree 0.919 0.062 -0.036 0.139 Age - 80 + 2.019 0.519*** -0.314 0.277 Advanced Diploma 0.991 0.071 0.021 0.131 Married 1.018 0.064 -0.185 0.073** Certificate 1.085 0.049* 0.037 0.084 Place of Birth: English Speaking Countries 0.764 0.062*** -0.095 0.095 Health Status: Other Countries 0.768 0.083** -0.427 0.136*** Infectious and Parasitic 1.375 0.221** -0.114 0.235 Income: Cancer 1.526 0.148*** 0.000 0.160 Second Decile 1.155 0.139 -0.013 0.117 Mental and Behavioural 1.532 0.078*** 0.212 0.081*** Third Decile 1.043 0.138 0.032 0.131 Nervous System 1.281 0.073*** 0.058 0.094 Fourth Decile 1.117 0.156 -0.028 0.157 Circulatory System 1.510 0.065*** 0.121 0.075 Fifth Decile 0.971 0.138 0.091 0.159 Digestive System 1.228 0.071*** 0.319 0.088*** Sixth Decile 0.910 0.135 -0.082 0.165 Musculoskeletal 1.429 0.056*** 0.212 0.078*** Seventh Decile 1.010 0.147 0.033 0.173 Genitourinary 1.098 0.089 0.152 0.126 Eigth Decile 0.700 0.107* 0.060 0.176 Pregnancy 1.274 0.212 0.017 0.252 Ninth Decile 0.937 0.139 -0.176 0.187 Diabetes 1.668 0.122*** 0.035 0.116 Tenth Decile 0.852 0.128* 0.067 0.183 Injuries 1.320 0.120*** 0.345 0.128*** Unstated 0.651 0.152** 0.170 0.282 Chronic Respiratory 1.447 0.072*** 0.092 0.082
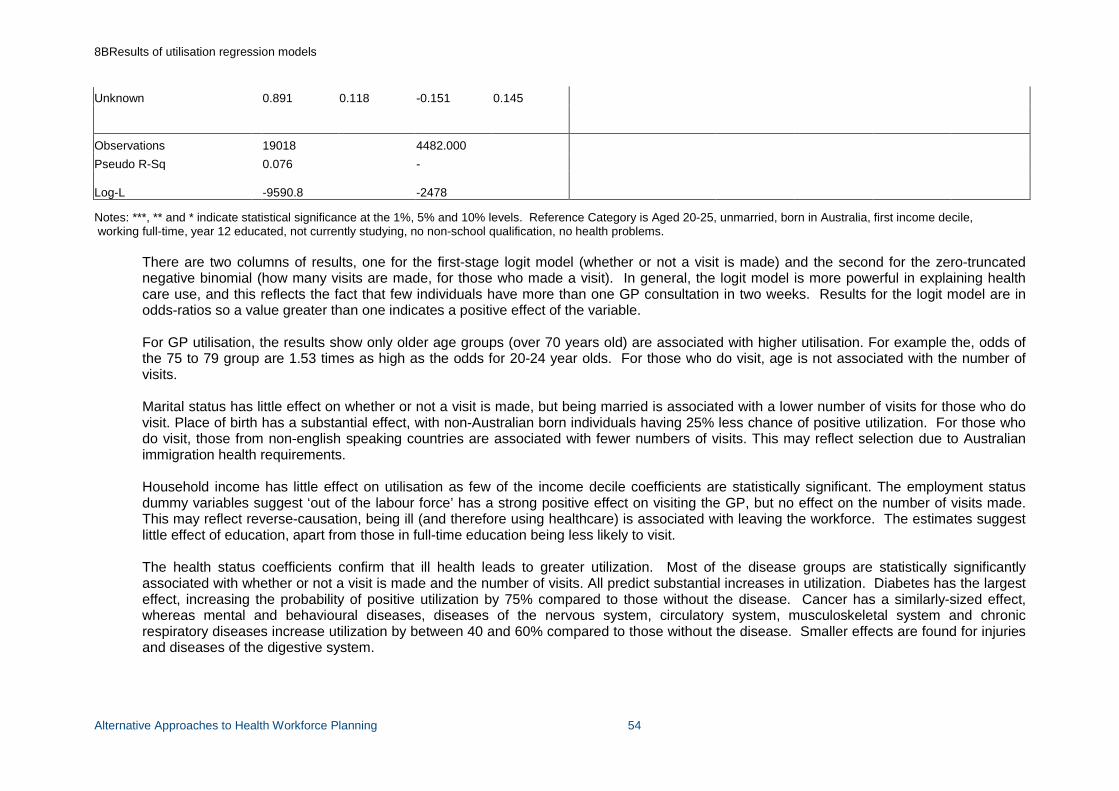
8BResults of utilisation regression models
Alternative Approaches to Health Workforce Planning 54
Unknown 0.891 0.118 -0.151 0.145
Observations 19018 4482.000 Pseudo R-Sq 0.076 -
Log-L -9590.8 -2478
Notes: ***, ** and * indicate statistical significance at the 1%, 5% and 10% levels. Reference Category is Aged 20-25, unmarried, born in Australia, first income decile, working full-time, year 12 educated, not currently studying, no non-school qualification, no health problems.
There are two columns of results, one for the first-stage logit model (whether or not a visit is made) and the second for the zero-truncated negative binomial (how many visits are made, for those who made a visit). In general, the logit model is more powerful in explaining health care use, and this reflects the fact that few individuals have more than one GP consultation in two weeks. Results for the logit model are in odds-ratios so a value greater than one indicates a positive effect of the variable. For GP utilisation, the results show only older age groups (over 70 years old) are associated with higher utilisation. For example the, odds of the 75 to 79 group are 1.53 times as high as the odds for 20-24 year olds. For those who do visit, age is not associated with the number of visits.
Marital status has little effect on whether or not a visit is made, but being married is associated with a lower number of visits for those who do visit. Place of birth has a substantial effect, with non-Australian born individuals having 25% less chance of positive utilization. For those who do visit, those from non-english speaking countries are associated with fewer numbers of visits. This may reflect selection due to Australian immigration health requirements.
Household income has little effect on utilisation as few of the income decile coefficients are statistically significant. The employment status dummy variables suggest ‘out of the labour force’ has a strong positive effect on visiting the GP, but no effect on the number of visits made. This may reflect reverse-causation, being ill (and therefore using healthcare) is associated with leaving the workforce. The estimates suggest little effect of education, apart from those in full-time education being less likely to visit.
The health status coefficients confirm that ill health leads to greater utilization. Most of the disease groups are statistically significantly associated with whether or not a visit is made and the number of visits. All predict substantial increases in utilization. Diabetes has the largest effect, increasing the probability of positive utilization by 75% compared to those without the disease. Cancer has a similarly-sized effect, whereas mental and behavioural diseases, diseases of the nervous system, circulatory system, musculoskeletal system and chronic respiratory diseases increase utilization by between 40 and 60% compared to those without the disease. Smaller effects are found for injuries and diseases of the digestive system.
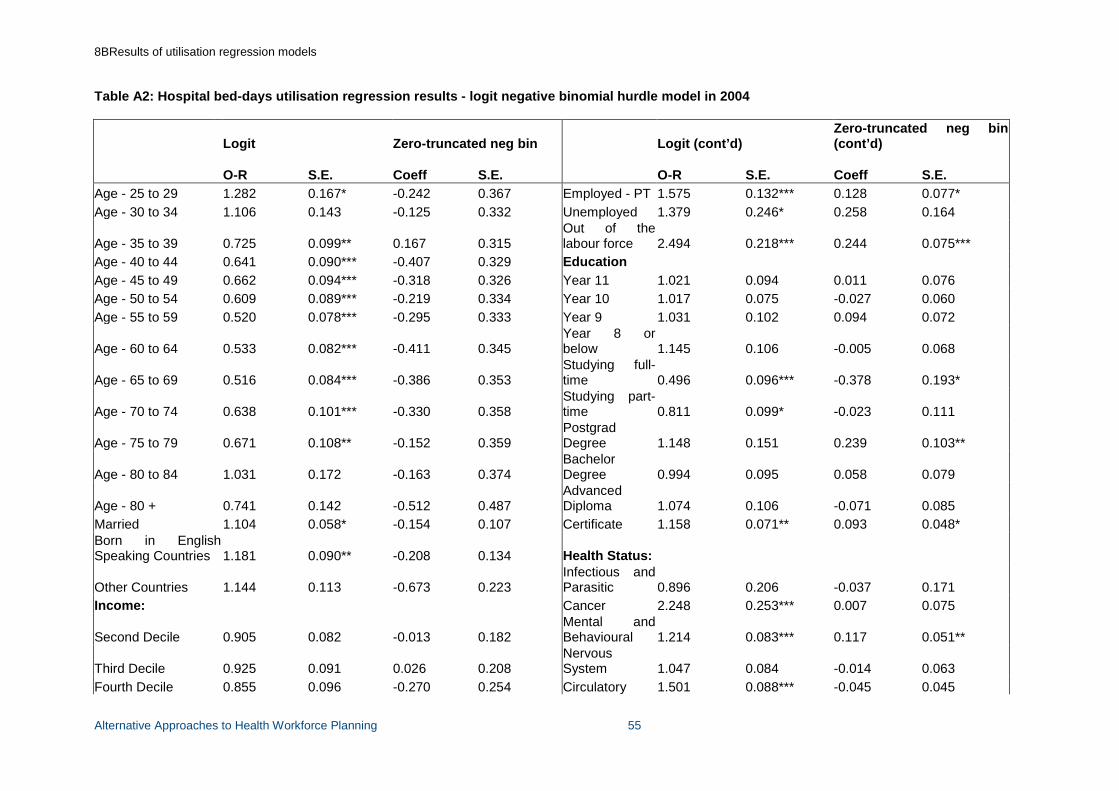
8BResults of utilisation regression models
Alternative Approaches to Health Workforce Planning 55
Table A2: Hospital bed-days utilisation regression results - logit negative binomial hurdle model in 2004
Logit Zero-truncated neg bin Logit (cont’d) Zero-truncated neg bin (cont’d)
O-R S.E. Coeff S.E. O-R S.E. Coeff S.E.
Age - 25 to 29 1.282 0.167* -0.242 0.367 Employed - PT 1.575 0.132*** 0.128 0.077* Age - 30 to 34 1.106 0.143 -0.125 0.332 Unemployed 1.379 0.246* 0.258 0.164
Age - 35 to 39 0.725 0.099** 0.167 0.315 Out of the labour force 2.494 0.218*** 0.244 0.075***
Age - 40 to 44 0.641 0.090*** -0.407 0.329 Education Age - 45 to 49 0.662 0.094*** -0.318 0.326 Year 11 1.021 0.094 0.011 0.076 Age - 50 to 54 0.609 0.089*** -0.219 0.334 Year 10 1.017 0.075 -0.027 0.060 Age - 55 to 59 0.520 0.078*** -0.295 0.333 Year 9 1.031 0.102 0.094 0.072
Age - 60 to 64 0.533 0.082*** -0.411 0.345 Year 8 or below 1.145 0.106 -0.005 0.068
Age - 65 to 69 0.516 0.084*** -0.386 0.353 Studying full-time 0.496 0.096*** -0.378 0.193*
Age - 70 to 74 0.638 0.101*** -0.330 0.358 Studying part-time 0.811 0.099* -0.023 0.111
Age - 75 to 79 0.671 0.108** -0.152 0.359 Postgrad Degree 1.148 0.151 0.239 0.103**
Age - 80 to 84 1.031 0.172 -0.163 0.374 Bachelor Degree 0.994 0.095 0.058 0.079
Age - 80 + 0.741 0.142 -0.512 0.487 Advanced Diploma 1.074 0.106 -0.071 0.085
Married 1.104 0.058* -0.154 0.107 Certificate 1.158 0.071** 0.093 0.048* Born in English Speaking Countries 1.181 0.090** -0.208 0.134 Health Status:
Other Countries 1.144 0.113 -0.673 0.223 Infectious and Parasitic 0.896 0.206 -0.037 0.171
Income: Cancer 2.248 0.253*** 0.007 0.075
Second Decile 0.905 0.082 -0.013 0.182 Mental and Behavioural 1.214 0.083*** 0.117 0.051**
Third Decile 0.925 0.091 0.026 0.208 Nervous System 1.047 0.084 -0.014 0.063
Fourth Decile 0.855 0.096 -0.270 0.254 Circulatory 1.501 0.088*** -0.045 0.045
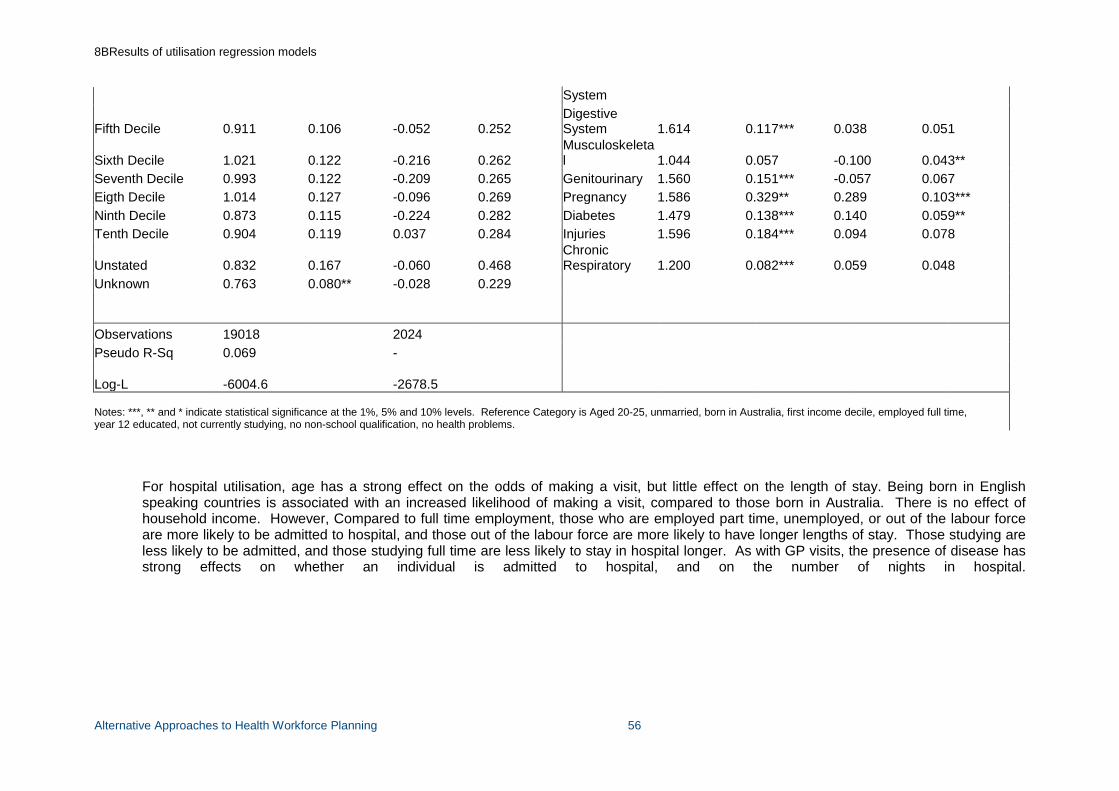
8BResults of utilisation regression models
Alternative Approaches to Health Workforce Planning 56
System
Fifth Decile 0.911 0.106 -0.052 0.252 Digestive System 1.614 0.117*** 0.038 0.051
Sixth Decile 1.021 0.122 -0.216 0.262 Musculoskeletal 1.044 0.057 -0.100 0.043**
Seventh Decile 0.993 0.122 -0.209 0.265 Genitourinary 1.560 0.151*** -0.057 0.067 Eigth Decile 1.014 0.127 -0.096 0.269 Pregnancy 1.586 0.329** 0.289 0.103*** Ninth Decile 0.873 0.115 -0.224 0.282 Diabetes 1.479 0.138*** 0.140 0.059** Tenth Decile 0.904 0.119 0.037 0.284 Injuries 1.596 0.184*** 0.094 0.078
Unstated 0.832 0.167 -0.060 0.468 Chronic Respiratory 1.200 0.082*** 0.059 0.048
Unknown 0.763 0.080** -0.028 0.229
Observations 19018 2024 Pseudo R-Sq 0.069 -
Log-L -6004.6 -2678.5
Notes: ***, ** and * indicate statistical significance at the 1%, 5% and 10% levels. Reference Category is Aged 20-25, unmarried, born in Australia, first income decile, employed full time, year 12 educated, not currently studying, no non-school qualification, no health problems.
For hospital utilisation, age has a strong effect on the odds of making a visit, but little effect on the length of stay. Being born in English speaking countries is associated with an increased likelihood of making a visit, compared to those born in Australia. There is no effect of household income. However, Compared to full time employment, those who are employed part time, unemployed, or out of the labour force are more likely to be admitted to hospital, and those out of the labour force are more likely to have longer lengths of stay. Those studying are less likely to be admitted, and those studying full time are less likely to stay in hospital longer. As with GP visits, the presence of disease has strong effects on whether an individual is admitted to hospital, and on the number of nights in hospital.

Alternative Approaches to Health Workforce Planning 57