
Alterations in functional connectivity for language in prematurely born adolescents
10
BRAIN A JOURNAL OF NEUROLOGY Alterations in functional connectivity for language in prematurely born adolescents Robin J. Schafer, 1 Cheryl Lacadie, 1 Betty Vohr, 2 Shelli R. Kesler, 3 Karol H. Katz, 4,5 Karen C. Schneider, 4 Kenneth R. Pugh, 6 Robert. W. Makuch, 5 Allan L. Reiss, 3 R. Todd Constable 1 and Laura R. Ment 4,7 1 Department of Diagnostic Imaging, Yale University School of Medicine, New Haven, CT, USA 2 Department of Pediatrics, Warren Alpert Brown Medical School, Providence, RI, USA 3 Department of Psychiatry, Center for Interdisciplinary Brain Sciences Research, Stanford University School of Medicine, Palo Alto, CA, USA 4 Department of Pediatrics, Yale University School of Medicine, New Haven, CT, USA 5 Department of Epidemiology and Public Health, Yale University School of Medicine, New Haven, CT, USA 6 Haskins Laboratory, New Haven, CT, USA 7 Department of Neurology, Yale University School of Medicine, New Haven, CT, USA Correspondence to: Dr Robin J. Schafer, Yale University, School of Medicine, Magnetic Resonance Research Center, PO Box 208043, New Haven, CT 06520, USA E-mail: [email protected] Abstract Recent data suggest recovery of language systems but persistent structural abnormalities in the prematurely born. We tested the hypothesis that subjects who were born prematurely develop alternative networks for processing language. Subjects who were born prematurely (n = 22; 600–1250 g birth weight), without neonatal brain injury on neonatal cranial ultrasound, and 26 term control subjects were examined with a functional magnetic resonance imaging (fMRI) semantic association task, the Wechsler Intelligence Scale for Children-III (WISC-III) and the Clinical Evaluation of Language Fundamentals (CELF). In-magnet task accuracy and response times were calculated, and fMRI data were evaluated for the effect of group on blood oxygen level dependent (BOLD) activation, the correlation between task accuracy and activation and the functional connectivity between regions activating to task. Although there were differences in verbal IQ and CELF scores between the preterm (PT) and term control groups, there were no significant differences for either accuracy or response time for the in-magnet task. Both groups activated classic semantic processing areas including the left superior and middle temporal gyri and inferior frontal gyrus, and there was no significant difference in activation patterns between groups. Clear differences between the groups were observed in the correlation between task accuracy and activation to task at P _ 0.01, corrected for multiple comparisons. Left inferior frontal gyrus correlated with accuracy only for term controls and left sensory motor areas correlated with accuracy only for PT subjects. Left middle temporal gyri correlated with task accuracy for both groups. Connectivity analyses at P _ 0.001 revealed the importance of a circuit between left middle temporal gyri and inferior frontal gyrus for both groups. In addition, the PT subjects evidenced greater connectivity between traditional language areas and sensory motor areas but significantly fewer correlated areas within the frontal lobes when compared to term controls. We conclude that at 12 years of age, children born prematurely and children born at term had no difference in performance on a simple lexical semantic processing task and doi:10.1093/brain/awn353 Brain 2009: Page 1 of 10 | 1 Received May 14, 2008. Revised November 5, 2008. Accepted December 1, 2008 ß 2009 The Author(s) This is an Open Access article distributed under the terms of the Creative Commons Attribution Non-Commercial License (http://creativecommons.org/licenses/by-nc/ 2.0/uk/) which permits unrestricted non-commercial use, distribution, and reproduction in any medium, provided the original work is properly cited. Brain Advance Access published January 21, 2009 by guest on March 18, 2016 http://brain.oxfordjournals.org/ Downloaded from
Transcript of Alterations in functional connectivity for language in prematurely born adolescents
BRAINA JOURNAL OF NEUROLOGY
Alterations in functional connectivity for languagein prematurely born adolescentsRobin J. Schafer,1 Cheryl Lacadie,1 Betty Vohr,2 Shelli R. Kesler,3 Karol H. Katz,4,5
Karen C. Schneider,4 Kenneth R. Pugh,6 Robert. W. Makuch,5 Allan L. Reiss,3
R. Todd Constable1 and Laura R. Ment4,7
1 Department of Diagnostic Imaging, Yale University School of Medicine, New Haven, CT, USA
2 Department of Pediatrics, Warren Alpert Brown Medical School, Providence, RI, USA
3 Department of Psychiatry, Center for Interdisciplinary Brain Sciences Research, Stanford University School of Medicine, Palo Alto, CA, USA
4 Department of Pediatrics, Yale University School of Medicine, New Haven, CT, USA
5 Department of Epidemiology and Public Health, Yale University School of Medicine, New Haven, CT, USA
6 Haskins Laboratory, New Haven, CT, USA
7 Department of Neurology, Yale University School of Medicine, New Haven, CT, USA
Correspondence to: Dr Robin J. Schafer,
Yale University, School of Medicine,
Magnetic Resonance Research Center,
PO Box 208043,
New Haven, CT 06520, USA
E-mail: [email protected]
AbstractRecent data suggest recovery of language systems but persistent structural abnormalities in the prematurely born. We tested the
hypothesis that subjects who were born prematurely develop alternative networks for processing language. Subjects who were
born prematurely (n = 22; 600–1250 g birth weight), without neonatal brain injury on neonatal cranial ultrasound, and 26 term
control subjects were examined with a functional magnetic resonance imaging (fMRI) semantic association task, the Wechsler
Intelligence Scale for Children-III (WISC-III) and the Clinical Evaluation of Language Fundamentals (CELF). In-magnet task
accuracy and response times were calculated, and fMRI data were evaluated for the effect of group on blood oxygen level
dependent (BOLD) activation, the correlation between task accuracy and activation and the functional connectivity between
regions activating to task. Although there were differences in verbal IQ and CELF scores between the preterm (PT) and term
control groups, there were no significant differences for either accuracy or response time for the in-magnet task. Both groups
activated classic semantic processing areas including the left superior and middle temporal gyri and inferior frontal gyrus, and
there was no significant difference in activation patterns between groups. Clear differences between the groups were observed
in the correlation between task accuracy and activation to task at P_0.01, corrected for multiple comparisons. Left inferior
frontal gyrus correlated with accuracy only for term controls and left sensory motor areas correlated with accuracy only for PT
subjects. Left middle temporal gyri correlated with task accuracy for both groups. Connectivity analyses at P_0.001 revealed
the importance of a circuit between left middle temporal gyri and inferior frontal gyrus for both groups. In addition, the PT
subjects evidenced greater connectivity between traditional language areas and sensory motor areas but significantly fewer
correlated areas within the frontal lobes when compared to term controls. We conclude that at 12 years of age, children born
prematurely and children born at term had no difference in performance on a simple lexical semantic processing task and
doi:10.1093/brain/awn353 Brain 2009: Page 1 of 10 | 1
Received May 14, 2008. Revised November 5, 2008. Accepted December 1, 2008
� 2009 The Author(s)
This is an Open Access article distributed under the terms of the Creative Commons Attribution Non-Commercial License (http://creativecommons.org/licenses/by-nc/
2.0/uk/) which permits unrestricted non-commercial use, distribution, and reproduction in any medium, provided the original work is properly cited.
Brain Advance Access published January 21, 2009 by guest on M
arch 18, 2016http://brain.oxfordjournals.org/
Dow
nloaded from
activated similar areas. Connectivity analyses, however, suggested that PT subjects rely upon different neural pathways for
lexical semantic processing when compared to term controls. Plasticity in network connections may provide the substrate for
improving language skills in the prematurely born.
Keywords: connectivity; fMRI; volumetric; preterm; language
Abbreviations: BA = Brodman’s area; BOLD = blood oxygen level dependent; CCCT = correlation coefficient comparison test;fMRI = functional magnetic resonance imaging; H = hippocampus; IFG = inferior frontal gyrus; MTG = middle temporal gyrus;pTG = posterior middle and inferior temporal gyrus; PT = preterm; ROI = region(s) of interest; STG = superior temporal gyrus;SMA = sensorimotor association cortex
IntroductionThe cognitive deficits associated with preterm (PT) birth have been
described, and include diminished attention, memory and reason-
ing skills relative to full-term peers (Saigal and Doyle, 2008).
Recent studies have, however, documented functional recovery
over a range of cognitive skills on the part of the prematurely
born, especially by late childhood and early adolescence, and an
increasing number of children born before week 33 of gestation
and weighing 51500 g at birth are successfully maturing into
adulthood (Rushe et al., 2001; Allin and Nosarti, 2005; Saigal
et al., 2006; Ment and Constable, 2007; Saigal and Doyle, 2008).
Cognitive behaviour of prematurely born children that is indis-
tinguishable from that of children born full term suggests non-
differential localization between the two groups in neuro-cognitive
studies employing fMRI brain imaging. At the same time, evidence
of such non-differential localization in PT children is unanticipated
because structural abnormalities associated with PT birth persist
through early development (Peterson et al., 2000b) and are still
observed during adolescence (Nosarti et al., 2008). These abnor-
malities occur even in the absence of severe disability and take the
form of smaller cortical and sub-cortical volumes, larger ventricular
volumes and decreases in callosal projections and in fibre tract
organization in general (Santhouse et al., 2002; Kesler et al.,
2004; Gimenez et al., 2006; Constable et al., 2008; Mullen
et al., 2008). The default assumption is that such structural differ-
ences would result in a difference in the localization of cognitive
function.
An alternative view is that localization could be the same for the
two groups when behaviour is equivalent, but in such cases the
network underlying the areas of activation would differ. This
account of functional recovery in a structurally altered brain
would permit the possibility for activations to task in PT and
term born children to be largely overlapping, though the connec-
tivity between regions may differ. Connectivity refers to the coor-
dination of response across spatially distinct brain areas (Raichle
and Snyder, 2007). Work on resting state connectivity, examining
brain activity during sleep states and in anaesthetized animals,
indicates that connectivity is at least partially anatomically deter-
mined, dependent upon white and grey matter fibres (Greicius
et al., 2003; Hampson et al., 2006; Vincent et al., 2007). Thus
we expect modifications in connectivity in the context of altered
anatomy.
This work explores the neurobiological underpinnings of func-
tional recovery in a set of 12-year-old PT children. When tested
earlier, at age eight, they evidenced the cognitive deficits fre-
quently documented in PT children including impaired perfor-
mance on basic semantic tasks and a failure to make use of
familiar semantic pathways when assessed by functional magnetic
resonance imaging (fMRI) (Peterson et al., 2002). Yet in light of
previous work indicating recovery of basic semantic processing
during adolescence (Saavalainen et al., 2006), we adopted the
null hypothesis for their performance on the simple semantic asso-
ciation task presented to them and to a term born control group
during a 12-year-old follow-up fMRI scan. The blood oxygen
level-dependent (BOLD) response was used to localize any
group differences in activation during task performance. In addi-
tion, to verify the persistence of structural differences, we exam-
ined data from volumetric scans available for a majority of the
subjects from the two groups. Finally, the network underlying
the areas of activation was identified post hoc by analysing the
connectivity between regions responding to task in the PT and the
control group. These analyses constitute the first examination of
functional connectivity in the developing PT brain.
MethodsThis study was performed at Yale University School of Medicine, New
Haven, CT, Warren Alpert Brown Medical School, Providence, RI, and
Stanford University, Palo Alto, CA. The protocols were reviewed and
approved by institutional review boards at each location. All scans
were obtained and analysed at Yale University with the exception of
voxel-based and volumetric morphometric analyses which were per-
formed at the Stanford Center for Interdisciplinary Brain Sciences
Research.
SubjectsSeventy-four children provided written assent, and parents provided
written consent for the study. As has been our custom for all imaging
studies, children were reimbursed $100 to participate in each scanning
session. PT children included in this study were screened for intraven-
tricular haemorrhage, periventricular leukomalacia and low pressure
ventriculomegaly, and showed no evidence of neonatal brain injury.
Twenty (9 PT) were excluded from the analyses due to incomplete
scanning sessions, response recording errors or excessive motion; six
additional PT children with a history of intraventricular haemorrhage
and/or periventricular leukomalacia were also excluded from the ana-
lysis. FMRI data from the remaining 48 subjects were analysed.
The 22 PT subjects (10 males) participated as part of a 12 year fol-
low up to the Multicenter Randomized Indomethacin Intraventricular
Haemorrhage Prevention Trial (Ment et al., 1994). The PT subjects
2 | Brain 2009: Page 2 of 10 R. J. Schafer et al.
by guest on March 18, 2016
http://brain.oxfordjournals.org/D
ownloaded from

were recruited from the original cohort based on geographical prox-
imity to New Haven, Connecticut and are representative of the original
cohort in sex, handedness, full-scale intelligence quotient scores, race/
ethnicity and maternal education. Twenty six children born at term
were recruited from the local community. They were group-matched
with the PT children for age, sex and minority status. The assessments
of neonatal health status and neurodevelopmental outcome have been
previously described. Blinded assessment of intelligence was performed
in a separate session from the fMRI scan using the Wechsler
Intelligence Scale for Children-III (WISC-III) (Wechsler, 1991).
Children also underwent measures of language function, including
portions of the Clinical Evaluation of Language Fundamentals (CELF)
Third Edition (Semel et al., 1995), the Peabody Picture Vocabulary
Test-Revised (PPVT-R) (Peabody, 1981) and the Gray Silent Reading
Test (Wiederholt and Blalock, 2000). The PPVT-R provides a receptive
vocabulary score, while the CELF and the Gray Silent Reading Test
measure the ability to understand spoken and written language.
Volumetric MRI studiesHigh-resolution volumetric magnetic resonance imaging scans were
collected on 37 of the 48 subjects (15 PT). Volumetric images were
acquired with a three-dimensional volumetric radiofrequency spoiled
gradient echo pulse sequence 124 contiguous 1.2 mm sagittal slices
(256�192 matrix, TE = 5 ms, �= 45, TR = 24 ms, NEX = 1, field of
view = 30 cm).
fMRI task paradigmThe fMRI paradigm consisted of two block-design tasks, semantic
association and non-word rhyme, each presented across four runs
consisting of six task blocks and seven baseline blocks. Because of
difficulties with the non-word rhyme stimuli, this task had to be elimi-
nated from the study. All blocks were 18 s in length and contain four
4.5 s fixed time trials, for a total of 24 task trials and 28 baseline trials
per run, 96 task trials and 112 baseline trials across the four runs.
Stimuli were presented using Psyscope (Macwhinney et al., 1997)
and timed via a Macintosh PowerPC running the programme.
Responses were registered using a fiber optic button box.
Dependent behavioural measures are response time and response
accuracy.
Task stimuli consisted of 56 word pairs presented on a single line on
a screen. Twenty items were repeated once in identical order and 20
items were repeated once in inverse order to yield 96 trials. Subjects
were required to decide whether the two words were associated; in 50
of the 96 trials, the items did so, e.g. dry wet or bronze chrome. We
refer to these as the matched trials; they include instances of near
synonyms, of antonyms and of items that share a category.
Accurate response in these trials demand lexical access and semantic
association. In non-matched trials words were not readily related,
e.g. bride cloud or pin rag. The baseline involved the visual presenta-
tion of a pair of symbol strings consisting of forward and back-slashes.
Subjects were required to decide if the pair matched or not through
visual inspection with respect to the single parameter, direction of
slant. Of the 112 baseline trials, 54 were matches and 48 were
non-matches.
fMRI imagingImages were collected from all 48 subjects on a 1.5T Siemans Sonata
scanner with a standard bird-cage head coil. Functional images were
acquired with a gradient-echo, echo-planner imaging sequence of
24 axial-oblique slices set parallel to the ac–pc line (6 mm thick, 0 skip)
with gradient echo planar imaging (64� 64 matrix, TE = 45 ms, �= 80,
TR = 2 s, 2112 kHz bandwidth). BOLD acquisitions were obtained at
122 images per slice per run. The 24 6 mm slices permitted full brain
coverage for every subject. The scanning series included both T1- and
T2-weighted axial-oblique 2D anatomic scans and a 3D Sagittal SPGR
anatomic series. Stimuli presentation was timed to start on a signal
from the scanner at the beginning of each run; there was a programmed
delay for discarded acquisitions in order to allow magnetization to reach
steady-state. This sequence required a minimum total time in the scanner
of 1 h, 10 min.
Data analysis
Behavioural data analysis
Task accuracy and response time data were input to a 2�2 ANOVA
in SPSS (trial type by diagnostic group) in which subject age at time of
scan was factored in as a covariate. Because semantic association
occurred only in matched trials, if a difference were to be found in
the 2�2 ANOVA, group contrast in accuracy and response time
would be examined separately in these trials. For completeness, accu-
racy and response time to the baseline task was examined by univari-
ate ANOVA. In addition, to verify that the well-established connection
between PT structural irregularities and cognitive performance
(Peterson et al., 2000a) was instantiated in our data, accuracy
scores were correlated with a representative measure of structural
divergence, left ventricle volume.
Volumetric analysis
Volumetric images were transferred digitally to Stanford University.
Raters blinded to group membership visually inspected the images to
exclude those evidencing excessive motion. Scans were imported into
BrainImage version 5.x (http://spnl.stanford.edu/tools/brainimage.htm)
for semiautomated whole brain segmentation and quantification in the
sagittal plane using previously described methods (Kesler et al., 2004).
The process yields results for whole brain grey matter, white matter and
cerebrospinal fluid, including subcortical grey matter. Measurements for
each group were compared using general linear modelling adjusting for
total brain volume and age at scan.
Imaging data analysis
Functional images were motion corrected using SPM99 (Friston et al.,
1995), and registered to a three-dimensional reference brain as imple-
mented in the Yale BioImage Suite software package (http://
www.bioimagesuite.org). Individual subject data were analysed
within BioImage Suite (Papademetris et al., 2006) using a General
Linear Model with the semantic task as a regressor on each voxel in
the entire brain volume. The data were normalized to a signal measure
of 100 and were spatially smoothed with an 8.0 mm Gaussian kernel
over a 3 voxel radius to account for variations in the location of acti-
vation across participants. The output maps are normalized beta-maps
that are in the acquired space (3.44�3.44�6 mm).
To take these data into a common reference space, three registra-
tions were calculated within the BioImage Suite software package
using the intensity-only component of the method reported in
(Papademetris et al., 2004). The first registration performs a linear
registration between the individual subject raw functional image
stripped of the skull and that subject’s 2D anatomical image. The
2D anatomical image is then linearly registered to the individual’s
3D anatomical image. The 3D differs from the 2D in that it has
a 1�1� 1 mm resolution whereas the 2D z-dimension is set
Connectivity in preterms and controls Brain 2009: Page 3 of 10 | 3
by guest on March 18, 2016
http://brain.oxfordjournals.org/D
ownloaded from
by slice-thickness and its x–y dimensions are set by voxel size. Finally,
a non-linear registration is computed between the individual 3D anat-
omical image and a reference 3D image. The reference brain used was
a selected normal subject brain from an age-matched child who did
not participate in the study. All three registrations were applied
sequentially to the individual normalized beta-maps to bring all data
into the common reference space.
Data were converted to AFNI format [(Cox, 1996) http://afni.
nimh.nih.gov] for group analysis. Because males show a different tra-
jectory of recovery than female PT children, we applied a 2�2
ANOVA (gender type by diagnostic group) in which subject was trea-
ted as a random factor using the GroupAna programme from the AFNI
Matlab library (http://afni.nimh.nih.gov/afni/matlab/). In addition to
group analysis, we examined activation associated with semantic pro-
cessing via a regression analysis performed using 3DRegAna (http://
afni.nimh.nih.gov/pub/dist/doc/program_help/3dRegAna.html) on
whole brain activation and accuracy scores on the matched trials,
those in which semantic association occurred. In both these analyses
individual voxel thresholds were set at a P50.01. Results were masked
and converted back into ANALYZE format for viewing in BioImage
Suite. Data were corrected for multiple comparisons by spatial extent
of contiguous suprathresholded individual voxels at an experiment-
wise P50.01. In a Monte Carlo simulation within the AFNI software
package and using a smoothing kernel of 8 mm and a connection
radius of 7.2 mm on 3.44�3.44�6 mm voxels, it was determined
that an activation volume of 102 original voxels (2754 microliters)
satisfied the P50.01 threshold.
ROI connectivity analysis
The synchrony of response between regions responding highly to task
was examined post hoc. Functional connectivity in each group was
substantiated using cross-subject correlations between mean activa-
tions within regions isolated via the imaging data analysis. A cross-
subject correlation is the correlation between the mean activation for
each subject in each region being compared (Horwitz et al., 1998,
2000; Pugh et al., 2000). In the absence of time course information
from resting state runs, the correlation across-subjects of two or more
regional mean activations during task offers a good approximation of
temporal connectivity, the correlation between the time course of
BOLD responses in two or more regions or across voxels in the brain.
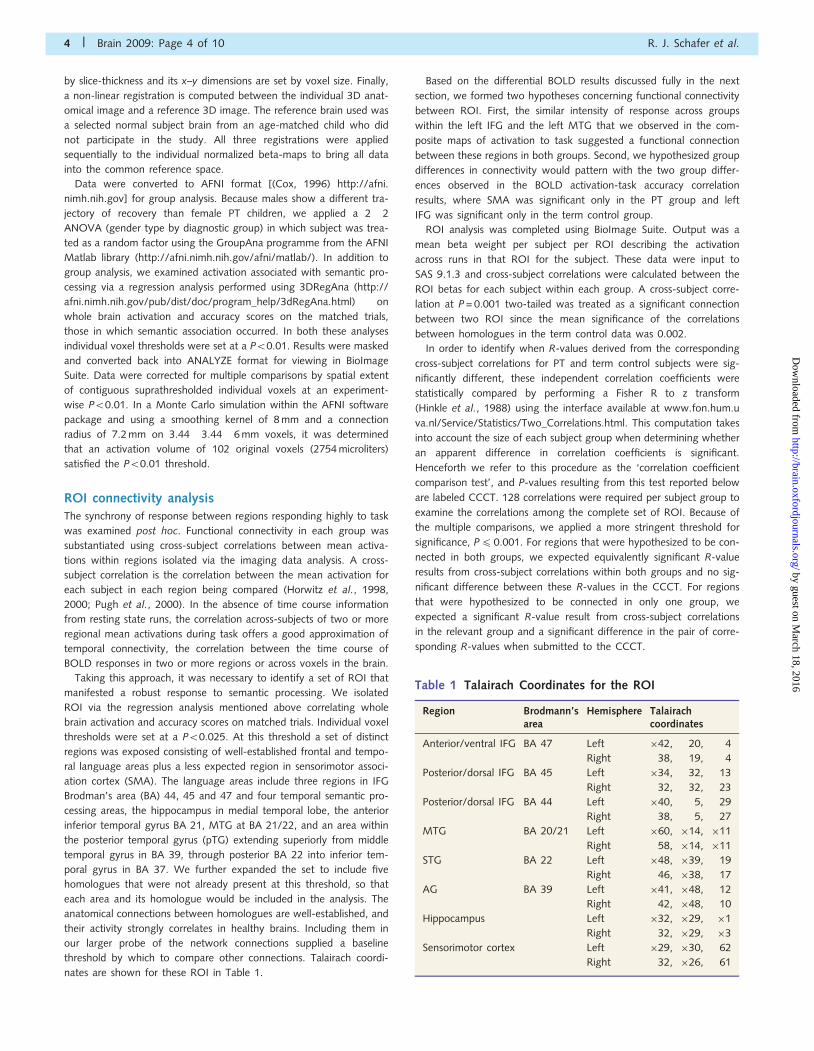
Taking this approach, it was necessary to identify a set of ROI that
manifested a robust response to semantic processing. We isolated
ROI via the regression analysis mentioned above correlating whole
brain activation and accuracy scores on matched trials. Individual voxel
thresholds were set at a P50.025. At this threshold a set of distinct
regions was exposed consisting of well-established frontal and tempo-
ral language areas plus a less expected region in sensorimotor associ-
ation cortex (SMA). The language areas include three regions in IFG
Brodman’s area (BA) 44, 45 and 47 and four temporal semantic pro-
cessing areas, the hippocampus in medial temporal lobe, the anterior
inferior temporal gyrus BA 21, MTG at BA 21/22, and an area within
the posterior temporal gyrus (pTG) extending superiorly from middle
temporal gyrus in BA 39, through posterior BA 22 into inferior tem-
poral gyrus in BA 37. We further expanded the set to include five
homologues that were not already present at this threshold, so that
each area and its homologue would be included in the analysis. The
anatomical connections between homologues are well-established, and
their activity strongly correlates in healthy brains. Including them in
our larger probe of the network connections supplied a baseline
threshold by which to compare other connections. Talairach coordi-
nates are shown for these ROI in Table 1.
Based on the differential BOLD results discussed fully in the next
section, we formed two hypotheses concerning functional connectivity
between ROI. First, the similar intensity of response across groups
within the left IFG and the left MTG that we observed in the com-
posite maps of activation to task suggested a functional connection
between these regions in both groups. Second, we hypothesized group
differences in connectivity would pattern with the two group differ-
ences observed in the BOLD activation-task accuracy correlation
results, where SMA was significant only in the PT group and left
IFG was significant only in the term control group.
ROI analysis was completed using BioImage Suite. Output was a
mean beta weight per subject per ROI describing the activation
across runs in that ROI for the subject. These data were input to
SAS 9.1.3 and cross-subject correlations were calculated between the
ROI betas for each subject within each group. A cross-subject corre-
lation at P = 0.001 two-tailed was treated as a significant connection
between two ROI since the mean significance of the correlations
between homologues in the term control data was 0.002.
In order to identify when R-values derived from the corresponding
cross-subject correlations for PT and term control subjects were sig-
nificantly different, these independent correlation coefficients were
statistically compared by performing a Fisher R to z transform
(Hinkle et al., 1988) using the interface available at www.fon.hum.u
va.nl/Service/Statistics/Two_Correlations.html. This computation takes
into account the size of each subject group when determining whether
an apparent difference in correlation coefficients is significant.
Henceforth we refer to this procedure as the ‘correlation coefficient
comparison test’, and P-values resulting from this test reported below
are labeled CCCT. 128 correlations were required per subject group to
examine the correlations among the complete set of ROI. Because of
the multiple comparisons, we applied a more stringent threshold for
significance, P4 0.001. For regions that were hypothesized to be con-
nected in both groups, we expected equivalently significant R-value
results from cross-subject correlations within both groups and no sig-
nificant difference between these R-values in the CCCT. For regions
that were hypothesized to be connected in only one group, we
expected a significant R-value result from cross-subject correlations
in the relevant group and a significant difference in the pair of corre-
sponding R-values when submitted to the CCCT.
Table 1 Talairach Coordinates for the ROI
Region Brodmann’sarea
Hemisphere Talairachcoordinates
Anterior/ventral IFG BA 47 Left �42, 20, 4
Right 38, 19, 4
Posterior/dorsal IFG BA 45 Left �34, 32, 13
Right 32, 32, 23
Posterior/dorsal IFG BA 44 Left �40, 5, 29
Right 38, 5, 27
MTG BA 20/21 Left �60, �14, �11
Right 58, �14, �11
STG BA 22 Left �48, �39, 19
Right 46, �38, 17
AG BA 39 Left �41, �48, 12
Right 42, �48, 10
Hippocampus Left �32, �29, �1
Right 32, �29, �3
Sensorimotor cortex Left �29, �30, 62
Right 32, �26, 61
4 | Brain 2009: Page 4 of 10 R. J. Schafer et al.
by guest on March 18, 2016
http://brain.oxfordjournals.org/D
ownloaded from
Results
Subject assessmentAs shown in Table 2 the PT subjects had a mean gestation age of
28.6� 2 weeks and a mean birth weight of 1013.2� 139.2 g.
Children in the two groups were well matched in gender and
race. Mothers of term control subjects had significantly more
years of education (P = 0.033) and were more likely to have grad-
uated from high school (P = 0.04). As shown in Table 3, there
were no significant differences in the numbers of right-handed
subjects or subject height at scan. PT subjects were on average
6 months older than term controls (P = 0.048). Data in Table 3 also
demonstrate that verbal IQ, verbal comprehension IQ, perfor-
mance IQ and full-scale IQ scores were all significantly lower for
the 22 PT subjects when compared to the 26 term control children
(P = 0.007, 0.012, 0.001 and 0.003, respectively). Similarly, CELF
receptive language and total scores and PPVT-R scores were also
significantly lower for PT subjects (P = 0.002, 0.008 and 0.016,
respectively). None of the subjects had a VIQ score 570.
In-magnet behavioural resultsThe PT and term groups performed equally well on the semantic
association task. As reported in Table 3, no significant difference
for trial type or group was observed on either dependent variable,
accuracy or response time. Likewise no significant difference
between the two groups on the baseline task was observed for
either accuracy or response time. As expected, there was a signif-
icant inverse correlation between accuracy and left ventricle
volume only for PT subjects (RPreterm =�0.744, pPreterm = 0.001,
RTerm =�0.282, pTerm = 0.203).
Brain volumes for the study subjectsBrain volume data for a subset of the study children are shown in
Table 4 and demonstrate significant differences between the PT
and term study children for the deep gray regions bilaterally
(P50.001 for left and 0.002 for right), for the left frontal, tem-
poral and parietal white regions (P = 0.04, 0.05 and 0.05, respec-
tively), for the right temporal and deep white matter (P = 0.02 and
0.04, respectively) and for right and left lateral ventricular
cerebrospinal fluid volumes (P = 0.036 and 0.002, respectively).
Functional imaging resultsThere was no significant difference at P50.01, corrected, in acti-
vation patterns between the two study groups. This null result was
not a threshold effect: no significant differences were observed if
we lowered our significance threshold to P50.05, corrected.
Composite group activation maps at P50.001 corrected for the
22 PT and 26 term control subjects are shown in Fig. 1 and reveal
that both the PT subjects and those born full term present the
greatest activation to task in the left IFG and in the left STG/MTG.
Maps of the correlation between accuracy on semantically asso-
ciated items with whole brain activation to task for both study
groups are shown in Fig. 2A. For both study groups, task accuracy
significantly correlates with activation in the left MTG, in BA 22
for the PT subjects and in BA 39 for the term controls (P50.01,
corrected). Activation in the left SMA of PT subjects also signifi-
cantly correlated with accuracy, as did that in the left IFG of the
term controls (P50.01, corrected). For illustrative purposes, a plot
of the correlation between activation within the left IFG and accu-
racy on semantic items is shown in Fig. 2B. The plot demonstrates
a high degree of correlation for term control subjects (R = 0.632,
P50.001, R-square = 0.40) but not for prematurely born study
subjects (R = 0.001, P = 0.996, R-square = 0.00) despite the fact
that we know from the composite maps in Fig. 1 that both
groups robustly activate left IFG.
Table 3 Developmental data including cognitive test andtask results
Preterm Term P-value
Age at scan (years) 12.8� 2.1 12.2�0.4 0.048
Height at scan (m) 153.3� 11.5 152.3� 7.9 NS
# right-handed 18 (86%) 24 (92%) 0.64
WISC III IQ scores
VIQ 97.5� 14.4 107.7� 14.1 0.007
VCIQ 98.4� 14.1 108.0� 13.9 0.012
PIQ 90.2� 13.8 104.9� 15.6 0.001
FSIQ 93.3� 12.9 106.9� 14.8 0.003
CELF
Receptive language 94.3� 12.9 108.0� 16.2 0.002
Expressive language 96.2� 14.5 102.2� 13.4 0.22
Total score 94.0� 12.9 104.8� 14.7 0.008
Gray Silent Reading quotient 95.4� 16.7 107.2� 23.4 0.07
PPVT - R 94.7� 18.4 106.9� 19.5 0.016
In magnet task accuracy
Matched trials 77.09%� 13.6 73.77%� 15.0 0.568
Unmatched trials 80.0%� 24.2 75.77� 20.0
In magnet task resp. time
Matched trials 1383.03
ms�406.19
1316.13
ms�399.83
0.568
Unmatched trials 1562.19
ms�491.11
1479.87� 460.66
In magnet task baseline
Accuracy 75.77%� 14.6 74.73%� 13.0 0.639
Response time 1291.93
ms�350.0
1221.35� 323.17 0.129
Table 2 Neonatal Data
Preterm Term P-value
Number 22 26
Number of males 10 (45%) 11 (42%) 1.0
Birth weight (grams) 1013.2�139.2
Gestational age (weeks) 28.6� 1.9
Non-white 10 (45%) 7 (27%) 0.23
Chorioamnionitis 5 (23%)
Randomization to indomethacin 11 (50%)
Bronchopulmonary dysplasia 6 (27%)
Maternal education (years) 12.9� 2.1 15.0�2.8 0.033
Maternal education5high school 4 (18%) 0 0.038
Connectivity in preterms and controls Brain 2009: Page 5 of 10 | 5
by guest on March 18, 2016
http://brain.oxfordjournals.org/D
ownloaded from

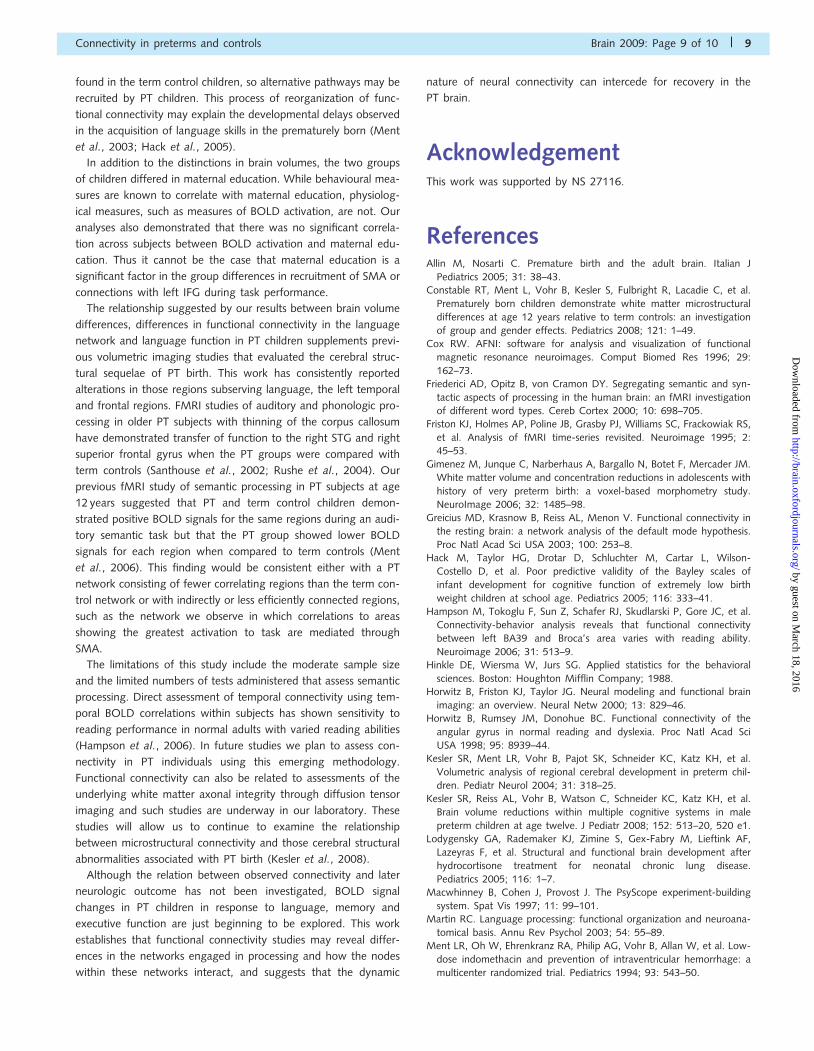
ROI connectivity resultsR-values and P-values from cross-subject correlations are listed in
Table 5 together with the results of the CCCT. Included are data
from all regions whose cross-subject correlation met the threshold
of P40.001 for at least one group. All significant correlations in
activity between non-homologous regions are depicted in Fig. 3.
Significant connections shared by both groups are drawn in blue;
those unique to one group are drawn in red. Results can also be
viewed on rotating 3D brain images at http://research.yale.edu/
bioimagesuite/MovieGallery/PTconnectivitymovie.html.
As shown in Table 5 and Fig. 3, the correlation in activity
between the left pTG and left anterior/ventral inferior frontal
gyrus, BA 47, was highly robust in both groups (R = 0.687,
P = 0.0004 and R = 0.686, P50.0001 for PT and term control sub-
jects, respectively). No difference was found between these two
R-values (pccct = 0.995). The correlations between these two ROI
were among the most robust connections in our data set. Other
non-homologous regions whose R-values were significant for both
groups were found within both frontal and temporal regions.
Homologous regions evidencing significant correlations in both
groups are listed on Table 5.
Differences between the two groups were identified in three
types of connections: fronto-temporal, cross-hemispheric frontal,
and those involving the SMA. Among fronto-temporal cross-
subject correlations, two pairs of R-values were found to significantly
differ between groups. Interestingly these connections crossed
hemispheres: the correlation between right BA 22 and left BA
44 was found to be significant only for the term control subjects
(R = 0.618, P = 0.001, pccct = 0.0042); the correlation between left
pTG and right BA 47 was found to be significant only for the PT
subjects (R = 0.698, P = 0.0003, pccct = 0.049). Two pairs of signifi-
cantly correlating frontal regions occurred only in the term control
data where subjects evidenced significant cross-subject correlations
between right BA 47 and left BA 45 and between right BA 47 and
right BA 45 (R = 0.716, P50.0001, pccct = 0.064 for the former and
R = 0.906, P50.0001, pccct = 0.00066 for the latter).
Finally, significant cross-subject correlations involving the SMA
occurred only in PT data. The R-values for the PT and term control
groups significantly differed between right SMA and right hippo-
campus (RR H = 0.67, pR H = 0.0006, pccct = 0.013), and between
left SMA and three regions: the right hippocampus, and right and
left BA 22 (RR H = 0.718, pR H = 0.0002, pccct = 0.048; RL22 = 0.701,
pL22 = 0.0003, pccct = 0.034; RR22 = 0.662, pR22 = 0.001,
pccct = 0.044).
All connections exclusive to one group are diagrammed in red in
Fig. 3. This figure clearly illustrates a difference in connections with
left IFG between the two groups. Significant direct connections
from right IFG and right MTG to the left IFG are observed in
the term control data. The SMA and right temporal regions par-
ticipate more prominently in the network isolated in PT children.
DiscussionUsing fMRI to examine lexical semantic processing, we have demon-
strated that children born prematurely and term control subjects
engage neural systems for language differently at age 12 years.
The basis of this conclusion is a set of key findings. These include
two similarities between the groups: the PT and term control subjects
performed equally well on a visual semantic association task, and
their overall composite group activations to task were non-distinct.
Three critical differences between the groups were also isolated. First
was a structural difference. Similar to examinations of volumetric
and microstructural changes in other cohorts reported during
late childhood and early adolescence (Lodygensky et al., 2005;
Fig. 1 fMRI group composite maps. Activation to task in each
group, P50.001, corrected for multiple comparisons, n = 26
Term born controls (top row) and n = 22 Prematurely born
children (bottom row). Images are radiologic: left is on the
right. Initial slice at approximately Talairach z = 9, �8, 8 mm
increments. There is no significant difference between these
two sets of maps.
Table 4 Volumetric data (least square means,mm3
� SEM)
Region Preterm n = 15 Term n = 22 P-value
Gray matter
L Frontal gray 114.1� 1.86 110.7� 1.49 0.17
R Frontal gray 114.4� 1.76 112.7� 1.41 0.47
L Temporal gray 62.1� 1.85 59.4� 1.48 0.28
R Temporal gray 60.6� 1.80 58.0� 1.44 0.28
L Parietal gray 69.3� 1.72 66.4� 1.38 0.21
R Parietal gray 69.3� 1.65 65.8� 1.32 0.11
L Occipital gray 37.9� 0.93 35.7� 0.75 0.09
R Occipital gray 36.6� 1.06 36.3� 0.85 0.81
L Deep gray 17.7� 0.40 19.7� 0.31 50.001
R Deep gray 17.3� 0.40 19.1� 0.31 0.002
White matter
L Frontal white 82.3� 1.94 87.7� 1.56 0.04
R Frontal white 86.9� 1.81 90.5� 1.45 0.14
L Temporal white 45.4� 1.68 49.8� 1.35 0.05
R Temporal white 44.4� 1.93 50.4� 1.55 0.02
L Parietal white 72.6� 1.45 76.4� 1.16 0.05
R Parietal white 71.0� 1.59 73.9� 1.27 0.16
L Occipital white 29.3� 0.98 28.8� 0.79 0.70
R Occipital White 27.5� 1.26 27.2� 1.01 0.87
L Deep white 22.7� 0.38 23.0� 0.31 0.48
R Deep white 22.5� 0.39 23.6� 0.31 0.04
CSF
L Ventricle CSF 7.10� 4.72 4.16� 1.33 0.0038
R Ventricle CSF 6.02� 3.10 4.10� 1.37 0.0425
6 | Brain 2009: Page 6 of 10 R. J. Schafer et al.
by guest on March 18, 2016
http://brain.oxfordjournals.org/D
ownloaded from
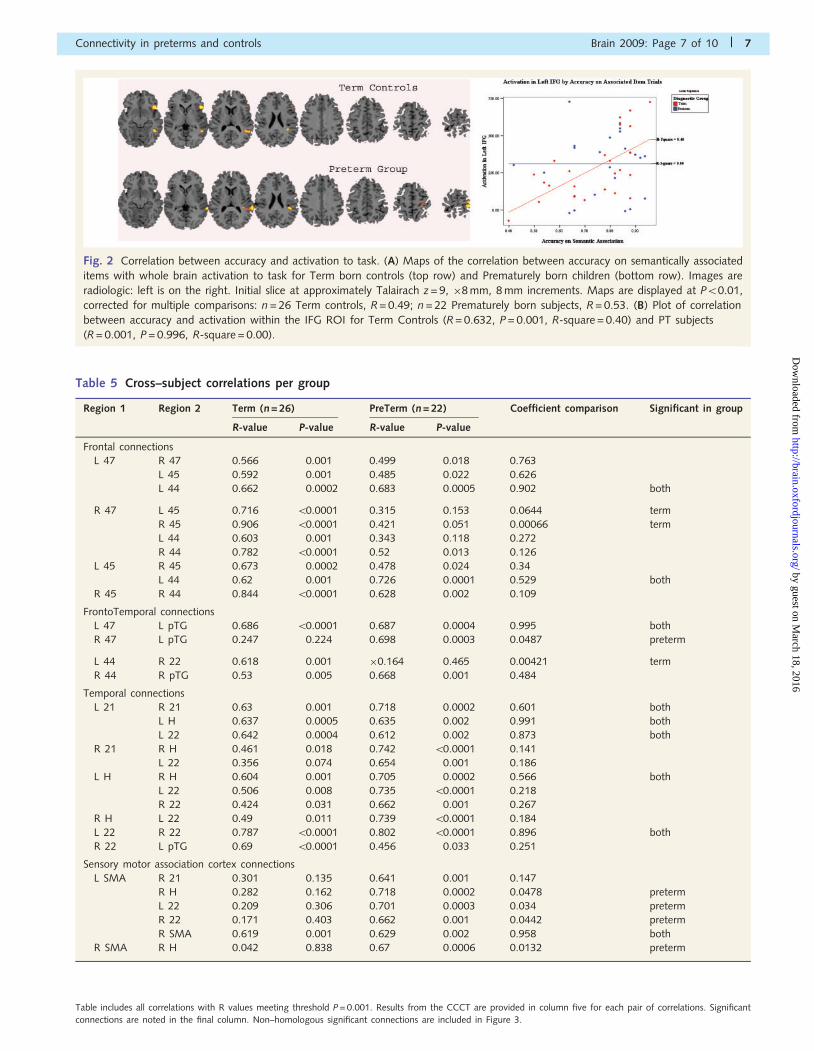
Fig. 2 Correlation between accuracy and activation to task. (A) Maps of the correlation between accuracy on semantically associated
items with whole brain activation to task for Term born controls (top row) and Prematurely born children (bottom row). Images are
radiologic: left is on the right. Initial slice at approximately Talairach z = 9, �8 mm, 8 mm increments. Maps are displayed at P50.01,
corrected for multiple comparisons: n = 26 Term controls, R = 0.49; n = 22 Prematurely born subjects, R = 0.53. (B) Plot of correlation
between accuracy and activation within the IFG ROI for Term Controls (R = 0.632, P = 0.001, R-square = 0.40) and PT subjects
(R = 0.001, P = 0.996, R-square = 0.00).
Table 5 Cross–subject correlations per group
Region 1 Region 2 Term (n = 26) PreTerm (n = 22) Coefficient comparison Significant in group
R-value P-value R-value P-value
Frontal connections
L 47 R 47 0.566 0.001 0.499 0.018 0.763
L 45 0.592 0.001 0.485 0.022 0.626
L 44 0.662 0.0002 0.683 0.0005 0.902 both
R 47 L 45 0.716 50.0001 0.315 0.153 0.0644 term
R 45 0.906 50.0001 0.421 0.051 0.00066 term
L 44 0.603 0.001 0.343 0.118 0.272
R 44 0.782 50.0001 0.52 0.013 0.126
L 45 R 45 0.673 0.0002 0.478 0.024 0.34
L 44 0.62 0.001 0.726 0.0001 0.529 both
R 45 R 44 0.844 50.0001 0.628 0.002 0.109
FrontoTemporal connections
L 47 L pTG 0.686 50.0001 0.687 0.0004 0.995 both
R 47 L pTG 0.247 0.224 0.698 0.0003 0.0487 preterm
L 44 R 22 0.618 0.001 �0.164 0.465 0.00421 term
R 44 R pTG 0.53 0.005 0.668 0.001 0.484
Temporal connections
L 21 R 21 0.63 0.001 0.718 0.0002 0.601 both
L H 0.637 0.0005 0.635 0.002 0.991 both
L 22 0.642 0.0004 0.612 0.002 0.873 both
R 21 R H 0.461 0.018 0.742 50.0001 0.141
L 22 0.356 0.074 0.654 0.001 0.186
L H R H 0.604 0.001 0.705 0.0002 0.566 both
L 22 0.506 0.008 0.735 50.0001 0.218
R 22 0.424 0.031 0.662 0.001 0.267
R H L 22 0.49 0.011 0.739 50.0001 0.184
L 22 R 22 0.787 50.0001 0.802 50.0001 0.896 both
R 22 L pTG 0.69 50.0001 0.456 0.033 0.251
Sensory motor association cortex connections
L SMA R 21 0.301 0.135 0.641 0.001 0.147
R H 0.282 0.162 0.718 0.0002 0.0478 preterm
L 22 0.209 0.306 0.701 0.0003 0.034 preterm
R 22 0.171 0.403 0.662 0.001 0.0442 preterm
R SMA 0.619 0.001 0.629 0.002 0.958 both
R SMA R H 0.042 0.838 0.67 0.0006 0.0132 preterm
Table includes all correlations with R values meeting threshold P = 0.001. Results from the CCCT are provided in column five for each pair of correlations. Significant
connections are noted in the final column. Non–homologous significant connections are included in Figure 3.
Connectivity in preterms and controls Brain 2009: Page 7 of 10 | 7
by guest on March 18, 2016
http://brain.oxfordjournals.org/D
ownloaded from

Gimenez et al., 2006; Nosarti et al., 2008), the PT children in our
study were found to have significant decreases in left frontal and
bilateral temporal white matter volumes when compared to term
controls. Second, despite the fact that both groups activated cortical
regions well-known to be associated with semantic processing, the
left IFG and MTG, correlations between activations and accurate
performance revealed group differences, including a correlation
only found for the PT children between task accuracy and activation
in the left SMA. Lastly, we observed differences in the connectivity
between the regions that were engaged by children in both groups
when accurately performing the task. Particularly, only in PT children
was activation in the temporal areas functionally connected with
activation in the SMA, and only in term-born children was activation
in the left IFG functionally connected with activation in right IFG and
right MTG.
The cross-subject correlation method employed here constitutes
an extension of previous fMRI studies of prematurely born sub-
jects that have mainly focussed on the comparison of activation
patterns between PT and term control groups. Using a measure of
network connectivity, we speculate functional recovery through
network innovation. Recovery in cognitive performance is often
associated with some form of neuro-anatomical compensation,
such as the recruitment of adjacent regions or homologues
(Perani et al., 2003; Saur et al., 2006) or completely distinct local-
izations (Peterson et al., 2002). The present work revealed a case
in which the PT children and the term control group did not sig-
nificantly differ in either task performance or in the group com-
posite localized BOLD response to task, but did so in the
functional connectivity of the regions of significant BOLD
response.
The examination of functional connectivity confirmed our
hypothesis that connectivity would reflect the left hemisphere
co-activation to task in left IFG and MTG observed in both
groups. Both groups evidenced functional connectivity between
left IFG in BA47 and the left pTG ROI that contains substantial
portions of left MTG. We conclude that the connection between
these two regions predominantly subserved the semantic task in
both groups consistent with the role of these areas across studies
of lexical semantics in adults (Friederici et al., 2000; Martin, 2003;
Noppeney et al., 2004). Yet clear differences in the network feed-
ing into and enhancing the activation in this circuit were observed
and these underlie the findings in Fig. 2. Specifically, in the term
control data, ROI significantly correlating with the left IFG–pTG
circuit are in right IFG and right MTG and are connected directly
with activation in left IFG; by comparison, in prematurely born
subjects, ROI significantly correlating with the left IFG–pTG circuit
include bilateral SMA which is directly connected not with left IFG,
but with the left temporal lobe. Thus our hypothesis concerning
SMA connectivity in the PT group was confirmed without excep-
tion. SMA appears to mediate connections between language
areas in the PT brain. We also identified a subset of frontal con-
nections available only to the term control group, consistent with
our expectations.
Since the groups did not differ in task performance or composite
BOLD activations to task, we interpret the differences in functional
connectivity in the language network recruited by the two groups
for task processing as a response to the structural distinctions in
cerebral white matter volumes that we report. Persistent structural
anomalies in the PT sample, evidenced in these volumetric differ-
ences, may prevent the formation of the parsimonious network
Fig. 3 Functional connectivity in each group. Cross-subject correlations between non-homologous regions and satisfying the threshold,
P = 0.001. R-values and P-values are reported in Table 5. Blue lines join regions significantly correlating in both groups. Red lines join
regions significantly correlating in a unique group.
8 | Brain 2009: Page 8 of 10 R. J. Schafer et al.
by guest on March 18, 2016
http://brain.oxfordjournals.org/D
ownloaded from
found in the term control children, so alternative pathways may be
recruited by PT children. This process of reorganization of func-
tional connectivity may explain the developmental delays observed
in the acquisition of language skills in the prematurely born (Ment
et al., 2003; Hack et al., 2005).
In addition to the distinctions in brain volumes, the two groups
of children differed in maternal education. While behavioural mea-
sures are known to correlate with maternal education, physiolog-
ical measures, such as measures of BOLD activation, are not. Our
analyses also demonstrated that there was no significant correla-
tion across subjects between BOLD activation and maternal edu-
cation. Thus it cannot be the case that maternal education is a
significant factor in the group differences in recruitment of SMA or
connections with left IFG during task performance.
The relationship suggested by our results between brain volume
differences, differences in functional connectivity in the language
network and language function in PT children supplements previ-
ous volumetric imaging studies that evaluated the cerebral struc-
tural sequelae of PT birth. This work has consistently reported
alterations in those regions subserving language, the left temporal
and frontal regions. FMRI studies of auditory and phonologic pro-
cessing in older PT subjects with thinning of the corpus callosum
have demonstrated transfer of function to the right STG and right
superior frontal gyrus when the PT groups were compared with
term controls (Santhouse et al., 2002; Rushe et al., 2004). Our
previous fMRI study of semantic processing in PT subjects at age
12 years suggested that PT and term control children demon-
strated positive BOLD signals for the same regions during an audi-
tory semantic task but that the PT group showed lower BOLD
signals for each region when compared to term controls (Ment
et al., 2006). This finding would be consistent either with a PT
network consisting of fewer correlating regions than the term con-
trol network or with indirectly or less efficiently connected regions,
such as the network we observe in which correlations to areas
showing the greatest activation to task are mediated through
SMA.
The limitations of this study include the moderate sample size
and the limited numbers of tests administered that assess semantic
processing. Direct assessment of temporal connectivity using tem-
poral BOLD correlations within subjects has shown sensitivity to
reading performance in normal adults with varied reading abilities
(Hampson et al., 2006). In future studies we plan to assess con-
nectivity in PT individuals using this emerging methodology.
Functional connectivity can also be related to assessments of the
underlying white matter axonal integrity through diffusion tensor
imaging and such studies are underway in our laboratory. These
studies will allow us to continue to examine the relationship
between microstructural connectivity and those cerebral structural
abnormalities associated with PT birth (Kesler et al., 2008).
Although the relation between observed connectivity and later
neurologic outcome has not been investigated, BOLD signal
changes in PT children in response to language, memory and
executive function are just beginning to be explored. This work
establishes that functional connectivity studies may reveal differ-
ences in the networks engaged in processing and how the nodes
within these networks interact, and suggests that the dynamic
nature of neural connectivity can intercede for recovery in the
PT brain.
AcknowledgementThis work was supported by NS 27116.
ReferencesAllin M, Nosarti C. Premature birth and the adult brain. Italian J
Pediatrics 2005; 31: 38–43.Constable RT, Ment L, Vohr B, Kesler S, Fulbright R, Lacadie C, et al.
Prematurely born children demonstrate white matter microstructural
differences at age 12 years relative to term controls: an investigation
of group and gender effects. Pediatrics 2008; 121: 1–49.
Cox RW. AFNI: software for analysis and visualization of functional
magnetic resonance neuroimages. Comput Biomed Res 1996; 29:
162–73.Friederici AD, Opitz B, von Cramon DY. Segregating semantic and syn-
tactic aspects of processing in the human brain: an fMRI investigation
of different word types. Cereb Cortex 2000; 10: 698–705.
Friston KJ, Holmes AP, Poline JB, Grasby PJ, Williams SC, Frackowiak RS,
et al. Analysis of fMRI time-series revisited. Neuroimage 1995; 2:
45–53.
Gimenez M, Junque C, Narberhaus A, Bargallo N, Botet F, Mercader JM.
White matter volume and concentration reductions in adolescents with
history of very preterm birth: a voxel-based morphometry study.
NeuroImage 2006; 32: 1485–98.
Greicius MD, Krasnow B, Reiss AL, Menon V. Functional connectivity in
the resting brain: a network analysis of the default mode hypothesis.
Proc Natl Acad Sci USA 2003; 100: 253–8.
Hack M, Taylor HG, Drotar D, Schluchter M, Cartar L, Wilson-
Costello D, et al. Poor predictive validity of the Bayley scales of
infant development for cognitive function of extremely low birth
weight children at school age. Pediatrics 2005; 116: 333–41.
Hampson M, Tokoglu F, Sun Z, Schafer RJ, Skudlarski P, Gore JC, et al.
Connectivity-behavior analysis reveals that functional connectivity
between left BA39 and Broca’s area varies with reading ability.
Neuroimage 2006; 31: 513–9.Hinkle DE, Wiersma W, Jurs SG. Applied statistics for the behavioral
sciences. Boston: Houghton Mifflin Company; 1988.Horwitz B, Friston KJ, Taylor JG. Neural modeling and functional brain
imaging: an overview. Neural Netw 2000; 13: 829–46.Horwitz B, Rumsey JM, Donohue BC. Functional connectivity of the
angular gyrus in normal reading and dyslexia. Proc Natl Acad Sci
USA 1998; 95: 8939–44.
Kesler SR, Ment LR, Vohr B, Pajot SK, Schneider KC, Katz KH, et al.
Volumetric analysis of regional cerebral development in preterm chil-
dren. Pediatr Neurol 2004; 31: 318–25.
Kesler SR, Reiss AL, Vohr B, Watson C, Schneider KC, Katz KH, et al.
Brain volume reductions within multiple cognitive systems in male
preterm children at age twelve. J Pediatr 2008; 152: 513–20, 520 e1.
Lodygensky GA, Rademaker KJ, Zimine S, Gex-Fabry M, Lieftink AF,
Lazeyras F, et al. Structural and functional brain development after
hydrocortisone treatment for neonatal chronic lung disease.
Pediatrics 2005; 116: 1–7.
Macwhinney B, Cohen J, Provost J. The PsyScope experiment-building
system. Spat Vis 1997; 11: 99–101.
Martin RC. Language processing: functional organization and neuroana-
tomical basis. Annu Rev Psychol 2003; 54: 55–89.
Ment LR, Oh W, Ehrenkranz RA, Philip AG, Vohr B, Allan W, et al. Low-
dose indomethacin and prevention of intraventricular hemorrhage: a
multicenter randomized trial. Pediatrics 1994; 93: 543–50.
Connectivity in preterms and controls Brain 2009: Page 9 of 10 | 9
by guest on March 18, 2016
http://brain.oxfordjournals.org/D
ownloaded from

Ment LR, Constable RT. Injury and recovery in the developing brain:evidence from functional MRI studies of prematurely born children.
Nat Clin Pract Neurol 2007; 3: 558–71.
Ment LR, Peterson BS, Vohr B, Allan W, Schneider KC, Lacadie C, et al.
Cortical recruitment patterns in children born prematurely comparedwith control subjects during a passive listening functional magnetic
resonance imaging task. J Pediatr 2006; 149: 490–8.
Ment LR, Vohr B, Allan W, Katz KH, Schneider KC, Westerveld M, et al.
Change in cognitive function over time in very low-birth-weightinfants. Jama 2003; 289: 705–11.
Mullen KM, Schafer RJ, Vohr B, Katz KH, Schneider KC, Constable RT,
et al. Gender, birth weight and neural connectivity: preterm subjects atage 16 years. Honolulu, Hawaii: Pediatric Academic Societies & Asian
Society for Pediatric Research Joint Meeting; 2008.
Noppeney U, Phillips J, Price C. The neural areas that control the retrieval
and selection of semantics. Neuropsychologia 2004; 42: 1269–80.Nosarti C, Giouroukou E, Healy E, Rifkin L, Walshe M, Reichenberg A,
et al. Grey and white matter distribution in very preterm adolescents
mediates neurodevelopmental outcome. Brain 2008; 181: 205–17.
Papademetris X, Jackowski AP, Schultz RT, Staib LH, Duncan JS.Integrated intensity and point-feature nonrigid registration. Lecture
notes in computer science 2004; 3216: 763–70.
Papademetris X, Jackowski M, Rajeevan N, DiStasio M, Okuda H,
Constable RT, et al. BioImage suite: an integrated medical image ana-lysis suite: an update. SC/NA-MIC Workshop on Open Science at 9th
MICCAI Conference. Copenhagen, 2006.
Peabody. Peabody picture vocabulary test-revised. Circle Pines, NM:American Guidance Service; 1981.
Perani D, Cappa SF, Tettamanti M, Rosa M, Scifo P, Miozzo A, et al.
A fMRI study of word retrieval in aphasia. Brain Lang 2003; 85:
357–68.Peterson BS, Vohr B, Cannistraci CJ, Schneider KC, Katz KH,
Westerveld M, et al. Regional brain volume abnormalities and long-
term cognitive outcome in preterm infants. JAMA 2000a; 284:
1939–47.Peterson BS, Vohr B, Staib LH, Cannistraci CJ, Dolberg A, Schneider KC,
et al. Regional brain volume abnormalities and long-term cognitive
outcome in preterm infants. JAMA 2000b; 284: 1939–47.Peterson BS, Vohr BR, Kane M, Whalen DH, Schneider KC, Katz KH,
et al. A functional MRI study of language processing and
cognitive outcome in prematurely born children. Pediatrics 2002;110: 1153–62.
Pugh KR, Mencl WE, Shaywitz BA, Shaywitz SE, Fulbright RK,
Constable RT, et al. The angular gyrus in developmental
dyslexia: task-specific differences in functional connectivity within pos-terior cortex. Psychol Sci 2000; 11: 51–6.
Raichle ME, Snyder AZ. A default mode of brain function: a brief history
of an evolving idea. Neuroimage 2007; 56: 171–84.
Rushe TM, Rifkin L, Stewart AL, Townsend JP, Roth SC, Wyatt JS, et al.Neuropsychological outcome at adolescence of very preterm birth and
its relation to brain structure. Dev Med Child Neurol 2001; 43:
226–33.Rushe TM, Temple CM, Rifkin L, Woodruff PWR, Bullmore ET, Stewart AL,
et al. Lateralisation of language function in young adults born very
preterm. Arch Dis Child Fetal Neonatal Ed 2004; 89: F112–8.
Saavalainen P, Luoma L, Bowler D, Timonen T, Maatta S, Laukkanen E,et al. Naming skills of children born preterm in comparison with their
term peers at the ages of 9 and 16 years. Dev Med Child Neurol 2006;
48: 28–32.
Saigal S, Doyle LW. An overview of mortality and sequelae of pretermbirth from infancy to adulthood. Lancet 2008; 371: 261–9.
Saigal S, Stoskopf B, Streiner DL, Boyle M, Pinelli J, Paneth N, et al.
Transition of extremely low-birth-weight infants from adolescence to
young adulthood. JAMA 2006; 295: 667–75.Santhouse AM, Ffytche DH, Howard RJ, Williams SCR, Stewart AL,
Rooney M, et al. The functional significance of perinatal corpus callosum
damage: an fMRI study in young adults. Brain 2002; 125: 1782–92.Saur D, Lange R, Baumgaertner A, Schraknepper V, Willmes K,
Rijntjes M, et al. Dynamics of language reorganization after stroke.
Brain 2006; 129: 1371–84.
Semel E, Wiig EH, Secord WA. Clinical evaluation of language funda-mentals. New York: The Psychological Corporation Harcourt Brace &
Company, 1995.
Vincent JL, Patel GH, Fox MD, Snyder AZ, Baker JT, Van Essen DC, et al.
Intrinsic functional architecture in the anaesthetized monkey brain.Nature 2007; 447: 83–6.
Wechsler D. Wechsler intelligence scale for children, Third Edition.
New York: The Psychological Corporation Harcourt Brace Co., 1991.Wiederholt JL, Blalock G. Gray silent reading tests. Austin, Texas: PRO-
ED, Inc., 2000.
10 | Brain 2009: Page 10 of 10 R. J. Schafer et al.
by guest on March 18, 2016
http://brain.oxfordjournals.org/D
ownloaded from