Alpha and beta diversity of plants and animals along a tropical land-use gradient
15
Ecological Applications, 19(8), 2009, pp. 2142–2156 Ó 2009 by the Ecological Society of America Alpha and beta diversity of plants and animals along a tropical land-use gradient MICHAEL KESSLER, 1,2,10 STEFAN ABRAHAMCZYK, 1,2,3 MERIJN BOS, 3,4 DAMAYANTI BUCHORI, 5 DADANG DWI PUTRA, 6 S. ROBBERT GRADSTEIN, 1 PATRICK HO ¨ HN, 3 JU ¨ RGEN KLUGE, 1 FRIEDERIKE OREND, 1 RAMADHANIEL PITOPANG, 7 SHAHABUDDIN SALEH, 7 CHRISTIAN H. SCHULZE, 8 SIMONE G. SPORN, 1 INGOLF STEFFAN-DEWENTER, 3,9 SRI S. TJITROSOEDIRDJO, 5 AND TEJA TSCHARNTKE 3 1 Albrecht-von-Haller-Institute of Plant Sciences, University of Go ¨ttingen, 37073 Go ¨ttingen, Germany 2 Systematic Botany, University of Zu ¨rich, Zollikerstrasse 107, CH-8008 Zu ¨rich, Switzerland 3 Agroecology, University of Go ¨ttingen, 37073 Go ¨ttingen, Germany 4 Louis Bolk Institute, Hoofdstraat 24, 3972 LA Driebergen, The Netherlands 5 Faculty of Biology, Bogor Agricultural University, Jalan Padjajaran, 16144 Bogor, Indonesia 6 Celebes Bird Club, c/o Balai Penelitian dan Pengembangan Zoologi, Puslitbang Biologi—LIPI, Jl. Raya Bogor Jakarta Km 46, 16911 Gibinong, Indonesia 7 Faculty of Agriculture, Tadulako University, Palu, Indonesia 8 Department of Population Ecology, Faculty of Life Sciences, University of Vienna, Althanstraße 14, A-1090 Vienna, Austria 9 Department of Animal Ecology I, University of Bayreuth, Universita ¨tsstrasse 30, 95440 Bayreuth, Germany Abstract. Assessing the overall biological diversity of tropical rain forests is a seemingly insurmountable task for ecologists. Therefore, researchers frequently sample selected taxa that they believe reflect general biodiversity patterns. Usually, these studies focus on the congruence of a diversity (the number of species found per sampling unit) between taxa rather than on b diversity (turnover of species assemblages between sampling units). Such approaches ignore the potential role of habitat heterogeneity that, depending on the taxonomic group considered, can greatly enhance b diversity at local and landscape scales. We compared a and b diversity of four plant groups (trees, lianas, terrestrial herbs, epiphytic liverworts) and eight animal groups (birds, butterflies, lower canopy ants, lower canopy beetles, dung beetles, bees, wasps, and the parasitoids of the latter two) at 15 sites in Sulawesi, Indonesia, that represented natural rain forest and three types of cacao agroforests differing in management intensity. In total, we recorded 863 species. Patterns of species richness per study site varied strongly between taxonomic groups. Only 13–17% of the variance in species richness of one taxonomic group could be predicted from the species richness of another, and on average 12–18% of the variance of b diversity of a given group was predicted by that in other groups, although some taxon pairs had higher values (up to 76% for wasps and their parasitoids). The degree of congruence of patterns of a diversity was not influenced by sampling completeness, whereas the indicator value for b diversity improved when using a similarity index that accounts for incomplete sampling. The indication potential of a diversity for b diversity and vice versa was limited within taxa (7–20%) and virtually nil between them (0–4%). We conclude that different taxa can have largely independent patterns of a diversity and that patterns of b diversity can be more congruent. Thus, conservation plans on a landscape scale need to put more emphasis on the high heterogeneity of agroforests and the overarching role of b diversity shaping overall diversity patterns. Key words: agroforests; biodiversity indication; community similarity; indicator species; Indonesia; species richness; Sulawesi, Indonesia; tropical rain forest. INTRODUCTION The immense diversity of tropical plant and animal communities faces ever-increasing risk of extinction (e.g., Jetz et al. 2007), but our inadequate taxonomic knowledge of tropical taxa continues to limit the scope and extent of biodiversity assessments. Accordingly, researchers frequently employ selected surrogate taxa believed to reflect overall levels of biodiversity (Pearson 1994, Prendergast 1997, Pharo et al. 1999, Rodrigues and Brooks 2007). Such surrogate taxa can be flagship species (chosen for their charisma), focal taxa (individ- ual species of particular conservation concern), keystone species (with high ecological impact), umbrella species (requiring large areas of habitat, thereby providing space for other taxa), or indicator taxa (with the same habitat requirements as the species or communities that they indicate) (e.g., Paine 1969, Wilcox 1984, Landres et al. 1988, Mittermeier 1988, Lambeck 1997, Simberloff Manuscript received 11 June 2008; revised 5 March 2009; accepted 6 March 2009. Corresponding Editor: H. Hillebrand. 10 E-mail: [email protected] 2142
-
Upload
unwmataram -
Category
Documents
-
view
2 -
download
0
Transcript of Alpha and beta diversity of plants and animals along a tropical land-use gradient
Ecological Applications, 19(8), 2009, pp. 2142–2156� 2009 by the Ecological Society of America
Alpha and beta diversity of plants and animalsalong a tropical land-use gradient
MICHAEL KESSLER,1,2,10 STEFAN ABRAHAMCZYK,1,2,3 MERIJN BOS,3,4 DAMAYANTI BUCHORI,5 DADANG DWI PUTRA,6
S. ROBBERT GRADSTEIN,1 PATRICK HOHN,3 JURGEN KLUGE,1 FRIEDERIKE OREND,1 RAMADHANIEL PITOPANG,7
SHAHABUDDIN SALEH,7 CHRISTIAN H. SCHULZE,8 SIMONE G. SPORN,1 INGOLF STEFFAN-DEWENTER,3,9
SRI S. TJITROSOEDIRDJO,5 AND TEJA TSCHARNTKE3
1Albrecht-von-Haller-Institute of Plant Sciences, University of Gottingen, 37073 Gottingen, Germany2Systematic Botany, University of Zurich, Zollikerstrasse 107, CH-8008 Zurich, Switzerland
3Agroecology, University of Gottingen, 37073 Gottingen, Germany4Louis Bolk Institute, Hoofdstraat 24, 3972 LA Driebergen, The Netherlands
5Faculty of Biology, Bogor Agricultural University, Jalan Padjajaran, 16144 Bogor, Indonesia6Celebes Bird Club, c/o Balai Penelitian dan Pengembangan Zoologi, Puslitbang Biologi—LIPI, Jl. Raya Bogor Jakarta Km 46,
16911 Gibinong, Indonesia7Faculty of Agriculture, Tadulako University, Palu, Indonesia
8Department of Population Ecology, Faculty of Life Sciences, University of Vienna, Althanstraße 14, A-1090 Vienna, Austria9Department of Animal Ecology I, University of Bayreuth, Universitatsstrasse 30, 95440 Bayreuth, Germany
Abstract. Assessing the overall biological diversity of tropical rain forests is a seeminglyinsurmountable task for ecologists. Therefore, researchers frequently sample selected taxa thatthey believe reflect general biodiversity patterns. Usually, these studies focus on thecongruence of a diversity (the number of species found per sampling unit) between taxarather than on b diversity (turnover of species assemblages between sampling units). Suchapproaches ignore the potential role of habitat heterogeneity that, depending on thetaxonomic group considered, can greatly enhance b diversity at local and landscape scales. Wecompared a and b diversity of four plant groups (trees, lianas, terrestrial herbs, epiphyticliverworts) and eight animal groups (birds, butterflies, lower canopy ants, lower canopybeetles, dung beetles, bees, wasps, and the parasitoids of the latter two) at 15 sites in Sulawesi,Indonesia, that represented natural rain forest and three types of cacao agroforests differing inmanagement intensity. In total, we recorded 863 species. Patterns of species richness per studysite varied strongly between taxonomic groups. Only 13–17% of the variance in speciesrichness of one taxonomic group could be predicted from the species richness of another, andon average 12–18% of the variance of b diversity of a given group was predicted by that inother groups, although some taxon pairs had higher values (up to 76% for wasps and theirparasitoids). The degree of congruence of patterns of a diversity was not influenced bysampling completeness, whereas the indicator value for b diversity improved when using asimilarity index that accounts for incomplete sampling. The indication potential of a diversityfor b diversity and vice versa was limited within taxa (7–20%) and virtually nil between them(0–4%). We conclude that different taxa can have largely independent patterns of a diversityand that patterns of b diversity can be more congruent. Thus, conservation plans on alandscape scale need to put more emphasis on the high heterogeneity of agroforests and theoverarching role of b diversity shaping overall diversity patterns.
Key words: agroforests; biodiversity indication; community similarity; indicator species; Indonesia;species richness; Sulawesi, Indonesia; tropical rain forest.
INTRODUCTION
The immense diversity of tropical plant and animal
communities faces ever-increasing risk of extinction
(e.g., Jetz et al. 2007), but our inadequate taxonomic
knowledge of tropical taxa continues to limit the scope
and extent of biodiversity assessments. Accordingly,
researchers frequently employ selected surrogate taxa
believed to reflect overall levels of biodiversity (Pearson
1994, Prendergast 1997, Pharo et al. 1999, Rodrigues
and Brooks 2007). Such surrogate taxa can be flagship
species (chosen for their charisma), focal taxa (individ-
ual species of particular conservation concern), keystone
species (with high ecological impact), umbrella species
(requiring large areas of habitat, thereby providing
space for other taxa), or indicator taxa (with the same
habitat requirements as the species or communities that
they indicate) (e.g., Paine 1969, Wilcox 1984, Landres et
al. 1988, Mittermeier 1988, Lambeck 1997, Simberloff
Manuscript received 11 June 2008; revised 5 March 2009;accepted 6 March 2009. Corresponding Editor: H. Hillebrand.
10 E-mail: [email protected]
2142
1998, Leader-Williams and Dublin 2000, Bond 2001).
Recent reviews however, concluded that it is not yet
possible to decide when and where surrogate approaches
are effective, how surrogate species should best be
selected, and how to assess the chances of successful
surrogacy (Favreau et al. 2006, Wolters et al. 2006,
Rodrigues and Brooks 2007).
For selecting indicator taxa, the basic approach is to
compare the degree to which patterns of diversity and
community composition coincide or differ between taxa
(Landres et al. 1988, Lawton et al. 1998, Barlow et al.
2007). The congruence of such patterns can be assessed
at various spatial scales and levels of abstraction
(Whittaker 1960, 1972, Hubbell 2001). The classical
distinction is between a diversity derived from species
richness at a given site or spatial level and b diversity
derived from changes in species composition from one
site or spatial level to another (Whittaker 1960, 1972,
Cody 1986, Crist et al. 2003). Most of the diversity at
larger spatial scales is made up of b diversity (Crist et al.
2003, Crist and Veech 2006, Gabriel et al. 2006).
Moreover, a and b diversity may reveal contrasting
spatiotemporal patterns (Tylianakis et al. 2005), and the
extent to which a diversity can predict b diversity can
differ between taxonomic groups. Hence, comparing aand b diversity at local and landscape scales is an
important yet little-understood area of basic and applied
ecological research.
Although the basic conceptual distinction between aand b diversity is well established in the ecological
literature, the analytical problems that arise from this
distinction are complex and not yet fully explored,
especially in the context of biodiversity conservation.
First, levels of diversity can be measured at different
spatial scales, which may require partitioning of the
diversity (Whittaker 1960, 1972, Crist et al. 2003, Crist
and Veech 2006). Second, a fundamental complication
arises from the fact that a diversity is assessed based on
sampling units whereas b diversity is calculated based on
differences between sampling units (e.g., Legendre et al.
2005, Tuomisto and Ruokolainen 2006, Jost 2007).
Accordingly, the number and quality of data points
differ greatly. For example, in a study of 10 sites, 10 data
points can be obtained for a diversity and 45 data points
(pairwise similarity values) for b diversity. At the level of
a diversity, species identities are irrelevant during data
analysis, whereas at the level of b diversity it is the
difference between the identities that is taken into
account. At the level of a diversity, regression or
correlation analyses as well as canonical analyses may
be adequate (Magurran 2004). In contrast, at the level of
b diversity, methods for comparing matrices have to be
applied (e.g., the Mantel test) (Legendre and Legendre
1998). Thus, variances analyzed at these different levels
of abstraction are not comparable and there is no simple
relationship between them (Legendre et al. 2005),
although numerous previous studies have confused them
(Tuomisto and Ruokolainen 2006).
Within taxonomic groups, the conclusions drawn
from patterns in a and b diversity can be similar
(Clough et al. 2007), but may also differ greatly
(Tylianakis et al. 2005) because two sites with equal
species richness can share between all and none of their
species. Local species richness of mobile taxonomic
groups may approach regional species richness (Oliver et
al. 1998), whereas assemblages of less mobile species are
expected to differ between sites, leading to an increase in
species turnover and, consequently, in regional diversity.
Ultimately, the assumption that patterns for a and bdiversity change in a similar way, which is underlying
many biodiversity assessments, has been rarely tested
and may not hold true (Tylianakis et al. 2005).
In the tropics, the congruence of diversity patterns
between different taxa has mostly been studied across
large geographical regions (e.g., Beccaloni and Gaston
1995, Carroll and Pearson 1998, Oliver et al. 1998,
Myers et al. 2000, Moore et al. 2002, Duque et al. 2005,
Tushabe et al. 2006, Larsen et al. 2007, McKnight et al.
2007). Only four studies have compared small-scale
changes in taxonomically diverse groups along gradients
of land use within tropical landscapes (Lawton et al.
1998, Schulze et al. 2004, Barlow et al. 2007, Noske et al.
2008; see Plate 1). This paucity of studies is largely due
to the difficulty of sampling and identifying the
enormous biodiversity of tropical forests. As in most
assessments of indicator taxa (Wolters et al. 2006), two
of these studies focused only on the congruence of adiversity (Lawton et al. 1998, Schulze et al. 2004).
Additionally, Barlow et al. (2007) and Noske et al.
(2008) also assessed congruencies between patterns of bdiversity of various taxa along land-use gradients and
found higher congruence of b diversity than of adiversity between taxa. However, their analyses were
based on observed data for a diversity and a similarity
matrix for b diversity and are therefore statistically
incomparable. Furthermore, none of these studies
compared a diversity with b diversity within taxa.
In the present study, we linked a and b diversity of
four plant groups (trees, lianas, terrestrial herbs,
epiphytic liverworts) and eight animal groups (birds,
butterflies, lower canopy ants, lower canopy beetles,
dung beetles, bees, wasps, and the parasitoids of the
latter two) at 15 sites in natural rain forest and in three
types of cacao agroforests differing in management in
Sulawesi, Indonesia. For a direct comparison of a and bdiversity, we analyzed a diversity not only with linear
regressions, but also by comparing differences in species
numbers, a level we called Da (Appendix A), an additive
analogue to the factorial similarity in species composi-
tion used in analyses of b diversity. Furthermore,
because sampling is typically incomplete in species-rich
tropical communities (Lawton et al. 1998), we compared
observed species richness and similarity as well as
estimated species richness and similarity indices (Colwell
and Coddington 1994).
December 2009 2143TROPICAL a AND b DIVERSITY
We focused our study on plants and insects as
potential biological indicator taxa because they repre-
sent ;80% of all described species (Herrera and Pellmyr
2002) and determine important ecosystem processes
(Loreau et al. 2001, 2003, Kremen 2005). In particular,
because trees are the main structural elements of forests
and represent crucial food resources for many verte-
brates and insects (Daniels et al. 1992, Davis and Sutton
1998, Fermon et al. 2000, Greenberg et al. 2000, Willott
et al. 2000, Green et al. 2005), they are commonly used
to determine overall forest biodiversity (e.g., Oliver et al.
1998, Williams-Linera et al. 2005). Birds were included
because they are the best-known major group of
organisms and are much-used biodiversity indicators
(Garson et al. 2002, Schulze et al. 2004, Jetz et al. 2007).
By comparing the predictive values of a, Da, and bdiversity of floral and faunal groups, we provide basis
data for the use of indicator taxa in the design of policies
that aim at biodiversity conservation in tropical
landscapes.
METHODS
Study area and site selection
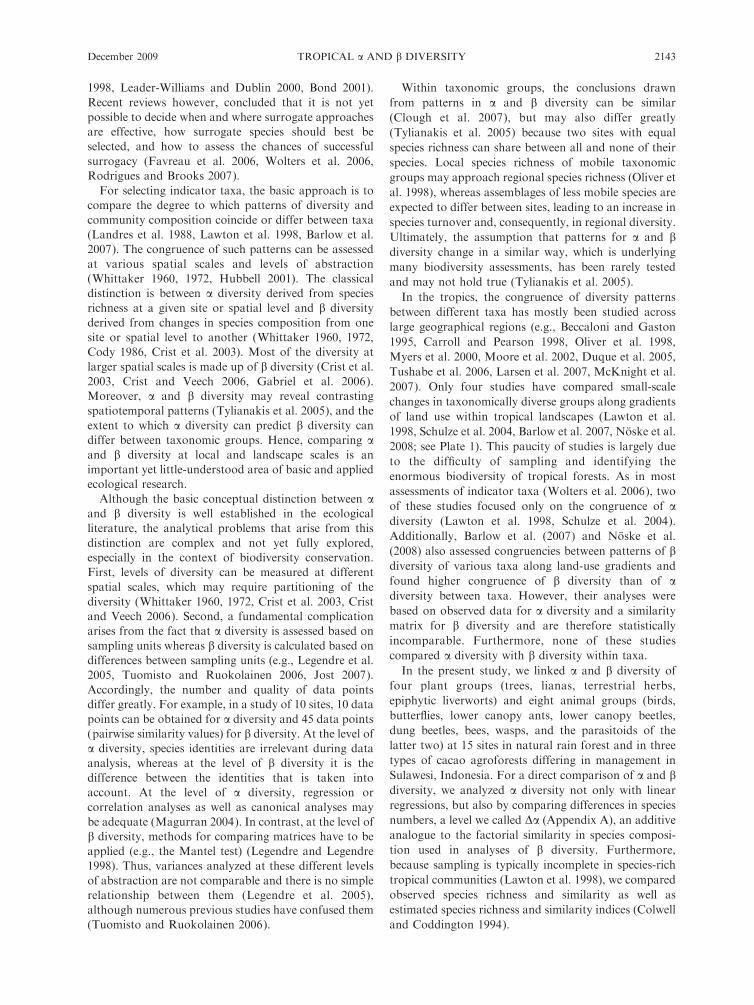
The study took place in an area of ;10 km2 in and
around the village of Toro in the Kulawi Valley, Central
Sulawesi, Indonesia (183002400 S, 1208201100 E, 800–900 m
above sea level; Fig. 1). Toro is located at the western
border of the 231 000-ha Lore Lindu National Park,
;100 km south of Palu, the capital city of Central
Sulawesi. The region has an annual temperature of 24.08
6 0.168C (mean 6 SE) and a monthly rainfall of 143.7
6 22.74 mm. There are no clear seasonal precipitation
fluctuations. The natural vegetation of the National
Park around the village is submontane rain forest.
The agricultural landscape in the region is highly
heterogeneous, consisting of a patchy mosaic of pasture,
hedges, and cacao-dominated agroforests, which is
typical for the region. Cacao production in the region
increased strongly in the 1990s when large areas of
coffee agroforest were converted into cacao agroforests
(Steffan-Dewenter et al. 2007). Cacao agroforests in the
FIG. 1. Location of the study sites in mature forest (MF) and different agroforestry systems (AN, agroforest with natural shadetrees; AD, agroforest with diverse planted shade trees; AF, agroforest with few planted shade tree species) around Toro Village inthe Kulawi Valley, Central Sulawesi, Indonesia. The inset shows the location of the island of Sulawesi and of the study region(star).
MICHAEL KESSLER ET AL.2144 Ecological ApplicationsVol. 19, No. 8
Toro village are owned and managed by small-scale
farmers. Shade tree management in the region is
dynamic and farmers tend to remove shade trees in
mature agroforestry systems to increase cacao produc-
tion (Steffan-Dewenter et al. 2007).
We defined a priori four habitat types with a gradient
of shade tree diversity (Gradstein et al. 2007). (1)
Mature forest sites (MF sites) were selected close to the
village, but within the national park, at least 300 m away
from forest sites where selective logging occurred, and
representative of the submontane forest in the area
(Kessler et al. 2005). In the selected sites minor rattan
extraction occurred. (2) We chose cacao agroforests with
diverse, natural shade trees (AN sites), retained after
thinning of the previous forest cover and underplanted
with cacao trees and few fruit trees. These sites had a
long history of cultivation (approximately 20–40 years,
converted from coffee to cacao agroforest approximate-
ly 10 years ago). These agroforests still had high
numbers of native shade trees, including some endemic
species. (3) We selected cacao agroforests with shade tree
stands dominated by various species of planted shade
trees (AD sites). These sites had a shorter history of
cultivation between 15 and 20 years (cacao cultivation
since approximately 10 years ago, sometimes converted
from coffee agroforests), and the majority of the former
forest canopy trees were replaced by various planted
fruit and timber trees that provided the owners with
non-market products. Among these trees were some
native species, including a few endemics. (4) Cacao
agroforests with a low diversity of planted shade trees
(AF sites) had a history of cultivation after a clearcut
12–30 years ago (converted 4–12 years ago from coffee
plantations, rice, or cornfields). Management of these
agroforests was aimed at maximum cacao productivity.
Shade was provided predominantly by the nonindige-
nous leguminous trees Gliricidia sepium (Jacq.) Walp.
and Erythrina subumbrans Merr., which are nitrogen-
fixing. Few native timber or fruit tree species were also
grown, none of which were endemic.
We selected four replicates of each of the four habitat
types, except for AN, where one plot had to be excluded
from the analysis because the local owner cut many of
the shade trees before our sampling was completed.
Agroforest sites were selected based on the age of the
cacao trees, which was at all sites between 4 and 17
years. At the time of this study, agroforestry was non-
intensive in each site, with little use of fertilizers and
pesticides. Farmers regularly pruned trees and weeded
the plantations (two to four times per year).
The minimum distance between study sites was 300 m
and the maximum distance was ;5 km. All sites were
between 850 m and 1100 m above sea level. The
agroforests did not have sharp borders with other
habitat types, but gradually changed into other forms
of land use and at the landscape scale formed a
continuous band along the forest margin. Boundaries
between agroforests were based on ownership rather
than on any physical boundaries. We marked core areas
of 503 50 m2 in the middle of each site, whose land use
and shade-tree composition was as constant as possible.
Sites belonging to the different habitat types were
geographically interspersed so that none of the individ-
ual habitat types were spatially clustered. Geographical
distance between sites was calculated as the linear
distance between the study plots based on GPS readings
and was log-transformed prior to analysis.
Species collection and determination
Trees.—Each plot was subdivided into 25 subplots of
10 3 10 m2. Within each subplot all trees with diameter
at breast height (dbh; measured at 1.3 m above the
ground surface) �10 cm were mapped and individually
numbered with aluminum tags, their dbh was measured,
and their trunk height and total height were estimated.
Specimens of all recognizable morphospecies of trees
were collected in sets of at least seven duplicates.
Identification of the plant specimens was done by R.
Pitopang, partly in collaboration with Dr. P. J. A.
Keßler (Leiden, Holland), at Herbarium Celebense,
CEB (Universitas Tadulako, Palu) and Herbarium
Bogoriense, BO (Bogor). Vouchers were deposited in
the herbaria BIOT, BO, CEB, GOET, and L. Specimens
that could not reliably be named were grouped into
morphospecies.
Lianas and herbs.—In each study plot of 50350 m2 10
subplots of 23 2 m2 each were randomly placed. Within
these, all herb and liana species were inventoried,
collected, and determined as detailed for the trees.
Epiphytic liverworts from lower canopy trees.—Two
trees with a height up to 8 m, a dbh ranging between 20
and 60 cm, and comparable bark texture were selected in
each study plot. In the agroforest sites these require-
ments for tree structure were fulfilled by cacao trees and
in natural forest sites by trees in the understory. Each
tree was divided into zone 1 (tree base up to the first
ramification), zone 2 (inner crown), and zone 3 (outer
crown), according to modified Johansson zones for
small trees (Johansson 1974). Within subplots of 200
cm2, liverworts were sampled from each cardinal
direction in all three zones. The identification was
carried out by M. Burghardt, S. R. Gradstein, and
S. G. Sporn (Gottingen, Germany). Vouchers were
deposited in CEB, GOET, and L. Specimens that could
not reliably be named were sorted to morphospecies.
Birds.—In February and March 2007, each plot was
visited on two mornings from 05:30 to 10:30. Birds were
recorded visually and acoustically and by systematic
tape recordings (Parker 1991, Abrahamczyk et al. 2008).
For every species we recorded the number of individuals
present simultaneously in the plot. During the second
visit, only additional records (new species or more
individuals of the same species) were considered. Species
flying only above the canopy such as swifts (Apodidae)
and raptors were excluded from the analysis. For
taxonomy we followed Coates and Bishop (1997).
December 2009 2145TROPICAL a AND b DIVERSITY
Butterflies.—Butterflies were captured alive in traps
baited with rotten mashed bananas. A detailed descrip-
tion of the trap design can be found in Daily and Ehrlich
(1995). Traps were suspended from tree branches with
strings ;1.5 m above the ground. To prevent ants from
entering the traps, branches touching the traps were
removed and the string was prepared with sticky glue.
At each location four traps were set up on the corners of
each study plot. Trapping was conducted in March
2007, with nine days of trapping per study site. The
majority of specimens could be identified in the field
and, therefore, trapped specimens were released imme-
diately afterwards. To avoid pseudoreplicates all but-
terflies were marked with a number on their forewing.
Butterflies were identified according to Aoki et al.
(1982), D’Abrera (1985), Tsukada et al. (1985), Tsukada
(1991), and Vane-Wright and Fermon (2003). Butterfly
communities are known to vary seasonally (Barlow et al.
2007), but in our study area seasonality appears to affect
only the abundance of individual species and not species
richness and composition (C. H. Schulze, unpublished
data).
Ants and beetles from lower canopy trees.—Within
each study plot, four trees were selected, which were of
similar age and size. These were cacao trees in the
agroforests (n ¼ 48; height, 3.4 6 0.56 m) and small,
shade-dwelling lower canopy trees (n¼ 15; height, 6.3 6
1.90 m) with canopy sizes similar to those of the selected
cacao trees at natural forest sites. At one forest site, ants
and beetles from only three trees could be sampled due
to a technical problem. In order to characterize the
forest insect fauna as completely as possible, we also
sampled insects on a diverse set of trees in the forest
understory. The 15 trees in the forest sites were identified
by R. Pitopang and belonged to 14 species of 10 families.
Only on one occasion were two sampled trees in the
same forest site of the same family. None of the forest
trees were recorded flowering or fruiting at the time of
sampling. At the time of the survey, cacao in the region
was between a main flowering and a harvesting period,
although minor flowering and fruiting occurred
throughout the year. The lower canopy-dwelling ant
and beetle fauna were sampled using canopy knock-
down fogging, which is an effective and widely used
technique for collecting arthropods from tree crowns
(Perfecto et al. 1997, Lawton et al. 1998). With a
SwingFog TF35, a fog of 1% pyrethroid insecticide
(Permethrin; Mitra Envitech, Bogor, Indonesia) was
blown horizontally into the target canopy to avoid
collecting insects from higher canopy layers. Killed
arthropods were collected from a 4-m2 sheet of white
canvas placed directly under each tree. We randomly
selected one site per day and sampled all four trees
between 08:00 and 09:00 at the time of day of lowest
wind speed and rainfall probability between 17 Decem-
ber 2003 and 1 January 2004. The collected beetles and
ants were sorted into units based on external morphol-
ogy (morphospecies). Ant sorting was carried out by A.
Rizali (IPB Bogor, Indonesia), based on literature
(Bolton 1994) and reliable digital resources (available
online).11 Beetles were identified and sorted by C. Bayer,
B. Buche, and A. Rizali. Where necessary, beetle
morphospecies were sorted based on genitalia prepara-
tions. All morphospecies were photographed and posted
on the Internet through which more than 50 specialists
internationally contributed with identifications based on
the photographs and continued further taxonomic work.
Dung beetles.—Dung beetles were collected using
baited pitfall traps as described in Shahabuddin et al.
(2005). Traps were baited with ;20 g of fresh cattle (Bos
taurus) dung. The dung was wrapped in a small square
of textile and fixed with a string at the top of the trap,
which was covered by a metal roof as protection against
sun and rain. Five traps were set up along an 80-m
transect and exposed for two days (Shahabuddin 2007).
After removal from the traps, specimens were preserved
in Scheerpelz solution (75% ethanol, 5% acetic acid, 20%
water) as recommended by F. T. Krell (unpublished
manuscript). Dung beetles were sampled once per month
between March and August 2005. Identification of
specimens was done in close collaboration with B.
Buche (Berlin, Germany) using available keys (e.g.,
Balthasar 1963) and the reference collection of the
Bogor Zoological Museum of LIPI (Bogor, Indonesia).
Unidentified species were sorted to morphospecies.
Bees, wasps, and their parasitoids.—Trap nests offer
standardized nesting sites for aboveground-nesting bees
and wasps and can therefore be used to experimentally
study these insects. They were constructed from PVC
tubes with a length of 28 cm and a diameter of 14 cm.
Internodes of the reed Saccharum spontaneum (Poaceae)
with varying diameter (3–25 mm) and a length of 20 cm
were inserted into these tubes to provide nesting sites
(following Tscharntke et al. 1998). Twelve trap nests
(four in each stratum) were installed from October 2004
until September 2005 in three different heights from
understory (U) and intermediate tree height (I) to the
canopy (C), where we placed the trap nests with a
crossbow and a line. Trap nests were checked every
month and bee and wasp larvae were reared for later
identification. Understory was defined as below the
cacao tree canopy, and trap nests were placed 1.5 m
above ground. Intermediate height trap nests were
placed above the cacao tree canopy and below the
shade tree canopy (4 m above the ground in high-
intensity plots and 7 m in primary forest, depending on
canopy structure). Due to technical constraints we
placed the canopy trap nests in the lower part of the
shade tree canopy. Here, trap nest heights varied
between forest habitat type due to different canopy
heights, with higher nests in primary forests and low-
intensity agroforestry systems (primary forest, 19.13 6
0.438 m; low-intensity AF, 20.89 6 0.746 m, n ¼ 16,
11 hhttp://www.antweb.orgi and hhttp://www.antbase.neti
MICHAEL KESSLER ET AL.2146 Ecological ApplicationsVol. 19, No. 8
respectively) and lower nests in medium- and high-
intensity agroforestry systems (medium-intensity AF,
16.36 6 0.619 m; high-intensity AF, 15.29 6 0.844 m, n
¼ 16, respectively). Sticky glue was applied every month
to the edge of the PVC tube to deter ants from
colonizing the trap nests. Individuals from the four trap
nests per plot and stratum and the whole year were
pooled for analysis.
Data analyses
a diversity.—For the analyses of aobs diversity we usedthe number of species recorded in each plot (Appendix
A). Because observed species richness values in field
studies are typically an underestimate of the actual
number of species occurring at a site (Colwell and
Coddington 1994), sampling completeness and estimat-
ed species richness (aest diversity) were also calculated
using the Chao2 richness estimator (Chao 1987) with
study sites as sample units, using the program EstimateS
8 Windows (Colwell 2006). The Chao2 estimator is
recommended by Walther and Moore (2005) and is
analogous to the estimator used for b diversity. To
assess the potential impact of sampling completeness, we
correlated sampling completeness with the correlation
values.
Da diversity.—In order to more directly compare aand b diversity, we calculated differences in species
richness between plots using Mantel analyses. As for adiversity, this was done for the observed and the
estimated richness values. The correlations of sampling
completeness with the correlation values that involved
two taxonomic groups were done using the lower of the
two values of sampling completeness.
b diversity.—Similarities in the species composition of
site pairs were quantified with the quantitative Sørensen
similarity index (also known as Bray-Curtis index),
which takes into account species abundances (Magurran
2004). To correct for incomplete sampling, we further
used the similarity index of Chao et al. (2005), which is
based on the above index but includes an estimation of
incompleteness. As for a diversity, this was done for the
observed and the estimated richness values, as well as
correlating sampling completeness with the Mantel
values.
Correlation analyses.—The correlation of diversity
values between taxonomic groups was calculated using
Spearman correlations (a diversity) and Mantel analyses
(Da and b diversity). Mantel analyses are correlation
tests between matrices consisting of pairwise similarities
or dissimilarities (Legendre and Legendre 1998). Prob-
abilities are assigned by repeatedly randomizing the
arrangement of similarity matrices, each time recalcu-
lating correlation coefficients and comparing the ob-
served correlation value to the randomly generated
ones. All Mantel analyses were conducted with PCOrd
4.5 (McCune and Mefford 1999), applying 9999
randomizations. Mantel analyses were also used to
assess (1) the relationship between turnover in species
composition (b diversity) and geographical distance
between sites and (2) the relationship between Dadiversity and b diversity. Correspondences of the three
measures of diversity (a, Da, and b diversity) withinstudy groups were assessed using Spearman correla-tions. When averaging R2 values, two different ap-
proaches were used because many original R values hadnegative signs that were lost when squaring them. First,
we did not consider negative values. Second, for thoseR2 values based on negative R values, we maintained thesigns. This was done because negative signs only can be
considered to have high indication value (R2 values) ifthe negative richness relationship between taxa is knowna priori. Usually, however, the implicit assumtion of
biodiversity indication is that the diversity patterns ofthe taxa are positively correlated. In this case, R2 values
resulting from squaring negative R values would bemisleading.
RESULTS
Species richness per site: a and Da diversity
In total, we recorded 863 species, with total speciesrichness per taxonomic group ranging from nine cavity-
nesting bee species to 198 canopy beetle species (Table1). Estimated sampling completeness ranged from 29%
for canopy beetles to 89% for cavity-nesting bees (Table
1).Patterns of species richness per sample site using the
observed species numbers (aobs diversity) varied betweentaxonomic groups along the land-use gradient (Fig. 2).The aobs diversity of trees, lianas, liverworts, and dung
beetles was highest in either mature forest stands oragroforest stands with natural shade trees and declined
with decreasing shade-tree diversity, whereas that ofherbs and canopy beetles showed the opposite pattern.With highest richness recorded in agroforests with
diverse natural or planted shade trees, aobs diversity ofbutterflies, bees, wasps, and their parasitoids showed a
hump-shaped pattern. Birds had an inversely hump-
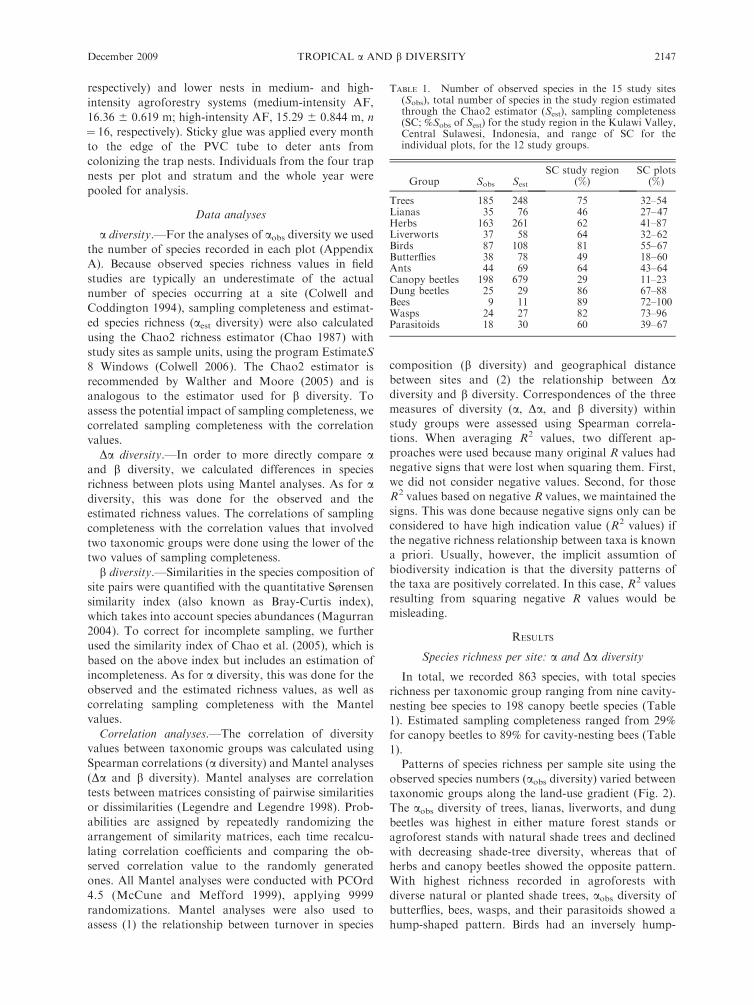
TABLE 1. Number of observed species in the 15 study sites(Sobs), total number of species in the study region estimatedthrough the Chao2 estimator (Sest), sampling completeness(SC; %Sobs of Sest) for the study region in the Kulawi Valley,Central Sulawesi, Indonesia, and range of SC for theindividual plots, for the 12 study groups.
Group Sobs Sest
SC study region(%)
SC plots(%)
Trees 185 248 75 32–54Lianas 35 76 46 27–47Herbs 163 261 62 41–87Liverworts 37 58 64 32–62Birds 87 108 81 55–67Butterflies 38 78 49 18–60Ants 44 69 64 43–64Canopy beetles 198 679 29 11–23Dung beetles 25 29 86 67–88Bees 9 11 89 72–100Wasps 24 27 82 73–96Parasitoids 18 30 60 39–67
December 2009 2147TROPICAL a AND b DIVERSITY
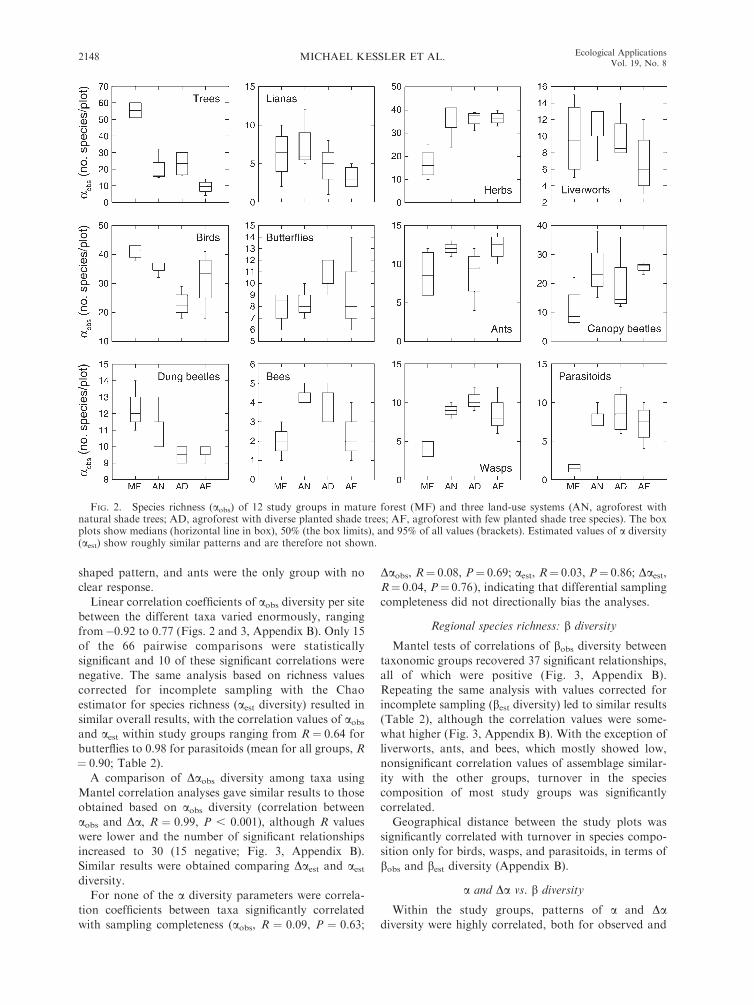
shaped pattern, and ants were the only group with no
clear response.
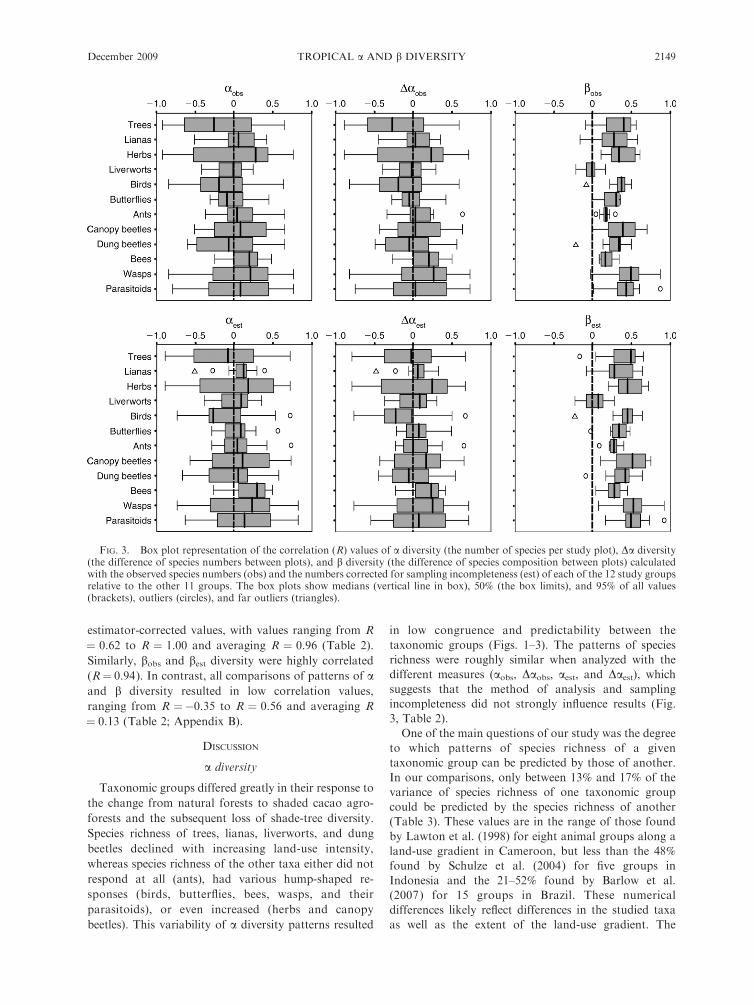
Linear correlation coefficients of aobs diversity per site
between the different taxa varied enormously, ranging
from�0.92 to 0.77 (Figs. 2 and 3, Appendix B). Only 15
of the 66 pairwise comparisons were statistically
significant and 10 of these significant correlations were
negative. The same analysis based on richness values
corrected for incomplete sampling with the Chao
estimator for species richness (aest diversity) resulted in
similar overall results, with the correlation values of aobsand aest within study groups ranging from R ¼ 0.64 for
butterflies to 0.98 for parasitoids (mean for all groups, R
¼ 0.90; Table 2).
A comparison of Daobs diversity among taxa using
Mantel correlation analyses gave similar results to those
obtained based on aobs diversity (correlation between
aobs and Da, R ¼ 0.99, P , 0.001), although R values
were lower and the number of significant relationships
increased to 30 (15 negative; Fig. 3, Appendix B).
Similar results were obtained comparing Daest and aestdiversity.
For none of the a diversity parameters were correla-
tion coefficients between taxa significantly correlated
with sampling completeness (aobs, R ¼ 0.09, P ¼ 0.63;
Daobs, R¼ 0.08, P¼ 0.69; aest, R¼ 0.03, P¼ 0.86; Daest,R¼ 0.04, P¼ 0.76), indicating that differential sampling
completeness did not directionally bias the analyses.
Regional species richness: b diversity
Mantel tests of correlations of bobs diversity between
taxonomic groups recovered 37 significant relationships,
all of which were positive (Fig. 3, Appendix B).
Repeating the same analysis with values corrected for
incomplete sampling (best diversity) led to similar results
(Table 2), although the correlation values were some-
what higher (Fig. 3, Appendix B). With the exception of
liverworts, ants, and bees, which mostly showed low,
nonsignificant correlation values of assemblage similar-
ity with the other groups, turnover in the species
composition of most study groups was significantly
correlated.
Geographical distance between the study plots was
significantly correlated with turnover in species compo-
sition only for birds, wasps, and parasitoids, in terms of
bobs and best diversity (Appendix B).
a and Da vs. b diversity
Within the study groups, patterns of a and Dadiversity were highly correlated, both for observed and
FIG. 2. Species richness (aobs) of 12 study groups in mature forest (MF) and three land-use systems (AN, agroforest withnatural shade trees; AD, agroforest with diverse planted shade trees; AF, agroforest with few planted shade tree species). The boxplots show medians (horizontal line in box), 50% (the box limits), and 95% of all values (brackets). Estimated values of a diversity(aest) show roughly similar patterns and are therefore not shown.
MICHAEL KESSLER ET AL.2148 Ecological ApplicationsVol. 19, No. 8
estimator-corrected values, with values ranging from R
¼ 0.62 to R ¼ 1.00 and averaging R ¼ 0.96 (Table 2).
Similarly, bobs and best diversity were highly correlated
(R¼ 0.94). In contrast, all comparisons of patterns of aand b diversity resulted in low correlation values,
ranging from R ¼�0.35 to R ¼ 0.56 and averaging R
¼ 0.13 (Table 2; Appendix B).
DISCUSSION
a diversity
Taxonomic groups differed greatly in their response to
the change from natural forests to shaded cacao agro-
forests and the subsequent loss of shade-tree diversity.
Species richness of trees, lianas, liverworts, and dung
beetles declined with increasing land-use intensity,
whereas species richness of the other taxa either did not
respond at all (ants), had various hump-shaped re-
sponses (birds, butterflies, bees, wasps, and their
parasitoids), or even increased (herbs and canopy
beetles). This variability of a diversity patterns resulted
in low congruence and predictability between the
taxonomic groups (Figs. 1–3). The patterns of species
richness were roughly similar when analyzed with the
different measures (aobs, Daobs, aest, and Daest), whichsuggests that the method of analysis and sampling
incompleteness did not strongly influence results (Fig.
3, Table 2).
One of the main questions of our study was the degree
to which patterns of species richness of a given
taxonomic group can be predicted by those of another.
In our comparisons, only between 13% and 17% of the
variance of species richness of one taxonomic group
could be predicted by the species richness of another
(Table 3). These values are in the range of those found
by Lawton et al. (1998) for eight animal groups along a
land-use gradient in Cameroon, but less than the 48%
found by Schulze et al. (2004) for five groups in
Indonesia and the 21–52% found by Barlow et al.
(2007) for 15 groups in Brazil. These numerical
differences likely reflect differences in the studied taxa
as well as the extent of the land-use gradient. The
FIG. 3. Box plot representation of the correlation (R) values of a diversity (the number of species per study plot), Da diversity(the difference of species numbers between plots), and b diversity (the difference of species composition between plots) calculatedwith the observed species numbers (obs) and the numbers corrected for sampling incompleteness (est) of each of the 12 study groupsrelative to the other 11 groups. The box plots show medians (vertical line in box), 50% (the box limits), and 95% of all values(brackets), outliers (circles), and far outliers (triangles).
December 2009 2149TROPICAL a AND b DIVERSITY
habitats studied by Schulze et al. (2004) ranged from
natural forests to annual crop fields devoid of trees, and
those of Barlow et al. (2007) ranged from natural forests
to Eucalyptus plantations. Our study focused on a
comparatively limited range of natural forests and
agroforestry systems. However, our R2 values do not
reflect the negative signs of many of the individual
correlation (R) values. If these signs are maintained,
then our average R2 values range from �0.01 to 0.02
(Table 3). Thus, unless the nature of the diversity
relationship between two given study groups was known
a priori, the predictive value of patterns of species
richness between study groups in our study was
essentially zero. Thus, the differences between compar-
isons of taxonomic groups along tropical land-use
gradients likely reflect differences in the study taxa as
well as the extent of the land-use gradient.
The independent patterns that we recorded for the adiversity of a wide range of taxonomic groups are
comparable with those reported by studies that com-
pared taxa along natural ecotones. For example, along
an elevational gradient in Costa Rica, richness of palms
is highest at 100 m (Chazdon 1987), of trees at 300 m
(Lieberman et al. 1996), of moths and vascular
epiphytes at 1000 m (Cardelus et al. 2006, Brehm et al.
2007), and of ferns at 1800 m (Kluge et al. 2006). This
difficulty of predicting patterns of species richness by
indicator taxa has as well been documented for forests
on different soil types in Amazonia (Duque et al. 2005,
Tuomisto and Ruokolainen 2005) and for various taxa
in Europe and North America (e.g., Prendergast 1997,
Su et al. 2004, Wolters et al. 2006, Billeter et al. 2008).
Despite the fact that trees are the main structural
elements of forests, tree species richness was in our study
only positively correlated with the species richness of
birds, dung beetles, and lianas. This result is in support
of the idea that large groups of species depend on food
resources that are not directly related to tree species
richness, as has been suggested for canopy beetles
(Wagner 2001), social bees (Klein et al. 2003), and
canopy ants (Philpott and Foster 2005). For example,
canopy beetle assemblages in the study area were
dominated by species associated with dead wood and
related fungi (M. M. Bos and B. Buche, unpublished
data), while communities of canopy ants on cacao were
mostly affected by microclimatic changes that were
largely independent of changes in species richness of
shade trees (Bos et al. 2007).
The observation of decreased species richness in five
of seven studied insect groups in mature forest could be
related to pronounced vertical stratification reported for
tropical forest insects (e.g., Rodgers and Kitching 1998,
DeVries et al. 1999, Schulze et al. 2001, Fermon et al.
2005, Diwakar and Balakrishnan 2007). While in some
taxa species richness is more pronounced in one
vegetation layer, others contribute equally to lower
strata as well as the upper canopy (e.g., DeVries et al.
1997, Schulze et al. 2001, Stork and Grimbacher 2006).
Natural and anthropogenic forest disturbance can cause
a breakdown of vertical stratification as documented for
butterflies in selectively logged forest (Dumbrell and Hill
2005, Fermon et al. 2005), at tree-fall gaps (Hill et al.
2001), and forest edges (DeVries et al. 1997). Conse-
quently, lower vegetation strata at agroforestry sites,
particularly sites at the forest edge, may be characterized
by a rich mixture of canopy and understory species,
while lower vegetation strata of forest interior sites are
characterized predominantly by relatively few forest
understory species.
b diversity
Congruence of b diversity patterns between study
groups was higher than between a diversity patterns
(Figs. 2 and 3, Table 3). Unlike the results from the adiversity comparisons, the only negative correlations
were found for liverworts. On average, 12–18% of the
variance in b diversity could be predicted by that in
another taxonomic group, although certain pairs of taxa
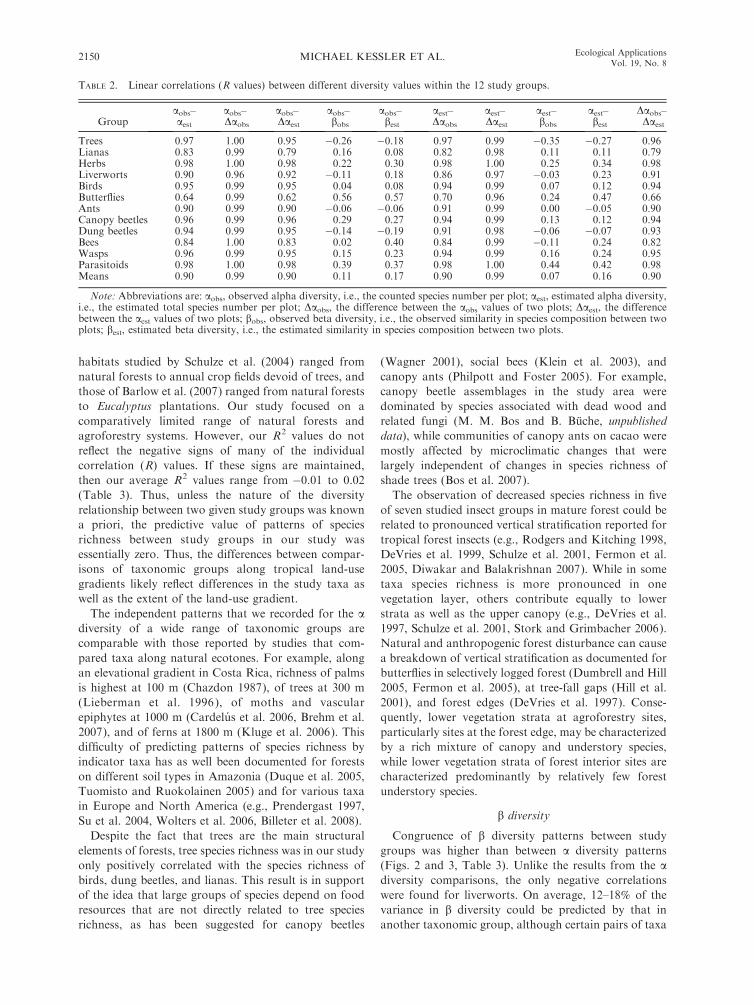
TABLE 2. Linear correlations (R values) between different diversity values within the 12 study groups.
Groupaobs–aest
aobs–Daobs
aobs–Daest
aobs–bobs
aobs–best
aest–Daobs
aest–Daest
aest–bobs
aest–best
Daobs–Daest
Trees 0.97 1.00 0.95 �0.26 �0.18 0.97 0.99 �0.35 �0.27 0.96Lianas 0.83 0.99 0.79 0.16 0.08 0.82 0.98 0.11 0.11 0.79Herbs 0.98 1.00 0.98 0.22 0.30 0.98 1.00 0.25 0.34 0.98Liverworts 0.90 0.96 0.92 �0.11 0.18 0.86 0.97 �0.03 0.23 0.91Birds 0.95 0.99 0.95 0.04 0.08 0.94 0.99 0.07 0.12 0.94Butterflies 0.64 0.99 0.62 0.56 0.57 0.70 0.96 0.24 0.47 0.66Ants 0.90 0.99 0.90 �0.06 �0.06 0.91 0.99 0.00 �0.05 0.90Canopy beetles 0.96 0.99 0.96 0.29 0.27 0.94 0.99 0.13 0.12 0.94Dung beetles 0.94 0.99 0.95 �0.14 �0.19 0.91 0.98 �0.06 �0.07 0.93Bees 0.84 1.00 0.83 0.02 0.40 0.84 0.99 �0.11 0.24 0.82Wasps 0.96 0.99 0.95 0.15 0.23 0.94 0.99 0.16 0.24 0.95Parasitoids 0.98 1.00 0.98 0.39 0.37 0.98 1.00 0.44 0.42 0.98Means 0.90 0.99 0.90 0.11 0.17 0.90 0.99 0.07 0.16 0.90
Note: Abbreviations are: aobs, observed alpha diversity, i.e., the counted species number per plot; aest, estimated alpha diversity,i.e., the estimated total species number per plot; Daobs, the difference between the aobs values of two plots; Daest, the differencebetween the aest values of two plots; bobs, observed beta diversity, i.e., the observed similarity in species composition between twoplots; best, estimated beta diversity, i.e., the estimated similarity in species composition between two plots.
MICHAEL KESSLER ET AL.2150 Ecological ApplicationsVol. 19, No. 8
had much higher values, as exemplified by wasps and
their parasitoids (76%) and wasps and canopy beetles
(49%).
The low correlation coefficients between b diversity of
bees and other study groups (even with their parasitoids)
probably relate to the comparably even distribution of
the nine aboveground nesting bee species in the study
area, with most species present in all habitat types. In
contrast, the other two ‘‘independent’’ study taxa,
namely liverworts and ants, showed marked turnover
between plots and habitats. Their low correlations to
other study groups are presumably based on taxon-
specific ecological requirements. Intriguingly, in Britain
hot spots of liverwort diversity corresponded to cold
spots of birds and butterflies (Prendergast et al. 1993). In
the other taxonomic groups, variability in patterns of bdiversity did not seem to relate to general taxonomic
(e.g., plants vs. animals) or ecological (e.g., relative to
trophic level, mobility) differences, but were rather
group specific. For example, the extremely high turnover
in beetle species relates to the fact that the majority of
the recorded species aggregated on resources that were
little related to habitat type, such as deadwood and fungi
(M. M. Bos and B. Buche, unpublished data).
a vs. b diversity
In accordance with previous studies (e.g., Su et al.
2004, Tuomisto and Ruokolainen 2005, Barlow et al.
2007, McKnight et al. 2007, Noske et al. 2008) our
results show that among the 12 investigated groups, the
use of indicator taxa is most valuable when taking into
account the patterns in b diversity rather than adiversity. The higher congruence of patterns of bdiversity than of a diversity is readily explained
biologically (Su et al. 2004, McKnight et al. 2007,
Rodrigues and Brooks 2007). Along an ecological
gradient (land use, elevation, climate, soil fertility,
etc.), b diversity of all taxa will tend to shift more
strongly the more divergent the ecological conditions
are. In contrast, species richness can be similar even
under strikingly different conditions (Fig. 4).
Within the studied taxonomic groups, the congruence
of patterns of a and b diversity was fairly low, with R2
values averaging 0.07–0.20 (Table 3). Across the
different taxa, only 1–4% of the variance of b diversity
of a given group could be predicted by the patterns of adiversity of another group, and vice versa. If the sign of
negative correlations is maintained in calculating these
values, the values are further reduced to 0–1%. The
main conclusion to be drawn from this is that indication
of patterns of b diversity through patterns of a diversity
of another taxon is practically impossible within our
study system and difficult using the same taxon. These
results are not surprising considering the low correlation
values within each of the diversity levels and the fact
TABLE 3. Mean determination coefficients (R2 values) of a given study group relative to the other 11 study groups, for sixmeasures of diversity.
Group
aobs aest Daobs Daest bobs best
� þ � þ � þ � þ � þ � þ
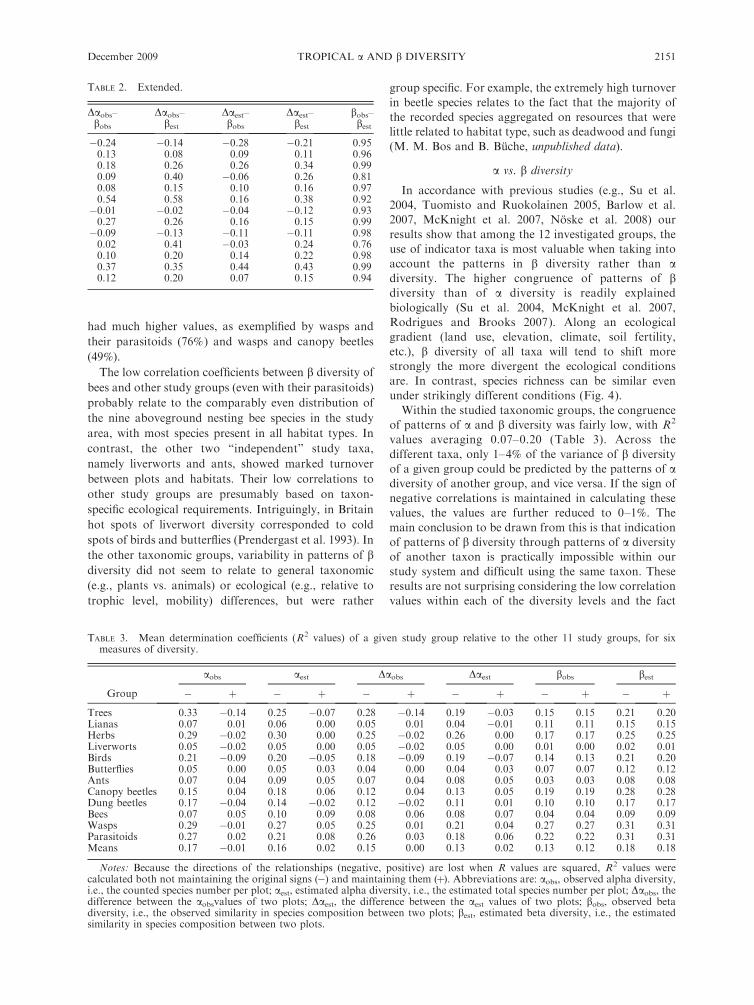
Trees 0.33 �0.14 0.25 �0.07 0.28 �0.14 0.19 �0.03 0.15 0.15 0.21 0.20Lianas 0.07 0.01 0.06 0.00 0.05 0.01 0.04 �0.01 0.11 0.11 0.15 0.15Herbs 0.29 �0.02 0.30 0.00 0.25 �0.02 0.26 0.00 0.17 0.17 0.25 0.25Liverworts 0.05 �0.02 0.05 0.00 0.05 �0.02 0.05 0.00 0.01 0.00 0.02 0.01Birds 0.21 �0.09 0.20 �0.05 0.18 �0.09 0.19 �0.07 0.14 0.13 0.21 0.20Butterflies 0.05 0.00 0.05 0.03 0.04 0.00 0.04 0.03 0.07 0.07 0.12 0.12Ants 0.07 0.04 0.09 0.05 0.07 0.04 0.08 0.05 0.03 0.03 0.08 0.08Canopy beetles 0.15 0.04 0.18 0.06 0.12 0.04 0.13 0.05 0.19 0.19 0.28 0.28Dung beetles 0.17 �0.04 0.14 �0.02 0.12 �0.02 0.11 0.01 0.10 0.10 0.17 0.17Bees 0.07 0.05 0.10 0.09 0.08 0.06 0.08 0.07 0.04 0.04 0.09 0.09Wasps 0.29 �0.01 0.27 0.05 0.25 0.01 0.21 0.04 0.27 0.27 0.31 0.31Parasitoids 0.27 0.02 0.21 0.08 0.26 0.03 0.18 0.06 0.22 0.22 0.31 0.31Means 0.17 �0.01 0.16 0.02 0.15 0.00 0.13 0.02 0.13 0.12 0.18 0.18
Notes: Because the directions of the relationships (negative, positive) are lost when R values are squared, R2 values werecalculated both not maintaining the original signs (�) and maintaining them (þ). Abbreviations are: aobs, observed alpha diversity,i.e., the counted species number per plot; aest, estimated alpha diversity, i.e., the estimated total species number per plot; Daobs, thedifference between the aobsvalues of two plots; Daest, the difference between the aest values of two plots; bobs, observed betadiversity, i.e., the observed similarity in species composition between two plots; best, estimated beta diversity, i.e., the estimatedsimilarity in species composition between two plots.
TABLE 2. Extended.
Daobs–bobs
Daobs–best
Daest–bobs
Daest–best
bobs–best
�0.24 �0.14 �0.28 �0.21 0.950.13 0.08 0.09 0.11 0.960.18 0.26 0.26 0.34 0.990.09 0.40 �0.06 0.26 0.810.08 0.15 0.10 0.16 0.970.54 0.58 0.16 0.38 0.92�0.01 �0.02 �0.04 �0.12 0.930.27 0.26 0.16 0.15 0.99�0.09 �0.13 �0.11 �0.11 0.980.02 0.41 �0.03 0.24 0.760.10 0.20 0.14 0.22 0.980.37 0.35 0.44 0.43 0.990.12 0.20 0.07 0.15 0.94
December 2009 2151TROPICAL a AND b DIVERSITY

that concordances across levels of diversity are neces-
sarily less tight (Tylianakis et al. 2005, Clough et al.
2007).
Implications for biodiversity sampling
Our study shows that indication of diversity patterns
of a given taxon by another taxon remains a difficult
task (Prendergast 1997, Favreau et al. 2006, Wolters et
al. 2006, Billeter et al. 2008). This has previously been
shown for patterns of a diversity both at the local level
(Lawton et al. 1998, Schulze et al. 2004, Favreau et al.
2006, Wolters et al. 2006) and on regional to continental
scales (Beccaloni and Gaston 1995, Carroll and Pearson
1998, Myers et al. 2000, Moore et al. 2002, Tushabe et
al. 2006, Billeter et al. 2008). We also found that
different approaches to calculating a diversity (species
numbers vs. differences between species numbers;
observed vs. estimated values) resulted in roughly
similar values. In particular, the sampling completeness
of the different study groups did not appear to influence
the observed patterns of a diversity directionally or in a
predictable way.
Our study further showed that b diversity is more
consistent across the study taxa, and although overall
levels of congruence were rather low (see also Tuomisto
and Ruokolainen 2005, Noske et al. 2008), negative
correlation values were very rare and indication is
possible, if on a low level. Furthermore, in contrast to adiversity, the correction for sampling incompleteness
increased the indicative value of b diversity, showing
that this approach should be preferred when comparing
b diversity of incomplete samples.
Implications for biodiversity conservation
in tropical landscapes
Because the potential conservation value of an area
depends more on which species occur there, rather than
how many species (Gaston 1996), the reasonably good
FIG. 4. Examples of the relationships of a diversity (the number of species found per sampling unit) and b diversity (theturnover of species assemblages between sampling units, also known as the Bray-Curtis similarity) between different taxa. (A) Thespecies richness of trees and herbs are closely inversely correlated due to the high abundance of herbs in open plantations with fewshade trees. This high species richness of herbs in turn correlates positively with the species richness of butterflies (C), many ofwhich use the herbs as food plants. Species numbers of trees and butterflies are not significantly correlated (B). In contrast to adiversity, b diversity is positively correlated between trees and herbs (D) as well as between herbs and butterflies (F), and slightly,but not significantly so, between trees and butterflies (E). Thus, changes in land use affect b diversity of different taxa in roughly thesame way, whereas trends in a diversity can be completely unrelated or even opposite. Trend lines in nonsignificant relationships areshown by dotted lines for clarity (B and E).
* P , 0.05; ** P , 0.01; *** P , 0.001.
MICHAEL KESSLER ET AL.2152 Ecological ApplicationsVol. 19, No. 8
indication of b diversity, in contrast to a diversity, is of
considerable practical interest (McKnight et al. 2007).
Due to contrasting patterns, indication of b diversity
through a diversity is also not possible, suggesting that
diversity assessments based exclusively on patterns of adiversity miss the important b diversity component.
Perhaps most importantly, our study shows that, at
least at the scale of our study, trees, despite being the
main structural components of forests and agroforests
and providing resources to many other organisms, are
not better suited as indicators than other taxa. Whether
the relatively high correlation values obtained for both
a and b diversity patterns for some taxon pairs such as
trees and birds (a diversity) or wasps and their
parasitoids (b diversity) represent general relationships
that can be used for biodiversity indication remains to
be confirmed by further studies. Our results thus
support those from other multi-taxa studies of the
consequences of land-use change and suggest that the
impact of management changes on the diversity and
composition of a given taxon in tropical agroforests
cannot be predicted reliably from other taxa, although
changes in species composition (b diversity) appear to
be more consistent than those of species richness (adiversity).
ACKNOWLEDGMENTS
This study was funded by the German Research Foundation(DFG), grant SFB-552 STORMA (Stability of Tropical Rain-forest Margins). We thank Pak Mann, Arifin, Daniel Stieten-roth, Adam Malik, Wolfram Lorenz, Surya Tarigan, and allplantation owners for their help in this work. We also thankMirkka Jones and Hanna Tuomisto for comments on themanuscript.
LITERATURE CITED
Abrahamczyk, S., M. Kessler, D. D. Putra, M. Waltert, and T.Tscharntke. 2008. The value of differently managed cacaoplantations for forest bird conservation in Sulawesi, Indo-nesia. Bird Conservation International 18:349–362.
Aoki, T., S. Yamaguchi, and Y. Uemura. 1982. Satyridae,Libytheidae. Pages 1–500 in E. Tsukada, editor. Butterflies ofthe South East Asian Islands 3. Plapac, Tokyo, Japan.
Balthasar, V. 1963. Monographie der Scarabaeidae undAphodiidae der palaearktischen und orientalischen Region,Band 1. Verlag der Tschechoslowakischen Akademie derWissenschaften, Prague, Czechoslovakia.
Barlow, J., et al. 2007. Quantifying the biodiversity value oftropical primary, secondary, and plantation forests. Proceed-ings of the National Academy of Sciences (USA) 104:18555–18560.
Beccaloni, G. W., and K. J. Gaston. 1995. Predicting the speciesrichness of neotropical forest butterflies: Ithomiinae (Lepi-doptera: Nymphalidae) as indicators. Biological Conserva-tion 71:77–86.
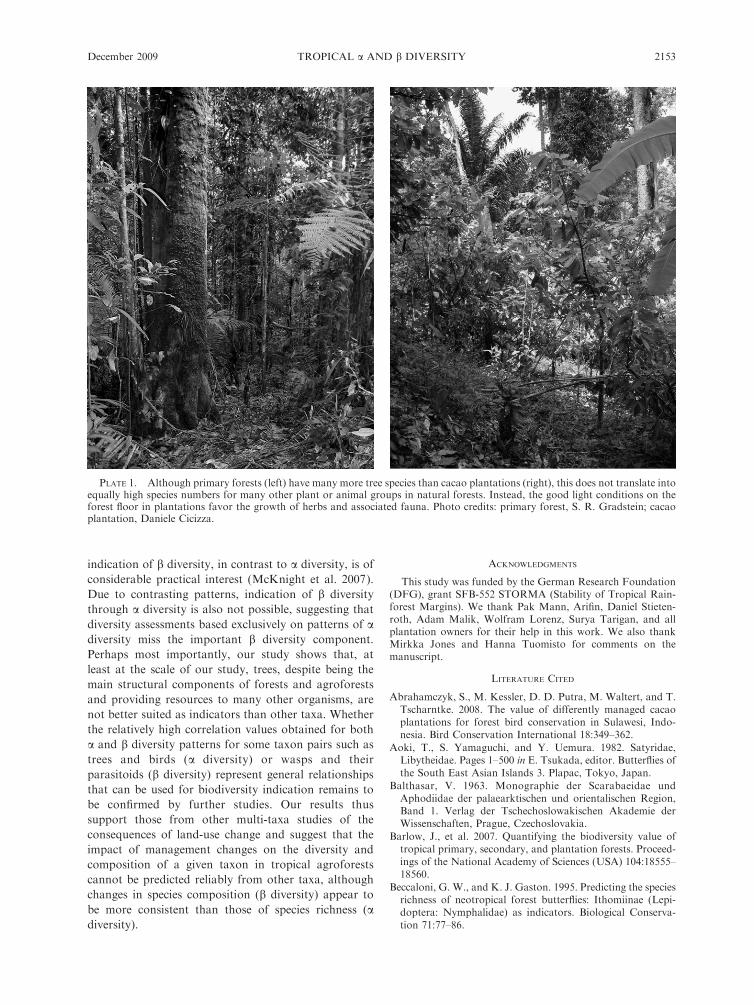
PLATE 1. Although primary forests (left) have many more tree species than cacao plantations (right), this does not translate intoequally high species numbers for many other plant or animal groups in natural forests. Instead, the good light conditions on theforest floor in plantations favor the growth of herbs and associated fauna. Photo credits: primary forest, S. R. Gradstein; cacaoplantation, Daniele Cicizza.
December 2009 2153TROPICAL a AND b DIVERSITY
Billeter, R., et al. 2008. Indicators for biodiversity inagricultural landscapes: a pan-European study. Journal ofApplied Ecology 45:141–150.
Bolton, B. 1994. Identification guide to the ant genera of theworld. Harvard University Press, Cambridge, Massachusetts,USA.
Bond, W. 2001. Keystone species: Hunting the snark? Science292:63–64.
Bos, M. M., I. Steffan-Dewenter, and T. Tscharntke. 2007. Thecontribution of cacao agroforests to the conservation oflower canopy ant and beetle diversity in Indonesia. Biodi-versity and Conservation 16:2429–2444.
Brehm, G., R. K. Colwell, and J. Kluge. 2007. The role ofenvironment and mid-domain effect on moth species richnessalong a tropical elevational gradient. Global Ecology andBiogeography 16:205–219.
Cardelus, C. L., R. K. Colwell, and J. E. Watkins. 2006.Vascular epiphyte distribution patterns: explaining the mid-elevation richness peak. Journal of Ecology 94:144–156.
Carroll, S. S., and D. L. Pearson. 1998. Spatial modeling ofbutterfly species diversity using tiger beetles as a bioindicatortaxon. Ecological Applications 8:531–543.
Chao, A. 1987. Estimating the population size for capture–recapture data with unequal catchability. Biometrics 43:783–791.
Chao, A., R. L. Chazdon, R. K. Colwell, and T.-J. Shen. 2005.A new statistical approach for assessing similarity of speciescomposition with incidence and abundance data. EcologyLetters 8:148–159.
Chazdon, R. L. 1987. The palm flora of Braulio CarrilloNational Park, Costa Rica. Brenesia 28:107–116.
Clough, Y., A. Holzschuh, D. Gabriel, T. Purtauf, D. Kleijn, A.Kruess, I. Steffan-Dewenter, and T. Tscharntke. 2007. Alphaand beta diversity of arthropods and plants in organicallyand conventionally managed wheat fields. Journal of AppliedEcology 44:804–812.
Coates, B. J., and K. D. Bishop. 1997. A guide to the birds ofWallacea. Dove, Alderley, Queensland, Australia.
Cody, M. L. 1986. Diversity, rarity, and conservation inMeditarranean-climate regions. Pages 123–152 in M. Soule,editor. Conservation biology: the science of scarcity anddiversity. Sinauer, Sunderland, Massachusetts, USA.
Colwell, R. K. 2006. EstimateS: Statistical estimation of speciesrichness and shared species from samples. Version 8. hhttp://www.purl.oclc.org/estimatesi
Colwell, R. K., and J. A. Coddington. 1994. Estimatingterrestrial biodiversity through extrapolation. PhilosophicalTransactions of the Royal Society B 345:101–118.
Crist, T. O., and J. A. Veech. 2006. Additive partinioning ofrarefaction curves and species–area relationships: unifyingalpha, beta, and gamma diversity with sample size andhabitat area. Ecology Letters 9:923–932.
Crist, T. O., J. A. Veech, J. C. Gering, and K. S. Summerville.2003. Partioning species diversity across landscapes andregions: a hierarchical analysis of a, b, c diversity. AmericanNaturalist 162:734–743.
D’Abrera, B. 1985. Nymphalidae, Satyridae and Amathusiidae.Pages 245–534 in B. D’Abrera, editor. Butterflies of theOriental Region II. Hill House, Ferny Creek, Victoria,Australia.
Daily, G. C., and P. R. Ehrlich. 1995. Preservation ofbiodiversity in small rainforest patches: rapid evaluationsusing butterfly trapping. Biodiversity and Conservation 4:35–55.
Daniels, R. J. R., N. V. Joshi, and M. Gadgil. 1992. On therelationship between bird and woody plant species diversityin the Uttara Kannada District of South India. Proceedingsof the National Academy of Sciences (USA) 89:5311–5315.
Davis, A. J., and S. L. Sutton. 1998. The effects of rainforestcanopy loss on arboreal dung beetles in Borneo: implications
for the measurement of biodiversity in derived tropicalecosystems. Diversity and Distributions 4:167–173.
DeVries, P. J., D. Murray, and R. Lande. 1997. Speciesdiversity in vertical, horizontal, and temporal dimensions of afruit-feeding butterfly community in an Ecuadorian rain-forest. Biological Journal of the Linnean Society 62:343–364.
DeVries, P. J., T. R. Walla, and H. F. Greeney. 1999. Speciesdiversity in spatial and temporal dimensions of fruit-feedingbutterflies from two Ecuadorian rainforests. BiologicalJournal of the Linnean Society 68:333–353.
Diwakar, S., and R. Balakrishnan. 2007. Vertical stratificationin an acoustically communicating ensiferan assemblage of atropical evergreen forest in southern India. Journal ofTropical Ecology 23:479–486.
Dumbrell, A. J., and J. K. Hill. 2005. Impacts of selectivelogging on canopy and ground assemblages of tropical forestbutterflies: implications for sampling. Biological Conserva-tion 125:123–131.
Duque, A. J., J. F. Duivenvoorden, J. Cavalier, M. Sanchez, C.Polanıa, and A. Leon. 2005. Ferns and Melastomataceae asindicators of vascular plant composition in rain forests ofColombian Amazonia. Plant Ecology 178:1–13.
Favreau, J. M., C. A. Drew, G. R. Hess, M. J. Rubino, F. H.Koch, and K. A. Eschelbach. 2006. Recommendations forassessing the effectiveness of surrogate species approach.Biodiversity and Conservation 15:3949–3969.
Fermon, H., M. Waltert, T. B. Larsen, U. Dall’Asta, and M.Muhlenberg. 2000. Effects of forest management on diversityand abundance of nymphalid butterflies in southeastern Coted’Ivoire. Journal of Insect Conservation 4:173–189.
Fermon, H., M. Waltert, R. I. Vane-Wright, and M. Muhlen-berg. 2005. Forest use and vertical stratification in fruit-feeding butterflies of Sulawesi, Indonesia: impacts forconservation. Biodiversity and Conservation 14:333–350.
Gabriel, D., I. Roschewitz, T. Tscharntke, and C. Thies. 2006.Beta diversity at different spatial scales: plant communities inorganic and conventional agriculture. Ecological Applica-tions 16:2011–2021.
Garson, J., A. Aggarwal, and S. Sarkar. 2002. Birds assurrogates for biodiversity: an analysis of a data set fromsouthern Quebec. Journal of Biosciences 27:347–360.
Gaston, K. J. 1996. Biodiversity: a biology of numbers anddifference. Blackwell, Oxford, UK.
Gradstein, S. R., M. Kessler, and R. Pitopang. 2007. Treespecies diversity relative to human land uses in tropical rainforest margins in Central Sulawesi. Pages 321–334 in T.Tscharntke, C. Leuschner, M. Zeller, E. Guhardja, and A.Bidin, editors. The stability of tropical rainforest margins:linking ecological, economic and social constraints of landuse and conservation. Springer, Berlin, Germany.
Green, R. E., J. C. Stephen, J. P. W. Scharlemann, and A.Balmford. 2005. Farming and the fate of wild nature. Science307:550–555.
Greenberg, R., P. Bichier, and A. C. Angon. 2000. Theconservation values for birds of cacao plantations withdiverse planted shade in Tabasco, Mexico. Animal Conser-vation 3:105–112.
Herrera, C. M., and O. Pellmyr. 2002. Plant–animal interac-tions: an evolutionary approach. Blackwell, Oxford, UK.
Hill, J. K., K. C. Hamer, J. Tangah, and M. Dawood. 2001.Ecology of tropical butterflies in rainforest gaps. Oecologia128:294–302.
Hubbell, S. P. 2001. The unified neutral theory of biodiversityand biogeography. Monographs in Population Biology 32.Princeton University Press, Princeton, New Jersey, USA.
Jetz, W., D. S. Wilcove, and A. P. Dobson. 2007. Projectedimpacts of climate and land-use change on the globaldiversity of birds. PLoS Biology 5:1211–1219.
Johansson, D. R. 1974. Ecology of vascular epiphytes in West-African rain forest. Acta Phytogeographica Suecica 59:1–136.
MICHAEL KESSLER ET AL.2154 Ecological ApplicationsVol. 19, No. 8
Jost, L. 2007. Partitioning diversity into independent alpha andbeta components. Ecology 88:2427–2439.
Kessler, M., P. J. A. Keßler, S. R. Gradstein, K. Bach, M.Schmull, and R. Pitopang. 2005. Tree diversity in primaryforest and different land use systems in Central Sulawesi,Indonesia. Biodiversity and Conservation 14:547–560.
Klein, A.-M., I. Steffan-Dewenter, and T. Tscharntke. 2003.Pollination of Coffea canephora in relation to local andregional agroforestry management. Journal of AppliedEcology 40:837–845.
Kluge, J., M. Kessler, and R. R. Dunn. 2006. What driveselevational patterns of diversity? A test of geometricconstraints, climate and species pool effects for pteridophyteson an elevational gradient in Costa Rica. Global Ecology andBiogeography 15:358–371.
Kremen, C. 2005. Managing ecosystem services: What do weneed to know about their ecology? Ecology Letters 8:468–479.
Lambeck, R. J. 1997. Focal species: a multi-species umbrella fornature conservation. Conservation Biology 11:849–856.
Landres, P. B., J. Verner, and J. W. Thomas. 1988. Ecologicaluses of vertebrate indicator species, a critique. ConservationBiology 2:316–328.
Larsen, F. W., J. Bladt, and C. Rahbek. 2007. Improving theperformance of indicator groups for the identification ofimportant areas for species conservation. ConservationBiology 21:731–740.
Lawton, J. H., et al. 1998. Biodiversity inventories, indicatortaxa and effects of habitat modification in tropical forest.Nature 391:72–76.
Leader-Williams, N., and H. T. Dublin. 2000. Charismaticmegafauna as ‘‘flagship species.’’ Pages 53–81 in A. Entwistleand N. Dunstone, editors. Priorities for the conservation ofmammalian diversity: Has the panda had its day? CambridgeUniversity Press, Cambridge, UK.
Legendre, P., D. Borcard, and P. R. Peres-Neto. 2005.Analyzing beta diversity: partitioning the spatial variationof community composition data. Ecological Monographs 75:435–450.
Legendre, P., and L. Legendre. 1998. Numerical ecology.Second English edition. Developments in environmentalmodelling 20. Elsevier, Amsterdam, The Netherlands.
Lieberman, D., M. Lieberman, R. Peralta, and G. S. Hart-shorn. 1996. Tropical forest structure and composition on alarge-scale altitudinal gradient in Costa Rica. Journal ofEcology 84:137–152.
Loreau, M., N. Mouquet, and A. Gonzalez. 2003. Biodiversityas spatial insurance in heterogeneous landscapes. Proceedingsof the National Academy of Sciences (USA) 100:12765–12770.
Loreau, M., S. Naeem, P. Inchausti, J. Bengtsson, J. P. Grime,A. Hector, D. U. Hooper, M. A. Huston, D. Raffaelli, B.Schmid, D. Tilman, and D. A. Wardle. 2001. Biodiversityand ecosystem functioning: current knowledge and futurechallenges. Science 294:804–808.
Magurran, A. E. 2004. Measuring biological diversity. Black-well, Oxford, UK.
McCune, B., and M. J. Mefford. 1999. PC-ORD: multivariateanalysis of ecological data. Version 4.5. MjM SoftwareDesign, Gleneden Beach, Oregon, USA.
McKnight, M. W., P. S. White, R. I. McDonald, J. F.Lamoreux, W. Sechrest, R. S. Ridgely, and S. N. Stuart.2007. Putting beta-diversity on the map: broad-scale congru-ences and coincidences in the extremes. PLoS Biology 5:2424–2432.
Mittermeier, R. A. 1988. Primate diversity and the tropicalforest: case studies from Brazil and Madagascar and theimportance of the megadiversity countries. Pages 145–154 inE. O. Wilson, editor. Biodiversity. National Academy Press,Washington, D.C., USA.
Moore, J. L., A. Balmford, T. Brooks, N. D. Burgess, L. A.Hansen, C. Rahbek, and P. H. Williams. 2002. Theperformance of sub-Saharan African vertebrates as indicatorgroups for conservation priority setting. ConservationBiology 17:595–601.
Myers, N., R. A. Mittermeier, C. G. Mittermeier, G. A. B. daFonseca, and J. Kent. 2000. Biodiversity hotspots forconservation priorities. Nature 403:853–858.
Noske, N. M., N. Hilt, F. A. Werner, G. Brehm, K. Fiedler,and S. R. Gradstein. 2008. Disturbance effects on diversity ofepiphytes and moths in a montane forest in Ecuador. Basicand Applied Ecology 9:4–12.
Oliver, I., A. J. Beattle, and A. York. 1998. Spatial fidelity ofplant, vertebrate, and invertebrate assemblages in multiple-use forest in Eastern Australia. Conservation Biology 12:822–835.
Paine, R. T. 1969. A note on trophic complexity andcommunity stability. American Naturalist 103:91–93.
Parker, T. A. 1991. On the use of tape recorders in avifaunalsurveys. Auk 108:443–444.
Pearson, D. L. 1994. Selecting indicator taxa for thequantitative assessment of biodiversity. Philosophical Trans-actions of the Royal Society B 345:75–79.
Perfecto, I., J. Vandermeer, P. Hanson, and V. Cartın. 1997.Arthropod biodiversity loss and the transformation of atropical agro-ecosystem. Biodiversity and Conservation 6:935–945.
Pharo, E. J., A. J. Beatti, and D. Binns. 1999. Vascular plantdiversity as a surrogate for bryophyte and lichen diversity.Conservation Biology 13:282–292.
Philpott, S. M., and P. F. Foster. 2005. Nest-site limitation incoffee agroecosystems: artificial nests maintain diversity ofarboreal ants. Ecological Applications 15:1478–1485.
Prendergast, J. R. 1997. Species richness covariance in highertaxa: empirical tests of the biodiversity indicator concept.Ecography 20:210–216.
Prendergast, J. R., R. M. Quinn, J. H. Lawton, B. C. Eversham,and D. W. Gibbons. 1993. Rare species, the coincidence ofdiversity hotspots and conservation strategies. Nature 365:335–337.
Rodgers, D. J., and R. L. Kitching. 1998. Vertical stratificationof rainforest collembolan (Collembola: Insecta) assemblages:description of ecological patterns and hypotheses concerningtheir generation. Ecography 21:392–400.
Rodrigues, A. S. L., and T. M. Brooks. 2007. Shortcuts forbiodiversity conservation planning: the effectiveness ofsurrogates. Annual Review of Ecology, Evolution, andSystematics 38:713–737.
Schulze, C. H., K. E. Linsenmair, and K. Fiedler. 2001.Understorey versus canopy: patterns of vertical stratificationand diversity among Lepidoptera in a Bornean rain forest.Plant Ecology 153:133–152.
Schulze, C., M. Waltert, P. J. A. Keßler, R. Pitopang,Shahabuddin, D. Veddeler, M. Muhlenberg, S. R. Gradstein,C. Leuschner, I. Steffan-Dewenter, and T. Tscharntke. 2004.Biodiversity indicator taxa of tropical land-use systems:comparing plants, birds, and insects. Ecological Applications14:1321–1333.
Shahabuddin, G. 2007. Effect of land use on dung beetles(Coleoptera: Scarabaeidae) diversity and dung decomposi-tion in Central Sulawesi, Indonesia. Dissertation. BogorAgricultural University, Bogor, Indonesia.
Shahabuddin, G., C. H. Schulze, and T. Tscharntke. 2005.Changes of dung beetle communities from rainforeststowards agroforestry systems and annual cultures. Biodiver-sity and Conservation 14:863–877.
Simberloff, D. 1998. Flagships, umbrellas, and keystones: Issingle-species management passe in the landscape era?Biological Conservation 83:247–257.
December 2009 2155TROPICAL a AND b DIVERSITY
Steffan-Dewenter, I., et al. 2007. Tradeoffs between income,biodiversity, and ecosystem function during rainforestconversion and agroforestry intensification. Proceedings ofthe National Academy of Sciences (USA) 104:4973–4978.
Stork, N. E., and P. S. Grimbacher. 2006. Beetle assemblagesfrom an Australian tropical rainforest show that the canopyand the ground strata contribute equally to biodiversity.Proceedings of the Royal Society B 273:1969–1975.
Su, J. C., D. M. Debinski, M. E. Jakubauskas, and K.Kindscher. 2004. Beyond species richness: communitysimilarity as a measure of cross-taxon congruence forcoarse-filter conservation. Conservation Biology 18:167–173.
Tscharntke, T., A. Gathmann, and I. Steffan-Dewenter. 1998.Bioindication using trap-nesting bees and wasps and theirnatural enemies: community structure and interactions.Journal of Applied Ecology 35:708–719.
Tsukada, E. 1991. Nymphalidae (2). Pages 1–576 in E.Tsukada, editor. Butterflies of the South East Asian Islands5. Plapac, Tokyo, Japan.
Tsukada, E., Y. Nishiyama, and M. Kaneko. 1985. Nympha-lidae (1). Pages 1–558 in E. Tsukada, editor. Butterflies of theSouth East Asian Islands 4. Plapac, Tokyo, Japan.
Tuomisto, H., and K. Ruokolainen. 2005. Environmentalheterogeneity and the diversity of pteridophytes and Mela-stomataceae in western Amazonia. Biologist Skrifter 55:37–56.
Tuomisto, H., and K. Ruokolainen. 2006. Analyzing orexplaining beta diversity? Understanding the targets ofdifferent methods of analysis. Ecology 87:2697–2708.
Tushabe, H., J. Kalema, A. Byaruhanga, J. Asasira, P.Ssegawa, A. Balmford, T. R. B. Davenport, and J. Fjeldsa.2006. A nationwide assessment of the biodiversity value of
Uganda’s important bird areas network. ConservationBiology 20:85–99.
Tylianakis, J. M., A.-M. Klein, and T. Tscharntke. 2005.Spatiotemporal variation in the diversity of Hymenopteraacross a tropical habitat gradient. Ecology 86:3296–3302.
Vane-Wright, R. I., and H. Fermon. 2003. Taxonomy andidentification of Lohora Moore (Lepidoptera: Satyrinae), theSulawesi bush browns. Invertebrate Systematics 17:129–141.
Wagner, M. 2001. Seasonal changes in the canopy arthropodfauna in Rinorea beniensis in Budongo Forest, Uganda. PlantEcology 153:169–178.
Walther, B., and J. L. Moore. 2005. The concepts of bias,precision and accuracy, and their use in testing theperformance of species richness estimators, with a literaturereview of estimator performance. Ecography 28:815–829.
Whittaker, R. H. 1960. Vegetation of the Siskiyou Mountains,Oregon and California. Ecological Monographs 30:279–338.
Whittaker, R. H. 1972. Evolution and measurement of speciesdiversity. Taxon 21:213–251.
Wilcox, B. A. 1984. In situ conservation of genetic resources:determinants of minimum area requirements. SmithsonianInstitution Press, Washington, D.C., USA.
Williams-Linera, G., M. Palacios-Rios, and R. Hernandez-Gomez. 2005. Fern richness, tree species surrogacy, andfragment complementarity in a Mexican tropical montanecloud forest. Biodiversity and Conservation 14:119–133.
Willott, S. J., D. C. Lim, S. G. Compton, and S. L. Sutton.2000. Effects of selective logging on the butterflies of aBornean rainforest. Conservation Biology 14:1055–1065.
Wolters, V., J. Bengtsson, and A. S. Zaitsev. 2006. Relationshipamong species richness of different taxa. Ecology 87:1886–1895.
APPENDIX A
An example of the calculation of the six different diversity parameters used in the study (Ecological Archives A019-090-A1).
APPENDIX B
Linear and Mantel correlations between study groups (Ecological Archives A019-090-A2).
MICHAEL KESSLER ET AL.2156 Ecological ApplicationsVol. 19, No. 8