alpha-1-acid glycoprotein as a potential - Edinburgh Napier ...
278
ALPHA-1-ACID GLYCOPROTEIN AS A POTENTIAL BIOMARKER OF BREAST CANCER IN AT RISK INDIVIDUALS. Submitted by Emma Louise Dewar A thesis submitted in partial fulfilment of the requirements of Edinburgh Napier University, for the award of Doctor of Philosophy. September 2015 School of Life, Sport and Social Sciences Edinburgh Napier University Edinburgh
-
Upload
khangminh22 -
Category
Documents
-
view
3 -
download
0
Transcript of alpha-1-acid glycoprotein as a potential - Edinburgh Napier ...
ALPHA-1-ACID GLYCOPROTEIN AS A POTENTIAL
BIOMARKER OF BREAST CANCER IN AT RISK INDIVIDUALS.
Submitted by
Emma Louise Dewar
A thesis submitted in partial fulfilment of the requirements of
Edinburgh Napier University, for the award of Doctor of Philosophy.
September 2015
School of Life, Sport and Social Sciences
Edinburgh Napier University
Edinburgh

I
Declaration
It is hereby declared that this thesis is the result of the author’s
original research. It has been composed by the author and has not
been previously submitted for examination which has led to the
award of a degree.
Signed:

II
Acknowledgements
I would like to thank all those who have helped make this project both enjoyable
and possible over the past three years.
Firstly, to Dr Kevin Smith, for instigating my journey into the world of
postgraduate research as well as continuing support and advice throughout this
process. Secondly, to Dr Gerardine (Gerri) Matthews-Smith for her guidance
and unyielding support when everything seemed lost. To Dr Roseanne
Cetnarkskyj I would like to say thank you for negotiating the obtainment of my
second sample set, as well as the organising and facilitating of clinics for their
collection, plus assistance whenever it was needed. Furthermore, thank you to
Dr David Mincher and Dr Clare Taylor for joining my supervisory team to aid the
completion of this project, your help has been invaluable. Thanks also go to
Miss Elaine Anderson for allowing access to my second sample population.
I am incredibly grateful for the help, advice, and friendship provided by my
fellow research students and my work colleagues both past and present.
Particular thanks go to Lucy McVey for keeping me sane these last 3 years.
Lastly to my family and partner Josh Ritchie, thank you for putting up with me
during my studies, I know it probably wasn’t easy.
“Happiness can be found, even in the darkest of times, if one only remembers
to turn on the light”

III
Abstract
The identification of a blood-based diagnostic biomarker for breast cancer (BC)
would be particularly beneficial to those at increased risk of developing BC and
could result in earlier detection which may increase survival rates due to earlier
treatment. Alterations in α-1-acid glycoprotein (AGP) glycosylation levels occur
during disease and this study sought to determine the diagnostic potential of
AGP glycan variation in triple negative breast cancer (TNBC) compared to BC
of unknown type and healthy controls as well as women at increased risk of
developing BC compared to age-matched healthy controls.
AGP was isolated from blood of two different sample populations using low
pressure chromatography. AGP purity was confirmed using SDS-PAGE and
concentration determined using spectrophotometry. Structural analysis of AGP
glycan monosaccharide and oligosaccharide content was undertaken using high
pH anion-exchange chromatography with pulsed amperometric detection
(HPAEC-PAD).
Increased AGP concentrations were observed, in comparison to their controls,
in BC of unknown type, TNBC and “at-risk” samples. Quantitative alterations in
monosaccharide composition were also present. N-acetylgalactosamine
(GalNAc) was present in over 88% of TNBC samples and was inversely
correlated with age. For the TNBC groups, GalNAc was also present at higher
levels in samples of individuals with family history of BC. There was an overall
increase in GlcNAc levels compared to age-matched healthy controls and
GalNAc presence in 81% of “at risk” samples.
Oligosaccharide analysis revealed increased branching in BC of unknown type
and TNBC <35 years of age, whereas the “normal” healthy population and
TNBC >35 possessed less branching. A similar trend was observed between
the “at risk” samples and the age-matched controls. These branching patterns
aligned well with the corresponding monosaccharide data.
Overall, this study indicated that alterations in AGP levels and glycosylation
exist between TNBC compared to BC of unknown type and “normal” healthy
controls as well as an “at risk” population and age-matched healthy controls.
The data could underpin the development of a new diagnostic BC biomarker.

IV
List of Figures
Chapter 1
Figure 1.1 Hemiacetal Configuration of Common Monosaccharides within
Glycans.
Figure 1.2 Formation of Glycosidic Linkgages.
Figure 1.3 Representation of Bond Between Terminal GlcNAc and Asn
Residue.
Figure 1.4 N-linked Glycosylation.
Figure 1.5 Types of N-linked Glycan Structure.
Figure 1.6 Unglycosylated Structure of AGP Variants.
Figure 1.7 Protein Alignment of AGP Variants.
Figure 1.8 Illustration of AGP N-linked Glycosylation Possibilities.
Figure 1.9 Summary Flow Diagram of AGP Isolation and Analysis.
Chapter 2
Figure 2.1 Pulsed Potentials of the PAD System During HPAEC.
Chapter 4
Figure 4.1 Low Pressure Chromatography Chromatogram Produced During
AGP Isolation.
Figure 4.2 SDS-PAGE Gel Proving AGP Purification.
Figure 4.3 Plot of Variation of Absorbance with Concentration of
Commercially Purchase Human AGP.
Figure 4.4 Plot of Variation of Mean Isolated AGP Concentration.
Figure 4.5 Mean AGP Concentration of At-Risk and Age-Matched Healthy
Control Samples.

V
Figure 4.6 Isolated AGP Levels of At-Risk Samples Compared to Age-
Matched Healthy Controls or Mean Healthy Control.
Chapter 5
Figure 5.1 Oxyanion Formation.
Figure 5.2 HPAEC Separation Chromatogram of Common N-linked Glycan
Monosaccharides.
Figure 5.3 Identification of Unknown Peak.
Figure 5.4 Chromatogram of Commercially Purchased Human AGP Samples
to Highlight Dionex Reproducibility.
Figure 5.5 Plot of Peak Area Variation with Known Concentrations of
Common N-linked Glycan Monosaccharides and Galactosamine.
Figure 5.6 Mean Monosaccharide Content of TNBC Samples by Age
Compared to Controls.
Figure 5.7 Mean Monosaccharide Content of Samples With and Without
Family History.
Figure 5.8 Mean Monosaccharide Content of Treated and Untreated TNBC
Compared to Controls.
Figure 5.9 Mean Monosaccharide Content of TNBC Sample by Stage
Compared to Controls.
Figure 5.10 Mean Monosaccharide Content of At-Risk and Healthy Control
Populations.
Figure 5.11 Comparison of Monosaccharide Content of At-Risk Samples with
Age-Matched Healthy Controls.
Figure 5.12 Illustration of Structural Differences Between High Mannose,
Complex and Hybrid N-linked Glycan Types.

VI
Chapter 6
Figure 6.1 N-linked Oligosaccharide (5µg) Library.
Figure 6.2 Oligosaccharide Chromatogram of “Normal” Healthy Controls
Compared to an N-linked Oligosaccharide (5µg) Library.
Figure 6.3 Oligosaccharide Chromatogram of BC of Unknown Type Controls
Compared to an N-linked Oligosaccharide (5µg) Library.
Figure 6.4 Oligosaccharide Chromatogram of TNBC Sample CT79
Compared to an N-linked Oligosaccharide (5µg) Library.
Figure 6.5 Oligosaccharide Chromatogram of TNBC Sample F5412
Compared to an N-linked Oligosaccharide (5µg) Library.
Figure 6.6 Oligosaccharide Chromatogram of TNBC Sample MT3965
Compared to an N-linked Oligosaccharide (5µg) Library.
Figure 6.7 Oligosaccharide Chromatogram of TNBC Sample MT2305
Compared to an N-linked Oligosaccharide (5µg) Library.
Figure 6.8 Oligosaccharide Chromatogram of TNBC Sample MT2621
Compared to an N-linked Oligosaccharide (5µg) Library.
Figure 6.9 Oligosaccharide Chromatogram of TNBC Sample MT3625
Compared to an N-linked Oligosaccharide (5µg) Library.
Figure 6.10 Oligosaccharide Chromatogram of TNBC Sample MT1106
Compared to an N-linked Oligosaccharide (5µg) Library.
Figure 6.11 Oligosaccharide Chromatogram of TNBC Sample MT1937
Compared to an N-linked Oligosaccharide (5µg) Library.
Figure 6.12 Oligosaccharide Chromatogram of TNBC Sample MT3759
Compared to an N-linked Oligosaccharide (5µg) Library.
Figure 6.13 Oligosaccharide Chromatogram of TNBC Sample MT1177
Compared to an N-linked Oligosaccharide (5µg) Library.
Figure 6.14 Oligosaccharide Chromatogram of TNBC Sample MT1178
Compared to an N-linked Oligosaccharide (5µg) Library.
VII
Figure 6.15 Oligosaccharide Chromatogram of TNBC Sample MT3601
Compared to an N-linked Oligosaccharide (5µg) Library.
Figure 6.16 Oligosaccharide Chromatogram of TNBC Sample MT2569
Compared to an N-linked Oligosaccharide (5µg) Library.
Figure 6.17 Oligosaccharide Chromatogram of TNBC Sample MT3352
Compared to an N-linked Oligosaccharide (5µg) Library.
Figure 6.18 Oligosaccharide Chromatogram of TNBC Sample MT3362
Compared to an N-linked Oligosaccharide (5µg) Library.
Figure 6.19 Oligosaccharide Chromatogram of TNBC Sample MT3442
Compared to an N-linked Oligosaccharide (5µg) Library.
Figure 6.20 Oligosaccharide Chromatogram of TNBC Sample MT3497
Compared to an N-linked Oligosaccharide (5µg) Library.
Figure 6.21 Oligosaccharide Chromatogram of W1 Compared to C1 and an N-
linked Oligosaccharide (5µg) Library.
Figure 6.22 Oligosaccharide Chromatogram of W2 Compared to C2 and an N-
linked Oligosaccharide (5µg) Library.
Figure 6.23 Oligosaccharide Chromatogram of W3 Compared an N-linked
Oligosaccharide (5µg) Library.
Figure 6.24 Oligosaccharide Chromatogram of W4 Compared to C4 and an N-
linked Oligosaccharide (5µg) Library.
Figure 6.25 Oligosaccharide Chromatogram of W5 Compared to C5 and an N-
linked Oligosaccharide (5µg) Library.
Figure 6.26 Oligosaccharide Chromatogram of W6 Compared to C6 and an N-
linked Oligosaccharide (5µg) Library.
Figure 6.27 Oligosaccharide Chromatogram of W7 Compared to C7 and an N-
linked Oligosaccharide (5µg) Library.
Figure 6.28 Oligosaccharide Chromatogram of W8 Compared to C8 and an N-
linked Oligosaccharide (5µg) Library.
VIII
Figure 6.29 Oligosaccharide Chromatogram of W9 Compared to an N-linked
Oligosaccharide (5µg) Library.
Figure 6.30 Oligosaccharide Chromatogram of W10 Compared to an N-linked
Oligosaccharide (5µg) Library.
Figure 6.31 Oligosaccharide Chromatogram of W11 Compared to C11 and N-
linked Oligosaccharide (5µg) Library.
Figure 6.32 Oligosaccharide Chromatogram of W12 Compared to C12 and an
N-linked Oligosaccharide (5µg) Library.
Figure 6.33 Oligosaccharide Chromatogram of W13 Compared to C13 and an
N-linked Oligosaccharide (5µg) Library.
Figure 6.34 Oligosaccharide Chromatogram of W14 Compared to an N-linked
Oligosaccharide (5µg) Library.
Figure 6.35 Oligosaccharide Chromatogram of W15 Compared to an N-linked
Oligosaccharide (5µg) Library.
Figure 6.36 Oligosaccharide Chromatogram of W16 Compared to an N-linked
Oligosaccharide (5µg) Library.
Figure 6.37 Illustration of Possible Glycan Branching in AGP.

IX
List of Tables
Chapter 1
Table 1.1 Scottish Government Breast Cancer Risk Stratification.
Table 1.2 Scottish Breast Cancer Surveillance Guidelines.
Table 1.3 TNM System of Classification.
Table 1.4 Prospective Breast Cancer Biomarkers.
Table 1.5 Summary of AGP Functions.
Chapter 2
Table 2.1 Composition of Low Pressure Chromatography Elution and
Desorption Buffers.
Chapter 3
Table 3.1 TNBC Sample Information.
Table 3.2 Positive Control Sample Information.
Table 3.3 Negative Control Sample Information.
Table 3.4 At-Risk Sample Demographics.
Table 3.5 Age-matched Healthy Control Sample Demographics.
Chapter 4
Table 4.1 Summary of Isolated AGP Concentrations.
Table 4.2 Summary of Isolated AGP Concentrations of At-Risk Samples
Compared to Age-Matched Healthy Control Samples.
Chapter 5
Table 5.1 Equations Devised from Standard Curve to Determine mol
monosaccharide/mol AGP content of each sample.
Table 5.2 Monosaccharide Content of Dataset 1 Samples.
Table 5.3 Monosaccharide Content of Dataset 2 Samples.
Table 5.4 Monosaccharide Content Trends Observed in At-Risk Samples.

X
Chapter 6
Table 6.1 Oligosaccharide Branching Trends Observed in At-Risk Samples.

XI
Abbreviations
AAT alpha-1-antitrypsin
AGP alpha-1-acid glycoprotein
ANOVA analysis of variance
APR acute phase response
Arg Arginine
Asn Asparagine
BC breast cancer
BRCA1 breast cancer gene 1
BRCA2 breast cancer gene 2
BMI body mass index
CA15.3 cancer antigen 15.3
CA27.29 cancer antigen 27.29
CDH1 cadherin 1, E-cadherin
CEA carcinoembryonic antigen
CGD Clinical Genetics Department
CHEK2 checkpoint kinase 2
CI Chief Investigator
CMF cyclophosphamide, methotrexate and fluorouracil
Con A conclavin A
DCIS ductal carcinoma in situ
DNA deoxyribonucleic acid
Dol-P dolichylphosphate
EDTA ethylenediaminetetraacetic acid
ELISA enzyme-linked immunosorbent assay
ENU Edinburgh Napier University
EPO erythropoeitin
ER oestrogen receptor
fMLP N-formylmethionyl-leucyl-phenylalanine
Fuc fucose
Gal galactose

XII
GalNAc N-acetylgalactosamine
GCSF granulocyte colony stimulating factor
GDP guanosine diphosphate
Glc glucose
GlcNAc N-acetylglucosamine
GlcNAcT-V N-acetylglucosaminyltransferase V
GP general practitioner
HCl hydrochloric acid
HER2 human epidermal growth factor 2
HPAEC-PAD high pH anion-exchange chromatography with
pulsed amperometric detection
HPLC high performance liquid chromatography
HR hormone receptor
HRT hormone replacement therapy
HSA human serum albumin
IDC invasive ductal carcinoma
IHC immunohistochemistry
IL-1β interleukin 1 beta
IL-2 interleukin 2
IL-6 interleukin 6
ILC invasive lobular carcinoma
KCl potassium chloride
kDa kilo Dalton
KSCN potassium thiocyanate
LCIS lobular carcinoma in situ
LPS lipopolysaccharide
Lys Lysine
Man mannose
MCA mucin-like carcinoma associated antigen
MRI magnetic resonance imaging
MUC-1 mucin 1
NaCl sodium chloride

XIII
NaOAc sodium acetate
NaOH sodium hydroxide
NeuAc neuraminic acid
nm nanometres
NPI Nottingham Prognostic Indicator
NTAC neoadjuvant Taxotere®, Adriamycin® and
cyclophosphamide
OH hydroxyl group
ORM1 orosomucoid 1
ORM 2 orosomucoid 2
OST oligosaccharyltransferase
PEG polyethylene glycol
PHA phytohaemagglutinin
Phe phenylalanine
pI isoelectric point
PIS participant information sheet
pKa dissociation constant
PNGase F peptide-N-glycosidase F
PR progesterone receptor
Pro Proline
PTEN phosphatase and tensin homologue
PWM pokeweed mitogen
R&D research and development
REC research ethics committee
RER rough endoplasmic reticulum
ROS reactive oxygen species
RT radiotherapy
SA sialic acid
SD standard deviation
SDS sodium dodecyl sulfate
SDS-PAGE sodium dodecyl sulfate polyacrylamide gel
electrophoresis

XIV
Ser Serine
SLex sialyl lewis X antigen
STK11 serine-threonine kinase 11
TAC Taxotere®, Adriamycin® and cyclophosphamide
TFA trifluoroacetic acid
Thr Threonine
TMED tetramethylethylenediamine
TNBC triple negative breast cancer
TNF-α tumour necrosis factor alpha
TNM tumour node metastasis
TP53 tumour protein 53
Tris-HCl 2-Amino-2-hydroxymethyl-propane-1,3-diol
hydrochloride
Trp Tryptophan
Tyr Tyrosine
UDP uridine diphosphate
UICC Union for International Cancer Control
UK United Kingdom
UV ultra-violet

XV
Preface
This thesis is a written account of independent postgraduate research
undertaken by the author, investigating Alpha-1-acid glycoprotein (AGP)
glycosylation as a potential biomarker of breast cancer (BC) in women at risk of
BC development.
Acute phase reaction (APR) as a result of pathological and physiological
conditions causes AGP (a positive acute phase protein) plasma concentration
to increase 2-5 fold, with increased expression of abnormal AGP glycoforms
compared to normal AGP glycoforms. Raised AGP levels have been identified
in BC patients and progression of the disease has been linked to increasing
AGP plasma levels. Additionally, there is evidence that unique alterations of
AGP glycosylation are present in other disease conditions thus there is a strong
possibility that the same is true of BC.
Chapter 1 provides an overview of current knowledge regarding glycan
biosynthesis and their attachment to proteins as well as more detailed
information about AGP’s structure and known functions. Furthermore, the
recent links between triple negative breast cancer (TNBC) occurrence and
BRCA1 and BRCA2 mutations are introduced with discussion of the patient
pathway and current guidelines for increased surveillance of these individuals.
Chapter 2 summarises the materials and methodology used to conduct the
research including low pressure chromatography for isolation of AGP, SDS-
PAGE to prove successful AGP isolation, spectrophotometry for calculation of
concentration of AGP present in samples, acid hydrolysis and enzyme digestion
to cleave monosaccharides and oligosaccharide for analysis and finally high pH
anion exchange chromatography with pulsed amperometric detection (HPAEC-
PAD) for analysis of AGP glycan composition (monosaccharides) and structure
(oligosaccharides).
Chapter 3 discusses the two datasets of samples recruited for the study.
Dataset 1 was comprised of plasma samples from women suffering from TNBC
at various ages compared to “normal” healthy samples and women with BC with
an unknown molecular subtype. Dataset 2 was composed of women at
increased risk developing BC due to family history risk. This cohort were
recruited from a local NHS familial breast screening clinic (for women under age

XVI
50 with an increased risk due to genetic testing or family history risk
assessment) who then were compared to age-matched healthy controls in a
case-control style manner.
Chapter 4 illustrates the results of AGP isolation and level determination from
both datasets. Discussion is given regarding the variations or similarities in AGP
levels in different sample populations of both dataset 1 and dataset 2 as well as
the isolation method chosen.
Chapter 5 provides a comprehensive overview of HPAEC-PAD and its use for
analysis of monosaccharide content of glycans. Monosaccharide content results
of AGP glycans using HPAEC-PAD are displayed and discussed, as variation in
these levels can indicate alterations in structure.
Chapter 6 presents the versatility of HPAEC-PAD and its subsequent use for
structural analysis of intact AGP glycans (oligosaccharide). An explanation of
the technical aspects of the technique is given as well as presentation and
discussion of sample results from datasets 1 and 2.
Lastly, chapter 7 details the conclusions drawn from this study in terms of
AGP’s potential use a BC biomarker in “at risk” individuals. Additionally this
chapter give suggestions for future work that could supplement the current
research.
The results of this study have been published in part in the following publication:
Dewar, E., Matthews-Smith, G., Cetnarskyj, R., and Smith, K.D., (2014). Alpha-
1-Acid Glycoprotein as a Breast Cancer Biomarker in At Risk Individuals. 9th
European Breast Cancer Conference (abstract number 240), Glasgow, March
2014.

XVII
Aims
To evaluate the diagnostic potential of alterations to AGP levels and
glycosylation patterns in TNBC compared to BC of an unknown molecular type
as well as “normal” healthy controls and women at increased risk of BC
development compared to a ‘normal’ healthy age-matched control population.
Hypothesis
This study hypothesised that significant differences in AGP levels,
monosaccharide content and oligosaccharide (glycan) structure may be present
in TNBC samples compared to BC of an unknown molecular type and “normal”
healthy controls. It was also hypothesised that modifications to AGP glycan
content, structure and levels occur in women at increased risk of BC
development, which may be seen at the early stages of BC development,
compared to “normal” healthy age-matched controls.

XVIII
Contents
Declaration I
Acknowledgements II
Abstract III
List of Figures IV
List of Tables IX
Abbreviations XI
Preface XV
Aims XVII
Hypothesis XVII
Chapter 1 – Literature Review .................................................................................... 1
1.1 Breast Cancer. .................................................................................................. 2
1.1.1 Breast Cancer Overview. ............................................................................ 2
1.1.2 High Risk Factors for Breast Cancer Development. .................................... 2
1.1.2.1 Hodgkin’s Lymphoma ........................................................................... 6
1.1.2.2 Histological and Molecular Breast Cancer Types. ................................ 6
1.1.2.3 Histological Breast Cancer Staging. ..................................................... 9
1.1.3 Clinical Features of High Risk Breast Cancer. ........................................... 10
1.1.3.1 Triple Negative BC. ............................................................................ 11
1.1.4 Current Breast Cancer Biomarkers. .......................................................... 12
1.1.5 Need for a Diagnostic Breast Cancer Biomarker. ...................................... 15
1.2 Glycosylation and Cancer ............................................................................. 16
1.2.1 Glycosylation and Breast Cancer .............................................................. 19
1.2.2 O- and N- Glycosylation as Drivers for the Breast Cancer Subtypes
Discussed in This Thesis. ........................................................................................ 20
1.2.3 Glycobiology ............................................................................................. 22
1.2.4 Glycan Components .................................................................................. 23
1.2.5 Glycoproteins ............................................................................................ 27
1.2.5.1 Biosynthesis of N-linked Glycans. ...................................................... 29
1.2.5.2 Types of N-linked Glycans: High-Mannose, Complex and Hybrid. ...... 33
1.3 Alpha-1-acid Glycoprotein ............................................................................. 34
1.3.1 AGP Structure ........................................................................................... 35
1.3.2 AGP Function ............................................................................................ 40
1.3.3 AGP in Cancer. ......................................................................................... 44

XIX
1.3.4 AGP is an Ideal Candidate for a BC Biomarker. ........................................ 47
1.4 Research Strategy. ......................................................................................... 48
Chapter 2 – Materials and Methodology. ................................................................. 51
2.1 Introduction................................................................................................. 52
2.1.1 Dataset 1 Sample Acquisition and Demographics. .................................... 52
2.1.2 Dataset 2 NHS Sample Acquisition. .......................................................... 53
2.1.2.1 Population Identification. .................................................................... 53
2.1.2.2 Ethical Approval. ................................................................................ 53
2.1.2.3 Recruitment and Informed Consent. ................................................... 54
2.1.2.4 Inclusion Criteria. ............................................................................... 55
2.1.2.5 Exclusion Criteria. .............................................................................. 55
2.1.2.6 Blood Draw and Data Collection Sheet. ............................................. 55
2.1.3 Phase 2 ENU Age-Matched Negative Control Sample Acquisition. ........... 55
2.1.3.1 Population Identification. .................................................................... 55
2.1.3.2 Ethical Approval. ................................................................................ 56
2.1.3.3 Recruitment and Informed Consent. ................................................... 56
2.1.3.4 Inclusion Criteria. ............................................................................... 56
2.1.3.5 Exclusion Criteria. .............................................................................. 56
2.1.3.6 Family History, Blood Draw and Data Collection Sheet. ..................... 57
2.2 Laboratory Materials and Methods. ........................................................... 57
2.2.1 Samples .................................................................................................... 57
2.2.2 AGP Isolation ............................................................................................ 57
2.2.3 Determination of Sample AGP Concentration. .......................................... 61
2.2.4 High pH Anion-Exchange Chromatography. .............................................. 62
2.3 Statistical Analysis. .................................................................................... 66
Chapter 3 – Participant Demographics ................................................................... 67
3.1 Dataset 1 Sample Demographics. ............................................................. 68
3.2 Dataset 2 Sample Demographics. ............................................................. 70
3.3 Patient Demographic Discussion. ............................................................. 72
Chapter 4 – AGP Isolation and Level Determination .............................................. 76
4.1 AGP Isolation. ............................................................................................. 77
4.2 Calculation of Sample AGP Concentration. .............................................. 79
4.3 Dataset 1 AGP Concentration. ................................................................... 80
4.4 Dataset 2 AGP Concentration. ................................................................... 83
4.5 Discussion. ................................................................................................. 85
4.5.1 Purification of AGP. ............................................................................... 85
4.5.2 Determination of Isolated AGP Levels. .................................................. 89
4.5.3 Alternative Supportive Methodologies. ................................................... 90
4.5.4 Variation of Isolated AGP Content in Healthy Individuals. ...................... 90
XX
4.5.5 Isolated AGP Levels from Dataset 1. ..................................................... 92
4.5.6 Isolated AGP Levels from Dataset 2. ..................................................... 94
4.5.7 Variants of AGP. .................................................................................... 97
4.6 Summary Statement. .................................................................................. 97
Chapter 5 – Monosaccharide Analysis Results and Discussion ........................... 99
5.1 Introduction............................................................................................... 100
5.2 Dataset 1 Results. ..................................................................................... 103
5.3 Dataset 1 Monosaccharide Content Results. .......................................... 106
5.4 Dataset 2 Monosaccharide Results. ........................................................ 112
5.5 Discussion. ............................................................................................... 123
5.5.1 Introduction. ......................................................................................... 123
5.5.2 Trends in AGP Monosaccharide Content. ............................................ 124
5.5.3 Benefits and Shortcomings in the Methodology Used. ......................... 135
5.5.4 Additional Methodologies to Study Glycan Content. ............................ 136
5.6 Summary Statement. ................................................................................ 137
Chapter 6 – Oligosaccharide Analysis Results and Discussion. ........................ 139
6.1 Introduction............................................................................................... 140
6.2 Dataset 1 Oligosaccharide Results. ........................................................ 142
6.3 Dataset 2 Oligosaccharide Results. ........................................................ 155
6.4 Discussion. ............................................................................................... 167
6.4.1 Introduction. ......................................................................................... 167
6.4.2 Trends in Oligosaccharide Branching Observed in Dataset 1. ............. 169
6.4.3 Trends in Oligosaccharide Branching Observed in Dataset 2. ............. 174
6.4.4 Profiles of Glycosylation Enzymes. ...................................................... 178
6.4.5 Benefits and Shortcomings in the Methodology. .................................. 180
6.4.6 Additional Methodologies to Study Branching. ..................................... 181
6.5 Summary Statement. ................................................................................ 182
Chapter 7 – Conclusion and Future Work ............................................................. 183
7.1 Conclusions. ............................................................................................. 184
7.2 Future Work. ............................................................................................. 191
References .............................................................................................................. 194
Appendix ................................................................................................................. 240

1
Chapter 1 – Literature Review

2
1.1 Breast Cancer.
1.1.1 Breast Cancer Overview.
Breast cancer (BC) is the most common cancer in women in the UK with over
49,000 new cases in 2011 and accounts for almost a third of cancers diagnosed
in women (Information Services Division: ISD Scotland., 2014; Northern Ireland
Cancer Registry., 2013; Office for National Statistics., 2011; Welsh Cancer
Intelligence and Surveillance Unit., 2014). This type of cancer occurs when the
DNA of ductal epithelial cells of the breast is altered from proto-oncogenes to
oncogenes, leading to formation of malignant masses, or tumours, in the breast
tissue. These DNA modifications can be sporadic or inherited with family history
being a significant risk factor in BC development. Inherited BCs are often
diagnosed at a young age and are more commonly bilateral (National Cancer
Institute., 2014). However, the majority of BCs are sporadic and tend to occur
when somatic cells i.e. non-germline cells that are not inherited become
mutated. This may be due to the individual having several risk factors linked to
BC development (see Table 1.1), with scientists estimating that 42% of BC
incidences could be prevented by being physically active, drinking less alcohol
and reducing obesity (World Cancer Research Fund., 2011). Other risk factors
for the general population include being female (Siegel, et al., 2012), aging
(Sasieni, et al., 2011) and hormone replacement therapy (Beral, 2003; Ritte, et
al., 2012).
1.1.2 High Risk Factors for Breast Cancer Development.
Assessing increased risk using family history is formally defined using a specific
criteria. In Scotland the criteria used are strong family history of BC as well as
mutations of BRCA1 and BRCA2 genes which are considered high risk factors
for BC development (The Scottish Government., 2009). Currently Clinical
Genetics departments (CGD) in Scotland are the gatekeepers for early breast
screening based on family history which has been assessed using the criteria. If
a person has a family history of BC or ovarian cancer their GP can refer them to
clinical genetics after consulting guidelines for risk assessment and CGD will
formally take and confirm the cancers in a family history to then apply a risk of
low, moderate, high or very high risk of the individual developing BC (see Table

3
1.1) devised by Scottish Intercollegiate Guidelines Network (SIGN) which is an
adaptation of the guidelines used in England and Wales provided by the
National Institute for Health and Care Excellence (NICE; National Institute for
Health and Care Excellence. (2013)). Once risk level is determined, if
individuals have at least a 20% chance of having a BRCA1 and BRCA2
mutation, the two genes most associated with BC development, and there is a
living affected family member that person will be offered the option to have
genetic testing (The Scottish Government., 2009).
Table 1.1 Scottish Government Breast Cancer Risk Stratification.
Criteria for assessment of risk of breast cancer development in Scotland (The Scottish
Government., 2009).
A family history of BC has long been recognised as a predictor of BC
development. A first degree relative i.e. mother or sister diagnosed with BC over
age 50 effectively doubles an individual’s risk of developing BC, or trebles if the
relative was premenopausal at diagnosis or if there were two first-degree
relatives diagnosed. There is a lesser risk (1.5 fold) associated with a second
degree relative i.e. a grandparent or aunt diagnosed with BC (Pharoah, et al.,
1997). The risk also increases if multiple first degree relatives are diagnosed
with almost a 4 fold risk if three or more first degree relatives are diagnosed
(Collaborative Group on Hormonal Factors in Breast Cancer., 2001). The
aforementioned risk is also inversely proportional to the age of the relative and
is far higher if a brother rather than a sister is diagnosed with BC (Bevier, et al.,
2012).

4
If a BRCA1 or BRCA2 mutation is detected the affected individual will be offered
extra surveillance and possibly prophylactic surgery in the form of a
mastectomy to remove breast tissue to aid the prevention of BC development.
BRCA1 of BRCA2 mutation carriers are also at increased risk of ovarian cancer
(Gayther and Pharoah, 2010) and as such may also be offered a salpingo-
oophorectomy (removal of fallopian tubes and ovaries) to reduce the risk of
developing ovarian cancer. Women who are considered low risk can enrol in the
National Breast Cancer Screening Programme from age 50, for screening every
three years. Unaffected individuals with a family history assessed as moderate
will have screening offered from the age of 40 occurring every two years,
increasing to annually between ages 40-50. In contrast, the very high risk BC
group can be offered screening from age 25, with mammography every two
years increasing to annually then eighteen months when they reach age 50 as
this is an interim screen alongside the national screening service (see Table
1.2).
Table 1.2 Scottish Breast Cancer Surveillance Guidelines. (The Scottish
Government., 2009).
Mutations of BRCA1 and BRCA2 are dominantly inherited, accounting for
approximately 20-25% of hereditary BCs (Easton, 1999) and 5-10% of BCs
overall (Campeau, et al., 2008). BRCA1 and BRCA2 are genes (located on
chromosomes 17q21 and 13q12-13 respectively) found in breast cells and other

5
tissue which produce tumour suppressor proteins that aid the repair of DNA
when cells divide. Individuals have two copies of these genes, one inherited
from their mother and one from their father. If a mutation occurs in either copy,
the function may be lost and damaged DNA is not repaired. It is the
accumulation of unrepaired DNA that causes BC when these genes are
mutated, not the genes themselves (Hall, et al., 1990; Wooster, et al., 1994).
These genes have been extensively studied to assess the risk of BC
development in mutation carriers. Initially it was concluded there was an 84%
chance of developing BC for individuals carrying a BRCA1 or BRCA2 mutation
(Ford, et al., 1994). However, further studies examined the BC risk of each
gene separately, and discovered that BRCA1 mutations conferred a 54-65%
risk of developing BC by aged 70 or 45% if a BRCA2 mutation was present
(Antoniou, et al., 2003; Easton, et al., 1995). Conversely, a recent, UK based
study known as EMBRACE (Mavaddat, et al., 2013) found that by age 70,
BRCA1 mutation carriers had a 65% risk of BC development while BRCA2
mutation carriers had a 45% risk. Other genetic mutations are associated with
BC development to a lesser extent – CHEK2, TP53, PTEN, STK11 and CDH1
(Campeau, et al., 2008; Walsh, et al., 2006) – however not all BCs occurring
among relatives can be attributed to a genetic mutation.
Prophylactic mastectomy and salpingo-oophorectomy are offered to mutation
carriers and high risk relatives. Studies have shown that preventative surgery
significantly lowers risk of BC development by approximately 90%, but does not
entirely eradicate it (Hartmann, et al., 1999; Heemskerk-Gerritsen, et al., 2013;
Rebbeck, et al., 2004). However, even after risk-reducing mastectomies a small
number of women still go on to develop BC (Rebbeck, et al., 2004; Skytte, et
al., 2011).
While mastectomy is considered the most effective risk-reducing strategy for
BC, there is evidence that oophorectomy can also reduce risk of BC
development. This procedure is primarily used for prevention of ovarian cancer
but several studies have shown protective effects for breast cancer as well
particularly if performed before age 50. For instance oophorectomy prior to age
40 reduced the risk of BC development by 64% and 31% in BRCA1 and BRCA2
mutation carriers respectively (Domchek, et al., 2010; Rebbeck, et al., 2009).
This risk reduction does not appear to be affected by hormone replacement

6
therapy which may be given to prevent the effects of oophorectomy induced
menopause (Eisen, et al., 2008; Rebbeck, et al., 2005). However, in spite of the
aforementioned preventative measures some individuals still develop cancers of
the breast or peritoneum (Finch, et al., 2006; Olivier, et al., 2004; Rutter, et al.,
2003).
1.1.2.1 Hodgkin’s Lymphoma
A less well known high risk factor for BC development is radiotherapy treatment
for Hodgkin’s lymphoma. Hodgkin’s lymphoma is the uncontrolled proliferation
of B-lymphocytes and their congregation in sections of the lymphatic systems
such as lymph nodes. These proliferated B-lymphocytes are unable to fight
infection leaving an individual vulnerable to disease. Hodgkin’s lymphoma
usually presents at a young age and is commonly treated with radiotherapy to
the chest area. Studies have shown that having radiotherapy for Hodgkin’s
lymphoma puts individuals at a comparable risk of BC development to those
with mutations of BRCA1 and BRCA2 (Swerdlow, et al., 2012). It has also been
found that risk of BC is inversely correlated with age at treatment and reducing
the proportion of breast tissue exposed during treatment may reduce the risk of
BC in the future (De Bruin, et al., 2009; Swerdlow, et al., 2012). Maximum risk
of BC development was found at ages 50-59 and while an individual would be
eligible to participate in the national screening programme, there are
suggestions that they would benefit from more frequent screening which should
continue for more than 40 years after radiotherapy (De Bruin, et al., 2009;
Swerdlow, et al., 2012). Currently. in Scotland, if a person’s risk of BC
development is more than 30%, (as for individuals who had been treated with
radiotherapy for Hodgkin’s lymphoma) they are eligible for increased
surveillance as detailed in the guidelines for high and very high risk individuals
above in Table 1.2 (The Scottish Government., 2009).
1.1.2.2 Histological and Molecular Breast Cancer Types.
BC can occur as either a non-invasive or invasive tumour. Non-invasive cancers
are further subdivided into ductal carcinoma in situ (DCIS) and lobular

7
carcinoma in situ (LCIS). In situ refers to the state and location of the breast
epithelial cells; they have gone through malignant transformation and are now
proliferating but remain at the site of origin and do not penetrate the basement
membrane into surrounding tissues. DCIS and LCIS are not at risk of metastatic
spread as there are no blood vessels or lymphatics in the epithelial layer of the
breast (Sakorafas and Farley, 2003).
DCIS is also referred to as intraductal cancer and originates from the terminal
duct lobular epithelium and is a significant risk factor for development of
invasive BC (Leonard and Swain, 2004). DCIS usually presents as micro-
calcifications in a mammogram where calcium deposits have formed during
areas of rapid epithelial proliferation. Difficulties can arise when determining
whether DCIS will become invasive and therefore whether treatment for DCIS is
necessary. Treatment usually involves a small excision of cancerous ducts but
in some cases mastectomy is required. LCIS is rarer than DCIS and is a
proliferation of identical small cells forming a mass in multiple breast lobules
and sometimes in ducts. There is strong evidence to suggest that untreated
LCIS can develop into BC (Coopey, et al., 2012; Simpson, et al., 2003). In
contrast to DCIS, LCIS is almost impossible to detect via mammography as it
does not cause micro-calcifications and is not a substantial lesion however
areas of increased density in mammograms have been linked to LCIS (Beute,
et al., 1991; Georgian-Smith and Lawton, 2001; Sonnenfeld, et al., 1991).
The two most common types of invasive BC are invasive ductal carcinoma
(IDC) and invasive lobular carcinoma (ILC). Approximately 75% of BCs are IDC
with ILC accounting for a further 10%. The remaining 15% of diagnosed
invasive BCs are made up of rare types such as Mucinous, Medullary, Tubular,
and Papillary (Underwood, 2004).
IDC commonly presents as irregularly dense area of soft tissue with pointed
surface projections or as a palpable lump. As the name suggests IDCs originate
in the ductal epithelium but ultimately invade the surrounding breast tissue
allowing cancerous cells to infiltrate vascular and lymphatics systems which can
result in carriage to secondary locations forming metastases (King and Robins,
2006). A diagnosis of IDC often occurs when a tumour does not fit one of the
“special types” such as ILC since IDCs do not possess distinguishing features.
ILC is typically an asymmetrical thickening or bumpiness of the breast stroma

8
rather than a lump in the breast (IDC) that results in patients having much larger
tumours by the time they are symptomatic compared to patients with IDC. ILCs
do not usually present with microcalcification so are difficult to identify in
mammograms but a characteristic feature of ILC cells is their lack of E-
cadherin, a cell adhesion molecule (de Leeuw, et al., 1997). Treatment for both
IDC and ILC involves surgery and usually chemotherapy, radiotherapy or
hormone therapy depending on the severity and hormone receptor status of the
tumour.
In recent years research studies have provided a further classification of
tumours (mainly IDCs) in the form of molecular subtypes (Curtis, et al., 2012).
Four molecular subtypes of BC have been identified: normal breast-like,
luminal, basal-like and human epidermal growth factor 2 (HER2) with the
luminal subtype later being subdivided into luminal A and luminal B (Hu, et al.,
2006; Perou, et al., 2000; Sørlie, et al., 2001; Sørlie, et al., 2003). Of the four
molecular subtypes, luminal (both A and B) is the only subtype possessing
oestrogen receptors (ER) and are identified by having genes activated that are
linked to an ER pathway, low molecular weight cytokeratins. When subdivided,
Luminal A is usually a low histological grade, has high expression of ER-
activated genes, low expression of proliferation genes, and is associated with a
good prognosis. However, Luminal B subtypes have a worse prognosis and
display higher proliferation rates and histological grades (Sotiriou, et al., 2003).
The remaining three molecular subtypes (normal breast-like, HER2 and basal-
like) do not possess ERs. Normal breast-like subtypes show high expression of
genes usually found in adipose tissue and show similar gene expression to
normal breast samples during micro-array analysis (Peppercorn, et al., 2008).
This subtype tends to have a good prognosis but in many cases this may be a
false negative result due to the fact that there are not enough cancer cells
present in the sample. Therefore, further investigation is required to assess the
clinical significance of this subtype (Correa Geyer and Reis-Filho, 2009;
Pusztai, et al., 2006). HER2 and basal-like subtypes are linked with aggressive
clinical features such as larger tumour size and higher tumour grade (Voduc, et
al., 2010). The HER2 subtype is determined by overexpression of HER2 and its
associated genes as well as lack of ER and progesterone receptors (PR)
(Weigelt, et al., 2010). However some tumours with HER2 overexpressed are

9
not categorized as HER subtypes but are considered Luminal B if they have an
ER positive status (Parker, et al., 2009; Rouzier, et al., 2005). Lastly, despite
extensive research, the definition of basal-like tumours varies widely. They are
typically defined as tumour cells expressing genes found in normal basal
epithelial cells and tend to be triple negative (discussed in more depth in section
1.1.3.1) meaning they lack ER, PR or HER2 although this is not always the
case (Rakha, et al., 2008; Weigelt, et al., 2010).
1.1.2.3 Histological Breast Cancer Staging.
Patients can be grouped by the severity of their disease which allows clinicians
to construct a suitable treatment plan, give an indication of prognosis, evaluate
the effect of treatment, exchange information with other treatment centres and
contribute to cancer research. The TNM system of cancer classification was
developed by the Union for International Cancer Control (UICC; previously the
International Union Against Cancer) and is based on three main components:
extent of the primary Tumour; presence or absence and extent of surrounding
lymph Node metastasis and presence or absence of distant Metastasis. This is
one of the most commonly accepted approaches for determining the stage of
cancer and is normally presented as groups of stages that indicate chances of
patient survival (see Table 1.3). Other classification systems include the
Nottingham Prognostic Indicator (NPI), an index combining tumour size, lymph
node status and grade to divide patients into three prognostic groups (good,
moderate and poor) using the calculation 0.2 x tumour size (cm) + grade (1-3) +
lymph node status (1= no nodes; 2= 1-3 nodes; 3= ≥3 lymph nodes are
involved) (Harmer, 2011).

10
Table 1.3 TNM System of Classification. Method of grouping cancer
patients based on tumour dimension (no primary tumour present i.e. T0 and ≥5cm or progression into chest wall/oedema/ulceration being T4); lymph node infiltration with N0= no lymph node metastasis to N3= infiltration into internal mammary lymph nodes and distant metastasis where M0= no metastasis and M1= distant metastasis (Sobin, et al., 2009).
1.1.3 Clinical Features of High Risk Breast Cancer.
Higher risk of BC development is associated with early age onset and
aggressive clinical features. While there is some debate surrounding what age
confers “young”, most studies agree that this refers to women below the age of
35-40. Approximately 7% of all BCs are diagnosed in women younger than 40
(National Cancer Institute., 2012) and there is evidence to suggest that this
number is rising (Leclère, et al., 2013). BC within this group tends to be
aggressive, have a high histological grade, be triple negative (TN), and possess
a basal-like phenotype.
Research has revealed that BC in younger women arises through distinct
biological pathways compared to older women (Anders, et al., 2008). Younger
women (<40) with BC had an altered molecular phenotype distribution in
comparison to a general population with BC (Collins, et al., 2012). The age of
diagnosis has been shown to inversely correlate with poor prognosis; the risk of
mortality increasing by 5% for every year reduction in age of diagnosis (Gajdos,
et al., 2000; Han, et al., 2010). Younger patients often have much larger, more
T N M
Stage 0 0 0 0
Stage 1 1 0 0
0 1 0
1 1 0
2 0 0
2 1 0
3 0 0
0 2 0
1 2 0
2 2 0
3 1/2 0
Stage 3B 4 0/1/2 0
Stage 3C Any 3 0
Stage 4 Any Any 1
Stage 2A
Stage 2B
Stage 3A
11
invasive tumours, have nodal involvement with more nodes affected and the
majority were diagnosed at stage II or III. A further feature differing between
young and older BC sufferers is that young patients are more likely to present
with a palpable mass as opposed to a mammographic lesion but this is due to
mammography screening not being routinely recommended for young women
unless they are at increased risk of BC development (Gajdos, et al., 2000).
Additionally, risk of local and distant recurrence is increased if BC develops at a
young age (Dubsky, et al., 2002; Nixon, et al., 1994). Age is not an independent
risk factor for BC development but biological factors alone fail to explain the
differences between BC in younger and older women.
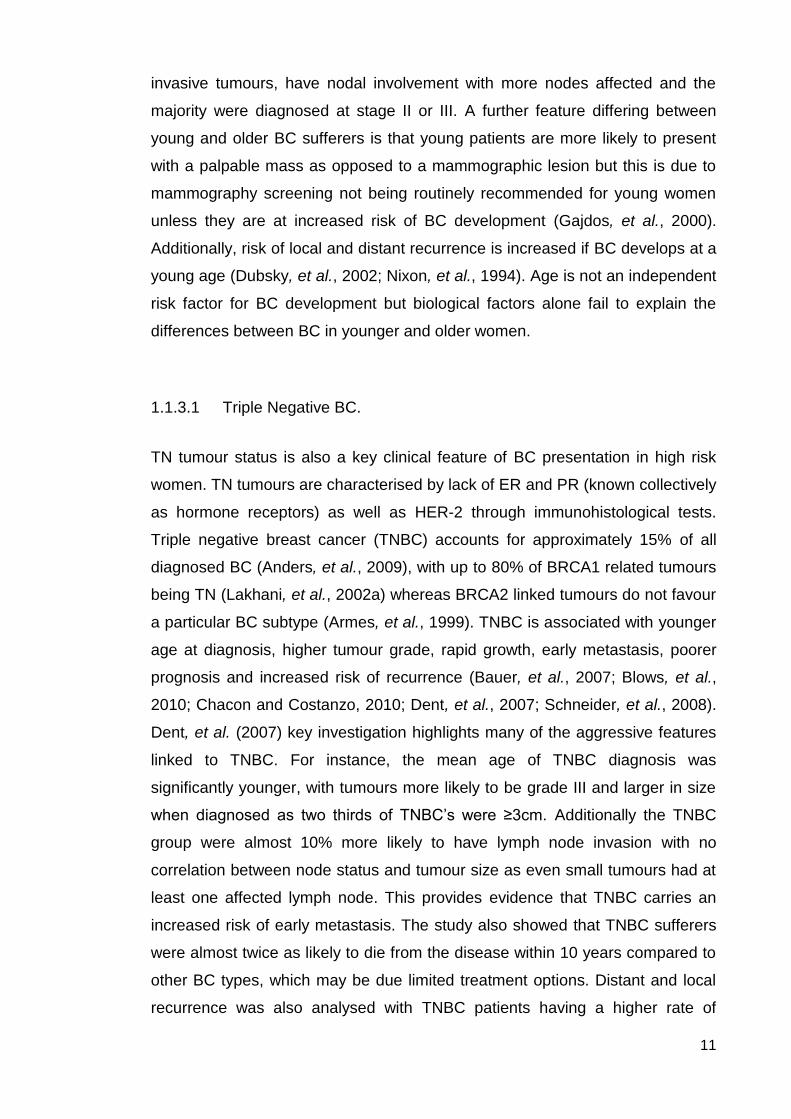
1.1.3.1 Triple Negative BC.
TN tumour status is also a key clinical feature of BC presentation in high risk
women. TN tumours are characterised by lack of ER and PR (known collectively
as hormone receptors) as well as HER-2 through immunohistological tests.
Triple negative breast cancer (TNBC) accounts for approximately 15% of all
diagnosed BC (Anders, et al., 2009), with up to 80% of BRCA1 related tumours
being TN (Lakhani, et al., 2002a) whereas BRCA2 linked tumours do not favour
a particular BC subtype (Armes, et al., 1999). TNBC is associated with younger
age at diagnosis, higher tumour grade, rapid growth, early metastasis, poorer
prognosis and increased risk of recurrence (Bauer, et al., 2007; Blows, et al.,
2010; Chacon and Costanzo, 2010; Dent, et al., 2007; Schneider, et al., 2008).
Dent, et al. (2007) key investigation highlights many of the aggressive features
linked to TNBC. For instance, the mean age of TNBC diagnosis was
significantly younger, with tumours more likely to be grade III and larger in size
when diagnosed as two thirds of TNBC’s were ≥3cm. Additionally the TNBC
group were almost 10% more likely to have lymph node invasion with no
correlation between node status and tumour size as even small tumours had at
least one affected lymph node. This provides evidence that TNBC carries an
increased risk of early metastasis. The study also showed that TNBC sufferers
were almost twice as likely to die from the disease within 10 years compared to
other BC types, which may be due limited treatment options. Distant and local
recurrence was also analysed with TNBC patients having a higher rate of

12
distant recurrence primarily in the immediate three years after diagnosis while
risk of local recurrence was similar to that of other BC types.
There is some overlap between triple negative histological subtype and basal-
like molecular subtypes in the literature but the two are not synonymous. There
is controversy surrounding the definition of basal-like BCs (for a recent review
see Badve, et al. (2011) while there is definitive agreement TNBCs are ER, PR
and HER2 negative. Furthermore, in a clinical setting immunohistological
staining is more readily available than testing used to determine molecular
subtypes, thus tumours are more likely to be classified as TN than basal-like
(Nielsen, et al., 2004). This study will refer to TNBCs throughout.
1.1.4 Current Breast Cancer Biomarkers.
A biomarker is defined as a measurable characteristic that can be evaluated to
indicate normal biological processes, pathogenic processes or monitor
therapeutic interventions (Atkinson, et al., 2001). Biomarker research is thought
to be imperative as clinical benefits could include earlier disease detection,
improved monitoring of disease detection and treatment (Popescu, et al., 2010;
Whelan, et al., 2008). A main priority of cancer detection is to develop
biomarkers that can be detected via less invasive and complex methods and
which also have the sensitivity and specificity to identify cancer earlier
(Somasundaram, et al., 2009), thus improving mortality rates, cost-effectiveness
and potentially reducing the need for invasive treatment. However, there are
very few biomarkers currently capable of this and those that are, often require
improvement through the use of a biomarker panel to be successful (Anderson,
2005; Rifai, et al., 2006).
With regards to BC, finding a suitable serum biomarker would be of great
importance to those with an increased risk since the current methods, although
greatly improving detection, such as palpation, mammography and MRI
scanning (magnetic resonance imaging) are not capable of identifying all
tumours. Additionally, repeated exposure to radiation from mammography
screening increases risk of developing a cancer by 0.3-0.6 fold (Berrington de
González, 2011). For instance, calcium deposits surround a lesion that could
indicate BC onset cannot be visualised using MRI, smaller tumours in the early

13
stages may not be palpable and mammography has decreased sensitivity in
women with dense breasts (Checka, et al., 2012). A BC biomarker, particularly
one that is a blood constituent, could enable identification of disease presence
where imaging technologies fail and could allow more frequent screening
starting at a younger age than can be provided using mammography.
Presently, there are only two clinically adopted biomarkers capable of
distinguishing BC existence from “healthy” individuals but not for early diagnosis
only for evidence of metastasis and evaluating treatment success. The first is
carcinoembryonic antigen (CEA), a glycoprotein generated during foetal
development by the large intestine although it has also been found in adult
human blood at very low levels. Serum concentrations of CEA are increased in
patients with ovarian, lung, pancreatic, liver, colorectal, prostate and BCs. In
particular, women with metastatic BC show a 30-50% increase in CEA levels
and a positive correlation between therapeutic response and CEA in women
with metastasis (Cheung, et al., 2000; Mughal, et al., 1983; Williams, et al.,
1988). The second marker for BC is mucin 1 (MUC-1), a glycoprotein bound to
the surface of epithelial cells of the stomach, pancreas, ovaries, bladder,
respiratory tract and breast. Production of MUC-1 is upregulated and glycan
chains of MUC-1 become truncated during BC compared to MUC-1 from normal
breast epithelials. Cancer antigen 15.3 (CA15.3) is a secreted and soluble form
of MUC-1, the concentration of which can be used to determine prognosis.
CA15.3 has a similar specificity but much higher sensitivity when compared to
CEA testing alone and is regarded as the “gold standard” test for BC
management (Seregni, et al., 2008).
Over 80% sensitivity is achieved for detection of metastasis when measuring
CEA and CA15.3 together (Robertson, et al., 1999). An investigation by
Ebeling, et al. (2002) revealed that elevated levels of CA15.3 and serum CEA
prior to surgical intervention were positively correlated with death from BC and
early relapse. A decline in levels of CA15.3 and CEA were noted post-surgery.
However, in patients where the concentrations of CEA decreased by over 33%
were at significantly higher risk of death and relapse, which multivariate analysis
showed to be an independent prognostic indicator. Research by Nicolini, et al.
(2006) showed that a combination of classical BC biomarkers CEA, CA15.3 and
tissue polypeptide (TPA) was more effective than the MCA (mucin-like
carcinoma associated antigen)-CA15.3 biomarker panel at detecting early BC

14
relapse. Using all three markers greatly improved overall sensitivity with only a
minor decrease in specificity. Another study revealed that combined
measurement of CA15.3 and SLex might be better at detecting metastasis and
monitoring BC than the CEA-CA15.3 combination (Kurebayashi, et al., 2006). In
2001 Gion and colleagues published a paper confirming their earlier work in
1999 that cancer antigen 27.29 (CA27.29) was of comparable quality to CA15.3
for management of BC patients and was more sensitive when there was a
limited antigen concentration (Gion, et al., 1999; Gion, et al., 2001).
Earlier research has already revealed several potential BC biomarkers.
However, most of these are not sensitive or specific enough. Yet, advances in
proteomic technologies that detect prospective biomarkers have enabled
analysis of new biomarker possibilities. For instance, identification of tumour
antigens through a proteomics approach allows for post-translational
modifications to be assessed whereas previous methods detection methods
such as analysis of recombinant proteins did not. This enables detection of
autoantibodies that react to naturally occurring proteins, including lysates from
tumours and their cell lines, allowing antigenicity towards changes in post
translational modifications such as glycosylation to be uncovered (Misek and
Kim, 2011). Profiling of serum and nipple aspirate fluid has been enhanced by
using mass spectrometry to interrogate bodily fluids for possible biomarkers.
Mass spectrometry permits direct protein content analysis of human biofluids
enabling fast detection of prospective biomarkers (Gast, et al., 2009; Pawlik, et
al., 2006). Recently, several new biomarker candidates have been investigated
(see Table 1.4).

15
Biomarker Type
CA15.3 Serum Protein
HER-2/neu Serum Protein
RS/DJ-1 Serum Protein/Autoantibody
p53 Autoantibody
HSP60 Autoantibody
HSP90 Autoantibody
Mucin-related Autoantibody
α-2-HS-glycoprotein Ductal Protein
Lipophilin B Ductal Protein
β-globin Ductal Protein
Hemopexin Ductal Protein
Vitamin D-binding protein Ductal Protein
Table 1.4 Prospective Breast Cancer Biomarkers. [Adapted
from Misek and Kim (2011)] Recently investigated potential biomarkers for breast cancer.
While these biomarkers are appropriate for monitoring BC progression and
treatment efficacy they are all unsuitable for detecting the onset of BC, and
there are currently no biomarkers that can.
AGP is a potential BC biomarker due to it displaying aberrant glycosylation
during diseases such as cancer (Turner, et al., 1985; Hashimoto, et al., 2004;
Saldova, et al., 2007) and its suitability as a BC biomarker is discussed further
in section 1.3.4.
1.1.5 Need for a Diagnostic Breast Cancer Biomarker.
The overview provided earlier in this chapter highlights a need for increased
surveillance for those at greater risk of BC. While mammography is a highly
specific and sensitive method of detection for BC in national screening
programmes, there are some BCs that go unnoticed and screening can only be
offered every few years to avoid excess radiation exposure that could induce
cancer (Berrington de González, 2011; NHS Breast Screening Programme,
2003). Magnetic resonance imaging (MRI) can also be used for detection of BC
in addition to mammography and can be offered at a younger age and more
frequently that mammography. However, due to cost, this is not currently
funded in Scotland for women at increased risk of BC due to family history or
mutation status. Both these detection methods run the risk of over diagnosing
patients resulting in an individual receiving unnecessary treatment for a lesion

16
that would not have developed into cancer. However, at present there is no way
of telling whether an abnormality detected during screening will develop into
cancer and so the best option is to proceed with treatment (Marmot, et al.,
2012). Therefore, there is still a need for a more cost-effective, less harmful
method of BC screening that could be used more often for women at increased
risk of BC or the general population. A model biomarker would be located in the
blood with the ability to be used for both detection and prognosis. A blood
based biomarker would require minimally invasive procedures to retrieve and
components could be easily isolated for analysis. To date, no suitable blood-
based biomarkers have been identified for the detection of BC. While
biomarkers such as CEA and CA15.3 glycoprotein are routinely used clinically,
there are none suitable for early diagnosis of BC or screening programmes.
This is because they may also be raised in benign conditions and have very low
sensitivity and specificity [for a recent review see Mirabelli and Incoronato
(2013)]. Absence of an effective blood-based biomarker leads to late diagnosis
of many BC sufferers, limiting their treatment options and increasing their
mortality. As both CEA and CA15.3 are glycoproteins capable of evaluating BC
prognosis, investigation of other glycoproteins as potential biomarkers may be
beneficial.
1.2 Glycosylation and Cancer
Investigation into the altered metabolism of cancer cells has enabled the
definition of six hallmarks of cancer which have been widely researched and
were originally defined as: sustaining proliferative signalling; evading growth
suppressors; activating invasion and metastasis; enabling replicative
immortality; inducing angiogenesis and resisting cell death (Hanahan and
Weinberg, 2000). More recently, these six hallmarks have been expanded by a
further four to include avoiding immune destruction; genome instability and
mutation; tumour-promoting inflammation and deregulating cellular energetics
such as the Warburg effect (Hanahan and Weinberg, 2011; Warburg, et al.,
1928) giving a new total of ten cancer hallmarks. Aberrant glycosylation of a
number of molecules is a known consequence of cancer (Dube and Bertozzi,
2005) and contributes to several of the above hallmarks of cancer.

17
Changes in glycosylation may be due to a number of factors including differing
levels of glycosyltransferases and glycosidases as well as their location within
the cell, availability and activity of nucleotide sugars, availability of protein
substrates and expression of molecules that regulate glycoprotein folding
(Varki, et al., 2009). The altered glycosylation may disrupt normal cellular
functions and contribute to tumour growth, metastasis and immune evasion or
may be a consequence of altered cell metabolism that could be used as
biomarkers (Varki, et al., 2009).
Glycosylated molecules such as glycoproteins exist as secretory molecules or
as glycoconjugates on cell surfaces; therefore it is important to consider both
when discussing their involvement in cancer. The most common glycan
alterations during cancer occur in N- and O- linked glycans and include
sialylation, fucosylation, truncation and branching (Stowell, et al., 2015).
Additionally, cancer cells often revert to expression of oncofetal antigens which
are more commonly expressed in foetal tissue during development as opposed
to normal adult tissue (Sapra, et al., 2012).
Sialylation is the addition of sialic acid residues usually as terminal structures,
such as Neu5ac, to glycans which are involved in cell adhesion, cell to cell
signalling and cellular recognition (Varki, et al., 2009). Increases in sialylation
have been identified in active cancer and this correlates with a decreased cell
adhesion which may aid the metastasis of tumour cells (Dennis, et al., 1982;
Nadanaka, et al., 2001; Renkonen, et al., 1997 and Ugorski, et al., 2002).
Furthermore, the viability of cancer cells may be increased by alterations of α2-
6 sialylation expression that contribute to tumour growth via mechanisms
independent of glycoproteins (Kroes, et al., 2010, Bobowski, et al., 2012). It has
also been proposed that increased sialylation of cancer cells provides protection
from the immune system and subsequent eradication (Bull, et al., 2014).
Similarly, fucosylation is the incorporation of the monosaccharide fucose into
glycan chains and this process has been shown to occur at differing rates
during the early and late stages of cancer. Early stage cancer appears to favour
increased fucosylation as research has shown an upregulation of
fucosyltransferase 8 (FUT8) which may aid cell proliferation (Chen, et al., 2013).
However, once established, tumours display less fucosylation which may assist
their survival via NK cell evasion through interaction with a secondary signalling

18
pathway known as tumour necrosis factor-related apoptosis-inducing ligand
(TRAIL; Moriwaki, et al., 2009). Furthermore, increased fucosylation is
associated with an increase in Sialyl LewisX (SLeX) terminal structures. SLeX is
a ligand involved in cell adhesion, therefore increased expression may play a
role in metastasis through increased binding of tumour cells in secondary
organs (Julien, et al., 2011).
Another characteristic of cancer cells is truncated glycans, particularly O-linked
glycans. These usually exist as more complex structures however during
cancer, mucin-like O-linked glycans become truncated resulting in formation of
Tn or Sialyl Tn (STn) stuctures. A solitary GalNAc confers Tn while and GalNAc
joined to a sialic acid denotes STn. In both instances GalNAc remains attached
to the protein via a linkage to the hydroxyl group of Serine or Threonine.
Research has indicated that truncation of O-glycans may enhance malignant
properties of cells including proliferation rate, invasive growth, loss of growth
inhibition and tissue architecture as well as alterations in the adhesion of
basement membranes (Radhakrishnan, et al., 2014).
Additionally, the Warburg effect describes the increased uptake and anaerobic
metabolism of glucose by cancer cells for energy to facilitate proliferation
(Warburg, et al., 1928). Recently, the Warburg effect has been linked to
increased O-GlcNAc transferase which catalyses the addition of N-
acetylglucosamine to proteins and lipids (Jozwiak, et al., 2014). It has been
hypothesised that O-GlcNAcylation acts as a nutrient sensor and may link cell
metabolism to transcription and signal transduction (Butkinaree, et al., 2010;
Hanover, et al., 2010) resulting in enhanced proliferation, growth, angiogenesis
and metastasis (Khan, et al., 2013; Porta, et al., 2014).
Increases in β1-6 branching of N-linked glycans arises from amplified
expression GlcNAc tranferase V and can explain the increased size of
glycopeptides derived from tumour cells. GlcNAc transferase V is encoded by
MGAT5 and studies have shown their involvement in tumour growth and
metastasis when increased. For example, increased β1-6 branching induced by
elevated GlcNAc transferase V resulted in more cell migration as well as
decreased cell-cell and cell-matrix adhesion (Demetriou, et al, 1995) while mice
deficient in MGAT5 had reduced tumour proliferation and metastasis

19
(Granovsky, et al., 2000). Thus highlighting the role of increased β1-6 N-linked
glycan branching in cancer progression.
Finally, tumour cells often display markers normally only seen during foetal
development. These markers are known as oncofoetal antigens and the two
most evident in the research are alpha fetoprotein (AFP) and carcinoembryonic
antigen (CEA), both of which are glycoproteins (Zhang, et al., 2015). AFP has a
similar amino acid sequence to albumin, a minimal carbohydrate content of 3%
and is present at low levels in normal adults. However, serum AFP
concentrations of above 500ng/ml are linked with malignancy (Farinati, et al.,
2006). Similarly, CEA is also expressed in malignancy as well as foetal
development and is currently used clinically as an indicator and monitor of
cancer. For example, persistently elevated CEA may indicate metastasis or
ineffective therapy (Dallas, et al., 2012; Prager, et al., 2014) and pre-operative
CEA can give an indication of patient prognosis (Amri, et al., 2013).
1.2.1 Glycosylation and Breast Cancer
Breast cancer remains the leading and most common cancer diagnosed in
women (Information Services Division: ISD Scotland., 2014; Northern Ireland
Cancer Registry., 2013; Office for National Statistics., 2011; Welsh Cancer
Intelligence and Surveillance Unit., 2014) and as such, extensive research has
been undertaken to identify potential biomarkers of diagnosis and prognosis as
well as therapeutic targets. Much of this research has investigated altered
glycosylation during BC using antibodies and lectins to recognise specific
carbohydrate structures which unveiled variations in cell surface and serum
protein glycosylation between BC and normal individuals. Elevated expression
of truncated O-linked glycans, such as Tn and STn antigens, as well as
increased N-linked β1-6 branching have been observed in breast cancer (Wu,
et al., 2010, Saldova, et al., 2011). Increased sialic acid and fucose content was
also noted due to the over expression of Lewis type structures such as SLex
(Saldova, et al., 2011). Observations in serum proteins during BC have also
indicated variations in mannose content and it is hypothesised that changes in
processing of glycans which would normally trim Man9 structures leads to an
increased expression of high mannose structures in place of complex and

20
hybrid N-linked glycans (de Loez, et al., 2011). All of the aforementioned glycan
alterations correlated with changed expression of the corresponding
glycosyltransferases that contribute to their formation – galactosyltransferases,
fucosyltransferases, sialyltransferases and N-acetylglucosaminyltransferases
(Potapenko, et al., 2010; Wu, et al., 2010; Burchell, et al., 1999).
The effects of these glycan alterations on patient prognosis and metastasis
have also been investigated. Such research has shown that increased N-linked
β1-6 branching and over expression of Lewis type epitopes is associated with
poor outcomes in BC patients (Madjid, et al., 2005; Cui, et al., 2011) with
expression of both SLex and SLea linked to higher risk of metastasis (Julien, et
al., 2011; Nakagoe, et al., 2002). Additionally, the increased presence of high
mannose structures have been shown to correlate with breast cancer
progression (de Loez, et al., 2011).
Finally, aberrant glycosylation observed during BC has led to the use of
glycoproteins such as CEA and CA 15-3 as serum BC biomarkers (discussed in
more detail earlier in section 1.1.4). However, these glycoproteins lack the
specificity and sensitivity required of diagnostic biomarkers so are not suitable
for screening purposes (Anderson, 2005; Rifai, et al., 2006). Similarly, changes
in glycosylation observed during BC are also displayed in other cancer types as
mentioned in the previous section of this literature review (1.2). Therefore, a
clear necessity for further investigation of altered glycosylation during BC has
been highlighted.
1.2.2 O- and N- Glycosylation as Drivers for the Breast Cancer Subtypes
Discussed in This Thesis.
The main BC subtype discussed throughout this thesis is TNBC, which may
also be referred to as basal-like BC in the literature. As discussed in section 1.2,
O-linked glycosylation is the post-translational addition of GalNAc to hydroxyl (-
OH) groups of Ser/Thr followed by attachment of further monosaccharides by
various glycosyltransferases (Varki, et al., 2009). N-linked glycosylation is more
complex (see Figure 1.4) and occurs as the transfer of a donor molecule
(Glc3Man9GlcNAc2) to the amino groups of Asn residues at sites where the
correct amino acid sequence exists (Asn-X-Ser/Thr) (Varki, et al., 2009).

21
Currently, little research has been performed with regards to glycosylation
patterns within BC subtypes. Yet, O- and N-linked glycosylation of particular cell
surface molecules have been found to aid the progression of certain BC
subtypes (Srinivasan, et al., 2014).
A recent study carried out by Lee, et al., 2014 revealed structural glycan
alterations of luminal A, HER2 and basal-like cell secretions compared to
normal breast epithelial cells using LC-MS. Their research showed an increase
in hybrid N-linked structures, higher levels of glycan branching, increased SLex/a
terminal structures as well as elevated fucosylation and overall degree of
sialylation in basal-like BC cells. However, similar results were also seen in
luminal and HER2 subtypes apart from basal-like cells having bisecting GlcNAc
present and higher concentrations of α2-6 sialylation. Alpha 2-6 sialylation can
occur in both O- and N-linked glycans with increases being linked to late stage
BC (Alley and Novotny, 2010). As glycan sialylation is believed to aid tumour
growth and contribute to metastasis through its functions in cell-cell recognition,
cell adhesion and cellular recognition, increases in α2-6 sialylation are not
unexpected in late stage cancer. Furthermore, TNBC is notoriously aggressive,
fast growing and is linked with poor patient outcomes (Bauer, et al., 2007;
Blows, et al., 2010; Chacon and Costanzo, 2010; Dent, et al., 2007; Schneider,
et al., 2008). This also fits with the hypothesis that increased α2-6 sialylation of
O- and N-linked glycans could be a contributing factor.
With regards to cell surface molecule glycosylation driving BC subtypes,
research by Srinivasan et al (2014) revealed that N-linked glycosylation of
ADAM8, a transmembrane metalloproteinase, occurred in ER negative tumours
but not in ER positive tumours and that ADAM8 activity was reliant on correct N-
linked glycosylation. ADAM8 has been shown to be upregulated in TNBC and is
involved in cell adhesion as well as activation of growth pathways such as β1-
integrin which promotes invasion and metastasis (Romagnoli, et al, 2014).
Furthermore, MUC1 - a heavily O-glycosylated protein located in cell
membranes – has been shown to express aberrant O-linked glycans on its
surface after malignant transformation of cells (Gendler, et al., 1988). Recent
research has shown a high expression of MUC-1 in TNBC tumour cells which
correlated with tumour grade (Siroy, et al., 2013). However, other studies have
noted an inverse correlation between MUC1 expression and tumour grade
22
(Rahn, et al., 2001). Throughout cancer MUC1 has been shown to interact with
p53 to inhibit apoptosis which enables malignant cells to proliferate unimpeded
(Wei, et al., 2005) and promote tumour invasion through beta-catenin. This
association with beta-catenin results in the promotion of metastasis through
epithelial-mesenchymal transition. This is the transformation of epithelial cells to
mesenchymal stem cells through loss of cell-cell adhesion and cell polarity with
enhancement of invasive and migratory mechanisms (Schroeder, et al., 2003
and Roy, et al., 2011). Therefore, increased expression of MUC1 in TNBC may
contribute to the aggressive development and poor patient outcome linked with
this BC subtype.
1.2.3 Glycobiology
Glycobiology is the study of proteins and lipids which have covalently linked,
oligosaccharide chains added to their surface catalysed by enzymes
(Rademacher, et al., 1988). Oligosaccharide chains (also known as glycans)
are composed of monosaccharides that share a (CH2O)n chemical formula. The
chains are synthesised as a co-translational and/or a post-translational
modification. Glycosylation takes place in the endoplasmic reticulum and Golgi
apparatus, generating a variety of particular glycoconjugates in the form of
either glycolipids or glycoproteins. At a molecular level, glycosylation is
controlled by enzyme clusters known as glycosyltransferases, within the
endoplasmic reticulum and Golgi, which catalyse the joining of
monosaccharides, arranging them in precise sequences to generate
oligosaccharide chains. Therefore, glycosylation is not directly regulated
genetically like the majority of protein or lipid alterations (Kobata, 1992;
Sasisekharan and Myette, 2003). The variety of glycoconjugates (i.e.
glycoproteins or glycolipids) produced can be affected by similar enzymes being
present in other cell and tissue types causing trimming and/or additional
monosaccharides being added to a glycan resulting in glycoforms. Glycoforms
are proteins with the same amino acid sequences but possess different glycans
(Lis and Sharon, 1993; Rademacher, et al., 1988). Variation between
glycoconjugates is known as heterogeneity and the collections of glycoforms
that arise are referred to as the glycome.

23
Glycoconjugates are essential, having a vast array of functions such as acting
as adhesion molecules and sometimes as enzymes. Generation of
glycoconjugates uses large amounts of energy in an ordered and complex
manner (Kornfeld and Kornfeld, 1985; Taylor and Drickamer, 2003; Varki, 2009)
with glycosylation often being responsible for large amounts of a protein’s (or
lipid’s) mass (Rademacher, et al., 1988). For instance, oligosaccharides
account for 45% of the molecular mass α-1-acid glycoprotein (AGP). It is also
reported that approximately 70% of proteins undergo glycosylation (Wormald
and Dwek, 1999).
These factors, imply that glycosylation of macromolecules is purposeful. For
example, cancer progression has been shown to rely on glycans being present.
For instance, increased sialyl Lewis X antigen (SLex; an inflammation derived
terminal antigen structure containing fucose) present on glycans during cancer
amplifies interactions with P-selectins which aids dissemination of tumours
(Kim, et al., 1998). This has enabled links to be drawn between glycan function
and many pathophysiological or physiological conditions (Varki, 1993).
Overall, glycobiology is an important area of biomedical research that has yet to
be fully explored. An accumulation of research in this area highlights that
glycosylation is involved in many aspects of human life, from development to
cancer progression. Therefore, it is possible that glycan composition could be
used as a biomarker for BC onset.
1.2.4 Glycan Components
As discussed in section 1.2.1 glycosylation is the post-translation modification of
a molecule through the addition of glycans (sugar chains). Glycans are
comprised of monomeric units known as monosaccharides which can be
discriminated between by their functional groups. There are two fundamentally
different monosaccharides that differ in their functional groups at carbon 1 (C1;
the anomeric carbon atom), namely, keto and aldehyde, which are composed of
the C1 carbon atom linked covalently by a double bond to oxygen. When the
structure of a monosaccharide is considered in its open-chain form, if a keto
group is present, the double bond is located within a chain (>C=O) and the

24
monosaccharide is described as a ketose. Whereas aldoses have an aldehyde
group with the double bond situated at the C1 end (-CH=O) (Bertozzi and
Rabuka, 2009).
Oligosaccharides occur when eight or less monosaccharides undergo
polymerisation (Bertozzi and Rabuka, 2009). The number of carbon atoms
within the structure can be used to sub classify monosaccharides for instance;
galactose (Gal), glucose (Glc) and mannose (Man) possess six and are
therefore termed hexoses. Fucose (Fuc) also has six carbons but is referred to
as a deoxyhexose as carbon 6 (C6) is missing a hydroxyl group (-OH), while
sialic acids (SA; Gal with common terminating sugars α-2-3 or α-2-6 linked, also
known as neuraminic acid NeuAc) are located on glycan termini and have nine
carbons (Varki, 1992). Furthermore, a second group of monosaccharides
known as hexosamines incorporate an amino group on the second of six
carbons and tend to occur as N-acetylated structures such as N-
acetylgalactosamine (GalNAc) and N-acetylglucosamine (GlcNAc).These are
the most common sugars found within glycoconjugates (see Figure 1.1 below
for summary). Monosaccharides can exist as one of two stereoisomers, either
D- or L- (with the former being the most common within nature), depending on
whether the -OH group on the chiral centre found farthest away from the –CHO
functional group has the D-glyceraldehyde configuration (OH to the right in the
Standard Fischer Projection formula) or the L-glyceraldehyde configuration (OH
to the left in the Standard Fischer Projection formula) (Bertozzi and Rabuka,
2009).

25
Figure 1.1 Hemiacetal Configuration of Common Monosaccharides within Glycans. Chemical structures of a selection of monosaccharides that normally
compose glycoprotein oligosaccharide chains, as stable hemiacetal rings. As Fuc is a deoxyhexose the “missing” –OH group on C6 has been emphasised using .
The formation of glycan chains occurs when monosaccharides join together
through the –OH group of C1 and another –OH group of a neighbouring residue
forming a glycosidic bond through the loss of a H2O molecule (condensation
reaction) shown in Figure 1.2. Depending on the conformation of the –OH
group of C1, the adjacent –OH must be in either the α or β anomeric position
and the types of monosaccharides that are linked during the reaction determine
whether the subsequent oligosaccharides are homo- or heterogenous. This
creates a large assortment of glycans from few monosaccharides (termed
heterogeneity), as the structure can vary marginally in length of chains,
sequence, number of chains attached or type of bond. This structural diversity is
illustrated by the fact that only six tripeptides can be generated from three

26
amino acids but 27, 648 trisaccharides can be produced from just three
hexoses (Maeder, 2002). Furthermore, sugars are able to possess various
linkage positions resulting in more complex structures being produced and by
displaying α and β anomers even more glycan varieties can be formed.
Figure 1.2 Formation of Glycosidic Linkages. Examples of α- (A) and β- (B) 1, 4-
linkages between two sugar molecules. Linkages can also occur between carbon 1 and carbon 6 (1, 6-linkage).
Overall, it is remarkable that oligosaccharide structures are capable of such
wide variation in composition. It is this variation in structure and glycan
attachment to proteins to form glycoproteins that is of great interest for
discovery of a BC biomarker.
OH
H
H
OH
O
CH2OH
H
H
OH
H
HO
H
H
H2O
O
H
CH2OH
O
H
H
OH OH
H
1
4
B
OH
H H
H
OH
CH2OH
O
H
H
OH OH
H
O
CH2OH
H
H
OH
H
HO
H
H
H2O
O
1 4
A
H

27
1.2.5 Glycoproteins
Glycoproteins are polypeptides covalently linked to oligosaccharide moieties
that usually have a SA residue at their terminus. The biosynthesis of glycans is
a complex process but necessary as glycans contribute to stability and function
of the recipient polypeptide. The addition of glycans to the polypeptide
backbone can occur as a co- and/or post-translational modification.
Glycans commonly become linked to polypeptides via either N- or O-linkages at
the reducing end of the oligosaccharide chain. At specific asparagine residues
within the protein portion, N-linkages can occur through the amide nitrogen,
while O-linkages arise via an –OH group of serine/threonine (Ser/Thr). It is
known that approximately 97% of all blood plasma glycoproteins possess N-
linked glycans (Finne and Krusius, 1979). Their synthesis is complex and
attachment to the polypeptide requires the specific tripeptide sequence Asn-X-
Ser(Thr) in order to occur. This sequence can be used to predict which Asn
residues in the protein backbone will become glycosylated via an N-link (Gavel
and von Heijne, 1990). Due to specific requirements such as an appropriately
positioned consensus sequence, sufficient oligosaccharyltransferase activity
and variety of fully assembled, glycosylated lipid-linked oligosaccharide donors,
glycosylation only occurs on roughly one third of Asn residues (Kornfeld and
Kornfeld, 1985). The intricate synthesis of N-linked glycans from a common
precursor results in the possession of a characteristic core structure of
GlcNAc2Man3.

28
Figure 1.3 Representation of Bond Between Terminal GlcNAc and Asn Residue. [Adapted from Garrett and Grisham (2005)] Depiction of linkage between
terminal monosaccharide GlcNAc and the Asn residue in the consensus sequence of the recipient protein to form a basic glycoprotein prior to processing.
In comparison, O-linked glycan synthesis is much simpler, without the
requirement for a consensus sequence in the inner core; it is GalNAc normally
attached to Ser/Thr. However, thereafter glycan diversity is increased due to
numerous core structures being generated by such a simple synthesis. O-linked
glycans may contain Glc within the oligosaccharide chain and tend to exist on
glycoproteins originating from epithelial cells (Dell and Morris, 2001).
Many glycoproteins are exclusively either N- or O- linked. For example AGP, α-
1-antitrypsin (AAT), tissue plasminogen activator, interferon β and interferon γ
only possess N-linkages while granulocyte colony stimulating factor (GCSF)
and interleukin-2 (IL-2) are solely O-linked. It is possible for glycoproteins to
carry an assortment of N- and O-linkages as is the case of coagulation factor
VIII and the hormone erythropoietin (EPO) (Lis and Sharon, 1993).
Integration of glycoproteins in different cell types strongly influences their
expression. The polypeptide backbone is synthesised through the transcription
and translation of particular genes and co-ordinates glycosylation sites (Freeze,
2001). Glycoform expression from different cell types is capable of producing a
wide variety of glycans as each type has a diverse assortment of enzymes
which catalyse glycan formation, resulting in a large amount of heterogeneity.
α-D-N-acetylglucosamine
(GlcNAc)
Asparagine residue
(Asn)
NH
O
C CH3 H
OH
CH2OH
H
O
OH H
NH H C
O
CH2 C
C O
H
N H
OH

29
Therefore, variance between glycan compositions can reveal the biochemical
and physiological conditions present during production as well as tissue or cell
origin (van Dijk, et al., 1994). Glycosylation of proteins with a diverse
assortment of glycans is essential for normal mammalian function as glycans
are involved in biomolecule and cellular recognition, movement of enzymes
within cells and ceasing leukocyte rolling during inflammation. However, to gain
a wide variety of glycans, a complex mode of synthesis is required which is fully
explored in the following section. Glycan heterogeneity affects the conformation
of a glycoprotein which changes its physical properties such as solubility or
stability. This influences functions such as cell-cell, protein-protein or protein-
saccharide recognition; intracellular enzyme trafficking and inhibition of
leukocyte rolling during inflammation (Durand and Seta, 2000; Sears and Wong,
1998).
The majority of serum proteins possess surface glycans. The glycosylation of
proteins is the final stage in the maturation of the protein structure. If
glycoproteins fail to become glycosylated, their function may be altered or lost
entirely. EPO is an example of a protein whose activity is reduced when it is has
incomplete glycosylation. In order to function correctly EPO must be
glycosylated at three N-linked sites (positions 24, 38 and 83) and one O-linked
site (126). EPO regulates red blood cell synthesis upon release from the
kidneys, but is rapidly eliminated by the liver if reduced SA content of the
glycans occurs. Removal of SA residues can occur during or after biosynthesis
during recycling of cell surface molecules (Varki, 2009). This highlights the
importance of glycosylation as anaemia can occur in an individual if EPO is
removed before it can participate in the synthesis of red blood cells (Macdougall
and Eckardt, 2006).
1.2.5.1 Biosynthesis of N-linked Glycans.
N-linked glycosylation occurs in the membrane of the rough endoplasmic
reticulum (RER) and Golgi. It is the en bloc transferal of a Glc3Man9GlcNAc2 (a
tetradecasaccharide) from a polyisoprenyl donor onto the amide nitrogen
located at the terminus of an Asn side chain acting as an acceptor protein.

30
In order for N-linked glycosylation to occur on the amide group of Asn residues,
β-turns within the secondary structure of polypeptides must be formed. β-Turns
are formed when hydrogen bonds arise between the hydroxyl (-OH) group of
Ser/Thr and an Asn residue amide (CO-NH2) group (Smith, et al., 1997).
Therefore, the consensus sequence (Asn-X-Ser/Thr) resides as a β-turn, where
X can be any amino acid except proline (Pro) as it is missing an α-amide proton
preventing β-turn configuration (Bause, 1983). A bond can now form between
the –NH group of the Asn amide residue and terminal monosaccharide
(GlcNAc) of a basic glycan chain resulting in the beginning of a glycoprotein
(see Figure 1.3). It may also be possible for N-linked oligosaccharides to react
with neutral, aromatic amino acid side chains in the three amino acids adjacent
to glycosylated Asn residues (Yet and Wold, 1990). Newly added glycans are
then processed and trimmed in the RER and Golgi by competitive enzymes
known as glycosidases and glycosyltranserases e.g. mannosidase, glucosidase
and galactotransferase. These enzymes can catalyse several varied reactions
due to their competitive nature, increasing microheterogeneity of the glycans
produced (Couldrey and Green, 2000; Guile, et al., 1996).
N-linked glycosylation occurs in four locations (summarised in Figure 1.4). In
the cytosol of the RER, monosaccharides become bound to nucleotides to
create high energy molecules such as GDP-Man and UDP-GlcNAc that attach
to the lipid dolichylphosphate (Dol-P) situated in the RER membrane, forming
Man5GlcNAc2-Dol-P. The transfer of nucleotide-bound monosaccharides to Dol-
P is catalysed by GlcNAc-transferase, GlcNAc-1-phosphotransferase and
mannosyltransferase. Transporter proteins termed flippases then cause the
structure to move from the RER cytosol to the RER lumen (Sanyal and Menon,
2009) where another seven monosaccharides are joined to the structure via
glycosidic bonds creating the oligosaccharide precursor Glc3Man9GlcNAc2.
Oligosaccharyltransferase (OST) is a multimeric complex that transfers the
oligosaccharide precursor from Dol-P to Asn in the consensus sequence (Asn-
X-Ser/Thr) of nascent glycoproteins (Dennis, et al., 1999; Imperiali and
O’Connor, 1999). The structure is then trimmed by glycosidases whilst being
translocated through the RER and Golgi. In the medial Golgi GlcNAc-
transferases perform substitutions and lastly, in the trans Golgi network the
structure is elongated before leaving the Golgi.

31
Regulatory stages take place during synthesis to ensure that defective glycans
are not created. For instance, glycoproteins enter the calnexin/calreticulin cycle,
once they have two Glc removed in the RER by α-1,2-glucosidase I and α-1,3-
glucosidase II, which prevents incorrectly folded proteins from remaining in the
pathway. If an improperly folded protein is detected, a Glc residue is added to
the protein in the RER lumen by a glycosyltransferase targeting it to re-enter the
calnexin/calreticulin cycle. The faulty protein remains in the calnexin/calreticulin
cycle until folded correctly, at which point the added Glc residue is removed by
glucosidase II (Deprez, et al., 2005; Sousa, et al., 1992).

32
Figure 1.4 N-linked Glycosylation. [Adapted from (Larkin and Imperiali, 2011; Rich
and Withers, 2009; Varki, 2009)] A summary of the synthesis and processing of N-linked glycans in the RER and Golgi which differ depending on the type of N-linked glycan attached.
= Gal =SA = GlcNAc = Man = Fuc = Glc

33
1.2.5.2 Types of N-linked Glycans: High-Mannose, Complex and Hybrid.
N-linked glycans share a common pentasaccharide core (Man3GlcNAc2) but
can differ in overall structure due to the biosynthetic process of trimming and
adding monosaccharides (Albani and Plancke, 1998) as shown in Figure 1.4.
Three types of N-linked glycans termed high-mannose, complex or hybrid
(shown in Figure 1.5) are produced via trimming and processing of the glycan
precursor by enzymes in the RER and Golgi.
High-mannose structures are distinguished by the possession of a
heptasaccharide core which is formed when the pentasaccharide core gains
between two and six Man residues (see Figure 1.5). A maximum of four Man
residues can join to the Man located at the non-reducing terminus of the core
and as suggested by the name high-mannose, the only monosaccharides found
in these chains are Man (Imperiali and O’Connor, 1999; Kobata, 1992). If high-
mannose structures become phosphorylated, producing mannose-6-phosphate,
they are targeted towards the lysosomes through binding to the Man-6-
phosphate receptor and exit from the cis golgi without being involved in the rest
of the processing pathway (Smith, et al., 1997).
Synthesis of complex N-linked glycans requires more processing as they tend
be capable of a wider assortment of linkages and monosaccharides. They
consist of a trimannosyl core (three Man) with two GlcNAc residues linked to a
glycoprotein and during processing have sugars added to them such as
GlcNAc, Gal, Fuc and SA as shown in Figure 1.5. Structural variation of the
glycan may be increased by a Fuc residue bonding to the innermost GlcNAc
(Kobata, 1992). In comparison to high-mannose structures which tend to
express only 2 GlcNAc residues and between 5-9 Man, complex glycans
usually have 4-6 GlcNAc residues and 5-7 neutral sugars (Fan, et al., 1994).
Complex glycans can exist as bi-, tri-, tetra- and penta-antennary chains and
can be subdivided as such, with a SA residue at the terminus allowing the
glycans to avoid being destroyed by the liver and circulate in the blood (Morell,
et al., 1971).
Hybrid structures arise when mannosidase (hydrolyses Man) does not act upon
addition of a GlcNAc residue to the core structure in the Golgi. Similar to high-
mannose, Man residues can join core outer Man residues as well as GlcNAc,

34
while Fuc can bind to the innermost GlcNAc residue in a similar manner to
complex glycans (see Figure 1.5). This results in a combination of high-
mannose and complex characteristics as hybrids possess a Man α-1,6 branch
(high-mannose) and a Man α-1,3 branch incorporating Gal and more GlcNAc
residues comparable to complex glycans (Durand and Seta, 2000; Kobata,
2000).
Figure 1.5 Types of N-linked Glycan Structure. [Adapted from Varki et al.,
2009] Illustration of high-mannose, complex and hybrid N-linked glycan structures emphasising the common pentasaccharide core.
1.3 Alpha-1-acid Glycoprotein
Alpha-1-acid glycoprotein (AGP) is an N-linked glycoprotein, exclusively
expressing complex glycans that can be bi-, tri- or tetra-antennary, which occurs
= GlcNAc = Man = Gal = SA
Asn
High-Mannose
Asn
Complex
Asn
Hybrid

35
naturally in plasma through secretion by hepatocytes (primarily), breast tissue
(Gendler, et al., 1982), cardiac cells (Siegal, et al., 1985), testes,
gastrointestinal tract (Twining, et al., 1977) and number of immune cells such as
monocytes and lymphocytes (Gahmberg, et al., 1978). Therefore, AGP
glycosylation could prove to be a suitable biomarker for BC detection due to
secretions of AGP carrying aberrant glycosylation from malignant BC tumour
cells.
AGP is predominantly secreted by hepatic parenchymal cells and while its
primary function has yet to be discovered, it is known that AGP is involved in
plasma protein binding of drugs for transportation, regulation of homeostasis,
and immunomodulation (Fournier, 2000). For instance, AGP has been shown to
increase in concentration during inflammation suggesting its implication as an
anti-inflammatory and immunomodulatory molecule. Increased AGP
concentrations as well as changes in glycosylation have been shown to occur
during several pathophysiological and physiological states such as cancer.
1.3.1 AGP Structure
AGP is named due to its migration with the α-1 protein group during plasma
protein electrophoresis as it has a low pI of 2.8-3.8 (Nakano, et al., 2004). AGP
is formed when a 201 residue single polypeptide precursor is cleaved after the
first 18 residues (Ceciliani and Pocacqua, 2007). The remaining protein portion
contains roughly 59% of AGP’s structure and 23kDa of its total mass (Albani, et
al., 2000; Liao, et al., 1985) with the rest being composed of carbohydrate.
Human AGP was initially thought to be composed of 181 amino acids creating a
single polypeptide (Schmid, et al., 1973). However, research by Dente, et al.
(1985) proved that AGP was 183 amino acids in length due to an extra Lys and
an Arg residue at positions 173 and 174 respectively. There is also the potential
for 22 amino acid substitutions within the molecule. These 22 sites of
substitution are linked to the differences between the genes that code for AGP
(AGP 1 and 2) and the gene products are present in a 3:1 ratio in human
plasma under normal physiological conditions.
There are three main genetic variants of AGP with expression of these variants
controlled by three adjacent genes located on chromosome 9. AGP-A (also

36
referred to as ORM-1) encodes variants F1, F2 and S while AGP-B and AGP-B’
(ORM-2) code for A (Colombo, et al., 2006; Katori, et al., 2011). The three
genes are very similar in structure with AGP-A only differing from identical
genes AGP-B/B’ by 22 base substitutions. As F1, F2 and S are all encoded by
two alleles of AGP-A, they are collectively known as F1*S and differ by less
than five amino acids each. However, variant A has approximately 20 amino
acids substituted but with all variants containing 183 amino acids in total this is
only a minor difference (nearly 11%) (Schmid, 1989). It is not yet known
whether these substitutions affect gene product glycosylation but, it is thought
that they may be located within AGP’s glycosylation sites at positions 15, 75
and 85 as shown in Figure 1.8 (van Dijk, et al., 1991). F1*S is the main
constituent of serum with a 3:1 ratio compared to A but this may be due to AGP-
B/B’ being expressed 100 times less than AGP-A (possibly owing to
transcription occurring only at the first gene within the cluster) (Dente, et al.,
1987). However, the level of each variant has been shown to change during
diseases such as lymphoma, ovarian cancer and melanoma with ratios of up to
8:1 reported (Budai, et al., 2009). Figure 1.6 shows a structural representation
of the F1*S variant (A) and the A variant (B) acquired by x-ray crystallography
which reveals the folding pattern of F1*S and A are the same but the binding
pockets differ as F1*S has three lobes and is wide but A only has two lobes
thus is narrower and may affect binding function (Taguchi, et al., 2013). Figure
1.6 A/B shows unglycosylated AGP variants as the extensive glycosylation
makes x-ray crystallography difficult therefore glycans are removed.
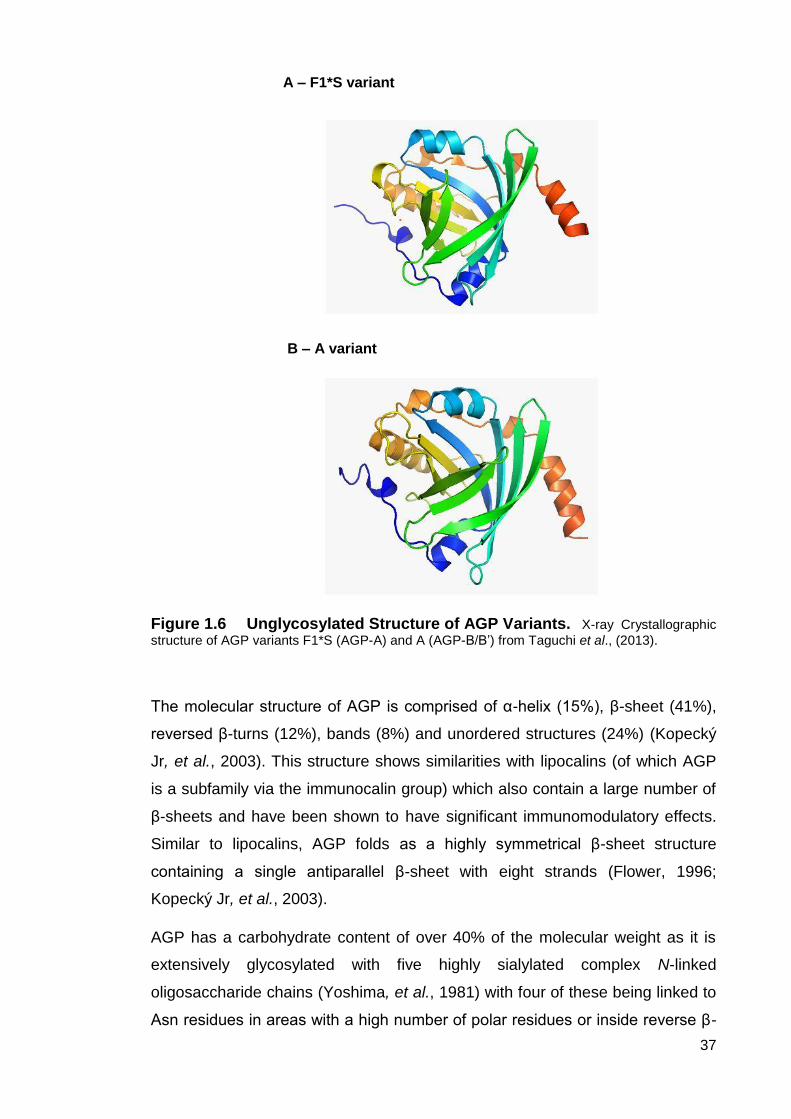
37
Figure 1.6 Unglycosylated Structure of AGP Variants. X-ray Crystallographic
structure of AGP variants F1*S (AGP-A) and A (AGP-B/B’) from Taguchi et al., (2013).
The molecular structure of AGP is comprised of α-helix (15%), β-sheet (41%),
reversed β-turns (12%), bands (8%) and unordered structures (24%) (Kopecký
Jr, et al., 2003). This structure shows similarities with lipocalins (of which AGP
is a subfamily via the immunocalin group) which also contain a large number of
β-sheets and have been shown to have significant immunomodulatory effects.
Similar to lipocalins, AGP folds as a highly symmetrical β-sheet structure
containing a single antiparallel β-sheet with eight strands (Flower, 1996;
Kopecký Jr, et al., 2003).
AGP has a carbohydrate content of over 40% of the molecular weight as it is
extensively glycosylated with five highly sialylated complex N-linked
oligosaccharide chains (Yoshima, et al., 1981) with four of these being linked to
Asn residues in areas with a high number of polar residues or inside reverse β-
A – F1*S variant
B – A variant

38
turns (Ceciliani and Pocacqua, 2007; Kremer, et al., 1988). The consensus
sequence Asn-X-Ser(Thr) where X cannot contain a proline (Pro) residue due to
it preventing a β-turn, necessary for glycan attachment.
A number of amino acids such as all three tryptophan (Trp) residues, certain
tyrosine (Tyr) residues and the majority of phenylalanine (Phe) residues have
preferences of location within AGP’s folded structure (see Figure 1.7) due to
molecular interactions within the polypeptide backbone (Albani, 2003). While
some residues lie close to or above the surface of AGP such as Trp 122 which
is located between the surface and the hydrophobic binding site and Trp 160
(exposed), Trp 25 is buried in the hydrophobic binding site. Trp residues are
more capable of rotation the closer they reside to the surface (Friedman, et al.,
1985). Furthermore, 5-7 Tyr and the majority of the Phe residues lie buried –
partially or completely – in the native state.
AGP-A MQIPLCANLVPVPITNATLDQITGKWFYIASAFRNEEYNKSVQEIQATFFYFTPNKTEDTI 60
AGP-B/B’ MQIPLCANLVPVPITNATLDRITGKWFYIASAFRNEEYNKSVQEIQATFFYFTPNKTEDTI 60
*******************:****************************************
AGP-A FLREYQTRQDQCIYNTTYLNVQREN-TISRYVGGQEHFAHLLILRDTKTYMLAFDVNDEK 119
AGP-B/B’ FLREYQTRQDQCFYNSSYLNVQRENGTVSRYEGGREHVAHLLFLRDTKTLMFG---DDEK 117
************:**::******** *:*** **:**.****:****** *:. :***
AGP-A NWGLSVYADKPETTKEQLGEFSYLEALDCLRIPKSDVVYTDWKKDKCEPLEKQHEKERKQ 179
AGP-B/B’ NWGLSFYADKPETTKEQLGEF--YEALDCLCIPRSDVMYTDWKKDKCEPLEKQHEKERKQ 175
*****.*************** ****** **:***:**********************
AGP-A EEGES 184
AGP-B/B’ EEGES 180
*****
Figure 1.7 Protein Alignment of AGP Variants. [adapted from Taguchi, et
al., 2013 and created using Clustal 2.1 software] The start methionine is highlight in green and sites of transcript variation are highlighted in red. “:” (colon) indicates conservation between groups of strongly similar properties. “.” (period) indicates conservation between groups of weakly similar properties.
The remaining 41-45% of the AGP molecule is composed of glycan chains and
galactoglycoprotein (Schmid, et al., 1980) is the only molecule to surpass AGP
in its unusually high glycan content with 76%. At residues 15, 38, 54, 75 and 85
there are five variable, highly sialylated heteropolysaccharide complex-type N-
linked glycans attached to Asn residues usually in the first half (from the N-
terminus) of the polypeptide (Eap and Baumann, 1993; Israili and Dayton,
2001). The negative charge and low pI (2.8-3.8) is due to C1 of SA possessing
a –COOH group as well as acidic amino acids being present (Elg, et al., 1997;

39
Hochepied, et al., 2003). It is estimated that 11-12% of AGP is comprised of up
to 16 SAs, which results in the low pI of AGP, with each having an approximate
weight of 314Da and if these are lost through desialylation, AGP becomes
inactive. Mature unglycosylated AGP has a higher pI of 4.97 (Devereux et al.,
1984). The glycan structure of AGP is also composed of Gal, GlcNAc and Man
(14%) as well as Fuc (1%). (Dente, et al., 1987; Kremer, et al., 1988). The
innermost pentasaccharide core is common to all N-linked glycans.
Fournier, et al. (2000) revealed that Fuc can be linked via the external branch to
GlcNAc using an α-1-3 bond as well as being linked to a core GlcNAc or Gal via
a α-1-6 and α-1-2 bond respectively. This may account for the degree of
variation in fucosylation between individuals which tends to increase when
greater numbers of tri- and tetra antennary chains are present in the structure.
Approximately 30% of human serum proteins do not contain Fuc but AGP is in
the minority of glycoproteins that can possess tetra antennary N-linked glycans
along with bi- and tri- antennary, therefore allowing for the presence of Fuc. Fuc
accounts for 0.8% of AGP with Gal, GlcNAc, Man and SA completing the
molecule with 6.3%, 14.9%, 5.2% and 11.3% respectively.
The presence of glycans allows for the vast structural variability of AGP creating
the potential for 105 different glycoforms. This is known as microheterogeneity.
Only 12-20 of these are expressed during normal (non-pathological)
circumstances with varying levels of fucosylation, branching and sialylation
demonstrated by each (Albani, 1997). AGP expresses two types of
microheterogeneity: type I and type II which can be sub-classified and are not
associated with the peptide backbone but rather the glycan chains. Type I is the
major form, responsible for the reduced tri- and tetra-antennary chain
expression in favour of bi-antennary branching. However, type II (the minor
form) is associated with the degree of sialylation and fucosylation of AGPs five
oligosaccharide chains (Albani, 1997). As shown in Figure 1.8, Asn residues
express glycans selectively depending on their degree of branching which
reduces the possible number of glycoforms. Asn 15 and 38 are the first and
second sites of glycan expression and usually have bi-antennary glycans linked
to them. Additionally, Asn 15 never carries tetra-antennary chains just as Asn
38 will not bind fucosylated glycans. However, branched glycans are favoured
by Asn 75, which only binds tri- and tetra-antennary chains, and Asn 85 which

40
displays the highest levels of α-1,3- fucosylation (Higai, et al., 2005). Fournier et
al., (2000) proposed that these are the only two sites with the ability to bind
tetra-antennary glycans with multiple Fuc residues due to increased branching.
AGP glycans are 10-15% bi-antennary with the majority (85-90%) being either
tri- or tetra-antennary (Perkins, et al., 1985).
Smith, et al. (2002) demonstrated that AGP is more metabolically stable than
other glycoconjugates as tri- and tetra-antennary chains are bound more tightly
by their termini than bi-antennary chains to the polypeptide core. As well as this,
it was shown that glycan microheterogeneity variation is established by sugar
nucleotide availability, tissue-specific glycosyltransferase gene regulation and
enzyme competition during the processing of the glycan.
Figure 1.8 Illustration of AGP N-linked Glycosylation Possibilities. Glycan branching is shown as described previously in the text, however chain length can differ. The particular Asn sites that glycans link to are also labelled with certain residues only expressing a specific type of glycan branching (bi-, tri- and tetra-antennary).
1.3.2 AGP Function
The primary in vivo function of AGP is still debated despite rigorous
investigation, however, it is reported that AGP production contributes to
regulation of homeostasis, plasma protein binding to drugs and
immunomodulation. With immunomodulatory functions being influenced by

41
glycosylation pattern (Ceciliani and Pocacqua, 2007) as summarised in Table
1.5. The structure of the glycans AGP carries can affect its function (Chiu, et al.,
1977) and as a member of the lipocalin family, AGP has a highly conserved
structure with a largely varied protein sequence allowing it to perform the
transportation of small hydrophobic molecules (Flower, et al., 2000; Treuheit, et
al., 1992).

42
Table 1.5 Summary of AGP Functions.
AGP glycoforms have differing immunomodulatory roles due to varying glycan
structure, particularly in cancer patients. For example, Pukhal'skiĭ, et al. (1994)
isolated AGP from ascitic fluid in stomach cancer patients as well as from the
blood of a healthy population and investigated the effects of lymphocyte
Activity AGP Involvement Examples Study
Anti-inflammatory Injury healing carried out by neutrophils and
complement is reliant on SLex groups.
AGP with little or no bi-antennary glycans enables
inhibition of CD3-induced lymphocyte proliferation.
Reduces neutrophil influx and TNF-α expression in
mice with renal ischemia and reperfusion injury.
Inhibits complement cascade if carrying the correct
glycan composition.
Pos, et al. (1990b)
Kalmovarin, et al. (1991)
Williams, et al. (1997)
Daemen, et al. (2000)
Pro-inflammatory AGP co-induces monocyte production of IL-1β, IL-6
and TNF-α in the presence of LPS.
Can stimulate fMLP preactivated neutrophils to
produce a secondary ROS response.
Local AGP production by monocytes in response to
cytokines.
Boutten, et al. (1992)
Drenth, et al. (1996)
Su and Yeh (1996)
Hochepied, et al. (2003)
Gunnarsson, et al. (2010)
Immunomodulation Modulation of lymphocytes by decreasing their
responsiveness to PHA, Con A and PWM.
Lymphocyte function is maximally suppressed by
agalactosylated and asialylated AGP.
Inhibits activation and migration of neutrophils.
Inhibits apoptosis and the resulting inflammation.
Inhibits phagocytosis and platelet aggregation.
Snyder and Coodley (1976)
Chiu, et al. (1977)
Bennett and Schmid (1980)
Athamna, et al. (1996)
Hochepied, et al. (2003)
de Vries, et al. (2004)
Mestriner, et al. (2007)
Matsumoto, et al. (2007)
Drug Binding High affinity binding sites can bind neutral and
basic drugs as well as steroids and plasma.
Can bind tamoxifen, imipramine, warfarin, quinine,
imatinib, disopyramide and methadone.
Elevated AGP can reduce adverse effects of toxic
drug doses by binding to the toxic component and
subsequently inactivating it.
Binds toxic lectins and LPS produced by
microorganisms.
Otagiri, et al. (1987)
Chatterjee and Harris (1990)
Pos, et al. (1990a)
Silamut, et al. (1991)
Hervé, et al. (1998)
Libert, et al. (1994)
Moore, et al. (1997)
Frantz, et al. (2000)
Israili and Dayton (2001)
Matsumoto, et al. (2002)
Kopecký Jr, et al. (2003)
Gambacorti-Passerini, et al. (2003)
Widmer, et al. (2006)

43
responsiveness. AGP isolated from patients with stomach cancer contained
more bi-antennary glycans and proved a better inhibitor of lymphocyte
proliferation than AGP from healthy individuals. However, AGP possessing two
bi-antennary glycans stimulated both IL-2 and lymphocyte proliferation.
Therefore, AGP can have an immunomodulatory effect through the inhibition of
IL-2 secretion; however this effect seems to be influenced by structural
differences of AGP. Additionally, positive correlation between inhibition of
lymphocyte proliferation by AGP and decreased IL-2 secretions has also been
noted (Elg, et al., 1997).
The immunosuppressive actions of AGP may have implications in cancer
management as the immune system is not activated against cancer cells
allowing them to proliferate unnoticed. AGP lacking Gal and SA gave the most
potent inhibition of lymphocyte proliferation (Bennett and Schmid, 1980) which
suggests that tumours may create a highly immunosuppressive environment if
their cells contain galactosidase and neuraminidase. AGP has already been
shown to act as an immunosuppressant in ovarian cancer by decreasing
lymphocyte proliferation and IL-2 production (Elg, et al., 1997). Saldova, et al.
(2008) revealed patients with ovarian cancer possessed AGP with increased
SLex when plasma concentration was amplified. Increased SLex contributes to
high AGP plasma levels as it reduces the accessibility of free Gal to Kupffer
cells in the liver decreasing the rate of AGP clearance from plasma (Coombs, et
al., 2006). Furthermore, increased endogenous sialylation has been revealed as
a possible anti-apoptotic mechanism involved in transforming tumours to a more
malignant phenotype in type B lymphoma cells (Keppler, et al., 1999). This links
with research by Kato, et al. (2001) showing that sialidase expression is
inversely correlated with tumour growth and metastatic potential of murine
cancer cells, perhaps via a regulatory mechanism promoting apoptosis and
suppressing cell growth.
Overall, while the exact function of AGP remains unknown its minor functions
contribute to cancer development and progression. AGP can suppress aspects
of the immune system resulting in cancer cells remaining undetected and can
potentially create more malignant tumours.

44
1.3.3 AGP in Cancer.
A significant number of research studies have been undertaken to assess
whether the subtle structure changes in AGP could act as a disease specific
biomarker. Normally this equates to measuring SA and Fuc levels in
comparison to healthy individuals; the variation in the degree of branching (bi,-
tri-, and tetra-antennary) of oligosaccharide chains; or the occurrence of antigen
structures such as SLex. Research to date has shown that AGP glycosylation is
altered during acute and chronic inflammation, diabetes and liver disease (for
example increased Fuc content) as well as pregnancy (increased tri- and tetra-
antennary branching) and burns victims (increased bi-antennary branching)
(Higai, et al., 2003; Mooney, et al., 2006; Pawiłowicz, et al., 2006; Poland, et al.,
2001; Pos, et al., 1990b; Saroha, et al., 2011).
The majority of research into AGP as a potential biomarker in cancer initially
focussed on changes in AGP plasma concentration during disease. AGP
plasma levels have been shown to increase 2-5 fold in the presence of cancer
(Rudman, et al., 1974); be significantly augmented (compared to healthy
individuals) in cancer of the ovary, breast or lung (Duché, et al., 2000;
Routledge, 1989) as well as increased AGP levels in malignant lung and breast
tissue (Twining and Brecher, 1977). Furthermore, it was noted by Turner et al.,
(1985) that BC patients have a 35.8% increase in AGP concentrations
compared to a healthy population. These results are consistent with the notion
that AGP operates as a positive acute phase protein during an APR.
Moreover, rising AGP levels have been shown to correlate with increased
clinical stages of primary BC (early to disseminated disease) which had
metastasised to the liver (Chandrasekaran, et al., 1984; Roberts, et al., 1975).
Comparison of these findings with AGP from healthy individuals, resulted in the
discovery of two AGP forms with different molecular masses. A 45kDa form,
possibly carrying 3-4 oligosaccharide chains and a 37kDa form potentially
having 5-6 oligosaccharide chains attached. Similarly, increased expression of
AGPs genetic variants has been shown when levels of AGP increase during
disease. F1*S and A variants of AGP have been shown to increase 2.5 fold in
lung and BC with a 1.6 fold increase being recorded in ovarian cancer.

45
However, the overall ratio of F1*S to A was not significantly altered to that of a
healthy population (Duché, et al., 2000).
In addition to increased AGP concentration, disease specific modifications of
AGP glycosylation and expression have been observed between cancer, and
healthy populations. AGP in cancer patients has been shown to carry higher
levels of bi-antennary glycans, fucosylation and sialylation (Turner, et al., 1985).
Increased SA was related to the occurrence of the APR, while increased Fuc
seemed to be linked to the spread of malignancy, thus indicating the potential of
AGP as a cancer biomarker. Croce, et al. (2005) revealed that AGP purified
from colorectal cancer patients carries SLex groups which is a terminal structure
containing Fuc. Shiyan and Bovin (1997) showed that unusual glycoforms of
AGP, such as glycans with GlcNAc as terminal residues (mono-agalacto
glycans), also occur; and that AGP carrying the maximum number of bi-
antennary glycans present in cancer patients showed more immunomodulatory
activity than AGP from healthy individuals.
Levels of AGP in fluid from patients with various diseases enabled Rudman, et
al. (1974) to distinguish congestive heart failure and liver cirrhosis (which do not
result in excessive cell proliferation) from pancreatic, breast, lung and ovarian
cancer. They also found that the majority of the fluids isolated from cancer
patients had an abnormal monosaccharide content displaying decreased
hexosamines (GlcNAc and GalNAc), hexoses and SA while a small number of
samples showed increased hexosamines. Rudman, et al. (1974) concluded that
invasive mechanisms used by cancer cells when the disease spreads could be
correlated with their results.
In parallel, an investigation by Roberts, et al. (1975) showed that BC
progression and prognosis could potentially be monitored by analysing serum
AGP concentration. Patients with early tumours <5cm had greatly increased
concentrations of serum AGP compared to a healthy control group, and patients
with early tumours >5cm had even higher levels of serum AGP than those with
smaller tumours. Patients with recurrent BC had higher serum AGP levels when
compared to the previous two groups and the last group (disseminated BC) had
the biggest increase in serum AGP concentration out of all the cohorts tested.
Therefore, showing increased AGP levels are good indicators of BC
progression and prognosis.

46
The studies reviewed to date conclude that AGP serum concentration can be
used as an indicator of disease however the changes in concentration are not
capable of being disease specific or definitively monitoring prognosis.
Therefore, AGP surface glycosylation patterns have been analysed in a number
of conditions in order to determine validity of AGP as a biomarker.
Investigations by Hansen et al., (1984) showed that variations in
oligosaccharide branching allowed researchers to differentiate between a
healthy population and those with lung carcinoma or benign lung disease.
Benign lung disease and healthy populations had less bi-antennary branching
but AGP from cancer cohorts contained more bi-antennary branches. This
investigation was repeated using the same method by Bleasby et al., (1985)
however; their findings for AGP microheterogeneity disputed those of the
previous study with AGP showing no significant differences to enable
discrimination between benign diseases and cancer.
Turner, et al., (1985) reported that patients with advanced stage cancer had
higher serum concentrations of Fuc. Elevated SA levels were also noted in
cancer patients and occasionally it was noted that rises is SA accompanied
increases in Fuc. Turner, et al., (1985) concluded that measuring these two
together (along with APP concentrations) could prove useful for monitoring
individuals with cancer. They proposed that Fuc concentrations may predict the
degree of tumour infiltration and that incidence of APR could be revealed by SA
content. Furthermore, research revealed that primary and secondary liver
cancer could be distinguished between by analysis of AGP glycoforms and
these findings could be used to determine the stage of ovarian cancer and
monitor the success of therapy in advanced ovarian cancer (Mackiewicz and
Mackiewicz, 1995).
Additional investigation into AGP fucosylation and branching in cancer by
Hashimoto, et al. (2004) demonstrated that cancer prognosis and progression
could be assessed by changes to AGP microheterogeneity. Good prognosis
was associated with advanced stage cancer for patients who possessed normal
AGP branching and fucosylation for the majority of time after surgery, while
poor prognosis was linked to those with highly branched AGP glycans and who
also had elevated fucosylation. Furthermore, Saldova, et al. (2007) showed that
increased expression of SLex structures by AGP could be used in combination

47
with elevated FA2 (fucosylated, agalactosylbiantennaryglycan) levels on IgG
antibodies to distinguish between ovarian cancer and benign gynaecological
conditions.
Therefore, increased AGP concentration on its own is merely a non-specific
indication that something has changed within an individual and cannot be
diagnostic for a certain pathophysiological condition. However, modifications of
AGP glycosylation in various diseases, such as cancer, have the potential to be
manipulated as biomarkers for diagnosis and progression of disease and
changes in glycosylation structure can alter the function of glycoproteins which
may also link to particular diseases. There is still a need for further research to
discover more disease-specific markers to enhance survival rates by improving
diagnosis, prognosis and monitoring of disease. While the primary function of
AGP remains elusive there is evidence linking altered AGP glycosylation to
various diseases including cancer. Therefore, AGP glycosylation is an ideal
candidate for investigation as a diagnostic BC biomarker.
1.3.4 AGP is an Ideal Candidate for a BC Biomarker.
Throughout the previous sections several features of AGP have been discussed
that make it an excellent candidate for investigation as a BC biomarker in this
research study. Firstly, AGP is not only produced by hepatocytes but extra
hepatic production has been reported in breast tissue as well (Gendler, et al.,
1982), inferring that alterations in AGP glycosylation may result during BC from
breast tumour secretions as well as hepatocellular AGP secretions.
Concentrations of AGP have also been shown to rise in line with BC
progression (Roberts, et al., 1975) which may further indicate the role of BC
tumour secretions. Additionally, AGP is one of the most heavily glycosylated
proteins in existence (approximately 45%) expressing various bi-, tri- and tetra-
antennary complex N-linked glycans (Yoshima, et al., 1981; Schmid, et al.,
1980) making AGP a highly suitable model for glycosylation studies. Research
has shown that AGP displays aberrant glycosylation during a variety of
pathophysiological conditions including cancer (Turner, et al., 1985 and
Hashimoto, et al., 2004). Therefore, it is possible that AGP may display uniquely
altered glycosylation patterns during TNBC or BRCA1/2 related BC. Lastly,

48
acquisition of AGP from BC patients would be minimally invasive as AGP can
be isolated from whole blood. Thus individuals could be tested through the
provision of a small blood sample which is a key aim of biomarker development
(Misek and Kim, 2011). Overall, the reasons listed above provide evidence of
AGP’s suitability for the current research study investigating the potential of
AGP glycosylation as a biomarker in TNBC and women at increased risk of BC
development due to family history and/or genetic predisposition via BRCA1 and
BRCA2 mutations.
1.4 Research Strategy.
Glycoproteins are present in all human blood and are the most heterogeneous
group of posttranslational modifications known. Glycans reflect fluctuations in a
person’s health via high structural diversity which has been proven to correlate
with the development or progression of cancer as well as other disease states
(Block, et al., 2005). Plus, there is increasing evidence that glycoprotein glycans
are modified during BC (Abbott, et al., 2008; Burchell, et al., 2001; Dennis and
Laferté, 1989; Fernandes, et al., 1991; Goodarzi and Turner, 1995; Hayes, et
al., 1989; Hull, et al., 1989; Perey, et al., 1992a; Perey, et al., 1992b; Sewell, et
al., 2006). As mentioned previously, BC affects thousands of women every
year, particularly those carrying BRCA1/2 mutations. Individuals afflicted with
these mutations are far more likely to develop aggressive forms of BC. By
detecting cancer development earlier, more treatments would be available to
BRCA1/2 mutations carriers increasing their chance of survival. AGP is a
circulatory glycoprotein whose N-linked glycosylation undergoes modifications
between normal and diseased states such as cancer. By assessing whether a
unique change in AGP glycosylation occurs prior to or after development of BC
in BRCA1/2 mutation carriers a new biomarker could be discovered. This is
why investigation of AGP as a biomarker for proactive detection of BC in
BRCA1/2 mutation carriers is vital.
The purpose of the study was to determine any changes to AGP glycosylation
in women with family history of BC. To facilitate this, a case control style study
was performed after collection of initial data from validation of laboratory
protocols to isolate and analyse AGP glycosylation. This type of approach has

49
been adopted in many other studies and was consistent with the range of
samples that were available for this study.
Preliminary findings were accumulated using plasma samples from women with
family history of BC and/or TNBC, due to the previously described link between
BRCA1/2 mutations and TNBC. Further to this, blood samples were collected
from women with family history of BC attending the High Risk Familial Breast
Screening Clinic at Edinburgh’s Western General Hospital and age-matched
healthy controls from Edinburgh Napier University to form a case-control style
approach. A summary flow diagram of the isolation and analytical process is
shown in Figure 1.9 below,
To summarise, this study sought to identify alterations to AGP glycosylation that
may be indicative of BC onset, particularly in women at increased risk of BC
development or those with an aggressive from of BC such as TNBC. It was
hoped that the results of this study could lead to further investigations using
larger cohort sizes with annual or bi-annual follow-up to monitor any BC
development.

50
Frozen plasma samples from TNBC, healthy and
BC of unknown type
AGP isolation by low pressure chromatography and desalting using centrifugal filters
ISOLATED AGP
Concentration determined via spectrophotometry
Acid hydrolysis Enzyme digestion
HPAEC-PAD: Monosaccharide analysis
HPAEC-PAD: Oligosaccharide analysis
Fresh blood samples from women at high risk of BC and age-match healthy controls
SDS-PAGE to test purity
Figure 1.9 Summary Flow Diagram of AGP Isolation and Analysis conducted in this research. SDS-PAGE = sodium dodecyl sulphate polyacrylamide
gel electrophoresis and HPAEC-PAD = high pH anion-exchange chromatography with pulsed amperometric detection.

51
Chapter 2 – Materials and Methodology.
52
2.1 Introduction.
This chapter details all methods used for this study along with justifications of
any deviations from the original research strategy. The objective of this chapter
is to provide a detailed and transparent description of the methods used to
enable the collection and interpretation of all data presented in the chapters that
follow.
2.1.1 Dataset 1 Sample Acquisition and Demographics.
As detailed previously, a strong link between TNBC and BRCA1 mutations has
been unveiled by recent research (Anders, et al., 2009; Lakhani, et al., 2002b).
Therefore, as this study could not obtain confirmed BRCA1/2 mutation carrier
samples, samples of plasma were purchased from the Canadian Breast Cancer
Foundation Tumour Bank (Alberta) from patients with TNBC with and without
family history of BC (n=18). Patient’s family history was not determined
genetically but through patient’s selecting a known family history on a data
collection sheet. TNBC status was confirmed by pathology laboratories in
Canada as part of a patient’s clinical care using immunohistochemistry (IHC;
Edmonton) or Allred assay system (Calgary) (Gazinska, et al., 2013; Oakman,
et al., 2010) prior to blood draw. Samples from across the age spectrum were
requested as there is an even stronger link between BRCA1 mutations and
TBNC in young women than those with TNBC at a later age.
Positive control samples in the form of generic BC were purchased from Capital
Biosciences (Maryland, USA). Samples were largely from the age range
expected of BC sufferers (age 50-70). Samples were of a low-medium TNM
stage and were all invasive. Similarly the ethnicity of all patient samples was
Caucasian.
Additionally, negative control samples used in Dataset 1 were obtained from the
Scottish Blood Transfusion Service. No information was provided other than
blood type but it was thought that any blood drawn with the intent of transfusion
would be from individuals free from disease and thus inflammation. To aid the
collection of reliable results, n=5 samples were selected for use, one of each
blood type (A, B, O and AB) and a second type B, selected at random. All

53
samples were of positive Rhesus type as no negative Rhesus type samples
were available.
All samples were subjected to laboratory methods (described in detail later in
this chapter) to isolate AGP and analyse glycan content.
2.1.2 Dataset 2 NHS Sample Acquisition.
2.1.2.1 Population Identification.
Edinburgh’s Western General Hospital is home to the High Risk Familial Breast
Screening Clinic run by consultant breast surgeon Miss Elaine Anderson.
Women attending this clinic had been referred due to having family history of
BC and required more frequent and earlier screening for BC development, thus
this was identified as a recruitment site for potential participants. Any
participants recruited from this site would represent a population who were at
increased risk of BC development but were yet to develop BC. While potential
participants were identified at this site, they were invited to attend Edinburgh
Napier University (ENU) to donate a blood sample for the study.
2.1.2.2 Sample Size.
Sufficient case sample size of n=12 was decided upon based on an 80%
statistical power of detecting differences in AGP glycosylation using a 5%
statistical significance level and by estimating the degree of agreement between
the test system through determination of the Kappa co-efficient greater than
0.81.
2.1.2.2 Ethical Approval.
To access a clinical cohort ethical approval is needed from a local NHS
Research Ethics Committee (REC) and Research and Development (R&D)
department is necessary. Ethical approval was granted by NHS Lothian’s REC
in April 2013 and shortly thereafter NHS Lothian R&D approval was received
also (see Appendix 1). One requirement of favourable ethical opinion was for

54
the Chief Investigator (CI; myself) to obtain a Research Passport – previously
known as an Honorary Contract – prior to undertaking the study. A Research
Passport for the CI was obtained in October 2013. Further ethical approval was
granted by NHS Lothian’s REC and R&D in December 2013 to increase the
maximum number of study participants to n=20 (see Appendix 2).
2.1.2.3 Recruitment and Informed Consent.
The consultant surgeon identified potential research participants with the aid of
clerical staff from Ardmillan House Breast Screening Centre, Edinburgh. An
invitation letter (see Appendix 3) from the consultant was included in an
information pack containing a patient information sheet (PIS, Appendix 4), draft
consent form (Appendix 5), reply slip (Appendix 11) and a pre-paid reply
envelope. Information packs were then posted out to 50 potential participants
with the aim of recruiting a minimum of n=12. Women who were willing to take
part were asked to fill in the reply slip and provide contact details allowing them
to be contacted by the research team to arrange a suitable appointment time to
donate a blood sample and fill in a data collection sheet (Appendix 6). By
deciding to take part, women were agreeing that they met the inclusion criteria
and did not knowingly have a condition that would exclude them from the study.
At the participant’s clinic appointment an informed consent form (Appendix 5)
was completed by a trained member of the research team including ensuring
each potential participant had read the PIS, understood the implications of
participating and that they had the right to withdraw without consequence at any
time. Participants were also asked to consent to whether their GP should be
informed of their involvement in the study. If participants consented, they were
asked to provide contact details for their GP to enable the research team to post
a letter and PIS to inform GP’s of the individual’s participation in the study.
Consent was taken prior to blood draw and filling in of the data collection sheet.
Blood samples were then subjected to the same laboratory methods as
samples from Phase 1 (described later in this chapter) and participants offered
a Lothian Bus Day ticket for attendance.

55
2.1.2.4 Inclusion Criteria.
Women, over the age of 18 who attended the High Risk Familial Breast
Screening Clinic at Edinburgh’s Western General Hospital due to increased risk
of BC development.
2.1.2.5 Exclusion Criteria.
Women could not participate in the study if they were diabetic, pregnant or had
a chronic inflammatory condition such as rheumatoid arthritis, Crohn’s disease
or liver disease. This was due to previous research detailing changes to AGP
glycosylation in these conditions which could have provided misleading results
for this study.
2.1.2.6 Blood Draw and Data Collection Sheet.
Once informed consent had been obtained, participants were asked provide
answers to the questions within the data collection sheet (Appendix 6),
transcribed by a member of the research team, to provide information that was
relevant to the study e.g. height, weight and questions relating to medical
history and a 3-4 ml blood sample was drawn by a qualified member of the
research team.
2.1.3 Phase 2 ENU Age-Matched Negative Control Sample Acquisition.
2.1.3.1 Population Identification.
To complete this case control study an age-matched negative control population
i.e. healthy participants were recruited from ENU. These participants would
represent a population without family history of BC and without underlying
health conditions that could affect AGP glycosylation. As before, participants
would be required to provide a blood sample for analysis and fill in a data
collection sheet with information relevant to the study.

56
2.1.3.2 Ethical Approval.
Ethical approval was granted by ENU Faculty of Health, Life and Social
Sciences Ethics Committee on 15th January 2014.
2.1.3.3 Recruitment and Informed Consent.
Posters (Appendix 7) were placed around ENU describing the study and what
would be involved for potential participants. Posters detailed the ages that were
required for age-matched participants and asked interested individuals to
contact the research team. The research team then gave a PIS (Appendix 8) to
potential participants to read, if they were still interested an appointment would
be arranged for the individual to give informed consent (Appendix 9), have their
family history taken (by a trained member of the research team), have a blood
sample drawn and fill in a data collection sheet (Appendix 10) with information
relevant to the study. Informed consent was taken by a trained member of the
research team as was the blood sample. By taking family history the research
team could be sure that participants had no family history of BC. Blood samples
were again subjected to laboratory procedures described later in this chapter.
2.1.3.4 Inclusion Criteria.
An individual who is an age-match to one of the increased risk participants, thus
acting as a negative control group for this study.
2.1.3.5 Exclusion Criteria.
Individuals were not eligible for the study if they had increased risk of BC, were
diabetic or pregnant, had had recent surgery or had an inflammatory condition
such as arthritis or Crohn’s disease.

57
2.1.3.6 Family History, Blood Draw and Data Collection Sheet.
During a participants appointment and once informed written consent had been
given, a trained member of the research team took a detailed family history to
check that participants did not have an unknown family history of BC. If a
participant was still eligible after family history was taken, a 3-4 ml blood sample
was drawn and a data collection sheet filled in by the participant, providing
relevant information for the study e.g. height, weight or any medication being
taken.
2.2 Laboratory Materials and Methods.
2.2.1 Samples
Dataset 1 comprised of eighteen TNBC plasma samples purchased from the
Alberta Tumour Bank – six from patients below 35 years of age, six from
patients aged 35-60 and six from patients over 60. Five BC samples were
acquired from Capital Biosciences Inc., Rockville, Maryland, USA and used as
positive controls while five “normal” plasma samples from donor without cancer
were pooled and sourced from the Scottish National Blood Transfusion Service
to act as negative controls.
Dataset 2 included sixteen whole blood samples obtained from female
volunteers at increased risk of BC due to family history and/or a genetic
mutation who were recruited at a local High Risk Familial Breast Screening
clinic. Ten age-matched healthy controls were recruited from members of staff
at ENU.
All samples were stored at -20⁰ C until further analysis was able to take place.
2.2.2 AGP Isolation
2.2.2.1 Polyethylene Glycol Precipitation.
One millilitre whole blood, serum or plasma samples were transferred into fresh
eppendorf tubes from their collection vials. PEG 3350 (Sigma-Aldrich, Poole,
UK) was added to samples at 40% w/v (0.4g to 1ml of sample or 0.04g to 100µl

58
sample) then samples were vortexed to ensure even distribution and
refrigerated at 4°C for a minimum of 24 hours. The samples were centrifuged at
14,000 RPM for 30 minutes in an Eppendorf Centrifuge 5415C, the supernatant
moved to fresh eppendorfs and the pellets discarded. Samples were frozen at -
20°C until protein purification could take place.
2.2.2.2 Buffers.
Buffer Components
Cibracron Blue Elution
One hundred millimolar potassium chloride, 50mM Trizma and 3.07mM
sodium azide (pH7)
Cibacron Blue Desorption
Five hundred millimolar of potassium thiocyanate to 250ml of Cibacron Blue
Elution buffer
Red Sepharose Elution
Twenty three millimolar of sodium acetate to 250ml of distilled water and
200mM of glacial acetic acid to a separate beaker containing 100ml
distilled water.136ml of sodium acetate dilution was added to 13.5ml
of glacial acetic dilution in a fresh beaker. 1000ml of distilled water was
added to the solution (pH 5.7)
Red Sepharose Desorption
One molar sodium chloride to 100ml Red Sepharose Elution buffer
Table 2.1 Composition of Low Pressure Chromatography Elution and Desorption Buffers. Composition of all buffers utilised for isolation of AGP by low
pressure affinity chromatography are detailed in Table 2.1. All buffers were stored in Duran jars until use.

59
2.2.2.3 Low Pressure Chromatography.
A 10ml disposable Poly-Prep column sourced from Bio-Rad Laboratories Ltd.,
Hemel Hempstead, UK, was filled to approximately 5ml with Reactive Blue
Sepharose (Cibacron Blue 3GA) resin purchased from Sigma-Aldrich, Poole,
UK, and this was carried out for Red Sepharose CL-6B resin (provided by Bio-
Rad Laboratories Ltd., Hemel Hempstead, UK) columns also. The previously
prepared Cibacron Blue 3GA column was equilibrated using 5ml of the
appropriate elution buffer (compositions presented in Table 2.1), added at a
flow rate of 0.5 ml per minute by a Pharmacia LKB Pump P-1 for 10 minutes,
before adding approximately 1ml supernatant, resulting from PEG precipitation,
simultaneously with 12.5ml elution buffer for 25 minutes at a flow rate of 0.5ml
per minute. Changes in absorbance were monitored with a single path
Pharmacia optical UV-1 monitor and were noted as a peak on a Kipp and
Zonen BD41 chart recorder (see Figure 4.1 in Chapter 4) set at 2mm/min
indicating when supernatant had passed through the column and the eluted
fraction (approximately 9ml) was collected in a 15ml centrifuge tube. Human
serum albumin (HSA) is bound by Cibacron Blue 3GA resin within the column
resulting in AGP being eluted. The column was then regenerated using 7.5ml
desorption buffer, in place of elution buffer, for 15 minutes at a flow rate of 0.5ml
per minute, to remove previously bound HSA from the column. This was shown
on the Kipp and Zonen BD41 chart recorder as a baseline. Before addition of
further samples, the column was equilibrated using elution buffer.
The eluted fraction (approximately 9ml) was concentrated to approximately 2ml
using a Christ RVC 2-18 Concentrator at -60⁰ C (SciQuip Ltd., Shrewsbury, UK)
and the time taken for this to occur varied between samples. The concentrated
2ml fraction added to a previously prepared Red Sepharose CL-6B resin
column which was equilibrated with 5ml of the appropriate elution buffer (see
Table 2.1) for 10 minutes at a flow rate of 0.5ml per minute. 2ml of sample
concentrated from the Cibacron Blue 3GA column was added simultaneously
with 12.5ml elution buffer for 25 minutes at a flow rate of 0.5ml per minute .The
movement of the sample through the column was monitored with a single path
Pharmacia optical UV-1 monitor and were noted as peaks on a Kipp and Zonen
BD41 chart recorder (see Figure 4.1 in Chapter 4). Approximately a 9ml eluted
fraction was again collected in a 15ml centrifuge tube. Red Sepharose CL-6B

60
resin binds AAT and transferrin thus the eluted fraction contained isolated
AGP.Transferrin and AAT were removed from the column by washing with
7.5ml of the appropriate desorption buffer (see Table 2.1) for 15 minutes at a
flow rate of 0.5ml per minute. All of the above purification methods were
performed at room temperature. Both columns were stored in 10% ethanol at
4°C until further use to prevent bacterial growth and drying out of the resin.
Purified AGP in the eluted fraction (approximately 9ml) was concentrated in the
Christ RVC 2-18 Concentrator at -60⁰ C to approximately 2ml and the time
taken for this to occur varied between samples. Once concentrated to 2ml the
purified AGP was ready for desalting.
2.2.2.4 Desalting.
Excess salt was removed from samples of isolated AGP using a Centricon®
YM-10 centrifugal filter device with a 10,000Da cut-off filter purchased from
Millipore Ltd., Hertfordshire, UK. Initially, the filter membrane was dampened
with one or two drops of HPLC grade water (sourced from Rathburn Chemicals
Ltd., Walkerburn, UK), the 2ml concentrated eluted fraction containing isolated
AGP is then added and topped up with 2ml of HPLC grade water. To prevent
cross contamination only one filter device was used per sample. Filter devices
containing samples were spun in a Zentrifugen Universal 320 centrifuge by
Hettich for 30 minute cycles at 4000 rpm, being topped up with 1ml of HPLC
grade water after every cycle, until the full 1ml of HPLC grade water added prior
to a cycle had filtered through. This took approximately six cycles and indicated
that de-salting was complete. Excess salt water collected at the bottom of the
tube was disposed of and the desalted sample was transferred into a fresh
eppendorf then dried to completion in a Christ RVC-2-18 Concentrator.
2.2.2.5 Sodium Dodecyl Sulfate Polyacrylamide Gel Electrophoresis
(SDS-PAGE).
SDS-PAGE was performed in line with the protocol devised by Laemmli (1970)
and all reagents were purchased from Sigma-Aldrich, Poole, UK, unless stated
otherwise. The resolving gel was composed of 10% (w/v) acrylamide (30%

61
protogel; purchased from ThermoFisher Scientific, Loughborough, UK), 0.1%
(w/v) SDS, 0.08% (w/v) ammonium peroxodisulfate and 0.375 Tris-HCl, pH
8.85. The stacking gels were formed using 5% (w/v) acrylamide (30% protogel),
0.2% (w/v) SDS, 0.12% (w/v) ammonium peroxodisulfate and 0.17M Tris-HCl
pH 6.8. Polymerisation of resolving and stacking gels was achieved by adding
N,N,N’,N’ – tetramethylethylenediamine (TEMED) to give a final concentration
of 0.05% (v/v) and 0.02% (v/v) respectively. Samples were denatured for 5
minutes at 95°C after the addition of 2 x loading sample buffer (LSB) containing
20% glycerol, 4% SDS, 200mM Tris-HCl pH 6.8 and 10mM
ethylenediaminetetraacetic acid (EDTA). Samples were then loaded onto the
gel and electrophoresed for 50 minutes at 185V in running buffer (0.1% SDS,
25mM Tris, 192 mM glycine, pH8.3). Gels were stained with Coomassie brilliant
blue R.
2.2.2.6 Coomassie Staining.
Gels were submerged in Coomassie brilliant blue staining solution sourced from
Sigma-Aldrich, Poole, UK (45% methanol, 10% acetic acid, 0.2% Coomassie
R250) after electrophoresis. Gels were then incubated at room temperature and
gently agitated for 30 minutes. Following incubation, dH2O was used to wash
gels which were then immersed in destaining solution (Sigma-Aldrich, Poole,
UK; 20% methanol, 10% acetic acid in dH2O) to enable visualisation of protein
and through reduction of back ground staining.
2.2.3 Determination of Sample AGP Concentration.
A standard calibration curve of absorbance against AGP concentration (mg/ml)
was produced by dissolving commercial human AGP sourced from Sigma-
Aldrich, Poole, UK, at concentrations from 0-1.5 mg/ml, in 1ml HPLC water and
reading the absorbance of each at 280nm. De-salted and concentrated AGP
samples were reconstituted in 1ml HPLC grade water then the absorbance
measured at 280nm on a Thermo Scientific™ Genesys™ 10S UV-Vis
Spectrophotometer using a quartz cuvette with a path length of 1cm. The

62
equation of the standard curve was used to calculate the concentration of AGP
in samples from their absorbance value in accordance with the linear
relationship between absorbance and concentration outlined by the Beer-
Lambert law.
2.2.4 High pH Anion-Exchange Chromatography.
2.2.4.1 Acid Hydrolysis.
Once the concentration of AGP in each sample was determined an aliquot of
each sample was diluted to give 50μg/ml using HPLC water, dried down to
completion and reconstituted in 100μl HPLC water. The 50µg reconstituted
sample was transferred to a glass vial with an aluminium lid (to prevent
evaporation; purchased from Sigma-Aldrich, Poole, UK) and to this 100μl of 2M
TFA acid (Fisher Scientific, Loughborough, UK) and 50μl 4M HCl (Sigma-
Aldrich, Poole, UK) were added. Vials were then placed in a heat block set at
100°C for 4 hours to allow glycans to separate from the polypeptide back bone
of AGP and the bonds between glycan monosaccharides to be hydrolysed.
2.2.4.2 Dowex Ion Exchange.
Dowex-50 WX8 H+cation exchange resin (1 ml; purchased from Sigma-Aldrich,
Poole, UK) was added to a Pasteur pipette packed with approximately 1 cm of
glass wool to produce a Dowex column. The column was washed with 6ml of
HPLC water and then the sample added. The polypeptide scaffold was bound
by the resin while the separated glycans passed through the column and were
collected in a fresh eppendorf. A further 1 ml of HPLC water was added to the
column to flush out any remaining glycans which were collected in another fresh
Eppendorf. If using multiple samples, a separate Dowex column was used for
each sample to prevent cross contamination. Collected monosaccharides from
each sample were dried down to completion using a Christ RVC-2-18
Concentrator at -60⁰ C in preparation for monosaccharide analysis. Time taken
to dry down samples to completion varied between samples.

63
2.2.4.3 Monosaccharide Analysis.
Analysis of sample AGP monosaccharide content was achieved using HPAEC-
PAD on a Dionex 3000™ system with a GP50 gradient pump, an ED40
electrochemical detector, a CarboPac™ PA-100 analytical column (4x250mm)
and a guard column (4x50mm) (Dionex, Camberley, UK) and used in
conjunction with a HP Compaq computer with Chromeleon™ software to control
the automated system. This instrument separated monosaccharides based on
the formation of oxyanions from contact with the alkaline eluents and detection
occurred from the oxidation of these oxyanions on the gold electrode surface
which generated a measurable electric current. During PAD the pulse
potentials used were 0 seconds (sec), 0.05 V; 0.29 sec, 0.05 V; 0.49 sec, 0.05
V; 0.5 sec, 0.05 V; 0.51 sec, 0.6 V; 0.61 sec, -0.6 V; 0.65 sec, -0.6 V; 0.66 sec,
0.05 V.
Figure 2.1 Pulsed Potentials of the PAD System During HPAEC.
A 15 minute regeneration of a CarboPac PA-100 pellicular anion exchange
column was performed using 50% 0.5M NaOH (Sigma-Aldrich, Poole, UK) and
50% HPLC water. Each dried AGP glycan sample had 45 μl HPLC water and
5μl internal standard (2-deoxy-D-galactose, 1 mg/ml; Sigma-Aldrich, Poole, UK)
added before 50 μl was transferred into fresh plastic Dionex vials with septum
ready for monosaccharide analysis. The vials were then placed into the auto-
sampler of the Dionex analyser and 10 µl volumes applied to the column.
-0.8
-0.6
-0.4
-0.2
0
0.2
0.4
0.6
0.8
0 0.1 0.2 0.3 0.4 0.5 0.6 0.7
Po
ten
tial (V
)
Time (seconds)
DELAY SAMPLING
CLEANING
REDUCTION

64
Monosaccharides were separated at pH13 with an isocratic elution with 30 mM
NaOH at a flow rate of 0.5 ml/min for 35 minutes. The HPAEC column was
regenerated for 15 minutes using 50% 0.5M NaOH/ 50% HPLC prior to further
analyses.
Monosaccharide peaks were identified by dividing elution time of peaks by the
internal standard, then comparing the ratios to that of known monosaccharide
standards purchased from Sigma-Aldrich, Poole, UK (Fuc, Man, Glucosamine,
Galactosamine, Gal). Standard curves of each monosaccharide present on
AGP were produced by plotting monosaccharide amount (μg) versus peak area
in order to quantify levels of each monosaccharide within AGP samples.
2.2.4.4 Enzymatic Digestion.
One hundred microlitres of HPLC grade water was used to reconstitute
approximately 100µg of AGP and the solution was transferred from an
eppendorf into a glass vial with an aluminium lined cap which were purchased
from Sigma-Aldrich, Poole, UK. The vial was then placed in a heating block at
100°C for 3 hours to denature AGP. After denaturation the AGP solution was
dried down to completion using a Christ RVC-2-18 Concentrator at -60⁰ C and
the time required to accomplish this varied between samples.
To perform enzyme digestion, the denatured AGP was reconstituted in 79%
(v/v) HPLC grade water and the following reagents (New England Biolabs Inc.,
Hitchin, Hertfordshire, UK) - 10% (v/v) NP-40, 10% (v/v) NE Buffer G7 and 5
units (U) of PNGase F enzyme giving a total volume of 100µl. One unit of
PNGase F is defined by the manufacturer as the amount of enzyme required to
remove >95% of the carbohydrate from 10µg of denatured RNase B in 1 hour at
37⁰ C in a total reaction volume of 10µl. This mixture was incubated in water
bath for 24 hours at 37°C, following which, a further 5U of PNGase was added
and incubation resumed for another 24 hours at 37°C.
Once enzyme digestion had occurred, protein fragments were separated from
the oligosaccharides by ethanol precipitation. Three hundred microlitres of ice-
cold 80% ethanol was added to the 100 µl reaction mixture (3:1), the solution
mixed thoroughly and then stored at -20°C overnight. The processed AGP was

65
then centrifuged for 30 minutes at 14000 rpm. The supernatant containing
oligosaccharides was transferred to a fresh Eppendorf and dried to completion
under a vacuum while the protein pellet was discarded.
2.2.4.5 Oligosaccharide Analysis.
HPAEC-PAD was performed on a Dionex ICS 3000™ system with a GP50
gradient pump, an ED40 electrochemical detector, a CarboPac™ PA-100
analytical column (4x250mm) and a guard column (4x50mm) which was
purchased from Dionex, Camberley, UK. This was used in conjunction with a
HP Compaq computer with Chromeleon™ software to control the automated
system. This instrument separated oligosaccharides based size and charge due
to the formation of oxyanions from contact with the alkaline eluents and
detection occurred from the oxidation of these oxyanions on the gold electrode
surface which generated a measurable electric current. The same pulsed
potentials as monosaccharide analysis were used (see Figure 2.1) to analyse
oligosaccharide content of samples. Initial regeneration of the CarboPac PA-
100 pellicular anion exchange column was achieved by running 50% 1M NaOH
and 50% HPLC grade water through the column for 20 minutes prior to use.
Samples were reconstituted in 25 μl of HPLC grade water before being loaded
into the CarboPac PA-100 column. Oligosaccharides were separated using the
following eluent settings – equilibration for 10 minutes with 10% NaOH/ 5% 1M
NaOAc/ 85% HPLC grade water; separation for 45 minutes with a linear
gradient to a concluding eluent composition of 10% NaOH/20% NaOAc/ 70%
HPLC grade water; regeneration for 10 minutes using 50% NaOH/ 50% HPLC
grade water and lastly equilibration for 5 minutes using 10% NaOH/ 5% NaOAc/
85% HPLC grade water. All of these steps occurred at a flow rate of 1 ml/min.
NaOAc and NaOH were sourced from Sigma-Aldrich, Poole, UK.
A reference profile comprised of approximately 5μg of a human N-linked
oligosaccharide library purchased from ProZyme Inc., California, USA was
analysed for comparison with commercial AGP and patient-derived sample
profiles.

66
2.3 Statistical Analysis.
Microsoft® Excel 2010 was used to calculate the Pearson correlation coefficient
(r2). Pearson correlation coefficient values of 0.7-1 represent strong linear
relationships with 1 denoting a perfectly linear fit. Mean and standard deviation
were also established using Microsoft® Excel 2010. Statistical significance
(p<0.05) was determined using SPSS statistical analysis software package
version 20.

67
Chapter 3 – Participant Demographics

68
3.1 Dataset 1 Sample Demographics.
As detailed previously, a strong link between TNBC and BRCA1 mutations has
been unveiled by recent research. Fully anonymised samples of plasma were
purchased from the Alberta Tumour Bank from patients with TNBC with and
without family history of BC. TNBC status had been determined during the
patients’ clinical care process using IHC or Allred assay system prior to blood
draw (Gazinska, et al., 2013; Oakman, et al., 2010). Family history was
recorded by patients’ answering “Yes” or “No” during completion of a
questionnaire upon their initial clinic visit, however no further details were
requested. Table 3.1 below gives further details regarding TNBC samples.
Samples from a variety of ages were requested as there is an even stronger link
between BRCA1 mutations and TBNC in young women than those with TNBC
at a later age. Samples were separated by age into categories ≤ 35 years old
(n=6); >35 to 60 years old (n=6) and >60 years old (n=6) giving a total TNBC
sample size of n=18. Age of samples ranged from 22 to 81 years of age with a
mean ± standard deviation of 53 ± 19. Eight patients (44%) had received
treatments prior to donation of a blood sample.
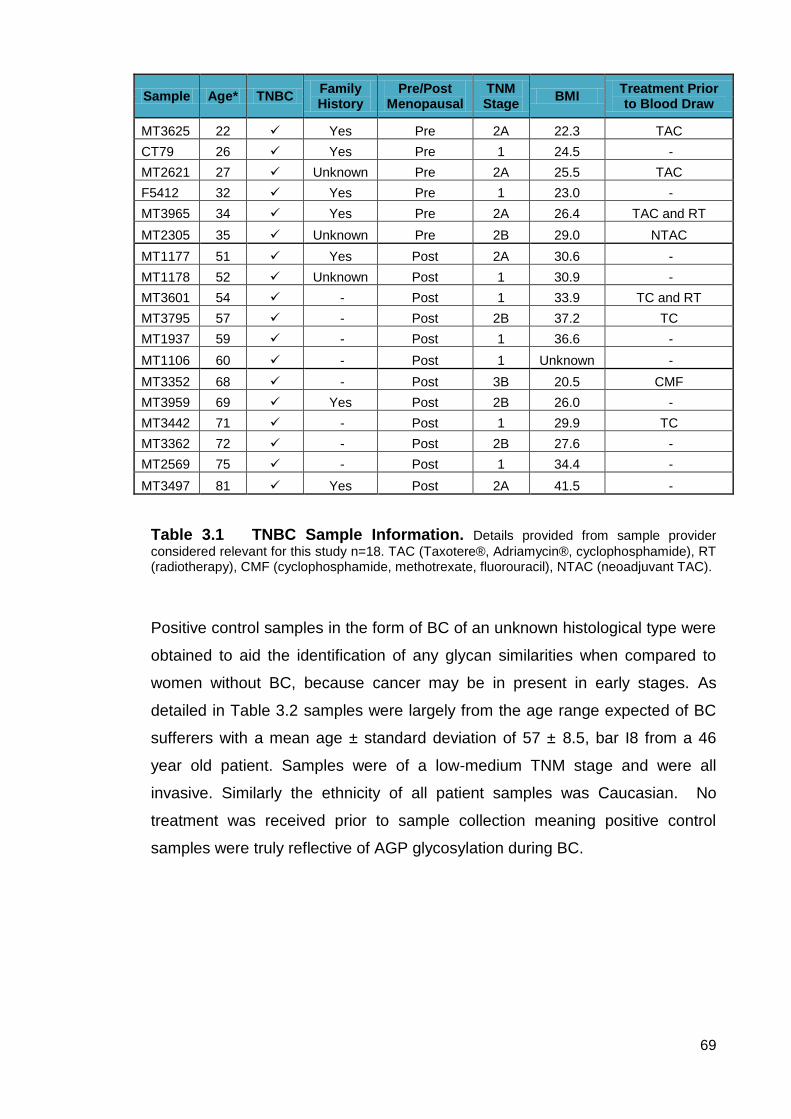
69
Sample Age* TNBC Family History
Pre/Post Menopausal
TNM Stage
BMI Treatment Prior to Blood Draw
MT3625 22 Yes Pre 2A 22.3 TAC
CT79 26 Yes Pre 1 24.5 -
MT2621 27 Unknown Pre 2A 25.5 TAC
F5412 32 Yes Pre 1 23.0 -
MT3965 34 Yes Pre 2A 26.4 TAC and RT
MT2305 35 Unknown Pre 2B 29.0 NTAC
MT1177 51 Yes Post 2A 30.6 -
MT1178 52 Unknown Post 1 30.9 -
MT3601 54 - Post 1 33.9 TC and RT
MT3795 57 - Post 2B 37.2 TC
MT1937 59 - Post 1 36.6 -
MT1106 60 - Post 1 Unknown -
MT3352 68 - Post 3B 20.5 CMF
MT3959 69 Yes Post 2B 26.0 -
MT3442 71 - Post 1 29.9 TC
MT3362 72 - Post 2B 27.6 -
MT2569 75 - Post 1 34.4 -
MT3497 81 Yes Post 2A 41.5 -
Table 3.1 TNBC Sample Information. Details provided from sample provider
considered relevant for this study n=18. TAC (Taxotere®, Adriamycin®, cyclophosphamide), RT (radiotherapy), CMF (cyclophosphamide, methotrexate, fluorouracil), NTAC (neoadjuvant TAC).
Positive control samples in the form of BC of an unknown histological type were
obtained to aid the identification of any glycan similarities when compared to
women without BC, because cancer may be in present in early stages. As
detailed in Table 3.2 samples were largely from the age range expected of BC
sufferers with a mean age ± standard deviation of 57 ± 8.5, bar I8 from a 46
year old patient. Samples were of a low-medium TNM stage and were all
invasive. Similarly the ethnicity of all patient samples was Caucasian. No
treatment was received prior to sample collection meaning positive control
samples were truly reflective of AGP glycosylation during BC.

70
Sample Age* BC
Type TNM Stage
Treatment Prior to Blood Draw
Ethnicity
H8 61 IDC 2A - Caucasian
I2 54 IDC 2A - Caucasian
I3 56 IDC 2 - Caucasian
I5 69 IDLC 2A - Caucasian
I8 46 IDC 1A - Caucasian
Table 3.2 Positive Control Sample Information. Relevant details provided by
sample supplier (Capital Bioscience) n=5. All samples were taken from women suffering from BC of low to moderate stage.
Negative control samples were obtained from the Blood Transfusion Service
and used to represent a healthy population. Thus their AGP glycosylation
patterns are likely to mirror those of a healthy individual.
Sample Blood Type
N1 A+
N2 B+
N3 AB+
N4 O+
N5 B+
Table 3.3 Negative Control Sample Information. Blood type of each sample
provided for information n=5.
3.2 Dataset 2 Sample Demographics.
In addition to samples collected for dataset 1, a population of 50 women at
increased risk of BC development were identified at a local High Risk Familial
Breast Screening Clinic. 16 women agreed to participate in the study giving a
recruitment rate of 32%. Table 3.4 shows the information collected from each
participant providing various factors for analysis. Ages of participants ranged
from 25-68 years old with a mean age ± standard deviation of 48.5 ± 11.8 with
the majority of participants (93.75%, n=15) being classed as high risk due to
family history and/or a genetic mutation. Within the sample set (n=16) half of the
participants had confirmed BRCA1 or BRCA2 mutations (n=8), others (n=7) had
no confirmed mutation but one participant had a BRCA1 mutation in the family

71
but had chosen not to be tested yet. The remaining participant (n=1) was
considered high risk due to previous treatment for Hodgkin’s lymphoma. A
number of participants had opted for preventative surgical measures (n=9)
which is reflected in the menopause column of Table 3.4. Further information
including smoker status and BMI (calculated from height and weight data
collected) are also shown in Table 3.4.
Sample Age Risk Gene Mutation BMI Smoker Prophylactic
surgery Pre/Post
Menopausal
W1 47 High BRCA1 28.2 N Full Hysterectomy Surgery
W2 68 High BRCA 2 20.2 N Full Hysterectomy Post
W3 68 High - 23.7 N - Post
W4 43 High BRCA2 32.4 N Oopherectomy No HRT
W5 25 High Not tested but BRCA1 in family 27.4 N - Pre
W6 42 High BRCA2 20.9 N Oopherectomy No HRT
W7 47 High Hodgkins lymphoma 26.1 N Pre
W8 37 High BRCA1 24 N Mastectomy Pre
W9 52 Mod - 23 N - Peri
W10 45 High - 24.8 N - Pre
W11 51 High BRCA2 20.4 Y Full Hysterectomy Surgery
W12 43 High - 25.2 N - Pre
W13 63 High - 24.1 N - Post
W14 34 High BRCA1 34.2 N Full Hysterectomy Surgery
W15 53 High BRCA1 21.9 N Oopherectomy Surgery
W16 58 High - 28.2 N Full Hysterectomy Surgery
Table 3.4 At-Risk Sample Demographics Details from data collection
sheet completed by participants (n=16) at clinic appointment. Collected information includes age, BC risk status, genetic mutation (if any), height and weight to calculate BMI, smoker status, preventative surgery and menopausal status.

72
Sample Age BMI Smoker Pre/Post Menopausal
C1 47 22.4 Y - not for 21 years Peri
C2 68 25.6 Y – not for 33 years Post
C4 43 27.7 Y - not for 8 years Peri
C5 25 25.6 Y - not for 4 years Pre
C6 42 23.5 No Pre
C7 47 28.5 No Pre
C8 37 20.6 Y - not for 8 years Pre
C11 51 32.5 No Peri
C12 43 26.4 N Pre
C13 63 29.3 Y - not for 20 years Post
Table 3.5 Age-Matched Healthy Control Sample Demographics. Table
provides demographic information about recruited age-matched control samples (n=10) for dataset 2.
3.3 Patient Demographic Discussion.
Current BC detection methods struggle to detect BC in its very early stages.
Detecting BC as early as possible is particularly important for women at high
risk of BC development as these women often develop more aggressive
tumours at a younger age and would greatly benefit from earlier diagnosis that
could be provided by a blood-based biomarker such as AGP. Earlier detection
would increase treatment options and likelihood of survival.
Dataset 1 of this study investigated AGP glycosylation in a patient population
with BC to examine AGP glycosylation during disease. The ideal sample
population for phase 1 would have been high risk women with family history or
BRCA1/BRCA2 mutations who had developed BC however, despite extensive
searching this population was not accessible. Thus, with recent research
indicating up to 80% of BRCA1 mutation carriers develop TNBC, samples from
women of varying ages with TNBC with and without family history were
obtained. Triple negative status was determined using IHC and All Red Assays
at pathology laboratories in Canada as part of a clinical process. IHC is the
staining of histological tissue samples using antibodies for the detection of
various cellular components such as ER and PR. While IHC diagnostic
thresholds differ between laboratories, there are suggestions that any result
>1% should be considered positive for hormone receptors. The Allred system is
a form of IHC results are given as a score from 0-8 calculated from percentage

73
of cells stained and intensity of staining. A higher score indicates greater
presence of hormone receptors and high staining intensity. A TN result is given
if no staining occurs (<1%) and an Allred score of 0 or 1 (depending on
laboratory diagnostic protocols) (Gazinska, et al., 2013; Oakman, et al., 2010).
All TNBC samples in Phase 1 were reported as testing negative for ER, PR and
HER2 however the diagnostic thresholds used were not obtainable.
Within the dataset 1 sample population, approximately half (55.5%) had not
undergone any treatment prior to blood draw. Of the remaining samples,
various treatments had been employed. TAC, CMF and NTAC are different
combinations of chemotherapy drugs Taxotere®, Adriamycin® (known
generically as Docetaxel and Doxorubicin respectively), Cyclophosphamide,
Methotrexate, and Fluorouracil. NTAC means chemotherapy was given prior to
surgery in an attempt to reduce the size of the tumour. The treatments given to
this sample group reflect that chemotherapy and RT are the treatments of
choice for TNBC as hormone therapies such as Tamoxifen are not feasible due
to lack of ER, PR and HER2. It has been shown previously by this research
team that altered AGP glycosylation during BC returns to a normal glycosylation
pattern upon treatment with Tamoxifen (Doak, 2008). Therefore, by choosing
untreated and treated BC samples a comparison can be drawn to investigate
differences in AGP glycosylation.
Dataset 1 samples were mainly of low TNM staging with n=8 stage 1, n=9 stage
2 and n=1 stage 3 and were all invasive ductal cancers. This was highly
beneficial for assessment of AGP glycosylation as a detection biomarker
because by choosing early stage TNBC, the AGP glycosylation patterns and
composition were reflective of that during the beginnings of TNBC development.
Furthermore, Phase 1 samples were from TNBC sufferers with ages ranging
from 22-81 giving a mean age of 53. Samples were equally separated into three
age categories of ≤35, >35-60 and >60 years of age. As discussed in section
1.1.3, approximately 7% of BCs are diagnosed in women below the age of 40
and this figure may be rising. BC diagnosed in young women is more likely to
be aggressive, of a high grade, TN and is associated with poor prognosis.
Recent research has revealed distinct differences between BC in younger
women compared to older women and each is thought to develop via different
biological pathways (Anders, et al., 2008; Anders, et al., 2009). Recently, it has

74
been suggested, in the United States that women who develop BC below the
age of 35 to be referred for genetic testing for BRCA1 of BRCA2 mutations due
to the links discovered between early presentation of BC and mutations of these
genes.
The positive control for dataset 1 was samples from women who had developed
BC; no information was available on the molecular or histological subtype of the
tumour (n=5). This was to determine whether changes in AGP glycosylation
occurred differently between generic BC and samples known to be TN.
Additionally the samples chosen to represent a positive control were all of low
stage BC, again to provide a better representation of AGP glycosylation during
early stage BC as well as enabling a better comparison with TNBC samples.
Blood samples donated by the Blood Transfusion Service were used to
represent a healthy population as a negative control (n=5). No information other
than blood type was provided for these samples however, individuals are
screened prior to blood donation to assess their health status and suitability for
donation. Therefore, it is highly likely that these samples were provided by
healthy individuals and suitable for use as a negative control in this study.
Dataset 2 samples were collected in a case-control manner, where each case
(a woman at increased risk of BC) was age-matched to a healthy control for
comparison. This was to examine if altered AGP glycosylation in the at-risk
population could be an indicator of BC development and opposing that whether
similarities in AGP glycosylation to healthy control samples could indicate no
BC development. As discussed in Chapter 1, women can be considered at
increased risk of BC development for several reasons. In this study women
were recruited from a High Risk Familial Breast Screening Clinic and those that
chose to participate were at increased risk because of a known BRCA1 or
BRCA2 mutation, strong family history of BC but no mutation detected or tested
for and one participant was at increased risk due to previous treatment for
Hodgkin’s lymphoma which involves radiation to the chest area. A variety of
ages were recruited ranging from 25 to 68 years of age with a mean age of 47
which is approaching the age that women at normal risk of BC would be sent for
screening in Scotland. These women were all under increased surveillance as
stated in the screening guidelines with some having had prophylactic surgery to
aid BC prevention. None of the at-risk population were taking any type of

75
preventative drugs such as Tamoxifen. Unfortunately, no follow up of the “at
risk” participants was possible because if BC is detected during screening they
are referred to another clinic for treatment and no further information is provided
to the screening clinic regarding their treatment or progression.
Use of an age-matched healthy control population allowed for a direct
comparison to be drawn between AGP glycosylation in at-risk and not at-risk
individuals increasing the likelihood that any changes in AGP glycosylation seen
in the at-risk population was due to disease occurrence. Unfortunately due to a
poor recruitment rate, not all age-matched controls could be recruited for this
study. However, of the participants recruited, there was variation in ages and
pre/peri/post-menopausal status. The age of participants ranged from 25-68
years and the mean age was 46 which was very similar to that of the at-risk
population recruited. Therefore, despite not all age-matched samples being
successfully recruited, a sufficient variation of control samples were collected.
Smoking status was recorded as inflammation of the lungs due to smoke
inhalation could alter AGP glycosylation producing a false result.
Dataset 2 of the study required individuals to self-select to participate which
removed any bias from the investigator but samples could still be biased in
terms of other factors such as age. Participants were also responsible for
reporting whether they met any of the exclusion criteria listed. Participants may
have had undiagnosed conditions that could result in altered AGP glycosylation
and thus affect results of the study.
Overall, it was considered that the samples recruited for both datasets would be
able to effectively test the hypothesis and aims of the study.

76
Chapter 4 – AGP Isolation and Level Determination

77
4.1 AGP Isolation.
This study used an adapted version of Smith, et al. (1994) for the isolation of
AGP from blood samples. This utilised a low pressure chromatography
procedure to isolate AGP which preserved the structural integrity of both the
protein and glycans.
Samples were precipitated with PEG 3350 and the supernatant collected prior
to further purification using low pressure chromatography. Sample
supernatants were applied to a Cibacron Blue 3GA Sepharose low pressure
chromatography column which binds HSA and the fraction containing AGP was
collected when a peak was illustrated by the chart recorder approximately 5
minutes (according to defined operating conditions) after addition of a sample to
the column (Figure 4.1 A). Eluted fractions were collected until baseline
absorbance was reached. The column was then regenerated for approximately
20 minutes by the addition of desorption buffer to remove HSA bound to the
Cibacron Blue 3GA Sepharose resin. The eluted fraction was concentrated
before application to a Red Sepharose CL6B to further remove impurities
including AAT. Approximately 10 minutes after sample application the AGP
fraction was eluted and collected when a peak was illustrated by the chart
recorder (Figure 4.1 B). Again, the column was regenerated using a desorption
buffer.

78
Figure 4.1 Low Pressure Chromatography Chromatograms Produced During AGP Isolation A) Cibacron Blue 3GA Sepharose B) Red Sepharose
CL6B
Following isolation of AGP all samples were subjected to desalting using
Centricon filter devices to prevent sample contamination and remove excess
salts that could interfere with absorbance readings at 280nm, thus altering AGP
concentration calculated from those results.
AGP purity and effectiveness of the isolation technique stated above were
proved using SDS-PAGE as shown in Figure 4.2.
0
5
10
15
20
25
0 10 20 30 40 50 60
Ab
so
rban
ce a
t 280n
m
Time (mins)
Sample
Desorption buffer
Albumin peak
Collected AGP containing fraction
0
5
10
15
20
25
0 10 20 30 40 50 60
Ab
so
rban
ce a
t 280n
m
Time (min)
A
Sample Desorption
buffer
AAT peak
Collected AGP containing fraction
B

79
Figure 4.2 SDS-PAGE Gel Proving AGP Purification. Gel shows protein
molecular mass marker ladder (lane A), commercially available AGP (lane B), PEG-precipitated plasma (lane C) and two samples that have undergone the isolation technique (lanes D and E). Purified AGP is highlighted using a while bands likely to be HSA and AAT are indicated
by a .
The SDS-PAGE gel showed AGP had been isolated to the same standard as
commercially available AGP and that unpurified plasma (lane C) contains
several impurities that have been removed from the isolated AGP samples. The
main impurities removed by the isolation technique are HSA (67kDa) and AAT
(52kDa).
4.2 Calculation of Sample AGP Concentration.
A calibration curve of absorbance values of commercial AGP ranging from
0.0625-1.5 mg/ml at 280nm was used to produce a line of best fit (Figure 4.3)
with equation of y = 0.5663 x (R2 = 0.99). Isolated concentrations of AGP from
normal blood samples obtained from the blood transfusion service (negative
A B C D E
250 kDa
130 kDa
95 kDa
74 kDa
55 kDa
36 kDa
25 kDa

80
control; n=4), samples from individuals with varying degrees of BC (positive
control; n=5), and samples from individuals with TNBC (n=18) with or without
family history as well and the means of each group are shown in Table 4.1.
Figure 4.3 Plot of Variation of Absorbance with Concentration of Commercially Purchased Human AGP (n=3). R
2>0.9. Relative amount of AGP in a
sample (x): x = Absorbance at 280nm/ 0.5663.
4.3 Dataset 1 AGP Concentration.
Using the equation shown in Figure 4.3 AGP concentrations from dataset 1
were determined as shown below in Table 4.1.
y = 0.5663x r² = 0.9967
0.0
0.1
0.2
0.3
0.4
0.5
0.6
0.7
0.8
0.9
1.0
0.0 0.2 0.4 0.6 0.8 1.0 1.2 1.4 1.6
Ab
so
rban
ce a
t 280n
m
Concentration of Commercially Purchased Human AGP (mg/ml)

81
Table 4.1 Summary of Isolated AGP Concentrations. AGP concentrations of
BC (n=5), healthy (n=5) and TNBC (n=18) samples are given as µg/ml with the difference between each sample and the mean ± SD AGP concentration of healthy samples provided in a separate column.
All TNBC samples showed AGP concentrations elevated above mean healthy
controls, with over 80% having over double the mean healthy AGP
concentration. AGP concentration of TNBC samples was comparable across all
age categories with only a small decline in mean concentration with increasing
N1 178 -
N2 331 -
N3 16 -
N4 68 -
N5 234 -
Negative Control Mean ± SD 165.5 ± 126.5
Breast Cancer H8 4156 + 4007.7
Breast Cancer I2 4417 + 4268.7
Breast Cancer I3 536 + 387.7
Breast Cancer I5 161 + 12.7
Breast Cancer I8 137 - 11.2
Positive Control Mean ± SD 1881.4 ± 2203.1
MT 3965 474.1 + 325.8
MT 3625 280.2 + 131.9
MT 2305 544.6 + 396.3
CT 79 1073.5 + 925.2
F 5412 579.9 + 431.6
MT 2621 333.1 +183.0
TNBC Under 35 Mean ± SD 547.5 ± 316.4
MT 1177 562.3 + 414.0
MT 1178 474.1 + 325.8
MT 3601 685.7 + 537.4
MT 3795 421.2 + 272.9
MT 1937 650.4 + 502.1
MT 1106 403.6 + 255.3
TNBC 35-60 Mean ± SD 532.9 ± 128.9
MT 3352 262.6 + 114.3
MT 3497 791.4 + 643.1
MT 3442 685.7 + 537.4
MT 3362 579.9 + 431.6
MT 3959 456.5 + 308.2
MT 2569 315.5 + 167.2
TNBC 60 and Over Mean ± SD 515.3 ± 230.5
SampleConcentration
(μg/ml)
Level Compared to
Mean Healthy AGP

82
age. All except one of the BC positive control samples had AGP concentrations
above that of the mean healthy controls. Samples H8, I2 and I3 were greatly
increased above mean healthy control concentration whereas sample I5 was
comparable to the mean heathy controls and sample I8 revealed a slightly lower
AGP concentration. As only one repeat of TNBC samples was possible due to
small sample volume, mean AGP concentration values were calculated for age
category for comparison with each control (BC and healthy) and are shown
below in Figure 4.4.
Figure 4.4 Plot of Variation of Mean Isolated AGP Concentrations from all
sample groups (n=3), significance at p<0.05 indicated by *.
Mean concentrations of isolated AGP from normal blood samples was
significantly lower (p<0.05) than isolated AGP from both BC samples (positive
controls) and samples from individuals with TNBC with/without family history.
Similarly, there was a significant difference between all TNBC groups and
positive control. There was no significant variation between mean AGP
concentrations in TNBC groups (p<0.05) when a one-way analysis of variance
(ANOVA) was used although a slight decrease in concentration with increasing
age was noted.
0
500
1000
1500
2000
2500
3000
3500
Negative Control
Positive Control
<35 >35 - 60 >60
Co
ncen
trati
on
of
AG
P (
μg
/ml)
Sample Groups
*
* * *

83
4.4 Dataset 2 AGP Concentration.
Sample At Risk (μg/ml)
Age Matched Healthy Control (μg/ml)
Difference Between “At Risk” Sample and Healthy Control
(μg/ml)
1 455.5 243.6 + 211.9
2 441.5 305.5 + 136.0
3 384.9 - + 111.2 *
4 443.2 183.6 + 259.6
5 471.4 356.7 + 114.7
6 517.3 303.7 + 213.6
7 342.6 247.2 + 95.4
8 226.0 151.8 + 74.2
9 459.1 - + 185.4 *
10 799.9 - + 526.2 *
11 420.2 499.7 - 79.5
12 706.3 220.7 + 485.6
13 148.3 224.2 - 75.9
14 148.3 - - 125.4 *
15 287.8 - + 14.1 *
16 277.2 - + 3.5 *
Mean ± SD 408.1 ± 196.5 273.7 ± 99.8
Table 4.2 Summary of Isolated AGP Concentrations of At-Risk Samples Compared to Age-Matched Healthy Control Samples. AGP concentrations of “at
risk” (n=16) and healthy controls (n=10) are given as µg/ml. Where comparison to an age-matched control was not possible, a comparison was drawn between the mean healthy AGP concentration (273.7µg/ml) and indicated by an *.
The majority of “at risk” samples (87.5%) revealed increased AGP
concentrations compared to age-matched healthy controls or mean AGP
concentration of healthy controls. However, samples W11 and W13 showed
AGP concentrations below that of healthy controls while samples W15 and W16
were only marginally elevated above healthy control concentrations. Sample
W10 had the highest AGP concentration at 799.9µg/ml closely followed by W12
at 706.3µg/ml, and samples W13 and W14 both had the lowest AGP
concentration of 148.3µg/ml. Of the age-matched healthy controls C11
possessed highest AGP concentration of 499.7µg.ml with C8 having the lowest
at 151.8µg/ml.

84
Figure 4.5 Mean AGP Concentration of “At Risk” and Age-Matched Healthy Control Samples. Mean AGP concentration of “at risk” (n=16) and
healthy control (n=10) samples is given in µg/ml. Data was gathered in triplicate and calculated using the equation in Figure 4.3 as above. Statistical significance of p<0.01 indicated by **.
Use of a one-way ANOVA determined a significant difference between mean
AGP concentrations of “at risk” samples and healthy controls (p<0.01) with the
“at risk” population having significantly elevated AGP levels.
0
100
200
300
400
500
600
700
At Risk Age-Matched Healthy Controls
Co
ncen
trati
on
of
AG
P (
µg
/ml)
Sample Group
**

85
Figure 4.6 Isolated AGP Levels of At-Risk Samples Compared to Age-Matched Healthy Controls or Mean Healthy Control. Graph shows a direct
comparison between AGP concentrations from “at risk” sample and an age-matched healthy control. Where an age-matched healthy control was not possible, “at risk” samples are compared to the mean AGP concentration of the healthy control population. Significant differences are indicated as * for p<0.05 and ** for p<0.01
.
The majority of “at risk” samples (12/16) showed significantly higher levels of
AGP (p<0.01; W10 and W12 p<0.05) compared to controls, However, W11 and
W14 had significantly lower AGP levels and W15 and W16 showed no
significant difference. As mentioned previously, absorbance measurements
were taken in triplicate and used to calculate AGP concentration with little
variation displayed between readings as shown by small error bars in Figure
4.6. Overall AGP concentrations of the “at risk” population show a 1.4 fold
increase compared to the healthy control population.
4.5 Discussion.
4.5.1 Purification of AGP.
The aim of the research discussed in this chapter was to confirm purification of
AGP and determine concentrations of isolated AGP to assess the variation in
levels from two sample populations - Dataset 1 included of samples from
0
100
200
300
400
500
600
700
800
900
1 2 3 4 5 6 7 8 9 10 11 12 13 14 15 16
Co
ncen
trati
on
of
AG
P (
µg
/ml)
Sample Number
At Risk Age Matched Healthy Control Mean Healthy Control
** **
**
** **
**
**
**
**
*
**
*
**
**

86
healthy individuals, women with BC of unknown type and women with TNBC as
well as Dataset 2 containing samples from women at increased risk of BC
development and age-matched healthy controls. This was performed using low
pressure chromatographic isolation of AGP, desalting, SDS-PAGE and
spectrophotometry.
The isolation of plasma proteins from whole blood was once a problematic and
laborious task, due to the presence of large amounts of HSA in plasma
(approximately 50%) (Travis et al., 1976). HSA was difficult to remove
completely as it has a similar molecular mass and charge to other plasma
proteins, therefore effective removal techniques are essential (Travis et al.,
1976).
There are several protocols of AGP isolation available, most of which exploit
AGP’s low pI or extremely high solubility (Chan and Yu., Charlwood et al., 1976;
Hellerstein et al., 1985; 1991; Sugiyama et al., 1985; Routledge et al., 1980 and
Weimer et al., 1950). However, the majority use harsh acidic conditions that will
affect the structural integrity of glycans bound to AGP which would affect
investigation of glycosylation. For instance, an initial AGP isolation method used
by Weimer, et al. (1950) used ammonium sulphate to precipitate AGP at low
pH. Low pH could result in glycan structure alterations such as desialylation
(Varki, et al., 2009). Other methods of AGP isolation include hot phenol
extraction (Chan and Yu, 1991) but this was shown to be ineffective as AGP
purified in this way was more readily cleared upon injection into mice which
indicated a change in glycan structure such as desialylation (McCurdy, et al.,
2011).
Another method was proposed by Herve, et al. (1996), who created a two-step
purification of AGP from plasma comparable with the protocol of Smith, et al.
(1994).
The method utilised in this study was an adapted form of Smith and colleagues
(1994) protocol which in turn adapted Laurent, et al. (1984) method using PEG
3350 and low pressure affinity chromatography to isolate AGP without
denaturation or desialylation. Thus allowing AGP’s in vivo glycan structure to be
analysed for unique characteristics that could indicate presence of BC. Previous
studies by Doak (2008) and Gallacher (2009) have shown this AGP isolation
87
method is suitable for both fresh and frozen samples as AGP remains stable.
Subsequently methods such as Herve, et al. (1996) were comparable with
Smith, et al. (1994).
Initial addition of PEG 3350 to samples at 40% w/v enables precipitation of
proteins less soluble than AGP and blood cells, leaving AGP and other major
plasma constituents such as HSA and AAT (Smith, et al. 1994). PEG 3350
functions by drawing water molecules away from proteins in the suspension,
increasing the number of protein to protein interactions in the plasma. Proteins
can no longer dissolve when these interactions become abundant leading them
to precipitate (Ingham, 1990). The main advantages of PEG 3350 are two-fold:
firstly, PEG 3350 does not denature the proteins it interacts with, preserving the
in vivo nature of AGP when used. This is imperative when performing a
structural analysis such as this study. Secondly, PEG 3350 removes a number
of potentially interfering plasma components in one simple step (Smith, et al.,
1994) as shown in Figure 4.2. However, after centrifugation, HSA and AAT
remain in the removed supernatant, both of which can interfere with AGP
analysis and thus require removal.
This study employed low pressure affinity chromatography in the form of a
Cibracron Blue Sepharose 3GA column which facilitated the removal of HSA
from samples, further isolating AGP. As shown in Figure 4.1a, after addition of a
sample to the column, the first fraction containing AGP eluted at approximately
15 minutes, represented by a peak deviating from the baseline. The addition of
a desorption buffer (see Table 2.1) resulted in column-bound HSA eluting from
the column shown as a second peak on the chromatogram. Complete
regeneration of the column occurred within 20 minutes.
Use of Cibacron Blue for removal of HSA has been recognised for several years
with Travis, et al. (1976) reporting removal of up to 98% HSA when using a
Cibacron blue column. HSA possesses bilirubin binding sites and as Cibacron
Blue dye is similar to bilirubin as it contains negatively charged planar aromatic
ring systems, HSA binds to the dye (Leatherbarrow and Dean, 1980). Cibacron
Blue dye works well for this study as it removes HSA allowing the remaining
plasma constituents to pass through the column unhindered.

88
The original method used by Smith, et al. (1994) contained a Q-sepharose step
to further isolate AGP after removal of HSA describe previously. However, the
method was designed for larger sample volumes (50ml) which could afford the
loss of sample at this stage but due to small sample quantity the step was
removed to preserve sample volume. Removal of this step has been shown to
have little effect on AGP purity by members of the research team through
immunodiffusion and SDS-PAGE (Behan, 2010; Gallacher, 2009). Therefore,
the next stage of AGP isolation was elimination of AAT from samples.
For removal of AAT, concentrated samples from the previous step were applied
to a Red Sepharose CL-6B column; a peak indicating sample elution from the
column was seen between 13-25 minutes and collected as before. Application
of a desorption buffer to the column resulted in a second peak illustrating the
elution of AAT previously bound to the column. Whilst in the column, AAT and
proteins such as kinases, dehydrogenases and transferases bind to the resin.
However, AGP is so heavily glycosylated there is not enough of the protein
portion available to facilitate binding, allowing AGP to pass through the column
unimpeded. The eluted sample fraction now contained only purified AGP as
shown in Smith, et al. (1994) study by the appearance of a single band on SDS-
PAGE at the 45kDa mark and detection of only AGP through immunodiffusion.
The current study confirmed the successful isolation of AGP using SDS-PAGE,
which in figure 4.2 shows a single band at approximately 45kDa in line with
previous investigations Smith, et al. (1994).
4.5.1.1 Potential Problems with Purification Method
The purification method described in section 2.2.2 successfully purified AGP
from whole blood and plasma samples to facilitate the current study. However,
issues did arise that could be improved in the future. Firstly, due to small
sample volumes there was limited unused sample to perform techniques such
as SDS-PAGE or lectin ELISA’s to confirm AGP purification. Therefore, use of
this purification method in subsequent studies would benefit from larger initial
sample volumes of approximately 3-4ml. Another potential problem with this
purification method was that the same Cibracron Blue Sepharose 3GA and Red
Sepharose CL-6B columns were used for purification of all samples used in this

89
study. Despite rigorous cleaning of the columns with desorption buffers after
application of each sample, sample remnants may have remained in the column
which could have resulted in cross-contamination. However, use of a freshly
prepared column for each sample to avoid cross-contamination entirely would
have proved costly and so was not feasible for this study. Additionally, due to
the introduction of salts, from use of a NaOAc buffer during the isolation
process, it was necessary to filter isolated samples using Centricon filter
devices with a 10kDa molecular weight cut off. Presence of salt in isolated AGP
samples would interfere with absorbance readings at 280nm, as both NaOAc
and AGP absorb at this wavelength, which would subsequently affect
calculation of AGP total mass in samples. Although desalting of isolated AGP
samples was performed there was no way to ensure all salt had been removed
which could have falsely elevated AGP concentrations measure
spectrophotometrically.
Despite the potential problems with the purification method it is unlikely that
there was any negative implications for AGP glycosylation as several studies
have successfully utilised this purification methods for analysis of AGP glycan
content without detriment to glycosylation (Behan., 2010; Behan and Smith.,
2011; Behan, et al., 2013; Doak., 2008; Gallacher., 2009; Smith et al., 1997;
Smith et al., 2002).
4.5.2 Determination of Isolated AGP Levels.
AGP levels were determined after purification through a standard curve created
using varying concentrations of commercially available AGP. Phe, Tyr and Trp
residues present in AGP’s protein backbone absorb at 280nm, the protein
backbone is not distorted by isolation techniques used making the use of
spectrophotometry more reliable (Smith et al.,1994; Behan., 2010).
A standard curve was constructed using concentrations of commercial AGP at
0.0625-1.5 mg/ml as these are similar to in vivo AGP levels and gave
absorbance readings <1. The linearity of the Beer Lambert equation breaks
down with absorbance values above 1.0 indicating that the sample is too
saturated to give a dependable result (Williams and Fleming, 2007). There is

90
good correlation between commercial AGP concentration and absorbance at
280nm with an r2 value of 0.99.
4.5.3 Alternative Supportive Methodologies.
Sample volume and funding permitting, additional methodologies exist that may
have supported the purification method used in this study to aid the confirmation
of results and enhance the outcomes. Efficiency of the low pressure
chromatography columns used could have been verified through the use of
plasma samples spiked with known concentrations of AGP to measure the
percentage of AGP recovered from the column. SDS-PAGE of all fractions after
application to each low pressure chromatography column would have
evidenced the removal of different unwanted sample components by each
column as opposed to the before and after purification samples shown in figure
2.4. Western Blotting of SDS-PAGE gels using AGP specific antibodies could
have confirmed purification of AGP (Behan, 2010). Use of a Bradford assay
(Bradford, 1976) to determine total protein concentration or a sandwich ELISA
incorporating antihuman AGP and antihuman AGP conjugated with horseradish
peroxidase could have been utilised (Hashimoto, 2004) to measure AGP
concentration (McCurdy et al., 2011) and could have been used to corroborate
calculated AGP concentrations from absorbance measurements and improve
the reliability of results. However, this would have reduced the already limited
sample volume available for this study.
4.5.4 Variation of Isolated AGP Content in Healthy Individuals.
Isolated AGP from healthy control samples in dataset 1 ranged from 16-
331µg/ml with a mean ± SD of 165.5 ± 126.5µg/ml indicating large variation of
isolated AGP levels in samples from healthy individuals within this dataset.
However, levels of isolated AGP from age-matched healthy controls in dataset 2
were more consistent, ranging from 151.8-499.7µg/ml with a mean ± SD of
273.7 ± 99.8 µg/ml. Differences in isolate AGP levels between healthy controls
of both datasets could be due to the way samples were stored and the length of
storage prior to use. Healthy control samples for dataset 1 were stored at in a
freezer at -20⁰ C for several months prior to purification whereas samples from

91
age-matched healthy controls used in dataset 2 were collected fresh and the
purification process started immediately without prior freezing. Therefore it is
possible that degradation of AGP occurred while healthy samples from dataset
1 were stored at -20⁰ C as proteins should be stored at -80⁰ C to prevent
degradation (Saraswathy and Ramalingam, 2011). Degradation could also
account for the large disparities between healthy control samples in dataset 1
depending on length of storage. Additionally, as AGP concentration is known to
increase during inflammation and several diseases (Cecilani and Pocacqua,
2007) asymptomatic volunteers may have considered themselves healthy but
been unaware of having pathological conditions that could have falsely elevated
levels of AGP isolated from samples used as healthy controls and increased
variation between samples.
Interestingly, studies by Kishino et al., (2002) and Orzyck-Powiiowicz (2006)
revealed that gender may influence AGP levels in healthy individuals in that
men may have higher concentrations of AGP than women and that AGP
content can vary throughout a woman’s menstrual cycle. As no gender
information was supplied with healthy samples for dataset 1, variation in
isolated AGP levels could be due to a mixture of male and female samples
being supplied by the Blood Transfusion Service for this study.
Previous studies have shown the mean concentration of AGP in healthy
participants to range between 360-1460µg/ml (Blain, et al., 1985; Jørgensen, et
al., 2002). However, earlier research using an identical purification method has
shown mean levels of AGP in healthy populations at 53µg/ml, 78µg/ml and
830µg/ml (Behan, 2010; Doak, 2008; Smith et al., 2002). In this study, mean
isolated AGP levels of healthy participants were marginally lower than the
majority of previously published results. This may be because samples were
obtained from the Blood Transfusion which implements a strict health criterion
prior to blood donation, leading to very low AGP concentrations. However, it is
more likely that some sample loss has occurred during the purification process
or ineffective sample storage.

92
4.5.5 Isolated AGP Levels from Dataset 1.
Isolated levels of AGP from all sample groups in dataset 1 are shown in table
4.1 and were calculated using the standard curve in figure 4.3 which revealed
that mean AGP levels in a healthy population (165.5 ± 126.5μg/ml) were
significantly lower than those of both BC samples (positive control; 1881.4 ±
2203.1μg/ml) and TNBC samples regardless of age (547.5 ± 316.4; 532.8 ±
128.9 and 515.2 ± 230.5μg/ml respectively).
4.5.5.1 Isolated AGP Levels of BC Positive Control Samples
In comparison to healthy controls used in this study, BC samples acting as
positive controls had a significant (p<0.05) 11 fold greater mean concentration.
However, research by Blain, et al., (1985), Jørgensen, et al., (2002) and Smith
et al., (2002) showed AGP levels of 360-1460µg/ml isolated from healthy
individuals. Therefore, if applying this healthy AGP reference range to BC
samples in this study, only two out of five samples (H8 and I2) had AGP
concentrations above this range, both showing an approximate 3 fold increase.
The elevation of isolated AGP in H8 and I2 correlates with results from a study
by Rudman, et al. (1974) which investigated AGP in various disease states and
showed a 2-5 fold increase in AGP concentration in the course of cancer.
Furthermore, the results for H8 and I2 connect well to research that illustrates
plasma AGP concentration in BC being 2.5 times higher than healthy controls
(Duché, et al., 2000), while Twining and Brecher (1977) illustrated a 35.8%
increase in AGP concentration in BC sufferers compared to healthy individuals.
However, the findings of this study do not show association an with research
conducted by Roberts et al., (1975) which highlighted a correlation between
increasing plasma AGP concentration and increasing severity of BC, as the
remaining BC samples from the current study (I3, I5 and I8) have isolated AGP
levels within or below the range indicated by Blain, et al., (1985), Jørgensen, et
al., (2002) and Smith et al., (2002). All positive control BC samples were from
women with low grade tumours of 1A to 2A using TNM staging. Therefore,
given the results from the study by Roberts et al., (1975), it was expected that
all positive control BC samples would contain similar levels of isolated AGP

93
after purification. As discussed in section 4.3.5, reasons for this unexpected
variation could be due to storage of samples prior to purification. BC samples
used as positive controls for this study were purchased in advance of the
current research study beginning and were kept frozen at -20⁰ C which may
have caused degradation of AGP, subsequently affecting the detected
concentration after purification (Saraswathy and Ramalingam, 2011).
4.5.5.2 Isolated AGP Levels of TNBC Samples.
AGP levels isolated from TNBC samples ranged from 262.6-791µg/ml with
mean concentrations of 547.5 ± 316.4; 532.8 ± 128.9 and 515.2 ± 230.5μg/ml
when grouped by age as <35, 35- 60 and >60 years old respectively. All TNBC
samples contained significantly (p<0.05) elevated levels of isolated AGP of
approximately a 3 fold difference compared to healthy control samples. To date
no other studies have investigated AGP concentration in TNBC. Yet, these
increases in AGP concentration are similar to those published by Rudman et al.,
(1974) and Duche et al., (2000) who found AGP levels rose by 2-5 fold during
cancer and 2.5 fold in BC specifically. However, if relating these results to
isolated AGP levels from healthy individuals in other studies (Blain, et al., 1985,
Jørgensen, et al., 2002 and Smith et al., 2002), AGP concentrations from TNBC
samples lie below or within healthy AGP concentration ranges. Yet, unlike the
healthy and BC control samples, lower levels of isolated AGP are unlikely to be
due to degradation of the protein during storage. This is because samples were
stored at -80⁰ C upon collection at the facility in Canada and transported on ice
within seven days to Edinburgh Napier University where the purification process
began immediately upon reciept of samples. While the possibility of sample loss
during purification could be attributed to lower levels of AGP being isolated from
these samples, recovery experiments were not performed prior to sample
purification it so remains unclear whether sample loss was a factor.
Interestingly, despite elevation of AGP concentration in the TNBC samples
being equivalent to previous studies compared to healthy controls, isolated AGP
levels from these samples were significantly (p<0.05) lower than BC positive
controls. Postive controls contained 3.5 fold greater AGP concentration than
TNBC samples. All TNBC samples were from patients with low TNM stage

94
tumours (1-2B) except MT3352 which was stage 3B. This indicated an initial
difference between TNBC and BC of an unknown type and links to research by
Perou et al., (2000) suggesting that perhaps BC subtypes should be considered
separate diseases due to the different molecular mechanisms involved in their
development. If TNBC tumours are secreting different levels of AGP than other
BC subtypes this could be used to further differentiate between BC subtypes
and aid early diagnosis.
While mean levels throughout the TNBC age groups were consistent showing
no significant differences, standard deviations highlighted variance within the
groups. Eight patients with TNBC who donated blood samples underwent
chemotherapy prior to blood draw. This may have accounted for variation in
AGP concentrations in samples as AGP concentration has been shown to
return to healthy, pre-cancer levels upon treatment (Kailajarva et al., 2000).
However, this hypothesis could only be attributed to TNBC samples from
women <35 years old as low AGP levels corresponded with patients who had
received treatment prior to blood draw while those who had not received
treatment had higher levels of AGP. This may account for the large variation
between samples in this group (indicated by a SD of 316.4). In the other age
groups there appeared to be no correlation between treatment and AGP levels.
If examining AGP concentrations in TNBC samples by stage there also
appeared to be no links between TNM stage and AGP concentration. This
contradicts findings by Roberts et al., (1975). For example MT3352 was TNM
stage 3B but contained 262.6µg/ml isolated AGP and CT79 was TNM stage 1
yet had an isolated AGP concentration of 1073.5µg/ml.
4.5.6 Isolated AGP Levels from Dataset 2.
Dataset 2 was comprised of samples from a population at increased risk of BC
development in comparison to samples from age-matched healthy controls.
Where age-matched controls could not be recruited, comparisons were drawn
using the mean AGP concentration of the age-matched healthy controls which
in this dataset was 273.7 ± 99.8µg/ml. This is lower than the range of 360-
1460µg/ml found in previous studies by Blain, et al. (1985) and Jorgensen, et al.

95
(2002) as well as being similar to levels isolated previously by this research
group (Behan, 2010; Doak, 2008; Smith et al., 2002).
As this study was comparing two healthy populations, the only difference being
that one population was it increased risk of BC, it was expected that no
differences would be found in terms of AGP concentration. However, mean
AGP levels isolated from “at risk” patients were significantly (p<0.01) increased
compared to age-matched healthy controls .Similarly if examining “at risk”
samples compared to their age-matched healthy control individually, 87.5%
contained significantly (majority p<0.01, 2 samples p<0.05) elevated levels of
isolated AGP. As with TNBC samples in dataset 1 isolated AGP levels from the
”at risk” population were within the normal range reported by previous studies
(Blain, et al. 1985; Jorgensen, et al. 2002; Behan, 2010; Doak, 2008; Smith et
al., 2002). Yet the majority of “at risk” sample showed at least a 1.3 fold rise in
AGP concentration compared to age-matched controls which is not as high as
the 2-5 fold or 2.5 fold increases reported by Rudman et al., (1974) and Duche
et al., (2000) during cancer or seen in TNBC samples from dataset 1, but an
increase in AGP concentration could still indicate the early stages of BC
development. Relating to this, AGP is known to possess immunomodulatory
functions (see Table 1.5) and increases in AGP concentration are associated
with decreased proliferation of lymphocytes (Chiu et al., 1977), decreased
lymphocytic secretion of IL-2 (Elg et al., 1997) which aids differentiation of self
and non-self by the immune system (Liao et al., 2011) and preliminary data
gathered by Zsila et al., (2009) demonstrates that increased AGP concentration
may activate cell proliferation. Therefore, the small increases in AGP
concentration in “at-risk” samples compared to age-matched healthy controls
may be a result of early metastatic breast cells creating an immune suppressed
micro-environment to enhance tumour development and survival. Furthermore,
several studies have already shown AGP’s non-specific immunosuppressive
actions during cancer may promote immune evasion and lower the
effectiveness of immunotherapy based treatments (Tamura et al., 1981; Samal
et al., 1982 and Elg et al., 1997). Yet in contrast, a study conducted in 1986 by
Watanabe et al., implicated AGP expression with inhibition of tumour growth.
However, as AGP protein synthesis and glycosylation are independently
regulated (van Dijk et al., 1994 and van Dijk et al., 1995) it is possible that

96
expression of altered AGP glycosylation was responsible for tumour inhibition
rather than increased AGP concentration.
Furthermore, previous research within this group by Doak (2008) examined
untreated BC, tamoxifen treated BC and “at risk” individuals receiving tamoxifen
as a preventative measure. Doak’s study revealed that an “at risk” population
receiving tamoxifen had similar AGP levels to a “normal” healthy population
(660µg/ml compared to 530µg/ml respectively). None of the current study’s “at
risk” participants were receiving tamoxifen and the majority had AGP
concentrations similar to or lower than “at risk” tamoxifen recipients in Doak's
(2008) study. Therefore, it would appear that tamoxifen treatment has little
effect on AGP levels in an “at risk” population. However, no information on why
Doak’s “at risk” population were considered to be at risk of BC development
was provided while the current study contained women who were “at risk” due
to confirmed family history, BRCA1 or BRCA2 mutation or treatment for
Hodgkin’s lymphoma.
Examination of sample AGP concentration in confirmed mutation carriers within
dataset 2 showed no correlation between BRCA1 mutation and AGP
concentration. Nevertheless, sample W1 had an isolated AGP level 1.5 fold
higher than other samples from BRCA1 patients which may point to initial
development of BC (Rudman et al., 1974 and Duche et al., 2000). BRCA2
mutation carriers had consistently higher concentrations of AGP compared to
BRCA1 mutation carriers except for sample W1. As BRCA1 mutation carriers
are at higher risk of BC development compared to BRCA2 carriers (Mavaddat et
al., 2013) maybe the concentrations of AGP within these samples should be
viewed differently. The majority of BRCA1 samples contained isolated AGP
levels approximately 1.5 fold lower than BRCA2 samples, as BRCA1 carriers
are more likely to develop BC, perhaps an initial decrease in AGP concentration
is associated with BC occurrence. Similarly low levels of AGP were seen in
samples W13 and W16 which had no known mutations. Yet, to date no other
studies have investigated AGP in BRCA1 and BRCA2 mutation carriers so no
comparisons can be drawn to test this hypothesis.

97
4.5.7 Variants of AGP.
When assessing AGP concentration in samples it is important to note that total
AGP concentration is the result of variants produced by three genes known as
AGP-A (ORM1) and AGP-B/B’ (ORM2) (Katori et al., 2011). AGP-A encodes for
F1, F2 and S variants which are more commonly referred to as F1*S and AGP-
B/B’ both encode for the A variant (Colombo et al., 2006; Taguchi et al., 2013).
The F1*S and A variants differ by 20 amino acid substitutions (see Figure 1.7)
but do not vary greatly in structure (see Figure 1.6). In healthy individuals the
ratio of F1*S to A variants is approximately 3:1 (Dente et al., 1987) however
these ratios may alter during cancer. As increases in isolated AGP levels were
seen in BC of unknown type and TNBC samples (dataset 1) as well as “at-risk”
samples (dataset 2) compared to healthy controls, it is possible that differences
in AGP variant ratios was also occurring. Previous research has revealed that
increased expression of F1*S and A variants occurs in breast, ovarian and lung
cancer, however the overall ratio tends to remain the same (Duche et al., 1998
and Duche et al., 2000). In contrast to this, a more recent study by Budai et al.,
(2009) using ultra high performance liquid chromatography and mass
spectrometry instead of the isoelectric focussing and immunoblotting method
used by Duche et al., (1998;2000), unveiled F1*S to A variant ratios of up to 8:1
in lymphoma, melanoma and ovarian cancer. However, unfortunately it was not
feasible to investigate the proportion of AGP variants within samples during this
study to account for increases in overall levels of isolated AGP.
4.6 Summary Statement.
In summary this chapter accomplished its aim to confirm the isolation of AGP
from blood samples using low pressure chromatography and assess variation in
isolated AGP levels from different sample populations used in this study.
It was noted that other analytical techniques may have been employed to
support the findings if sample volume was not so limited; that variation of
isolated AGP levels in healthy controls and BC of unknown type in dataset 1
may have been due to ineffective storage and alterations in the ratios of AGP
variants which could have accounted for increased isolated AGP levels.

98
Results from dataset 1 highlight differences in isolated AGP levels between
healthy individuals, BC and TNBC samples. Samples from healthy individuals
contained low mean levels of isolated AGP while BC samples had significantly
increased AGP levels in comparison. Both sets of controls showed variation
within the positive and negative control groups that may be a results of
substandard storage or sample loss during purification. Interestingly, AGP
concentration of TNBC samples were significantly raised above the healthy
control but significantly lower than the BC control which could further
differentiate a diagnosis using AGP in future. Age of individuals and TNM stage
of TNBC tumour appeared to have no effect on AGP concentration while
treatment prior to blood draw may have caused lower levels of AGP in the <35
years of age group.
In dataset 2 the majority of “at-risk” samples had increased isolated AGP levels
compared to age-match healthy controls despite both sample populations being
considered disease free. This unexpected increase in AGP concentration could
be contributing to the development of BC by suppressing the immune system in
the tumour vicinity to avoid destruction by the immune system. Additionally, a
number of samples, particularly samples from BRCA1 mutation carriers,
contained isolated AGP levels at least 1.5 fold lower than other “at-risk”
samples which could infer that a decrease in AGP concentration occurs during
the initial stages of BC development.
However, isolated AGP levels alone are not indicative of BC thus this study
focuses on alterations in AGP glycosylation.

99
Chapter 5 – Monosaccharide Analysis Results and
Discussion

100
5.1 Introduction.
Glycans attached as post-translational modifications to proteins can vary in
structure and composition during certain physiological or pathological
conditions. These changes can affect the conformation of the protein affecting
function and circulation lifetime. Furthermore, a glycan pattern unique to a
specific disease could be used as a biomarker to distinguish between healthy
and diseased individuals. Therefore, analysis of glycan chain composition and
structure (known as microheterogeneity) is vitally important. Analysis of
individual sugars (monosaccharides) that are the components of glycan chains
can indicate structural alterations of the chain as a whole (oligosaccharide). For
example, Gal is exclusively present in the branches of AGP glycans, thus
distinctly increased concentrations of Gal could indicate greater branching of
AGP glycans.
HPAEC-PAD is a well utilised, reliable and documented technique for
monosaccharide analysis of glycans (Cataldi, et al., 2000; Corradini, et al.,
2012). While other methods of glycan composition analysis are available such
as mass spectrometry, nuclear magnetic resonance, HPLC, gas
chromatography and lectin ELISAs, these techniques often require
derivatisation – the transformation of an analyte into a similar structure
(derivative) that is more amenable to the analytical technique being used - or
large sample quantities to obtain better separation and detection, with HPAEC-
PAD continuing to be one of the most reliable and effective methods of glycan
analysis. HPAEC-PAD was implemented for this study as no prior derivatisation
of samples was necessary, which would have altered the structure of
monosaccharides and may have affected results. Secondly, HPAEC-PAD is
highly sensitive, able to detect 10-100 picomolar concentrations (Hardy, et al.,
1988) which was very beneficial for Phase 1 of this study as only small sample
volumes could be obtained.
In order for monosaccharide analysis by HPAEC-PAD to occur, glycans must
first be cleaved from the protein and the covalent bonds between
monosaccharides disrupted. TFA and HCl are commonly used to cleave neutral
and basic monosaccharides in preparation for analysis. This study incubated
50µg of isolated AGP for 4 hours at 100°C with 100µl 2M TFA and 50µl 4M HCl

101
in line with the protocol devised by Smith, et al. (1997), which was proven to
effectively cleave individual monosaccharides for analysis.
To utilise HPAEC for monosaccharide analysis there are several requirements.
Firstly, a highly mechanical and chemically stable stationary phase is
necessary; commonly in the form of a column containing a polymer based
pellicular resin. The active component of such resins is a quaternary ammonium
ion. Secondly, an alkaline mobile phase such as 0.03M NaOH is required to be
used in an isocratic gradient. Lastly, a detection system must be in place to
identify separated monosaccharides. This study used NaOH in an isocratic
gradient to induce electrocatalytic oxidation of weakly acidic sugars this
occurred through the ionisation of hydroxyl groups (-OH) within monosaccharide
structures, forming oxyanions at high pH (12 or above) (see Figure 5.1).
Monosaccharides possess several –OH groups which vary in position between
monosaccharides resulting in different dissociation constants (pKa) ranging
from 12-14. HPAEC analysis exploits the pKa values of monosaccharides and
their subsequent binding to the pellicular anion-exchange resin, to separate
them for detection. Those with higher pKa values, such as Fuc, are less
negatively charged and form weaker interactions with the cationic resin within
the CarboPac™ PA-100 and are therefore eluted and detected earlier than a
more negatively charged monosaccharide (Lee, 1990; McGuire, et al., 1999).
Detection of eluted monosaccharides occurs on a gold electrode and prior to
the invention of PAD the gold electrode would be fouled by a build-up of oxides
that formed a coating on the surface, making it redundant. Since the 1980’s
PAD has overcome the issue of electrode fouling by allowing oxides to form
when the potential is increased thus the monosaccharides are detected but
cleaning the electrode surface using a low potential, greatly improving the
reproducibility of the technique (Johnson and LaCourse, 1992; Rocklin and
Pohl, 1983). Detection occurs when an oxyanion (an ionised –OH group on a
monosaccharide) comes into contact with the gold electrode at a high potential,
the electrical current generated by the oxidation of the monosaccharide on the
electrode surface is then measured and recorded. The electrode surface is then
cleaned by lowering the potential, readying it for the next eluted
monosaccharide (see Figure 2.1).

102
Figure 5.1 Oxyanion Formation. [Adapted from Behan, (2010)]
O CH2OH
OH HO
HO
O-Na+
O CH2OH
OH HO
HO
O-
O CH2OH
OH HO
HO
OH
Sodium hydroxide (NaOH) eluent
added.
O CH2OH
OH HO
HO
O H δ+
Na+
OH
δ-
Anomeric –OH group is the most
acidic.
NaOH
Monosaccharide oxyanion interacts
with positively charged Na+ ions in the
sodium hydroxide eluent, separating
the hydroxyl group.
Na+ of the sodium hydroxide eluent
forms a bond with the O– of the
hydroxyl group creating an oxyanion.
Oxyanion then forms a bond with the
cationic resin in the CarboPac PA100
column.
+ +
+ +
+ +
+ +
+ +
+ +
+ +
+ +
+
+
+ + +
+ +
+
+ +
+
+ + +
+ +
+ + +

103
5.2 Dataset 1 Results.
The monosaccharide composition of AGP glycan chains was evaluated via
HPAEC-PAD. Samples from dataset 1 and dataset 2 were analysed to establish
any quantitative or qualitative differences in composition that may form the
basis of a novel BC biomarker.
Performing such analysis is reliant on complete separation of glycan chains
from the polypeptide backbone of AGP and degradation of the bonds between
individual monosaccharides. Uncleaved or degraded monosaccharides will not
be detected by HPAEC-PAD which could alter results. Figure 5.2 shows a
representative chromatogram of monosaccharides common to complex N-
linked glycans – Fuc, glucosamine, Gal and Man. To represent the
deacetylation of N-acetylated hexosamines by HCl and NaOH during acid
hydrolysis and HPAEC respectively, glucosamine was used as a standard for
GlcNAc. The chromatogram below illustrates that HPAEC is capable of
separating stereoisomers such as Gal and Man which are isomers of one
another differing by the orientation of their atoms in space (see Figure 1.1 in
Chapter 1). 2-Deoxy-galactose was used as an internal standard to aid the
identification of sample monosaccharides through retention time ratios. The
alkaline conditions selected, provided consistent elution order of
monosaccharides throughout this study.
Figure 5.2 HPAEC Separation Chromatogram of Common Complex N-linked Glycan Monosaccharides Fuc – Fucose; IS – Internal standard (2-Deoxy-D-
galactose); GlcNAc – N-acetylglucosamine; Gal – Galactose; Man- Mannose.
0
20
40
60
80
100
120
140
160
180
200
0 5 10 15 20 25
Peak H
eig
ht
(nC
)
Time (mins)
Fuc
IS GlcN
Gal
Man

104
However, upon monosaccharide analysis of TNBC samples a peak was
consistently detected at approximately 15 minutes between IS and GlcNAc.
Further investigation revealed this to be N-acetylgalactosamine (GalNAc) which,
as shown below in Figure 5.3, has a similar retention time to that of the
unexpected peak. As with GlcNAc, galactosamine (GalN) was used as a
standard to represent GalNAc. GalNAc is not routinely present in N-linked
complex glycans such as AGP but is commonly found in O-linked glycans.
Figure 5.3 Identification of Unknown Chromatogram Peak. Continual
appearance of unknown peak in TNBC samples was identified as Galactosamine as both had similar retention times and ratios.
Reliability of the acid hydrolysis technique and HPAEC instrument was critical
for investigation of monosaccharide content during this study. Therefore, prior to
Phase 1 sample analysis, commercially purchased AGP test samples were acid
hydrolysed using methods previously devised by the research group (Behan, et
al., 2013) and the monosaccharide content analysed to ensure reliability of the
methods.
-50
0
50
100
150
200
250
300
350
400
0 10 20 30
Peak H
eig
ht
(nC
)
Time (min)
Monomix
CT79 Breast Cancer Sample
Expected GalNAc elution time
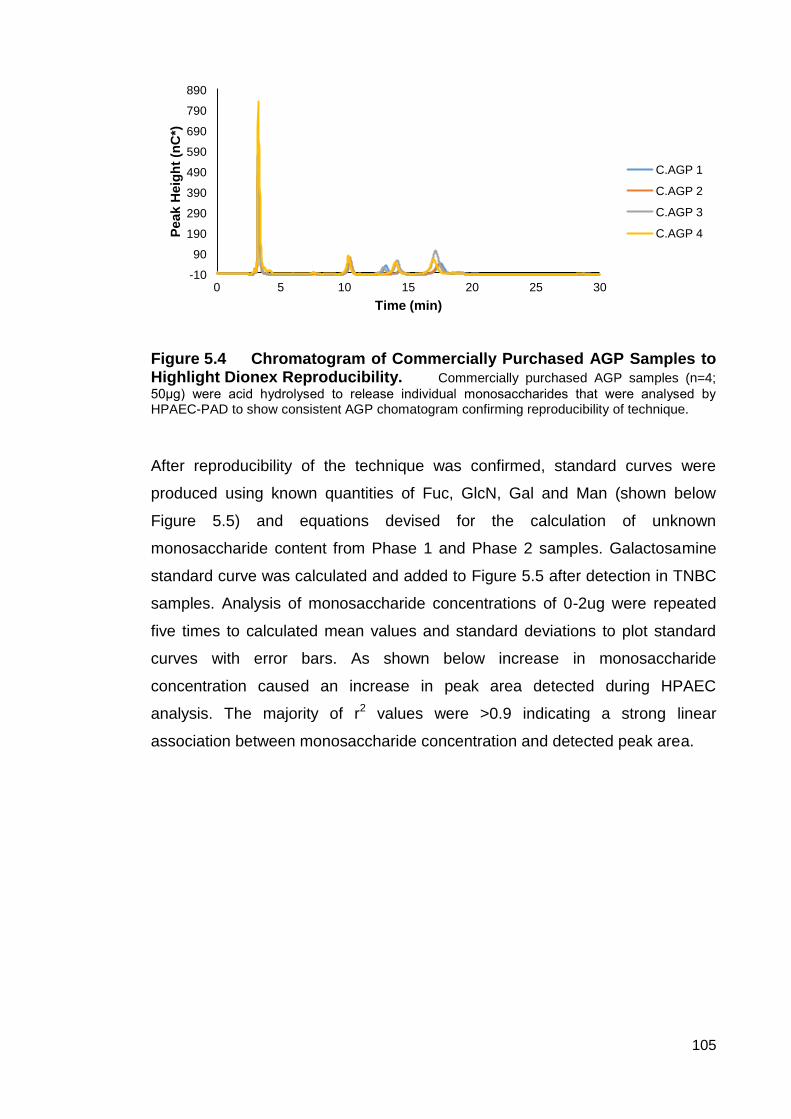
105
Figure 5.4 Chromatogram of Commercially Purchased AGP Samples to Highlight Dionex Reproducibility. Commercially purchased AGP samples (n=4;
50μg) were acid hydrolysed to release individual monosaccharides that were analysed by HPAEC-PAD to show consistent AGP chomatogram confirming reproducibility of technique.
After reproducibility of the technique was confirmed, standard curves were
produced using known quantities of Fuc, GlcN, Gal and Man (shown below
Figure 5.5) and equations devised for the calculation of unknown
monosaccharide content from Phase 1 and Phase 2 samples. Galactosamine
standard curve was calculated and added to Figure 5.5 after detection in TNBC
samples. Analysis of monosaccharide concentrations of 0-2ug were repeated
five times to calculated mean values and standard deviations to plot standard
curves with error bars. As shown below increase in monosaccharide
concentration caused an increase in peak area detected during HPAEC
analysis. The majority of r2 values were >0.9 indicating a strong linear
association between monosaccharide concentration and detected peak area.
-10
90
190
290
390
490
590
690
790
890
0 5 10 15 20 25 30
Peak H
eig
ht
(nC
*)
Time (min)
C.AGP 1
C.AGP 2
C.AGP 3
C.AGP 4

106
Figure 5.5 Plot of Peak Area Variation with Known Concentrations of
Common N-linked Glycan Monosaccharides and Galactosamine. (n=5).
The equation of each monosaccharide curve was rearranged to give an
equation for generating concentration of each monosaccharide in µg.
Concentration in micrograms was then subsequently adapted to nanomoles for
conversion to mol of sugar per mol AGP. This allowed for direct comparison of
monosaccharide content between sample groups in dataset 1 and dataset 2 of
the study.
Table 5.1 Equations Derived From Standard Curve to Determine mol
monosaccharide per mol AGP Content of Each Sample.
5.3 Dataset 1 Monosaccharide Content Results.
Dataset 1 of the study compared the monosaccharide content of samples from
women with TNBC (n=18), healthy individuals (n=5; negative control) and
women with BC of an unknown hormone receptor type (n=5; positive control).
For both positive and negative controls, analysis was carried out in triplicate and
thus figures shown in Table 5.2 are means of three replicates and standard
0
100
200
300
400
500
0 0.5 1 1.5 2 2.5
Peak A
rea (
nC
*min
)
Monosaccharide Concentration (µg)
Galactose
Fucose
2-deoxy-D-galactose
Glucosamine
Mannose
Galactosamine
Monosaccharide Equation of Mono Curve Equation for Mono Mass (µg) Equation for µg to nmol Equation for mol sugar/mol AGP
Fucose y = 137.46x x= Peak Area/137.46 x= (mono mass µg/MW of mono) X 1000 x= no. nmol AGP injected/ nmol mono
2-deoxy-galactosamine y = 158.58x x= Peak Area/158.58 " "
Galactosamine y = 152.32x x= Peak Area/152.32 " "
Glucosamine y = 149.21x x= Peak Area/149.21 " "
Galactose y = 215.78x x= Peak Area/215.78 " "
Mannose y = 147.66x x= Peak Area/147.66 " "
r2= 0.95
r2= 0.98
r2= 0.89
r2= 0.94
r2= 0.99
r2= 0.81

107
deviation is shown. However, low TNBC sample volumes made repeat analysis
impossible, therefore figures shown in Table 5.2 below are representative of
only one analysis of each sample.
Monosaccharide Content (mol monosaccharide/mol AGP)
Fucose GalNAc GlcNAc Galactose Mannose
Sample
H8 Trace Trace 0.01 ± 0.02 0.07 ± 0.13 0.11 ± 0.13
I2 0.02 ± 0.01 Trace 0.06 ± 0.05 0.14 ± 0.09 0.16 ± 0.24
I3 0.04 ± 0.00 Trace 0.01 ± 0.00 1.13 ± 0.09 0.15 ± 0.02
I5 Trace Trace 0.01 ± 0.00 0.17 ± 0.14 0.15 ± 0.20
I8 0.01 ± 0.00 Trace 0.02 ± 0.00 0.04 ± 0.00 0.06 ± 0.06
Mean Positive Control 0.01 ± 0.01 - 0.02 ± 0.01 0.31 ± 0.20 0.13 ± 0.02
N1 0.02 ± 0.01 Trace Trace 0.05 ± 0.00 0.94 ± 0.07
N2 0.01 ± 0.00 Trace 0.11 ± 0.10 0.11 ± 0.01 0.07 ± 0.10
N3 0.01 ± 0.00 Trace 0.11 ± 0.04 0.12 ± 0.08 0.18 ± 0.17
N4 0.01 ± 0.02 Trace 0.03 ± 0.02 0.17 ± 0.00 0.42 ± 0.18
N5 Trace Trace 0.01 ± 0.01 0.01 ± 0.01 0.02 ± 0.01
Mean Negative Control 0.01 ± 0.00 - 0.05 ± 0.02 0.09 ± 0.03 0.33 ± 0.17
F5412 0.21 0.27 0.56 1.54 0.87
MT3625 Trace Trace Trace 0.02 0.41
MT2305 0.04 0.04 0.16 0.60 1.13
CT79 0.04 0.08 0.27 0.62 0.29
MT2621 0.08 0.02 0.09 0.45 0.76
MT3965 0.02 0.45 0.06 0.83 0.25
Mean <35 0.07 ± 0.08 0.17 ± 0.19 0.19 ± 0.20 0.67 ± 0.50 0.62 ± 0.35
MT1106 0.04 0.02 0.35 0.71 1.76
MT1177 0.05 0.04 0.85 1.26 3.51
MT1178 0.05 0.38 0.24 0.57 1.45
MT3601 0.15 0.16 0.32 0.78 1.18
MT1937 0.05 0.12 0.20 0.38 0.80
MT3795 0.12 0.02 0.43 0.59 1.90
Mean Over 35-60 0.07 ± 0.05 0.12 ± 0.14 0.39 ± 0.23 0.72 ± 0.30 1.77 ± 0.94
MT3362 0.02 0.01 0.03 0.34 0.69
MT3497 0.12 0.08 0.46 0.66 1.80
MT3442 0.01 0.01 0.25 0.45 0.74
MT3959 0.04 0.02 0.26 0.13 3.03
MT3352 Trace Trace Trace Trace 1.35
MT2569 Trace 0.03 0.03 0.51 0.44
Mean >60 0.03 ± 0.05 0.03 ± 0.02 0.17 ± 0.18 0.35 ± 0.19 1.34 ± 0.96
Table 5.2 Monosaccharide Content of Dataset 1 Samples. Table shows
mean of three replicates of each positive and negative control sample ± SD. While TNBC figures are the result of one analysis.

108
Man is only present in the pentasaccharide core of complex N-linked glycans,
thus consistent levels are an indication that similar amounts of AGP are being
analysed each time. While Man levels differed slightly between the three
groups, variation was not significant and alterations in level may be due to the
sheer accuracy of the HPAEC technique. As no significant difference was found
this suggested that the N-linked pentasaccharide core structures were
consistent in all samples implying that the levels of AGP being analysed were
as intended and reliable.
Due to only one repeat of each TNBC sample being possible, statistical analysis
of differences between individual TNBC samples was not possible. However,
TNBC samples were sub-divided into varying categories such as age, family
history status, cancer grade and treatment status to statistically examine any
alterations in monosaccharide content that could lead to a biomarker for BC in
“at risk” individuals. Healthy and BC of unknown type samples were then
compared to these categories using one-way ANOVA with a Tukey’s post hoc
test to examine any statistical differences between the groups. Statistical
significance is indicated on the graphs that follow (Figures 5.6, 5.7, 5.8, and 5.9)
by an * symbol above the relevant column for significance at p<0.05 and **
symbol if significance is at p<0.001.
Figure 5.6 Mean Monosaccharide Content of TNBC Samples by Age Compared to Controls. TNBC samples were separated into age categories <35, >35-
60 and >60 (n=6 per category) for comparison with healthy and BC of unknown type. Statistical significance indicated by * for p<0.05 and ** for p<0.01.
0
0.2
0.4
0.6
0.8
1
1.2
Healthy Breast Cancer
(Unknown Type)
<35 TBNC 35-60 TNBC >60 TNBC
mo
l su
gar/
mo
l A
GP
Fucose GalNAc GlcNAc Galactose
**
*
*

109
Differences in monosaccharide content were observed between both negative
and positive controls as well as across all age categories of TNBC. Healthy
samples showed low levels of all monosaccharides whereas BC of an unknown
type showed increased levels of Gal although these differences were not
significant. Increased levels of Gal may indicate increased branching of glycan
chains within a sample as Gal is only present in the branches of complex N-
linked glycans such as those on AGP. Interestingly, TNBC is shown to have
elevated levels of all monosaccharides compared to not only the healthy
population, but that of the BC unknown type as well. TNBC samples aged <35
and 35-60 show similar monosaccharide content trends with levels of
monosaccharides increasing slightly with age. However, TNBC samples from
women >60 years of age contained lower levels of all monosaccharides than
both the other TNBC age categories but levels were still elevated above those
of the healthy population. Furthermore, the unusual presence of GalNAc
appears to decrease with age, but again this was not significant. GlcNAc levels
of the TNBC 35-60 category were found to be significantly higher (p<0.05) to
both the healthy and BC of unknown type. Similarly levels of Gal were
significantly higher in TNBC <35 and 35-60 age groups. This suggested that
TNBC has a different monosaccharide content to that of BC that may be of a
different type, significantly so at younger ages (<60) but not in the age range
that BC commonly occurs (usually 50-70). When comparing TNBC from
patients below and over 50 years old, only Gal was significantly higher in <50
group compared to both controls. Analysis of samples MT3625 and MT3352
showed unquantifiable trace amounts of the majority of monosaccharides that
were expected to have been detected. The explanation for this is unknown but it
is unlikely to be a true reflection of monosaccharide content.
*

110
Figure 5.7 Mean Monosaccharide Content of Samples With and Without Family History. TNBC samples were separated into groups with and without family
history (n=7 and n=8) as well as unknown family history status (n=3) for comparison with healthy and BC of unknown type. Statistical significance indicated by * for p<0.05 and ** for p<0.01.
Examining the monosaccharide content of TNBC samples categorised by family
history status, highlighted several significant differences between those with
family history and both controls. As with TNBC separated by age, levels of all
monosaccharides were elevated compared to healthy and BC of unknown type
controls. Furthermore, samples from patients with family history of BC have
higher levels of all monosaccharides compared to those with no family history
(not significant). However, when compared to controls, samples from patients
with family history have significantly higher Fuc compared to BC of unknown
type. GalNAc is also significantly increased in those with family history and
unknown family history status compared to both controls. Both controls contain
significantly lower levels of GlcNAc compared to family history TNBC samples
but the BC of unknown type also has signficantly lower GlcNAc levels than
those without family history. A significantly higher level of Gal was also
observed in family history compared to healthy samples. Samples with unknown
family history exhibit monosaccharide trends similar to both family history and
non-family history samples such as elevated GalNAc levels similar to family
history samples and Gal level comparable to those of non-family history TNBC.
Therefore there appears to be a distinct difference in the monosaccahride
content of TNBC samples with family history compared to BC of unknown type.
0
0.2
0.4
0.6
0.8
1
1.2
Healthy Breast Cancer
(Unknown Type)
Family History
No Family History
Unknown
mo
l su
gau
r/m
ol
AG
P
Fucose GalNAc GlcNAc Galactose
* * *
*
*
* **

111
Additionally there are few differences between non family-history TNBC
samples and BC of unknown type other than significantly higher GlcNAc levels.
Figure 5.8 Mean Monosaccharide Content of Treated and Untreated TNBC Compared to Controls. Statistical significance indicated by * for p<0.05 and **
for p<0.01.
To assess whether treatment prior to blood draw had an effect on AGP
monosaccharide content in TNBC, samples were split into treated and
untreated samples and compared to both controls. When sub-categorised in
this manner, treated and untreated TNBC samples appeared to follow similar
trends in monosaccharide content that are distinctly different to either control.
There were no significant differences between monosaccharide content in
treated and untreated samples implying that at this stage treatment was having
no effect on AGP monosaccharide content in TNBC samples. However,
significantly lower levels of all monosaccharides were found in both controls
compared to treated TNBC samples other than Gal which was only significantly
lower in healthy samples compared to treated TNBC. There were also no
significant differences in monosaccharide content found in either control
compared to untreated samples.
0
0.2
0.4
0.6
0.8
1
1.2
Healthy Breast Cancer (Unknown Type)
Untreated Treated
mo
ls s
ug
ar/
mo
ls A
GP
Fucose GalNAc GlcNAc Galactose
*
*
**
**

112
Figure 5.9 Mean Monosaccharide Content of TNBC Samples by Stage
Compared to Controls.
As in Figure 5.9, when TNBC samples are separated into cancer stage there
are similar trends in monosaccharide content between Stage 1 and Stage 2
TNBC. As there was only one Stage 3 TNBC in the cohort (MT3352) this
sample was not used for comparison as the sample would not be a reliable
representation of Stage 3 TNBC. Stage 1 TNBC possessed significantly higher
levels of Fuc, GalNAc and GlcNAc (p<0.05) in comparison to both controls with
Gal being significantly higher than the healthy population as well. Stage 2 TNBC
also had significantly higher levels of GlcNAc (p<0.05) compared to both
controls and Gal in comparison to the healthy population. No significant
difference was found between Stage 1 and Stage 2 TNBC but GalNAc and Gal
showed a 0.4 and 1.29 fold decrease in Stage 2 TNBC which may indicate a
decrease in glycan branching.
5.4 Dataset 2 Monosaccharide Results.
Dataset 2 of this study examined the monosaccharide content of a population of
“at risk” women (n=16) compared to (where possible) age-matched healthy
controls (n=10) to determine any differences between the groups as well as any
patterns that may indicate BC onset. Analysis using HPAEC-PAD was
conducted five times for each sample to improve the reliability of results.
0
0.2
0.4
0.6
0.8
1
1.2
Healthy Breast Cancer (Unknown Type)
TNBC Stage 1 TNBC Stage 2
mo
l su
gar/
mo
l A
GP
Fucose GalNAc GlcNAc Galactose
*
* *
*
*
*
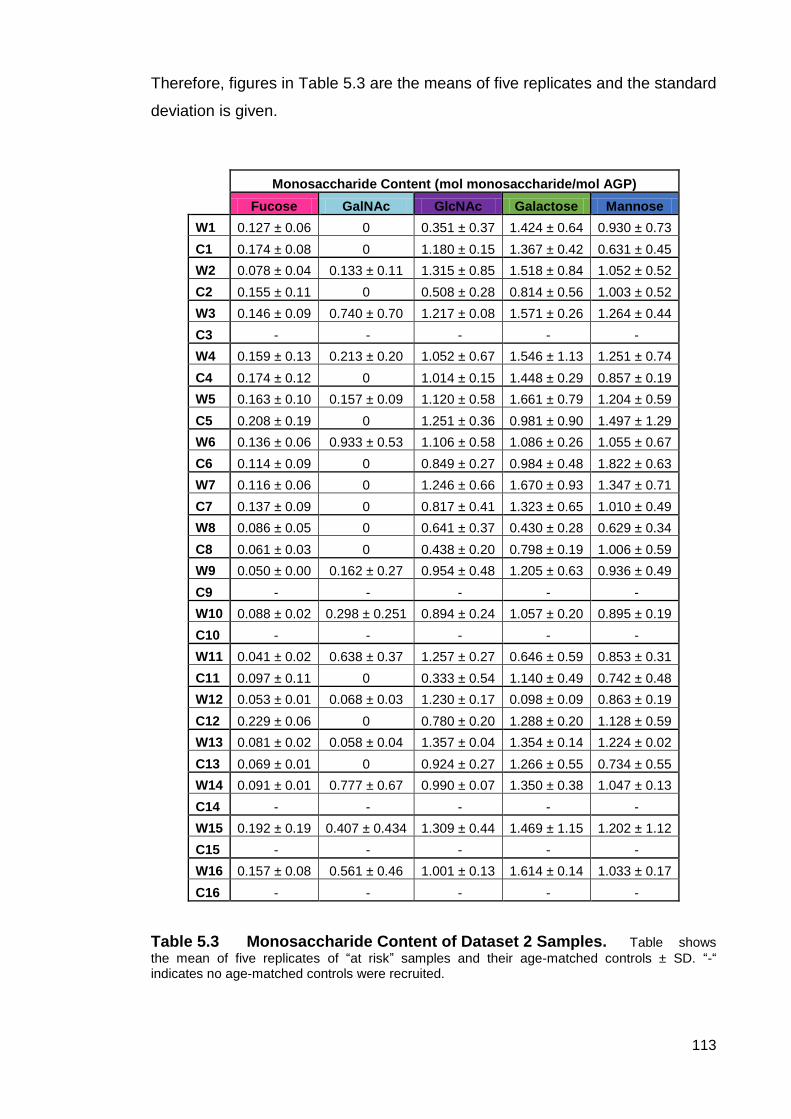
113
Therefore, figures in Table 5.3 are the means of five replicates and the standard
deviation is given.
Monosaccharide Content (mol monosaccharide/mol AGP)
Fucose GalNAc GlcNAc Galactose Mannose
W1 0.127 ± 0.06 0 0.351 ± 0.37 1.424 ± 0.64 0.930 ± 0.73
C1 0.174 ± 0.08 0 1.180 ± 0.15 1.367 ± 0.42 0.631 ± 0.45
W2 0.078 ± 0.04 0.133 ± 0.11 1.315 ± 0.85 1.518 ± 0.84 1.052 ± 0.52
C2 0.155 ± 0.11 0 0.508 ± 0.28 0.814 ± 0.56 1.003 ± 0.52
W3 0.146 ± 0.09 0.740 ± 0.70 1.217 ± 0.08 1.571 ± 0.26 1.264 ± 0.44
C3 - - - - -
W4 0.159 ± 0.13 0.213 ± 0.20 1.052 ± 0.67 1.546 ± 1.13 1.251 ± 0.74
C4 0.174 ± 0.12 0 1.014 ± 0.15 1.448 ± 0.29 0.857 ± 0.19
W5 0.163 ± 0.10 0.157 ± 0.09 1.120 ± 0.58 1.661 ± 0.79 1.204 ± 0.59
C5 0.208 ± 0.19 0 1.251 ± 0.36 0.981 ± 0.90 1.497 ± 1.29
W6 0.136 ± 0.06 0.933 ± 0.53 1.106 ± 0.58 1.086 ± 0.26 1.055 ± 0.67
C6 0.114 ± 0.09 0 0.849 ± 0.27 0.984 ± 0.48 1.822 ± 0.63
W7 0.116 ± 0.06 0 1.246 ± 0.66 1.670 ± 0.93 1.347 ± 0.71
C7 0.137 ± 0.09 0 0.817 ± 0.41 1.323 ± 0.65 1.010 ± 0.49
W8 0.086 ± 0.05 0 0.641 ± 0.37 0.430 ± 0.28 0.629 ± 0.34
C8 0.061 ± 0.03 0 0.438 ± 0.20 0.798 ± 0.19 1.006 ± 0.59
W9 0.050 ± 0.00 0.162 ± 0.27 0.954 ± 0.48 1.205 ± 0.63 0.936 ± 0.49
C9 - - - - -
W10 0.088 ± 0.02 0.298 ± 0.251 0.894 ± 0.24 1.057 ± 0.20 0.895 ± 0.19
C10 - - - - -
W11 0.041 ± 0.02 0.638 ± 0.37 1.257 ± 0.27 0.646 ± 0.59 0.853 ± 0.31
C11 0.097 ± 0.11 0 0.333 ± 0.54 1.140 ± 0.49 0.742 ± 0.48
W12 0.053 ± 0.01 0.068 ± 0.03 1.230 ± 0.17 0.098 ± 0.09 0.863 ± 0.19
C12 0.229 ± 0.06 0 0.780 ± 0.20 1.288 ± 0.20 1.128 ± 0.59
W13 0.081 ± 0.02 0.058 ± 0.04 1.357 ± 0.04 1.354 ± 0.14 1.224 ± 0.02
C13 0.069 ± 0.01 0 0.924 ± 0.27 1.266 ± 0.55 0.734 ± 0.55
W14 0.091 ± 0.01 0.777 ± 0.67 0.990 ± 0.07 1.350 ± 0.38 1.047 ± 0.13
C14 - - - - -
W15 0.192 ± 0.19 0.407 ± 0.434 1.309 ± 0.44 1.469 ± 1.15 1.202 ± 1.12
C15 - - - - -
W16 0.157 ± 0.08 0.561 ± 0.46 1.001 ± 0.13 1.614 ± 0.14 1.033 ± 0.17
C16 - - - - -
Table 5.3 Monosaccharide Content of Dataset 2 Samples. Table shows
the mean of five replicates of “at risk” samples and their age-matched controls ± SD. “-“ indicates no age-matched controls were recruited.

114
As discussed for dataset 1, Man is only present in the pentasaccharide core of
AGP glycans and therefore the consistent levels indicate similar concentrations
of AGP being analysed. There was no significant variation between sample Man
levels in dataset 2 implying that consistent concentrations of AGP were
analysed and the results of monosaccharide analysis were reliable.
Figure 5.10 Mean Monosaccharide Content of At-Risk and Healthy Control Populations. Mean monosaccharide content in mol monosaccharide/mol
AGP of a population at risk of BC (n=16) compared to a healthy control population (n=10) ± SD.
Comparison of mean monosaccharide content of the “at risk” population and
healthy controls as well as a one-way ANOVA revealed alterations between
both groups. The “at risk” population had slightly decreased Fuc levels
compared to the healthy controls (not significant), but had significantly elevated
concentrations of GalNAc (p<0.01) and GlcNAc (p<0.05). GalNAc was present
in 81% of “at risk” samples but not detected in any of the healthy control
samples and mean GlcNAc levels were 1.3 times higher in the ”at risk”
population. No significant difference was found between either group for Gal or
Man, highlighting the same levels of AGP were analysed.
The following graphs (Figures 5.11 A-P) give direct comparisons of AGP
monosaccharide content between “at risk” samples and their age-matched
healthy control or the mean monosaccharide content if an age-matched healthy
control was unavailable.
0
0.5
1
1.5
2
2.5
3
Fucose GalNAc GlcNAc Gal Man
mo
l m
on
osacch
ari
de/m
ol
AG
P
Mean Monosaccharide Content
At Risk Healthy Control
**
*

115
0
0.5
1
1.5
2
2.5
3
Fucose GalNAc GlcNAc Galactose
mo
l m
on
oacch
ari
de/m
ol
AG
P
Monosaccharide
W1 C1
0
0.5
1
1.5
2
2.5
3
Fucose GalNAc GlcNAc Galactose
mo
l m
on
osacch
ari
de/m
ol
AG
P
Monosaccharide
W2 C2
0
0.5
1
1.5
2
2.5
3
Fucose GalNAc GlcNAc Galactose
mo
l m
on
osacch
rid
e/m
ol
AG
P
Monosaccharide
W3 Average Healthy Control
A
B
C

116
0
0.5
1
1.5
2
2.5
3
Fucose GalNAc GlcNAc Galactose
mo
l m
on
osacch
ari
de/m
ol
AG
P
Monosaccharide
W4 C4
0
0.5
1
1.5
2
2.5
3
Fucose GalNAc GlcNAc Galactose
mo
l m
on
osacch
ari
de/m
ol
AG
P
Monosaccharide
W5 C5
0
0.5
1
1.5
2
2.5
3
Fucose GalNAc GlcNAc Galactose
mo
l m
on
osacch
ari
de/m
ol
AG
P
Monosaccharide
W6 C6
D
E
F
**
*
*
**

117
0
0.5
1
1.5
2
2.5
3
Fucose GalNAc GlcNAc Galactose
mo
l m
on
osacch
ari
de/m
ol
AG
P
Monosaccharide
W7 C7
0
0.5
1
1.5
2
2.5
3
Fucose GalNAc GlcNAc Galactose
mo
l m
on
osacch
ari
de/m
ol
AG
P
Monosaccharide
W8 C8
0
0.5
1
1.5
2
2.5
3
Fucose GalNAc GlcNAc Galactose
mo
l m
on
osacch
ari
de/m
ol
AG
P
Monosaccharide
W9 Mean Healthy Control
G
H
I
*

118
0
0.5
1
1.5
2
2.5
3
Fucose GalNAc GlcNAc Galactose
mo
l m
on
osacch
ari
de/m
ol
AG
P
Monosaccharide
W10 Mean Healthy Control
0
0.5
1
1.5
2
2.5
3
Fucose GalNAc GlcNAc Galactose
mo
l m
on
osacch
ari
de/m
ol
AG
P
Monosaccharide
W11 C11
0
0.5
1
1.5
2
2.5
3
Fucose GalNAc GlcNAc Galactose
mo
l m
on
osacch
ari
de/m
ol
AG
P
Monosaccharide
W12 C12
J
K
L
**
*

119
0
0.5
1
1.5
2
2.5
3
Fucose GalNAc GlcNAc Galactose
mo
l m
on
osacch
ari
de/m
ol
AG
P
Monosaccharide
W13 C13
0
0.5
1
1.5
2
2.5
3
Fucose GalNAc GlcNAc Galactose
mo
l m
on
osacch
ari
de/m
ol
AG
P
Monosaccharide
W14 Mean Healthy Control
0
0.5
1
1.5
2
2.5
3
Fucose GalNAc GlcNAc Galactose
mo
l m
on
osacch
ari
de/m
ol
AG
P
Monosaccharide
W15 Mean Healthy Control
M
N
O
**
**

120
Figure 5.11 Comparison of Monosaccharide Content of At-Risk Samples with Age-Matched Healthy Controls. Graphs A-P show direct comparisons of
sample AGP monosaccharide content between “at risk” samples (n=16) and their age-matched healthy controls (n=10). Where age-matched healthy controls could not be recruited (n=6), “at risk” samples were compared to the mean monosaccharide content of all healthy controls. Figures shown represent mean of the five replicates ± SD. Statistical significance indicated by * if p<0.05 or ** if p<0.01.
In line with previous statistical analysis in this chapter (Figure 5.10),
comparisons between the monosaccharide content of “at risk” samples and
age-matched controls (or mean monosaccharide content where no age-
matched control was available) were analysed using a one-way ANOVA.
Results were considered statistically significant at p<0.05.
Sample W1 showed no significant differences in monosaccharide levels
compared to age-matched healthy control C1. However, GlcNAc levels were
70% decreased in W1 compared to C1. Fuc and Gal levels were similar in both
samples and no GalNAc was detected in either.
Comparison of sample W2 to age-matched control sample C2 revealed no
significant differences in monosaccharide content. While Fuc levels were
comparable in both samples, GlcNAc and Gal were elevated in W2 compared to
C2. Additionally, GalNAc was present in W2 but not C2 though not at significant
levels.
No age-matched healthy control was available for comparison to sample W3.
Therefore, as stated, W3 was compared to the mean monosaccharide levels of
all healthy controls. GalNAc was present at significant levels (p<0.01) in W3
0
0.5
1
1.5
2
2.5
3
Fucose GalNAc GlcNAc Galactose
mo
l m
on
osacch
ari
de/m
ol
AG
P
Monosaccharide
W16 Mean Healthy Control
P
**

121
and both GlcNAc and Gal were also elevated by 47% and 38% respectively (not
significant).
Sample W4 had GalNAc present (significant at p<0.05) however GalNAc was
not present in C4. No other significant differences in monosaccharide content
were found between W4 and C4 as levels of Fuc, GlcNAc and Gal were almost
identical.
Assessment of W5 and C5 revealed significant GalNAc presence (p<0.05) in
W5 but not C5. Fuc levels were marginally lower in W5 – 0.16 compared to 0.2
mol monosaccharide/mol AGP – and GlcNAc levels were similar in both
samples. In contrast, Gal levels of W5 were almost double those in C5.
Significant GalNAc levels (p<0.01) were detected in W6 whereas no GalNAc
was found in C6. W6 also showed an increase in GlcNAc compared to C6
however, Gal was 40% decreased in W6. Fuc levels were comparable in both
samples.
W7 and C7 had no significant differences in monosaccharide content, with both
lacking GalNAc and possessing similar Fuc levels. However, GlcNAc and Gal
levels in W7 were increased compared to C7.
Interestingly, samples W8 and C8 had lower levels of all monosaccharides
compared to other sample pairs. Neither sample contained GalNAc however
W8 contained higher levels on GlcNAc (not significant). In contrast, C8 showed
significantly higher levels on Gal (p<0.05). Again, Fuc levels were similar in W8
and C8
W9 was the second “at risk” sample not to recruit an age-matched healthy
control, so as with W3, was compared to the mean monosaccharide content of
all healthy controls. However, no significant differences were found in
monosaccharide content between the groups. W9 showed lower levels of Fuc
but increased GlcNAc, similar Gal levels to the control (not significant) and
GalNAc was present.
W10 was also compared to the mean monosaccharide content of all healthy
controls which revealed significant (p<0.01) GalNAc concentrations in W10. No
other significant differences in monosaccharide content were discovered as
levels on Fuc, GlcNAc and Gal were similar in both groups.

122
Comparison of W11 to C11 revealed that W11 contained 57.5% less Fuc than
the age-matched healthy control. W11 also had significant levels of GalNAc
present (p<0.01) whereas C11 contained none. When examining GlcNAc
content, W11 had almost four times as much GlcNAc as C11 but 43% less Gal
(not significant).
W12 was examined against age-matched healthy control C12 and showed
GalNAc presence (not significant) and GlcNAc levels elevated above C12.
However, W12 Fuc levels were four times lower than C12 and unusually, Gal
levels were significantly lower than the healthy control. GalNAc presence was
not detected in C12.
Similarly, GalNAc was not detected in C13 upon analysis but was present in
W13 (not significant). No significant differences were found between the control
and “at risk” sample for any monosaccharide despite a 32% elevation of GlcNAc
in W13 compared to C13.
An age-matched healthy control could not be recruited for “at risk” sample W14,
thus comparisons were drawn between the mean monosaccharide content of all
healthy controls and W14. Fuc, GlcNAc and Gal levels were comparable
between W14 and healthy controls with minimal increases in W14’s GlcNAc and
Gal content. However, a significant (p<0.01) level of GalNAc was detected in
W14, with no GalNAc detected in the healthy control samples.
Similarly, comparison of W15 with the mean monosaccharide content of all
healthy controls showed significant presence of GalNAc (p<0.01) in W15 but
none detected in the healthy control samples. W15 also showed elevation of
Fuc, GlcNAc and Gal by 26%, 37% and 18% respectively, though no
differences were significant.
Lastly, as with W14 and W15, significant (p<0.01) levels of GalNAc were
detected in W16 when compared to the mean monosaccharide content of all
healthy controls. A similar trend followed, where Fuc, GlcNAc and Gal were
elevated in comparison to the controls. As with previous comparison, no
GalNAc was present in any of the control samples.
123
5.5 Discussion.
5.5.1 Introduction.
The aim of the research discussed in this chapter was to determine the
concentrations of monosaccharides and investigate changes in
monosaccharide concentrations from isolated AGP samples from two sample
populations – Dataset 1 comprised samples from healthy individuals, women
with BC of unknown type and women with TNBC as well as Dataset 2
containing samples from women at increased risk of BC development and age-
matched healthy controls. This was performed using acid hydrolysis and
analysis by HPAEC-PAD.
To date several studies have explored changes to AGP glycan composition in
BC (Croce, et al., 2005; Hashimoto, et al., 2004; Turner, et al., 1985) but none
have investigated monosaccharide levels in TNBC. As well as increases in in
vivo AGP concentration, unique changes in monosaccharide content of AGP’s
five glycans occurring in a disease-dependent manner could potentially be used
as a biomarker for disease diagnosis.
As discussed in section 5.1, monosaccharide levels of AGP glycans from TNBC
samples, healthy individuals and women with BC of an unknown type were
analysed by HPAEC-PAD after subjection to acid hydrolysis. While the exact
monosaccharide sequence cannot be determined from the cleavage of glycan
chains into individual monosaccharides, variations in monosaccharide levels
can be assessed for suggestions of structural changes. This can be used in
conjunction with data collected from analysis of whole oligosaccharide chains
(explained in Chapter 6, section 6.4) to better assess structural changes.
While used earlier to confirm reproducibility of the HPAEC-PAD technique,
commercial AGP was not a suitable representation of a normal, healthy
population to act as a negative control in this study. This is because the method
used to isolate commercial AGP was an adaptation of a large-scale
methodology by Hao and Wickerhauser (1973) which differed from that used in
this study. Therefore, AGP was isolated from samples sourced from the Blood
Transfusion Service to represent a healthy population and ensure consistent
isolation methods across all sample groups, reducing the risk of unreliable
results.

124
5.5.2 Trends in AGP Monosaccharide Content.
5.5.2.1 Dataset 1
Analysis of sample monosaccharide content using HPAEC-PAD revealed low
levels of monosaccharides (Fuc, GlcNAc, Galactose and Mannose) in the
healthy controls. In comparison, BC of unknown type (acting as a positive
control) showed increased Galactose and Mannose content. GalNAc was not
observed in any control samples.
Overall, TNBC samples showed increased Fuc, GlcNAc, Gal and Man content
compared to both controls and interestingly, 88% of TNBC samples revealed
the unusual presence of GalNAc which is associated with O-linked glycosylation
(Varki, et al., 2009) and discussed later in section 5.5.2.4.
5.5.2.1.1 Monosaccharide Content of TNBC Categorised by Age.
When comparing monosaccharide content of TNBC samples by age, individuals
<60 years of age showed increased concentrations of all monosaccharides
monitored, including significantly (p<0.05) increased Galactose and GlcNAc
(p<0.01 in the 35-60 age group) compared to both controls whereas TNBC
samples from women >60 years old possessed increased GlcNAc and
Mannose content compared to controls but had similar Galactose and Fuc
content.
TNBC is a notoriously aggressive form of BC particularly in young women.
Mean Fuc levels of TNBC samples from women aged <35 and 35-60 were
double that of those >60. Although this difference was not significant, these
results fit with the idea that increased Fuc levels correlate with poorer prognosis
associated with TNBC at a younger age (Anders et al., 2008 and Hashimoto et
al., 2004). Furthermore, increased fucosylation may be due to increased
presence of SLeX terminal structures which are linked to increased risk of
metastasis (Julien et al., 2011 and Nakagoe et al., 2002).
The current study also demonstrated increased GlcNAc and Gal in samples
from women <60 which also confers to current evidence that BC at a younger
age is more aggressive and associated with a poorer prognosis. For example,

125
data from Smith et al., 2012 showed that increased Gal sample content was
correlated with increased AGP glycan branching in malignant BC samples
which could define malignant samples from non-malignant samples.
Additionally, increased N-linked β1-6 branching has been linked to poor
outcomes in BC patients, further associating poor prognosis with younger TNBC
patients as increases in glycan branching were observed in this patient
population during this study (Madjid et al., 2005 and Cui et al., 2011).
5.5.2.1.2 Monosaccharide Content of TNBC Categorised by Family History.
Examination of TNBC sample monosaccharide concentrations categorised by
family history of BC revealed TNBC samples from individuals with family history
had significantly elevated monosaccharide (p<0.05; GlcNAc p<0.01) content
compared to both controls. Increased levels of GalNAc, GlcNAc and Galactose
in were observed in TNBC samples from individuals with family history of BC in
comparison to samples without family history of BC. Yet no significant
difference in Fuc content was observed between samples with or without family
history. Monosaccharide content of TNBC samples from women with unknown
family history of BC (n=3) did not fall distinctly into either trend seen in family
history or no family history. Galactose and Fuc content were similar to that of
samples without family history, yet concentrations of GalNAc were comparable
to sample with family history of BC. Therefore, this group may have contained
samples that could have been assigned to either the family history or no family
history group based on monosaccharide content. Of the 3 TNBC samples with
unknown family history MT1178 contained a monosaccharide content that
reflected the family history category while MT2621 and MT2305
monosaccharide content resembled that of the no family history group.
However, the current study cannot definitively associate monosaccharide
content with family history because no follow up of this sample population was
available.
Increased Fuc content of these samples could indicate worse prognosis and
risk of metastasis associated with TNBC’s poor outcomes (Hashimoto et al.,
2004; Julien et al., 2011 and Nakagoe et al., 2002). However, comparable

126
levels of Fuc between TNBC samples from women with and without family
history or unknown family history may indicate similar levels of metastasis risk
between these groups and reflect overall poor prognosis of TNBC rather than
conferring more risk to those with family history.
However, elevated GalNAc and Gal content in TNBC samples from women with
family history compared to those without family history could imply increased
branching of AGP in these samples (Smith, et al., 2012). This could correlate
with previous literature indicating poor prognosis associated with increased
glycan branching (Smith et al., 2012; Madjid et al., 2005 and Cui et al., 2011)
however a recent, large study by Malone et al., (2011) revealed patients with
family history of BC had a better prognosis than women without family history.
Therefore, it is unclear whether the increased GalNAc and Gal in TNBC
samples from patients with family history act as prognostic indicators of survival.
5.5.2.1.3 Monosaccharide Content of Treated and Untreated TNBC
Samples.
Furthermore, comparison of treated and untreated TNBC samples delivered
similar trends in monosaccharide content and the concentrations of all
monosaccharides were increased above both controls. Previous research by
Doak (2008) using the same methods as this study showed that altered
glycosylation during BC returned to a normal glycosylation pattern similar to the
healthy control population upon treatment. This may indicate that treatment
administered prior to blood draw had no effect on glycosylation composition or
that these treatments have not had an effect on the TNBC and therefore the
glycosylation composition remains unchanged.
5.5.2.1.4 Monosaccharide Content of TNBC Samples Grouped by TNM
Stage.
In this study, the data on monosaccharide content of TNBC samples were also
separated by cancer stage to allow comparison of TNBC at stage 1 and stage
2. Comparison of mean Fuc content in controls and TNBC by cancer stage
revealed that stage 1 TNBC had increased Fuc concentration compared to

127
stage 2. These results did correspond with previous research (Hashimoto, et al.,
2004; Turner, et al., 1985), which showed that levels of Fuc increased with
increasing cancer severity. However, given that no samples of advanced stage
TNBC were available to this study for comparison, it remains unknown if
elevated Fuc levels would have been seen compared to early stage TNBC.
Furthermore, with only one TNBC sample representing stage 3 a reliable
comparison with stage 1 and 2 mean GlcNAc and Gal content could not be
made. Stage 1 and stage 2 TNBC showed similar levels of GlcNAc while stage
2 had slightly lower levels of Gal. Although no significant differences were found
between TNBC stages there were significant differences (p<0.05) between
GlcNAc and Gal in controls and TNBC stages. Healthy and BC of unknown type
samples had significantly (p<0.05) lower levels of GlcNAc compared to stage 1
and stage 2 TNBC. Mean Gal levels were significantly (p<0.05) higher in stage
1 and stage 2 TNBC compared to healthy controls but not BC of unknown type.
Thus implying that not only do both stages of TNBC exhibit greater AGP glycan
branching but that this may be similar to that of BC of unknown type.
Increased GlcNAc and Gal content of TNBC samples compared to the positive
and negative controls could indicate increased branching of AGP glycans in
these samples. The higher the TNM stage attributed to a tumour the more
developed the cancer is, the worse the prognosis and there may be increased
metastasis compared to lower stage tumours (Sobin, et al., 2009). Hashimoto,
et al., (2004) highlighted that patients with various advanced malignancies
showed more tri- and tetra-antennary branching and these results were
confirmed via mass spectrometry in a later study (Asao, et al., 2013). A
separate study by Hamid, et al., (2008) revealed increased tri-antennary
branching of AGP was linked to BC progression. Therefore, the results of the
current study contradict previous research as higher GlcNAc and Gal
concentrations in stage 1 TNBC infer increased branching at lower stage TNBC
compared to stage 2 TNBC.
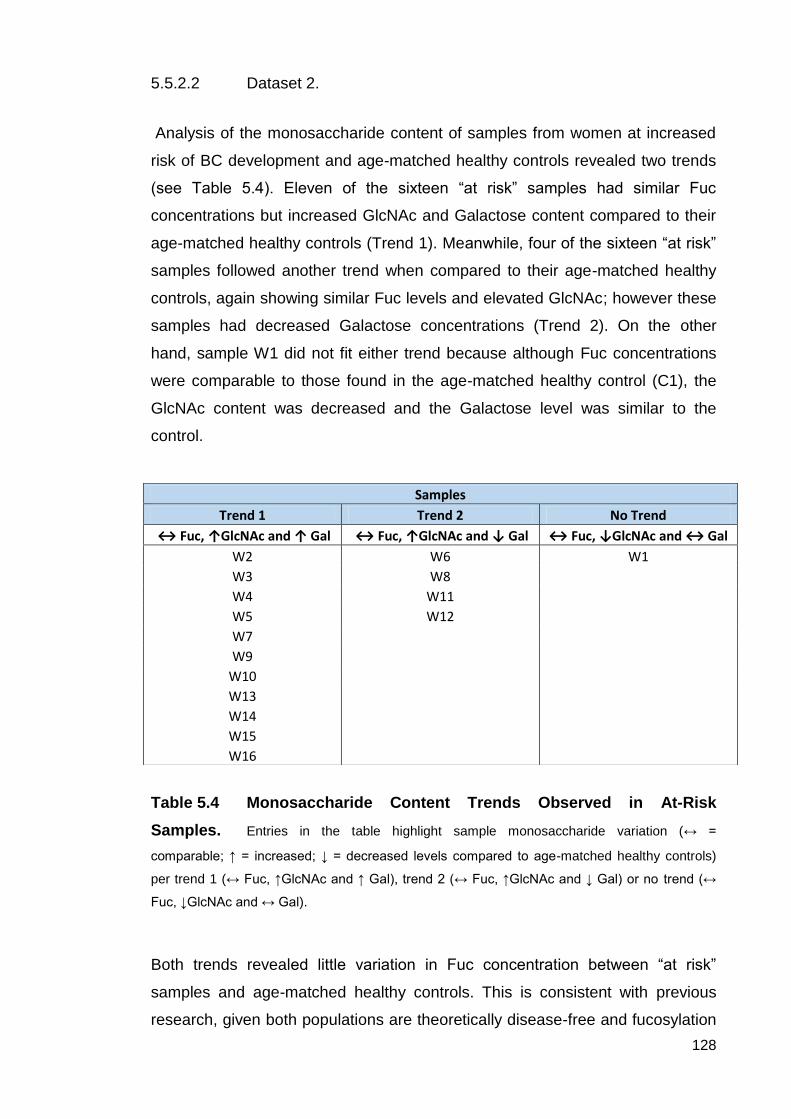
128
5.5.2.2 Dataset 2.
Analysis of the monosaccharide content of samples from women at increased
risk of BC development and age-matched healthy controls revealed two trends
(see Table 5.4). Eleven of the sixteen “at risk” samples had similar Fuc
concentrations but increased GlcNAc and Galactose content compared to their
age-matched healthy controls (Trend 1). Meanwhile, four of the sixteen “at risk”
samples followed another trend when compared to their age-matched healthy
controls, again showing similar Fuc levels and elevated GlcNAc; however these
samples had decreased Galactose concentrations (Trend 2). On the other
hand, sample W1 did not fit either trend because although Fuc concentrations
were comparable to those found in the age-matched healthy control (C1), the
GlcNAc content was decreased and the Galactose level was similar to the
control.
Table 5.4 Monosaccharide Content Trends Observed in At-Risk
Samples. Entries in the table highlight sample monosaccharide variation (↔ =
comparable; ↑ = increased; ↓ = decreased levels compared to age-matched healthy controls)
per trend 1 (↔ Fuc, ↑GlcNAc and ↑ Gal), trend 2 (↔ Fuc, ↑GlcNAc and ↓ Gal) or no trend (↔
Fuc, ↓GlcNAc and ↔ Gal).
Both trends revealed little variation in Fuc concentration between “at risk”
samples and age-matched healthy controls. This is consistent with previous
research, given both populations are theoretically disease-free and fucosylation
Samples
Trend 1 Trend 2 No Trend
↔ Fuc, ↑GlcNAc and ↑ Gal ↔ Fuc, ↑GlcNAc and ↓ Gal ↔ Fuc, ↓GlcNAc and ↔ Gal
W2 W6 W1
W3 W8
W4 W11
W5 W12
W7
W9
W10
W13
W14
W15
W16

129
has been shown to increase during malignancy (Hashimoto et al., 2004). Fuc is
usually incorporated into a glycan chain as a component of a terminal structure,
such as SLex or bound to the pentasaccharide core via the innermost GlcNAc of
N-linked glycans. Fuc may also be integrated directly into O-linked glycans by
O-fucosyltransferases such as POFUT1 or O-FUT2 (Wang et al., 2001; Roos et
al., 2002). Studies have revealed that increased fucosylation in cancer patients
increases with the stage of malignancy and is associated with a poor post-
operative outcome (Asao et al., 2013; Ferens-Sieczkowska, et al., 2013;
Hashimoto, et al., 2004; Turner, et al., 1985). Furthermore, Hamid et al., (2008)
and Royle et al., (2008) established that increased fucosylation of a number of
serum proteins, including AGP, was the most significant change detected in
serum samples from breast cancer patients. This can be attributed to the
altered functions of aberrant fucosylation during cancer. For example, increases
in the expression of fucosyltransferase FUT 8 may enhance malignant cell
proliferation (Chen et al., 2013) and increases in SLeX terminal structures may
denote enhanced metastasis (Julien et al, 2011). However, a study conducted
by Moriwaki et al., (2009) found decreased fucosylation on established tumours
aided evasion from NK cells. Therefore, the Fuc content from samples in
dataset 2 may imply that immune evasion by cancer cells is occurring in these
participants. However, as similarly low levels of Fuc were observed in both the
“at risk” and age-matched healthy controls it is more likely that decreased Fuc
content in these samples implies lack of malignancy.
Variation in Mannose concentration was also observed between certain “at-risk”
samples and age-matched healthy controls, for example W1, having
approximately 32% more Mannose than the corresponding control. Increased
expression of high mannose glycans during BC has been observed (de Loez et
al., 2011) and despite AGP being known to solely complex type glycans (see
Figure 5.12), expression of high mannose type glycans during BC onset cannot
be ruled out. For instance a study by de Loez et al., (2011) used a mouse
model and human serum to demonstrate the presence high mannose N-linked
glycans during BC which may infer incomplete trimming of glycans during
processing which would normally result in expression of complex and hybrid N-
linked glycans (see Figure 1.4).

130
Figure 5.12 Illustration of Structural Differences Between High Mannose,
Complex and Hybrid N-linked Glycan Types.
Moreover, inter-individual variation of GlcNAc and Galactose concentration was
identified between age-matched healthy control samples with levels ranging
from 0.333-1.251 mol monosaccharide/mol AGP and 0.798-1.448 mol
monosaccharide/mol AGP respectively. Variation in GlcNAc and Galactose
levels are associated with the degree of glycan branching. Galactose is present
solely in the branches of N-linked glycans but GlcNAc is a component of the
common pentasaccharide core as well as in glycan branches (Varki, et al.,
2009. Therefore, changes in concentration in each of these monosaccharides
are a more reliable indicator of alternative branching. Alterations in AGP glycan
branching have been evaluated in a number of conditions such as cancer and
inflammation (Higai et al., 2005, Smith et al., 2002, and Hashimoto et al., 2004).
Studies have shown a decrease in branching during acute inflammation through
the presence of increased bi-antennary glycans, yet glycans switch to
displaying more tri- and tetra-antennary glycans during chronic inflammation
(Higai et al., 2005; Fassbender et al., 1991 and Smith et al., 2002). In the
present study, given that healthy volunteers self-selected to participate they
may have been unaware of or offered incomplete information regarding
possessing inflammatory conditions that may have implications for the
quantification of AGP monosaccharide content. Therefore this possibly could
account for decreased or increased levels of GlcNAc and Gal in certain age-
Asn
High Mannose
Asn
Complex
Trimming and addition
of monosaccharides
Asn
Hybrid
= Mannose = GlcNAc = Galactose = Sialic Acid

131
matched control samples. Since the age-matched healthy control samples for
dataset 2 were collected fresh and purification began immediately, it is unlikely
that ineffective storage may have caused alterations in AGP monosaccharide
content of these samples (Hofbauerova, et al., 2003).
5.5.2.3 Protein Glycosylation in Cancer/Breast Cancer: Summary of the
findings of the present study.
Previous research has highlighted various changes in glycosylation of proteins
during cancer development (Dube and Bertozzi, 2005). The current study
examined two sample populations – one with TNBC and the other at high risk of
BC development due to family history and/or genetic mutations predisposing BC
risk.
Monosaccharide analysis of TNBC samples revealed increased Fuc, GlcNAc,
and Gal compared to healthy and BC of unknown type controls (see Table 5.2).
Increased Mannose was also detected and possible reasons for this have been
discussed in the previous section (5.5.2.2). The majority of TNBC samples
(88%) had the unusual presence of GalNAc detected and the significance of
this is discussed in section 5.5.2.4.
In contrast to this, investigation of monosaccharide content in at risk samples
revealed two trends. Eleven samples conveyed trend 1 possessing similar
levels of Fuc but increased GlcNAc and Gal compared to their age-matched
healthy controls. Whereas 4 samples displayed trend 2 and showed similar Fuc
content, increased GlcNAc but decreased Gal compared to age-matched
healthy controls. Sample W1 monosaccharide content did not follow either of
these trends as analysis revealed similar levels of Fuc and Gal with decreased
GlcNAc compared to controls.
As discussed in previous sections (literature review sections as well as 5.5.2.1
and 5.5.2.2) changes in Fuc content have been noted in various cancers.
Increased expression of FUT8 (a fucosyltransferase) was found by Chen, et al.,
(2013) during early stage cancer which may promote malignant cell proliferation
through increased fucosylation. This correlates with data from previous studies
that revealed increased fucosylation correlated with cancer severity and poor

132
prognosis (Asao, et al., 2013; Ferens-Sieczkowska, et al., 2013; Hashimoto, et
al., 2004; Turner, et al., 1985). However, a study by Moriwaki et al., (2009)
highlighted a decrease in fucosylation once tumours are established which may
protect tumours from destruction by NK cells. Thus the increased Fuc content
seen in TNBC samples from dataset 1 may reflect that these early stage (TNM
stage 1 and 2) samples are expressing increased Fuc to enhance the growth of
tumours which may lead to a poor prognosis for the patient. This would align
well with the current knowledge regarding TNBC’s aggressive nature (Blows, et
al., 2010; Dent, et al., 2007; Schnieder, et al., 2008). Meanwhile, the lack of
change in Fuc content observed in at risk samples from the current study could
indicate the creation of an immunosuppressive tumour environment through the
avoidance of NK cell detection. If this is the case then use of Fuc as a marker of
BC development in individuals at increased risk of BC may not be ideal.
Furthermore, alterations in GlcNAc and Gal content have been demonstrated
during cancer (Asao, et al., 2013; Cui, et al., 2011; Hamid et al., 2008;
Hashimoto, et al., 2004; Smith, et al., 2012) and changes in their levels are
often correspond with changes in degree of branching (Behan, et al., 2013).
Notably, increases in both monosaccharides taken together are a more reliable
indicator of changes in branching as GlcNAc is also present in the common
pentasaccharide core of N-linked glycans, whereas Gal is only present in glycan
branches (Varki, et al., 2009; see Figures 1.5 and 5.12). A study by Hashimoto,
et al., (2004) and a separate study by Asao, et al., (2013) showed correlation
between increases in glycan branching and cancer stage. Similarly, research
has shown that tri-antennary glycans are predominantly displayed as BC
progresses (Hamid, et al., 2008). Furthermore, increases in N-linked β1-6
branching were demonstrated to correlate with increased mortality during
cancer in studies by Majid, et al., (2005) and Cui, et al., (2011). In light of these
previous findings, the increases in GlcNAc and Gal content observed in TNBC
samples and eleven at risk samples (Trend 1) could be indicative of BC
progression and poorer prognosis. However, at risk samples displaying trend 2
(increased GlcNAc and decreased Gal compared to controls) could suggest
less glycan branching within these samples and potentially a better prognosis if
the participant develops BC or even less risk of BC development to those
displaying trend 1.

133
5.5.2.4 O-glycosylation of AGP: considerations for the present study.
For decades mature adult AGP has been described as solely expressing 5
complex N-linked glycans (Yoshima, et al., 1981). Despite this, GalNAc (a
known component of O-linked glycans) was detected in 81% of TNBC sample
and 88% of “at-risk” samples while no GalNAc was detected in any of the
negative or positive control samples.
GalNAc is a known component of O-linked glycans through its addition to
primary alcohol hydroxyl groups in the side-chains of Ser/Thr residues as the
starting point for the addition of further monosaccharide moieties to create O-
linked glycan chains (Varki, et al., 2009). As AGP contains Ser/Thr amino acids
within its protein backbone sequence the possibility exists for AGP to possess
O-linked glycans (see Figure 1.7). In fact during foetal development, AGP
expresses 3 N-linked glycans and 3 O-linked glycans with the O-linked glycans
subsequently being lost during development (Shiyan and Bovin, 1997).
Studies have revealed that certain proteins revert to foetal glycan expression
during cancer due to rapid proliferation during tumour development (Sapra, et
al., 2012; Farinati, et al., 2006). This is known as oncofoetal antigen expression
and has been shown to occur in glycoproteins such as AFP and CEA (Farinati,
et al., 2006 and Amri, et al., 2013). Thus, it is possible that the detection of
GalNAc is the majority of TNBC and “at risk” samples could be due to AGP
expressing oncofoetal antigens.
Additionally, as GalNAc is not a constituent of the pentasaccharide core
perhaps GalNAc was integrating into AGP glycan branches. Previous studies
investigating AGP glycosylation have found the presence of GalNAc in a variety
of patient populations. Anderson, et al. (2002) reported 64% of AGP samples
from individuals with hepatitis C contained GalNAc, however GalNAc was not
present in cirrhosis samples leading them to speculate that disappearance of
GalNAc from samples could indicate progression of liver disease to a cirrhotic
state. When investigating AGP glycosylation in fibrosis patients, Mooney, et al.
(2006) detected GalNAc in 34% of samples. Both studies had limited sample
numbers meaning no investigation into GalNAc presence could be undertaken.
However, both groups hypothesised that GalNAc presence could be due to the
attachment of a terminal structure on AGP glycans. This theory was

134
investigated by Gallacher (2009) after GalNAc was detected when examining
AGP glycosylation in benign, invasive and non-invasive BC samples. Benign
and invasive BC samples had GalNAc present therefore immunodiffusion was
used to investigate whether this was due to addition of terminal glycan
structures. Blood group antigen A and sialyl Tn were tested for as they are the
most common GalNAc containing terminal structures. However, neither were
detected indicating neither of these terminal structures were responsible for
GalNAc presence in Gallacher’s samples. Unfortunately, it was not feasible as
part of this study to investigate the source of GalNAc within TNBC samples.
Nevertheless, in contrast to this study, Gallacher (2009) found an association
between GalNAc presence and ER/PR positivity in tumours whereas this study
only found GalNAc in TNBC samples and not BC of unknown type samples.
A number of TNBC samples showed elevated levels of GalNAc in conjunction
with decreased levels of Fuc and vice versa (see Table 5.2). Therefore, it may
be possible that GalNAc is binding in place of Fuc in AGP glycans. However, no
significant differences were found among GalNAc content when comparing
TNBC to controls by age. Contrary to this, significant differences (p<0.05) were
seen in GalNAc levels between TNBC with family history of BC and TNBC with
unknown family history status compared to healthy and BC of unknown type
controls samples. GalNAc values were also significantly (p<0.05) higher in
treated TNBC samples compared to both controls.
Additionally, when investigating monosaccharide content in TNBC cancer
stages, stage 1 TNBC showed significantly (p<0.05) higher levels of GalNAc
than healthy and BC of unknown type controls. Thus GalNAc was not only
present in TNBC samples but was significantly different when examining the
data in different categories.
AGP expression of O-glycans and hence detection of GalNAc links to recent
literature regarding O-glycosylation of other proteins being involved in TNBC.
For example, Milde-Langosch, et al., (2014) revealed that upregulation of O-
glycosylation related enzymes were associated with TNBC subtype and
metastasis. The group hypothesised that since a number of ligands are
composed of O-linked glycans, increases in their expression could increase the
movement and binding of malignant cells away from the primary tumour site.
Similarly, elevated expression of MUC1 (an O-glycosylated protein) has been

135
shown in TNBC and increases were associated with tumour grade (Siroy, et al.,
2013). Studies have revealed that MUC1 may promote tumour growth by
inhibiting malignant cell apoptosis (Wei, et al., 2005) and enhance metastasis
via epithelial-mesenchymal transition (Schroeder, et al., 2003 and Roy, et al.,
2011). Consequently, detection of GalNAc and its association with O-
glycosylation from TNBC samples in this study - such as F5412, MT3965,
MT1178 and MT3601 which contained high levels of GalNAc - could indicate
that these patients have a higher risk of metastasis and aggressive tumour
growth which is already linked to TNBC (Blows, et al., 2010; Dent, et al., 2007;
Schnieder, et al., 2008).
5.5.3 Benefits and Shortcomings in the Methodology Used.
The current study used the well-documented and highly sensitive technique,
HPAEC-PAD, (Behan and Smith, 2011; Hardy and Townsend, 1988; Harazono,
et al., 2011; Smith, et al., 2012; Townsend, et al., 1995) for the quantification of
monosaccharides within purified AGP samples after acid hydrolysis. A benefit of
both techniques is that they are non-discriminant - acid hydrolysis will release
all monosaccharides from the protein backbone (Behan, 2010) just as HPAEC-
PAD will detect all monosaccharides in a sample (Smith, et al., 2012; Harazono,
et al., 2011; Behan and Smith, 2011; Townsend, et al., 1995). A further benefit
of these techniques is that samples do not require derivitization to enhance
detection as this would alter the structures of the monosaccharides (Lee, 1990).
Use of commercial monosaccharide standards of Fuc, GalNAc, GlcNAc, Gal
and Man with HPAEC-PAD enabled the identity and consistent elution time
(retention times) of each monosaccharide to be established prior to each batch
of samples being analysed (see Figure 5.2). Additionally, 5 commercial AGP
samples were subjected to acid hydrolysis and HPAEC-PAD to confirm the
reliability and reproducibility of the method (see Figure 5.4).
However, as with AGP concentration analysis, inadequate sample storage may
have affected the monosaccharide content of AGP in dataset 1. The samples
were purchased prior to the study commencing and it was acknowledged that
post-translational modifications such as glycosylation may degrade if stored at -
20°C instead of -80°C (Davies, 1968). Dataset 2 samples were processed

136
immediately and not stored for long periods of time, therefore, storage is
unlikely to have affected the monosaccharide content in these samples.
Additionally, while monosaccharide standards were analysed prior to each
batch of sample investigation, other controls such as commercial AGP could
have been subjected to acid hydrolysis and HPAEC-PAD to ensure
contamination was not occurring. However, commercial AGP is expensive and
with a limited budget for this study it was not feasible to use commercial AGP as
a control.
5.5.4 Additional Methodologies to Study Glycan Content.
Additional methodologies could, in principle, have been used throughout this
study to support and confirm the results obtained. However, due to the small
budget and small sample volumes this was not feasible.
Initially, given greater sample quantities, basic techniques could have been
utilised to confirm removal of glycans from AGP by acid hydrolysis or to
demonstrate increased branching within AGP samples. SDS-PAGE separates
proteins by size on a gel through application of an electrical current and the
protein bands can be visualised using stains (Laemmmli, 1970). Samples could
have been analysed on an SDS-PAGE gel pre and post acid hydrolysis to
detect the reduction of molecular mass that would have indicated successful
removal of glycans from the protein. Futhermore, a periodic acid-Schiff stain,
such as that proposed by (Hart, et al., 2003), could have been used in
conjunction with SDS-PAGE and a nitrocellulose blot to measure glycosylation
of AGP pre and post acid hydrolysis. Yet recovery of the AGP protein bound to
Dowex-50 WX8 H+cation exchange resin to enable separation of proteins and
monosaccharides after acid hydrolysis proved difficult. Therefore, this along
with the cost implication was a factor in choosing not to use such techniques.
Likewise, analysis of each sample using SDS-PAGE could have indicated
increased monosaccharide content and glycan branching as these samples
would have possessed a higher molecular mass than their counterparts with
lower monosaccharide content. Thus, samples with a higher molecular mass
due to increased monosaccharide content would not have migrated as far
through a SDS-PAGE gel, giving rise to different banding for each sample.
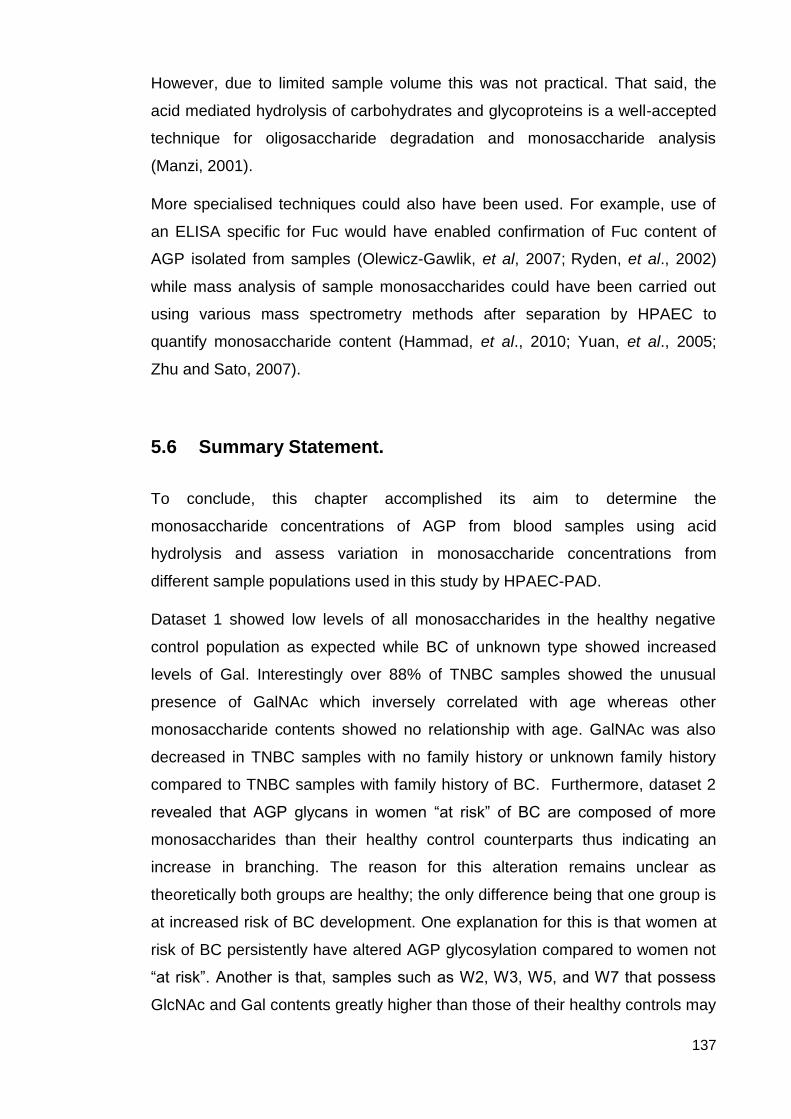
137
However, due to limited sample volume this was not practical. That said, the
acid mediated hydrolysis of carbohydrates and glycoproteins is a well-accepted
technique for oligosaccharide degradation and monosaccharide analysis
(Manzi, 2001).
More specialised techniques could also have been used. For example, use of
an ELISA specific for Fuc would have enabled confirmation of Fuc content of
AGP isolated from samples (Olewicz-Gawlik, et al, 2007; Ryden, et al., 2002)
while mass analysis of sample monosaccharides could have been carried out
using various mass spectrometry methods after separation by HPAEC to
quantify monosaccharide content (Hammad, et al., 2010; Yuan, et al., 2005;
Zhu and Sato, 2007).
5.6 Summary Statement.
To conclude, this chapter accomplished its aim to determine the
monosaccharide concentrations of AGP from blood samples using acid
hydrolysis and assess variation in monosaccharide concentrations from
different sample populations used in this study by HPAEC-PAD.
Dataset 1 showed low levels of all monosaccharides in the healthy negative
control population as expected while BC of unknown type showed increased
levels of Gal. Interestingly over 88% of TNBC samples showed the unusual
presence of GalNAc which inversely correlated with age whereas other
monosaccharide contents showed no relationship with age. GalNAc was also
decreased in TNBC samples with no family history or unknown family history
compared to TNBC samples with family history of BC. Furthermore, dataset 2
revealed that AGP glycans in women “at risk” of BC are composed of more
monosaccharides than their healthy control counterparts thus indicating an
increase in branching. The reason for this alteration remains unclear as
theoretically both groups are healthy; the only difference being that one group is
at increased risk of BC development. One explanation for this is that women at
risk of BC persistently have altered AGP glycosylation compared to women not
“at risk”. Another is that, samples such as W2, W3, W5, and W7 that possess
GlcNAc and Gal contents greatly higher than those of their healthy controls may

138
be a sign of BC development. Furthermore, GalNAc presence in N-linked
glycans, such as those is AGP, is unusual as it is more commonly present in O-
linked glycans. Therefore, its presence in 81.2% of “at risk” samples may
indicate BC development.

139
Chapter 6 – Oligosaccharide Analysis Results and
Discussion.

140
6.1 Introduction.
Alterations to AGP oligosaccharide chain structure may occur during a disease
state (Hashimoto, et al., 2004; Turner, et al., 1985). These structural changes
can be used in conjunction with monosaccharide data to evaluate glycosylation
changes in AGP that could be unique to BC.
HPAEC-PAD was implemented to separate and detect oligosaccharide chains,
after cleavage from the polypeptide backbone of AGP using PNGaseF, due its
highly reliable and sensitive capabilities (Hardy, et al., 1988). Similar to
monosaccharide analysis, HPAEC detection sensitivity was greatly improved by
the addition of PAD to purge the gold electrode of contaminants between
sample analyses. Oligosaccharide separation is reliant on interactions between
the negatively charged carbohydrate molecules (due to pH13 mobile phase)
and the positively charged stationary phase. The strength of interaction
oligosaccharide interaction with the stationary phase is determined by
negatively charged terminal 9-carbon carboxylated SA residues combined with
the negative charge of component monosaccharides under alkaline conditions.
Therefore (as shown in section 6.2 and 6.4) oligosaccharide chains with varying
terminal SA residues and negative charge contribution from monosaccharide
content, results in different elution times for each oligosaccharide chain. For
instance a bi-antennary oligosaccharide chain with only one terminal SA residue
will have a lower overall negative charge and will elute earlier than a tri-
antennary oligosaccharide chain with three terminal SA residues. Therefore,
separation is enhanced due to the formation of oxyanions under strong alkaline
conditions, resulting in varying pKa values of monosaccharides within the chain
to allow differentiation between glycan structures. Thus a “fingerprint” of the
extent of branching can be seen using HPAEC-PAD without prior derivatisation
of samples (Lee, 1990). As such, HPAEC-PAD has remained a valuable and
sensitive technique for structural analysis of glycans after their removal from the
protein portion using enzymes or chemicals.
Separation of oligosaccharide chains during HPAEC-PAD necessitates the
removal of glycans bound to the anion exchange resin within the column. This
removal is facilitated by an increasing linear gradient of NaOAc which acts as a
pushing agent while 100mM NaOH provides an alkaline pH. The NaOAc

141
gradient is increased from 50-250 mM over a period of 30 minutes causing
displacement of glycans from the column surface as the NaOAc competes for
the anion-exchange resin. Increasing the NaOAc gradient to 250mM ensures
the elution of all oligosaccharide chains including the highly branched and
sialylated glycans which form the strongest bond with the column resin and
hence are most difficult to remove. SA exists in 2 main forms that differ by a
single OH group being present or absent, known as N-acetylneuraminic acid
(NeuAc) and N-glycolneuraminic acid. Behan (2010) revealed that HPAEC-PAD
is capable of separating these two SA forms by over 10 minutes in spite of the
minute structural difference, further highlighting the sensitivity of the technique.
During analysis of glycan structure using HPAEC-PAD, similar oligosaccharide
chains which vary only by the extent of sialylation will separate out into distinct
charged bands due to considerably different overall negative charges of each
structure. Additionally the size of glycans will affect elution time within a charged
band. Therefore, glycan chains with increased monosaccharide content will
have a later elution time than glycan chains with a lower monosaccharide
content but same degree of sialylation. For instance, if mono-sialylated bi-, tri-
and tetra-antennary chains were analysed simultaneous, this would be the
order in which they elute. This is because glycans with greater monosaccharide
content will contain higher numbers of carbon atoms and thus have more –OH
groups and negative charge causing an increase in retention time through a
stronger interaction with the stationary phase resin (Paskach, et al., 1991).
Similarly the reverse is also true whereby a highly branched chain with
incomplete sialylation may elute prior to a less branched structure with full
sialylation, as the overall charge of the former will be less negative due to
missing SA residues. However, this would be a rare occurrence as lack of SA
terminal structures usually results in degradation of the molecule, due to Gal
being exposed at the terminus. If another terminal structure was present, thus
hiding Gal, degradation would not occur.
Furthermore, separation of glycan chains can be affected by different linkages
within chain structures. Townsend, et al. (1988) discovered that variation
between linkages connecting an SA terminal residue to a glycan chain can
increased retention time. An SA residue can bind to the outer most Gal of a
glycan branch via an α-(2,3) or α-(2,6) linkage, with greater expression of α-

142
(2,3) giving a greater elution time due to increased interaction with the column.
Column interaction is increased because if an α-(2,6) linkage binds SA as a
terminal structure, the oxyanion effect at the C6 –O- group of Gal is removed as
that carbon is facilitating the attachment of SA. Absence of this additional
negative charge allows the glycan chain to elute faster than if an α(2,3) linkage
occurred because an α(2,3) linkage will not utilise the oxyanion group of C6
(Townsend, et al., 1989). Additionally the group also found when Gal is bound
to the pentasaccharide core via a β-(1,4) bond to GlcNAc, the elution time is
reduced compared to a β-(1,3) linkage, due to less association of the -OH
groups with the column resin at pH13 during analysis. This allows separation of
glycans when these linkages differ (Townsend, et al., 1989; Townsend, et al.,
1988).
6.2 Dataset 1 Oligosaccharide Results.
Oligosaccharide analysis was carried out using HPAEC-PAD, as described in
chapter 2, to provide a fingerprint of the extent of AGP glycan branching within
samples and assess any alterations between sample groups. HPAEC-PAD
initially separates glycans into specific charged bands. Eluting first are glycans
expressing one SA residue (10-20 minutes), secondly are bi-sialylated glycans
(20-30 minutes), followed by tri-sialylated (30-40 minutes) and tetra-sialylated
glycans (40-50 minutes). Figure 6.1 illustrates an N-linked oligosaccharide (5µg)
library with groups of bi-, tri- and tetra-sialylated chains labelled at the expected
time ranges as described by the manufacturer. This N-linked library
chromatogram was used as a comparison for all samples to enable
identification of sialylation of AGP branches. Unlike monosaccharides, which
can be quantified using calibration curves, oligosaccharides cannot be
quantified as no pure forms for use as a reference were available. Commercially
sourced AGP was not used for comparison due to the different isolation method
used.

143
Figure 6.1 N-linked Oligosaccharide (5µg) Library. Illustrates the
separation of varying degrees of branching as distinct charged bands, each labelled with their SA content: bi-sialylated, tri-sialylated and tetra-sialylated.
In the case of dataset 1, oligosaccharide chromatograms were collect from
TNBC samples (n=18), BC of unknown type (n=5; positive control) and “normal”
healthy individuals (n=5; negative control). As this method was not quantitative
there was no requirement for sample repeats unless an erroneous
chromatogram was produced, additionally there was only enough isolated AGP
from TNBC samples for a single oligosaccharide analysis to be performed.
Figure 6.2 Oligosaccharide Chromatogram of “Normal” Healthy
Controls Compared to an N-linked Oligosaccharide (5µg) Library.
0
10
20
30
40
50
60
0 10 20 30 40 50 60
Peak H
eig
ht
(nC
)
Time (min)
Bi-sialylated
Tri-sialylated Tetra-sialylated
-10
0
10
20
30
40
50
60
10 20 30 40 50
Peak H
eig
ht
(nC
)
Time (min)
N1 N2 N3 N4 N5 N-linked Library
Bi-sialylated
Tri-sialylated Tetra-sialylated

144
Oligosaccharide analysis of “normal” healthy controls and comparison to the N-
linked library revealed a tendency towards bi-sialylated and tri-sialylated glycan
branches. The majority of peaks lay in the tri-sialylated time range, followed by
bi-sialylated and lastly tetra-sialylated. Most of the healthy controls showed only
one or two peaks in the tetra-sialylated time-frame compared to several in the
tri-sialylated time-range.
Figure 6.3 Oligosaccharide Chromatogram of BC of Unknown Type
Controls Compared to an N-linked Oligosaccharide (5µg) Library.
Use of BC of an unknown type as a positive control highlighted variations in
glycan branching compared to “normal” healthy samples (negative control).
Comparison to the N-linked library standard revealed BC of an unknown type
had an increase in tri-sialylated and tetra-sialylated branches with very few
peaks detected in the bi-sialylated time range.
-10
0
10
20
30
40
50
60
10 20 30 40 50
P
eak H
eig
ht
(nC
)
Time (min)
H8 I2 I3 I5 I8 N-linked Library
Bi-sialylated
Tri-sialylated Tetra-sialylated

145
Figure 6.4 Oligosaccharide Chromatogram of TNBC Sample CT79
Compared to an N-linked Oligosaccharide (5µg) Library.
Very few peaks were detected in TNBC sample CT79 but magnification of the
chromatogram revealed peaks within the tri- and tetra-sialylated time ranges.
No peaks were detected in the bi-sialylated time range. This right shift indicates
increased branching within sample CT79.
Figure 6.5 Oligosaccharide Chromatogram of TNBC Sample F5412
Compared to an N-linked Oligosaccharide (5µg) Library.
TNBC sample F5412 showed a significant number of tri-sialylated glycans with
a smaller number of peaks in the bi- and tetra-sialylated area. Again this
-10
0
10
20
30
40
50
60
10 20 30 40 50
P
eak H
eig
ht
(nC
)
Time (min)
CT79 N-linked Library
0
10
20
30
40
50
60
10 20 30 40 50
P
eak H
eig
ht
(nC
)
Time (min)
F5412 N-linked Library
Bi-sialylated
Tri-sialylated Tetra-sialylated
Bi-sialylated
Tri-sialylated Tetra-sialylated

146
showed an increase in branching similar to that of BC of unknown type as
opposed to low levels of branching seen in healthy samples.
Figure 6.6 Oligosaccharide Chromatogram of TNBC Sample MT3965
Compared to an N-linked Oligosaccharide (5µg) Library.
A lower level of branching was seen in TNBC sample MT3965 resembling the
extent of branching found in normal samples. No peaks were detected in the
tetra-sialylated time range. However, bi-sialylated and tri-sialylated peaks were
detected in the corresponding time frames, thus suggesting a lower degree of
branching.
Figure 6.7 Oligosaccharide Chromatogram of TNBC Sample MT2305
Compared to an N-linked Oligosaccharide (5µg) Library.
0
10
20
30
40
50
60
10 20 30 40 50
Peak H
eig
ht
(nC
)
Time (min)
MT3965 N-linked Library
-10
0
10
20
30
40
50
60
10 20 30 40 50
Peak H
eig
ht
(nC
)
Time (min)
MT2305 N-linked Library
Bi-sialylated
Tri-sialylated Tetra-sialylated
Bi-sialylated
Tri-sialylated Tetra-sialylated

147
Oligosaccharide analysis of TNBC sample MT2305 highlighted similar
oligosaccharide branching to that of TNBC sample MT3965 in that tri-sialylated
branching was most prominent with few bi-sialylated branches and no tetra-
sialylated branches detected. This degree of branching most closely reflects
that of the normal population in this dataset.
Figure 6.8 Oligosaccharide Chromatogram of TNBC sample MT2621
Compared to an N-linked Oligosaccharide (5µg) Library.
In TNBC sample MT2621 mostly tri-sialylated glycans were detected with three
peaks detected late in the bi-sialylated time range. Again this corresponded with
healthy samples’ AGP glycan branching and is similar to that of samples
MT3965 and MT2305 which both have less branching of glycans.
0
10
20
30
40
50
60
10 20 30 40 50
Peak H
eig
ht
(nC
)
Time (min)
MT2621 N-linked Library
Bi-sialylated
Tri-sialylated Tetra-sialylated

148
Figure 6.9 Oligosaccharide Chromatogram of TNBC Sample MT3625
Compared to an N-linked Oligosaccharide (5µg) Library.
TNBC sample MT3625 showed a similar oligosaccharide profile to MT3695,
MT2305 and MT2621 whereby late bi-sialylated branching is detected as well
as tri-sialylated branching. However, a peak was detected in the tetra-sialylated
time range indicating the presence of a glycan with a higher degree of
branching that the previous samples and healthy control samples.
Figure 6.10 Oligosaccharide Chromatogram of TNBC Sample MT1106
Compared to an N-linked Oligosaccharide (5µg) Library.
0
10
20
30
40
50
60
10 20 30 40 50
Peak H
eig
ht
(nC
)
Time (min)
MT3625 N-linked Library
0
10
20
30
40
50
60
10 20 30 40 50
Peak H
eig
ht
(nC
)
Time (min)
MT1106 N-linked Library
Bi-sialylated
Tri-sialylated Tetra-sialylated
Bi-sialylated
Tri-sialylated Tetra-sialylated

149
TNBC sample MT1106 had a mostly tri-sialylated glycans with a small number
of bi-sialylated peaks detected which became apparent upon magnification of
the chromatogram. There was also a minor peak detected in the tetra-sialylated
time area.
Figure 6.11 Oligosaccharide Chromatogram of TNBC sample MT1937
Compared to an N-linked Oligosaccharide (5µg) Library.
Tetra-sialylated branching was identified in TNBC sample MT1937 but the
majority of glycans still appeared in the tri-sialylated and bi-sialylated region of
the chromatogram. However the chromatogram still indicated that that an
increase in glycan branching was present in this sample, similar to that of the
positive control.
0
10
20
30
40
50
60
10 20 30 40 50
Peak H
eig
ht
(nC
)
Time (min)
MT1937 N-linked library
Bi-sialylated
Tri-sialylated Tetra-sialylated

150
Figure 6.12 Oligosaccharide Chromatogram of TNBC Sample MT3759
Compared to an N-linked Oligosaccharide (5µg) Library.
TNBC sample MT3759 displayed an oligosaccharide profile with mainly bi- and
tetra-sialylated glycans present. No peaks were detected in the tri-sialylated
time period. Therefore, MT3759 appeared to have an increase in the degree of
AGP glycan branching.
Figure 6.13 Oligosaccharide Chromatogram of TNBC Sample MT1177
Compared to an N-linked Oligosaccharide (5µg) Library.
Interestingly, TNBC sample MT1177 showed a very clear oligosaccharide
profile featuring a variety of types of glycan branching. Bi-sialylated and tri-
sialylated branching featured more prominently than tetra-sialylated. However,
0
10
20
30
40
50
60
10 20 30 40 50
Peak H
eig
ht
(nC
)
Time (min)
MT3759 N-linked library
0
10
20
30
40
50
60
10 20 30 40 50
Peak H
eig
ht
(nC
)
Time (min)
MT1177 N-linked library
Bi-sialylated
Tri-sialylated Tetra-sialylated
Bi-sialylated
Tri-sialylated Tetra-sialylated

151
the presence of tetra-sialylated glycans indicated an increase in the degree of
branching not commonly seen within the other TNBC samples.
Figure 6.14 Oligosaccharide Chromatogram of TNBC Sample MT1178
Compared to an N-linked Oligosaccharide (5µg) Library.
TNBC sample MT1178 clearly exhibits all identified types of glycan branching
with peaks visible in the bi-, tri and tetra-sialylated regions of the chromatogram.
Peaks prior to the bi-sialylated area also indicated presence of mono-sialylated
bi-antennary glycans. Therefore, MT1178 possessed a wide variety of glycan
branching with larger peaks in the tri-sialylated time frame suggesting a
preference for this level of glycan branching.
0
10
20
30
40
50
60
10 20 30 40 50
Peak H
eig
h (
nC
)
Time (min)
MT1178 N-linked library
Bi-sialylated Tri-sialylated Tetra-sialylated

152
Figure 6.15 Oligosaccharide Chromatogram of TNBC Sample MT3601
Compared to an N-linked Oligosaccharide (5µg) Library.
Oligosaccharide analysis of TNBC sample MT3601 highlighted larger peaks
arising in the mono-sialylated, bi-sialylated and tetra-sialylated regions of the
chromatogram. No peaks were detected in the tri-antennary region suggested
that AGP isolated from this participant favoured a lesser degree of branching.
Figure 6.16 Oligosaccharide Chromatogram of TNBC Sample MT2569
Compared to an N-linked Oligosaccharide (5µg) Library.
A preference for bi-and tri-sialylated glycans was shown by TNBC sample
MT2569 with only one peak being detected in the tetra-sialylated region of the
0
10
20
30
40
50
60
10 20 30 40 50
Peak H
eig
ht
(nC
)
Time (min)
MT3601 N-linked library
0
10
20
30
40
50
60
10 20 30 40 50
Peak H
eig
ht
(nC
)
Time (min)
MT2569 N-linked library
Bi-sialylated Tri-sialylated Tetra-sialylated
Bi-sialylated
Tri-sialylated Tetra-sialylated

153
chromatogram. Again, indicating a lesser degree of branching displayed by
TNBC samples.
Figure 6.17 Oligosaccharide Chromatogram of TNBC Sample MT3352
Compared to an N-linked Oligosaccharide (5µg) Library.
Analysis of TNBC sample MT3352’s branching highlighted a shift towards more
highly branched AGP glycan chains with an increase in peaks detected in the
tri- and tetra-sialylated time frames of the chromatogram.
Figure 6.18 Oligosaccharide Chromatogram of TNBC Sample MT3362
Compared to an N-linked Oligosaccharide (5µg) Library.
TNBC sample MT3362 displayed a preference for bi-sialylated and tri-sialylated
glycans with no peaks present in the tetra-sialylated region of the
0
10
20
30
40
50
60
10 20 30 40 50
Peak H
eig
ht
(nC
)
Time (min)
MT3352 N-linked library
0
10
20
30
40
50
60
10 20 30 40 50
Peak H
eig
ht
(nC
)
Time (min)
MT3362 N-linked library
Bi-sialylated Tri-sialylated Tetra-sialylated
Bi-sialylated Tri-sialylated Tetra-sialylated

154
chromatogram. Therefore, there was a predominance of less highly branched
AGP glycan chains in this sample.
Figure 6.19 Oligosaccharide Chromatogram of TNBC samples MT3442
Compared to an N-linked Oligosaccharide (5µg) Library.
Very few peaks were detected in TNBC sample MT3442 however peaks were
visible during the bi-sialylated time frame and a minor peak was present in the
tetra-sialylated area. No peaks were found in the tri-sialylated region of the
chromatogram. Thus, a lesser degree of branching was present in this sample.
Figure 6.20 Oligosaccharide Chromatogram of TNBC Sample MT3497
Compared to an N-linked Oligosaccharide (5µg) Library.
0
10
20
30
40
50
60
10 20 30 40 50
Peak H
eig
ht
(nC
)
Time (min)
MT3442 N-linked library
0
10
20
30
40
50
60
10 20 30 40 50
Peak H
eig
ht
(nC
)
Time (min)
MT3497 N-linked library
Bi-sialylated Tri-sialylated Tetra-sialylated
Bi-sialylated Tri-sialylated Tetra-sialylated

155
Several peaks were present in the bi-sialylated and tri-sialylated areas of the
chromatogram with one peak also detected within the tetra-sialylated time point.
The predominance of bi- and tri-antennary glycans detected indicated a lesser
degree of branching present in MT3497.
6.3 Dataset 2 Oligosaccharide Results.
Oligosaccharide analysis of dataset 2 was performed using identical methods to
dataset 1. HPAEC-PAD was utilised to separate AGP glycans (initially by
charge) to deliver an indication of the extent of branching and any structural
alterations to oligosaccharide chains between samples from women at-risk of
BC development and age-matched healthy controls. The same N-linked (5µg)
library chromatogram given in section 6.2 (Figure 6.1) was used for comparison
as in dataset 1 to provide elution times of the charge bands of interest – bi-
sialylated (20-30 min), tri-sialylated (30-40 min) and tetra-sialylated (40-50 min).
Figure 6.21 Oligosaccharide Chromatogram of W1 Compared to C1 and
an N-linked Oligosaccharide (5µg) Library.
A clear difference in glycan structure could be seen between W1 and age-
matched healthy control C1. W1 had a greater number of tri-sialylated and tetra-
sialylated peaks, with the tetra-sialylated peaks also being far larger than any
-10
0
10
20
30
40
50
60
10 20 30 40 50
Peak H
eig
ht
(nC
)
Time (min)
C1 W1 N-linked Library
Bi-sialylated Tri-sialylated Tetra-sialylated

156
peaks in C1. Whereas C1 showed a preference for less highly branched
glycans with most peaks eluting in the bi- and tri-sialylated charge bands.
Figure 6.22 Oligosaccharide Chromatogram of W2 Compared to C2 and
an N-linked Oligosaccharide (5µg) Library.
W2 also had a preference for highly branched glycans with more peaks
detected in the tri- and tetra-sialylated charge bands. Bi-sialylated peaks were
present in W2 however they were smaller and lower in numbers than peaks
found in the tri- and tetra-sialylated charge bands indicating less of these types
of glycans being present in the sample. C2 had no peaks in the tetra-sialylated
charge band but had high numbers of peaks in the bi- and tri-sialylated elution
region.
-10
0
10
20
30
40
50
60
10 20 30 40 50
Peak H
eig
ht
(nC
)
Time (min)
W2 C2 N-linked Library
Tetra-sialylated Tri-sialylated
Bi-sialylated

157
Figure 6.23 Oligosaccharide Chromatogram of W3 Compared to an N-
linked Oligosaccharide (5µg) Library.
An age-matched healthy control was not available for comparison of
oligosaccharide analysis of W3 and a mean of the healthy controls could not be
calculated as the results are not quantitative. However, structural observation
can still be gathered from analysis. W3 had peaks in all charged bands. More
peaks were present in the bi-sialylated charge band however, these peaks were
small in size. A lower number of larger peaks were detected in the tri- and tetra-
sialylated elution regions. Therefore, it would appear that W3 has a preference
for more highly branched glycans.
Figure 6.24 Oligosaccharide Chromatogram of W4 Compared to C4 and
an N-linked Oligosaccharide (5µg) Library.
0
10
20
30
40
50
60
10 20 30 40 50
Peak H
eig
ht
(nC
)
Time (min)
W3 N-linked Library
-10
0
10
20
30
40
50
60
10 20 30 40 50
Peak H
eig
ht
(nC
)
Time (min)
W4 C4 N-linked library
Bi-sialylated Tri-sialylated Tetra-sialylated
Bi-sialylated
Tri-sialylated Tetra-sialylated

158
Alterations in glycan structure were apparent between W4 and C4 upon
analysis. W4 had small peaks in every charge band with the majority appearing
in the tri- and tetra-sialylated elution regions. Small peaks were present in the
bi-sialylated charge band however these were smaller peaks than those in the
other charge band and there were less of them. Thus indicating AGP glycans
from W4 displayed a higher degree of branching. C4 revealed a different pattern
whereby no peaks were detected in the tetra-sialylated region of the
chromatogram however several peaks were present in the tri-sialylated charge
band with a smaller number eluting late in the bi-sialylated band. Therefore, W4
has more highly branched AGP glycans than C4.
Figure 6.25 Oligosaccharide Chromatogram of W5 Compared to C5 and
an N-linked Oligosaccharide (5µg) Library.
W5 had a larger number of peaks present in the tri- and tetra-sialylated charge
bands upon oligosaccharide analysis showing a greater degree of AGP glycan
branching in this sample. In comparison, C5 had a large peak in the bi-
sialylated region and several smaller peaks in the tri-sialylated charge band
suggesting less highly branched AGP glycans compared to W5. Interestingly a
very large peak was detected prior to the bi-sialylated charge band which may
have indicated a large presence of mono-sialylated bi-antennary glycans.
-10
0
10
20
30
40
50
60
10 20 30 40 50
Peak H
eig
ht
(nC
)
Time (min)
W5 C5 N-linked Library
Bi-sialylated Tri-sialylated Tetra-sialylated

159
Figure 6.26 Oligosaccharide Chromatogram of W6 Compared to C6 and
an N-linked Oligosaccharide (5µg) Library.
Oligosaccharide analysis of W6 revealed the majority of peaks lay within the bi-
and tri-sialylated charge bands suggesting a lower level of branching compared
to other “at risk” samples. Only two peaks were present in the tetra-sialylated
region of W6’s chromatogram suggesting very little of this type of glycan
branching existed in this sample. This profile was similar to that of C6 which
also had very few peaks in the tetra-sialylated charge band but more peaks
detected in the bi- and tri-sialylated region. Results showed that both W6 and
C6 possessed a lower extent of AGP glycan branching.
-10
0
10
20
30
40
50
60
10 20 30 40 50
Peak H
eig
ht
(nC
)
Time (min)
W6 C6 N-linked Library
Bi-sialylated Tri-sialylated Tetra-sialylated

160
Figure 6.27 Oligosaccharide Chromatogram of W7 compared to C7 and
an N-linked Oligosaccharide (5µg) Library.
Sample W7 possessed a large peak in the bi-sialylated charge band and
several smaller peaks in the tri-sialylated charge band suggesting a lower level
of glycan branching despite detection of peaks in the tetra-sialylated charge
band as these were small and present in low numbers. C7 showed a wide
variety of peaks present across all three charged bands with the majority
occurring in the tri-sialylated charge band. However, two large peaks were
detected in the bi-sialylated charge band which may highlight a preference for
this type of AGP glycan branching. Several small peaks were detected in the
tetra-sialylated charge band revealing low levels of higher branched structures.
0
10
20
30
40
50
60
10 20 30 40 50
Peak H
eig
ht
(nC
)
Time (min)
W7 C7 N-linked Library
Bi-sialylated Tri-sialylated Tetra-sialylated
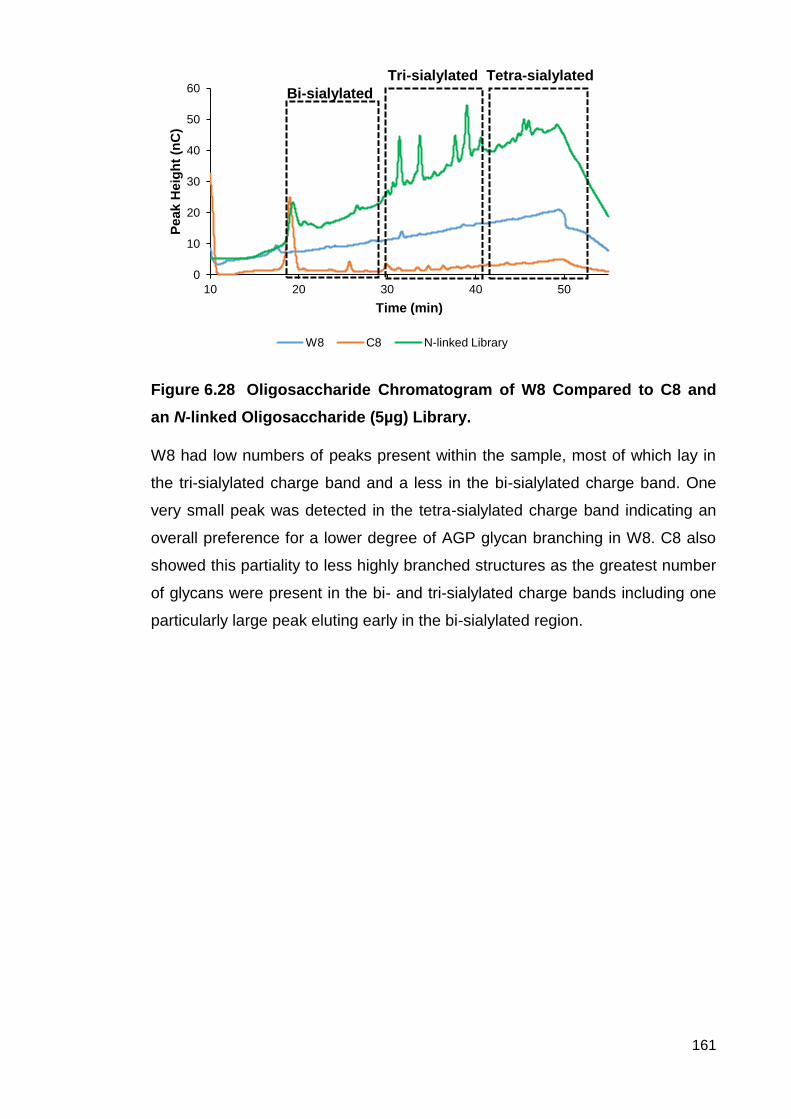
161
Figure 6.28 Oligosaccharide Chromatogram of W8 Compared to C8 and
an N-linked Oligosaccharide (5µg) Library.
W8 had low numbers of peaks present within the sample, most of which lay in
the tri-sialylated charge band and a less in the bi-sialylated charge band. One
very small peak was detected in the tetra-sialylated charge band indicating an
overall preference for a lower degree of AGP glycan branching in W8. C8 also
showed this partiality to less highly branched structures as the greatest number
of glycans were present in the bi- and tri-sialylated charge bands including one
particularly large peak eluting early in the bi-sialylated region.
0
10
20
30
40
50
60
10 20 30 40 50
Peak H
eig
ht
(nC
)
Time (min)
W8 C8 N-linked Library
Bi-sialylated
Tri-sialylated Tetra-sialylated

162
Figure 6.29 Oligosaccharide Chromatogram of W9 Compared to an N-
linked Oligosaccharide (5µg) Library.
As with sample W3 no age-matched health control could be recruited for
comparison to the at-risk sample W9 and no mean could be calculated so a
general features were observed. Few peaks were detected in the bi-sialylated
charge band however and those that were present eluted at longer retention
times. However a great number of larger peaks were present in the tri- and
tetra-sialylated charge bands showing W9 to have a preference for a greater
degree of branching in AGP glycans.
Figure 6.30 Oligosaccharide Chromatogram of W10 compared to an N-
linked Oligosaccharide (5µg) Library.
0
10
20
30
40
50
60
10 20 30 40 50
Peak H
eig
ht
(nC
)
Time (min)
W9 N-linked Library
0
10
20
30
40
50
60
10 20 30 40 50
Peak H
eig
ht
(nC
)
Time (min)
W10 N-linked Library
Bi-sialylated Tri-sialylated Tetra-sialylated
Bi-sialylated Tri-sialylated Tetra-sialylated

163
It was not possible to recruit an age-matched healthy control for comparison to
“at risk” sample W10. Few peaks were detected in the sample however those
that were mostly occurred in the bi- and tri-sialylated charge bands suggesting
low levels of branching in this sample. Two minute peaks were present in the
tetra-sialylated charge band showing presence of more highly branched
structures however the overall preference of W10 was for less branched AGP
glycans.
Figure 6.31 Oligosaccharide Chromatogram of W11 Compared to C11 and
an N-linked Oligosaccharide (5µg) Library.
“At risk” sample W11 showed a greater tendency toward tri- and tetra-sialylated
glycans due to the presence of higher numbers of larger peaks in these charge
bands compared to fewer small peaks in the bi-sialylated charge band.
Whereas no peaks were present in C11’s tetra-sialylated charge band but
peaks were detected in the bi- and tri-sialylated regions. Therefore, W11
appeared to have more highly branched AGP glycans than C11.
-10
0
10
20
30
40
50
60
10 20 30 40 50
Peak H
eig
ht
(nC
)
Time (min)
W11 C11 N-linked Library
Bi-sialylated
Tri-sialylated Tetra-sialylated

164
Figure 6.32 Oligosaccharide Chromatogram of W12 Compared to C12 and
an N-linked Oligosaccharide (5µg) Library.
Minute peaks were detected in at-risk sample W12 and upon magnification, the
most significant peaks were present in the bi- and tri-sialylated charge bands
indicating low levels of branching. However, C12 had large peaks present
throughout the charge bands with numerous large peaks in the lower glycan
branching bi- and tri-sialylated charge bands. While peaks were detected in the
tetra-sialylated charge band of C12, they were present in lesser numbers than
those in other regions. Therefore, while both samples had peaks in the same
charge bands, W12 appeared to have a lower level of branching than C12 due
to smaller peak sizes in these elution regions.
0
10
20
30
40
50
60
10 20 30 40 50
Peak H
eig
ht
(nC
)
Time (min)
W12 C12 N-linked Library
Bi-sialylated Tri-sialylated Tetra-sialylated

165
Figure 6.33 Oligosaccharide Chromatogram of W13 Compared to C13 and
an N-linked Oligosaccharide (5µg) Library.
W13 possessed peaks in the tri-sialylated charge band with none detected in
the tetra-sialylated band. Several small peaks were present in the bi-sialylated
charge band however the tendency towards tri-sialylated glycans was still
prevalent. However, several large peaks occurred in C13’s bi- and tri-sialylated
charge bands with lower numbers of smaller peaks detected in the tetra-
sialylated region. Thus sample W13 indicated a preference for slightly higher
branching of AGP glycans compared to C13 which had a greater presence of
bi- and tri-sialylated glycans.
Figure 6.34 Oligosaccharide Chromatogram of W14 Compared to and N-
linked Oligosaccharide (5µg) Library.
0
10
20
30
40
50
60
10 20 30 40 50
Peak H
eig
ht
(nC
)
Time (min)
W13 C13 N-linked Library
0
10
20
30
40
50
60
10 20 30 40 50
Peak H
eig
ht
(nC
)
Time (min)
W14 N-linked Library
Bi-sialylated
Tri-sialylated Tetra-sialylated
Bi-sialylated Tri-sialylated Tetra-sialylated
166
Age-matched healthy controls could not be recruited for W14, W15 or W16,
therefore observations were made without comparison to a healthy control.
Oligosaccharide analysis of W14 showed a penchant for tri-sialylated glycans
with only one or two peaks detected in the bi- or tetra-sialylated charge bands.
Figure 6.35 Oligosaccharide Chromatogram of W15 Compared to an N-
linked Oligosaccharide (5µg) Library.
W15 possessed AGP glycans mainly with low levels of branching as indicated
by prevalence of peaks in the bi-sialylated charge band. Few peaks occurred in
the tri- of tetra-sialylated regions of the chromatogram.
0
10
20
30
40
50
60
10 20 30 40 50
Peak H
eig
ht
(nC
)
Time (min)
W15 N-linked Library
Bi-sialylated Tri-sialylated Tetra-sialylated

167
Figure 6.36 Oligosaccharide Chromatogram of W16 Compared to an N-
linked Oligosaccharide (5µg) Library.
Tri-sialylated glycans were most predominant in “at risk” sample W16 with the
majority of peaks occurring in this charged band. Few peak were detected in the
bi-sialylated and tetra-sialylated region however the overall preference
remained tri-sialylated glycans.
6.4 Discussion.
6.4.1 Introduction.
The aim of the research discussed in this chapter was to investigate variation in
the extent of branching of oligosaccharide glycan chains of isolated AGP from
two sample populations - Dataset 1 comprised samples from healthy
individuals, women with BC of unknown type and women with TNBC as well as
Dataset 2 containing samples from women at increased risk of BC development
and age-matched healthy controls. This was performed through enzymatic
release of N-linked glycans and analysis by HPAEC-PAD.
Release of intact AGP glycans from the polypeptide backbone is an essential
prerequisite for investigation of their structure. This was achieved through
denaturing isolated AGP then endoglycosidase PNGase F was used to cleave
intact glycans from the polypeptide backbone. This study used heat to denature
AGP as it promotes cleavage of glycans by PNGase F, whereas other methods
0
10
20
30
40
50
60
10 20 30 40 50
Peak H
eig
ht
(nC
)
Time (min)
W16 N-linked Library
Bi-sialylated Tri-sialylated Tetra-sialylated

168
of denaturing, such as SDS, would cause destruction of glycan structures
(Hermentin, et al., 1992). Therefore, other denaturing methods would be
unsuitable for the purposes of this study as they may produce unreliable results
(Hermentin, et al., 1992). PNGase F was used because the enzyme cleaves
only the bond between the first GlcNAc of the pentasaccharide core and the
Asn residue within the denatured polypeptide backbone (Plummer, et al., 1984).
A further condition of enzymatic release of glycans using PNGase F, is that the
N-linked glycan consensus sequence Asn-X-Ser/Thr is present (Plummer, et al.,
1984). Therefore this ensured release of glycans in their entirety for analysis as
well as guaranteeing every glycan was released. Separation of glycans by
HPAEC-PAD was reliant on the negative charge of the ionised carboxylic acid
group of terminal SA residues. Use of acidic conditions, such as those used to
cleave AGP glycan monosaccharides, would have resulted in the loss of SA
and unreliable results (Szabo, et al., 2012). However, PNGase F preserves SA
residues allowing true ex vivo results to be collected.
HPAEC-PAD chromatograms of oligosaccharides in samples versus the N-
linked library (Figures 6.1 to 6.20) show successful separation of glycans after
PNGase F treatment into bands primarily based on the influence of the negative
charges of SA residues. As discussed in the introduction to this chapter (section
6.1), glycan chains are not only separated by HPAEC due negative charge of
SA residues and size, but by component monosaccharides and the linkages
between them as well (Hardy and Townsend, 1988). To improve peak
resolution during separation, strong alkaline conditions of pH13 were employed
causing formation of oxyanions which enabled isomeric structures to be
recognised. Another possible method of improving peak resolution would have
been to reduce glycan chains prior to HPAEC analysis. However, this may have
caused degradation and epimerisation of any glycans structures with sensitivity
to alkaline conditions used during analysis as well as being more time
consuming (Lee, 1996).
An N-linked library was analysed by HPAEC-PAD as a standard to indicate the
elution time of bi-, tri- and tetra-sialylated glycans (see Figures 6.1 and 6.37).
Sample chromatograms were subsequently compared to the chromatogram
produced by this N-linked library to identify the presence of these glycan types

169
at the corresponding elution time points. As mentioned previously, commercially
sourced AGP was not analysed due to the difference in isolation method and an
inaccurate representation of glycan branching for instance, a lack of tetra-
sialylated glycans (Behan, 2010).
Figure 6.37 Illustration of Possible Glycan Branching in AGP. Diagram
depicts bi-sialylated (2 branches), tri-sialylated (3 branches) and tetra-sialylated (4 branches)
branching of complex oligosaccharides.
6.4.2 Trends in Oligosaccharide Branching Observed in Dataset 1.
Comparisons were drawn from oligosaccharide chromatograms of samples in
all three groups from dataset 1 – BC of unknown type (positive control, n=5),
“normal” healthy individuals (negative control n=5) and individuals suffering
from TNBC (n=18).
Oligosaccharide analysis of samples from “normal” healthy individuals (see
Figure 6.2) revealed a preference for bi- and tri-sialylated glycans (see Figure
6.37) as most peaks were present within the corresponding charge bands, with
Asn
Tri-sialylated
branching
Asn
Bi-sialylated
branching
Asn
Tetra-sialylated
branching
= Mannose = GlcNAc = Galactose = Sialic Acid
= region of branching = pentasaccharide core

170
few peaks detected in the tetra-sialylated time frame. This conformed to
previous published research (Asao, et al., 2013; Behan, 2010; Kimura, et al.,
2006; Maresca, et al., 2012; Smith, et al., 2012) in which it was shown that AGP
generally had less branched glycan structures in healthy volunteers.
Interestingly, a small number of peaks were detected in the region preceding
the bi-sialylated charge band which could indicate the presence of mono-
sialylated bi-antennary glycans. However, previous research suggests that this
is unlikely in AGP from healthy individuals as Gal would become exposed if an
SA residue is missing causing the glycan to be targeted for destruction by
lysosomes or repair by the calnexin/calreticulin cycles (Ware, et al., 1995). The
oligosaccharide profiles generated from “normal” healthy samples correspond
with the data collected through monosaccharide analysis in chapter 5 (see table
5.2) in that GlcNAc and Gal levels were generally low compared to BC of
unknown type and TNBC samples, indicating less branched glycan structures.
BC of unknown type samples (see Figure 6.3) indicated a tendency for more
highly branched structures upon oligosaccharide analysis (see Figure 6.37).
Peaks were mainly present in the tri-sialylated and tetra-sialylated charge band
with only samples H8 and I5 showing any presence of bi-sialylated glycans. H8
and I5 oligosaccharide chromatograms were in agreement with previous
research (Fujii, et al., 1988; Hansen, et al., 1984) which showed an increase in
bi-sialylated glycans during liver and lung cancer, whereas I2, I3 and I8
possessed an oligosaccharide profile resembling branching patterns seen by
Hashimoto, et al., (2004) in breast cancer associated with a poor prognosis as
there was greater expression of tri- and tetra-sialylated structures. Samples I3
and I5 had peaks detected in the region prior to the bi-sialylated charge band
again suggesting the unlikely presence of mono-sialylated glycans. However, I3
showed the presence of Fuc during monosaccharide analysis which can
occasionally mask the negative charge of SA resulting earlier elution of glycans
(Poland, et al., 2001). Therefore, the apparent mono-sialylated glycans could in
fact have been early eluting bi-sialylated glycans. Yet, this would not explain the
peak from sample I5 in the region before the bi-sialylated charge band as no
Fuc was detected during monosaccharide analysis (see Table 5.2).

171
The majority of TNBC samples showed a preference for bi- and tri-sialylated
branching as indicated by peaks in the corresponding region of chromatograms
(see Figure 6.37). Ten TNBC samples showed the presence of tetra-sialylated
branching but often only one peak was detected in this region compared to
several peaks in bi- and tri-sialylated charged bands. Therefore, despite the
presence of tetra-sialylated branching, there was an overall preference for less
AGP glycan branching within TNBC samples contradicting oligosaccharide
profiles seen during previous research into AGP branching in liver, lung and
breast cancer (Fujii, et al., 1988; Hansen, et al., 1984; Smith, et al., 2012). Fujii,
et al., (1988) and Hansen, et al., (1984) observed increased binding of AGP
from patients with liver and lung cancer respectively compared to inflammatory
conditions of these organs since AGP from cancer patients showed less binding
affinity in a Con A column which binds bi-sialylated glycans. Similarly, Smith, et
al., (2012) showed increased branching of AGP through HPAEC-PAD analysis
in patient with breast cancer. However, Hashimoto, et al., (2004) and Asao, et
al., (2013) found that increased AGP glycan branching correlated with breast
cancer progression. Similarly, a link between expression of tri-sialylated glycans
and BC progression was discovered by Hamid, et al., (2008). Therefore, it is
possible that the lack of predominant tetra-sialylated glycan branching in favour
of tri-sialylated branching in TNBC samples could be due to early TNM stage of
tumours, with most tumours in this sample cohort being classed as stage 1 or 2.
Indeed, a shift towards increased branching in the only stage 3 TNBC sample
(MT3352; see Figure 6.17) was observed as this sample had an increased
number of peaks detected in the tri- and tetra-sialylated time frames.
Assessment of oligosaccharide profiles of TNBC samples by age, showed
women <35 had much higher proportions of tri-sialylated branching. The
majority of samples in this group had a low number bi-sialylated glycans present
with these peaks eluting almost at the bi-sialylated time range cut off (see
Figures 6.4 to 6.9). Looking at these results in conjunction with monosaccharide
analysis of these samples showed that high levels of Fuc were detected in
F5412 and MT2621. This may have meant that the late eluting bi-sialylated
glycans were in fact early eluting tri-sialylated glycans as Fuc presence has
been shown to reduce the elution time of oligosaccharide chains (Poland, et al.,
2001). However, this does not explain the late eluting bi-sialylated peak in

172
MT3625 as no Fuc was detected during monosaccharide analysis. This
preference for tri-sialylated branching corresponds with previous research from
Hamid, et al., (2008) who observed an increased presence of tri-sialylated
branching in BC denoted progression. As TNBC in younger women is
notoriously aggressive, shows rapid growth and is associated with high tumour
grades as well as poor prognosis (Blows, et al., 2010; Dent, et al., 2007;
Schnieder, et al., 2008) the detection of increased branching could correlate
with these features and indicate that these women’s tumours are progressing to
a higher TNM stage.
Additionally, the majority of samples had peaks present in the tetra-sialylated
charge band. The detection of tetra-sialylated glycans in the TNBC samples
from young women further indicates that increased glycan branching observed
in these samples could be related to cancer progression as increased branching
corresponds with previous observations by other research groups during cancer
development (Asao, et al., 2013; Cui, et al., 2011; Hashimoto, et al., 2004;
Majid, et al., 2005; Smith, et al., 2012). These studies also highlighted an
association between increased branching and poor prognosis (Hashimoto, et
al., 2004; Majid, et al., 2005; Smith, et al., 2012). Therefore, the increased
branching in TNBC samples from women <35 is consistent with the known poor
prognosis associated with TNBC at a young age (Blows, et al., 2010; Dent, et
al., 2007; Schnieder, et al., 2008).
While the majority of glycans were detected in the tri-sialylated charge band,
CT79 had no bi-sialylated glycans present; instead it showed a tendency for tri-
and tetra-sialylated glycans unlike other samples in this age group. Increased
AGP glycan branching is associated with poorer prognosis in cancer patients
after surgery (Hashimoto, et al., 2004). Data provided by the Alberta Tumour
Bank revealed that participant CT79 had undergone surgery for a stage 1 TNBC
one day prior to blood draw. Therefore, if AGP glycan branching remained
increased post-surgery this may indicate that participant CT79 had a poor
prognosis for TNBC if Hashimoto and colleagues (2004) results and compared
to this sample. In comparison, MT2305 had surgery 15 days before blood draw
yet showed no presence of tetra-sialylated glycans thus may have had a better
prognosis.
173
TNBC samples from participants aged >35-60 (see Figures 6.10 to 6.15)
produced an oligosaccharide profile that contradicted previous studies
investigating AGP glycan branching during cancer (Fujii, et al., 1988; Hansen,
et al., 1984; Smith, et al., 2012) which have shown increased branching during
various cancer types. Five of the six samples in this age bracket favoured bi-
sialylated branching while MT1177 illustrated similar numbers of peaks in the bi-
and tri-sialylated charge bands with one particularly large peak towards the end
of the tri-sialylated elution time. MT1177 had no treatment prior to blood draw
but did have surgery 3 days prior to blood draw, and was TNM stage 2. Again
this increase in branching could indicate a poorer post-surgery prognosis
(Hashimoto, et al., 2004). MT1177’s oligosaccharide profile corresponded with
monosaccharide data collected from the same sample, in that MT1177 had
increased levels of GlcNAc and Gal. Increases in the levels of GlcNAc and Gal
are indicative of increased N-linked glycan branching (Behan, et al., 2013). The
remaining five samples in this age category showed one or more peaks in the
tetra-sialylated charge band, however the majority of peaks were still visible in
the bi-sialylated charge band which does not conform with previous research
findings (Fujii, et al., 1988; Hansen, et al., 1984; Smith, et al., 2012) illustrating
AGP oligosaccharide structures during cancer possess highly branched
glycans. As several studies have linked increased branching with cancer
progression and poor survival (Asao, et al., 2013; Cui, et al., 2011; Hashimoto,
et al., 2004; Majid, et al., 2005; Smith, et al., 2012) the similarity of this TNBC
age group’s oligosaccharide profile to the healthy control group could suggest
better outcomes for these patients with less risk of cancer progression and
metastasis. The oligosaccharide profiles from these samples fit the equivalent
monosaccharide data which shows lower levels of GlcNAc and Gal than
MT1177.
Finally, AGP oligosaccharide profiles analysed from TNBC samples of women
<60 years old, indicated an increase in bi-sialylated glycan expression in line
with the previous age category and contradiction of preceding research. As
previously stated, sample MT3959’s oligosaccharide chromatogram was
discarded as an erroneous result due to erratic and closely eluted peaks being
detected. Unfortunately due to small sample volume repeat oligosaccharide

174
analysis could not be performed. Four of the five remaining samples in this age
category had a peak detected in the tetra-sialylated charge band but overall the
majority of peaks were present in the bi-sialylated charge band. As discussed
for the previous age category (aged >35-60), the preference for bi-sialylated
glycans and resemblance to the healthy control population’s oligosaccharide
profiles could suggest that these patients will have a better outcome given
studies have shown that increased glycan branching is associated with poor
prognosis during various cancers (Asao, et al., 2013; Cui, et al., 2011;
Hashimoto, et al., 2004; Majid, et al., 2005; Smith, et al., 2012). These results
match the monosaccharide data obtained from these samples which had the
lowest GlcNAc and Gal content of the three age categories.
6.4.3 Trends in Oligosaccharide Branching Observed in Dataset 2.
All “normal” healthy control samples showed lower levels of AGP glycans
branching as most peaks were detected in the bi- and tri-sialylated
chromatogram regions (see Figure 6.37). While certain healthy control samples
may have had peaks in the tetra-sialylated chromatogram region, these were
few in number and small in size thus, still giving an overall preference for a
lesser degree of AGP branching in healthy control samples. This matches the
monosaccharide data obtained for these samples which displayed lower levels
of branching associated monosaccharides, GlcNAc and Gal. Additionally no
GalNAc was found in any healthy control samples. This corresponds with
oligosaccharide analysis of “normal” healthy control samples from previous
studies that demonstrated lower levels of glycan branching in healthy samples
(Asao, et al., 2013; Behan, 2010; Kimura, et al., 2006; Maresca, et al., 2012;
Smith, et al., 2012) as well as the glycan branching observed in healthy
samples from dataset 1.
Similar to monosaccharide results obtained from dataset 2, two trends were
apparent upon analysis of oligosaccharides (see Table 6.1).

175
Samples
Trend 1 Trend 2
↑ Oligosaccharide Branching ↓ or ↔ Oligosaccharide Branching
W1 W6
W2 W7
W3 W8
W4 W10
W5 W12
W9 W13
W11 W15
W14
W16
Table 6.1 Oligosaccharide Branching Trends Observed in At-Risk Samples. Entries in the table highlight sample oligosaccharide variation (↔ =
comparable; ↑ = increased; ↓ = decreased levels compared to age-matched healthy controls) pertaining to trend 1 (↑ increased branching compared to age-matched healthy controls) and trend 2 (↓ lower or ↔ similar branching to age-matched healthy controls).
At risk samples W1, W2, W3, W4, W5, W9, W11, W14 and W16 had an
oligosaccharide profile featuring increased branching compared to healthy
control samples (Trend 1 and Figures 6.21, 6.22, 6.23, 6.24. 6.25, 6.29, 6.31,
6.34, 6.36 and 6.37). Comparison with monosaccharide data collected for these
samples previously (see Table 5.3), highlights a link between increased GlcNAc
and Gal content and increased branching of glycan structures. All of these
samples, bar W1 and W11 followed the initial monosaccharide trend identified
in Chapter 5. W1 did not fit either of the monosaccharide trends found as W1
presented with lower GlcNAc, similar Gal to its counterpart control (C1) and no
GalNAc presence which may have accounted for any apparent increase in AGP
glycan branching. Therefore, it is unclear why W1 displays large peaks in the
tetra-sialylated and tri-sialylated charge bands as this data contradicts this
monosaccharide data gathered for this sample. W11 also did not fit the first
monosaccharide profile as it was expected that W11 would reveal a preference
for less highly branched AGP glycans. However, several large peaks in the tri-
sialylated charge band and a number of smaller peaks in the tetra-sialylated
band indicated a predominance of highly branched structures compared to low
numbers of small peaks present in the bi-sialylated charge band. Yet, W11
possessed comparable GalNAc and Gal levels. The unusual presence of
GalNAc in such quantities could explain the appearance of more highly
branched structures as it may be present as part of a terminal glycan structure.

176
Earlier research has linked increases in glycan branching with a number of
unfavourable features in cancer (Asao, et al., 2013; Cui, et al., 2011;
Hashimoto, et al., 2004; Majid, et al., 2005; Smith, et al., 2012). A link between
increased glycan branching of AGP in cancer samples and higher cancer stage
was found by Hashimoto, et al., (2004) and Asao, et al., (2013) using crossed
affinity immunoelectrophoresis and mass spectrometry respectively. Similarly,
increased presence of N-linked β1-6 branching was associated with increased
mortality by Majid, et al., (2005) and Cui, et al., (2011); Smith, et al’s (2012)
research also demonstrated increased glycan branching during BC. Moreover,
studies have shown a relationship between lymph node metastasis and tumour
growth with increased N-linked β1-6 branching (Guo, et al., 2003; Handerson, et
al., 2005; Pinho, et al., 2009; Takahashi, et al., 2009)
Therefore, the results observed in Trend 1 samples are unexpected because at
the time of sample collection these women were considered to be cancer free. It
was expected that no differences in AGP glycan branching between age-
matched healthy controls and at risk women would be identified. However, if
previous literature is considered alongside these results, the increased
branching detected in these samples could indicated that women displaying this
trend are in the early stages of BC development. The results correlate well with
glycan branching results from BC of unknown type and TNBC <35 which also
showed a preference for increased branching which further supports the notion
that samples from women displaying trend 1 (increased branching) may be
developing BC. Additionally, this shift towards increased branching denoting
BC development may be further supported by studies relating increases in N-
linked β1-6 branching with tumour growth and metastasis.
Seven at-risk samples – W6, W7, W8, W10, W12, W13 and W15 – had similar
oligosaccharide profiles to those found in “normal” healthy control samples
(Trend 2 and see Table 6.1 as well as Figures 6.26, 6.27, 6.28, 6.30, 6.32, 6.33
and 6.35). All showed a predominance of bi- and tri-sialylated AGP glycans with
little or no peaks detected in tetra-sialylated charge bands (see Figure 6.37).
Samples W6, W8 and W12 oligosaccharide profiles correlated with the
monosaccharide results collected for these sample whereby lower levels of Gal
were detected compared to their counterpart healthy controls thus suggesting
lower levels of glycan branching. This was particularly true for W8 as very low

177
levels of GlcNAc and Gal levels were present as well as no GalNAc being
detected meaning it was highly likely that low levels of oligosaccharide
branching would be present in the sample. However, W7, W10, W13 and W15
displayed oligosaccharide profiles that contradicted their monosaccharide data
as they all displayed increased levels of GlcNAc and Gal. Thus a lesser degree
of branching was not expected in these samples and it is unclear why this has
occurred. One possible reason may be that lower levels of GalNAc were
present in these samples compared to others fitting this monosaccharide trend
thus less branching occurred in W7, W10, W13 and W15.
The results described for Trend 2 are more in-keeping with results expected
from dataset 2 as a whole. As all participants of this cohort as considered at
increased risk of BC development but as yet to develop the disease it was
predicted that glycan branching of AGP within these samples would resemble
that seen in age-matched healthy controls. Therefore, the AGP glycan
branching following Trend 2 (similar or decreased branching) observed in seven
at risk samples links well with the original hypothesis. Several studies have
shown predominance of bi-sialylated glycans as opposed to more highly
branched tri- and tetra-sialylated glycans (structures in Figure 6.37) in healthy
volunteers (Asao, et al., 2013; Behan, 2010; Kimura, et al., 2006; Maresca, et
al., 2012; Smith, et al., 2012), including healthy controls in dataset 1 of this
study. Therefore, a link between low levels of glycan branching and a disease-
free state has been established by previous literature. In contrast to this,
numerous research groups have shown a correlation between increased glycan
branching and cancer (Asao, et al., 2013; Cui, et al., 2011; Hashimoto, et al.,
2004; Majid, et al., 2005; Smith, et al., 2012), which further suggests that
samples displaying Trend 2 glycan branching in this study are indeed from
participants who have not developed BC despite being at increased risk.
However, Fuc was detected at low levels in all at-risk and healthy control
samples. As explained in section 6.4.2 this could lead to early elution of peaks
during oligosaccharide analysis due to Fuc masking the negative charge of SA
residues (Poland, et al., 2001). Therefore, it may be that Fuc presence was
responsible for peaks appearing prior to the bi-sialylated charge band in certain
samples which were in fact early eluting bi-sialylated glycans as opposed to the
more unlikely presence of mono-sialylated bi-antennary glycans. However, as

178
Fuc was present in all dataset 2 samples analysed this left-ward shift to shorter
retention times may have occurred in all oligosaccharide chromatogram still
enabling variations in branching to be identified.
6.4.4 Profiles of Glycosylation Enzymes.
The results of the current study and of prior research discussed previously in
sections 6.4.2 and 6.4.3 demonstrate aberrant glycan branching as a hallmark
of breast cancer. Given that building and alteration of glycans is controlled
enzymatically, research has been undertaken to demonstrate alterations of
glycosyltransferases and glycosidases that may be deregulated during cancer.
Therefore, the results of this study will now also be discussed briefly in the
context of known alterations in glycan related enzymes.
The results of this study indicate a potential link between BC development and
increased branching which corresponds well with similar results obtain by other
research groups (Asao, et al., 2013; Cui, et al., 2011; Hashimoto, et al., 2004;
Majid, et al., 2005; Smith, et al., 2012).These observed increases in glycan
branching could be due to increased expression of N-
acetylglucosaminetransferase V and α2-3 or α2-6 sialyltransferases.
N-acetylglucosaminetransferase V (GlcNAcT-V) is responsible for N-linked β1-6
branching and increased levels of this enzyme have been reported to be
involved in cancer metastasis and progression (Guo, et al., 2003; Handerson, et
al., 2005; Pinho, et al., 2009; Takahashi, et al., 2009). Lymph node metastasis
of BC has been shown to occur with overexpression of GlcNAcT-V (Handerson,
et al., 2005) and target proteins of GlcNAcT-V (such as integrin and cadherin)
with increased N-linked β1-6 branching appear to play a role in metastasis and
promoting malignant cell growth (Guo, et al., 2003; Pinho, et al., 2009;
Takahashi, et al., 2009). Additionally, research by Granovsky, et al., (2000)
revealed mice without GlcNAcT-V were able to suppress tumour growth and
metastasis. Thus, increased branching of AGP found in the majority of at-risk
samples and TNBC samples <35 could suggest enhancement of tumour growth
and metastatic risk.

179
Moreover, the sialyltransferase family catalyse the addition of terminal sialic
acid to glycan branches and are overexpressed during malignancy and involved
in glycan branching, progression, metastasis and carcinogenesis (Burchell, et
al., 1999; Julien, et al., 2006; Ogawa, et al., 1997; Perez-Garay,et al., 2010;
Petretti, et al., 2000; Picco, et al., 2010; Recchi, et al., 1998). Breast tumour
formation was shown to occur in mice who over expressed α2-3
sialyltransferase I (Picco, et al., 2010) which could indicate increased glycan
branching due to increased addition of terminal sialic acid residues. A study
investigating glycosylation in pancreatic cancer cell lines also established the
involvement of α2-3 sialyltransferase III in tumour progression (Perez-Garay, et
al., 2010). Similarly, Julien, et al., (2006) revealed enhanced breast tumour
formation in the presence of increased α2-6 sialyltransferase III.
Additionally, elevation of sialyltransferase levels have been associated with
poor prognosis in various cancers (Gretschel, et al., 2003; Patani, et al., 2008;
Sato, et al., 2002; Schneider, et al., 2001). For example, increased metastasis
and poor prognosis were linked to increased α2-3 sialyltransferase III and α2-6
sialyltransferase I in gastric cancer (Gretschel., et al., 2003) while elevated
levels of α2-6 sialyltransferase I also correlated with poor prognosis in colorectal
cancer (Schneider, et al., 2001). However, Patani, et al., (2008) revealed
increases in α2-6 sialyltransferase I may infer a better prognosis in BC patients.
Therefore, it may be the mode of terminal sialylation rather than increased
levels of branching that may define prognosis in certain cancers as breast
tumour growth was associated with increased α2-6 sialyltransferase III by
Julien, et al., (2006).
The results of the previous literature further support that increased branching
observed in the majority of at risk samples and TNBC <35 could suggest
development, progression and risk of metastasis. However, details regarding
the mode of terminal sialic acid linkages could provide further prognostic
indications.

180
6.4.5 Benefits and Shortcomings in the Methodology.
Analysis of the extent of branching of AGP oligosaccharides first required the
removal of N-linked glycans which was performed using PNGase F which
cleaves high mannose, complex and hybrid N-linked glycan at the innermost
GlcNAc to remove the oligosaccharide in its entirety (Plummer, et al., 1984).
The successful use of PNGase F for the cleavage of N-linked glycans has been
widely documented to remove all N-linked glycans from the protein backbone
(Plummer, et al., 1984). This is often confirmed by SDS-PAGE to demonstrate
the lower molecular weight of AGP post-glycan removal (Laemmmli, 1970).
However, due to the limited funding for this study, it was not possible to confirm
complete removal of all N-linked glycans from samples in this study.
Additionally, using enzymatic cleavage to remove N-linked glycans avoids the
desialylation observed when harsh chemical methodologies are used (Chan
and Yu, 1991). Unfortunately, this study did not use controls to ensure the
activity of PNGase F which was an oversight of the investigator. PNGase F
minus isolated AGP and HPLC water could have been used alongside dataset 1
and dataset 2 samples as positive and negative controls respectively and
analysed using HPAEC-PAD (Semaan, et al., 2012).
Furthermore, the use of HPAEC-PAD is a highly reliable and sensitive method
for the analysis of oligosaccharide branching (Behan and Smith, 2011; Hardy
and Townsend, 1988; Harazono, et al., 2011; Smith, et al., 2012). Another
benefit of HPAEC-PAD is that samples to not require derivitisation prior to
analysis which would alter their structure in an effort to aid detection (Lee,
1990). However, analysis of oligosaccharide chain branching by HPAEC-PAD is
not quantitative (Smith et al., 2012) unlike analysis by mass spectrometry
(Morelle and Michalski, 2007).
Inadequate sample storage may have affected the oligosaccharide branching of
AGP detected in samples as the samples were purchased prior to the study
commencing and post-translational modifications such as glycosylation may
degrade if stored at -20°C instead of -80°C (Davies, 1968). Similarly, other
studies have shown that post-translational modifications are sensitive to pH and
heat (McCurdy, et al., 2011). As dataset 2 samples were processed

181
immediately and not stored for long periods of time, storage is unlikely to have
affected monosaccharide content in these samples.
6.4.6 Additional Methodologies to Study Branching.
Removal of oligosaccharide chains could have been analysed on an SDS-
PAGE gel pre and post incubation with PNGase F to detect the reduction of
molecular mass that would have indicated successful removal of glycans from
the protein (Laemmmli, 1970). Furthermore, a periodic acid-Schiff stain, could
have been used in conjunction with SDS-PAGE and a nitrocellulose blot to
confirm deglycosylation of AGP pre and post enzymatic digestion (Hart, et al.,
2003).
Techniques to release and O-glycans present within samples could have been
utilised with HPAEC-PAD for identification of O-glycosylation. However, there is
no universal enzyme available to cleave O-linked oligosaccharide as there is for
N-linked glycans using PNGase F (Jensen, et al., 2009). Therefore chemical
removal must be used such as β-elimination or hydrazine treatment prior to
analysis using HPAEC-PAD (Patel, et al., 1993; Xia, et al., 2005).
Additionally, commercially available ELISA’s utilising antibodies against terminal
α2-3 or α2-6 sialylation could have been used support the levels of branching
detect by HPAEC-PAD through measurement of these terminal residues (Shah,
et al., 2008). Increases or decreases of α2-3 or α2-6 sialylation are thought to
relate directly to the degree of branching (Behan, 2010; Picco, et al., 2010;
Smith, et al., 2012).
Finally, use of mass spectrometry has been widely used to measure
oligosaccharide branching in conjunction with separation techniques such as
gas chromatography, HPLC and HPAEC-PAD (Morelle and Michalski, 2007).
However small sample sizes available to this study would preclude using these
techniques which mostly rely on further chemical derivatisation and purification
steps prior to analysis (Morelle and Michalski, 2007).

182
6.5 Summary Statement.
Overall, this chapter achieved its aim to investigate variation in the extent of
branching of oligosaccharide glycan chains of isolated AGP.
In dataset 1, TNBC samples from women aged <35 had increased AGP glycan
branching compared to women with TNBC above this age. Oligosaccharide
profiles of women with TNBC aged >35 resemble those found in other cancer
studies involving AGP and BC of unknown type (positive control) samples
where bi-sialylated branching was shown as dominant. This therefore, highlights
a difference between TNBC in young women compared to older women as well
as BC of unknown type. Furthermore, a difference in branching was revealed
between TNBC and BC of unknown type in comparison to healthy controls
which showed increased glycan branching.
Additionally, results from dataset 2 could imply that lower levels of branching
occurring in “at-risk” samples correlating with “normal” healthy control
oligosaccharide profiles, may indicate that these individuals have no signs of
BC development at present. However, deviation from this oligosaccharide
profile with an increase in AGP glycan branching was shown in 9 of the at-risk
samples and could suggest the beginnings of BC development in light of results
obtained in other studies. Again the healthy control population for dataset 2
showed a preference for lower levels of branching.
Finally, use of PNGase F and HPAEC-PAD to facilitate analysis of AGP
oligosaccharide branching had numerous benefits including, high sensitivity,
ability to release and detect all N-linked glycans. However, the methodology
used for this study could have been improved through the use of improved
sample storage, and potentially, ELISA to support HPAEC-PAD results, SDS-
PAGE and periodic acid-Schiff staining to confirm deglycosylation of proteins by
enzymatic digestion; removal of any O-glycans using β-elimination with analysis
by HPAEC-PAD and quantification of all glycan structures by mass
spectrometry. However, due to issues with funding and low sample volumes,
these additional techniques could not be employed for this study.

183
Chapter 7 – Conclusion and Future Work

184
7.1 Conclusions.
The main aim of this study was to determine whether disease-specific
alterations in the glycosylation pattern of AGP occurred in TNBC and if this
differed from BC of an unknown subtype or healthy individuals (termed Dataset
1) as well as examining any variations in AGP glycosylation patterns in women
at increased risk of BC development for onset of BC compared to age-matched
healthy controls (termed Dataset 2).
Currently, there is no reliable serum biomarker for BC onset and in Scotland
detection of BC is reliant on self-examination and mammography. While
screening of women over 50 using mammography has greatly increased the
detection rate of BC, mammography is not a full proof detection method and
exposes recipients to radiation (Berrington de Gonzalez., 2011). Also with
screening only recommended for women over 50, unless determined at an
increased risk of BC development due to family history, a BRCA1 or 2 mutation
or previous treatment for Hodgkin’s lymphoma, women unaware of their
increased risk may miss out on early detection of BC occurrence. Furthermore,
with recent research unveiling that BC may need to be classified as several
separate diseases in the future dependent on molecular subtype of a tumour
and links between TNBC occurrence at a young age and BRCA1/2 mutation
carriers, investigating a potential serum biomarker for BC is essential.
Particularly because a blood-based BC biomarker may negate the need for
costly mammography screening and its associated radiation exposure as well
as enabling screening to occur more frequently in those at higher risk of BC
development.
The study acquired two sample populations termed dataset 1 and dataset 2.
Dataset 1 sought to fulfil the aim of assessing whether AGP glycosylation
patterns differed between TNBC, BC of an unknown subtype and “normal”
healthy controls. Dataset 2 collected samples from women at increased risk of
BC in comparison to age-matched healthy controls to assess any changes to
AGP glycosylation which may have indicated BC development. Both datasets
were subjected to the same laboratory methods for isolation and analysis of
AGP which have been shown to preserve the in vivo state of AGP thus
providing a true depiction of AGP glycosylation within the body. AGP isolation

185
was conducted using low pressure affinity chromatography and the isolated
levels calculated using spectrophotometry. AGP glycans were then separated
from the polypeptide backbone using acid hydrolysis (monosaccharide analysis)
or enzyme digestion (oligosaccharide analysis) and analysis was performed
using HPAEC-PAD.
Differences in AGP levels were found between various sample groups during
this study. As expected, in dataset 1, levels of AGP in BC of an unknown
subtype were greatly increased above the healthy population. However, TNBC
samples had increased AGP levels above the healthy population yet levels
were far lower than the BC of an unknown subtype. Thus highlighting an
alteration in AGP between the TNBC and BC of an unknown type populations,
providing further evidence of the differences between BC subtypes. Dataset 2
also produced unexpected results when examining AGP levels because despite
both populations technically being considered healthy, isolated AGP levels were
significantly raised in the at-risk population compared healthy controls. Two
particular at-risk samples (W10 and W12) had levels more than double that of
their controls which may have indicated BC development.
Variation of AGP concentration observed in this study could have been due to
increases in F1*S and A variant forms of AGP. These variants are known to
exist in a 3:1 ratio in healthy individuals (Dente et al., 1987) and alterations
have been shown to have increased expression of F1*S and A variants in
breast, ovarian and lung cancer, however the overall ratio tends to remain the
same (Duche et al., 1998 and Duche et al., 2000). However, the study by Budai,
et al., (2009) showed a change in F1*S to A variant ratios of up to 8:1 in
lymphoma, melanoma and ovarian cancer but these differences were not
dependent on cancer type. Additionally, an early study by Treuheit, et al.,
(1992) revealed that AGP variants had differing preferences for bi-, tri- and
tetra-sialylated glycans at each glycosylation site. Yet, there is little evidence of
these preferences differing during disease. Thus analysis of AGP variants
would be of little use as a potential biomarker specific for breast cancer.
Analysis of AGP glycan monosaccharide content highlighted quantitative
differences between samples groups in both datasets. In dataset 1, healthy
samples had relatively low levels of all monosaccharides whereas BC of an
unknown type possessed far higher levels of Gal. Most unusually, as AGP

186
solely expresses complex N-linked glycans, GalNAc was present in over 88% of
TNBC samples. GalNAc is a component of O-glycans and previous literature
investigating other proteins has shown a reversion to foetal glycosylation during
cancer. Foetal AGP expresses O-linked glycans (Shiyan and Bovin, 1997) and
there is a known link between TNBC and O-glycosylation of other proteins
(Milde-Langosch, et al., 2014; Siroy, et al., 2013). Thus GalNAc presence could
indicated O-glycosylation of AGP and could be a marker of TNBC as GalNAc
was not present in the healthy control or BC of unknown type populations.
TNBC samples were divided into several categories for comparison with one
another as well as controls. When categorised by age (<35, 35-60 and >60) a
similar trend was displayed throughout each group with Gal showing highest
levels, followed by GlcNAc, then GalNAc and then Fuc. Interestingly with
GalNAc presence was inversely correlated with age and TNBC in women >60
had lower levels of Gal compared to the other two age categories. Similar
monosaccharide levels were detected in TNBC samples when comparing family
history to no family history or unknown family history. However, the no family
history group had lower levels of GalNAc compared to those with family history
and those with unknown family history. Little difference was seen in
monosaccharides between treated and untreated TNBC indicating that
treatment may not be working as previous research within this group has shown
AGP glycosylation patterns returning to normal upon treatment. This would fit
with TNBC’s notoriously aggressive nature. Separation by stage of TNBC also
revealed few differences between stage 1 and stage 2 TNBC other than
marginally lower levels of GalNAc and Gal in stage 2. Therefore, as with AGP
levels, alterations in AGP monosaccharide content are present not only
between healthy and BC populations but between TNBC and both controls as
well.
Mean levels of monosaccharides in at-risk samples and healthy control samples
in dataset 2 showed similar levels of Fuc and Gal. However GlcNAc was
significantly elevated in the at-risk population and GalNAc was detected in 81%
of at-risk samples but none was present in the healthy population. Two trends
emerge upon analysis of each at-risk samples with their age-matched healthy
control with most samples fitting one or the other. The first trend identified was
at-risk samples possessing comparable Fuc levels to their control but having
187
GlcNAc and Gal levels above that of the control. The second trend found was
at-risk samples containing similar Fuc levels to their control and increased
GlcNAc levels but having lower Gal levels than their control. Only one sample
did not fit either of these trends (W1). Therefore, it would appear that a
difference in AGP monosaccharide content lies between women at risk of
increased BC development and healthy controls despite both technically being
healthy. Furthermore, GalNAc presence in the at-risk population indicates that it
is not disease specific as it is unlikely that all at-risk samples analysed were in
the early stages of BC development.
Oligosaccharide analysis demonstrated structural differences in AGP from the
various sample populations studied. In dataset 1 there was a shift from bi- and
tri-sialylated glycans in healthy samples to tri- and tetra-sialylated glycans in BC
of unknown type samples which contradicted previous research from this group
who had found truncation of AGP glycan branches in BC samples. However,
when examining oligosaccharide profiles from TNBC samples from women
aged 35-60 and >60 showed a preference for bi-sialylated branching in line with
previous studies. Yet, AGP from women with TNBC <35 possessed more highly
branched glycans, similar to BC of unknown type. Therefore indicating a
difference between TNBC at a young age and TNBC in older women.
Oligosaccharide analysis of dataset 2 highlighted a division of oligosaccharide
profiles in the at-risk group. Healthy control samples in dataset 2 showed a
similar oligosaccharide profile to those from dataset 1 where bi-sialylated and
tri-sialylated glycans were predominant. Seven of the at-risk samples showed
glycan profiles with similar low levels of branching to the healthy controls.
However, nine samples featured oligosaccharide profiles with increased
branching through preference for tri- and tetra-sialylated glycans compared to
the healthy controls. With samples featuring in either trend, the majority fitted
well with the corresponding monosaccharide collected for each sample for
instance an increase in GlcNAc or Gal was matched with an increase in
branching and vice versa. Thus, these differences in glycan branching may
further indicate the early development of BC in the at-risk samples that have
glycan profiles similar to those of the TNBC <35 and BC of unknown type
samples from dataset 1.

188
Additionally, concentration determination, monosaccharide and oligosaccharide
analysis of healthy populations in both datasets unveiled base-line variability
within the group. This could be attributed to inter-individual variation as AGP
glycan content and concentration are known to change during inflammation
(Higai, et al., 2005) as well as healthy volunteers being unaware of or untruthful
about possessing inflammatory conditions that may have affected AGP glycan
content and concentration.
Thus far no other research groups have examined AGP glycosylation in TNBC
or performed a case-control style study to investigate AGP glycosylation using
individuals confirmed to be at increased risk of BC development. Earlier studies
have shown AGP concentration to increase dramatically during cancer and
inflammation while remaining low in healthy populations (Rudman, et al., 1974;
Duche, et al., 2000; Routledge, 1989; Twining and Brecher, 1977). The current
study also revealed this pattern in BC of unknown type and healthy samples,
yet TNBC samples showed a minimal increase compared to healthy samples
and also showed lower concentrations of AGP compared to BC of unknown
type. Hence AGP concentrations during TNBC appear to contradict previous
research. Previous studies have also established that adult AGP expresses 5
complex N-linked glycans (Yoshima, et al., 1981) while foetal AGP displays 3 N-
linked glycans and 3 O-linked glycans with the O-glycans being lost during
development (Shiyan and Bovin., 1997) However results obtained in this study
are suggestive of AGP expressing O-glycans in adults during TNBC and
possible BC development in women at risk of BC development. This reversion
to O-glycosylation could be due to expression of foetal antigens which has been
shown to occur on other proteins during cancer (Farinati, et al., 2006 and Amri,
et al., 2013) and may be caused by rapid cell proliferation (Sapra, et al., 2012;
Farinati, et al., 2006). The results of this study support previous research linking
increased glycan branching with cancer development and progression (Asao, et
al., 2013; Cui, et al., 2011; Hashimoto, et al., 2004; Majid, et al., 2005) as TNBC
samples <35 and at risk samples showed a higher degree of branching
compared to other samples in this study. However, TNBC from women >35 had
lower levels of branching detected which aligns with research by Fujii, et al.,
(1988), Hansen, et al., (1984) and Smith, et al., (2012) investigating AGP

189
glycosylation during cancer. Therefore, the current study clearly contributes new
knowledge and builds upon existing information regarding AGP.
The alterations of AGP glycosylation observed in this study may be linked to
several key hallmarks of cancer such as sustaining proliferative signalling;
evading growth suppressors; activating invasion and metastasis; enabling
replicative immortality; inducing angiogenesis; resisting cell death (Hanahan
and Weinberg, 2000); avoiding immune destruction; genome instability and
mutation; tumour-promoting inflammation and deregulating cellular energetics
such as the Warburg effect (Hanahan and Weinberg, 2011; Warburg, et al.,
1928). Aberrant glycosylation of proteins such as sialylation, fucosylation,
truncated O-glycans, increased branching (Stowell, et al., 2015) and expression
of oncofoetal antigens (Sapra, et al., 2012) may aid cancer progression and
metastasis (Chen, et al., 2013; Julien, et al., 2011; Guo,et al., 2003; Handerson,
et al., 2005; Pinho, et al., 2009; Takahashi, et al., 2009). Presence of Fuc in
samples may enhance cell proliferation as shown by Chen, et al., (2013) who
observed increased levels of FUT 8. Similarly, Fuc could be present as a
component of SLex which has a role in cell adhesion thus its expression could
be aiding the binding of cancer cells to secondary organs and facilitating
metastasis (Julien, et al., 2011).Thus, Fuc content of AGP could play a role in
metastasis and malignant cell proliferation in BC. Furthermore, increased
GlcNAc and Gal could be linked to increases in glycan branching (Behan, et al.,
2013), specifically N-linked β1-6 branching which has be shown to rise in
cancer (Stowell, et al., 2015). Increases in glycan branching have been shown
to contribute to lymph node metastasis and tumour growth (Guo, et al., 2003;
Handerson, et al., 2005; Pinho, et al., 2009; Takahashi, et al., 2009). Therefore
the increased branching of AGP and corresponding increase in GlcNAc and Gal
observed in TNBC samples <35 and several at risk samples could indicate that
AGP is potentially contributing to BC development and metastasis. Additionally,
the unexpected detection of GalNAc in samples of isolated AGP in this study
could indicate two further hallmarks of cancer – truncated O-glycans and
regression to expressing foetal antigens (Stowell, et al., 2015). But, clearly more
work is necessary beyond the scope of the present study. GalNAc is a
constituent of O-glycans and not present in N-linked glycans (Varki, et al.,
2009). Thus as AGP has been shown to only express complex type N-linked

190
glycans, GalNAc presence suggests O-glycosylation of AGP. As mentioned
previously, AGP does express O-linked glycans during foetal development but
not in adult AGP (Shiyan and Bovin, 1997), suggesting that AGP in some
samples from this study may have reverted back to glycan expression observed
in foetuses. Expression of O-linked glycans during cancer is associated with
enhancement of the malignant properties of cells such as increased
proliferation, invasion of surrounding tissues and metastasis (Radhakrishnan, et
al., 2014). Thus, if AGP is displaying O-linked glycosylation during BC, AGP
could be functioning to promote BC development, progression and metastasis.
Expression of GalNAc, potentially from O-linked glycans, may be due to
Warburg effect which causes increased uptake and anaerobic metabolism of
glucose by cancer cells for energy to enhance proliferation (Warburg, et al.,
1928). Increased O-GlcNAc transferase which catalyses the addition of N-
acetylglucosamine to proteins and lipids has been linked to the Warburg effect
(Jozwiak, et al., 2014) and it has been hypothesised that O-GlcNAcylation acts
as a nutrient sensor (Butkinaree, et al., 2010; Hanover, et al., 2010) resulting in
enhanced proliferation, growth, angiogenesis and metastasis (Khan, et al.,
2013; Porta, et al., 2014).
In summary, this study has fulfilled its aims of investigating variations in AGP
glycosylation in TNBC and women at increased risk of BC development in the
hope of identifying disease specific changes that could be utilised as a
diagnostic biomarker. The data collected indicates that AGP glycosylation in
TNBC varies compared to healthy controls and BC of unknown type mainly due
to the unusual presence of GalNAc. Furthermore, differences in AGP
glycosylation within an at-risk population that are similar to that of TNBC<35
and BC of unknown type samples could indicate early BC development. The
results of this study suggest that increased levels of GlcNAc and Gal correlating
to increased glycan branching could indicate BC development. However,
decreased GlcNAc and Gal in combination with decreased glycan branching
implies individuals are disease free. Based on the results, it would appear that
AGP glycosylation is a good biomarker of BC as examination of glycan content
and branching allowed the investigator to differentiate between healthy, BC of
unknown type and TNBC in dataset 1 as well as suggesting BC development of
a number of at-risk samples in dataset 2.

191
7.2 Future Work.
The study presented within has provided evidence of AGP’s potential as a
biomarker of BC in at risk individuals. However, the study was limited by the
type of samples that could be acquired for analysis as well as the sample size
that was feasible for the author to process and analyse. Yet the current study
has provided useful preliminary data that could lead on to subsequent research
to confirm the results and expand on this study’s findings. The following are
suggestions that could improve investigation into AGP’s potential as a BC
biomarker in at risk individuals.
Firstly, repetition of the method used in this study with larger sample cohorts to
assess whether the current study’s findings are supported. While the sample
sizes used in the current study were suitable for this preliminary investigation, a
secondary study using more participants could enhance the reliability of the
data.
Repetition of this study using only untreated samples would allow glycosylation
patterns that were uninfluenced by treatment to be obtained. Thus the accuracy
of the monosaccharide and oligosaccharide data would be improved as
changes detected in glycosylation would be a true reflection of those at the
beginning of BC development.
Recruitment of women at increased risk of BC development who have
developed BC to draw direct comparisons between women at risk without BC
and a healthy population. Therefore, it would be possible to assess whether
glycosylation patterns observed in at risk samples that differed from age-
matched healthy controls did indicate BC.
Conducting a study running over several years, following women at risk of BC
and analysing their AGP glycosylation at various points to detect onset of BC if
it occurs. Performing a study in this manner would allow monitoring of
glycosylation patterns in at risk individuals, with the potential to have BC
confirmed by a conventional method, such as mammography, assess aberrant
AGP glycosylation as a biomarker of BC.
Moreover, analysis of AGP glycosylation in other cancer types could be utilised
in a future study. This would enable comparison of AGP glycosylation patterns
192
in different cancer types to determine whether BC can be distinguished from
other cancer types.
Furthermore, additional methods could have been employed to complement
and enhance the validity of results in this study, outlined in part in sections
4.5.3, 5.5.4, 6.4.6.
Investigation of AGP concentration in the various sample populations employed
in this study could have been improved by assessing the efficiency of the low
pressure chromatography columns used known concentrations of AGP to spike
plasma samples to measure AGP recovery. Removal of unwanted plasma
proteins using low pressure chromatography to purify AGP could have been
evidence by SDS-PAGE of all fractions after application to each low pressure
chromatography column. Western Blotting of SDS-PAGE gels using AGP
specific antibodies could have confirmed purification of AGP (Behan, 2010) and
a Bradford assay (Bradford, 1976) or an antihuman AGP ELISA would have
enabled measurement of protein concentration (Hashimoto, 2004; McCurdy et
al., 2011). Use of these techniques could have complemented the determination
of AGP concentrations solely on absorbance methods.
Again, SDS-PAGE could have been utilised to prove deglycosylation of AGP by
acid hydrolysis and PNGase F through a reduction in molecular weight while
incorporation of a periodic acid-Schiff stain for glycosylation with a nitrocellulose
blot could have also been used to assess deglycosylation of AGP; although
acid-mediated chemical hydrolysis is generally accepted as a quantitative
process. Moreover, analysis of monosaccharide and oligosaccharide content
using ELISA’s (to measure Fuc and SA) and mass spectrometry could have
supported the HPAEC-PAD results. Lastly, possible O-linked glycosylation of
AGP would have been possible if β-elimination or hydrazine treatment had been
employed to release O-glycans to allow their analysis by HPAEC-PAD.
Additionally due to limited funding and sample volume it was not possible to use
the techniques listed above to confirm the findings of the current study.
Unfortunately, it was not possible to recruit women at increased risk of BC who
had developed BC for this study. This is because once women have BC
detected at the screening clinic, they are moved to a different department for

193
treatment and contact between the patient and the screening clinic is lost. No
follow-up is carried out.
This study found alterations to AGP glycosylation in TNBC samples and
samples from women at increased risk of BC development that could identify
early BC development. While this data is preliminary, follow up studies carried
out using the recommendations listed above could aid the development of a
blood-based biomarker for diagnosis of BC which could revolutionise the
screening of women for BC.

194
References
195
Abbott, K. L., Aoki, K., Lim, J.-M., Porterfield, M., Johnson, R., O’Regan, R. M.,
Wells, L., Tiemeyer, M. & Pierce, M. (2008). Targeted Glycoproteomic
Identification of Biomarkers for Human Breast Carcinoma. Journal of
Proteome Research, 7(4), 1470-1480.
Albani, J. (1997). Binding effect of progesterone on the dynamics of α1-acid
glycoprotein. Biochimica et Biophysica Acta, 1336(2), 349-359.
Albani, J. R. & Plancke, Y. D. (1998). Interaction between calcofluor white and
carbohydrates of α1-acid glycoprotein. Carbohydrate research, 314(3–4),
169-175.
Albani, J. R., Sillen, A., Plancke, Y. D., Coddeville, B. & Engelborghs, Y. (2000).
Interaction between carbohydrate residues of α1-acid glycoprotein
(orosomucoid) and saturating concentrations of Calcofluor White. A
fluorescence study. Carbohydrate Research, 327(3), 333-340.
Alley Jr, W.R. & Novotny, M.V. (2010). Glycomic analysis of Sialic Acid
Linkages in Glycans Derived from Blood Serum Glycoproteins. Journal of
Proteome Research, 9(6), 3062-3072.
Amri, R., Bordeianou, L.G., Sylla, P. & Berger, D.L. (2013). Preoperative
carcinoembryonic antigen as an outcome predictor in colon cancer.
Journal of Surgical Oncology, 108, 14-18.
Anders, C. K., Hsu, D. S., Broadwater, G., Acharya, C. R., Foekens, J. A.,
Zhang, Y., Wang, Y., Marcom, P. K., Marks, J. R., Febbo, P. G., Nevins,
J. R., Potti, A. & Blackwell, K. L. (2008). Young Age at Diagnosis
Correlates With Worse Prognosis and Defines a Subset of Breast
Cancers With Shared Patterns of Gene Expression. Journal of Clinical
Oncology, 26(20), 3324-3330.
Anders, C. K., Johnson, R., Litton, J., Phillips, M. & Bleyer, A. (2009). Breast
cancer before age 40 years. Seminars in Oncology, 36(3), 237-249.
Anderson, N., Pollacchi, A., Hayes, P., Therapondos, G., Newsome, P., Boyter,
A. & Smith, K. (2002). A preliminary evaluation of the differences in the

196
glycosylation of alpha-1-acid glycoprotein between individual liver
diseases. Biomedical Chromatography, 16(6), 365-372.
Anderson, N. L. (2005). The Roles of Multiple Proteomic Platforms in a Pipeline
for New Diagnostics. Molecular & Cellular Proteomics, 4(10), 1441-1444.
Antoniou, A., Pharoah, P. D., Narod, S., Risch, H. A., Eyfjord, J. E., Hopper, J.
L., Loman, N., Olsson, H., Johannsson, O., Borg, A., Pasini, B., Radice,
P., Manoukian, S., Eccles, D. M., et al. (2003). Average risks of breast
and ovarian cancer associated with BRCA1 or BRCA2 mutations
detected in case Series unselected for family history: a combined
analysis of 22 studies. American Journal of Human Genetics, 72(5),
1117-1130.
Armes, J. E., Trute, L., White, D., Southey, M. C., Hammet, F., Tesoriero, A.,
Hutchins, A. M., Dite, G. S., McCredie, M. R., Giles, G. G., Hopper, J. L.
& Venter, D. J. (1999). Distinct molecular pathogeneses of early-onset
breast cancers in BRCA1 and BRCA2 mutation carriers: a population-
based study. Cancer Research, 59(8), 2011-2017.
Asao, T., Yazawa, S., Nishimura, T., Hayashi, T., Shimaoka, H., Saniabadi, A.
R. & Kuwano, H. (2013). Development of a Novel System for Mass
Spectrometric Analysis of Cancer-Associated Fucosylation in Plasma
alpha-1-Acid Glycoprotein. BioMed Research International, 2013, 9.
Athamna, A., Kramer, M. R. & Kahane, I. (1996). Adherence of Mycoplasma
pneumoniae to human alveolar macrophages. FEMS Immunology &
Medical Microbiology, 15(2‐3), 135-141.
Atkinson, A. J., Colburn, W. A., DeGruttola, V. G., DeMets, D. L., Downing, G.
J., Hoth, D. F., Oates, J. A., Peck, C. C., Schooley, R. T., Spilker, B. A.,
Woodcock, J. & Zeger, S. L. (2001). Biomarkers and surrogate endpoints:
Preferred definitions and conceptual framework*. Clinical Pharmacology
& Therapeutics, 69(3), 89-95.
Badve, S., Dabbs, D. J., Schnitt, S. J., Baehner, F. L., Decker, T., Eusebi, V.,
Fox, S. B., Ichihara, S., Jacquemier, J., Lakhani, S. R., Palacios, J.,
Rakha, E. A., Richardson, A. L., Schmitt, F. C., et al. (2011). Basal-like
197
and triple-negative breast cancers: a critical review with an emphasis on
the implications for pathologists and oncologists. Modern Pathology,
24(2), 157-167.
Bauer, K. R., Brown, M., Cress, R. D., Parise, C. A. & Caggiano, V. (2007).
Descriptive analysis of estrogen receptor (ER)-negative, progesterone
receptor (PR)-negative, and HER2-negative invasive breast cancer, the
so-called triple-negative phenotype: a population-based study from the
California cancer Registry. Cancer, 109(9), 1721-1728.
Bause, E. (1983). Structural requirements of N-glycosylation of proteins.
Studies with proline peptides as conformational probes. Biochemical
Journal, 209(2), 331.
Behan, J. (2010). The Binding Ability of Alpha-1-acid Glycoprotein as a
Mechanism of Resistance to Methadone., Edinburgh Napier University.
Behan, J. L., Cruickshank, Y. E., Matthews-Smith, G., Bruce, M. & Smith, K. D.
(2013). The Glycosylation of AGP and Its Associations with the Binding to
Methadone. BioMed Research International, 2013, 7.
Behan, J. L. & Smith, K. D. (2011). The analysis of glycosylation: a continued
need for high pH anion exchange chromatography. Biomedical
Chromatography, 25(1-2), 39-46.
Bennett, M. & Schmid, K. (1980). Immunosuppression by human plasma alpha
1-acid glycoprotein: importance of the carbohydrate moiety. Proceedings
of the National Academy of Sciences, 77(10), 6109-6113.
Beral, V. (2003). Breast cancer and hormone-replacement therapy in the Million
Women Study. The Lancet, 362(9382), 419-427.
Berrington de González, A. (2011). Estimates of the potential risk of radiation-
related cancer from screening in the UK. Journal of Medical Screening,
18(4), 163-164.
Bertozzi, C. R. & Rabuka, D. (2009). Structural basis of glycan diversity. In
Essentials of Glycobiology (pp. 23-36). Cold Spring Harbor, New York:
Cold Spring Harbor Laboratory Press.

198
Beute, B. J., Kalisher, L. & Hutter, R. V. (1991). Lobular carcinoma in situ of the
breast: clinical, pathologic, and mammographic features. American
Journal of Roentgenology, 157(2), 257-265.
Bevier, M., Sundquist, K. & Hemminki, K. (2012). Risk of breast cancer in
families of multiple affected women and men. Breast Cancer Research
and Treatment, 132(2), 723-728.
Blain, P. G., Mucklow, J. C., Rawlins, M. D., Roberts, D. F., Routledge, P. A. &
Shand, D. G. (1985). Determinants of plasma alpha 1-acid glycoprotein
(AAG) concentrations in health. British Journal of Clinical Pharmacology,
20(5), 500-502.
Block, T. M., Comunale, M. A., Lowman, M., Steel, L. F., Romano, P. R.,
Fimmel, C., Tennant, B. C., London, W. T., Evans, A. A., Blumberg, B. S.,
Dwek, R. A., Mattu, T. S. & Mehta, A. S. (2005). Use of targeted
glycoproteomics to identify serum glycoproteins that correlate with liver
cancer in woodchucks and humans. Proceedings of the National
Academy of Sciences of the United States of America, 102(3), 779-784.
Blows, F. M., Driver, K. E., Schmidt, M. K., Broeks, A., van Leeuwen, F. E.,
Wesseling, J., Cheang, M. C., Gelmon, K., Nielsen, T. O., Blomqvist, C.,
Heikkilä, P., Heikkinen, T., Nevanlinna, H., Akslen, L. A., et al. (2010).
Subtyping of Breast Cancer by Immunohistochemistry to Investigate a
Relationship between Subtype and Short and Long Term Survival: A
Collaborative Analysis of Data for 10,159 Cases from 12 Studies. Public
Library of Science Medicine, 7(5), e1000279.
Bobowski, M., Cazet, A., Steenackers, A. & Delannoy, P. (2012). Role of
complex gangliosides in cancer progression. Carbohydrate Chemistry:
chemical and biological approaches, volume 37. RSC Publishing
Cambridge, 1-20.
Boutten, A., Dehoux, M., Deschenes, M., Rouzeau, J. D., Bories, P. N. &
Durand, G. (1992). α1-Acid Glycoprotein Potentiates Lipopolysaccharide-
Induced Secretion of Interleukin-1β, Interleukin-6 and Tumor Necrosis

199
Factor-α by Human Monocytes and Alveolar and Peritoneal
Macrophages. European Journal of Immunology, 22(10), 2687-2695.
Bradford, M.M. (1976). A rapid and sensitive method for the quantitation of
microgram quantities of protein utilizing the principle of protein binding.
Analytical Biochemistry, 72, 248-254.
Budai, L., Ozohanics, O., Ludányi, K., Drahos, L., Kremmer, T., Krenyacz, J. &
Vékey, K. (2009). Investigation of genetic variants of α-1 acid
glycoprotein by ultra-performance liquid chromatography–mass
spectrometry. Analytical and Bioanalytical Chemistry, 393(3), 991-998.
Bull, C., den Brok, M.H. & Adema, G.J.(2014). Sweet escape: Sialic acids in
tumour immune evasion. Biochimica Biophysica Acta, 1846, 238-246.
Burchell, J., Poulsom, R., Hanby, A., Whitehouse, C., Cooper, L., Clausen, H.,
Miles, D. & Taylor-Papadimitriou, J. (1999). An alpha2,3 sialyltransferase
(ST3Gal I) is elevated in primary breast carcinomas. Glycobiology, 9(12),
1307-1311.
Burchell, J. M., Mungul, A. & Taylor-Papadimitriou, J. (2001). O-Linked
Glycosylation in the Mammary Gland: Changes that Occur During
Malignancy. Journal of Mammary Gland Biology and Neoplasia, 6(3),
355-364.
Butkinaree, C., Park, K. & Hart, G.W. (2010). O-linked β-N-acetylglucosamine
(O-GlcNAc): extensive crosstalk with phosphorylation to regulate
signaling and transcription in response to nutrients and stress. Biochimica
Biophysica Acta, 1800, 96-106.
Campeau, P., Foulkes, W. & Tischkowitz, M. (2008). Hereditary breast cancer:
new genetic developments, new therapeutic avenues. Human Genetics,
124(1), 31-42.
Cataldi, T. R., Campa, C. & De Benedetto, G. E. (2000). Carbohydrate analysis
by high-performance anion-exchange chromatography with pulsed
amperometric detection: the potential is still growing. Fresenius Journal of
Analytical Chemistry, 368(8), 739-758.

200
Ceciliani, F. & Pocacqua, V. (2007). The Acute Phase Protein α1-Acid
Glycoprotein: A Model for Altered Glycosylation During Diseases. Current
Protein and Peptide Science, 8(1), 91-108.
Chacon, R. D. & Costanzo, M. V. (2010). Triple-negative breast cancer. Breast
Cancer Res, 12 (Supplement 2), S3.
Chan, J. & Yu, D. (1991). One-step isolation of α1-Acid glycoprotein. Protein
Expression and Purification, 2(1), 34-36.
Chandrasekaran, E. V., Davila, M., Nixon, D. & Mendicino, J. (1984). Structures
of the Oligosaccharide Chains of Two Forms of α1-Acid Glycoprotein
Purified from Liver Metastases of Lung, Colon, and Breast Tumors.
Cancer Research, 44(4), 1557-1567.
Charlwood, P.A., Hatton, M.W.C. & Regoeczi, E. (1976). On the
physicochemical and chemical properties of alpha-1-acid glycoproteins
from mammalian and avian plasmas. Biochimica et Biophysica Acta -
Protein Structure, 453(1), 81-92.
Chatterjee, M. & Harris, A. L. (1990). Reversal of acquired resistance to
adriamycin in CHO cells by tamoxifen and 4-hydroxy tamoxifen: role of
drug interaction with alpha 1 acid glycoprotein. British Journal of Cancer,
62(5), 712.
Checka, C. M., Chun, J. E., Schnabel, F. R., Lee, J. & Toth, H. (2012). The
Relationship of Mammographic Density and Age: Implications for Breast
Cancer Screening. American Journal of Roentgenology, 198(3), W292-
W295.
Chen, S., Zheng, T., Shortreed, M.R., Alexanderm C. & Smith, L.M. (2007).
Analysis of cell surface carbohydrate expression paterns in normal and
tumourgenic human breast cell lines using lectin arrays. Analytical
Chemistry, 79, 5698-5702.
Cheung, K. L., Graves, C. R. L. & Robertson, J. F. R. (2000). Tumour marker
measurements in the diagnosis and monitoring of breast cancer. Cancer
Treatment Reviews, 26(2), 91-102.

201
Chiu, K. M., Mortensen, R. F., Osmand, A. P. & Gewurz, H. (1977). Interactions
of alpha1-acid glycoprotein with the immune system. I. Purification and
effects upon lymphocyte responsiveness. Immunology, 32(6), 997.
Christiansen, M.N., Chik, J., Lee, L., Anugraham, M., Abrahams, J.L. & Packer,
N.H. (2014). Cell surface protein glycosylation in cancer. Proteomics,
14(4-5), 525-546.
Collaborative Group on Hormonal Factors in Breast Cancer. (2001). Familial
breast cancer: collaborative reanalysis of individual data from 52
epidemiological studies including 58 209 women with breast cancer and
101 986 women without the disease. The Lancet, 358(9291), 1389-
1399.
Collins, L. C., Marotti, J. D., Gelber, S., Cole, K., Ruddy, K., Kereakoglow, S.,
Brachtel, E. F., Schapira, L., Come, S. E., Winer, E. P. & Partridge, A. H.
(2012). Pathologic features and molecular phenotype by patient age in a
large cohort of young women with breast cancer. Breast Cancer
Research and Treatment, 131(3), 1061-1066.
Colombo, S., Buclin, T., Decosterd, L. A., Telenti, A., Furrer, H., Lee, B. L.,
Biollaz, J. & Eap, C. B. (2006). Orosomucoid (alpha1-acid glycoprotein)
plasma concentration and genetic variants: effects on human
immunodeficiency virus protease inhibitor clearance and cellular
accumulation. Clinical Pharmacology & Therapeutics, 80(4), 307-318.
Coombs, P. J., Taylor, M. E. & Drickamer, K. (2006). Two categories of
mammalian galactose-binding receptors distinguished by glycan array
profiling. Glycobiology, 16(8), 1C-7C.
Coopey, S., Mazzola, E., Buckley, J., Sharko, J., Belli, A., Kim, E. H.,
Polubriaginof, F., Parmigiani, G., Garber, J., Smith, B., Gadd, M., Specht,
M., Guidi, A., Roche, C., et al. (2012). The role of chemoprevention in
modifying the risk of breast cancer in women with atypical breast lesions.
Breast Cancer Research and Treatment, 136(3), 627-633.
Corradini, C., Cavazza, A. & Bignardi, C. (2012). High-performance anion-
exchange chromatography coupled with pulsed electrochemical detection

202
as a powerful tool to evaluate carbohydrates of food interest: Principles
and applications. International Journal of Carbohydrate Chemistry, 2012.
Correa Geyer, F. & Reis-Filho, J. S. (2009). Microarray-based Gene Expression
Profiling as a Clinical Tool for Breast Cancer Management: Are We There
Yet? International Journal of Surgical Pathology, 17(4), 285-302.
Couldrey, C. & Green, J. E. (2000). Metastases: the glycan connection. Breast
Cancer Research, 2(5), 321-323.
Croce, M., Sálice, V., Lacunza, E. & Segal-Eiras, A. (2005). α1-acid glycoprotein
(AGP): a possible carrier of sialyl lewis X (slewis X) antigen in colorectal
carcinoma. Histology and Histopathology, 20(1), 91-97.
Cui, H., Lin, Y., Yue, L., Zhao, X., Liu, J. (2011). Differential expression of the
alpha2,3-sialic acid residues in breast cancer is associated with
metastatic potential. Oncology Reports, 25, 1365-1371.
Curtis, C., Shah, S. P., Chin, S.-F., Turashvili, G., Rueda, O. M., Dunning, M. J.,
Speed, D., Lynch, A. G., Samarajiwa, S., Yuan, Y., Graf, S., Ha, G.,
Haffari, G., Bashashati, A., et al. (2012). The genomic and transcriptomic
architecture of 2,000 breast tumours reveals novel subgroups. Nature,
486(7403), 346-352.
Daemen, M. A. R. C., Heemskerk, V. H., van’t Veer, C., Denecker, G., Wolfs, T.
G. A. M., Vandenabeele, P. & Buurman, W. A. (2000). Functional
protection by acute phase proteins α1-acid glycoprotein and α1-
antitrypsin against ischemia/reperfusion injury by preventing apoptosis
and inflammation. Circulation, 102(12), 1420-1426.
Dallas, M.R., Liu, G., Chen, W., Thomas, S.N., Wirtz, D., Huso, D.L. &
Konstantopoulos, K. (2012). Divergent roles of CD44 and
carcinoembryonic antigen in colon cancer metastasis. Federation of
American Societies for Experimental Biology, 26(6), 2648-2656.
Davies, D. F. (1968). Effects of freezing and thawing serum and plasma on
selected quantitative recoveries. Cryobiology, 5(1), 87-95.

203
De Bruin, M. L., Sparidans, J., van't Veer, M. B., Noordijk, E. M., Louwman, M.
W. J., Zijlstra, J. M., van den Berg, H., Russell, N. S., Broeks, A.,
Baaijens, M. H. A., Aleman, B. M. P. & van Leeuwen, F. E. (2009). Breast
Cancer Risk in Female Survivors of Hodgkin's Lymphoma: Lower Risk
After Smaller Radiation Volumes. Journal of Clinical Oncology, 27(26),
4239-4246.
De Graaf, T., Van der Stelt, M., Anbergen, M. & Van Dijk, W. (1993).
Inflammation-induced expression of sialyl Lewis X-containing glycan
structures on alpha 1-acid glycoprotein (orosomucoid) in human sera.
The Journal of Experimental Medicine, 177(3), 657-666.
de Leeuw, W. J. F., Berx, G., Vos, C. B. J., Peterse, J. L., Van de Vijver, M. J.,
Litvinov, S., Van Roy, F., Cornelisse, C. J. & Cleton-Jansen, A.-m.
(1997). Simultaneous loss of E-cadherin and catenins in invasive lobular
breast cancer and lobular carcinoma in situ. The Journal of Pathology,
183(4), 404-411.
de Loez, M.L., Young, L.J., An, H.J., Kronewitter, S.R., Kim, J. & Miyamoto, S.
(2011). High-mannose glycans are elevated during breast cancer
progression. Molecular and Cellular Proteomics, 128(5), 257-264.
de Vries, B., Walter, S. J., Wolfs, T. G. A. M., Hochepied, T., Räbinä, J.,
Heeringa, P., Parkkinen, J., Libert, C. & Buurman, W. A. (2004).
Exogenous alpha-1-Acid Glycoprotein Protects against Renal Ischemia-
Reperfusion Injury by Inhibition of Inflammation and Apoptosis.
Transplantation, 78(8), 1116-1124.
Dell, A. & Morris, H. R. (2001). Glycoprotein Structure Determination by Mass
Spectrometry. Science, 291(5512), 2351-2356.
Demetriou, M., Nabi, I.R., Coppolino, M., Dedhar, S. & Dennis, J.W. (1995).
Reduced contact-inhibition and substratum adhesion in epithelial cells
expressing GlcNAc-transferase V. Journal of Cell Biology, 130(2), 383-
392.

204
Dennis, J. W., Granovsky, M. & Warren, C. E. (1999). Glycoprotein
glycosylation and cancer progression. Biochimica et Biophysica Acta
(BBA) - General Subjects, 1473(1), 21-34.
Dennis, J. W. & Laferté, S. (1989). Oncodevelopmental Expression of —
GlcNAcβ1–6Manα1-6Manβ1— Branched Asparagine-linked
Oligosaccharides in Murine Tissues and Human Breast Carcinomas.
Cancer Research, 49(4), 945-950.
Dent, R., Trudeau, M., Pritchard, K. I., Hanna, W. M., Kahn, H. K., Sawka, C.
A., Lickley, L. A., Rawlinson, E., Sun, P. & Narod, S. A. (2007). Triple-
Negative Breast Cancer: Clinical Features and Patterns of Recurrence.
Clinical Cancer Research, 13(15), 4429-4434.
Dente, L., Ciliberto, G. & Cortese, R. (1985). Structure of the human α1-acid
glycoprotein gene: sequence homology with other human acute phase
protein genes. Nucleic Acids Research, 13(11), 3941-3952.
Dente, L., Pizza, M., Metspalu, A. & Cortese, R. (1987). Structure and
expression of the genes coding for human alpha 1-acid glycoprotein. The
European Molecular Biology Organisation Journal, 6(8), 2289-2296.
Deprez, P., Gautschi, M. & Helenius, A. (2005). More Than One Glycan Is
Needed for ER Glucosidase II to Allow Entry of Glycoproteins into the
Calnexin/Calreticulin Cycle. Molecular Cell, 19(2), 183-195.
Doak, K. (2008). Alterations in the glycosylation pattern of alpha-1-glycoprotein
may be diagnostic for the detection of breast cancer and/or reducing the
effect of chemotherpay in vivo., University of Strathclyde.
Domchek, S. M., Friebel, T. M., Singer, C. F. & et al. (2010). Association of risk-
reducing surgery in BRCA1 or BRCA2 mutation carriers with cancer risk
and mortality. The Journal of the American Medical Association 304(9),
967-975.
Drenth, J. P. H., Göertz, J., Daha, M. R. & Van der Meer, J. W. M. (1996).
Immunoglobulin D Enhances the Release of Tumour Necrosis Factor-α,

205
and Interleukin-1β As Well As Interleukin-1 Receptor Antagonist From
Human Mononuclear Cells. Immunology, 88(3), 355-362.
Dube, D.H. & Bertozzi, C.R. (2005). Glycans in cancer and inflammation -
potential for therapeutics and diagnostics. Nature Reviews, Drug
Discovery, 4(6), 477-488.
Dubsky, P. C., Gnant, M. F. X., Taucher, S., Roka, S., Kandioler, D., Pichler-
Gebhard, B., Agstner, I., Seifert, M., Sevelda, P. & Jakesz, R. (2002).
Young Age as an Independent Adverse Prognostic Factor in
Premenopausal Patients with Breast Cancer. Clinical Breast Cancer,
3(1), 65-72.
Duché, J.C., Herve, F. & Tillement, J.P. (1998). Study of the expression of the
genetic variants of human alpha-1-acid glycoprotein in healthy subjects
using isoelectric focussing and immunoblotting. Journal of
Chromatography B, 715, 103-109.
Duché, J. C., Urien, S., Simon, N., Malaurie, E., Monnet, I. & Barré, J. (2000).
Expression of the genetic variants of human alpha-1-acid glycoprotein in
cancer. Clinical Biochemistry, 33(3), 197-202.
Durand, G. & Seta, N. (2000). Protein Glycosylation and Diseases: Blood and
Urinary Oligosaccharides as Markers for Diagnosis and Therapeutic
Monitoring. Clinical Chemistry, 46(6), 795-805.
Eap, C. B. & Baumann, P. (1993). The α1-acid glycoprotein: structure and
possible functions in the acute phase response: CRC Press.
Easton, D. F. (1999). How many more breast cancer predisposition genes are
there? Breast Cancer Research, 1(1), 14 - 17.
Easton, D. F., Ford, D. & Bishop, D. T. (1995). Breast and ovarian cancer
incidence in BRCA1-mutation carriers. Breast Cancer Linkage
Consortium. American Journal of Human Genetics, 56(1), 265.
Ebeling, F. G., Stieber, P., Untch, M., Nagel, D., Konecny, G. E., Schmitt, U. M.,
Fateh-Moghadam, A. & Seidel, D. (2002). Serum CEA and CA 15-3 as
206
prognostic factors in primary breast cancer. British Journal of Cancer,
86(8), 1217-1222.
Eisen, A., Lubinski, J., Gronwald, J., Moller, P., Lynch, H. T., Klijn, J., Kim-Sing,
C., Neuhausen, S. L., Gilbert, L., Ghadirian, P., Manoukian, S., Rennert,
G., Friedman, E., Isaacs, C., et al. (2008). Hormone Therapy and the
Risk of Breast Cancer in BRCA1 Mutation Carriers. Journal of the
National Cancer Institute, 100(19), 1361-1367.
Elg, S. A., Mayer, A. R., Carson, L. F., Twiggs, L. B., Hill, R. B. &
Ramakrishnan, S. (1997). α-1 acid glycoprotein is an immunosuppressive
factor found in ascites from ovarian carcinoma. Cancer, 80(8), 1448-
1456.
Fan, J. Q., Namiki, Y., Matsuoka, K. & Lee, Y. C. (1994). Comparison of acid
hydrolytic conditions for Asn-linked oligosaccharides. Analytical
Biochemistry, 219(2), 375-378.
Fassbender, K., Zimmerli, W., Kissling, R., Sobieska, M., Aeschlimann, A.,
Kellner, M. & Muller, W. (1991). Glycosylation of alpha 1 acid
glycoprotein in relation to duration of disease in acute and chronic
infection and inflammation. Clinica Chimica Acta, 203, 315-327.
Farinati, F., Marino, D., De Giorgio, M., Baldan, A., Cantarini, M, Cursara, C.,
Rapaccini, G., Del Poggio, P., Di Nolfo, M.A., Benvegnu, L., Zoli, M.,
Borzio, F., Bernardi, M. & Trevisani, F. (2006). Diagnostic and prognostic
role of alpha-fetoprotein in hepatocellular carcinoma: both or neither?
American Journal of Gastroenterology, 101, 524-523.
Ferens-Sieczkowska, M., Kratz, E. M., Kossowska, B., Passowicz-Muszynska,
E. & Jankowska, R. (2013). Comparison of haptoglobin and alpha(1)-acid
glycoprotein glycosylation in the sera of small cell and non-small cell lung
cancer patients. Postȩ py higieny i medycyny doświadczalnej, 67, 828-
836.
Fernandes, B., Sagman, U., Auger, M., Demetrio, M. & Dennis, J. W. (1991).
β1–6 Branched Oligosaccharides as a Marker of Tumor Progression in
Human Breast and Colon Neoplasia. Cancer Research, 51(2), 718-723.

207
Finch, A., Shaw, P., Rosen, B., Murphy, J., Narod, S. A. & Colgan, T. J. (2006).
Clinical and pathologic findings of prophylactic salpingo-oophorectomies
in 159 BRCA1 and BRCA2 carriers. Gynecologic Oncology, 100(1), 58-
64.
Finne, J. & Krusius, T. (1979). Structural Features of the Carbohydrate Units of
Plasma Glycoproteins. European Journal of Biochemistry, 102(2), 583-
588.
Flower, D. R. (1996). The lipocalin protein family: structure and function.
Biochemical Journal, 318(1), 1-14.
Flower, D. R., North, A. C. T. & Sansom, C. E. (2000). The lipocalin protein
family: structural and sequence overview. Biochimica et Biophysica Acta
(BBA) - Protein Structure and Molecular Enzymology, 1482(1–2), 9-24.
Ford, D., Easton, D. F., Bishop, D. T., Narod, S. A. & Goldgar, D. E. (1994).
Risks of cancer in BRCA1-mutation carriers. Breast Cancer Linkage
Consortium. Lancet, 343(8899), 692-695.
Fournier, T., Medjoubi-N, N. & Porquet, D. (2000). Alpha-1-acid glycoprotein.
Biochimica et Biophysica Acta, 1482(1-2), 157-171.
Frantz, M., Jung, M. L., Ribereau-Gayon, G. & Anton, R. (2000). Modulation of
mistletoe (Viscum album L.) lectins cytotoxicity by carbohydrates and
serum glycoproteins. Arzneimittel-Forschung, 50(5), 471-478.
Freeze, H. H. (2001). Update and perspectives on congenital disorders of
glycosylation. Glycobiology, 11(12), 129R-143R.
Friedman, M. L., Schlueter, K. T., Kirley, T. L. & Halsall, H. (1985).
Fluorescence quenching of human orosomucoid. Accessibility to drugs
and small quenching agents. Biochemical Journal, 232(3), 863-867.
Fujii, M., Takahashi, N., Hayashi, H., Furusho, T., Matsunaga, K. & Yoshikumi,
C. (1988). Comparative study of alpha 1-acid glycoprotein molecular
variants in ascitic fluid of cancer and non-cancer patients. Anticancer
Research, 8(3), 303-306.

208
Gajdos, C., Tartter, P. I., Bleiweiss, I. J., Bodian, C. & Brower, S. T. (2000).
Stage 0 to stage III breast cancer in young women. Journal of the
American College of Surgeons, 190(5), 523-529.
Gallacher, G. (2009). Alpha-1-acid glycoprotein as a biomarker for early breast
cancer. University of Strathclyde.
Gambacorti-Passerini, C., Zucchetti, M., Russo, D., Frapolli, R., Verga, M.,
Bungaro, S., Tornaghi, L., Rossi, F., Pioltelli, P., Pogliani, E., Alberti, D.,
Corneo, G. & D’Incalci, M. (2003). α1 Acid Glycoprotein Binds to Imatinib
(STI571) and Substantially Alters Its Pharmacokinetics in Chronic
Myeloid Leukemia Patients. Clinical Cancer Research, 9(2), 625-632.
Garrett, R. & Grisham, C. M. (2005). Biochemistry: Thomson Brooks/Cole.
Gast, M. C. W., Van Dulken, E. J., Van Loenen, T. K. G., Kingma-Vegter, F.,
Westerga, J., Flohil, C. C., Knol, J. C., Jimenez, C. R., Van Gils, C. H. &
Wessels, L. F. A. (2009). Detection of breast cancer by surface-enhanced
laser desorption/ionization time-of-flight mass spectrometry tissue and
serum protein profiling. The International Journal of Biological Markers,
24(3), 130-141.
Gavel, Y. & von Heijne, G. (1990). Sequence differences between glycosylated
and non-glycosylated Asn-X-Thr/Ser acceptor sites: implications for
protein engineering. Protein Engineering, 3(5), 433-442.
Gayther, S. A. & Pharoah, P. D. P. (2010). The inherited genetics of ovarian
and endometrial cancer. Current Opinion in Genetics & Development,
20(3), 231-238.
Gazinska, P., Grigoriadis, A., Brown, J. P., Millis, R. R., Mera, A., Gillett, C. E.,
Holmberg, L. H., Tutt, A. N. & Pinder, S. E. (2013). Comparison of basal-
like triple-negative breast cancer defined by morphology,
immunohistochemistry and transcriptional profiles. Modern Pathology,
26(7), 955-966.
Gendler, S., Taylor-Papadimitriou, J., Duhig, T., Rothbard, J. & Burchell, J.
(1988). A highly immunogenic region of human polymorphic epithelial

209
mucin expressed by carcinomas is made up of tandem repeats. Journal
of Biological Chemistry, 263, 12820-12823.
Georgian-Smith, D. & Lawton, T. J. (2001). Calcifications of Lobular Carcinoma
In Situ of the Breast. American Journal of Roentgenology, 176(5), 1255-
1259.
Gion, M., Mione, R., Leon, A. E. & Dittadi, R. (1999). Comparison of the
Diagnostic Accuracy of CA27.29 and CA15.3 in Primary Breast Cancer.
Clinical Chemistry, 45(5), 630-637.
Gion, M., Mione, R., Leon, A. E., Lüftner, D., Molina, R., Possinger, K. &
Robertson, J. F. (2001). CA27.29: a valuable marker for breast cancer
management. A confirmatory multicentric study on 603 cases. European
Journal of Cancer, 37(3), 355-363.
Goodarzi, M. T. & Turner, G. A. (1995). Decreased branching, increased
fucosylation and changed sialylation of alpha-1-proteinase inhibitor in
breast and ovarian cancer. Clinica Chimica Acta, 236(2), 161-171.
Gretschel, S., Haensch, W., Schlag, P.M. & Kremmner, W. (2003). Clinical
relevance of sialyltransferases ST6Gal-I and ST3Gal-III in gastric cancer.
Oncology, 65, 139-145.
Guile, G. R., Rudd, P. M., Wing, D. R., Prime, S. B. & Dwek, R. A. (1996). A
Rapid High-Resolution High-Performance Liquid Chromatographic
Method for Separating Glycan Mixtures and Analyzing Oligosaccharide
Profiles. Analytical Biochemistry, 240(2), 210-226.
Gunnarsson, P., Fornander, L., Påhlsson, P. & Grenegård, M. (2010). Sialic
acid residues play a pivotal role in α1-acid glycoprotein (AGP)-induced
generation of reactive oxygen species in chemotactic peptide pre-
activated neutrophil granulocytes. Inflammation Research, 59(2), 89-95.
Guo, H.B., Lee, I., Kamar, M. & Pierce, M. (2003). N-
acetylglucoaminyltransferase V expression levels regulate cadherin-
assciated homotypic cell-cell adhesion and intracellular signalling
pathways. Journal of Biological Chemistry, 278(52), 52412-52424.

210
Hall, J. M., Lee, M. K., Newman, B., Morrow, J. E., Anderson, L. A., Huey, B. &
King, M. C. (1990). Linkage of early-onset familial breast cancer to
chromosome 17q21. Science, 250(4988), 1684-1689.
Hamid, U., Royle, L., Saldova, R., Radcliffe, C.M., Harvey, D.J., Storr, S.J.,
Pardo, M., Antrobus, R., Chapman, C.J., Zitzmann, N., Robertson, J.F.,
Dwek, R.A. & Rudd, P.M. (2008). A strategy to reveal potential glycan
markers from serum glycoproteins associated with breast cancer
progression. Glycobiology, 18(12), 1105-1118.
Hammad, L.A., Derryberry, D.Z., Jmeaian, Y.R. & Mechref, Y. (2010).
Quantification of monosaccharides through multiple-reaction monitoring
liquid chromatography/mass spectrometry using an aminopropyl columm.
Rapid Communications in Mass Spectrometry, 24(11), 1565-1574.
Han, W., Kang, S. & Society, T. K. B. C. (2010). Relationship between age at
diagnosis and outcome of premenopausal breast cancer: age less than
35 years is a reasonable cut-off for defining young age-onset breast
cancer. Breast Cancer Research and Treatment, 119(1), 193-200.
Hanahan, D & Weinberg, R.A. (2000). The hallmarks of cancer. Cell, 100, 57-
70.
Hanahan, D & Weinberg, R.A. (2011). Hallmarks of Cancer: The next
generation. Cell, 144, 646-674.
Handerson, T., Camp, R., Harigopal, M., Rimm, D. & Pawelek, J. (2005).
Beta1,6-branched oligosaccharides are increased in lymph node
metastases and predict poor outcome in breast carcinoma. Clinical
Cancer Research, 11(8), 2969-2973.
Hanover, J.A., Krause M.W. & Love, D.C. (2010). The hexosamine signalling
pathway: O-GlcNAc cycling in feast or famine. Biochimica Biophysica
Acta, 1800, 80-95.
Hansen, J.-E. S., Larsen, V. A. & Bøg-Hansen, T. C. (1984). The
microheterogeneity of α1-acid glycoprotein in inflammatory lung disease,

211
cancer of the lung and normal health. Clinica Chimica Acta, 138(1), 41-
47.
Harazono, A., Kobayashi, T., Kawasaki, N., Itoh, S., Tada, M., Hashii, N., Ishii,
A., Arato, T., Yanagihara, S., Yagi, Y., Koga, A., Tsuda, Y., Kimura, M.,
Sakita, M., et al. (2011). A comparative study of monosaccharide
composition analysis as a carbohydrate test for biopharmaceuticals.
Biologicals, 39(3), 171-180.
Hardy, M. R. & Townsend, R. R. (1988). Separation of positional isomers of
oligosaccharides and glycopeptides by high-performance anion-
exchange chromatography with pulsed amperometric detection.
Proceedings of the National Academy of Sciences, 85(10), 3289-3293.
Hardy, M. R., Townsend, R. R. & Lee, Y. C. (1988). Monosaccharide analysis of
glycoconjugates by anion exchange chromatography with pulsed
amperometric detection. Analytical Biochemistry, 170(1), 54-62.
Harmer, V. (2011). Breast Cancer Nursing Care and Management: John Wiley
& Sons.
Hart, C., Schulenberg, B., Steinberg, T.H., Leung, W.Y. & Patton, W.F. (2003).
Detection of glycoproteins in polyacrylamide gels and on elctroblots using
Pro-Q Emeral 488 dye, a fluorescent periodate Schiff-base stain.
Electophoresis, 24(4), 588-598.
Hartmann, L. C., Schaid, D. J., Woods, J. E., Crotty, T. P., Myers, J. L., Arnold,
P. G., Petty, P. M., Sellers, T. A., Johnson, J. L., McDonnell, S. K., Frost,
M. H., Grant, C. S., Michels, V. V. & Jenkins, R. B. (1999). Efficacy of
Bilateral Prophylactic Mastectomy in Women with a Family History of
Breast Cancer. New England Journal of Medicine, 340(2), 77-84.
Hashimoto, S., Asao, T., Takahashi, J., Yagihashi, Y., Nishimura, T., Saniabadi,
A. R., Poland, D. C. W., van Dijk, W., Kuwano, H., Kochibe, N. &
Yazawa, S. (2004). α1-Acid glycoprotein fucosylation as a marker of
carcinoma progression and prognosis. Cancer, 101(12), 2825-2836.

212
Hayes, D. F., Abe, M., Siddiqui, J., Tondini, C. & Kufe, D. W. (1989). Clinical
and molecular investigations of the DF3 breast cancer-associated
antigen. Immunological Approaches to the Diagnosis and Therapy of
Breast Cancer II, 45-53.
Heemskerk-Gerritsen, B. A. M., Menke-Pluijmers, M. B. E., Jager, A., Tilanus-
Linthorst, M. M. A., Koppert, L. B., Obdeijn, I. M. A., van Deurzen, C. H.
M., Collée, J. M., Seynaeve, C. & Hooning, M. J. (2013). Substantial
breast cancer risk reduction and potential survival benefit after bilateral
mastectomy when compared with surveillance in healthy BRCA1 and
BRCA2 mutation carriers: a prospective analysis. Annals of Oncology,
24(8), 2029-2035.
Hellerstein, M.K., Sasak, V., Ordovas, J. & Munro, H.N. (1985). Isolation of
alpha-1-acid glycoprotein from human plasma using high performance
liquid chromatography. Analytical Biochemistry, 146(2), 336-371.
Hermentin, P., Witzel, R., Vliegenthart, J. F. G., Kamerling, J. P., Nimtz, M. &
Conradt, H. S. (1992). A strategy for the mapping of N-glycans by high-
pH anion-exchange chromatography with pulsed amperometric detection.
Analytical Biochemistry, 203(2), 281-289.
Hervé, F., Duché, J.-C. & Jaurand, M.-C. (1998). Changes in expression and
microheterogeneity of the genetic variants of human α1-acid glycoprotein
in malignant mesothelioma. Journal of Chromatography B: Biomedical
Sciences and Applications, 715(1), 111-123.
Herve, F., Millot, M. C., Eap, C. B., Duche, J. C. & Tillement, J. P. (1996). Two-
step chromatographic purification of human plasma alpha(1)-acid
glycoprotein: its application to the purification of rare phenotype samples
of the protein and their study by chromatography on immobilized metal
chelate affinity adsorbent. Journal of Chromatography B Biomedical
Sciences and Applications, 678(1), 1-14.
Higai, K., Aoki, Y., Azuma, Y. & Matsumoto, K. (2005). Glycosylation of site-
specific glycans of α1-acid glycoprotein and alterations in acute and
chronic inflammation. Biochimica et Biophysica Acta 1725(1), 128-135.

213
Higai, K., Azuma, Y., Aoki, Y. & Matsumoto, K. (2003). Altered glycosylation of
α1-acid glycoprotein in patients with inflammation and diabetes mellitus.
Clinica Chimica Acta, 329(1-2), 117-125.
Hochepied, T., Berger, F. G., Baumann, H. & Libert, C. (2003). α1-Acid
glycoprotein: an acute phase protein with inflammatory and
immunomodulating properties. Cytokine and Growth Factor Reviews,
14(1), 25-34.
Hofbauerova, K., Kopecky Jr, V., Sykora, J. & Karpenko, V.(2003). Thermal
stability of the human blood serum acid α1-glycoprotein in acidic media.
Biophysical Chemistry, 103, 25-33.
Hu, Z., Fan, C., Oh, D. S., Marron, J., He, X., Qaqish, B. F., Livasy, C., Carey,
L. A., Reynolds, E. & Dressler, L. (2006). The molecular portraits of
breast tumors are conserved across microarray platforms. BMC
Genomics, 7(1), 96.
Hull, S. R., Bright, A., Carraway, K. L., Abe, M., Hayes, D. F. & Kufe, D. W.
(1989). Oligosaccharide differences in the DF3 sialomucin antigen from
normal human milk and the BT-20 human breast carcinoma cell line.
Cancer Communications, 1(4), 261-267.
Imperiali, B. & O’Connor, S. E. (1999). Effect of N-linked glycosylation on
glycopeptide and glycoprotein structure. Current Opinion in Chemical
Biology, 3(6), 643-649.
Information Services Division: ISD Scotland. (2014). Cancer in Scotland:
Information Services Division: ISD Scotland.
Israili, Z. & Dayton, P. (2001). Human alpha-1-glycoprotein and its interactions
with drugs. Drug Metabolism Reviews, 33(2), 161-235.
Jensen, P.H., Kolarich, D. & Packer, N.H. (2009). Mucin-type O-glycosylation -
putting the pieces together. Federation of European Biochemical
Societies, 277(1), 81-94.
Jozwiak, P., Forma, E., Brys, M. & Krzeslak, A. (2014). O-GlcNAcylation and
metabolic reprogramming in cancer. Frontiers in Endocrinology, 5, 1-13.

214
Julien, S., Adriaenssens, E., Ottenberg, K., Furlan, A., Courtand, G., Vercoutter-
Edouart, A.S., Hanisch, F.G., Delannoy, P. & Le Bourhis, X. (2006).
ST6GalNAc I expression in MDA-MB 231 breast cancer cells greatly
modifies their O-glycosylation pattern and enhances their tumourgenicity.
Glycobiology, 16(1), 54-64.
Julien, S., Ivetic, A., Grigoriadis, A, QiZe, D., Burford, B., Sproviero, D., Picco,
G., Gillett, C., Papp, S.L., Schaffer, L., Tutt, A., Taylor-Papadimitriou, J.,
Pinder, S., & Burchell., J. (2011). Selectin ligand Sialyl-Lewis X antigen
drives metastasis of hormone-dependent breast cancers. Cancer
Research, 71, 7683 - 7693.
Johnson, D. C. & LaCourse, W. R. (1992). Pulsed electrochemical detection at
noble metal electrodes in liquid chromatography. Electroanalysis, 4(4),
367-380.
Jørgensen, H. G., Elliott, M. A., Allan, E. K., Carr, C. E., Holyoake, T. L. &
Smith, K. D. (2002). α1-Acid glycoprotein expressed in the plasma of
chronic myeloid leukemia patients does not mediate significant in vitro
resistance to STI571. Blood, 99(2), 713-715.
Kailajarva, M., Ahokoski, O., Virtanen, A., Salminen, E. & Irjala, K. (2000). Early
effects of adjuvant tamoxifen therapy on serum hormones, proteins and
lipds. Anticancer Research,20(2B), 1323-1327.
Kalmovarin, N., Friedrichs, W. E., O'Brien, H. V., Linehan, L. A., Bowman, B. H.
& Yang, F. (1991). Extrahepatic expression of plasma protein genes
during inflammation. Inflammation, 15(5), 369-379.
Kato, T., Wang, Y., Yamaguchi, K., Milner, C. M., Shineha, R., Satomi, S. &
Miyagi, T. (2001). Overexpression of lysosomal-type sialidase leads to
suppression of metastasis associated with reversion of malignant
phenotype in murine B16 melanoma cells. International Journal of
Cancer, 92(6), 797-804.
Katori, N., Sai, K., Saito, Y., Fukushima-Uesaka, H., Kurose, K., Yomota, C.,
Kawanishi, T., Nishimaki-Mogami, T., Naito, M., Sawada, J.-I., Kunitoh,
H., Nokihara, H., Sekine, I., Ohe, Y., et al. (2011). Genetic variations of

215
orosomucoid genes associated with serum alpha-1-acid glycoprotein
level and the pharmacokinetics of paclitaxel in Japanese cancer patients.
Journal of Pharmaceutical Sciences, 100(10), 4546-4559.
Keppler, O. T., Peter, M. E., Hinderlich, S., Moldenhauer, G., Stehling, P.,
Schmitz, I., Schwartz-Albiez, R., Reutter, W. & Pawlita, M. (1999).
Differential sialylation of cell surface glycoconjugates in a human B
lymphoma cell line regulates susceptibility for CD95 (APO-1/Fas)-
mediated apoptosis and for infection by a lymphotropic virus.
Glycobiology, 9(6), 557-569.
Khan, K.H., Yap, T.A., Yan, L. & Cunningham, D. (2013). Targeting the PI3K-
AKT-mTOR signaling network in cancer. Chinese Journal of Cancer, 32,
253-265.
Kim, Y. J., Borsig, L., Varki, N. M. & Varki, A. (1998). P-selectin deficiency
attenuates tumor growth and metastasis. Proceedings of the National
Academy of Sciences, 95(16), 9325-9330.
Kimura, T., Shibukawa, A. & Matsuzaki, K. (2006). Biantennary Glycans as Well
as Genetic Variants of α1-Acid Glycoprotein Control the Enantioselectivity
and Binding Affinity of Oxybutynin. Pharmaceutical Research, 23(5),
1038-1042.
King, R. J. B. & Robins, M. W. (2006). Cancer Biology: Pearson/Prentice Hall.
Kishino, S., Nomura, A., Itoh, S., Nakagawa, T., Takekuma, Y., Sugawara, M.,
Furukawa, H., Todo, S. & Miyazaki, K. (2002). Age- and gender-related
differences in carbohydrate concentrations of alpha1-acid glycoprotein
variants and the effects of glycoforms on their drug-binding capacities.
European Journal of Clinical Pharmacology, 58(9), 621-628.
Kobata, A. (1992). Structures and functions of the sugar chains of
glycoproteins. European Journal of Biochemistry, 209(2), 483-501.
Kobata, A. (2000). A journey to the world of glycobiology. Glycoconjugate
Journal, 17(7), 443-464.

216
Kopecký Jr, V. r., Ettrich, R., Hofbauerová, K. & Baumruk, V. r. (2003).
Structure of human α1-acid glycoprotein and its high-affinity binding site.
Biochemical and Biophysical Research Communications, 300(1), 41-46.
Kornfeld, R. & Kornfeld, S. (1985). Assembly of asparagine-linked
oligosaccharides. Annual Review of Biochemistry, 54(1), 631-664.
Kremer, J. M., Wilting, J. & Janssen, L. H. (1988). Drug binding to human alpha-
1-acid glycoprotein in health and disease. Pharmacological Reviews,
40(1), 1-47.
Kroes, R.A., He, H., Emmett, M.R., Nilsson, C.L., Leach, F.E., Amster, I.J.,
Marshall, A.G. & Moskal, J.R. (2010). Overexpression of ST6GalNAcV, a
ganglioside-specific alpha2,6-sialyltransferase, inhibits glioma growth in
vivo. Proceedings of the National Academy of Sciences, 107(28), 12646-
12651.
Kurebayashi, J., Nomura, T., Hirono, M., Okubo, S., Udagawa, K., Shiiki, S.,
Ikeda, M., Nakashima, K., Tanaka, K. & Sonoo, H. (2006). Combined
Measurement of Serum Sialyl Lewis X with Serum CA15-3 in Breast
Cancer Patients. Japanese Journal of Clinical Oncology, 36(3), 150-153.
Küster, B., Wheeler, S. F., Hunter, A. P., Dwek, R. A. & Harvey, D. J. (1997).
Sequencing of N-Linked Oligosaccharides Directly from Protein Gels: In-
Gel Deglycosylation Followed by Matrix-Assisted Laser
Desorption/Ionization Mass Spectrometry and Normal-Phase High-
Performance Liquid Chromatography. Analytical Biochemistry, 250(1),
82-101.
Laemmli, U. K. (1970). Cleavage of structural proteins during the assembly of
the head of bacteriophage T4. Nature, 227(5259), 680-685.
Lakhani, S. R., van de Vijver, M. J., Jacquemier, J., Anderson, T. J., Osin, P. P.,
McGuffog, L., Easton, D. F. & Consortium, f. t. B. C. L. (2002a). The
Pathology of Familial Breast Cancer: Predictive Value of
Immunohistochemical Markers Estrogen Receptor, Progesterone
Receptor, HER-2, and p53 in Patients With Mutations in BRCA1 and
BRCA2. Journal of Clinical Oncology, 20(9), 2310-2318.

217
Lakhani, S. R., van de Vijver, M. J., Jacquemier, J., Anderson, T. J., Osin, P. P.,
McGuffog, L., Easton, D. F. & for the Breast Cancer Linkage, C. (2002b).
The Pathology of Familial Breast Cancer: Predictive Value of
Immunohistochemical Markers Estrogen Receptor, Progesterone
Receptor, HER-2, and p53 in Patients With Mutations in BRCA1 and
BRCA2. Journal of Clinical Oncology, 20(9), 2310-2318.
Larkin, A. & Imperiali, B. (2011). The Expanding Horizons of Asparagine-Linked
Glycosylation. Biochemistry, 50(21), 4411-4426.
Laurent, P., Miribel, L., Bienvenu, J., Vallve, C. & Arnaud, P. (1984). A three-
step purification of human α1-acid glycoprotein. Federation of European
Biochemical Societies Letters, 168(1), 79-83.
Leatherbarrow, R. J. & Dean, P. D. (1980). Studies on the mechanism of
binding of serum albumins to immobilized cibacron blue F3G A.
Biochemical Journal, 189(1), 27.
Leclère, B., Molinié, F., Trétarre, B., Stracci, F., Daubisse-Marliac, L. &
Colonna, M. (2013). Trends in incidence of breast cancer among women
under 40 in seven European countries: A GRELL cooperative study.
Cancer Epidemiology, 37(5), 544-549.
Lee, Y. C. (1990). High-performance anion-exchange chromatography for
carbohydrate analysis. Analytical Biochemistry, 189(2), 151-162.
Lee, Y. C. (1996). Carbohydrate analyses with high-performance anion-
exchange chromatography. Journal of Chromatography A, 720(1–2), 137-
149.
Lee, L.Y., Thaysen-Andersen, M., Baker, M.S., Packer, N.H., Hancock, W.S. &
Fanayan, S. (2014). Comprehensive N-glycome profiling of cultured
human epithelial cells identifies unique secretome N-glycosylation
signatures enabling tumourgenic subtype classification. Journal of
Proteome Research, 13(11), 4783-4795.

218
Liao, Y., Taylor, J. M., Vannice, J. L., Clawson, G. A. & Smuckler, E. A. (1985).
Structure of the rat alpha 1-acid glycoprotein gene. Molecular and
Cellular Biology, 5(12), 3634-3639.
Liao, W., Lin, J. & Leonard, W.J. (2011). IL-2 family cytokines: New insights into
the complex roles of IL-2 as a broad regulator of T helper cell
differentiation.Current Opinions in Immunology, 23(5), 598-604.
Libert, C., Brouckaert, P. & Fiers, W. (1994). Protection by alpha 1-acid
glycoprotein against tumor necrosis factor-induced lethality. The Journal
of Experimental Medicine, 180(4), 1571-1575.
Lis, H. & Sharon, N. (1993). Protein glycosylation: Structural and Functional
Aspects. European Journal of Biochemistry, 218(1), 1-27.
Macdougall, I. C. & Eckardt, K. (2006). Novel strategies for stimulating
erythropoiesis and potential new treatments for anaemia. The Lancet,
368(9539), 947-953.
Mackiewicz, A. & Mackiewicz, K. (1995). Glycoforms of serum α1-acid
glycoprotein as markers of inflammation and cancer. Glycoconjugate
Journal, 12(3), 241-247.
Madjid, Z., Parsons, T., Watson, N., Spendlove, I., Ellis, I. & Durrant, L.G.
(2005). High expression of Lewis y/b antigens is associated with
decreased survival in lymph node negative breast carcinomas. Breast
Cancer Research, 7, 780-787.
Maeder, T. (2002). Sweet medicines. Scientific American, 287(1), 40.
Malone, K. E., Daling, J. R., Doody, D. R., O'Brien, C., Resler, A., Ostrander, E.
A. & Porter, P. L. (2011). Family History of Breast Cancer in Relation to
Tumor Characteristics and Mortality in a Population-Based Study of
Young Women with Invasive Breast Cancer. Cancer Epidemiology
Biomarkers & Prevention, 20(12), 2560-2571.
Manzi, A. (2001). Acid hydrolysis for release of monosaccharides. Current
Protocols in Molecular Biology. Chapter 7: Unit 17.16.

219
Maresca, B., Cigliano, L., Spagnuolo, M.S., Dal Piaz, F., Corsaro, M.M., Balato,
N., Nino, M., Balato, A., Ayala, F. & Abrescia, P. (2012). Differences
between glycosylation patterns of haptoglobin isolated from skin scales
and plasma of psoriatic patients. Public Library of Science One, 7(12),
e52040.
Marmot, M. G., Altman, D. G., Cameron, D. A., Dewar, J. A., Thompson, S. G.
& Wilcox, M. (2012). The benefits and harms of breast cancer screening:
an independent review. The Lancet, 380(9855), 1778-1786.
Matsumoto, K., Nishi, K., Kikuchi, M., Kadowaki, D., Tokutomi, Y., Tokutomi, N.,
Suenaga, A. & Otagiri, M. (2007). α 1-Acid Glycoprotein Suppresses Rat
Acute Inflammatory Paw Edema through the Inhibition of Neutrophils
Activation and Prostaglandin E 2 Generation. Biological &
Pharmaceutical Bulletin, 30(7), 1226-1230.
Matsumoto, K., Sukimoto, K., Nishi, K., Maruyama, T., Suenaga, A. & Otagiri,
M. (2002). Characterization of ligand binding sites on the α 1-acid
glycoprotein in humans, bovines and dogs. Drug Metabolism and
Pharmacokinetics, 17(4), 300-306.
Mavaddat, N., Peock, S., Frost, D., Ellis, S., Platte, R., Fineberg, E., Evans, D.
G., Izatt, L., Eeles, R. A., Adlard, J., Davidson, R., Eccles, D., Cole, T.,
Cook, J., et al. (2013). Cancer Risks for BRCA1 and BRCA2 Mutation
Carriers: Results From Prospective Analysis of EMBRACE. Journal of the
National Cancer Institute, 105(11), 812-822.
McCurdy, T. R., Bhakta, V., Eltringham-Smith, L. J., Gataiance, S., Fox-
Robichaud, A. E. & Sheffield, W. P. (2011). Comparison of methods for
the purification of alpha-1 acid glycoprotein from human plasma. Journal
of Biomedicine and Biotechnology, 2011, 578207.
McGuire, J. M., Stewart, Y. M. & Smith, K. D. (1999). The effect of pH on the
high pH anion-exchange chromatography elution of monosaccharides.
Chromatographia, 49(11-12), 699-702.
Mestriner, F. L. A. C., Spiller, F., Laure, H. J., Souto, F. O., Tavares-Murta, B.
M., Rosa, J. C., Basile-Filho, A., Ferreira, S. H., Greene, L. J. & Cunha,

220
F. Q. (2007). Acute-phase protein α-1-acid glycoprotein mediates
neutrophil migration failure in sepsis by a nitric oxide-dependent
mechanism. Proceedings of the National Academy of Sciences, 104(49),
19595-19600.
Milde-Langosch, K., Karn, T., Schmidt, M., zu Eulenburg, C., Oliveira-Ferrer, L.,
Wirtz, R., Schumacher, U., Witzel, I., Schutze, D. & Muller, V. (2014).
Prognostic relevance of glycosylation-associated genes in breast cancer.
Breast Cancer Research and Treatment, 145(2), 295-305.
Mirabelli, P. & Incoronato, M. (2013). Usefulness of Traditional Serum
Biomarkers for Management of Breast Cancer Patients. BioMed
Research International, 2013, 9.
Misek, D. E. & Kim, E. H. (2011). Protein Biomarkers for the Early Detection of
Breast Cancer. International Journal of Proteomics, 2011.
Miyoshi, E., Moriwaki, K., Terao, N., Tan, C., Terao, M., Nakagawa, T.,
Matsumoto, H., Shinzaki, S. & Kamada, Y. (2012). Fucosylation is a
promising target for cancer diagnosis and therapy. Biomolecules, 2(1),
34-45.
Mooney, P., Hayes, P. & Smith, K. (2006). The putative use of α-1-acid
glycoprotein as a non-invasive marker of fibrosis. Biomedical
Chromatography, 20(12), 1351-1358.
Moore, D. F., Rosenfeld, M. R., Gribbon, P. M., Winlove, C. P. & Tsai, C. M.
(1997). Alpha-1-Acid (AAG, Orosomucoid) Glycoprotein: Interaction with
Bacterial Lipopolysaccharide and Protection from Sepsis. Inflammation,
21(1), 69-82.
Morell, A. G., Gregoriadis, G., Scheinberg, I. H., Hickman, J. & Ashwell, G.
(1971). The Role of Sialic Acid in Determining the Survival of
Glycoproteins in the Circulation. Journal of Biological Chemistry, 246(5),
1461-1467.
Morelle, W. & Michalski, J.C. (2007). Analysis of protein glycosylation by mass
spectrometry. Nature Protocols, 2(7), 1585-1602.

221
Moriwaki, K., Noda, K., Furukawa, Y., Ohshima, K., Uchiyama, A., Nakagawa,
T., Taniguchi, N., Daigo, Y., Nakamura, Y., Hayashi, N. & Miyoshi, E.
(2009). Deficiency of GMDS leads to escape from NK cell mediated
tumour surveillance through modulation of TRAIL signaling.
Gastroenterology, 137(1), 188-198.
Mughal, A. W., Hortobagyi, G. N., Fritsche, H. A., Buzdar, A. U., Yap, H.-Y. &
Blumenschein, G. R. (1983). Serial Plasma Carcinoembryonic Antigen
Measurements During Treatment of Metastatic Breast Cancer. The
Journal of the American Medical Association, 249(14), 1881-1886.
Nakagoe, T., Fukushima, K., Itoyanagi., N., Ikuta, Y., Oka, T., Nagayasu, T.,
Ayabe, H., Hara, S., Ishikawa, H & Minami, H. (2002). Expression of
ABH/Lewis-related antigens as prognostic factors in patients with breast
cancer. Journal of Cancer Research and Clinical Oncology, 128(5), 257-
264.
Nakano, M., Kakehi, K., Tsai, M. H. & Lee, Y. C. (2004). Detailed structural
features of glycan chains derived from α1-acid glycoproteins of several
different animals: the presence of hypersialylated, O-acetylated sialic
acids but not disialyl residues. Glycobiology, 14(5), 431-441.
National Cancer Institute. (2012). Cancer of the Breast - SEER Stat Fact
Sheets. Retrieved 27th June, 2012, from
http://seer.cancer.gov/statfacts/html/breast.html
National Cancer Institute. (2014). Fact Sheet - BRCA1 and BRCA2: Cancer
Risk and Genetic Testing. Retrieved 6th May, 2014, from
http://www.cancer.gov/cancertopics/factsheet/Risk/BRCA
National Institute for Health and Care Excellence. (2013). Familial Breast
Cancer - Classification and care of people at risk of familial breast cancer
and management of breast cancer and related risks in people with a
family history of breast cancer.
NHS Breast Screening Programme. (2003). Review of Radiation Risk in Breast
Screening. Retrieved 6th May, 2014, from

222
http://www.cancerscreening.nhs.uk/breastscreen/publications/nhsbsp54.p
df
Nicolini, A., Tartarelli, G., Carpi, A., Metelli, M., Ferrari, P., Anselmi, L., Conte,
M., Berti, P. & Miccoli, P. (2006). Intensive post-operative follow-up of
breast cancer patients with tumour markers: CEA, TPA or CA15. 3 vs
MCA and MCA-CA15. 3 vs CEA-TPA-CA15. 3 panel in the early
detection of distant metastases. BioMed Central Cancer, 6(1), 269.
Nielsen, T. O., Hsu, F. D., Jensen, K., Cheang, M., Karaca, G., Hu, Z.,
Hernandez-Boussard, T., Livasy, C., Cowan, D., Dressler, L., Akslen, L.
A., Ragaz, J., Gown, A. M., Gilks, C. B., et al. (2004).
Immunohistochemical and Clinical Characterization of the Basal-Like
Subtype of Invasive Breast Carcinoma. Clinical Cancer Research, 10(16),
5367-5374.
Nixon, A. J., Neuberg, D., Hayes, D. F., Gelman, R., Connolly, J. L., Schnitt, S.,
Abner, A., Recht, A., Vicini, F. & Harris, J. R. (1994). Relationship of
patient age to pathologic features of the tumor and prognosis for patients
with stage I or II breast cancer. Journal of Clinical Oncology, 12(5), 888-
894.
Northern Ireland Cancer Registry. (2013). Cancer Incidence, Prevalence and
Survival Statistics for Northern Ireland: 1993-2012: Northern Ireland
Cancer Registry.
Oakman, C., Viale, G. & Di Leo, A. (2010). Management of triple negative
breast cancer. The Breast, 19(5), 312-321.
Office for National Statistics. (2011). Cancer Statistics Registrations, England:
Office For National Statistics.
Ogawa, J.I., Inoue, H. & Koide, S. (1997). Alpha-1,3-sialyltransferase type 3N
and alpha-1,3-fucosyltransferase type VII are related to sialyl Lewis (x)
synthesis and patient survival from lung carcinoma. Cancer, 79(9), 1678-
1685.

223
Olewicz-Gawlik, A., Korczowska-Lacka, I., Lacki, J.K., Klamam, K. & Hrycaj, P.
(2007). Fucosylation of serum alpha-1-acid glycoprotein in rheumatoid
arthritis patients treated with infliximab. Clinical Rheumatology, 26(10),
1679-1684.
Olivier, R., Van Beurden, M., Lubsen, M., Rookus, M., Mooij, T., Van De Vijver,
M. & Van't Veer, L. (2004). Clinical outcome of prophylactic
oophorectomy in BRCA1/BRCA2 mutation carriers and events during
follow-up. British Journal of Cancer, 90(8), 1492-1497.
Orczyk-Pawilowicz, M., Hirniem L. & Katnik-Prastowska, I.(2006). Alterations of
N-glycan branching and experssion of sialic acid on amniotic fluid alpha-
1-acid glycoprotein derived from second and third trimesters of normal
and prolonged pregnancies. Clinica Chimica Acta, 367, 86-92.
Otagiri, M., Maruyama, T., Imai, T., Suenaga, A. & Imamura, Y. (1987). A
comparative study of the interaction of warfarin with human α1-acid
glycoprotein and human albumin. Journal of Pharmacy and
Pharmacology, 39(6), 416-420.
Parker, J. S., Mullins, M., Cheang, M. C. U., Leung, S., Voduc, D., Vickery, T.,
Davies, S., Fauron, C., He, X., Hu, Z., Quackenbush, J. F., Stijleman, I.
J., Palazzo, J., Marron, J. S., et al. (2009). Supervised Risk Predictor of
Breast Cancer Based on Intrinsic Subtypes. Journal of Clinical Oncology,
27(8), 1160-1167.
Paskach, T. J., Lieker, H.-P., Reilly, P. J. & Thielecke, K. (1991). High-
performance anion-exchange chromatography of sugars and sugar
alcohols on quaternary ammonium resins under alkaline conditions.
Carbohydrate Research, 215(1), 1-14.
Patani, N., Jiang, W. & Mokbel, K. (2008). Prognostic utility of
glycosyltransferase expression in breast cancer. Cancer Genomics and
Proteomics, 5(6), 333-340.
Patel, T., Bruce, J., Merry, A., Bigge, C., Wormald, M., Parekh, R. & Jaques, A.
(1993). Use of hydrazine to release intact and unreduced form both N-

224
and O-linked oligosaccharides from glycoproteins. Biochemistry, 32, 679-
693.
Pawiłowicz, M., Hirnle, L. & Kątnik-Prastowska, I. (2006). Alterations of N-
glycan branching and expression of sialic acid on amniotic fluid alpha-1-
acid glycoprotein derived from second and third trimesters of normal and
prolonged pregnancies. Clinica Chimica Acta, 367(1-2), 86-92.
Pawlik, T. M., Hawke, D. H., Liu, Y., Krishnamurthy, S., Fritsche, H., Hunt, K. K.
& Kuerer, H. M. (2006). Proteomic analysis of nipple aspirate fluid from
women with early-stage breast cancer using isotope-coded affinity tags
and tandem mass spectrometry reveals differential expression of vitamin
D binding protein. BioMed Central Cancer, 6(1), 68.
Peppercorn, J., Perou, C. M. & Carey, L. A. (2008). Molecular Subtypes in
Breast Cancer Evaluation and Management: Divide and Conquer. Cancer
Investigation, 26(1), 1-10.
Perey, L., Hayes, D. F. & Kufe, D. (1992a). Effects of Differentiating Agents on
Cell Surface Expression of the Breast Carcinoma-associated DF3-P
Epitope. Cancer Research, 52(22), 6365-6370.
Perey, L., Hayes, D. F., Maimonis, P., Abe, M., O'Hara, C. & Kufe, D. W.
(1992b). Tumor Selective Reactivity of a Monoclonal Antibody Prepared
against a Recombinant Peptide Derived from the DF3 Human Breast
Carcinoma-associated Antigen. Cancer Research, 52(9), 2563-2568.
Perez-Garay, M., Arteta, B., Pages, L., de Llorens, R., de Bolos, C., Vidal-
Vanaclocha, F. & Peracaula, R. (2010). Alpha2,3-sialyltransferase
ST3Gal III modulates pancreatic cancer cell motility and adhesion in vitro
and enhances its metastatic potential in vivo. Public Library of Science
One, 5(9), e12524.
Perkins, S. J., Kerckaert, J.-P. & Loucheux-Lefebvre, M. H. (1985). The shapes
of biantennary and tri/tetaantennary α1 acid glycoprotein by small-angle
neutron and X-ray scattering. European Journal of Biochemistry, 147(3),
525-531.

225
Perou, C. M., Sørlie, T., Eisen, M. B., van de Rijn, M., Jeffrey, S. S., Rees, C.
A., Pollack, J. R., Ross, D. T., Johnsen, H. & Akslen, L. A. (2000).
Molecular portraits of human breast tumours. Nature, 406(6797), 747-
752.
Pertretti, T., Kemmner, W., Schulze, B. & Schlad, P.M. (2000). Altered mRNA
expression of glycosyltransferases in human colorectal carcinomans and
liver metastases. Gut, 46(3), 359-366.
Pharoah, P. D., Day, N. E., Duffy, S., Easton, D. F. & Ponder, B. A. (1997).
Family history and the risk of breast cancer: a systemic reveiw and meta-
analysis. International Journal of Cancer, 71(5), 800-809.
Picco, G., Julien, S., Brockhausen, I., Beatson, R., Antonopoulos, A., Haslam,
S., Mandel, U., Dell, A., Pinder, S., Taylor-Papadimitriou, J. & Burchell, J.
(2010). Over-expression of ST3Gal-I promotes mammary tumourgenesis.
Glycobiology, 20(10), 1241-1250.
Pinho, S.S., Reis, C.A., Parades, J., Magalhaes, A.M., Ferreira, A.C.,
Figueiredo, J., Xiaogang, W., Carneiro, F., Gartner, F. & Seruca, R.
(2009). The role of N-acetylglucosaminyltransferace III and V in the post-
transcriptional modifications of E-cadherin. Human Molecular Genetics,
18(14), 2599-2608.
Plummer, T., Elder, J., Alexander, S., Phelan, A. & Tarentino, A. L. (1984).
Demonstration of peptide: N-glycosidase F activity in endo-beta-N-
acetylglucosaminidase F preparations. Journal of Biological Chemistry,
259(17), 10700-10704.
Poland, D. C. W., Schalkwijk, C. G., Stehouwer, C. D. A., Koeleman, C. A. M.,
van het Hof, B. & van Dijk, W. (2001). Increased α3-fucosylation of α1-
acid glycoprotein in Type I diabetic patients is related to vascular
function. Glycoconjugate Journal, 18(3), 261-268.
Popescu, I. D., Albulescu, R., Raducan, E., Dinischiotu, A. & Tanase, C. (2010).
Applications of SELDI-TOF technology in cancer biomarkers discovery.
Romanian Biotechnological Letters, 15(5), 5655.

226
Porta, C., Paglino, C. & Mosca, A. (2014). Targeting PI3K/AKT/mTOR signaling
in cancer. Frontiers in Oncology, 4: 64.
Pos, O., Oostendorp, R. A. J., Stelt, M. E., Scheper, R. J. & Dijk, W. (1990a).
Con A-nonreactive human α1-acid glycoprotein (AGP) is more effective in
modulation of lymphocyte proliferation than Con A-reactive AGP serum
variants. Inflammation, 14(2), 133-141.
Pos, O., Van Der Stelt, M. E., Wolbink, G. J., Nusten, M. W. N., Van Der
Tempel, G. L. & Van Dijk, W. (1990b). Changes in the serum
concentration and the glycosylation of human αl-acid glycoprotein and αl-
protease inhibitor in severely burned persons: relation to interleukin-6
levels. Clinical & Experimental Immunology, 82(3), 579-582.
Potapenko, I.O., Haakensen, V.D., Luders, T., Helland, A., Bukholm, I., Sorlie,
T., Kristensen, V.N., Lingaerde, O.C. & Borresen-Dale, A. (2010). Glycan
gene expression signatures in normal and malignant breast tissue; a
possible role in diagnosis and progression. Molecular Oncology, 4(2), 98-
118.
Prager, G.W., Braemswig, K.H., Martel, A., Unseid, M., Heinze, G., Brodowicz,
T., Scheithauer, W., Komek, G. & Zielinksi, C.C. (2014). Baseline
carcinoembryonic antigen (CEA) serum levels predict bevacizumab-
based treatment response in metastatic colorectal cancer. Cancer
Science, 105(8), 996-1001.
Pukhal'skiĭ, A. L., Toptygina, A. P., Kalashnikova, E. A., Shiian, S. D., Nasonov,
V. V., Bovin, N. V., Liutov, A. G. & Baĭrushin, F. T. (1994).
Immunomodulating effects of alpha1-acid glycoprotein (orosomucoid) in
cultured human peripheral blood lymphocytes]. Bulletin of Experimental
Biology, 118(7), 71.
Pusztai, L., Mazouni, C., Anderson, K., Wu, Y. & Symmans, W. F. (2006).
Molecular Classification of Breast Cancer: Limitations and Potential. The
Oncologist, 11(8), 868-877.
Rademacher, T. W., Parekh, R. B. & Dwek, R. A. (1988). Glycobiology. Annual
Review of Biochemistry, 57(1), 785-838.

227
Radhakrishnan, P., Dabelsteen, S., Madsen, F.B., Francavilla, C., Kopp, K.L.,
Steentoft, C., Vakhrushev, S.Y., Olsen, J.V., Hansen, L., Bennett, E.P.,
Woetmann, A., Yin, G., Chen, L., Song, H., Bak, M., Hlady, R.A., Peters,
S.L., Opavsky, R., Thode, C., Qvortrup, K., Schjoldager, K.T.B.G.,
Clausen, H., Hollingsworth, M.A., & Wandall, H.H. (2014). Immature
truncated O-glycophenotype of cancer directly induces oncogenic
features. Proceedings of the National Academy of Sciences of the United
States of America, 111(39): E4066-E4075.
Rahn, J.J., Dabbagh, L., Pasdar, M. & Hugh, J.C. (2001). The importance of
MUC1 cellular localization in patients with breast carcinoma: an
immunohistologic study of 71 patients and review of the literature.
Cancer, 91,1973-1982.
Rakha, E. A., Reis-Filho, J. S. & Ellis, I. O. (2008). Basal-Like Breast Cancer: A
Critical Review. Journal of Clinical Oncology, 26(15), 2568-2581.
Rebbeck, T. R., Friebel, T., Lynch, H. T., Neuhausen, S. L., van ’t Veer, L.,
Garber, J. E., Evans, G. R., Narod, S. A., Isaacs, C., Matloff, E., Daly, M.
B., Olopade, O. I. & Weber, B. L. (2004). Bilateral Prophylactic
Mastectomy Reduces Breast Cancer Risk in BRCA1 and BRCA2
Mutation Carriers: The PROSE Study Group. Journal of Clinical
Oncology, 22(6), 1055-1062.
Rebbeck, T. R., Friebel, T., Wagner, T., Lynch, H. T., Garber, J. E., Daly, M. B.,
Isaacs, C., Olopade, O. I., Neuhausen, S. L., van ′t Veer, L., Eeles, R.,
Evans, D. G., Tomlinson, G., Matloff, E., et al. (2005). Effect of Short-
Term Hormone Replacement Therapy on Breast Cancer Risk Reduction
After Bilateral Prophylactic Oophorectomy in BRCA1 and BRCA2
Mutation Carriers: The PROSE Study Group. Journal of Clinical
Oncology, 23(31), 7804-7810.
Rebbeck, T. R., Kauff, N. D. & Domchek, S. M. (2009). Meta-analysis of Risk
Reduction Estimates Associated With Risk-Reducing Salpingo-
oophorectomy in BRCA1 or BRCA2 Mutation Carriers. Journal of the
National Cancer Institute, 101(2), 80-87.

228
Recchi, M.A., Hebbar, M., Hornez, L., Harduin-Lepers, A., Peyrat, J.P. &
Delannoy, P. (1998). Multiplex reverse transcription polymerase chain
reaction assessment of sialyltransferase expression in human breast
cancer. Cancer Research, 58(18), 4066-4070.
Rich, J. R. & Withers, S. G. (2009). Emerging methods for the production of
homogeneous human glycoproteins. Nature Chemical Biology, 5(4), 206-
215.
Rifai, N., Gillette, M. A. & Carr, S. A. (2006). Protein biomarker discovery and
validation: the long and uncertain path to clinical utility. Nature
Biotechology, 24(8), 971-983.
Ritte, R., Lukanova, A., Berrino, F., Dossus, L., Tjonneland, A., Olsen, A.,
Overvad, T., Overvad, K., Clavel-Chapelon, F., Fournier, A., Fagherazzi,
G., Rohrmann, S., Teucher, B., Boeing, H., et al. (2012). Adiposity,
hormone replacement therapy use and breast cancer risk by age and
hormone receptor status: a large prospective cohort study. Breast Cancer
Research, 14(3), R76.
Roberts, J. G., Keyser, J. W. & Baum, M. (1975). Serum α-1-acid glycoprotein
as an index of dissemination in breast cancer. British Journal of Surgery,
62(10), 816-819.
Robertson, J. F. R., Jaeger, W., Syzmendera, J. J., Selby, C., Coleman, R.,
Howell, A., Winstanley, J., Jonssen, P. E., Bombardieri, E., Sainsbury, J.
R. C., Gronberg, H., Kumpulainen, E. & Blamey, R. W. (1999). The
objective measurement of remission and progression in metastatic breast
cancer by use of serum tumour markers. European Journal of Cancer,
35(1), 47-53.
Rocklin, R. D. & Pohl, C. A. (1983). Determination of Carbohydrates by Anion
Exchange Chromatography with Pulsed Amperometric Detection. Journal
of Liquid Chromatography, 6(9), 1577-1590.
Roos, C., Kolmer, M., Mattila, P. & Renkonen, R. (2002). Composition of
Drosophila melanogaster proteome involved in fucosylatiod glycan
metabolism. The Journal of Biological Chemistry, 227, 3168-3175.

229
Routledge, P. A. (1989). Clinical relevance of alpha 1 acid glycoprotein in health
and disease. Progress in clinical and biological research, 300, 185.
Rouzier, R., Perou, C. M., Symmans, W. F., Ibrahim, N., Cristofanilli, M.,
Anderson, K., Hess, K. R., Stec, J., Ayers, M., Wagner, P., Morandi, P.,
Fan, C., Rabiul, I., Ross, J. S., et al. (2005). Breast Cancer Molecular
Subtypes Respond Differently to Preoperative Chemotherapy. Clinical
Cancer Research, 11(16), 5678-5685.
Roy, L.D., Sahraei, M., Subramani, D.B., Besmer, D., Nath, S., Tinder, T.L.,
Bajaj, E., Shanmugam, K., Lee, Y.Y., Hwang, S., Gendler, S. &
Mukherjee, P. (2011). MUC1 enhances invasiveness of pancreatic
cancer cells by inducing epithelial to mesenchymal transition. Oncogene,
30(12), 1449-1459.
Royle, L., Campbell, M., Radcliffe, C., White, D., Harvey, D., Abrahams, J., Kim,
Y., Henry, G, Shadick, N., Weinblatt, M., Lee, D., Rudd, P. & Dwek, R.
(2008). HPLC-based analysis of serum N-glycans on a 96-well plate
platform with dedicated database software. Analytical Biochemistry,
376(1), 1-12.
Rudman, D., Chawla, R. K., Del Rio, A. E., Hollins, B. M., Hall, E. C. & Conn, J.
M. (1974). Orosomucoid content of pleural and peritoneal effusions.
Journal of Clinical Investigation, 54(1), 47-155.
Rutter, J. L., Wacholder, S., Chetrit, A., Lubin, F., Menczer, J., Ebbers, S.,
Tucker, M. A., Struewing, J. P. & Hartge, P. (2003). Gynecologic
Surgeries and Risk of Ovarian Cancer in Women With BRCA1 and
BRCA2 Ashkenazi Founder Mutations: An Israeli Population-Based
Case–Control Study. Journal of the National Cancer Institute, 95(14),
1072-1078.
Rydén, I., Påhlsson, P., Lundblad, A. & Skogh, T. (2002). Fucosylation of α1-
acid glycoprotein (orosomucoid) compared with traditional biochemical
markers of inflammation in recent onset rheumatoid arthritis. Clinica
Chimica Acta, 317(1-2), 221-229.

230
Sakorafas, G. H. & Farley, D. R. (2003). Optimal management of ductal
carcinoma in situ of the breast. Surgical Oncology, 12(4), 221-240.
Saldova, R., Wormald, M. R., Dwek, R. A. & Rudd, P. M. (2008). Glycosylation
changes on serum glycoproteins in ovarian cancer may contribute to
disease pathogenesis. Disease Markers, 25(4), 219-232.
Saldova, R., Reuben, J.M., Hamid, A.U.M., Rudd, P. & Criastofanilli, M.(2011).
Levels of specific serum N-glycans identify breast cancer patients wth
higher circulating tumour cell counts. Annals of Oncology, 22(5), 1113-
1119.
Sanyal, S. & Menon, A. K. (2009). Specific transbilayer translocation of dolichol-
linked oligosaccharides by an endoplasmic reticulum flippase.
Proceedings of the National Academy of Sciences, 106(3), 767-772.
Sapra, P., Damelin, M., DiJoseph, J., Marquette, K., Geles, K., Golas, J.,
Dougher, M., Narayanan, B., Giannakou, A., Khandke, K., Dushin, R.,
Ernstoff, E., Lucas, J., Leal, M., Hu, G., O'Donnell, C., Tchistiakova, L.,
Abraham, R. & Gerber, H. (2012). Long-term tumour regression indiced
by an antibody-drug conjugate that targets FT4, an oncofetal antigen
expressed on tumour-initiating cells. Molecular Cancer Therapeutics,
12(1), 38-47.
Saraswathy, N. & Ramalingam, P. (2011). Concepts and Techniques in
Genomics and Proteomics, 1st Edition. Woodhead Publishing.
Saroha, A., Biswas, S., Chatterjee, B. P. & Das, H. R. (2011). Altered
glycosylation and expression of plasma alpha-1-acid glycoprotein and
haptoglobin in rheumatoid arthritis. Journal of Chromatography B,
879(20), 1839-1843.
Sasieni, P. D., Shelton, J., Ormiston-Smith, N., Thomson, C. S. & Silcocks, P.
B. (2011). What is the lifetime risk of developing breast cancer? : the
effect of adjusting for mutliple primaries. British Journal of Cancer 105,
460-465.

231
Sasisekharan, R. & Myette, J. R. (2003). The Sweet Science of Glycobiology:
Complex carbohydrates, molecules that are particularly important for
communication among cells, are coming under systematic study.
American Scientist, 91(5), 432-441.
Schmid, K. (1989). Human plasma alpha 1-acid glycoprotein--biochemical
properties, the amino acid sequence and the structure of the
carbohydrate moiety, variants and polymorphism. Progress in Clinical
and Biological Research, 300, 7-22.
Schmid, K., Kaufmann, H., Isemura, S., Bauer, F., Emura, J., Motoyama, T.,
Ishiguro, M. & Nanno, S. (1973). Structure of α1-acid glycoprotein. The
complete amino acid sequence, multiple amino acid substitutions and
homology with the immunoglobulins. Biochemistry, 12, 2711-2724.
Schmid, K., Mao, S., Kimura, A., Hayashi, S. & Binette, J. P. (1980). Isolation
and characterization of a serine-threonine-rich galactoglycoprotein from
normal human plasma. Journal of Biological Chemistry, 255(7), 3221-
3226.
Schneider, F., Kemmner, W., Haensch, W., Franke, G., Gretschel, S., Karsten,
U. & Schlag, P.M. (2001). Overexpression of sialyltransferase CMP-sialic
acid:Galbeta1,3GalNac-R alpha6-sialyltransferase is related to poor
patient survival in human colorectal carcinomas. Cancer Research,
61(11), 4605-4611.
Schneider, B. P., Winer, E. P., Foulkes, W. D., Garber, J., Perou, C. M.,
Richardson, A., Sledge, G. W. & Carey, L. A. (2008). Triple-Negative
Breast Cancer: Risk Factors to Potential Targets. Clinical Cancer
Research, 14(24), 8010-8018.
Schroeder, J.A., Adriance, M.C., Thompson, M.C., Camenisch, TD. & Gendler,
S.J. (2003). MUC1 alters beta-catenin-dependent tumor formation and
promotes cellular invasion. Oncogene, 22(9), 1324-1332.
Sears, P. & Wong, C. H. (1998). Enzyme action in glycoprotein synthesis.
Cellular and Molecular Life Sciences, 54(3), 223-252.

232
Semaan, S.M., Wang, X., Marshall, A.G. & Sang, Q.A. (2012). Identification of
potential glycoprotein biomarkers in estrogen receptor positive (ER+) and
negative (ER-) human breast cancer tissues by LC-LTQ/FT-ICR mass
spectrometry. Journal of Cancer, 3, 269-284.
Seregni, E., Coli, A. & Mazzuca, N. (2008). Circulating Tumour Markers in
Breast Cancer. In E. Bombardieri, L. Gianni & G. Bonadonna (Eds.), (pp.
33-42): Springer Berlin Heidelberg.
Sewell, R., Bäckström, M., Dalziel, M., Gschmeissner, S., Karlsson, H., Noll, T.,
Gätgens, J., Clausen, H., Hansson, G. C., Burchell, J. & Taylor-
Papadimitriou, J. (2006). The ST6GalNAc-I Sialyltransferase Localizes
throughout the Golgi and Is Responsible for the Synthesis of the Tumor-
associated Sialyl-Tn O-Glycan in Human Breast Cancer. Journal of
Biological Chemistry, 281(6), 3586-3594.
Shah, M.H., Telang, S.D., Shah, P.M. & Patel, P.S. (2008). Tissue and serum
alpha2-3- and alpha2-6-linkage specific sialylation changes in oral
carcinogensis. Glycoconjugate Journal, 25(3), 279-290.
Shiyan, S. & Bovin, N. (1997). Carbohydrate composition and
immunomodulatory activity of different glycoforms of α1-acid glycoprotein.
Glycoconjugate Journal, 14(5), 631-638.
Siegel, R., DeSantis, C., Virgo, K., Stein, K., Mariotto, A., Smith, T., Cooper, D.,
Gansler, T., Lerro, C., Fedewa, S., Lin, C., Leach, C., Cannady, R. S.,
Cho, H., et al. (2012). Cancer treatment and survivorship statistics, 2012.
CA: A Cancer Journal for Clinicians, 62(4), 220-241.
Silamut, K., Molunto, P., Ho, M., Davis, T. M. & White, N. J. (1991). Alpha 1-
acid glycoprotein (orosomucoid) and plasma protein binding of quinine in
falciparum malaria. British Journal of Clinical Pharmacology, 32(3), 311.
Simpson, P., Gale, T., Fulford, L., Reis-Filho, J. & Lakhani, S. (2003). The
diagnosis and management of pre-invasive breast disease: Pathology of
atypical lobular hyperplasia and lobular carcinoma in situ. Breast Cancer
Research, 5(5), 258 - 262.

233
Siroy, A., Abdul-Karim, F.W., Miedler, J., Fong, N., Fu, P., Gilmore, H. & Baar,
J. (2013). MUC1 is expressed at high frequency in early-stage basal-like
triple negative breast cancer. Human Pathology, 44(10), 2159-2166.
Skytte, A. B., Crüger, D., Gerster, M., Lænkholm, A. V., Lang, C., Brøndum-
Nielsen, K., Andersen, M. K., Sunde, L., Kølvraa, S. & Gerdes, A. M.
(2011). Breast cancer after bilateral risk-reducing mastectomy. Clinical
Genetics, 79(5), 431-437.
Smith, K., Behan, J., Matthews-Smith, G. & Magliocco, A. M. (2012). Alpha-1-
Acid Glycoprotein (AGP) as a Potential Biomarker for Breast Cancer.
Smith, K. D., Elliott, M. A., Elliott, H. G., McLaughlin, C. M., Wightman, P. &
Wood, G. C. (1994). Heterogeneity of α1-acid glycoprotein in rheumatoid
arthritis. Journal of Chromatography B: Biomedical Sciences and
Applications, 661(1), 7-14.
Smith, K. D., Hounsell, E. F., McGuire, J. M., Elliott, M. A. & Elliott, H. G. (1997).
Structural Elucidation of the N-linked oligosaccharides of glycoproteins
using high pH anion- exchange chromatography. Advances in
Macromolecular Carbohydrate Research, 1, 65-91.
Smith, K. D., Pollacchi, A., Field, M. & Watson, J. (2002). The heterogeneity of
the glycosylation of alpha 1 acid glycoprotein between the sera and
synovial fluid in rheumatoid arthritis. Biomedical Chromatography, 16(4),
261-266.
Snyder, S. & Coodley, E. L. (1976). Inhibition of Platelet Aggregation by
{alpha}1-Acid Glycoprotein. Archives of Internal Medicine, 136(7), 778-
781.
Sobin, L., Gospodarowicz, M. & Wittekind, C. (2009). The TNM Classification of
Malignant Tumours 7th Edition: Union for International Cancer Control.
Somasundaram, K., Nijaguna, M. B. & Kumar, D. M. (2009). Serum proteomics
of glioma: methods and applications. Expert Review of Molecular
Diagnostics, 9(7), 695-707.

234
Sonnenfeld, M. R., Frenna, T. H., Weidner, N. & Meyer, J. E. (1991). Lobular
carcinoma in situ: mammographic-pathologic correlation of results of
needle-directed biopsy. Radiology, 181(2), 363-367.
Sørlie, T., Perou, C. M., Tibshirani, R., Aas, T., Geisler, S., Johnsen, H., Hastie,
T., Eisen, M. B., van de Rijn, M. & Jeffrey, S. S. (2001). Gene expression
patterns of breast carcinomas distinguish tumor subclasses with clinical
implications. Proceedings of the National Academy of Sciences, 98(19),
10869-10874.
Sørlie, T., Tibshirani, R., Parker, J., Hastie, T., Marron, J., Nobel, A., Deng, S.,
Johnsen, H., Pesich, R. & Geisler, S. (2003). Repeated observation of
breast tumor subtypes in independent gene expression data sets.
Proceedings of the National Academy of Sciences, 100(14), 8418-8423.
Sotiriou, C., Neo, S.-Y., McShane, L. M., Korn, E. L., Long, P. M., Jazaeri, A.,
Martiat, P., Fox, S. B., Harris, A. L. & Liu, E. T. (2003). Breast cancer
classification and prognosis based on gene expression profiles from a
population-based study. Proceedings of the National Academy of
Sciences, 100(18), 10393-10398.
Sousa, M. C., Ferrero-Garcia, M. A. & Parodi, A. J. (1992). Recognition of the
oligosaccharide and protein moieties of glycoproteins by the UDP-
Glc:glycoprotein glucosyltransferase. Biochemistry, 31(1), 97-105.
Stowell, S.R., Ju, T.& Cummings, R.D. (2015). Protein glycosylation in cancer.
Annual Review of Pathology, 10, 473-510.
Su, S. J. & Yeh, T. M. (1996). Effects of alpha 1-acid glycoprotein on tissue
factor expression and tumor necrosis factor secretion in human
monocytes. Immunopharmacology, 34(2–3), 139-145.
Sugiyama, Y., Suzuki, Y., Sawada, Y., Kawasaki, S., Beppu, T., Iga, T. &
Hanano, M. (1985). Auramine O as a fluorescent probe for the binding of
basic drugs to human alpha-1-acid glycoprotein. The development of a
simple fluorometric method for the determination of alpha-1-acid
glycoprotein in human serum. Biochemical Pharmacology, 34(6), 821-
829.

235
Swerdlow, A. J., Cooke, R., Bates, A., Cunningham, D., Falk, S. J., Gilson, D.,
Hancock, B. W., Harris, S. J., Horwich, A., Hoskin, P. J., Linch, D. C.,
Lister, T. A., Lucraft, H. H., Radford, J. A., et al. (2012). Breast Cancer
Risk After Supradiaphragmatic Radiotherapy for Hodgkin's Lymphoma in
England and Wales: A National Cohort Study. Journal of Clinical
Oncology, 30(22), 2745-2752.
Szabo, Z., Bones, J., Guttman, A., Glick, J., & Karger, B.L. (2012). Sialic Acid
Speciation Using Capillary Electrophoresis: Optimization of Analyte
Derivatization and Separation. Analytical Chemistry, 84(18), 7638-7642.
Taguchi, K., Nishi, K., Chuang, V. T. G., Maruyama, T. & Otagiri, M. (2013).
Molecular Aspects of Human Alpha-1 Acid Glycoprotein—Structure and
Function. New York, United States: InTech.
Takahashi, M., Kuroki, Y., Ohtsubo, K. & Taniguchi, N. (2009). Core fucose and
bisecting GlcNAc, the direct modifiers of the N-glycan core: their
functions and target proteins. Carbohydrate Research, 344(12), 1387-
1390.
Tamura, K., Shibata, Y., Matsuda, Y. & Ishida, N. (1981). Isolation and
characterisation of an immunosuppressive acidic protein from ascitic
fluids of cancer patients. Cancer Research, 41, 3244-3252.
Taylor, M. E. & Drickamer, K. (2003). Introduction to Glycobiology: Oxford
University Press Limited.
The Scottish Government. (2009). CANCER GENETICS SERVICES IN
SCOTLAND - Management of Women with a Family History of Breast
Cancer. In H. P. Division (Ed.).
Townsend, R., Hardy, M. R., Cumming, D. A., Carver, J. P. & Bendiak, B.
(1989). Separation of branched sialylated oligosaccharides using high-pH
anion-exchange chromatography with pulsed amperometric detection.
Analytical Biochemistry, 182(1), 1-8.
Townsend, R. R., Hardy, M., Olechno, J. D. & Carter, S. R. (1988).
Chromatography of carbohydrates. Nature, 335(6188), 379-380.

236
Travis, J., Bowen, J., Tewksbury, D., Johnson, D. & Pannell, R. (1976). Isolation
of albumin from whole human plasma and fractionation of albumin-
depleted plasma. Biochemical Journal, 157(2), 301-306.
Treuheit, M. J., Costello, C. E. & Halsall, H. B. (1992). Analysis of the five
glycosylation sites of human alpha 1-acid glycoprotein. Biochemical
Journal, 283(Pt 1), 105.
Turner, G. A., Skillen, A. W., Buamah, P., Guthrie, D., Welsh, J., Harrison, J. &
Kowalski, A. (1985). Relation between raised concentrations of fucose,
sialic acid, and acute phase proteins in serum from patients with cancer:
choosing suitable serum glycoprotein markers. Journal of Clinical
Pathology, 38(5), 588-592.
Twining, S. S. & Brecher, A. S. (1977). Identification of α1-acid glycoprotein, α2-
macroglobulin and antithrombin III as components of normal and
malignant human tissues. Clinica Chimica Acta, 75(1), 143-148.
Underwood, J. C. E. (2004). General and Systemic Pathology. : Churchill
Livingstone, Elsevier Limited.
van Dijk, W., Pos, O., Van der Stelt, M., Moshage, H., Yap, S. H., Dente, L.,
Baumann, P. & Eap, C. (1991). Inflammation-induced changes in
expression and glycosylation of genetic variants of alpha 1-acid
glycoprotein. The Biochemical Journal, 276, 343-347.
van Dijk, W., Turner, G. A. & Mackiewicz, A. (1994). Changes in glycosylation of
acute-phase proteins in health and disease: occurrence, regulation and
function. Glycosylation and Disease, 1(1), 5-14.
Varki, A. (1992). Diversity in the Sialic Acids. Glycobiology, 2(1), 25-40.
Varki, A. (1993). Biological roles of oligosaccharides: all of the theories are
correct. Glycobiology, 3(2), 97-130.
Varki, A., Cummings, R.D., Esko, J.D., Freeze, H.H., Stanley, P., Bertozzi, C.R.,
Hart, G.W., and Etzler, M.E. . (2009). Essentials of Glycobiology (2nd
Edition ed.): Cold Spring Harbour Laboratory Press.

237
Voduc, K. D., Cheang, M. C. U., Tyldesley, S., Gelmon, K., Nielsen, T. O. &
Kennecke, H. (2010). Breast Cancer Subtypes and the Risk of Local and
Regional Relapse. Journal of Clinical Oncology, 28(10), 1684-1691.
Walsh, T., Casadei, S., Coats, K. & et al. (2006). Spectrum of mutations in
BRCA1, BRCA2, CHEK2, and TP53 in families at high risk of breast
cancer. The Journal of the American Medical Association, 295(12), 1379-
1388.
Wang, Y., Shao, L., Shi, S., Harris, R., Spellman, M., Stanley, P. & Haltiwanger,
R. (2001). Modification of epidermal growth factor-like repeats with O-
fucose. Molecular cloning and expression of a novel GDP-fucose protein
O-fucosyltransferase. The Journal of Biological Chemistry, 276, 40338-
40345.
Warburg, O. (1928). The chemical constitution of respiration ferment. Science,
68, 437-443.
Ware, F.E., Vassilakos, A., Peterson, P.A., Jackson, M.R., Lehrman, M.A. &
Williams, D.B. (1995). The molecular chaperone calnexin binds
Glc1Man9GlcNAc2 oligosaccharide as an initial step in recognizing
unfolded glycoproteins. Journal of Biological Chemistry, 270, 4697-4704.
Watanabe, N., Neda, H., Sone, H., Yamauchi, N., Umetsu, T., Niitsu, Y. &
Urushizaki, I. (1986). Analysis of TNF receptor by binding assay. Gan To
Kagaku Ryoho, 13(8), 2630-2636.
Wei, X., Xu, H. & Kufe, D. (2005). Human MUC1 oncoprotein regulates p53-
responsive gene treanscription in the genotoxic stress response. Cancer
Cell, 7(2), 167-178.
Weigelt, B., Geyer, F. C. & Reis-Filho, J. S. (2010). Histological types of breast
cancer: How special are they? Molecular Oncology, 4(3), 192-208.
Weimer, H. E., Mehl, J. W. & Winzler, R. J. (1950). Studies on the mucoproteins
of human plasma. V. Isolation and characterization of a homogeneous
mucoprotein. Journal of Biological Chemistry, 185(2), 561-568.

238
Welsh Cancer Intelligence and Surveillance Unit. (2014). Female Breast
Cancer, 1985-2012: Welsh Cancer Intelligence and Surveillance Unit.
Whelan, L. C., Power, K. A. R., McDowell, D. T., Kennedy, J. & Gallagher, W.
M. (2008). Applications of SELDI-MS technology in oncology. Journal of
Cellular and Molecular Medicine, 12(5a), 1535-1547.
Widmer, N., Decosterd, L. A., Csajka, C., Leyvraz, S., Duchosal, M. A.,
Rosselet, A., Rochat, B., Eap, C. B., Henry, H. & Biollaz, J. (2006).
Population pharmacokinetics of imatinib and the role of α1-acid
glycoprotein. British Journal of Clinical Pharmacology, 62(1), 97-112.
Williams, D. & Fleming, J. (2007). Spectroscopic Methods in Organic Chemistry
(6th Edition ed.): McGraw-Hill Education - Europe.
Williams, J. P., Weiser, M. R., Pechet, T. T. V., Kobzik, L., Moore, F. D. &
Hechtman, H. B. (1997). α1-Acid glycoprotein reduces local and remote
injuries after intestinal ischemia in the rat. American Journal of
Physiology-Gastrointestinal and Liver Physiology, 273(5), 1031-1035.
Williams, M. R., Turkes, A., Pearson, D., Twining, P., Griffiths, K. & Blamey, R.
W. (1988). The use of serum carcinoembryonic antigen to assess
therapeutic response in locally advanced and metastatic breast cancer: a
prospective study with external review. The Journal of the European
Society of Surgical Oncology and the British Association of Surgical
Oncology, 14(5), 417.
Wooster, R., Neuhausen, S. L., Mangion, J., Quirk, Y., Ford, D., Collins, N.,
Nguyen, K., Seal, S., Tran, T., Averill, D. & et, a. (1994). Localization of a
breast cancer susceptibility gene, BRCA2, to chromosome 13q12-13.
Science, 265(5181), 2088-2090.
World Cancer Research Fund. (2011). World Cancer Statistic: Breast Cancer.
Retrieved 7th January, 2012
Wormald, M. R. & Dwek, R. A. (1999). Glycoproteins: glycan presentation and
protein-fold stability. Structure, 7(7), R155-R160.

239
Wu, C., Guo, X., Wang, W., Wang.Y., (2010). N-acetylglucosaminyltransferase-
14 as a potential biomarker for breast cancer by immunohistochemistry.
Biomed Central Cancer, 10, 123.
Xia, B., Royall, J., Damera, G., Sachdev, G. & Cummings, R. (2005). Altered O-
glycosylation and sulfation of airway mucins associated with cystic
fibrosis. Glycobiology, 15(8), 747-775.
Yuan, J., Hashii, N., Kawasaki, N., Itoh, S., Kawanishi, T. & Hayakawa, T.
(2005). Isotope tag method for quantitative analysis of carbohydrates by
liquid chromatography-mass spectrometry. Journal of Chromatography A,
1067(1-2), 145-152.
Yoshima, H., Matsumoto, A., Mizuochi, T., Kawasaki, T. & Kobata, A. (1981).
Comparative study of the carbohydrate moieties of rat and human plasma
alpha 1-acid glycoproteins. Journal of Biological Chemistry, 256(16),
8476-8484.
Zhang, X., Chen, B., He, M., Zhang, Y., Xiao, G. & Hu, B. (2015). Magnetic
immunoassay coupled with inductively coupled plasma mass
spectrometry for simultaneous quantification of alpha-fetoprotein and
carcinoembryonic antigen in human serum. Spectrochimica Acta Part B,
106. 20-27.
Zhu, X. & Sato, T. (2007). The distinction of underivatized monosaccharides
using electrospray ionization ion trap mass spectrometry. Rapid
Communications in Mass Spectrometry, 21(2), 191-198.
Zsila, F., Fitos, I., Bencze, G., Keri, G. & Orfi, L. (2009). Determination of
human serum alpha-1-acid glycoprotein and albumin binding of various
marketed and preclinical kinase inhibitors. Current Medicinal Chemistry,
16(16), 1964-1977.

240
Appendix

241
Appendix 1 – NHS Lothian REC Approval.

242

243
244

245
Appendix 2 – NHS Lothian REC Amendment Approval.

246
Appendix 3 – Case Invitation Letter.

247
Appendix 4 – Case Participant Information Sheet.

248

249
Appendix 5 – Case Consent Form.

250
Appendix 6 – Case Data Collection Sheet.

251
Appendix 7 – Age-matched Control Recruitment Poster.

252
Appendix 8 – Age-matched Control Participant Information Sheet.
253

254

255
Appendix 9 – Age-matched Control Consent Form.

256
Appendix 10 – Age-matched Control Data Collection Sheet.

257
Appendix 11 – Case Reply Slip.