0049349e.pdf - Edinburgh Research Archive
270
This thesis has been submitted in fulfilment of the requirements for a postgraduate degree (e.g. PhD, MPhil, DClinPsychol) at the University of Edinburgh. Please note the following terms and conditions of use: • This work is protected by copyright and other intellectual property rights, which are retained by the thesis author, unless otherwise stated. • A copy can be downloaded for personal non-commercial research or study, without prior permission or charge. • This thesis cannot be reproduced or quoted extensively from without first obtaining permission in writing from the author. • The content must not be changed in any way or sold commercially in any format or medium without the formal permission of the author. • When referring to this work, full bibliographic details including the author, title, awarding institution and date of the thesis must be given.
-
Upload
khangminh22 -
Category
Documents
-
view
1 -
download
0
Transcript of 0049349e.pdf - Edinburgh Research Archive

This thesis has been submitted in fulfilment of the requirements for a postgraduate degree
(e.g. PhD, MPhil, DClinPsychol) at the University of Edinburgh. Please note the following
terms and conditions of use:
• This work is protected by copyright and other intellectual property rights, which are
retained by the thesis author, unless otherwise stated.
• A copy can be downloaded for personal non-commercial research or study, without
prior permission or charge.
• This thesis cannot be reproduced or quoted extensively from without first obtaining
permission in writing from the author.
• The content must not be changed in any way or sold commercially in any format or
medium without the formal permission of the author.
• When referring to this work, full bibliographic details including the author, title,
awarding institution and date of the thesis must be given.
Carrier state studies in Theileria parva infected cattle in Zimbabwe
Samuel Musekiwa Masaka
Thesis submitted for Master of Philosophy degree in Veterinary Science
University of Edinburgh 1997
I
i
\

Dedication
To, Panashe, Mudikani and Catherine
Such little recompense for long hours of loneliness.

List of tables
List of figures
List of abbreviations
Acknowledgements
Summary
CHAPTER ONE
CONTENTS
Carrier state studies in Theileria parva infected cattle in Zimbabwe
INTRODUCTION
Chapter two
Literature Review
2.1 Identification and classification of T. parva
2.2 Life Cycle and Transmission
2.3 Pathogenesis of Theileriosis
2.4 Characterisation of T. parva stocks
2.4.1 Cross immunity
2.4.2 Infectivity
2.4.3 Drug testing
2.4.4 Monoclonal antibody profiles (MAbs)
2.4.5 Protein analysis
2.4.6 DNA analysis
2.5 . Immunity to· T. parva
2.6 Diagnostic methods for T. parva infection
2.6.1 Clinical signs
2.6.2 Microscopy
2.6.3 Antibody Detection
2.7 Control of Theileriosis and other T:ck-bome diseases
2.7.1 Chemotherapy
2.7.2 Vaccination
2.7.3 Recombinant DNA vaccines
Page No.
vi
viii
xii
xiv
XV
14
14
14
15
19
22
23
23
24
24
25
26
28
30
30
32
33
33
35
36
39

2.8 Carrier State
CHAPTER THREE
Infection of experimental animals with Theileria parva parasites
3.1 INTRODUCTION
3.2 An overview of the experiments
3.3 Materials and methods
3.3.1 Experimental calves and maintenance
3.3.2 T parva parasite stocks
3.3.3 Infection of experimental animals with ground up tick stabilates
3.3.4 Infections by application of adult R. appendiculatus ticks
3.3.5 Field exposure of calves at Hunyani estates
3.4 Monitoring and assessment ofTheilerial infections during
primary reaction
3.5 Monitoring between recovery and challenge
3.6 Characterisation of the Hunyani isolate with
Mono clonal Antibodies (MAbs)
3.7 RESULTS
3.7.1 Reactions to primary infection
3.7.2 Reactions to T parva Boleni and .tvlarikebuni preliminary infection
studies
3.7.3 T parva Boleni infections
3.7.4 T parva A very infections
3.7.5 T parva Bally Vaughan infections
3.7.6 Infections from tick applications
3.7.7 Hunyani field exposure
3.8 Reactions to T parva A very challenge
3.9 Discus~ion
11
Page No.
41
44
45
47
47
49
52
52
53
54
57
60
61
61
62
63
63
64
64
64
66
73
Page No:
CHAPTER FOUR
Detection ofT. parva in carrier I recovered animals using PCR amplification
4.1
4.2
Introduction
Materials and Methods
4.2.1 PCR organisation and precautions
4.2.2 Sample preparation
4.2.2.1 EDT A blood saponin lysis extraction
4.2.2.2 Peripheral blood mononuclear cells (PBM)
4.2.2.3 DNA extraction from PBM
4.2.2.4 DNA extraction from T. parva Muguga piroplasms
4.2.2.5 DNA extraction from T. parva macroschizont cells
4.3 Polymerase chain reaction conditions for p67 T parva primer
76
80
80
82
82
83
83
84
85
sequence 85
4.3.1 Optimisation ofPCR conditions using p67 primers 87
4.4 Polymerase chain reaction conditions forp104 T. parva primer sequence 87
4. 4.1 Sensitivity of PCR assay using p 1 04 primers 88
4.5 Detection ofPCR products. 89
4.5.1 Polyacrylamide gel electrophoresis
4.5.1 (a) Silver staining ofPolyacrylamide gels
4.5.2 Agarose gel electrophoresis of DNA
4.5.3 Preparation ofT parva Muguga probe
4.5.3.1 Blot Preparation
4.5.3.2 DNA labelling and hybridisation
4.6 RESULTS
4.6.1 Specificity ofp67 PCR assay
4.6.2 Optimisation results ofPCR conditions using p67 primers
4.6.3 PCR results forT parva Marikebuni infected
calf ( 818) using p6 7 primers
4.6.4 PCR results forT parva Boleni infected
calf (805) using p67 primers
iii
89
90
90
91
92
93
94
94
94
95
96

Page No:
4.6.5 Specificity of assay using p 104 primers 96
4.6.6 Sensitivity ofPCR assay using p104 primers 97
4.6.7 Results of tests on carrier recovered animals using dot blot hybridisation 97
4.6.7.1 T. parva Boleni infected calves p104 PCR results 97
4.6.7.2 T. parva A very infected calves p104 PCR results 100
4.6.7.3 p104 PCR results ofT. parva Bally Vaughan infected calves 101
4.6.7.4 p104 PCR results of calves infected by application of Ayrshire
and Chikeya ticks
4. 6. 7. 5 p 1 04 PCR results of calves infected by exposure to
ticks at Hunyani Estates (1st exposure)
4.6. 7.6 p 104 PCR results of calves infected by exposure to
ticks at Hunyani Estates (2nd exposure)
4.7 DISCUSSION
CHAPTER FIVE
102
103
103
104
Detection of Theileria parasites in infected I recovered cattle by tick application
5.1 Introduction 126
5.2 J\1aterials and Methods 128
5.2.1 Rabbits and Ticks 128
5.2.2 Application of ticks to cattle to pick up Theileria infections 128
5.2.3 Assessment of ticks for theileria infections using Feulgen stain 129
5.3 Results 132
5.4 Discussion 135
CHAPTER SIX
IFA titres of anti-schizont antibodies in relation to T. parva carrier state
6.1 Introduction 143
6.2 Materials and Methods 144
6.2.1 T. parva Berea macroschizont antigen preparation 145
6.2.2 Preparation of formalin-fixed Theileria macroschizont
antigen slides 145
6.2.3 Control sera 146
IV

6.2.4 Conjugate
6.2.5 IF AT procedure
6.3 RESULTS
6.3.1 Pre-infection titres
6.3.2 Post infection titres
6.3.3 Serological reactions to initial T parva infection
6.3.4 Serological reactions to T parva A very challenge
6.3.5 Control calves results
6.3.6 Relationship ofiFAT to infectivity to ticks
6.4 Discussion
CHAPTER SEVEN
GENERAL DISCUSSION
REFERENCES
APPENDICES
V
Page No.
146
147
149
149
150
151
152
152
153
153
161
178
xvii

LIST OF TABLES
Page No.
Table 2.1
Table 3.1
Table 3.2
Table 3.3
Table 3.4
Table 3.5
Table 3.6
Table 3.7
Table 3.8
Table 3.9
Table 4.1
Table 4.2
Table 5.1
Table 5.2
Classification and features of Theileria
(Levine et al., 1980).
Experimental design for initial animal infections
T. parva stocks used for infection
Mortality due to Theileriosis on Ayrshire and Chikeya farms 53
Sampling protocol for IFAT and PCR
T. parva Marikebuni infected calfNo:818 test results
T. parva Boleni infected calfNo:805 test results
Summary of reactions of calves to initial infection
with Theileria parasites
Summary of cattle reactions to T. parva A very challenge
Results ofHunyani Theileria schizont lyrnphocyte
culture isolates (E 1 , E2, E3, and E4) with
anti-schizont monoclonal antibodies. Two control
cell lines included -T. parva Boleni and Muguga
PCR results for extracts prepared from
3 types of sample for T. parva Marikebuni
infected calfNo: 818 using p67 primers
from the first 30 days post infection
PCR results for extracts prepared from
4 types of sample for T. parva Boleni infected
calfNo: 805 using the p67 primers from the first
30 days post infection
Days of application of R. appendiculatus nymphs
to pick up Theileria infections
Tick numbers successfully dissected after feeding
on rabbits
VI
14
48
51
59
68
69
70
71
72
124
125
131
134

Page No.
Table 5.3 Prevalence of infections in adult R. appendiculatus
ticks that fed as nymphae on Theileria-infected cattle 138
Table 5.4 Prevalence of infections in adult R. appendiculatus
ticks that fed as nymphae on Theileria-infected
cattle. Batch II: 139
Table 5.5 Prevalence of infections in adult R. appendiculatus
ticks that fed as nymphae on Theileria-infected
cattle. Batch Ill. 140
Table 5.6 Prevalence of infections in adult R. appendicu/atus
ticks that fed as nymphae on Theileria-infected
cattle. Batch IV: 141
Table 5.7 Prevalence of infections in adult R. appendiculatus
ticks that fed as nymphae on Theileria-infected
cattle. Hunyani estates 2nd exposure. Batch V: 142
Table 6.1 Sensitivity and specificity of Indirect fluorescent
antibody test for T parva macroschizont antibodies
to different=/- cut-off titres. 151
vii

LIST OF FIGURES
Figure 1.1 (a) Map of Zimbabwe showing R. appendiculatus
distribution and Theileriosis
Page No.
outbreaks 1994 3
Figure 1.1 (b) Map of Zimbabwe showing outbreaks ofTheileriosis 1995 4
Figure 1.2
Figure 2.2
Figure 4.1
Figure 4.2
Figure 4.3a
Figure 4.3b
Figure 4.4
Figure 4.5
Figure 4.6
Figure 4.7
Map of Zimbabwe showing outbreaks ofTheileriosis 1996
Life cycle ofT parva
p67 T parva primer sequence
p 1 04 T parva primer sequence
Photograph of silver stained PAGE ofPCR products to
test specificity assay using p67 T parva primers
Silver stained PAGE ofPCR products from the amplification
of B. bovis piroplasms: to show the presence of amplifiable
B. bovis DNA after saponin lysis, proteinase K digestion
4
17
87
88
108
of bovine blood. 109
Photograph of silver stained PAGE of PCR products to
test specificity assay using p67 T parva primers
Photograph of silver stained PAGE of PCR
products to test specificity assay using p67 T parva
primers with tempelate DNA of Theileria and
Babesia species.
Silver stained PAGE of PCR products to determine
sensitivity of assay. PCR amplification of
T. parva Muguga piroplasm DNA (lane 1-6) and
macroschizont DNA (lane 7-12).
Photograph of silver stained PAGE of
p67 PCR products ofT parva Muguga
piroplasm saponin lysis extracts comparing
the sensitivity between 3 0 and 40 cycle run .
viii
110
Ill
112
113

Page No.
Figure 4.8 An investigation of the effect of increased
dNTP concentration on the sensitivity of the
p67 PCR assay. Ten-fold dilutions of known
T parva Muguga piroplasm positive blood was
tested at 0.2 mM, 0.4 mM and 0.8 mM dNTPs. 114
Figure 4.9 Photograph of silver stained PAGE of p67 PCR
products comparing assay sensitivity to detect
T parva piroplasms in the presence of2.5 mM,
5.0 mM and 10 mM MgCh. 115
Figure 4.10 Silver stained PAGE of PCR products to test
sensitivity of p67 PCR assay with different primer
concentration 116
Figure 4.11 Photograph of silver stained PAGE of PCR
products :PCR amplification of saponin lysed
EDT A blood samples from calf 818 infected
with T parva Marikebuni day 11 to 1 7 post infection.
Two micro litres of sample were tested in PCR assay
with p67 primers after saponin lysis
and proteinase K digestion. 117
Figure 4.12 Photograph of silver stained PAGE ofPCR
products showing :PCR amplification of saponin
lysed EDT A blood, right prescapular gland (RPG)
biopsy material, left prescapular gland (LPG) biopsy
material and PBM phenol chloroformed samples from
calf805 T. parva Boleni day 5 to 9 post infection
Two microlitres of sample were tested in PCR assay
with p67 primers after sapo'lin lysis
and proteinase K digestion. 118
ix

Page No.
Figure 4.13 Photograph of silver stained PAGE ofp67 PCR 119
products showing :
Samples from calf805 T. parva Boleni for
days 10, 11, 12 and 13 post infection.
PCR amplification of extracts from
(a) right prescapular gland (RPG) biopsy
material phenol/ chloroform extract,
(b) left prescapular gland (LPG) biopsy
material phenol/ chloroform extract,
(c) PBM phenol/ chloroform extract
(d) saponin lysed EDTA samples
Figure 4.14 Photograph of silver stained PAGE of p67 PCR
products showing :Samples from calf 805
T parva Boleni for days 16, 17, 18 post infection 120
Figure 4.15 Photograph of silver stained PAGE of p67 PCR
products showing :
Samples from calf 805 T. parva Boleni
for days 19, 20, 21, 22, 23, 24 25 and
EDT A samples from T pan·a Marikebuni
calf 818 days 4 7 and 48 post infection.
PCR amplification of extracts from
(a) right prescapular gland (RPG) biopsy
material phenol I chloroform extract,
(b) left prescapular gland (LPG) biopsy
material phenol I chloroform extract,
(c) PBM phenol/ chloroform extract
(d) saponin lysed EDT A srmples . 121
X

Page No.
Figure 4.16 Agarose gel electrophoresis of PCR products
for p 1 04 PCR specificity 122
Figure 4.17 DNA prepared from various parasite infected
cells, and piroplasms were run on a PCR assay
using p104 primers. PCR products were
slot-blotted, probed with T parva Muguga
random labelled PCR product. The result
of dot blot hybridisation to confirm the PCR
product of 497 bp hybridised to PCR amplification
product from T. parva only: 123
Figure 6.1 Drawing of Antigen-slide with reference number X
and wells A to H for serum dilutions 1/80 to Ill 0240. 147
Figure 6.2 IFAT results of bovine sera samples from Lanark farms 149
Figure 6.3 IF AT results for samples tested post infection 150
Figure 6.4 T. parva anti-schizont antibody response to T. parva
Boleni infection 157
Figure 6.5 T. parva anti-schizont antibody response to T. parva
A very infection 157
Figure 6.6 T. parva anti-schizont antibody response to T parva
Bally Vaughan infection 158
Figure 6.7 T. parva anti-schizont antibody response to
infection by infected tick applications from
Ayrshire and Chikeya farms 158
Figure 6.8 T. parva anti-schizont antibody response to
infection by exposure at Hunyani Estates (1st) 159
Figure 6.9 T. parva anti-schizont antibody response to
L"lfection by exposure at Hrnyani Estates (2"d) 159
Figure 6.10 Relationship tick infection rates and T. parva
anti-schizont antibody titres 160
XI

Ab
Ag
AEC-SA
bp
cpm
CTVM
DNA
dNTP's
EDTA
FCS
FITC
Fig
FP
IFAT
ILRI
Kb
Lab
LPG
MAb
Macs
Macros
MEM
MM
Jll
Jlg
JlM
nuns
ml
mM
M oR
List of Abbreviations
Antibody
Antigen
Associated Chemical Enterprises- South Africa
Base pairs
counts per minute
Centre for Tropical Veterinary Medicine
Deoxyribonucleic Acid
Deoxynucleotide triphosphates
Ethylene Diamine Tetraacetic Acid
Foetal calf serum
Fluorescein isothiocyanate
Figure
Forward Primer
Indirect Fluorescent Antibody Test
International Livestock Research Institute
Kilo bases
Laboratory
Left Prescapular Gland
Monoclonal antibody
Macroschizonts
macroschizonts
Minimum Essential Medium
Master Mix
micro litre
rrucrogram
micro-molar
minutes
millilitre
milli-molar
Moderate reaction
xii

MR Mild reaction
n.d. not done
ng nanogram
NR No reaction
-ve negative
nps no parasites seen
PBM peripheral blood mononuclear cells
PBS Phosphate buffered saline
p.c. post challenge
piros piroplasms
+ve positive
p.l. post infection
PCR Polymerase Chain Reaction
p.t.a. post tick application
RBC Red blood cell
Ref Reference
recip. Reciprocal
REG Right Ear Gland
rpm revolutions per minute
RP Reverse Primer
RPG Right prescapular Gland
SDS Sodium dodecyl sulphate
SR Severe reaction
Taq Thermus aquaticus
TAE Tris-acetate EDT A buffer
TBE Tris-borate EDTA buffer
t.e. tick equivalent
TE Tris EDTA buffer
Temp Temperature
VRL Veterinary Research Laboratories
xiii

ACKNOWLEDGEMENTS
I am very grateful to those that helped me complete this work in one way or
the other. I wish to express my gratitude to my first supervisor Dr. S. M. Williamson
for her immense contribution and constant support throughout the period of study and
the advice during the writing up of this thesis. The support of support in Lab 102 and
1 05 at the CTVM is greatly acknowledged throughout the study. I would like to
extend my warmest thanks to Dr. N. Lally who taught me most of the molecular
biology techniques applied in this thesis during my first year of study. I am sincerely
grateful to Dr. K. Sumption for his supervision during the study.
Special thanks to my second supervisor Dr. S. M~ during the thesis work
in Zimbabwe for his unwavering support, advice on PCR and DNA work, and for
allowing the use of bench space in the Heartwater Immunology lab, reagents and
equipment in the Heartwater section. I very much appreciated his close interest in my
work and his encouragement and most of all his advice.
Special thanks to Mr. B. H. Simbi who assisted me a great deal in the PCR
and DNA work into the "wee" hours of several nights. The assistance of
Protozoology staff, M. Mashamba, T. Hove, L. Kambeva, D. Chikosi, G. Kamutero
and B. Chirema in the general and technical aspects of this work is greatly appreciated
and their time in looking after the experimental animals for over a period of22
months .. Dr. D. Munodzana, in the Protozoology laboratory is thanked for his
involvement with the in vivo monitoring of the experimental animals. Many thanks
are due to the VRL Tick unit for the provision of ticks used in experiments.
Thanks to the British Council and Overseas Development Administration for
the financial support without which this work would not have been possible .
I am very grateful to Dr. E. Anderson -project leader Wildlife Epidemiology Project
(ODA) for his support and in allowing me to use his bench space and molecular grade
reagents. Many thanks are due to my employers for granting me the study leave to
undertake this study. The financial support provided by the FAO tick and Tick-borne
disease programme in Harare is greatly appreciated, especially the provision of
experimental animals.
xiv

SUMMARY
Theileriosis caused by the protozoan parasite Theileria parva, transmitted by
Rhipicephalus appendiculatus ticks, is an important animal disease for the livestock
industry in Zimbabwe. To characterise Zimbabwean T parva parasites, susceptible
calves were infected by 3 methods; (a) subcutaneous inoculation with three T. parva
ground-up-tick stabilates, (b) application of ticks collected from the field and (c) field
exposure. The aim of the study was to characterise the duration of parasitaemia
following infection by the 3 methods, and to compare the sensitivity of the
Polymerase Chain Reaction (PCR) assay with conventional methods for detection of
carrier status.
All the animals seroconverted following infection or tick exposure, as detected in the
Indirect fluorescent antibody test (IF AT) for antibodies to T parva, were
demonstrated to be carriers of infection by PCR for the duration of experiment, and
immune to T parva A very challenge after 522 days under tick free conditions. In
order to demonstrate a carrier status clean R. appendiculatus nymphs were fed on the
recovered animals on 4 dates up to 456 days post infection and allowed to moult to
adults and examined for infection.. Ten out of 14 animals had a carrier status that
resulted in tick infections.
Cultures of Theileria infected lymphoblastoid cells were attempted from animals
which developed theileriosis at Hunyani estates on field exposure. The monoclonal
antibody (MAb) profile indicated infections in each case with Theileria taurotragi
isolates. However, the clinical and post-mortem examination findings of the calves
were typical of T. parva infection. Animals which recovered after treatment had
persistent piroplasm parasitaemia and high infection prevalence in ticks applied. This
implies that onward transmission in cattle occurs with this parasite, with important
implications for causation of severe theileriosis in cattle. Tick infections did not occur
following feeding on calves recovered from buffalo derived T parva Bally Vaughan
isolate or with T. parva Avery isolete. Infections with field parasites were found to
result in more efficient transmission of Theileria parasites to ticks than the Bolvac®
vaccine stock; the former could be associated with the more persistent piroplasm
parasitaemia in the recovered animals and the severity of the Theileria clinical
XV
reactions. PCR using p 1 04 primer sequences for rhoptry I microneme antigens of T.
parva was the most sensitive indicator of carrier status. Clinical signs upon infection
were not correlated with persistence of infection; carriage of parasite DNA occurred
irrespective of initial severity. The IF A test was validated using sera from the carrier
animals and naive animals pre-infection. The IFAT titre required to detect all infected
animals was 1:160, at which the test had a specificity of only 64.63%. An IFAT cut
off titre of 1:320 resulted in a sensitivity and specificity of 90.49.% and 88.06%
respectively. The current cut-off used in Zimbabwe (1 :640) resulted in 100%
specificity, but sensitivity of only 64.63%. The PCR employed provided a highly
sensitive method for determining T parva infection, was more sensitive than IF AT
(cut-off 1 :640) and tick pick up. At least 71.7% of the samples tested post infection
were positive by PCR compared to the 44% positives by IFAT at a cut-off of 1:640.
Only 15% of the tick application experiments were positive compared to the 80.6%
PCR positive tests and 38.9% IFAT positives when the tests were carried out
synchronously.
Each of the isolates resulted in a carrier state detectable by PCR and this lasted for at
least 500 days, with Theileria transmission to ticks recorded up to 456 days post
infection. This is longer than recorded in previous studies in Zimbabwe. These
results suggest that carrier status is the normal state following infection. Indications
are that T parva Boler:U is the most suitable immunising parasite stock; although T
parva Avery and Bally Vaughan infections did not result in onward transmission to
ticks, these parasites are of higher pathogenicity which would be disadvantageous in
vaccination.
xvi

CHAPTER ONE
Carrier state studies in Theileria parva infected cattle in Zimbabwe
INTRODUCTION
Theileria parva the causative protozoan organism of East Coast Fever (ECF) in cattle
was introduced into Zimbabwe in 1902 by a shipment of cattle which originated from
German East Africa (Tanganyika), (Lawrence and Norval, 1979). The cattle
shipment was meant to restock the country after the rinderpest panzootic of 1896-
1897 (Thomson, 1985).
To control the disease it was necessary to control its tick vector
Rhipicephalus appendiculatus and therefore short interval dipping was made
compulsory in 1914. East Coast Fever was believed to have been eradicated from
Zimbabwe in the 1950's (Lawrence and Norval, 1979; Thomson, 1984), although
another form of theileriosis, known as "Zimbabwean theileriosis" or "January
disease" continues to be a problem (Cranefield, 1991; Lawrence 1991 a, 1991 b; Perry
and Young, 1995).
In Zimbabwe, the control of ticks and tick-borne diseases of cattle has been
one of the most important factors contributing to the development of the livestock
industry, which is of major economic importance to the country. Theileriosis is
endemic to certain farms I areas in which a stable to unstable situation appears to
prevail, although there is a risk of disease outbreaks because of cattle movement.
The government of Zimbabwe spent an estimated US$9 million in trying to control
the disease in the financial year 1988/89 (Perry et al., 1990), due to direct mortalities,
productivity losses, control costs, extension services, financing, diagnosis, training

and research. Theileria parva is a tickbome protozoan parasite transmitted by ticks
of the genus Rhipicephalus causing theileriosis in cattle in East and Central Africa.
In Zimbabwe, theileriosis mainly occurs on the Zimbabwean highveld where the
brown ear tick Rhipicephalus appendiculatus is found. Figure 1.1 (a) shows the
distribution of the R. appendiculatus ticks in Zimbabwe and the Theileriosis
outbreaks of 1994. Figure 1.1 (b) and 1.2 shows the theileriosis outbreaks between
January and December 1995 and January to September of 1996 respectively. Data
was obtained from the Director of veterinary services field report returns and the
cases confirmed by Giemsa stained microscopic examination of samples submitted.
The outbreaks mainly occur in the commercial farming areas of Zimbabwe which are
found along the Highveld of Zimbabwe receiving greater than 400mm annual
rainfall, thus an excellent environment for the tick vector.. Theileriosis associated
with the presence of buffalo is considered to becoming more significant as a result of
the integrated livestock I game farming on the highveld and in the lowveld in areas
with the National Parks [Figure 1.1(b)game] (Hove et al., In press).
Bovine theileriosis is one of the most important diseases restricting the development
of this farming practice. As a result of theileriosis and other tick-borne diseases it
has been necessary to practise weekly dipping during the rainy season, (November to
March) when the adult R. appendiculatus tick is active (Short and Norval, 1981 ), and
dipping is also carried out fortnightly during the dry season. Government legislation
on the contr0l of theileriosis, (Theiler!osis Animal Health Regulation of 1976)
stipulates that it is a notifiable disease and when outbreaks occur there is temporary
suspension of movement of stock to and from infected properties for a period of
2

twenty-eight days, during which animals are dipped or sprayed on every fourth day
and strict tick control is applied. The main disadvantage of intensive tick control is
that animals free of ticks will remain susceptible to tick-borne diseases including
theileriosis and any breakdown may result in outbreaks of other tick-borne diseases.
Figure 1.1 (a)
• Harare area
3

•
Figure I 1 (b)
THEILERIOSIS OUTBREAKS FIELD REPORTS JAN - DEC 1995
'IMIII.IIJOSII CX1I1Ili!Ail
KATIOtiAL PAIJCS
IAJAAIAUA
(:IOioOMIAI. LNIDa
~ICALIOOIIOIDaALAQA
oo.G4Da'IJ..AUA
Figure 1.2
THEn.!IUOSJSOUJ'BREAKS FIELD RIPORTS~ .. Sepeea ..... , ltH
•
-Hararearea
~-_..., __ ~*"--
4
Blll
Serious disease outbreaks were observed previously (Lawrence et al., 1980), and also
during the war of independence (1972-1980) when a million head of cattle were lost
in the communal areas due to tick-borne diseases.
The development of treatment and infection method of immunisation against
theileriosis in Zimbabwe offers the Veterinary Services an alternative tick-borne
disease control strategy which involves less use of acaricides and relies more on
controlled immunisation and the development of natural immunity to theileriosis
thereby saving foreign currency. Recently a strategic dipping policy was formally
introduced through the Animal Health (Cattle Cleansing) Regulations, (1993) thus
encouraging the development of enzootic stabnity. The infection and treatment
method involves immunising animals by first injecting the animals with long-acting
tetracycline followed by inoculation of the stabilate ofT parva (Boleni) sporozoites.
In Zimbabwe the T parva Boleni parasite stock was selected for its relatively low
virulence and ability to confer immunity against several local stocks and two from
eastern Africa (Uilenberg et al., 1982; Irvin et al., 1989; FAO I Danida Phase II
report, 1993; Hove et al.,1995). Through use of a lower immunising dose, Bolvac®
stabilate can be used without the need for tetracycline treatment thus making the
whole exercise cheaper and much easier to perform, although treatment is necessary
for high grade dairy cattle. One of the main worries of farmers participating in the
immunisation programme, and authorities concerned in the exercise, has been the
length of protection and the period over which immunised animals remain infective
to the vector tick population. Another issue is that at present the cattle movement
policy for immunised herds prevents movement of immunised cattle to other
5

properties except to the abattoir. This implies that immunised animals pose more of
a threat, regarding the spread of the parasite than naturally infected animals that
might also remain as reservoirs of disease. Animals that are reservoirs of Theileria
parva infection may present a risk of spread of the disease to other disease free areas
where the vector exists (Figure 2.1 ). The theileriosis team at Harare already has
evidence suggesting that some herds remain free of reported disease in theileriosis
endemic areas but are moving cattle freely and might have significant numbers of
Theileria "carrier" animals (T. Hove, personal communication).
This presents the Zimbabwe Veterinary Services Department with a new
scenario that may require changes in tick-borne disease control policy and legislation
governing Theileria infected herds as these may provide foci of infection. Yet,
another issue to be studied and established is the ability of the carrier animals to
infect ticks resulting in high enough tick infection prevalence to achieve endemic
stability in their subsequent hosts. A serological survey of cattle (Norval et al.,
1985) found that T parva positive reactors occurred throughout Zimbabwe,
including areas in which no outbreaks of theileriosis had been recorded. Theileria
taurotragi has been isolated in Zimbabwe (Lawrence and Mackenzie, 1980;
Uilenberg et al., 1982) and is known to show some cross-reaction with the T parva
group on the IF AT (de V os and Roos, 1981; Uilenberg et al., 1982) and this could
have affected the results as the test is very subjective. There is therefore a need to
develop a sensitive test for the detection of parasites in Theileria carrier animals in
order to detect animals which have had previous exposure to the parasite and hence
understand the true epidemiology of the disease in Zimbabwe.
6

An improved test is required for the detection of bovine theileriosis, as the sensitivity
and specificity of current antibody detection tests and stained blood smear
examinations are inadequate. The current serological techniques used to diagnose
theileriosis may not detect carrier animals and do not distinguish between T parva
and closely related parasites, such as T taurotragi. Positive serological reactions to
Theileria parasites may simply indicate a previous exposure to theileriosis, current
infection or the presence of antibodies against other non-pathogenic Theileria
parasites. A false negative reaction observed in serological tests may result from
rearrangement of the antigens due to harsh treatment during the process of extraction
and storage or the reduction in antibody levels to schizonts and piroplasms with time
as seen in the immunofluorescent tests. False negative results can result from natural
or induced tolerance, antibiotic induced immunoglobulin suppression, incomplete or
blocking antibody, non-specific inhibitors like anticomplementary serum or tissue
culture toxic substances or the test could be very sensitive (Thrusfield, 1995).
Mackenzie and Lawrence (1979) demonstrated that an animal with a non-specific
schizont antibody titre could transmit a lethal infection. This results in difficulties in
the selection of non-exposed and therefore susceptible animals for experimental
purposes, and also in inaccuracies in epidemiological surveys and live animal exports
to countries in the region.
Identification of T parva carriers by subinoculation of blood into susceptible
animals and tick feeding is not considered to be feasible because of the number of
animals that would be involved and the labour and expense required. The recent
development of specific DNA probes and nucleic acid hybridisation protocols to
7
detect parasites directly in blood from cattle has several advantages over
conventional microscopic, serologic and subinoculation techniques. The polymerase
chain reaction (PCR) is an in-vitro method of nucleic acid synthesis by which a
particular segment of target deoxy-ribonucleic acid (DNA) can be specifically
replicated. It involves two oligonucleotide primers that flank the parasite DNA
fragment to be amplified and repeated cycles of heat denaturation of the DNA,
annealing of primers to their complementary sequences, and extension of the
annealed primers with Thermus aquaticus (I'aq) DNA polymerase. The PCR assay
could prove to be useful in epidemiological studies in detecting very low
parasitaemias in carrier animals because the method has resulted in the highest level
of sensitivity for the detection of many organisms, including the piroplasms of
Babesia bovis (Fahrimal et al., 1992). Specificity can be manipulated by the choice
of primers to gene sequences that are conserved or variable between related
organisms, if such sequence information is available. Primers can be selected which
are specific for T parvc_z and will not amplify the more distantly related T taurotragi
or T mutans DNA. The test takes less than twenty-four hours , requires less
expensive equipment than serology by fluorescent antibody or enzyme linked
immunosorbent assays and is easy to perform. This study is aimed at developing an
improved method of detecting T parva-carriers based on the PCR and comparing it
with other methods of parasite detection in infected I immunised recovered cattle.
The objectives of this study were to compare a PCR assay with other methods
of assessing T parva infection or carrier status in animals infected with T parva
Boleni and other Zimbabwean parasites. The other methods used for assessing
8

infection or carrier status were microscopy, serology, nymphal R. appendiculatus
feeding and dissection of the subsequent adults to determine mean prevalence of
infections.
The first described PCR assays for the detection of T parva used primer
sequences based on the p67 gene (Bishop et al., 1992). The p 104 primer sequence
(based on work by R.Skilton, ILRI) was utilised after comparing the results of the
two PCR assays. At the CTVM, Edinburgh the sensitivity of the PCR assay using
the p67 primers was assessed using T parva Muguga blood stabilate of known
amounts and piroplasm DNA. The assay's specificity was performed on 1 ng
aliquots of DNA of other Theileria species and other haemoparasites including
Babesia bigemina, Babesia bovis, Trypanosoma congolense, Cowdria ruminantium,
and Anaplasma marginale. Other methods of DNA extraction were tested in-order to
develop an easy reproducible method for preparing samples for PCR.
The sensitivity and specificity of the p67 PCR was assessed by infecting
calves with T parva Boleni and Marikebuni parasites which are known to cause
carrier status (Koch, 1990; Bishop et al., 1992). The sensitivity of the polymerase
chain reaction for the detection of T parva parasites was compared with the Giemsa
stained blood smears, and indirect fluorescent antibody test. Using primer sequences
designed by Bishop et al., (1992) for the T parva p67 sporozoite antigen which is
thought, on the basis of the absence of observed restriction fragment length
polymorphism to be conserved among T parva stocks. The following haemoparasite
stocks were tested by PCR; T parva (Muguga), T parva (Boleni), T taurotragi,
Theileria mutans, T parva Lawrencei, Theileria annulata and Theileria sergenti.
9

Other haemoparasite DNA material including Babesia bigemina and Babesia bovis,
Anaplasma marginale, Cowdria ruminantium and Trypanosoma congolense were
tested to confirm the specificity of the assay.
At the Veterinary Research Laboratories, Harare, calves were infected with
different T parva stocks isolated in Zimbabwe. Clean nymphal R. appendiculatus
were fed on the Theileria recovered animals and the subsequent adult ticks had
salivary glands dissected out and stained with the Feulgen stain to determine
Theileria infections.
Results from the adult ticks fed as nymphae on infected animals suggest that
T parva infection can be maintained by carriers and it supports the earlier
assumption that recovered cattle can set up new foci of disease (Koch, 1990). It has
long been accepted that the protozoan parasite Theileria parva, causing January
disease In Zimbabwe, produces a carrier state In recovered animals
(~v1ackinnon,1953; Neitz, 1957). This conclusion was not based on experimental
evidence, but was deduced from epizootiological observations where recovered cattle
were assumed to be the source of new foci of infection when moved to farms where
tick control was inadequate and the tick vector and disease were present (Brocklesby
and Barnett, 1966a). The FAO team in Harare also established that Theileria
recovered animals remained carriers for a period over 18 months (FAO phase II
Epidemiology and Immunisation report , 1993) by transmission to susceptible cattle.
Theileria recovered animals were also shown to be infective to the tick population at
7 and 12 months post infection (Koch, 1990). The causative T parva parasites are
remarkably homogeneous and usually of relatively low virulence to those causing
10

ECF, and it was also demonstrated in studies by Koch ( 1990), that these parasites
have a well developed carrier status. Matson ( 1967) recorded a great variation in
pathogenicity of Theileria infections over a period of two seasons, ranging from as
severe as T parva to inapparent. Mixed infections of T taurotragi are to be
expected as both parasites use the same tick vector and also are identical
parasitologically in the vertebrate and arthropod host (Norval et al., 1992). This has
complicated sera-prevalence studies as high antibody titres have been observed in
areas where theileriosis outbreaks have not been reported, and needs to be considered
in the planning of tick and tick-borne disease control programmes. This problem has
been attributed to cross-reactions between T parva and T taurotragi (Koch, et al.,
1986).
The theileriosis situation in Zimbabwe is also complicated by the wide
distribution of both T parva and T taurotragi as revealed by anti-schizont MAbs
and RFLP analysis using a Theileria extra-chromosomal element probe (Bishop et
al., 1994), and the presence of wildlife providing alternative hosts for the tick and
hence parasites.
The PCR assay using p 1 04 primer sequences for T parva microneme I
rhoptry antigens can be utilised in the field for species differentiation where it is
difficult to distinguish T parva from other Theileria species morphologically or
serologically. Identification ofT parva carriers, confirmation ofT parva outbreaks
and understanding of the epidemiology c f disease as the situation in Zimoc1bwe is
complicated by the occurrence of T taurotragi and T mutans. It is difficult to
define stocks on the basis of virulence or pathogenicity as the Theileria stocks vary
11
considerably in their virulence to cattle. Mildly pathogenic stocks of T parva have
been described from Kenya and Zimbabwe (Barnett and Brocklesby, 1966b;
Brocklesby, 1969; Koch., et al., 1988). Diagnosis of the disease has been based on
the presence of macroschizonts in the stained lymph node biopsy smears, but
although this is the most important diagnostic test it is impossible to differentiate the
schizonts ofT parva and T taurotragi. New outbreaks of Theileriosis have occurred
in areas where the tick vector is present, and this has been attributed to the movement
of cattle from properties which have experienced pathogenic T parva outbreaks, thus
further complicating the disease situation.
This was an observational study aimed at surveying the nature and importance of
carrier state of T parva in Zimbabwe in an effort to improve diagnostic methods of
the disease. It is very important to advise farmers that T parva-carriers do occur,
and they should take this into consideration when buying new stock and for disease
control purposes.
Objectives of study were to:
(a). Develop a polymerase chain reaction assay for the detection of Zimbabwean
T. parva including the T. parva Boleni (Bolvac®) infections in carrier I recovered
cattle using p67 and p 104 gene primer sequences.
(b). Assess the sensitivity of p67 PCR assay using dilutions of T. parva infected
blood with known parasitaemias.
(c). Assess t!le specificity of the P67 and p 104 PCR assays using other Theileria
species, and haemoparasites including Babesia bovis, Trypanosoma congolense,
Cowdria ruminantium and Anaplasma marginale.
12

(d). Compare the p 1 04 PCR assay with other methods of assessing T parva
infection or carrier status in infected I recovered animals; eg. microscopy, serology,
nymphal tick feeding on recovered animals and examination of stained adult tick
salivary glands.
13
CHAPTER TWO
LITERATURE REVIEW
2.1 Identification and classification ofT. parva.
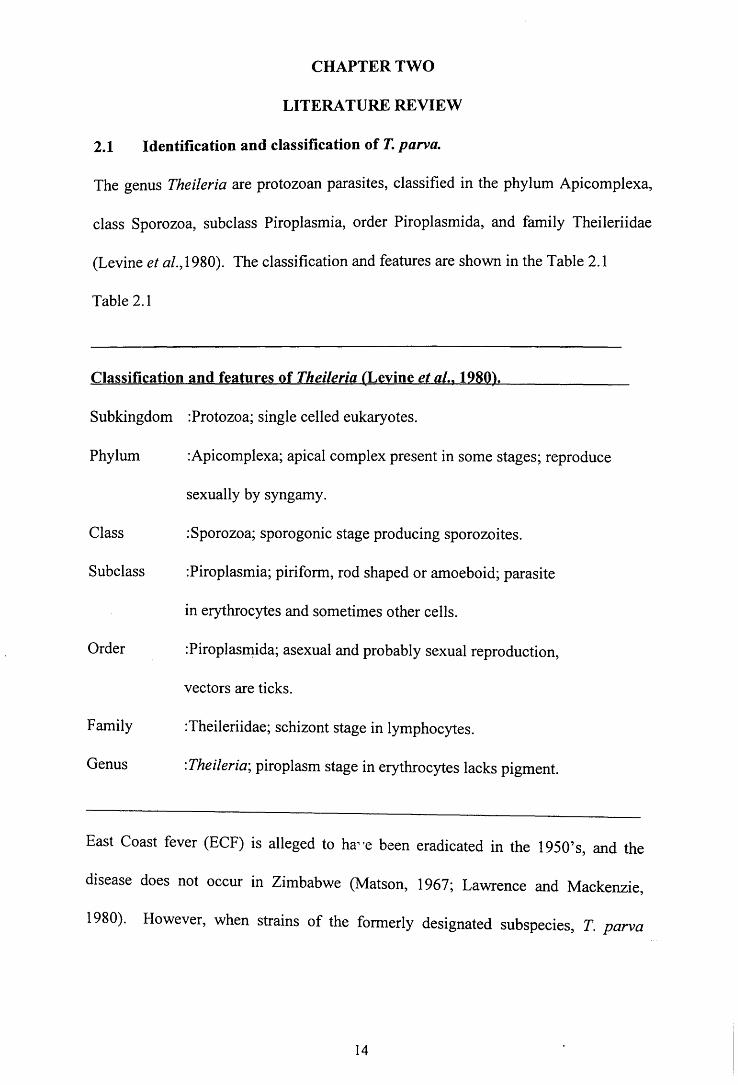
The genus Theileria are protozoan parasites, classified in the phylum Apicomplexa,
class Sporozoa, subclass Piroplasmia, order Piroplasmida, and family Theileriidae
(Levine et al., 1980). The classification and features are shown in the Table 2.1
Table 2.1
Classification and features of Theileria (Levine et al., 1980).
Subkingdom :Protozoa; single celled eukaryotes.
Phylum
Class
Subclass
Order
Family
Genus
:Apicomplexa; apical complex present in some stages; reproduce
sexually by syngamy.
:Sporozoa; sporogonic stage producing sporozoites.
:Piroplasmia; piriform, rod shaped or amoeboid; parasite
in erythrocytes and sometimes other cells.
:Piroplas~ida; asexual and probably sexual reproduction,
vectors are ticks.
:Theileriidae; schizont stage in lymphocytes.
:Theileria; piroplasm stage in erythrocytes lacks pigment.
East Coast fever (ECF) is alleged to ha"e been eradicated in the 1950's, and the
disease does not occur in Zimbabwe (Matson, 1967; Lawrence and Mackenzie,
1980). However, when strains of the formerly designated subspecies, T. parva
14

lawrencei or T. parva bovis, occur the possibility of classical ECF re-emerging
spontaneously can not be ruled out (Uilenberg et al., 1982; Norval et al., 1985). T
parva (Boleni) has been reported as a strain of T parva with characteristics
intermediate between those of classical "cattle-derived parva type" and those of the
"buffalo associated lawrencei-type" (Corridor disease) (Uilenberg et al. 1981 ).
However recent genetic studies have revealed that cattle-derived T parva isolates are
relatively homogeneous on the basis of reactivities with monoclonal antibodies
(MAbs) and restriction fragment length polymorphisms (RFLPs) detected using T
parva repetitive and ribosomal DNA probes (Bishop et al., 1994).
2.2 Life Cycle and Transmission.
The life cycle of Theileria is complicated as shown in figure 2.1.
Several authors have reviewed the life cycle ofT parva (Bamett, 1968; 1977; Irvin
et al., 1981; Melhom and Shein; 1984; Morrison et al., 1981 ). R. appendiculatus
larval and nymphal ticks become infected with T parva when they feed on infected
cattle or wild animals and they ingest erythrocytes which contain the piroplasm stage
of the parasite. The infected erythrocytes are lysed within the tick gut releasing
piroplasms which differentiate into male and femal~ gametes which then fuse to
produce zygotes. The zygotes subsequently invade the cells in the gut wall of the
tick several days after the tick has completed feeding and detaches itself from the
host (Melhom et al., 1978; Young and Leitch, 1981a). Motile kinetes are released
into ~he tick-haemolymph during and following the period when the tick is moulting
(Young and Leitch, 1980; Melhom and Schein; 1984). The kinetes then migrate to
the salivary glands where they invade the "e" cells of the type Ill acini glands and
15

undergo sporogony (Fawcett et al., 1981 a & b; 1982a, b & c; 1985). Sporogony
usually does not start until the tick (now a nymph or adult) commences feeding, but it
can be induced by incubation of the tick at 37°C (Young et al.,1979; Ochanda et al.,
1988). Occasionally it may occur before feeding under natural conditions when there
is high ambient temperature. When the kinete invades the tick salivary glands it
proliferates as the sporoblast stage throughout the host cell. The sporozoites are
finally liberated into the saliva and injected into the mammalian host during the
feeding process of the tick. The development of the sporozoites in the adult tick is
completed 3 to 5 days after commencement of feeding at which time infective
sporozoites appear in the tick saliva (Purnell and Joyner, 1968). It has been
postulated that a single kinete can result in as many as 40 000 sporozoites (Fawcett et
al., 1982a) or more in T taurotragi infection (Fawcett et al., 1985). Young and
Leitch (1980) have suggested that susceptibility of ticks and infectivity of Theileria
parasites are the factors that control the infection prevalence and levels of Theileria
parasites in the ticks. There is however a marked variation in the level of infection
between individual ticks and within a batch of ticks fed on the same animal, and this
range may encompass no infection in a tick to greater than 250 infected salivary
gland acini (Young and Leitch, 1980).
16

figure 2.2
Life cyc\c of T. parva
o~x:J;.Eo:~ @k ~ ~ch<tont • ® Merogony
~ Sch•ZOgony ~ ~
Infected - ) ~ tymphoblastoid ~ _,/ \~~(
cells M
@I)> erozoiles
r ~ (fJ
Sporoz.oites \ @ enter
~ tymphocyte
. Soorozoites t . emitted :o saliv 0 ® @ ?lroplasm
a <::! .nfecled erythrocy1es
--------~ Soorozoites ~. produced.
Nymph
Adult
Macrogamete ~ ~·· .. V • M" ~ <crogametocy1e
Gut eoith r· cells e
1um
"*----Larva
17
/

The infection of the host animal commences with the feeding of the tick when the
infective stage of Theileria, the sporozoite, is injected with the saliva into the host
during feeding 3 to 4 days after attachment (Pumell et al., 1974; Young et al., 1975).
The attachment site is generally infiltrated by a variety of inflammatory cell types
including lymphocytes because the tick remains attached tor several days before
initiation of the rapid feeding phase, during this time the sporozoites are released into
the host tissue (Walker, 1990). The sporozoites ofT parva have an apical complex,
micronemes, rhoptries and a surface coat, and resemble sporozoites of Plasmodium.
These sporozoites are capable of penetrating a susceptible lymphoid cell within a few
minutes or seconds (Fawcett et al., 1982) resulting in multiple infections of up to
eight schizonts in a single host cell although these cells may eventually die (Stagg et
al., 1981 ). The parasite then develops into a schizont and the host cell is transformed
into a lymphoblastoid cell which produces two infected daughter cells resulting in a
clonal expansion with a ten-fold increase of infected cells every three or so days
(Jarrett, et al., 1969; Irvin, et al., 19R2). Within 12-14 days all the lymphoid tissues
of the bovine host are infiltrated and the schizonts start undergoing merogony
(Melhom and Schein, 1984; Shaw and Tilney, 1992). The host cell plasma
membrane ruptures on completion of merogony liberating the mature merozoites
which penetrate erythrocytes and develop into piroplasms. Under the microscope the
giemsa stained blood smear shows the piroplasms as comma or spherical shapes
lying freely within the erythrocyte cytoplasm. Thus the piroplasm waits for another
tick to feed for the life cycle ofT parva to continue.
18

2.3 Pathogenesis of Theileriosis
Susceptible cattle usually die within 2 to 4 weeks of infection with the parasite and
the disease is characterised by large numbers of parasitised lymphoid cells found
throughout the lymphoid system and associated with extensive lymphocytosis
(Morrison et al., 1981 ). The course of infection in cattle may be divided into three
stages: a prepatent stage; a stage of lymphoid proliferation; and a stage of lymphoid
disorganisation and depletion. The prepatent period stage covers the period between
the inoculation of sporozoites by the tick and the appearance of schizonts in the
draining lymph node. The sporozoites invade lymphocytes at the site of inoculation
and develop into recognisable schizonts after two to three days. The schizonts
stimulate proliferation of both infected and non-infected lymphocytes, possibly by
stimulating production of a T -cell growth factor similar to interleukin-2 (Brown and
Logan, 1986). Lymphocyte proliferation starts at the site of inoculation, but from
five days after infection parasitised cells begin to appear in the draining lymph node.
The appearance of parasitised cells in the lymph nodes coincides with the
onset of fever and stimulates active lymphoid proliferation and the release of large
numbers of infected and non-infected lymphoblasts into the efferent lymph. After a
further two to three days, more distant lymph nodes in the chain become infected and
hyperplastic and parasitised and non-parasitised lymphoblasts enter the peripheral
circulation. Parasitised cells also infiltrate the non-lymphoid tissues, particularly the
gastrointestinal tract and the lungs which results in pulmonary oedema. These
parasitised cells can also establish in other lymph nodes and lymphoid tissue
(thymus, spleen) as well as in many parenchymatous organs (notably liver, kidneys,
19

lungs, myocardium, adrenals), bone marrow, and sometimes in the brain. It is the
schizont stage of the parasite which accounts for the pathology of theileriosis.
Four to five days after the initial appearance of schizonts, the process of lymphocyte
proliferation is succeeded by a process of lymphocyte destruction, and lymphoid
organs and lymphoid foci in parenchymatous organs may show evidence of necrosis
and depletion of lymphocytes. Both parasitised and non-parasitised lymphocytes are
destroyed and this appears to be the result of activation of specific protective
cytotoxic T -lymphocytes and non-specific cytotoxic T -lymphocytes, ['natural killer
cells'] (Emery et al., 1981). Lymphocyte destruction causes a fall in serum
immunoglobulin levels ( Spooner et al., 1973) and immunosuppression (Wagner et
al., 1975), and this may enhance progress of the disease and facilitate secondary
respiratory infections.
In non-fatal cases, development of specific protective cytotoxic T
lymphocytes (which destroy parasitised lymphoblasts) and helper T-lymphocytes
terminates schizont proliferation (Eugui and Emery, 1981; Baldwin et al., 1987).
Recovery from infection is thought to depend on the survival of a sufficient number
of effector cells over the first 14 days and on their capacity to achieve a specific
protective response (Emery et al., 1981 ). Re-exposure of recovered animals
stimulates activation of memory T -lymphocytes which, in turn, stimulate activation
of cytotoxic T -lymphocytes which are thought to eliminate the infection (Morrison et
al., 1989). Al~hough some development )f schizonts and piroplasms may occur and
cause a mild clinical response.
20

A proportion of recovered animals remains unthrifty and unproductive, and foci of
infected lymphoid cells may be found persisting in a variety of organs (Dolan, 1986).
Immunosuppresssion may predispose such animals to secondary infections and
eventually prove fatal.
Lymphocyte proliferation and destruction are responsible in a number of
ways for the lesions which characterise East Coast fever. Focal or diffuse infiltration
of lymphocytes and lymphoblasts may cause degenerative changes in liver, kidneys
and brain, while focal infiltration in the mucosa of the gastrointestinal tract is
responsible for necrosis and erosion of overlaying tissue. Activation of the
coagulation cascade leading to an accumulation of fibrin degradation products
suggests that disseminated intravascular coagulation may be an important component
of the terminal stages of disease (Maxie et al., 1982; Shitakha et al., 1983).There is
also activation of the complement cascade, and vasoactive components are released
as a result of lymphocyte disintegration in the lungs. These may be responsible for
the pulmonary oedema which is often final cause of death.
Within the erythrocytes piroplasms can undergo merogony to produce further
merozoites (Melhom and Schein, 1984; Conrad et al., 1986). The invasion of
erythrocytes by piroplasms does not have any pathogenic effect. In T parva
intraerythrocytic division of piroplasms does not occur although in T annulata,
mutans, sergenti, and taurotragi it is the main mechanism of maintenance of
infection (Conrad, 1983; Conrad et al., 19~5).
21

2.4 Characterisation of T. parva stocks.
Foil owing the realisation that different immunological strains in T parva stocks exist
and with the development of the infection and treatment method of immunisation, it
became critically important to characterise T parva stocks.
The following definitions of terms below were taken from lrvin et a/ ( 1983)
Irvin (1987) and Anon (1989a).
1) Isolation :Viable organis1ns, isolated in experimental hosts or culture
systems or prepared as a stabilate on a single occasion from
a field sample.
2) Stock
3) Line
4). Strain
:All the populations of a parasite derived from an isolate
without any implication of homogeneity or characterisation
including cell lines and tick stabilates, and subsequent parasite
preparations derived from them.
:A laboratory derivative of a stock maintained under defined physical
conditions, such as in a culture of parasitised bovine lymphoid cells.
:A popu~ation of homogeneous organisms possessing a set of defined
characteristics. Unambiguous characterisation of a strain can only be
assured if the population of organisms was initiated from a parasite
clone.
5) Stabilate :A sample of organisms preserved alive (usually in replicate) on
6) Clone
a single occasion.
:Genetically iderJ.tical organisms derived from a single cell by asexual
division (mitosis).
22

6a) Parasite clone :Theileria line derived from a single parasite.
6b) Cell clone :Theileria line derived from a single parasitized cell.
2.4.1 Cross immunity
Cross-immunity tests were developed to characterise the immunological behaviour of
T. parva which involves immunising cattle with a stock of Theileria, usually by the
infection and treatment method, and challenging the immune animals with different
Theileria stocks (Mutugi et al., 1988b ). In Zimbabwe T. parva Boleni was selected
for use in immunisation on the basis of cross immunity tests and displays a wider
dose range over which mild reactions can be induced making it an attractive
candidate for wide scale immunisation against ECF (Irvin et al., 1989). This means
that large numbers of animals have to be used in cross-immunity tests for stock
characterisation making the testing very expensive.
2.4.2 Infectivity
Another way of characterising Theileria stocks has been the measurement of clinical
and parasitological parameters after infection with a standard dose of sporozoite
stabilate. The clinical_ and parasitological parameters to be measured would be the
duration of parasitosis and fever; the time to appearance of piroplasms; and the time
to death or recovery.
Additional features which can be measured are the level of schizont
parasitosis, piroplasm parasitaemia and the reduction in white blood cell numbers.
The:·e parameters define the infectivity of a particular stock for a particular breed and
age of animals (Norval et al., 1990).
23
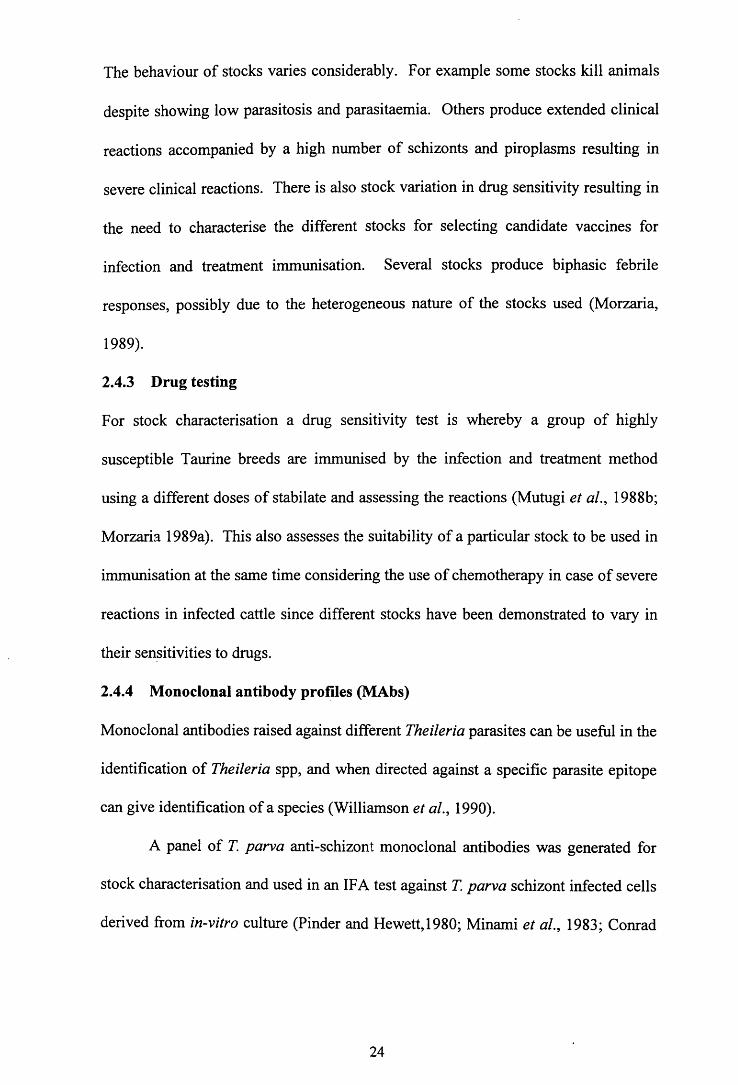
The behaviour of stocks varies considerably. For example some stocks kill animals
despite showing low parasitosis and parasitaemia. Others produce extended clinical
reactions accompanied by a high number of schizonts and piroplasms resulting in
severe clinical reactions. There is also stock variation in drug sensitivity resulting in
the need to characterise the different stocks for selecting candidate vaccines for
infection and treatment immunisation. Several stocks produce biphasic febrile
responses, possibly due to the heterogeneous nature of the stocks used (Morzaria,
1989).
2.4.3 Drug testing
For stock characterisation a drug sensitivity test is whereby a group of highly
susceptible Taurine breeds are immunised by the infection and treatment method
using a different doses of stabilate and assessing the reactions (Mutugi et al., 1988b;
Morzaria 1989a). This also assesses the suitability of a particular stock to be used in
immunisation at the same time considering the use of chemotherapy in case of severe
reactions in infected cattle since different stocks have been demonstrated to vary in
their sensitivities to drugs.
2.4.4 Monoclonal antibody profiles (MAbs)
Monoclonal antibodies raised against different Theileria parasites can be useful in the
identification of Theileria spp, and when directed against a specific parasite epitope
can give identification of a species (Williamson et al., 1990).
A panel ofT. parva anti-schizont monoclonal antibodies was generated for
stock characterisation and used in an IF A test against T. parva schizont infected cells
derived from in-vitro culture (Pinder and Hewett,1980; Minami et al., 1983; Conrad
24

et al., 1987b; 1989b; Maritim et al 1989b ). Most cattle derived T parva stocks
isolated from Zimbabwe do not react with MAb-7 (Koch et al., 1988), and this has
been a useful tool in differentiating Zimbabwean parasites in the region. Monoclonal
antibodies are particularly useful to determine whether there is contamination with
another parasite, they demonstrate antigenic differences in the characterisation of T
parva stocks (Pinder and Hewett, 1980). Disadvantages include lack of sensitivity
and the selection of certain parasites during the establishment of cultures (Norval et
al., 1992). The latter was shown by the dominant types surviving in culture when
there are mixed parasite populations.
2.4.5 Protein analysis.
Attempts have been made to use isoenzyme analysis to differentiate stocks of
Theileria (Musisi et al., 1981; Melrose et al., 1980; Allsopp et al., 1985). Glucose
phosphate isomerase has been found to be of value in analysis of Theileria annulata.
Another approach to identify proteins which are parasite antigens is to probe western
blots of relevant antigens with a panel of monoclonal antibodies. Shapiro et
al.,(1987) showed that MAb5 identifies a polymorphic schizont antigen in T parva
stocks thus showing that certain anti-schizont MAbs may therefore identify stock
specific markers. Another technique used to characterise infection specific proteins
of various T parva stocks is two-dimensional gel electrophoresis (Sugimoto et al.,
1989). Stock specific differences have been detected, although the technique is
difficult to perform and interpret. It ~an be a useful laboratory tool in stock
identification in research.
25

2.4.6 DNA analysis
Conrad et al.,(1987a) and Allsopp and Allsopp (1988) described T. parva repetitive
(Tpr) DNA probes capable of revealing extensive polymorphism among Theileria
stocks.
In order to detect any changes that may occur when stabilates are passaged
through ticks, cattle or other hosts such as buffalo or waterbuck, it is important to
differentiate stocks genetically. It is necessary also to characterise any breakthrough
parasite populations during immunisation to investigate the failure or otherwise of
vaccination trials in relation to parent bulk stock. DNA probes capable of revealing
extensive polymorphism among Theileria stocks, have been described and recently
probes such as ribosomal and telomeric sequences (Bishop et al., 1994) and Sfi I
digestions of T. parva DNA on pulsed field gels (Morzaria et al., 1990a), which also
detect polymorphism have been developed. By sequencing cloned PCR products
derived from the amplification of specific portions of the Tpr sequences, it has been
possible to select and synthesize oligonucleotide probes capable of differentiating
specific T. parva stocks or groups of stocks (Allsopp et al., 1988; 1993; Bishop et
al., 1994). These markers reveal the existence of a sexual cycle in T. parva and also
whether immunisation stocks are transmitted to previously uninfected ticks following
vaccination by the infection and treatment method. The PCR technique results in
amplification of very small amounts of DNA to a detectable level (Allsopp et
al., 1989), and allows the detection o~~ Theileria carrier animals and it might be able to
identify the parasites at species and strain level (Williamson et al., 1990).
26

DNA probes could be used to identify and quantify the DNA from different Theileria
species in ticks and also in the mammalian host (Stiller, 1990).
Restriction enzymes cleave DNA at specific nucleotide sequences and
fragments produced can be resolved on agarose gels by electrophoresis and
visualised under ultra violet-illumination following ethidium bromide staining.
Through selection of restriction enzymes such as S.fi I and Not I cut Theileria DNA at
infrequent intervals, and separating the digested DNA in pulsed field gel
electrophoresis, unique and characteristic banding patterns of T parva and T mutans
have been detected (Morzaria et al.,1990a).
In Africa the two most important Theileria species, Theileria parva and T
annulata do not overlap in their distribution, except possibly in southern Sudan. The
distribution of their tick vectors controls the distribution of these parasites, along
with the distribution of the mammalian hosts they infect. Due to the lack of infection
in the tick by Theiieria parasites or lack of suitable conditions for parasite
developme.nt within the tick, the distribution of the disease may not follow that of the
major vector, Rhipicephalus appendiculatus. The schizonts of T parva and T
annulata are indistinguishable from each other on morphological grounds as are
those of T taurotragi, except when they develop multiple infections of cells. In
cultures of T parva, T taurotragi and T annulata, the host cell may adopt a
different morphology (Stagg et al., 1976). T parva has been shown to infect cattle
and buffalo and other wildlife species. The virulence of species of Theileria may be
variable depending on the stock of parasite, the dose of parasite, &id the type of
mammalian host.
27

Further to the identification of Theileria parasite repetitive DNA sequences, T. parva
stocks have been used as radiolabeled probes to hybridise specifically to T. parva
DNA but not that of T. mutans, T. annulata and T. taurotragi (Conrad et al., 1987a:
1989a; 1989b; Allsopp and Allsopp, 1988).
2.5 Immunity to T. parva.
As regards immunity to Theileria the relative speed at which parasite sporozoites
enter lymphocytes (Fawcett et al., 1982); the intracellular synchronous multiplication
of the macroschizont within the host cell (Hulliger et al., 1964) and the fact that
piroplasm development occurs relatively late in the course of infection makes
immunity to Theileriosis a complex matter. It has been demonstrated (Burridge et
al., 1973a) that antibody titres to both schizont and piroplasm stages of the parasite
can go below detectable levels after about six months in the absence of further
challenge in infected cattle or artificial immunisation, although such animals remain
immune to lethal homologous challenge (Burridge et al., 1972a; lrvin and Morrison,
1987). Ainong Theileria species there is no evidence of cross protection. For
example, cattle immwtised against T. annulata are fully susceptible to T. parva and
vice versa (Sergent et al., 1945; Neitz, 1957). The cross-immunity evaluation is
particularly useful in areas where T. parva and T. taurotragi co-exist (Mutugi et al.,
1990a). It is of interest to note that all Theileria species which parasitize cattle can
occur concurrently in a host animal because there is no cross-immunity between
species, and carrier states from these concurrent infections can develop (Young,
1981).
28

The proper establishment of infection by T parva confers immunity to the disease
(Morrison et al., 1987). Attempts to confer immunity by passive transfer of serum
from immune to naive cattle (Muhammed, et al., 1975) were unsuccessful. There was
no protection against challenge with infected ticks despite the strong antibody
responses after inoculation of schizont and piroplasm antigen of T parva (Wagner et
al., 1975b; Emery et al., 1981 ). These results implied that immunity to T parva is
cell mediated, and this was supported by further experiments which showed that
immunity could be transferred adoptively with thoracic duct lymphocytes from T
parva immune chimeric twins to their susceptible partners (Emery, 1981; Mckeever
and Morrison, 1990).
The study of cellular immune mechanisms has been made possible by the
success of in-vitro infection of bovine lymphocytes (Brown et a/ 1973). Potent
peripheral blood lymphocytes (PBL) were stimulated by macroschizont infected cells
grown in-vitro (Pearson et a/, 1979), and they eventually showed that the growth of
cells resulted in the generation of cytotoxic cells which killed infected cells. Cells
acquired from lymphoid tissues of cattle undergoing lethal infection with T parva
were shown to induce proliferative responses into normal autologous PBL which had
been collected and preserved prior to the initiation of infection, thus demonstrating
that the proliferative response was not directed against antigens acquired in culture.
It has also been demonstrated that these cytotoxic T -cells do not kill cells from
unrelated cattle infected with the same · )arasite. Further studies have shown that
these genetically restricted cytotoxic cells, which are generated in Theileria immune
cattle are T -lymphocytes which recognise cell surface antigens of macroschizont
29

infected cells in conjunction with self-class maJor histocompatilbility (MHC)
antigens (Morrison et al., 1987). It is therefore currently necessary to protect animals
against theileriosis using live parasites although low grade carrier state results from
this (Dolan, 1981; Young et al., 1981a), because in an immune animal the cell
mediated responses against the schizont act in concert with antibodies against
sporozoites (Musoke, et al., 1984) Also, it has been suggested that when sporozoites
are deposited by ticks into the skin of immune animals they are killed by sporozite
antibody-mediated processes, and that those escaping the latter proceed to invade
target cells and develop into schizonts which are then eliminated by CTLs (cytotoxic
T-cells). Immunity to homologous challenge has been shown to last for 3.5 years in
animals that recover spontaneously from the disease (Burrridge et al., 1972).
2.6 Diagnostic methods for T. parva infection
2.6.1 Clinical signs
The first clinical signs are fever and increases in pulse and respiration rates. There
may be a sharp decline in milk production. After a few days the animals becomes
depressed and lethargic. The temperature continues to rise, often to 41-42°C.
Lachrymation commonly occurs together with oedema of the eyelids, and may be
accompanied by photophobia. The animal is often constipated. There is a
generalised enlargement of the superficial lymph nodes; the prescapular and precrural
nodes become very prominent (Norval et al., 1992).
Zimbabwe theileriosis exhibits the same :linical features as East Coast fever except
that the course is often shorter and death may occur three to four days after the first
onset of signs. T. parva infections are characterised by pyrexia, enlargement of
30

several lymph nodes particularly those draining the area head, severe pulmonary
oedema and wasting. On development of pyrexia, a lympho-destructive phase is
initiated which is normally associated with a severe leucopenia. In fatal cases
anaemia is not present, nor develops in terminal cases (Norval et al., 1992). The
predominant sign observed clinically is acute difficulty in breathing and frothing at
the nostrils and at post mortem is pulmonary oedema in terminal cases. Pyrexia
occurs seven to ten days following infection and persists through-out the clinical
course. Sometimes one of the presenting signs is blindness associated with corneal
opacity. The incubation period is generally about 15 days from the time of
attachment of the infected tick, but may range from eight to 25 days. The period and
the course of disease become shorter as the challenge is increased (Jarrett et al.,
1969).
The disease usually progresses over a period of 15 days, but may terminate
after five days or be prolonged to 25 days. The fever remains high, although in a
small proportion of cases there may be a temporary remission for one or two days.
Appetite and rumination become increasingly depressed and there is a severe loss of
condition, increasing weakness and ataxia, and frequent recumbency. Constipation is
succeeded by diarrhoea and there may be blood and mucus in the faeces.
In the terminal stages of the disease dyspnoea develops, with an increased
respiratory rate, a watery cough and the discharge of frothy fluid from the nostrils.
Evid ~nee of pulmonary oedema and hydropericardium may be detected on
auscultation. Stemal and submandibular oedema may be present. The superficial
31

lymph nodes begin to regress, the rectal temperature falls to subnormal levels, the
animal becomes recumbent and dies in a coma.
A small proportion of animals, usually about 5 per cent , may recover, but
convalescence is prolonged and the animals may remain emaciated and unproductive
for months.
The disease may assume a less severe form in animals with partial immunity or
inherent resistance, but pyrexia and enlargement of superficial lymph nodes remain
constant features and in calves may be accompanied by persistent unthriftiness. Mild
disease has also been reported occasionally following infection with mild strains of
T parva of reduced virulence. The occurrence of the tick vector should be
considered jn making a diagnosis.
2.6.2 Microscopy
A laboratory diagnosis is affected by the level of parasite as this is determined by the
clinical signs as these vary from inapparent, or mild to severe and fatal. Diagnosis of
classical East Coast fever is based on the characteristic clinical signs and lesions, and
may be confirmed by. demonstration of schizonts and in the later stages of disease,
piroplasms in Giemsa-stained lymph node smears. The only difficulty with this
method is that one cannot distinguish the schizonts of T. annulata, T. parva and T.
taurotragi from one another morphologically. However it should be noted that T.
annulata does not occur in the same geographical areas as T. parva and T. taurotragi,
except where their distributions overlap in southern Sudan (Norval et al., 1992). The
examination of stained blood smears for piroplasms which appear 5-8 days after the
detection of schizonts in new infections can be of not much use without clinical data
32
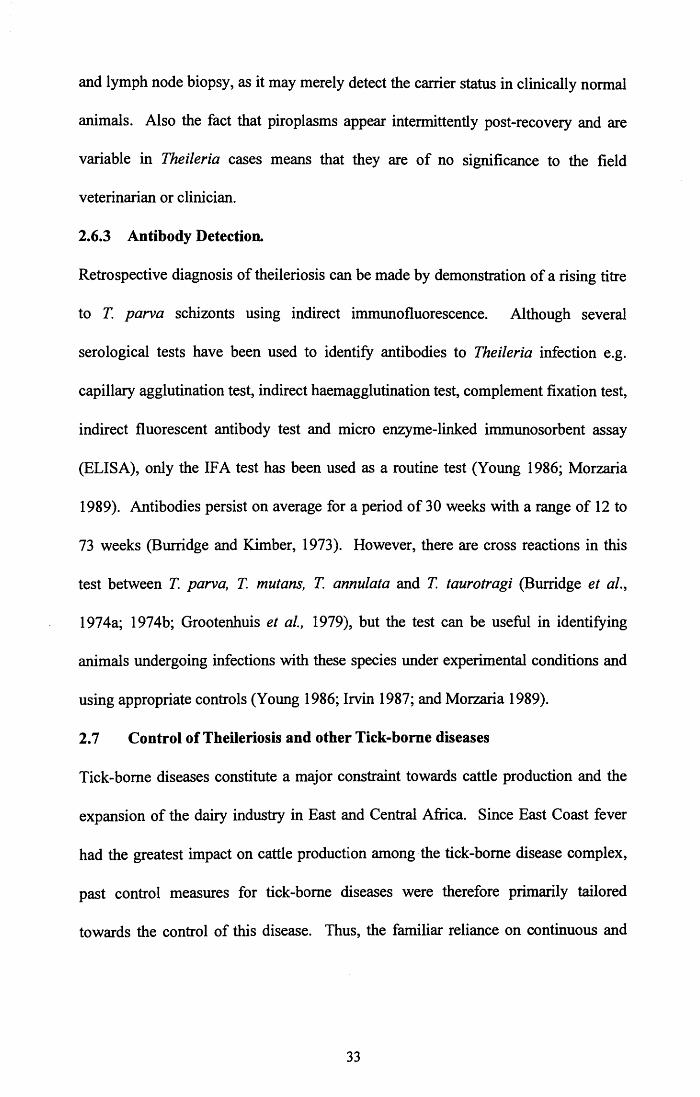
and lymph node biopsy, as it may merely detect the carrier status in clinically normal
animals. Also the fact that piroplasms appear intermittently post-recovery and are
variable in Theileria cases means that they are of no significance to the field
veterinarian or clinician.
2.6.3 Antibody Detection.
Retrospective diagnosis of theileriosis can be made by demonstration of a rising titre
to T. parva schizonts using indirect immunofluorescence. Although several
serological tests have been used to identify antibodies to Theileria infection e.g.
capillary agglutination test, indirect haemagglutination test, complement fixation test,
indirect fluorescent antibody test and micro enzyme-linked immunosorbent assay
(ELISA), only the IF A test has been used as a routine test (Young 1986; Morzaria
1989). Antibodies persist on average for a period of 30 weeks with a range of 12 to
73 weeks (Burridge and Kimber, 1973). However, there are cross reactions in this
test between T. parva, T. mutans, T. annulata and T. taurotragi (Burridge et al.,
1974a; 1974b; Grootenhuis et al., 1979), but the test can be useful in identifying
animals undergoing infections with these species under experimental conditions and
using appropriate controls (Young 1986; lrvin 1987; and Morzaria 1989).
2. 7 Control of Theileriosis and other Tick-borne diseases
Tick-borne diseases constitute a major constraint towards cattle production and the
expansion of the dairy industry in East and Central Africa. Since East Coast fever
had the greatest impact on cattle production among ·the tick-borne disease complex,
past control measures for tick-borne diseases were therefore primarily tailored
towards the control of this disease. Thus, the familiar reliance on continuous and
33

intensive dipping, was designed to render cattle free of the three host brown ear tick,
(R. appendiculatus), and thus interrupt ECF transmission. The control of theileriosis
in Zimbabwe has basically been by tick control, chemotherapeutic treatment and
recently by immunisation of cattle on properties at risk of epidemic outbreaks.
Intensive tick control (averaging 42 treatments per year) has been practiced for
several decades since the introduction of East Coast fever in the country. The
department of Veterinary Services has realised that control of ticks and tick-borne
diseases can no longer rely on the use of acaricides as demonstrated by the disaster
following breakdowns in the systems (Lawrence and Norval, 1979) during the war of
independence (1972-1980) when almost a million cattle were lost (Norval, 1979).
On a nation-wide scale it has become very costly for the Zimbabwean government to
maintain the structure thus a move towards the eventual attainment of endemic
stability to tick-borne diseases by immunisation coupled with reduced or strategic
dipping has been recently encouraged by the department of Veterinary Services
(1993). However this case has to be approached with caution as three other tick
borne diseases occur namely anaplasmosis, babesiosis and cowdriosis, and studies
have to be carried out in-order to determine safe acceptable levels of tick challenge in
the different geographical regions of the country. Thus in Zimbabwe there are
projects involved mainly in applied research on the development of vaccines and
related field trials, and research into heartwater is also being carried out.
The use of acaricide chemi ~als to destroy ticks is a measure beset with
numerous problems. These range from the ever escalating acaricide costs, the non
availability of acaricides in rural areas due to poor distribution, poor construction of
34

dip tanks, availability of water, low number of dip-tanks, the potential problem of
tick resistance to acaricides (Nolan, 1981; Keating, 1983; Young et al., 1988), to a
recently public awareness on issues dealing with pollution of the environment and
residues in animal products like milk.
Another issue which has been studied is the development of resistance in
cattle to R. appendiculatus ticks. The resistance is caused by repeated exposure and
probably also affects the transmission of T.parva by impairing the feeding of the
ticks (Chiera et al., 1985; Fivaz et al., 1989). Infection rate in the ticks feeding on
cattle with a high degree of resistance are likely to be low and the severity of the
clinical disease in resistant cattle exposed to infected ticks is likely to be reduced
(Young et al., 1986). The benefits of allowing tick infestations to a certain level on
cattle can be difficult to explain to farmers.
Nevertheless, tick control has remained as the chosen method despite the
above mentioned set backs and has contributed to the livestock development in the
region as well as the eradication of East Coast fever.
2. 7.1 Chemotherapy
There are currently drugs available on the market for the treatment of theileriosis but
these are very expensive and usually beyond the reach of the communal farmer.
Clexon (parvaqoune) and Butalex (buparvaqoune) are now available and have had
good results (McHardy et al., 1985) and still a good diagnostician is required to
prescribe timely treatment to avoid any loses. The drugs are effective against both
schizonts and piroplasms, but treatment does not achieve a parasitological cure, and
recovered animals may remain carriers and may take several months to return to
35

normal productivity (Dolan, 1986). Both drugs have the disadvantage of being
relatively expensive and this reduces their application in the field, but they can be
used as a back-up to prevent mortality if other forms of control prove ineffective.
2. 7.2 Vaccination
The development of methods of immunisation against East Coast fever has been
reviewed by Brown (1985), Norval et a/ (1992) and Mutugi et al., (1988). Protective
immunity to T. parva persists for at least five years after natural infection (Neitz,
1957). Immunity will develop only in animals in which infection with schizonts has
been established. Effective methods of immunisation are achieved by controlled
infection of cattle using sporozoites derived from ticks.
In the early years of this century, before the introduction of acaricides, crude,
techniques of controlled infection were developed for immunisation. In Kenya,
animals from endemic areas which were thought to be immune were exposed to
natural infection on heavily infested pastures. The majority which survived could be
used as transport oxen through infected areas. In South Africa, cattle were
immunised by the intravenous inoculation of preparations of spleen and lymph node
from infected animals, and up to 70% were protected against natural challenge
(Theiler, 1911).
No further progress was made until 1953, when Neitz discovered that the
administration of chlortetracycline (Aureomycin) during the incubation period had a
marked suppressive effect on the development of infection and permtned the
establishment of a solid immunity. Neitz' s observation was followed up by a team of
scientists working in Kenya under the auspices ;of the Food and Agricultural
36

Organisation (FAO) of the United Nations, and an infection and treatment method of
immunisation was developed (Radley, 1978). The method is described in detail in an
FAO manual (Anon, 1984). A crude suspension of sporozoites is prepared from
adult ticks which have fed as nymphs on infected cattle, have moulted, and have been
pre-fed on rabbits for three to four days to allow maturation of the sporozoites. The
suspension is mixed with glycerol as a cryoprotectant and stored, deep frozen, at
minus 70°C or in liquid nitrogen. Aliquots are titrated in susceptible cattle to
determine an optimum dose for immunisation. The stabilate is inoculated
subcutaneously into the cattle to be immunised and simultaneously an intramuscular
injection of 20 mg/kg of a long-acting oxytetracycline preparation is administered.
Infection develops to a mild or subclinical level and the animals are thereafter
resistant to challenge, both experimental and natural, although infection may persist
and animals may remain asymptomatic carriers. The duration of immunity appears
to be comparable to that which follows natural recovery.
The infection and treatment technique provides good immunity against the
homologous immunising strain, but is not consistently successful against unrelated
strains. On the basis of extensive cross-immunity trials, the Boleni stock has been
found to be a suitable vaccine for immunisation in Zimbabwe. Vaccination against
theileriosis can be viewed as an attempt at artificially introducing enzootic stability
between cattle, Theileria parasites, tick vectors, so that susceptible cattle once
introduced to ih0 Theileria pathogen thro 1gh immunisation are subsequently able to
withstand lethal challenge from these infections. The use of live vaccines even in the
control of other tick-borne disease require that trained personnel be available to
37

vaccinate susceptible herds. Also the preparation of the vaccines can only be done in
special laboratories to avoid contamination with extraneous pathogens.
There are six strategies for controlling tick-borne diseases in areas where the
diseases are enzootic (Lawrence, 1990) :-
(a) Absolute tick control without immunisation
(b) Absolute tick control with immunisation
(c) Tick reduction with immunisation
(d) Tick reduction without immunisation
(e) Immunisation without tick control
(f) No control
The choice of the most appropriate strategy is dependent on the epidemiological and
economic characteristics of the cattle production system targeted for. In the
Zimbabwe subsistence livestock economy most of the cattle would be adapted to
local ticks and tick-borne diseases and it is currently appropriate to allow enzootic
stability to develop naturally. For the high production livestock economy, especially
dairy production with highly susceptible animals, the control measures adapted must
be effective but also economically justifiable. In order to allow maximum
productivity it might be necessary to protect against all·the major tick-borne diseases
to reduce the cost of acaricides thus rendering the animals to develop enzootic
stability. However the whole exercise has to be approached with great caution
because of the development of carrier stat 1s and the possibility of having high levels
of parasites in the tick vecto1 s and hosts not forgetting the introduction of the
parasites in areas with the tick vector, which do not have the disease.
38

2.7.3 Recombinant DNA vaccines
The main mechanism of immunity in theileriosis is cell mediated and thus makes the
development of genetically engineered vaccines challenging. The schizont stage of
the parasite induces antigenic changes on the surface of the infected lymphocyte,
which are recognised in conjunction with MHC antigens of the host (lrvin, 1987:
Morrison, 1989). Efforts are underway to identify and isolate the parasite genes
responsible for the antigenic changes seen in infected cells, with the goal of
transfecting such genes into host cells to induce the changes normally stimulated by
intact parasites. In addition to the schizont associated cell mediated immunity,
humoral responses are induced by Theileria sporozoites. Monoclonal antibodies
have been demonstrated to neutralise T parva sporozoite infectivity (Musoke et al.,
1984). The neutralisation was not strain specific indicating a common antigenic
determinant associated with the sporozoite surface coat (Webster et al., 1985).
Dobbelaere et al. (1985a, b) found the 67kDa protein to be the common antigen.
Williamson et al., (1989) characterised a surface antigen complex of T
annulata sporozoites by using monoclonal antibodies that neutralised sporozoite
activity in-vitro. The gene encoding for this complex was cloned, and a fusion
protein expressed from a fragment of the gene elicited strong neutralising antibodies.
Work on potentially protective antigens of T parva has produced promising results.
Sera from animals that had recovered spontaneously or from animals in endemic
are~: identified five major antigens ofrela·ive molecular masses 180, 104, 85, 67 and
35 kDa (Musoke et al., 1987). Of these antigens, the 67 kDa and 85 kDa are located
on the surface of sporozoites (Dobbelaere et al., 1985). The 104 kDa was shown to
39

be a microneme I rhoptry antigen (lams et al., 1990), and the location of the other
antigens on the parasite has not been determined. Both the 67 and 85 kDa proteins
were recognised by neutralising monoclonal antibodies as well as by colostrum
collected from immune dams (Morzaria et al., 1989) The 67 kDa antigen is stage
specific being present in sporoblasts and sporozoites while the 85 kDa antigen is
found on the surface of sporozoites and schizonts of Tparva. The 67 kDa antigen is
invariant whereas the 85 kDa antigen varies in relative molecular mass depending on
the stock of parasite. The 85 kDa has been demonstrated to vary from 69 kDa for
Tparva (Marikebuni) to 100 kDa for buffalo derived Tparva (the former Tparva
Lawrencei) (Shapiro et al., 1987). Further work on the p67 was done in an attempt to
develop an alternative immunisation procedure at ILRI, Nairobi. The gene encoding
the p67 was expressed by using the plasmid expression vector pMG 1. Previous work
found the gene to encode for 709 amino acid residues, a single intron of 29 base pairs
and is only transcribed during sporogony. The recombinant p67 sequences were
fused to the first 85 amino acid residues derived from a non-structural gene (NSI) of
influenza virus A. Protection in 6 out of nine animals on homologous challenge was
successful with the partially purified recombinant antigen emulsified in 3% saponin
(Musoke et al., 1992).
Partial characterisation of the T parva genome using monoclonal antibodies
to screen genomic expression libraries generated from piroplasm DNA inserted into
bacteriophage vectors has been done by Guerin-Marchand and Lambiotte (1984).
Several clones were identified and characterised and found to encode sequences
40

having molecular weights rangtng from 18.5 to 25.5 kDa. Antisera to these
sequences neutralised the infectivity of sporozoites in vitro.
Although the prospects of developing effective recombinant vaccines for
Theileria spp. seem promising, particularly if the parasite DNA can be introduced in
a vaccinia expression vector, such vaccines are not likely to be available soon for
field use (Irvin and Morrison, 1989).
2.8 Carrier State
In a study in Zimbabwe, T. parva was demonstrated to produce a carrier state in
cattle, 7-12 months after infection (Koch , 1990), by transmission of disease using
adult ticks fed as nymphs on healthy theileriosis recovered cattle.
Investigations into T. parva Boleni carrier state were performed in the FAO I
Danida programme for Tick and Tick-borne disease control (Phase 11). Three tick
pick-up I transmission attempts were carried out using T. parva Boleni-carrier
animals at 6, 10, and 18 months post immunisation. None of the 15 tick batches fed
as nymphs on the carrier animals showed infection in the salivary glands. However,
infectivity of the tick batches to susceptible cattle was achieved with 10 out of 15
batches. After 18 months, transmission of the carrier parasites was achieved in four
of the six cattle.
Successful PCR amplifications were performed using DNA from 2 cattle
infected with T. parva Boleni 3 months post infection, tick infections were negative 6
weeks post infection of experimental animals (Bishop et al., 1992)
In Kenya, Kariuki et al., (1995) showed that uninfected R. appendiculatus nymphs
applied to naturally recovered Zebu and exotic cattle kept under tick free conditions
41

in the laboratory could transmit fatal theileriosis as adult ticks to susceptible cattle at
16 and 17 months respectively. It was also possible to demonstrate that cattle
immunised by the infection and treatment method to be carriers of T. parva by
examination of the salivary glands of ticks applied to them and by tick transmission.
In Kenya, uninfected R. appendiculatus nymphs were applied to cattle from a T.
parva endemic area over a period of 13 months after transferring the animals to
Muguga Veterinary Institute, and 18 out of 23 batches transmitted T. parva infection
to cattle. Infection intensities in the tick batches were very low, with one (1) salivary
gland acinus infected per tick.
A carrier state lasting for 19 months was demonstrated by Dolan (1981; 1985)
in cattle experimentally infected with T. parva isolates after treatment with curative
drug, parvaquone (Clexon, Welcome Foundation).
The carrier state of Theileria has been defined as the ability of an infected and
recovered host to infect ticks, which are then able to transmit the parasite to
susceptible animals (Levine, 1973; Schwabe et al., 1977; Young et al., 1986). Stages
which maintain infection are:
1) slow proliferation of schizont -infected lymphocytes, some of which undergo
merogony to produce merozoites infective to the erythrocytes (Maritim et al.,
1989b; Kariuki, 1991 ); this stage can occur in T. parva infections of cattle
and buffalo.
2) by the regular division of intra-erythrocytic piroplasms, this occurs in all
Theileria species, with the possible exception of T. parva. Recent work by Conrad et
al., (1987) has confirmed that limited division of intraerythrocytic stages ofT. parva
42
may occur. Establishment of cell lines from carrier cattle (Kariuki et a/.,1995)
infected with T. parva have been successfully demonstrated but the methods are very
laborious and can be very insensitive especially in field situations where there might
be mixed parasite populations. However the methods can be applied successfully in
research and in special cases of vaccine breakthroughs.
43
CHAPTER THREE
Infection of experimental animals with Theileria parva parasites
3.1 INTRODUCTION
The Zimbabwe Theileriosis vaccination programme using the live Bolvac ® vaccine is
targeted at areas of high disease incidence and properties with theileriosis problems.
The present Zimbabwean Theileria vaccine stabilate Bolvac® was confirmed to
confer immunity against several stocks and two from eastern Africa. Partial
immunity was demonstrated against another stock from northern Malawi (Hove et
al., 1995). The control of theileriosis in Zimbabwe is now moving away from
absolute reliance on intensive dipping, to vaccination against the disease with the aim
of attaining endemic stability of cattle through strategic seasonal tick control,
coupled with immunisation. Indigenous cattle in enzootic areas are generally resistant
to theileriosis and undergo mild infections from which they recover, but may remain
chronic carriers. In contrast, exotic cattle are highly susceptible and undergo severe
infections that may be fatal, consequently immunisation is targeted at these improved
breeds. It is these vaccinated herds which could provide further foci of infection
(Koch, 1990), as it has long been accepted that T parva produces a carrier state in
recovered animals (MacKinnon, 1953; Neitz, 1957). The cost ofacaricides to control
ticks and anti-theileria! drugs have been a major drawback to cattle producers.
Cattle of improved breeds which recover from pathogenic Theileria parva infections
may fail to develop their full productive pJtential and are less economic to maintain
(Pegram et al., 1996). Several factors which affect infection in the mammalian hosts
include the number of ticks infesting cattle, tick infection rates, success of
44
transmission, antibody prevalence, case fatality rates, disease incidence and "carrier
state". Hence the need to cautiously introduce vaccination in the cattle populations at
risk.
In order to obtain accurate epidemiological data it is important to develop new
diagnostic methods for T parva to determine if the animals are carriers of infection
and also to investigate apparent vaccine failures or breakthroughs. The situation in
Zimbabwe is further complicated by the fact that animals which could be T parva
carriers are being moved from place to place at cattle sales thus resulting in the
spread of the parasite to areas where the vector is present.
In order to compare conventional methods of detecting carriers of Theileria
parva by PCR, calves were infected and exposed to infected ticks in order to
establish carrier states of T parva with Zimbabwean isolates including the
immunisation vaccine candidate Bolvac®. The animals were kept in tick-proof
facilities and monitored until 40 days after challenge with T parva A very. Burridge
et al., (1972) demonstrated that cattle recovered from East Coast fever are almost
invariably immune to challenge with T parva, and this immunity has been
demonstrated to last for at least 3.5 years. Hence in this study it was very important
to establish T parva infection in order to achieve a carrier state of the disease and
immune status.
3.2 An overview of the experiments
Prelitninary stuaics were carried out (Jt tht · CTVM, Edinburgh to test the PCR assay.
Two susceptible calves were infected one with T parva Boleni (Zimbabwe) and the
other T parva Marikebuni (Kenya). Both parasites are known to induce a carrier
45

state. The clinical, parasitological parameters and serology were monitored in the
calves and blood taken for PCR assay.
Different Zimbabwean T. parva stocks including the Theileria vacctne
(Bolvac®) were used to infect susceptible Friesian calves at the Veterinary Research
Laboratories (VRL ), Harare. Clinical and parasitological parameters were measured
intensively until recovery from primary infection and then intermittently until the
calves were challenged 522 days, later. In this study 5 groups of experimental calves
were infected with different stocks ofT. parva (as described in Table 3.1). Due the
unavailability of cattle pens and calves to infect by the application of infected ticks
only two calves could be used for the Ayrshire an':! Chikeya tick applications (Group
IV a and b). The vaccine stock T. parva (Boleni) was used to infect group I
experimental calves and the clinical reactions compared to other Zimbabwean
parasite stocks.
At Hunyani estates there was a risk of a mixed Theileria infection because of
the presence of wild animals e.g. tsesebbe, impala and sable. As a result it was very
important to make cell cultUre isolates from the calves for characterisation using a
panel of anti-schizont monoclonal antibodies in order to correctly identify any other
Theileria species that may be present. The use of MAbs is particularly useful in
differentiating T. taurotragi from non-pathogenic stocks ofT. parva because these
parasites are difficult to distinguish morphologically and in their common tick vector
or in cattle, clinical reactions may be sir1ilar. In addition cross-reactions between
parasites in routine IF A testing can occur (Grootenhuis et al., 1979; Minami et al.,
1983). Those animals surviving initial infection were challenged with T. parva
46

A very, which is known to be a virulent isolate (Koch, 1990). Calves in this study
were challenged on days shown in Table 3.1 and calves in group 11 had homologous
challenge.
This chapter describes the response of these calves to infection and challenge. Tick
feeds were performed and material was generated for in vitro analysis in the
subsequent chapters. Later chapters will describe studies on the persistence of the
parasites in the calves as measured by microscopic examination, the feeding of clean
nymphal R. appendiculatus ticks, PCR and serology. In this chapter the persistence
of infection was determined by the examination of weekly blood smears, Giemsa
stained to check for piroplasms.
3.3 Materials and methods
3.3.1 Experimental calves and maintenance
Calves for preliminary experiments at CTVM for infection with T. parva Marikebuni
(calf 818) and T. parva Boleni (calf 805) were Friesian bulls of about 6 months of
age and were kept on straw in tick-proof facilities. Calf 805 was challenged with a
lethal dose of T. parva (Muguga) sporozoite stabilate 63 days post infection to
determine if the Boleni stock protected against heterologous stock.
In Zimbabwe, Friesian bull calves of about 6 months old were bought from
Lanark Farms situated 40 kilometres south ofHarare. This farm is known to have no
history of pathogenic theileriosis and strict tick control is practised from birth.
Calv·~s were shown to be seronegative for T. parva antibodies by the Indirect
Fluorescent Antibody Test (Burridge and Kimber, 1972) and no parasites were seen
in Giemsa-stained blood smears taken from the ear vein. Animals were maintained
47

on concrete floors in tick-proof facilities at VRL and were fed on low protein dairy
meal for the whole experimental period until the final 35 days when they were
allowed to graze in a paddock and received acaricidal treatment. Table 3.1 details the
experimental calves used and parasite infections. Two groups (Va and Vb) of
susceptible calves were transported to Hunyani estates and exposed to ticks in a
paddock previously grazed by the beef herd on the farm. The calves were exposed
on two separate occasions a year apart.
Table 3.1 Experimental design for primary animal infections perfonned in Zimbabwe.
Experiment calf Calf Source of Mode of Interval group number infection infection between
infection and challenge
I W70 T. parva Subcutaneous 522 days W73 Boleni-vaccine inoculation W74; stock W75
11 1442 T. parva A very Subcutaneous 522 days 1454 stabilate inoculation
Ill 1447 T. parva Bally Subcutaneous 522 days 1459 Vaughan inoculation
stabilate IV a 1456 Ayrshire farm Tick 564 days
ticks application IVb 1437 Chikeya farm Tick not done
ticks application V a 1372 Hunyani Field 566 days
1376 Estates ( 1 st) exposure 1451 1458
Vb El, Hunyani Field 182 days E2, Estates (2nd) exposure E3, E4, E5
48

3.3.2 T. parva parasite stocks
The T. parva stocks were stored in liquid nitrogen as cryopreserved tick stabilates in
Minimum Essential Medium (MEM) (Gibco) (Cunningham et al., 1973) containing
7 .5o/o glycero~, 200 units I 200 J.Lg per millilitre of penicillin I streptomycin (Gibco)
and 3.5% bovine plasma albumin-Fraction V (Sigma). Details ofT. parva stocks are
shown in Table 3.2.
(a) The original T. parva (Boleni) stock, when isolated at Boleni Farm in
Arcturus in 1979 was found to be pathogenic (Lawrence and Mackenzie, 1980;
Uilenberg et al., 1982). From 1984, the pathogenicity of the parasite has been found
to be mild in Friesian calves (Koch et al., 1988; Irvin et al., 1989). The stabilate T.
parva (Boleni 86-1), which was derived from T.parva (Boleni 85-4), proved to be
even milder than the original stocks. Examination of the T. parva (Boleni GU79-1)
stabilate, derived from the original T. parva (Boleni GU79), in Friesian calves also
resulted in less severe reactions than the original stabilate (FAO I DANIDA
Programme Phase 11, 1993). Group I calves were infected with the vaccine stock.
(b) Adult R. appendiculatus ticks were collected from a paddock at Bally
Vaughan farm, 45 kilometres north-east of Harare Zimbabwe, shared by both cattle
and wild ungulates including buffalo. The adult ticks were fed for four days on
rabbit ears and a stabilate was prepared (Cunningham et al., 1973). The parasite was
characterised at The International Livestock Research Institute (ILRI, Nairobi) as
buffalo derived T. parva formerly known as T. p. lawrencei (Bishop et al., 1994).
Group Ill calves were infected with the stock by subcutaneous inoculation.
49

(c) The A very stock was isolated at a dairy farm near Gweru owned Mr. W. J.
Avery. During a theileriosis outbreak, a sick Holstein-Friesian cow was brought to
the Veterinary Research Laboratory, Harare and clean nymphal R. appendiculatus
ticks were applied to pick up the infection (Koch, 1990). The salivary glands of the
moulted adult ticks were dissected out, and stained using Methyl-green pyronin and
had a mean intensity of infection of 133.3 infected acini per tick. The ground-up-tick
stabilate was prepared as per method described by Cunningham et al. (1973). This
stock was used to infect group 11 calves. (Table 3.2).
50

Table 3.2 T parva stocks used for infection
Boleni A very Bally Vau~han
Isolation site Boleni farm A very farm Arc turns
Isolation date Jan 1979 Jan 1986 Feb 1991
Method of Isolation Clean R. append. Clean R. append Questing ticks fed on ticks fed on field ticks field case field case
Reference Lawrence & Koch, 1990. FAO, Mackenzie, 1980 1991
MAb characterisation Cattle derived Cattle derived Buffalo
T parva T parva derived T parva
Stabilate used Gu79-3 A very BV 17
Stabilate number 24 23 17
Passage number 3 2 1
o/o infected ticks 63.5 58.2 1.8
Tick equivalent I ml 10 10 10
Volume used per calf (ml) 1 1 1
R. append. Rhipicephalus appendicu/atus
Group I, 11, and Ill calves were infected with T parva Boleni, Avery and Bally
Vaughan stabilates described above respectively .
........ ·
I .. ~
51

3.3.3 Infection of experimental animals with ground up tick stabilates
At least four 2.0 ml Nunc cryotubes of any one stabilate were thawed rapidly in a
37°C water bath, pooled and allowed to equilibrate at room temperature for twenty
minutes. Each experimental animal received 1.0 ml of a particular stabilate by
subcutaneous inoculation in front of the right parotid lymph node using a tuberculin
syringe with a one-inch 18-gauge needle.
3.3.4 Infections by application of adult R. appendiculatus ticks
Group IV a (calf 1456) was infected by applying 150 adult R. appendiculatus ticks to
ear bags. The adult ticks were picked up by hand from grass-tops at the beginning of
February 1994 from a paddock at Ayrshire Farm 90 kilometres north of Harare. The
property is known to have had outbreaks of pathogenic theileriosis and cattle on the
farm have been immunised against theileriosis since 1990. A sample of 29 adult
ticks from the infection batch had an infection prevalence of 20.68% when they were
dissected to determine the Theileria infection rate. The ticks collected from Ayrshire
Farm had a total of21 infected acini in the 6 infected ticks after partial feeding for 3-
4 days on rabbits' ears:
Group IVb (calf 143 7) was infected by applying· 150 adult R. appendiculatus
ticks in ear bags, which had been questing on grass in paddock at Chikeya Farm 100
kilometres north of Harare. The property is known to have had outbreaks of
pathogenic theileriosis. A sample of 30 adult R. appendiculatus ticks were dissected
and the infection intensity of 16.7%. Out of the 30 Chikeya Farm aduit ticks
collected 25 Theileria positive acini were detected in the 5 ticks that were infected.
52

The mortality records due to theileriosis are shown on Table 3.3 for the
period 1986 to 1991 as reported to the Director of Veterinary Services Harare for the
two above mentioned properties (DVS Monthly reports 1986 - 1991 ).
Table 3.3
Mortality due to Theileriosis on Ayrshire and Chikeya farms
Farm Herd
Ayrshire
Chikeya
Census
600
410
1986-87
?
18
DEATHS*
1987-88 1988-89
?
74
18
100
* DVS/Owner- manager/ FAO staff reports
1989-90 1990-91 (8)
22
70
20(+35oo)
15(+16oo)
(8) FAO phase 11 Theileriosis project tracer animals put to graze in the same
paddocks with farm owner's animals.
oo severe infections treated with Clexon® (Coopers).
? Data not available
3.3.5 Field exposure of calves at Hunyani estates
Hunyani Estates, a property 70 kilometres south east of Harare, was identified for
exposure of susceptible calves to theileriosis infection. The proprietor had reported
four cases of pathogenic theileriosis in the 1992 rainy season and the FAO
Theileriosis team at VRL had immunised cattle on the property in October 1993.
The farmer practised weekly dipping of cattle from the months of November to June
53

and twice per week from July to October in Amitraz. Neighbouring farmers had also
lost animals due to theileriosis when they had strayed through broken fences onto the
Hunyani estates.
A group of four Theileria negative calves purchased from Lanark Farms
(Group Va, numbers 1372, 1376, 1451, and 1458) were allowed to graze in a
paddock at Hunyani Estates known to be heavily infested with adult R.
appendiculatus ticks in February 1994. Questing grass top R. appendiculatus adult
ticks were picked up by hand in the paddock when the susceptible calves were
exposed, and had a prevalence of infection of 10.7%. A second group (Group Vb
calves El, E2, E3, E4 and E5) were moved to Hun:-/ani Estates in February 1995, into
the same paddock as the previous group for field exposure to ticks, in order to pick
up infection and attempt tissue culture isolation of the Theileria parasite. Both
groups were seen daily by an animal attendant on the farm and monitored once a
week by Mr. K. Kanhai (FAO) and the author. They were visited immediately if
there were any reports of sick animals.
3.4 Monitoring and assessment of Theilerial infections during primary
reaction
At the CTVM the calves used for the preliminary studies were monitored daily by
Dr. S. Williamson and the author according to the monitoring regime detailed below.
The calves exposed at Hunyani estates (group V) were monitored once a week by
visits to the estates and closer monitoring was achieved when they were transferred
to the VRL-Harare post recove-ry and challenge with the rest of the experimental
54
animals. Calves in groups I - IV were monitored from the day of infection (day 0) by
Drs. T. Hove, D. Munodzana and the author for 35 days as follows:
(a) Clinical examination
Rectal temperatures were recorded daily from day 0 of primary infection or
challenge. A temperature of 39.5°C and above was recorded as a febrile response.
During the course of infection the clinical signs of the disease including pyrexia,
depression, inappetance, weakness, lachrymation, petechial haemorrhages and lymph
node enlargement were noted. A check list was used on each occasion. Post mortem
examinations were carried out on all animals which died and smears were prepared
from the prescapular, parotid, precrural and mesenteric lymph nodes, the heart
muscle, spleen, liver, kidney, lung and brain.
(b) Parasitological examination
(i) Lymph nodes-: The presence of schizonts (macroschizonts/microschizonts ) and
hyperplastic cells in the draining lymph nodes were monitored by examination of
Giemsa stained needle biopsy smears. These were prepared daily when they were
enlarged, starting on day 5 post inoculation of sporozoite stabilate, when the lymph
nodes were first found to be enlarged. Lymph node biopsy smears from animals
which had ticks applied on them were made after having palpation to check for
enlargement due to infection. The biopsy sampling was continued until schizonts
were no longer detected on three consecutive days of sampling. Lymph node biopsy
smec:rs were air dried, fixed in absolute nethanol (AEC-SA) for one minute and
stained in filtered 1 0% Giemsa stain (Merck) in Giemsa buffer (Appendix 1) for 20
minutes. The smears were rinsed in tap water, air dried and examined under oil
55

immersion at 500 X and 1000 X magnification using a Labolux D microscope (Leitz,
Germany). The degree of schizont parasitosis was evaluated as:
Mac+ 1% cells containing schizonts (1 on the macroschizont index).
Mac++ 1-5% of cells containing schizonts (2 on the macroschizont index).
Mac+++ > 5% of cells containing schizonts (3 on the macroschizont index.
(ii) Blood smears
The presence and level of parasitaemia was monitored by the examination of thin
blood smears, using blood taken from the ear veins taken on day 0 and from day 12
until no parasites were seen for three consecutive days, following which blood
smears were taken weekly. Blood smears were stained as described above, and the
degree of parasitaemia was recorded as the percentage of infected red blood cells.
The parasitaemia was noted after 50 high power fields (HPF) using a X1 00 objective
had been examined. The smear was recorded as "no parasites seen" if 100 high
power fields (approximately 35 000 RBC) were examined and no piroplasms
observed.
(c) Tissue culture
Jugular blood was taken into vacutainer tubes (Bccto:1 Dickinson, California, USA)
containing the di-sodium salt of ethylenediaminetetra-acetic acid (EDTA - Sigma) in
order to isolate Theileria infected cells from calves undergoing a clinical reaction
after exposure at Hunyani estates. Details of tissue culture attempts are given in
section 3.3.
56

(d) PCR
Blood was taken into EDT A vacutainer tubes for use in the PCR as detailed in Table
3.5.
(e) Serology
Blood was taken in plain vacutainer tubes (Becton Dickinson, Meyland, Cedex,
France) a day prior to infection or exposure of calves and one day before challenge.
Calves were also sampled for serum as indicated in Table 3.3. The blood was left to
clot at room temperature, incubated for 1 hour in a 3 7°C water bath and then left to
stand overnight at 4°C. The following day, serum was removed and centrifuged at
400 xg for 20 minutes at room temperature. The serum was aliquoted and stored at -
20°C until use.
3.5 Monitoring between recovery and challenge
Blood for serum and PCR was taken according to the sampling protocol shown in
Table 3.4. Rectal temperatures were recorded daily. Blood smears were also taken
weekly from all the animals for the duration of the experiment and Giemsa stained
for microscopic examination.
3.5 (a) Treatment
During the primary infection and the challenge, animals which underwent severe
reactions were treated with buparvaquone (Butalex, Coopers, England) at a dose of
2.5 mg/kg, intramuscularly on a single occasion.
3.5 (b) Evaluation forT. parva reactions
The criteria used to define calf reactions to the infection were as described by Anon,
(1989):
57

NR no reaction - when no parasites were detected on the Giemsa-stained blood
smears and no clinical signs were apparent.
MR mild reaction - when the animal was clinically normal, with no fever or a
fever persistent for less than 4 days, a low schizont parasitosis and the animal
recovered.
MoR moderate reaction - when the animal showed a mild and transient clinical
reaction which eventually disappeared with a schizont parasitosis and a febrile
reaction of 5 to 9 days.
SR severe reaction - when schizonts were detected, the febrile reaction persisted
for 8 days or more and the animal was clinically ill.
Some of the experimental animals at Hunyani Estates died despite treatment when
they had severe theileriosis.
Post mortem examinations were carried out on all animals which died and
smears were prepared from the prescapular, parotid, precrural and mesenteric lymph
nodes, heart muscle, spleen, liver, kidney, lung and brain. Smears were fixed and
Giemsa stained as described ·above in order to confirm the cause of death as
theileriosis.
58
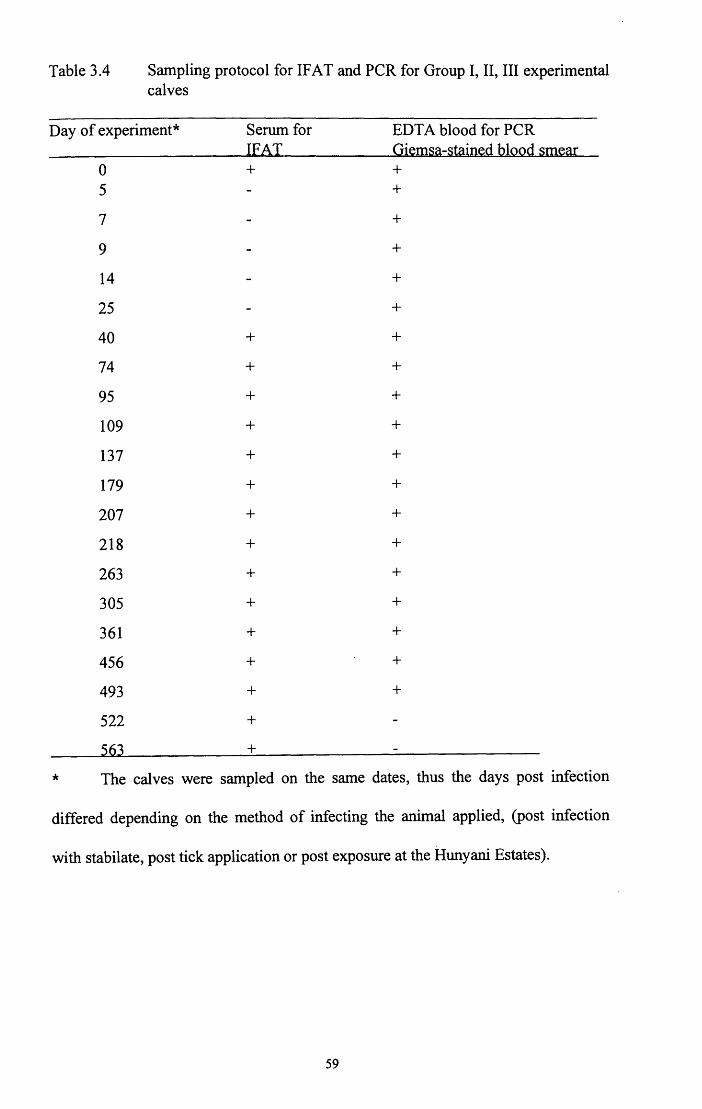
Table 3.4 Sampling protocol for IFAT and PCR for Group I, 11, Ill experimental calves
Day of experiment* Serum for EDT A blood for PCR IEAI Gi~msa-stain~d blQQd sm~ar
0 + + 5 +
7 +
9 +
14 +
25 +
40 + +
74 + +
95 + +
109 + +
137 + +
179 + +
207 + +
218 + +
263 + +
305 + +
361 + +
456 + +
493 + +
522 +
+
* The calves were sampled on the same dates, thus the days post infection
differed depending on the method of infecting the animal applied, (post infection
with stabilate, post tick application or post exposure at the Hunyani Estates).
59
Blood smears were done on each animal weekly for Giemsa staining. The PCR and
IF AT are described in the later chapters 4 and 6 respectively. The group IV, V a and
Vb experimental calves were sampled at the same time as the other calves post tick
application and exposure, thus they had different days post infection samplings.
3.6 Characterisation of the Hunyani isolate with Monoclonal Antibodies
(MAbs)
In order to identify the T parva stock at Hunyani Estates a panel of eleven
monoclonal antibodies (MAbs) raised against Theileria macroschizont antibodies
supplied by ILRI (Nairobi) were used to analyse the cell lines established from the
animals exposed at Hunyani estates. Infected lymphoblastoid cells isolated from the
animals (Tag numbers El, E3, E4, and E5) exposed at Hunyani Estates were tested
with the panel of MAbs, T parva Muguga (Kenya) and T parva Boleni (Zimbabwe)
schizont antigens. All the antigens were prepared using the formaldehyde fixation
method as described in the preparation of macroschizont antigen (section 6.2.1 ). The
anti-schizont MAbs 1-4, 7, 10, 12, 15, and 20 used in this study have been described
before (Minami et al., 1983; Conrad et al., 1987). MAbs 21 and 22 have also been
described by Conrad et a/ (1989). Pearson et al (1979) prepared MAb 23 using mice
inoculated twice with cells of a T taurotragi schizont -infected lymphoblastoid cell
line, which gave positive reactions with T taurotragi schizonts but not with T. parva
schizonts. The ten well slides used in the MAb -IFAT had three MAbs applied per
slide at dilutions of 1 in 50 and 1 in 200. Twenty J.!l of MAb at the specified ~ilution
was used and the remaining wells had PBS pH 7.2 added. After incubation in a
moist chamber for 30 minutes at room temperature the slides were washed
60

thoroughly two times for 15 minutes with gentle agitation in ice cold PBS. Twenty
Jll of conjugate was added to each well after the washes and incubated in a moist
chamber at room temperature for 30 minutes. The conjugate used was a sheep anti
mouse IgG-Fluorescein isothiocyanate (FITC) conjugate (Serotec, Denmark) at a
dilution of 1:60 in PBS containing 0.01% (w/v) Evans Blue. Following incubation
with the conjugate the slides were given a further wash as before and mounted under
50% dilution buffered glycerol (Microscopic glycerol-BDH) in PBS(1:1) with a 50
mm x 22 mm cover slip and were ready to be read under a Leitz fluorescent
microscope. The results were recorded as the percentage of fluorescing cells and the
intensity of fluorescence as follows:
+ >90o/o fluorescence
(+) 50% fluorescence
( +) w weak fluorescence
no fluorescence
3.7 RESULTS
3. 7.1 Reactions to primary infection
The reason for carrying out T. parva infections at the CTVM was to determine
whether the type of experiment could be carried out successfully in Harare. That is,
the infection of cattle with laboratory T. parva stocks, monitoring of parasites
microscopically, determining of presence of parasites indirectly by PCR, serology
and the optimi~ation of the PCR assay. The experiments at CTVM were successful
and indicated that similar studies could be carried out in Zimbabwe using local
61

stocks ofT. parva. Clinical reactions and microscopy results are described in this
chapter and the PCR, tick infections and serology in subsequent chapters.
A summary of calf reactions to primary infections with T. parva Boleni and
Marikebuni at the CTVM is given in Tables 3.5 and 3.6 respectively. Calf 805
infected with neat 1 ml of the Bolvac® vaccine had a severe theileriosis reaction and
did not require treatment since we intended to validate the PCR assay for the
detection ofT. parva.
The clinical and parasitological reactions for individual calves (groups I, 11, Ill, IV
and V) for the first 30 days post infection are swnmarised in Tables 3.7 and 3.8.
Two calves in Group I (W74 & W75) were lost in accidents in the cattle pens at VRL
Harare and calf 1437 had to be humanely killed due to a bacterial infection in its
urinary bladder.
3. 7.2 Reactions to T. parva Boleni and Marikebuni preliminary infection
studies
Calf number 818 infected with T. parva Marikebuni underwent a mild clinical
reaction. The calf had macroschizonts detected in the right and left prescapular
glands on three days post infection. The febrile episode persisted for less than four
days and the animal recovered without any treatment as detailed in Table 3.6.
The T. parva Boleni infected calf (805) had a severe clinical reaction with schizont
parasitosis detected for 16 successive days and had 12 days of febrile reaction as
detailed in Tabl~ 3.6. Piroplasm parasitcemia in this calf lasted for 20 successive
days from day 14 with a maximum of 0.6% on day 19 post infection. The calf
recovered without treatment and was challenged with a lethal dose of T. parva
62
(Muguga) sporozoite stabilate 63 days post infection to determine if the Boleni stock
protected against heterologous stock.
PCR assays using the p67 primer sequences for T parva on samples from the
calves 818 and 805 were successful and therefore allowed us to carry out further
experiments in Harare. (PCR results are given in Chapter 4).
3. 7.3 T. parva Boleni infection
Calves in group I (W70, W73, W74 and W75) underwent moderate reactions and did
not require treatment. Calf W73 did not demonstrate a rectal temperature greater
than 39.5°C and had a macroschizont parasitosis and piroplasm parasitaemia of less
than 0.1% for 23 days. The other calves in the group had rectal temperatures above
39.5°C as shown in summary of primary infections in Table 3.7. Calves in this
group showed piroplasm parasitaemias of not more than 0.1% during the 30 days
post infection. The piroplasm parasitaemia persisted for an average period of 28
days in all 4 calves (range of 22 to 35 days). The piroplasms in the T parva Boleni
infected animals appeared intermittently during the 522 day period before
heterologous challenge. The group also had low macroschizont parasitosis for 8 to
10 days.
3. 7.4 T. parva A very infections
Of the two calves in Group 11, animal 1442 had no parasites detected in the draining
lymph nodes. Calf 1442 showed a piroplasm parasitaemia of less than 0.1% on days
179 e-nd 193 post infection although it did not show evidence of infection during the
initial 30 days. The second calf in group 11 (calf 1454) had a severe Theileria
63

reaction and had to be treated on day 15 post infection and it did not show any
piroplasm parasitaemia.
3. 7.5 T. parva Bally Vaughan infections
Calf 1459 showed no evidence of Theileria reaction, no febrile reaction and no
piroplasm parasitaemia throughout the period before heterologous challenge as
shown in Table 3. 7. The other animal infected with the T. parva Bally Vaughan
stabilate (calf 144 7) had a moderate clinical Theileria reaction as shown in Table 3. 7.
A piroplasm parasitaemia of less than 0.1% was detected from day 17 to 25, and on a
single occasion, day 367 post infection in the Giemsa stained blood smear (calf
1447).
3. 7.6 Infections from tick applications
(a) Naive calf 1456 which had application of Ayrshire Farm ticks showed a
moderate Theileria reaction and macroschizont parasitosis for 8 days and piroplasm
parasitaemias of less than 0.1% for 11 days. The calf recovered without treatment
and had persistent piroplasm parasitaemia for up to day 321 post tick application
(Table 3. 7).
(b) Calf 143 7 had the Chikeya ticks and underwent a Gloderate clinical reaction with
macroschizonts detectable by microscopy for 12 days post tick application. The
piroplasm parasitaemia was 0.1% for 11 successive days from day 17 post tick
application. (Table 3. 7)
3. 7. 7 Hunyani field exposure
3.7.7 (a) Three calves in group Va (Tags 1451; 1376; 1458) died from severe
theileriosis on day 14 following field exposure at Hunyani Estates even after
64

buparvaquone treatment. Post mortem confirmed theileriosis as the cause of death
and macroshizonts were seen in brain smears of two calves (1451 and 1376). Calf
13 72 survived following treatment and maintained a piroplasm parasitaemia of
between 0.1% and 2% during the 522 days prior to heterologous challenge. Details
of clinical reactions to primary infection are shown in Table 3.7.
3.7.7 (b) Group Vb calves (E 1 to E5) exposed to ticks in the field at Hunyani
Estates a year later (February 1995) suffered severe clinical theileriosis despite
buparvaquone treatment, two calves died (E2 and E3) after transportation to the tick
proof facilities at VRL - Harare. Post mortem examinations confirmed theileriosis as
cause of death.
The piroplasm parasitaemias in the surviving calves E4 and E5 were 1%
when the animals were undergoing Theileria clinical reactions and decreased to 0.1%
post recovery. Piroplasms could be seen in the Giemsa-stained blood smears on
every seventh day up to 80days post exposure. Piroplasms were seen more
frequently in the Hunyani Estates exposed calves than in the other experimental
groups (1, 11 ,Ill, IV a and b).
3.7.7 (c) The results for the reactivities of Theileria schizont-infected bovine
lymphocyte culture isolates are presented in Table 3.9. Isolates from Hunyani estates
gave positive reactions with the T taurotragi - specific MAb 23 and also MAbs 12
and 10. Reactions with MAb 10 which was raised against T parva (Kiambu-Kenya),
and MAb 22 which is characteristic ofT parva showed 50% fluorescence (Table
3. 9) The T parva Boleni and Muguga controls gave negative and positive reactions
with MAb 7 respectively Table 3.9).
65

MAbs 1-4, 7, 10, 12, 20, 21, 22 show a pattern characteristic of T. parva
(Minami et al., 1983; Conrad et al., 1989). Zimbabwean isolates have been known
not to react with MAb 7 (Koch et al., 1988). Isolates El, E2, E3 and E4 gave strong
positive reactions with the T taurotragi-specific MAbs 23 and 12, but weak
reactions with MAb 10. There was also some weak binding with MAb 22 in cell
culture isolates E 1 and E2 at 1:50 dilution of the MAb.
3.8 Reactions to T. parva A very challenge
A summary of clinical reactions toT parva A very challenge is given in Table 3.8 for
the first 40 days post challenge. The experimental animals were immune to T parva
A very challenge although two calves exposed at Hunyani estates (E4 and E5) had
macroschizont parasitosis for 4 and 3 days, at 14 and 16 days post challenge
respectively.
The T parva Boleni infected I recovered calves did not have a febrile
reaction, no macroschizonts but a piroplasm parasitaemia of less than 0.1% was seen
in the Giemsa stained blood smears 21 and 24 days post challenge in calves W70 and
W73 respectively. The piroplasms persisted for 5 days in calf W70, and 2 days in
calf W73 post challenge.
In the group II calf (1454) had a piroplasm parasitaemia of less than 0.1% on
day 23 only post challenge and the other calf had no parasites seen in the Giemsa
stained blood smear. The other calf (1442) which received a homologous challenge
had a rectal temperature above 39.5°C on dayl2 post infection, did not have
macroschizont parasitosis and piroplasm parasitaemia.
66

The T. parva Bally Vaughan (group Ill) infected I recovered calf 1442 had no
parasites seen in the Giemsa stained lymph node and blood smears post challenge,
but calf 1459 had a piroplasm parasitaemia of less than 0.1% on day 21 only post
challenge with T. parva A very.
Calf 1456 infected and recovered after tick application had no clinical
Theileria reaction and a piroplasm parasitaemia of less that 0.1% was seen in the
blood smears for 4 days from day 23 post heterologous challenge.
The control calves had severe reactions and calf 4855 died on day 30 post infection.
A prolonged macroschizont parasitosis was seen in the lymph node smears for 10
days in calf 4853, and 11 days in calf 4855 post infection.
67

Table 3.5 T parva Marikebuni infected calf No:818 febrile reaction and parasitological evidence of infection
Day p.i 0 1 2 3 4 5 6 7 8 9 10 11 12 13 14 15 16 17 18 19 20 21 22 23 24 25 26 27 28 29 30
Rectal temp. oc RPG smear 39.0 ns 38.9 ns 39.2 ns 39.0 ns 39.5 nps 39.2 nps 39.2 nps 38.8 nps 39.6 nps 38.7 mac +ve 39.3 nps 39.1 nps 39.1 nps 39.4 nps 39.2 nps 38.7 mac +ve 39.0 nps 39.1 mac +ve 38.9 nps 38.8 nps 39.0 nps 39.0 nps 39.2 nps 38.9 nps 38.7 ns 38.9 ns 38.5 ns 38.1 ns 38.4 ns 38.9 ns 38.6 ns
:Temperature :no parasites seen# :right prescapular gland :left prescapular gland :macroschizont positive :not sampled
LPG smear ns ns ns ns ns ns ns ns ns ns nps nps nps nps nps nps nps mac+ve nps nps nps nps nps nps ns ns ns ns ns ns ns
temp. nps RPG LPG mac +ve ns +<0.1% :piroplasms observed (iess than 0.1% parasitaemia)
68
Blood smear nps nps nps nps nps nps nps nps nps nps nps nps nps nps + 1piro nps +<0.1 o/o +<0.1o/o nps +<0.1% +<0.1% + 0.1% nps + 0.1o/o nps +<0.1% +<0.1% ns +<0.1% +<0.1 o/o ns

Table 3.6: T. parva Boleni infected calf No:805 febrile reaction and parasitological evidence of infection
Day p.i 0 1 2 3 4 5 6 7 8 9 10 11 12 13 14 15 16 17 18 19 20 21 22 23 24 25 26 2~
28 29 30
temp. nps +<0.1 o/o RPG LPG mac +ve ns
Rectal temp. °C RPG smear LPG smear 38.6 38.6 38.7 38.6 38.6 38.8 38.5 38.8 39.7 39.2 39.1 40.6 41.2 40.9 40.4 40.7 40.2 40.4 39.7 39.5 39.6 39.6 39.4 39.2 39.2 39.0 38.7 38.7 38.7 38.6 38.6
ns ns ns ns ns ns ns ns nps ns nps ns nps ns nps ns mac +ve ns mac +ve ns mac +ve mac +ve mac +ve mac +ve mac +ve mac +ve mac +ve mac +ve mac +ve mac +ve mac +ve mac +ve mac +ve mac +ve mac +ve mac +ve mac +ve mac +ve mac +ve mac +ve mac +ve mac +ve mac +ve mac +ve mac +ve mac +ve mac +ve mac +ve nps nps nps nps nps nps ns ns ns ns ns ns ns ns
:temperature :no parasites seen :piroplasms seen (less than 0.1% parasitaemia) :right prescapular gland :left prescapular gland :macroschizont positive :not sampled
69
Blood smear nps nps nps nps nps nps nps nps nps nps nps nps nps nps +<0.1% +<0.1 o/o +<0.1 o/o +ve0.1% +ve0.3% +ve0.6o/o +ve0.3% +ve0.4% +ve0.2% +ve0.2% +ve0.2o/o + 0.1 o/o +<0.1% +<0.1% +<0.1 o/o +<0.1% +<0.1%

Tab
le 3
.7:
Sum
mar
y o
f rea
ctio
ns o
f cal
ves
in t
he f
irst
50
days
to p
rim
ary
infe
ctio
n w
ith
The
iler
ia p
aras
ites
GR
OU
P
INF
EC
TIO
N
CA
LF
D
AY
S I
O a
ud U
UR
AII
ON
T.
pa
rva
IFA
T
T. p
arva
B
upar
vaqu
one
Die
d/S
urvi
ved
NO
. T
emp
Mac
s P
irop
lasm
s re
cipr
ocal
tit
re
reac
tio
Tre
atm
ent
>39
.5°C
D
ayO
D
ay 4
0 p.
i. n
I T
.par
va B
olen
i W
70
12(3
) 8(
8)
14(3
5)
160
640
M o
R
nil
Sur
vive
d W
73
-9(
7)
14(3
3)
80
1280
M
oR
ni
l S
urvi
ved
W74
8(
5)
8(10
) 13
(23)
80
25
60
M o
R
nil
Sur
vive
d W
75
7(2)
7(
1 0)
13
(22)
16
0 12
80
M o
R
nil
Sur
vive
d 11
T
.par
va A
ver
y 14
54
9(8)
) 10
(7
nps
160
5120
S
R
Day
15
Sur
vive
d 14
42
-np
s np
s 16
0 32
0 N
R
nil
Sur
vive
d m
T
.par
va
Bal
ly
1447
13
(3)
10(8
) 17
(8)
160
2560
M
oR
ni
l S
urvi
ved
Vau
ghan
14
59
-np
s np
s 16
0 12
80
NR
S
urvi
ved
IV(a
&b)
A
yrsh
ire
tick
s 14
56
12(3
) 9(
14)
16(1
1)
160
640
M o
R
nil
Sur
vive
d C
hike
ya ti
cks
1437
11
(8)
11 (1
2)
17(1
1)
80
1280
M
oR
ni
l S
urvi
ved
V a
Hun
yani
1s
t 13
72
-11
(13)
19
(6)
160
1280
S
R
Day
14
Sur
vive
d ex
posu
re
1376
nd
10
(4)
died
80
di
ed
SR
D
ay 1
4 D
ied
day
14 p
.i
1451
nd
12
(2)
· di
ed
160
died
S
R
Day
14
Die
d da
y 14
p.i.
14
58
nd
10(2
) di
ed
160
died
S
R
Day
14
Die
d da
y 14
p.i.
V
b
Hun
yani
2n
d E
l 9(
5)
9(12
) 17
(5)
80
1280
S
R
Day
14
Sur
vive
d ex
posu
re
E2
9((5
) 10
(4)
160
died
S
R
Day
14
Die
d da
y 14
p.i.
E
3 9(
5)
8(6)
80
di
ed
SR
D
ay 1
4 D
ied
day
14 p
.i.
E4
10(5
) 10
(8)
14(1
3)
160
1280
S
R
Day
14
Su
rviv
ed.
I
E5
9(5)
14
(7)
21(7
) 80
64
0 S
R
Day
14
Sur
vive
d I
--
Key
: M
oR
:Mod
erat
e re
acti
on
NR
:n
o re
acti
on
SR
:s
ever
e re
acti
on
mac
s :m
acro
schi
zont
s nd
:n
ot d
one
p.i.
:pos
t in
fect
ion
Tem
p. R
ecta
l te
mpe
ratu
re
( )
:fig
ures
ref~r to
num
ber
of d
ays
posi
tive
for
mac
rosc
hizo
nts
or p
irop
lasm
s, o
r ha
d fe
bril
e re
acti
on
70

Tab
le 3
.8:
Sum
mar
y o
f cat
tle
reac
tion
s to
T. p
arva
A v
ery
chal
leng
e
GR
OU
P
I n m
IV(a
&b)
V a
Vb
Con
trol
Key
: S
R
NR
()
INF
EC
TIO
N
CA
LF
NO
. D
ays
post
D
AY
S IO
and
DU
RA
TIO
N(
) T.
pa
rva
IF A
T
prim
ary
Tem
p. >
39.5
°C M
acs
Pir
opla
sms
reci
p ti
tre
infe
ctio
n D
ayO
&
40 p
.c.
T. p
arva
Bol
er,i
W70
52
2 -
nps
21(5
) 32
0 64
0 W
73
522
-np
s 24
(2)
640
1280
W
74 &
75
Die
d T.
par
va A
ver
y 14
54
522
-np
s 23
(1)
640
1280
14
42
522
12(1
) np
s np
s 64
0 12
80
T.
parv
a B
ally
14
47
522
-np
s np
s 12
80
1280
V
augh
an
1459
52
2 -
nps
21(1
) 64
0 64
0 A
yrsh
ire
tick
s 14
56
564
-np
s 23
(4)
640
1280
14
37
Die
d H
unya
ni
1st
1372
56
6 -
nps
21(7
) 12
80
640
expo
sure
13
76
Die
d 14
51
Die
d 14
58
Die
d H
unya
ni
2nd
El
182
-np
s 21
(4)
640
640
expo
sure
E
4 18
2 -
14(4
) 21
(7)
320
1280
E
5 18
2 -
16(3
) 21
(7)
640
2560
E
2&
3
Die
d 48
53
13(1
0)
I 0(1
5)
25(4
) 80
25
60
4855
7(
11)
7(22
) 15
(14)
t 32
0 di
ed
--
:sev
ere
reac
tion
np
s :n
o pa
rasi
tes
seen
m
acs
:mac
rosc
hizo
nts
:no
reac
tion
p.
c.
:pos
t cha
llen
ge
Tem
p.
:rec
tal t
empe
ratu
re
:fig
ures
ref
er to
num
ber
of d
ays
posi
tive
for
mac
rosc
hizo
nts
or p
irop
lasm
s, o
r ha
d fe
bril
e re
acti
on.
71
T. p
arva
rea
ctio
n
NR
N
R
NR
N
R
NR
N
R
NR
NR
NR
N
R
NR
I
SR
I S
R

Table 3.9 Results of Hunyani Theileria schizont lymphocyte culture isolates (El, E2, E3, and E4) with anti-schizont monoclonal antibodies. Two control cell lines included.
Theileria
Q~lllin~ El E2 E3 E1 BQl~ni Mu~~a MAb Dilution 1 1:50 + +
1;2QQ + +
2 1:50 +
1;2QQ +
3 1:50 +
1;2QQ +
4 1:50 + +
1;2QQ + +
7 1:50 +
1;2QQ +
10 1:50 (+) (+) (+) (+) + +
1:2QQ (+) + +
12 1:50 + + + + + +
1;2QQ + + + + + +
20 1:50 + +
1;2QQ + +
21 1:50 + +
1:2QQ + +
22 1:50 ?(+)w?(+) +
1:2QQ +
23 I :50 + + + +
1;2QQ + + + +
MAb :monoclonal antibody MAb23 : T. taurotragi specific + :positive (>90% fluorescence) :no fluorescence (+)w :weak fluorescence (+) :50% fluorescence
72

3.9 Discussion
The Theileria vaccine (Bolvac®) was found to produce a severe Theileria reaction in
the experiments at the CTVM and a high piroplasm parasitaemia of 0.6% on day 19
post infection was observed although the calf recovered without treatment. However,
a moderate reaction was demonstrated in Group I calves at VRL-Harare. Although
clinical reactions in the groups of calves showed that the Boleni is an ideal parasite
stock for immunisation purposes, it has to be administered with caution especially in
dairy herds as calf 805 infected at the CTVM Edinburgh had a severe reaction to the
T. parva Boleni infection. However, the original T. parva Boleni stock, when
isolated was pathogenic until the early 1980's when the stock became less virulent
(Koch, 1990. The present T. parva Boleni GU79-1.3 (Bolvac®) stabilate derived
from the original T. parva (Boleni GU79) causes less severe reactions than the
original stabilate as observed in the Theileriosis immunisation programme (FAO,
report).
Although calf 1442 did not have a Theileria clinical reaction it was infected
as it had a piroplasm seen in the Giemsa ~tained blood smears post infection. The
other calf required treatment as it underwent severe reaction.
Group IV calves (1456 and 1437) which had infected ticks from Ayrshire and
Chikeya farms applied to them both had moderate reactions to Theileria infection
and survived without treatment. This is a definite indication of the presence of
Theileria parasites in the field as previously discussed the two properties have had
Theileriosis outbreaks before (Table 3.3) and they were immunisations with Bolvac®
vaccine.
73

A pathogenic Theileria was isolated from the calves exposed at Hunyani estates
which was shown to be T. taurotragi on the basis of monoclonal antibody results.
The observation that two of the cell culture isolate (E 1 and E2) antigens partially
reacted with the MAb 22 indicates that these isolates may contain mixed parasite
populations which differ in their expression of specific schizont antigens. This was
also confirmed by the severe theileriosis clinical reactions the calves underwent, as
T. taurotragi has been reported to cause mild infections (Koch, 1990; Norval et al.,
1992). he reaction to MAbs 10 and 12 are similar to results obtained with isolates
from Chipinge and Lawfield in Zimbabwe (Koch et al., 1988) and both isolates were
considered to be non-pathogenic T. taurotragi, based on serological and cross
immunity tests (Lawrence and Mackenzie, 1980; Uilenberg et al., 1982). Also the
results were similar to T. taurotragi isolates from Kenya (Minru.ni et al., 1983). The
only difference was in the severe clinical reactions in the two groups of susceptible
Friesian calves exposed at Hunyani Estates. The results emphasise the value of MAb
testing as a means of differentiating T. taurotragi from non-pathogenic stocks ofT.
parva and in situations where there are wil~ ungulates which can be alternative hosts
for the vector tick. Hunyani Estates is surrounded by the Chivero National Park and
the presence of wild ungulates which could provide alternative hosts for the ticks was
inevitable. The calves which survived were immune to T. parva A very challenge and
yet the monoclonal antibody profile test was positive for the T. taurotragi specific
MAb 23. After recovery piroplasms persisted for a long period intermittently and
were detectable by direct microscopic examination thus indicating the presence of
infection in the animals, although piroplasm parasitaemias of less than 0.1% were
74

recorded frequently post recovery.. Further characterisation studies are required on
the Hunyani isolate.
The calves in groups I, 11, Ill and IV had an average live-weight of 380 kilograms.
The Hunyani exposed calves were undersized up to the end of the experiment and
were disposed of with average live-weights of 150 kilograms
No clinical reactions were noticed on challenge of the experimental animals
except for the control group. One of the control group animals did not react to the
infection with T. parva Avery (4855) but was infected at a later date and showed a
severe reaction.
Piroplasms were seen on day 291 post infection in the blood smears of the
calf which had a severe Theileria reaction (1454) and was treated with
buparvaquone. The levels of parasitosis in individual cattle receiving a particular
dose of stabilate and even in those receiving a particular number of infected ticks has
been demonstrated to be variable (Norval et al., 1992). This variability has been
attributed to the different tick infection prevalences and even with Theileria
infections induced by tick feeding sporoz<;>ites are injected over a period of time,
resulting in a low grade inoculation over several days (Purnell et al., 1974; Young,
1977), resulting in severe clinical reactions.
In this chapter calves were successfully infected with Theileria parasites to
provide material to be used in the subsequent chapters in the determination of
infection indirectly by PCR, tick infections and serology. The success of the
infections was also demonstrated by the immunity to T. parva A very challenge and
each method of infection resulted in immunity.
75
CHAPTER FOUR
Detection of T. parva in carrier I recovered animals using PCR amplification
4.1 Introduction
The main aim of this study was to develop an alternative diagnostic technique
for the detection of carrier state of T. parva infection since the conventional methods
of parasite detection have limitations in their levels of sensitivity and specificity.
The classical definition of a carrier of Theileria is the ability of an infected and
recovered animal to serve as a reservoir of infection for vector ticks which are then
able to transmit the parasite to a susceptible host (Levine, 1973; Young et al., 1986).
This chapter describes the application of the PCR in the detection of infection or
Theileria parasites either as macroschizonts or piroplasms in the experimental
animals described in Chapter 3.
The ability of a diagnostic tool to be highly sensitive and specific in
epidemiological studies is important as this will enable workers in disease control
programmes to defme prevalences of the carrier state in different cattle populations.
In many Theileria infected animals, infection persists after recovery and is
maintained by two stages of the parasite's life cycle: piroplasm, and macroschizont
(Norval et al., 1992). The epidemiology of theileriosis in Zimbabwe is complicated
by the existence of non-pathogenic Theileria species in cattle, which may correspond
to T. taurotragi from eland, and can be difficult to distinguish from T. parva
(Lawrence and Mackenzie, 1980; Koch, et al., 1988). Vaccination against
theileriosis has been initiated using the Boleni strain and this might further
76

complicate the epidemiology of the disease as foci of infection are created because
the strain is known to induce a carrier state (Koch, et al., 1992).
A method of demonstrating carrier state is tick application to animals and
transmission of infection to susceptible hosts (xeno-diagnosis), this is the definitive
method of proving the carrier state of an animal, but it is not practical on a large scale
is expensive, laborious and may not always detect actual carriers (Koch, 1990).
Currently carrier status is thought to be maintained by the persistence and slow
division of macroschizonts giving rise to piroplasms and the PCR offers a way of
parasite detection. The IF AT and other serological tests do not always detect carriers
whose infection can be confirmed by xenodiagnosis (Dolan, 1986a). Therefore,
improved methods for detection of long term T. parva-infected animals, capable of
transmitting disease to the tick vector then to susceptible cattle are required.
Preliminary investigations at the CTVM were done using the p67 primer sequence to
detect Theileria parasites in T. parva Boleni and T. parva Marikebuni infected
animals undergoing clinical reactions. At the VRL-Harare T. parva p104 primer
sequences were used on the samples from ~e animals undergoing clinical reactions
and post recovery after comparing with results obtained with the p67 primers. The
p 1 04 primer sequences were found to amplify a product from all T. parva stocks,
including Boleni and buffalo derived, but nothing was amplified from DNA from T.
mutans, taurotragi or annulata. The sensitivity of the PCR assay on T. parva DNA
was about 100-?00 parasites on ethidium-bromide agarose gel, and about 10 parasites
with probing (R. Skilton personal communications).
77
PCR is an in vitro method of nucleic acid synthesis by which a targeted
segment of DNA can be specifically replicated. It involves two oligonucleotide
primers that flank the DNA fragment to be amplified in repeated three-step cycles of
heat denaturation of the DNA, annealing of the primers to their complimentary
sequence, and extension of the annealed primers with DNA polymerase. These
primers hybridise to opposite strands of the target sequence and are orientated so that
DNA synthesis by the polymerase proceeds across the region between the primers.
Since the extension products of this reaction are also complementary to and capable
of binding the primers, successive cycles of amplification essentially double the
amount of target DNA synthesised in the previous cycle. The result is an exponential
accumulation of the specific target fragment, theoretically 2° , where n is the number
of amplification cycles performed. The isolation of a thermostable DNA polymerase
(Saiki et al., 1988) purified from the thermophilic bacterium, Thermus aquaticus
(Taq) which can survive incubation at temperatures required for DNA strand
separation (up to 98° C) enabled automation of the process to occur.
Preliminary investigations at the ~TVM using the p67 T parva pnmer
sequence were aimed at trying to achieve a high level of sensitivity of the PCR assay.
The high sensitivity of the PCR is due to the exponential amplification of target
DNA, and is so sensitive that a single DNA molecule has been amplified successfully
(Innis and Gelfand, 1990). Factors such as enzyme, dNTP, primer, magnesium
concentrations affect the PCR product yield since the process is cyclic (Xu and
Larzul, 1991 ). Many other factors like number of cycles, annealing and denaturation
temperatures also affect the efficiency of the PCR. Although theoretically it is
78
possible to detect one gene copy, this cannot be achieved in diagnostic applications.
After optimisation of the PCR, the sensitivity of detection must be determined, and
optimal methods should be developed for the treatment of samples to release target
DNA, while minimising inhibition by other components. A lack of sensitivity in the
detection of T parva was observed in tick stabilates cryopreserved in glycerol when
tested after phenol I chloroform extraction.
The discovery of the sequence from the central region of the small subunit ribosomal
RNA (srRNA) has provided specific primers for PCR amplification of DNA from
different Theileria species (Allsopp et al., 1993). T parva (Boleni) and buffalo
derived T. parva have been detected in naturally recovered animals by PCR (Bishop
et al., 1992). Molecular characterisation of 40 Theileria isolates from Zimbabwe has
shown that there was no support for the subspecific recognition of T parva using the
repetitive DNA probe, pBOLREP1 hybridised to Southern blots of EcoR !-digested
DNA, as there were similarities in T parva parasites isolated from cattle on seven
farms. The Tpr restiction fragment pattern of 5 T r ~rva isolates from East Africa
were not similar to the predominant Tpr genotype of the isolates from Zimbabwe
(Bishop et al., 1994). A high degree of sensitivity was demonstrated by the detection
of 1 piroplasm in 1 J.!l of blood thereby offering an alternative approach to the
detection of carrier animals (Bishop et al., 1992).
In an attempt to create a more universally conserved pair of primers for
amplification of DNA from Tparva stocks , 20-mer synthetic oligonucleotides were
designed to amplify a 233 b.p. fragment of DNA encoding amino acid residues 274-
340 of a Tparva Muguga sporozoite surface antigen, p67 (Nene et al., 1992). This
79

gene is thought to be conserved among T parva stocks on the basis of the absence of
observed restriction fragment length polymorphism (Bishop et al., 1991 ).
The 104 kDalton protein, which is localised in the microneme I rhoptry
complexes of the sporozoite stage of T parva, has been found to be very antigenic
[Nucleotide sequence data reported in this study has been submitted to the Gen
Bank™ Data Bank with the accession number M29954] (lams et al, 1990). Also
lams et a/, ( 1990), have shown that immunological activity to epitopes of the 1 04
kDa antigen occur in animals immunised by the infection and treatment method.
At the CTVM the PCR products from the p67 T. parva sequences were visualised by
polyacrylamide gel electrophoresis (PAGE) and silver staining. Samples from the
Theileria infected I recovered calves were tested on PCR assay using p 167 and p 1 04
primers and the presence of amplified DNA was detected directly on ethidium
stained agarose gels or by hybridisation to a labelled probe. The results were
compared with conventional methods of parasite detection.
4.2 Materials and Methods
Formulation of solutions and buffers used in this chapter are detailed in Appendix 1.
Sterile distilled water was used in the preparation of all solutions used in
experiments, glassware used was sterilised and all plasticware was previously unused
and sterile. Details of parasites used to infect the animals are shown in Tables in
chapter 3.
4.2.1 PCR organisation and precautions
The prevention of contamination with amplified DNA sequences is paramount to the
successful application of PCR in any establishment.
80

Successful amplification via PCR yields at least 1 pico-mole of a desired
product or about 6x 10⁹
molecules per microlitre. Thus cross contamination becomes
evident when amplification occurs in negative controls that do not receive template
and should be suspected when more than one band is obtained after electrophoresis
of PCR products and staining. Contamination usually occurs with amplified
sequences via aerosols generated during sample processing as in mixing by vortex
action, opening of micro-centrifuge tubes, pipetting, ejecting pil?ette tips from
micropipettors and centrifuging under vacuum. Since transport by air-borne products
is common the following precautions were taken:
(a) Different procedures were allocated different rooms up to and including the
set up of amplification reactions both at the CTVM and Harare-VRL. Enhanced
containment was also provided by a biosafety cabinet (ESB™ , JBio, Techgen
International Ltd), designated for PCR use only in Laboratory 105 (CTVM) in which
no theileriosis work was being carried out. The preparation of master mixes was
done after UV sterilisation of the cabinet.
(b) A separate room was allocated ~or the detection of PCR products, ie.
electrophoresis of PCR products, and dot blotting. Gloves were worn at all stages,
with changes of gloves between laboratories.
(c) A set of pipettes were set aside exclusively for each defined procedure to
avoid any cross contamination; a set of pipettes for the following, buffers,
deoxynucleotide, primers and enzyme. The setting up of master mixes prior to
adding to the samples in PCR reaction tubes, reduced the number of pipetting
procedures hence reducing the risk of contamination of stock solutions.
81
(d) At the VRL, Harare, separate rooms were allocated for the processing of
samples and preparation of solutions. The main Theileriosis laboratory was not used
and most of the work was performed in the Heartwater Immunology laboratory
where Theileria culture and routine diagnostic work is not performed.
(e) The rooms for the special procedures were only accessible by authorised
personnel to avoid people bringing in materials used for related purposes in the
laboratory.
(g) All pipette tips and microcentrifuge tubes were autoclaved prior to use and
discarded subsequent to use.
4.2.2 Sample preparation
4.2.2.1 EDTA blood saponin lysis extraction.
The EDT A blood samples were prepared as follows: Two hundred micro litres of
jugular EDTA blood was mixed with 800J.Ll of saponin lysis buffer (0.22% sodium
chloride, 0.015% saponin (Sigma), 1.0 mM EDTA) and spun at 13000 xg for 60
seconds. The pellet was resuspended in 1 OOOJ.Ll of fresh saponin lysis buffer and
spun at 13000rpm. The pellet was was~ed twice more in 1 OOOJ.Ll saponin lysis
buffer, the supematant being removed after each wash.
The fmal pellet was resuspended in 100J.Ll TE (10 mM Tris-HCL, 1.0 mM
EDTA pH 8.0) and Proteinase K (Boehringer Mannheim) was added to 2.5J.Lg per ml
and the sample was incubated 56°C for 1 hour or overnight at 37°C. The samples
were then boiled in a water bath for 5 minutes and stored at -20°C or at 4 °C.
82

4.2.2.2 Peripheral blood mononuclear cells (PBM)
Using aseptic techniques, 8 ml of jugular EDTA blood was mixed with an equal
volume of sterile phosphate buffered saline (PBS) pH 7.2. The blood was then
layered carefully onto two aliquots of 6 ml Ficoll paque (Pharmacia) and centrifuged
at 400 xg for 40 minutes at room temperature. After centrifugation the upper plasma
layer was discarded and the lymphocyte layer harvested from the interface into 1 0
mls sterile PBS (pH 7 .2). The mononuclear cells were washed twice in PBS at 2000
xg at room temperature. The final PBM pellet was resuspended in 500 J.d TE pH 8.0
and stored at -20°C until DNA extraction.
4.2.2.3 DNA extraction from PBM
SDS and Proteinase K were added to the PBM in 500J.!l of TE pH 8 to a final
concentration of 1% and 2.5 Jlg/ml respectively. The PBM were incubated at 56°C
for one hour or overnight at 3 7°C. The samples were then boiled for 10 minutes to
denature the Proteinase K. An equal volume of equilibrated phenol was added,
mixed by inverting several times and separated by centrifugation for 5 minutes at
13000 x g at room temperature. The aqueous layer was transferred into a fresh
eppendorf tube and an equal volume of phenol:chloroform (1: 1) was added to the
aqueous suspension, mixed and centrifuged as above. The aqueous layer was again
transferred into a fresh eppendorf tube and an equal volume of chloroform (BDH)
added and mixed before centrifuging at 13000 x g for 5 minutes.
Following centrifugation the aqueous layer was carefully removed and
retained and sodium chloride was added to a final concentration of O.lM. Twice the
sample volume of ice cold absolute alcohol was added and the sample was chilled at
83

-20°C overnight or -80°C for an hour. The sample was then centrifuged at 13000 x g
for 5 minutes and the resulting pellet washed twice in 70% ethanol. Excess ethanol
was pi petted off and the pellet dried. The pellet was finally dissolved in 50J.!l of TE
(pH 8.0) and stored at -20°C until used. In a few circumstances some sample volume
was increased to 1 OOJ.!l if the sample was found to be too viscous to use and the
volume to the PCR reaction was increased proportionally.
4.2.2.4 DNA extraction from T. parva Muguga piroplasms
DNA was extracted from T parva Muguga piroplasms for use in developing of the
PCR assay and as positive control material. The piroplasms were supplied by Dr. S.
Williamson at the Centre for Tropical Veterinary Medicine, University of Edinburgh.
The purified piroplasm pellet was thawed and made up to 3 ml with TE. SDS was
added to 1% and the pellet was gently homogenised and made up to 15 ml with TE.
Proteinase K was added to a final concentration of 100 J.Lg/ml and the piroplasms
were mixed for one hour at room temperature. After incubation for one hour at
56°C, the DNA was extracted with an equal volume of equilibrated phenol followed
by centrifugation at 3000 xg for 20 mi~utes (Beckman-CPKR centrifuge). The
aqueous layer was collected and mixed with an equal volume of equilibrated phenol
for 20 minutes and centrifuged as above. After centrifugation the aqueous layer was
collected and mixed for 20 minutes with an equal volume of phenol/chloroform (2: 1)
followed by centrifugation at 3000 xg for twenty minutes. The aqueous layer was
again removed and mixed for 5 minutes with an equal volume of chloroform and
centrifuged at 2000xg for 10 minutes at 15°C. The final aqueous layer was removed
and sodium chloride added to a final concentration of 0.1M. The DNA was then
84

precipitated by the addition of twice the volume of ice-cold absolute ethanol and was
placed at -20°C for one hour followed by centrifugation at 3500 xg for 30 minutes.
The pellet was washed twice in 70% ethanol and dissolved in approximately 50 Jll
TE. The RNA was removed by incubation in 20Jlg/ml RNAse for 30 minutes at
3 7°C and the DNA was re-extracted using ethanol and precipitated as above and the
concentration was estimated using a DNA fluorimeter (TKO).
4.2.2.5 DNA extraction from T. parva macroschizont cells
DNA was extracted from cultured lymphoblastoid cell lines infected with schizonts
ofT. parva Marikebuni, T. annulata and T. parva Boleni. Approximately 10 x 107
cultured cells of each parasite stock were washed three times in PBS pH 7 .2,
centrifuging at 2500 rpm for 10 minutes each time. The final pellets were
resuspended in TE pH 8 at a concentration of 0.5 x 10 7 cells per ml. The cells were
digested in TE buffer containing 1 o/o SDS; and 100Jlg/ml proteinase K, by mixing at
room temperature for 20 minutes then incubation at 56°C for one hour. This was
followed by phenol I chloroform extraction and ethanol precipitation of DNA as
described by Ausubel, et al., (1987) for t~?-e preparation of piroplasm DNA (section
4.2.2 3)
4.3 Polymerase chain reaction conditions for p67 T. parva primer sequence
The method of Bishop et al (1992) was used to amplify the gene coding for the p67
primer sequence. The primers were procured from the Oswel DNA service of the
University of Edinburgh.
To fully optimise the system, titrations were carried out using varying
concentrations of MgC12, dNTPs and primers. The optimal conditions for the
85

amplification of template Theileria DNA were also determined by increasing the
number of cycles in the PCR assay to 40. Serial dilutions of blood with a 21%
piroplasm parasitaemia from a calf infected with T. parva Muguga were processed by
saponin lysis and tested by PCR in the presence of 2.5mM, 5.0 mM and 1 OmM
MgC12 and either 30 or 40 cycles consisting of 1 minute at 94°C, 1 minute at 60°C
and 45 seconds at 72°C. (Figure 4. 7).
After the 5 J.Ll volume of samples to be tested had been denatured in boiling
water for 5 minutes and chilled on ice, the master mix was added, then sterile mineral
oil (Sigma) was overlayed. The final concentrations used were the ones
recommended by Bishop et al. (1992) and were as follows: The 50J.Ll reactions
contained 50 mM KCL; 10 mM Tris-HCL pH 8.3; 1.5 mM MgC12; 0.1% (w/v)
gelatin; 200J.LM each deoxyribonucleotide triphosphate (dNTPs); 2.5 units of
Thermus aquaticus (Taq) polymerase (Boehringer Mannheim); 1J.LM each
oligonucleotide primer; 5 ng schizont containing DNA or 1 ng purified piroplasm
DNA. The reaction mixtures were subjected to 30 cycles on a Perkin Elmer or
Hybaid thermocycler consisting of: dena~ation, 94°C for 60 seconds; annealing,
60°C for 60 seconds; and extension, at 72°C for 45 seconds. Control reactions were
set up which contained positive, bovine 1 ng bovine DNA (Sigma) and sterile water
(blank) samples for each reaction process with the samples. The fragment produced
at the end of the amplification process in positive samples was approximately 234 bp
long and was not detected in DNA extracts of other haemoprotozoa, Babesia bovis,
Anaplasma marginale, Theileria taurotragi, Theileria annulata, Theileria sergenti,
Trypanosoma congolense, Theileria mutans, and Theileria buffeli.
86

Figure 4.1 p67 T. parva primer sequence
(F054) IL144 5' TCA GGC GCA GCA TCA ACA GGT 3'
(F055) IL145 5' GTT CTT TCC CCT TCA TAT GCC C 3'
Oligonucleotide primers IL144 and IL145 were designed to amplify a 233 bp
fragment coding for amino acid residues 274-340 of a T. parva sporozoite surface
antigen p67 (Bishop et al., 1992).
4.3.1 Optimisation of PCR conditions using p67 primers
The optimal conditions for the amplification of template Theileria DNA was
determined using varying concentrations of MgC12, primer, and dNTPs and cycling
parameters of the PCR reaction. In a series of experiments dilutions of T. parva
Muguga piroplasm infected blood were processed by the saponin lysis method and
were used to test effect upon the PCR performance variation of:
(a) dNTP concentration (Figure 4.8)
(b) magnesium chloride concentration (Figure 4.9)
(c) primer concentration (Figure 4.1 0)
(d) number of cycles (Figure 4.7) .
Serial dilutions ofT. parva Muguga piroplasms DNA and saponin lysis extractions
were tested by PCR in order to determine the level of sensitivity.
4.4 Polymerase chain reaction conditions for p104 T. parva primer sequence
Dr. R. Skilton at ILRI (Nairobi) kindly supplied the p 104 primer sequences and the
protocol for PCR amplification. The fragment produced was approximately 497 b. p.
long and was not obtained in PCR with T. taurotragi, T. mutans, B. bigemina, and B.
bovis DNA phenol I chloroform extracts. Primers were supplied freeze dried and
87

were resuspended in sterile distilled water and aliquoted in 1 OOng/J.Ll stocks. The
primer sequences are as shown in Figure 4.2
Figure 4.2 p 1 04 T parva primer sequence
4875 5' ATT TAA GGA ACC TGA CGT GAC TGC 3'
4876 5' TAA GAT GCC GAC TAT TAA TGA CAC C 3'
The polymerase chain reaction was carried out in 50J.!l reactions and the final
concentrations were: 50mM KCl, 10mM Tris-HCL; 1.5 mM Magnesium chloride;
200J.!M each deoxy-ribonucleotide triphosphate (dNTP's); 2ng/J.Ll each
oligonucleotide primer; 1.25 units of Taq DNA polymerase; 5J.!l of processed
material (saponin lysed blood or phenol chloroformed PBL). The master mix was
prepared in a clean room and then moved to another ·where the samples were ready to
be added to the master mix. An aliquot of processed sample was denatured in a
0.5ml PCR reaction tube by boiling for 5 minutes and then chilled on ice. The
samples were then centrifuged briefly at 7000 xg on a microcentrifuge and the 45J.Ll
of master mix was added. The reaction tubes were overlaid with 60J.!l of fine mineral
oil (Sigma) and were put on ice as they we~e ready to go on the thermocycler. The
reaction mixtures were subjected to 94 oc for 60 seconds and 40 cycles of :
denaturation at 94 oc for 60 seconds ; annealing at 60°C for 60 seconds; and
extension at 72°C for 60 seconds; and finally held at 4°C.
4.4.1 Sensitivity of PCR assay using p104 primers
Dot blot hybridisation was performed to confirm the identity of the predicted PCR
product of the 497 bp as being amplified from the target DNA and compared with
p67 results (Results not shown). Ten-fold dilutions ofT parva Muguga piroplasm
88

DNA were run in the PCR assay and 10 micro litres of each was dot-blotted and
probed with the 32
P labelled probe. For each PCR assay an ethidium bromide
agarose gel was run with the positive control, negative control (bovine DNA), and
size markers to confirm the size of the band.
4.5 Detection of PCR products .
4.5.1 Polyacrylamide gel electrophoresis
Nucleic acids can be separated by molecular weight ustng electrophoresis on
acrylamide agarose gels. Silver stained acrylamide gels have the advantage of better
resolution for smaller DNA or RNA molecules (!0 to 500 bp), and are especially
useful in DNA sequencing (Maizels et al., 1991). Polyacrylamide gel elecrophoresis
(PAGE) of T. parva p67 PCR products was used to visualise the product, based on
the method of Sambrook et al., (1989). Acrylamide stock (40% acrylamide/bis)
diluted in loening buffer (Appendix 1) was used to make 7.5% acrylamide.
Polymerisation was catalysed by 0.1% (v/v) N,N,N,N,-tetramethylenediamine
(TEMED) (Sigma), and 0.1% (w/v) ammonium persulphate (APS) (Biorad) and the
gels were poured after their addition. A c<;>mb was then placed into the acrylamide
gel to create wells as the solution polymerised. Gels were cast using the "Mini
Protean™" gel system (Biorad) and run at 150volts constant setting. Ten microlitres
of PCR product was added to 5 J.tl 6x bromophenol blue (Appendix 1) loading buffer
in a microcentrifuge tube before loading onto the cast gel. One of the wells
contained the DNA size markers added in the 6x loading buffer.
89
4.5.1 (a) Silver staining of Polyacrylamide gels
DNA in polyacrylamide gels was stained after separation ustng the method of
Herring et al., (1982). Gentle agitation was applied at each step of the staining
procedure. The gel was fixed in fixative (10% ethanol, 0.5% glacial acetic acid) for
10 minutes, followed by staining in 0.21% of silver nitrate (Sigma) solution for 10
minutes. After washing twice in distilled water, the developer (3o/o (m/v) sodium
hydroxide, 0.75% (v/v) formaldehyde) was added until satisfactory colour
development had occurred. The reaction was stopped when the bands were clearly
visible by removing the solution and adding 0.75o/o di-sodium carbonate in distilled
water. eo-electrophoresis of a pUC19-Sau3A DNA size markers (Sigma) or <DX174
Hae Ill digest (Sigma) permitted the estimation of the band size and this was
confirmed by plotting the log10 base pair length against the distance travelled through
the gel in relation to the DNA marker bands (pUC19Sau3A). Gels were then
photographed using a Polaroid MP4 land camera and were dried on a gel drier
(Model 583 gel drier -Biorad).
4.5.2 Agarose gel electrophoresis of DN~
Standard electrophoresis on agarose gels can be used to separate nucleic acids from
100 bp to 50,000 bp (50 kb), and horizontal or flatbed electrophoresis is the mthod of
choice because it is easy to set up for routine use. One other advantage is that a
number of buffers can be used for DNA electrophoreis. Ethidium bromide-stained
agarose gels were run to detect PCR products for the positive and negative controls
of T. parva p 1 04 primer sequences to check if the assay had worked. The molecular
grade agarose (Sigma), 1.6%(w/v) was dissolved in Tris -acetate EDTA buffer (T AE)
90
pH 8.0. The agarose was boiled in microwave oven and ethidium bromide was
added to the molten agarose to a final concentration of 200 ng/ml and poured onto
the "sub-cell" to set. DNA loading buffer [0.25% (w/v) bromophenol blue, 0.15%
(w/v) Ficoll 400] was added at a ratio of 1 :6 to the PCR product samples prior to
loading, and electrophoresis was carried out at 5 volts per centimetre in 0.5X TAE
buffer until the required resolution was achieved. eo-electrophoresis of a of pUC 19-
Sau3A (Sigma) or <I>X174 Hae Ill digest (Sigma) DNA size markers permitted the
estimation of the band size.
4.5.3 Preparation of T. parva Muguga probe
PCR amplification product using p104 primers ofT. parva Muguga piroplasm DNA
was used as a probe. Following preparative gel electrophoresis using low gelling I
melting temperature agarose (Sigma) the gel slice containing the band
(approximately 497 b.p.) was cut from the gel being visualised under UV light. This
agarose slice was then melted at 56°C for one hour and subjected to phenol
extraction (Ausubel~ et al., 1987), dissolved in TE and stored at -20°C. In order to
estimate the amount of DNA in the sample a 10 J.!l aliquot was electrophoresed on
ethidium bromide agarose gel and the fluorescence was compared with similar sized
fragments of known concentration using 0X174 DNA size markers (Sigma).
Because of the hazards associated with radioactivity the materials were
handled carefully behind a protective shield, gloves and protective glasses were
worn. Labelling of the probe was achieved using a random primed extension
reaction in a 20J.!l volume with 1 OOng of T. parva PCR product DNA (Heartwater
project-Harare protocol for DNA probes). After denaturation at 95°C for 10 minutes
91

the following reaction was set up :1J..Ll of each dNTP (ATP, GTP and TTP)
(Boehringer Mannheim); 2J..Ll of reaction mix ; 5J.1l 32P-dCTP (=50J..LCi Amersham
International), 1 J..Ll Klenow (Boehringer Mannheim labeling kit).
The mixture was incubated at 37°C for 30 minutes, and the reaction
terminated by the addition of EDTA to a concentration of 0.04 Molar in 100 J.!l of TE
(pH 8.0). One microlitre was taken to measure the amount of incorporated
radioactive 32P on an Ls 8500 counter. The remainder was purified on a Colurnn
sephadex G-50 (Boehringer Mannheim). In order to keep the probe denatured 20J..Ll
of 20mg/ml Herring sperm DNA was added to the purified probe.
4.5.3.1 Blot P·reparation
Forty microlitres of polymerase chain reaction product for each sample tested was
made up to a 1 OOJ.!l with TE pH 8.0 and sodium hydroxide to a final concentration of
0.4 Molar and incubated at 3 7°C for 30 minutes. The samples were put on ice
immediately after incubation. Nylon membranes were soaked in 2xSSC for 15
minutes prior to being assembled in a Dot Blot apparatus (I-Iybri.Dot Manifold
Gibco). The samples to be tested, including controls, were applied to the individual
wells ( 1 00 J..Ll per well) in the dot blot apparatus and were left to sit for 10 minutes
before a gentle vacuum suction was applied to the apparatus to pull the samples
through. The apparatus was then dismantled and the membrane was briefly rinsed
with 2xSSC then exposed to UV light (UV Transilluminator) for two minutes to fix
the DNA allowed to air dry. After drying the membrane was wrapped in plastic film
and stored at 4°C until prehybridization.
92
4.5.3.2 DNA labelling and hybridisation.
Because of the hazards associated with radioactivity, gloves were worn, protective
glasses and the work was done behind a protective shield.
Two membranes were placed in a large hybridisation bottle containing 50mls of
prehybridization (Appendix 1) solution and placed in a rolling Hybaid oven at 42°C.
These were allowed to prehybridise for at least six (6) hours. The 32 P labelled probe
(50 J.!l) was added to the prehybridisation solution to a concentration of 2 x 10⁷ cpm
ml -I and hybridisation was allowed to occur for at least sixteen (16) hours or
overnight at 42°C. After hybridisation the membranes were washed in a special
designated room as follows:
Wash#1
Wash#2
Wash#3
Wash#4
Wash#S
Wash#6
SOS).
15 minutes /room temperature in 2X SSC
15 minutes /room temperature in 2X SSC/0.1% SDS
15 minutes /room temperature in O.SX SSC/0.1 o/o SDS
15 minutes /room temperature in O.lX SSC/0.1 o/o SDS
60 minutes /60°C water bath in 0.1X SSC/1% SDS
Repeat wash #5 above (60 minutes /60°C water bath in O.lX SSC/1 o/o
After the washes the blots were briefly rinsed at room temperature in
0.1 xSSC, blotted with 3MM filter paper, wrapped in plastic film and exposed to X
ray film for two hours at room temperature. The auto-radiographs were
photographed using a Polaroid Mp4 land camera.
93
4.6 RESULTS
4.6.1 Specificity of p67 PCR assay
1.0 ng amounts of T. parva Muguga piroplasm and macroschizont DNA extracts
were positive in the p67 PCR assay. In contrast T. annulata macroschizont bovine
DNA, saponin lysed Babesia bovis (Lismore), B. bovis (Kwanyanga) B. bovis
(Mexico) piroplasms, and Anaplasma marginale (Zimbabwean isolate) did not
produce any positive bands. Results shown in Figure 4.3. A 155 bp fragment was
amplified from the three isolates indicating that amplifiable B. bovis DNA was
present (Fahrimal, et al., 1992). Results shown in Figure 4.3 b. When Theileria
buffeli, Trypanosoma congolense, Theileria mutans, T. taurotragi, T. sergenti, T.
annulata, and T. parva Muguga piroplasm DNA preparations were tested (1.0 ng
each), PCR positive bands were detected only with T. parva Muguga. (Figure 4.4).
T. parva Muguga piroplasms gave positive bands for the saponin lysed blood
samples when tested in the p67 PCR at a parasitaemia of 0.0000021%. (Figure 4.5).
The saponin lysed B. bovis samples were tested by PCR using the BV 60 primer
sequences known to be conserved in B. bovi~ isolates.
4.6.2 Optimisation results of PCR conditions using p67 primers
One tenth of a picogram and 1.0 pg of T. parva Muguga piroplasm and
macroschizont DNA was detected respectively in the phenol I chloroform extracts
(Figure 4.6) using the standard PCR protocol of 30 cycles.
Thirty cycles with 5.0 mM MgC12 gave better amplification than 30 cycles
with 2.5 mM or 10 mM MgC12, or 40 cycles with 5.0 mM MgC12. Amplification of
the desired band occurred at lower piroplasm parasitaemias with the former (Figures
94

4.7 and 4.9). While 30 cycles at 5.0 mM MgC12 amplified blood dilutions to a
detection limit of 0.0000021 o/o piroplasm parasitaemia, 40 cycles at the same MgC12
concentration amplified dilutions up to 0.00021% piroplasm parasitaemia
respectively (100 fold increase in sensitivity at lower cycling conditions) (Figure
4.9). The parasitaemic blood was diluted out in uninfected EDTA blood.
An increase in the dNTP and primer concentration produced extra DNA
bands in the PCR product (Figures 4.8 and 4.10). An increase in the MgC12
concentration lowered the sensitivity of the assay and produced weaker bands of the
desired product in lower dilutions of the saponin lysed extracts of infected EDT A
blood (Figure 4. 9).
4.6.3 PCR results for T. parva Marikebuni infected calf (818) using p67 primers.
The optimised PCR conditions using 30 cycles and 2.5 mM MgC12 were applied for
detection of T. parva Marikebuni (calf 818) from experimental infection. The PCR
products were detected by electrophoresis and silver staining.
In the T. parva Marikebuni infected (calf 818) PCR ~roduct of 234 base pairs was
detected days 10, 12 and 14 post infection i~ the phenol I chloroform extracted PBM
samples (Table 4.1 ). In the left prescapular gland biopsy material which had been
phenol I chloroform extracted, the PCR assay was positive on day 13, 18, 20 and 21
post infection. The calf had been infected by subcutaneous inoculation of stabilate in
its left shoulder area. For saponin lysed EDT A extracts positive products were
detected from day 15 to 23 post infection. Day 24 extract was not tested but the test
was positive on the sample from day 25 post infection. Results shown in Table 4.1.
95

4.6.4 PCR results for T. parva Boleni infected calf (805) using p67 primers
A higher proportion of positive results were obtained with the T parva Boleni
infected calf (805) as shown in Table 4.2. PCR positive products were detected in
the phenol I chloroform extract of the right prescapular gland biopsy material four
days post infection up to day 7 post infection. This calf was infected by
subcutaneous inoculation of the stabilate on its right shoulder area. In the phenol I
chloroform extracts of peripheral blood mononuclear cells the PCR assay was
positive on days 8 to 13, day 15, 18, 21, 22 and 23 post infection.. The right
prescapular lymph node biopsy material was negative on day 8, and positive from
day 9 to 22. Positive PCR product were also detected on day 24 post infection in the
right prescapular lymph node.
The left prescapular lymph node was positive on 13 occasions of the
sampling, from day 9 to 25 post infection except for day 12 post infection when it
was negative in the PCR assay. Saponin lysed extracts of EDT A blood were positive
from day 18 to 25, eight consecutive days post infection in the same PCR assay.
The PCR assay was positive on day 18 pqst infection, 4 days after the piroplasms
were seen in the Giemsa stained blood smear (Table 4.2).
4.6.5 Specificity of assay using p104 primers
Products of PCR assay using p104 primers tested with 1.0 ng extracts ofT. mutans,
T taurotragi, Trypanosoma congolense, T. buffeli, T. annulata and T. sergenti did
not produce bands (Figure 4.16), and did not hybridise with the p104 probe (Figure
4.1 7). Positive bands were detectable on the ethidium bromide 1.6% agarose gel for
the T. parva Muguga (piroplasms) and Boleni (macroschizont) DNA from their
96
respective PCR products. The p104 probe hybridised with T. parva Muguga and
Boleni PCR products on the dot blot (Figure 4.17).
4.6.6 Sensitivity of PCR assay using p104 primers
The assay was positive up a dilution of 0.1 ng of T. parva Muguga piroplasm DNA
on the probed dot blot (Figure 4.18).
4.6. 7 Results of tests on carrier recovered animals using dot blot hybridisation
Blood samples taken from the experimental calves on the days shown in the
sampling protocol (Table 3 .2) were processed and amplification ofT. parva DNA by
PCR attempted and probed with the p 104 probe. The hybridisation results are shown
in Appendix Ill for all experimental animals. The controls were analysed by
elctrophoresis on an ethidium bromide stained gel before dot hybridisation of the rest
of the samples. A summary of results comparing the PCR results with microscopic
examination of Giemsa stained blood smears, IF AT and tick infections for each calf
including the Hunyani Estates second exposure are shown in Tables in Appendix IV.
No PCR products were detected in blank (no template) srunples indicating that there
was no contamination with extraneous T. parva DNA.
4.6.7.1 T. parva Boleni infected calves p104 PCR results
Summary of PCR results is shown in Appendix IV.
The Kappa statistic is used without assuming that one test is the best, it is possible to
assess the agreement between different tests if a gold standard is not available. The
logic of using this approach is that agreement between tests is evidence of validity,
whereas disagreement suggests that the tests are untrustworthy (Thrusfield, 1995). In
this study the kappa statistic was used to observe proportions in agreement between
97
any two methods (test results) on samples taken on the same days post infection or
recovery. However, this comparison does not consider agreement that could arise
just by chance, so by calculating the kappa statistic which takes account of chance
agreement the expected proportion (EP) of agreement by chance was calculated.
A definition by Thrusfield (1995) of Kappa states that:
it is the excess agreement over that expected by chance, divided by the
potential excess; that is:
kappa = (OP - EP) I (1 - EP)
Kappa ranges from 1 (complete agreement) to 0 (zero) [agreement is equal to that
expected by chance], whereas negative values indicate agreement less than is
expected by chance. In this study we expected the results between any two methods
to be in agreement as the tests were performed post infection in carrier animals.
Arbitrary 'benchmarks' for evaluating observed kappa values are
>0.81: almost perfect agreement; 0.61-0.80: substantial agreement;
0.41-0.60: moderate agreement; 0.21-0.40: fair agreement;
0-0.20: slight agreement; and 0: poor agre~ment (Everitt, 1989).
Results for group I calves (W70, W73, W74 and W75): Using the Kappa statistic for
comparing two tests there was moderate agreement in the PCR results from the group
I calves in the PBM phenol chloroformed.extracts and saponin lysed EDTA blood
extracts (Kappa = 0.51), but there was no agreement in between the latter and the
results for the microscopic examination of the Giemsa-stained blood smears (Kappa
= -0.23).
98

Calf W70: The experimental calves infected with T parva Boleni (Bolvac®) were
positive by the pI 04 PCR assay from day 14 post infection in the PBM extract and
sometimes in the saponin lysed extract as detected by dot blot hybridisation.
Calf W70 was positive from day 14 up to the last day tested 493 days, post infection
in the PBM sample extracts. In the saponin lysed extracts it was positive from day
40 up to the last day tested ( 493) except for day 95 when it was negative. In the 15
PBM extracts tested, all were positive in the PCR assay and 12 out of 15 in the
EDT A extracts were positive. (Appendix IV-Table 1 ).
Calf W73: Calf W73 was positive on day 14, 40, 74, 95, 109 and day 493 post
infection in the PBM samples. In the saponin lysed EDT A blood the calf was
positive on day 14, 40, 109, and 179 up the last date tested (493) post infection. The
saponin lysed samples were negative on days 25, 74, 95 and 137 post infection Thus
6 out of a total of 15 PBM phenol chloroformed extracts, and 11 out of 15 EDT A
saponin lysed extracts were positive when sampled from calf W73 post infection.
(Appendix IV-Table 2)
Calf W74: Calf W74 was tested up to day. 305 before it died. Phenol I chloroform
PBM cells were positive on the p104 PCR assay day 14, 40, 74, 95 109 and 137 post
infection. The EDTA blood extracts were positive on day 25, 40, 74, 109, 137, 179,
218, 221, and 263 post infection. Thus 6 dates tested post infection in the extracted
PBM were positive out of 12 tested. Nine out of the 11 dates tested post infection
were positive in the PCR assay on the EDTA blood. (Appendix IV-Table 3).
Calf W75.: Calf W75 was positive in both the PBM and EDTA saponin lysed
extracts on day 14 post infection, but was negative in the respective samples on days
99

25 and 40. The PBM samples were again positive on days 74, 95, 109, and 137, and
the EDTA blood was positive on days 74, 95, 109,207,218,263,305, and 361. The
EDT A blood sample extracts for days 446 and 493 were negative on the PCR assay.
Thus a total of 5 samplings tested in the phenol I chloroform PBM extracts were
positive out of 13, and 9 out of 13 of the EDTA saponin lysed extracts were positive
when tested post infection with T. parva Boleni. (Appendix IV-Table 4)
4.6.7.2 T. parva A very infected calves p104 PCR results
Calf 1442; Calf 1442 was positive in the PBM and EDTA sample extracts on day
14 post exposure. The PBM samples were positive on six other dates when they
were tested, thus day 25, 74, 95, 109, 137, and 179 post infection. Saponin lysed
EDTA blood extracts were positive on days 95, 305 361 and 493 which was the last
date tested. Seven PBM samples out of the 15 dates sampled post infection were
positive in the PCR assay and 5 out of 15 in the saponin lysed extracts of EDT A
blood sampled post infection. Using the Kappa statistic for comparing two tests
there was no agreement between the results obtained from the PBM phenol I
chloroformed extracts and the EDTA blooq (kappa = -0.34), and even between the
latter and microscopic examination of Giemsa-stained blood smears (kappa = -0.80).
Results shown in Appendix IV-Table 5.
Calf 1454: Calf 1454 was positive in both the PBM and EDTA extracts on days 14,
15, and 25 post infection. The PBM extracts were again positive on days 40, 74,
109, 137, and 361 post infection but negative on days 95, 179, 207, 218, 263, 305
and 456 post infection. More positive results were observed in the saponin lysed
EDTA samples on days 74, 109, 137, 179, 218, 305, 361 and 493 which was the last
100

date to be tested. Eight positive results were obtained out of 17 dates which were
tested using the PBM samples which were phenol I chloroform extracted. Eleven
positives were seen out of the 15 samples tested post infection in the EDT A blood
samples. The p 104 PCR results showed fair agreement between the PBM phenol I
chloroformed extracts and EDT A saponin lysed blood extracts using the Kappa
statistic (kappa = 0.39), and there was no agreement between the later and Giemsa
stained blood smear results (kappa = -0.64). Results shown in Appendix IV-Table 6.
4.6.7.3 p104 PCR results ofT. parva Bally Vaughan infected calves
Calf 1447: Four out of the 15 dates calf 1447 was sampled were positive in the PBM
phenol I chloroform extracts, these were on days 14, 74, 109 and 137. The EDTA
saponin-lysed samples were positive in the p104 PCR assay on seven dates, day 14,
109, 179,207,218,305, and 493 out ofthe 15 dates the calf was sampled and tested
post infection. Using the Kappa statistic there was no agreement between the PCR
results on the two extracts, PBM and EDTA blood extracts, (kappa = -0.034), and
EDTA blood extracts and blood smear results (kappa = -0.75). Results shown in
Appendix IV-Table 7.
Calf 1459: Calf 1459 PBM phenol I chloroformed extracts were positive on 3 out of
13 dates that the calf was sampled and tested, day 14, 25 and 95 post infection. In
the EDT A saponin lysed samples 9 out the 14 dates sampled produced positive
results in the PCR assay post infection on days 14, 74, 109, 204, 218, 263, 305, 361,
and 456. A slight agreement was observed n the PCR results obtained in the PBM
phenol I chloroformed extracts and the EDTA saponin lysed extracts (kappa = 0.00)
101

and there was no agreement between the later and microscopic examination of
Giemsa stained blood smears (kappa = -0.85). (Appendix V-Table 8).
4.6.7.4 p104 PCR results of calves infected by application of Ayrshire and
Chikeya ticks
Calf 1456 : On only two dates when calf 1456 was tested were the PBM extracts
positive on the PCR assay out of 13 dates sampled and tested post infection (days
138 and 180). Six out 13 dates EDTA blood extracts were positive on days 152, 180,
250, 264, 488 and 534 days post tick application. The PCR results in the PBM and
EDTA blood extracts were not in agreement but moderate agreement was observed
between the later and Giemsa stained blood smears using the Kappa statistic (kappa
= 0.53). Table of results shown in Appendix V-Table 9.
Calf 1437: Peripheral blood mononuclear cells phenol I chloroformed extracts
sampled from calf 1437 were positive on 5 dates out of the 8 dates sampled and
tested on the p104 PCR on days 82, 117, 138, 152, and 180 post tick application.
The EDT A saponin lysed samples were positive on 3 dates (days 152, 222 and 264
post infection) out of the nine dates that the calf was sampled and tested. There was
no agreement observed between the PBM phenol I chloroformed and the EDT A
blood saponin lysed extracts (kappa = -0.11), and also between the latter and
. . piroplasms seen in the Giemsa stained blood smears (kappa = -0.40). (Appendix IV-
Table 10).
102

4.6.7.5 p104 PCR results of calves infected by exposure to ticks at Hunyani
Estates (1st exposure)
Peripheral blood mononuclear cells from calf 13 72 samples were all negative in the
PCR assay after phenol chloroform extraction in the PCR assay. However, the
EDT A saponin lysed blood extracts were positive on 10 out of the 14 dates sampled
and tested post infection, on days 66, 80, 150, 178, 248, 262, 304, 319,402 and 535.
There was completely no agreement between PBM and EDT A blood extracts when
the positive and negative results were analysed using the Kappa statistic, and yet
there was substantial agreement between the latter and piroplasms seen in the blood
smears (kappa = 0.63). Results shown in Appendix IV-Table 11.
4.6.7.6 p104 PCR results of calves infected by exposure to ticks at Hunyani
Estates (2nd exposure)
The following days post exposure at Hunyani Estates were tested days tested for the
3 calves were, day 0, 42, 128, and 175. The PCR results for the three calves (El, E4,
and E5) were positive for the p104 T. parva PCR assay on days 42. Dot blot
hybridisation results of the p104 PCR products are shown in (Appendix IV-Table
12a, b, and c). A comparison of the PCR results obtained in the PBM phenol I
chloroform and EDTA blood extracts showed a moderate agreement (kappa = 0.47),
compared to the complete agreement observed in the later and piroplasms seen in the
Giemsa stained blood smears using the Kappa· statistic (kappa = 1.00).
103

4.7 DISCUSSION
The study showed that PCR using T. parva p67 and p 104 primer sequences can be
used to amplify Theileria parva DNA from Zimbabwean carrier animals. The
relative advantages of p67 and p 104 primers when used in PCR reactions with T.
parva piroplasm and infected lymphocyte DNA. The primers generated PCR
products of the expected sizes respectively (233 bp and 497 bp) and their specificity
and high level of sensitivity. The main disadvantage of the PCR assays using these
primers was the time spent in extracting the sample DNA to be tested and
precautions taken to avoid contamination.
The PCR assay used in the preliminary studies at the CTVM proved to be sensitive
and specific for T. parva as reported by Bishop et al. (1992) and in this study the
assay did not amplify DNA from other haemoprotozoa. However the PCR assay
using the p67 was found to be affected by the primer, magnesium chloride and dNTP
concentrations and the best results were observed using the protocol in Bishop et al.
(1992). Parasite detection in the T. pan'a Marikebuni (Kenya) infected calf was
possible up to day 48 post infection using the p67 primers and silver staining for
detection of the PCR products. The proportion of positive results in the samples
from the Boleni infected calf and Marikebuni were different and the clinical reaction
in the calf (805) which received the T. parva Boleni was severe, and had more
positive results with the PCR test (Calf 805). However, it should be noted that the
infection prevalence in the ticks used to prepare the T. parva Marikebuni stabilate
had a lower prevalence and only 6 ticks (3 males and 3 females) were infected out of
a total of twenty dissected and examined by Methyl-green pyronin stain.
104

Dot blot hybridisation of PCR products showed the p 104 sequences to be
useful in the detection of T parva parasites in infected animals. It was also specific
for T parva macroschizont or piroplasm DNA and did not amplify bovine DNA and
other Theileria species.
The amplification of DNA from animals infected with the three Zimbabwean
T parva laboratory stocks, and three infections from field parasites, was possible
using the two sets of primers (Bishop et al., 1994; R. Skilton personal
communication). Positive PCR results were obtained intermittently and at times
which did not necessarily correspond to the occasions when piroplasms were seen in
blood smears post recovery. In the Boleni infected calves the positive PCR results
did not always agree with the result of blood smear examination. (Appendix V
Tables 1 to 4 ).
Although the test might not be able to consistently detect carriers in T parva
Boleni Bolvac® immunised animals it has shown that it can detect T parva parasites
218, 493 days post infection in healthy recovered animals as shown in the study T
parva Boleni infected animals (W70, W73, W74 and W75). PCR amplification of
DNA could be used in parallel with the serological and Giemsa stained blood smears
so as to increase the overall sensitivity and specificity of the diagnostic system as
advised for T. mutans (Bishop et al., 1994b). However, where suspect mixed
infections occur like the Hunyani Estates exposure it would be advisable to use a
panel of MAbs and T taurotragi PCR assay if there is successful isolation in cell
culture.
105

Calves 1442 and 1454 showed intermittently positive PCR reactions but more
positive reactions were detected in the latter which was treated on day 15 post
infection because of a severe clinical reaction (Appendix IV-Table 5 and 6). The
positive PCR results when the calves were going through the clinical reactions were
in agreement with the lymph node smear examinations. Positive PCR results did not
always agree with the result of blood smear examination post recovery. Similarly
PCR results did not agree with the negative results of adult R. appendicu/atus ticks
applied as nymphs on the calves.
In some cases though the PCR did not perform as expected and the results
were negative even though piroplasns were detectable in the blood. The explanation
for this could be that the samples were not processed to allow the exposure of target
DNA. It is also known that negative results may occur due to ~nhibitors of Thermus
aquaticus thermo-stable polymerase present in the blood, in particular haemoglobin
(Newton and Graham, 1994 ).
Although a lot of care was taken to remove inhibitors like haemoglobin
during the saponin lysis procedure, the proteinase K digestion can also act as PCR
inhibitor. To remove the latter, inactivation by boiling for 10 minutes was performed
and again before the addition to the PCR master mix.
An advantage of the PCR is its specificity although there could be room for
improving its sensitivity by improving the sample extraction methods to expose the
target DNA. In many carrier animals piroplasm parasitaemias are intermittent or too
low to be detected by the microscopist. In the case of anti-schizont antibodies
sometimes very low titres are observed which may only indicate recent exposure to
106

theileriosis. Antibodies are not considered a useful indicator of prevalence of disease
in the carrier population and also are not reliable for speciation of the infection
(Norval, et al., 1992).
In blood exhibiting very low piroplasm parasitaemias post recovery the PCR
assay was able to detect Theileria parasites 18 months post infection in T. parva
Boleni, A very, Bally Vaughan, 19 months post tick application of Ayrshire ticks,
infected cattle, and 19 months post exposure at Hunyani Estates. Results shown in
Appendix Ill and V.
The positive PCR results were not in agreement with the results of blood
smear examination, but were in agreement with the positive results of the adult ticks
dissected after having fed as nymphs on the Theileria recovered animals.
PCR results on PBM and EDTA blood of calf 1372 did not agree with the blood
smear examinations throughout the experiment and this was attributed to the butalex
treatment. However, there was substantial agreement between PCR results of the
EDT A saponin lysed extracts with the Giemsa stained blood smear results using the
Kappa statistic (kappa = 0.63) as it was observed that this animal had a continuous
piroplasm parasitaemia. The tick infection results were in agreement with the
Giemsa stained blood smear microscopic examinations. (Appendix V-Table 12). A
comparison of all the PCR results on the EDT A blood extracts and microscopic
examination of Giemsa stained blood smears· indicated that 82% of the results were
not in agreement using the Kappa statistic (kappa = -0.23), with less positive results
in the blood smear examinations.
107
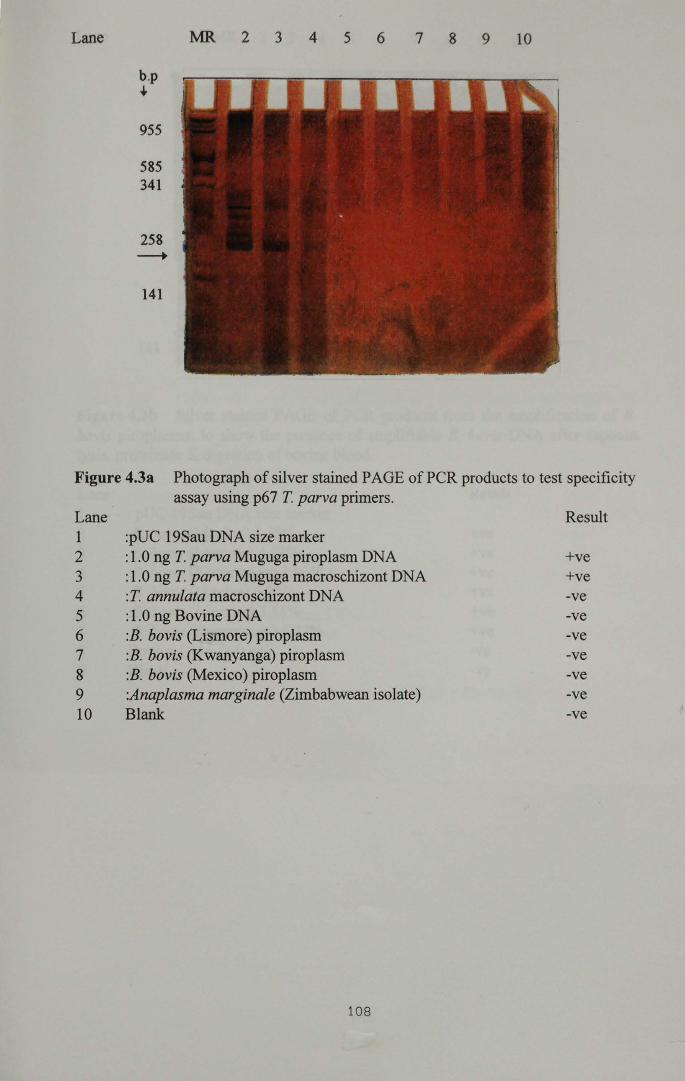
Lane
b.p .. 955
585 341
258 ___.
141
~ 2 3 4 5 6 7 8 9 10
Figure 4.3a Photograph of silver stained PAGE of PCR products to test specificity assay using p67 T parva primers.
Lane Result 1 :pUC 19Sau DNA size marker 2 :1.0 ng T parva Muguga piroplasm DNA +ve 3 :1.0 ng T parva Muguga macroschizont DNA +ve 4 :T annulata macroschizont DNA -ve 5 :1.0 ng Bovine DNA -ve 6 :B. bovis (Lismore) piroplasm -ve 7 :B. bovis (Kwanyanga) piroplasm -ve 8 :B. bovis (Mexico) piroplasm -ve 9 :Anaplasma marginale (Zimbabwean isolate) -ve 10 Blank -ve
108

Lane l\1R 2 3 4 5 6 7 8 9 10
b.p
• 955
585 341
258
141
Figure 4.3b Silver stained PAGE of PCR products from the amplification of B. bovis piroplasms: to show the presence of amplifiable B. bovis DNA after saponin lysis, proteinase K digestion of bovine blood.
Lane Result 1 : pUC 19Sau DNA size marker 2 :B. bovis (Mexico) 3 .48% +ve 3 :B. bovis (Lismore) 4. 02% +ve 4 :B. bovis (Kwanyanga) 1.93% +ve 5 :B. bovis (Mexico) 5.23% +ve 6 :B. bovis (Lismore) 3.88% +ve 7 :B. bovis (K anyanga) 6.22% +ve 8 Bovine DNA (1.0 ng) -ve 9 Blank -ve
10 9

Lane
b.p + 955
585 341
258
141
MR 2 3 4 5 6 7 8 9 10
Figure 4.4 Photograph of silver stained PAGE of PCR products to test specificity assay using p67 T. parva primers
Lane Result 1 : pUC 19Sau DNA size marker 2 :1.0 ng Bovine DNA -ve 3 :T. buffeli (Marula) piroplasm DNA -ve 4 :Trypanosoma congolense DNA (c.c) -ve 5 :T. mutans piroplasm DNA -ve 6 :T. taurotragi macroschizont DNA (V953)(c.c.) -ve 7 :T. sergenti (Shintoku) piroplasm DNA -ve 8 : T. annulata macroschizont DNA (c.c.) -ve 9 :T. parva Muguga macroschizont DNA (c.c.) +ve 10 :T. parva Muguga piroplasm DNA +e
Note: c.c. :DNA material prepared from cell culture material.
110

b.p +
955
585 341
258
141
Figure 4.5
1 2 3 4 5 6 7 8 9 ~
I I
Photograph of silver stained PAGE of PCR products to test specificity assay using p67 T. parva primers with tempelate DNA of Theileria and Babesia species.
Lane Result 1 :T. parva Muguga piroplasm DNA 1.0 ng +ve 2 :T. parva Muguga macroschizont DNA 1.0 ng +ve 3 :T. annulata macrochizont DNA -ve 4 : T. sergenti piroplasm DNA -ve 5 : T. taurotragi macroschizont DNA -ve 6 :T. parva (Muguga) saponin lysed blood (0.0000021% piroplasm
parasitaemia) +ve 7 :B. bovis (Lismore) saponin lysed bovine blood extract
(2% parasitaemia) -ve 8 :B. bovis (K wanyanga) saponin lysed bovine blood extract
(2% parasitaemia) -ve 9 :B. bovis (Mexico) saponin lysed bovine blood extract
(2% parasitaemia) -ve 10 :pUC 19Sau DNA size marker 234 b.p. is the length of a positive amplification product. MR DNA marker size
111

Lane 1 2 3 4 5 6 7 8 9 10 11 12 13 14 15
b.p. 955
585 341
258
141
Figure 4.6 Silver stained PAGE of PCR products to determine sensitivity of assay. PCR amplification of T parva Muguga piroplasm DNA (lane 1-6) and macroschizont DNA (lane 7-12). Samples were diluted in Tris-EDTA pH 7.6 and 2 J.!l amounts were added to each 25 J.!l PCR reaction.
Lane Result 1 :T parva Muguga (piroplasms DNA) 1 ng +ve 2 ·" " " 0.1 ng +ve 3 " " " " 0.01 ng +ve 4 ·" " " 0.001 ng +ve 5 ·" " " 0.0001 ng +ve (weak) 6 ·" " " 0.00001 ng -ve 7 :T parva Muguga (macroschizonts DNA) 1 ng +ve 8 ·" " " 0.1 ng +ve 9 ·" " " 0.01 ng +ve 10 ·" " " 0.001 ng +ve (weak) 11 ·" " " 0.0001 ng -ve 12 ·" " " 0.00001 ng -ve 13 :Positive control 14 :Negative control 1.0 ng Bovine DNA 15 :pUC 19Sau DNA size marker
+ve weak weak positive 234 b.p. is the length of a positive amplification product
112

Lane
1 2 3 4 S 6 7 8 9 10 11 12 13 14 1S 16 17 18 19 20 21 22 23 24
955 585 341
258
141
Figure 4. 7 Photograph of silver stained PAGE of p67 PCR products of T. parva Muguga piroplasm saponin lysis extracts comparing the sensitivity between 30 and 40 cycle run. 30 cycles Lane 1 : T. parva Muguga 21% piroplasm 2 :T. parva Muguga 0.21% piroplasm 3 :T. parva Muguga 0.021% piroplasm 4 :T. parva Muguga 0.0021% piroplasm 5 :T. parva Muguga 0.00021 o/o piroplasm 6 :T. parva Muguga 0.000021% piroplasm 7 :T parva Muguga 0.0000021% piroplasm 8 :DNA size markers pUC 19 Sau 3A 9 :DNA size markers pUC 19 Sau 3A 10 :DNA size markers pUC 19 Sau 3A 11 :Positive control T parva Muguga 12 :Positive control T. parva Muguga 13 :Bovine DNA negative control 40 cycles 14 : T. parva Muguga 21% piroplasm 15 :T parva Muguga 0.21% piroplasm 16 :T parva Muguga 0.021% piroplasm 17 :T parva Muguga 0.0021% piroplasm 18 : T parva Muguga 0.00021% piroplasm 19 : T. parva Muguga 0.000021% piroplasm 20 :T parva Muguga 0.0000021% piroplasm 21 :Bovine DNA 22 :Positive control T parva Muguga 23 :Positive control T parva Muguga 234 b.p. is the length of a positive amplification product
113
Result +ve +ve +ve +ve +ve +ve +ve
+ve +ve -ve
+ve +ve +ve +ve
+ve (weak) -ve -ve -ve +ve +ve

Lane 'MR. 2 3 4 5 6 7 8 9 10 11 12 13 14 15
b.p
• 955
585 341
258
141
Figure 4.8 An investigation of the effect of increased dNTP concentration on the sensitivity of the p67 PCR assay. Ten-fold dilutions of known T parva Muguga piroplasm positive blood was tested at 0.2 mM, 0.4 mM and 0.8 mMdNTPs.
Lane Result 1 :pUC 19Sau DNA size marker 2 :Negative control (Bovine DNA) -ve 3 :Blank -ve
:0.8 mMdNTP 4 :0.000021 o/o piroplasm parasitaemia -ve 5 :0.00021% piroplasm parasitaemia +ve (extra bands) 6 :0.0021 o/o piroplasm parasitaemia +ve (extra bands) 7 :0.021% piroplasm parasitaemia +ve
:0.4 mM dNTP 8 :0.021% piroplasm parasitaemia +ve 9 :0.0021% piroplasm parasitaemia +ve 10 :0.00021% piroplasm parasitaemia +ve (extra bands) 11 :0.000021 o/o piroplasm parasitaemia -ve
0.2 mMdNTP 12 :0.021% piroplasm parasitaemia +ve 13 :0.0021 o/o piroplasm parasitaemia +ve 14 :0.00021% piroplasm parasitaemia +ve 15 :0.000021% piroplasm parasitaemia -ve
114
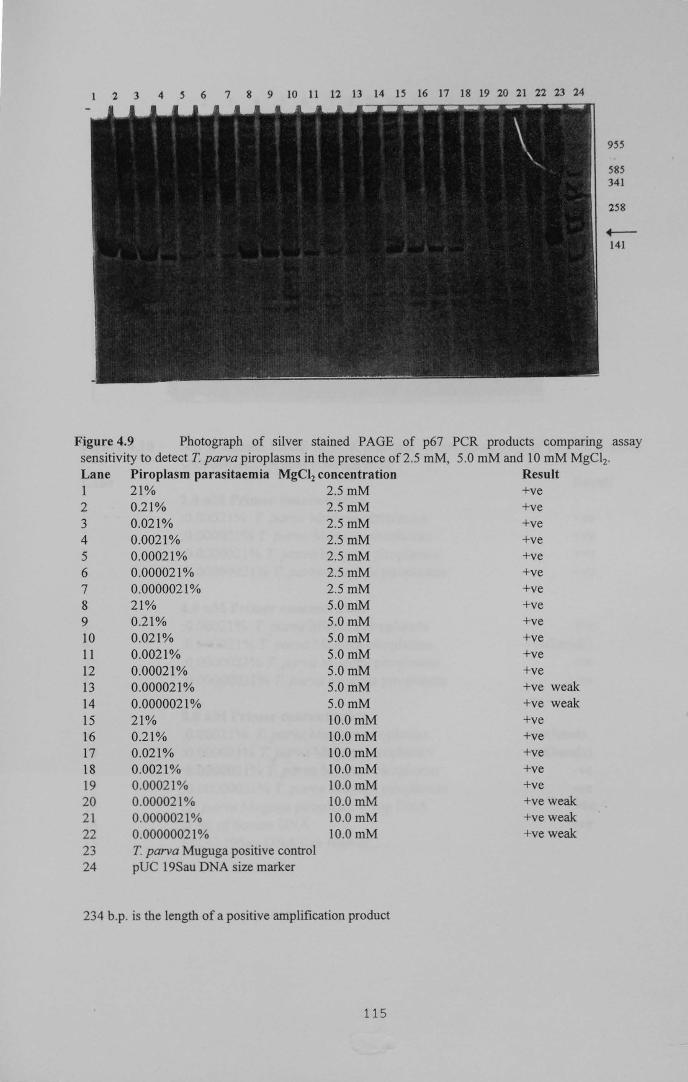
2 3 4 S 6 7 8 9 10 11 12 13 14 IS 16 17 18 19 20 21 22 23 24
9S5
58S 341
258
.,____ 141
Figure 4.9 Photograph of silver stained PAGE of p67 PCR products comparing assay sensitivity to detect T parva piroplasms in the presence of2.5 mM, 5.0 mM and 10 mM MgCl2•
Lane Piroplasm parasitaemia MgCI2 concentration Result 1 21% 2.5 mM +ve 2 0.21% 2.5 mM +ve 3 0.021% 2.5 mM +ve 4 0.0021% 2.5mM 5 0.00021% 2.5mM 6 0.000021% 2.5mM 7 0.0000021% 2.5mM 8 21% 5.0mM 9 0.21% 5.0mM 10 0.021% 5.0mM 11 0.0021% 5.0mM 12 0.00021% 5.0mM 13 0.000021% 5.0mM 14 0.0000021% 5.0mM 15 21% 10.0 mM 16 0.21% 10.0 mM 17 0.021% 10.0 mM 18 0.0021% 10.0 mM 19 0.00021% 10.0 mM 20 0.000021% 10.0 mM 21 0.0000021% 10.0 mM 22 0.00000021% 10.0 mM 23 T parva Muguga positive control 24 pUC 19Sau DNA size marker
234 b.p. is the length of a positive amplification product
115
+ve +ve +ve +ve +ve +ve +ve +ve +ve +ve weak +ve weak +ve +ve +ve +ve +ve +ve weak +ve weak +ve weak

2 3 4 5 6 7 8 9 10 11 12 13 14 15
955
-585 341
258
+--141
Figure 4.10 Silver stained PAGE of PCR products to test sensitivity of p67 PCR assay with different primer concentration
Lane Result
1 2 3 4
5 6 7 8
9 10 11 12 13 14 15
2.0 uM Primer concentration :0.00021% T parva Muguga piroplasms :0.000021% T parva Muguga piroplasms :0.0000021% T parva Muguga piroplasms :0.00000021% T parva Muguga piroplasms
4.0 uM Primer concentration :0.00021 o/o T parva Muguga piroplasms :0.000021% T parva Muguga piroplasms :0.0000021% T parva Muguga piroplasms :0.00000021% T parva Muguga piroplasms
8.0 uM Primer concentration :0.00021% T parva Muguga piroplasms :0.000021% T parva Muguga piroplasms :0.0000021% T parva Muguga piroplasms :0.00000021% T parva Muguga piroplasms :T parva Muguga piroplasm 0.1ng DNA : 1 ng of bovine DNA : pUC 19Sau DNA size marker
116
+ve +ve +ve +ve
+ve +ve(bands)
-ve -ve
+ve(bands +ve(bands)
-ve -ve +ve -ve

Lane 1 2 3 4 6 7 8 9 10
Figure 4.11 Photograph of silver stained PAGE ofPCR products:
955
585 341
258
141
PCR amplification of saponin lysed EDTA blood samples from calf 818 infected with T parva Marikebuni day 11 to 17 post
infection. Two micro litres of sample were tested in PCR assay with p67 pnmers after saponin lysis and proteinase K digestion.
Lane Result 1 :Day 11 p.i. -ve 2 :Day 12 p.i. -ve 3 :Day 13 p.i. -ve 4 :Day 14 p.i. +ve(weak) 5 :Day 15 p.i. +ve 6 :Day 16 p.i. +ve 7 :Day 17 p.i. +ve
8 : Positive control T parva Muguga piroplasms 9 :Negative control 10 :pUC 19Sau DNA size marker
p.i. :post infection 234 b.p. is the length of a positive amplification product
117

2 3 4 5 6 7 8 9 10 11 12 13 14 15
b.p
955
585 341 258
+----141
Figure 4.12 Photograph of silver stained PAGE of PCR products showing : PCR amplification of saponin lysed EDTA blood, right prescapular gland (RPG) biopsy material, left prescapular gland (LPG) biopsy material and PBM phenol chloroformed samples from calf 805 T. parva Boleni day 5 to 9 post infection. Two micro litres of sample were tested in PCR assay with p67 primers after saponin lysis and proteinase K digestion. Lane Result 1 :Positive control +ve 2 :Day 5 p.i. RPG (p.c.) w+ve 3 :Day 6 p.i. RPG (p.c.) +ve 4 :Day 7 p.i. RPG (p.c.) w+ve 5 :Day 8 p.i. RPG (p.c.) -ve 6 :Day 8 p.i. EDTA (s.l.) -ve 7 :Day 8 p.i. EDTA (s.l.) -ve 8 :Day 8 p.i. PBM (p.c.) +ve 9 :Day 8 p.i. LPG (p.c.) +ve 10 :Day 9 p.i. LPG (p.c.) +ve 11 :Day 9 p.i. PBM (p.c.) +ve 12 :Day 9 p.i. RPG (p.c.) +ve 13 :Day 9 p.i. EDTA (s.l.) -ve 14 : T. parva Muguga macroschizont DNA +ve 15 :pUC 19Sau DNA size marker
234 b.p. is the length of a positive amplification product -ve :negative s.l. :saponin lysis extracted +ve :postttve w +ve :weak positive p.c. :phenol chloroform extraction after proteinase K digestion p.t. :post infection PBM :peripheral blood mononuclear cells
118

1 2 3 4 5 6 7 8 9 10 11 12 13 14 15
b.p
955
585 341
258 ..._.
141
Figure 4.13 Photograph of silver stained PAGE of p67 PCR products showing : Samples from calf 805 T parva Boleni for days 10, 11, 12 and 13 post infection. PCR amplification of extracts from (a) right prescapular gland (RPG) biopsy material phenol/ chloroform extract, (b) left prescapular gland (LPG) biopsy material phenol/ chloroform extract, (c) PBM phenol/ chloroform extract (d) saponin lysed EDTA samples .
Lane Result 1 :Day 10 p.i. RPG biopsy material +ve 2 :Day 10 p.i. LPG biopsy material +ve 3 :Day 10 p.i. PBM +ve 4 :Day 11 p.i. EDTA -ve 5 :Day 11 p.i. RPG biopsy material +ve 6 :Day 11 p.i. LPG biopsy material +ve 7 :Day 11 p.i. PBM +ve 8 :Day 12 p.i. EDTA -ve 9 :Day 12 p.i. RPG biopsy material +ve 10 :Day 12 p.i. LPG biopsy material +ve 11 :Day 12 p.i. PBM +ve 12 :Day 13 p.i. EDT A -ve 13 :Negative control 14 :pUC 19Sau DNA size marker 15 :T. parva Muguga macroschizont DNA positive control (1.0 ng)
119

2 3 4 5 6 7 8 9 10 11 12 13 14 15
b.p
955
585 341
258
+--
141
Figure 4.14 Photograph of silver stained PAGE of p67 PCR products showing : Samples from calf 805 T. parva Boleni for days 16, 17, 18 post infection. PCR amplification of extracts from (a) right prescapular gland (RPG) biopsy material phenol/ chloroform extract, (b) left prescapular gland (LPG) biopsy material phenol/ chloroform extract, (c) PBM phenoV chloroform extract (d) saponin lysed EDTA samples. Lane 1 2 3 4
:Day 16 p.i. PBM (p.c.) :Day 16 p.i. LPG (p.c.) :Day 16 p.i. RPG (p.c.) :Day 16 p.i. EDTA blood (s.l.) :Day 17 p.i. PBM (p.c.) :Day 17 p.i. LPG (p.c.) :Day 17 p.i. RPG (p.c.) :Day 17 p.i. EDTA blood (s.l.) :Day 18 p.i. PBM (p.c.) :Day 18 p.i. LPG (p.c.) :Day 18 p.i. RPG (p.c.)
5 6 7 8 9 10 11 12 13 14 15
:Negative control (1 .0 ng Bovine DNA) :Blank :Positive control T. parva Muguga piroplasm DNA :pUC 19Sau DNA size marker
p.1. post infection s. l. saponin lysis extraction p.c. phenol chloroform extraction
120
Result +ve -ve -ve -ve -ve +ve +ve -ve +ve +ve +ve -ve
-ve

1 2 3 4 5 6 7 8 9 10 11 12 13 14 15 16 17 18 19 20 21 22 23 24
Figure 4.15
b.p 955
585
341 258
141
Photograph of silver stained PAGE of p67 PCR products showing : Samples from calf 805 T parva Boleni for days 19, 20, 21, 22, 23, 24 25 and EDTA samples from T parva Marikebuni calf818 days 47 and 48 post infection. PCR amplification of extracts from (a) right prescapular gland (RPG) biopsy material phenol I chloroform extract, (b) left prescapular gland (LPG) biopsy material phenol I chloroform extract, (c) PBM phenol/ chloroform extract (d) saponin lysed EDT A samples . Lane Result Lane Result Calf 805
:Day 19 p.i. PBM (p.c.) -ve 11 2 :Day 19 p.i. LPG (p.c.) +ve 12 3 :Day 19 p.i. RPG (p.c.) +ve 13 4 :Day 19 EDTA +ve (w) 14 5 :Day 20 p.i. PBM (p.c.) +ve 15 6 :Day 20 p.i. LPG (p.c.) +ve 16 7 :Day 20 p.i. RPG (p.c.) +ve 17 8 :Day 20 p.i.EDTA (s.l.)+ve (w) 18 9 :Day 21 p.i. PBM (p.c.) -ve 19 10 :Day 21 p.i. LPG (p.c.) +ve Calf 818 20 :Day 47 p.i. calf818 EDTA (s.l.) 21 :Day 48 p.i. calf818 EDTA (s.l.) 22 : T parva Muguga piroplasm positive control 23 :Bovine DNA 1.0 ng Negative control 24 :pUC 19Sau DNA size marker p.1. post infection s.l. saponin lysis extraction p.c. phenol chloroform extraction +ve (w)weak positive
121
:Day 21 p.i. RPG (p.c.) +ve :Day 21 EDTA (s.l.) +ve :Day 22 p.i. PBM (p.c.) +ve :Day 22 p.i. LPG (p.c.) +ve :Day 22 p.i. RPG (p.c.) +ve :Day 22 EDTA (s.l.) +ve :Day 23 p.i. PBM (p.c.) +ve (w) :Day 24 p.i. LPG (p.c.) +ve (w) :Day 25 p.i. RPG (p.c.) +ve (w)
+ve(w) +ve +ve

_ LANE-_
Figure 4.16 Agarose gel electrophoresis ofPCR products for p104 PCR specificity
Lane Result A :0 X174 Hae Ill dig DNA size marker
B :Bovine DNA 1.0 ng -ve
C :Blank -ve
D :T. parva Muguga piroplasm DNA 1.0 ng +ve
E :T mutans (1.0 ng piroplasm DNA tested in PCR assay) -ve
F :T taurotragi (1.0 ng macroschizont DNA added to PCR reaction) -ve
G :Trypanosoma congolense 1.0 ng DNA added to PCR reaction) -ve
H :T buffeli (Marula) (1.0 ng piroplasm DNA added to PCR reaction) -ve
I :T sergenti (Shintoku) (1.0 ng piroplasm DNA added to PCR reaction) -ve
J :T parva Boleni (1.0 ng macroschizont DNA added to PCR reaction) +ve
K :B. bovis DNA -ve
L :Blank -ve
M :0 X174 Hae III dig DNA size marker
:0 X174 Hae Ill dig DNA size marker
12?

Figure 4.17 DNA prepared from various parasite infected cells, and piroplasms were run on a PCR assay using pI 04 primers. PCR products were slot-blotted, probed with T. parva Muguga random labelled PCR product. The result of dot blot hybridisation to confirm the PCR product of 497 bp hybridised to PCR amplification product from T. parva only:
AS : T. parva Muguga PCR product (I 0 J.Ll)
All :T. parva Muguga PCR product (30 J.Ll)
Cl :T. mutans (1.0 ng piroplasm DNA tested in PCR assay)
C3 :T. taurotragi (1.0 ng macroschizont DNA added to PCR reaction)
CS :Blank
C7 :Bovine DNA (1.0 ng added in PCR reaction tube)
El :Trypanosoma congolense (1.0 ng DNA added to PCR reaction)
E3 :T. buffeli (Marula) (1.0 ng piroplasm DNA added to PCR reaction)
E7 :T. sergenti (Shintoku) (1.0 ng piroplasm DNA added to PCR reaction)
FS :T. parva Boleni (1.0 ng macroschizont DNA added to PCR reaction)
Fll :T. parva Boleni (1.0 ng macroschizont DNA added to PCR reaction)
123

A
B_
C-
o-
E-
F-
G-
1 2 J
3 4 I
6 7 8 9 10 11 12 I I t I 1

Table 4.1 PCR results for extracts prepared from 3 types of sample for T parva Marikebuni infected calf No: 818 using p67 primers from the first 30 days post infection (p.i.)
Day p.i PCRPBM PCRLPG PCR EDTA IF AT titre blood
0 -ve -ve -ve <1:10 1 -ve -ve -ve 2 -ve -ve -ve 3 -ve -ve -ve 4 -ve -ve -ve 5 -ve -ve -ve 6 -ve -ve -ve 7 -ve -ve -ve 1:10 8 -ve -ve -ve 9 -ve -ve -ve 10 +ve -ve -ve 11 +ve -ve -ve 12 -ve -ve -ve 13 -ve +ve -ve 14 +ve -ve -ve 1:160 15 -ve -ve +ve 16 -ve -ve +ve 17 -ve -ve +ve 18 -ve +ve +ve 19 -ve -ve +ve 20 -ve w+ve +ve 21 -ve w+ve +ve 1:640 22 -ve -ve +ve 23 -ve -ve +ve 2.f -ve -ve ns 25 -ve -ve +ve 26 -ve ns ns 27 -ve ns ns 1:2560 28 -ve ns -ve 29 ns ns 30 ns ns +ve 3/28 4/25 10/25 proportion -ve :negative LPG :left prescapular gland +ve :positive ns :not sampled 234 b.p. product is the length of a positive amplification
124

Table 4.2 PCR results for extracts prepared from 4 types of sample for T parva Boleni infected calf No: 805 using the p67 primers from the first 30 days post infection (p.i.)
Day p.i
0 1 2 3 4 5 6 7 8 9 10 11 12 13 14 15 16 17 18 19 20 21 22 23 24 25 26 27 28 29 30 +ve proportion
+ve -ve ns
PCRPBM PCRRPG
-ve -ve -ve -ve -ve -ve -ve -ve -ve ± ? -ve w +ve -ve w +ve -ve w +ve
+ve -ve +ve +ve +ve +ve +ve +ve +ve +ve +ve -ve
-ve +ve +ve +ve
-ve +ve -ve +ve
+ve +ve -ve +ve
+ve +ve -ve +ve
+ve +ve +ve -ve
-ve +ve -ve -ve -ve ns -ve ns -ve ns ns ns ns ns 11/28 18/25
.. :positive :negative :not sampled
PCRLPG
ns ns ns ns ns ns ns ns ns
+ve +ve +ve
-ve +ve +ve +ve +ve +ve +ve +ve +ve +ve +ve
-ve -ve -ve -ve -ve -ve ns ns 13/20
125
LPG RPG w +ve
PCR EDTA IFAT blood titre -ve ns ns ns ns -ve -ve -ve -ve -ve -ve -ve -ve -ve -ve -ve -ve -ve
-ve -ve -ve -ve -ve 8/29
<1 :160
1:160
1:160
+ve w +ve
+ve +ve 1:640 +ve +ve +ve +ve
1:640
1 :left prescapular gta!1d :right prescapular gland :weak positive

CHAPTER FIVE
Detection of Theileria parasites in infected I recovered cattle by tick application
5.1 Introduction
The three host, brown ear tick Rhipicephalus appendiculatus is the principle
field vector of T. parva. The nymphal tick has also been known to transmit the
disease (Koch et a!., 1993; Koch, 1990; Ochanda, 1994). Experiments by Ochanda
(1994) have shown that R. appendiculatus nymphae infected as larvae developed
lower prevalence and intensity of infection compared to adults infected as nymphae.
Transmission is always transtadial and transovarian transmission has not been
demonstrated.
In this chapter clean, R. appendiculatus nymphs from a laboratory colony
were used to pick up the infection from the infected I carrier recovered cattle
(discussed in chapter 3) in order to determine the infectivity of the Theileria
infections to ticks in the laboratory. The nymphal ticks were applied on the calves
post recovery in order to demonstrate that infections cculd be passed onto ticks when
the animals were not showing any clinical reactions. Four tick feeds were performed
on the Theileria infected calves at approximately 3 months intervals. One tick feed
was done on the calves which sur:vived on the Hunyani estates second exposure in
order to confirm the occurrence of a mixed infection and the presence of a virulent
Theileria parasite on the farm. At the same time as tick feeds, PCR, serology and
blood smear examinations were performed. The nymphs were allowed to moult to
the next instar and the salivary glands of the adult ticks were dissected out and
stained to determine the prevalence ofT. parva infection. The Feulgen technique to
126

identify Theileria infection in adult ticks has been demonstrated to be rapid and
simple method (Blewett and Branagan, 1973; Walker et al., 1979). The Schiffs
reagent used in the Feulgen stain is stable at 4°C when prepared, easy to use and is
commercially available. Several staining techniques for the detection of Theileria in
whole salivary glands have been compared and the Feulgen stain supplemented by
the superimposition of Giemsa stain was superior to other methods (Norval, et al.,
1992). A comparison of conventional Feulgen staining with DNA probes found 90-
100% correlation in Theileria infected tick salivary glands (Conrad, et al., 1989a),
however this depends on the parasite stock used. There still remains problems with
quantification of Theileria parasites in salivary glands of field ticks because more
than one theileria! species may occur in individual ticks, [ eg. T parva and T
taurotragi in R. appendiculatus; T mutans and T velifera in Amblyomma
variegatum] (Norval, et al., 1992), thus the development nucleic acid techniques is
necessary.
The following terms are used to describe levels of infection and conform to
those given by Buscher and Otim (1986);
Prevalence
Abundance
Mean intensity
:Number of infected ticks per number of ticks examined.
:Number of infected acini per infected plus uninfected
tick examined.
:Number of infected acini per infected tick.
A batch of ticks was defined as a group of ticks of the same stock that fed to
repletion on an animal and were removed on a single occasion. Since piroplasms are
believed to be the stage infective for the feeding tick (Gander, 1911; Mehlhorn and
127

Schein, 1984 ), their presence or absence in the circulation determines whether an
animal is a carrier at a given time. In this study nymphal R. appendiculatus ticks
were applied onto the recovered animals different occasions over a period of 19
months and dissected at the next instar to determine if the Zimbabwean T parva
parasites can effectively cause animals to be persistent or sporadic carriers.
Quantitative studies on T parva salivary glands of R. appendiculatus adults have
shown that the age and the feeding site of nymphs on an infected calf and its
parasitaemia had no detectable influence on the tick infections and higher infections
were found in female ticks from heavier nymphs, in females versus male (Buscher
and Tangus, 1986).
5.2 Materials and Methods
5.2.1 Rabbits and Ticks
Pure bred New Zealand white rabbits, weighing at least 2 kilograms were used for
tick feeding and were obtained from the Tick unit at the Veterinary Research
Laboratories-Harare.
Theileria freeR. appendiculatus nymphs (Mcllwaine colony) were used for
tick feeds. These ticks were originally obtained from the Lake Chivero region 30
kilometres south of Harare and have been maintained in a closed colony by feeding
stages of the ticks on New Zealand White rabbits at the Veterinary Research
Laboratories, Harare since 1976 (Short & Norval, 1981 ).
128
5.2.2 Application of ticks to cattle to pick up Theileria infections
The experimental animals had their backs washed, shaved and zipped cotton cloth
(57 cm x 24 cm) were attached with glue (Gemchem, Harare). Uninfected R.
appendiculatus nymphs were applied in batches of 1 000 at a time per animal.
Nymphal tick applications and feeds on the carrier I recovered animals were
performed on the days shown on Table 5.1 below.
The nymphs were left to feed to repletion and when engorged transferred into
incubators at 28°C and relative humidity 85% for 28 days to complete their moult.
Adult ticks were left for another two weeks to harden before processing for
assessment of infection.
5.2.3 Assessment of ticks for Theileria infections using Feulgen stain
Feulgen technique was used to detect Theileria-infected ac~ni in the adult tick
salivary glands (Young and Leitch, 1982). In order to examine tick batches for
infections approximately 300 adult ticks from each batch were allowed to feed on
New Zealand White rabbit's ears for 4 days so that the T parva sporoblasts could
mature to sporozoites. Approximately 7 5 males and 7 5 female adult ticks were
applied and placed in each ear bag.
Adult ticks were placed in cotton bags attached onto rabbit's ears using elastoplast
(Zinc Oxide Elastic Adhesive Bandage-Smith and Nephew Ltd Pinetown S.A.). Any
adult ticks which had not fed by the first day were removed and destroyed, and those
continuing to feed were left until day 3 after application (day of application counted
as day zero). Adult ticks which had successfully fed were removed on the fourth day
from the rabbit's ears, counted and were partially embedded in paraffm wax
129

(Histoplast-Shandon Scientific Ltd. Runcom Cheshire, England) with their dorsal
sides uppermost and submerged in normal saline. Salivary glands were dissected out
after having cut out the cuticle of the tick using fine pointed surgical blades (Size
No: 11) and fine pair of forceps.
Five pairs of salivary glands were spread individually on each glass slide and
were allowed to dry. These were fixed in methanol for 5 minutes dried, and then
hydrolysed in 5N HCL for one hour. The excess acid was drained off and the glands
stained in Schiff's reagent stain for one hour (Buscher & Otim 1986). After the
Feulgen staining the stained glands were washed thoroughly under running tap-water,
air dried at room temperature and then mounted with 50mm x 22mm coverslips with
DPX mountant. The salivary glands were examined under a magnification of X200
to assess the number of acini infected with Theileria sporozoites per individual tick.
The number of ticks dissected and examined varied from batch to batch and animal
to animal as shown in the Tables 5.2 to 5.7. One of the reasons for this variation is
that it was found that nymphal ticks fed less successfully with repeat applications due
to dermal hypersensitivity induced in the host. The degree of the reactions varied
from animal to animal and feed to feed. In order to improve the number of nymphae
feeding successfully the nymphs were applied on the ears of the calf or the numbers
applied were reduced to 200 at a time so they could feed to repletion. It has been
shown that the site of tick feeding does not influence the level of infection
developing in subsequent instars.
130

Table 5.1
Days of application of R. appendiculatus nymphs to pick up Theileria infections
Group Parasite Calf No: Batch I Batch 11 Batch Ill Batch IV Batch V
I Boleni W70 95 p.i. 218 p.i. 305 p.i. 456 p.i. nd
I Boleni W73 95 p.i. 218 p.i. 305 p.i. 456 p.i. nd
I Boleni W74 95 p.i. 218 p.i. 305 p.i. nd nd
I Boleni W75 95 p.i. 218 p.i. 305 p.i. nd nd
11 A very 1442 95 p.i. 218 p.i. 305 p.i. 456 p.i. nd
11 A very 1454 95 p.i. 218 p.i. 305 p.i. 456 p.i. nd
Ill Bally 1447 95 p.i. 218 p.i. 305 p.i. 456 p.i. nd
Vaughan
Ill Bally 1459 95 p.i. 218 p.i. 305 p.i. 456 p.i. nd
Vaughan
IV a Ayrshire 1456 nd 264 p.t.a. 348 499 nd
IVb Chikeya 1437 138 p.t.a. 264 p.t.a. nd nd nd
V a Hunyani 1372 140 post 266 post 350 post 501 post nd
Estates exposure exposure exposure exposure
Vb Hunyani El 137 post
Estates exposure
Vb Hunyani E4 137 post
Estates exposure
Vb Hunyani E5 137 post
Estates exposure
nd :not done
p. t.a. :post tick application
p.1. :post infection
131

5.3 Results
Table 5.2 shows the numbers ticks which fed successfully for four days as adults on
the rabbits and were dissected. After the first batch the numbers decreased as the
animals reacted to the attachment of the nymphs resulting in the death of a large
numbers of adult ticks on feeding on rabbits before the dissections.
The prevalence of Theileria infections in adult R. appendiculatus ticks that
fed as nymphae on the Theileria recovered cattle are shown in Tables 5.3 to 5.7.
For day 95 tick applications, 3 out of 4 batches of the ticks fed on T. parva
Boleni calves W70, W73, and W75 were positive with infection prevalence of 0.4%,
5.96% and 7.14 % respectively. For day 218 applications 3 out of 4 batches were
positive with animal number W74 having transmitted the infection but was negative
for the first batch of ticks. Theileria parasites were not detected in ticks applied to
the group I animals on days 305 and 456 post infection. No Theileria parasites were
detected in the Boleni infected calves on days 305 and 456 post infection.
Bally Vaughan infections: The tick batches which fed on group II and Ill
calves had no parasites seen in the adult tick salivary glands in any of the four
batches.
Ayrshire ticks application: Uninf~cted R. appendiculatus nymphs were applied on
days 264, 348 and 499 post adult tick application and the subsequent adult ticks had
prevalence of infection of 11.6%, 10.24% and 11.6% respectively.
Chikeya ticks application: A single acini was Theileria infected in the two
batches fed on 138 and 268 days post adult ticks application on calf 1437.
Hunyani estates infections;
132

A sample of 28 adult R. appendiculatus ticks from the paddock at Hunyani estates
had an infection rate of 10.71%, seven acini were infected in the 3 ticks that were
infected. A 68.03% prevalence of infection was shown in the ticks which fed on the
recovered animai 1372 on days 140 post exposure(Table 5.3). The prevalence of
infection in the subsequent ticks were high (Tables 5.4, 5.5 & 5.6) with 60.6%,
27.2% and 37.82 % prevalence for applications on days 266, 350 and 501
respectively. The second group of animals exposed (E 1, E4 & E5) had uninfected
nymphs applied 13 7 days post exposure and the prevalence of infection in the
subsequent adult ticks were 18.88, 12.39 and 90.44% respectively. The highest range
of number of infected acini per tick was 1-79 in the day 266 days post exposure adult
ticks.
133

Table 5.2
Tick numbers successfully dissected after feeding on rabbits
Group Animal Batch I Batch 11 Batch Ill Batch IV Batch V
tag no:
I W70 235 193 200 134
W73 250 213 144 124
W74 218 190 145 * nd
W75 224 191 190 * nd
11 1442 131 186 137 23
1454 152 244 244 147
Ill 1447 143 204 500 228
1459 148 24 76 231
IV 1456 nd 199 127 185
1437 260 201 * nd * nd
V 1372 122 221 353 220
VI El 233
E4 218
E5 136
* ticks dead
nd notdone
134

5.4 Discussion
In this study Boleni infected I recovered animals were shown to be infective carriers
of T parva to the vector ticks for a period of 218 days post infection. Three of the
tick applications on this date on 4 Boleni infected animals were positive. Thus
transmission of T parva Boleni to ticks from immunised animals was shown. As
transmission studies were not performed in this study, to prove that the infected tick
batches could transmit disease it cannot be stated that onward transmission of the
Boleni parasite would occur. Koch et al., (1992) demonstrated transmission of
disease 7-9 months after T parva Boleni immunisation by application of adult ticks
onto susceptible cattle from nymphs fed on Boleni immunised animals.
Group II T parva A very and group Ill buffalo derived T parva Bally
Vaughan infected and recovered calves were not capable of transmitting infection to
ticks. Maritim et al (1989) in 5 out of 11 infected animals infected with buffalo
derived T parva. In this study 1 054 adult R. appendiculatus ticks fed as nymphae on
T parva Bally Vaughan infected I recovered calves were negative. Much higher
infection rates (10 to 90o/o) have been obtained from R. appendiculatus adults fed as
nymphs on African buffalo than obtained from T parva or buffalo derived T parva
carrier cattle (Young and Grooten4uis., 1984). Previous workers have demonstrated
that buffalo derived parasites are difficult to transmit to ticks because of their low
levels of parasites and low numbers of piroplasms.
R. appendiculatus adult ticks collected in field from vegetation transmitted T
parva infection to susceptible calves (Group IV) resulting in a moderate Theileria
reaction. The two properties, Ayrshire and Chikeya had cattle immunised in the
135

previous years and these could have added the parasite population in the ticks and the
farmers were not experiencing any outbreaks of disease.
Both experiments at Hunyani Estates were complicated by the possibility of
infection with T taurotragi. High tick infection rates following application of ticks
to recovered calves suggest a biologically different Theileria from the other
laboratory stocks. The severity of the reactions exposed at this property meant that
the farmer could not graze his stock in the particular paddock used in this study. It is
possible that the high tick infection rates which were detectable after 501 days post
exposure at Hunyani estates, 499 days post tick application of field ticks were mixed
infections of T parva and T taurotragi in the ticks. However in this chapter it has
been shown that an infection prevalence of90.44% in adult ticks fed as nymphae 137
days post exposure at Hunyani Estates (Hunyani 2nd exposure), and in Chapter three
a T taurotragi-like monoclonal antibody profile appeared yet the parasite was
pathogenic contrary to work by Grootenhuis. et al., (1979) who found that a tick
derived stabilate ofT taurotragi was uniformly infective to cattle and mild reactions
developed and the survivors after treatment were immune to T parva A very
challenge. The Hunyani exposed calves were positive forT parva (chapter 4) in this
study by PCR using p 1 04 primer sequences designed for microneme I rhoptry
antigens of T parva.
Young et al., (1983) demonstated that higher T parva infections (96%)
developed in salivary glands of ticks exposed in the field than those incubated at 28
or 23 °C. In this study an infection rate of 90.44% was achieved in adults fed as
136

nymphae 13 7 days post exposure at Hunyani estates, higher than the infection rate of
10.71% in grass-top ticks from the same paddock.
From these results it can be concluded that field parasites cause higher levels of
carrier status capable of causing tick infections higher than those caused by the
Boleni immunizing stock. Another explanation could be the degree of infectivity of
the ground up tick stabilates is low because of liquid nitrogen storage.
It was difficult to achieve a minimum of 200 feeding adult ticks per batch for
each animal as the animals reacted to the ticks resulting in the variability of the
number of ticks successfully feeding on an animal. The large variation in the
infection rate in the ticks fed on I-Iunyani exposed calves and the Boleni infected can
be a pointer in distinguishing field parasites from the vaccine stock, as the two
properties Hunyani and Ayrshire have had cattle iiThnunised. Further
characterisation of the Hunyani parasite is required because the cattle were infected
with T. taurotragi or a very atypical strain of T. parva. Variations within the same
group of animals can occur as it is possible that at the time of nymphal application
the animals did not have piroplasms in the peripheral blood vessels.
137

Results: Table 5.3 Prevalence of infections in adult R. appendiculatus ticks that fed as nymphae on Theileria-infected cattle. Batch 1:
Animal Day Number of Number Mean No. Prevalence Range No: p.l. ticks of ticks infected of Number Parasite dissected infected acini per infection infected
tick % per tick (min-max)
W70 95 p.i. 235 14 1.43 5.96 1-4 Boleni W73 95 p.i. 250 1 1 0.4 1 Boleni W74 95 p.i. 218 0 0 0 0 Boleni W75 95 p.i. 224 16 1.44 7.14 1 - 3 Boleni 1442 95 p.i. 131 0 0 0 0 A very 1454 95 p.i. 152 0 0 0 0 A very 1447 95 p.i. 143 0 0 0 0 Bally Vaughan 1459 95 p.i. 148 0 0 0 0 Bally Vaughan 1437 138 260 1 1 0.38 1 Chikeya. p.t.a 1372 140 p.e. 122 83 5.66 68.03 1-29 Hunyani Estates
p.1. :post infection p.t.a. :post tick application p.e. :post exposure
138
of of
acini

Table 5.4 Prevalence of infections in adult R. appendiculatus ticks that fed as nymphae on Theileria-infected cattle. Batch II: Calf No. Day Number of Number of Mean no. Prevalence Range Parasite p.l. ticks dissected ticks of infected of Number
of of
infected acini per Infection infected acini tick % per tick
(min-max) W70 218 pi 193 0 0 0 0 Boleni W73 218 pi 213 7 1 3.29 1 Boleni W74 218 pi 190 2 1 2.22 1 Boleni W75 218 pi 191 2 1.5 1.05 1 - 2 Boleni 1442 218 pi 186 0 0 0 0 A very 1454 218 pi 244 0 0 0 0 A very 1447 B V 218 pi 204 0 0 0 0 1459 BV 218 pi 24 0 0 0 0 1456 264 199 23 2.52 11.6 1 - 8 Ayrshire p.t.a 1437 264 201 1 1 0.50 1 Chikeya p.t.a. 1372 266 221 134 13.30 60.60 1 -79 Hunyani p.e. Estates
p.t. :post infection p.t.a. :post tick application p.e. :post exposure B.V. :Bally Vaughan
139

Table 5.5 Prevalence of infections in adult R. appendiculatus ticks that fed as nymphae on Theileria-infected cattle. Batch Ill. Calf No: Day Number of Number of Mean No. Prevalence Range of Parasite p.l. ticks ticks of infected of Number of
dissected infected aclDl per Infection infected acini tick % per tick
(min-max) W70 Boleni 305 200 0 0 0 0
p.i. W73 Boleni 305 144 0 0 0 0
p.i. W74Boleni 305 145 0 0 0 0
p.i. W75Boleni 305 190 0 0 0 0
p.i. 1442 A very 305 137 0 0 0 0
p.i. 1454 A very 305p.i 137 0 0 0 0
1459 BV 305 76 0 0 0 0 p.l.
1447B V 305 All ticks 0 0 0 0 p.l. dead nd
1456 348 127 13 2.08 10.24 1- 8 Ayrshire p.t.a Farm 1372 350 353 ~6 4.74 27.20 1- 33 Hunyani p.e. Estates ..__ nd :notdone p.1. :post infection p.t.a :post tick application p.e. :post exposure B. V. :Sally Vaughan
140

Table 5.6 Prevalence of infections in adult R. appendiculatus ticks that fed as nymphae on Theileria-infected cattle. Batch IV:
Calf No. Day p.i. Number of Number of Mean no. Prevalence Range Parasite ticks Ticks of infected of Number
dissected infected ac1ru per infection infected tick % actru
tick
of of
per
(min-max W70 456 134 0 0 0 0 Boleni W73 456 124 0 0 0 0 Boleni W74 Died 0 Boleni 11112/95 W75 Died 0 Boleni 26/09/95 1442 456 23 0 0 0 A very 1459 456 231 0 0 0 0 B. V. 1447 456 228 0 0 0 0 BV. 1456 499 p.t.a. 185 23 2.52 11.6 1 - 2 Ayrshire Farm 1372 501 220 81 4.32 37.82 1-34 Hunyani post Estates exposure exposure
B.V. :Bally Vaughan nd :not done p.1. :post infection p.t.a. :post tick application
141

Table 5.7 Prevalence of infections in adult R. appendicu/atus ticks that fed as nymphae on Theileria-infected cattle. Hunyani Estates 2nd exposure Batch V: Calf No. Day post Number of Number Mean no: of Prevalence Range of
exposure ticks of ticks infected acini of Number of dissected infected per tick Infection% infected
actru per tick (min-max)
El 137 233 44 3.48 18.88 1-22 E4 137 218 27 1.78 12.39 1 -4 E5 137 136 123 8.12 90.44 1-43
142

CHAPTER SIX
IF A titres of anti-schizont antibodies in relation to T. parva carrier state
6.1 Introduction
Serological investigations using T. parva macroschizont antigens can be used
to detect previous exposure to Theileria parasites, but are not considered to provide
an accurate indicator of carrier state. The IF AT can be used to monitor experimental
infections even though with a few drawbacks. A Theileriosis serological survey in
1986 revealed that between 20 to 70% of adult cattle in the commercial farms and
50% of calves in the communal areas under 4 months of age were seropositive using
the IF AT (Koch et al., 1986), showing the presence of reactors in areas where no
outbreaks have been reported thus indicating the limitations of the test specificity and
sensitivity. The causes of this were not understood, although it was suggested that
enzootic stability may be widespread and that mild strains causing inapparent
infections may occur. The movement of carrier recovered animals from theileriosis
outbreaks at cattle sales to areas infested with the tick vector has also been suggested
as an explanation for the high anti-schizont antibody titres in areas which have not
reported outbreaks. The diagnostic method used to detect the Theileria parasites
during the acute phase of infections by microscopic examination is not reliable post
recovery since the piroplasms appear intermittently and schizonts are not detectable
as described in previous chapters. With the current wide scale use of Bolvac ®
vaccine there is a need to validate the IF AT and relatively new tests such as the
ELISA which are currently being developed for Theileria parasites (Wright et al.,
1993). This may assist in the detection of mild Theileria species which cause
143

seroconversions similar to T. parva. The IF AT can be used for the detection of
antibodies indicating previous exposure to infection. In Zimbabwe the interpretation
of the IF AT has always been found wanting in its specificity in the detection of T.
parva parasite carriers when exporting animals or in the selection of properties for
immunisation against theileriosis. The test is also used routinely for selecting
animals for experimental purposes and for export to countries which do not accept
animals with evidence of antibodies for Theileria.
In the previous chapters the reactions of experimental calves to T. parva
infection and challenge and their carrier state were discussed. In this chapter, the
serological response of the same calves pre- and post-infection and post-challenge
will be described using IF AT with macroschizont antigen of the Zimbabwean, Berea
stock of T. parva. The preference of schizont antigen over the piroplasm antigen in
the IF A test results from the work of Burridge and Kimber (1973). In their studies a
significant antibody titre to T. parva cell culture schizont antigen was demonstrated
for between 12 and 73 weeks after infection in the sera of 3 5 cattle recovered from
experimental East Coast Fever.
The aim of this chapter is to determine the distribution of titres of calves from
a T. parva free p~operty and to determine the optimum cut-off titre for use in the
IF AT for the identification of carrier animals post-recovery from T. parva infection.
6.2 Materials and Methods
The indirect fluorescent antibody test was used to determine levels of antibodies
against macroschizont antigen in sera of calves before and after infection with
Theileria parasites.
144

6.2.1 T. parva Berea macroschizont antigen preparation
A vial of 1.8 ml T parva Berea (Passage 52) lymhoblastoid cells stored in liquid
nitrogen was thawed in a water bath at 37°C and the cell suspension was resuspended
in 1 0 ml of L 15 Leibovitz medium without foetal calf serum and centrifuged at 200
xg at room temperature. After the second wash the lymphoblastoid cell pellet was
resuspended in sterile Gibco -LIS with L-glutamine medium with 10% foetal calf
serum (Gibco) at a pH of 7.2 in a 25 cm2 culture flasks (Flow Laboratories) The
medium also contained 100 iulml of penicillin and 1 OOflg/ml of streptomycin
(Sigma) added under aseptic conditions (this medium requires no atmospheric carbon
dioxide since it has a bicarbonate-free buffering system). The culture was maintained
at 37°C incubator and was subcultured every 48 hours until there was at least 500 ml
containing 1 0 x 1 06 cells per ml on harvesting. For specific counts of viable cells, an
aliquot of cell suspension was diluted in 0.2% Trypan blue prepared in PBS and
counted using a haemocytometer. An aliquot of cells was centrifuged in a Shandon
cytospin and Giemsa stained to establish the number of infected cells. The antigen
was prepared from cultures exhibiting a cell viability greater than 85% and an
infection rate of at least 85% as detailed in the next section.
6.2.2 Preparation of formalin-:-fiXed Theileria macroschizont antigen slides
T parva Berea infected lymphoblastoid cells were used when the culture was in log
phase of cell growth. The cell suspension was centrifuged at 200 xg for 10 minutes
at 4 oc and resuspended in chilled sterile PBS pH 7 .2. Sterile tubes were used to
separate the cell suspension (viable from dead) through a Ficoll-Paque (Pharmacia)
gradient solution spinning at 400 xg for 30 minutes at 4°C with the ratio of 4.5 ml
145
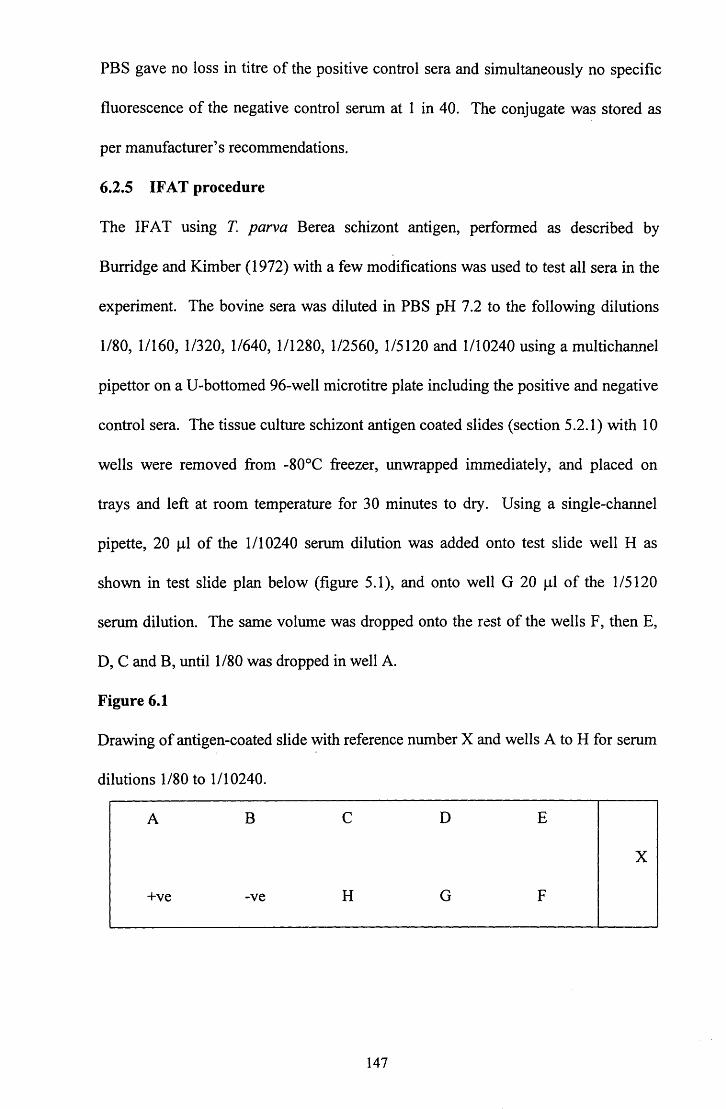
PBS gave no loss in titre of the positive control sera and simultaneously no specific
fluorescence of the negative control serum at 1 in 40. The conjugate was stored as
per manufacturer's recommendations.
6.2.5 IF AT procedure
The IF AT using T parva Berea schizont antigen, performed as described by
Burridge and Kimber (1972) with a few modifications was used to test all sera in the
experiment. The bovine sera was diluted in PBS pH 7.2 to the following dilutions
1/80, 11160, 1/320, 1/640, 1/1280, 1/2560, 1/5120 and 1/10240 using a multichannel
pipettor on a U-bottomed 96-well microtitre plate including the positive and negative
control sera. The tissue culture schizont antigen coated slides (section 5 .2.1) with 1 0
wells were removed from -80°C freezer, unwrapped immediately, and placed on
trays and left at room temperature for 30 minutes to dry. Using a single-channel
pipette, 20 J.Ll of the 1/10240 serum dilution was added onto test slide well H as
shown in test slide plan below (figure 5.1 ), and onto well G 20 J.Ll of the 115120
serum dilution. The same volume was dropped onto the rest of the wells F, then E,
D, C and B, untill/80 was dropped in well A.
Figure 6.1
Drawing of antigen-coated slide with reference number X and wells A to H for serum
dilutions 1180 to 1/10240.
A B c D E
X
+ve -ve H G F
147

After having proceeded in the same way with the rest of the antigen slides so that
each serum was placed on one slide, known positive and negative control sera (that
were serially diluted) were also placed on two slides with 20 J.!l in each well. The
negative and positive control sera were added last on the test slides at I :80 dilutions,
in wells "-ve" and "+ve" at as indicated (figure 6.1) in 20 J.!l volumes, followed by
incubation in a wet chamber at room temperature for 1 hour. After incubation the
cold PBS was rinsed off each slide well using a wash-bottle and placed in a staining
jar with cold PBS pH 7.2 and washed twice for 15 minutes with gentle agitation.
Fifty microlitres of conjugate at a dilution of 1 in 60 in PBS containing Evans Blue
(Sigma) at a final concentration of 0.1% (v/v) as a counterstain was added after
draining excess PBS ensuring that each well was completely covered and incubated
in a moist wet chamber for 30 minutes. The slides were washed twice again as in the
above in cold PBS, excess PBS drained off and mounted in 50% glycerol with a 22 x
40 mm coverslip. Slides were examined for fluorescence using a x50 oil immersion
objective using an ultraviolet incident light fluorescent microscope (Leitz). The
degree of fluorescence was recorded as follows:
+ strong fluorescence (positive reaction)
+I- weak positive
no fluorescence negative reaction)
This routine method is used at the Veterinary Research laboratories Harare -
Protozoology section and has used on the FAO Theileriosis project studies on the
Control of Tick and Tick-borne diseases.
148
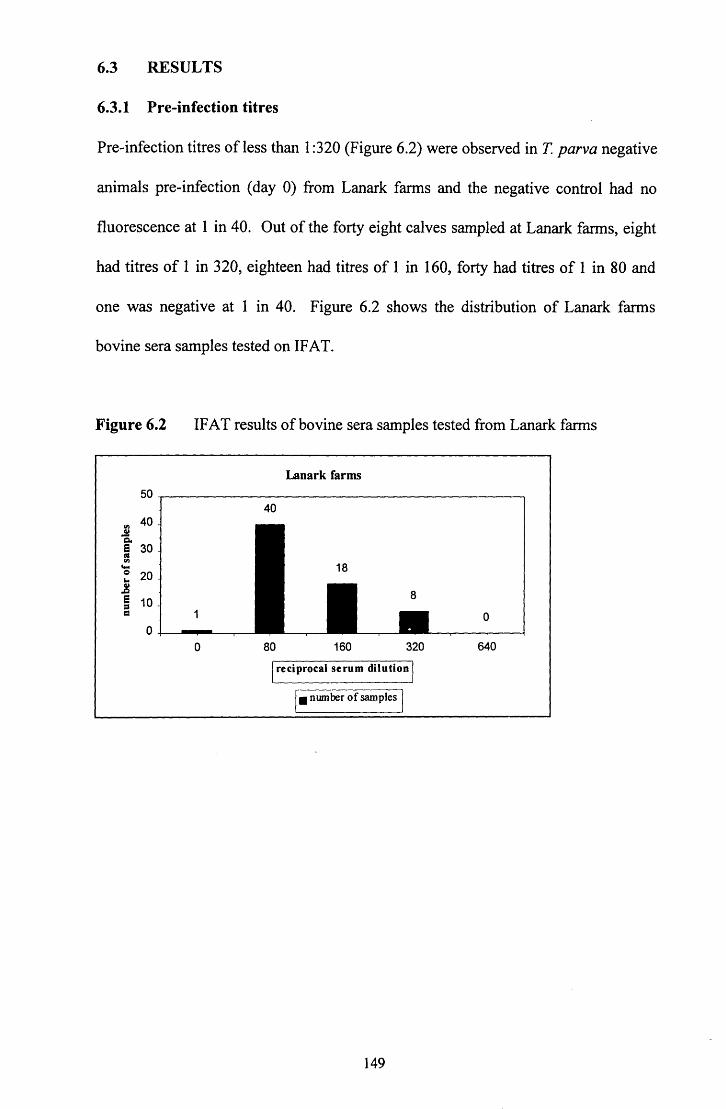
6.3 RESULTS
6.3.1 Pre-infection titres
Pre-infection titres of less than 1 :320 (Figure 6.2) were observed in T. parva negative
animals pre-infection (day 0) from Lanark farms and the negative control had no
fluorescence at 1 in 40. Out of the forty eight calves sampled at Lanark farms, eight
had titres of 1 in 320, eighteen had titres of 1 in 160, forty had titres of I in 80 and
one was negative at 1 in 40. Figure 6.2 shows the distribution of Lanark farms
bovine sera samples tested on IFAT.
Figure 6.2
50
Ill 40 " c. e 30 (11 Ill
'-Q 20 "' " ~ e 10 = c
0
IF AT results of bovine sera samples tested from Lanark farms
0
Lanark farms
40
80 160 320
j reciprocal serum dilution I
I• number of samples j
149
0
640

Figure 6.3 IF AT results for samples tested post infection
IFAT results post infections
140 124 120.
~
Q. 100 e ~ 80 fll .... 0
60 ... ~ .c
40 e = c: 20
0 80 160 320 640 1280 2560 5120 1 0240
Reciprocal serum dilutions
/• Number of samples j
6.3.2 Post infection titres
During the 19 months post infection the antibody titres were not maintainedand were
not constant as shown in Figure 6.6, 6.7 and 6.8. Figure 6.3 shows the distribution of
ani-schizont antibody titres in the experomental animals post infection. Table 6.1
shows the sensitivity and specificity of the IF AT test of the post infection results in
the experimental animals. Of the 410 occasions when the 15 animals were tested, 6
were positive at 1:80, 53 positive at 1:160, 125 positive at 1:320, and 307 had titres
equal to or greater than 1 :640. The serological titres post infection are summarised in
Figure 6.3, and the sensitivity and specificity of 64.63% and 100% respectively was
achieved at a cut-off titre of 1 :640 (Table 6.1 ). Details of indirect fluorescent test
results are shown in Appendix V.
The sensitivity of a diagnostic method is the proportion of true positives that are
detected by the method; and the specificity of the method is the proportion of true
negatives that are detected (Thrusfield, 1995).
150

Using the IF AT results pre- and post-infection with T parva parasites (Figure 6.2
and 6.3) the sensitivity and specificity of the IF AT were calculated as shown in Table
6.1 (Thrusfield, 1995).
Table 6.1 Sensitivity and specificity of Indirect fluorescent antibody test for T parva macroschizont antibodies to different=/- cut-off titres.
Cut -off titre (+ye) 1:80 1:160 1:320 1:640 1:1280 1:2560 1:5120 1:10240
SENSITIVITY (%) 100 98.54 90.49 64.63 34.39 14.88 6.10 0.98
6.3.3 Serological reactions to initial T. parva infection
SPECIFICITY (%) 61.19 88.06 100 100 100 100 100 100
An animal with an antibody titre of ~ 1 :320 was considered to be serologically
negative to T parva prior to infection. On day 40 after infection, tick application or
field tick exposure all the infected calves were serologically positive.
During the period of 19 months post infection the calves were monitored
under tick-proof conditions, the group I calves maintained anti-schizont antibody
levels of between 1:160 and 1:5120 as shown in Figure 6.4. The reciprocal serum
dilutions for the bovine sera are detailed in Appendix V.
Group 11 calves infected with T. parva A very maintained anti-schizont
antibody titre of between 1: 160 and 1: 10240 during the 19 months post infection.
However, one of the calves (calf 1442) which did not show a Theileria clinical
reaction had a titre of 1: 10240 on day 88 post infection only, and for the rest of the
151

experiment had a maximum of 1: 640 until challenged. Antibody titres to the
schizont antigen for group II calves are shown in Figure 6.5 and details for the
reciprocal antibody titres are detailed in Appendix V.
The group Ill calves had a four-fold increase in antibody titres 40 days post
infection and through the 19 months ranged from 1: 160 and 1 :2560, and calf 144 7
had a antibody titre of 5120 on 249 post infection. The antibody titres for the calves
are shown in Figure 6.6 and the reciprocal serum dilutions which were positive in the
IF AT are detailed in Appendix V.
Calves 1456 and 1437 which had infected ticks applied had antibody levels ranging
from 1 :80 and 1 0240 during the period before challenge. Calf 14 3 7 which had a
Theileria infection from Chikeya farm ticks had a four-fold rise in antibody titre 40
days post infection (Figure 6.7).
The calf (1372) exposed at Hunyani maintained a range of 1:320 to 1:10240
through the 22 months post infection. A four-fold rise in antibodies to T parva
macroschizont antigen at 40 days post exposure was noted, and the titres were below
the cut-off point on some occasions tested (Figure 6.8) The second group of calves
exposed at Hunyani estates which also had buparvaquone treatment had titres ranging
between 1:320 and 1:2560. The serological response is shown in Figure 6.9 and
details of the reciprocal serum dilutions are in Appendix V.
6.3.4 Serological reaction to T. parva A very challenge
Seven animals with pre-challenge antibody titres to T parva Berea schizont antigen
of 1:320 and less showed no clinical reaction to T. parva A very challenge although
microscopic examination of blood smears showed (Table 3 .8) piroplasms of less than
152
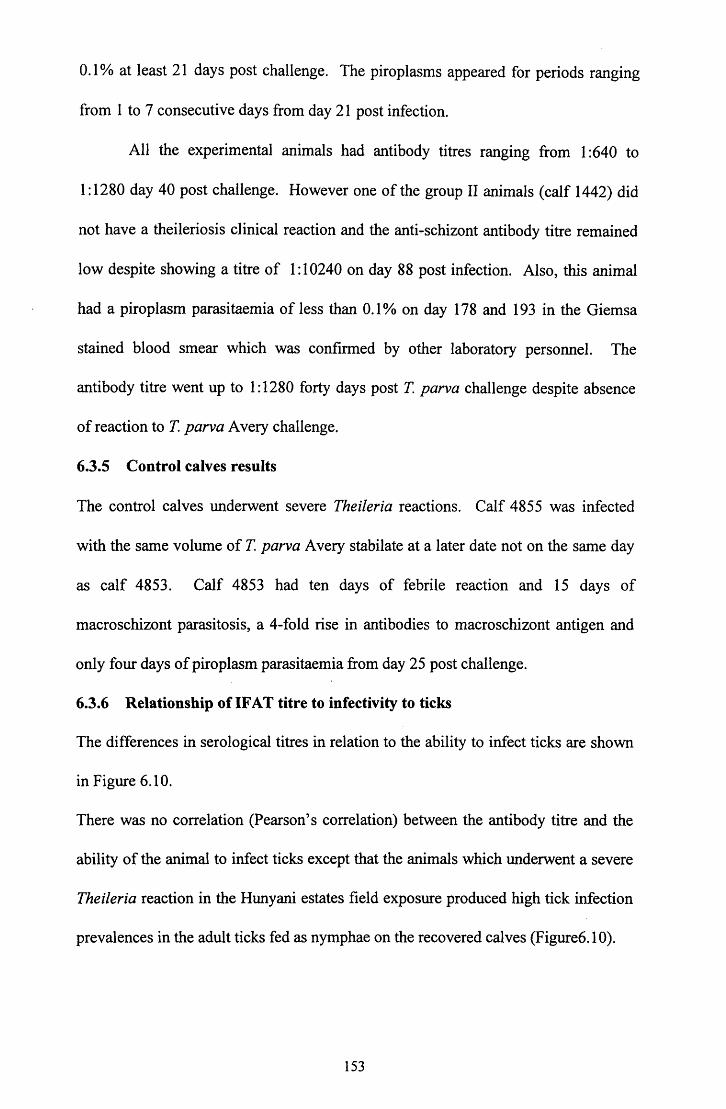
0.1% at least 21 days post challenge. The piroplasms appeared for periods ranging
from 1 to 7 consecutive days from day 21 post infection.
All the experimental animals had antibody titres ranging from 1 :640 to
1 : 1280 day 40 post challenge. However one of the group II animals (calf 1442) did
not have a theileriosis clinical reaction and the anti-schizont antibody titre remained
low despite showing a titre of 1: 10240 on day 88 post infection. Also, this animal
had a piroplasm parasitaemia of less than 0.1% on day 178 and 193 in the Giemsa
stained blood smear which was confirmed by other laboratory personnel. The
antibody titre went up to 1:1280 forty days post T. parva challenge despite absence
of reaction to T. parva A very challenge.
6.3.5 Control calves results
The control calves underwent severe Theileria reactions. Calf 4855 was infected
with the same volume of T. parva A very stabilate at a later date not on the same day
as calf 4853. Calf 4853 had ten days of febrile reaction and 15 days of
macroschizont parasitosis, a 4-fold rise in antibodies to macroschizont antigen and
only four days of piroplasm parasitaemia from day 25 post challenge.
6.3.6 Relationship of IF AT titre to infectivity to ticks
The differences in serological titres in relation to the ability to infect ticks are shown
in Figure 6.1 0.
There was no correlation (Pearson's correlation) between the antibody titre and the
ability of the animal to infect ticks except that the animals which underwent a severe
Theileria reaction in the Hunyani estates field exposure produced high tick infection
prevalences in the adult ticks fed as nymphae on the recovered calves (Figure6.1 0).
153

6.4 Discussion
The experimental animals seroconverted by day 40 post infection and the
antibody titres were between 1:640 and 1:2560 except for one calf (1442) which only
had a titre of 1 :320 but was immune on T. parva A very challenge. Antibody titres
started to decrease 100 days post infection for most of the animals and even went
below the positive cut-off titre of 1 :640 in the Boleni infected calves. The duration
of antibody responses to Theileria varies considerably and is dependent on numerous
factors such as variations in individual animals, and the carrier status (low levels of
schizont parasitosis). In the absence of re-challenge, schizont IF A antibodies have
been known to decline by six months after infection (Burridge and Kimber, 1973 ).
However, development of the carrier state may cause antibody levels to be
maintained for longer.
The examination of fluorescent stained cells in the IF AT make it a very
subjective test and in some cases very difficult to interpret. However in this
controlled experiment it was easy to do several repeats in order to confirm a sudden
lowering of titres and to confirm non-specific fluorescence. In this study antibodies
to macroschizonts started to wane at about 4 months post infection in all the groups
of experimental animals but the animals were still immune to challenge.
Calf W70 although exhibiting a negative antibody titre (1 :320) was immune to T.
parva A very at the time of challenge. Thus from the validation results, a 100%
sensitivity and 90.49o/o specificity of the IF AT at a cut-off titre of 1:320 would detect
this serum sample as from an animal previously exposed toT. parva.
154
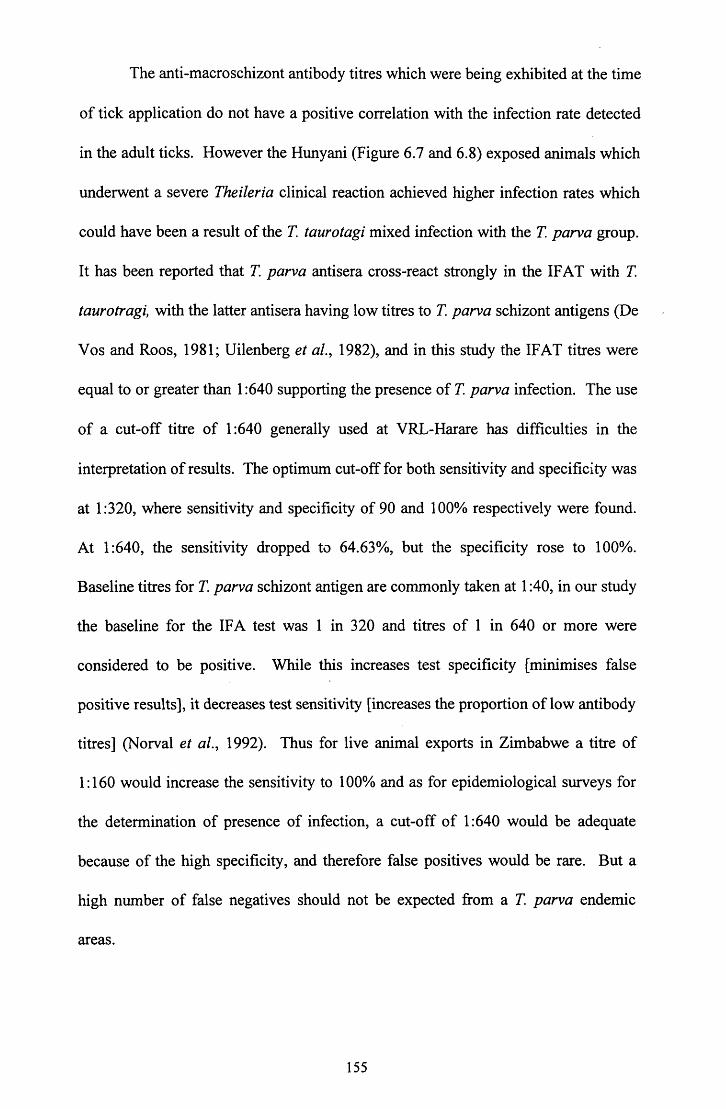
The anti-macroschizont antibody titres which were being exhibited at the time
of tick application do not have a positive correlation with the infection rate detected
in the adult ticks. However the Hunyani (Figure 6.7 and 6.8) exposed animals which
underwent a severe Theileria clinical reaction achieved higher infection rates which
could have been a result of the T taurotagi mixed infection with the T parva group.
It has been reported that T parva antisera cross-react strongly in the IF AT with T
taurotragi, with the latter antisera having low titres to T parva schizont antigens (De
V os and Roos, 1981; Uilenberg et al., 1982), and in this study the IF AT titres were
equal to or greater than 1 :640 supporting the presence of T parva infection. The use
of a cut-off titre of 1:640 generally used at VRL-Harare has difficulties in the
interpretation of results. The optimum cut-off for both sensitivity and specificity was
at 1:320, where sensitivity and specificity of 90 and 100% respectively were found.
At 1:640, the sensitivity dropped to 64.63%, but the specificity rose to 1 OOo/o.
Baseline titres for T parva schizont antigen are commonly taken at 1 :40, in our study
the baseline for the IFA test was 1 in 320 and titres of 1 in 640 or more were
considered to be positive. While this increases test specificity [minimises false
positive results], it decreases test sensitivity [increases the proportion of low antibody
titres] (Norval et al., 1992). Thus for live animal exports in Zimbabwe a titre of
1: 160 would increase the sensitivity to 100% and as for epidemiological surveys for
the determination of presence of infection, a cut-off of 1:640 would be adequate
because of the high specificity, and therefore false positives would be rare. But a
high number of false negatives should not be expected from a T parva endemic
areas.
155

In this case the severity of the initial reaction to T. parva infection was not
reflected in the anti-schizont antibody levels as demonstrated with the Hunyani
second exposure calves. The lack of correlation between the antibody titres and the
ability to infect ticks shows that the IF AT cannot be used as a tool for the
identification of T. parva carriers. Antibody titres have been known to fall to
insignificant levels in animals capable of transmitting infection to ticks (Mackenzie
and Lawrence, 1979).
The fluctuating antibody titres to schizont antigen have been reported before
(Mackenzie and Lawrence, 1979), and have been linked with the presence of
piroplasms as these are a result merozoites from schizont infected cells.
Direct and indirect fluorescent antibody techniques can also be used to detect
piroplasms and schizonts of Theileria in blood smears and tissue sections (Morrison
et al., 1981 ). It is likely that a new generation of tests for both antibody and antigen
detection will soon be available for the theileria/ diseases. Katende et al., (1990)
describes an ELISA test for T.mutans. Recent work in collaboration with ILRI
workers has shown the IF A test using the T. parva Berea schizont antigen to be as
sensitive as the ELISA test for T. parva when testing experimental animals in
Zimbabwe preinfection and 40 days post infection only (Katende, J. personal
communication).
156

Figure 6.4 T. parva anti-schizont antibody response to T parva Boleni infection
Group I JFAT results
10240 [-+- W70 --- W7~ ~W74 ~W75J
5120
2560
t:: 0 ·.a
..2 1280 -.o s 2 640 ~
~ 320 e
0. ·u d)
~ 160
80
0 60 95 165 235 305 375 456
Days post infect ion
Figure 6.5 T. parva anti-schizont antibody response to T parva A very infection
Group ll IFAT results
I-+- Tag 1454 ---- Tag 1442 1
10240
t:: 5120 0 ·.a ..2 2560 ~
E 1280 ~
Cil 640 e 0. 320 0 1\)
~ 160
80
0 60 95 165 235 305 375 456
Days post infection
157
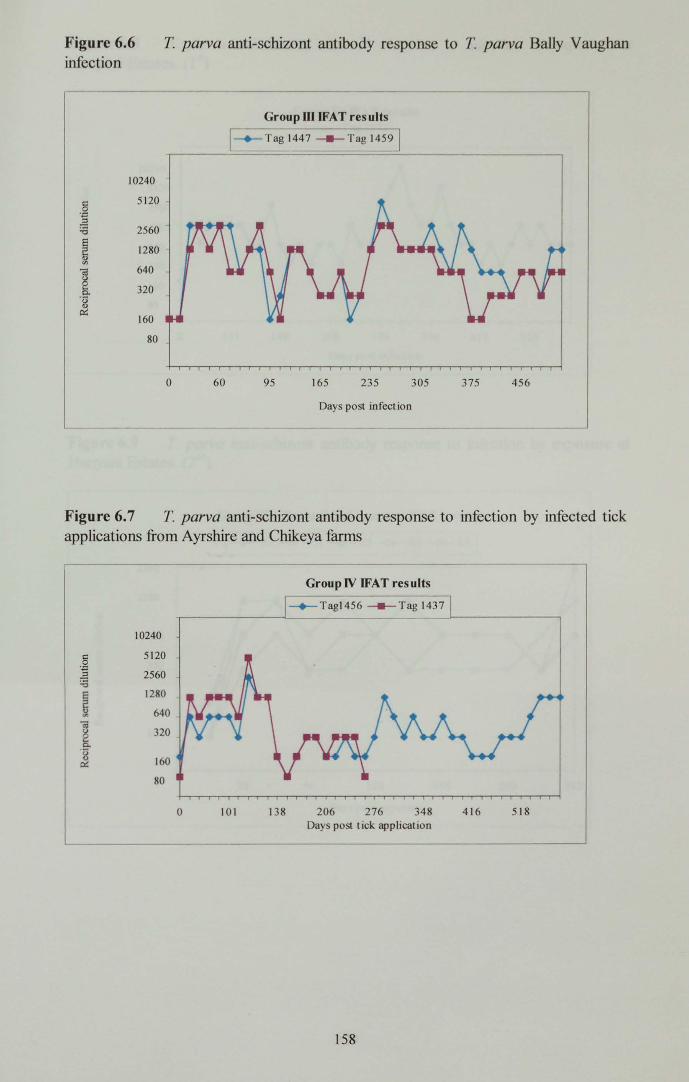
Figure 6.6 infection
T. parva anti-scruzont antibody response to T. parva Bally Vaughan
10240
t:: 5120 0 ·a ..2 :.a 2560 s
1280 ~ Cl)
""§ 640 0 ~ 320 0. ·o Cl)
~ 160
80
Group Ill IF AT results
[_ • Tag ~447 ~2:_ag~ ~---------- --------------------~
0 60 95 165 235 305 375 456
Days post infect ion
Figure 6. 7 T. parva anti-schizont antibody response to infection by infected tick applications from Ayrshire and Chlkeya farms
10240
5120
2560
1280
640
320
160
80
0 101 138
Group IV 1FAT results
-+- Tagl456 ---Tag 1437
206 276 348 Days post tick application
158
416 518

Figure 6.8 T. parva anti-shizont antibody response to infection by exposure at Hunyani Estates. ( 1 51
)
10240
5120
2560
1280
640
320
160
80
0 103 140
Grou_p V a IFAT results [-+-Tag 1372]
208 278
Days post infection
350 418 520
Figure 6.9 T. parva anti-schizont antibody response to infection by exposure at Hunyani Estates. (2nd)
2560
1280
t::: 0
·.p .2 640 :.0 E
~ 320
ea g 160 a ·u 0 ~
80
GroupVb- Huoyaoi 2nd exposure IFAT results
1-+- E 1 --- E2 --.-- £3 ---)(-- £4 ___._ E5 I
28 56 128 158
Day post expo ure
159
203 243

Figure 6.10: Relationship between tick infection rates and T. parva anti-schizont antibody titres
100
(/) Q.l
~ 75 c 0
:u 50 ~ .£ .:Jt:. () 25 i=
</!. ... • I 0 .... 0 320
Tick infection rates versus IFAT titres
• • •
• • • t
640 960 1280 1600 1920 2240 2560 2880 3200 3520 3840 4160 4480 4800 5120
Reciprocal serum dilution
I• Tick infection rate ~
160

CHAPTER SEVEN
GENERAL DISCUSSION
In the previous chapters the responses of calves to infection and challenge, and the
detection of carrier status through use of different tests have been reported and
discussed.
Discussion of the fmdings follow:
T. parva infections and challenge
The T. parva Boleni infected calf at the CTVM had a severe Theileria reaction
compared to the calves infected with the same parasite stock at VRL-Harare and was
immune toT. parva Muguga (Kenya) sporozoite challenge. A mild clinical reaction
ensued (Table 3 .6), accompanied by a prolonged low level schizont parasitosis and a
maximum piroplasm parasitaemia of 0.6%. The animals in groups infected with
ground up tick stabilates, tick applications from Ayrshire and Chikeya farms
developed moderate Theileria reactions, while calves exposed to ticks at Hunyani
Estates had severe reactions and five animals were lo~~ due to theileriosis on the two
occasions. However the experimental animals (groups I-V; Table 3.8), were all
immune to T. parva A very challenge, irrespective of the initial severity of disease.
Group I calves infected with T. parva Boleni showed a marked difference from the
other groups in the number of days when piroplasms were detected under the
microscope at very low levels of less than 0.1% continuously between 22 and 35
days from day 13 post primary infection.
Although one calf (1442-group 11) which was inoculated with T. parva A very
stabilate did not show parasites during primary infection, it was T. parva positive
161

usisng the p 1 04 PCR assay during primary infection and post infection. Also calf
1459, T. parva Bally Vaughan infected did not show any Theileria reaction but
evidence of infection was confirmed by p 104 PCR during primary infection and later.
Although these calves did not show any Theileria reaction, calf 1456 had a four-fold
rise in the serum anti-schizont antibody titre and was immune to T. parva Avery
challenge. Since the use of live parasites has been successful in immunising against
ECF, the establishment of infection is a basic requirement for the induction of
protective responses (McKeever and Morrison, 1990) and their studies have also
revealed that protection is mediated by parasite specific cytotoxic T cells which are
restricted by class I major histocompatibility complex (MHC) products (Morrison et
al., 1995).
Following challenge with T. parva A very the six groups were solidly immune
522 days post infection, 566 days post tick application, 563 and 182 days post
exposure following the second Hunyani exposure. The T. parva Boleni infected calf
at the CTVM was immune to challenge with Muguga challenge 63 days post
infection, and two T. parva (Boleni) recovered animals at VRL-Harare were immune
to heterologous challenge 522 days post infection, irrespective of the presence of
initial macroschizont infection. However, considerable piroplasm parasitaemias were
evident in the animals after challenge with T. parva A very, an indication that the
challenge parasites were not completely blocked and there was a variation between
individual animals.
Although the Hunyani exposure calves underwent a severe clinical reaction
two of the calves (E4 and ES) developed macroschizonts on challenge with T. parva
162

A very and this was not evident in the other groups infected with laboratory ground
up-tick stabilates. It is considered that animals which recover spontaneously from
the disease are solidly immune to homologous challenge, and it has been shown that
this protection lasts for up to 3.5 years in the absence of challenge (Burridge et al.,
1972). In our study each group of animals irrespective of immunising stock, was
protected against T parva A very, and the reactions to challenge were not related to
the severity of initial reactions to infection. This finding is in agreement with Barnett
(1957) and Burridge et al (1972). The severity ofT parva Avery challenge was
demonstrated in the control calves 4853 and 4855, in which the later died 30 days
post infection. The A very stabilate has been known to be pathogenic even when used
at low doses (0.01 ml equivalent to 0.1 tick), (Koch, 1990).
The carrier state of these animals was assessed using Giemsa-stained blood smears to
detect the presence of piroplasms; PCR and Dot-blot hybridisation to detect the
presence of Theileria parva parasite DNA in any form (macroschizonts,
microschizonts or piroplasm); and the feeding of R. appendiculatus nymphs to pick
up infection. The establishment of infection in the experimental animals was
confirmed by the schizonts seen in the lymph node biopsy smears post infection.
Piroplasms were detected intermittently in all the calves during the period when they
showed clinical reactions and post recovery in Giemsa-stained blood smears.
Detection of carrier state by PCR
The sensitivity and specificity of the PCR was found to be high post-recovery in
comparison with the detection of piroplasms in Giemsa-stained blood smears. Of the
samples tested by PCR post infection 42.42% and 62.66% were positive in the PBM
163

phenol I chloroformed and EDT A blood saponin lysed extracts respectively; in
comparison 32.39o/o of blood smears were positive for Theileria piroplasms and 53%
of serum samples were considered to be positive at a titre of 1:640 (summary of
results shown in Appendix IV). In the samples from group I calves there was
moderate agreement (P = 0.0001) using the Kappa statistic between the PCR results
on the phenol chloroformed PBM and EDT A saponin lysed extracts. However, the
PCR results on EDT A saponin lysed extracts were not in agreement with the blood
smear microscopic examinations for the piroplasms as shown in summary of results
in Appendix IV. In comparisons of PCR on EDT A saponin lysed extracts and blood
smears, 82% were not in agreement with more positive results in the PCR assays.
The mode of action of buparvaquone as described by McHardy (1988) on T.
parva schizonts in cultured lymphoid cells demonstrated progressive vacuolation of
the cytoplasm as the principal lesion. This would explain why the development of
piroplasms in the treated calves undergoing a theileriosis reaction was not affected,
and it was evident in this study that the piroplasm parasitaemias were persistent in
the butalex treated calves.. Also studies by Dolan (1986a, 1986b) demonstrated a
high prevalence of carriers in cattle recovered after treatment with parvaquone
(Clexon, Pittman-Moore). The PCR assay was able to demonstrate persistent carrier
state after infection and recovery in all the different modes of infections even in
calves which did not show any Theileria clinical reactions.
However, because of the expense and technical expertise involved with the
PCR assays, the use of PCR can be used to confmn the presence of T. parva
infection after the examination of Giemsa stained blood smears and the IF AT as
164
these remain less expensive tests. As for cases involving import and exports of live
animals the PCR could be applied in order to avoid the spread of pathogenic strains.
There must be a definite risk associated with the introduction of cattle infected I
recovered from theileriosis strains such as were present on the Hunyani estate, as
these could transmit a lethal infection. This kind of situation has been suggested if
dipping is relaxed since ticks infected with the parasites from carrier animals can
transmit lethal infection (Maritim et al., 1989). The PCR assay could be used in such
circumstances to identify pathogenic strains.
Comparison of methods for carrier status detection
No significant difference was found between the preparation of samples positive by
PCR (EDT A blood) and positive microscopy. Statistical analysis comparing the
PCR positive EDT A bloods and positive microscopy results during the 19 months
post-infection showed no significant differences (McNemar test for correlated
proportions for individuals sampled twice). However, analysis of the pooled results
showed a significant difference (P = 0.01) at one degree, of freedom with the PCR
being more sensitive. A comparison between PCR results on phenol I chloroformed
peripheral blood mononuclear cell extracts and Giemsa-stained blood smears showed
no statistically significant difference (calves infected with ground-up-tick stabilates ).
Although the IF AT used in our study only detects anti-schizont antibodies, it
can be used as an indicator of previous infection. When IF AT positive antibody
titres (cut-off 1 :640) are compared with PCR positive results there was no significant
difference between the proportion of positive results with the two tests during the
period of 19 months post-infection. However, with the pooled data (for all
165

infections) there was significant difference (p = 0.05) [McNemar test] with the PCR
having a higher proportion of positives. There was no significant difference between
PCR and IF AT in the proportion of tests giving a positive result, when IF AT was
interpreted with a cut-off of 1 :320.
Thus the current cut-off titre of 1 :640 for T. parva schizont antibodies used at
the VRL is recommended in combination with a PCR assay for samples from
theileriosis areas in order to ascertain absence of previous infection. For areas which
practice strict tick control and known to be free of theileriosis a cut off of 1:320
would be ideal in screening animals for previous infection using the IF AT.
These results have demonstrated that the conventional methods of Theileria
parasite detection can be used to determine previous exposure to the parasite in
combination with the specific PCR. The latter is important in distinguishing T.
parva from T. taurotragi infections. The Indirect Fluorescent Antibody test for anti
schizont antibodies can be used to determine previous exposure to T. parva and a
comparison with the ELISA test (J. Katende- ILRI, Nairobi, personal
communications) has shown a high degree of correlation between the two. The
sensitivity and specificity of the p67 and p 104 PCR assays was found to be high post
recovery compared to the detection of piroplasms in Giemsa-stained blood smears.
However the problem arises when there are mixed infections with T. taurotragi in
field situations.
Detection of carrier state by tick application
In this study 2 T. parva (Avery) and 2 buffalo-derived T. parva (Bally Vaughan)
infected calves failed to transmit T. parva to ticks although parasites were detected in
166

these cattle by PCR amplification. This could be due to failure of the ticks to either
pick up the parasite; or alternatively, the parasites may not have been available for
pick up at the time of tick application, as intermittent transmission has been
demonstrated (Dolan, 1986). However, the Hunyani Estates calf which survived the
first exposure was able to infect ticks applied on days 140, 266, 350 and 501 post
exposure. It was also possible to achieve tick infections with Chikeya farm parasite
infected calves on days 138, and 264 post tick application and 264, 348 and 499 days
for the calf infected with ticks from Ayrshire farms. Out of a total of 42 tick
applications (including the group II and Ill animals) on all the experimental animals
43% were positive post recovery from infection. All the animals infected with field
parasites, that is Hunyani Estates, Chikeya and Ayrshire parasites infected the R.
appendiculatus ticks (12 tick applications) and the Boleni had 6 out of 14 tick
applications positive, also post recovery from infection.
To compare PCR assay with the detection of the parasite in the ticks would be
difficult because repeated tick feeds in the recovered animals were not very
successful due to poor feeding as the cattle became sensitised to R. appendiculatus.
Acquired resistance to ixodid ticks has been recognised as a possible biological
control method (Treger, 1939). The acquired immunity is expressed as a reduction in
the number of ticks which attach to the host, a reduced engorgement weight, a
reduction of viability and capacity to moult and a reduced egg and larval production,
resulting in a significantly reduced tick population (Willadsen, 1980). Ideally to
determine if the Boleni-infected cattle were infective to ticks for a long time, they
must be left naive to ticks for a longer time after infection with a stabilate before
167

applying clean nymphs to be dissected at the next instar. As demonstrated on the
third and fourth tick feeds efforts to feed nymphal ticks on the animals were not
successful hence the negative results in the adult tick dissections of the ticks which
fed on the two T. parva Boleni infected cattle. In contrast, Theileria infections were
detected in the calf which recovered from the Ayrshire tick application and the
Hunyani-exposed survivor.
Ochanda (1994) considered that there was an overriding factor in "days post
infection" that determines the prevalence of infection in ticks irrespective of the
individual bovine host. The possibilities were advanced that the age of the piroplasm
could be an important factor in determining infection levels developing in the ticks,
or that piroplasms themselves were not infective agent to the tick. However, we
noted that carriers following field exposure and infection were infective to the tick
499 days post application of ticks, and 501 days post exposure to field ticks although
the latter was considered to be a mixed infection. The T. parva Boleni infected
animals were to the contrary not infective on I after day 305 post infection. The
concern of Zimbabwean farmers that Boleni immunised cattle are carriers was
supported, but long term carriage (> 12 months) was not found to occur in the two
calves (W70 and W73) and this could be due to the hypersensitive reactions induced
by the tick feeds. Although Boleni immunised animals may not have long term
infectivity to ticks the carrier status with field Theileria parasites could pose a
problem if the Theileria recovered animals are moved to other properties where the
tick vector is present. Parasite survival was explained by Neitz, (1957); transovarial
transmission does not occur in T. parva and adult ticks cleanse themselves while
168

feeding, thus it is the recovered animals which will maintain the parasite for onward
transmission to the tick vector. It has been demonstrated that T parva can survive
for nearly two years under field conditions in Kenya, virtually the same survival
period as that of the tick itself (Newson et al., 1984; Young et al, 1983), but this
period is likely to be shorter at lower, warmer altitudes like in Zimbabwe which has a
lower altitude and further emphasises the important role played by ticks in the
survival of the parasite. However further studies on the behaviour of T parva
Boleni-carrier status are necessary to determine the period when the host is infective
to the tick as this plays a major role in maintaining enzootic stability when nymphs
feed in the subsequent dry season (Koch et al., 1992). Although there was no
correlation between the tick infections and anti-schizont antibody titre, high tick
infection rates occurred when ticks were fed on the calves with titres of <1 :640,
currently considered sero-negative for T. parva.
Serology for detection of carrier status
Antibody responses of the studied animals to infection md challenge were monitored
by the IF AT using macro schizont antigen as a conventional test. Although the test is
considered to be unreliable for the detection of carrier animals, (Mackenzie and
Lawrence, 1979) its reliability was enhanced when used in combination with the
PCR. The IF AT revealed that all the experimental animals might not maintain the
antibody titres achieved at 40 days post infection; in some cases the titres were
negative during the period between recovery and challenge. Due to the development
of a carrier status the anti-schizont antibody titres were expected to be maintained for
longer, however in this study one T parva Boleni recovered and a Hunyani
169
recovered animal did not show titres indicative of previous exposure to theileriosis
and yet were immune to T. parva A very challenge. In 3 of the Boleni immunised
animals, T. parva A very, and Bally Vaughan infected animals significant schizont
antibody titres were maintained up to approximately 14 weeks. The results on the
duration of significant antibody titres in this study are similar to reports by Burridge
and Kimber (1972) who found that significant schizont antibody titres in sera from 5
ECF recovered animals were maintained for 14 weeks, and in 3 animals after 26
weeks using the IF AT.
Calf 1442 (group 11) did not have a Theileria reaction but was solidly immune on
challenge possibly due to very low levels of parasites which were not detectable by
microscopy. The macro schizont IF AT results showed a relatively similar pattern in
all calves except for calf 1442, in Group 11 infected with T.parva A very.
The severity of the clinical reactions did not match the antibody titres in the
different groups although all calves sera-converted after primary infection, exhibiting
anti -macro schizont antibodies.
We demonstrated that the application of infected R. appendiculatus ticks
from Chikeya and Ayrshire farms, and the exposure of susceptible calves to field
ticks at Hunyani Estates produced a higher level of infection than the injection of
ground-up tick stabilates. Comparison of the theileriosis reactions experienced
during the infection, and exposure to tick infections and field exposure, revealed a
great variation in the degree of virulence of the various Theileria infections studied.
One complication of the study was tick toxicosis observed on Hunyani Estates due to
the high tick burdens seen subsequently on calves on the second exposure
170
experiment. The occurrence of Theileria parasites which are highly infective to the
vector-tick population is a major factor in the spread of pathogenic theileriosis in
Zimbabwe as demonstrated by the 5 out of 9 calves lost on exposure at Hunyani
Estates. On these farms, the mixed infection of T parva and T taurotragi was highly
infective to the laboratory tick colony, unfortunately it was not possible in this study
to fully characterise these parasites. Theileriosis cases that differed from the usual
ECF in a variety of ways have been encountered before the eradication of East Coast
Fever (ECF) from Zimbabwe in 1954. Among the differences noted were the
scarcity of schizonts and rarity of intraerythrocytic piroplasms. Outbreaks of
theilerosis seen at present in Zimbabwe are caused by Theileria parva which is either
cattle derived or buffalo derived, and in contrast to ECF cause less severe clinical
reactions. T taurotragi has been isolated in Zimbabwe (Lawrence and Mackenzie,
1980; Uilenberg, et al., 1982) and is known to show some cross reaction with the T
parva group on the IF AT (de V os and Roos., 1981; Uilenberg et al., 1982;. Barnet,
1957). On characterisation ofT. parva isolates from Zimbabwe Koch (1990), three
batches of adult ticks had mean numbers of infected acini of 5.3, 24.4 and 5.4 per
tick for the batches fed as nymphs on sick animals exposed for two weeks at
Willsbridge Farm. In our study mean numbers of infected acini of 5.66, 13.3, 4.7
and 4.32 per tick were observed day 140, 266, 350 and 501 days post exposure at
Hunyani Estates when the animal was not undergoing a clinical reaction.
Furthermore, high tick infection rates were demonstrated in 3 calves exposed at
Hunyani Estates a year later after nymphs had been applied on the recovered calves
137 days post exposure. Koch (1990) attributed the high infection rate of the R.
171

appendiculatus ticks to mixed infection with T. taurotragi, a common species in
Zimbabwe (Lawrence and Mackenzie, 1980; Uilenberg et al., 1982), which is
capable of causing high infection rates in ticks (Young et al., 1980).
In our study the Bally Vaughan tick stabilate produced a moderate Theileria
reaction. T. parva derived from buffalo is highly infective to cattle causing a severe
disease with high mortality characterised by low numbers of schizonts infected cells
and low piroplasm parasitaemias (Neitz., 1955; 1957; Barnett and Brocklesby .,
1966; Young et al., 1973). In Kenya and Tanzania cattle which were infected with
buffalo-derived T. parva and which survived and became carriers provided a source
ofT. parva to ticks for subsequent transmission to cattle (Maritim et al., 1989a, b).
In contrast, in our study the two calves infected with T. parva Bally Vaughan were
not able to transmit infection to nymphs of R. appendiculatus on all four occasions
post recovery.
Although the application of R. appendiculatus nymphae to pick up Theileria
infections and adult tick dissections is very laborious, cmTently there are no other
methods of determining infection-rates in the tick. It is the ideal method for
confirming the carrier animals are transmitting viable piroplasm to complete the life
cycle of T. parva in the ticks, and it also provides a quantitative estimate of infection
rate. The polymerase chain reaction is now used for finding the infection prevalence
of vectors with pathogens of livestock [Anaplasmosis] and human diseases [Chaga's
disease ](Stiller, 1990; Steindel, et al., 1993). The Boleni-infected animals appeared
to have a relatively low risk of transmitting the disease to ticks due to the very low
parasitaemias which they exhibited, the inability to infect ticks 305 days post
172

infection and the very low tick infection rates achieved on the two occasions the ticks
were Theileria infected after having fed as nymphs on the recovered animals.
Although tick numbers were low due to poor tick feeding and low piroplasms
parasitaemias were not observed by microscopic examination of Giemsa-stained
blood smears; these factors could be a disadvantage for the Bolvac ® vaccine against
theileriosis as the presence of carriers is considered to maintain tick infection, which
acts to boost vaccinal immunity when the cattle are challenged (Norval et al., 1992;
Koch, 1990). However, field parasites which produce severe theileriosis could pose
a problem for the cattle farmers and to the Veterinary Department in the event of
Theileria outbreaks if there is a breakdown in dipping or disease breakthroughs.
Thus there is a need to constantly monitor theileriosis outbreaks and more important
develop techniques to differentiate between T. parva Boleni (Bolvac ®) and field
infections as available monoclonal antibodies do not distinguish Zimbabwean T.
parva isolates (Koch et al., 1988).
Bovine T. taurotragi has always been described as a mild strain in Southern
Africa (Uilenberg et al., 1982). T. taurotragi may be to some extent related to T.
parva considering their partial serological relationship, their transmission by the
same vector and the morphological similarity of the macroschizonts. Their
differences are immunological (absence of cross-immunity), serological (partial),
differences in the infection rate in the vector and in the developmental cycle in the
tick (Young et al., 1980), morphological (more rod- and comma-shaped piroplasms
in T parva) as well as differences in the infectivity for the eland. However, in our
study the T. taurotragi I ?T. parva mixed infection was pathogenic to cattle and
173

could be maintained in cattle producing high tick infection rates in adult R.
appendiculatus ticks. This could pose a dangerous situation to farmers who might
purchase animals from a property like Hunyani Estates and may not practice strict
tick control. The infected acini though were not morphologically different from T
parva as described by Young et al (1980), were similar to the results of Fawcett et al.
(1985) in the estimations of the number of sporozoites suggesting T parva infection
in the ticks. Further characterisation of the Theileria parasite at Hunyani Estates is of
interest in order to investigate the possibility that cattle-pathogenic T taurotragi,
parasites capable of onward transmission in cattle exist on this Estate.
It was not possible to conclusively show that the Hunyani theileriosis was T.
taurotragi or T. parva on parasitological, clinical and serological grounds. Although
the monoclonal antibody profile showed a T. taurotragi profile, the recovered
animals were positive on the T. parva PCR assay which is specific for T parva and
does not amplify T. taurotragi. A tick stabilate prepared from ticks fed on animals
recovered from the second Hunyani exposure was negative on the PCR. Since T.
parva and T. taurotragi are transmitted by the same vector and presence of wild
ungulates at Hunyani, a mixed infection cannot be discounted. R. appendiculatus
adults fed as nymphs on eland (Taurotragus oryx) can achieve 100% infection rates
(Young et al., 1980), and in tick batches fed on T. parva carrier buffalo can vary
from 1 Oo/o to 70% (Grootenhuis et al., (1987). In this study high infection rates
(12.39% to 90.44o/o) were observed 137 days post exposure at Hunyani Estates.
The possibility of detection and subsequent removal, or restriction of movement, of
carrier animals in the hope of eradicating theileriosis in Zimbabwe, as originally
174
suggested by Mackenzie and Lawrence ( 1979), has proved to be an impossible goal
to achieve, thus the Zimbabwe Veterinary Department has taken up immunisation
using the live Bolvac ®vaccine in order to control theileriosis on endemic properties.
Conclusions
1. The indirect fluorescent antibody test should be retained, in combination with
PCR; at a titre of 1 :640 the IF AT is 100% specific, but with a sensitivity of 64.63%.
Therefore the specific PCR should be used on IF AT negative animals from endemic
areas.
2. Animals exposed to T. parva infection remained carriers for duration of the
experiment, irrespective of initial severity.
3. Cattle immunised with the Boleni strain were shown to carry infection to 493
days post infection by PCR assay using p104 primers, but Theileria transmission to
ticks was at extremely low frequency. The study suggests Bolvac ® immunised
calves can be considered to carry infection transmissible to vector ticks up to 218
post infection in the absence of challenge.
4. The carrier status for pathogenic T. parva, in Bolvac ® immunised animals
after virulent challenge was not determined, and therefore the risk of transmission by
immunised, field exposed cattle must be considered.
5. A highly pathogenic T parva infection was present at one property, which
resulted in high transmission rate to ticks. R. appendiculatus nymphs fed on
recovered anima! kept under tick-free conditions were infected at 500 days after the
bovine host had been infected and recovered and had high tick infection rates when
175
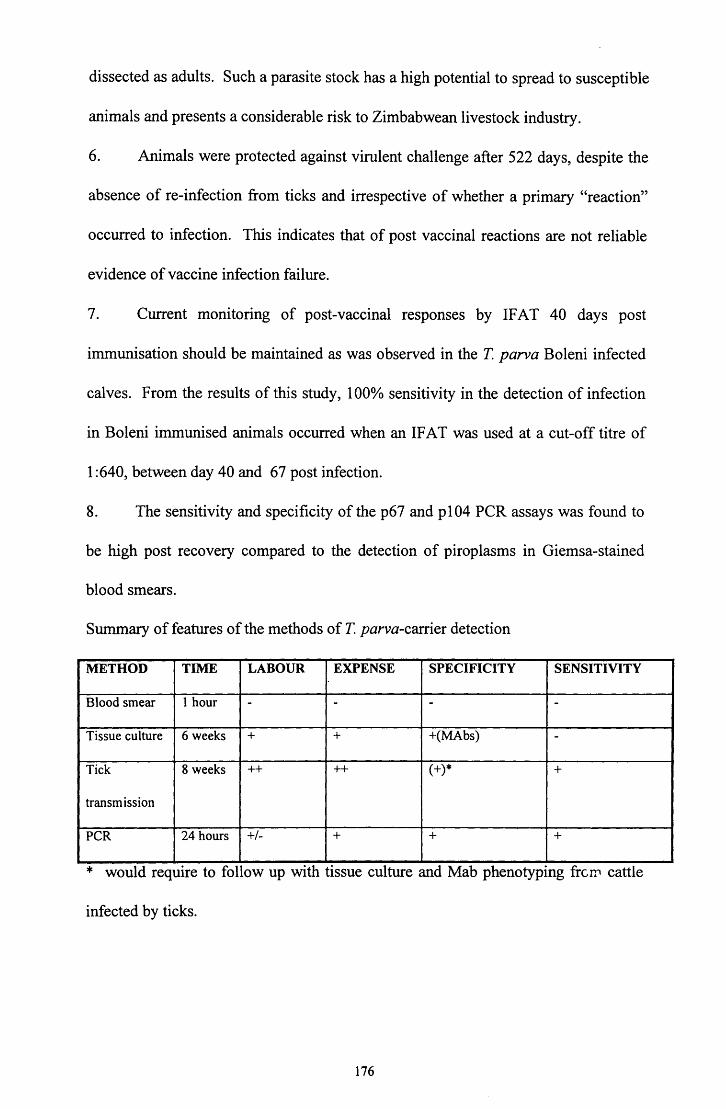
dissected as adults. Such a parasite stock has a high potential to spread to susceptible
animals and presents a considerable risk to Zimbabwean livestock industry.
6. Animals were protected against virulent challenge after 522 days, despite the
absence of re-infection from ticks and irrespective of whether a primary "reaction"
occurred to infection. This indicates that of post vaccinal reactions are not reliable
evidence of vaccine infection failure.
7. Current monitoring of post-vaccinal responses by IF AT 40 days post
immunisation should be maintained as was observed in the T parva Boleni infected
calves. From the results of this study, 100% sensitivity in the detection of infection
in Boleni immunised animals occurred when an IF AT was used at a cut-off titre of
1:640, between day 40 and 67 post infection.
8. The sensitivity and specificity of the p67 and p 104 PCR assays was found to
be high post recovery compared to the detection of piroplasms in Giemsa-stained
blood smears.
Summary of features of the methods ofT parva-carrier detection
METHOD TIME LABOUR EXPENSE SPECIFICITY SENSITIVITY
Blood smear 1 hour - - - -
Tissue culture 6 weeks + + +(MAbs) -
Tick 8 weeks ++ ++ (+)* +
transmission
PCR 24 hours +I- + + +
* would require to follow up wtth tissue culture and Mab phenotyptng frc111 cattle
infected by ticks.
176

The above table partly shows that currently there is no ideal method for the detection
of carrier state in 1: parva infected animals and thus more research is required in this
area.
The order of the day for the farmers in the beef industry in Zimbabwe was
summarised by Matson, (1967) as "NEVER BUY BREEDING STOCK FROM A
THEILERIOSIS PROPERTY", in order to control the spread of pathogenic strains of
theileriosis, because of the variations noted in the pathogenesis of the disease.
177

LIST OF REFERENCES ALLSOPP, B.A., GIBSON, W.C. and STAGG, D.A. (1985). Characterisation of
some East African Theileria species isolated by isoenzyme analysis with particular reference to T. parva. International Journal for Parasitology., 15: 271-276.
ALLSOPP, B.A.,and ALLSOPP, N.T.E.P. (1988). Theileria parva: Genomic DNA studies reveal intraspecific sequence diversity. Molecular and Biochemical Parasitology, 28: 77-84.
ALLEN, J.R., (1989). Immunology of interactions between ticks and laboratory animals. Experimental and Applied acarology, 1: 5-13.
ALLSOPP, B., CARRINGTON, M., BA YLIS, H., SOHAL, S., DOLAN, T. and lAMS, K. (1989). Improved characterisation of Theileria parva isolates using the polymerase chain reaction and oligonucleotide probes. Molecular and Biochemical Parasitology, 35: 137-148.
ALLSOPP, B.A., BA YLIS, H.A., ALLSOPP, M.T.E.B., CAVALIER-SMITH, T., BISHOP, R.P., CARRINGTON, D.M., SGHANPAL, B. and SPOONER, P. (1993). Discrimination between six species of Theileria using oligonucleotide probes which detect small ribosomal RNA sequences. Parasitology, 107: 157-165.
ANON., (1984). Immunisation against Theileria parva. In: Ticks and Tick-borne disease control. Volume 2. Rome: Food and Agriculture Organisation of the United Nations.
ANON., (1989b). Classification of Theileria parva reactions in cattle. In: Theileriosis in Eastern, Central and Southern Africa: Proceedings of a Workshop on East Coast Fever Immunisation Held in Lilongwe, Malawi, 20-22 September; 1988. Editor. T.T. Dolan, International laboratory for Research on Animal Diseases, Nairobi, pp. 187-188.
AUSUBEL, F.M., BRENT, R., KINGSTON, R.E., MOORE, D.D., SMITH, J.A., SEIDMAN, J.A. and STRUHL, K. (1987). Current protocols in Molecular Biology. New York: J. Wiley.
BALDWIN, C.L., GODDEERlS, B.M. and MORRISON, W.l. (1987). Bovine helper T -cell clones specific for lymphocytes infected with Theileria parva Muguga. Parasite Immunology, 9: 499-514.
BARNETT, S.F. and BROCKLESBY, D.W. (1966). The susceptibility of the African buffalo (Syncerus caffer) to infection with Theileria parva. (Theiler, 1904). British Veterinary Journal, 122: 379-386.
178

BARNETT, S.F. (1968). Theileriosis. In: D. Weinman and M. Ristic, (Editors), Infectious Blood diseases of man and animals, Academic Press, New York and London. Volume 11. pp. 269-328.
BARNETT, S.F. (1977). Theileria In:J.P. Krier (Editor). Parasitic protozoa. Academic Press, New York. Volume 4; pp. 77-113.
BA YLIS, H.A., SOHAL, K.S., CARRINGTON, M., BISHOP, P.R. and ALLSOPP, B.A. (1991). An unusual repetitive gene family in Theileria parva which is stage specifically transcribed., 49: 133-142. Molecular and Biochemical Parasitology
BELL-SAKYI, L. and WILLIAMSON, S. (1974). Antibody responses in IFAT of experimental calves immunised by infection with sporozoites or macroschizonts of Theileria annulata. In: 25th International congress on the History of Veterinary Medicine, 24-31 May, 1992. Ankara, Kapadokya and Instanbul, Turkey. pp 142-147.
BISHOP, R., SOHANPAL, B., KARIUKI, D.P., YOUNG, A.S., NENE, V.,BA YLIS, H., ALLSOPP,B.A., SPOONER, P.R., DOLAN, T.T. and MORZARIA, S.P. (1992). Detection of carrier state in Theileria parva infected cattle by the polymerase chain reaction. Parasitology, 104: 215-232.
BISHOP, R.P., SOHANPAL,B.K. and MORZARIA, S.P. (1994b). Cloning and characterisation of repetitive DNA sequence from Theileria mutans: application as a species probe. Parasitology Research, 80: 33-41.
BISHOP, R., SOHANP AL, B. and MORZARIA, S., (1993). Theileria parva: Detection of Genomic Polymorphisms by Polymerase Chain Reaction Amplification of DNA using arbitrary primers. Experimental Parasitology, 77: 53-61.
BISHOP, R.P. SPOONER P.R., KANHAI, G.K., KIARIE, J.,LATIF, A.A., HOVE, T., MASAKA, S. and DOLAN, T.T. (1.994). Molecular characterisation of Theileria parasites: Application to the epidemiology of Theileriosis in Zimbabwe. Parasitology, 109:, 573-581.
BLEWETT, D.A. and BRANAGAN, D. (1973). The demonstration of Theileria parva infection in intact Rhipicephalus appendiculatus salivary glands. Tropical Animal Health and Production, 5: 27-34.
BOS~AA, J.C. (1994). Hereditary Rea twater resistant charcteristics 1n cattle. Farming in South Africa, 19, 71-96.
179

BROCKLESBY, D.W. and BARNETT, S.F. (1966a). The literature concerning Theileridae of the African buffalo (Syncerus caffer). British Veterinary Journal, 122: 71-378.
BROCKLESBY, D.W. and BARNETT, S.F. (1966b) The isolation of "Theileria lawrencei (Kenya)" from a wild buffalo (Syncerus caffer) and its serial passage through captive buffaloes. British Veterinary Journal, 122: 387-395.
BROWN, C.O.D., STAGG, D.A., PURNELL, R.E., KANHAI, G.K. and PAYNE, R.C. (1973). Infection and transformation of bovine lymphoid cells in vitro by the the infective particle of Theileria parva. Nature, 245: 101-103.
BROWN, C.O.D. (1985). Immunisation against East Coast fever. In: Immunisation against Theileriosis in Africa. Nairobi. Editor, A. D. Irvin.
BROWN, W.C., SUGIMOTO, C. and GRAB, D.J. (1989) Theileria parva: Bovine Helper T -cell clones specific for both infected lymphocytes and schizont membrane antigens. Experimental Parasitology, 69: 234-248.
BROWN, W.C. and LOGAN, K.S., (1986). Bovine T -cell clones infected with Theileria parva produce a factor with IL-2 activity. Parasite Immunology, 8: 189-192.
BURRIDGE, M.J., MORZARIA, S.P., CUNNINGHAM, M.P. and BROWN, C.O.D., (1972). Duration of immunity East Coast Fever (Theileria parva infection of cattle). Parasitology, 64: 511-515.
BURRIDGE, M.J. (1971). Application of the indirect fluorescent antibody test in experimental EAST COAST FEVER (Theileria parva infection in cattle). Research in Veterinary Science, 12: 338-341.
BURRIDGE, M.J. and KIMBER, C.D. (1972b). The indirect fluorescent antibody test for experimental East Coast Fever (Theileria parva) infection of cattle: Detection of antibodies to schizonts in dried blood samples. Tropical and medical Parasitology, 23: 111-113.
BURRIDGE, M.J. and KIMBER, C.D., (1972). The indirect fluorescent antibody test for experimental East Coast Fever (Theileria parva) infection in cattle: Evaluation of a cell culture antigen. Research in Veterinary Science, 13: 451-455.
BURRIDGE, M.J. and KIMBER, C.D. (1973a). Duration of serological response to the indirect fluorescent antibody test of cattle recovered from Theileria parva infection. Research in Veterinary Science, 14: 270-271.
180

BURRIDGE, M.J. and KIMBER, C.D. (1973b). Studies on colostral antibodies to Theileria parva using the Indirect Fluorescent Antibody Test. Parasitology, 24: 305-308.
BURRIDGE, M.J., BROWN, C.G.D., CRAWFORD, J.G., KIRIM, I.M., MORZARIA, S.P., PA YNE, R.C. and NEWSON, R.M. (1974a). Preliminary studies on an atypical strain of bovine Theileria isolated from Kenya. Research in Veterinary Science, 17: 139-144.
BURRIDGE, M.J.,BROWN, C.G.D., and KIMBER, C.D. (1974b). Theileria annulata: Cross reactions between a cell culture schizont antigen and antigens of East African species in the indirect fluorescent antibody test. Experimental Parasitology, 35: 374-380.
BUSCHER, G. and OTIM, B., (1986). Quantitative studies on Theileria parva in the salivary glands of Rhipicephaluus appendiculatus adults: Quantitation and prediction of infection. International Journal of Parasitology, 16: (1 ), 93-100.
BUSCHER, G. and T ANGUS, J. (1986). Quantitative studies on Theileria parva in the salivary glands of Rhipicephaluus appendiculatus adults: Search for conditions for high infections. International Journal of Parasitology, 16: (2), 121-129.
CHAMPAGNE, D.E. (1994) The role of salivary vasodilators in blood feeding and parasite transmission. Parasitology Today, 10: No:11: 430-433
CHIERA, J.W., NEWSON, R.M. and CUNNINGHAM, M.P. (1985). Cummilative effects of host resistance on Rhipicephalus appendiculatus Neumann. (Acarina: Ixodidae) in the laboratory. Parasitology, 90: 401-408.
CONRAD, P.A. (1983). Studies· on the in-vitro cultivation of intra-erythrocytic stages of Theileria annulata, Theileria parva and Babesia bovis. Ph. D. theis, University of Edinburgh.
CONRAD, P.A., KELL Y, B.G. and BROWN, C.G.D. (1985). Intraerythrocytic schizogony of Theileria annulata. Parasitology, 91: 67-82.
CONRAD, P.A., lAMS, K., BROWN, W.C., SOHANPAL, B. and OLE-MOI-YOI, 0. (1987a). DNA probes detect genomic diversity in Theileria parva stocks. Molecular and Biochemical Parasitology, 25: 213-226.
CONRAD, R.E., CHEN, P. and DOLAN, T.T. (1989a). Detection of Theileria parva in salivary glands of infected Rhipicephalus appendiculatus ticks with DNA probes. Proceedings of Eighth Veterinary hemoparasite Disease Conference, Aprill0-12, St. Louis, pp. 12-12.
181

CONRAD, P.A., OLE-MOI-YOI, O.K., BALDWIN, C.L., DOLAN, T.T. O'CALLAGHAN, C.J., NJAMUNGEH, R.E.G., GROOTENHUIS, J.G., ST AGG, D.A., LEITCH, B.L. and YOUNG, A.S. (1989b ). Characterisation of buffalo derived theileria parasites with monoclonal antibodies and DNA probes. Parasitology; 98: 179-188.
CONRAD, P.A., STAGG, D.A., GROOTENHUIS, J.G., IRVIN, A.D., NEWSON, J., NJAMUNGGEH, R.E.G., ROSSITER, P.B. and YOUNG, A.S. (1987b). Isolation of Theileria parasites from African buffalo (Syncerus caffer) and characterisation with anti-schizont monoclonal antibodies. Parasitology; 94: 413-423.
COOK, G.C. and SPLITTER, G.A. (1989). Comparison of Bovine mononuclear cells with other species for cytolytic activity against virally infected cells. Veterinary,. Immunology and Immunopathology; 20: 239-261.
COOK, A.J.C. (1991). Communal farmers and tick control- A field study 1n Zimbabwe. Tropical Animal Health and Production. 23: 161-166.
CRANEFIELD, P.F. (1991). Science and the Empire: East Coast Fever in Rhodesia and the Transvaal. Cambridge University Press.
CUNNINGHAM, M.P., BROWN, C.G.D., BURRIDGE, M.J., and PURNELL, R.E. (1973). Cryopreservation of infective particles of Theileria parva. International Journal of Parasitology. Volume 3: pp 583-587.
de VOS, A.J. and ROOS, J.A., (1981). The isolation of Theileria taurotragi in South Africa. Onderstepooort Journal ofVeterinary Research. 48: 149-153.
DOBBELAERE, D.A.E., SHAPIRO, Z.S. and WEBSTER, P. (1988). Identification of a surface antigen on Theileria parva sporozoites by monoclonal antibody. Proceedings 'Of National Academy of Science, USA, 82: 1771-1775.
DOLAN, T.T. (1981). Progress in the chemotherapy of Theileriosis. In: Advances in the Control of Theileriosis: Proceedings of an International Conference, Held at ILRAD, Nairobi, 9-13 February, 1981; Editors, A.D. Irvin, M.P. Cunningham, and A.S. Young, Martinus Nijhoff Publishers, The Hague, pp. 186-208.
DOLAN. T.T., YOUNG, A.S., LOSOS, G.T., McMILLAN, 1., MINDER, C.E. and SOULSBY, K. (1984d) Dose dependent responses of cattle to Theileria parva stabilate infection. Int 'rnational Journal of parasitology. 14: 89-95.
DOLAN, T.T., (1986a). Chemotherapy of East Coast Fever: the long term weight changes in carrier state and disease manifestations of parvaquone treated cattle. Journal of comparative pathology, 96: 137-146.
182

DOLAN, T.T. (1986b). Chemotherapy of East Coast fever: Treatment of infection induced by isolates of Theileria parva with halofuginone. Acta Tropica, 43: 163-173.
EMERY, D.L., EUGUI, E.M., NELSON, R.T. and TENYWA, T. (1981. Cell mediated immune responses to Theileria parva (East Coast fever) during immunisation and lethal infections in cattle. Immunology, 43: 323-336.
EUGUI, E.M. and EMERY, D.L. (1981). Genetically restricted cell mediated cytotoxicity in cattle immune to Theileria parva. Nature, London, 290: 252-254.
EVERITI, R.S. (1989). Statistical Methods for Medical Investigations. Oxford University Press, New York I Edward Arnold, London.
FAHRIMAL, Y., GOFF, W.L. and JASMER, D.P. (1992). Detection of Babesia bovis carrier cattle by using polymerase chain reaction amplification of parasite DNA. Journal ofC/inical Microbiology. 30: 1374-1379.
F AO-DANIDA Programme for Tick and Tick-borne Disease Control in Eastern and Southern Africa. Phase 11. Zimbabwe. ( 1993) Studies on theileriosis and economics of tick control.
FAWCETI, D.W., DOXCEY, S. and BUSCHER, G. (1981a). Salivary gland ofthe tick vector of East Coast Fever. I. Ultrastructure of the type Ill acinus. Tissue and Cell, 13: 209-230.
FAWCETI, D.W., DOXCEY, S. and BUSCHER, G. (1981b). Salivary gland ofthe tick vector of East Coast fever. 11. Cellular basis for fluid secretion in the type Ill acinus. Tissue and Cell, 13: 231-251.
FAWCETT, D.W., DOXCEY, S. and BUSCHER, G. (1982a). Salivary gland of the tick vector of East Coast fever. Ill . Ultrastructure of sporogony in Theileria parva. Tissue and Cell, 14: 183-206.
FAWCETI, D.W., DOXCEY, S. and BUSCHER, G. (1982b). Salivary glands of the tick vector of East Coast fever, IV. Cell type selectivity and host responsiveness to Theileria parva. Tissue and Cell, 14: 397-444.
FAWCETT, D W. and DOXSEY, S. (1982c). The entry of sporozoites of Theileria parva into bovine lymphocytes in-vitro. Electron microscopic observations. European Journal of Cell Biology, 27: 10-21.
183

FAWCETT, D.W., YOUNG, A.S. and LEITCH, B.L. (1985). Sporogony in Theileria (Apicomplexa: Piroplasmida). A comparative ultrastructure study. Journal ofSubmiroscopic Cytology, 17: 299-314.
FIV AZ, B.H., NORV AL, R.A.I. and LAWRENCE, J.A. (1989). Transmission of Theileria parva bovis (Boleni strain) to cattle resistant to the brown ear tic1 ~ Rhipicephalus appendiculatus (Neumann). Tropical Animal health and production, 21: 129-134.
FIV AZ, B.H. (1989). Immune suppression by the brown ear tick Rhipicephalus appendiculatus. Journal of Parasitology, 75: 946-952.
FIV AZ, B.H., de WAAL, D.T. and LANDER, K. (1992). Indegenous and crossbred cattle:- a comparison of resistance to ticks and implications for their strategic control in Zimbabwe. Tropical Animal health and production, 28: 81-89.
GROOTENHUIS, J.G., YOUNG, A.S. DOLAN, T.T. and STAGG, D.A. (1979). Characteristics of Theileria species (eland) infections in eland and cattle. Research in Veterinary Science, 27: 59-68.
GROOTENHUIS, J.G., YOUNG, A.S. and UILENBERG, G. (1981). The relationship between Theileria taurotragi from eland and Theileria sp. (Idobogo) from cattle. Veterinary Parasitology, 8: 39-47.
GODDEERIS, B.M., KATENDE, J.M., IRVIN, A.D., CHUMO, R.S.C. (1982). Indirect fluorescent antibody test for experimental and epizootiological studies on East Coast Fever (Theileria parva infection in cattle). Evaluation of a cell culture schizont antigen fixed and stored in suspension. Research in Veterinary Science, 33: 360-365.
GROOTENHUIS, J.G., YOUNG, A.S., STAGG, D.A., LEITCH, B.L. DOLAN, T.T. and CONRAD, P.A. (1987). Infection of African buffalo (Syncerus caffer) and cattle with Theileria parva lawrencei after serial passage in cattle. Research in Veterinary Science, 42: 326-330.
GROOTENHUIS, J.G., LEITCH, STAGG, D.A., B.L. DOLAN, T.T. and YOUNG, A.S. (1987). Experimental induction of Theileria parva lawrencei carrier state in an African buffalo (Syncerus caffer). Parasitology, 94: 425-431.
GONDER, R. (1911). The development of Theileria parva, the cause of East Coast fever of cattle in South Africa: Report of the Government Vete-rinary bacteriologist 1909-10. Pretoria: The Government Printing and Stationary Office; pp. 69-93.
184

GUERIN-MARCHAND, C. and LAMBIOTTE, M. (1984). The genome of Theileria parva some structural properties. Fed. Eur. Biochem. Soc. Letters. 169: 305-308.
HALL, R. (1985). Identification of genes encoding important protective antigens of sporozoites of Theileria parva. In: International Laboratory for Research on Animal Diseases (ILRAD), Nairobi, pp 31.
HOVE, T., MUSISI, F.L., KANHAI, G.K., LATIF, A., MASAKA, S., MUNATSWA, F.C., PEGRAM, R.G., KAMWENDO, S.P., QUIROGA, J.C., MWANGONDWE, R. and DOLAN, T.T. (1995). Challenge of Theileria parva (Boleni) immunised with selected East African Theileria stocks. Tropical Animal Health and Production, 27: 202-210.
HULLIGER, L., WILDE, J.K.H., BROWN,C.G.D. and TURNER, L. (1964). Mode of multiplication of Theileria in cultures of Bovine lymphocytic cells. Nature, 203: 728-730.
INNIS, M.A. and GELF AND, D.H. (1990) Optimisation of PCR, A guide to methods and applications ( eds. M.A. Innis, H. H. Gelfand, Sninsky, J .J. and T.J. White. pp. 3-12. Academic Press, London.
lAMS, P.K., YOUNG, R.J., NENE, V., DESAI, J.,WEBSTER, P., OLE-MOI, O.K., and MUSOKE, A.J. (1990). Characterisation of the gene encoding a p104 kilodalton microneme rhoptry protein of Theileria parva. Molecular and Biochemical Parasitology, 39: 47-60.
IRVIN, A.D., PIERCE, M.A., PURNELL, R.E. and KING, J.M., (1972). The possible role of the eland (Taurotragus ory:.) in the epidemiology of East Coast fever and other bovine theileriosis. Veterinary Record., 91: 21, 513-517.
IRVIN, A.D. and BOARER, C.D.H. (1980). Some implications of a sexual cycle in Theileria. Parasitology, 80: 571-579.
IRVIN, A.D., CUNNINGHAM, M.P. and YOUNG, A.S. (1981). (Editors). Advances in the control of Theileriosis: Proceedings of an International Conference Held at ILRAD, Nairobi, 9-13 February, 1981. Martinus Nijhoff Publlishers, The Hague, 427 pp.
IRVIN, A.D., OCAMA, J.G.R. and SPOONER, P.R. (1982). Cycle of bovine lymphobJ::lStoid cells parasitis~d l y Theileria parva. Research in Veterinary Science, 33: 298-304.
185

IRVIN, A.D., DOBBELAERE, D.A.E., MWAMACHI, D.M., MINAMI, T., SPOONER, P.R. and OCAMA, J.G.R. (1983). Immunisation against East Coast fever: correlation between monoclonal antibody profiles of T. parva stocks and cross immunity in vivo. Research in Veterinary Science, 35: 341-346.
IRVIN, A.D. (1987). Characterisation of species and strains of Theileria. Advances in Parasitology, 26: 145-197.
IRVIN, A.D. and MORRISON, W.I. (1989). Vaccines against Theileria parva; In: Veterinary Protozoan and Haemoparasite vaccines. (Editor; I.G. Wright). CRC. Press; Boca Raton, pp. 115-130.
IRVIN, A.D., MORZARIA, S.P., MUNATSWA, F.C. and NORV AL, R.A.I. (1989). Immunisation of cattle with a Theileria parva bovis stock from Zimbabwe protects against challenge with virulent T. parva parva and T. parva lawrencei stocks from Kenya. Veterinary Parasitology, 32: 271-278.
JARRETT, W.F.H., CRIGHTON, G.W. and PIRIE, H.M. (1969a). Theileria parva: Kinetics of replication. Experimental Parusitology, 24: 9-25.
JONGEJAN, F., MUSISI, F.L., MOORHOUSE, P.D.S., SNACKEN, M. and UILENBERG, G. (1986). Theileria taurotragi in Zambia. The Veterinary Quarterly, 8: 261-263.
JONGEJAN, F., PEGRAM, R.G., ZIVKOVIC, D., HENSEN, E.J., MWASE, E.T., THEILEMANS, M.J.C., COSSE, A., NIEWOLD, T.A., ASHRAF El SAID and UILENBERG, G., (1989). Monitoring of naturally acquired and artificially induced immunity to Amblyoma variegatum and Rhipicephalus appendiculatus ticks under field and laboratory conditions. Experimental Acarology, 1: 181-199.
JOOSTE, K.F. (1966a). A two-year study of the seasonal occurrence of adult ticks on a herd of red poll cows. Rhodesia Agricultural Journal, 63: 97-99.
JOOSTE, K.F. ( 1966b ). Seasonal incidence of the immature stages of the brown ear tick. Agricultural Journal, 63: 16-18.
JOYNER, L.P. and PURNELL, R.E. (1968). The feeding behaviour on rabbits and in-vitro of the Ixodid tick Rhipicephalus appendiculatus. (Neumann, 1901). Parasitology, 58: 715-723.
KACHANI, M. FLACH, E.J., WILLIASON, S.M., OUHELLI El HASNAOUI, M. and SPOONER, R.L. ( 1996). The use of an enzyme-linked immunosorbent assay for tropical theileriosis research in Morocco. Preventive Veterinary Medicine, 26: 329-339.
186

KANEKO, S., MILLER, R.H., FEINSTONE, S.M., UNOURA, M. KOBA Y ASHI, K., HATTORI, N. and PURCELL, N. (1989). Detection of serum Hepaptitis B virus DNA in patients with chronic hepataitis using the polymerase chain reaction assay. Proceedings of the National Academy of Sciences, USA, 86: 312-316.
KARIUKI, D.P. (1991). Studies on the carrier state of Theileria parva in the epidemiology and control of East Coast fever. Ph. D. thesis. University of Salford.
KARIUKI, D.P.,YOUNG, A.S., MORZARIA, S.P., LESAN, A.C., MINING, S.K.,OMWOYO, P.,WAFULA and MOL YNEUX, D.H., (1995). Theileria parva carrier state in naturally infected and artificially immunised cattle. Tropical Animal Health and Production, 27: 15-25.
KATENDE, J.M., GODDERRIS, B.M., MORZARIA, S.P., NKONGE, C.G. and MUSOKE, A.J. (1990). Identification of a Theileria mutans specific antigen for use in an antibody and antigen detection ELISA. Parasite Immunology, 12: 419-433.
KEATING, M.I. (1983). Tick control by chemical acaricides in Kenya: a review ( 1912-1981) Tropical Animal Health and Production, 15: 1-6.
KIMBER, C.D. and PURNELL, R.E. (1972). A Rapid Technique for the detection of Theileria parasites in the salivary glands of the tick Rhipicephalus appendiculatus. Research in Veterinary Science, 13: 393-394.
KIMBER, C.D. and BURRIDGE, M.J. (1972). The indirect fluorescent antibody test for experimental East Coast fever (Theileria parva infection of cattle). Evaluation of dried blood sam-ples as a source of antibody. Research in Veterinary Science, 13: 133:.135.
KOCH, H.T., NORV AL, R.A.I., OCAMA, J.G.R. and MUNATSWA, F.C. (1986). Epidemiology of Theileria parva bovis in Zimbabwe.. In: Proceedings of an international workshop on the ecology of tick-borne diseases, held at Nyanga, Zimbabwe, 17-21 February, 1986. Editor, R.W. Sutherst. Tick and Tick-borne diseases. No: 17: 97-98.
KOCH, H.T., OCAMA, J.G.R., MUNATSWA, F.C., BYROM, B., NORVAL, R.A.I., SPOONER, P.R., CONRAD, P.A. and IRVIN, A.D. (1988). Isolation and characterisation of bovine TJ eileria parasites in Zimbabwe. Veterinary Parasitology, 28: 19-32.
187

KOCH, H.T. (1990). Aspects of the Epidemiology of January Disease: (Theileria parva bovis infection) in Zimbabwe. Ph. D. thesis: University of Utrecht, 122pp.
KOCH, H.T., NORVAL, R.A.I., OCAMA, J.G.R., and MUNATSWA, F.C. (1992). A study on the Theileria parva bovis carrier state. Preventive Veterinary Medicine 12: 197-203.
KOCH, H.T., KAMBEWA, L., NORV AL, R.A.I., OCAMA, J.G.R. and MUNATSWA, F.C. (1993). Transmission of Theileria parva bovis by nymphs of Rhipicephalus appendiculatus. Preventive Veterinary Medicine, 17: 89-93.
LAWRENCE, D.A. (1934). Report of the Director of Veterinary Research, Southern Rhodesia. Rhodesia Printing and Publishing Co. Ltd. Salisbury, 12pp.
LAWRENCE, J.A. (1977). The serological relationship between Theileria parva (Muguga) and Theileria lawrencei from (Rhodesia) Zimbabwe. Veterinary Record, 100: 470-471.
LAWRENCE, J.A. and NORV AL, R.A.I. (1979). A history of ticks and tick-borne diseases of cattle in Rhodesia. Rhodesia Veterinary Journal, 10: 28-40.
LAWRENCE, J.A., FOGGIN,C.M., NORVAL, R.A.I. (1980a). The effect ofwar on the control of diseases of livestock in Rhodesia (Zimbabwe). Veterinary Record, 107: 82-85.
LAWRENCE, J.A., and MACKENZIE, P.K.I. (1980b). The isolation of a nonpathogenic Theileria of cattle transmitted by Rhipicephalus appendiculatus. Zimbabwe Veterinary Journal, 11: 27-36.
LAWRENCE, J.A., NORV AL, R.A.I. and UILENBERG, G. (1983). Rhipicephalus zambesiensis as a vector of bovine Theileriidac. Tropical Animal Health and Production, 15: 39-42.
LAWRENCE, J.A. (1990). Summing up of strategies for tick-borne disease control in Africa, especially East Africa. Parassitologia, 32: 113-115.
LAWRENCE, J.A. (1991). Retrospective observations on the transmission of East Coast fever in Zimbabwe. Tropical Animal Health and Production, 23: 69-74.
188

LEITCH, B. L., and YOUNG, A. S. (1981 ). Theileria infections in Rhipicephalus appendiculatus ticks collected in the field. Pp 63-65 in A. D. Irvin, M.P. Cunningham and A.S. Young (Editors). Advances in the control of theileriosis. 427 pp. The Hague, Martinus Nijhoff.
LEVINE, N.D. (1973). Protozoan Parasites of Domestic animals and Man. 2"d Edition, Burgess Publishing Company, Minneapolis, 406 pp.
LEVINE, N.D., CORLISS, J.O., COX, F.E.G., DEROUX, G., GRAIN, J., HONIGBERG, B.N., LEEDALE, G.F., LOEBLICH, A.R. II., LOM,J., L YNN, D.H., NERINFIELD, F.G., PAGE, F.C., POLJANSKY, G., SPRAGUE, V., V AURA, J. and WALLACE, F.G. (1980). A newly revised classification of the protozoa. Journal of Protozoology, 27: 37-38.
MACKENZIE, P.K.I. and LAWRENCE, J.A. (1979). Immunofluorescent antibody levels in cattle naturally infected with Theileria lawrencei. Rhodesia Veterinary Journal, 10: 64-66.
MACKINNON, J. (1953). Report of the Director of Veterinary Services. Southern Rhodesia. (Zimbabwe).
MAIZELS, R.M., BLAXTER, M.L., ROBERTSON, D.B. and SELKIRK, M.E. (Editors). ( 1991 ). Parasite Antigens, Parasite Genes. A Laboratory Manual for Molecular Parasitology. Cambridge University Press, Cambridge, UK.
McKEEVER, DJ. and MORRISON, W.I. (1990). Theileria parva: the nature of the immune response and its significance for immunoprophylaxis. Revue scientifique 'et. technique de /. office International Epizoties, 9(2): 405-421.
McHARDY, N., WEKESA, L.S., HUDSON, A.T. and RANDALL, A.W. (1985). Anti-theileria! activity of BW720C (buparvaquone): a comparison with parvaquone. 'Research in Veterinary Science, 39: 29-33.
MARGULIS, L. (1974). The classification and evolution of prokaryotes and eukaryotes. In: Handbook of Genetics. Editor, R.C. King, Volume I, Plenum Press, New York, pp. 1-4.
MARITIM, A.C., KARIUKI, D.P., YOUNG, A.S. and MUTUGI, J.J. (1989a) The importance of the carrier state of Theileria parva in the epidemiology of theileriosis and its control by immunisation. In: Theileriosis in Eastern, Central and Southern Africa: Proceedings of a Workshop on East Coast Fever Immunisation, Held in Lilongwe, Malawi, 20-22 September, 1988; Editor, T.T. Dolan,: The International Laboratory for Research in Aninmal Diseases, Nairobi, Kenya pp. 121-128.
189

MARITIM, A.C., YOUNG, A.S., LESAN, A.C., NDUNGU, S.G., MUTUGI, J.J. and STAGG, D.A. (1989). Theileria! parasites isolated from carrier cattle after immunisation with Theileria parva by the infection and treatment method. Parasitology, 99: 139-147.
MATSON, B.A. (1967). Theileriosis in Rhodesia. A study of diagnostic specimens over two seasons. Journal of South African Veterinary Medicine Asssociation, 38(1 ): 93-1 01.
MA TSON, B.A. and NORV AL, R.A.I. (1977). The seasonal occurrence of adult ixodid ticks on cattle on a Rhodesian highveld farm. Rhodesian Veterinary Journal, 8: 2-6.
MAXIE, M.G., DOLAN, T.T., JURA, W.G.Z., TABEL, H. and FLOWERS, M.J. (1982). A comparative study of the diseases in cattle caused by Theileria parva or T lawrencei. II. haematology, clinical chemistry, coagullation studies and complement. Veterinary parasitology, 10: 1-19.
MEDLEY, G.F., PERRY, B.D. and YOUNG, A.S. (1993). Preliminary analysis of the transmission dynamics of Theileria parva in Eastern Africa. Parasitology, 106: 251-264.
MEHLHORN, H. SCHEIN, E. and WARNEKE, M. (1978). Electron microscopic studies on the development of kinetics of Theileria parva in the gut of the vector tick Rhipicepalus appendiculatus. Acta Tropica, 35: 123-136.
MELROSE, T.R., WALKER, A.R. and BROWN, C.G.D. (1980). Identificationof Theileria in the salivary glands of Hyalomma anatolicum and Rhipicephalus appendiculatus using isoenzyme electrophoresis. Tropical Animal Health and Production, 12: 214-218.
MEHLHORN, H. and SCHEIN, E.~ (1984). The piroplasms: life cycle and sexual stages. Advances in Parasitology, 23: 37-103.
MELTZER, D.G.A. (1993). Historical survey of disease problems in wildlife populations - Southern Africa mammals. Journal of Zoo and Wildlife Medicine, 24: 237-244.
MINAMI, T., SPOONER, P.R., IRVIN, A.D., OCAMA, J.G.R., DOBBELAERE, D.A.E. and FUJINAGA, T. (1983). Characterisation of stocks of Theileria parva by monoclonal antibody profiles. Research in Veterinary Sciennce, 35: 334-340.
190

MORRISON, W.I., BUSCHER, G., EMERY, D.L., NELSON, R.l. and MURRA Y, M. ( 1981 ). The kinetics of infection with Theileria parva in cattle and the relevance of the development of immunity. In: Advances in the Control of Theileriosis: Proceedings of an International Conference Held at ILRAD, Nairobi, 9-13 February, 1981. Editors, A.D. Irvin, M.P. Cunningham and A.S. Young, Martinus NijhoffPublishers, The Hague, pp. 311-326.
MORRISON, W.I., BUSCHER, G., MURRA Y, M. EMERY, D.L., MASAKE, R.A., COOK, R.H. and WELLS, P.W. (1981). Theileria parva: Kinetics of infection in the lymphoid system of cattle. Experimental Parasitology, 52: 248-260.
MORRISON, W.I., GODDEERIS, B.M., TEALE, A.J., GROOCOCK, C.M., KEMP, S.J. and STAGG, D.A. (1987). Cytotoxic T-cells elicited in cattle challenged with Theileria parva (Muguga): evidence for restriction by class I MHC determinants and parasite strain specificity. Parasite Immunology, 9: 563-578.
MORRISON, W.I., GODDEERIS, B.M., BROWN, W.C., BALDWIN, C.L. and TEALE, A.J. (1989). Theileria parva in cattle: characterisation of infected lymphocytes and the immune responses they provoke. Veterinary Immunology and Immunopathology, 20: 213-237.
MORRISON, W.I., TARACHA, L.N.E. and McKEEVER, D.J. (1995). Theileriosis: progress towards vaccine development through understanding immune responses to the parasite. Veterinary Parasitology, 51: 177-187.
MORZARIA, S.P. (1989). Identification of Theileria species and characterisation of Theileria parva stocks. In: Theileriosis in Eastern, Central and Southern Africa: Proceedings of a workshop on East Coast Fever Immunisation Held in Lilongwe, Malawi, 20-22 September, 1988. Editor; T.T. Dolan, International "laboratory for Research on Animal Diseases, Nairobi. pp. 102-110.
MORZARIA, S.P., MUSOKE, A.J., SPOONER, P.R., BISHOP, P.R., and YOUNG, J.R. (1990a). Sfii and Notl polymorphisms in Theileria stocks detected by pulsed field gel electrophoresis. Molecular and Biochemical Parasitology.,40: 203-212.
MUHAMMED, S.L., LAUERMAN, L.H. and JOHNSON, L.W. (1975). Effects of humoral antibodies on the course of Theileria parva (East Coast fever) of cattle. American Journal of Veterinary Research, 36: 399-402.
MULLIS, K., and FALOONA, F. (1987) In Methods in enzymology. Editor, R. Wu, Volume 155 Academic Press, New York and London.
191

MUSISI, F.L., KILGOUR, V., BROWN, C.G.D. and MORZARIA, S.P. (1981). Preliminary investigations on isoenzyme variants of lymphoblastoid cell lines infected with Theileria species. Research in Veterinary Science, 30: 38-43.
MUSISI, F.L. and LAWRENCE, J.A. (1995). Prospects for control of Tick -borne diseases in cattle by immunisation inEastern, Central and Southern Africz Agriculture and Human Values, 12(2):.
MUSOKE, A.J., NANTULYA, V.M., RURANGIRWA, F.R. and BUSCHER, G. (1984) Evidence for a common protective antigenic determinant on sporozoites of several different Theileria parva strains. Immunology, 52: 231-238.
MUSOKE, A.J., NENE, V., NANTUL YA, V.M. VOIGT, W. (1987). Characterisation of the surface antigen of T. parva sporozoites. Annual Scientific Report, ILRAD, pp 14-15.
MUSOKE, A.J. and NENE, V. (1990). Development of recombinant vaccines for control of theileriosis. Parasitologia, 32: 73-86.
MUSOKE, A.J., MORZARIA, S.P., NKONGE, C., JONES, E. and NENE, V. (1992). A recombinant sporozoite surface antigen of Theileria parva induces protection in cattle. Proceedings of the National Academy of Sciences, USA, 89: 514-518.
MUTUGI, J.J. and MUNODZANA, D. (1996). In: Proceedings of a workshop on Integrated tick and tick-borne disease control in Zimbabwe. Held at Hunyani Hills Hotel, Norton, Zimbabwe. 13-15 May, 1996. Editor, J.J. Mutugi and D. Munodzana. Organised by Government of Zimbabwe I FAO Project on Integrated Tick and Tick-Borne Disease Control GCP/ZIM/014/DEN and GCP/ZIM/015/BEL.
MUTUGI, J.J., YOUNG, A.S., MARITIM, A.C., NDUNGU, S.G., STAGG, D.A., GROOTENHUIS, J.G. and LEITCH, B.L. (1988). Immunisation of cattle against Theileriosis using varying doses of Theileria parva lawrencei and T. parva parva sporozoites and oxytetracycline treatments. International Journal for Parasitology, 18( 4): 453-461.
NEITZ, W.O. (1957). Theileriosis, gonderioses and cytauxzoones, a rev1ew. Onderstepoort Journal of Veterinary Research. 27:, 275-430.
NENE, V. MUSOKE, A.J. and lAMS, K (1987). Cloning of a gene that coc'es for potentially protective antigen in T. parva sporozoites. Annual Scientific Report, ILRAD, pp 16-17.
192

NENE, V., lAMS, K.P., GOBRIGHT, E. and MUSOKE, J.A. (1992). Characterisation of the gene encoding a candidate vaccine antigen of Theileria parva sporozoites. Molecular and Biochemical Parasitology, 51: 17-28.
NEWSON, R.M., CHIERA, J.W., YOUNG, A.S., DOLAN, T.T., CUNNINGHAM, M.P. and RADLEY, D.E. (1984). Survival of Rhipicephalus appendiculatus (Acarina: Ixodidae) and persistence of Theileria parva Apicompexa: Theileriidae) in the field. International Journal of Parasitology, 14: 483-489.
NEWTON and GRAHAM, (1994). PCR. Bios Scientific. Publishers Limited, Oxford.
NOLAN, J. (1990). Acaricide resistance in single and multi-host ticks and strategies for tick control. Parassitologia, 32: 145-153.
NORV AL, R.A.I. and LIGHTFOOT. (1982). Tick problems in Wildlife in Zimbabwe. The factors influencing the occurrence and abundance of Rhipicephalus appendiculatus. Zimbabwe Veterinary Journal. Volume 13:, No; 1/2. 11-.
NORVAL, R.A.I., FIVAZ, B.H., LAWRENCE, J.A. and BROWN, A.F. (1985). Epidemiology of tick-borne diseases of cattle in Zimbabwe. Ill. Theileria parva group. Tropical Animal Health and Production, 17: 19-28.
NORVAL, R.A.l., SUTHERST, R.W., KURKI, J., GIBSON, J.D. and KERR, J.D. (1988b ). The effect of the brown ear tick Rhipicephalus appendiculatus on the growth of Sanga and European breed cattlf·. Veterinary Parasitology, 30: 149-164.
NORVAL, R.A.I., LAWRENCE, J.A., YOUNG, A.S., PERRY, B.D., DOLAN, T.T. and SCOTT, J. (1991). Theileria parva: influence of vector, parasite and host relationships on epidemiology of theileriosis in southern Africa. Parasitology, 102; 347-356.
NORV AL, R.A.I., PERRY, B.D. and YOUNG, A.S. (1992). The Epidemiology of Theileriosis in Africa. Academic Press, London.
OCHANDA, H., YOUNG, A.S., MUTUGI, J.J., MUMO, J.M. and OMWOYO, P.L. (1988). The effect of temperature on the rate of transmission of Theileria parva 1nfection to cattle by its ick vector Rhipicephalus appendiculatus. Parasitology, 97: 239-245.
OCHANDA, H. (1994). Factors affecting population dynamics of Theileria parva in Rhipicephalus ticks. Ph. D. thesis, Warwick Uniyersity, pp193.
193

OLE-MOIYOI, 0. (1989). Theileria parva: An intracellular protozoan parasite that induces reversible lymphocyte transformation. Experimental Parasitology, 69: 204-210.
PEARSON, T.W., LUNDIN, L.B., DOLAN, T.T. and STAGG, D.A. (1979). Cell mediated immunity to Theileria transformed cells. Nature, 281: 678-680.
PEGRAM, R.G., JAMES, A.D., BAMHARE, C., DOLAN, T.T., HOVE, T., KANHAI, G.K. and LATIF, A. A. (1996). Effects of immunisation against Theileria parva of beef cattle productivity and economics of control options. Tropical animal Health and Production, 28: 99-111.
PERRY, B.D., MUKHEBI, A.W., NORVAL, R.A.I. and BARNETT, J.C. (1990). A preliminary assessment of current and alternative tick and tick-borne disease control strategies in Zimbabwe. Report to the Director of Veterinary Services. ILRAD. (International Laboratory for Research on Animal Diseases, Nairobi, Kenya. 41 pp.
PERRY, B.D. and YOUNG, A.S. (1995). The pest and future roles of epidemiology and economics in the control of tick-borne diseases of livestock in Africa: the case of theileriosis. Preventive Veterinary Medicine, 25: 107-120.
PINDER and HEWETT., (1980). Monoclonal antibodies detect antigenic diversity in Theileria parva parasites. Journal of Immunology; 124: 1 000-1001.
PURNELL, R.E. and JOYNER, L.P. (1968). The development of Theileria parva in the salivary glands of the tick, Rhipicephalus appendiculatus. Parasitology, 58: 725-732.
PURNELL, R.E., LEDGER, M.A., OMWOYO, P.L., PAYNE, R.C. and PIERCE, M.A. (1974). Theileria parva: variation in the infection rate of the vector tick; Rhipicephalus appendiculatus. International Journal of Parasitology, 4: 513-517.
RADLEY, D.E. (1978). Chemopropylactic immunisation against East Coast fever. In: J.K.H. Wilde. (editor). Tick-borne Diseases and their vectors Edinburgh: University of Edinburgh, Centre for Tropical Veterinary Medicine.
RADLEY, D.E. (1981 ). Infection and treatment immunisation against theileriosis. In Advances in the Control of Th '!ileriosis: Proceedings of an International Conference Held at ILRAD, Nairobi, 9-13 February,l981. (Editors. A.D. Irvin, M.P. Cunninghan1 and A.S. Young), Matinus Nijhoff Publishers, The Hague, pp. 227-236.
194

RADLEY, D.E., BROWN, C.G.D.,CUNNINGHAM, M.P., KIMBER, C.D., MUSISI, F.L., PAYNE, R.C., PURNELL, R.E., STAGG, S.M. and YOUNG, A.S., (1975).East Coast Fever. 3. Chemoprophylactic immunisation of cattle using oxytetracycline and a combination of theileria! strains. Veterinary Parasitology, 1: 51-60.
SAIKI, R.K., GELFAND, D.H., STOFFEL, S., SEJART, S., HIGUCHI, R., HORN, G. T., MULL IS, K.B. and ERLICHS, H.A. (1988). Primer directed enzymatic amplification of DNA with a thermostable DNA polymerase. Science, 239: 487-491.
SAMBROOK, J., FRITSCH, E.F ., MANIATIS, T., (1989). Molecular cloning: A laboratory manual. 2nd edition. Cold Spring Harbour Laboratory, New York.
SCHWABE, C.W., RIEMANN, H.P. and FRANTI, C.E. (1977). Epidemiology in Veterinary Practice, Lea and Febiger, Philadelphia, 303 pp.
SERGENT, E., DONATIEN, A.L., PARROT, L.M. and LESTOQUARD, F. 1945. Etudes surles Piroplasmose Bovine. Institut pasteu d' Algerie, 816pp. Abstract.
SHAPIRO, S.Z., FUllSAKI, K., MORZARIA, S.P., WEBSTER, P., FUJINAGA, T., SPOONER, P .R. and IRVIN, A. D. (1987). A life cycle stage-specific antigen for Theileria parva recognised by anti-macroschizont monoclonal antibodies. Parasitology, 94:, 29-37.
SHA W, K.M. and TILNEY, L.G. (1992). How individual cells develop from a syncytium: merogony in Theileria parva (Apicomplexa). Journal of Science, 101: 109-123.
SHITAKHA, V.M., NANTULYA, V.M., MUSOKE, A.J., RAMASAMY, R. and BUSCHER, ·G. (1983). Complement activation and fibrinolysis during infection with Theileria parva (East Coast fever) in cattle. Veterinary Immunology and Immunopathology, 4: .263-373.
SHORT, N.J., and NORV AL, R.A.I. (1981). The seasonal activity of Rhipicephalus appendiculatus Neumann, 1901(Acari:Ixodidae) in the highveld of Zimbabwe Rhodesia. Journal of Parasitology, 67: 77-84.
SPOONER, R.L., PENHALE, W.J., BURRIDGE, M.J. and BROWN, C.G.D. (1973). Some serum globulin changes in East Coast fever. Research in Veterinary Science, 15: 368-374.
STAGG, D.A., KANHAI, G.K., YOUNG, A.S., and BROWN, C.G.D. (1976). The establishment of Theileria infected cell lines from an eland (Taurotragus oryx Lydekker, 1906). Research in Veterinary Science, 20: 122-126.
195
STAGG, D.A., DOLAN, T.T., LEITCH, B.L. and YOUNG, A.S. (1981). The initial stages of infection of cattle cells with Theileria parva sporozoites in-vitro. Parasitology, 83: 191-197.
STEW ART, (1983). In vitro immunosuppression of bovine mononuclear cells by tick saliva. South African Journal of Science (Darwin), 19: 119-.
STEINDEL, M., NETO, D.E., MENEZES, L.P., ROMANHA, J.A. and SIMPSON, J.G.A. (1993). Random amplified polymorphic DNA analysis of Trypanosoma cruzi starins. Molecular and Biochemical Parasitology, 60: 71-80.
STILLER, D. (1990). Application of Biotechnology for diagnosis and control of ticks and tick borne diseases. Parassitologia, 32: 87-111.
SUGIMOTO, C., MUTHARIA, L.M., CONRAD, P., DOLAN, T.T., BROWN, W.C., GODDERRIS, B.M. and PEARSON, T.W. (1989). Protein changes in bovine lymphoblastoid cells induced by infection with the intracellular parasite Theileria parva. Molecular and Biochemical Parasitology; 37: 159-169.
THEILER, A., (1911). Progress report on the possibility of vaccinating cattle against East Coast fever. First report of the Director of Veterinary Research, South Africa.
THOMPSOM, J. W. (1985). Theileriosis in Zimbabwe. In: Immunisation against Theileriosis in Africa: Proceedings of a Joint Workshop, Nairobi, 1-5 October, 1984. Editor, A.D. lrvin; International Laboratory for Research on Animal Diseases, Nairobi, pp. 12-15.
THRUSFIELD, M., (1995). Veterinary Epidemiology, 2"d Edition. Blackwell Science Ltd. · The University Press, Cambridge.
TITUS, R.G. and RIBEIRO, J.M.C. (1990). ~he role of vector saliva in transmission of arthropod borne disease. Parasitology Today, 6: 157-160.
TITUS, R.G. and RIBEIRO, J.M.C. (1988). Salivary gland lysates from the sandfly Lutzomyia longipalpis enhance Leishmania infectivity. Science, 239: 306-308.
UILEMBERG, G. (1981 ). Theileria/ species of domestic animals. In: Advances in the Control of Theileriosis. Proceedings of an International Conference, Held at ILRAD, Nairobi, 9-13 February, 1981. Editors, A.D. Irvin, M.P. Cunningham and A.S. Young, Martinus Nijhoff Publishers, The Hague, pp. 4-37.
196

UILENBERG, G., PERIE, N.M., LAWRENCE, J.A., de VOS, A.J., PALING, R.W. and SP ANJER, A. A. M. ( 1982). Causal agents of bovine theileriosis in South Africa. Tropical Animal Health and Production, 14: 127-140.
UILENBERG, G. (1995). International collaborative research: significance of tick-borne hemoparasitic diseases to world animal health. Veterinary Parasitology, 51: 19-41.
WAGNER, G.G., DUFFUS, W.P.H. and BURRIDGE, M.J. (1974). The specific immunoglobulin response in cattle immunised with isolated Theileria parva antigens. Parasitology, 69: 43-53.
WAGNER, G.G., DUFFUS, W.P.H., KIMBER, C.D. and LULE, M. (1974). Immunochemical studies on East Coast Fever: Il. Partial segregation and characterisation of the Theileria parva piroplasm antigen. Journal of Parasitology, 60:(5) pp. 854-859.
WAGNER, G.G., JESSETT, D.M., BROWN, C,G.D. and RADLEY, D.E. (1975). Diminished antibody response to rinderpest vaccination in cattle undergoing experimental East Coast fever. Research in Veterinary Science, 19: 209-211.
WAGNER, G.G., DUFFUS, W.P.H., AKWABI, C., BURRIDGE, M.J. and LULE, M. (1975). The specific immunoglobulin response in cattle to Theileria parva (Muguga) infection. Parasitology, 70: 95-102.
WALKER, A.R., McKELLAR, S.B., BELL, L.J. and BROWN, C.O.D. (1979). Rapid quantitative assessment of Theileria infection in ticks. Tropical Animal Health and Production, 11: 21-26.
WALKER, A.R. and FLETCHER, J.D. (1985). Age grades and infection rates of Rhipicephalus appendiculatus. Neumann (Acari: Ixodidae) to assess theileriosis challenge in the· field. Bulletin of Entomological Research, 75: 653-660.
WALKER, A.R. ( 1990). Parasitic adaptations in the transmissioni of Theileria by ticks- a review. Tropical Animal Health and Production, 22: 23-33.
WEBSTER, P., DOBBELAERE, D.A.E. and FAWCETT, D.W. (1985). The entry of sporozoites of Theileria parva into bovine lymphocytes in-vitro. Immunoelectron microscopic observations. European Journal of Cell Biology, 36: 157-162.
197
WILLIAMSON, S., TAIT, A., BROWN, C.O.D., WALKER, A., BECK, P., SHIELS, B., FLETCHER, J. and HALL, R. (1989). Theileria annulata sporozoite surface antigen expressed in Escherichia coli elicits neutralising antibody. Proceedings of the National Academy of Sciences, USA, 86: 4639-4643.
WILLIAMSON, S.M., LESAN, A. C. and A WICH, J.R., (1990). Immunological and molecular tools for use in ECF immunisation and for assessment of other tick borne diseases. In: Progress towards the control of East Coast fever (Fheileriosis) in Kenya._Editors, A.S. Young, J.J. Mutugi and A.C. Maritim, Kenya Agricultural Research Institute, Nairobi, pp. 66-71.
WILSON, S.G. (1950). An experimental study of East Coast fever in Uganda. II. The duration of immunity in East Coast fever. Parasitology, 40: 210-214.
WRIGHT, P.F., NILSSON, E., van ROUIJ, E.M.A., LELENTA, M. and JEGGO, M.H. (1993). Standardisation and validation of enzyme linked immunosorbent assay techniques for the detection of antibody in infectious disease diagnosis. Revue Scientific et Techniques Office International des Epizootics, 12: 435-450.
XU, L.Z. and LARZUL, D. (1991). The polymerase chain reaction: basic methodology and applications. Comparative Immunology, Microbiology and Infectious Diseases., 14: (3), 209 -221.
YOUNG, A.S., PURNELL, R.E., KIMBER, C.D. and PA YNE,. R.C. (1975). Correlation between the morphology and infectivity of Theileria lawrencei developing in the tick Rhipicephalus appendiculatus. Parasitology, 71: 27-34.
YOUNG, A.S., GROOTENHUIS, J.G., KIMBER, C.D., KANHAI, G.K. and STAGG, D.A. (1977). · Isolation of a Theileria species from eland (Taurotragus oryx) infective for cattle. Tropenmedizin und Parasitologie, 29: 185-194.
YOUNG, A.S., LEITCH, B.L. and OMWOYO, P.L. (1979). The induction of infective stages of Theileria parva by exposure of host ticks to high temperature. Veterinary Record, 105: 531-535.
YOUNG, A.S .. GROOTENHUIS, J.G., LEITCH, B.L. and SCHEIN, E. (1980). The development of Theileria = Cytauzoon taurotragi (Martin and Brocklesby, 1960) from eland in its tick vector Rhipicephalus appendiculatus. Parasitology, 81: 129-144.
198

YOUNG, A.S. and LEITCH, B.L. (1980). A probable relationship between the development of Theileria species and the ecdysis of their tick host Journal of Parasitology, 66:, 356-359.
YOUNG, A.S. and LEITCH, B.L. (1981a). Production of Rhipicephalus appendiculatus ticks with high infection of Theileria parva. Journal of Parasitology, 67: 751-752.
YOUNG, A.S., LEITCH, B.L., IRVIN, A.D. and DOBBELAERE, D.A.E. (1981). The effects of irradiation on the susceptibility of Rhipicephalus appendiculatus ticks to Theileria infection. Parasitology, 82: 473-479.
YOUNG, A.S. and LEITCH, B.L. (1981b). Epidemiology of East Coast fever: Some effects of temperature on the development of Theileria parva in the tick vector, Rhipicephalus appendiculatus. Parasitology, 83: 199-211.
YOUNG, A.S., LEITCH, B.L., DOLAN, T.T., NEWSON, R.M., NGUMI, P.N., OMWOYO, P.L. (1983). Transmission of Theileria parva by a population of Rhipicephalus appendiculatus under simulated natural conditions. Parasitology, 86: 255-267.
YOUNG, A.S. and GROOTENHUIS, J.G. (1985). Influence of wildlife on immunisation of cattle against Theileriosis in East Africa. In: Immunisation against Theileriosis in Africa. Proceedings of a Joint Workshop, Nairobi, 1-5 October, 1984. Editor, A.D. Irvin, International Laboratory for Research onAnimal Diseases, Nairobi, pp. 104-109.
YOUNG, A.S., LEITCH, B.L., NEWSON, R.M. and CUNNINGHAM, M.P. (1986). Maintenance of Theileria parva infection in an endemic area of Kenya. Parasitology; 93: 9-16.
199

APPENDIX I
SOLUTIONS AND BUFFERS. FOR PCR AND BLOT HYBRIDISATION
1. Tris-Acetate-EDTA (TAE) buffer kept as a concentrate stock
242 g Tris base
57.1 ml Glacial acetic acid
100 ml 0.5 M EDT A (pH 8.0)
Distilled water to 1 litre
2. 1 OX DNA Loading Buffer:
20 mM EDTA (EDTA)
25% Ficoll (type 400) (Pharmacia)
0.2% Bromophenol blue (Sigma)
3. Ethidium bromide (EtBr) stock 5 mg/ml in water. Care: EtBr is a powerful mutagen.
Handle with gloves and take care in disposal of contaminated solutions.
4. 5XTBE:
54 g Tris base (Sigma)
27.5 g Boric acid
20 ml 50mM EDT A (pH 8.0) per litre
5. 20X SSC (Standard Saline Citrate)
174 g I I NaCl (Sigma)
88.2 g I I sodium citrate; pH 7.0
6. Saponin Lysis Buffer
0.22% Sodium chloride (Sigma)
0.015%, Saponin (Sigma)
Distilled water up to 100 ml
7. Tris EDTA pH 7.6 (TE)
10 mM Tris-HCL
1.0mM EDTA
xvii

8. Dot Blot Hybridisation
a) Alkali Denaturing Solution
1.5 M Sodium Chloride (Sigma)
0.5 M Sodium Hydroxide (Merck)
Neutralising Solution (pH 8.0
1 M Tris Base
1.5 M Sodium chloride
per 2 litres
175.3 g
40.0 g
per 2 litres
242.2 g
175.3 g
Solution made up to final volume after adjusting to pH with concentrated HCL.
20 X SSC pH 7.0
Sodium chloride
Sodium citrate (Sigma)
per litre
175.2 g
88.2 g
pH adjusted to 7.0 with 10 N sodium hydroxide before solution made up to final volume
b) Hybridisation
Hybridisation buffer
5xSSC
5% Blocking reagent (Amersham)
0.1% N-lauroylsarcosiue (Sigma)
0.02% SOS
50% Formamide (Pharmacia)
Formamide added after the solution has been dissolved at 50°C. The buffer is stored at -20°C.
Page No;
APPENDIX 11
Febrile and parasitic reactions to Theileria infection XIX
APPENDIX Ill
Febrile and parasitic reactions toT. parva A very challenge xxvix
APPENDIX IV Summary of results xxxviii
APPENDIX V pl04 PCR Dot blot PCR Results li
APPENDIX VI Tables of reciprocal titres of IF AT Results and figures lviii
xviii

APPENDIX 11 Figure (a): Febrile reaction to T. parva Boleni primary infection
Group I Boleni infections
41 .5
ou 40.5 Q)
:; -; Qj 39.5 a. E ~ iii 38.5 ti Q)
0:: 37.5
36.5 r
-2 0 2 4 6 8 10 12 14 16 18 20 22 24 26 28 30
Days
Figure (b): Parasitic reaction to T. parva Boleni primary infection
W70 Boleni infection
5
4 X Q)
3 '"0 .s 0
0.3
(/)
8 (/)
al
0.. 0 ..... 2 CiS
::E ••••••••••••••••• 0.1 ·o.. ';I(
0
-2 0 2 4 6 8 10 12 14 16 18 20 22 24 26 28 30
Days p.i.
~macs -.- piroplasms I
XIX
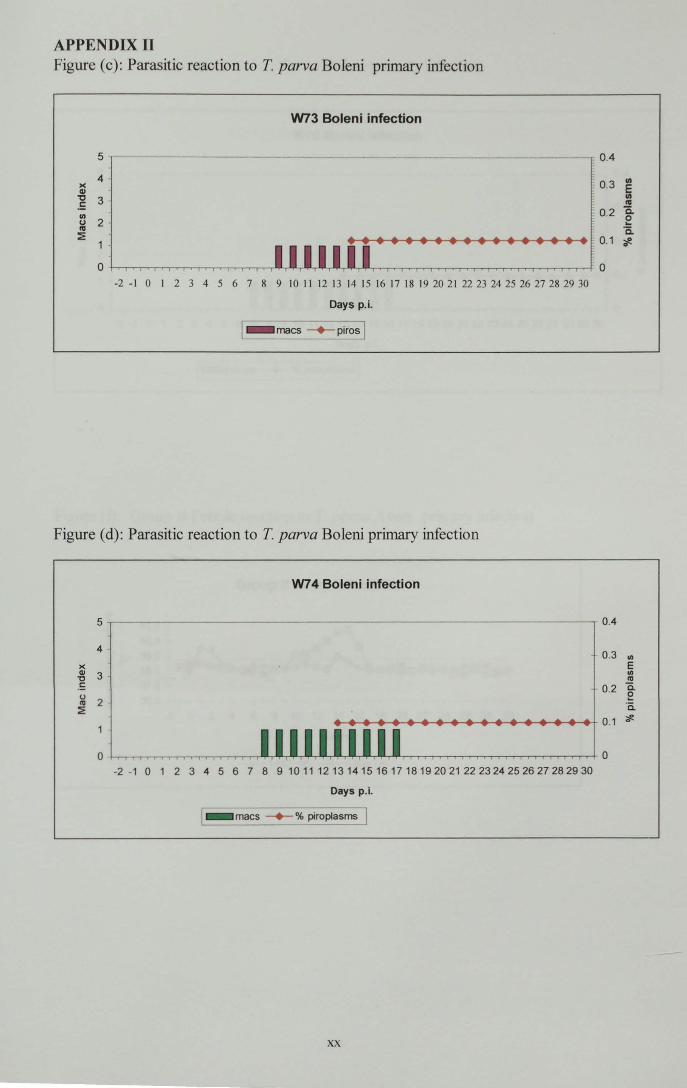
APPENDIX 11 Figure (c): Parasitic reaction to T. parva Boleni primary infection
W73 Boleni infection
5 --------------------- ----- 0.4
o.3 e Cll
"' 0.2 c.. e c.
••••••••••••••••• 0.1 ff.
-2 -1 0 I 2 3 4 5 6 7 8 9 10 11 12 13 14 15 16 17 18 19 20 21 22 23 24 25 26 27 28 29 30
Days p.i.
1- macs -+- piros I
Figure (d): Parasitic reaction to T. parva Boleni primary infection
W7 4 Boleni infection
5 ----------·-------------------------,-
4
-2-1 0 1 2 3 4 56 7 8 9101112131415161718192021222324252627282930
Days p.i.
[ - _ma~% piroplasms I
XX
0.4
0.3 en E en 10
0.2 a. e ·a.
0.1 <F.

APPENDIX 11 Figure (e): Parasitic reaction to T. P arva Bo leni primary infection
Wl5 Boleni infection
5 ------------------ -- - ------ 0.4
4
-2 -1 0 1 2 3 4 56 7 8 9101112131415161718192021222324252627282930
Days p.i.
~acs -+- % piroplasms I
Figure (f): Group II Febrile reaction to T. parva A very primary infection
41 .5 t 40.5 .
Group 11 Avery infections
~~ q .··~··r--.. ~..a~HI~ .... 37.5
36.5
-2 0 2 4 6 8 10 12 14 16 18 20 22 24 26 28 30
Days
[: • 1M2 (11) -11- 1454 (11) I
xxi
. 0.3 Ill
E Ill ro
0.2 Ci e ·a.

APPENDIX 11 Figure (g): Parasitic reaction to T. parva A very primary infection
1454 PARASITIC REACTION
5 0.4 c: 4 Cl)
0 0.3 E N Cl) - )( 3 "' .c. Q> (.)'0 0.2 c.. Cl) c: 2 e e-(,) 0.1 a. "' ~ ~
0 0 -2 0 2 4 6 8 10 12 14 16 18 20 22 24 26 28 30
Days Post-infection.
I Macroschizont index -+- %piroplas~
Figure (h): Group Ill Febrile reaction to T. parva primary infection
Group Ill Bally Vaughan infections
p 41.5
Cll
2 40.5
"' Qj 39.5 Q.
E 38.5 .! i;j 37.5 0 Cll 36.5 0::
-2 0 2 4 6 8 10 12 14 16 18 20 22 24 26 28 30
Days Post-infection
E+--1441 (ID) ~1459 (IU) I
XXI!

APPENDIX 11 Figure (i) : Parasitic reaction to T parva primary infection
------------------~
5
~ 4 "0 .£ c 3 0 N
~ 2 VI 0
~ 1 :.'!!
1447 Sally Vaughan infection
-2 0 2 4 6 8 10 12 14 16 18 20 22 24 26 28 30
Days Post-infection
~ fv1acroschizont index ---+- % piroplasm; I
0.4
0.3 VI
E VI
0.2 IV Q. e ·a.
0.1 ;f!.
Figure U): Group IV Febrile reaction to Theileria infected ticks application
Group IV Ayrshire and Chikeya tick applications
ft> 41 .5
Ql 40.5 :; iii ~ 39.5 - ·-············ a. E 38.5 .! (ij
37.5 0 Ql
0:: 36.5
-2 0 2 4 6 8 10 12 14 16 18 20 22 24 26 28 30
Days Post-tick application
[ ~.-1437(rv) -e- 1456 (rv) I
XXIII

APPENDIX 11 Figure (k): Group IV Parasitic reaction to infection by ticks
5
4
)(
~ 3 .!: (fl
~ 2 E
-----------------------------------1456 Ayrshire tick application
-------------------- 0.25
o.15 E (fl
n:l . . . . . . . . . . . . . . . ~ e
0.05 ·o.. ~
-2 0 2 4 6 8 10 12 14 16 18 20 22 24 26 28 30
days p.i.
~ rracs -+- piroplasrrs j
Figure (1): Group IV Parasitic reaction to infection by ticks
5
4
)(
~ 3 £
~ 2 n:l E
1437 Chikeya tick application
------------------------------------ ------------------ 0.2
0.15 Cl)
E Cl)
• • • • • • • • • • • • • • 0.1 -[
-2 0 2 4 6 8 10 12 14 16 18 20 22 24 26 28 30
days p.i.
[i rrecs -+- piroB
'LXlV
e ·o.. 0.05 ~

APPENDIX 11 Figure (m): Febrile reaction to tick exposure
Group Va Hunyani Estates exposure
41.5 u L 40.5
~ • t1:l
~ 39.5 -- ---------------·-·······················--·----·-···--·-····· 0..
§ 38.5 ~ ~ 37.5
36.5
• I X I
.. X
-2 0 2 4 6 8 I 0 12 14 16 18 20 22 24 26 28 30
Days Post exposure
E 1372 (V) ---- 1376 (V) ...,._ 1451 (V) --M-- 1458 (V) • ]
Figure (n): Parasitic reaction to tick exposure
1372 Hunyani exposure
5 0.4 X (1)
0.3 '"0 4 .s
0.2 ~ 3 0
:.2 2 0 en 0.1 0
\-. 0 t1:l
~ 0 0
-2 0 2 4 6 8 1 0 12 14 16 18 20 22 24 26 28 30
Da s po t e posure
- Macroschizont index -+- % piroplasms
XX
en 8 en t1:l
0.. 0 1-< ·a ~
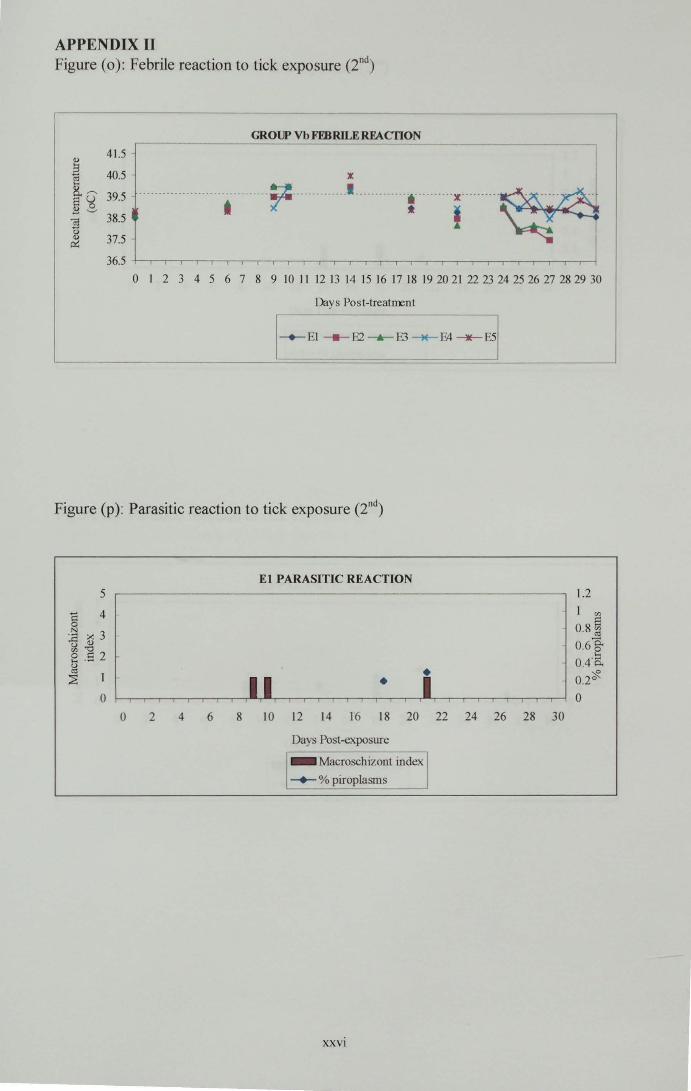
APPENDIX 11 Figure ( o ): Febrile reaction to tick exposure (2nd)
GROUP Vb FFBRILERFACTION
Q.) 41.5
2 40.5 ~ 1-< 8_,--..
39.5 El u Q.) 0
+-- .........,
38.5 ] (.) Q.) 37.5 ~
36.5
0 1 2 3 4 5 6 7 8 9 10 11 12 13 14 15 16 17 18 19 20 21 22 23 24 25 26 27 28 29 30
Da s Post-treahrent
[ • El • m--m --~---9 ~---------------------------------
Figure (p ): Parasitic reaction to tick exposure (2nd)
El PARASITIC REACTION 5 r--------------- --- -
• • 0
0 2 4 6 8 1 0 12 14 16 18 20 22 24 26 28 30
XXVI
1.2
1 m 8
0.8 ~ 0.6g. 0.4·5.
0 .2~ 0

APPENDIX 11 Figure ( q): Parasitic reaction to tick exposure (2nd)
E2 PARASITIC REACTION 5 1.2
~ 4 0
E :><: 3 (.) <1) en '"O 8 .s 2 (.)
~
I en
0.8 6 en a:s
0.6 0.. 0 ~
0.4 ·o. 0.2
~
0 • 0
0 2 4 6 8 10 12 14 16 18 20 22 24 26 28 30
Days Post-exposure
- Macroschi zont index
-+- % piroplasms
Figure (r): Parasitic reaction to tick exposure (2nd)
E3 PARASITIC REACTION :><: 5 -- ----- -- 1.2 <1)
'"0 4 I en .s s
~ 0.8 en 3 a:s
0 0.6 0..
:.8 0 2 .~ (.) • 0.4 0. en
0 1 • ~ ~ • 0.2 (.)
CO • ~ 0 0
0 2 4 6 8 10 12 14 16 18 20 22 24 26 28 30
Da s Po t-exposure
[ • Macroschizont index
-+- % piroplasms
xxvii

APPENDIX 11 Figure (s): Parasitic reaction to tick exposure (2nd)
E4 PARASITIC REACTION
5 X V
'"d 4 • • .s i:: 3 0 -~ ..c: 2 <.) (/) • 0 ... <.) <1:1
:::8 0 •
0 2 4 6 8 10 12 14 16 18 20 22 24 26 28 30
Days Post -exposure
Figure (t): Parasitic reaction to tick exposure (2nd)
ES PARASITIC REACTION
5
•
• 0
0 2 4 6 8 I 0 12 14 16 18 20 22 24 26 28 30
XXYlll
1.2
(/)
8 0.8 ~
0.6 g. -~
0.4 0.. :::R
0.2 °
0
1.2
1 (/)
0 . 8~ 0.6§-
0.4·5.
0 . 2~ 0

APPENDIX Ill Figure 3.7(a): Febrile reaction to T.parva A very challenge
Group I Challenge febrile reaction
G 0
41.5 '-.../ ~
2 40.5 ~
& 39.5 s 38.5 E '§ 37.5 g
36.5 ~
0 I 2 3 4 5 6 7 8 9 I 0 J I 12 13 14 15 16 17 18 19 20 21 22 23 24 25 26 27 28 29 30
Days post challenge
I -+-W70~3]
Figure 3.7(b): Parasitic reaction to T.parva A very challenge
W70 CHALLENGEP ARASIDC RFACTION
5 - -- --- --- ~- ----- -- 0.4 X ~ 4 '"0 0.3 .s en s i:l 3 .$ 0
] 0.2 g. 2 .!:l
C) 0.. en 0
0.1 ~ 1-< • • ~ I
0 0
0 l 2 3 4 5 6 7 8 9 lO 11 12 13 14 15 16 17 18 19 20 21 22 23 24 25 26 27 28 29 30
Days Post-challenge
- Macroschizont
--+- % piropla ms '---
xxix

APPENDIX Ill Figure 3.7(c): Parasitic reaction to T.parva A very challenge
W73 CHALLENGE PARAS me RFACTION 5 r- -- -- - 0.4
4 ~ 0.3 en 0 El :.8 ~ 3 ~ ?A.S 0.2 -a
0 8 .8 2 ·a g '$. ::;8
I • • • • • • 0.1
0 I 0 0 2 4 6 8 10 12 14 16 18 20 22 24 26 28 30
Days Post-challenge
lllll~acroscbizont
___._ % piroplasms
Figure 3.8(a): Febrile reaction to T.parva A very challenge
Group 11 Challenge febrile reaction
u 41.5 ~ V
40.5 2 ~ 1-< 39.5 V 0.. s 38.5 ~
ea 37.5 0 (j
~ 36.5
0 2 4 6 8 10 12 14 16 18 20 22 24 26 28 30
XXX

APPENDIX Ill Figure 3.8(b): Parasitic reaction to T.parva A very challenge
1442 Challenge parasitic reaction
5 0 4 -~ X g ~ 3 -8 .s
2 ~ -s t:l I
0
0 2 4 6 8 10 12 14 16 18 20 22
Days post-challenge
~ -rmcs in
-+- %piroplas1Tfl -
Figure 3.8(c): Parasitic reaction to T.parva A very challenge
1454 PARASITIC CHALLENGEREACI10N
5 r-X
~ 4 .8 i5 3 0
:.a (.) 2 (/}
0 .... I ~
~ 0
24 26 28 30
• •
·-
0.4
0.3 gj 0.
0.2 _g s 0.
0.1 ~
0
0.4
0.3 m
~ 0. 0.2 0 ·a
- 0.1 ~
0
0 1 2 3 4 5 6 7 8 9 10111213141516171819202122232425 2627282930
Days Post-challenge
-rmcs index
-+-%piroplasiiJ) -- -
xxxi

APPENDIX Ill Figure 3.9(a): Febrile reaction to T.parva A very challenge
---~-----------------------------------------.
GROUP Jll CHALLFNGE FFBRJLE RFACTION
41.5
37.5
3 6. 5 +r-....-.--...-rr-r...,.-,......-...--.-..-.-..-,--,.-r-r..,..,-..,-r-.,..-,,.,-,-r-r-r-r..,..,-.,.-,-r..-r-r-r...-r-y-r-,-r-r-r-1rr-r---r"T-r-r..,....,
0 I 2 3 4 5 6 7 8 9 I 0 I I 12 13 14 15 16 1 7 18 19 20 21 22 23 24 25 26 27 28 29 30
Day Post-challenge
F No:l447l
~-No:l459j
Figure 3.8(b): Parasitic reaction to T.parva A very challenge
;x: 5 -.g .s 4 i:l 0 3 ] 0 2 m 8 0
1
~ 0
0 1
144 7 CHALLENGE PARASITIC REACTIONS
-
2 3 4 5 6 7 8 9 10 11 12 13 14 15 16 17 18 19 20 21 22 23 24 25 26 27 28 29 30
Days Post-challenge
r. Macroschizont index
l=:!-%p irop la ms
XXXII
0.4 m
0.3 s .[
0.2 0 ·a 0.1
~
0
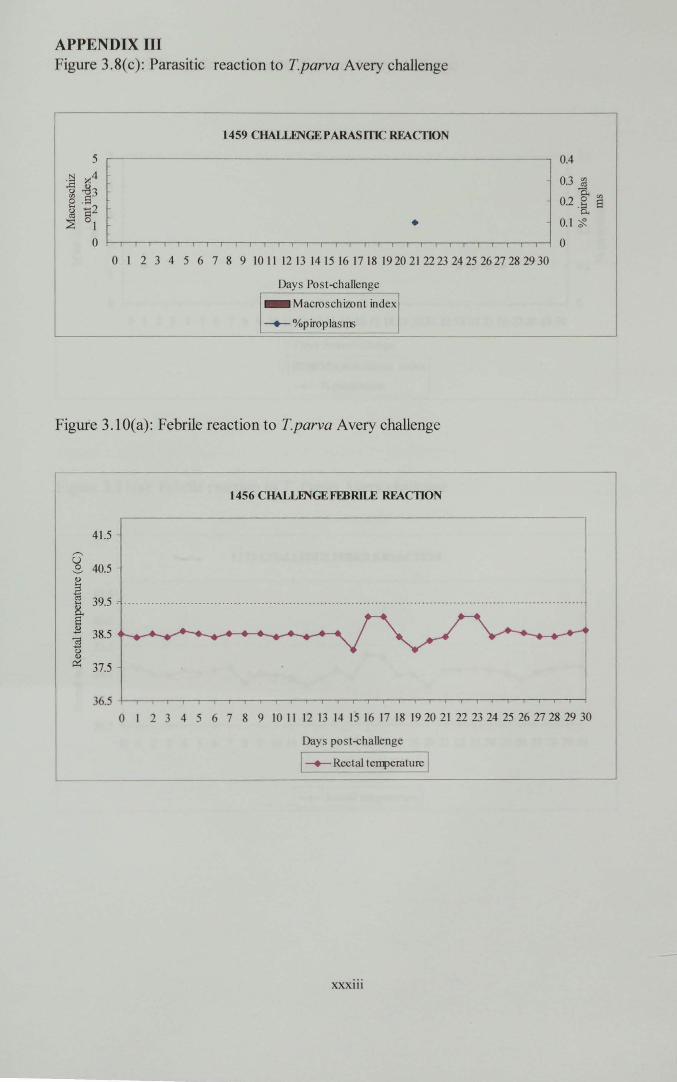
APPENDIX Ill Figure 3.8(c): Parasitic reaction to T.parva A very challenge
--------- --- -
1459 CHALLENGE PARASITIC REACTION
- - ------------------
• 0 l 2 3 4 5 6 7 8 9 10 11 12 13 14 15 16 17 18 19 20 21 22 23 24 25 26 27 28 29 30
Days Post-challenge
- Macroschi7...ont index
-+--- %piroplasms
Figure 3.10(a): Febrile reaction to T.parva A very challenge
1456 CHALLENGEFFBRILE RFACTION
41.5
G ~ 40.5 0
~ 39.5 . 1-1
8. ~ 38.5 ] 0 0 ~ 37.5
0.4
0.3 ~ o.Ul
0.2 .§ 8 0..
0.1 ~
0
36.5 +--~---r---r---r---r---.---.--.-..-.----,--r--.--r---r--.---.----r--r---r---r---r-.----.-r--r--r---.-i
0 I 2 3 4 5 6 7 8 9 I 0 1 I 12 13 I 4 15 16 17 18 19 20 2 I 22 23 24 25 26 27 28 29 30
Day post-challenge
[ • Rectal ten::perature I
XXXIII

APPENDIX Ill Figure 3.1 O(b): Parasitic reaction to T.parva A very challenge
r-
1456 CHALLENGE PARASITIC RFACTION
5 r -- - - ---- 0.4
4 i5 0
;El X 3 ~ .g ~ .8 2
~ • • •••
0 1 2 3 4 5 6 7 8 9 lO 11 12 13 14 15 16 17 18 19 20 21 22 23 24 25 26 27 28 29 30
Days Post-challenge -----,
-Macroschizont index
-+- % piroplasms
0.3 en
8 ~
0.2 g. ·a '$.
0.1
0
Figure 3.11(a): Febrile reaction to T. Parva A very challenge
1372 CHALLENGE FEE RILE REACTION
G 41.5 -l ~ 0 40.5 2 [ 39.5 . ·········· · ·········· · ···················· ·· ·· ·· ···· · ···· · ················· · ··············· · ·········· ............. 1. 8 2 38.5 ea 0 ~ 37.5
36.5
0 I 2 3 4 5 6 7 8 9 I 0 1 1 12 13 14 15 16 17 18 19 20 21 22 23 24 25 26 27 28 29 30
Days Po t-challenge
I • !-ectal temperature j
XX.XlV

APPENDIX Ill Figure 3.ll(b): Parasitic reaction to T Parva A very challenge
1372 CHALLITI'IGEPARASITIC RFACfiON
5 - ---
• • • • • • • • •
0 1 2 3 4 5 6 7 8 9 10 11 12 13 14 15 16 17 18 19 20 21 22 23 24 25 26 27 28 29 30
Days Post-challenge
-rmcs index
-+- %piroplasms
Figure 3.12(a): Febrile reaction to T Parva A very challenge
GROUP Vb CHALLENGE FEE RILE REACTIONS
0.4
0.3
0.2
0.1
0
I :: =-:- :: -~ ~ -- --- ---: J B 38.5 i-=~L.Oc..t.:i:=:~~[...~:::&;~~ s 0 ~ 37.5
36.5
0 I 2 3 4 5 6 7 8 9 10 11 12 13 14 15 16 17 18 19 20 21 22 23 24 25 26 27 28 29 30
Day P[3ost-challenge
FA
E5
XXXV
en s ~ 0. 0 ·a
'$.

APPENDIX Ill Figure 3.12(b): Parasitic reaction to T Parva Avery challenge
El CHALLENGEPARASffiC RFACTION
5
4
•••• 0
- - ·- 0.4
0.3 1/}
E 1/}
Cd
0.2~ ·a.
0.1
0
0 0
0 1 2 3 4 5 6 7 8 9 10 11 12 13 14 15 16 17 18 19 20 21 22 23 24 25 26 27 28 29 30
Days Post-chalJenge ---·-
-Macroschizont index
--+- % p iro pI as rns
Figure 3.12(c): Parasitic reaction to T Parva A very challenge
E4 CHALLENGE PARASITIC RFACflON
----------------- ----------.- 0.4
0 0 I 2 3 4 5 6 7 8 9 I 0 11 12 13 14 15 16 I 7 I 8 19 20 21 22 23 24 25 26 27 28 29 30
xxxvi
0.3 s ~
- 0.2 g. ·a

APPENDIX Ill Figure 3.12(d): Parasitic reaction toT. Parva Avery challenge
ES CHALLENGE PARAS ITJC RFACTION
:X: 5 ,...-~---------------- - --
-8 4 .a i:i 3 0
~ 2 0 en
0.4
oJ a ~
0.2 g. ·a
0 • • 1-< g • • • • • • • • • • Ql ~
~ 0
0 I 2 3 4 5 6 7 8 9 10 ll 12 13 14 15 16 17 I 8 19 20 21 22 23 24 25 26 27 28 29 30
Days Post-chaUenge
- Macrosclllzonl indexl --+-- % piroplastm
Figure 3.13(a): Control febrile reaction to T. Parva infection
,..-...
JJ 41.5 '-..../
Q)
2 40.5 ~ 1-< 39.5 Q) 0.. 8 38.5 2 5 37.5 0 Q) 36.5 ~ ' T
0 2 4
T. ptrw A \oery Challenge controls
T ., T T r T T -. .-.-.- r .,. ' T .,.- T l • -.,- T
6 8 10 12 14 16 18 20 22 24 26 28 30
Days Post-infection
c ~- 4853 --- 4855 1
xxxvii
0
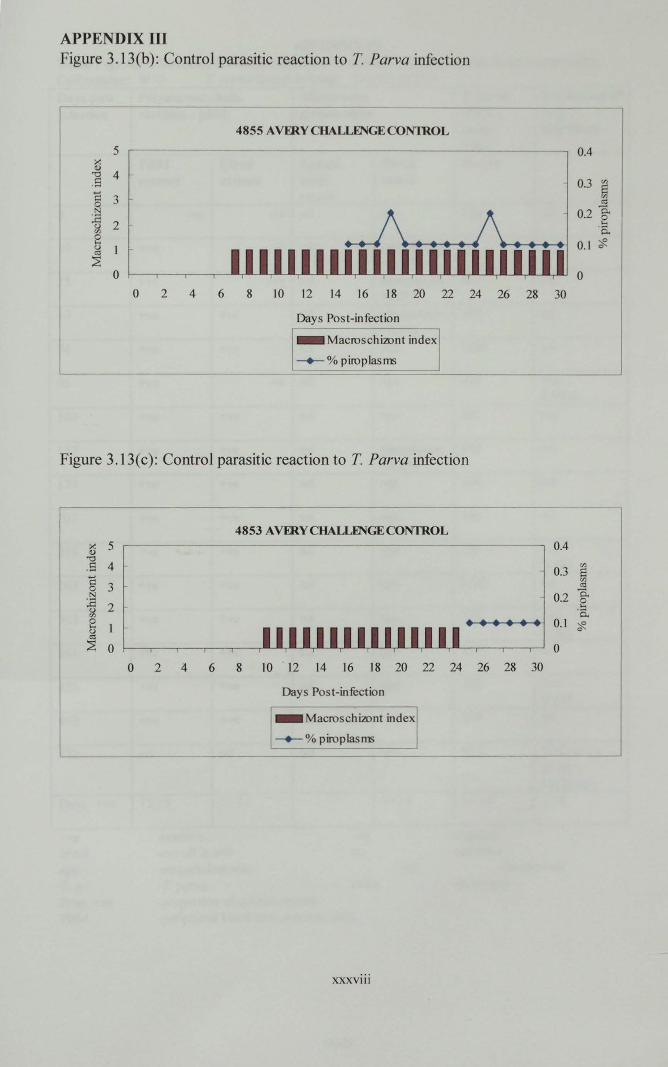
APPENDIX Ill Figure 3.13(b): Control parasitic reaction to T. Parva infection
r
4855 A VERY aiALLENGECONlROL
5 X a)
'"d 4 .5 B 3 0
- ~ .c 2 (.)
C/l 0 ...... (.) 1 -Cl;l
::E 0
0 2 4 6 8 1 0 12 14 16 18 20 22 24 26 28 30
Days Post-infection
-Macroschizont index
-+- %piroplasms
Figure 3.13(c): Control parasitic reaction to T. Parva infection
X 5 a)
'"d .5 4 c 0 3
~ 2 C/l 0 ...... (.)
~ 0
4853 A VERY CHALLENGE CONTROL
0 2 4 6 8 1 0 . 12 14 16 ] 8 20 22 24 26 28 30
Days Post-infection
I • Macroschi2ont index
-+- %piroplasms
XXXVlll
0.4
0.3
0.2
0.1
0
0.4
0.3 8 C/l Cd
0.2 g. ...... ·a
0.1 'cf?.
0
C/l s C/l Cd
"0. 0
. ~ 0.
'cf?.

APPENDIX IV Table 1 (group I) Summary of results obtained with different methods used to detect carrier status. C If ber W70 T. B I .. 6 ed D 0 31103194 a num . parva oemmect a_y_ Days post infection
0
14
25
40
74
95
109
137
179
207
218
263
305
361
456
493
522
Prop. +ve
+ve IFA1 nps T.p. Prop. +ve PBM
Polymerase chain reaction- pl04
PBM Blood extract extract
-ve -ve
+ve -ve
+ve -ve
+ve +ve
+ve +ve
+ve -ve
+ve +ve
+ve +ve
+ve +ve
+ve +ve
+ve +ve
+ve +ve
+ve +ve
+ve +ve
+ve +ve
+ve +ve
nd nd
15115 12115
-positive -cut off is 640
Microscopy giemsa stain
Lymph node smear nd
+ve
nd
nd
nd
nd
nd
nd
nd
nd
nd
nd
nd
nd
nd
nd
nd
-ve nd
Blood smear
nps
piroplasms <0.1°/o piroplasms <O.lo/o piroplasms <0.1°/o nps
nps
nps
piroplasms <0.1°/o nps
nps
nps
nps
nps
nps
nps
nps
nps
4 I 16
-no parasites seen NR -T. parva recip. -proportion of positive results -peripheral blood mononuclear cells
xxxix
T.parva Prevalence of IFAT-. tick-recip. infections Titre Serum
160 nd
nd nd
nd nd
640 nd
1280 nd
640 +ve 5.96°/o
320 nd
640 nd
320 nd
160 nd
320 -ve 01193
5120 nd
320 -ve 01200
1280 nd
320 -ve 01134
320 nd
320 *NRtoT.p. A very challenge
6 I 14 114
-negattve -not done
-no reaction -reciprocal

APPENDIX IV Table 2: (group I) Summary of results obtained with different methods used to detect carrier status. C If ber W73 T B I .. fected D 0 31103194 a num . parva oem m ay Day post infection
0
14
25
40
74
95
109
137
179
207
218
263
305
361
456
493
522
Prop. +ve
+ve nps recip. IFAT PBM Prop. +ve
Polymerase chain Microscopy reaction • p 104 giemsa stain
PBM Blood Lymph extract extract node
smear -ve -ve nd
+ve +ve +ve
-ve -ve nd
+ve +ve nd
+ve -ve nd
+ve -ve nd
+ve +ve nd
-ve -ve nd
-ve +ve nd
-ve +ve nd
-ve +ve nd
-ve +ve nd
-ve +ve nd
-ve +ve nd
-ve +ve nd
+ve +ve nd
nd nd nd
6115 11/15
-positive -no parasites seen -reciprocal -cut off is 640 -peripheral blood mononuclear cells -proportion of positive results
xl
Blood smear
nps
piroplasms <0.1% piroplasms <0.1°/o piroplasms <0.1°/o nps
nps
nps
nps
nps
nps
nps
nps
piroplasms <O.JOfo nps
nps
nps
nd
4 I 15
-ve
NR nd
T.parva Prevalence of IFAT- tick-infections recip. Titre Serum
80 nd
nd nd
1280 nd
1280 nd
320 nd
5120 +ve 0.4°/o
160 nd
640 nd
320 nd
320 nd
5120 +ve 3.29°/o
2560 nd
320 -ve 01144
320 nd
640 -ve 01124
640 nd
1280 NR to T.p.Avery challen_g_e
9 I 15 214
-negative T. p. -T parva
-no reaction -not done

APPENDIX IV Table 3:(group I) Summary of results obtained with different methods used to detect carrier status. C If be W74 T B 1 . . fi ed D 0 I a num r: . parva oemmect ~ :31 03194 Day post-infection
0 14
25
40
74
95
109
137
179
218
221
263
305
Died before challenge Prop. +ve
+ve -ve nps PBM recip. IFAT Prop. +ve
Polymerase chain Microscopy reaction - p 104 giemsa stain
PBM Blood Lymph extract extract node
smear -ve -ve nd
+ve -ve mac+ve
-ve +ve nd
+ve +ve nd
+ve +ve nd
+ve nd nd
+ve +ve nd
+ve +ve nd
-ve +ve nd
-ve +ve nd
-ve +ve nd
-ve +ve nd
-ve -ve nd
nd nd nd
6 I 12 9 I 11
-positive -negative -no parasites seen -peripheral blood mononuclear cells -reciprocal -cut off is 640 -proportion of positive results
xli
Blood smear
nps
piroplasms <0.1% piroplasms <0.1 o/o nps
nps
nps
nps
nps
nps
piroplasms <0.1°/o nps
nps
nps
nd
3 I 12
T. parva Prevalence of IF AT- tick-infections recip. Titre Serum
80 nd
nd nd
nd nd
2560 nd
2560 nd
640 -ve 01218
320 nd
640 nd
320 nd
320 +ve 2.22°/o
80 nd
5120 nd
320 -ve 01145
nd nd
5 I 10 11 3

APPENDIX IV Table 4: (group I)Summary of results obtained with different methods used to detect carrier status. C If be W75 T. B 1 . . tl ed D 0 31103194 a num r: . parva o em m ect a_y Day post-infection.
0
14
25
40
74
95
109
137
179
207
218
253
305
361
f--
446
493
Died before challenge Prop. +ve
+ve -ve recip. PBM Prop. +ve
Polymerase chain Microscopy reaction- p104 primers Giemsa stain
PBM Blood Lymph extract extract node
smear -ve -ve nd
+ve +ve mac +ve
-ve -ve nd
-ve -ve nd
+ve +ve nd
+ve +ve nd
+ve +ve nd
+ve -ve nd
-ve -ve nd
-ve +ve nd
-ve +ve nd
-ve +ve nd
-ve +ve nd
-ve +ve nd
nd -ve nd
nd -ve nd
nd nd nd
5113 9 I 13
-positive -negative -1 eciprocal -peripheral blood mononuclear cells -proportion of positive results
xlii
Blood smear
nps
piroplasms <0.1%, piroplasms <0.1 o/o nps
piroplasms <0.1% nps
piroplasms <0.1 o/o nps
nps
nps
nps
nps
nps
nps
nd
nd
nd
4 I 13
nd nps IF AT
T. parva Prevalence of IFAT- tick-infections recip. titre Serum
160 nd
320 nd
nd nd
1280 nd
640 nd
320 +ve 7.14°/o
320 nd
640 nd
160 nd
160 nd
320 +ve 1.05°/o
2560 nd
640 -ve 01190
640 nd
nd nd
nd nd
nd nd
6 I 12 213
-not done -no parasites seen -cut off is 1 :640

APPENDIX IV Table 5: (group Il) Summary of results obtained with different methods used to detect carrier status. C If be 1442 a num r: T. . parva A very s b.l ta 1 ate D 0 31103194 ay : Day post Polymerase chain Microscopy T. parva Prevalence of infection reaction - p 1 04 Giemsa stain IFAT- tick-infections
recip. Titre
PBM Blood Lymph Blood Serum extract extract node smear
smear 0 -ve -ve nd nps 160 nd
14 +ve +ve nps nps nd nd
25 +ve -ve nd nps nd nd
40 -ve -ve nd nps 160 nd
74 +ve -ve nd nps 320 nd
95 +ve +ve nd nps 160 -ve 01131
109 +ve -ve nd nps 160 nd
137 +ve -ve nd nps 320 nd
179 +ve -ve nd nps 160 nd
207 -ve -ve nd nps 160 nd
218 -ve -ve nd nps 320 -ve 01186
263 -ve -ve nd nps 640 nd
305 -ve +ve nd nps 320 -ve 01137
361 -ve +ve nd nps 320 nd
456 -ve -ve nd nps 160 -ve 0123
493 -ve +ve nd nps nd nd
522 nd nd nd nps 320 NRtoT.p. A very challenge
Prop. +ve 7 I 15 5115 0 I 16 1 I 13 0/4
+ve -positive recip. -rectprocal -ve -negative nps -no parasites seen nd -not done IFAT -cut off is 1 :640 PBM -peripheral blood mononuclear cells T.p. -T. parva. Prop. +ve -proportion of positive results NR -no reaction
xliii

APPENDIX IV Table 6 (group 11) Summary of results obtained with different methods used to detect carrier status. C If her 1454 T. A S b"l D a num .]!_arva V~ ta 1 ate ay 0:31103194 Day post infection
0
14
15 *
25
40
74
95
109
137
179
207
218
263
305
361
456
493
522
Prop. +ve
+ve nd T.p. NR recip. PBM
Polymerase chain Microscopy reaction- p104 primers G iemsa stain
PBM Blood Lymph Blood extract extract node smear
smear -ve -ve nd nps
+ve +ve macs+ve nps
+ve +ve macs+ve nps
+ve +ve nd nps
+ve -ve nd nps
+ve +ve nd nps
-ve nd nd nps
+ve +ve nd nps
+ve +ve nd nps
-ve +ve nd nps
-ve -ve nd nps
-ve +ve nd nps
-ve -ve nd nps
-ve +ve nd nps
+ve +ve nd nps
-ve -ve nd nps
nd +ve nd nps
nd nd nd nps
8 I 17 11 I 15 0 I 17
-pvsitive -ve -not done * -T. parva IFAT -no reaction Prop. +ve -reciprocal nps -peripheral blood mononuclear cells
xliv
T. parva Prevalence of IF AT- tick-infections recip. Titre Serum
160 nd
nd nd
nd nd
nd nd
10240 nd
1280 nd
640 -ve 01152
640 nd
1280 nd
320 nd
320 nd
160 -ve 01244
2560 nd
1280 -ve 01137
1280 nd
640 -ve 01147
640 nd
640 NR to T.p. A very challenge
11 I 14 014
-negative -Butalex~ treatment -cut off is 640 -proportion of positive results -no parasites seen

APPENDIX IV Table 7: (group Ill) Summary of results obtained with different methods used to detect carrier status. C If her 1447 a num T. .parva B ll V h b aly au_gl an sta i late 17 Day post infection
0
14
25
40
74
95
109
137
179
207
218
263
305
361
456
493
522
Prop.
+ve -ve recip. PBM
+ve
T. p. Prop. +ve
Polymerase chain Microscopy reaction - p 104 Giemsa stain
PBM Blood Lymph extract extract node
smear -ve -ve nd
+ve +ve mac +ve
-ve -ve nd
-ve -ve nd
+ve -ve nd
-ve -ve nd
+ve +ve nd
+ve -ve nd
-ve +ve nd
-ve +ve nd
-ve +ve nd
-ve -ve nd
-ve +ve nd
-ve -ve nd
-ve -ve nd
-ve +ve nd
nd nd nd
4/15 7115
-posit1ve -n~gative
-reciprocal -peripheral blood lymphocytes -T. parva -proportion of positive results
xlv
Blood smear
nps
nps
piroplasms <0.1°/o piroplasms <0.1°/o nps
nps
nps
nps
nps
nps
nps
nps
nps
nps
nps
nps
nd
2 I 15
nd nps IFAT NR
Day 0:31103/94 T. parva Prevalence of IFAT- tick-infections recip. Titre Serum
80 nd
160 nd
160 nd
2560 nd
640 nd
160 -ve 0/143
320 nd
1280 nd
320 nd
320 nd
160 -ve 0/204
2560 nd
1280 -ve
2560 nd
2560 -ve 0/228
640 nd
1280 NR to T.p. A very challenge
9/16 0/4
-not done -no parasites seen -cut off is 640 -no reaction

APPENDIX IV Table 8: (group Ill) Summary of results obtained with different methods used to detect carrier status. Calf number: Day post infection
0
14
25
40
74
95
109
137
179
204
218
263
305
361
456
493
522
Prop.
+ve -ve IFAl nd
+ve
PBM Prop. +ve
1459 T. parva Bally Vaughan stabilate 17 Polymerase chain Microscopy reaction - p 104 Giemsa stain
PBM Blood Lymph Blood extract extract Node smear
-ve -ve nd nps
+ve +ve nps nps
+ve -ve nd nps
-ve -ve nd nps
nd +ve nd nps
+ve -ve nd nps
nd +ve nd nps
-ve -ve nd nps
-ve -ve nd nps
ve- +ve nd nps
-ve +ve nd nps
-ve +ve nd nps
-ve +ve nd nps
-ve +ve nd nps
-ve +ve nd nps
-ve nd nd nps
nd nd nd nd
3 I 13 9114 0 I 15
.. -pos1ttve rec1p. -negative nps -cut off is 640 T. p. -not done NR -peripheral blood mononuclear cells -proportion of positive results
xlvi
Day 0:31103194 T.parva Prevalence of IFAT- tick-infections recip. Titre Serum
160 nd
nd nd
nd nd
2560 nd
640 nd
640 -ve 01148
160 nd
1280 nd
320 nd
160 nd
320 -ve 0124
2560 nd
1280 -ve 0176
640 nd
640d -ve 01231
320 nd
640 NR to T.p. A very challenge
9 I 15 0/4
-reciprocal -no parasites seen -T. parva -no reaction

APPENDIX IV Table 9: (group Iva) Summary of results obtained with different methods used to detect carrier
status. Calf number Day post tick application .
0
14
25
82
117
138
152
180
222
250
264
306
321
402
488
534
566
Prop. +ve
+ve -ve nd PBM recip. Prop. +ve
1456 Ayrshire Ticks. (150 adult R. append. ticks).Day 0:16.02.94 Polymerase chain Microscopy reaction - p 104 Giemsa stain
PBM Blood Lymph extract extract node
smear -ve -ve nd
nd nd mac+ve
nd nd nps
-ve -ve nd
-ve -ve nd weak +I-
+ve -ve nd
-ve +ve nd
+ve +ve nd
-ve -ve nd
-ve +ve nd
-ve +ve nd
-ve -ve nd
-ve -ve ·nd
-ve -ve nd
-ve +ve nd
-ve +ve nd
nd nd nd
2 I 13 6 I 13
-positive -negative -not done -peripheral blood mononuclear cells -reciprocal IFAT (-cut off is 640) -proportion of positive results
xlvii
Blood smear
nps
nps
piroplasms <0.1°/o piroplasms <0.1 °/o piroplasms <0.1°/o piroplasms <0.1°/o piroplasms <O.lo/o piroplasms <0.1°/o piroplasms <0.1°/o piroplasms <0.1% piroplasms <0.1% piroplasms <0.1°/o piroplasms <0.1°/o nps
nps
nps
nd
11 I 15
NR T.p. nps
T. parva Prevalence of IFAT- tick-infections recip. titre
Serum
160 nd
nd nd
nd nd
640 nd
2560 nd
160 +ve 11.6°/o
80 nd
320 nd
160 nd
160 nd
160 +ve 10.24°/o
640 nd
320 nd
320 nd
320 +ve 5.41°/o
160 nd
nd NR to T.p. A very challenge
3 I 13 313
-no reaction -T. parva -no parasites seen

APPENDIX IV Table 10: (group IVb) Summary of results obtained with different methods used to detect carrier
status. Calfnumber: 1437 Chikeya Tick application (150 adult R. app. ticks) Day 0:16.02.96 Day post tick application
0
14
25
82
117
138
152
180
222
250
264
Died before challenge Prop.+ve
+ve -ve nd PBM recip. nps IFAT Prop. +ve
Polymerase chain reaction - p 104
PBM extract
-ve
nd
nd
+ve
+ve
+ve
+ve
+ve
-ve
-ve
-ve
nd
5/8
positive negative -not done
Blood extract nd
nd
+ve
+ve
+ve
nd
3/9
Microscopy giemsa stain
Lymph Node nd
mac +ve
-ve nd
-ve nd
-ve nd
-ve nd
nd
-ve nd
nd
-ve nd
nd
nd
-peripheral blood mononuclear cells -reciprocal -no parasites seen -cut off is 640 -proportion of positive results
xlviii
T.parva Prevalence of IFAT- tick-infections recip. titre
Blood Serum smear nps 80 nd
nps nd nd
piroplasms nd nd <0.1°/o nps 1280 nd
nps 5120 nd
nps 640 +ve 0.38°/o
nps 320 nd
nps 320
piroplasms 320 nd <0.1°/o nps 320 nd
nps 80 +ve 0.5°/o
nd nd nd
2 I 10 3/8 2/2

APPENDIX IV Table 11: (group V) Summary of results obtained with different methods used to detect carrier status. C If ber 1372 H . E E D Y 0 8 a num unyam states xposure A 1 /02/94
Day post POLYMERASE CHAIN MICROSCOPY T.parva Prevalence of exposure REACTION- Pl04 GIEMSA STAIN IF AT- tick-infections
recip. Titre PBM Blood Lymph Blood Serum extract extract node smear smear
0 -ve -ve nd nps 80 nd
11 -ve nd macs -ve nps nd nd
19 -ve nd macs +ve piro<O.l 0/o nd nd
26 -ve -ve nps nps nd nd
37 -ve nd nd nps nd nd
41 -ve nd nd nps nd nd
66 -ve +ve nd nps nd nd
80 -ve +ve nd piro<O.l 0/o 1280 nd
115 -ve -ve nd piro<O.l o/o 640 nd
132 -ve -ve nd piro<O.l% 2560 +ve 68.03o/o
150 -ve +ve nd piro<O.l 0/o 320 nd
178 -ve +ve nd piro<O.l o/o 640 nd
220 -ve -ve nd piro<O.l 0/o 640 +ve 60.6°/o
248 -ve +ve nd piro<O.l 0/o 640 nd
262 -ve +ve nd piro<O.l 0/o 640 nd
304 -ve +ve .nd piro<O.l o/o 10240 nd
319 -ve +ve nd piro<O.l 0/o 2560 +ve 27.2°/o
488 -ve nd nd nd 640 nd
501 -ve +ve nd nd 640 +ve 37.82o/o
535 -ve +ve nd nd 640 nd
563 nd nd nd nd 1280 NR to T.p. A very challenge
Prop. +ve 0 I 19 10114 11 I 16 13 I 14 414
+ve -positive ifat -cut off 1s 640 -ve -negative piro -piroplasms seen PBM -peripheral blood mononuclear cells NR -no reaction nps -no parasites seen T.p -T. parva Prop. +ve -proportion of positive results
xlix

APPENDIX IV Table 12a: (group Vb) Summary of results obtained with different methods used to detect carrier status CalfnumberE1 exposed at Hunyani Estates Day post POLYMERASE CHAIN MICROSCOPY T.parva Prevalence oftick-exposure REACTION- P104 GIEMSA STAIN IF AT -recip. infections
titre PBM extract Blood extract Lympb Blood Serum
node smear smear 0 -ve -ve nd nps 80 nd
42 +ve +ve nd piro<O.l% 1280 nd
128 +ve +ve nd piro<O.I% 1280 nd
137 piro<O.l% 1280 18.88%
175 nd -ve nd piro<O.l% 1280 nd
182 piro<0.1% 640 NR to T.p. Avery challenge
Table 12b: (group Vb) Summary of results obtamed With d1fferent methods used to detect carrier status. Calf number E4 Exposed at Hun} ani Estates DAY POLYMERASE CHAIN MICROSCOPY T.parva Prevalence oftick-post exposure REACTION- Pl04 GIEMSA STAIN IF AT -recip. infections
titre PBM extract Blood extract Lympb Blood
Node smear 0 -ve -ve nd nps 80 nd
42 -ve +ve piro<O.l% 1280 nd
128 +ve +ve piro<O.l% 640 nd
137 piro<0.1% 320 12.39%
175 -ve +ve nd piro<0.1% 320 nd
176 +ve(weak) nd piro<O.l% 320
182 piro<O.l% 320 NR to T.p. A very challenge
Table 12c: (group Vb) Summary of results obtamed w.~h d1tferent methods used to detect earner status. Calf number E5 Exposed at H . Esta unyan1 tes DAY POLYMERASE CHAIN post exposure REACTION- Pl04
~ PBM extract Blood extract
0
42
128
137
175
182
LN PBM nps
NR piro
-ve -ve
-ve -ve
+ve +ve
nd nd
+ve -ve
-Lymph node -peripheral blood mononuclear cells -no parasites seen
-no reaction -piroplasms seen
MICROSCOPY GIEMSA STAIN
Lympb Blood Node smear smears nd
nd
nd
nps
+ve -ve lFAT
T.p.
nps
piro<O.l%
piro<0.1%
piro<O.l%
piro<O.I%
piro<O.l%
.. -pos1t1ve -negative -cut off is 640
-T. parva
T.parva Prevalence of tick-IFAT-recip. infections titre
80 nd
640 nd
640 nd
320 90.44o/o
640 nd
320 NR to T.p. A very challenge

APPENDIX V
Figure 1 The results of dot blot hybridisation to confirm PCR products from samples from Animal No: W70 PBM phenol chloroform extraction Result A 1 Positive control l.Ong amplified T. parva Muguga piros DNA +ve H9 positive control A2 Day 14 p.i. +ve HIO blank Hll A3 Day 2S p. i +ve H12 blank A4 Day 40 p.i. +ve H8 blank AS Day 74 p.i. +ve pta post tick application A6 Day 9S p.i. +ve +ve positive A7 Day 109 p.i. +ve -ve negative AS Day 137 p.i. +ve P/K proteinase K digestion A9 Day 179 p.i. +ve p.i. post infection A 10 Day 204 p.i. +ve All Day 218 p.i. +ve Al2 Day 263 p.i. +ve C 1 Day 278 p.i. +ve C2 Day 361 p.i. +ve C3 Day 446 p.i. weak +ve C4 Day 493 p.i. +ve CS Day 0 -ve EDT A saponin lysed-/ PK digested extracts El Day 14 p.i. +ve E2 Day 14 p.i. -ve E3 Day 2S p.i. -ve E4 Day 40 p.i. +ve ES Day 74 p.i. +ve E6 Day 9S p.i. -ve E7 Day 109 p.i. weak +ve E8 Day 13 7 p.i. weak +ve E9 Day 179 p.i. weak +ve ElO Day 204 p.i. weak +ve E 11 Day 218 p. i. weak positive E 12 Day 263 p.i. weak positive 0 1 Day 278 p.i. +ve 02 Day 361 p.i. weak +ve 03 Day 446 p.i. weak +ve 04 Day 493 p.i. +ve 06 DayO -ve 012 Positive control +ve Hl Positive control 0.1 ng Piroplasm DNA amplified +ve H2 BLANK -ve H3 positive control +ve H4 positive control +ve H5 positive control +ve H6 blank H7 positive control +ve
li

A
B
c
F
G
H

APPENDIX V
Figure 2 The results of dot blot hybridisation to confirm PCR products from samples from Animal No: W73
and W74 using p104 primers. W73 W74 PBMs Phenol chloroform extracts. PBMs Phenol chloroform extracts
Result Result
DayO -ve E 1 positive control +ve
Day 14 p.i +ve E2 Day 14 p.i. +ve
Day 2S p.i -ve E3 Day 2S p.i. -ve
Day40 p.i +ve E4 Day 40 p.i. +ve
Day 74 p.i +ve ES Day 74 p.i. +ve Day9S p.i +ve E6 Day 9S p.i. +ve Day 109 p.i +ve E7 Day 1 09 p. i. +ve Day 137 p.i -ve E8 Day 137 p.i. +ve Day 179 p.i -ve E9 Day 179 p.i. -ve Day204 p.i -ve EIO Day 203 p.i. -ve Day 218 p.i -ve Ell Day218p.i. -ve Day263 p.i -ve E12 Day 263 p.i. -ve
AI A2 A3 A4 AS A6 A7 A8 A9 AIO All Al2 Bl B2 B3 Bl2 Cl W73 C2 C3 C4 CS C6 C7 C8 C9 ClO Cll Cl2 Dl D2 D3 D4 DS Dl2
Day 30S p.i (weak +ve) F 1 Day 30S p.i. -ve
pta p.i. nd
Day 361 p.i -ve Day493 p.i +ve +ve control +ve control +ve EDT A saponin lysed extracts Day 14 p.i +ve Day2S -ve Day40 p. i +ve Day 74 p.i -ve Day 9S p.i -ve
·Day 109 p.i +ve Day 137 p.i -ve Day 179 p.i +ve Day 204 p. i +ve Day 218 p.i +ve Day 263 p.i +ve Day 305 p.i +ve Day 361 p.i +ve Day 4S6 p.i +ve Day 493 p.i +ve Day IS RPG +ve +ve control
post tick application post infection not done +ve
F3 Day 14 RPG(ph~nol) +ve F4 Day 0 -ve Edta saponin lysed P/K digested Gl Day 0 -ve G2 Day 14 p.i. +ve G3 Day 2S p.i. +ve G4 day 40 p.i. +ve GS Day 74 p.i. +ve G6 Day 9S p.i. +ve G7 Day 1 09 p.i. +ve G8 Day 137 p.i. +ve G9 Day 179 p.i. +ve GIO Day 213 p.i. +ve G 11 D~y 221 p.i. +ve G 12 Day 263 p.i. -ve
H9 Boleni +ve control
H3 Bovine DNA -ve control
H12 Muguga piros +vecontrol
P/K proteinase K digestion -ve negative positive
lii


APPENDIX V Figure 3 The results of dot blot hybridisation to confirm PCR products from samples from Animal No: W75 and 1372 using p 104 primers. W75 PBMs Phenol chloroform extracts 1372 PBMs Phenol chloroform
extracts Result Result
AI DayO -ve El DayO -ve A2 Day 14 +ve E2 Day 11 p.e. -ve A3 Day2S -ve E3 Day 19 p.e. -ve A4 Day40 -ve E4 Day26 p.e. -ve AS Day74 +ve ES Day 37 p.e. -ve A6 Day9S nd E6 Day41 p.e. -ve A7 Day 109 +ve E7 Day66 p.e. -ve A8 Day 137 +ve E8 Day 80 p.e. -ve A9 Day 179 -ve E9 Day llS p.e. -ve AlO Day204 -ve EIO Day 132 p.e. -ve All Day 218 -ve Ell Day ISO p.e. -ve Al2 Day 263 -ve El2 Day 178 p.e. -ve Bl Day 30S -ve F1 Day220 p.e. -ve B2 Day 361 -ve F2 Day 248 p.e. -ve B3 Day 13 RPG +ve F3 Day 262 p.e. -ve B4 Day 14 RPG +ve F4 Day 304 p.e. -ve BS Day IS RPG +ve FS Day 319 p.e. -ve Bl2 +ve control F6 Day 320 p.e. -ve
F7 Day402 p.e. -ve F8 Day S3S p.e. -ve
W75 EDT A saponin lysed 1372 EDT A saponon lysed P/K digest digest
Cl .DayO -ve Gl DayO -ve C2 Day 14 +ve G2 Day26 p.e. -ve C3 Day2S -ve G3 Day66 p.e. +ve C4 Day40 -ve G4 Day 80 p.e. +ve CS Day74 +ve GS Day liS p.e. -ve C6 Day9S nd G6 Day 132 p.e. -ve C7 Day 109 +ve G7 Day ISO p.e. -ve C8 Day 137 -ve G8 Day248 p.e. +ve C9 Day 179 -ve G9 Day220 p.e. -ve CIO Day204 +ve GIO Day 262 p.e. +ve Cll Day218 +ve Gll Day 304 p.e. +ve C12 Day263 +ve 012 Dl Day 30S +ve HI Day 319 p.e. +ve D2 Day 361 +ve H2 Day402 p.e. +ve D3 Day4S6 -ve H3 Day S3S p.e. +ve D4 Day493 -ve H4 DS Boleni +ve control HS Boleni positive control DIO +ve control H6 Blank D12 +ve control H7 Bovine DNA H8 Muguga piros DNA
-ve negative +ve positive P/K proteinase K digestion p.i. post infection HIO Muguga piros DNA H12 Muguga piros DNA H9 pta post tick application
Iiii


APPENDIX V Figure 4 The results of dot blot hybridisation to confirm PCR products from samples from Animal No:1437 and 1447 using p104 primers. 1437 1447 Pbms Phenol chloroform extracts.
Result AI DayO -ve A2 Day 14 nd A3 Day25 nd A4 Day82 +ve A5 Day 117 +ve A6 Day 138 +ve A7 Day 152 +ve A8 Day 180 +ve A9 Day215 -ve AIO Day243 -ve All Day257 -ve Al2 Blank
Bl Blank B2 Blank B3 Blank B4 -Bl2 Blank
EDT A saponin lysed P/K digested extracts Result Cl DayO nd C2 Day 14 nd C3 Day 14 pta -ve C4 Day 25 pta -ve C4 Day 82 pta -ve C5 Day 117 pta -ve C6 Day 138 -ve C7 Day 152 +ve C8 Day 180 -ve C9 Day215 +ve C10 Day 243 -ve C11 Day 257 +ve C12 blank Dl - D12 Blank
pta -ve p.i.
post tick application negative post infection
P/K +ve nd
Pbms Phenol chloroform extracts Result
El Day 14 p.i. RPG +ve E2 Day 14 p.i. +ve E3 Day 25 p.i. -ve E4 Day 40 p.i. -ve E5 Day 74 p.i. +ve E6 Day 95 p.i. -ve E7 Day 109 p.i. +ve E8 Day 137 p.i. +ve E9 Day 179 p.i. -ve EIO Day203 p.i. -ve Ell Day 218 p.i. -ve El2 Day 263 p.i. -ve
Fl Day 305 p.i. -ve F2 Day 361 p.i. -ve F3 Day456 p.i. -ve F4 Day 493p.i. -ve F5 Day 14 RPG +ve
EDT A saponin lysed P/K digested extracts Gl G2 G3 G4 G5 G6 G7 08 G9 G\0 Gll Gl2
HI H2 H3 H4 H6 H9 Hl2
proteinase K digestion positi 1e not done
liv
Result Day 14 p.i. +ve Day 15 p.i. +ve Day25 p.i. -ve Day 40 p.i. -ve Day 74 p.i. -ve Day 95 p.i. -ve Day 109 p.i. weak +ve Day 137 p.i. -ve Day 179 p.i. weak +ve Day203 p.i. weak +ve Day 218 p.i. weak +ve Day263 p.i. -ve
Day 305 p.i. +ve Day 361 p.i. -ve Day 456 p.i. -ve Day 493 p.i. +ve Boleni +ve control Muguga +ve control Muguga +ve control

c ...
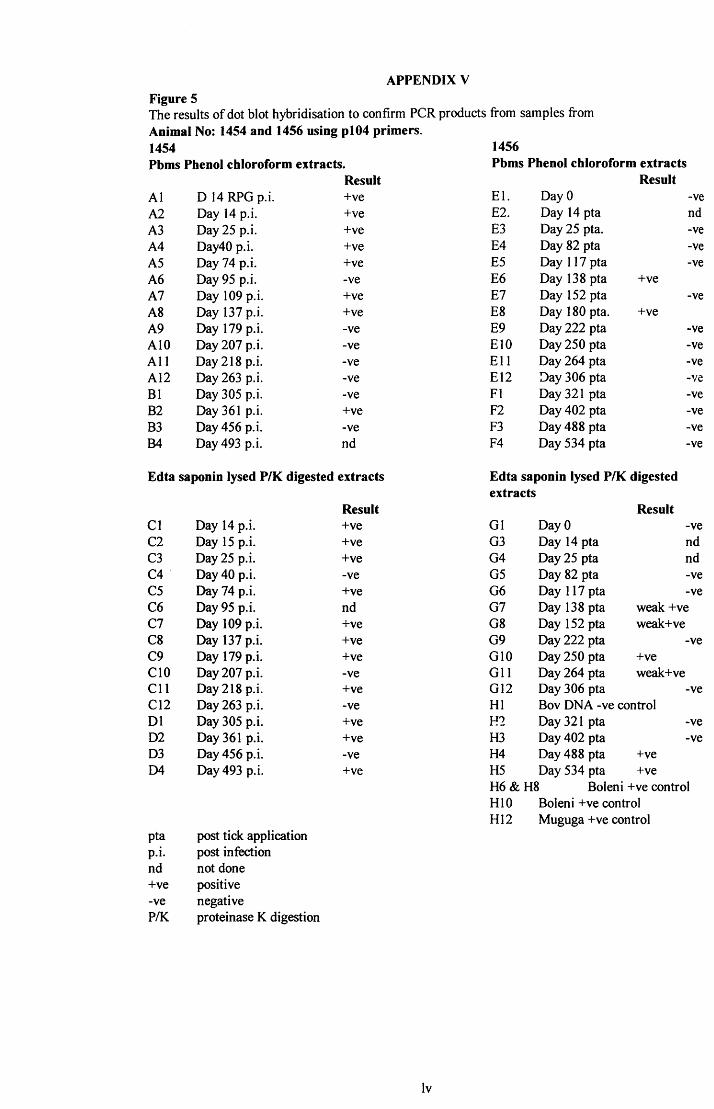
APPENDIX V Figure 5 The results of dot blot hybridisation to confirm PCR products from samples from Animal No: 1454 and 1456 using p104 primers. 1454 1456 Pbms Phenol chloroform extracts. Pbms Phenol chloroform extracts
Result Result AI D 14 RPG p.i. +ve El. DayO -ve A2 Day 14 p.i. +ve E2. Day 14 pta nd A3 Day2S p.i. +ve E3 Day2S pta. -ve A4 Day40 p.i. +ve E4 Day 82 pta -ve AS Day 74 p.i. +ve ES Day 117 pta -ve A6 Day9S p.i. -ve E6 Day 138 pta +ve A7 Day 109 p.i. +ve E7 Day IS2 pta -ve A8 Day 137 p.i. +ve E8 Day 180 pta. +ve A9 Day 179 p.i. -ve E9 Day 222 pta -ve AIO Day207 p.i. -ve EIO Day 2SO pta -ve All Day 218 p.i. -ve Ell Day 264 pta -ve Al2 Day263 p.i. -ve E12 !Jay 306 pta -ve 81 Day 30S p.i. -ve Fl Day 321 pta -ve 82 Day 361 p.i. +ve F2 Day402 pta -ve 83 Day 4S6 p.i. -ve F3 Day488 pta -ve B4 Day493 p.i. nd F4 Day S34 pta -ve
Edta saponin lysed P/K digested extracts Edta saponin lysed P/K digested extracts
Result Result Cl Day 14 p.i. +ve Gl DayO -ve C2 Day 1S p.i. +ve G3 Day 14 pta nd C3 Day 2S p.i. +ve G4 Day 2S pta nd C4. Day40 p.i. -ve GS Day 82 pta -ve CS Day 74 p.i. +ve G6 Day 117 pta -ve C6 Day9S p.i. nd G7 Day 138 pta weak +ve C7 Day 109 p.i. +ve G8 Day IS2 pta weak+ve C8 Day 137 p.i. +ve G9 Day 222 pta -ve C9 Day 179 p.i. +ve GIO Day 2SO pta +ve CIO Day207 p.i. -ve Gll Day 264 pta weak+ve C11 Day 218 p.i. +ve G12 Day 306 pta -ve Cl2 Day263 p.i. -ve HI Bov DNA -ve control Dl Day 30S p.i. +ve I-!'2 Day 321 pta -ve D2 Day 361 p.i. +ve H3 Day 402 pta -ve D3 Day4S6 p.i. -ve H4 Day 488 pta +ve D4 Day493 p.i. +ve HS Day S34 pta +ve
H6&H8 8oleni +ve control HIO Boleni +ve control Hl2 Muguga +ve control
pta post tick application p.i. post infection nd not done +ve positive -ve negative P/K proteinase K digestion
lv

1D 1,1 1,2 __ ~

APPENDIX V Figure 6 The results of dot blot hybridisation to confirm PCR products from samples from Animal No: 1459 and 1442 using p104 primers. 1459 Pbms Phenol chloroform extracts.
Result AI DayO p.i. -ve A2 Day 14 p.i. +ve A3 Day25 p.i. +ve A5 Day40 p.i. -ve A6 Day95 p.i. +ve A7 Day 74 p.i. nd AS Day 109 p.i. nd A9 Day 137 p.i. -ve AIO Day204 p.i. -ve All Day213 p.i. -ve A12 Day 263 p.i. -ve Bl Day 305 p.i. -ve B2 Day 361 p.i. -ve B3 Day 456 p.i. -ve B4 Day493 p.i. nd B5 Boleni positive control Bll Bov DNA -ve control B12 Bov DNA -ve control Edta saponin lysed P/K digested extracts
Cl C2 C3 C4 C5 C6 C7 CS C9 CIO Cll Cl2 Dl D2 D3 D4
pta P/K
Result Day 0 p.i. -ve Day 14.p.i. +ve Day 25 p.i. -ve Day40 p.i. -ve Day 74 p.i. +ve Day 95 p.i. -ve Day 109 p.i. +ve Day 137 p.i. -ve Day 179 p.i. -ve Day 204 p.i. +ve Day 21S p.i. +ve Day 263 p.i. +ve Day 305 p.i. +ve Day 361 p.i. +ve Day 456 p.i. +ve Day493 p.i. nd
post tick application -ve proteinase K digestion nd
negative not done
lvi
El. E2. E3 E4 E5 E6 E7 ES E9 EIO Ell E12 Fl F2 F3 F4 F5
1442 Pbms Phenol chloroform extracts
Result Day 14 p.i. +ve Day 14 p.i. +ve Day25. p.i. +ve Day40 p.i. -ve Day 74 p.i. +ve Day95 p.i. +ve Day 109 p.i .. +ve Day 137 p.i. +ve Day 179 p.i. +ve Day 207 p.i. -ve Day 213 p.i. -ve Day263 p.i. -ve Day 305 p.i. -ve Day 361 p.i. -ve Day456 p.i. -ve Day493 p.i. -ve Boleni +ve control
Edta saponin lysed P/K digested extracts Gl G2 G3 G4 G5 G6 G7 GS G9 GIO Gll 012 HI H2 H3 H4 H5 H7 H9 H12
+ve p.i.
Result DayO -ve Day 14 p.i. +ve Day 25 p.i. -ve Day 40 p.i. -ve Day 74 p.i. -ve Day 95 p.i. weak +ve Day 109 p.i. -ve Day 137 p.i. -ve Day 179 p.i. -ve Day 207 p.i. -ve Day 213 p.i. -ve Day 263 p.i. -ve Day 305 p.i. weak +ve Day 361 p.i. weak +ve Day 456 p.i. -ve Day493 p.i. +ve Boleni +ve control Bovine DNA -ve control Boleni +ve control Muguga +ve control
positive post infection
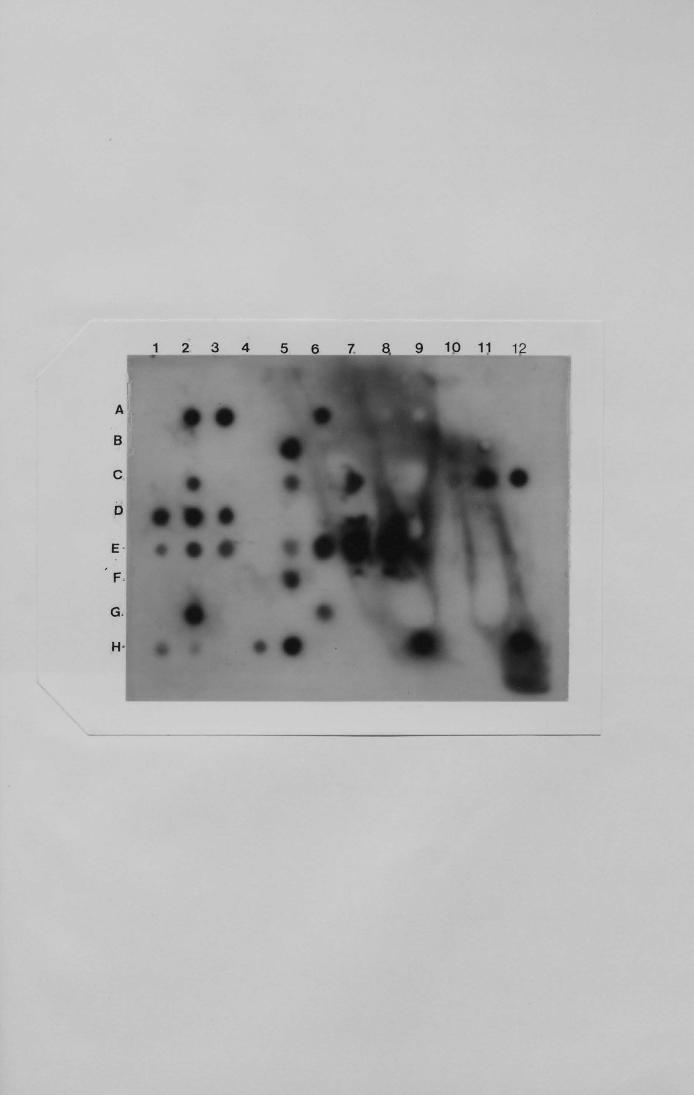
A
B
c
D
E·
f ,
G.
H·
1 2 3 4 r--......-

APPENDIX V Figure 7 PCR results for second Hunyani Estates exposure
Calf El Result AI Day 42 post exposure PBM +ve A2 Day 42 post exposure EDT A blood +ve A3 Day 128 post exposurePBM +ve A4 Day 128 post exposure EDTA +ve AS Day 17S post exposure EDT A -ve
CalfE4 Cl Day 42 post exposure PBM +ve C2 Day 42 post exposure EDT A blood -ve C3 Day 128 post exposurePBM +ve C4 Day I 28 post exposure EDT A +ve CS Day I 7 S post exposure EDT A -ve C6 Day 17S post exposure EDT A +ve C7 Day I 76 post exposure PBM weak +ve
CIO DayO EDTA -ve Cl I DayO PBM -ve
CalfES El Day 42 post exposure PBM +ve E2 Day 42 post exposure EDT A blood -ve E3 Day 42 post exposurePBM -ve E4 Day 128 post exposure EDT A weak +ve ES Day 17S post exposure EDT A -ve F1 Day 42 post exposure PBM -ve
G6 day 17S post exposure PBM +ve
H6 :,H7 T. parva Boleni macroschizont DNA +ve
H8 T. parva Muguga piroplasm DNA +ve
G12 T. parva Muguga piroplasm DNA +ve
AI2 T. parva Muguga piroplasm DNA +ve CI2 T. parva Muguga piroplasm DNA +ve
lvii

6 I
I. .
E-
F-
G-
H-

APPENDIX VI
APPENDIX VI; IFAT RESULTS INDIRECT FLUORESCENT ANTffiODY TEST RECIPROCAL SERUM DILUTIONS
Group I
Day p.i. W70 W73 W74 W75
0 160 80 80 160 17 640 1280 640 320 40 640 1280 2560 1280 46 5120 2560 5120 2560 53 5120 2560 5120 5120 60 1280 2560 5120 1280 67 640 1280 2560 2560 74 1280 320 2560 320 81 640 640 640 640 88 5120 2560 2560 5120 95 640 5120 640 320 109 320 160 320 320 123 640 640 640 640 137 640 640 640 640 151 320 640 320 320 165 320 1280 320 320 179 320 320 320 160 193 160 640 320 640 218 320 320 320 320 221 320 320 80 320 235 320 2560 1280 2560 249 1280 5120 640 5120 263 5120 2560 5120 2560 278 320 320 320 640 291 320 640 ~20 640 305 320 320 320 640 319 640 640 640 333 640 640 640 347 640 320 640 361 320 320 640 375 320 320 160 389 320 160 403 160 320 427 320 640 447 320 640 456 160 320 522 320 640 550 6-W 1280 562 640 1280 572 1280
lViii

APPENDIX VI
INDIRECT FLUORESCENT ANTIBODY TEST RECIPROCAL SERUM DILUTIONS
Group 11 Group Ill
Day p.i. Tag 1454 Tag 1442 Tag 1447 Tag 1459 0 160 160 160 160
17 320 320 160 160 40 5120 320 2560 1280 46 5120 320 2560 2560 53 2560 320 2560 1280 60 2560 160 2560 2560 67 5120 160 2560 640 74 1280 320 640 640 81 1280 160 1280 1280 88 5120 10240 1280 2560 95 640 160 160 640
109 640 160 320 160 123 1280 320 1280 1280 137 1280 320 1280 1280 151 1280 320 640 640 165 640 160 320 320 179 320 160 320 320 193 640 160 640 640 207 160 320 160 320 218 320 320 320 320 235 2560 640 1280 1280 249 10240 640 5120 2560 263 2560 640 2560 2560 278 1280 320 1280 1280 291 2560 640 1280 1280 305 1280 320 1280 1280 319 1280 320 2560 1280 333 1280 640 1280 640 347 1280 640 640 640 361 1280 320 2560 640 375 640 160 1280 160 389 640 640 160 403 640 160 640 320 427 640 160 640 320 447 640 160 320 320 456 1280 640 640 640 522 640 640 640 640 550 640 1280 320 320 562 1280 1280 1280 640 572 1280 1280 1280 640
lix

APPENDIX VI
INDIRECT FLUORESCENT ANTmODY TEST RECIPROCAL SERUM DILUTIONS
Group IV Group Va Day post tick application Day post exposure. Day pta Tag1456 Tag 1437 Days post i Tag 1372
0 160 80 0 160 40 640 1280 40 1280 81 320 320 83 640 87 640 1280 89 1280 95 640 1280 97 1280
101 640 1280 103 1280 108 320 640 110 1280 115 2560 5120 117 640 122 1280 640 124 640 129 1280 10240 131 2560 138 160 640 140 640 150 80 80 152 320 164 160 160 166 640 178 320 320 180 320 192 320 320 194 640 206 160 160 208 640 220 160 320 222 320 234 320 320 236 1280 248 160 320 250 640 264 160 80 266 640 276 320 278 2560 290 1280 292 5120 304 640 306 10240 319 320 321 2560 332 640 334 1280 348 320 350 1280 360 320 362 5120 374 640 376 1280 388 320 390 640 402 320 404 640 416 160 418 320 430 160 432 640 444 160 446 320 468 320 470 640 488 320 501 1280 518 320 520 640 534 640 566 1280 591 1280 593 640 603 1280 605 640 613 1280 6Li 640
0
lx

APPENDIX VI
INDIRECT FLUORESCENT ANTIBODY TEST RECIPROCAL SERUM DILUTION
Group Vb Days _post exposure at Hunyani estates.
.-- El E2 E3 E4 E5
0 80 160 80 160 80 28 640 640 1280 1280 320 40 1280 1280 640 56 640 320 320 70 1280 320 640 128 640 640 640 137 1280 320 320 158 640 320 640
182 640 320 640
203 640 320 640
231 320 640 320 243 640 1280 2560
lxi