Mitogenic and Cytotoxic Effects of Pentachlorophenol to AML 12 Mouse Hepatocytes
Upload
independentCategory
view
1download
0
doi:10.1182/blood-2002-12-3714Prepublished online April 24, 2003;2003 102: 1232-1240
Anne Hagemeijer and Roel WillemzeGiuseppe Leone, Jean-Henri Bourhis, Giuseppe Fioritoni, Ulrich Jehn, Sergio Amadori, Paola Fazi,De Rosa, Amine Belhabri, Rosario Giustolisi, Richard Delarue, Vincenzo Liso, Salvatore Mirto, Stefan Suciu, Franco Mandelli, Theo de Witte, Robert Zittoun, Eugenio Gallo, Boris Labar, Gennaro the EORTC/GIMEMAAML-10 trial(AML) in first complete remission (CR1): an intention-to-treat analysis of
leukemiatreatment of patients younger than 46 years with acute myeloid Allogeneic compared with autologous stem cell transplantation in the
http://bloodjournal.hematologylibrary.org/content/102/4/1232.full.htmlUpdated information and services can be found at:
(1882 articles)Transplantation � (4217 articles)Neoplasia �
(3722 articles)Clinical Trials and Observations �Articles on similar topics can be found in the following Blood collections
http://bloodjournal.hematologylibrary.org/site/misc/rights.xhtml#repub_requestsInformation about reproducing this article in parts or in its entirety may be found online at:
http://bloodjournal.hematologylibrary.org/site/misc/rights.xhtml#reprintsInformation about ordering reprints may be found online at:
http://bloodjournal.hematologylibrary.org/site/subscriptions/index.xhtmlInformation about subscriptions and ASH membership may be found online at:
Copyright 2011 by The American Society of Hematology; all rights reserved.Washington DC 20036.by the American Society of Hematology, 2021 L St, NW, Suite 900, Blood (print ISSN 0006-4971, online ISSN 1528-0020), is published weekly
For personal use only. by guest on June 11, 2013. bloodjournal.hematologylibrary.orgFrom
CLINICAL OBSERVATIONS, INTERVENTIONS, AND THERAPEUTIC TRIALS
Allogeneic compared with autologous stem cell transplantation in the treatment ofpatients younger than 46 years with acute myeloid leukemia (AML) in firstcomplete remission (CR1): an intention-to-treat analysis of theEORTC/GIMEMAAML-10 trialStefan Suciu, Franco Mandelli, Theo de Witte, Robert Zittoun, Eugenio Gallo, Boris Labar, Gennaro De Rosa, Amine Belhabri,Rosario Giustolisi, Richard Delarue, Vincenzo Liso, Salvatore Mirto, Giuseppe Leone, Jean-Henri Bourhis, Giuseppe Fioritoni,Ulrich Jehn, Sergio Amadori, Paola Fazi, Anne Hagemeijer, and Roel Willemze, for the EORTC and GIMEMA Leukemia Groups
In the European Organization for Re-search and Treatment of Cancer Leuke-mia Group and Gruppo Italiano MalattieEmatologiche dell’ Adulto (EORTC-LG/GIMEMA) acute myeloid leukemia(AML)–10 trial, patients in first completeremission (CR1) received a single inten-sive consolidation (IC) course. Subse-quently, those patients younger than 46years with an HLA-identical sibling donorwere assigned to undergo allogeneic (allo)stem cell transplantation (SCT), and pa-tients without such a donor were plannedfor autologous (auto) SCT. Between No-vember 1993 and December 1999, of 1198patients aged younger than 46 years, 822achieved CR. The study group consti-
tuted 734 patients who received IC: 293had a sibling donor and 441 did not.Allo-SCT and auto-SCT were performedin 68.9% and 55.8%, respectively. Cytoge-netic determination was successfully per-formed in 446 patients. Risk groups weregood (t(8;21), inv16), intermediate (NN or�Y only), and bad/very bad (all others).Median follow-up was 4 years; 289 pa-tients relapsed, 66 died in CR1, and 293died. Intention-to-treat analysis revealedthat the 4-year disease-free survival (DFS)rate of patients with a donor versus thosewithout a donor was 52.2% versus 42.2%,P � .044; hazard ratio � 0.80, 95% confi-dence interval (0.64, 0.995), the relapseincidence was 30.4% versus 52.5%, death
in CR1 was 17.4% versus 5.3%, and thesurvival rate was 58.3% versus 50.8%(P � .18). The DFS rates in patients withand without a sibling donor were similarin patients with good/intermediate riskbut were 43.4% and 18.4%, respectively,in patients with bad/very bad risk cytoge-netics. In younger patients (15-35 years),the difference was more pronounced. Thestrategy to perform early allo-SCT led tobetter overall results than auto-SCT, espe-cially for younger patients or those withbad/very bad risk cytogenetics. (Blood.2003;102:1232-1240)
© 2003 by The American Society of Hematology
Introduction
Current standard treatment strategy for patients with acute myelog-enous leukemia (AML) younger than 60 years consists of 1 or 2induction courses with cytosine arabinoside and an anthracyclinefollowed in the case of complete remission (CR) by one or moreintensive consolidation (IC) chemotherapy courses. There is noconsensus about the subsequent treatment modality. Some preferonly chemotherapy,1 ie, continuation of consolidation coursesand/or maintenance chemotherapy; others proceed with some formof allogeneic or autologous stem cell transplantation (allo- orauto-SCT). Several large randomized studies comparing IC courses
with stem cell transplantation, in which patients with an HLA-identical donor were scheduled to receive an allograft, reportcontradictory results.2-11 However, the sizes of these studies weresmall, the follow-up was insufficient, or the intensity of chemo-therapy preceding SCT was not optimal or different. In somestudies comparing chemotherapy versus auto-SCT versus allo-SCT, the design was not appropriate to assess the differencebetween auto-SCT and allo-SCT in terms of disease-free survival(DFS).2,3,6,10 In other studies the analyses were performed accord-ing to treatment actually given, the data on cytogenetics were
From the European Organization for Research and Treatment of Cancer(EORTC) Data Center, Brussels, Belgium; Department of CellularBiotechnology and Hematology, University La Sapienza, Roma, Italy;Department of Hematology, St Radboud University Hospital, Nijmegen, TheNetherlands; Department of Hematology, Hotel-Dieu, Paris, France;Department of Medicine, Hospital S. Giovanni Battista, Torino, Italy;Department of Hematology, University Hospital Rebro, Zagreb, Croatia;Department of Hematology, University Federico II Medical School, Napoli, Italy;Department of Hematology, Hospital Edouard Herriot, Lyon, France;Department of Hematology, Hospital Ferrarotto, Catania, Italy; Department ofHematology, Hospital Necker, Paris, France; Department of Hematology,University degli Study di Bari, Bari, Italy; Department of Hematology, HospitalCervello, Palermo, Italy; Department of Hematology, Catholic University, RomeItaly; Department of Hematology, Institut Gustave Roussy, Villejuif, France;Department of Hematology, Civil Hospital, Pescara, Italy; Department ofHematology, Klinikum Grosshadern Ludwig-Maximilians, Muenchen,Germany; Department of Hematology, University Tor Vergata, Roma, Italy;Gruppo Italiano Malattie Ematologiche dell’ Adulto (GIMEMA) Data Center,Department of Cellular Biotechnology and Hematology, University La
Sapienza, Roma, Italy; Center for Human Genetics, University of Leuven,Leuven, Belgium; Department of Hematology, and Leiden University MedicalCenter, Leiden, the Netherlands.
Submitted December 5, 2002; accepted April 9, 2003. Prepublished online asBlood First Edition Paper, April 24, 2003; DOI 10.1182/blood-2002-12-3714.
Supported in part by grants from the Kay Kendall Foundation, the LeukemiaCooperative Group of the EORTC, and the National Cancer Institute (grants5U10-CA11488-23 through 5U10-CA11488-32).
A list of the members of the EORTC and GIMEMA Leukemia Groups appears inthe “Appendix.”
Reprints: Stefan Suciu, EORTC Data Center, 83 Avenue E. Mounier, 83/11,B-1200, Brussels, Belgium; e-mail: [email protected].
The publication costs of this article were defrayed in part by page chargepayment. Therefore, and solely to indicate this fact, this article is herebymarked ‘‘advertisement’’ in accordance with 18 U.S.C. section 1734.
© 2003 by The American Society of Hematology
1232 BLOOD, 15 AUGUST 2003 � VOLUME 102, NUMBER 4
For personal use only. by guest on June 11, 2013. bloodjournal.hematologylibrary.orgFrom
scarce, or the proportion of patients who received the intendedrandomized treatment modality or the intended allo-SCT was toolow.12 The comparison of the effects of allo- and auto-SCT has alsobeen performed on the basis of registration data of the Internationaland European Blood and Bone Marrow Transplantation Regis-tries.13-15 Because these registries contain only data of patients inwhom a transplantation has been performed, this type of analysis isbiased because of selection of patients with good performance,variability of the interval between the moment of remission and thetransplantation, and exclusion of early relapses.16
In the previous AML-8A trial of the European Organization forResearch and Treatment of Cancer (EORTC) Leukemia Group andthe Italian Gruppo Italiano Malattie Ematologiche dell’ Adulto(GIMEMA) group, it has been shown that auto-SCT leads to asignificantly longer DFS than a second IC course, but significantdifferences between auto-SCT and allo-SCT could not be detected.6
The EORTC and GIMEMA researchers subsequently con-ducted a randomized study (AML-10 trial) for patients with AMLyounger than 61 years. All patients were randomly assigned at thetime of diagnosis for 1 of 3 anthracyclines added to cytosinearabinoside and etoposide as remission induction treatment. Afterachievement of CR an IC course was given. This course was to befollowed by an allo-SCT in the patients with a HLA-identicalfamily donor or by auto-SCT in those who lacked such a donor. Inthe latter group of patients a second randomization was performedto investigate the long-term results of transplantation with peripheralblood stem cells compared with bone marrow–derived stem cells.17
The AML-10 trial offers the possibility in patients up to the ageof 45 years to assess the value of early allo-SCT versus auto-SCTon the basis of intention to treat18 by comparing the outcome of thegroup of patients with an HLA-identical sibling donor (donorgroup) with the outcome of patients without such a donor (nodonor group).
Our analysis indicates that the strategy to perform an earlyallo-SCT was indeed justified in this group of patients younger than45 years, as it led to a longer DFS than the strategy to perform anearly auto-SCT. Subgroup analysis shows that patients withcytogenetical bad/very bad risk characteristics have a betteroutcome when a sibling donor is available. Because of a hightreatment-related mortality (TRM) observed in patients with adonor and with good cytogenetic features, one may question thewisdom of performing an allo-SCT in CR1 in this group of patients.Furthermore, because of a relatively high TRM in patients aged 36to 45 years, the prognosis of these patients with or without a siblingdonor is almost identical, whereas in younger patients the differ-ences were prominent.
Patients and methods
Study design
The EORTC-LG/GIMEMAAML-10 protocol was approved by the EORTCProtocol Review Committee and by the Ethical Committee of eachparticipating center. The study was conducted from November 1993 toDecember 1999 in 80 European centers. All patients, up to the age of 60years, with previously untreated AML, except acute promyelocytic leuke-mia, with more than 30% blast cells in the bone marrow, were eligible.Patients with a blast crisis of chronic myeloid leukemia (CML), AMLsupervening after other myeloproliferative diseases, or AML following amyelodysplastic syndrome of more than 6 months’ duration and patientswith severe heart, lung, liver, renal, hepatic, or neurologic diseases wereexcluded from registration. Before randomization, all patients had to givetheir informed consent, which was in accordance with the Helsinki protocol.
Random assignment for daunorubicin, mitoxantrone, or idarubicin wasperformed at the time of registration. Remission induction treatmentconsisted of cytosine arabinoside 25 mg/m2 intravenous bolus followedimmediately by 100 mg/m2 given as a continuous infusion daily for 10days; etoposide 100 mg/m2 in 0.9% saline daily by intravenous infusion(1 hour) on days 1 to 5; and one of the following: daunorubicin 50 mg/m2 ondays 1, 3, and 5 as a 5-minute infusion or mitoxantrone 12 mg/m2 as a30-minute infusion on days 1, 3, and 5 or idarubicin 10 mg/m2 as a 5-minuteinfusion on days 1, 3, and 5. In case of partial remission a second remissioninduction course was given. In case of CR a single course of consolidationtherapy was administered, which consisted of intermediate-dose cytosinearabinoside (500 mg/m2 every 12 hours in a 2-hour infusion on days 1-6)and the anthracycline, randomly assigned at registration, given on days 4 to6. Patients with a sibling donor were assigned to undergo an allogeneicSCT. All patients without such a donor had to receive an autologous bloodor bone marrow stem cell transplant without any purging. The recom-mended conditioning regimens were as follows: cyclophosphamide(60 mg/kg on 2 consecutive days) and total body irradiation, preferablyfractionated (6 fractions of 2 Gy over 3 days; dose rate � 0.06 Gy/min), orbusulphan 4 mg/kg per day on days �8, �7, �6, and �5 combined withcyclophosphamide 60 mg/kg on days �4 and �3. Graft-versus-hostprophylaxis was performed according to the local policy. T-cell depletion ofthe allogeneic graft was performed in 49 cases by monoclonal antibodies(n � 24), elutriation (n � 17), and other techniques (n � 8).
Patients
Between November 1993 and December 1999, a total of 2157 patients wererandomly assigned in the AML-10 study. Among 1198 patients agedbetween 15 and 46 years, 62 patients were considered as inevaluable for thetreatment response, mainly because of the lack of clinical documentation.Of the remaining 1136 patients, 822 (72.4%) entered complete remissionafter 1 or 2 courses of induction therapy. Among them, 50 patients wereoff-protocol treatment because of toxicity (n � 27) or other reason (n � 8),or they were poorly documented thereafter (n � 15). Of 772 patients whoreceived consolidation, 38 have not been HLA typed because of refusal(n � 9), early death/toxicity (n � 20), logistic reasons (n � 5), and other orunknown reasons (n � 4). Among the 734 patients, 55 had no sibling. Ofthe remaining 679 patients, 293 had an HLA-identical sibling donor (donorgroup) and 386 had no family donor. By adding to this latter group those 55patients with no siblings, a group of 441 patients has been formed, whichwas designated as the no donor group. The median follow-up was 4 years;289 patients relapsed, 66 died in CR1, and overall 293 patients died. With atotal of 355 events, the a posteriori statistical power in detecting adifference in the 4-year DFS rates between 42.4% and 52.2% wasapproximately 0.70.
Criteria of evaluation
The Cancer and Leukemia Group B (CALGB) criteria for response totreatment and relapse were used.19 CR was defined as a morphologicnormal marrow with less than 5% blasts. Normal findings for peripheralblood and differential counts (ie, platelets � 100 � 109/L, polymorpho-nuclear leukocyte [PMN] � 1.5 � 109/L, hemoglobin � 12 g/dL) wererequired at the evaluation of the induction course or at the evaluation ofconsolidation. Among patients who reached CR, relapse was defined as thepresence of more than 10% blasts in the bone marrow or blasts inextramedullary sites.
As cytogenetic classification the International System for CytogeneticNomenclature (ISCN) has been applied.20 A central review (by A.H.) ofcytogenetics has been performed. Twenty analyzed metaphases wererequired to include a patient in the cytogenetic normal karyotype (NNgroup). Complex abnormalities were defined as a clone with at least 4unrelated abnormalities. The patients with unknown, not done, or unsuccess-ful cytogenetics were grouped together as unknown. Regarding morphol-ogy, the French-American-British (FAB) cytologic classification has beenused, and a central review has been done in 44% of cases.21,22
ALLOGENEIC VERSUS AUTOLOGOUS SCT IN AML 1233BLOOD, 15 AUGUST 2003 � VOLUME 102, NUMBER 4
For personal use only. by guest on June 11, 2013. bloodjournal.hematologylibrary.orgFrom

Statistical analysis
The disease-free survival (DFS) was calculated from the date of CR untilthe date of first relapse or of death in first CR. The time to relapse and timeto death in CR were calculated as the DFS; patients who died in CR andthose who relapsed were respectively censored at that moment for these 2analyses. By definition all patients who died in CR were considered as deathfrom treatment-related mortality (TRM). The duration of survival wascalculated from the date of CR until the date of death; patients still alivewere censored at their last follow-up.
Actuarial curves were calculated according to the Kaplan-Meiertechnique.23 The standard errors (SE) of the estimates were computed usingthe Greenwood formula.23 The estimates of the incidence of relapse and ofdeath in CR, and their corresponding standard errors, were obtained usingthe cumulative incidence method, in which the risks of death in CR and ofrelapse were considered as competing risks.24 The differences betweenactuarial curves were tested for statistical significance using the 2-tailedlog-rank test,23 whereas for the cumulative incidences the Gray test wasused.24 The Cox proportional hazards model was used to obtain the estimateand the 95% confidence interval (CI) of the hazard ratio (HR) of theinstantaneous event rate in one group versus the one in another group, asspecified by a given variable, and the Wald test was used to determine theprognostic significance.23 The Cox model was also used to determine theindependent prognostic factors among those that appeared important inunivariate analyses (P � .1), or an a priori interaction with the donoravailability group was suspected (eg, age). The prognostic interactionbetween 2 variables was tested by including the product of these 2 variablesinto the model. All analyses were based on the intent-to-treat principle.
The cutoff date was April 8, 2002. SAS 8.1 statistical software (SASInstitute, Cary, NC) was used.
Results
Relationship between initial patient characteristicsand donor availability
The characteristics of patients with a sibling donor (donor group)and without a sibling donor (no donor group) are shown in Table 1.The distribution regarding age, white blood cell (WBC) count atdiagnosis, FAB subtype, and the CR rate after the first inductioncourse was similar in both groups. In each group approximatelyone third of patients had received 1 of the 3 anthracyclines, and thesex ratio (M/F) was 1.04 in both groups. Results of cytogeneticexamination were unknown in 288 patients: 170 (38.5%) in the nodonor group versus 118 (40.3%) in the donor group. In theremaining 446 patients, the following risk groups were considered:good (t(8;21) or inv16) in 123 patients, intermediate (NN or �Yonly) in 165 patients, bad (all other abnormalities, without goodand very bad cytogenetic features) in 78 patients, and very bad risk(�5, 5q�, �7, 7q�, complex abnormalities, abnormal (abn) 3q,t(9;22), t(6;9), or abn 11q23 and absence of good cytogeneticfeatures) in 80 patients. These subgroups were quite well distrib-uted between the 2 study groups (Table 1); the percentage ofpatients with very bad risk was slightly higher in the donor group(24.0%) than in the no donor group (14.0%).
Relationship between donor availability and stemcell transplantation
Allo-SCT in first CR was performed in 202 (68.9%) of 293 patientswith a sibling donor, and auto-SCT was performed in 246 (55.8%)of 441 patients without such a donor. The conditioning regimenconsisting of either busulphan � cyclophosphamide or cyclophos-phamide � total body irradiation (TBI) was administered in 56%and 44%, respectively, of patients receiving allografts and in 75%
and 25%, respectively, in patients receiving autotransplants. Eleven(2.5%) patients in the no donor group received transplants in firstCR with stem cells of a matched unrelated or phenotypicallyidentical related donor. Seven (2.5%) patients with a sibling donorreceived an autologous SC transplant. The percentages of actuallyperformed SCTs in the cytogenetic subgroups are shown in Table 2.
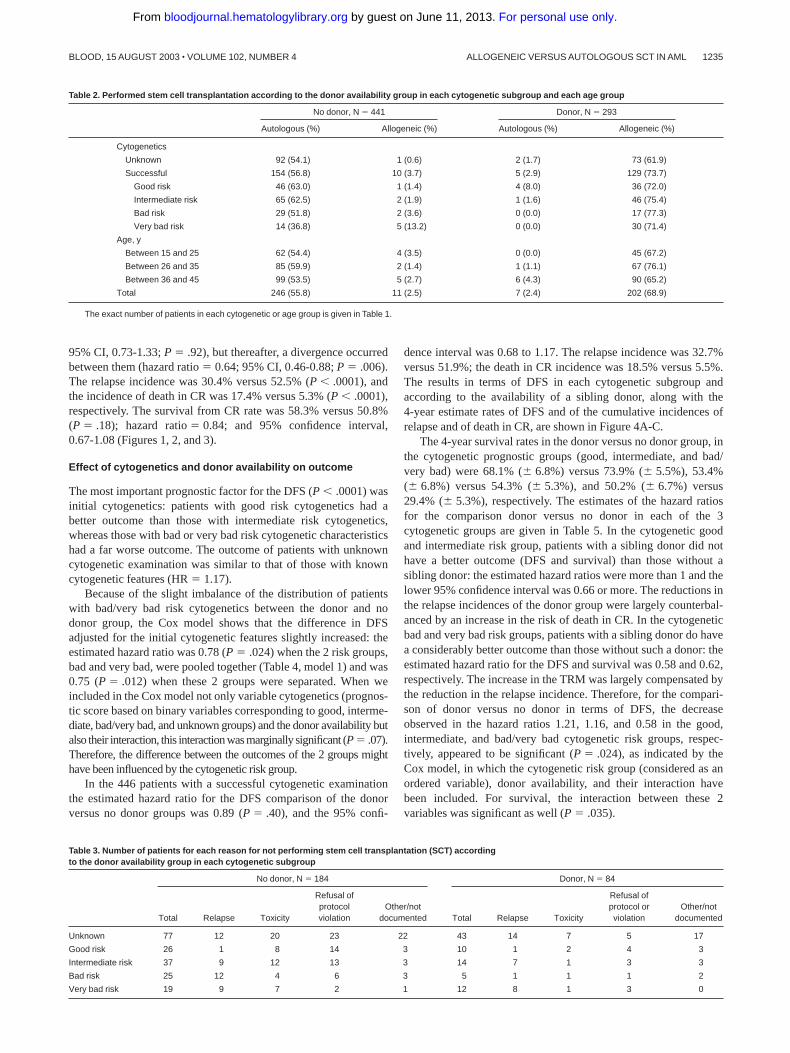
Although the percentages of actually performed SCTs in thedonor group were only slightly different among the cytogeneticsubgroups, in the no donor group a lower percentage (45.7%) ofpatients with bad/very bad cytogenetics received an autologous SCtransplant, and 7.4% of this subgroup received transplants withstem cells of a matched unrelated donor. The low autologoustransplantation rate was due mainly to a high early relapse ratebefore SCT could be performed in the bad/very bad risk group; of44 patients (Table 3) who have not received transplants, 37 relapsedearly. The reasons for no transplantation according to the donoravailability, in each cytogenetic subgroup, are indicated in Table 3.
The study group was divided into groupings of patients aged 16 to25, 26 to 35, and 36 to 45 years. Table 2 shows that the percentages ofpatients who had an auto- or allo-SCT performed in those with andwithout a donor were quite similar in each age grouping.
Effect of donor availability on outcome
The 4-year DFS rate of the donor group was superior to that of theno donor group: 52.2% versus 42.2%, P � .044; hazard ra-tio � 0.80; 95% confidence interval, 0.64-0.995. In the first 9months the curves were superimposable (hazard ratio � 0.99;
Table 1. Patient characteristics according to donor availability
No donor, N � 441 Donor, N � 293
Age, y, median (range) 33 (15-45) 35 (15-45)
Age group
Between 15 y and 25 y, n (%) 114 (25.9) 67 (22.9)
Between 26 y and 35 y, n (%) 142 (32.2) 88 (30.0)
Between 36 y and 45 y, n (%) 185 (42.0) 138 (47.1)
Median WBC count, � 109/L (range) 19.2 (0.4-336) 16.4 (0.6-420)
FAB type
Unknown, n (%) 5 (1.1) 2 (0.7)
M0, n (%) 14 (3.2) 9 (3.1)
M1, n (%) 71 (16.1) 46 (15.7)
M2, n (%) 157 (35.6) 106 (36.2)
M3, n (%)* 2 (0.5) 0 (0.0)
M4, n (%) 75 (17.0) 57 (19.5)
M4E, n (%) 25 (5.6) 22 (7.5)
M5, n (%) 83 (18.8) 40 (13.7)
M6-M7, n (%) 9 (2.1) 11 (3.7)
Courses needed to reach CR
1, n (%) 410 (93.0) 267 (91.1)
2, n (%) 31 (7.0) 26 (8.9)
Cytogenetics
Unknown, n (%) 170 (38.5) 118 (40.3)
Successful, n (%) 271 (61.5) 175 (59.7)
Good risk, n [%]† 73 [26.9] 50 [28.6]
Intermediate risk, n [%]‡ 104 [38.4] 61 [34.9]
Bad, n [%]§ 56 [20.7] 22 [12.6]
Very bad, n [%]� 38 [14.0] 42 [24.0]
Percentages between brackets were calculated for those with a successfulexamination.
*M3 according to the cytology review, but M5 and M2 according to thelocal cytologist.
†Presence of t(8;21) or inv(16).‡NN or �Y only.§Presence of other abnormalities without good or very bad cytogenetic features.�Presence of �5, 5q�, �7, 7q�, complex abnormalities, abn 3q, t(9;22), t(6;9),
or abn 11q23, and absence of good cytogenetic features.
1234 SUCIU et al BLOOD, 15 AUGUST 2003 � VOLUME 102, NUMBER 4
For personal use only. by guest on June 11, 2013. bloodjournal.hematologylibrary.orgFrom
95% CI, 0.73-1.33; P � .92), but thereafter, a divergence occurredbetween them (hazard ratio � 0.64; 95% CI, 0.46-0.88; P � .006).The relapse incidence was 30.4% versus 52.5% (P � .0001), andthe incidence of death in CR was 17.4% versus 5.3% (P � .0001),respectively. The survival from CR rate was 58.3% versus 50.8%(P � .18); hazard ratio � 0.84; and 95% confidence interval,0.67-1.08 (Figures 1, 2, and 3).
Effect of cytogenetics and donor availability on outcome
The most important prognostic factor for the DFS (P � .0001) wasinitial cytogenetics: patients with good risk cytogenetics had abetter outcome than those with intermediate risk cytogenetics,whereas those with bad or very bad risk cytogenetic characteristicshad a far worse outcome. The outcome of patients with unknowncytogenetic examination was similar to that of those with knowncytogenetic features (HR � 1.17).
Because of the slight imbalance of the distribution of patientswith bad/very bad risk cytogenetics between the donor and nodonor group, the Cox model shows that the difference in DFSadjusted for the initial cytogenetic features slightly increased: theestimated hazard ratio was 0.78 (P � .024) when the 2 risk groups,bad and very bad, were pooled together (Table 4, model 1) and was0.75 (P � .012) when these 2 groups were separated. When weincluded in the Cox model not only variable cytogenetics (prognos-tic score based on binary variables corresponding to good, interme-diate, bad/very bad, and unknown groups) and the donor availability butalso their interaction, this interaction was marginally significant (P � .07).Therefore, the difference between the outcomes of the 2 groups mighthave been influenced by the cytogenetic risk group.
In the 446 patients with a successful cytogenetic examinationthe estimated hazard ratio for the DFS comparison of the donorversus no donor groups was 0.89 (P � .40), and the 95% confi-
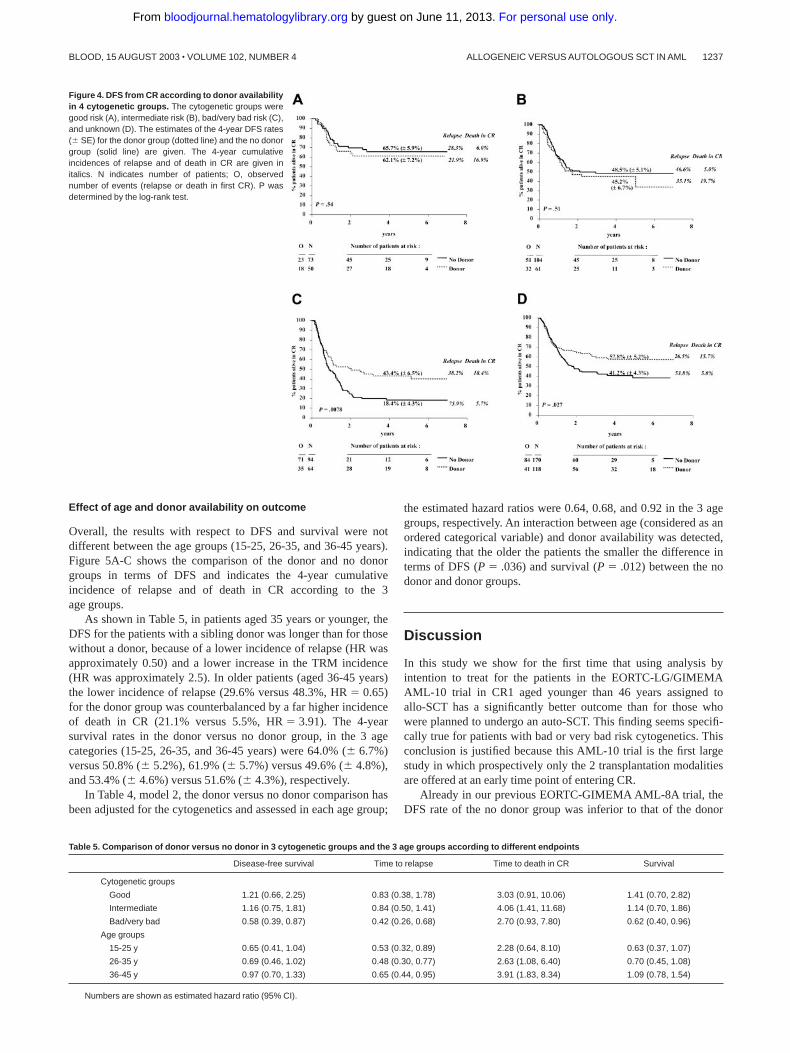
dence interval was 0.68 to 1.17. The relapse incidence was 32.7%versus 51.9%; the death in CR incidence was 18.5% versus 5.5%.The results in terms of DFS in each cytogenetic subgroup andaccording to the availability of a sibling donor, along with the4-year estimate rates of DFS and of the cumulative incidences ofrelapse and of death in CR, are shown in Figure 4A-C.
The 4-year survival rates in the donor versus no donor group, inthe cytogenetic prognostic groups (good, intermediate, and bad/very bad) were 68.1% (� 6.8%) versus 73.9% (� 5.5%), 53.4%(� 6.8%) versus 54.3% (� 5.3%), and 50.2% (� 6.7%) versus29.4% (� 5.3%), respectively. The estimates of the hazard ratiosfor the comparison donor versus no donor in each of the 3cytogenetic groups are given in Table 5. In the cytogenetic goodand intermediate risk group, patients with a sibling donor did nothave a better outcome (DFS and survival) than those without asibling donor: the estimated hazard ratios were more than 1 and thelower 95% confidence interval was 0.66 or more. The reductions inthe relapse incidences of the donor group were largely counterbal-anced by an increase in the risk of death in CR. In the cytogeneticbad and very bad risk groups, patients with a sibling donor do havea considerably better outcome than those without such a donor: theestimated hazard ratio for the DFS and survival was 0.58 and 0.62,respectively. The increase in the TRM was largely compensated bythe reduction in the relapse incidence. Therefore, for the compari-son of donor versus no donor in terms of DFS, the decreaseobserved in the hazard ratios 1.21, 1.16, and 0.58 in the good,intermediate, and bad/very bad cytogenetic risk groups, respec-tively, appeared to be significant (P � .024), as indicated by theCox model, in which the cytogenetic risk group (considered as anordered variable), donor availability, and their interaction havebeen included. For survival, the interaction between these 2variables was significant as well (P � .035).
Table 2. Performed stem cell transplantation according to the donor availability group in each cytogenetic subgroup and each age group
No donor, N � 441 Donor, N � 293
Autologous (%) Allogeneic (%) Autologous (%) Allogeneic (%)
Cytogenetics
Unknown 92 (54.1) 1 (0.6) 2 (1.7) 73 (61.9)
Successful 154 (56.8) 10 (3.7) 5 (2.9) 129 (73.7)
Good risk 46 (63.0) 1 (1.4) 4 (8.0) 36 (72.0)
Intermediate risk 65 (62.5) 2 (1.9) 1 (1.6) 46 (75.4)
Bad risk 29 (51.8) 2 (3.6) 0 (0.0) 17 (77.3)
Very bad risk 14 (36.8) 5 (13.2) 0 (0.0) 30 (71.4)
Age, y
Between 15 and 25 62 (54.4) 4 (3.5) 0 (0.0) 45 (67.2)
Between 26 and 35 85 (59.9) 2 (1.4) 1 (1.1) 67 (76.1)
Between 36 and 45 99 (53.5) 5 (2.7) 6 (4.3) 90 (65.2)
Total 246 (55.8) 11 (2.5) 7 (2.4) 202 (68.9)
The exact number of patients in each cytogenetic or age group is given in Table 1.
Table 3. Number of patients for each reason for not performing stem cell transplantation (SCT) accordingto the donor availability group in each cytogenetic subgroup
No donor, N � 184 Donor, N � 84
Total Relapse Toxicity
Refusal ofprotocolviolation
Other/notdocumented Total Relapse Toxicity
Refusal ofprotocol orviolation
Other/notdocumented
Unknown 77 12 20 23 22 43 14 7 5 17
Good risk 26 1 8 14 3 10 1 2 4 3
Intermediate risk 37 9 12 13 3 14 7 1 3 3
Bad risk 25 12 4 6 3 5 1 1 1 2
Very bad risk 19 9 7 2 1 12 8 1 3 0
ALLOGENEIC VERSUS AUTOLOGOUS SCT IN AML 1235BLOOD, 15 AUGUST 2003 � VOLUME 102, NUMBER 4
For personal use only. by guest on June 11, 2013. bloodjournal.hematologylibrary.orgFrom
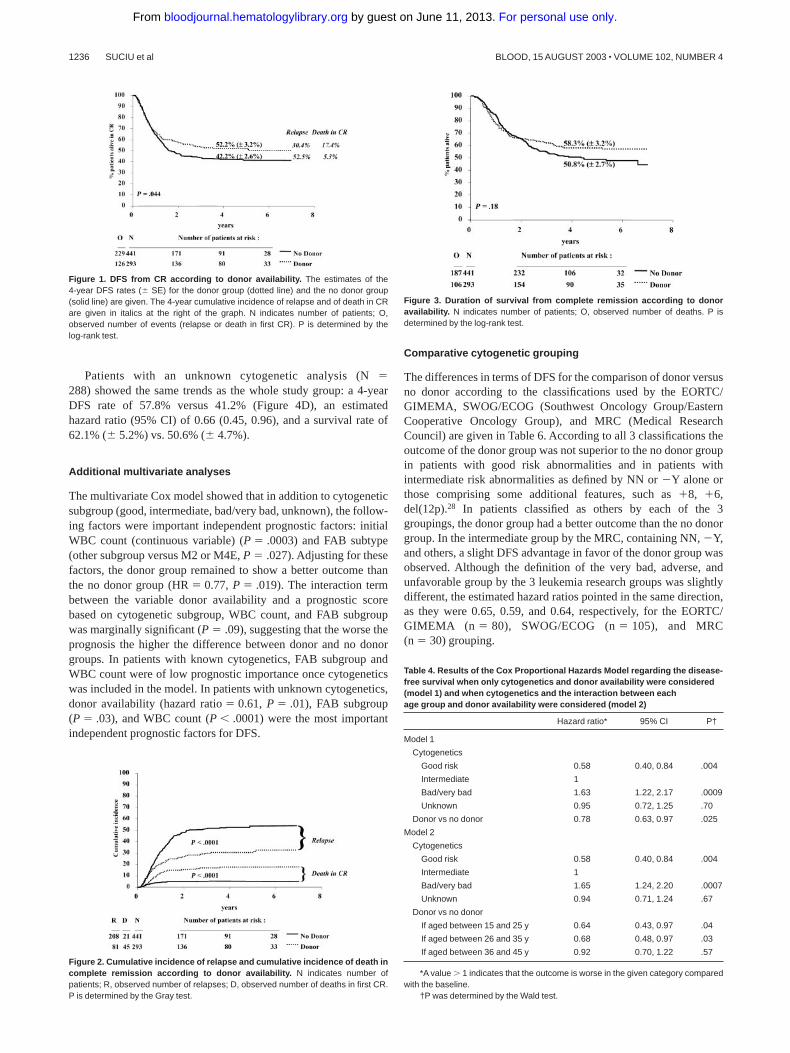
Patients with an unknown cytogenetic analysis (N �288) showed the same trends as the whole study group: a 4-yearDFS rate of 57.8% versus 41.2% (Figure 4D), an estimatedhazard ratio (95% CI) of 0.66 (0.45, 0.96), and a survival rate of62.1% (� 5.2%) vs. 50.6% (� 4.7%).
Additional multivariate analyses
The multivariate Cox model showed that in addition to cytogeneticsubgroup (good, intermediate, bad/very bad, unknown), the follow-ing factors were important independent prognostic factors: initialWBC count (continuous variable) (P � .0003) and FAB subtype(other subgroup versus M2 or M4E, P � .027). Adjusting for thesefactors, the donor group remained to show a better outcome thanthe no donor group (HR � 0.77, P � .019). The interaction termbetween the variable donor availability and a prognostic scorebased on cytogenetic subgroup, WBC count, and FAB subgroupwas marginally significant (P � .09), suggesting that the worse theprognosis the higher the difference between donor and no donorgroups. In patients with known cytogenetics, FAB subgroup andWBC count were of low prognostic importance once cytogeneticswas included in the model. In patients with unknown cytogenetics,donor availability (hazard ratio � 0.61, P � .01), FAB subgroup(P � .03), and WBC count (P � .0001) were the most importantindependent prognostic factors for DFS.
Comparative cytogenetic grouping
The differences in terms of DFS for the comparison of donor versusno donor according to the classifications used by the EORTC/GIMEMA, SWOG/ECOG (Southwest Oncology Group/EasternCooperative Oncology Group), and MRC (Medical ResearchCouncil) are given in Table 6. According to all 3 classifications theoutcome of the donor group was not superior to the no donor groupin patients with good risk abnormalities and in patients withintermediate risk abnormalities as defined by NN or �Y alone orthose comprising some additional features, such as �8, �6,del(12p).28 In patients classified as others by each of the 3groupings, the donor group had a better outcome than the no donorgroup. In the intermediate group by the MRC, containing NN, �Y,and others, a slight DFS advantage in favor of the donor group wasobserved. Although the definition of the very bad, adverse, andunfavorable group by the 3 leukemia research groups was slightlydifferent, the estimated hazard ratios pointed in the same direction,as they were 0.65, 0.59, and 0.64, respectively, for the EORTC/GIMEMA (n � 80), SWOG/ECOG (n � 105), and MRC(n � 30) grouping.
Figure 2. Cumulative incidence of relapse and cumulative incidence of death incomplete remission according to donor availability. N indicates number ofpatients; R, observed number of relapses; D, observed number of deaths in first CR.P is determined by the Gray test.
Figure 3. Duration of survival from complete remission according to donoravailability. N indicates number of patients; O, observed number of deaths. P isdetermined by the log-rank test.
Table 4. Results of the Cox Proportional Hazards Model regarding the disease-free survival when only cytogenetics and donor availability were considered(model 1) and when cytogenetics and the interaction between eachage group and donor availability were considered (model 2)
Hazard ratio* 95% CI P†
Model 1
Cytogenetics
Good risk 0.58 0.40, 0.84 .004
Intermediate 1
Bad/very bad 1.63 1.22, 2.17 .0009
Unknown 0.95 0.72, 1.25 .70
Donor vs no donor 0.78 0.63, 0.97 .025
Model 2
Cytogenetics
Good risk 0.58 0.40, 0.84 .004
Intermediate 1
Bad/very bad 1.65 1.24, 2.20 .0007
Unknown 0.94 0.71, 1.24 .67
Donor vs no donor
If aged between 15 and 25 y 0.64 0.43, 0.97 .04
If aged between 26 and 35 y 0.68 0.48, 0.97 .03
If aged between 36 and 45 y 0.92 0.70, 1.22 .57
*A value � 1 indicates that the outcome is worse in the given category comparedwith the baseline.
†P was determined by the Wald test.
Figure 1. DFS from CR according to donor availability. The estimates of the4-year DFS rates (� SE) for the donor group (dotted line) and the no donor group(solid line) are given. The 4-year cumulative incidence of relapse and of death in CRare given in italics at the right of the graph. N indicates number of patients; O,observed number of events (relapse or death in first CR). P is determined by thelog-rank test.
1236 SUCIU et al BLOOD, 15 AUGUST 2003 � VOLUME 102, NUMBER 4
For personal use only. by guest on June 11, 2013. bloodjournal.hematologylibrary.orgFrom
Effect of age and donor availability on outcome
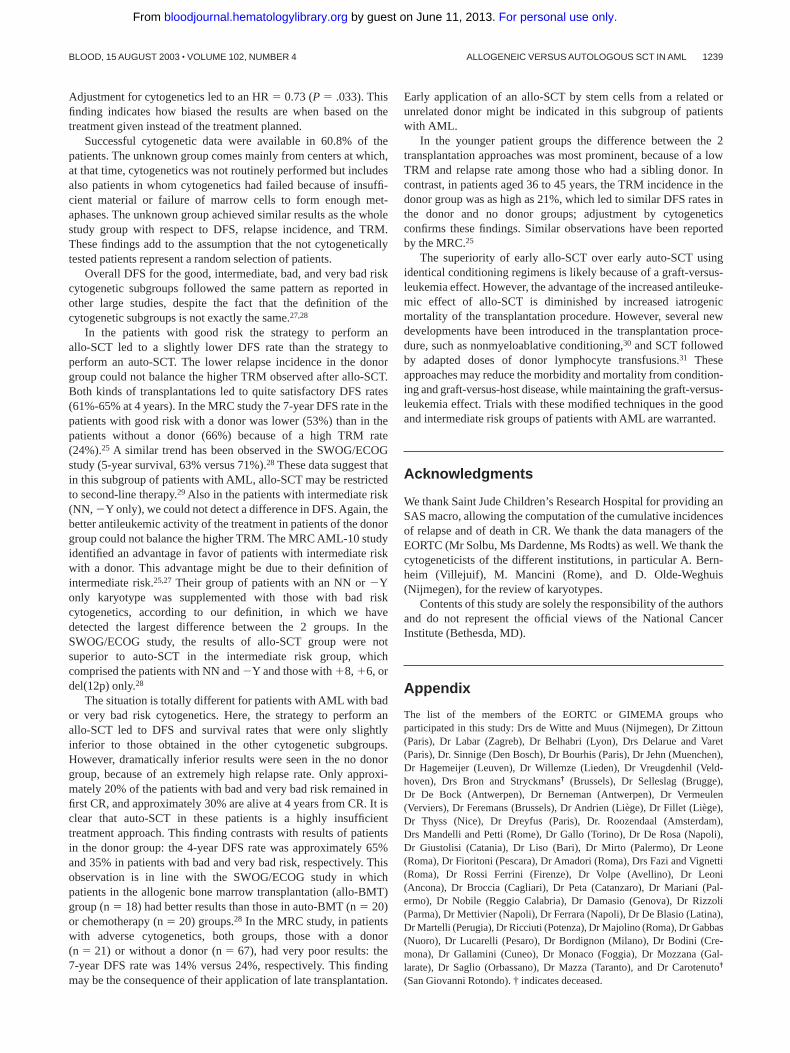
Overall, the results with respect to DFS and survival were notdifferent between the age groups (15-25, 26-35, and 36-45 years).Figure 5A-C shows the comparison of the donor and no donorgroups in terms of DFS and indicates the 4-year cumulativeincidence of relapse and of death in CR according to the 3age groups.
As shown in Table 5, in patients aged 35 years or younger, theDFS for the patients with a sibling donor was longer than for thosewithout a donor, because of a lower incidence of relapse (HR wasapproximately 0.50) and a lower increase in the TRM incidence(HR was approximately 2.5). In older patients (aged 36-45 years)the lower incidence of relapse (29.6% versus 48.3%, HR � 0.65)for the donor group was counterbalanced by a far higher incidenceof death in CR (21.1% versus 5.5%, HR � 3.91). The 4-yearsurvival rates in the donor versus no donor group, in the 3 agecategories (15-25, 26-35, and 36-45 years) were 64.0% (� 6.7%)versus 50.8% (� 5.2%), 61.9% (� 5.7%) versus 49.6% (� 4.8%),and 53.4% (� 4.6%) versus 51.6% (� 4.3%), respectively.
In Table 4, model 2, the donor versus no donor comparison hasbeen adjusted for the cytogenetics and assessed in each age group;
the estimated hazard ratios were 0.64, 0.68, and 0.92 in the 3 agegroups, respectively. An interaction between age (considered as anordered categorical variable) and donor availability was detected,indicating that the older the patients the smaller the difference interms of DFS (P � .036) and survival (P � .012) between the nodonor and donor groups.
Discussion
In this study we show for the first time that using analysis byintention to treat for the patients in the EORTC-LG/GIMEMAAML-10 trial in CR1 aged younger than 46 years assigned toallo-SCT has a significantly better outcome than for those whowere planned to undergo an auto-SCT. This finding seems specifi-cally true for patients with bad or very bad risk cytogenetics. Thisconclusion is justified because this AML-10 trial is the first largestudy in which prospectively only the 2 transplantation modalitiesare offered at an early time point of entering CR.
Already in our previous EORTC-GIMEMA AML-8A trial, theDFS rate of the no donor group was inferior to that of the donor
Table 5. Comparison of donor versus no donor in 3 cytogenetic groups and the 3 age groups according to different endpoints
Disease-free survival Time to relapse Time to death in CR Survival
Cytogenetic groups
Good 1.21 (0.66, 2.25) 0.83 (0.38, 1.78) 3.03 (0.91, 10.06) 1.41 (0.70, 2.82)
Intermediate 1.16 (0.75, 1.81) 0.84 (0.50, 1.41) 4.06 (1.41, 11.68) 1.14 (0.70, 1.86)
Bad/very bad 0.58 (0.39, 0.87) 0.42 (0.26, 0.68) 2.70 (0.93, 7.80) 0.62 (0.40, 0.96)
Age groups
15-25 y 0.65 (0.41, 1.04) 0.53 (0.32, 0.89) 2.28 (0.64, 8.10) 0.63 (0.37, 1.07)
26-35 y 0.69 (0.46, 1.02) 0.48 (0.30, 0.77) 2.63 (1.08, 6.40) 0.70 (0.45, 1.08)
36-45 y 0.97 (0.70, 1.33) 0.65 (0.44, 0.95) 3.91 (1.83, 8.34) 1.09 (0.78, 1.54)
Numbers are shown as estimated hazard ratio (95% CI).
Figure 4. DFS from CR according to donor availabilityin 4 cytogenetic groups. The cytogenetic groups weregood risk (A), intermediate risk (B), bad/very bad risk (C),and unknown (D). The estimates of the 4-year DFS rates(� SE) for the donor group (dotted line) and the no donorgroup (solid line) are given. The 4-year cumulativeincidences of relapse and of death in CR are given initalics. N indicates number of patients; O, observednumber of events (relapse or death in first CR). P wasdetermined by the log-rank test.
ALLOGENEIC VERSUS AUTOLOGOUS SCT IN AML 1237BLOOD, 15 AUGUST 2003 � VOLUME 102, NUMBER 4
For personal use only. by guest on June 11, 2013. bloodjournal.hematologylibrary.orgFrom

group; but here the no donor group was composed of patients whowere randomly assigned to receive autologous bone marrowtransplant (auto-BMT) or a second chemotherapy consolidation.Furthermore, the 6-year survival rate in the AML-8A trial was 8%higher for the donor group as compared with the no donor group,but, because of a limited number of deaths, the difference was notsignificant (P � .24).11 Similarly, Burnett et al25 reported in therecent MRC AML-10 study in which patients after 4 chemotherapycycles continued with allo- or auto-SCT or no further treatment25
that the patients with a donor had a higher 7-year DFS rate than thepatients without a donor (50% versus 42%; P � .01). However, thecomposition of their study group was different, as it includedchildren, patients with acute promyelocytic leukemia, and patients
aged older than 45 years, and only 24% of the patients without adonor received an auto-SC transplant.
In our current study all patients aged younger than 46 years whoachieved a CR and were consolidated by one course of intensivechemotherapy were eligible for either allo- or auto-SCT, dependingon the biologic availability of a sibling donor. The 2 groups, donorand no donor, were comparable with respect to sex, age, initialWBC count, FAB classification, cytogenetic distribution, andnumber of courses to reach CR. Only 55.8% of the patients actuallyreceived an auto-SC transplant and 68.9% received an allo-SCtransplant. Although this figure might be viewed as a limitation, weare convinced, like others,18,26 that comparison on the basis ofintention to treat is the only way to reliably evaluate a treatmentstrategy. Failure to undergo the assigned transplantation wasusually because of early relapse, poor clinical condition, refusal ofthe patient, or failure to harvest sufficient number of stem cells. Inother prospective studies the frequency to perform a transplantationis somehow comparable with ours,2,5,6,25,26 although this findingmay depend on the trial design, number and intensity of chemo-therapy courses before the planned SCT, and patient selection.
In the cytogenetic subgroups of our study the frequency oftransplantation differed. Only 50% of patients without a sibling donorand bad/very bad risk cytogenetics did undergo a transplantation,compared with 73% of the same subgroup of patients in the donorgroup. This frequency was mainly because of early relapses andfailure to harvest sufficient stem cells in the no donor group. Incontrast, 72% of patients with good risk cytogenetics with a donorreceived allo-SC transplants, whereas 63% of those without adonor received auto-SC transplants. These percentages are higherthan in the MRC AML-10 study (52% and 22%, respectively).25
The reasons may be the long interval between the achievement ofCR and the possible transplantation date in the MRC study becauseof the prolonged administration of the chemotherapy coursesand the high TRM rate reported among patients registeredbefore 1994.25
The significant difference in 4-year DFS rate of 10% (95% CI,1.9%-18.1%) in favor of the donor group was due to the lowerrelapse incidence (22%) despite a higher TRM (12%). In patientswho received the planned treatment, the TRM incidence afterallo-SCT (20%) or after auto-SCT (5%) is comparable to the datareported by different registries for patients with AML in firstCR.13-15 The 4-year DFS percentages for patients who actuallyreceived the planned allo- or auto-SC transplant were approxi-mately 10% higher than in the donor and no donor groups.
Figure 5. DFS from CR according to donor availability in the 3 age groups. The age groups were 15 to 25 years (A), 26 to 35 years (B), and 36 to 45 years (C). Theestimates of the 4-year DFS rates (� SE) for the donor group (dotted line) and the no donor group (solid line) are given. The 4-year cumulative incidences of relapse and ofdeath in CR are given in italics. N indicates number of patients; O, observed number of events (relapse or death in first CR). P was determined by the log-rank test.
Table 6. DFS analysis for the comparison of donor versus no donor accordingto the cytogenetic groups and 3 possible grouping systems
No donor, n Donor, n Estimated HR 95% CI
EORTC/GIMEMA
Favorable* 73 50 1.21 0.66, 2.25
NN, �Y only 104 61 1.16 0.75, 1.81
Others (bad)* 56 22 0.33 0.15, 0.75
Very bad* 38 42 0.65 0.39, 1.10
SWOG/ECOG
Favorable† 67 46 1.27 0.67, 2.42
Intermediate‡ 116 67 1.02 0.67, 1.55
Others 36 9 0.27 0.07, 1.16
Unfavorable§ 52 53 0.64 0.40, 1.02
MRC
Favorable* 73 50 1.21 0.66, 2.25
NN, �Y only 104 61 1.16 0.75, 1.81
Others 81 47 0.55 0.64, 0.88
Intermediate� 0.83 0.60, 1.14
Adverse¶ 13 17 0.59 0.26, 1.36
* Favorable cytogenetics is the presence of t(8;21) or inv(16); bad is thepresence of other abnormalities without good or very bad cytogenetic features; verybad is the presence of �5, 5q-, �7, 7q-, complex abnormalities, abn 3q, t(9;22),t(6;9), or abn 11q23, and absence of good cytogenetic features.
† Favorable cytogenetics in this grouping system is the presence of inv(16)with/without secondary aberrations; t(8;21) without del(9q) and complex karyotype.
‡ Intermediate cytogenetics is the presence of NN, �8, �6, �Y, del(12p) withoutpresence of unfavorable features.
§ Unfavorable cytogenetics is the presence of �7, 7q-, �5, 5q-, abn (3q), 9q,11q, 20q, 21q, 17p, t(6;9), t(9;22), or complex, defined as a clone with at least 3unrelated abnormalities.
� Intermediate is the combination of the NN, �Y only group with the other group.¶ Adverse cytogenetics in this grouping system is the presence of �7, �5, 5q-,
abn (3q), or complex, defined as a clone with at least 5 unrelated abnormalities.
1238 SUCIU et al BLOOD, 15 AUGUST 2003 � VOLUME 102, NUMBER 4
For personal use only. by guest on June 11, 2013. bloodjournal.hematologylibrary.orgFrom
Adjustment for cytogenetics led to an HR � 0.73 (P � .033). Thisfinding indicates how biased the results are when based on thetreatment given instead of the treatment planned.
Successful cytogenetic data were available in 60.8% of thepatients. The unknown group comes mainly from centers at which,at that time, cytogenetics was not routinely performed but includesalso patients in whom cytogenetics had failed because of insuffi-cient material or failure of marrow cells to form enough met-aphases. The unknown group achieved similar results as the wholestudy group with respect to DFS, relapse incidence, and TRM.These findings add to the assumption that the not cytogeneticallytested patients represent a random selection of patients.
Overall DFS for the good, intermediate, bad, and very bad riskcytogenetic subgroups followed the same pattern as reported inother large studies, despite the fact that the definition of thecytogenetic subgroups is not exactly the same.27,28
In the patients with good risk the strategy to perform anallo-SCT led to a slightly lower DFS rate than the strategy toperform an auto-SCT. The lower relapse incidence in the donorgroup could not balance the higher TRM observed after allo-SCT.Both kinds of transplantations led to quite satisfactory DFS rates(61%-65% at 4 years). In the MRC study the 7-year DFS rate in thepatients with good risk with a donor was lower (53%) than in thepatients without a donor (66%) because of a high TRM rate(24%).25 A similar trend has been observed in the SWOG/ECOGstudy (5-year survival, 63% versus 71%).28 These data suggest thatin this subgroup of patients with AML, allo-SCT may be restrictedto second-line therapy.29 Also in the patients with intermediate risk(NN, �Y only), we could not detect a difference in DFS. Again, thebetter antileukemic activity of the treatment in patients of the donorgroup could not balance the higher TRM. The MRC AML-10 studyidentified an advantage in favor of patients with intermediate riskwith a donor. This advantage might be due to their definition ofintermediate risk.25,27 Their group of patients with an NN or �Yonly karyotype was supplemented with those with bad riskcytogenetics, according to our definition, in which we havedetected the largest difference between the 2 groups. In theSWOG/ECOG study, the results of allo-SCT group were notsuperior to auto-SCT in the intermediate risk group, whichcomprised the patients with NN and �Y and those with �8, �6, ordel(12p) only.28
The situation is totally different for patients with AML with bador very bad risk cytogenetics. Here, the strategy to perform anallo-SCT led to DFS and survival rates that were only slightlyinferior to those obtained in the other cytogenetic subgroups.However, dramatically inferior results were seen in the no donorgroup, because of an extremely high relapse rate. Only approxi-mately 20% of the patients with bad and very bad risk remained infirst CR, and approximately 30% are alive at 4 years from CR. It isclear that auto-SCT in these patients is a highly insufficienttreatment approach. This finding contrasts with results of patientsin the donor group: the 4-year DFS rate was approximately 65%and 35% in patients with bad and very bad risk, respectively. Thisobservation is in line with the SWOG/ECOG study in whichpatients in the allogenic bone marrow transplantation (allo-BMT)group (n � 18) had better results than those in auto-BMT (n � 20)or chemotherapy (n � 20) groups.28 In the MRC study, in patientswith adverse cytogenetics, both groups, those with a donor(n � 21) or without a donor (n � 67), had very poor results: the7-year DFS rate was 14% versus 24%, respectively. This findingmay be the consequence of their application of late transplantation.
Early application of an allo-SCT by stem cells from a related orunrelated donor might be indicated in this subgroup of patientswith AML.
In the younger patient groups the difference between the 2transplantation approaches was most prominent, because of a lowTRM and relapse rate among those who had a sibling donor. Incontrast, in patients aged 36 to 45 years, the TRM incidence in thedonor group was as high as 21%, which led to similar DFS rates inthe donor and no donor groups; adjustment by cytogeneticsconfirms these findings. Similar observations have been reportedby the MRC.25
The superiority of early allo-SCT over early auto-SCT usingidentical conditioning regimens is likely because of a graft-versus-leukemia effect. However, the advantage of the increased antileuke-mic effect of allo-SCT is diminished by increased iatrogenicmortality of the transplantation procedure. However, several newdevelopments have been introduced in the transplantation proce-dure, such as nonmyeloablative conditioning,30 and SCT followedby adapted doses of donor lymphocyte transfusions.31 Theseapproaches may reduce the morbidity and mortality from condition-ing and graft-versus-host disease, while maintaining the graft-versus-leukemia effect. Trials with these modified techniques in the goodand intermediate risk groups of patients with AML are warranted.
Acknowledgments
We thank Saint Jude Children’s Research Hospital for providing anSAS macro, allowing the computation of the cumulative incidencesof relapse and of death in CR. We thank the data managers of theEORTC (Mr Solbu, Ms Dardenne, Ms Rodts) as well. We thank thecytogeneticists of the different institutions, in particular A. Bern-heim (Villejuif), M. Mancini (Rome), and D. Olde-Weghuis(Nijmegen), for the review of karyotypes.
Contents of this study are solely the responsibility of the authorsand do not represent the official views of the National CancerInstitute (Bethesda, MD).
Appendix
The list of the members of the EORTC or GIMEMA groups whoparticipated in this study: Drs de Witte and Muus (Nijmegen), Dr Zittoun(Paris), Dr Labar (Zagreb), Dr Belhabri (Lyon), Drs Delarue and Varet(Paris), Dr. Sinnige (Den Bosch), Dr Bourhis (Paris), Dr Jehn (Muenchen),Dr Hagemeijer (Leuven), Dr Willemze (Lieden), Dr Vreugdenhil (Veld-hoven), Drs Bron and Stryckmans† (Brussels), Dr Selleslag (Brugge),Dr De Bock (Antwerpen), Dr Berneman (Antwerpen), Dr Vermeulen(Verviers), Dr Feremans (Brussels), Dr Andrien (Liege), Dr Fillet (Liege),Dr Thyss (Nice), Dr Dreyfus (Paris), Dr. Roozendaal (Amsterdam),Drs Mandelli and Petti (Rome), Dr Gallo (Torino), Dr De Rosa (Napoli),Dr Giustolisi (Catania), Dr Liso (Bari), Dr Mirto (Palermo), Dr Leone(Roma), Dr Fioritoni (Pescara), Dr Amadori (Roma), Drs Fazi and Vignetti(Roma), Dr Rossi Ferrini (Firenze), Dr Volpe (Avellino), Dr Leoni(Ancona), Dr Broccia (Cagliari), Dr Peta (Catanzaro), Dr Mariani (Pal-ermo), Dr Nobile (Reggio Calabria), Dr Damasio (Genova), Dr Rizzoli(Parma), Dr Mettivier (Napoli), Dr Ferrara (Napoli), Dr De Blasio (Latina),Dr Martelli (Perugia), Dr Ricciuti (Potenza), Dr Majolino (Roma), Dr Gabbas(Nuoro), Dr Lucarelli (Pesaro), Dr Bordignon (Milano), Dr Bodini (Cre-mona), Dr Gallamini (Cuneo), Dr Monaco (Foggia), Dr Mozzana (Gal-larate), Dr Saglio (Orbassano), Dr Mazza (Taranto), and Dr Carotenuto†
(San Giovanni Rotondo). † indicates deceased.
ALLOGENEIC VERSUS AUTOLOGOUS SCT IN AML 1239BLOOD, 15 AUGUST 2003 � VOLUME 102, NUMBER 4
For personal use only. by guest on June 11, 2013. bloodjournal.hematologylibrary.orgFrom

References
1. Mayer RJ, Davis RB, Schiffer CA, et al. Intensivepost-remission chemotherapy in adults with acutemyeloid leukemia. Cancer and LeukemiaGroup B. N Engl J Med. 1994;331:896-903.
2. Cassileth PA, Harrington DP, Appelbaum F, et al.Chemotherapy compared with autologous or allo-geneic bone marrow transplantation in the man-agement of acute myeloid leukemia in first remis-sion. N Engl J Med. 1998;339:1649-1656.
3. Reiffers J, Gaspard MH, Maraninchi D, et al.Comparison of allogeneic or autologous bonemarrow transplantation and chemotherapy in pa-tients with acute myeloid leukemia in first remis-sion: a prospective controlled trial. Br J Haematol.1989;72:57-63.
4. Reiffers J, Stoppa AM, Attal M, et al. Allogeneic vsautologous stem cell transplantation vs chemo-therapy in patients with acute myeloid leukemia infirst remission: the BGMT 87 study. Leukemia.1996;10:1874-1882.
5. Harousseau JL, Cahn JY, Pignon B, et al. Com-parison of autologous bone marrow transplanta-tion and intensive chemotherapy as postremis-sion therapy in adult acute myeloid leukemia.The Groupe Ouest Est Leucemies AiguesMyeloblastiques (GOELAM). Blood. 1997;90:2978-2986.
6. Zittoun RA, Mandelli F, Willemze R, et al. Autolo-gous or allogeneic bone marrow transplantationcompared with intensive chemotherapy in acutemyelogenous leukemia. N Engl J Med. 1995;332:217-223.
7. Lowenberg B, Verdonck LJ, Dekker AW, et al.Autologous bone marrow transplantation in acutemyelogenous leukemia in first remission: resultsof a Dutch prospective study. J Clin Oncol. 1990;8:287-294.
8. Mitus AJ, Miller KB, Schenkein DP, et al. Im-proved survival for patients with acute myeloge-neous leukemia. J Clin Oncol. 1995;13:560-569.
9. Sierra J, Brunet S, Granena A, et al. Feasibilityand results of bone marrow transplantation afterremission induction and intensification chemo-therapy in de novo acute myeloid leukemia. Cata-lan Group for Bone Marrow Transplantation.J Clin Oncol. 1996;14:1353-1363.
10. Burnett AK, Goldstone AH, Stevens R, et al. Ran-domised comparison of addition of autologousbone-marrow transplantation to intensive chemo-
therapy for acute myeloid leukaemia in first remis-sion: results of MRC AML 10 trial. Lancet. 1998;351:700-708.
11. Keating S, de Witte T, Suciu S, et al. The influ-ence of HLA-matched sibling donor availability ontreatment outcome for patients with AML: ananalysis of the AML 8A study of the EORTC Leu-kemia Cooperative Group and GIMEMA. Br JHaematol. 1998;102:1344-1353.
12. Frassoni F. Commentary and randomised studiesin acute myeloid leukaemia: the double truth.Bone Marrow Transplant. 2002;25:471-473.
13. Gale RP, Buchner T, Zhang M-J, et al. HLA-identi-cal sibling bone marrow transplants vs chemo-therapy for acute myelogenous leukaemia in firstremission. Leukemia. 1996;10:1687-1691.
14. Gale RP, Horowitz MM, Weiner RS, et al. Impactof cytogenetic abnormalities on outcome of bonemarrow transplants in acute myelogenous leuke-mia in first remission. Bone Marrow Transplant.1995;16:203-208.
15. Gorin NC, Aegerter P, Auvert B. Autologous bonemarrow transplantation for acute leukemia in re-mission: an analysis of 1322 cases. HamatolBluttransfus. 1990;33:660-666.
16. Hermans J, Suciu S, Stijnen T, et al. Treatment ofacute myelogenous leukemia: an EBMT-EORTCretrospective analysis of chemotherapy versusallogeneic or autologous bone marrow transplan-tation. Eur J Cancer Clin Oncol. 1989;25:545-550.
17. de Witte T, Keating S, Suciu S, et al. A random-ised comparison of the value of autologous BMTversus autologous PSCT for patients with AML infirst CR in the AML 10 trial of the EORTC LCGand GIMEMA [abstract]. Blood. 2001;98:11.
18. Gray R, Wheatley K. How to avoid bias whencomparing bone marrow transplantation with che-motherapy. Bone Marrow Transplant. 1991;7:9-12.
19. Yates J, Glidewell O, Wiernik P, et al. Cytosinearabinoside with daunorubicin or adriamycin fortherapy of acute myelocytic leukemia: a CALGBstudy. Blood. 1982;60:454-462.
20. Mitelman F, ed. ISCN 1995: An International Sys-tem for Human Cytogenetic Nomenclature.Basel, Switzerland: S. Karger, 1995.
21. Bennett JM, Catovsky D, Daniel MT, et al. Pro-
posed revised criteria for the classification of theacute myeloid leukemia: a report of the French-American-British Cooperative Group. Ann InternMed. 1985;103:620-625.
22. Bennett JM, Catovsky D, Daniel MT, et al. Pro-posal for the recognition of minimally differenti-ated acute myeloid leukaemias (AML-M0). Br JHaematol. 1991;78:325-329.
23. Klein JP, Moeschberger ML. Survival Analysis:Techniques for Censored and Truncated Data.Statistics for Biology and Health. New York:Springer-Verlag; 1997.
24. Gray RJ. A class of K-sample tests for comparingthe cumulative incidence of a competing risk. AnnStat. 1988;16:1141-1154.
25. Burnett AK, Wheatley K, Goldstone AH, et al. Thevalue of allogeneic bone marrow transplantationin patients with acute myeloid leukaemia at differ-ing risk of relapse: results of the UK MRC AML 10trial. Br J Haematol. 2002;118:385-400.
26. Burnett AK. Current controversies: which patientswith acute myeloid leukaemia should receive abone marrow transplantation? An adult treater’sview. Br J Haematol. 2002;118:357-364.
27. Grimwade D, Walker H, Oliver F, et al. The impor-tance of diagnostic cytogenetics on outcome inAML: analysis of 1612 patients entered into theMRC AML 10 trial. Blood. 1998;92:2322-2333.
28. Slovak ML, Kopecky J, Casseleth PA, et al.Karyotypic analysis predicts outcome of pre-remission and postremission therapy in adultacute myeloid leukemia: a Southwest OncologyGroup/Eastern Cooperative Oncology GroupStudy. Blood. 2000;96:4075-4083.
29. Lowenberg B, Downing JR, Burnett A. Acute my-eloid leukemia. N Engl J Med. 1999;341:1051-1062.
30. Slavin S, Aker M, Shapira MY, Panigrahi S, Gab-riel C, Or R. Non-myeloablative stem cell trans-plantation for the treatment of cancer and life-threatening non-malignant disorders: pastaccomplishments and future goals. TransfusApheresis Sci. 2002;27:159-166.
31. Kolb HJ, Schattenberg A, Goldman JM, et al.Graft-versus-leukemia effect of donor lymphocytetransfusions in marrow grafted patients. Euro-pean Group for Blood and Marrow Transplanta-tion Working Party Chronic Leukemia. Blood.1995;86:2041-2050.
1240 SUCIU et al BLOOD, 15 AUGUST 2003 � VOLUME 102, NUMBER 4
For personal use only. by guest on June 11, 2013. bloodjournal.hematologylibrary.orgFrom
Copyright © 2022 FDOKUMEN