


Algebra I - Mr. Zirkle Language Arts
941
-
Upload
khangminh22 -
Category
Documents
-
view
0 -
download
0
Transcript of Algebra I - Mr. Zirkle Language Arts


Algebra I
Andrew Gloag, (AndrewG)Anne Gloag, (AnneG)
Say Thanks to the AuthorsClick http://www.ck12.org/saythanks
(No sign in required)

www.ck12.org iii
To access a customizable version of this book, as well as otherinteractive content, visit www.ck12.org
CK-12 Foundation is a non-profit organization with a mission toreduce the cost of textbook materials for the K-12 market bothin the U.S. and worldwide. Using an open-content, web-basedcollaborative model termed the FlexBook®, CK-12 intends to pi-oneer the generation and distribution of high-quality educationalcontent that will serve both as core text as well as provide anadaptive environment for learning, powered through the FlexBookPlatform®.
Copyright © 2011 CK-12 Foundation, www.ck12.org
The names “CK-12” and “CK12” and associated logos and theterms “FlexBook®”, and “FlexBook Platform®”, (collectively“CK-12 Marks”) are trademarks and service marks of CK-12Foundation and are protected by federal, state and internationallaws.
Any form of reproduction of this book in any format or medium,in whole or in sections must include the referral attribution linkhttp://www.ck12.org/saythanks (placed in a visible location) inaddition to the following terms.
Except as otherwise noted, all CK-12 Content (includingCK-12 Curriculum Material) is made available to Usersin accordance with the Creative Commons Attribution/Non-Commercial/Share Alike 3.0 Unported (CC-by-NC-SA) License(http://creativecommons.org/licenses/by-nc-sa/3.0/), as amendedand updated by Creative Commons from time to time (the “CCLicense”), which is incorporated herein by this reference.
Complete terms can be found at http://www.ck12.org/terms.
Printed: February 29, 2012
AUTHORSAndrew Gloag, (AndrewG)Anne Gloag, (AnneG)

iv www.ck12.org
1 Equations and Functions 1
1.1 Variable Expressions . . . . . . . . . . . . . . . . . . . . . . . . . . . . . . . . . . . . . . . . . . 2
1.2 Order of Operations . . . . . . . . . . . . . . . . . . . . . . . . . . . . . . . . . . . . . . . . . . . 9
1.3 Patterns and Equations . . . . . . . . . . . . . . . . . . . . . . . . . . . . . . . . . . . . . . . . . 19
1.4 Equations and Inequalities . . . . . . . . . . . . . . . . . . . . . . . . . . . . . . . . . . . . . . . 28
1.5 Functions as Rules and Tables . . . . . . . . . . . . . . . . . . . . . . . . . . . . . . . . . . . . . 37
1.6 Functions as Graphs . . . . . . . . . . . . . . . . . . . . . . . . . . . . . . . . . . . . . . . . . . . 46
1.7 Problem-Solving Plan . . . . . . . . . . . . . . . . . . . . . . . . . . . . . . . . . . . . . . . . . . 66
1.8 Problem-Solving Strategies: Make a Table and Look for a Pattern . . . . . . . . . . . . . . . . . . 70
1.9 Additional Resources . . . . . . . . . . . . . . . . . . . . . . . . . . . . . . . . . . . . . . . . . . 81
2 Real Numbers 82
2.1 Integers and Rational Numbers . . . . . . . . . . . . . . . . . . . . . . . . . . . . . . . . . . . . . 83
2.2 Addition of Rational Numbers . . . . . . . . . . . . . . . . . . . . . . . . . . . . . . . . . . . . . 93
2.3 Subtraction of Rational Numbers . . . . . . . . . . . . . . . . . . . . . . . . . . . . . . . . . . . . 100
2.4 Multiplication of Rational Numbers . . . . . . . . . . . . . . . . . . . . . . . . . . . . . . . . . . 107
2.5 The Distributive Property . . . . . . . . . . . . . . . . . . . . . . . . . . . . . . . . . . . . . . . . 116
2.6 Division of Rational Numbers . . . . . . . . . . . . . . . . . . . . . . . . . . . . . . . . . . . . . 123
2.7 Square Roots and Real Numbers . . . . . . . . . . . . . . . . . . . . . . . . . . . . . . . . . . . . 129
2.8 Problem-Solving Strategies: Guess and Check, Work Backward . . . . . . . . . . . . . . . . . . . 138
3 Equations of Lines 147
3.1 One-Step Equations . . . . . . . . . . . . . . . . . . . . . . . . . . . . . . . . . . . . . . . . . . . 148
3.2 Two-Step Equations . . . . . . . . . . . . . . . . . . . . . . . . . . . . . . . . . . . . . . . . . . . 157
3.3 Multi-Step Equations . . . . . . . . . . . . . . . . . . . . . . . . . . . . . . . . . . . . . . . . . . 166
3.4 Equations with Variables on Both Sides . . . . . . . . . . . . . . . . . . . . . . . . . . . . . . . . 174
3.5 Ratios and Proportions . . . . . . . . . . . . . . . . . . . . . . . . . . . . . . . . . . . . . . . . . 182
3.6 Scale and Indirect Measurement . . . . . . . . . . . . . . . . . . . . . . . . . . . . . . . . . . . . 192
3.7 Percent Problems . . . . . . . . . . . . . . . . . . . . . . . . . . . . . . . . . . . . . . . . . . . . 201
3.8 Problem Solving Strategies: Use a Formula . . . . . . . . . . . . . . . . . . . . . . . . . . . . . . 213

www.ck12.org v
4 Graphs of Equations and Functions 220
4.1 The Coordinate Plane . . . . . . . . . . . . . . . . . . . . . . . . . . . . . . . . . . . . . . . . . . 221
4.2 Graphs of Linear Equations . . . . . . . . . . . . . . . . . . . . . . . . . . . . . . . . . . . . . . . 233
4.3 Graphing Using Intercepts . . . . . . . . . . . . . . . . . . . . . . . . . . . . . . . . . . . . . . . 242
4.4 Slope and Rate of Change . . . . . . . . . . . . . . . . . . . . . . . . . . . . . . . . . . . . . . . . 253
4.5 Graphs Using Slope-Intercept Form . . . . . . . . . . . . . . . . . . . . . . . . . . . . . . . . . . 263
4.6 Direct Variation Models . . . . . . . . . . . . . . . . . . . . . . . . . . . . . . . . . . . . . . . . . 273
4.7 Linear Function Graphs . . . . . . . . . . . . . . . . . . . . . . . . . . . . . . . . . . . . . . . . . 281
4.8 Problem-Solving Strategies - Graphs . . . . . . . . . . . . . . . . . . . . . . . . . . . . . . . . . . 290
5 Writing Linear Equations 298
5.1 Linear Equations in Slope-Intercept Form . . . . . . . . . . . . . . . . . . . . . . . . . . . . . . . 299
5.2 Linear Equations in Point-Slope Form . . . . . . . . . . . . . . . . . . . . . . . . . . . . . . . . . 311
5.3 Linear Equations in Standard Form . . . . . . . . . . . . . . . . . . . . . . . . . . . . . . . . . . . 320
5.4 Equations of Parallel and Perpendicular Lines . . . . . . . . . . . . . . . . . . . . . . . . . . . . . 329
5.5 Fitting a Line to Data . . . . . . . . . . . . . . . . . . . . . . . . . . . . . . . . . . . . . . . . . . 339
5.6 Predicting with Linear Models . . . . . . . . . . . . . . . . . . . . . . . . . . . . . . . . . . . . . 353
5.7 Problem Solving Strategies: Use a Linear Model . . . . . . . . . . . . . . . . . . . . . . . . . . . 364
6 Graphing Linear Inequalities; Introduction to Probability 372
6.1 Inequalities Using Addition and Subtraction . . . . . . . . . . . . . . . . . . . . . . . . . . . . . . 373
6.2 Inequalities Using Multiplication and Division . . . . . . . . . . . . . . . . . . . . . . . . . . . . . 380
6.3 Multi-Step Inequalities . . . . . . . . . . . . . . . . . . . . . . . . . . . . . . . . . . . . . . . . . 386
6.4 Compound Inequalities . . . . . . . . . . . . . . . . . . . . . . . . . . . . . . . . . . . . . . . . . 396
6.5 Absolute Value Equations . . . . . . . . . . . . . . . . . . . . . . . . . . . . . . . . . . . . . . . . 406
6.6 Absolute Value Inequalities . . . . . . . . . . . . . . . . . . . . . . . . . . . . . . . . . . . . . . . 417
6.7 Linear Inequalities in Two Variables . . . . . . . . . . . . . . . . . . . . . . . . . . . . . . . . . . 423
7 Solving Systems of Equations and Inequalities 438
7.1 Linear Systems by Graphing . . . . . . . . . . . . . . . . . . . . . . . . . . . . . . . . . . . . . . 439
7.2 Solving Linear Systems by Substitution . . . . . . . . . . . . . . . . . . . . . . . . . . . . . . . . 451
7.3 Solving Linear Systems by Elimination through Addition or Subtraction . . . . . . . . . . . . . . . 459
7.4 Solving Systems of Equations by Multiplication . . . . . . . . . . . . . . . . . . . . . . . . . . . . 465
7.5 Special Types of Linear Systems . . . . . . . . . . . . . . . . . . . . . . . . . . . . . . . . . . . . 474
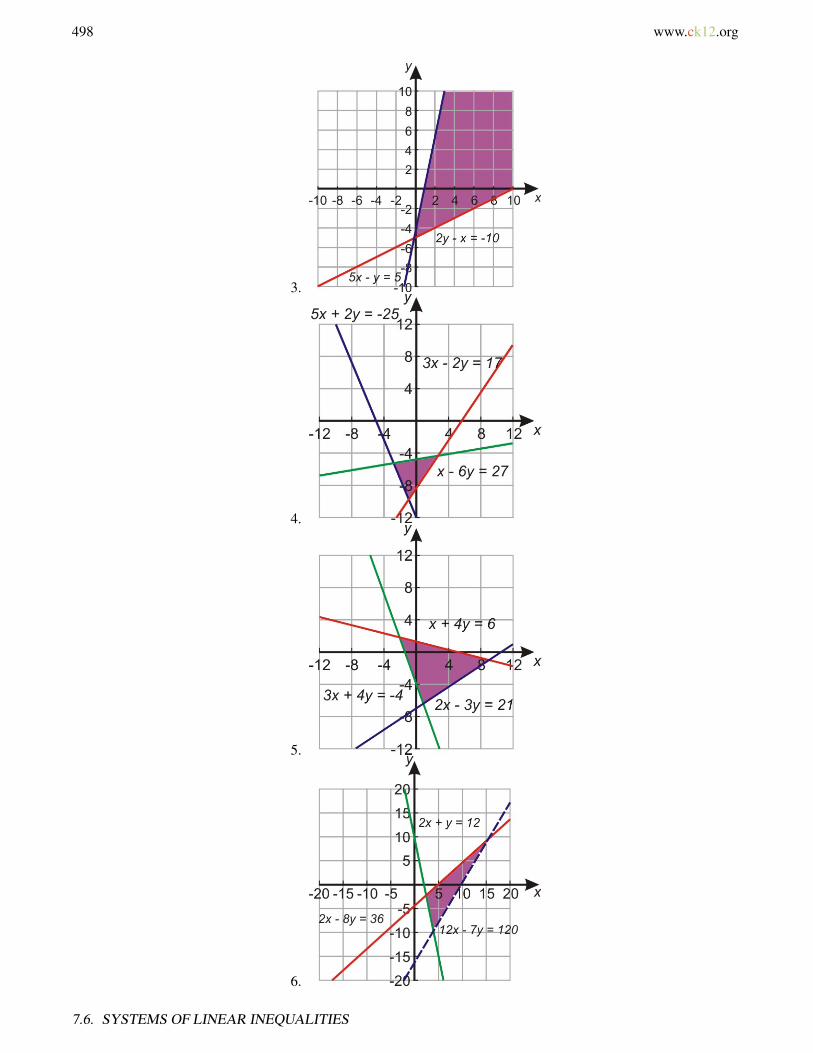
7.6 Systems of Linear Inequalities . . . . . . . . . . . . . . . . . . . . . . . . . . . . . . . . . . . . . 484
8 Exponential Functions 500
8.1 Exponent Properties Involving Products . . . . . . . . . . . . . . . . . . . . . . . . . . . . . . . . 501
vi www.ck12.org
8.2 Exponent Properties Involving Quotients . . . . . . . . . . . . . . . . . . . . . . . . . . . . . . . . 509
8.3 Zero, Negative, and Fractional Exponents . . . . . . . . . . . . . . . . . . . . . . . . . . . . . . . 517
8.4 Scientific Notation . . . . . . . . . . . . . . . . . . . . . . . . . . . . . . . . . . . . . . . . . . . 526
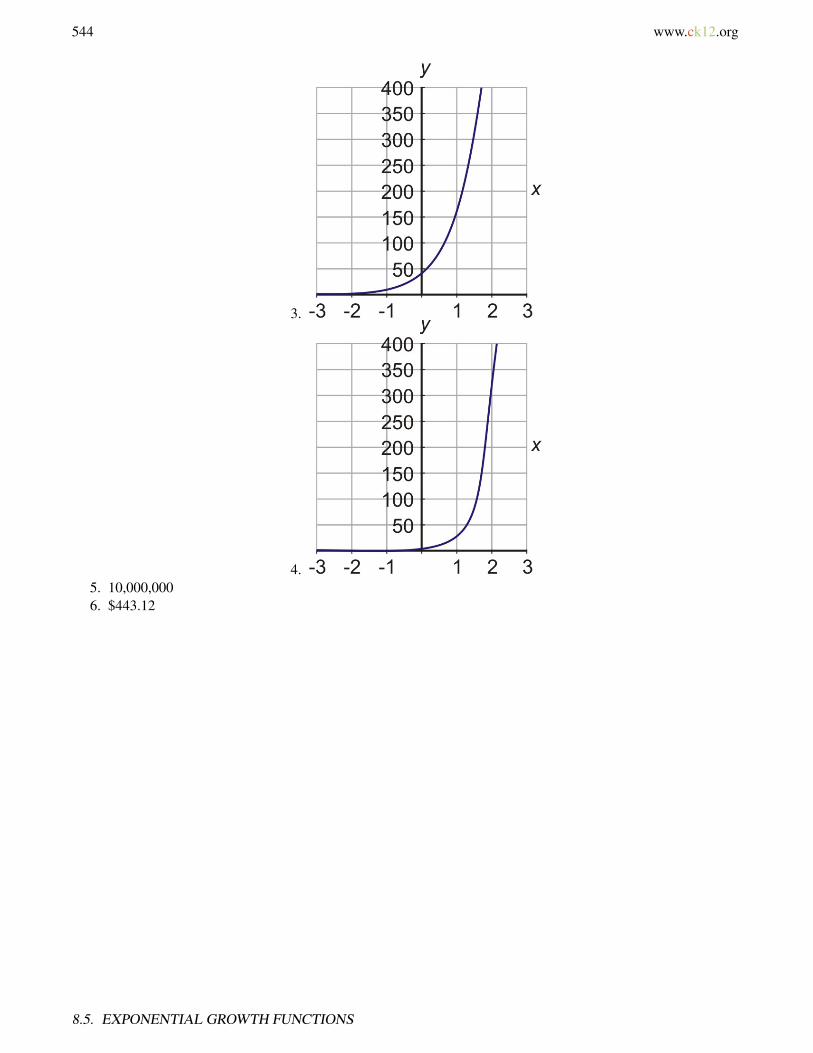
8.5 Exponential Growth Functions . . . . . . . . . . . . . . . . . . . . . . . . . . . . . . . . . . . . . 535
8.6 Exponential Decay Functions . . . . . . . . . . . . . . . . . . . . . . . . . . . . . . . . . . . . . . 545
8.7 Geometric Sequences and Exponential Functions . . . . . . . . . . . . . . . . . . . . . . . . . . . 555
8.8 Problem-Solving Strategies . . . . . . . . . . . . . . . . . . . . . . . . . . . . . . . . . . . . . . . 562
9 Factoring Polynomials; More on Probability 568
9.1 Addition and Subtraction of Polynomials . . . . . . . . . . . . . . . . . . . . . . . . . . . . . . . . 569
9.2 Multiplication of Polynomials . . . . . . . . . . . . . . . . . . . . . . . . . . . . . . . . . . . . . 579
9.3 Special Products of Polynomials . . . . . . . . . . . . . . . . . . . . . . . . . . . . . . . . . . . . 590
9.4 Polynomial Equations in Factored Form . . . . . . . . . . . . . . . . . . . . . . . . . . . . . . . . 597
9.5 Factoring Quadratic Expressions . . . . . . . . . . . . . . . . . . . . . . . . . . . . . . . . . . . . 607
9.6 Factoring Special Products . . . . . . . . . . . . . . . . . . . . . . . . . . . . . . . . . . . . . . . 615
9.7 Factoring Polynomials Completely . . . . . . . . . . . . . . . . . . . . . . . . . . . . . . . . . . . 625
10 Quadratic Equations and Quadratic Functions 636
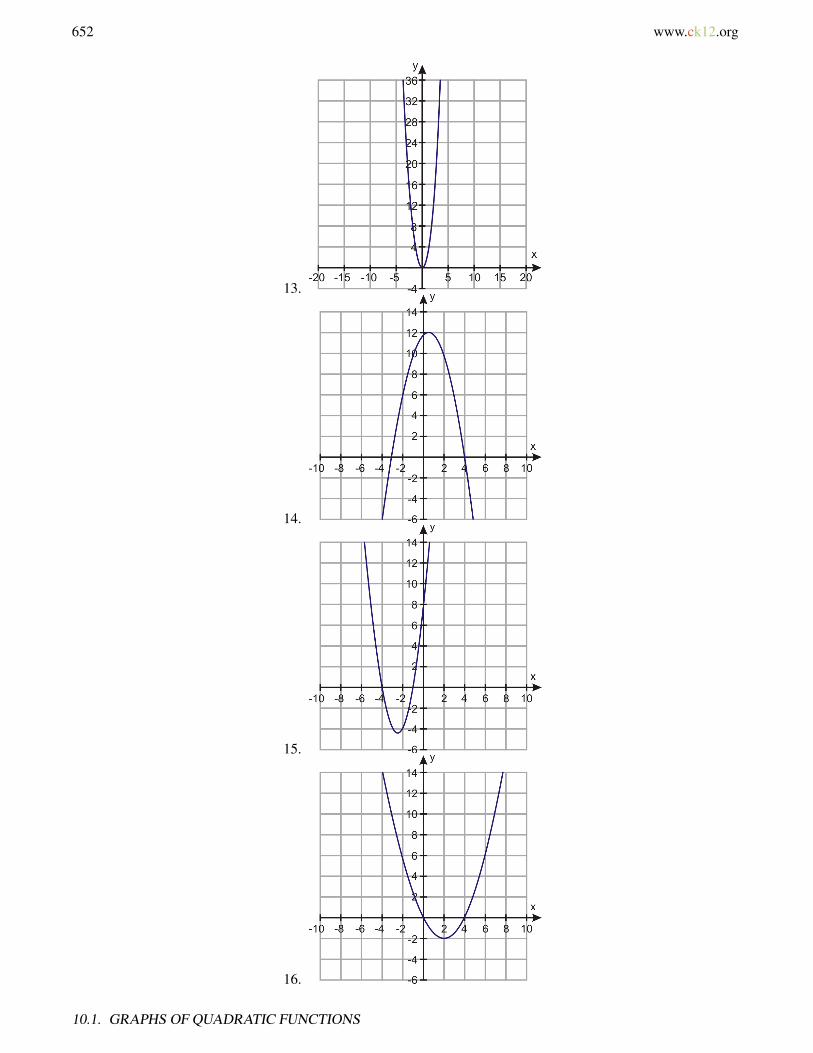
10.1 Graphs of Quadratic Functions . . . . . . . . . . . . . . . . . . . . . . . . . . . . . . . . . . . . . 637
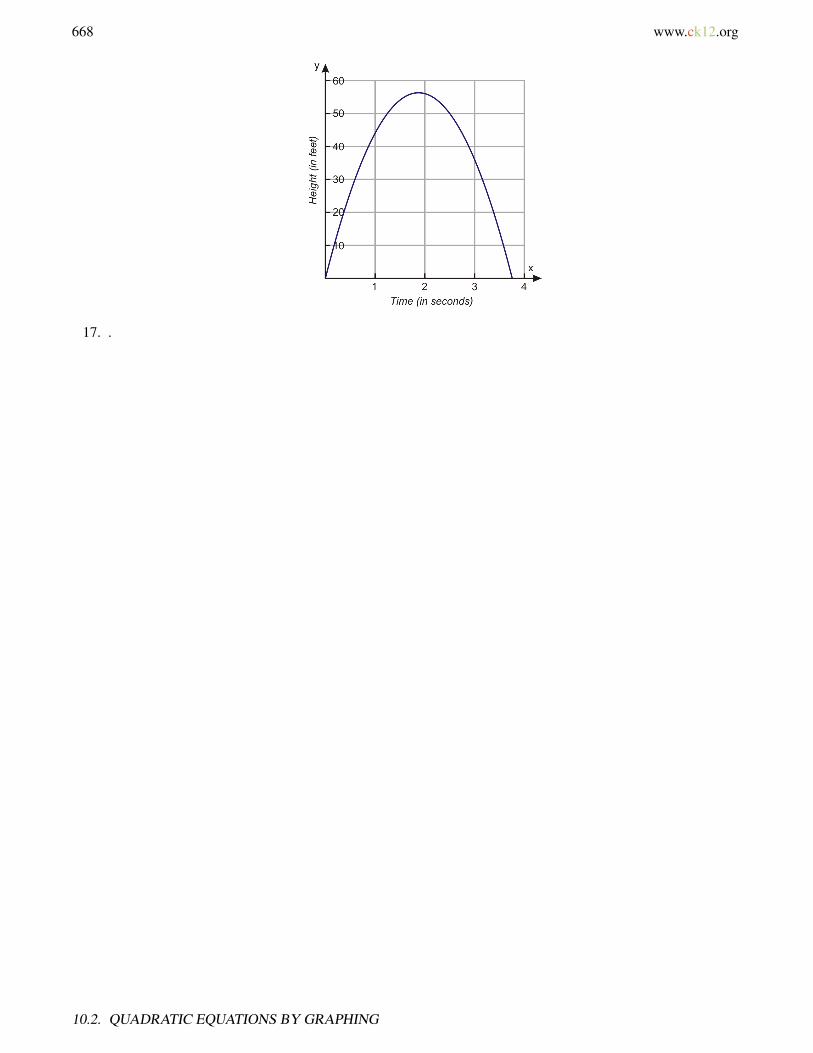
10.2 Quadratic Equations by Graphing . . . . . . . . . . . . . . . . . . . . . . . . . . . . . . . . . . . 654
10.3 Quadratic Equations by Square Roots . . . . . . . . . . . . . . . . . . . . . . . . . . . . . . . . . 669
10.4 Solving Quadratic Equations by Completing the Square . . . . . . . . . . . . . . . . . . . . . . . . 678
10.5 Solving Quadratic Equations by the Quadratic Formula . . . . . . . . . . . . . . . . . . . . . . . . 691
10.6 The Discriminant . . . . . . . . . . . . . . . . . . . . . . . . . . . . . . . . . . . . . . . . . . . . 704
10.7 Linear, Exponential and Quadratic Models . . . . . . . . . . . . . . . . . . . . . . . . . . . . . . . 710
10.8 Problem Solving Strategies: Choose a Function Model . . . . . . . . . . . . . . . . . . . . . . . . 730
11 Algebra and Geometry Connections; Working with Data 741
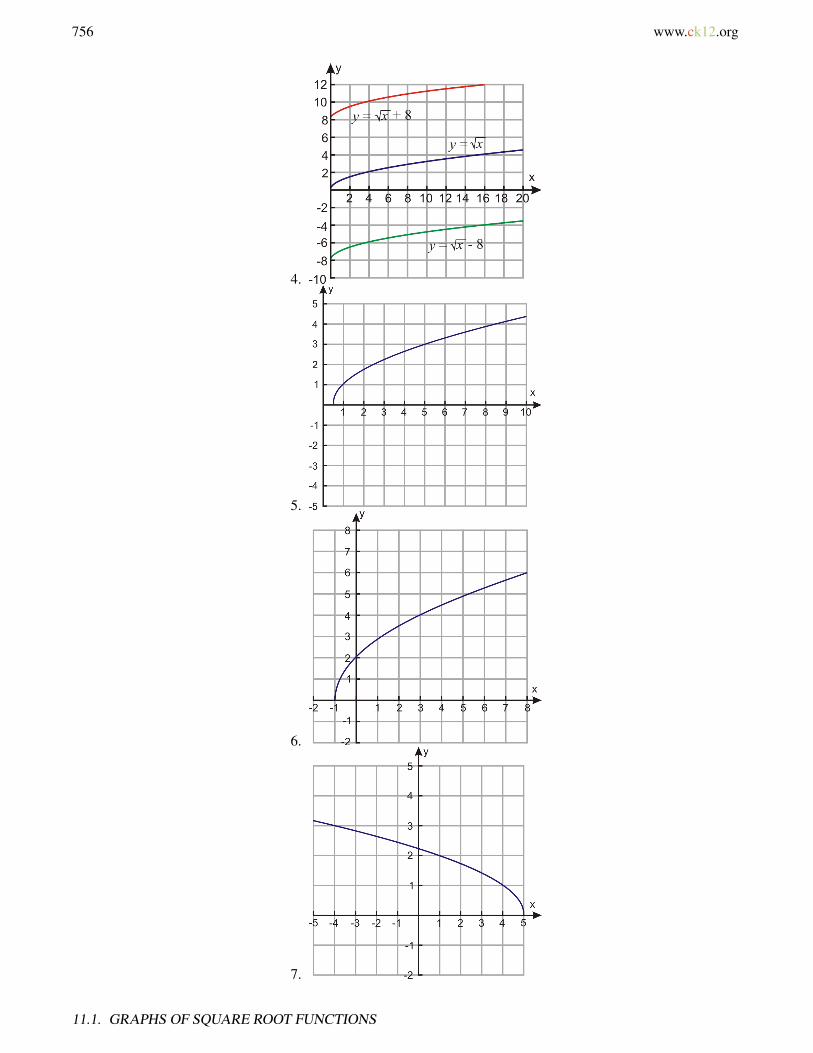
11.1 Graphs of Square Root Functions . . . . . . . . . . . . . . . . . . . . . . . . . . . . . . . . . . . . 742
11.2 Radical Expressions . . . . . . . . . . . . . . . . . . . . . . . . . . . . . . . . . . . . . . . . . . . 762
11.3 Radical Equations . . . . . . . . . . . . . . . . . . . . . . . . . . . . . . . . . . . . . . . . . . . . 776
11.4 The Pythagorean Theorem and Its Converse . . . . . . . . . . . . . . . . . . . . . . . . . . . . . . 786
11.5 Distance and Midpoint Formulas . . . . . . . . . . . . . . . . . . . . . . . . . . . . . . . . . . . . 797
11.6 Measures of Central Tendency and Dispersion . . . . . . . . . . . . . . . . . . . . . . . . . . . . . 807
11.7 Stem-and-Leaf Plots and Histograms . . . . . . . . . . . . . . . . . . . . . . . . . . . . . . . . . . 818
11.8 Box-and-Whisker Plots . . . . . . . . . . . . . . . . . . . . . . . . . . . . . . . . . . . . . . . . . 830
12 Rational Equations and Functions; Topics in Statistics 838

www.ck12.org vii
12.1 Inverse Variation Models . . . . . . . . . . . . . . . . . . . . . . . . . . . . . . . . . . . . . . . . 839
12.2 Graphs of Rational Functions . . . . . . . . . . . . . . . . . . . . . . . . . . . . . . . . . . . . . . 847
12.3 Division of Polynomials . . . . . . . . . . . . . . . . . . . . . . . . . . . . . . . . . . . . . . . . 863
12.4 Rational Expressions . . . . . . . . . . . . . . . . . . . . . . . . . . . . . . . . . . . . . . . . . . 872
12.5 Multiplication and Division of Rational Expressions . . . . . . . . . . . . . . . . . . . . . . . . . . 879
12.6 Addition and Subtraction of Rational Expressions . . . . . . . . . . . . . . . . . . . . . . . . . . . 887
12.7 Solutions of Rational Equations . . . . . . . . . . . . . . . . . . . . . . . . . . . . . . . . . . . . 900
12.8 Surveys and Samples . . . . . . . . . . . . . . . . . . . . . . . . . . . . . . . . . . . . . . . . . . 913
www.ck12.org 1
CHAPTER 1 Equations and FunctionsCHAPTER OUTLINE
1.1 VARIABLE EXPRESSIONS
1.2 ORDER OF OPERATIONS
1.3 PATTERNS AND EQUATIONS
1.4 EQUATIONS AND INEQUALITIES
1.5 FUNCTIONS AS RULES AND TABLES
1.6 FUNCTIONS AS GRAPHS
1.7 PROBLEM-SOLVING PLAN
1.8 PROBLEM-SOLVING STRATEGIES: MAKE A TABLE AND LOOK FOR A PATTERN
1.9 ADDITIONAL RESOURCES
CHAPTER 1. EQUATIONS AND FUNCTIONS

2 www.ck12.org
1.1 Variable Expressions
Learning Objectives
• Evaluate algebraic expressions.• Evaluate algebraic expressions with exponents.
Introduction – The Language of Algebra
Do you like to do the same problem over and over again? No? Well, you are not alone. Algebra was inventedby mathematicians so that they could solve a problem once and then use that solution to solve a group of similarproblems. The big idea of algebra is that once you have solved one problem you can generalize that solution tosolve other similar problems.
In this course, we’ll assume that you can already do the basic operations of arithmetic. In arithmetic, only numbersand their arithmetical operations (such as +,−,×,÷ ) occur. In algebra, numbers (and sometimes processes) aredenoted by symbols (such as x,y,a,b,c, . . . ). These symbols are called variables.
The letter x , for example, will often be used to represent some number. The value of x , however, is not fixed fromproblem to problem. The letter x will be used to represent a number which may be unknown (and for which we mayhave to solve) or it may even represent a quantity which varies within that problem.
Using variables offers advantages over solving each problem “from scratch”:
• It allows the general formulation of arithmetical laws such as a+b = b+a for all real numbers a and b .• It allows the reference to “unknown” numbers, for instance: Find a number x such that 3x+1 = 10 .• It allows short-hand writing about functional relationships such as, “If you sell x tickets, then your profit will
be 3x− 10 dollars, or f (x) = 3x− 10 ,” where “ f ” is the profit function, and x is the input (i.e. how manytickets you sell).
Example 1
Write an algebraic expression for the perimeter and area of the rectangle as follows.
To find the perimeter, we add the lengths of all 4 sides. We can start at the top-left and work clockwise. Theperimeter, P , is therefore:
1.1. VARIABLE EXPRESSIONS
www.ck12.org 3
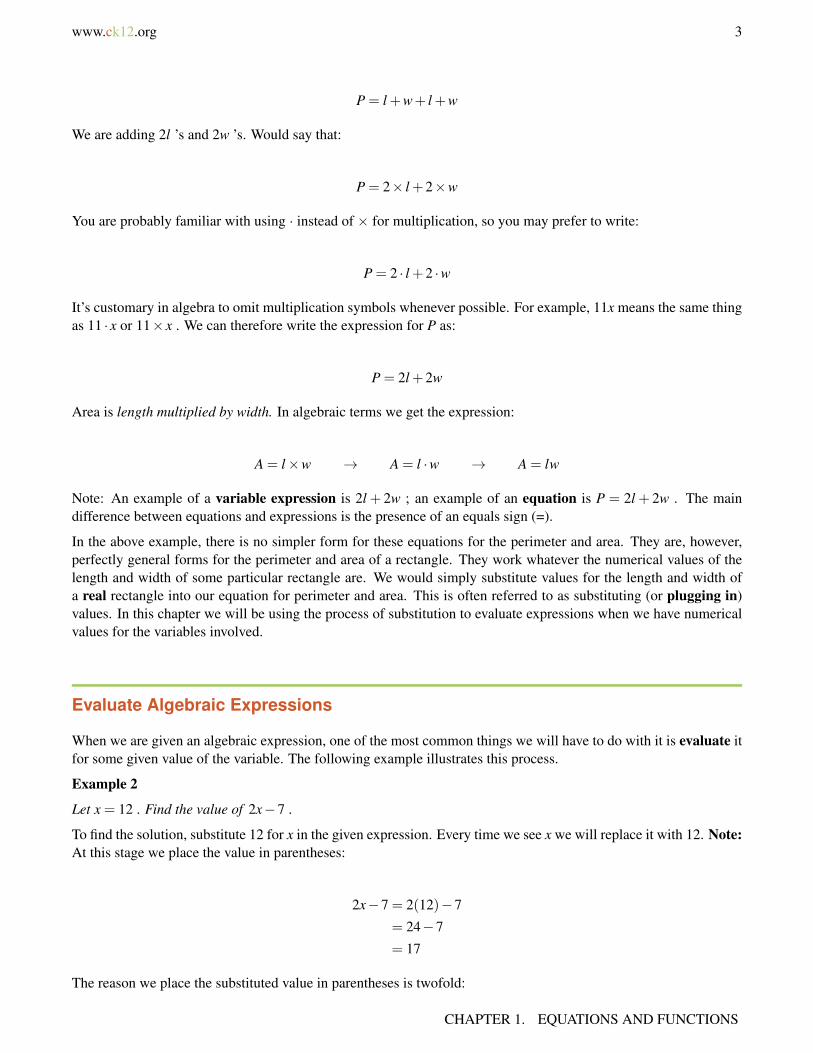
P = l +w+ l +w
We are adding 2l ’s and 2w ’s. Would say that:
P = 2× l +2×w
You are probably familiar with using · instead of × for multiplication, so you may prefer to write:
P = 2 · l +2 ·w
It’s customary in algebra to omit multiplication symbols whenever possible. For example, 11x means the same thingas 11 · x or 11× x . We can therefore write the expression for P as:
P = 2l +2w
Area is length multiplied by width. In algebraic terms we get the expression:
A = l×w → A = l ·w → A = lw
Note: An example of a variable expression is 2l + 2w ; an example of an equation is P = 2l + 2w . The maindifference between equations and expressions is the presence of an equals sign (=).
In the above example, there is no simpler form for these equations for the perimeter and area. They are, however,perfectly general forms for the perimeter and area of a rectangle. They work whatever the numerical values of thelength and width of some particular rectangle are. We would simply substitute values for the length and width ofa real rectangle into our equation for perimeter and area. This is often referred to as substituting (or plugging in)values. In this chapter we will be using the process of substitution to evaluate expressions when we have numericalvalues for the variables involved.
Evaluate Algebraic Expressions
When we are given an algebraic expression, one of the most common things we will have to do with it is evaluate itfor some given value of the variable. The following example illustrates this process.
Example 2
Let x = 12 . Find the value of 2x−7 .
To find the solution, substitute 12 for x in the given expression. Every time we see x we will replace it with 12. Note:At this stage we place the value in parentheses:
2x−7 = 2(12)−7
= 24−7
= 17
The reason we place the substituted value in parentheses is twofold:
CHAPTER 1. EQUATIONS AND FUNCTIONS

4 www.ck12.org
a. It will make worked examples easier for you to follow.b. It avoids any confusion that would arise from dropping a multiplication sign: 2 ·12 = 2(12) 6= 212 .
Example 3
Let x =−1 . Find the value of −9x+2 .
Solution
−9(−1)+2 = 9+2
= 11
Example 4
Let y =−2 . Find the value of 7y −11y+2 .
Solution
7(−2)
−11(−2)+2 =−312+22+2
= 24−312
= 2012
Many expressions have more than one variable in them. For example, the formula for the perimeter of a rectangle inthe introduction has two variables: length (l) and width (w) . In these cases be careful to substitute the appropriatevalue in the appropriate place.
Example 5
The area of a trapezoid is given by the equation A= h2(a+b) . Find the area of a trapezoid with bases a= 10 cm,b=
15 cm and height h = 8 cm .
To find the solution to this problem we simply take the values given for the variables, a,b and h , and plug them into the expression for A :
A =h2(a+b) Substitute 10 for a, 15 for b and 8 for h.
A =82(10+15) Evaluate piece by piece. (10+15) = 25;
82= 4
A = 4(25) = 100
1.1. VARIABLE EXPRESSIONS
www.ck12.org 5
Solution: The area of the trapezoid is 100 square centimeters.
Example 6
Find the value of 19(5x+3y+ z) when x = 7,y =−2 and z = 11 .
Let’s plug in values for x,y and z and then evaluate the resulting expression.
19(5(7)+3(−2)+(11)) Evaluate the individual terms inside the parentheses.
19(35+(−6)+11) Combine terms inside parentheses.
19(40) =
409≈ 4.44
Solution ≈ 4.44 (rounded to the nearest hundredth)
Example 7
The total resistance of two electronics components wired in parallel is given by
R1R2
R1 +R2
where R1 and R2 are the individual resistances (in ohms) of the two components. Find the combined resistance oftwo such wired components if their individual resistances are 30 ohms and 15 ohms.
Solution
R1R2
R1 +R2Substitute the values R1 = 30 and R2 = 15.
(30)(15)30+15
=45045
= 10 ohms
The combined resistance is 10 ohms.
Evaluate Algebraic Expressions with Exponents
Many formulas and equations in mathematics contain exponents. Exponents are used as a short-hand notation forrepeated multiplication. For example:
2 ·2 = 22
2 ·2 ·2 = 23
The exponent stands for how many times the number is used as a factor (multiplied). When we deal with integers, itis usually easiest to simplify the expression. We simplify:
22 = 4
and
23 = 8
CHAPTER 1. EQUATIONS AND FUNCTIONS
6 www.ck12.org
However, we need exponents when we work with variables, because it is much easier to write x8 than x · x · x · x · x ·x · x · x .
To evaluate expressions with exponents, substitute the values you are given for each variable and simplify. It isespecially important in this case to substitute using parentheses in order to make sure that the simplification is donecorrectly.
Example 8
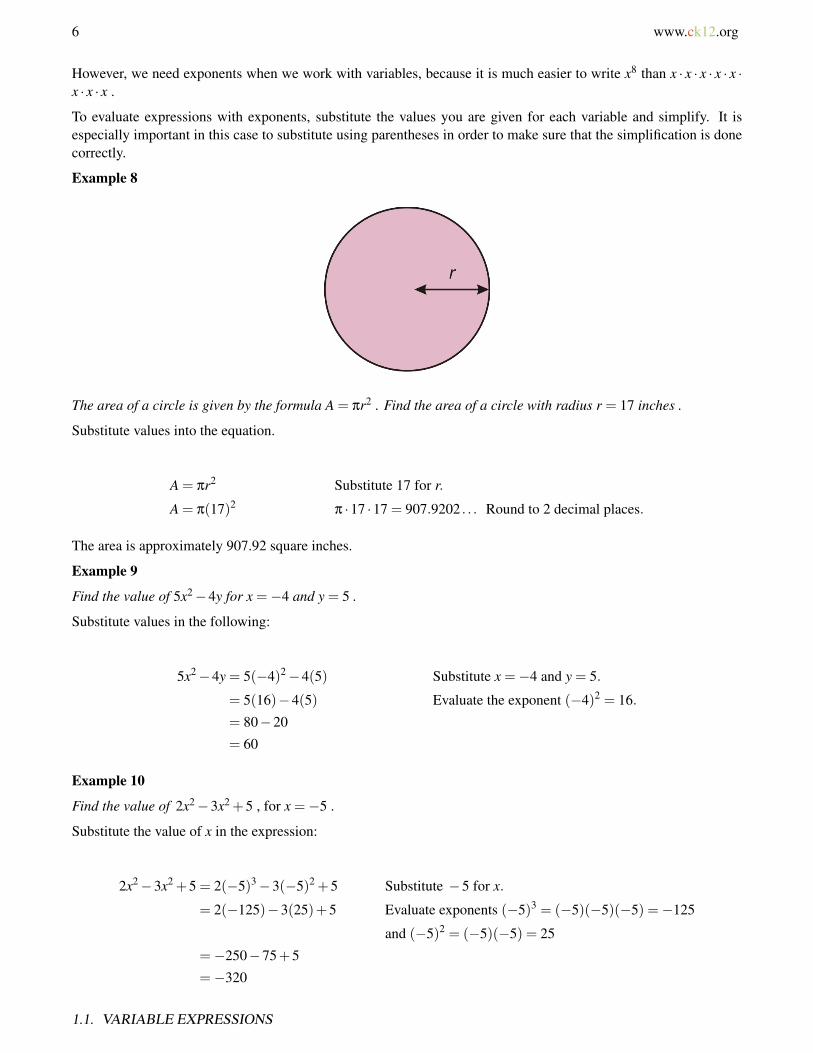
The area of a circle is given by the formula A = πr2 . Find the area of a circle with radius r = 17 inches .
Substitute values into the equation.
A = πr2 Substitute 17 for r.
A = π(17)2π ·17 ·17 = 907.9202 . . . Round to 2 decimal places.
The area is approximately 907.92 square inches.
Example 9
Find the value of 5x2−4y for x =−4 and y = 5 .
Substitute values in the following:
5x2−4y = 5(−4)2−4(5) Substitute x =−4 and y = 5.
= 5(16)−4(5) Evaluate the exponent (−4)2 = 16.
= 80−20
= 60
Example 10
Find the value of 2x2−3x2 +5 , for x =−5 .
Substitute the value of x in the expression:
2x2−3x2 +5 = 2(−5)3−3(−5)2 +5 Substitute −5 for x.
= 2(−125)−3(25)+5 Evaluate exponents (−5)3 = (−5)(−5)(−5) =−125
and (−5)2 = (−5)(−5) = 25
=−250−75+5
=−320
1.1. VARIABLE EXPRESSIONS
www.ck12.org 7
Example 11
Find the value of x2y3
x3+y2 , for x = 2 and y =−4 .
Substitute the values of x and y in the following.
x2y3
x3 + y2 =(2)2(−4)3
(2)3 +(−4)2 Substitute 2 for x and−4 for y.
4(−64)8+16
=−256
24=−32
3Evaluate expressions : (2)2 = (2)(2) = 4 and (2)3 = (2)(2)(2) = 8.
(−4)2 = (−4)(−4) = 16 and (−4)3 = (−4)(−4)(−4) =−64.
Example 12
The height (h) of a ball in flight is given by the formula: h =−32t2 +60t +20 , where the height is given in feet andthe time (t) is given in seconds. Find the height of the ball at time t = 2 seconds .
Solution
h =−32t2 +60t +20 Substitute 2 for t.
=−32(2)2 +60(2)+20
=−32(4)+60(2)+20
= 12 f eet
Review Questions
Write the following in a more condensed form by leaving out a multiplication symbol.
1. 2×11x2. 1.35 · y3. 3× 1
44. 1
4 · z
Evaluate the following expressions for a =−3,b = 2,c = 5 and d =−4 .
5. 2a+3b6. 4c+d7. 5ac−2b8. 2a
c−d9. 3b
d10. a−4b
3c+2d11. 1
a+b12. ab
cd
Evaluate the following expressions for x =−1,y = 2,z =−3, and w = 4 .
13. 8x3
CHAPTER 1. EQUATIONS AND FUNCTIONS

8 www.ck12.org
14. 5x2
6z3
15. 3z2−5w2
16. x2− y2
17. z3+w3
z3−w3
18. 2x2−3x2 +5x−419. 4w3 +3w2−w+220. 3+ 1
z2
21. The weekly cost C of manufacturing x remote controls is given by the formula C = 2000+3x , where the costis given in dollars.
a. What is the cost of producing 1000 remote controls?b. What is the cost of producing 2000 remote controls?
22. The volume of a box without a lid is given by the formula: V = 4x(10− x)2 where x is a length in inches andV is the volume in cubic inches.
a. What is the volume when x = 2 ?b. What is the volume when x = 3 ?
Review Answers
1. 22x2. 1.35y3. 3
44. z
45. 06. 167. -798. −2
39. −3
210. −11
711. -112. 3
1013. -814. −5
16215. -5316. -317. 37
−9118. -1419. 30220. 3 1
9
a. $5000b. $8000
a. 512 in3
b. 588 in3
1.1. VARIABLE EXPRESSIONS
www.ck12.org 9
1.2 Order of Operations
Learning Objectives
• Evaluate algebraic expressions with grouping symbols.• Evaluate algebraic expressions with fraction bars.• Evaluate algebraic expressions with a graphing calculator.
Introduction
Look at and evaluate the following expression:
2+4×7−1 =?
How many different ways can we interpret this problem, and how many different answers could someone possiblyfind for it?
The simplest way to evaluate the expression is simply to start at the left and work your way across, keeping track ofthe total as you go:
2+4 = 6
6×7 = 42
42−1 = 41
If you enter the expression into a non-scientific, non-graphing calculator you will probably get 41 as the answer. If,on the other hand, you were to enter the expression into a scientific calculator or a graphing calculator you wouldprobably get 29 as an answer.
In mathematics, the order in which we perform the various operations (such as adding, multiplying, etc.) is impor-tant. In the expression above, the operation of multiplication takes precedence over addition so we evaluate it first.Let’s re-write the expression, but put the multiplication in brackets to indicate that it is to be evaluated first.
2+(4×7)−1 =?
So we first evaluate the brackets: 4×7 = 28 . Our expression becomes:
2+(28)−1 =?
CHAPTER 1. EQUATIONS AND FUNCTIONS

10 www.ck12.org
When we have only addition and subtraction, we start at the left and keep track of the total as we go:
2+28 = 30
30−1 = 29
Algebra students often use the word “PEMDAS” to help remember the order in which we evaluate the mathematicalexpressions: Parentheses, Exponents, Multiplication, Division, Addition and Subtraction.
Order of Operations
a. Evaluate expressions within Parentheses (also all brackets [ ] and braces ) first.b. Evaluate all Exponents (squared or cubed terms such as 32 or x3 ) next.c. Multiplication and Division is next – work from left to right completing both multiplication and division in
the order that they appear.d. Finally, evaluate Addition and Subtraction – work from left to right completing both addition and subtraction
in the order that they appear.
Evaluate Algebraic Expressions with Grouping Symbols
The first step in the order of operations is called parentheses, but we include all grouping symbols in this step.While we will mostly use parentheses ( ) in this book, you may also see square brackets [ ] and curly braces andyou should include them as part of the first step.
Example 1
Evaluate the following:
a) 4−7−11−2
b) 4− (7−11)+2
c) 4− [7− (11+2)]
Each of these expressions has the same numbers and the same mathematical operations, in the same order. Theplacement of the various grouping symbols means, however, that we must evaluate everything in a different ordereach time. Let’s look at how we evaluate each of these examples.
a) This expression doesn’t have parentheses. PEMDAS states that we treat addition and subtraction as they appear,starting at the left and working right (it’s NOT addition then subtraction).
Solution
4−7−11+2 =−3−11+2
=−14+2
=−12
b) This expression has parentheses. We first evaluate 7−11 = −4 . Remember that when we subtract a negative itis equivalent to adding a positive:
1.2. ORDER OF OPERATIONS
www.ck12.org 11
Solution
4− (7−11)+2 = 4− (−4)+2
= 8+2
= 10
c) Brackets are often used to group expressions which already contain parentheses. This expression has both bracketsand parentheses. Do the innermost group first, (11+2) = 13 . Then complete the operation in the brackets.
Solution
4− [7− (11+2)] = 4− [7− (13)]
= 4− [−6]
= 10
Example 2
Evaluate the following:
a) 3×5−7÷2
b) 3× (5−7)÷2
c) (3×5)− (7÷2)
a) There are no grouping symbols. PEMDAS dictates that we evaluate multiplication and division first, workingfrom left to right: 3× 5 = 15; 7÷ 2 = 3.5 . (NOTE: It’s not multiplication then addition) Next we perform thesubtraction:
Solution
3×5−7÷2 = 15−3.5
= 11.5
b) First, we evaluate the expression inside the parentheses: 5−7 =−2 . Then work from left to right.
Solution
3× (5−7)÷2 = 3× (−2)÷2
= (−6)÷2
=−3
c) First, we evaluate the expressions inside parentheses: 3×5 = 15,7÷2 = 3.5 . Then work from left to right.
Solution
(3×5)− (7÷2) = 15−3.5
= 11.5
Note that in part (c), the result was unchanged by adding parentheses, but the expression does appear easier to read.Parentheses can be used in two distinct ways:
CHAPTER 1. EQUATIONS AND FUNCTIONS
12 www.ck12.org
• To alter the order of operations in a given expression• To clarify the expression to make it easier to understand
Some expressions contain no parentheses, others contain many sets. Sometimes expressions will have sets of paren-theses inside other sets of parentheses. When faced with nested parentheses, start at the innermost parentheses andwork outward.
Example 3
Use the order of operations to evaluate:
8− [19− (2+5)−7)]
Follow PEMDAS – first parentheses, starting with innermost brackets first:
Solution
8− (19− (2+5)−7) = 8− (19−7−7)
= 8−5
= 3
In algebra, we use the order of operations when we are substituting values into expressions for variables. In thosesituations we will be given an expression involving a variable or variables, and also the values to substitute for anyvariables in that expression.
Example 4
Use the order of operations to evaluate the following:
a) 2− (3x+2) when x = 2
b) 3y2 +2y−1 when y =−3
c) 2− (t−7)2× (u3− v) when t = 19,u = 4 and v = 2
a) The first step is to substitute in the value for x into the expression. Let’s put it in parentheses to clarify the resultingexpression.
Solution
2− (3(2)+2) 3(2) is the same as 3×2
Follow PEMDAS – first parentheses. Inside parentheses follow PEMDAS again.
2− (3×2+2) = 2− (6+2) Inside the parentheses, we evaluate the multiplication first.
2−8 =−6 Now we evaluate the parentheses.
b) The first step is to substitute in the value for y into the expression.
Solution
3× (−3)2 +2× (−3)−1
Follow PEMDAS: we cannot simplify parentheses.
1.2. ORDER OF OPERATIONS

www.ck12.org 13
= 3× (−3)2 +2× (−3)−1 Evaluate exponents : (−3)2 = 9
= 3×9+2× (−3)−1 Evaluate multiplication : 3×9 = 27;2×−3 =−6
= 27+(−6)−1 Evaluate addition and subtraction in order from left to right.
= 27−6−1
= 20
c) The first step is to substitute the values for t,u , and v into the expression.
Solution:
2− (19−7)2× (43−2)
Follow PEMDAS:
= 2− (19−7)2× (43−2) Evaluate parentheses : (19−7) = 12;(43−2) = (64−2) = 62
= 2−122×62 Evaluate exponents : 122 = 144
= 2−144×62 Evaluate the multiplication : 144×62 = 8928
= 2−8928 Evaluate the subtraction.
=−8926
In parts (b) and (c) we left the parentheses around the negative numbers to clarify the problem. They did not affectthe order of operations, but they did help avoid confusion when we were multiplying negative numbers.
Part (c) in the last example shows another interesting point. When we have an expression inside the parentheses, weuse PEMDAS to determine the order in which we evaluate the contents.
Evaluating Algebraic Expressions with Fraction Bars
Fraction bars count as grouping symbols for PEMDAS, and should therefore be evaluated in the first step of solvingan expression. All numerators and all denominators can be treated as if they have invisible parentheses. Whenreal parentheses are also present, remember that the innermost grouping symbols should be evaluated first. If, forexample, parentheses appear on a numerator, they would take precedence over the fraction bar. If the parenthesesappear outside of the fraction, then the fraction bar takes precedence.
Example 5
Use the order of operations to evaluate the following expressions:
a) z+34 −1 When z = 2
b)(a+2
b+4 −1)+b When a = 3 and b = 1
c) 2×(
w+(x−2z)(y+2)2 −1
)When w = 11,x = 3,y = 1 and z =−2
a) We substitute the value for z into the expression.
Solution:
2+34−1
CHAPTER 1. EQUATIONS AND FUNCTIONS

14 www.ck12.org
Although this expression has no parentheses, we will rewrite it to show the effect of the fraction bar.
(2+3)4−1
Using PEMDAS, we first evaluate the expression on the numerator.
54−1
We can convert 54 to a mixed number:
54= 1
14
Then evaluate the expression:
54−1 = 1
14−1 =
14
b) We substitute the values for a and b into the expression:
Solution:
(3+21+4
−1)−1
This expression has nested parentheses (remember the effect of the fraction bar on the numerator and denominator).The innermost grouping symbol is provided by the fraction bar. We evaluate the numerator (3+2) and denominator(1+4) first.
(55−1)−1 Now we evaluate the inside of the parentheses, starting with division.
(1−1)−1 Next the subtraction.
0−1 =−1
c) We substitute the values for w,x,y and z into the expression:
Solution:
This complicated expression has several layers of nested parentheses. One method for ensuring that we start with theinnermost parentheses is to make use of the other types of brackets. We can rewrite this expression, putting bracketsin for the fraction bar. The outermost brackets we will leave as parentheses ( ). Next will be the invisible bracketsfrom the fraction bar, these will be written as [ ]. The third level of nested parentheses will be the . We will leavenegative numbers in round brackets.
1.2. ORDER OF OPERATIONS
www.ck12.org 15
2
([11+ 3−2(−2) ]
[ 1+2 2]−1
)We start with the innermost grouping sign .
1+2 = 3; 3−2(−2) = 3+4 = 7
2([11+7][32]
−1)
The next level has two square brackets to evaluate.
2(
189−1)
We now evaluate the round brackets, starting with division.
2(2−1) Finally, we complete the addition and subtraction.
2(1) = 2
Evaluate Algebraic Expressions with a TI-83/84 Family Graphing Calculator
A graphing calculator is a very useful tool in evaluating algebraic expressions. The graphing calculator followsPEMDAS. In this section we will explain two ways of evaluating expressions with the graphing calculator.
Method 1: Substitute for the variable first. Then evaluate the numerical expression with the calculator.
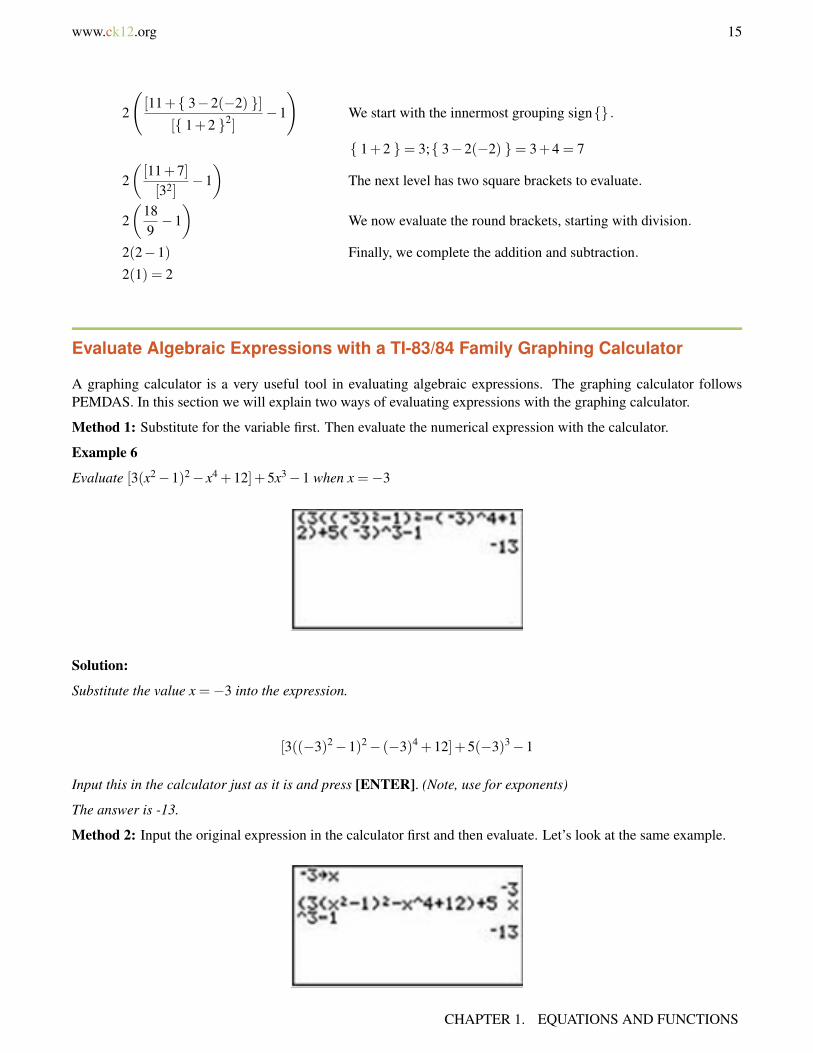
Example 6
Evaluate [3(x2−1)2− x4 +12]+5x3−1 when x =−3
Solution:
Substitute the value x =−3 into the expression.
[3((−3)2−1)2− (−3)4 +12]+5(−3)3−1
Input this in the calculator just as it is and press [ENTER]. (Note, use for exponents)
The answer is -13.
Method 2: Input the original expression in the calculator first and then evaluate. Let’s look at the same example.
CHAPTER 1. EQUATIONS AND FUNCTIONS

16 www.ck12.org
Evaluate [3(x2−1)2− x4 +12]+5x3−1 when x =−3
First, store the value x = −3 in the calculator. Type -3 [STO] x (The letter x can be entered using the x -[VAR]button or [ALPHA] + [STO]). Then type in the expression in the calculator and press [ENTER].
The answer is -13.
The second method is better because you can easily evaluate the same expression for any value you want. Forexample, let’s evaluate the same expression using the values x = 2 and x = 2
3 .
For x = 2 , store the value of x in the calculator: 2 [STO] x . Press [2nd] [ENTER] twice to get the previousexpression you typed in on the screen without having to enter it again. Press [ENTER] to evaluate.
The answer is 62.
For x = 23 , store the value of x in the calculator: 2
3 [STO] x . Press [2nd] [ENTER] twice to get the expression onthe screen without having to enter it again. Press [ENTER] to evaluate.
The answer is 13.21 or 107081 in fraction form.
Note: On graphing calculators there is a difference between the minus sign and the negative sign. When we storedthe value negative three, we needed to use the negative sign which is to the left of the [ENTER] button on thecalculator. On the other hand, to perform the subtraction operation in the expression we used the minus sign. Theminus sign is right above the plus sign on the right.
You can also use a graphing calculator to evaluate expressions with more than one variable.
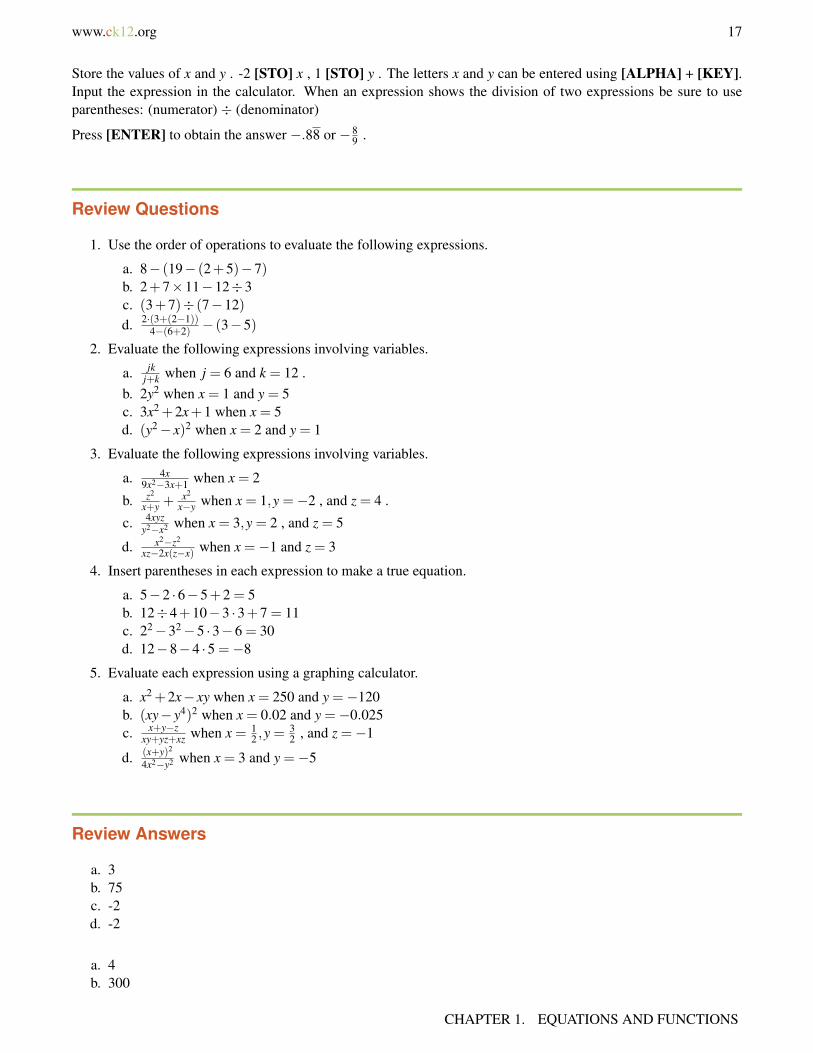
Example 7
Evaluate the expression: 3x2−4y2+x4
(x+y)12
for x =−2,y = 1 .
Solution
1.2. ORDER OF OPERATIONS
www.ck12.org 17
Store the values of x and y . -2 [STO] x , 1 [STO] y . The letters x and y can be entered using [ALPHA] + [KEY].Input the expression in the calculator. When an expression shows the division of two expressions be sure to useparentheses: (numerator) ÷ (denominator)
Press [ENTER] to obtain the answer −.88 or −89 .
Review Questions
1. Use the order of operations to evaluate the following expressions.
a. 8− (19− (2+5)−7)b. 2+7×11−12÷3c. (3+7)÷ (7−12)d. 2·(3+(2−1))
4−(6+2) − (3−5)
2. Evaluate the following expressions involving variables.
a. jkj+k when j = 6 and k = 12 .
b. 2y2 when x = 1 and y = 5c. 3x2 +2x+1 when x = 5d. (y2− x)2 when x = 2 and y = 1
3. Evaluate the following expressions involving variables.
a. 4x9x2−3x+1 when x = 2
b. z2
x+y +x2
x−y when x = 1,y =−2 , and z = 4 .
c. 4xyzy2−x2 when x = 3,y = 2 , and z = 5
d. x2−z2
xz−2x(z−x) when x =−1 and z = 3
4. Insert parentheses in each expression to make a true equation.
a. 5−2 ·6−5+2 = 5b. 12÷4+10−3 ·3+7 = 11c. 22−32−5 ·3−6 = 30d. 12−8−4 ·5 =−8
5. Evaluate each expression using a graphing calculator.
a. x2 +2x− xy when x = 250 and y =−120b. (xy− y4)2 when x = 0.02 and y =−0.025c. x+y−z
xy+yz+xz when x = 12 ,y =
32 , and z =−1
d. (x+y)2
4x2−y2 when x = 3 and y =−5
Review Answers
a. 3b. 75c. -2d. -2
a. 4b. 300
CHAPTER 1. EQUATIONS AND FUNCTIONS

18 www.ck12.org
c. 86d. 3
a. 831
b. −473
c. -24d. −8
5
a. (5−2) · (6−5)+2 = 5b. (12÷4)+10− (3 ·3)+7 = 11c. (22−32−5) · (3−6) = 30d. 12− (8−4) ·5 =−8
a. 93000b. 0.00000025c. −12
5d. 4
11
1.2. ORDER OF OPERATIONS
www.ck12.org 19
1.3 Patterns and Equations
Learning Objectives
• Write an equation.• Use a verbal model to write an equation.• Solve problems using equations.
Introduction
In mathematics, and especially in algebra, we look for patterns in the numbers that we see. The tools of algebraassist us in describing these patterns with words and with equations (formulas or functions). An equation is amathematical recipe that gives the value of one variable in terms of the other.
For example, if a theme park charges $12 admission, then the number of people who enter the park every day andthe amount of money taken by the ticket office are related mathematically. We can write a rule to find the amount ofmoney taken by the ticket office.
In words, we might say “The money taken in dollars is (equals) twelve times the number of people who enter thepark.”
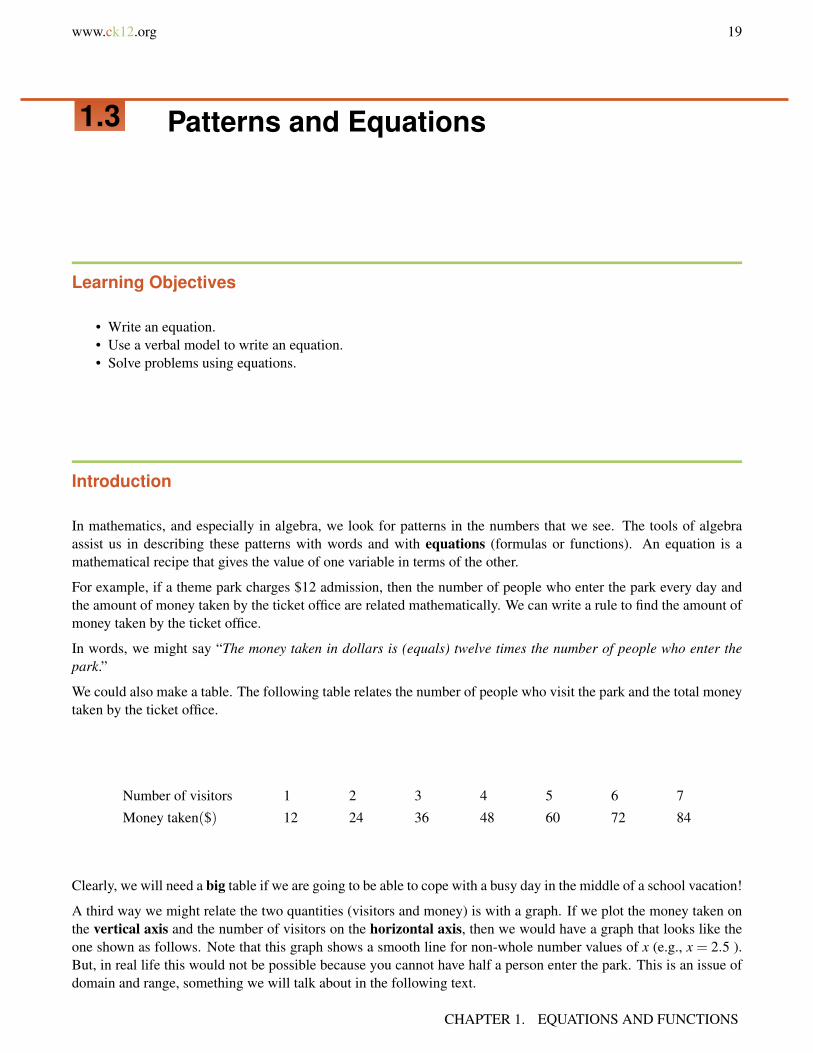
We could also make a table. The following table relates the number of people who visit the park and the total moneytaken by the ticket office.
Number of visitors 1 2 3 4 5 6 7
Money taken($) 12 24 36 48 60 72 84
Clearly, we will need a big table if we are going to be able to cope with a busy day in the middle of a school vacation!
A third way we might relate the two quantities (visitors and money) is with a graph. If we plot the money taken onthe vertical axis and the number of visitors on the horizontal axis, then we would have a graph that looks like theone shown as follows. Note that this graph shows a smooth line for non-whole number values of x (e.g., x = 2.5 ).But, in real life this would not be possible because you cannot have half a person enter the park. This is an issue ofdomain and range, something we will talk about in the following text.
CHAPTER 1. EQUATIONS AND FUNCTIONS

20 www.ck12.org
The method we will examine in detail in this lesson is closer to the first way we chose to describe the relationship.In words we said that “The money taken in dollars is twelve times the number of people who enter the park.” Inmathematical terms we can describe this sort of relationship with variables. A variable is a letter used to representan unknown quantity. We can see the beginning of a mathematical formula in the words.
The money taken in dollars is twelve times the number of people who enter the park.
This can be translated to:
the money taken in dollars = 12 × (the number of people who enter the park)
To make the quantities more visible they have been placed in parentheses. We can now see which quantities can beassigned to letters. First we must state which letters (or variables) relate to which quantities. We call this definingthe variables:
Let x = the number of people who enter the theme park.
Let y = the total amount of money taken at the ticket office.
We can now show the fourth way to describe the relationship, with our algebraic equation.
y = 12x
Writing a mathematical equation using variables is very convenient. You can perform all of the operations necessaryto solve this problem without having to write out the known and unknown quantities in long hand over and overagain. At the end of the problem, we just need to remember which quantities x and y represent.
Write an Equation
An equation is a term used to describe a collection of numbers and variables related through mathematical oper-ators. An algebraic equation will contain letters that relate to real quantities or to numbers that represent valuesfor real quantities. If, for example, we wanted to use the algebraic equation in the example above to find the moneytaken for a certain number of visitors, we would substitute that value in for x and then solve the resulting equationfor y .
Example 1
A theme park charges $12 entry to visitors. Find the money taken if 1296 people visit the park.
1.3. PATTERNS AND EQUATIONS
www.ck12.org 21
Let’s break the solution to this problem down into a number of steps. This will help us solve all the problems in thislesson.
Step 1 Extract the important information.
(money taken in dollars) = 12× (number of visitors)
(number of visitors) = 1296
Step 2 Translate into a mathematical equation.
We do this by defining variables and by substituting in known values.
Let y = (money taken in dollars)
y = 12×1296 THIS IS OUR EQUATION.
Step 3 Solve the equation.
y = 15552 Answer: The money taken is $15552
Step 4 Check the result.
If $15552 is taken at the ticket office and tickets are $12, then we can divide the total amount of money collected bythe price per individual ticket.
(number of people) =15552
12= 1296
Our answer equals the number of people who entered the park. Therefore, the answer checks out.
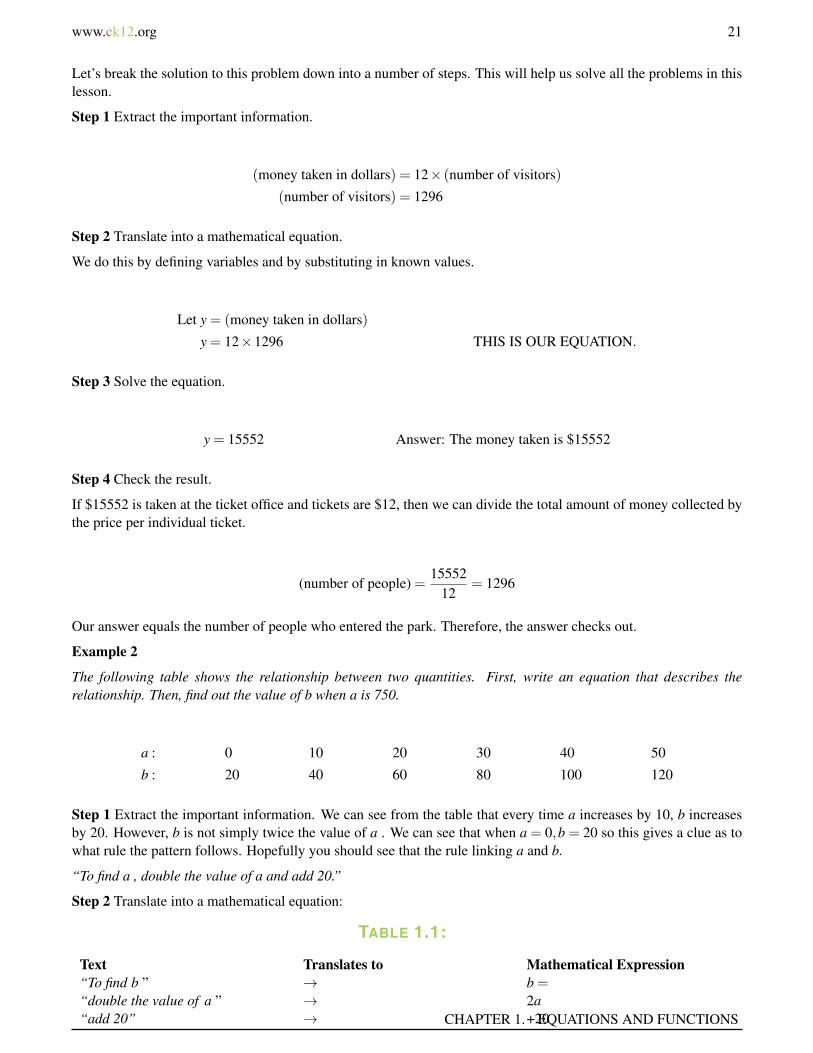
Example 2
The following table shows the relationship between two quantities. First, write an equation that describes therelationship. Then, find out the value of b when a is 750.
a : 0 10 20 30 40 50
b : 20 40 60 80 100 120
Step 1 Extract the important information. We can see from the table that every time a increases by 10, b increasesby 20. However, b is not simply twice the value of a . We can see that when a = 0,b = 20 so this gives a clue as towhat rule the pattern follows. Hopefully you should see that the rule linking a and b.
“To find a , double the value of a and add 20.”
Step 2 Translate into a mathematical equation:
TABLE 1.1:
Text Translates to Mathematical Expression“To find b ” → b =“double the value of a ” → 2a“add 20” → +20CHAPTER 1. EQUATIONS AND FUNCTIONS

22 www.ck12.org
b = 2a+20 THIS IS OUR EQUATION.
Step 3 Solve the equation.
Go back to the original problem. We substitute the values we have for our known variable and rewrite the equation.
[U+0080][U+009C]when a is 750[U+0080][U+009D] → b = 2(750)+20
Follow the order of operations to solve
b = 2(750)+20
b = 1500+20 = 1520
Step 4 Check the result.
In some cases you can check the result by plugging it back into the original equation. Other times you must simplydouble-check your math. Double-checking is always advisable. In this case, we can plug our answer for b into theequation, along with the value for a and see what comes out. 1520 = 2(750)+20 is TRUE because both sides of theequation are equal and balance. A true statement means that the answer checks out.
Use a Verbal Model to Write an Equation
In the last example we developed a rule, written in words, as a way to develop an algebraic equation. We willdevelop this further in the next few examples.
Example 3
The following table shows the values of two related quantities. Write an equation that describes the relationshipmathematically.
TABLE 1.2:
x− value y− value−2 100 02 -104 -206 -30
Step 1 Extract the important information.
We can see from the table that y is five times bigger than x . The value for y is negative when x is positive, and it ispositive when x is negative. Here is the rule that links x and y .
“ y is the negative of five times the value of x ”
Step 2 Translate this statement into a mathematical equation.
1.3. PATTERNS AND EQUATIONS
www.ck12.org 23
TABLE 1.3:
Text Translates to Mathematical Expression“ y is” → y =“negative 5 times the value of x ” → −5x
y =−5x THIS IS OUR EQUATION.
Step 3 There is nothing in this problem to solve for. We can move to Step 4.
Step 4 Check the result.
In this case, the way we would check our answer is to use the equation to generate our own xy pairs. If they matchthe values in the table, then we know our equation is correct. We will substitute x values of -2, 0, 2, 4, 6 in and solvefor y .
x =−2 : y =−5(−2) y =+10
x = 0 : y =−5(0) y = 0
x = 2 : y =−5(2) y =−10
x = 4 : y =−5(4) y =−20
x = 6 : y =−5(6) y =−30
Each xy pair above exactly matches the corresponding row in the table.
The answer checks out.
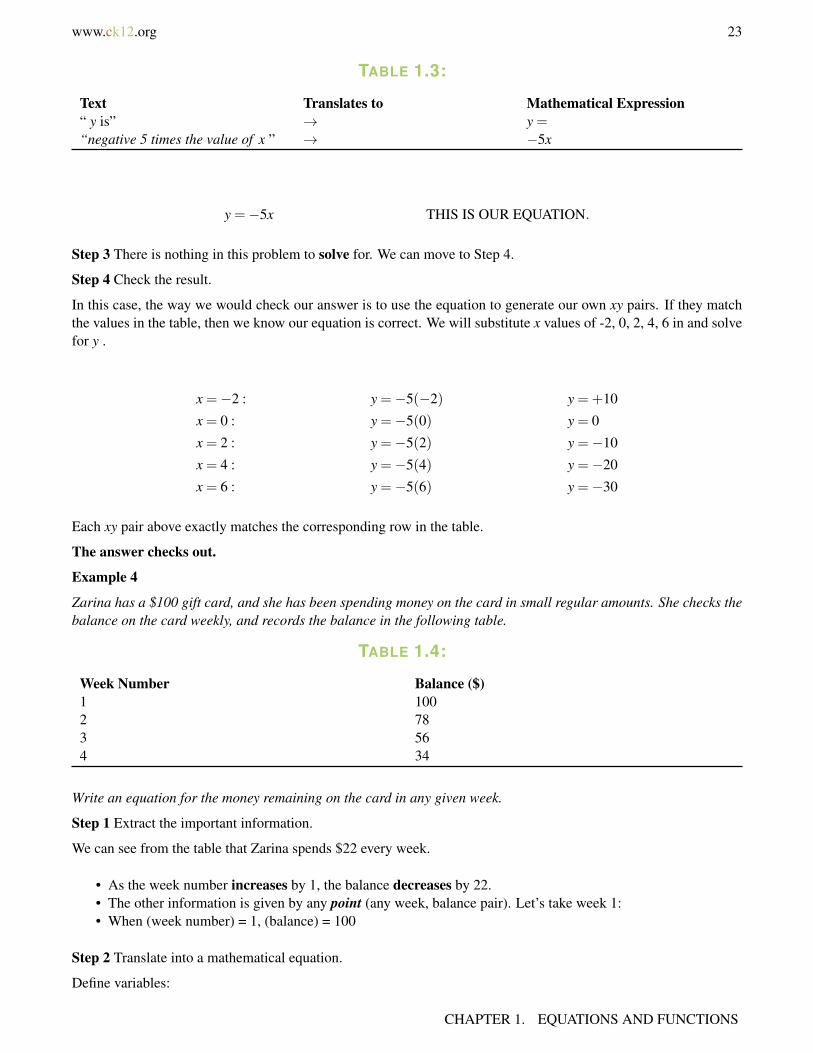
Example 4
Zarina has a $100 gift card, and she has been spending money on the card in small regular amounts. She checks thebalance on the card weekly, and records the balance in the following table.
TABLE 1.4:
Week Number Balance ($)1 1002 783 564 34
Write an equation for the money remaining on the card in any given week.
Step 1 Extract the important information.
We can see from the table that Zarina spends $22 every week.
• As the week number increases by 1, the balance decreases by 22.• The other information is given by any point (any week, balance pair). Let’s take week 1:• When (week number) = 1, (balance) = 100
Step 2 Translate into a mathematical equation.
Define variables:
CHAPTER 1. EQUATIONS AND FUNCTIONS
24 www.ck12.org
Let week number = n
Let Balance = b
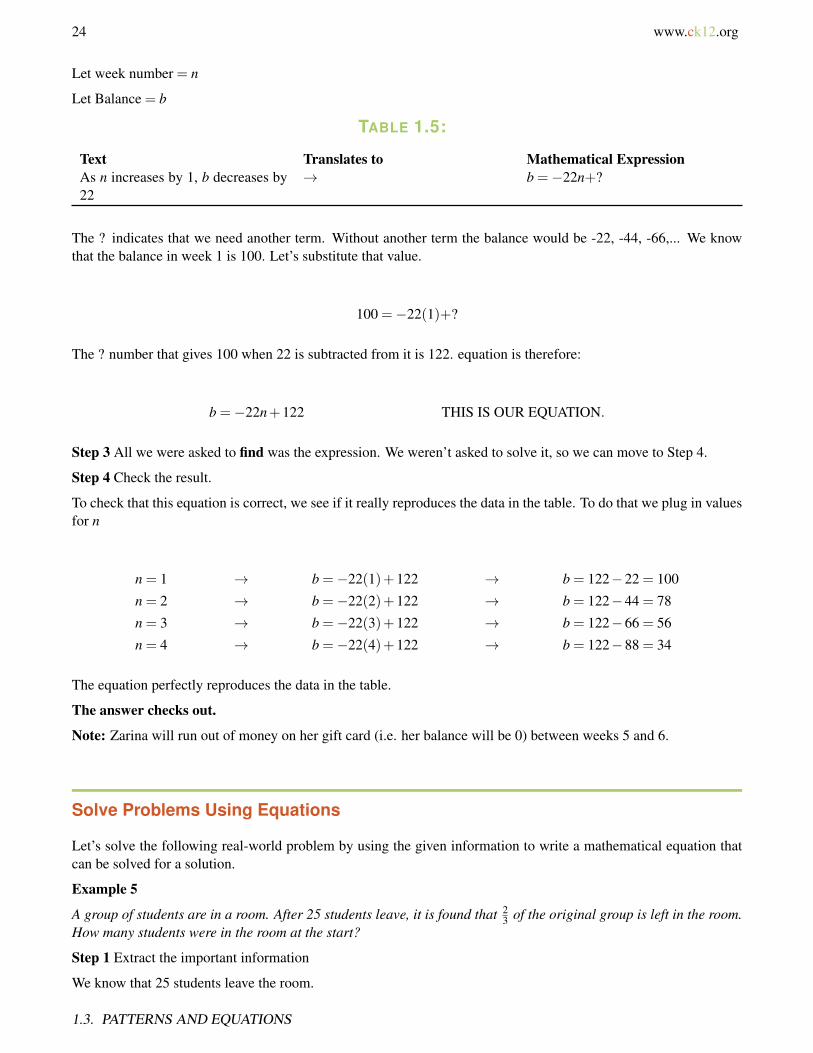
TABLE 1.5:
Text Translates to Mathematical ExpressionAs n increases by 1, b decreases by22
→ b =−22n+?
The ? indicates that we need another term. Without another term the balance would be -22, -44, -66,... We knowthat the balance in week 1 is 100. Let’s substitute that value.
100 =−22(1)+?
The ? number that gives 100 when 22 is subtracted from it is 122. equation is therefore:
b =−22n+122 THIS IS OUR EQUATION.
Step 3 All we were asked to find was the expression. We weren’t asked to solve it, so we can move to Step 4.
Step 4 Check the result.
To check that this equation is correct, we see if it really reproduces the data in the table. To do that we plug in valuesfor n
n = 1 → b =−22(1)+122 → b = 122−22 = 100
n = 2 → b =−22(2)+122 → b = 122−44 = 78
n = 3 → b =−22(3)+122 → b = 122−66 = 56
n = 4 → b =−22(4)+122 → b = 122−88 = 34
The equation perfectly reproduces the data in the table.
The answer checks out.
Note: Zarina will run out of money on her gift card (i.e. her balance will be 0) between weeks 5 and 6.
Solve Problems Using Equations
Let’s solve the following real-world problem by using the given information to write a mathematical equation thatcan be solved for a solution.
Example 5
A group of students are in a room. After 25 students leave, it is found that 23 of the original group is left in the room.
How many students were in the room at the start?
Step 1 Extract the important information
We know that 25 students leave the room.
1.3. PATTERNS AND EQUATIONS

www.ck12.org 25
We know that 23 of the original number of students are left in the room.
We need to find how many students were in the room at the start.
Step 2 Translate into a mathematical equation. Initially we have an unknown number of students in the room. Wecan refer to them as the original number.
Let’s define the variable x = the original number of students in the room.
25 students leave the room. The number of students left in the room is:
TABLE 1.6:
Text Translates to Mathematical Expressionthe original number of students inthe room
→ x
25 students leave the room → x−2523 of the original number is left inthe room
→ 23 x
x−25 =23
x THIS IS OUR EQUATION.
Step 3 Solve the equation.
Add 25 to both sides.
x−25 =23
x
x−25+25 =23
x+25
x =23
x+25
Subtract 23 x from both sides.
x− 23
x =23
x− 23
x+25
13
x = 25
Multiply both sides by 3.
3 · 13
x = 25 ·3
x = 75
Remember that x represents the original number of students in the room. So,
Answer There were 75 students in the room to start with.
Step 4 Check the answer:
CHAPTER 1. EQUATIONS AND FUNCTIONS
26 www.ck12.org
If we start with 75 students in the room and 25 of them leave, then there are 75−25 = 50 students left in the room.23 of the original number is 2
3 ·75 = 50
This means that the number of students who are left over equals to 23 of the original number.
The answer checks out.
The method of defining variables and writing a mathematical equation is the method you will use the most in analgebra course. This method is often used together with other techniques such as making a table of values, creatinga graph, drawing a diagram and looking for a pattern.
Review Questions
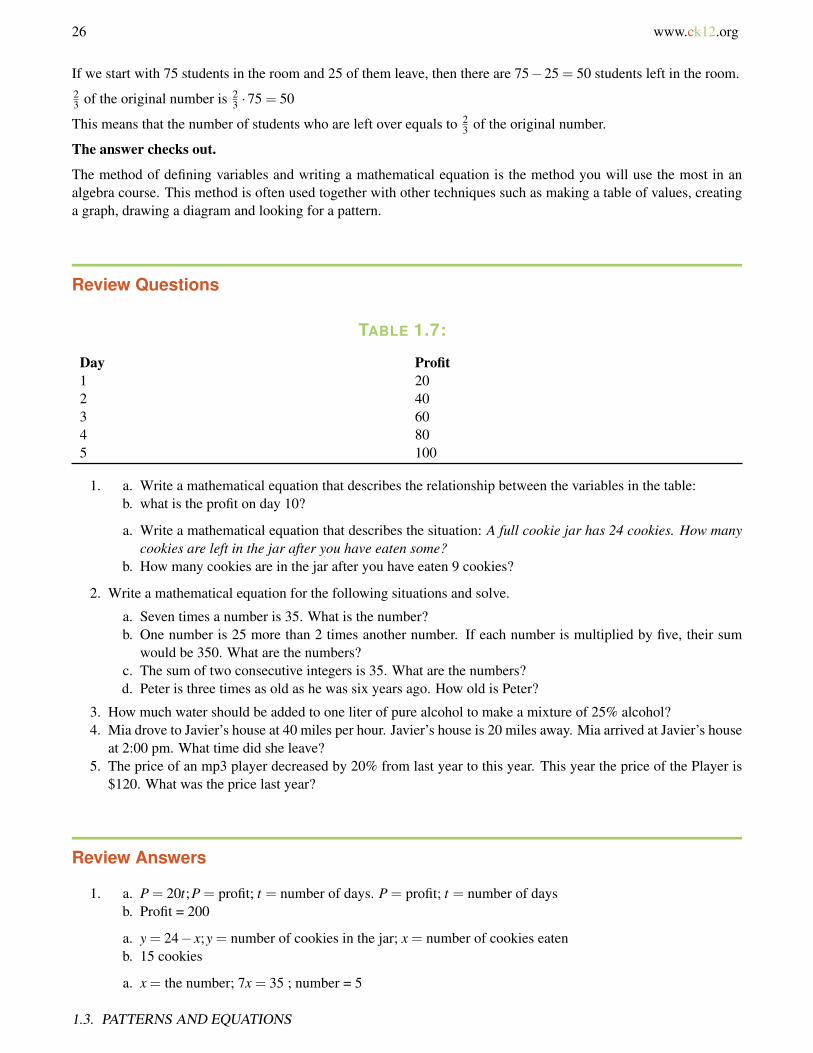
TABLE 1.7:
Day Profit1 202 403 604 805 100
1. a. Write a mathematical equation that describes the relationship between the variables in the table:b. what is the profit on day 10?
a. Write a mathematical equation that describes the situation: A full cookie jar has 24 cookies. How manycookies are left in the jar after you have eaten some?
b. How many cookies are in the jar after you have eaten 9 cookies?
2. Write a mathematical equation for the following situations and solve.
a. Seven times a number is 35. What is the number?b. One number is 25 more than 2 times another number. If each number is multiplied by five, their sum
would be 350. What are the numbers?c. The sum of two consecutive integers is 35. What are the numbers?d. Peter is three times as old as he was six years ago. How old is Peter?
3. How much water should be added to one liter of pure alcohol to make a mixture of 25% alcohol?4. Mia drove to Javier’s house at 40 miles per hour. Javier’s house is 20 miles away. Mia arrived at Javier’s house
at 2:00 pm. What time did she leave?5. The price of an mp3 player decreased by 20% from last year to this year. This year the price of the Player is
$120. What was the price last year?
Review Answers
1. a. P = 20t;P = profit; t = number of days. P = profit; t = number of daysb. Profit = 200
a. y = 24− x;y = number of cookies in the jar; x = number of cookies eatenb. 15 cookies
a. x = the number; 7x = 35 ; number = 5
1.3. PATTERNS AND EQUATIONS

www.ck12.org 27
b. x = another number; 2x+25 = another number; 5x+5(2x+25) = 350 ; numbers = 15 and 55c. x = first integer; x+1 = second integer; x+ x+1 = 35 ; first integer = 17, second integer = 18d. x = Peter’s age; x = 3(x−6) ; Peter is 9 years old.
2. 3 liters3. 1:30 pm4. $150
CHAPTER 1. EQUATIONS AND FUNCTIONS

28 www.ck12.org
1.4 Equations and Inequalities
Learning Objectives
• Write equations and inequalities.• Check solutions to equations.• Check solutions to inequalities.• Solve real-world problems using an equation.
Introduction
In algebra, an equation is a mathematical expression that contains an equal sign. It tells us that two expressionsrepresent the same number. For example, y = 12x is an equation. An inequality is a mathematical expression thatcontains inequality signs. For example y≤ 12x is an inequality. Inequalities are used to tell us that an expression iseither larger or smaller than another expression. Equations and inequalities can contain variables and constants.
• Variables are usually given a letter and they are used to represent unknown values. These quantities can changebecause they depend on other numbers in the problem.
• Constants are quantities that remain unchanged.
Equations and inequalities are used as a short hand notation for situations that involve numerical data. They are veryuseful because most problems require several steps to arrive at a solution, and it becomes tedious to repeatedly writeout the situation in words.
Write Equations and Inequalities
Here are some examples of equations.
a) 3x−2 = 5
b) x+9 = 2x+5
c) x3 = 15
d) x2 +1 = 10
To write an inequality, we use the following symbols.
> greater than
≥ greater than or equal to
< less than
≤ less than or equal to
1.4. EQUATIONS AND INEQUALITIES

www.ck12.org 29
6= not equal to
Here are some examples of inequalities.
a) 3x < 5
b) 4− x≤ 2x
c) x2 +2x−1 > 0
d) 3x4 ≥
x2 −3
The most important skill in algebra is the ability to translate a word problem into the correct equation or inequalityso you can find the solution easily. Going from a word problem to the solution involves several steps. Two of theinitial steps are defining the variables and translating the word problem into a mathematical equation.
Defining the variables means that we assign letters to any unknown quantities in the problem.
Translating means that we change the word expression into a mathematical expression containing variables andmathematical operations with an equal sign or an inequality sign.
Example 1
Define the variables and translate the following expressions into equations.
a) A number plus 12 is 20.
b) 9 less than twice a number is 33.
c) Five more than four times a number is 21.
d) $20 was one quarter of the money spent on the pizza.
Solution
a) Define
Let n = the number we are seeking
Translate
A number plus 2 is 20
n+12 = 20
Answer
The equation is: n+12 = 20
b) Define:
Let n = the number we are seeking
Translate
9 less than twice a number is 33
This means that twice a number minus 9 is 33
2×n−9 = 33
Answer
The equation is: 2n−9 = 33
c) Define
Let n = the number we are seeking
Translate
CHAPTER 1. EQUATIONS AND FUNCTIONS
30 www.ck12.org
Five more than four times a number is 21.
This means that four times a number plus five is 21.
4×n+5 = 21
Answer
The equation is: 4n+5 = 21
d) Define
Let m = the money spent on the pizza
Translate
$20 was one quarter of the money spent on the pizza.
Translate
20 = 14 ×m
Answer
The equation is: 14 m = 20
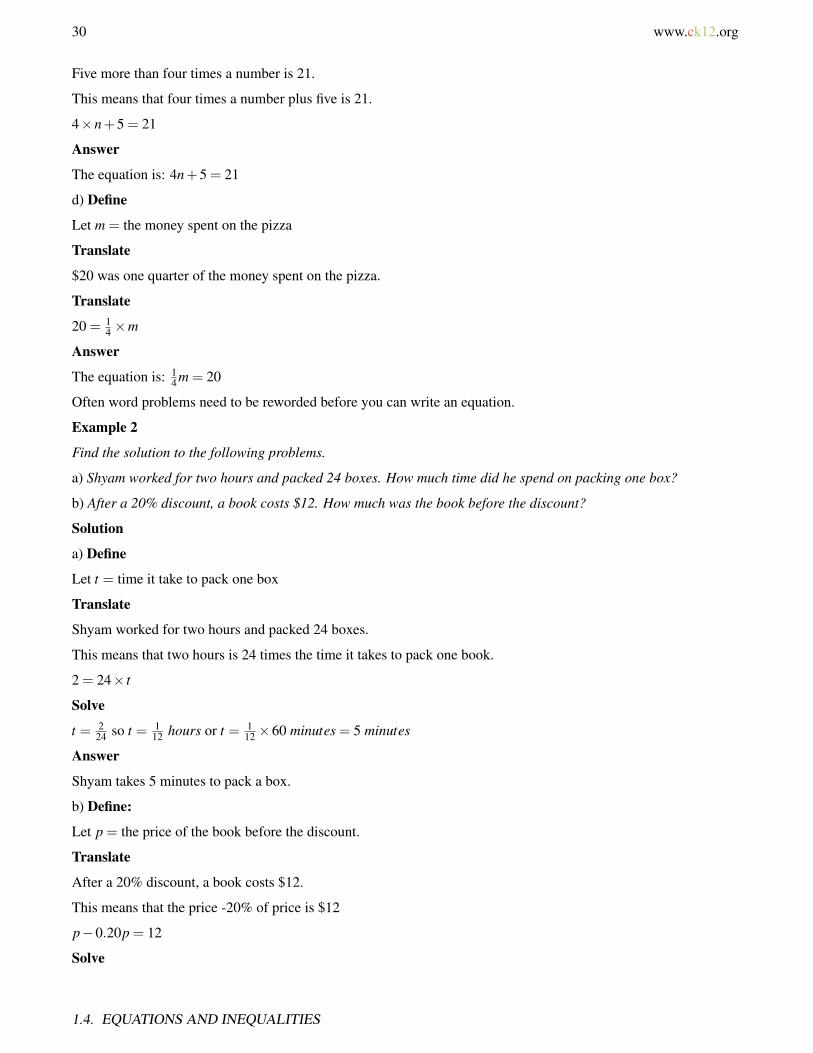
Often word problems need to be reworded before you can write an equation.
Example 2
Find the solution to the following problems.
a) Shyam worked for two hours and packed 24 boxes. How much time did he spend on packing one box?
b) After a 20% discount, a book costs $12. How much was the book before the discount?
Solution
a) Define
Let t = time it take to pack one box
Translate
Shyam worked for two hours and packed 24 boxes.
This means that two hours is 24 times the time it takes to pack one book.
2 = 24× t
Solve
t = 224 so t = 1
12 hours or t = 112 ×60 minutes = 5 minutes
Answer
Shyam takes 5 minutes to pack a box.
b) Define:
Let p = the price of the book before the discount.
Translate
After a 20% discount, a book costs $12.
This means that the price -20% of price is $12
p−0.20p = 12
Solve
1.4. EQUATIONS AND INEQUALITIES
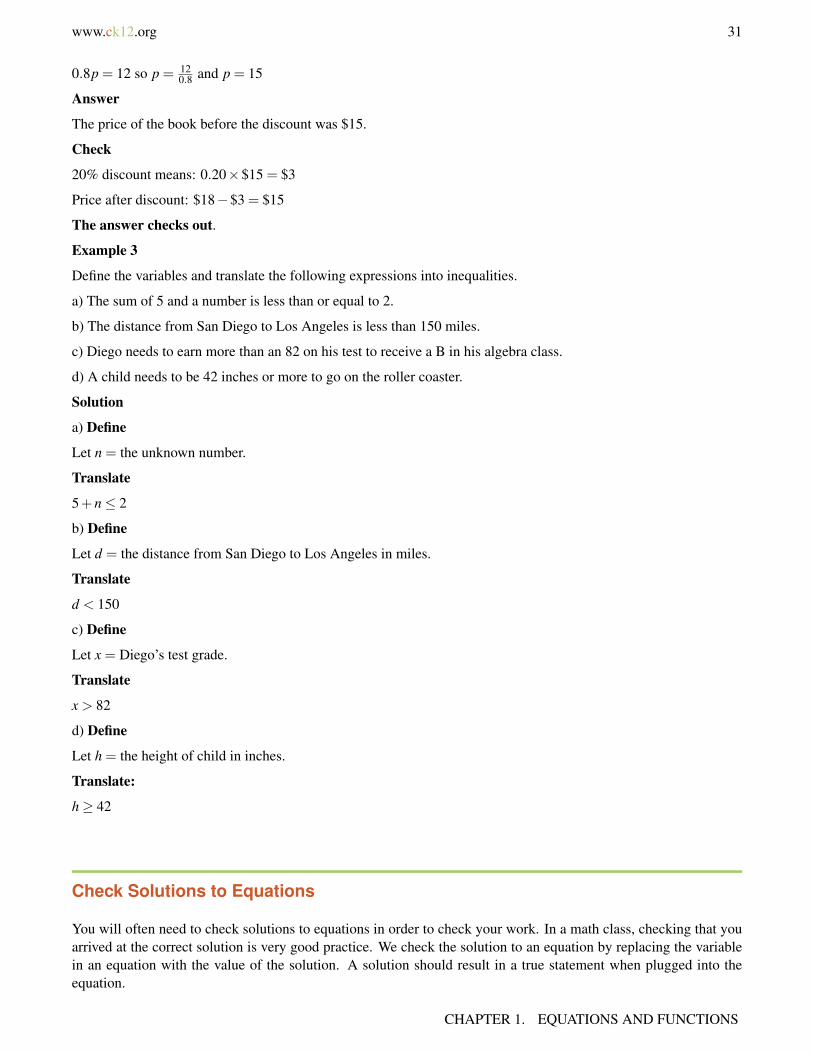
www.ck12.org 31
0.8p = 12 so p = 120.8 and p = 15
Answer
The price of the book before the discount was $15.
Check
20% discount means: 0.20×$15 = $3
Price after discount: $18−$3 = $15
The answer checks out.
Example 3
Define the variables and translate the following expressions into inequalities.
a) The sum of 5 and a number is less than or equal to 2.
b) The distance from San Diego to Los Angeles is less than 150 miles.
c) Diego needs to earn more than an 82 on his test to receive a B in his algebra class.
d) A child needs to be 42 inches or more to go on the roller coaster.
Solution
a) Define
Let n = the unknown number.
Translate
5+n≤ 2
b) Define
Let d = the distance from San Diego to Los Angeles in miles.
Translate
d < 150
c) Define
Let x = Diego’s test grade.
Translate
x > 82
d) Define
Let h = the height of child in inches.
Translate:
h≥ 42
Check Solutions to Equations
You will often need to check solutions to equations in order to check your work. In a math class, checking that youarrived at the correct solution is very good practice. We check the solution to an equation by replacing the variablein an equation with the value of the solution. A solution should result in a true statement when plugged into theequation.
CHAPTER 1. EQUATIONS AND FUNCTIONS

32 www.ck12.org
Example 4
Check that x = 5 is the solution to the equation 3x+2 =−2x+27 .
Solution
To check that x = 5 is the solution to the equation, we “plug in” the value of 5 for the variable, x :
3x+2 =−2x+27
3 · x+2 =−2 · x+27
3 ·5+2 =−2 ·5+27
15+2 =−10+27
17 = 17
This is a true statement.
This means that x = 5 is the solution to equation 3x+2 =−2x+27 .
Example 5
Check that the given number is a solution to the corresponding equation.
a) y =−1;3y+5 =−2y
b) z = 3;z2 +2z = 8
c) x =−12 ;3x+1 = x
Solution
Replace the variable in each equation with the given value.
a)
3(−1)+5 =−2(−1)
−3+5 = 2
2 = 2
This is a true statement. This means that y =−1 is a solution to 3y+5 =−2y .
b)
32 +2(3) = 8
9+6 = 8
15 = 8
This is not a true statement. This means that z = 3 is not a solution to z2 +2z = 8 .
c)
3(−1
2
)+1 =−1
2(−3
2
)+1 =−1
2
−12=−1
2
This is a true statement. This means that x = 12 is a solution to 3x+1 = x .
1.4. EQUATIONS AND INEQUALITIES

www.ck12.org 33
Check Solutions to Inequalities
To check the solution to an inequality, we replace the variable in the inequality with the value of the solution. Asolution to an inequality produces a true statement when substituted into the inequality.
Example 6
Check that the given number is a solution to the corresponding inequality.
a) a = 10;20a≤ 250
b) b =−2; 3−bb >−4
c) x = 34 ;4x+5≤ 8
d) z = 25; z5 +1 < z−20
Solution
Replace the variable in each inequality with the given value.
a)
20(10)≤ 250
200≤ 250
This statement is true. This means that a = 10 is a solution to the inequality 20a ≤ 250 . Note that a = 10 is notthe only solution to this inequality. If we divide both sides of the inequality by 20 we can write that
a≤ 12.5.
So any number equal to or less than 12.5 is going to be a solution to this inequality.
b)
3− (−2)(−2)
>−4
3+2−2
>−4
−52>−4
−2.5 >−4
This statement is true. This means that b =−2 is a solution to the inequality 3−bb >−4 .
c)
4(
34
)+5≥ 8
3+5≥ 8
8≥ 8
CHAPTER 1. EQUATIONS AND FUNCTIONS
34 www.ck12.org
This statement is true. It is true because the equal sign is included in the inequality. This means that x = 34 is a
solution to the inequality 4x+5≥ 8 .
d)
255+1 < 25−20
5+1 < 5
6 < 5
This statement is not true. This means that z = 25 is not a solution to z5 +1 < z−20 .
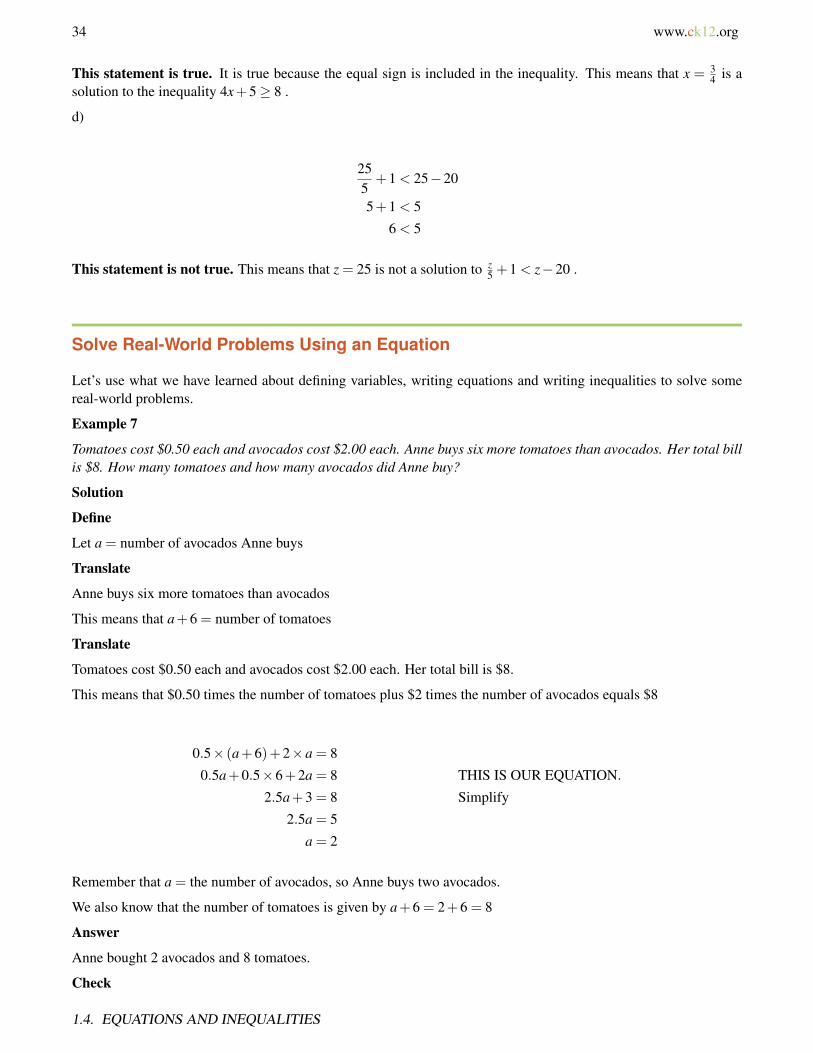
Solve Real-World Problems Using an Equation
Let’s use what we have learned about defining variables, writing equations and writing inequalities to solve somereal-world problems.
Example 7
Tomatoes cost $0.50 each and avocados cost $2.00 each. Anne buys six more tomatoes than avocados. Her total billis $8. How many tomatoes and how many avocados did Anne buy?
Solution
Define
Let a = number of avocados Anne buys
Translate
Anne buys six more tomatoes than avocados
This means that a+6 = number of tomatoes
Translate
Tomatoes cost $0.50 each and avocados cost $2.00 each. Her total bill is $8.
This means that $0.50 times the number of tomatoes plus $2 times the number of avocados equals $8
0.5× (a+6)+2×a = 8
0.5a+0.5×6+2a = 8 THIS IS OUR EQUATION.
2.5a+3 = 8 Simplify
2.5a = 5
a = 2
Remember that a = the number of avocados, so Anne buys two avocados.
We also know that the number of tomatoes is given by a+6 = 2+6 = 8
Answer
Anne bought 2 avocados and 8 tomatoes.
Check
1.4. EQUATIONS AND INEQUALITIES
www.ck12.org 35
If Anne bought two avocados and eight tomatoes, the total cost is:
2×$2+8×$0.50 = $4+$4 = $8
The answer checks out.
Example 8
To organize a picnic Peter needs at least two times as many hamburgers as hotdogs. He has 24 hotdogs. What is thepossible number of hamburgers Peter has?
Solution
Define
Let x = number of hamburgers
Translate
Peter needs at least two times as many hamburgers as hot dogs. He has 24 hot dogs.
This means that twice the number of hot dogs is less than or equal to the number of hamburgers.
2×24≤ x
Simplify
48≤ x
Answer
Peter needs at least 48 hamburgers
Check We found x = 48 . 48 hamburgers is twice the number of hot dogs. So more than 48 hamburgers is more thantwice the number of hot dogs.
The answer checks out.
Review Questions
1. Define the variables and translate the following expressions into equations.
a. Peter’s Lawn Mowing Service charges $10 per job and $0.20 per square yard. Peter earns $25 for a job.b. Renting the ice-skating rink for a birthday party costs $200 plus $4 per person. The rental costs $324 in
total.c. Renting a car costs $55 per day plus $0.45 per mile. The cost of the rental is $100.d. Nadia gave Peter 4 more blocks than he already had. He already had 7 blocks.
2. Define the variables and translate the following expressions into inequalities.
a. A bus can seat 65 passengers or fewer.b. The sum of two consecutive integers is less than 54.c. An amount of money is invested at 5% annual interest. The interest earned at the end of the year is
greater than or equal to $250.d. You buy hamburgers at a fast food restaurant. A hamburger costs $0.49. You have at most $3 to spend.
Write an inequality for the number of hamburgers you can buy.
3. Check that the given number is a solution to the corresponding equation.
a. a =−3;4a+3 =−9b. x = 4
3 ; 34 x+ 1
2 = 32
c. y = 2;2.5y−10.0 =−5.0d. z =−5;2(5−2z) = 20−2(z−1)
CHAPTER 1. EQUATIONS AND FUNCTIONS
36 www.ck12.org
4. Check that the given number is a solution to the corresponding inequality.
a. x = 12;2(x+6)≤ 8xb. z =−9;1.4z+5.2 > 0.4zc. y = 40;−5
2 y+ 12 <−18
d. t = 0.4;80≥ 10(3t +2)
5. The cost of a Ford Focus is 27% of the price of a Lexus GS 450h. If the price of the Ford is $15000, what isthe price of the Lexus?
6. On your new job you can be paid in one of two ways. You can either be paid $1000 per month plus 6%commission of total sales or be paid $1200 per month plus 5% commission on sales over $2000. For whatamount of sales is the first option better than the second option? Assume there are always sales over $2000.
Review Answers
1. a. x = number of square yards of lawn; 25 = 10+0.2xb. p = number of people at the party; 324 = 200+4pc. m = number of miles; 55+0.45m = 100d. n = number of blocks; n = 4+7
a. x = number of passengers; x≤ 65b. n = the first integer; 2n+1 < 54c. P = amount of money invested; 0.05P≥ 250d. n = number of hamburgers; 0.49n≤ 3
a. 4(−3)+3 =−9 so −12+3 =−9 so −9 =−9 . This is a true statement.b. 3
4
(43
)+ 1
2 = 32 so 1+ 1
2 = 32 so 3
2 = 32 This is a true statement.
c. 2.5(2)−10.0 =−5.0 so 5.0−10.0 =−5.0 so −5.0 =−5.0 . This is a true statement.d. 2(5− 2(−5)) = 20− 2((−5)− 1) so 2(5+ 10) = 20− 2(−6) so 2(15) = 20+ 12 so 30 = 32 . This is
not a true statement.
a. 2(12+6)≤ 8(12) so 2(18)≤ 96 so 36≤ 96 . This is true statement.b. 1.4(−9)+5.2 > 0.4(−9) so −12.6+5.2 >−3.6 so −7.4 >−3.6 . This is not a true statement.c. −5
2(40)<−18 so −100+ 12 <−18 so −99.5 <−18 . This is a true statement.
d. 80≥ 10(3(0.4)+2) so 80≥ 10(1.2+2) so 80≥ 10(3.2) so 80≥ 32 . This is a true statement.
2. x = price of a Lexus; 0.27x = 15000;x = $555563. x = total sales; 1000+0.06x > 1200+0.05(x−2000) so x > 10000.
1.4. EQUATIONS AND INEQUALITIES
www.ck12.org 37
1.5 Functions as Rules and Tables
Learning Objectives
• Identify the domain and range of a function.• Make a table for a function.• Write a function rule.• Represent a real-world situation with a function.
Introduction
A function is a rule for relating two or more variables. For example, the price a person pays for phone servicemay depend on the number of minutes he/she talks on the phone. We would say that the cost of phone service is afunction of the number of minutes she talks. Consider the following situation.
Josh goes to an amusement park where he pays $2 per ride.
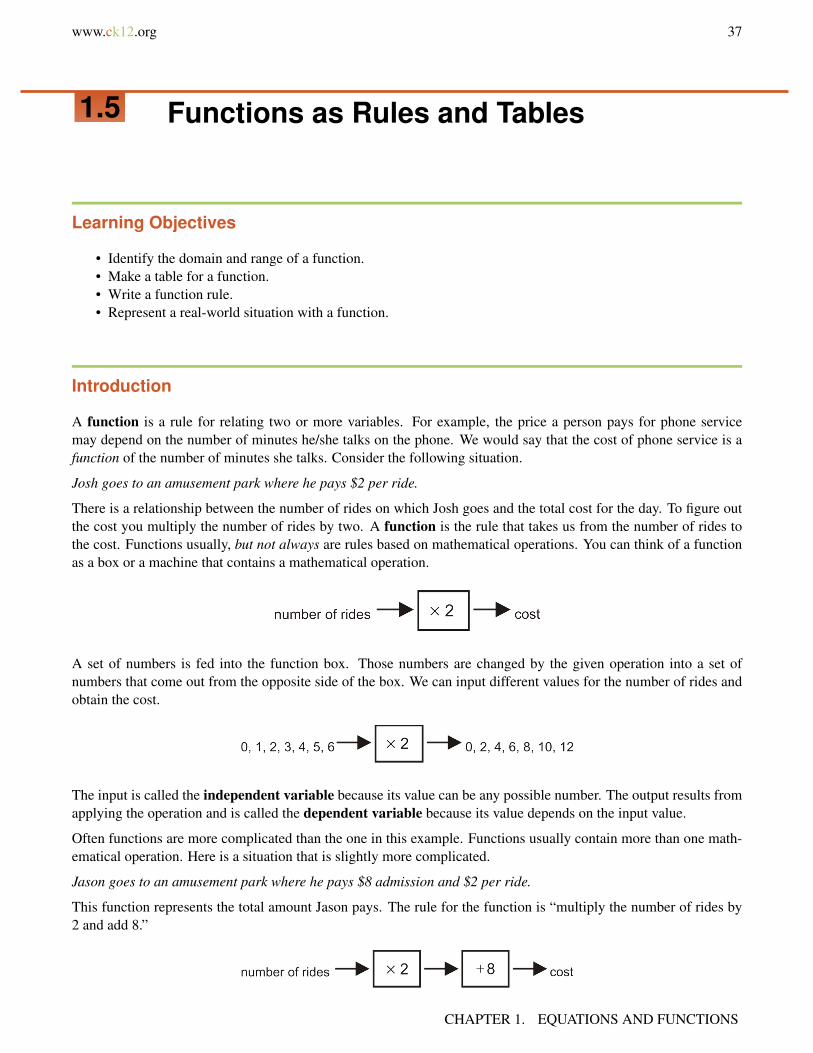
There is a relationship between the number of rides on which Josh goes and the total cost for the day. To figure outthe cost you multiply the number of rides by two. A function is the rule that takes us from the number of rides tothe cost. Functions usually, but not always are rules based on mathematical operations. You can think of a functionas a box or a machine that contains a mathematical operation.
A set of numbers is fed into the function box. Those numbers are changed by the given operation into a set ofnumbers that come out from the opposite side of the box. We can input different values for the number of rides andobtain the cost.
The input is called the independent variable because its value can be any possible number. The output results fromapplying the operation and is called the dependent variable because its value depends on the input value.
Often functions are more complicated than the one in this example. Functions usually contain more than one math-ematical operation. Here is a situation that is slightly more complicated.
Jason goes to an amusement park where he pays $8 admission and $2 per ride.
This function represents the total amount Jason pays. The rule for the function is “multiply the number of rides by2 and add 8.”
CHAPTER 1. EQUATIONS AND FUNCTIONS

38 www.ck12.org
We input different values for the number of rides and we arrive at different outputs (costs).
These flow diagrams are useful in visualizing what a function is. However, they are cumbersome to use in practice.We use the following short-hand notation instead.
input
↓f (x)︸︷︷︸= y← out put
f unction
box
First, we define the variables.
x = the number of rides Josh goes on
y = the total amount of money Jason paid at the amusement park.
So, x represents the input and y represents the output. The notation: f () represents the function or the mathematicaloperations we use on the input to obtain the output. In the last example, the cost is 2 times the number of rides plus8. This can be written as a function.
f (x) = 2x+8
The output is given by the formula f (x) = 2x+ 8 . The notations y and f (x) are used interchangeably but keep inmind that y represents output value and f (x) represents the mathematical operations that gets us from the input tothe output.
Identify the Domain and Range of a Function
In the last example, we saw that we can input the number of rides into the function to give us the total cost for goingto the amusement park. The set of all values that are possible for the input is called the domain of the function. Theset of all values that are possible for the output is called the range of function. In many situations the domain andrange of a function is the set of all real numbers, but this is not always the case. Let’s look at our amusement parkexample.
Example 1
Find the domain and range of the function that describes the situation:
Jason goes to an amusement park where he pays $8 admission and $2 per ride.
Solution
Here is the function that describes this situation.
f (x) = 2x+8 = y
1.5. FUNCTIONS AS RULES AND TABLES
www.ck12.org 39
In this function, x is the number of rides and y is the total cost. To find the domain of the function, we need todetermine which values of x make sense as the input.
• The values have to be zero or positive because Jason can’t go on a negative number of rides.• The values have to be integers because, for example, Jason could not go on 2.25 rides.• Realistically, there must be a maximum number of rides that Jason can go on because the park closes, he
runs out of money, etc. However, since we are not given any information about this we must consider that allnon-negative integers could be possible regardless of how big they are.
Answer For this function, the domain is the set of all non-negative integers.
To find the range of the function we must determine what the values of y will be when we apply the function to theinput values. The domain is the set of all non-negative integers (0, 1, 2, 3, 4, 5, 6...). Next we plug these values intothe function for x .
f (x) = 2x+8 = y
Then, y = 8,10,12,14,16,18,20, . . .
Answer The range of this function is the set of all even integers greater than or equal to 8.
Example 2
Find the domain and range of the following functions.
a) A ball is dropped from a height and it bounces up to 75% of its original height.
b) y = x2
Solution
a) Let’s define the variables:
x = original height
y = bounce height
Here is a function that describes the situation. y = f (x) = 0.75x .
The variable x can take any real value greater than zero.
The variable y can also take any real value greater than zero.
Answer The domain is the set of all real numbers greater than zero.
The range is the set of all real numbers greater than zero.
b) Since we don’t have a word-problem attached to this equation we can assume that we can use any real number asa value of x .
Since y = x2 , the value of y will always be non-negative whether x is positive, negative, or zero.
Answer The domain of this function is all real numbers.
The range of this function is all non-negative real numbers
As we saw, for a function, the variable x is called the independent variable because it can be any of the values fromthe domain. The variable y is called the dependent variable because its value depends on x . Any symbols can beused to represent the dependent and independent variables. Here are three different examples.
CHAPTER 1. EQUATIONS AND FUNCTIONS

40 www.ck12.org
y = f (x) = 3x
R = f (w) = 3w
v = f (t) = 3t
These expressions all represent the same function. The dependent variable is three times the independent variable. Inpractice, the symbols used for the independent and dependent variables are based on common usage. For example:t for time, d for distance, v for velocity, etc. The standard symbols to use are y for the dependent variable and x forthe independent variable.
A Function:
• Only accepts numbers from the domain.• For each input, there is exactly one output. All the outputs form the range.
Multimedia Link For another look at the domain of a function, see the following video where the narrator solvesa sample problem from the California Standards Test about finding the domain of an unusual function http://www.youtube.com/watch?v=NRB6s77nx2g (6:34)
MEDIAClick image to the left for more content.
.
Make a Table For a Function
A table is a very useful way of arranging the data represented by a function. We can match the input and outputvalues and arrange them as a table. Take the amusement park example again.
Jason goes to an amusement park where he pays $8 admission and $2 per ride.
We saw that to get from the input to the output we perform the operations 2× input +8 . For example, we input thevalues 0, 1, 2, 3, 4, 5, 6, and we obtain the output values 8, 10, 12, 14, 16, 18, 20. Next, we can make the followingtable of values.
TABLE 1.8:
x y0 81 102 123 144 165 186 20
1.5. FUNCTIONS AS RULES AND TABLES

www.ck12.org 41
A table allows us organize out data in a compact manner. It also provides an easy reference for looking up data, andit gives us a set of coordinate points that we can plot to create a graphical representation of the function.
Example 3
Make a table of values for the following functions.
a) f (x) = 5x−9 Use the following numbers for input values: -4, -3, -2, -1, 0, 1, 2, 3, 4.
b) f (x) = 1x Use the following numbers for input values: -1, -0.5, -0.2, -0.1, -0.01, 0.01, 0.1, 0.2, 0.5, 1.
Solution
Make a table of values by filling the first column with the input values and the second column with the output valuescalculated using the given function.
a)
TABLE 1.9:
x f (x) = 5x−9 = y−4 5(−4)−9 =−29-3 5(−3)−9 =−24-2 5(−2)−9 =−19-1 5(−1)−9 =−140 5(0)−9 =−91 5(1)−9 =−42 5(2)−9 = 13 5(3)−9 = 64 5(4)−9 = 11
b)
TABLE 1.10:
x f (x) = 1x = y
−1 1−1 =−1
-0.5 1−0.5 =−2
-0.2 1−0.2 =−5
-0.1 1−0.1 =−10
-0.01 1−0.01 =−100
0.01 10.01 = 100
0.1 10.1 = 10
0.2 10.2 = 5
0.5 10.5 = 2
1.0 11 = 1
You are not usually given the input values of a function. These are picked based on the particular function orcircumstance. We will discuss how we pick the input values for the table of values throughout this book.
CHAPTER 1. EQUATIONS AND FUNCTIONS
42 www.ck12.org
Write a Function Rule
In many situations, we collect data by conducting a survey or an experiment. Then we organize the data in a tableof values. Most often, we would like to find the function rule or formula that fits the set of values in the table. Thisway we can use the rule to predict what could happen for values that are not in the table.
Example 4
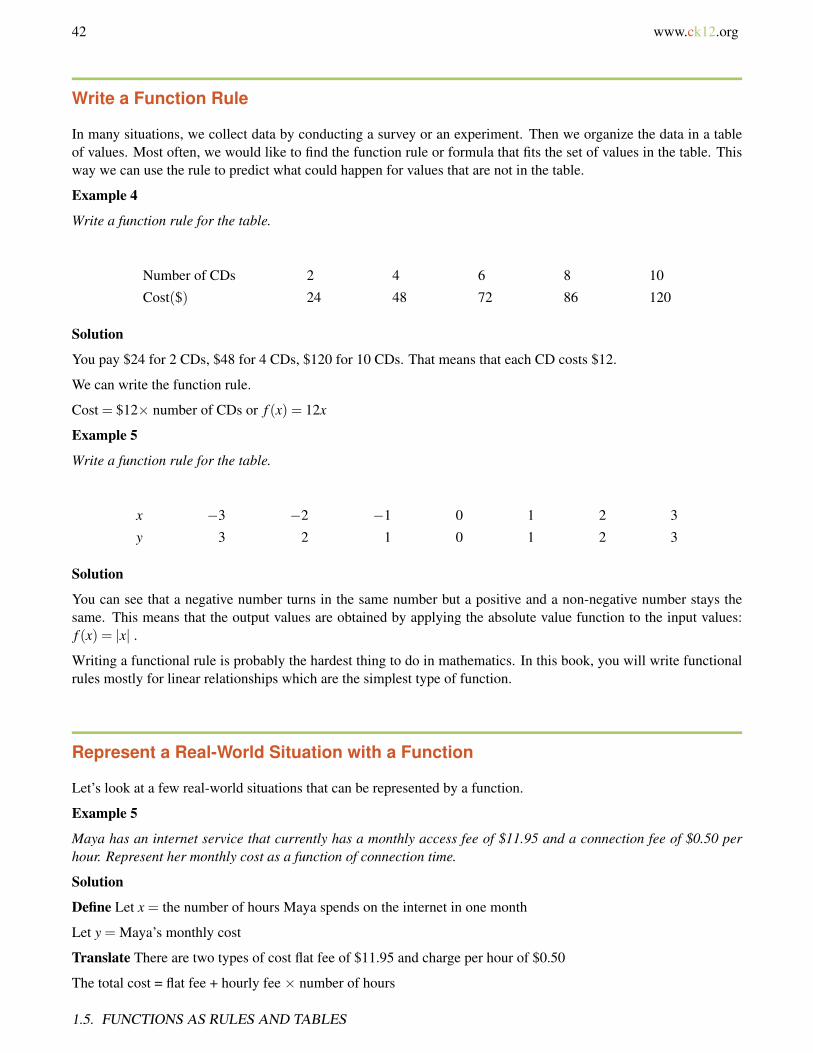
Write a function rule for the table.
Number of CDs 2 4 6 8 10
Cost($) 24 48 72 86 120
Solution
You pay $24 for 2 CDs, $48 for 4 CDs, $120 for 10 CDs. That means that each CD costs $12.
We can write the function rule.
Cost = $12× number of CDs or f (x) = 12x
Example 5
Write a function rule for the table.
x −3 −2 −1 0 1 2 3
y 3 2 1 0 1 2 3
Solution
You can see that a negative number turns in the same number but a positive and a non-negative number stays thesame. This means that the output values are obtained by applying the absolute value function to the input values:f (x) = |x| .
Writing a functional rule is probably the hardest thing to do in mathematics. In this book, you will write functionalrules mostly for linear relationships which are the simplest type of function.
Represent a Real-World Situation with a Function
Let’s look at a few real-world situations that can be represented by a function.
Example 5
Maya has an internet service that currently has a monthly access fee of $11.95 and a connection fee of $0.50 perhour. Represent her monthly cost as a function of connection time.
Solution
Define Let x = the number of hours Maya spends on the internet in one month
Let y = Maya’s monthly cost
Translate There are two types of cost flat fee of $11.95 and charge per hour of $0.50
The total cost = flat fee + hourly fee × number of hours
1.5. FUNCTIONS AS RULES AND TABLES
www.ck12.org 43
Answer The function is y = f (x) = 11.95+0.50x
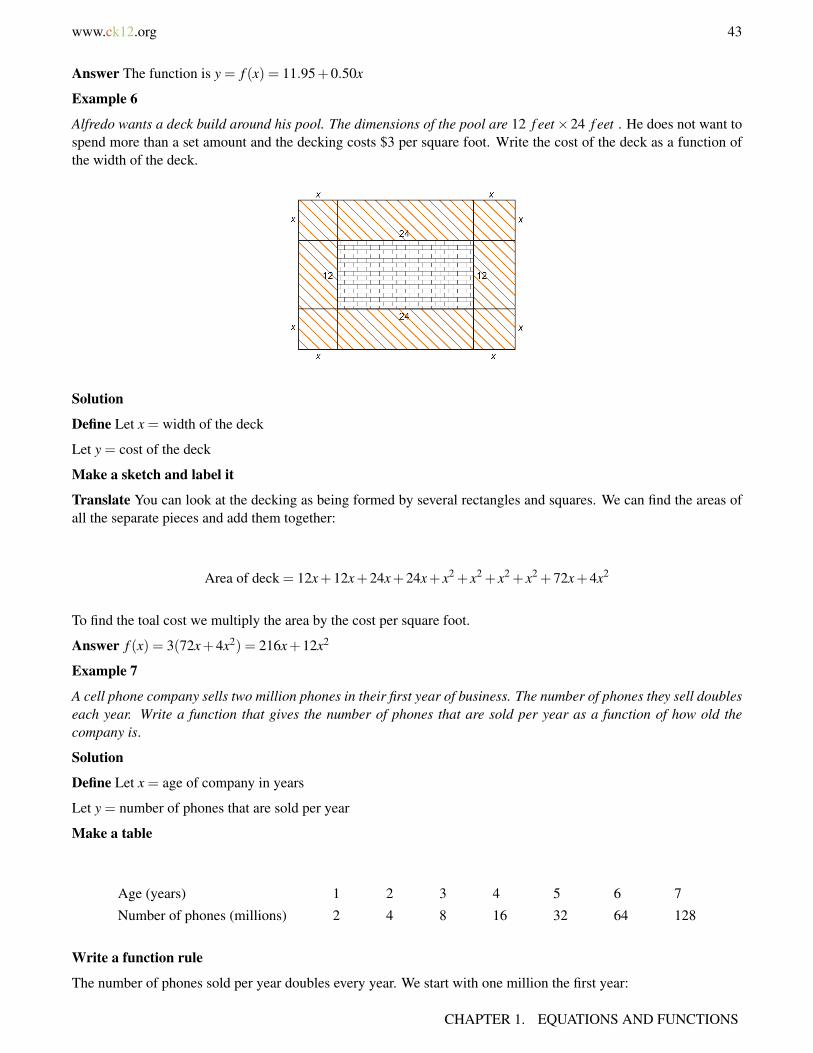
Example 6
Alfredo wants a deck build around his pool. The dimensions of the pool are 12 f eet×24 f eet . He does not want tospend more than a set amount and the decking costs $3 per square foot. Write the cost of the deck as a function ofthe width of the deck.
Solution
Define Let x = width of the deck
Let y = cost of the deck
Make a sketch and label it
Translate You can look at the decking as being formed by several rectangles and squares. We can find the areas ofall the separate pieces and add them together:
Area of deck = 12x+12x+24x+24x+ x2 + x2 + x2 + x2 +72x+4x2
To find the toal cost we multiply the area by the cost per square foot.
Answer f (x) = 3(72x+4x2) = 216x+12x2
Example 7
A cell phone company sells two million phones in their first year of business. The number of phones they sell doubleseach year. Write a function that gives the number of phones that are sold per year as a function of how old thecompany is.
Solution
Define Let x = age of company in years
Let y = number of phones that are sold per year
Make a table
Age (years) 1 2 3 4 5 6 7
Number of phones (millions) 2 4 8 16 32 64 128
Write a function rule
The number of phones sold per year doubles every year. We start with one million the first year:
CHAPTER 1. EQUATIONS AND FUNCTIONS
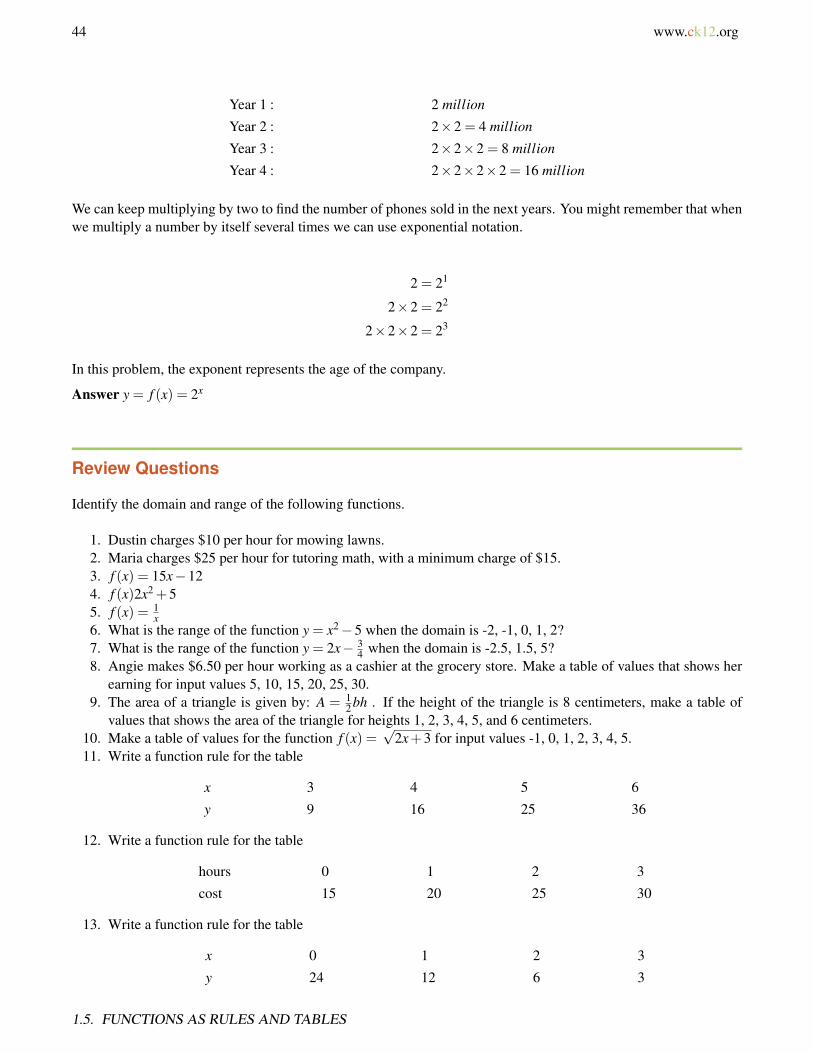
44 www.ck12.org
Year 1 : 2 million
Year 2 : 2×2 = 4 million
Year 3 : 2×2×2 = 8 million
Year 4 : 2×2×2×2 = 16 million
We can keep multiplying by two to find the number of phones sold in the next years. You might remember that whenwe multiply a number by itself several times we can use exponential notation.
2 = 21
2×2 = 22
2×2×2 = 23
In this problem, the exponent represents the age of the company.
Answer y = f (x) = 2x
Review Questions
Identify the domain and range of the following functions.
1. Dustin charges $10 per hour for mowing lawns.2. Maria charges $25 per hour for tutoring math, with a minimum charge of $15.3. f (x) = 15x−124. f (x)2x2 +55. f (x) = 1
x6. What is the range of the function y = x2−5 when the domain is -2, -1, 0, 1, 2?7. What is the range of the function y = 2x− 3
4 when the domain is -2.5, 1.5, 5?8. Angie makes $6.50 per hour working as a cashier at the grocery store. Make a table of values that shows her
earning for input values 5, 10, 15, 20, 25, 30.9. The area of a triangle is given by: A = 1
2 bh . If the height of the triangle is 8 centimeters, make a table ofvalues that shows the area of the triangle for heights 1, 2, 3, 4, 5, and 6 centimeters.
10. Make a table of values for the function f (x) =√
2x+3 for input values -1, 0, 1, 2, 3, 4, 5.11. Write a function rule for the table
x 3 4 5 6
y 9 16 25 36
12. Write a function rule for the table
hours 0 1 2 3
cost 15 20 25 30
13. Write a function rule for the table
x 0 1 2 3
y 24 12 6 3
1.5. FUNCTIONS AS RULES AND TABLES
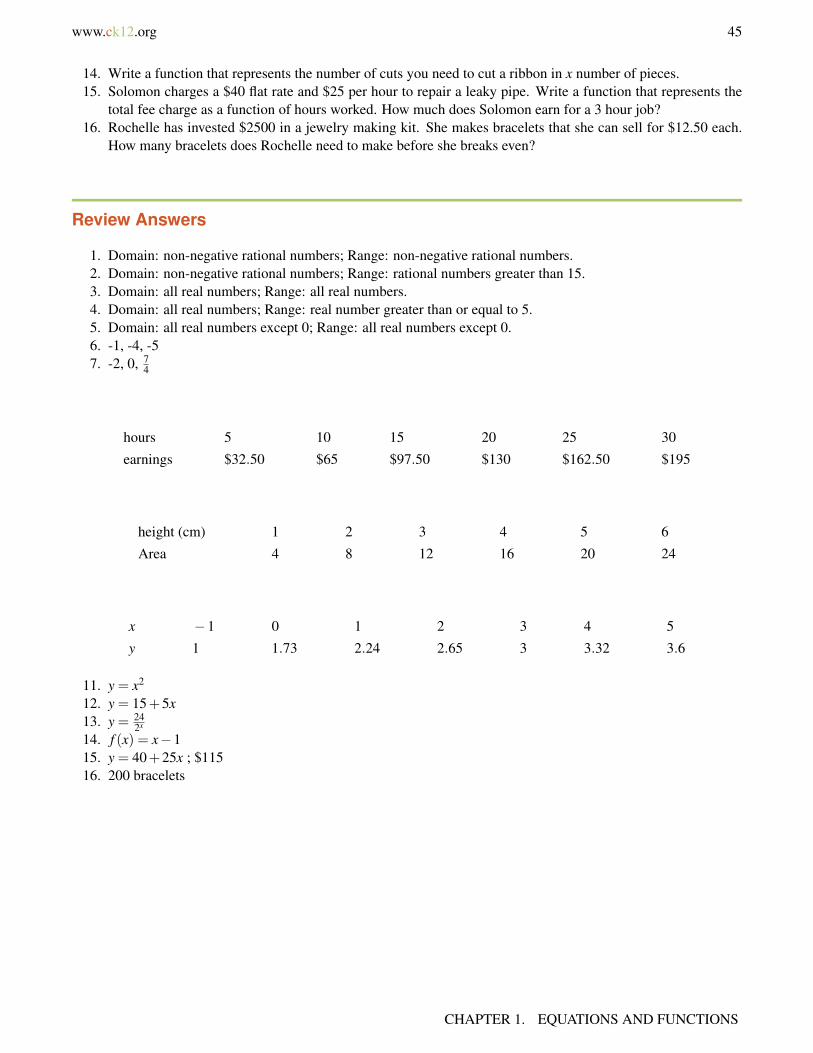
www.ck12.org 45
14. Write a function that represents the number of cuts you need to cut a ribbon in x number of pieces.15. Solomon charges a $40 flat rate and $25 per hour to repair a leaky pipe. Write a function that represents the
total fee charge as a function of hours worked. How much does Solomon earn for a 3 hour job?16. Rochelle has invested $2500 in a jewelry making kit. She makes bracelets that she can sell for $12.50 each.
How many bracelets does Rochelle need to make before she breaks even?
Review Answers
1. Domain: non-negative rational numbers; Range: non-negative rational numbers.2. Domain: non-negative rational numbers; Range: rational numbers greater than 15.3. Domain: all real numbers; Range: all real numbers.4. Domain: all real numbers; Range: real number greater than or equal to 5.5. Domain: all real numbers except 0; Range: all real numbers except 0.6. -1, -4, -57. -2, 0, 7
4
hours 5 10 15 20 25 30
earnings $32.50 $65 $97.50 $130 $162.50 $195
height (cm) 1 2 3 4 5 6
Area 4 8 12 16 20 24
x −1 0 1 2 3 4 5
y 1 1.73 2.24 2.65 3 3.32 3.6
11. y = x2
12. y = 15+5x13. y = 24
2x
14. f (x) = x−115. y = 40+25x ; $11516. 200 bracelets
CHAPTER 1. EQUATIONS AND FUNCTIONS

46 www.ck12.org
1.6 Functions as Graphs
Learning Objectives
• Graph a function from a rule or table.• Write a function rule from a graph.• Analyze the graph of a real world situation.• Determine whether a relation is a function.
Introduction
We represent functions graphically by plotting points on a Coordinate Plane (this is also sometimes called theCartesian plane). The coordinate plane is a grid formed by a horizontal number line and a vertical number line thatcross at a point called the origin. The origin is point (0, 0) and it is the “starting” location. In order to plot points onthe grid, you are told how many units you go right or left and how many units you go up or down from the origin.The horizontal line is called the x− axis and the vertical line is called the y− axis. The arrows at the end of eachaxis indicate that the plane continues past the end of the drawing.
From a function, we can gather information in terms of pairs of points. For each value of the independent variablein the domain, the function is used to calculate the value of the dependent variable. We call these pairs of pointscoordinate points or x,y values and they are written as (x,y) .
To graph a coordinate point such as (4, 2) we start at the origin.
Then we move 4 units to the right.
And then we move 2 units up from the last location.
1.6. FUNCTIONS AS GRAPHS
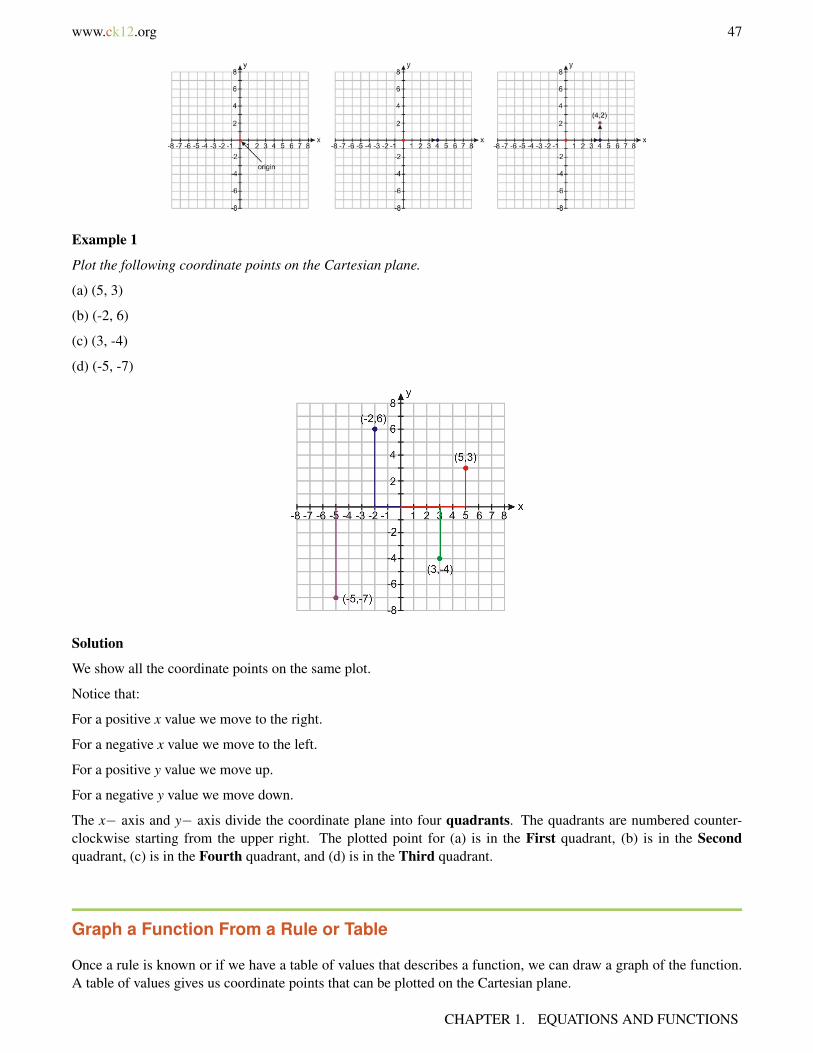
www.ck12.org 47
Example 1
Plot the following coordinate points on the Cartesian plane.
(a) (5, 3)
(b) (-2, 6)
(c) (3, -4)
(d) (-5, -7)
Solution
We show all the coordinate points on the same plot.
Notice that:
For a positive x value we move to the right.
For a negative x value we move to the left.
For a positive y value we move up.
For a negative y value we move down.
The x− axis and y− axis divide the coordinate plane into four quadrants. The quadrants are numbered counter-clockwise starting from the upper right. The plotted point for (a) is in the First quadrant, (b) is in the Secondquadrant, (c) is in the Fourth quadrant, and (d) is in the Third quadrant.
Graph a Function From a Rule or Table
Once a rule is known or if we have a table of values that describes a function, we can draw a graph of the function.A table of values gives us coordinate points that can be plotted on the Cartesian plane.
CHAPTER 1. EQUATIONS AND FUNCTIONS

48 www.ck12.org
Example 2
Graph the function that has the following table of values.
x −2 −1 0 1 2
y 6 8 10 12 14
Solution
The table gives us five sets of coordinate points (-2, 6), (-1, 8), (0, 10), (1, 12), (2, 14).
To graph the function, we plot all the coordinate points. Since we are not told the domain of the function or thecontext where it appears we can assume that the domain is the set of all real numbers. To show that the functionholds for all values in the domain, we connect the points with a smooth line. Also, we must realize that the linecontinues infinitely in both directions.
Example 3
Graph the function that has the following table of values.
Side of the Square 0 1 2 3 4
Area of the Square 0 1 4 9 16
The table gives us five sets of coordinate points: (0, 0), (1, 1), (2, 4), (3, 9), (4, 16).
To graph the function, we plot all the coordinate points. Since we are not told the domain of the function, we canassume that the domain is the set of all non-negative real numbers. To show that the function holds for all values inthe domain, we connect the points with a smooth curve. The curve does not make sense for negative values of theindependent variable so it stops at x = 0 but it continues infinitely in the positive direction.
1.6. FUNCTIONS AS GRAPHS
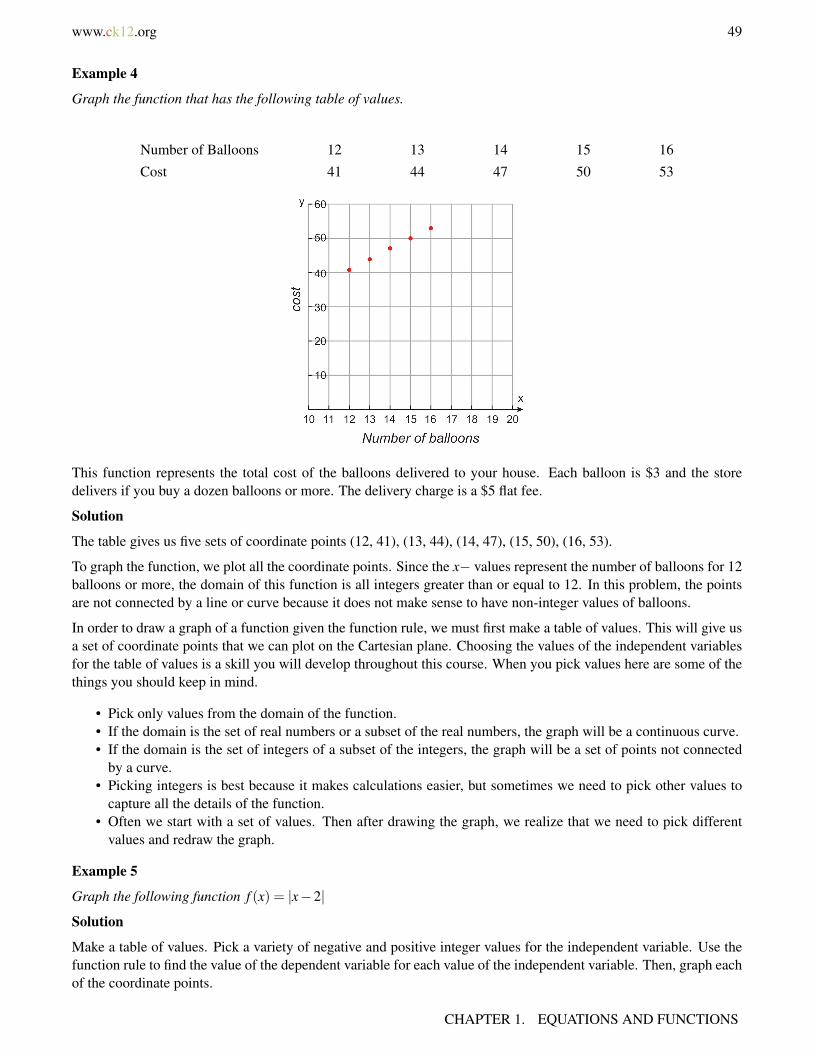
www.ck12.org 49
Example 4
Graph the function that has the following table of values.
Number of Balloons 12 13 14 15 16
Cost 41 44 47 50 53
This function represents the total cost of the balloons delivered to your house. Each balloon is $3 and the storedelivers if you buy a dozen balloons or more. The delivery charge is a $5 flat fee.
Solution
The table gives us five sets of coordinate points (12, 41), (13, 44), (14, 47), (15, 50), (16, 53).
To graph the function, we plot all the coordinate points. Since the x− values represent the number of balloons for 12balloons or more, the domain of this function is all integers greater than or equal to 12. In this problem, the pointsare not connected by a line or curve because it does not make sense to have non-integer values of balloons.
In order to draw a graph of a function given the function rule, we must first make a table of values. This will give usa set of coordinate points that we can plot on the Cartesian plane. Choosing the values of the independent variablesfor the table of values is a skill you will develop throughout this course. When you pick values here are some of thethings you should keep in mind.
• Pick only values from the domain of the function.• If the domain is the set of real numbers or a subset of the real numbers, the graph will be a continuous curve.• If the domain is the set of integers of a subset of the integers, the graph will be a set of points not connected
by a curve.• Picking integers is best because it makes calculations easier, but sometimes we need to pick other values to
capture all the details of the function.• Often we start with a set of values. Then after drawing the graph, we realize that we need to pick different
values and redraw the graph.
Example 5
Graph the following function f (x) = |x−2|
Solution
Make a table of values. Pick a variety of negative and positive integer values for the independent variable. Use thefunction rule to find the value of the dependent variable for each value of the independent variable. Then, graph eachof the coordinate points.
CHAPTER 1. EQUATIONS AND FUNCTIONS

50 www.ck12.org
TABLE 1.11:
x y = f (x) = |x−2|−4 |−4−2|= |−6|= 6-3 |−3−2|= |−5|= 5-2 |−2−2|= |−4|= 4-1 |−1−2|= |−3|= 30 |0−2|= |−2|= 21 |1−2|= |−1|= 12 |2−2|= |0|= 03 |3−2|= |1|= 14 |4−2|= |2|= 25 |5−2|= |3|= 36 |6−2|= |4|= 47 |7−2|= |5|= 58 |8−2|= |6|= 6
It is wise to work with a lot of values when you begin graphing. As you learn about different types of functions, youwill find that you will only need a few points in the table of values to create an accurate graph.
Example 6
Graph the following function: f (x) =√
x
Solution
Make a table of values. We cannot use negative numbers for the independent variable because we can’t take thesquare root of a negative number. The square root doesn’t give real answers for negative inputs. The domain is allpositive real numbers, so we pick a variety of positive integer values for the independent variable. Use the functionrule to find the value of the dependent variable for each value of the independent variable.
TABLE 1.12:
x y = f (x) =√
x0
√0 = 0
1√
1 = 12
√2≈ 1.41
3√
3≈ 1.734
√4 = 2
5√
5≈ 2.246
√6≈ 2.45
1.6. FUNCTIONS AS GRAPHS

www.ck12.org 51
TABLE 1.12: (continued)
x y = f (x) =√
x7
√7≈ 2.65
8√
8≈ 2.839
√9 = 3
Note that the range is all positive real numbers.
Example 7
The post office charges 41 cents to send a letter that is one ounce or less and an extra 17 cents for any amount up toand including an additional ounce. This rate applies to letters up to 3.5 ounces.
Solution
Make a table of values. We cannot use negative numbers for the independent variable because it does not make senseto have negative weight. We pick a variety of positive integer values for the independent variable but we also needto pick some decimal values because prices can be decimals too. This will give us a clear picture of the function.Use the function rule to find the value of the dependent variable for each value of the independent variable.
TABLE 1.13:
x y0 00.2 410.5 410.8 411 411.2 581.5 581.8 582 582.2 752.5 752.8 753.0 753.2 923.5 92
CHAPTER 1. EQUATIONS AND FUNCTIONS
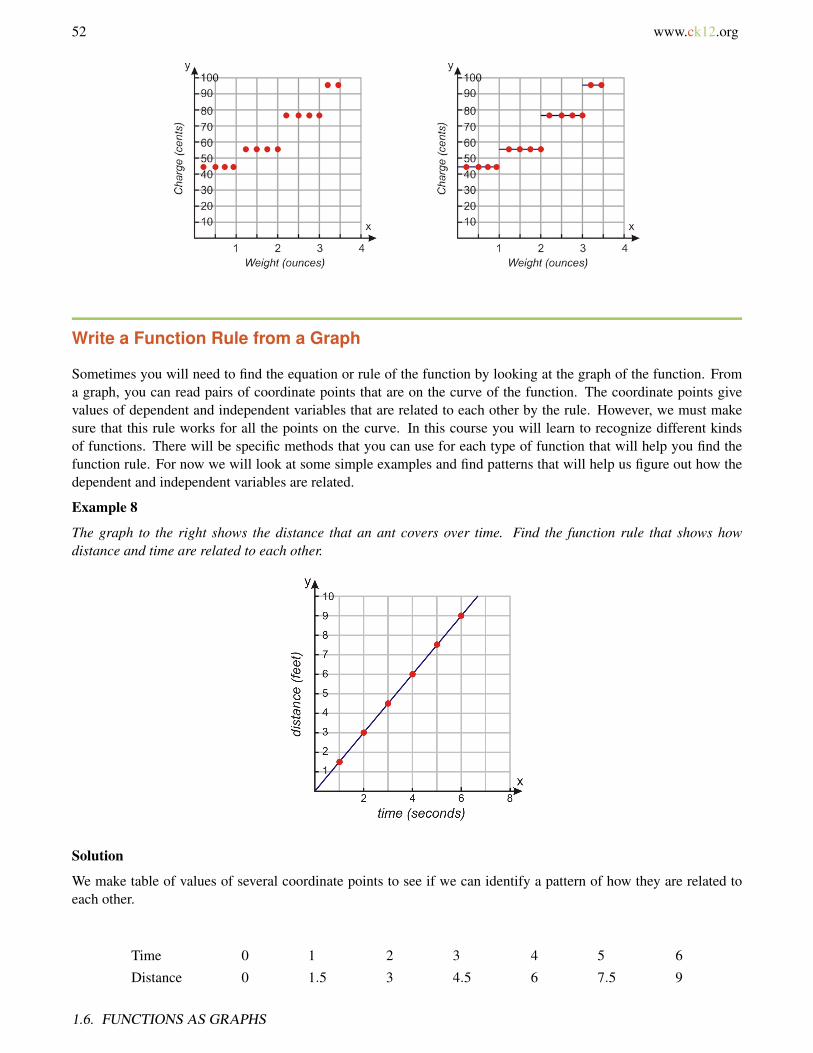
52 www.ck12.org
Write a Function Rule from a Graph
Sometimes you will need to find the equation or rule of the function by looking at the graph of the function. Froma graph, you can read pairs of coordinate points that are on the curve of the function. The coordinate points givevalues of dependent and independent variables that are related to each other by the rule. However, we must makesure that this rule works for all the points on the curve. In this course you will learn to recognize different kindsof functions. There will be specific methods that you can use for each type of function that will help you find thefunction rule. For now we will look at some simple examples and find patterns that will help us figure out how thedependent and independent variables are related.
Example 8
The graph to the right shows the distance that an ant covers over time. Find the function rule that shows howdistance and time are related to each other.
Solution
We make table of values of several coordinate points to see if we can identify a pattern of how they are related toeach other.
Time 0 1 2 3 4 5 6
Distance 0 1.5 3 4.5 6 7.5 9
1.6. FUNCTIONS AS GRAPHS
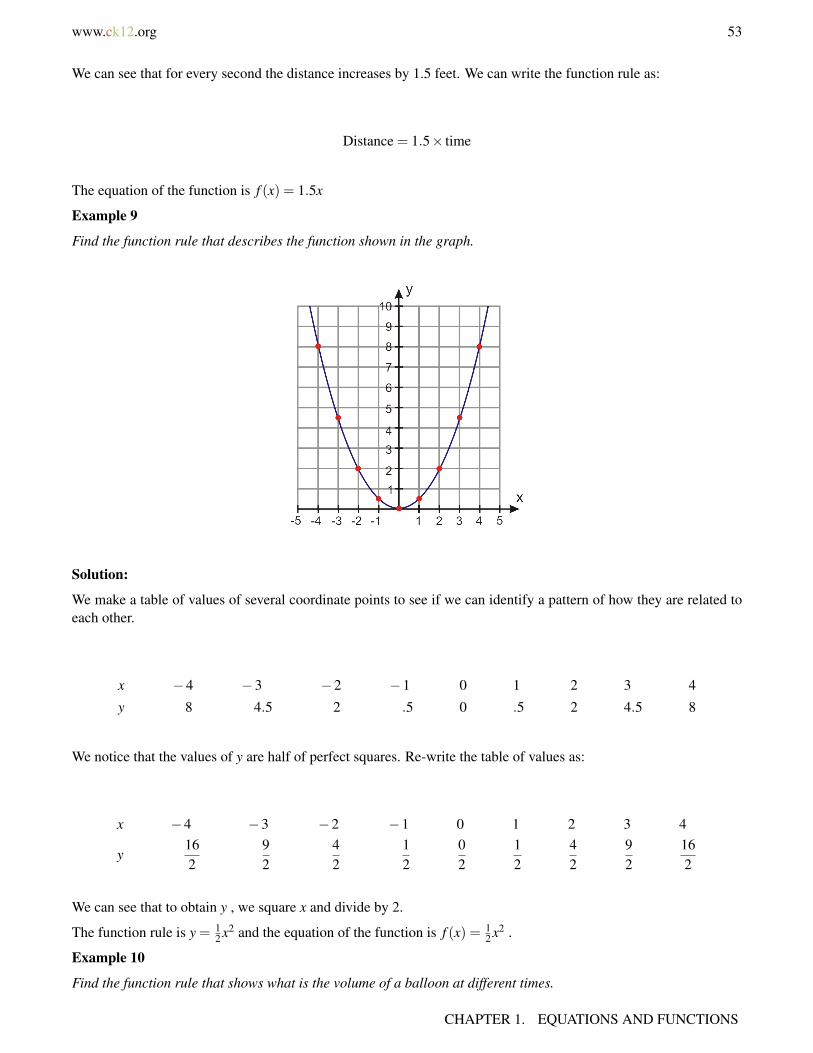
www.ck12.org 53
We can see that for every second the distance increases by 1.5 feet. We can write the function rule as:
Distance = 1.5× time
The equation of the function is f (x) = 1.5x
Example 9
Find the function rule that describes the function shown in the graph.
Solution:
We make a table of values of several coordinate points to see if we can identify a pattern of how they are related toeach other.
x −4 −3 −2 −1 0 1 2 3 4
y 8 4.5 2 .5 0 .5 2 4.5 8
We notice that the values of y are half of perfect squares. Re-write the table of values as:
x −4 −3 −2 −1 0 1 2 3 4
y162
92
42
12
02
12
42
92
162
We can see that to obtain y , we square x and divide by 2.
The function rule is y = 12 x2 and the equation of the function is f (x) = 1
2 x2 .
Example 10
Find the function rule that shows what is the volume of a balloon at different times.
CHAPTER 1. EQUATIONS AND FUNCTIONS

54 www.ck12.org
Solution
We make table of values of several coordinate points to see if we can identify a pattern of how they are related toeach other.
Time −1 0 1 2 3 4 5
Volume 10 5 2.5 1.2 0.6 0.3 0.15
We can see that for every day the volume of the balloon is cut in half. Notice that the graph shows negative time.The negative time can represent what happened on days before you started measuring the volume.
Day 0 : Volume = 5
Day 1 : Volume = 5 · 12
Day 2 : Volume = 5 · 12· 1
2
Day 3 : Volume = 5 · 12· 1
2· 1
2
The equation of the function is f (x) = 5(1
2
)x
Analyze the Graph of a Real-World Situation
Graphs are used to represent data in all areas of life. You can find graphs in newspapers, political campaigns, sciencejournals and business presentations.
Here is an example of a graph you might see reported in the news. Most mainstream scientists believe that increasedemissions of greenhouse cases, particularly carbon dioxide, are contributing to the warming of the planet. This graphshows how carbon dioxide levels have increased as the world has industrialized.
1.6. FUNCTIONS AS GRAPHS
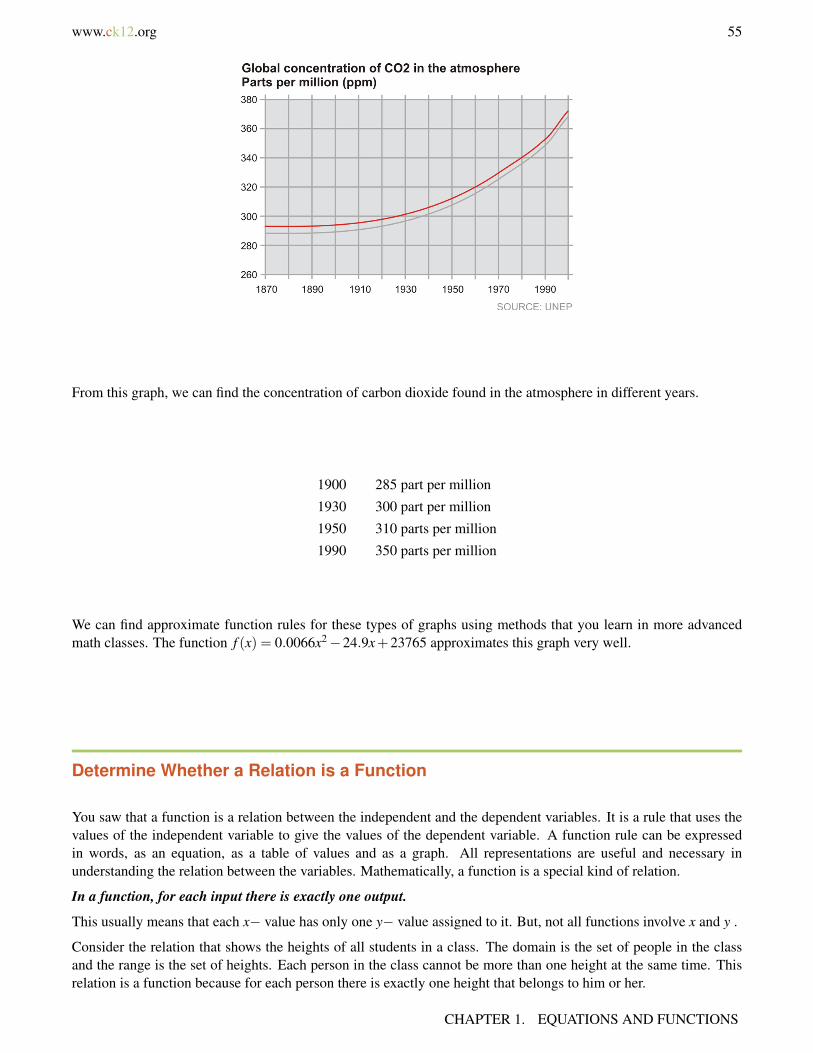
www.ck12.org 55
From this graph, we can find the concentration of carbon dioxide found in the atmosphere in different years.
1900 285 part per million
1930 300 part per million
1950 310 parts per million
1990 350 parts per million
We can find approximate function rules for these types of graphs using methods that you learn in more advancedmath classes. The function f (x) = 0.0066x2−24.9x+23765 approximates this graph very well.
Determine Whether a Relation is a Function
You saw that a function is a relation between the independent and the dependent variables. It is a rule that uses thevalues of the independent variable to give the values of the dependent variable. A function rule can be expressedin words, as an equation, as a table of values and as a graph. All representations are useful and necessary inunderstanding the relation between the variables. Mathematically, a function is a special kind of relation.
In a function, for each input there is exactly one output.
This usually means that each x− value has only one y− value assigned to it. But, not all functions involve x and y .
Consider the relation that shows the heights of all students in a class. The domain is the set of people in the classand the range is the set of heights. Each person in the class cannot be more than one height at the same time. Thisrelation is a function because for each person there is exactly one height that belongs to him or her.
CHAPTER 1. EQUATIONS AND FUNCTIONS
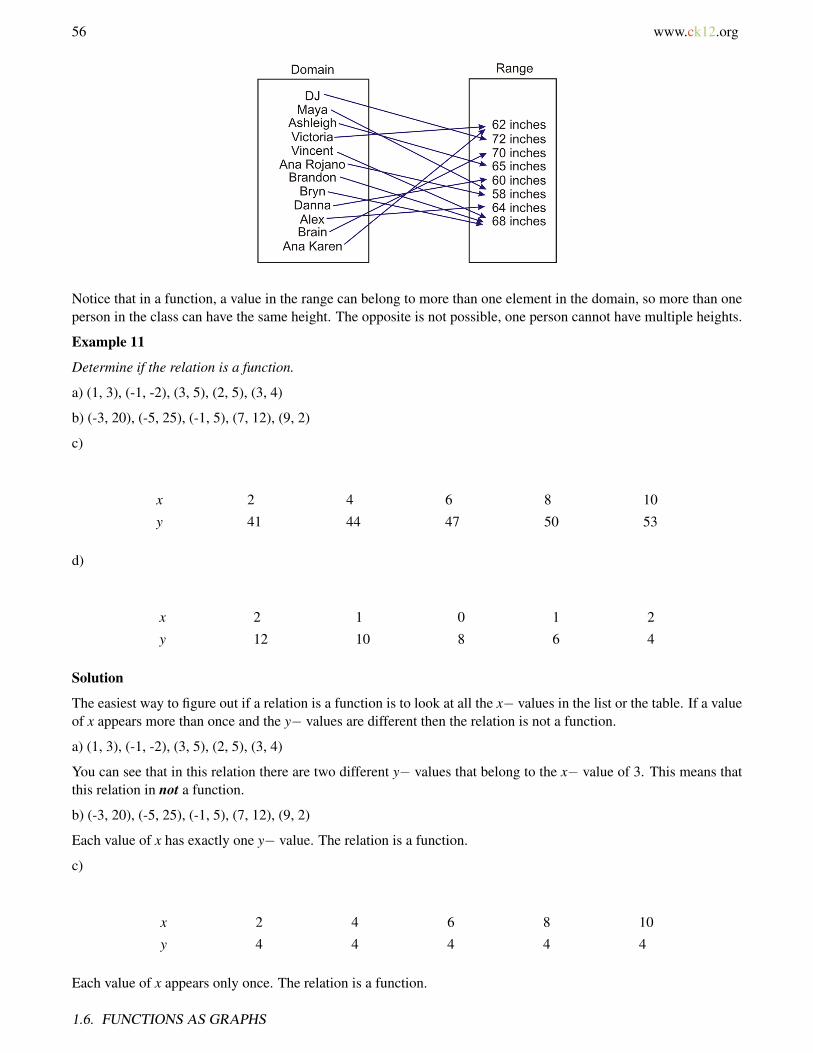
56 www.ck12.org
Notice that in a function, a value in the range can belong to more than one element in the domain, so more than oneperson in the class can have the same height. The opposite is not possible, one person cannot have multiple heights.
Example 11
Determine if the relation is a function.
a) (1, 3), (-1, -2), (3, 5), (2, 5), (3, 4)
b) (-3, 20), (-5, 25), (-1, 5), (7, 12), (9, 2)
c)
x 2 4 6 8 10
y 41 44 47 50 53
d)
x 2 1 0 1 2
y 12 10 8 6 4
Solution
The easiest way to figure out if a relation is a function is to look at all the x− values in the list or the table. If a valueof x appears more than once and the y− values are different then the relation is not a function.
a) (1, 3), (-1, -2), (3, 5), (2, 5), (3, 4)
You can see that in this relation there are two different y− values that belong to the x− value of 3. This means thatthis relation in not a function.
b) (-3, 20), (-5, 25), (-1, 5), (7, 12), (9, 2)
Each value of x has exactly one y− value. The relation is a function.
c)
x 2 4 6 8 10
y 4 4 4 4 4
Each value of x appears only once. The relation is a function.
1.6. FUNCTIONS AS GRAPHS
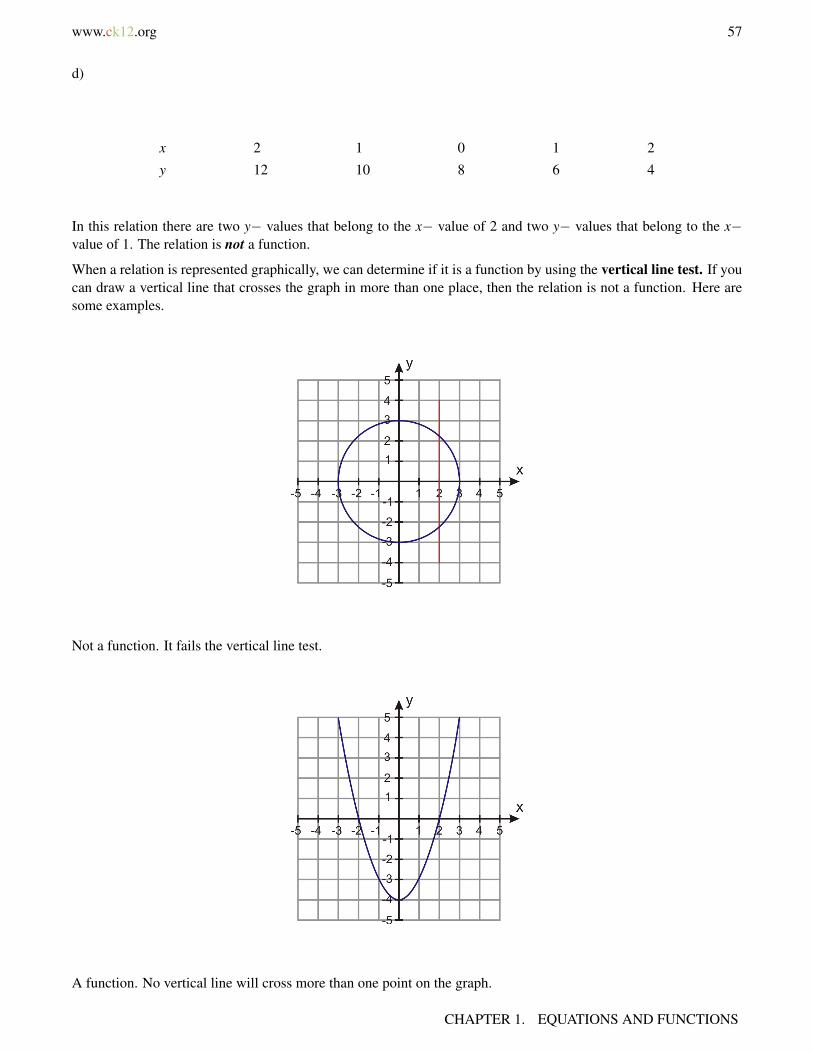
www.ck12.org 57
d)
x 2 1 0 1 2
y 12 10 8 6 4
In this relation there are two y− values that belong to the x− value of 2 and two y− values that belong to the x−value of 1. The relation is not a function.
When a relation is represented graphically, we can determine if it is a function by using the vertical line test. If youcan draw a vertical line that crosses the graph in more than one place, then the relation is not a function. Here aresome examples.
Not a function. It fails the vertical line test.
A function. No vertical line will cross more than one point on the graph.
CHAPTER 1. EQUATIONS AND FUNCTIONS

58 www.ck12.org
A function. No vertical line will cross more than one point on the graph.
Not a function. It fails the vertical line test.
Review Questions
1. Plot the coordinate points on the Cartesian plane.
a. (4, -4)b. (2, 7)c. (-3, -5)d. (6, 3)e. (-4, 3)
2. Give the coordinates for each point in the Cartesian plane.
1.6. FUNCTIONS AS GRAPHS
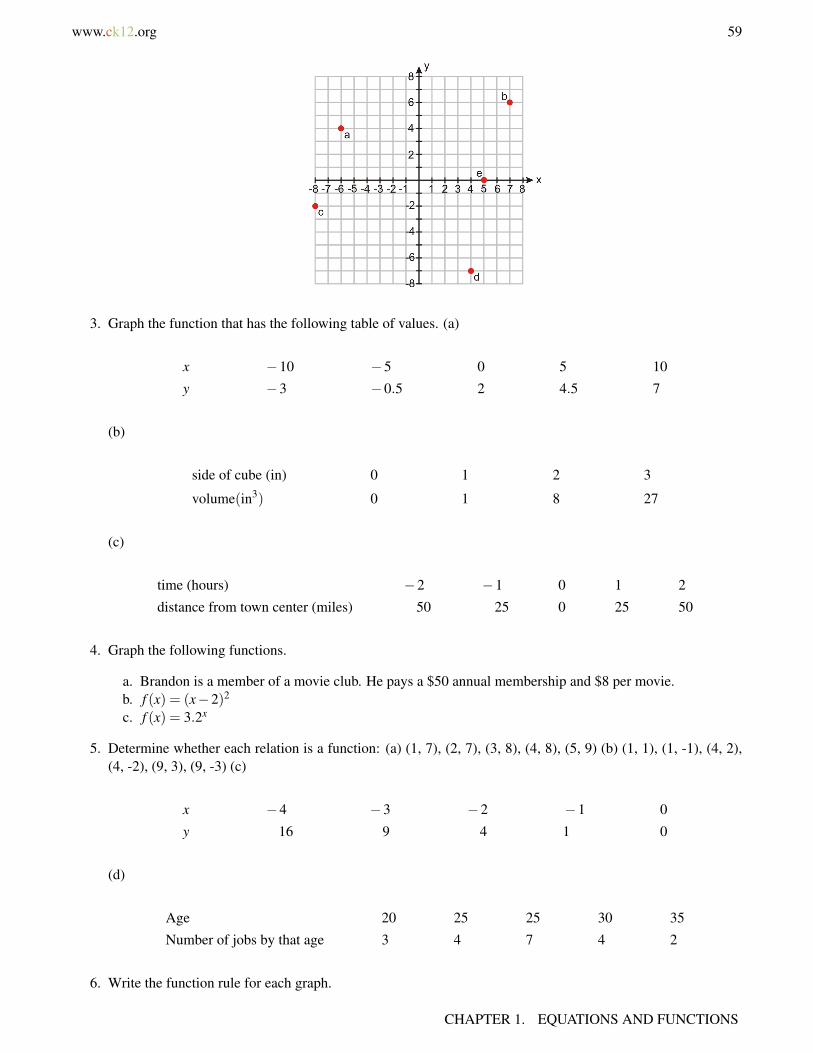
www.ck12.org 59
3. Graph the function that has the following table of values. (a)
x −10 −5 0 5 10
y −3 −0.5 2 4.5 7
(b)
side of cube (in) 0 1 2 3
volume(in3) 0 1 8 27
(c)
time (hours) −2 −1 0 1 2
distance from town center (miles) 50 25 0 25 50
4. Graph the following functions.
a. Brandon is a member of a movie club. He pays a $50 annual membership and $8 per movie.b. f (x) = (x−2)2
c. f (x) = 3.2x
5. Determine whether each relation is a function: (a) (1, 7), (2, 7), (3, 8), (4, 8), (5, 9) (b) (1, 1), (1, -1), (4, 2),(4, -2), (9, 3), (9, -3) (c)
x −4 −3 −2 −1 0
y 16 9 4 1 0
(d)
Age 20 25 25 30 35
Number of jobs by that age 3 4 7 4 2
6. Write the function rule for each graph.
CHAPTER 1. EQUATIONS AND FUNCTIONS
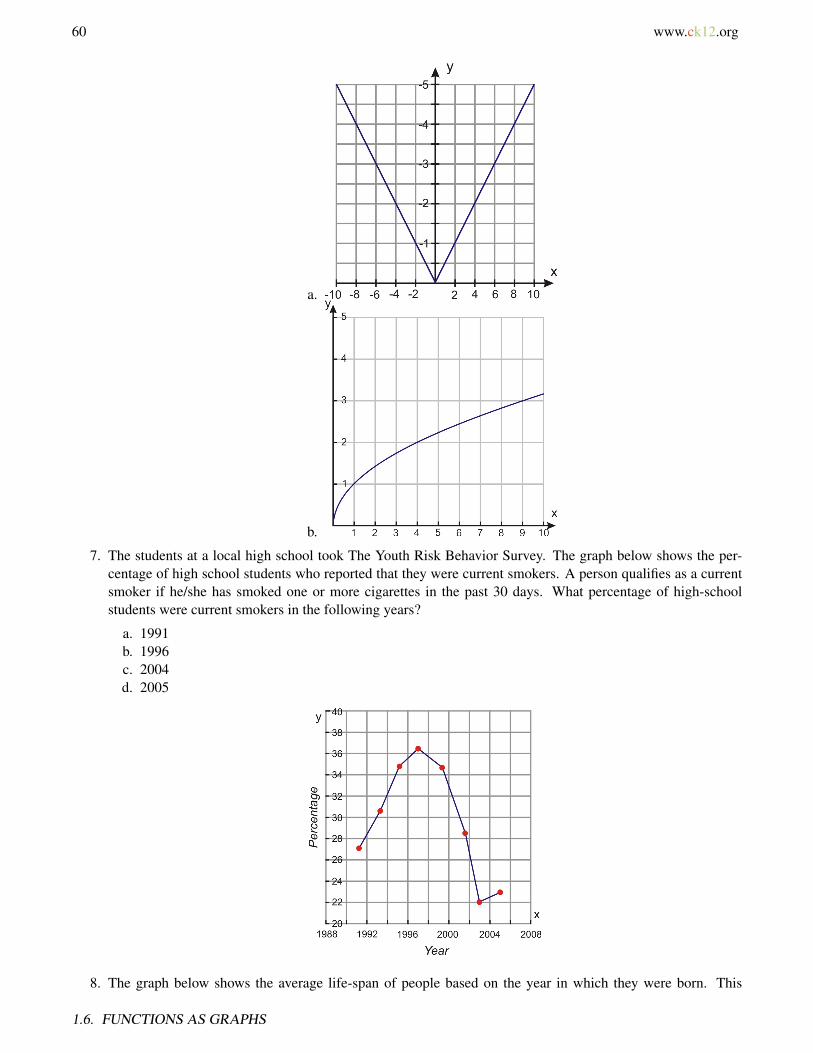
60 www.ck12.org
a.
b.
7. The students at a local high school took The Youth Risk Behavior Survey. The graph below shows the per-centage of high school students who reported that they were current smokers. A person qualifies as a currentsmoker if he/she has smoked one or more cigarettes in the past 30 days. What percentage of high-schoolstudents were current smokers in the following years?
a. 1991b. 1996c. 2004d. 2005
8. The graph below shows the average life-span of people based on the year in which they were born. This
1.6. FUNCTIONS AS GRAPHS

www.ck12.org 61
information comes from the National Vital Statistics Report from the Center for Disease Control. What is theaverage life-span of a person born in the following years?
a. 1940b. 1955c. 1980d. 1995
9. The graph below shows the median income of an individual based on his/her number of years of education.The top curve shows the median income for males and the bottom curve shows the median income for females.(Source: US Census, 2003.) What is the median income of a male that has the following years of education?
a. 10 years of educationb. 17 years of educationc. What is the median income of a female that has the same years of education?d. 10 years of educatione. 17 years of education
f.
10. Use the vertical line test to determine whether each relation is a function.
CHAPTER 1. EQUATIONS AND FUNCTIONS

62 www.ck12.org
a.
b.
Review Answers
1.
a. (-6, 4);b. (7, 6);c. (-8, -2);d. (4, -7);e. (5, 0)
1.6. FUNCTIONS AS GRAPHS
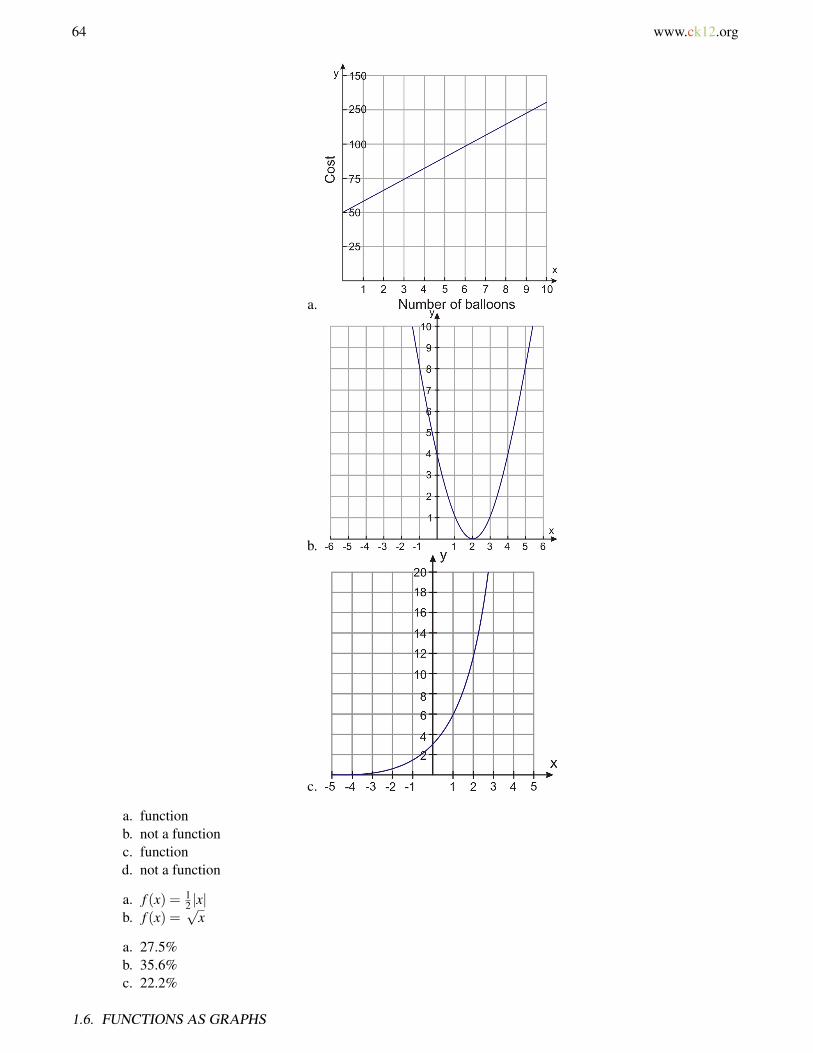
64 www.ck12.org
a.
b.
c.
a. functionb. not a functionc. functiond. not a function
a. f (x) = 12 |x|
b. f (x) =√
x
a. 27.5%b. 35.6%c. 22.2%
1.6. FUNCTIONS AS GRAPHS

www.ck12.org 65
d. 23%
a. 63 yearsb. 69 yearsc. 74 yearsd. 76 years
a. $19,500b. $56,000c. $10,000d. $35,000
a. functionb. not a function
CHAPTER 1. EQUATIONS AND FUNCTIONS
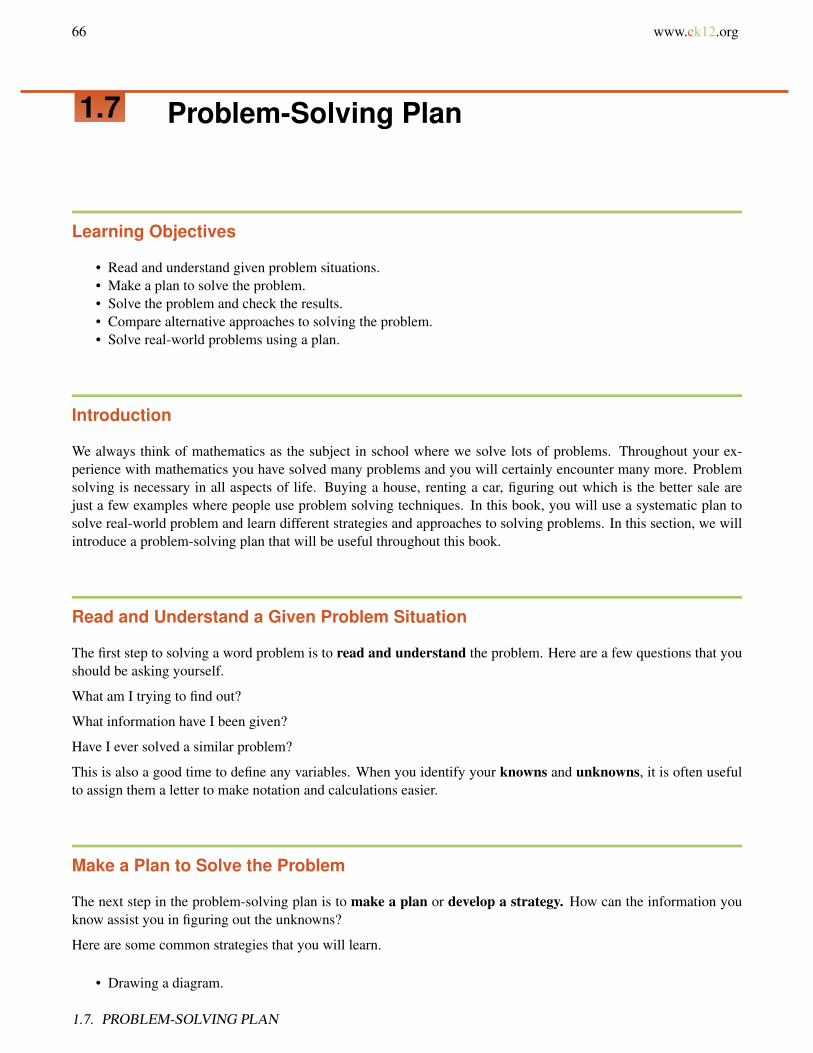
66 www.ck12.org
1.7 Problem-Solving Plan
Learning Objectives
• Read and understand given problem situations.• Make a plan to solve the problem.• Solve the problem and check the results.• Compare alternative approaches to solving the problem.• Solve real-world problems using a plan.
Introduction
We always think of mathematics as the subject in school where we solve lots of problems. Throughout your ex-perience with mathematics you have solved many problems and you will certainly encounter many more. Problemsolving is necessary in all aspects of life. Buying a house, renting a car, figuring out which is the better sale arejust a few examples where people use problem solving techniques. In this book, you will use a systematic plan tosolve real-world problem and learn different strategies and approaches to solving problems. In this section, we willintroduce a problem-solving plan that will be useful throughout this book.
Read and Understand a Given Problem Situation
The first step to solving a word problem is to read and understand the problem. Here are a few questions that youshould be asking yourself.
What am I trying to find out?
What information have I been given?
Have I ever solved a similar problem?
This is also a good time to define any variables. When you identify your knowns and unknowns, it is often usefulto assign them a letter to make notation and calculations easier.
Make a Plan to Solve the Problem
The next step in the problem-solving plan is to make a plan or develop a strategy. How can the information youknow assist you in figuring out the unknowns?
Here are some common strategies that you will learn.
• Drawing a diagram.
1.7. PROBLEM-SOLVING PLAN
www.ck12.org 67
• Making a table.• Looking for a pattern.• Using guess and check.• Working backwards.• Using a formula.• Reading and making graphs.• Writing equations.• Using linear models.• Using dimensional analysis.• Using the right type of function for the situation.
In most problems, you will use a combination of strategies. For example, drawing a diagram and looking forpatterns are good strategies for most problems. Also, making a table and drawing a graph are often used together.The “writing an equation” strategy is the one you will work with the most in your study of algebra.
Solve the Problem and Check the Results
Once you develop a plan, you can implement it and solve the problem. That means using tables, graph and carryingout all operations to arrive at the answer you are seeking.
The last step in solving any problem should always be to check and interpret the answer. Here are some questionsto help you to do that.
Does the answer make sense?
If you plug the solution back into the problem do all the numbers work out?
Can you use another method to arrive at the same answer?
Compare Alternative Approaches to Solving the Problem
Sometimes a certain problem is best solved by using a specific method. Most of the time, however, it can be solvedby using several different strategies. When you are familiar with all of the problem-solving strategies, it is up to youto choose the methods that you are most comfortable with and that make sense to you. In this book, we will oftenuse more than one method to solve a problem. This way we can demonstrate the strengths and weakness of differentstrategies when applied to different types of problems.
Regardless of the strategy you are using, you should always implement the problem-solving plan when you aresolving word problems. Here is a summary of the problem-solving plan.
Step 1
Understand the problem
Read the problem carefully. Once the problem is read, list all the components and data that are involved. This iswhere you will be assigning your variables.
Step 2
Devise a plan – Translate
Come up with a way to solve the problem. Set up an equation, draw a diagram, make a chart or construct a table asa start to solve your problem solving plan.
CHAPTER 1. EQUATIONS AND FUNCTIONS

68 www.ck12.org
Step 3
Carry out the plan – Solve
This is where you solve the equation you developed in Step 2.
Step 4
Look – Check and Interpret
Check to see if you used all your information. Then look to see if the answer makes sense.
Solve Real-World Problems Using a Plan
Let’s now apply this problem solving plan to a problem.
Example 1
A coffee maker is on sale at 50% off the regular ticket price. On the “Sunday Super Sale” the same coffee maker ison sale at an additional 40% off. If the final price is $21, what was the original price of the coffee maker?
Solution:
Step 1
Understand
We know: A coffee maker is discounted 50% and then 40%
The final price is $21.
We want: The original price of the coffee maker.
Step 2
Strategy
Let’s look at the given information and try to find the relationship between the information we know and the infor-mation we are trying to find.
50% off the original price means that the sale price is half of the original or 0.5 × original price
So, the first sale price = 0.5 × original price
A savings of 40% off the new price means you pay 60% of the new price 0.6 × new price = 0.6 × (0.5 × originalprice ) = 0.3 × original price
So, the price after the second sale = 0.3 × original price
We know that after two sales, the final price is $21
0.3 × original price = $21
Step 3
Solve
Since 0.3 × original price = $21
We can find the original price by dividing $21 by 0.3.
Original price = $21÷0.3 = $70
Answer The original price of the coffee maker was $70.
Step 4
1.7. PROBLEM-SOLVING PLAN
www.ck12.org 69
Check
We found that the original price of the coffee maker is $70.
To check that this is correct let’s apply the discounts.
50% of $70 = .5×$70 = $35 savings.
So, after the first sale you pay: original price – savings = $70−$35 = $35 .
40% of $35 = .4×$35 = $14 savings.
So, after the second sale you pay: $35−$14 = $21 .
The answer checks out.
Review Questions
1. A sweatshirt costs $35. Find the total cost if the sales tax is 7.75%.2. This year you got a 5% raise. If your new salary is $45,000, what was your salary before the raise?3. It costs $250 to carpet a room that is 14 f t×18 f t . How much does it cost to carpet a room that is 9 f t×10 f t
?4. A department store has a 15% discount for employees. Suppose an employee has a coupon worth $10 off any
item and she wants to buy a $65 purse. What is the final cost of the purse if the employee discount is appliedbefore the coupon is subtracted?
5. To host a dance at a hotel you must pay $250 plus $20 per guest. How much money would you have to payfor 25 guests?
6. It costs $12 to get into the San Diego County Fair and $1.50 per ride. If Rena spent $24 in total, how manyrides did she go on?
7. An ice cream shop sells a small cone for $2.95, a medium cone for $3.50 and a large cone for $4.25. LastSaturday, the shop sold 22 small cones, 26 medium cones and 15 large cones. How much money did the storeearn?
8. The sum of angles in a triangle is 180 degrees. If the second angle is twice the size of the first angle and thethird angle is three times the size of the first angle, what are the measures of the angles in the triangle?
Review Answers
1. $37.712. $428573. $89.294. $45.255. $7506. 8 rides7. $219.658. 30,60,90
CHAPTER 1. EQUATIONS AND FUNCTIONS

70 www.ck12.org
1.8 Problem-Solving Strategies: Make a Tableand Look for a Pattern
Learning Objectives
• Read and understand given problem situations.• Develop and use the strategy: make a table.• Develop and use the strategy: look for a pattern.• Plan and compare alternative approaches to solving the problem.• Solve real-world problems using selected strategies as part of a plan.
Introduction
In this section, we will apply the problem-solving plan you learned about in the last section to solve several real-world problems. You will learn how to develop and use the methods make a table and look for a pattern. Let’sreview our problem-solving plan.
Step 1
Understand the problem
Read the problem carefully. Once the problem is read, list all the components and data that are involved. This iswhere you will be assigning your variables.
Step 2
Devise a plan – Translate
Come up with a way to solve the problem. Set up an equation, draw a diagram, make a chart or construct a table asa start to solving your problem.
Step 3
Carry out the plan – Solve
This is where you solve the equation you developed in Step 2.
Step 4
Look – Check and Interpret
Check to see if you used all your information. Then look to see if the answer makes sense.
Read and Understand Given Problem Situations
The most difficult parts of problem-solving are most often the first two steps in our problem-solving plan. You needto read the problem and make sure you understand what you are being asked. If you do not understand the question,
1.8. PROBLEM-SOLVING STRATEGIES: MAKE A TABLE AND LOOK FOR A PATTERN
www.ck12.org 71
then you can not solve the problem. Once you understand the problem, you can devise a strategy that uses theinformation you have been given to arrive at a result.
Let’s apply the first two steps to the following problem.
Example 1:
Six friends are buying pizza together and they are planning to split the check equally. After the pizza was ordered,one of the friends had to leave suddenly, before the pizza arrived. Everyone left had to pay $1 extra as a result. Howmuch was the total bill?
Step 1
Understand
We want to find how much the pizza cost.
We know that five people had to pay an extra $1 each when one of the original six friends had to leave.
Step 2
Strategy
We can start by making a list of possible amounts for the total bill.
We divide the amount by six and then by five. The total divided by five should equal $1 more than the total dividedby six.
Look for any patterns in the numbers that might lead you to the correct answer.
In the rest of this section you will learn how to make a table or look for a pattern to figure out a solution for thistype of problem. After you finish reading the rest of the section, you can finish solving this problem for homework.
Develop and Use the Strategy: Make a Table
The method “Make a Table” is helpful when solving problems involving numerical relationships. When data isorganized in a table, it is easier to recognize patterns and relationships between numbers. Let’s apply this strategy tothe following example.
Example 2
Josie takes up jogging. On the first week she jogs for 10 minutes per day, on the second week she jogs for 12 minutesper day. Each week, she wants to increase her jogging time by 2 minutes per day. If she jogs six days per week eachweek, what will be her total jogging time on the sixth week?
Solution
Step 1
Understand
We know in the first week Josie jogs 10 minutes per day for six days.
We know in the second week Josie jogs 12 minutes per day for six days.
Each week, she increases her jogging time by 2 minutes per day and she jogs 6 days per week.
We want to find her total jogging time in week six.
Step 2
Strategy
A good strategy is to list the data we have been given in a table and use the information we have been given to find
CHAPTER 1. EQUATIONS AND FUNCTIONS

72 www.ck12.org
new information. We can make a table with the following headings.
TABLE 1.14:
Week Minutes per Day Minutes per Week
We are told that Josie jogs 10 minutes per day for six days in the first week and 12 minutes per day for six days inthe second week. We can enter this information in our table:
TABLE 1.15:
Week Minutes per Day Minutes per Week1 10 602 12 72
You are told that each week Josie increases her jogging time by 2 minutes per day and jogs 6 times per week. Wecan use this information to continue filling in the table until we get to week six.
TABLE 1.16:
Week Minutes per Day Minutes per Week1 10 602 12 723 14 844 16 965 18 1086 20 120
Step 3
Apply strategy/solve
To get the answer we read the entry for week six.
Answer In week six Josie jogs a total of 120 minutes.
Step 4
Check
Josie increases her jogging time by two minutes per day. She jogs six days per week.
This means that she increases her jogging time by 12 minutes per week.
Josie starts at 60 minutes per week and she increases by 12 minutes per week for five weeks.
That means the total jogging time = 60+12×5 = 120 minutes
The answer checks out.
You can see that by making a table we were able to organize and clarify the information we were given. It also helpedguide us in the next steps of the problem. This problem was solved solely by making a table. In many situations,this strategy would be used together with others to arrive at the solution.
1.8. PROBLEM-SOLVING STRATEGIES: MAKE A TABLE AND LOOK FOR A PATTERN
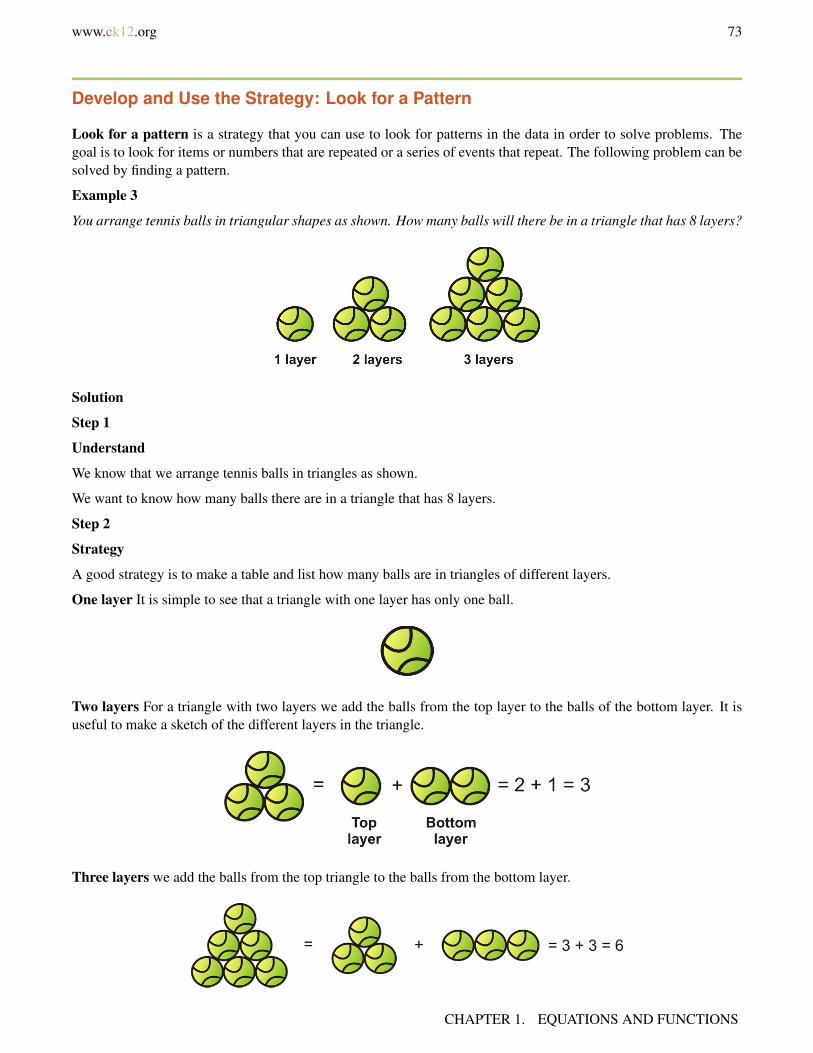
www.ck12.org 73
Develop and Use the Strategy: Look for a Pattern
Look for a pattern is a strategy that you can use to look for patterns in the data in order to solve problems. Thegoal is to look for items or numbers that are repeated or a series of events that repeat. The following problem can besolved by finding a pattern.
Example 3
You arrange tennis balls in triangular shapes as shown. How many balls will there be in a triangle that has 8 layers?
Solution
Step 1
Understand
We know that we arrange tennis balls in triangles as shown.
We want to know how many balls there are in a triangle that has 8 layers.
Step 2
Strategy
A good strategy is to make a table and list how many balls are in triangles of different layers.
One layer It is simple to see that a triangle with one layer has only one ball.
Two layers For a triangle with two layers we add the balls from the top layer to the balls of the bottom layer. It isuseful to make a sketch of the different layers in the triangle.
Three layers we add the balls from the top triangle to the balls from the bottom layer.
CHAPTER 1. EQUATIONS AND FUNCTIONS

74 www.ck12.org
We can fill the first three rows of the table.
TABLE 1.17:
Number of Layers Number of Balls1 12 33 6
We can see a pattern.
To create the next triangle, we add a new bottom row to the existing triangle.
The new bottom row has the same number of balls as there are layers.
- A triangle with 3 layers has 3 balls in the bottom layer.
To get the total balls for the new triangle, we add the number of balls in the old triangle to the number of rows in thenew bottom layer.
Step 3
Apply strategy/solve:
We can complete the table by following the pattern we discovered.
Number of balls = number of balls in previous triangle + number of layers in the new triangle
TABLE 1.18:
Number of Layers Number of Balls1 12 33 64 6+4 = 105 10+5 = 156 15+6 = 217 21+7 = 288 28+8 = 36
Answer There are 36 balls in a triangle arrangement with 8 layers.
Step 4
Check
Each layer of the triangle has one more ball than the previous one. In a triangle with 8 layers,
layer 1 has 1 ball, layer 2 has 2 balls, layer 3 has 3 balls, layer 4 has 4 balls, layer 5 has 5 balls, layer 6 has 6 balls,layer 7 has 7 balls, layer 8 has 8 balls.
When we add these we get: 1+2+3+4+5+6+7+8 = 36 balls
The answer checks out.
Notice that in this example we made tables and drew diagrams to help us organize our information and find a pattern.Using several methods together is a very common practice and is very useful in solving word problems.
1.8. PROBLEM-SOLVING STRATEGIES: MAKE A TABLE AND LOOK FOR A PATTERN

www.ck12.org 75
Plan and Compare Alternative Approaches to Solving Problems
In this section, we will compare the methods of “Making a Table” and “Looking for a Pattern” by using each methodin turn to solve a problem.
Example 4
Andrew cashes a $180 check and wants the money in $10 and $20 bills. The bank teller gives him 12 bills. Howmany of each kind of bill does he receive?
Solution
Method 1: Making a Table
Step 1
Understand
Andrew gives the bank teller a $180 check.
The bank teller gives Andrew 12 bills. These bills are mixed $10 bills and $20 bills.
We want to know how many of each kind of bill Andrew receives.
Step 2
Strategy
Let’s start by making a table of the different ways Andrew can have twelve $10 bills and $20 bills.
Andrew could have twelve $10 bills and zero $20 bills or eleven $10 bills and one $20 bills, so on.
We can calculate the total amount of money for each case.
Step 3
Apply strategy/solve
TABLE 1.19:
$10 bills $20 bills Total amount12 0 $10(12)+$20(0) = $12011 1 $10(11)+$20(1) = $13010 2 $10(10)+$20(2) = $1409 3 $10(9)+$20(3) = $1508 4 $10(8)+$20(4) = $1607 5 $10(7)+$20(5) = $1706 6 $10(6)+$20(6) = $1805 7 $10(5)+$20(7) = $1904 8 $10(4)+$20(8) = $2003 9 $10(3)+$20(9) = $2102 10 $10(2)+$20(10) = $2201 11 $10(1)+$20(11) = $2300 12 $10(0)+$20(12) = $240
In the table we listed all the possible ways you can get twelve $10 bills and $20 bills and the total amount of moneyfor each possibility. The correct amount is given when Andrew has six $10 bills and six $20 bills.
Answer: Andrew gets six $10 bills and six $20 bills.
Step 4
CHAPTER 1. EQUATIONS AND FUNCTIONS
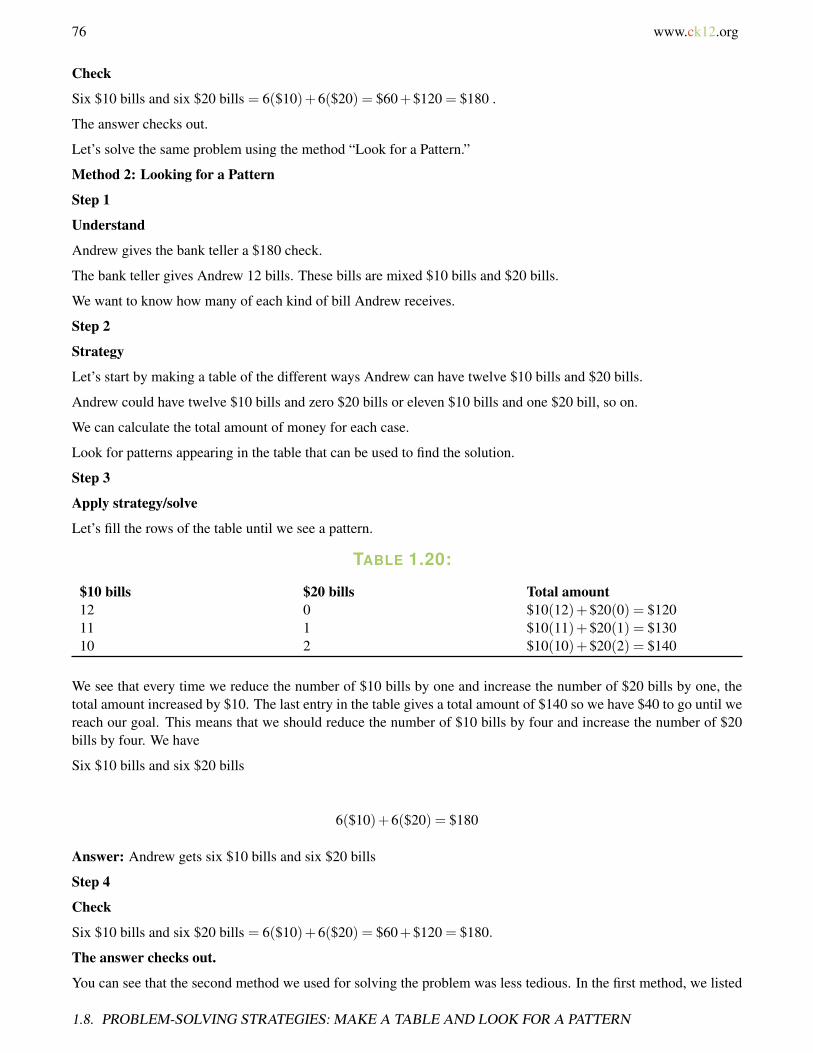
76 www.ck12.org
Check
Six $10 bills and six $20 bills = 6($10)+6($20) = $60+$120 = $180 .
The answer checks out.
Let’s solve the same problem using the method “Look for a Pattern.”
Method 2: Looking for a Pattern
Step 1
Understand
Andrew gives the bank teller a $180 check.
The bank teller gives Andrew 12 bills. These bills are mixed $10 bills and $20 bills.
We want to know how many of each kind of bill Andrew receives.
Step 2
Strategy
Let’s start by making a table of the different ways Andrew can have twelve $10 bills and $20 bills.
Andrew could have twelve $10 bills and zero $20 bills or eleven $10 bills and one $20 bill, so on.
We can calculate the total amount of money for each case.
Look for patterns appearing in the table that can be used to find the solution.
Step 3
Apply strategy/solve
Let’s fill the rows of the table until we see a pattern.
TABLE 1.20:
$10 bills $20 bills Total amount12 0 $10(12)+$20(0) = $12011 1 $10(11)+$20(1) = $13010 2 $10(10)+$20(2) = $140
We see that every time we reduce the number of $10 bills by one and increase the number of $20 bills by one, thetotal amount increased by $10. The last entry in the table gives a total amount of $140 so we have $40 to go until wereach our goal. This means that we should reduce the number of $10 bills by four and increase the number of $20bills by four. We have
Six $10 bills and six $20 bills
6($10)+6($20) = $180
Answer: Andrew gets six $10 bills and six $20 bills
Step 4
Check
Six $10 bills and six $20 bills = 6($10)+6($20) = $60+$120 = $180.
The answer checks out.
You can see that the second method we used for solving the problem was less tedious. In the first method, we listed
1.8. PROBLEM-SOLVING STRATEGIES: MAKE A TABLE AND LOOK FOR A PATTERN

www.ck12.org 77
all the possible options and found the answer we were seeking. In the second method, we started with listing theoptions but we looked for a pattern that helped us find the solution faster. The methods of “Making a Table” and“Look for a Pattern” are both more powerful if used alongside other problem-solving methods.
Solve Real-World Problems Using Selected Strategies as Part of a Plan
Example 5:
Anne is making a box without a lid. She starts with a 20 in× 20 in square piece of cardboard and cuts out fourequal squares from each corner of the cardboard as shown. She then folds the sides of the box and glues the edgestogether. How big does she need to cut the corner squares in order to make the box with the biggest volume?
Solution
Step 1
Understand
Anne makes a box out a 20 in× 20 in piece of cardboard.
She cuts out four equal squares from the corners of the cardboard.
She folds the sides and glues them to make a box.
How big should the cut out squares be to make the box with the biggest volume?
Step 2
Strategy
We need to remember the formula for the volume of a box.
Volume = Area of base × height
Volume = width × length × height
Make a table of values by picking different values for the side of the squares that we are cutting out and calculatethe volume.
Step 3
Apply strategy/solve
Let’s “make” a box by cutting out four corner squares with sides equal to 1 inch. The diagram will look like this:
CHAPTER 1. EQUATIONS AND FUNCTIONS
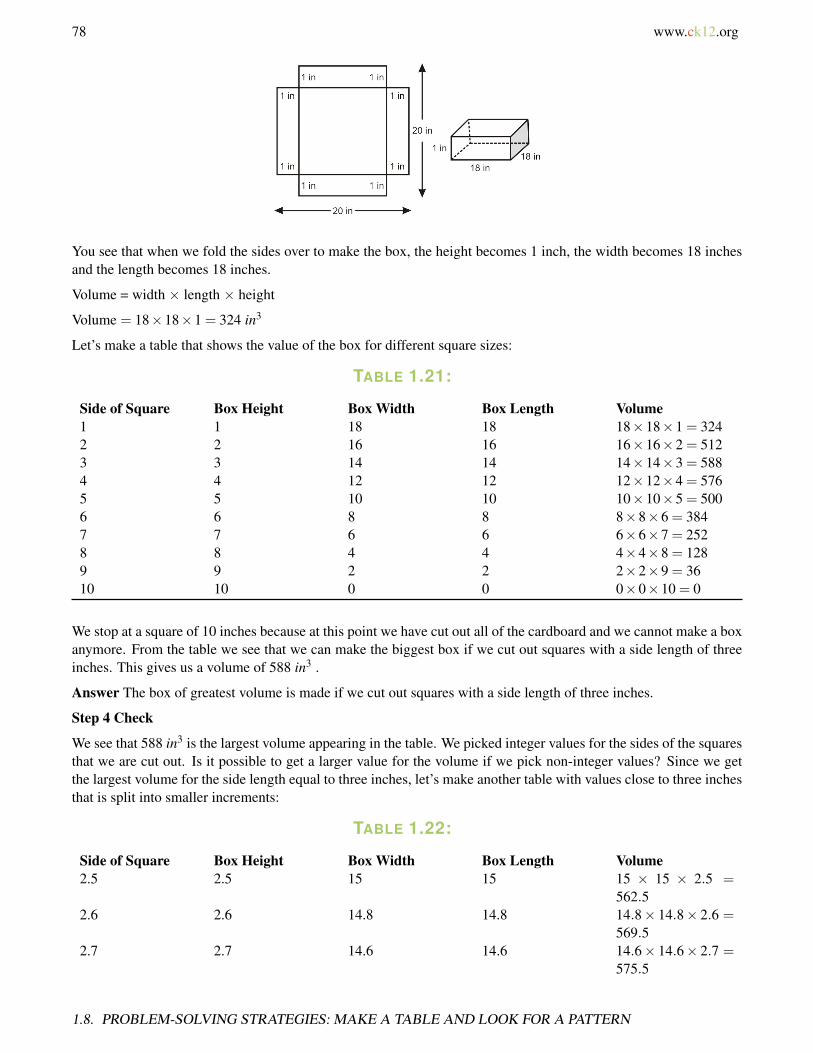
78 www.ck12.org
You see that when we fold the sides over to make the box, the height becomes 1 inch, the width becomes 18 inchesand the length becomes 18 inches.
Volume = width × length × height
Volume = 18×18×1 = 324 in3
Let’s make a table that shows the value of the box for different square sizes:
TABLE 1.21:
Side of Square Box Height Box Width Box Length Volume1 1 18 18 18×18×1 = 3242 2 16 16 16×16×2 = 5123 3 14 14 14×14×3 = 5884 4 12 12 12×12×4 = 5765 5 10 10 10×10×5 = 5006 6 8 8 8×8×6 = 3847 7 6 6 6×6×7 = 2528 8 4 4 4×4×8 = 1289 9 2 2 2×2×9 = 3610 10 0 0 0×0×10 = 0
We stop at a square of 10 inches because at this point we have cut out all of the cardboard and we cannot make a boxanymore. From the table we see that we can make the biggest box if we cut out squares with a side length of threeinches. This gives us a volume of 588 in3 .
Answer The box of greatest volume is made if we cut out squares with a side length of three inches.
Step 4 Check
We see that 588 in3 is the largest volume appearing in the table. We picked integer values for the sides of the squaresthat we are cut out. Is it possible to get a larger value for the volume if we pick non-integer values? Since we getthe largest volume for the side length equal to three inches, let’s make another table with values close to three inchesthat is split into smaller increments:
TABLE 1.22:
Side of Square Box Height Box Width Box Length Volume2.5 2.5 15 15 15 × 15 × 2.5 =
562.52.6 2.6 14.8 14.8 14.8× 14.8× 2.6 =
569.52.7 2.7 14.6 14.6 14.6× 14.6× 2.7 =
575.5
1.8. PROBLEM-SOLVING STRATEGIES: MAKE A TABLE AND LOOK FOR A PATTERN

www.ck12.org 79
TABLE 1.22: (continued)
Side of Square Box Height Box Width Box Length Volume2.8 2.8 14.4 14.4 14.4× 14.4× 2.8 =
580.62.9 2.9 14.2 14.2 14.2× 14.2× 2.9 =
584.83 3 14 14 14×14×3 = 5883.1 3.1 13.8 13.8 13.8× 13.8× 3.1 =
590.43.2 3.2 13.6 13.6 13.6× 13.6× 3.2 =
591.93.3 3.3 13.4 13.4 13.4× 13.4× 3.3 =
592.53.4 3.4 13.2 13.2 13.2× 13.2× 3.4 =
592.43.5 3.5 13 13 13 × 13 × 3.5 =
591.5
Notice that the largest volume is not when the side of the square is three inches, but rather when the side of thesquare is 3.3 inches.
Our original answer was not incorrect but it was obviously not as accurate as it could be. You can get an even moreaccurate answer if we take even smaller increments of the side length of the square. We can choose measurementsthat are smaller and larger than 3.3 inches.
The answer checks out if we want it rounded to zero decimal places but, A more accurate answer is 3.3 inches.
Review Questions
1. Go back and find the solution to the problem in Example 1.2. Britt has $2.25 in nickels and dimes. If she has 40 coins in total how many of each coin does she have?3. A pattern of squares is out together as shown. How many squares are in the 12th diagram?
4. Oswald is trying to cut down on drinking coffee. His goal is to cut down to 6 cups per week. If he starts 24cups the first week, cuts down to 21 cups the second week, and 18 cups the third week, how many weeks willit take him to reach his goal?
5. Taylor checked out a book from the library and it is now 5 days late. The late fee is 10 cents per day. Howmuch is the fine?
6. How many hours will a car traveling at 75 miles per hour take to catch up to a car traveling at 55 miles perhour if the slower car starts two hours before the faster car?
7. Grace starts biking at 12 miles per hour. One hour later, Dan starts biking at 15 miles per hour, following thesame route. How long would it take him to catch up with Grace?
8. Lemuel wants to enclose a rectangular plot of land with a fence. He has 24 feet of fencing. What is the largestpossible area that he could enclose with the fence?
CHAPTER 1. EQUATIONS AND FUNCTIONS

80 www.ck12.org
Review Answers
1. $302. 5 dimes and 35 nickels3. 23 squares4. 7 weeks5. 50 cents6. 5.5 hours7. 5 hours8. 3 f t in3
1.8. PROBLEM-SOLVING STRATEGIES: MAKE A TABLE AND LOOK FOR A PATTERN

www.ck12.org 81
1.9 Additional Resources
• For more on problem solving, see this George Pólya http://en.wikipedia.org/wiki/George_P%C3%B3lya http://en.wikipedia.org/wiki/George_P%C3%B3lya Wikipedia entry
Texas Instruments Resources
In the CK-12 Texas Instruments Algebra I FlexBook, there are graphing calculator activities designed to supple-ment the objectives for some of the lessons in this chapter. See http://www.ck12.org/flexr/chapter/9611.
CHAPTER 1. EQUATIONS AND FUNCTIONS

82 www.ck12.org
CHAPTER 2 Real NumbersCHAPTER OUTLINE
2.1 INTEGERS AND RATIONAL NUMBERS
2.2 ADDITION OF RATIONAL NUMBERS
2.3 SUBTRACTION OF RATIONAL NUMBERS
2.4 MULTIPLICATION OF RATIONAL NUMBERS
2.5 THE DISTRIBUTIVE PROPERTY
2.6 DIVISION OF RATIONAL NUMBERS
2.7 SQUARE ROOTS AND REAL NUMBERS
2.8 PROBLEM-SOLVING STRATEGIES: GUESS AND CHECK, WORK BACKWARD

www.ck12.org 83
2.1 Integers and Rational Numbers
Learning Objectives
• Graph and compare integers.• Classify and order rational numbers.• Find opposites of numbers.• Find absolute values.• Compare fractions to determine which is bigger.
Graph and Compare Integers
Integers are the counting numbers (1, 2, 3...), the negative opposites of the counting numbers (-1, -2, -3...), and zero.There are an infinite number of integers and examples are 0, 3, 76, -2, -11, and 995.
Example 1
Compare the numbers 2 and -5
First, we will plot the two numbers on a number line.
We can compare integers by noting which is the greatest and which is the least. The greatest number is farthest tothe right, and the least is farthest to the left.
In the diagram above, we can see that 2 is farther to the right on the number line than -5, so we say that 2 is greaterthan -5. We use the symbol “#62;” to mean “greater than”.
Solution 2 >−5
Example 2
A frog is sitting perfectly on top of number 7 on a number line. The frog jumps randomly to the left or right,but always jumps a distance of exactly 2. Describe the set of numbers that the frog may land on, and list all thepossibilities for the frog’s position after exactly 5 jumps.
Solution
We will graph the frog’s position, and also indicate what a jump of 2 looks like. We see that one possibility is thatthe frog lands on 5. Another possibility is that it lands on 9. It is clear that the frog will always land on an oddnumber.
CHAPTER 2. REAL NUMBERS
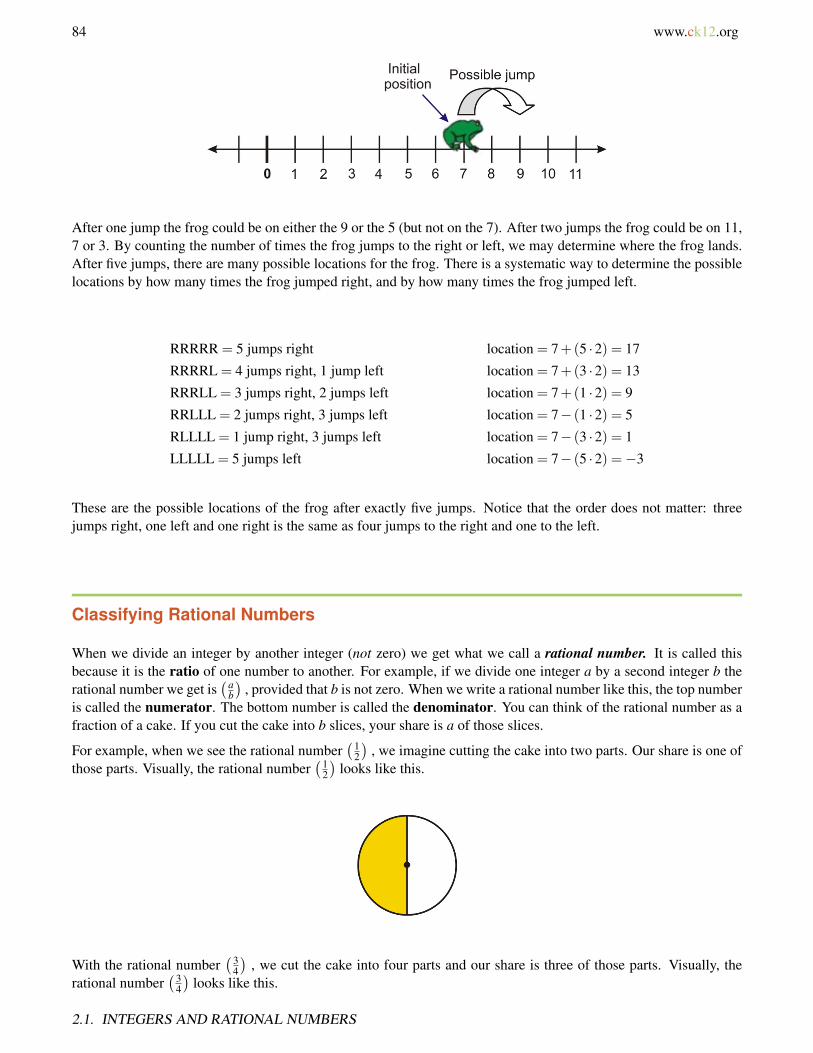
84 www.ck12.org
After one jump the frog could be on either the 9 or the 5 (but not on the 7). After two jumps the frog could be on 11,7 or 3. By counting the number of times the frog jumps to the right or left, we may determine where the frog lands.After five jumps, there are many possible locations for the frog. There is a systematic way to determine the possiblelocations by how many times the frog jumped right, and by how many times the frog jumped left.
RRRRR = 5 jumps right location = 7+(5 ·2) = 17
RRRRL = 4 jumps right, 1 jump left location = 7+(3 ·2) = 13
RRRLL = 3 jumps right, 2 jumps left location = 7+(1 ·2) = 9
RRLLL = 2 jumps right, 3 jumps left location = 7− (1 ·2) = 5
RLLLL = 1 jump right, 3 jumps left location = 7− (3 ·2) = 1
LLLLL = 5 jumps left location = 7− (5 ·2) =−3
These are the possible locations of the frog after exactly five jumps. Notice that the order does not matter: threejumps right, one left and one right is the same as four jumps to the right and one to the left.
Classifying Rational Numbers
When we divide an integer by another integer (not zero) we get what we call a rational number. It is called thisbecause it is the ratio of one number to another. For example, if we divide one integer a by a second integer b therational number we get is
(ab
), provided that b is not zero. When we write a rational number like this, the top number
is called the numerator. The bottom number is called the denominator. You can think of the rational number as afraction of a cake. If you cut the cake into b slices, your share is a of those slices.
For example, when we see the rational number(1
2
), we imagine cutting the cake into two parts. Our share is one of
those parts. Visually, the rational number(1
2
)looks like this.
With the rational number(3
4
), we cut the cake into four parts and our share is three of those parts. Visually, the
rational number(3
4
)looks like this.
2.1. INTEGERS AND RATIONAL NUMBERS
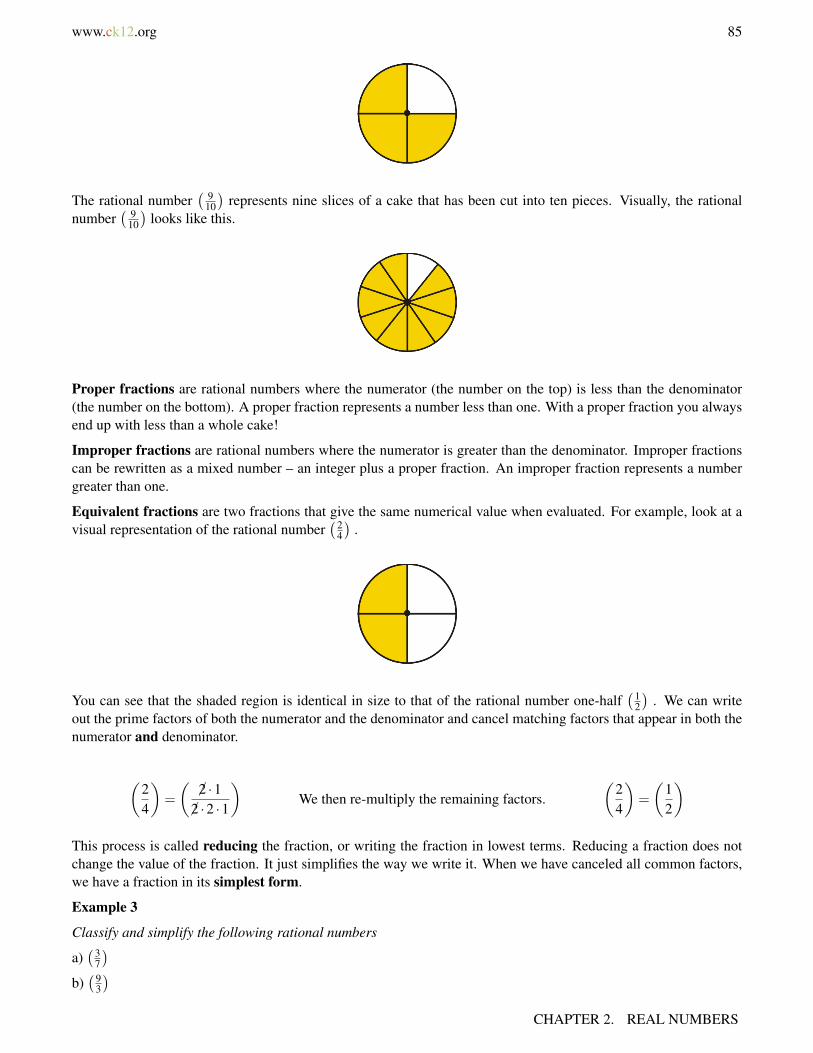
www.ck12.org 85
The rational number( 9
10
)represents nine slices of a cake that has been cut into ten pieces. Visually, the rational
number( 9
10
)looks like this.
Proper fractions are rational numbers where the numerator (the number on the top) is less than the denominator(the number on the bottom). A proper fraction represents a number less than one. With a proper fraction you alwaysend up with less than a whole cake!
Improper fractions are rational numbers where the numerator is greater than the denominator. Improper fractionscan be rewritten as a mixed number – an integer plus a proper fraction. An improper fraction represents a numbergreater than one.
Equivalent fractions are two fractions that give the same numerical value when evaluated. For example, look at avisual representation of the rational number
(24
).
You can see that the shaded region is identical in size to that of the rational number one-half(1
2
). We can write
out the prime factors of both the numerator and the denominator and cancel matching factors that appear in both thenumerator and denominator.
(24
)=
(2 ·12 ·2 ·1
)We then re-multiply the remaining factors.
(24
)=
(12
)This process is called reducing the fraction, or writing the fraction in lowest terms. Reducing a fraction does notchange the value of the fraction. It just simplifies the way we write it. When we have canceled all common factors,we have a fraction in its simplest form.
Example 3
Classify and simplify the following rational numbers
a)(3
7
)b)(9
3
)CHAPTER 2. REAL NUMBERS
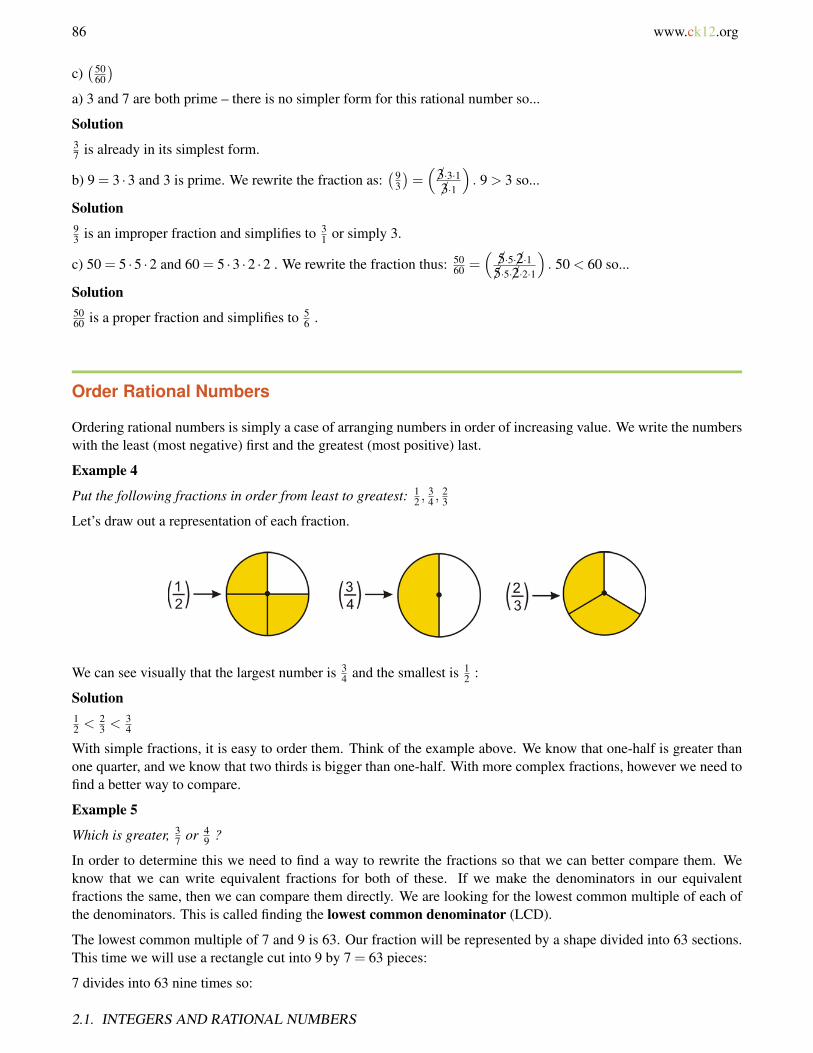
86 www.ck12.org
c)(50
60
)a) 3 and 7 are both prime – there is no simpler form for this rational number so...
Solution37 is already in its simplest form.
b) 9 = 3 ·3 and 3 is prime. We rewrite the fraction as:(9
3
)=(3·3·13·1
). 9 > 3 so...
Solution93 is an improper fraction and simplifies to 3
1 or simply 3.
c) 50 = 5 ·5 ·2 and 60 = 5 ·3 ·2 ·2 . We rewrite the fraction thus: 5060 =
(5·5·2·15·5·2·2·1
). 50 < 60 so...
Solution5060 is a proper fraction and simplifies to 5
6 .
Order Rational Numbers
Ordering rational numbers is simply a case of arranging numbers in order of increasing value. We write the numberswith the least (most negative) first and the greatest (most positive) last.
Example 4
Put the following fractions in order from least to greatest: 12 ,
34 ,
23
Let’s draw out a representation of each fraction.
We can see visually that the largest number is 34 and the smallest is 1
2 :
Solution12 < 2
3 < 34
With simple fractions, it is easy to order them. Think of the example above. We know that one-half is greater thanone quarter, and we know that two thirds is bigger than one-half. With more complex fractions, however we need tofind a better way to compare.
Example 5
Which is greater, 37 or 4
9 ?
In order to determine this we need to find a way to rewrite the fractions so that we can better compare them. Weknow that we can write equivalent fractions for both of these. If we make the denominators in our equivalentfractions the same, then we can compare them directly. We are looking for the lowest common multiple of each ofthe denominators. This is called finding the lowest common denominator (LCD).
The lowest common multiple of 7 and 9 is 63. Our fraction will be represented by a shape divided into 63 sections.This time we will use a rectangle cut into 9 by 7 = 63 pieces:
7 divides into 63 nine times so:
2.1. INTEGERS AND RATIONAL NUMBERS

www.ck12.org 87
(37
)=
99
(37
)=
(2763
)
Note that multiplying by 99 is the same as multiplying by 1. Therefore, 27
63 is an equivalent fraction to 37 . Here it is
shown visually.
9 divides into 63 seven times so:
(49
)=
77
(49
)=
(2863
)2863 is an equivalent fraction to 4
9 . Here it is shown visually.
By writing the fractions over a common denominator of 63, you can easily compare them. Here we take the 28shaded boxes out of 63 (from our image of 4
9 above) and arrange them in a way that makes it easy to compare withour representation of 3
7 . Notice there is one little square “left over”.
Solution
Since 2863 is greater than 27
63 , 49 is greater than 3
7 .
Remember
To compare rational numbers re-write them with a common denominator.
CHAPTER 2. REAL NUMBERS

88 www.ck12.org
Find the Opposites of Numbers
Every number has an opposite. On the number line, a number and its opposite are opposite each other. In otherwords, they are the same distance from zero, but they are on opposite sides of the number line.
By definition, the opposite of zero is zero.
Example 6
Find the value of each of the following.
a) 3+(−3)
b) 5+(−5)
c) (−11.5)+(11.5)
d) 37 +
−37
Each of the pairs of numbers in the above example are opposites. The opposite of 3 is (-3), the opposite of 5 is (-5),the opposite of (-11.5) is 11.5 and the opposite of 3
7 is 37 .
Solution
The value of each and every sum in this problem is 0.
Example 7
Find the opposite of each of the following:
a) 19.6
b) −49
c) x
d) xy2
e) (x−3)
Since we know that opposite numbers are on opposite sides of zero, we can simply multiply each expression by -1.This changes the sign of the number to its opposite.
a) Solution
The opposite of 19.6 is -19.6.
b) Solution
The opposite of is −49 is 4
9 .
c) Solution
The opposite of x is −x .
d) Solution
The opposite of xy2 is −xy2 .
2.1. INTEGERS AND RATIONAL NUMBERS

www.ck12.org 89
e) Solution
The opposite of (x−3) is −(x−3) = 3− x .
Note: With the last example you must multiply the entire expression by -1. A common mistake in this example isto assume that the opposite of (x−3) is (x+3) . DO NOT MAKE THIS MISTAKE!
Find absolute values
When we talk about absolute value, we are talking about distances on the number line. For example, the number7 is 7 units away from zero. The number -7 is also 7 units away from zero. The absolute value of a number is thedistance it is from zero, so the absolute value of 7 and the absolute value of -7 are both 7.
We write the absolute value of -7 like this |−7|
We read the expression |x| like this “the absolute value of x .”
• Treat absolute value expressions like parentheses. If there is an operation inside the absolute value symbolsevaluate that operation first.
• The absolute value of a number or an expression is always positive or zero. It cannot be negative. Withabsolute value, we are only interested in how far a number is from zero, and not the direction.
Example 8
Evaluate the following absolute value expressions.
a) |5+4|
b) 3−|4−9|
c) |−5−11|
d) −|7−22|
Remember to treat any expressions inside the absolute value sign as if they were inside parentheses, and evaluatethem first.
Solution
a)
|5+4|= |9|= 9
b)
3−|4−9|= 3−|−5|= 3−5
=−2
c)
|−5−11|= |−16|= 16
CHAPTER 2. REAL NUMBERS

90 www.ck12.org
d)
−|7−22|=−|−15|=−(15)
=−15
Lesson Summary
• Integers (or whole numbers) are the counting numbers (1, 2, 3...), the negative counting numbers (-1, -2,-3...), and zero.
• A rational number is the ratio of one integer to another, like ab or 3
5 . The top number is called the numeratorand the bottom number (which can not be zero) is called the denominator.
• Proper fractions are rational numbers where the numerator is less than the denominator.• Improper fractions are rational numbers where the numerator is greater than the denominator.• Equivalent fractions are two fractions that give the same numerical value when evaluated.• To reduce a fraction (write it in simplest form) write out all prime factors of the numerator and denominator,
cancel common factors, then recombine.• To compare two fractions it helps to write them with a common denominator: the same integer on the bottom
of each fraction.• The absolute value of a number is the distance it is from zero on the number line. The absolute value of a
number or expression will always be positive or zero.• Two numbers are opposites if they are the same distance from zero on the number line and on opposite sides
of zero. The opposite of an expression can be found by multiplying the entire expression by -1.
Review Questions
1. The tick-marks on the number line represent evenly spaced integers. Find the values of a,b,c,d and e .
2. Determine what fraction of the whole each shaded region represents.
a.
b.
2.1. INTEGERS AND RATIONAL NUMBERS
www.ck12.org 91
c.
3. Place the following sets of rational numbers in order, from least to greatest.
a. 12 ,
13 ,
14
b. 1112 ,
1211 ,
1310
c. 3960 ,
4980 ,
59100
d. 711 ,
813 ,
1219
4. Find the simplest form of the following rational numbers.
a. 2244
b. 927
c. 1218
d. 315420
5. Find the opposite of each of the following.
a. 1.001b. (5−11)c. (x+ y)d. (x− y)
6. Simplify the following absolute value expressions.
a. 11−|−4|b. |4−9|−|−5|c. |−5−11|d. 7−|22−15−19|e. −|−7|f. |−2−88|−|88+2|
Review Answers
1. a =−3;b = 3;c = 9;d = 12;e = 152. a = 1
3 ;b = 712 ;c = 22
35
a. 14 < 1
3 < 12
b. 1112 < 12
11 < 1310
c. 59100 < 49
80 < 3960
d. 813 < 12
19 < 711
a. 12
b. 13
c. 23
d. 34
a. -1.001b. 6− (x+ y)c. (y− x)
a. 7
CHAPTER 2. REAL NUMBERS

www.ck12.org 93
2.2 Addition of Rational Numbers
Learning Objectives
• Add using a number line.• Add rational numbers.• Identify and apply properties of addition.• Solve real-world problems using addition of fractions.
Add Using a Number Line
In Lesson one, we learned how to represent numbers on a number line. When we perform addition on a number line,we start at the position of the first number, and then move to the right by the number of units shown in the sum.
Example 1
Represent the sum 2+3 on a number line.
We start at the number 2, and then move 3 to the right. We end at the number 5.
Solution
2+3 = 5
Example 2
Represent the sum −2+3 on a number line.
We start at the number -2, and then move 3 to the right. We thus end at +1.
Solution
−2+3 = 1
Example 3
Represent the sum 2−3 on a number line.
CHAPTER 2. REAL NUMBERS
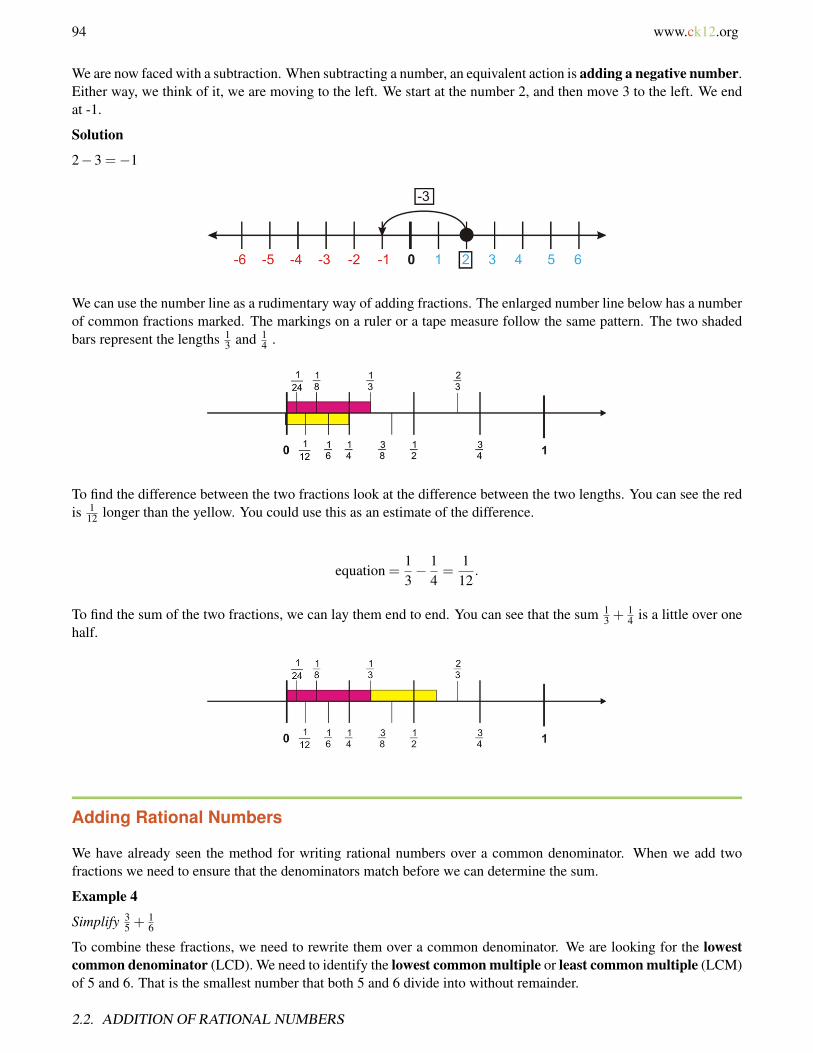
94 www.ck12.org
We are now faced with a subtraction. When subtracting a number, an equivalent action is adding a negative number.Either way, we think of it, we are moving to the left. We start at the number 2, and then move 3 to the left. We endat -1.
Solution
2−3 =−1
We can use the number line as a rudimentary way of adding fractions. The enlarged number line below has a numberof common fractions marked. The markings on a ruler or a tape measure follow the same pattern. The two shadedbars represent the lengths 1
3 and 14 .
To find the difference between the two fractions look at the difference between the two lengths. You can see the redis 1
12 longer than the yellow. You could use this as an estimate of the difference.
equation =13− 1
4=
112
.
To find the sum of the two fractions, we can lay them end to end. You can see that the sum 13 +
14 is a little over one
half.
Adding Rational Numbers
We have already seen the method for writing rational numbers over a common denominator. When we add twofractions we need to ensure that the denominators match before we can determine the sum.
Example 4
Simplify 35 +
16
To combine these fractions, we need to rewrite them over a common denominator. We are looking for the lowestcommon denominator (LCD). We need to identify the lowest common multiple or least common multiple (LCM)of 5 and 6. That is the smallest number that both 5 and 6 divide into without remainder.
2.2. ADDITION OF RATIONAL NUMBERS

www.ck12.org 95
• The lowest number that 5 and 6 both divide into without remainder is 30. The LCM of 5 and 6 is 30, so thelowest common denominator for our fractions is also 30.
We need to rewrite our fractions as new equivalent fractions so that the denominator in each case is 30.
If you think back to our idea of a cake cut into a number of slices, 35 means 3 slices of a cake that has been cut into
5 pieces. You can see that if we cut the same cake into 30 pieces (6 times as many) we would need 18 slices to havean equivalent share, since 18 = 3×6 .35 is equivalent to 18
30
By a similar argument, we can rewrite the fraction 16 as a share of a cake that has been cut into 30 pieces. If we cut
it into 5 times as many pieces we require 5 times as many slices.16 is equivalent to 5
30
Now that both fractions have the same common denominator, we can add the fractions. If we add our 18 smallerpieces of cake to the additional 5 pieces you see that we get a total of 23 pieces. 23 pieces of a cake that has beencut into 30 pieces means that our answer is.
Solution
35+
16=
1830
+5
30=
2330
You should see that when we have fractions with a common denominator, we add the numerators but we leave thedenominators alone. Here is this information in algebraic terms.
When adding fractions: ac +
bc = a+b
c
Example 5
Simplify 1411 +
19
The lowest common denominator in this case is 99. This is because the lowest common multiple of 9 and 11 is 99.So we write equivalent fractions for both 14
11 and 19 with denominators of 99.
CHAPTER 2. REAL NUMBERS
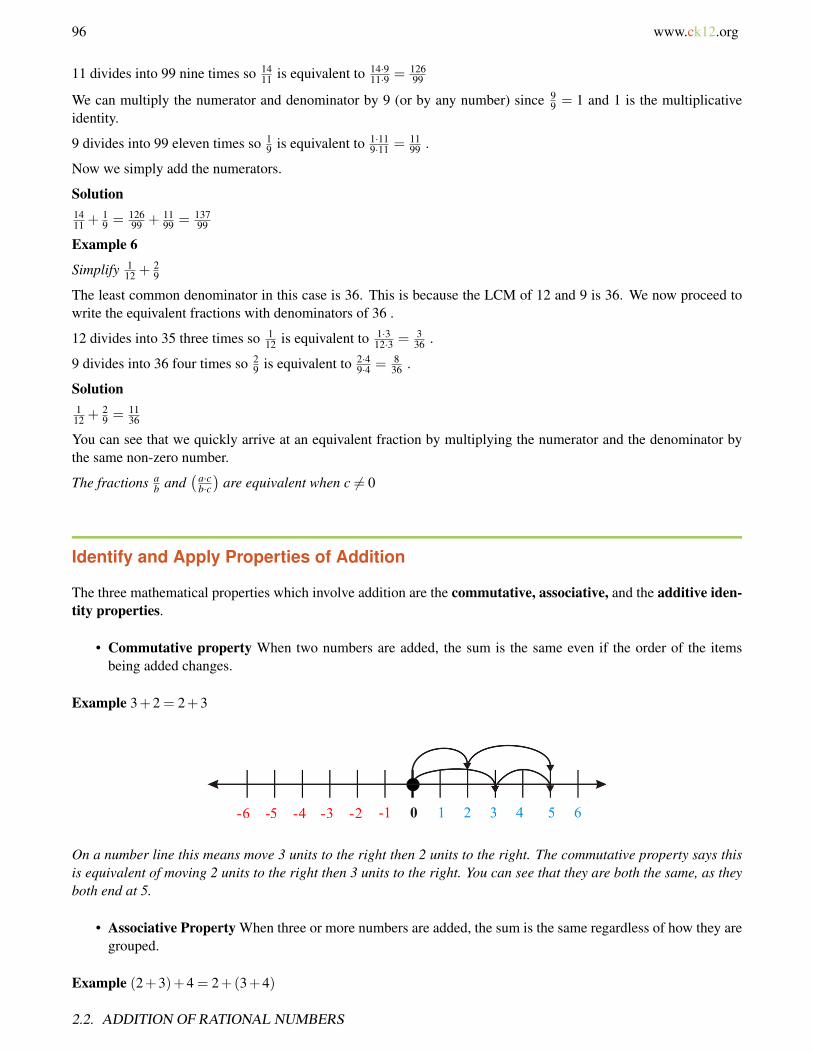
96 www.ck12.org
11 divides into 99 nine times so 1411 is equivalent to 14·9
11·9 = 12699
We can multiply the numerator and denominator by 9 (or by any number) since 99 = 1 and 1 is the multiplicative
identity.
9 divides into 99 eleven times so 19 is equivalent to 1·11
9·11 = 1199 .
Now we simply add the numerators.
Solution1411 +
19 = 126
99 + 1199 = 137
99
Example 6
Simplify 112 +
29
The least common denominator in this case is 36. This is because the LCM of 12 and 9 is 36. We now proceed towrite the equivalent fractions with denominators of 36 .
12 divides into 35 three times so 112 is equivalent to 1·3
12·3 = 336 .
9 divides into 36 four times so 29 is equivalent to 2·4
9·4 = 836 .
Solution112 +
29 = 11
36
You can see that we quickly arrive at an equivalent fraction by multiplying the numerator and the denominator bythe same non-zero number.
The fractions ab and
(a·cb·c)
are equivalent when c 6= 0
Identify and Apply Properties of Addition
The three mathematical properties which involve addition are the commutative, associative, and the additive iden-tity properties.
• Commutative property When two numbers are added, the sum is the same even if the order of the itemsbeing added changes.
Example 3+2 = 2+3
On a number line this means move 3 units to the right then 2 units to the right. The commutative property says thisis equivalent of moving 2 units to the right then 3 units to the right. You can see that they are both the same, as theyboth end at 5.
• Associative Property When three or more numbers are added, the sum is the same regardless of how they aregrouped.
Example (2+3)+4 = 2+(3+4)
2.2. ADDITION OF RATIONAL NUMBERS
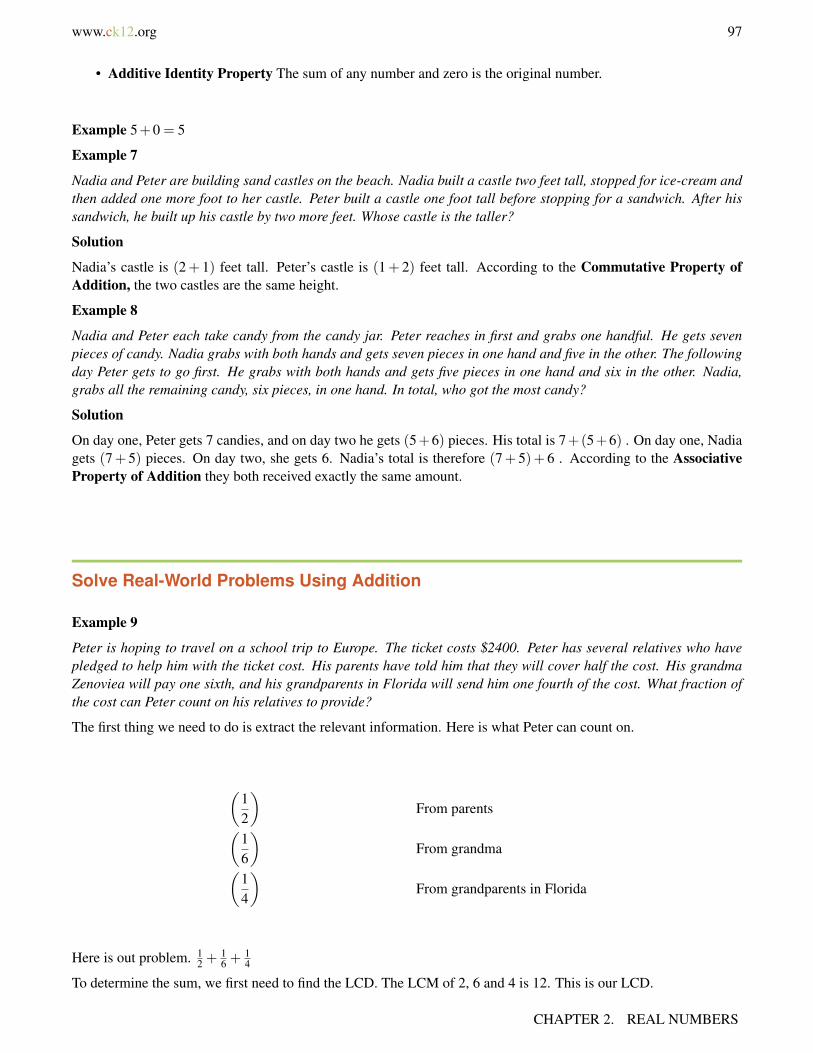
www.ck12.org 97
• Additive Identity Property The sum of any number and zero is the original number.
Example 5+0 = 5
Example 7
Nadia and Peter are building sand castles on the beach. Nadia built a castle two feet tall, stopped for ice-cream andthen added one more foot to her castle. Peter built a castle one foot tall before stopping for a sandwich. After hissandwich, he built up his castle by two more feet. Whose castle is the taller?
Solution
Nadia’s castle is (2+ 1) feet tall. Peter’s castle is (1+ 2) feet tall. According to the Commutative Property ofAddition, the two castles are the same height.
Example 8
Nadia and Peter each take candy from the candy jar. Peter reaches in first and grabs one handful. He gets sevenpieces of candy. Nadia grabs with both hands and gets seven pieces in one hand and five in the other. The followingday Peter gets to go first. He grabs with both hands and gets five pieces in one hand and six in the other. Nadia,grabs all the remaining candy, six pieces, in one hand. In total, who got the most candy?
Solution
On day one, Peter gets 7 candies, and on day two he gets (5+6) pieces. His total is 7+(5+6) . On day one, Nadiagets (7+ 5) pieces. On day two, she gets 6. Nadia’s total is therefore (7+ 5)+ 6 . According to the AssociativeProperty of Addition they both received exactly the same amount.
Solve Real-World Problems Using Addition
Example 9
Peter is hoping to travel on a school trip to Europe. The ticket costs $2400. Peter has several relatives who havepledged to help him with the ticket cost. His parents have told him that they will cover half the cost. His grandmaZenoviea will pay one sixth, and his grandparents in Florida will send him one fourth of the cost. What fraction ofthe cost can Peter count on his relatives to provide?
The first thing we need to do is extract the relevant information. Here is what Peter can count on.
(12
)From parents(
16
)From grandma(
14
)From grandparents in Florida
Here is out problem. 12 +
16 +
14
To determine the sum, we first need to find the LCD. The LCM of 2, 6 and 4 is 12. This is our LCD.
CHAPTER 2. REAL NUMBERS

98 www.ck12.org
2 divides into 12 six times :12=
6 ·16 ·2
=6
12
6 divides into 12 two times :16=
2 ·12 ·6
=2
12
4 divides into 12 six times :14=
3 ·13 ·4
=3
12
So an equivalent sum for our problem is6
12+
212
+312
=(6+2+3)
12=
1112
Solution
Peter can count on eleven-twelfths of the cost of the trip ($2,200 out of $2,400).
Lesson Summary
• To add fractions, rewrite them over the lowest common denominator (LCD). The lowest common denomi-nator is the lowest (or least) common multiple (LCM) of the two denominators.
• When adding fractions: ac +
bc = a+b
c• The fractions a
b and a·cb·c are equivalent when c 6= 0
• The additive properties are:• Commutative property the sum of two numbers is the same even if the order of the items to be added changes.
Ex: 2+3 = 3+2
• Associative Property When three or more numbers are added, the sum is the same regardless of how they aregrouped.
Ex: (2+3)+4 = 2+(3+4)
• Additive Identity Property The sum of any number and zero is the original number.
Review Questions
1. Write the sum that the following moves on a number line represent.
a.
b.
2. Add the following rational numbers and write the answer in its simplest form.
a. 37 +
27
2.2. ADDITION OF RATIONAL NUMBERS

www.ck12.org 99
b. 310 +
15
c. 516 +
512
d. 38 +
916
e. 825 +
710
f. 16 +
14
g. 715 +
29
h. 519 +
227
3. Which property of addition does each situation involve?
a. Whichever order your groceries are scanned at the store, the total will be the same.b. However many shovel-loads it takes to move 1 ton of gravel the number of rocks moved is the same.
4. Nadia, Peter and Ian are pooling their money to buy a gallon of ice cream. Nadia is the oldest and gets thegreatest allowance. She contributes half of the cost. Ian is next oldest and contributes one third of the cost.Peter, the youngest, gets the smallest allowance and contributes one fourth of the cost. They figure that thiswill be enough money. When they get to the check-out, they realize that they forgot about sales tax and worrythere will not be enough money. Amazingly, they have exactly the right amount of money. What fraction ofthe cost of the ice cream was added as tax?
Review Answers
1. a. 3+3+1−8 =−1b. 1−2+7+1 = 7
a. 57
b. 12
c. 3548
d. 1516
e. 5150
f. 512
g. 3145
h. 173513
a. Commutative and Associativeb. Associative
2. 112 is added as tax.
CHAPTER 2. REAL NUMBERS

100 www.ck12.org
2.3 Subtraction of Rational Numbers
Learning objectives
• Find additive inverses.• Subtract rational numbers.• Evaluate change using a variable expression.• Solve real world problems using fractions.
Find Additive Inverses
The additive inverse of a number is simply opposite of the number. (see section 2.1.4). Here are opposites on anumber line.
When we think of additive inverses we are really talking about the opposite process (or inverse process) of addition.In other words, the process of subtracting a number is the same as adding the additive inverse of that number. Whenwe add a number to its additive inverse, we get zero as an answer.
(6)+(−6) = 0 −6 is the additive inverse of 6.
(279)+(−279) = 0 −279 is the additive inverse of 279.
(x)+(−x) = 0 − x is the additive inverse of x.
Subtract Rational Numbers
The method for subtracting fractions (as you should have assumed) is just the same as addition. We can use the ideaof an additive inverse to relate the two processes. Just like in addition, we are going to need to write each of therational numbers over a common denominator.
Example 2
Simplify 13 −
19
The lowest common multiple of 9 and 3 is 9. Our common denominator will be nine. We will not alter the secondfraction because the denominator is already nine.
2.3. SUBTRACTION OF RATIONAL NUMBERS

www.ck12.org 101
3 divides into 9 three times 13 = 1·3
3·3 = 39 . In other words 3
9 is an equivalent fraction to 13 .
Our sum becomes 39 −
19
Remember that when we add fractions with a common denominator, we add the numerators and the denominatoris unchanged. A similar relationship holds for subtraction, only that we subtract the numerators.
When subtracting fractions ac −
bc = a−b
c
Solution13 −
19 = 2
9
Two-ninths is the simplest form for our answer. So far we have only dealt with examples where it is easy to findthe least common multiple of the denominators. With larger numbers, it is not so easy to be certain that we havethe least common denominator (LCD). We need a more systematic method. In the next example, we will use themethod of prime factors to find the least common denominator.
Example 3
Simplify 2990 −
13126
This time we need to find the lowest common multiple (LCM) of 90 and 126. To find the LCM, we first find theprime factors of 90 and 126. We do this by continually dividing the number by factors until we cannot divide anyfurther. You may have seen a factor tree before:
The factor tree for 90 looks like this:
90 = 9 ·10
9 = 3 ·310 = 5 ·290 = 3 ·3 ·5 ·2
The factor tree for 126 looks like this:
CHAPTER 2. REAL NUMBERS
102 www.ck12.org
126 = 9 ·14
9 = 3 ·314 = 7 ·2
126 = 3 ·3 ·7 ·2
The LCM for 90 and 126 is made from the smallest possible collection of primes that enables us to construct eitherof the two numbers. We take only enough of each prime to make the number with the highest number of factors ofthat prime in its factor tree.
TABLE 2.1:
Prime Factors in 90 Factors in 126 We Take2 1 1 13 2 2 25 1 0 17 0 1 1
So we need: one 2, two 3’s, one 5 and one 7. In other words: 2 ·3 ·3 ·5 ·7 = 630
• The lowest common multiple of 90 and 126 is 630. The LCD for our calculation is 630.
90 divides into 630 seven times (notice that 7 is the only factor in 630 that is missing from 90)
2990
=7 ·297 ·90
=203630
126 divides into 630 five times (notice that 5 is the only factor in 630 that is missing from 126)
13126
=5 ·135 ·126
=65630
Now we complete the problem.
2990− 13
126=
203630− 65
630=
(203−65)630
=138630
remember,
ac− b
c=
a−bc
This fraction simplifies. To be sure of finding the simplest form for 138630 we write out the numerator and denominator
as prime factors. We already know the prime factors of 630. The prime factors of 138 are
138 = 2 ·3 ·23138630
=2 · 3 ·232 · 3 ·3 ·5 ·7
one factor of 2 and one factor of 3 cancels
Solution2790 −
13126 = 23
105
Example 4
2.3. SUBTRACTION OF RATIONAL NUMBERS

www.ck12.org 103
A property management firm is acquiring parcels of land in order to build a small community of condominiums. Ithas bought three adjacent plots of land. The first is four-fifths of an acre, the second is five-twelfths of an acre, andthe third is nineteen-twentieths of an acre. The firm knows that it must allow one-sixth of an acre for utilities and asmall access road. How much of the remaining land is available for development?
The first thing we need to do is extract the relevant information. Here are the relevant fractions.
45,
512
and1920
The plots of land that the firm has acquired.
16
The amount of land that the firm has to give up.
This sum will determine the amount of land available for development.
45+
512
+1920− 1
6We need to find the LCM of 5,12,20 and 6.
5 = 5 one 5
12 = 2 ·2 ·3 two 2′s,one 3
20 = 2 ·2 ·5 two 2′s,one 5
6 = 2 ·3 one 3
The smallest set of primes that encompasses all of these is 2, 2, 3, 5. Our LCD is thus 2 ·2 ·3 ·5 = 60
Now we can convert all fractions to a common denominator of 60. To do this, we multiply by the factors of 60that are missing in the denominator we are converting. For example, 5 is missing two 2’s and a 3. This results in2 ·2 ·3 = 12 .
45=
12 ·412 ·5
=4860
512
=5 ·55 ·12
=2560
1920
=3 ·1910 ·6
=5760
16=
10 ·110 ·6
=1060
Our converted sum can be rewritten as: 4860 +
2560 +
5760 −
1060 = (48+25+57−10)
60 = 12060
Next, we need to reduce this fraction. We can see immediately that the numerator is twice the denominator. Thisfraction reduces to 2
1 or simply two. One is sometimes called the invisible denominator, as every whole number canbe thought of as a rational number whose denominator is one.
Solution
The property firm has two acres available for development.
Evaluate Change Using a Variable Expression
When we write algebraic expressions to represent a real quantity, the difference between two values is the changein that quantity.
CHAPTER 2. REAL NUMBERS
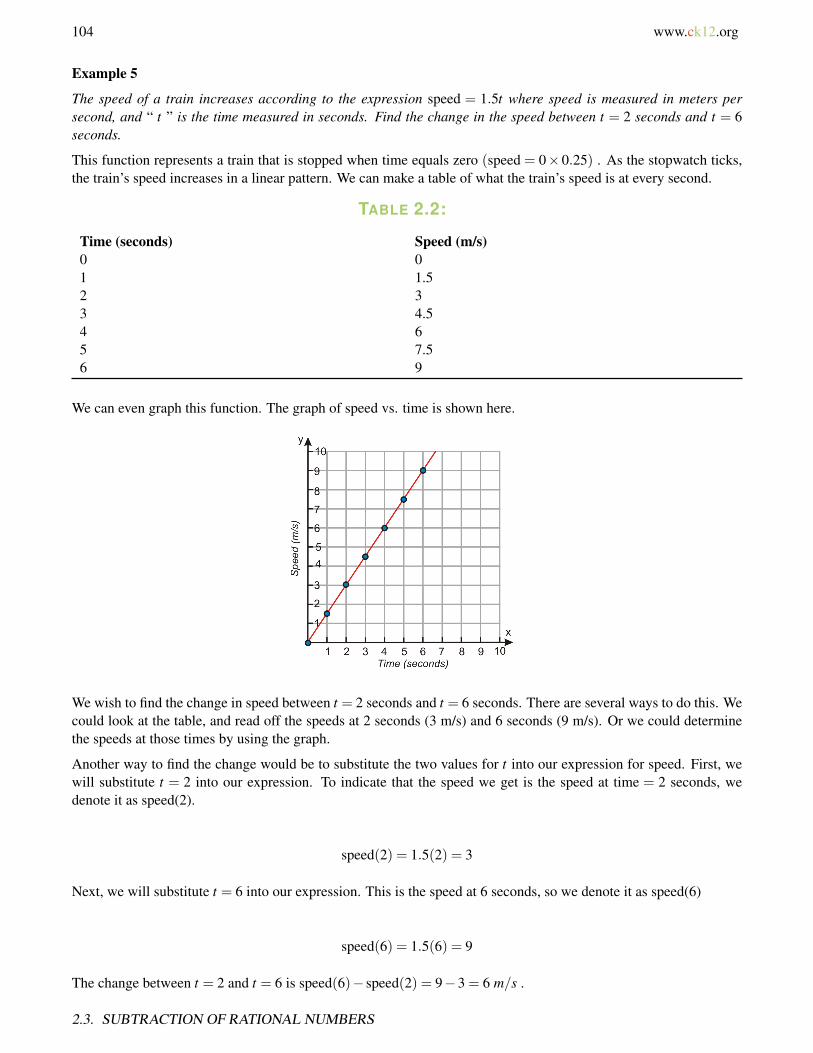
104 www.ck12.org
Example 5
The speed of a train increases according to the expression speed = 1.5t where speed is measured in meters persecond, and “ t ” is the time measured in seconds. Find the change in the speed between t = 2 seconds and t = 6seconds.
This function represents a train that is stopped when time equals zero (speed = 0×0.25) . As the stopwatch ticks,the train’s speed increases in a linear pattern. We can make a table of what the train’s speed is at every second.
TABLE 2.2:
Time (seconds) Speed (m/s)0 01 1.52 33 4.54 65 7.56 9
We can even graph this function. The graph of speed vs. time is shown here.
We wish to find the change in speed between t = 2 seconds and t = 6 seconds. There are several ways to do this. Wecould look at the table, and read off the speeds at 2 seconds (3 m/s) and 6 seconds (9 m/s). Or we could determinethe speeds at those times by using the graph.
Another way to find the change would be to substitute the two values for t into our expression for speed. First, wewill substitute t = 2 into our expression. To indicate that the speed we get is the speed at time = 2 seconds, wedenote it as speed(2).
speed(2) = 1.5(2) = 3
Next, we will substitute t = 6 into our expression. This is the speed at 6 seconds, so we denote it as speed(6)
speed(6) = 1.5(6) = 9
The change between t = 2 and t = 6 is speed(6)− speed(2) = 9−3 = 6 m/s .
2.3. SUBTRACTION OF RATIONAL NUMBERS
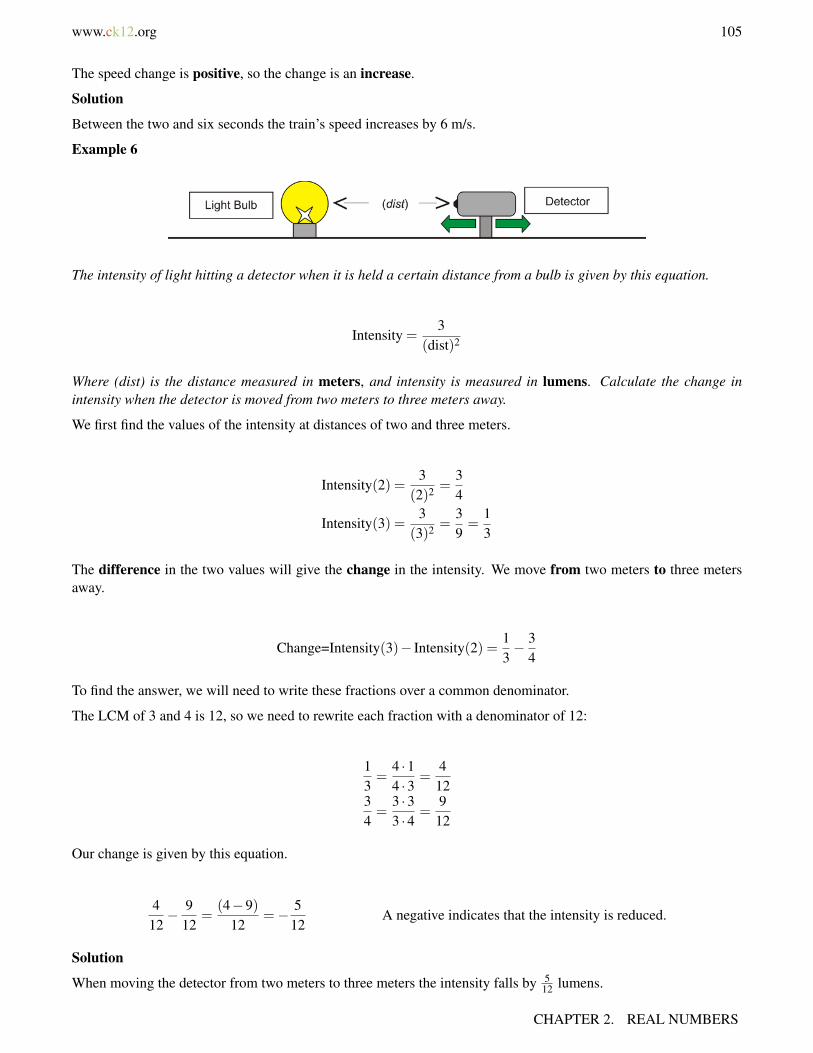
www.ck12.org 105
The speed change is positive, so the change is an increase.
Solution
Between the two and six seconds the train’s speed increases by 6 m/s.
Example 6
The intensity of light hitting a detector when it is held a certain distance from a bulb is given by this equation.
Intensity =3
(dist)2
Where (dist) is the distance measured in meters, and intensity is measured in lumens. Calculate the change inintensity when the detector is moved from two meters to three meters away.
We first find the values of the intensity at distances of two and three meters.
Intensity(2) =3
(2)2 =34
Intensity(3) =3
(3)2 =39=
13
The difference in the two values will give the change in the intensity. We move from two meters to three metersaway.
Change=Intensity(3)− Intensity(2) =13− 3
4
To find the answer, we will need to write these fractions over a common denominator.
The LCM of 3 and 4 is 12, so we need to rewrite each fraction with a denominator of 12:
13=
4 ·14 ·3
=412
34=
3 ·33 ·4
=912
Our change is given by this equation.
412− 9
12=
(4−9)12
=− 512
A negative indicates that the intensity is reduced.
Solution
When moving the detector from two meters to three meters the intensity falls by 512 lumens.
CHAPTER 2. REAL NUMBERS

106 www.ck12.org
Lesson Summary
• Subtracting a number is the same as adding the opposite (or additive inverse) of the number.• When subtracting fractions: a
c −bc = a−b
c• The number one is sometimes called the invisible denominator, as every whole number can be thought of as
a rational number whose denominator is one.• The difference between two values is the change in that quantity.
Review Questions
1. Subtract the following rational numbers. Be sure that your answer is in the simplest form.
a. 512 −
918
b. 23 −
14
c. 34 −
13
d. 1511 −
97
e. 213 −
111
f. 727 −
939
g. 611 −
322
h. 1364 −
740
i. 1170 −
1130
2. Consider the equation y = 3x+2 . Determine the change in y between x = 3 and x = 7 .3. Consider the equation y = 2
3 x+ 12 . Determine the change in y between x = 1 and x = 2 .
4. The time taken to commute from San Diego to Los Angeles is given by the equation time = 120speed where time
is measured in hours and speed is measured in miles per hour (mph). Calculate the change in time that arush hour commuter would see when switching from traveling by bus to train. The bus averages 40 mph to anew high speed train which averages 90 mph.
Review Answers
1. a. −112
b. 512
c. 512
d. 677
e. 9143
f. 10351
g. 922
h. 9320
i. −22105
2. Change =+123. Change =−1
34. The journey time would decrease by 1 2
3 hours.
2.3. SUBTRACTION OF RATIONAL NUMBERS
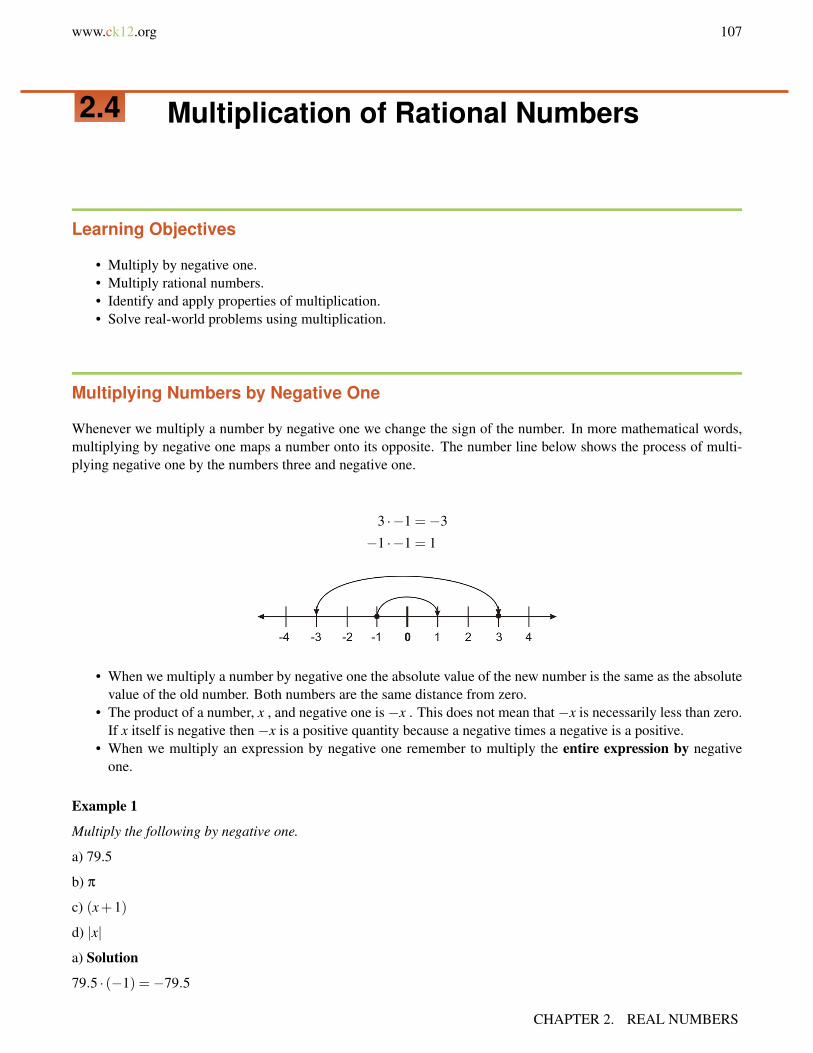
www.ck12.org 107
2.4 Multiplication of Rational Numbers
Learning Objectives
• Multiply by negative one.• Multiply rational numbers.• Identify and apply properties of multiplication.• Solve real-world problems using multiplication.
Multiplying Numbers by Negative One
Whenever we multiply a number by negative one we change the sign of the number. In more mathematical words,multiplying by negative one maps a number onto its opposite. The number line below shows the process of multi-plying negative one by the numbers three and negative one.
3 ·−1 =−3
−1 ·−1 = 1
• When we multiply a number by negative one the absolute value of the new number is the same as the absolutevalue of the old number. Both numbers are the same distance from zero.
• The product of a number, x , and negative one is−x . This does not mean that−x is necessarily less than zero.If x itself is negative then −x is a positive quantity because a negative times a negative is a positive.
• When we multiply an expression by negative one remember to multiply the entire expression by negativeone.
Example 1
Multiply the following by negative one.
a) 79.5
b) π
c) (x+1)
d) |x|
a) Solution
79.5 · (−1) =−79.5
CHAPTER 2. REAL NUMBERS

108 www.ck12.org
b) Solution
π · (−1) =−π
c) Solution
(x+1) · (−1) =−(x+1) =−x−1
d) Solution
|x|·(−1) =−|x|
Note that in the last case the negative sign does not distribute into the absolute value. Multiplying the argument ofan absolute value equation (the term between the absolute value symbol) does not change the absolute value. |x| isalways positive. |−x| is always positive. −|x| is always negative.
Whenever you are working with expressions, you can check your answers by substituting in numbers for the vari-ables. For example you could check part d of example one by letting x =−3 .
|−3|6=−|3| since |−3|= 3 and −|3|=−3 .
Multiply Rational Numbers
Example 2
Simplify 13 ·
25
One way to solve this is to think of money. For example, we know that one third of sixty dollars is written as 13 ·$60
. We can read the above problem as one-third of two-fifths. Here is a visual picture of the fractions one-third andtwo-fifths.
Notice that one-third of two-fifths looks like the one-third of the shaded region in the next figure.
Here is the intersection of the two shaded regions. The whole has been divided into five pieces width-wise and threepieces height-wise. We get two pieces out of a total of fifteen pieces.
Solution13 ·
25 = 2
15
Example 3
Simplify 37 ·
45
We will again go with a visual representation.
2.4. MULTIPLICATION OF RATIONAL NUMBERS

www.ck12.org 109
We see that the whole has been divided into a total of 7 ·5 pieces. We get 3 ·4 of those pieces.
Solution37 ·
45 = 12
35
When multiplying rational numbers, the numerators multiply together and the denominators multiply together.
When multiplying fractions ab ·
cd = ac
bd
Even though we have shown this result for the product of two fractions, this rule holds true when multiplying multiplefractions together.
Example 4
Multiply the following rational numbers
a) 12 ·
34
b) 25 ·
59
c) 13 ·
27 ·
25
d) 12 ·
23 ·
34 ·
45
a) Solution
12· 3
4=
1 ·32 ·4
=38
b) Solution With this problem, we can cancel the fives.
25· 5
9=
2 · 55 ·9
=29
c) Solution With this problem, multiply all the numerators and all the denominators.
13· 2
7· 2
5=
1 ·2 ·23 ·7 ·5
=4
105
d) Solution With this problem, we can cancel any factor that appears as both a numerator and a denominator sinceany number divided by itself is one, according to the Multiplicative Identity Property.
12× 23× 34× 4
5=
15
With multiplication of fractions, we can either simplify before we multiply or after. The next example uses factorsto help simplify before we multiply.
Example 5
Evaluate and simplify 1225 ·
3542
CHAPTER 2. REAL NUMBERS
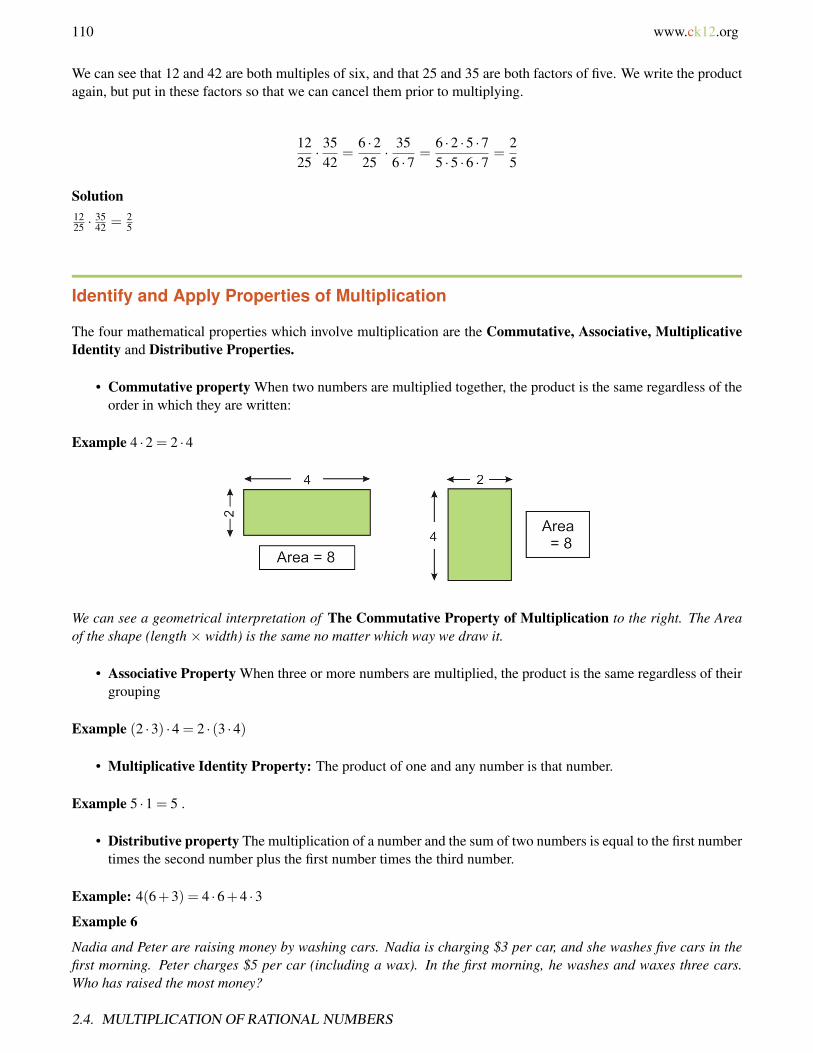
110 www.ck12.org
We can see that 12 and 42 are both multiples of six, and that 25 and 35 are both factors of five. We write the productagain, but put in these factors so that we can cancel them prior to multiplying.
1225· 35
42=
6 ·225· 35
6 ·7=
6 ·2 ·5 ·75 ·5 ·6 ·7
=25
Solution1225 ·
3542 = 2
5
Identify and Apply Properties of Multiplication
The four mathematical properties which involve multiplication are the Commutative, Associative, MultiplicativeIdentity and Distributive Properties.
• Commutative property When two numbers are multiplied together, the product is the same regardless of theorder in which they are written:
Example 4 ·2 = 2 ·4
We can see a geometrical interpretation of The Commutative Property of Multiplication to the right. The Areaof the shape (length × width) is the same no matter which way we draw it.
• Associative Property When three or more numbers are multiplied, the product is the same regardless of theirgrouping
Example (2 ·3) ·4 = 2 · (3 ·4)
• Multiplicative Identity Property: The product of one and any number is that number.
Example 5 ·1 = 5 .
• Distributive property The multiplication of a number and the sum of two numbers is equal to the first numbertimes the second number plus the first number times the third number.
Example: 4(6+3) = 4 ·6+4 ·3
Example 6
Nadia and Peter are raising money by washing cars. Nadia is charging $3 per car, and she washes five cars in thefirst morning. Peter charges $5 per car (including a wax). In the first morning, he washes and waxes three cars.Who has raised the most money?
2.4. MULTIPLICATION OF RATIONAL NUMBERS

www.ck12.org 111
Solution
Nadia raised 5 · $3 . Peter raised 3 · $5 . According to The Commutative Property of Multiplication, they bothraised the same amount of money.
Example 7
Andrew is counting his money. He puts all his money into $10 piles. He has one pile. How much money does Andrewhave?
Solution
The amount of money in each pile is $10. The number of piles is one. The total amount of money is $10 · 1 .According to The Multiplicative Identity Property, Andrew has a total of $10.
Example 8
A gardener is planting vegetables for the coming growing season. He wishes to plant potatoes and has a choice ofa single 8×7 meter plot, or two smaller plots of 3×7 meters and 5×7 meter. Which option gives him the largestarea for his potatoes?
Solution
In the first option, the gardener has a total area of (8×7) .
Since 8 = (3+5) we have (3+5) ·7 square meter, which equals (3 ·7)+(5 ·7) .
In the second option, the total area is (3 ·7)+(5 ·7) square meters.
According to The Distributive Property both options give the gardener the same area to plant potatoes
Solve Real-World Problems Using Multiplication
Example 9
In the chemistry lab there is a bottle with two liters of a 15% solution of hydrogen peroxide (H2O2) . John removesone-fifth of what is in the bottle, and puts it in a beaker. He measures the amount of H2O2 and adds twice thatamount of water to the beaker. Calculate the following measurements.
CHAPTER 2. REAL NUMBERS

112 www.ck12.org
a) The amount of H2O2 left in the bottle.
b) The amount of diluted H2O2 in the beaker.
c) The concentration of the H2O2 in the beaker.
a) To determine the amount of H2O2 left in the bottle, we first determine the amount that was removed. That amountwas 1
5 of the amount in the bottle (2 liters).
Amount removed =15·2 liters =
25
liter (or 0.4 liters)
Amount remaining = 2− 25=
105− 2
5=
85
liter (or 1.6 liters)
Solution
There is 1.6 liters left in the bottle.
b) We determined that the amount of the 15% H2O2 solution removed was 25 liter. The amount of water added was
twice this amount.
Amount of water = 2 · 25=
45
liter.
Total amount =45+
25=
65
liter (or 1.2 liters)
Solution
There are 1.2 liters of diluted H2O2 in the beaker.
c) The new concentration of H2O2 can be calculated.
Initially, with 25 of undiluted H2O2 there is 15% of 2
5 liters of pure H2O2 :
Amount of pure H2O2 = 0.15 · 25 = 0.15 ·0.4 = 0.06 liter of pure H2O2 .
After dilution, this H2O2 is dispersed into 1.2 liters of solution. The concentration = 0.061.2 = 0.05 .
To convert to a percent we multiply this number by 100.
Solution
The final of diluted H2O2 in the bottle is 5%.
Example 10
Anne has a bar of chocolate and she offers Bill a piece. Bill quickly breaks off 14 of the bar and eats it. Another
friend, Cindy, takes 13 of what was left. She splits the remaining candy bar into two equal pieces which she shares
with a third friend, Dora. How much of the candy bar does each person get?
First, let’s look at this problem visually.
2.4. MULTIPLICATION OF RATIONAL NUMBERS
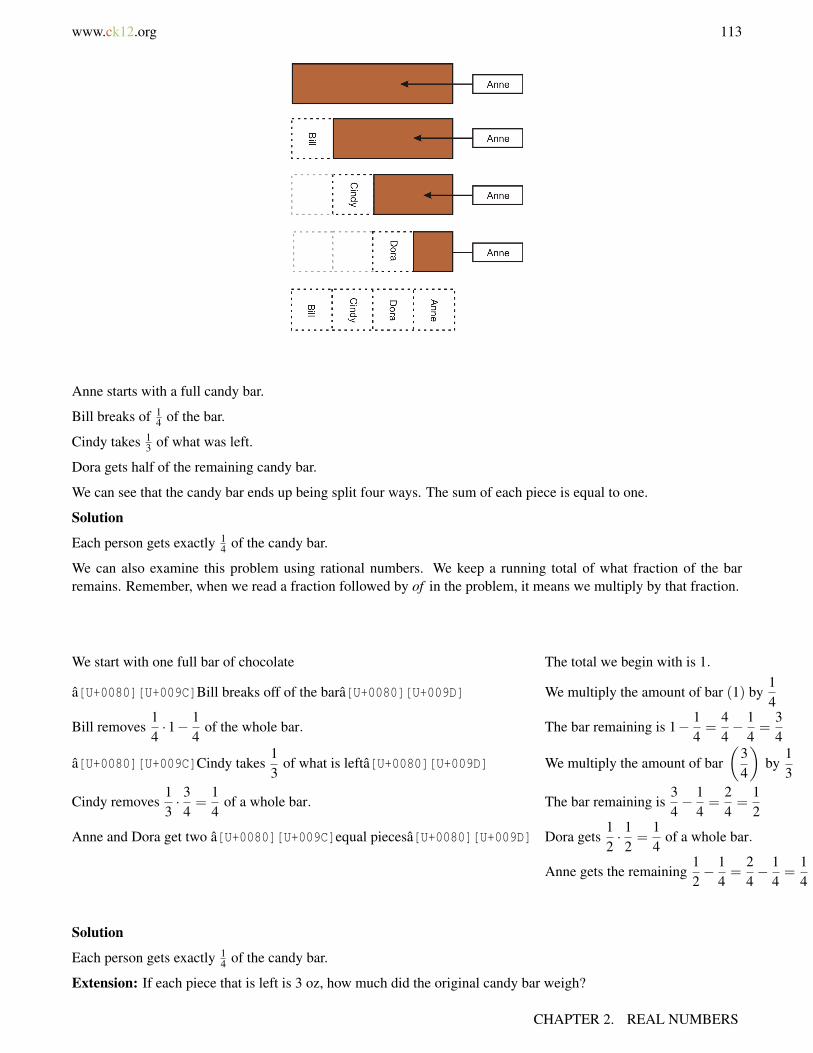
www.ck12.org 113
Anne starts with a full candy bar.
Bill breaks of 14 of the bar.
Cindy takes 13 of what was left.
Dora gets half of the remaining candy bar.
We can see that the candy bar ends up being split four ways. The sum of each piece is equal to one.
Solution
Each person gets exactly 14 of the candy bar.
We can also examine this problem using rational numbers. We keep a running total of what fraction of the barremains. Remember, when we read a fraction followed by of in the problem, it means we multiply by that fraction.
We start with one full bar of chocolate The total we begin with is 1.
â[U+0080][U+009C]Bill breaks off of the barâ[U+0080][U+009D] We multiply the amount of bar (1) by14
Bill removes14·1− 1
4of the whole bar. The bar remaining is 1− 1
4=
44− 1
4=
34
â[U+0080][U+009C]Cindy takes13
of what is leftâ[U+0080][U+009D] We multiply the amount of bar(
34
)by
13
Cindy removes13· 3
4=
14
of a whole bar. The bar remaining is34− 1
4=
24=
12
Anne and Dora get two â[U+0080][U+009C]equal piecesâ[U+0080][U+009D] Dora gets12· 1
2=
14
of a whole bar.
Anne gets the remaining12− 1
4=
24− 1
4=
14
Solution
Each person gets exactly 14 of the candy bar.
Extension: If each piece that is left is 3 oz, how much did the original candy bar weigh?
CHAPTER 2. REAL NUMBERS
114 www.ck12.org
Lesson Summary
• When multiplying an expression by negative one, remember to multiply the entire expression by negativeone.
• To multiply fractions ab ·
cd = ac
bd• The multiplicative properties are:• Commutative property the product of two numbers is the same whichever order the items to be multiplied
are written.
Ex: 2 ·3 = 3 ·2
• Associative Property: When three or more numbers are multiplied, the sum is the same regardless of howthey are grouped.
Ex: (2 ·3) ·4 = 2 · (3 ·4)
• Multiplicative Identity Property The product of any number and one is the original number.
Ex: 2 ·1 = 2
• Distributive property The multiplication of a number and the sum of two numbers is equal to the first numbertimes the second number plus the first number times the third number.
Ex: 4(2+3) = 4(2)+4(3)
Review Questions
1. Multiply the following by negative one.
a. 25b. −105c. x2
d. (3+ x)e. (3− x)
2. Multiply the following rational numbers, write your answer in the simplest form.
a. 512 ×
910
b. 23 ×
14
c. 34 ×
13
d. 1511 ×
97
e. 113 ×
111
f. 727 ×
914
g.(3
5
)2
h. 111 ×
2221 ×
710
i. 1215 ×
3513 ×
102 ×
2636
3. Three monkeys spend a day gathering coconuts together. When they have finished, they are very tired and fallasleep. The following morning, the first monkey wakes up. Not wishing to disturb his friends, he decides todivide the coconuts into three equal piles. There is one left over, so he throws this odd one away, helps himself
2.4. MULTIPLICATION OF RATIONAL NUMBERS
www.ck12.org 115
to his share, and goes home. A few minutes later, the second monkey awakes. Not realizing that the first hasalready gone, he too divides the coconuts into three equal heaps. He finds one left over, throws the odd oneaway, helps himself to his fair share, and goes home. In the morning, the third monkey wakes to find that he isalone. He spots the two discarded coconuts, and puts them with the pile, giving him a total of twelve coconuts.How many coconuts did the first and second monkey take? [Extension: solve by working backward]
Review Answers
1. a. −25b. 105c. −x2
d. −(x+3) or −x−3e. (x−3)
a. 38
b. 16
c. 14
d. 13577
e. 1143
f. 16
g. 27125
h. 115
i. 709
2. The first monkey takes eight coconuts. The second monkey takes five coconuts.
CHAPTER 2. REAL NUMBERS

116 www.ck12.org
2.5 The Distributive Property
Learning Objectives
• Apply the distributive property.• Identify parts of an expression.• Solve real-world problems using the distributive property.
Introduction
At the end of the school year, an elementary school teacher makes a little gift bag for each of his students. Each bagcontains one class photograph, two party favors and five pieces of candy. The teacher will distribute the bags amonghis 28 students. How many of each item does the teacher need?
Apply the Distributive Property
When we have a problem like the one posed in the introduction, The Distributive Property can help us solve it. Tobegin, we can write an expression for the contents of each bag.
Contents = (photo +2 favor +5 candy)
Contents = (p+2 f +5c) We may even use single letter variables to write an expression.
We know that the teacher has 28 students, therefore we can write the following expression for the number of itemsthat the teacher will need.
Items = 28 · (p+2 f +5c) 28 times the individual contents of each bag.
We generally omit any multiplication signs that are not strictly necessary.
Items = 28(p+2 f +5c)
The Distributive Property of Multiplication means that when faced with a term multiplying other terms insideparentheses, the outside term multiplies with each of the terms inside the parentheses.
2.5. THE DISTRIBUTIVE PROPERTY
www.ck12.org 117
So the teacher needs 28 class photos, 56 party favors and 140 pieces of candy.
The Distributive Property works when we have numbers inside the parentheses. You can see this by looking at asimple problem and considering the Order of Operations.
Example 1
Determine the value of 11(2+6) using both Order of Operations and the Distributive Property.
First, we consider the problem with the Order of Operations – PEMDAS dictates that we evaluate the amount insidethe parentheses first.
Solution
11(2+6) = 11(8) = 88
Next we will use the Distributive Property. We multiply the 11 by each term inside the parentheses.
Solution
11(2+6) = 11(2)+11(6) = 22+66 = 88
Example 2
Determine the value of 11(2−6) using both the Order of Operations and the Distributive Property.
First, we consider the Order of Operations and evaluate the amount inside the parentheses first.
Solution
11(2−6) = 11(−4) =−44
Next, the Distributive Property.
Solution
11(2−6) = 11(2)+11(−6) = 22−66 =−44
Note When applying the Distributive Property you MUST take note of any negative signs!
Example 3
Use the Distributive Property to determine the following.
a) 11(2x+6)
b) 7(3x−5)
c) 27
(3y2−11
)d) 2x
7
(3y2− 11
xy
)a) Simply multiply each term by 11.
Solution
11(2x+6) = 22x+66
b) Note the negative sign on the second term.
Solution
7(3x−5) = 21x−35
c) 27
(3y2−11
)= 2
7
(3y2)+ 2
7 (−11) = 6y2
7 −227
Solution27
(3y2−11
)= 6y2−22
7
CHAPTER 2. REAL NUMBERS
118 www.ck12.org
d) 2x7
(3y2− 11
xy
)= 2x
7 (3y2)+ 2x7
(−11xy
)= 6x2y
7−22x7xy
Solution2x7
(3y2− 11
xy
)= 6xy3−22
7y
Identify Expressions That Involve the Distributive Property
The Distributive Property often appears in expressions, and many times it does not involve parentheses as groupingsymbols. In Lesson 1.2, we saw how the fraction bar acts as a grouping symbol. The following example involvesusing the Distributive Property with fractions.
Example 4
Simplify the following expressions.
a) 2x+84
b) 9y−23
c) z+62
Even though these expressions are not written in a form we usually associate with the Distributive Property, the factthat the numerator of fractions should be treated as if it were in parentheses makes this a problem that the DistributiveProperty can help us solve.
a) 2x+84 can be re-written as 1
4(2x+8) . We can then proceed to distribute the 14 .
14(2x+8) =
2x4+
84=
2x2 ·2
+4 ·2
4
Solution2x+8
4 = x2 +2
b) 9y−23 can be re-written as 1
3(9y−2) .
We can then proceed to distribute the 13 .
13(9y−2) =
9y3− 2
3=
3 ·3x3− 2
3
Solution9y−2
3 = 3y− 23
c) z+62 can be re-written as 1
6(z+6) .
We can then proceed to distribute the 12 .
12(z+6) =
z2+
62
Solutionz+6
3 = z2 +3
2.5. THE DISTRIBUTIVE PROPERTY
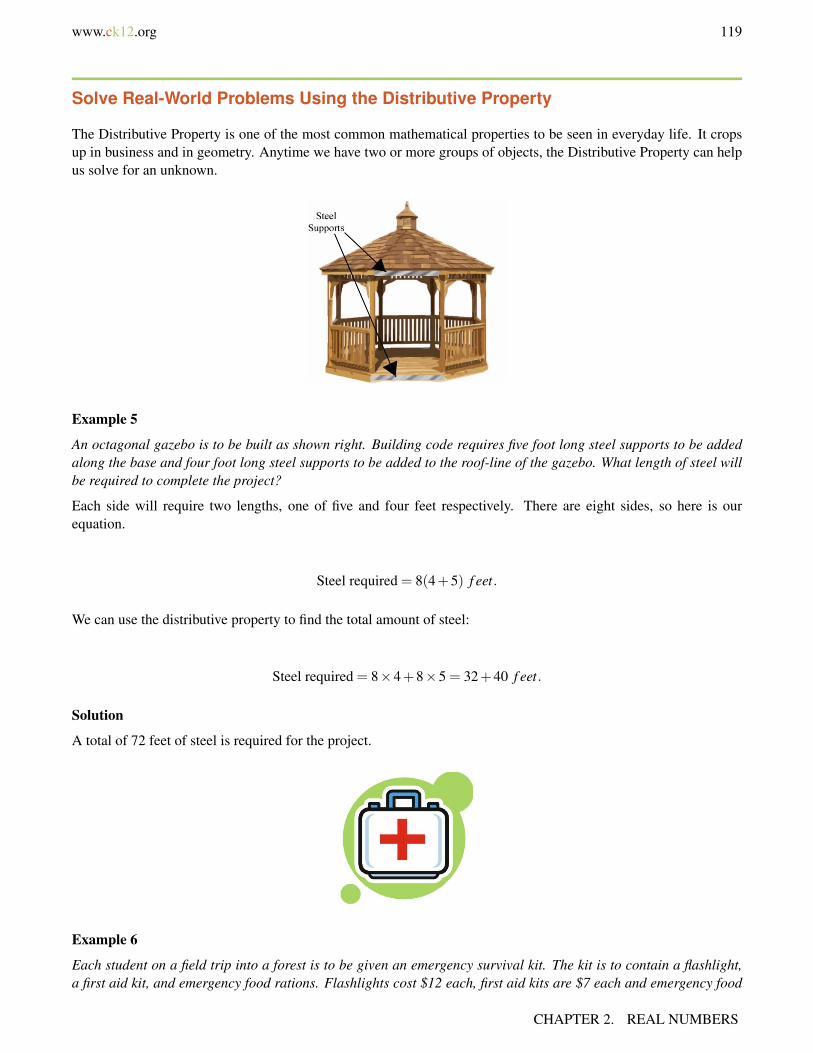
www.ck12.org 119
Solve Real-World Problems Using the Distributive Property
The Distributive Property is one of the most common mathematical properties to be seen in everyday life. It cropsup in business and in geometry. Anytime we have two or more groups of objects, the Distributive Property can helpus solve for an unknown.
Example 5
An octagonal gazebo is to be built as shown right. Building code requires five foot long steel supports to be addedalong the base and four foot long steel supports to be added to the roof-line of the gazebo. What length of steel willbe required to complete the project?
Each side will require two lengths, one of five and four feet respectively. There are eight sides, so here is ourequation.
Steel required = 8(4+5) f eet.
We can use the distributive property to find the total amount of steel:
Steel required = 8×4+8×5 = 32+40 f eet.
Solution
A total of 72 feet of steel is required for the project.
Example 6
Each student on a field trip into a forest is to be given an emergency survival kit. The kit is to contain a flashlight,a first aid kit, and emergency food rations. Flashlights cost $12 each, first aid kits are $7 each and emergency food
CHAPTER 2. REAL NUMBERS
120 www.ck12.org
rations cost $2 per day. There is $500 available for the kits and 17 students to provide for. How many days worth ofrations can be provided with each kit?
The unknown quantity in this problem is the number of days’ rations. This will be x in our expression. Each kit willcontain the following items.
1 ·$12 flashlight.1 ·$7 first aid kit.x ·$2 daily rations.
The number of kits = 17 , so the total cost is equal to the following equation.
Total cost = 17(12+7+2x)
We can use the Distributive Property on this expression.
17(12+7+2x) = 204+119+34x
We know that there is $500 available to buy the kits. We can substitute the cost with the money available.
204+119+34x = 500 The sum of the numbers on the left equal to the money available
323+34x = 500 Subtract 323 from both sides
−323−323
34x = 177 Divide both sides by 34
x = 5.20588 . . .
Since this represents the number of daily rations that can be bought, we must round to the next lowest wholenumber. We wouldn’t have enough money to buy a sixth day of supplies.
Solution
Five days worth of emergency rations can be purchased for each survival kit.
Lesson Summary
• Distributive Property The multiplication of a number and the sum of two numbers is equal to the first numbertimes the second number plus the first number times the third number.
Ex: 4× (6+3) = 4×6+4×3
• When applying the Distributive Property you MUST take note of any negative signs!
Review Questions
1. Use the Distributive Property to simplify the following expressions.
2.5. THE DISTRIBUTIVE PROPERTY
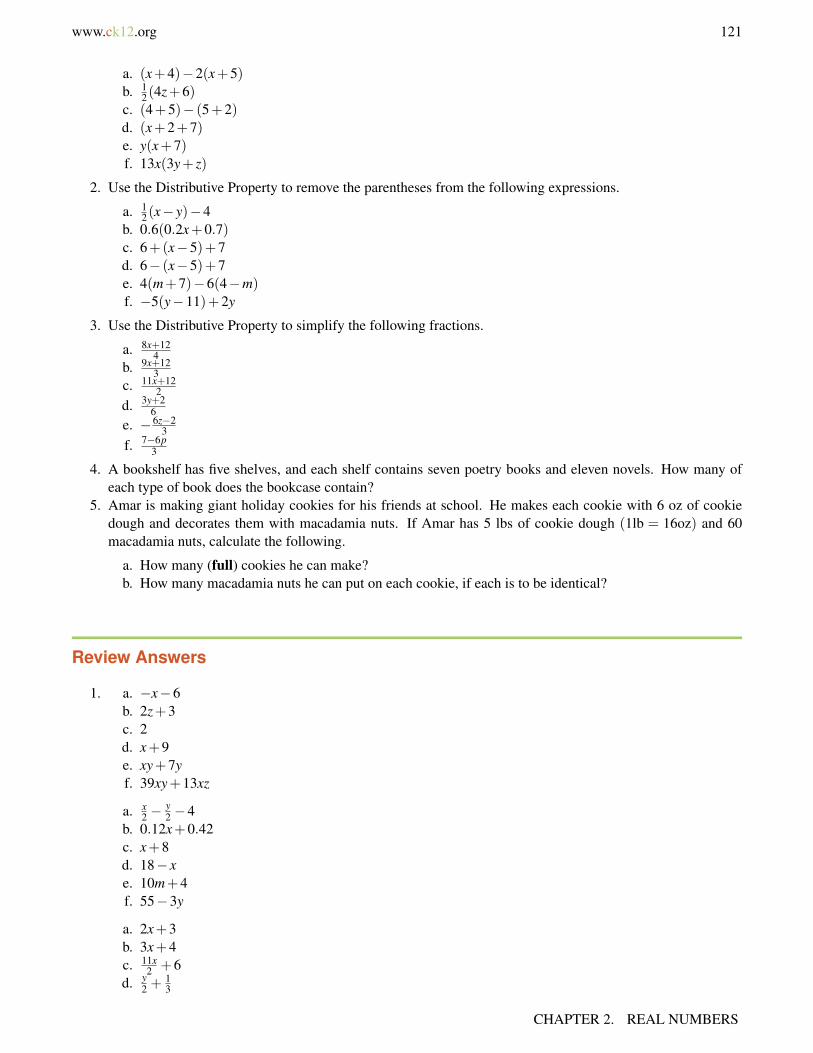
www.ck12.org 121
a. (x+4)−2(x+5)b. 1
2(4z+6)c. (4+5)− (5+2)d. (x+2+7)e. y(x+7)f. 13x(3y+ z)
2. Use the Distributive Property to remove the parentheses from the following expressions.
a. 12(x− y)−4
b. 0.6(0.2x+0.7)c. 6+(x−5)+7d. 6− (x−5)+7e. 4(m+7)−6(4−m)f. −5(y−11)+2y
3. Use the Distributive Property to simplify the following fractions.
a. 8x+124
b. 9x+123
c. 11x+122
d. 3y+26
e. −6z−23
f. 7−6p3
4. A bookshelf has five shelves, and each shelf contains seven poetry books and eleven novels. How many ofeach type of book does the bookcase contain?
5. Amar is making giant holiday cookies for his friends at school. He makes each cookie with 6 oz of cookiedough and decorates them with macadamia nuts. If Amar has 5 lbs of cookie dough (1lb = 16oz) and 60macadamia nuts, calculate the following.
a. How many (full) cookies he can make?b. How many macadamia nuts he can put on each cookie, if each is to be identical?
Review Answers
1. a. −x−6b. 2z+3c. 2d. x+9e. xy+7yf. 39xy+13xz
a. x2 −
y2 −4
b. 0.12x+0.42c. x+8d. 18− xe. 10m+4f. 55−3y
a. 2x+3b. 3x+4c. 11x
2 +6d. y
2 +13
CHAPTER 2. REAL NUMBERS

122 www.ck12.org
e. 23 −2z
f. 73 −2p
2. The bookshelf contains 35 poetry books and 55 novels.
a. Amar can make 13 cookies (2 oz leftover).b. Each cookie has 4 macadamia nuts (8 left over).
2.5. THE DISTRIBUTIVE PROPERTY

www.ck12.org 123
2.6 Division of Rational Numbers
Learning Objectives
• Find multiplicative inverses.• Divide rational numbers.• Solve real-world problems using division.
Introduction – Identity elements
An identity element is a number which, when combined with a mathematical operation on a number, leaves thatnumber unchanged. For addition and subtraction, the identity element is zero.
2+0 = 2
−5+0 =−5
99−0 = 99
The inverse operation of addition is subtraction.
x+5−5 = x When we subtract what we have added, we get back to where we started!
When you add a number to its opposite, you get the identity element for addition.
5+(−5) = 0
You can see that the addition of an opposite is an equivalent operation to subtraction.
For multiplication and division, the identity element is one.
2×1 = 2
−5×1 =−5
99÷1 = 99
In this lesson, we will learn about multiplying by a multiplicative inverse as an equivalent operation to division.Just as we can use opposites to turn a subtraction problem into an addition problem, we can use reciprocals toturn a division problem into a multiplication problem.
CHAPTER 2. REAL NUMBERS

124 www.ck12.org
Find Multiplicative Inverses
The multiplicative inverse of a number, x , is the number when multiplied by x yields one. In other words, anynumber times the multiplicative inverse of that number equals one. The multiplicative inverse is commonly thereciprocal, and the multiplicative inverse of x is denoted by 1
x .
Look at the following multiplication problem:
Simplify 23 ×
32
We know that we can cancel terms that appear on both the numerator and the denominator. Remember we leave aone when we cancel all terms on either the numerator or denominator!
23× 3
2=23× 32= 1
It is clear that 23 is the multiplicative inverse of 3
2 . Here is the rule.
To find the multiplicative inverse of a rational number, we simply invert the fraction.
The multiplicative inverse of ab is b
a , as long as a 6= 0
Example 1
Find the multiplicative inverse of each of the following.
a) 37
b) 47
c) 3 12
d) − xy
e) 111
a) Solution
The multiplicative inverse of 37 is 7
3 .
b) Solution
The multiplicative inverse of 49 is 9
r .
c) To find the multiplicative inverse of 3 12 we first need to convert 3 1
2 to an improper fraction:
312=
31+
12=
62+
12=
72
Solution
The multiplicative inverse of 3 12 is 2
7 .
d) Do not let the negative sign confuse you. The multiplicative inverse of a negative number is also negative!
Solution
The multiplicative inverse of − xy is − y
x .
e) The multiplicative inverse of 111 is 11
1 . Remember that when we have a denominator of one, we omit the denomi-nator.
2.6. DIVISION OF RATIONAL NUMBERS
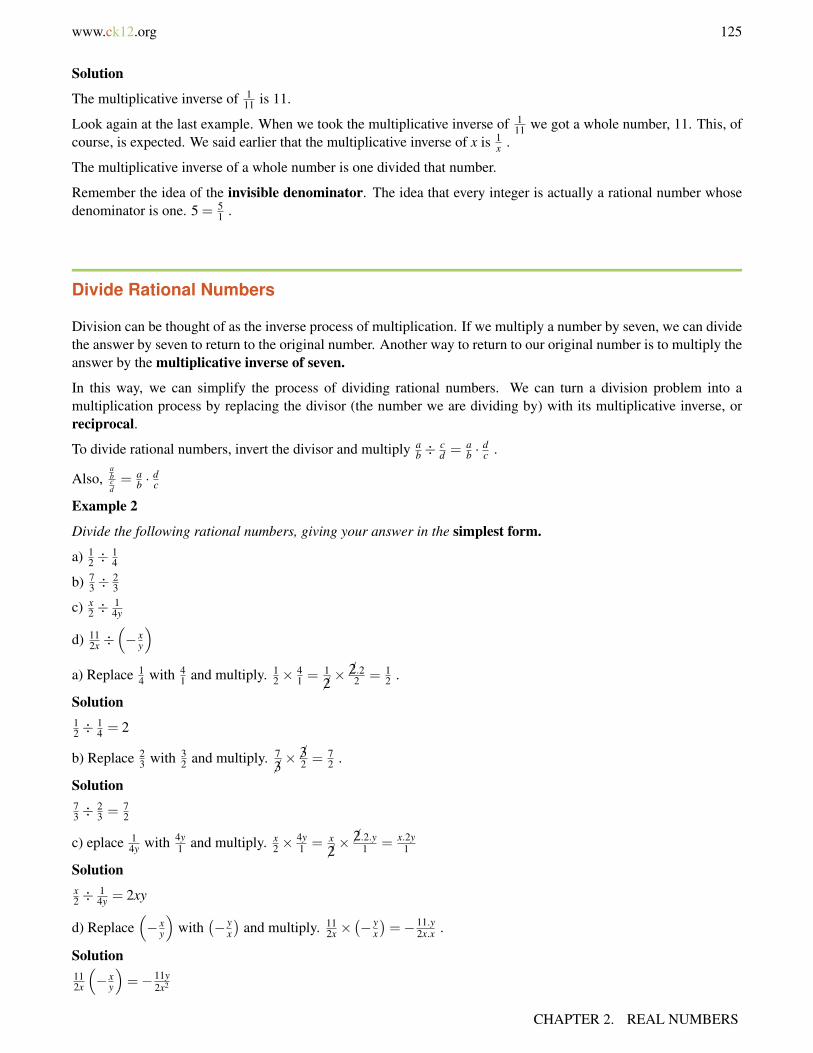
www.ck12.org 125
Solution
The multiplicative inverse of 111 is 11.
Look again at the last example. When we took the multiplicative inverse of 111 we got a whole number, 11. This, of
course, is expected. We said earlier that the multiplicative inverse of x is 1x .
The multiplicative inverse of a whole number is one divided that number.
Remember the idea of the invisible denominator. The idea that every integer is actually a rational number whosedenominator is one. 5 = 5
1 .
Divide Rational Numbers
Division can be thought of as the inverse process of multiplication. If we multiply a number by seven, we can dividethe answer by seven to return to the original number. Another way to return to our original number is to multiply theanswer by the multiplicative inverse of seven.
In this way, we can simplify the process of dividing rational numbers. We can turn a division problem into amultiplication process by replacing the divisor (the number we are dividing by) with its multiplicative inverse, orreciprocal.
To divide rational numbers, invert the divisor and multiply ab ÷
cd = a
b ·dc .
Also,abcd= a
b ·dc
Example 2
Divide the following rational numbers, giving your answer in the simplest form.
a) 12 ÷
14
b) 73 ÷
23
c) x2 ÷
14y
d) 112x ÷
(− x
y
)a) Replace 1
4 with 41 and multiply. 1
2 ×41 = 1
2× 2.22 = 1
2 .
Solution12 ÷
14 = 2
b) Replace 23 with 3
2 and multiply. 7
3× 32 = 7
2 .
Solution73 ÷
23 = 7
2
c) eplace 14y with 4y
1 and multiply. x2 ×
4y1 = x
2× 2.2.y1 = x.2y
1
Solutionx2 ÷
14y = 2xy
d) Replace(− x
y
)with
(− y
x
)and multiply. 11
2x ×(− y
x
)=−11.y
2x.x .
Solution112x
(− x
y
)=−11y
2x2
CHAPTER 2. REAL NUMBERS

126 www.ck12.org
Solve Real-World Problems Using Division
Speed, Distance and Time
An object moving at a certain speed will cover a fixed distance in a set time. The quantities speed, distance andtime are related through the equation:
Speed =Distance
Time
Example 3
Andrew is driving down the freeway. He passes mile marker 27 at exactly mid-day. At 12:35 he passes mile marker69. At what speed, in miles per hour, is Andrew traveling?
To determine speed, we need the distance traveled and the time taken. If we want our speed to come out in miles perhour, we will need distance in miles and time in hours.
Distance = 69−27 = 42 miles
Time taken = 35 minutes =3560
=5.75.12
=712
hour
We now plug in the values for distance and time into our equation for speed.
Speed =42( 712
) = 421÷ 7
12Replace
712
with127
and multiply.
Speed =421× 12
7=7.61
127
=6.12
1
Solution
Andrew is driving at 72 miles per hour.
Example 4
Anne runs a mile and a half in a quarter hour. What is her speed in miles per hour?
We already have the distance and time in the correct units (miles and hours). We simply write each as a rationalnumber and plug them into the equation.
Speed =
(32
)(14
) = 32÷ 1
4Replace
14
with41
and multiply.
Speed =32× 4
1=
122
= 6
Solution
Anne runs at 6 miles per hour.
Example 5 – Newton’s Second Law
2.6. DIVISION OF RATIONAL NUMBERS
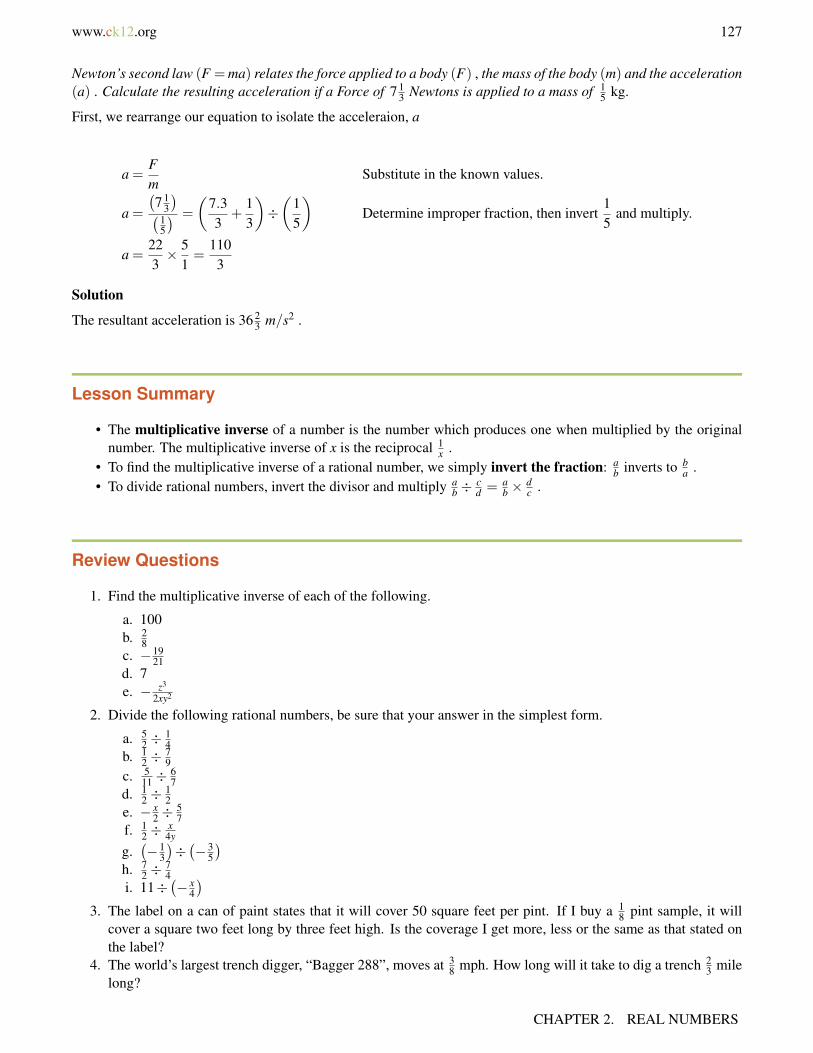
www.ck12.org 127
Newton’s second law (F =ma) relates the force applied to a body (F) , the mass of the body (m) and the acceleration(a) . Calculate the resulting acceleration if a Force of 7 1
3 Newtons is applied to a mass of 15 kg.
First, we rearrange our equation to isolate the acceleraion, a
a =Fm
Substitute in the known values.
a =
(7 1
3
)(15
) =
(7.33
+13
)÷(
15
)Determine improper fraction, then invert
15
and multiply.
a =223× 5
1=
1103
Solution
The resultant acceleration is 36 23 m/s2 .
Lesson Summary
• The multiplicative inverse of a number is the number which produces one when multiplied by the originalnumber. The multiplicative inverse of x is the reciprocal 1
x .• To find the multiplicative inverse of a rational number, we simply invert the fraction: a
b inverts to ba .
• To divide rational numbers, invert the divisor and multiply ab ÷
cd = a
b ×dc .
Review Questions
1. Find the multiplicative inverse of each of the following.
a. 100b. 2
8c. −19
21d. 7e. − z3
2xy2
2. Divide the following rational numbers, be sure that your answer in the simplest form.
a. 52 ÷
14
b. 12 ÷
79
c. 511 ÷
67
d. 12 ÷
12
e. − x2 ÷
57
f. 12 ÷
x4y
g.(−1
3
)÷(−3
5
)h. 7
2 ÷74
i. 11÷(− x
4
)3. The label on a can of paint states that it will cover 50 square feet per pint. If I buy a 1
8 pint sample, it willcover a square two feet long by three feet high. Is the coverage I get more, less or the same as that stated onthe label?
4. The world’s largest trench digger, “Bagger 288”, moves at 38 mph. How long will it take to dig a trench 2
3 milelong?
CHAPTER 2. REAL NUMBERS
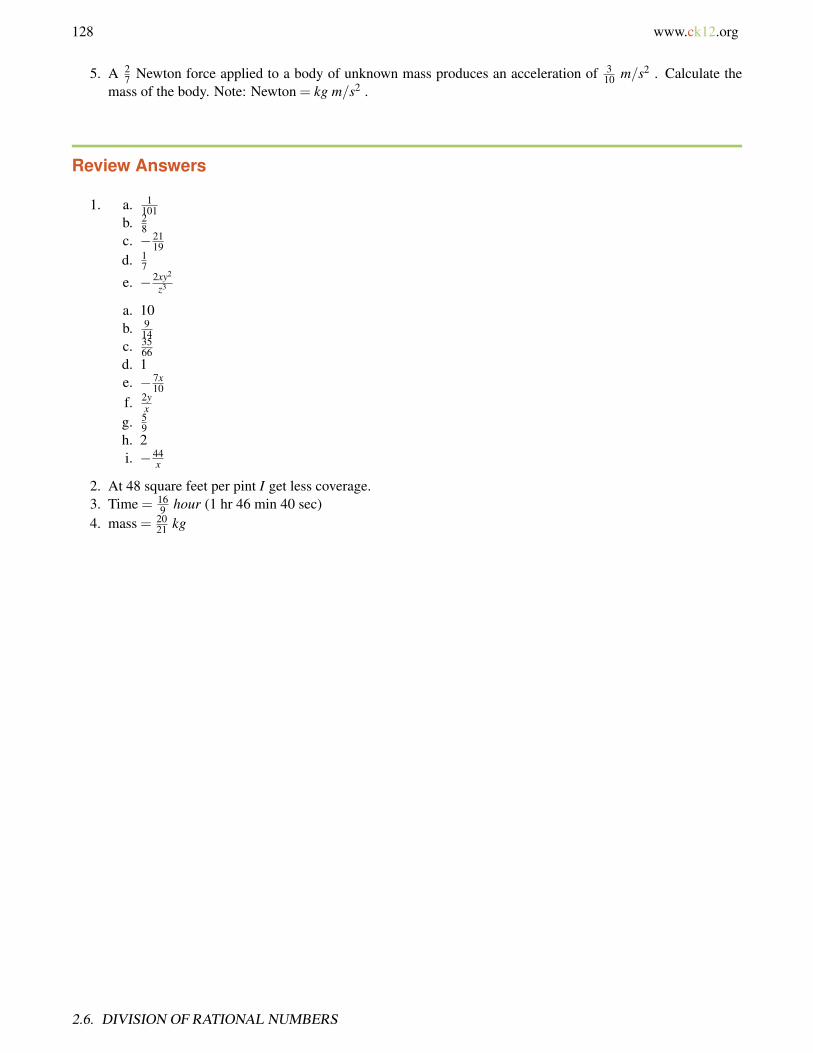
128 www.ck12.org
5. A 27 Newton force applied to a body of unknown mass produces an acceleration of 3
10 m/s2 . Calculate themass of the body. Note: Newton = kg m/s2 .
Review Answers
1. a. 1101
b. 28
c. −2119
d. 17
e. −2xy2
z3
a. 10b. 9
14c. 35
66d. 1e. − 7x
10f. 2y
xg. 5
9h. 2i. −44
x
2. At 48 square feet per pint I get less coverage.3. Time = 16
9 hour (1 hr 46 min 40 sec)4. mass = 20
21 kg
2.6. DIVISION OF RATIONAL NUMBERS
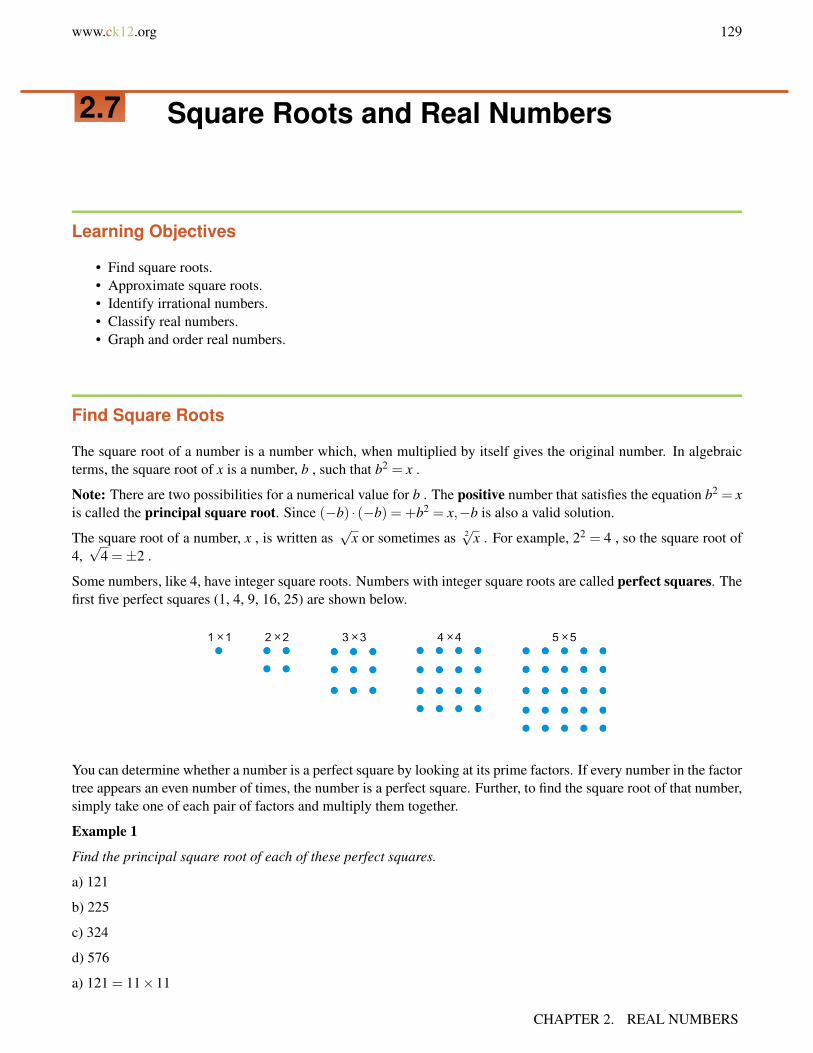
www.ck12.org 129
2.7 Square Roots and Real Numbers
Learning Objectives
• Find square roots.• Approximate square roots.• Identify irrational numbers.• Classify real numbers.• Graph and order real numbers.
Find Square Roots
The square root of a number is a number which, when multiplied by itself gives the original number. In algebraicterms, the square root of x is a number, b , such that b2 = x .
Note: There are two possibilities for a numerical value for b . The positive number that satisfies the equation b2 = xis called the principal square root. Since (−b) · (−b) = +b2 = x,−b is also a valid solution.
The square root of a number, x , is written as√
x or sometimes as 2√x . For example, 22 = 4 , so the square root of4,√
4 =±2 .
Some numbers, like 4, have integer square roots. Numbers with integer square roots are called perfect squares. Thefirst five perfect squares (1, 4, 9, 16, 25) are shown below.
You can determine whether a number is a perfect square by looking at its prime factors. If every number in the factortree appears an even number of times, the number is a perfect square. Further, to find the square root of that number,simply take one of each pair of factors and multiply them together.
Example 1
Find the principal square root of each of these perfect squares.
a) 121
b) 225
c) 324
d) 576
a) 121 = 11×11
CHAPTER 2. REAL NUMBERS

130 www.ck12.org
Solution√
121 = 11
b) 225 = (5×5)× (3×3)
Solution√
225 = 5×3 = 15
c) 324 = (2×2)× (3×3)× (3×3)
Solution√
324 = 2×3×3 = 18
d) 576 = (2×2)× (2×2)× (2×2)× (3×3)
Solution√
576 = 2×2×2×3 = 24
When we have an odd number of prime factors, we leave any unpaired factors under a radical sign. Any answer thatcontains both whole numbers and irreducible radicals should be written A
√b .
Example 2
Find the principal square root of the following numbers.
a) 8
b) 48
c) 75
d) 216
a) 8 = (2×2)×2
Solution√
8 = 2×√
2 = 2√
2
b) 48 = (2×2)× (2×2)×3
Solution√
48 = 2×2×√
3 = 4√
3
c) 75 = (5×5)×3
Solution√
75 = 5×√
3 = 5√
3
d) 216 = (2×2)×2× (3×3)×3
Solution√
216 = 2×√
2×3×√
3 = 6√
2√
3 = 6√
6
Note that in the last example we collected the whole numbers and multiplied them first, then we collect unpairedprimes under a single radical symbol. Here are the four rules that govern how we treat square roots.
√a×√
b =√
ab√
a÷√
b =
√ab
A√
a×B√
b = AB√
ab A√
a÷B√
b =AB
√ab
2.7. SQUARE ROOTS AND REAL NUMBERS

www.ck12.org 131
Example 3
Simplify the following square root problems
a)√
8×√
2
b) 3√
4×4√
3
c)√
12÷√
3
d) 12√
10÷6√
5
a)√
8×√
2 = 16
Solution√
8×√
2 = 4
b) 3√
4×4√
3 = 12√
12 = 12√(2×2)×3 = 12×2
√3
Solution
3√
4×4√
3 = 24√
3
c)√
12÷√
3 =
√123
=√
4
Solution√
12÷√
3 = 2
d) 12√
10÷6√
5 = 126
√105
Solution
12√
10÷6√
5 = 2√
2
Approximate Square Roots
When we have perfect squares, we can write an exact numerical solution for the principal square root. When wehave one or more unpaired primes in the factor tree of a number, however, we do not get integer values for thesquare root and we have seen that we leave a radical in the answer. Terms like
√2 ,√
3 and√
7 (square roots ofprime numbers) cannot be written as rational numbers. That is to say, they cannot be expressed as the ratio of twointegers. We call them irrational numbers. In decimal form, they have an unending, seemingly random, string ofnumbers after the decimal point.
To find approximate values for square roots, we use the √ or√
x button on a calculator. When the number we arefinding the square root of is a perfect square, or the square of a rational number, we will get an exact answer. Whenthe number is a non-perfect square, the decimals will appear random and we will have an irrational number as ouranswer. We call this an approximate answer. Even though we may have an answer to eight or nine decimal places,it still represents an approximation of the real answer which has an infinite number of non-repeating decimals.
Example 4
Use a calculator to find the following square roots. Round your answer to three decimal places.
a)√
99
b)√
5
c)√
0.5
d)√
1.75
CHAPTER 2. REAL NUMBERS
132 www.ck12.org
a) The calculator returns 9.949874371.
Solution√
8≈ 9.950
b) The calculator returns 2.236067977.
Solution√
5≈ 2.236
c) The calculator returns 0.7071067812.
Solution√
0.5≈ 0.707
d) The calculator returns 1.322875656.
Solution√
1.75≈ 1.323
Identify Irrational Numbers
Any square root that cannot be simplified to a form without a square root is irrational, but not all square rootsare irrational. For example,
√49 reduces to 7 and so
√49 is rational, but
√50 cannot be reduced further than√
25×√
2 = 5√
2 . The fact that we cannot remove the factor of square root of 2 makes√
50 irrational.
Example 5
Identify which of the following are rational numbers and which are irrational numbers.
a) 23.7
b) 2.8956
c) π
d)√
6
e) 3.27
a) 23.7 = 23 710 . This is clearly a rational number.
b) 2.8956 = 2 895610000 . Again, this is a rational number.
c) π = 3.141592654 . . . The decimals appear random, and from the definition of π we know they do not repeat. Thisis an irrational number.
d)√
6 = 2.44949489743 . . . Again the decimals appear to be random. We also know that√
6 =√
2×√
3 . Squareroots of primes are irrational.
√6 is an irrational number.
e) 3.27 = 3.2727272727 . . . Although these decimals are recurring they are certainly not unpredictable. This is arational number (in actual fact, 3.27 = 36
11 )
Classify Real Numbers
We can now see how real numbers fall into one of several categories.
2.7. SQUARE ROOTS AND REAL NUMBERS
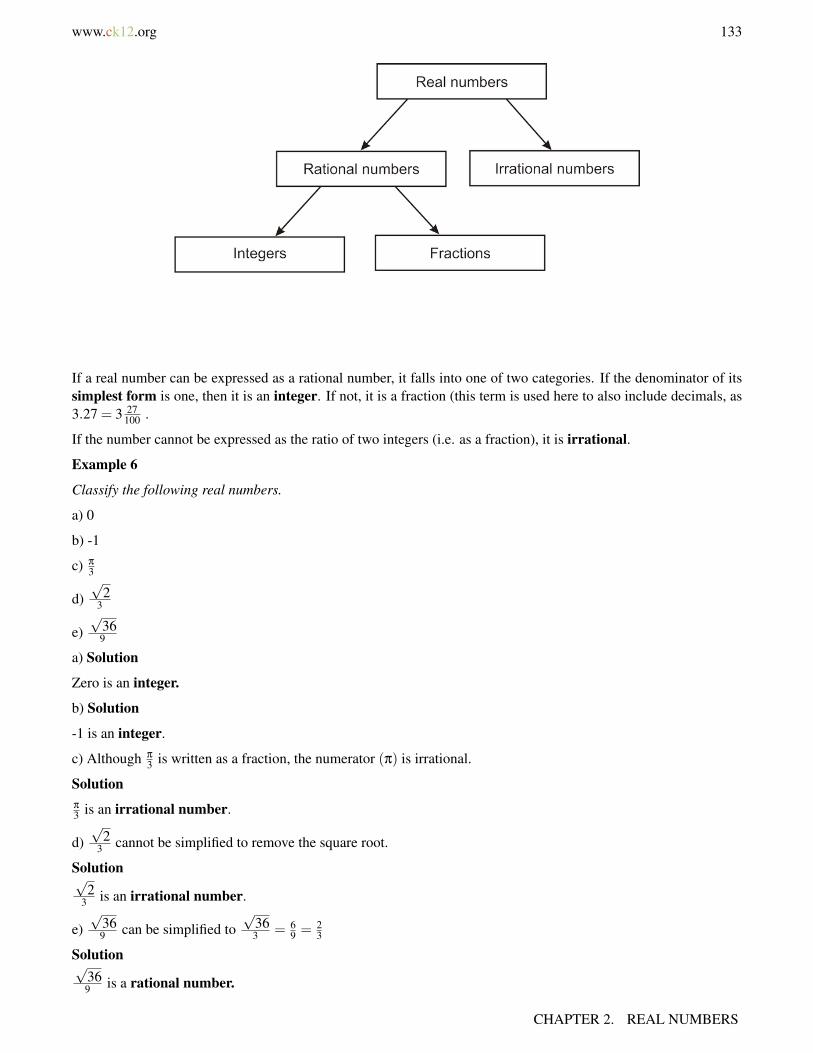
www.ck12.org 133
If a real number can be expressed as a rational number, it falls into one of two categories. If the denominator of itssimplest form is one, then it is an integer. If not, it is a fraction (this term is used here to also include decimals, as3.27 = 3 27
100 .
If the number cannot be expressed as the ratio of two integers (i.e. as a fraction), it is irrational.
Example 6
Classify the following real numbers.
a) 0
b) -1
c) π
3
d)√
23
e)√
369
a) Solution
Zero is an integer.
b) Solution
-1 is an integer.
c) Although π
3 is written as a fraction, the numerator (π) is irrational.
Solutionπ
3 is an irrational number.
d)√
23 cannot be simplified to remove the square root.
Solution√2
3 is an irrational number.
e)√
369 can be simplified to
√363 = 6
9 = 23
Solution√369 is a rational number.
CHAPTER 2. REAL NUMBERS
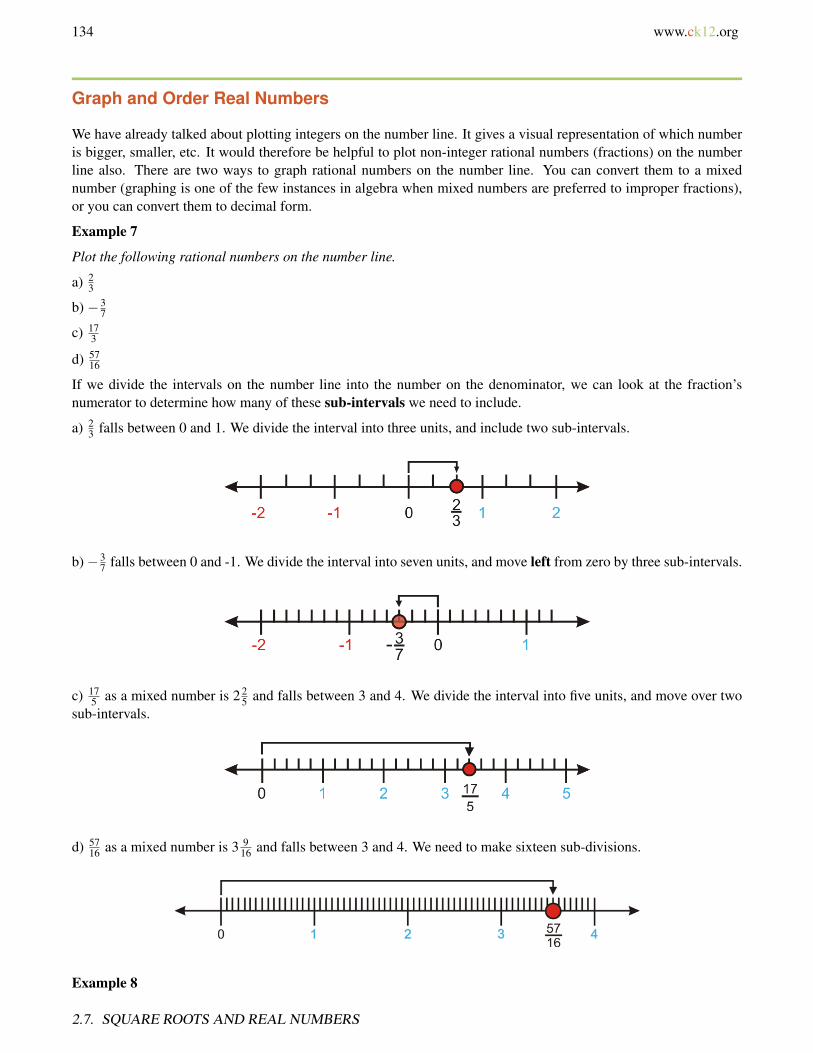
134 www.ck12.org
Graph and Order Real Numbers
We have already talked about plotting integers on the number line. It gives a visual representation of which numberis bigger, smaller, etc. It would therefore be helpful to plot non-integer rational numbers (fractions) on the numberline also. There are two ways to graph rational numbers on the number line. You can convert them to a mixednumber (graphing is one of the few instances in algebra when mixed numbers are preferred to improper fractions),or you can convert them to decimal form.
Example 7
Plot the following rational numbers on the number line.
a) 23
b) −37
c) 173
d) 5716
If we divide the intervals on the number line into the number on the denominator, we can look at the fraction’snumerator to determine how many of these sub-intervals we need to include.
a) 23 falls between 0 and 1. We divide the interval into three units, and include two sub-intervals.
b)−37 falls between 0 and -1. We divide the interval into seven units, and move left from zero by three sub-intervals.
c) 175 as a mixed number is 2 2
5 and falls between 3 and 4. We divide the interval into five units, and move over twosub-intervals.
d) 5716 as a mixed number is 3 9
16 and falls between 3 and 4. We need to make sixteen sub-divisions.
Example 8
2.7. SQUARE ROOTS AND REAL NUMBERS

www.ck12.org 135
Plot the following numbers, in the correct order, on a number line.
a) π
b) 227
c) 3.14
d)√
10
We will use a calculator to find decimal expansions for each of these, and use a number line divided into 1000sub-divisions. When we have two extremely close numbers, we will ensure that we place them in the correct orderby looking at the expansion to the 3rd decimal place and writing as a fraction of 1000.
a) π = 3.14159 . . .≈ 3 1421000
b) 227 = 3.14288 . . .≈ 3 143
1000
c) 3.14≈ 3 1401000
d)√
10 = 3.16227 . . .≈ 3 1621000
Solution
Lesson Summary
• The square root of a number is a number which gives the original number when multiplied by itself. Inalgebraic terms, the square root of x is a number, b , such that b2 = x , or b =
√x
• There are two possibilities for a numerical value for b . A positive value called the principal square root anda negative value (the opposite of the positive value).
• A perfect square is a number with an integer square root.• Here are some mathematical properties of square roots.
√a×√
b =√
ab√
a÷√
b =
√ab
A√
a×B√
b = AB√
ab A√
a÷B√
b =AB
√ab
• Square roots of prime numbers are irrational numbers. They cannot be written as rational numbers (the ratioof two integers). In decimal form, they have an unending, seemingly random, string of numbers after thedecimal point.
• Computing a square root on a calculator will produce an approximate solution since there are a finite numberof digits after the decimal point.
Review Questions
1. Find the following square roots exactly without using a calculator, giving your answer in the simplest form.
CHAPTER 2. REAL NUMBERS

136 www.ck12.org
a.√
25b.√
24c.√
20d.√
200e.√
2000
f.
√14
g.
√94
h.√
0.16i.√
0.1j.√
0.01
2. Use a calculator to find the following square roots. Round to two decimal places.
a.√
13b.√
99c.√
123d.√
2e.√
2000f.√
0.25g.√
1.35h.√
0.37i.√
0.7j.√
0.01
3. Classify the following numbers as an integer, a rational number or an irrational number.
a.√
0.25b.√
1.35c.√
20d.√
25e.√
100
4. Place the following numbers in numerical order, from lowest to highest.√
62
6150
√1.5
1613
5. Use the marked points on the number line and identify each proper fraction.
Review Answers
1. a. 5b. 2√
6c. 2√
5d. 10
√2
e. 20√
5f. 1
2g. 3
2
2.7. SQUARE ROOTS AND REAL NUMBERS

www.ck12.org 137
h. 0.4i. 1√
10or√
1010
j. 0.1
a. 3.61b. 1.16c. 9.95d. 11.09e. 44.72f. 0.5g. 1.16h. 0.61i. 0.84j. 0.1
a. rationalb. irrationalc. irrationald. integere. integer
2. 6150
√6
21613
√1.6
a. 23
b. 95
c. 94
d. 349
CHAPTER 2. REAL NUMBERS

138 www.ck12.org
2.8 Problem-Solving Strategies: Guess andCheck, Work Backward
Learning Objectives
• Read and understand given problem situations.• Develop and use the strategy: guess and check.• Develop and use the strategy: work backward.• Plan and compare alternative approaches to solving problems.• Solve real-world problems using selected strategies as part of a plan.
Introduction
In this chapter, we will continue using our problem solving plan to solve real-world problems. In this section, youwill learn about the methods of Guess and Check and Working Backwards. These are very powerful strategies inproblem solving and probably the most commonly used in everyday life. Let’s review our problem-solving plan.
Step 1
Understand the problem.
Read the problem carefully. Once the problem is read, list all the components and data that are involved. This iswhere you will be assigning your variables
Step 2
Devise a plan – Translate
Come up with a way to solve the problem. Set up an equation, draw a diagram, make a chart or construct a table asa start to solving your problem.
Step 3
Carry out the plan – Solve
This is where you solve the equation you came up with in Step 2.
Step 4
Look – Check and Interpret
Check to see if you used all your information and that the answer makes sense.
Let’s now apply this plan to a few problems.
2.8. PROBLEM-SOLVING STRATEGIES: GUESS AND CHECK, WORK BACKWARD
www.ck12.org 139
Read and Understand Given Problem Situations
The most difficult parts of problem-solving are most often the first two steps in our problem solving plan. First, youneed to read the problem and make sure you understand what you are being asked. Then devise a strategy that usesthe information you have been given to arrive at a solution.
Let’s look at a problem without solving it. We will read through the problem and list the information we have beengiven and what we are trying to find. We will then try to devise a strategy for solving the problem.
Example 1
A book cost $18 if bought online and $22.50 if bought at the store. The bookstore sold 250 books and took in $4995.How many books were bought online and how many were bought in the store?
Problem set-up:
Step 1
Understand
A book bought online is $18
A book bought at the store is $22.50
The total takings equal $4995
The total number of books sold equals 250
How many books were bought online and how many books were bought in the store?
Step 2
Strategy
Total takings = Total for online sales + Total for in-store sales.
$4995 = $18 (number of books sold online) + $22.50 (number of books sold in-store)
Number of books sold online + Number of books sold in the store = 250 books.
We can guess values for each category and see which of them will give the correct answers.
Develop and Use the Strategy: Guess and Check
The strategy for the method “Guess and Check” is to guess a solution and use the guess in the problem to see ifyou get the correct answer. If the answer is too big or too small, then make another guess that will get you closer tothe goal. You continue guessing until you arrive at the correct solution. The process might sound like a long one,however the guessing process will often lead you to patterns that you can use to make better guesses along the way.
CHAPTER 2. REAL NUMBERS
140 www.ck12.org
Here is an example of how this strategy is used in practice.
Example 2
Nadia takes a ribbon that is 48 inches long and cuts it in two pieces. One piece is three times as long as the other.How long is each piece?
Solution
Step 1
Understand
We need to find two numbers that add to 48. One number is three times the other number.
Step 2
Strategy
We guess two random numbers, one three times bigger than the other and find the sum.
If the sum is too small we guess larger numbers and if the sum is too large we guess smaller numbers.
Then, we see if any patterns develop from our guesses.
Step 3
Apply Strategy/Solve
Guess 5 and 15 the sum is 5+15 = 20 which is too small
Guess bigger numbers 6 and 18 the sum is 6+18 = 24 which is too small
However, you can see that the answer is exactly half of 48.
Multiply 6 and 18 by two.
Our next guess is 12 and 36 the sum is 12+36 = 48 This is correct.
Answer The pieces are 12 inches and 36 inches long.
Step 4
Check
12+36 = 48 The ribbon pieces add up to 48 inches.
36 = 3(12) One piece is three times the length of the other piece.
The answer checks out.
2.8. PROBLEM-SOLVING STRATEGIES: GUESS AND CHECK, WORK BACKWARD

www.ck12.org 141
Develop and Use the Strategy: Work Backward
The “Work Backward” method works well for problems in which a series of operations is applied to an unknownquantity and you are given the resulting number. The strategy in these problems is to start with the result and applythe operations in reverse order until you find the unknown. Let’s see how this method works by solving the followingproblem.
Example 3
Anne has a certain amount of money in her bank account on Friday morning. During the day she writes a check for$24.50, makes an ATM withdrawal of $80 and deposits a check for $235. At the end of the day she sees that herbalance is $451.25. How much money did she have in the bank at the beginning of the day?
Solution:
Step 1
Understand
We need to find the money in Anne’s bank account at the beginning of the day on Friday.
She took out $24.50 and $80 and put in $235.
She ended up with $451.25 at the end of the day.
Step 2
Strategy
From the unknown amount we subtract $24.50 and $80 and add $235. We end up with $451.25.
We need to start with the result and apply the operations in reverse.
Step 3
Apply Strategy/Solve
Start with $451.25. Subtract $235 and add $80 and then add $24.50.
451.25−235+80+24.50 = 320.75
Answer Anne had $320.75 in her account at the beginning of the day on Friday.
Step 4
Check
CHAPTER 2. REAL NUMBERS
142 www.ck12.org
Anne starts with $320.75
She writes a check for $24.50 $320.75−$24.50 = $296.25
She withdraws $80 $296.25−$80 = $216.25
She deposits $235 $216.25+$235 = $451.25
The answer checks out.
Plan and Compare Alternative Approaches to Solving Problems
Most word problems can be solved in more than one way. Often one method is more straight forward than others.In this section, you will see how different approaches compare for solving different kinds of problems.
Example 4
Nadia’s father is 36. He is 16 years older than four times Nadia’s age. How old is Nadia?
Solution
This problem can be solved with either of the strategies you learned in this section. Let’s solve the problem usingboth strategies.
Guess and Check Method
Step 1
Understand
We need to find Nadia’s age.
We know that her father is 16 years older than four times her age. Or 4× (Nadiaâ[U+0080][U+0099]s age)+16
We know her father is 36 years old.
Step 2
Strategy
We guess a random number for Nadia’s age.
2.8. PROBLEM-SOLVING STRATEGIES: GUESS AND CHECK, WORK BACKWARD
www.ck12.org 143
We multiply the number by 4 and add 16 and check to see if the result equals to 36.
If the answer is too small, we guess a larger number and if the answer is too big then we guess a smaller number.
We keep guessing until we get the answer to be 36.
Step 3
Apply strategy/Solve
Guess Nadiaâ[U+0080][U+0099]s age 10 4(10)+16 = 56 which is too big for her fatherâ[U+0080][U+0099]s age
Guess a smaller number 9 4(9)+16 = 52 which is too big
We notice that when we decreased Nadia’s age by one, her father’s age decreased by four.
We want the father’s age to be 36, which is 16 years smaller than 52.
This means that we should guess Nadia’s age to be 4 years younger than 9.
Guess 5 4(5)+16 = 36 This is the right age.
Answer Nadia is 5 years old.
Step 4
Check
Nadia is 5 years old. Her father’s age is 4(5)+16 = 36 . This is correct.
The answer checks out.
Work Backward Method
Step 1
Understand
We need to find Nadia’s age.
We know her father is 16 years older than four times her age. Or 4× (Nadiaâ[U+0080][U+0099]s age)+16
We know her father is 36 years old.
Step 2
Strategy
Nadia’s father is 36 years old.
To get from Nadia’s age to her father’s age, we multiply Nadia’s age by four and add 16.
Working backwards means we start with the father’s age, subtract 16 and divide by 4.
Step 3
Apply Strategy/Solve
Start with the fatherâ[U+0080][U+0099]s age 36
Subtract16 36−16 = 20
Divide by 4 20÷4 = 5
CHAPTER 2. REAL NUMBERS

144 www.ck12.org
Answer Nadia is 5 years old.
Step 4
Check
Nadia is 5 years old. Her father’s age is: 4(5)+16 = 36 . This is correct.
The answer checks out.
You see that in this problem, the “Work Backward” strategy is more straight-forward than the Guess and Checkmethod. The Work Backward method always works best when we perform a series of operations to get from anunknown number to a known result. In the next chapter, you will learn algebra methods for solving equations thatare based on the Work Backward method.
Solve Real-World Problems Using Selected Strategies as Part of a Plan
Example 6
Nadia rents a car for a day. Her car rental company charges $50 per day and $0.40 per mile. Peter rents a car froma different company that charges $70 per day and $0.30 per mile. How many miles do they have to drive beforeNadia and Peter pay the same price for the rental for the same number of miles?
Solution Let’s use the Guess and Check method.
Step 1
Understand
Nadia’s car rental costs $50 plus $0.40 per mile.
Peter’s car rental costs $70 plus $0.30 per mile.
We want to know how many miles they have to drive to pay the same price of the rental for the same number ofmiles.
Step 2
Strategy
Nadia’s total cost is $50 plus $0.40 times the number of miles.
Peter’s total cost is $70 plus $0.30 times the number of miles.
Guess the number of miles and use this guess to calculate Nadia’s and Peter’s total cost.
Keep guessing until their total cost is the same.
2.8. PROBLEM-SOLVING STRATEGIES: GUESS AND CHECK, WORK BACKWARD
www.ck12.org 145
Step 3
Apply Strategy/Solve
Guess 50 miles
Check $50+$0.40(50) = $70 $70+$0.30(50) = $85 too small
Guess 60 miles
Check $50+$0.40(60) = $74 $70+$0.30(60) = $88 too small
Notice that for an increase of 10 miles, the difference between total costs fell from $15 to $14.
To get the difference to zero, we should try increasing the mileage by 140 miles.
Guess 200 miles
Check $50+$0.40(200) = $130 $70+$0.30(200) = $130 correct
Answer: Nadia and Peter each have to drive 200 miles to pay the same total cost for the rental.
Step 4
Check
Nadia $50+$0.40(200) = $130 Peter $70+$0.30(200) = $130
The answer checks out.
Lesson Summary
The four steps of the problem solving plan are:
• Understand the problem• Devise a plan – Translate• Carry out the plan – Solve• Look – Check and Interpret
Two common problem solving strategies are:
• Guess and Check
Guess a solution and use the guess in the problem to see if you get the correct answer. If the answer is too big or toosmall, then make another guess that will get you closer to the goal.
• Work Backward
This method works well for problems in which a series of operations is applied to an unknown quantity and you aregiven the resulting number. Start with the result and apply the operations in reverse order until you find the unknown.
CHAPTER 2. REAL NUMBERS

146 www.ck12.org
Review Questions
1. Finish the problem we started in Example 1.2. Nadia is at home and Peter is at school which is 6 miles away from home. They start traveling towards each
other at the same time. Nadia is walking at 3.5 miles per hour and Peter is skateboarding at 6 miles per hour.When will they meet and how far from home is their meeting place?
3. Peter bought several notebooks at Staples for $2.25 each and he bought a few more notebooks at Rite-Aid for$2 each. He spent the same amount of money in both places and he bought 17 notebooks in total. How manynotebooks did Peter buy in each store?
4. Andrew took a handful of change out of his pocket and noticed that he was only holding dimes and quartersin his hand. He counted that he had 22 coins that amounted to $4. How many quarters and how many dimesdoes Andrew have?
5. Anne wants to put a fence around her rose bed that is one and a half times as long as it is wide. She uses 50feet of fencing. What are the dimensions of the garden?
6. Peter is outside looking at the pigs and chickens in the yard. Nadia is indoors and cannot see the animals.Peter gives her a puzzle He tells her that he counts 13 heads and 36 feet and asks her how many pigs and howmany chickens are in the yard. Help Nadia find the answer.
7. Andrew invests $8000 in two types of accounts. A savings account that pays 5.25% interest per year and amore risky account that pays 9% interest per year. At the end of the year he has $450 in interest from the twoaccounts. Find the amount of money invested in each account.
8. There is a bowl of candy sitting on our kitchen table. This morning Nadia takes one-sixth of the candy. Laterthat morning Peter takes one-fourth of the candy that’s left. This afternoon, Andrew takes one-fifth of what’sleft in the bowl and finally Anne takes one-third of what is left in the bowl. If there are 16 candies left in thebowl at the end of the day, how much candy was there at the beginning of the day?
9. Nadia can completely mow the lawn by herself in 30 minutes. Peter can completely mow the lawn by himselfin 45 minutes. How long does it take both of them to mow the lawn together?
Review Answers
1. 140 online sales and 110 in-store sales.2. 37.9 minutes 2.2 miles from home3. 8 notebooks at Staples and 9 notebooks at Rite-Aid4. 12 quarters and 10 dimes5. 10 feet wide and 15 feet long6. 5 pigs and 8 chickens7. $7200 in the savings account and $800 in the high-risk account8. 48 candies9. 18 minutes
Texas Instruments Resources
In the CK-12 Texas Instruments Algebra I FlexBook, there are graphing calculator activities designed to supple-ment the objectives for some of the lessons in this chapter. See http://www.ck12.org/flexr/chapter/9612.
2.8. PROBLEM-SOLVING STRATEGIES: GUESS AND CHECK, WORK BACKWARD

www.ck12.org 147
CHAPTER 3 Equations of LinesCHAPTER OUTLINE
3.1 ONE-STEP EQUATIONS
3.2 TWO-STEP EQUATIONS
3.3 MULTI-STEP EQUATIONS
3.4 EQUATIONS WITH VARIABLES ON BOTH SIDES
3.5 RATIOS AND PROPORTIONS
3.6 SCALE AND INDIRECT MEASUREMENT
3.7 PERCENT PROBLEMS
3.8 PROBLEM SOLVING STRATEGIES: USE A FORMULA
CHAPTER 3. EQUATIONS OF LINES

148 www.ck12.org
3.1 One-Step Equations
Learning Objectives
• Solve an equation using addition.• Solve an equation using subtraction.• Solve an equation using multiplication.• Solve an equation using division.
Introduction
Nadia is buying a new mp3 player. Peter watches her pay for the player with a $100 bill. She receives $22.00 inchange, and from only this information, Peter works out how much the player cost. How much was the player?
In math, we can solve problems like this using an equation. An equation is an algebraic expression that involvesan equals sign. If we use the letter x to represent the cost of the mp3 player we could write the following equation.
x+22 = 100
This tells us that the value of the player plus the value of the change received is equal to the $100 that Nadia paid.
Peter saw the transaction from a different viewpoint. He saw Nadia receive the player, give the salesperson $100then he saw Nadia receive $22 change. Another way we could write the equation would be:
x = 100−22
This tells us that the value of the player is equal to the amount of money Nadia paid (100 - 22).
Mathematically, these two equations are equivalent. Though it is easier to determine the cost of the mp3 player fromthe second equation. In this chapter, we will learn how to solve for the variable in a one variable linear equation.Linear equations are equations in which each term is either a constant or the product of a constant and a singlevariable (to the first power). The term linear comes from the word line. You will see in later chapters that linearequations define lines when graphed.
We will start with simple problems such as the one in the last example.
Solve an Equation Using Addition
When we write an algebraic equation, equality means that whatever we do to one side of the equation, we have todo to the other side. For example, to get from the second equation in the introduction back to the first equation, wewould add a quantity of 22 to both sides:
3.1. ONE-STEP EQUATIONS
www.ck12.org 149
x = 100−22
x+22 = 100−22+22 or x+22 = 100
Similarly, we can add numbers to each side of an equation to help solve for our unknown.
Example 1
Solve x−3 = 9
Solution
We need to isolate x . Change our equation so that x appears by itself on one side of the equals sign. Right now ourx has a 3 subtracted from it. To reverse this, we could add 3, but we must do this to both sides.
x−3 = 9
x−3+3 = 9+3 The +3 and −3 on the left cancel each other. We evaluate 9+3
x = 12
Example 2
Solve x−3 = 11
Solution
To isolate x we need to add 3 to both sides of the equation. This time we will add vertically.
x−3 = 11
+3 =+3
x = 14
Notice how this format works. One term will always cancel (in this case the three), but we need to remember tocarry the x down and evaluate the sum on the other side of the equals sign.
Example 3
Solve z−9.7 =−1.026
Solution
This time our variable is z , but don’t let that worry you. Treat this variable like any other variable.
z−9.7 =−1.026
+9.7 =+9.7
zb = 8.674
Make sure that you understand the addition of decimals in this example!
Solve an Equation Using Subtraction
When our variable appears with a number added to it, we follow the same process, only this time to isolate thevariable we subtract a number from both sides of the equation.
CHAPTER 3. EQUATIONS OF LINES
150 www.ck12.org
Example 4
Solve x+6 = 26
Solution
To isolate x we need to subtract six from both sides.
x+6 = 26
−6 =−6
x = 20
Example 5
Solve x+20 =−11
Solution
To isolate x we need to subtract 20 from both sides of the equation.
x+20 =−11
−20 =−20
x =−31
Example 6
Solve x+ 47 = 9
5
Solution
To isolate x we need to subtract 47 from both sides.
x+47=
95
−47=−4
7
x =95− 4
7
To solve for x , make sure you know how to subtract fractions. We need to find the lowest common denominator. 5and 7 are both prime. So we can multiply to find the LCD, LCD = 5 ·7 = 35 .
x =95− 4
7
x =7 ·935− 4 ·5
35
x =63−20
35
x =4335
Make sure you are comfortable with decimals and fractions! To master algebra, you will need to work with themfrequently.
3.1. ONE-STEP EQUATIONS
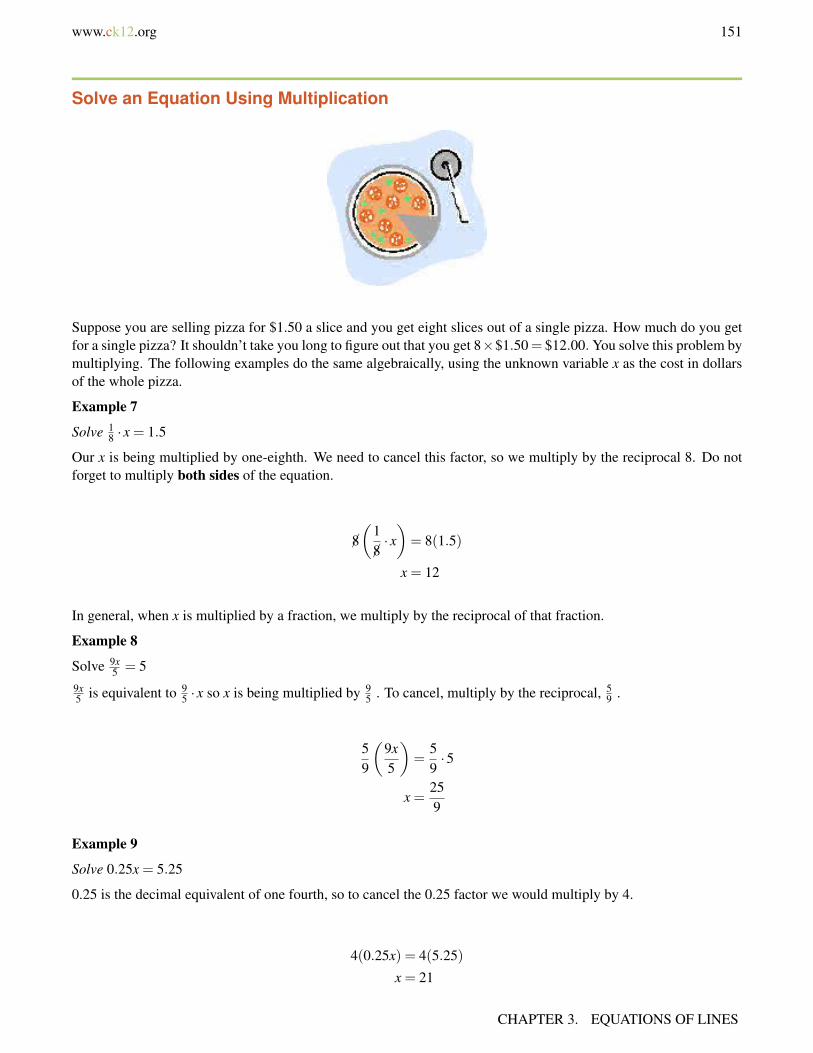
www.ck12.org 151
Solve an Equation Using Multiplication
Suppose you are selling pizza for $1.50 a slice and you get eight slices out of a single pizza. How much do you getfor a single pizza? It shouldn’t take you long to figure out that you get 8×$1.50= $12.00. You solve this problem bymultiplying. The following examples do the same algebraically, using the unknown variable x as the cost in dollarsof the whole pizza.
Example 7
Solve 18 · x = 1.5
Our x is being multiplied by one-eighth. We need to cancel this factor, so we multiply by the reciprocal 8. Do notforget to multiply both sides of the equation.
8(
18· x)= 8(1.5)
x = 12
In general, when x is multiplied by a fraction, we multiply by the reciprocal of that fraction.
Example 8
Solve 9x5 = 5
9x5 is equivalent to 9
5 · x so x is being multiplied by 95 . To cancel, multiply by the reciprocal, 5
9 .
59
(9x5
)=
59·5
x =259
Example 9
Solve 0.25x = 5.25
0.25 is the decimal equivalent of one fourth, so to cancel the 0.25 factor we would multiply by 4.
4(0.25x) = 4(5.25)
x = 21
CHAPTER 3. EQUATIONS OF LINES
152 www.ck12.org
Solve an Equation Using Division
Solving by division is another way to cancel any terms that are being multiplied x . Suppose you buy five identicalcandy bars, and you are charged $3.25. How much did each candy bar cost? You might just divide $3.25 by 5. Oryou may convert to cents and divide 325 by 5. Let’s see how this problem looks in algebra.
Example 10
Solve 5x = 3.25 To cancel the 5 we divide both sides by 5.
5x5
=3.25
5x = 0.65
Example 11
Solve 7x = 511 Divide both sides by 7.
x =5
7 ·11
x =577
Example 12
Solve 1.375x = 1.2 Divide by 1.375
x =1.2
1.375x = 0.872
Notice the bar above the final two decimals. It means recurring or repeating: the full answer is 0.872727272....
Multimedia Link To see more examples of one- and two-step equation solving, watch the video series starting athttp://www.youtube.com/watch?v=bAerID24QJ0
MEDIAClick image to the left for more content.
. The narrator in these videos uses informal terms and phrases to describe the process of solving equations, but theextra practice and seeing examples worked out may be helpful to reinforce procedural fluency.
Solve Real-World Problems Using Equations
Example 13
3.1. ONE-STEP EQUATIONS
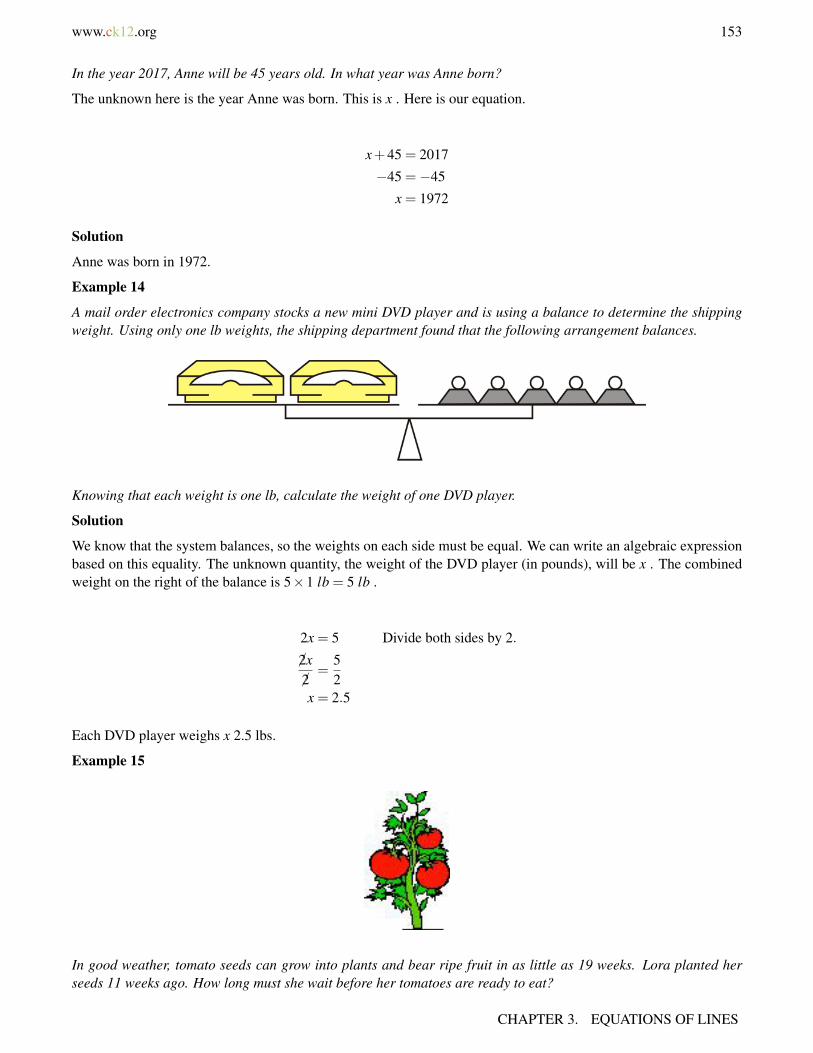
www.ck12.org 153
In the year 2017, Anne will be 45 years old. In what year was Anne born?
The unknown here is the year Anne was born. This is x . Here is our equation.
x+45 = 2017
−45 =−45
x = 1972
Solution
Anne was born in 1972.
Example 14
A mail order electronics company stocks a new mini DVD player and is using a balance to determine the shippingweight. Using only one lb weights, the shipping department found that the following arrangement balances.
Knowing that each weight is one lb, calculate the weight of one DVD player.
Solution
We know that the system balances, so the weights on each side must be equal. We can write an algebraic expressionbased on this equality. The unknown quantity, the weight of the DVD player (in pounds), will be x . The combinedweight on the right of the balance is 5×1 lb = 5 lb .
2x = 5 Divide both sides by 2.
2x2
=52
x = 2.5
Each DVD player weighs x 2.5 lbs.
Example 15
In good weather, tomato seeds can grow into plants and bear ripe fruit in as little as 19 weeks. Lora planted herseeds 11 weeks ago. How long must she wait before her tomatoes are ready to eat?
CHAPTER 3. EQUATIONS OF LINES
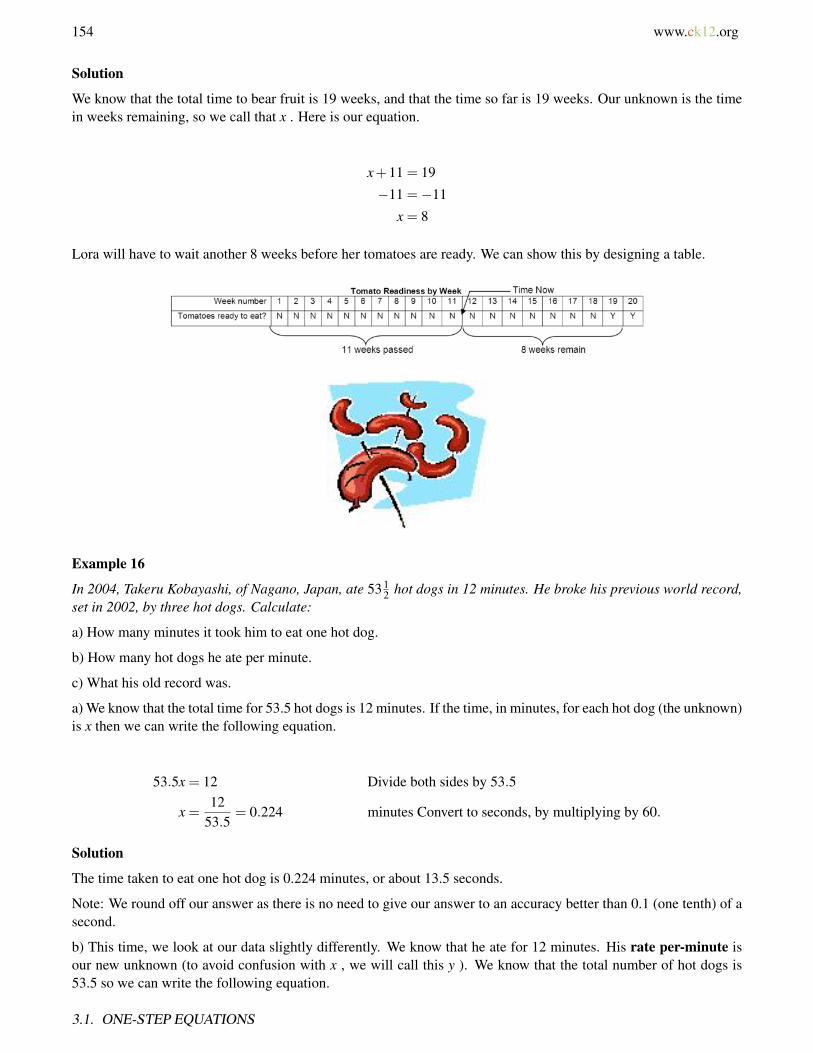
154 www.ck12.org
Solution
We know that the total time to bear fruit is 19 weeks, and that the time so far is 19 weeks. Our unknown is the timein weeks remaining, so we call that x . Here is our equation.
x+11 = 19
−11 =−11
x = 8
Lora will have to wait another 8 weeks before her tomatoes are ready. We can show this by designing a table.
Example 16
In 2004, Takeru Kobayashi, of Nagano, Japan, ate 53 12 hot dogs in 12 minutes. He broke his previous world record,
set in 2002, by three hot dogs. Calculate:
a) How many minutes it took him to eat one hot dog.
b) How many hot dogs he ate per minute.
c) What his old record was.
a) We know that the total time for 53.5 hot dogs is 12 minutes. If the time, in minutes, for each hot dog (the unknown)is x then we can write the following equation.
53.5x = 12 Divide both sides by 53.5
x =12
53.5= 0.224 minutes Convert to seconds, by multiplying by 60.
Solution
The time taken to eat one hot dog is 0.224 minutes, or about 13.5 seconds.
Note: We round off our answer as there is no need to give our answer to an accuracy better than 0.1 (one tenth) of asecond.
b) This time, we look at our data slightly differently. We know that he ate for 12 minutes. His rate per-minute isour new unknown (to avoid confusion with x , we will call this y ). We know that the total number of hot dogs is53.5 so we can write the following equation.
3.1. ONE-STEP EQUATIONS

www.ck12.org 155
12y = 53.5 Divide both sides by 12
y =53.512
= 4.458
Solution
Takeru Kobayashi ate approximately 4.5. hot dogs per minute.
c) We know that his new record is 53.5. and also that his new record is three more than his old record. We have anew unknown. We will call his old record z , and write the following equation.
x+3 = 53.5
−3 =−3
x = 50.5
Solution
Takeru Kobayashi’s old record was 50 12 hot dogs in 12 minutes.
Lesson Summary
• An equation in which each term is either a constant or a product of a constant and a single variable is a linearequation.
• Adding, subtracting, multiplying, or dividing both sides of an equation by the same value results in an equiv-alent equation.
• To solve an equation, isolate the unknown variable on one side of the equation by applying one or morearithmetic operations to both sides.
Review Questions
1. Solve the following equations for x .
a. x+11 = 7b. x−1.1 = 3.2c. 7x = 21d. 4x = 1e. 5x
12 = 23
f. x+ 52 = 2
3g. x− 5
6 = 38
h. 0.01x = 11
2. Solve the following equations for the unknown variable.
a. q−13 =−13b. z+1.1 = 3.0001c. 21s = 3d. t + 1
2 = 13
CHAPTER 3. EQUATIONS OF LINES
156 www.ck12.org
e. 7 f11 = 7
11f. 3
4 =−12 · y
g. 6r = 38
h. 9b16 = 3
8
3. Peter is collecting tokens on breakfast cereal packets in order to get a model boat. In eight weeks he has col-lected 10 tokens. He needs 25 tokens for the boat. Write an equation and determine the following information.
a. How many more tokens he needs to collect, n .b. How many tokens he collects per week, w .c. How many more weeks remain until he can send off for his boat, r .
4. Juan has baked a cake and wants to sell it in his bakery. He is going to cut it into 12 slices and sell themindividually. He wants to sell it for three times the cost of making it. The ingredients cost him $8.50, and heallowed $1.25 to cover the cost of electricity to bake it. Write equations that describe the following statements
a. The amount of money that he sells the cake for (u) .b. The amount of money he charges for each slice (c) .c. The total profit he makes on the cake (w) .
Review Answers
a. x =−4b. x = 4.3c. x = 3d. x = 0.25e. x = 1.6f. x =−11
6g. x = 29
24h. x = 1100
a. q = 0b. z = 1.9001c. s = 1
7d. t =−1
6e. f = 1f. y =−1.5g. r = 1
16h. b = 2
3
a. n+10 = 25,n = 15b. 8w = 10,w = 1.25c. r ·w = 15 or 1.25r = 15,r = 12
a. u = 3(8.5+1.25)b. 12v = uc. w = u− (8.5+1.25)
3.1. ONE-STEP EQUATIONS
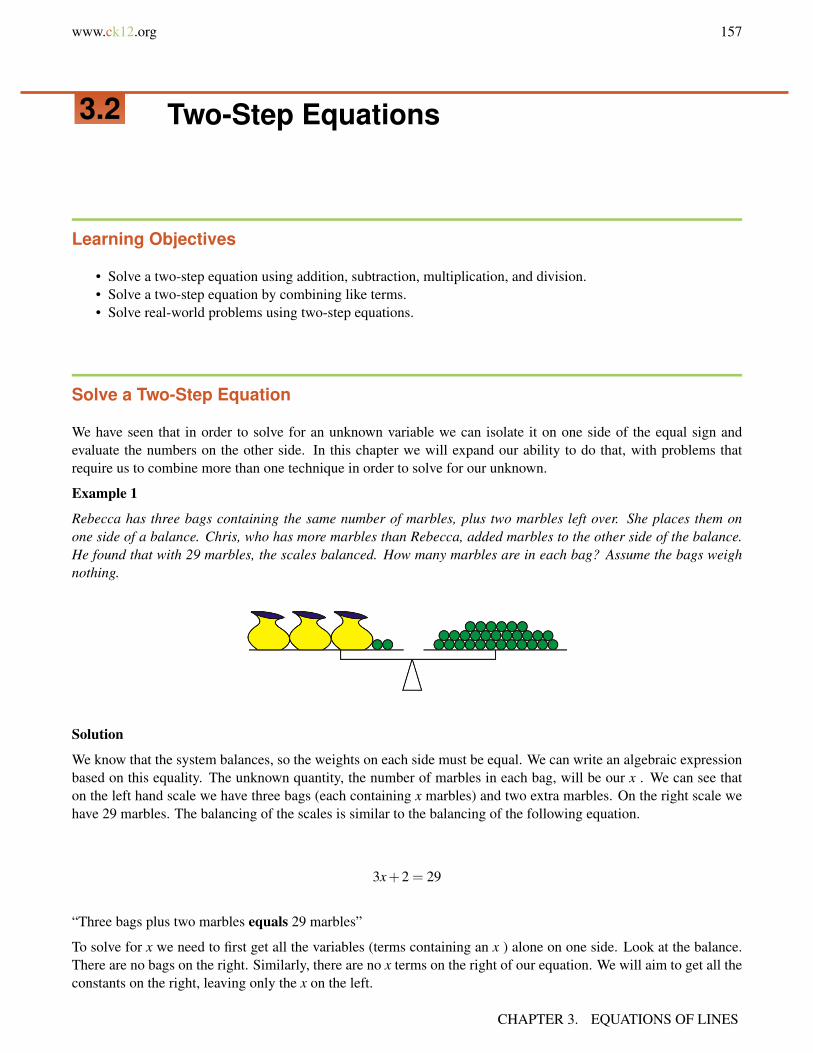
www.ck12.org 157
3.2 Two-Step Equations
Learning Objectives
• Solve a two-step equation using addition, subtraction, multiplication, and division.• Solve a two-step equation by combining like terms.• Solve real-world problems using two-step equations.
Solve a Two-Step Equation
We have seen that in order to solve for an unknown variable we can isolate it on one side of the equal sign andevaluate the numbers on the other side. In this chapter we will expand our ability to do that, with problems thatrequire us to combine more than one technique in order to solve for our unknown.
Example 1
Rebecca has three bags containing the same number of marbles, plus two marbles left over. She places them onone side of a balance. Chris, who has more marbles than Rebecca, added marbles to the other side of the balance.He found that with 29 marbles, the scales balanced. How many marbles are in each bag? Assume the bags weighnothing.
Solution
We know that the system balances, so the weights on each side must be equal. We can write an algebraic expressionbased on this equality. The unknown quantity, the number of marbles in each bag, will be our x . We can see thaton the left hand scale we have three bags (each containing x marbles) and two extra marbles. On the right scale wehave 29 marbles. The balancing of the scales is similar to the balancing of the following equation.
3x+2 = 29
“Three bags plus two marbles equals 29 marbles”
To solve for x we need to first get all the variables (terms containing an x ) alone on one side. Look at the balance.There are no bags on the right. Similarly, there are no x terms on the right of our equation. We will aim to get all theconstants on the right, leaving only the x on the left.
CHAPTER 3. EQUATIONS OF LINES
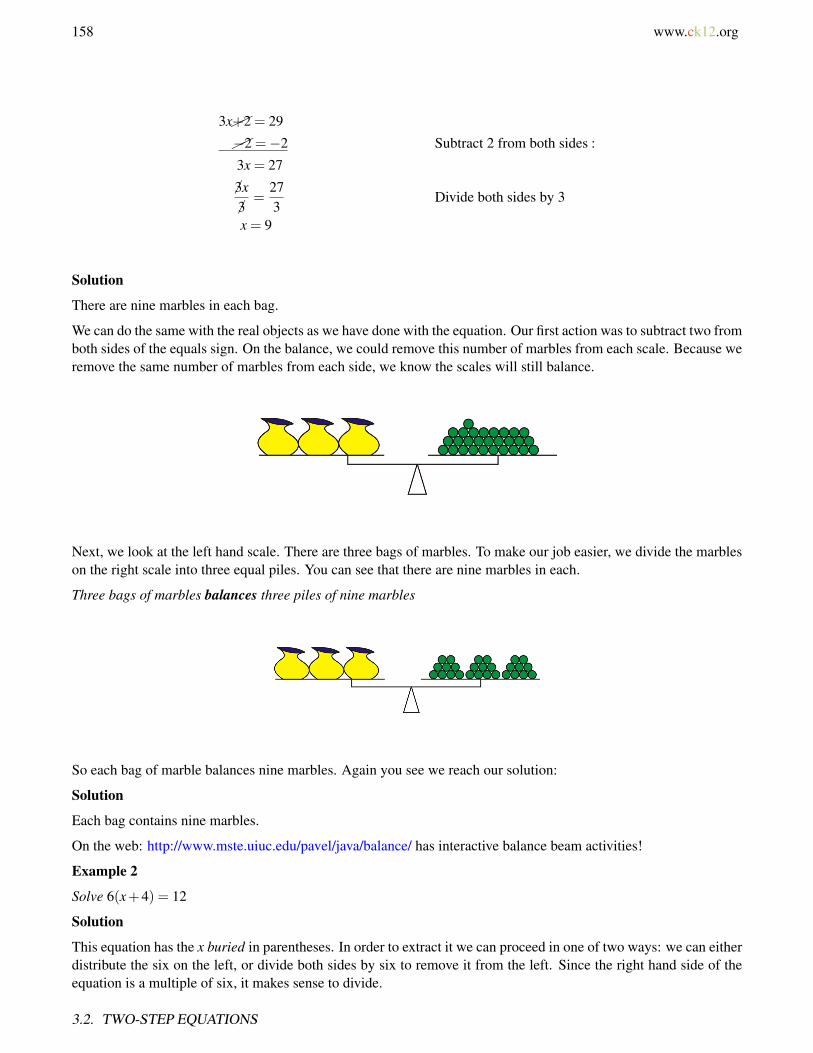
158 www.ck12.org
3x+2 = 29
−2 =−2 Subtract 2 from both sides :
3x = 27
3x
3=
273
Divide both sides by 3
x = 9
Solution
There are nine marbles in each bag.
We can do the same with the real objects as we have done with the equation. Our first action was to subtract two fromboth sides of the equals sign. On the balance, we could remove this number of marbles from each scale. Because weremove the same number of marbles from each side, we know the scales will still balance.
Next, we look at the left hand scale. There are three bags of marbles. To make our job easier, we divide the marbleson the right scale into three equal piles. You can see that there are nine marbles in each.
Three bags of marbles balances three piles of nine marbles
So each bag of marble balances nine marbles. Again you see we reach our solution:
Solution
Each bag contains nine marbles.
On the web: http://www.mste.uiuc.edu/pavel/java/balance/ has interactive balance beam activities!
Example 2
Solve 6(x+4) = 12
Solution
This equation has the x buried in parentheses. In order to extract it we can proceed in one of two ways: we can eitherdistribute the six on the left, or divide both sides by six to remove it from the left. Since the right hand side of theequation is a multiple of six, it makes sense to divide.
3.2. TWO-STEP EQUATIONS

www.ck12.org 159
6(x+4) = 12 Divide both sides by 6.
6(x+4)6
=126
x+4 = 2 Subtract 4 from both sides.
−4 −4
x =−2
Solution
x =−2
Example 3
Solve x−35 = 7
This equation has a fraction in it. It is always a good idea to get rid of fractions first.
(x− 3
5
)= 7
Solution:
5(
x−35
)= 5 ·7 Multiply both sides by 5
x−3 = 35
+3 =+3 Add 3 to both sides
x = 38
Solution
x = 38
Example 4
Solve 59(x+1) = 2
7
First, we will cancel the fraction on the left (making the coefficient equal to one) by multiplying by the reciprocal(the multiplicative inverse).
95· 59(x+1) =
95· 2
7
x+1 =1835
Subtract 1(
1 =3535
)from both sides.
x =1835− 35
35
x =18−35
35
Solution
x =−1735
These examples are called two-step equations, as we need to perform two separate operations to the equation toisolate the variable.
CHAPTER 3. EQUATIONS OF LINES
160 www.ck12.org
Solve a Two-Step Equation by Combining Like Terms
When we look at linear equations we predominantly see two terms, those that contain the unknown variable as afactor, and those that don’t. When we look at an equation that has an x on both sides, we know that in order tosolve, we need to get all the x− terms on one side of the equation. This is called combining like terms. They arelike terms because they contain the same variable (or, as you will see in later chapters, the same combination ofvariables).
Like Terms
• 17x,12x,−1.2x , and 17x9
• 3y,19y, and y99
• xy,6xy , and 0.0001xy
Unlike Terms
• 3x and 2y• 12xy and 2x• 0.001x and 0.001
To add or subtract like terms, we can use the Distributive Property of Multiplication instead of addition and subtrac-tion.
3x+4x = (3+4)x = 7x
0.03xy−0.01xy = (0.03−0.01)xy = 0.02xy
−y+16y−5y = (−1+16−5)y = 10y
5z+2z−7z = (5+2−7)z = 0z = 0
To solve an equation with two or more like terms we need to combine them before we can solve for the variable.
Example 5
Solve (x+5)− (2x−3) = 6
There are two like terms. The x and the −2x (do not forget that the negativesign multiplies everything in theparentheses).
Collecting like terms means we write all the terms with matching variables together. We will then add, or subtractthem individually. We pull out the x from the first bracket and the−2x from the second. We then rewrite the equationcollecting the like terms.
(x−2x)+(5− (−3)) = 6 Combine like terms and constants.
− x+8 = 6
−8 =−8 Subtract 8 from both sides
− x =−2 Mutliply both sides by −1 to get the variable by itself
Solution
x = 2
3.2. TWO-STEP EQUATIONS
www.ck12.org 161
Example 6
Solve x2 −
x3 = 6
Solution
This problem involves fractions. Combining the variable terms will require dealing with fractions. We need to writeall the terms on the left over a common denominator of six.
3x6− 2x
6= 6 Next we combine the fractions.
x6= 6 Multiply both sides by 6.
x = 36
Solve Real-World Problems Using Two-Step Equations
When we are faced with real world problems the thing that gives people the most difficulty is going from a problemin words to an equation. First, look to see what the equation is asking. What is the unknown for which you have tosolve? That will determine the quantity we will use for our variable. The text explains what is happening. Breakit down into small, manageable chunks. Then, follow what is going on with our variable all the way through theproblem.
Example 7
An emergency plumber charges $65 as a call-out fee plus an additional $75 per hour per hour. He arrives at a houseat 9:30 and works to repair a water tank. If the total repair bill is $196.25, at what time was the repair completed?
In order to solve this problem, we collect the information from the text and convert it to an equation.
Unknown time taken in hours – this will be our x
The bill is made up of two parts: a call out fee and a per-hour fee. The call out is a flat fee, and independent of x .The per-hour part depends on x . Lets look at how this works algebraically.
$65 as a call-out fee 65
Plus an additional $75 per hour +75x
So the bill, made up from the call out fee plus the per hour charge times the hours taken creates the followingequation.
Total Bill = 65+75x
CHAPTER 3. EQUATIONS OF LINES

162 www.ck12.org
Lastly, we look at the final piece of information. The total on the bill was $196.25. So our final equation is:
196.25 = 65+75x
We solve for x :
196.25 =65+75x
−65 =−65 To isolate x first subtract 65 from both sides :
131.25 = 75x Divide both sides by 75131.25
75= x = 1.75 The time taken was one and three quarter hours.
Solution
The repair job was completed at 11:15 AM.
Example 8
When Asia was young her Daddy marked her height on the door frame every month. Asia’s Daddy noticed thatbetween the ages of one and three, he could predict her height (in inches) by taking her age in months, adding 75inches and multiplying the result by one-third. Use this information to determine the following
a) Write an equation linking her predicted height, h , with her age in months, m .
b) Determine her predicted height on her second birthday.
c) Determine at what age she is predicted to reach three feet tall.
a) To convert the text to an equation, first determine the type of equation we have. We are going to have an equationthat links two variables. Our unknown will change, depending on the information we are given. For example, wecould solve for height given age, or solve for age given height. However, the text gives us a way to determine height.Our equation will start with “ h = ”.
Next we look at the text.
(m+75) Take her age in months, and add 75.13(m+75) Multiply the result by one-third.
Solution
Our full equation is h = 13(m+75) .
b) To determine the prediction of Asia’s height on her second birthday, we substitute m = 24 (2 years = 24 months)into our equation and solve for h .
h =13(24+75) Combine terms in parentheses.
h =13(99) Multiply.
h = 33
Solution
3.2. TWO-STEP EQUATIONS
www.ck12.org 163
Asia’s height on her second birthday was predicted to be 33 inches.
c) To determine the predicted age when she reached three feet, substitute h = 36 into the equation and solve for m .
36 =13(m+75) Multiply both sides by 3.
108 = m+75 Subtract 75 from both sides.
33 = m
Solution
Asia was predicted to be 33 months old when her height was three feet.
Example 9
To convert temperatures in Fahrenheit to temperatures in Celsius follow the following steps: Take the temperaturein Fahrenheit and subtract 32. Then divide the result by 1.8 and this gives temperature in degrees Celsius.
a) Write an equation that shows the conversion process.
b) Convert 50 degrees Fahrenheit to degrees Celsius.
c) Convert 25 degrees Celsius to degrees Fahrenheit.
d) Convert -40 degrees Celsius to degrees Fahrenheit.
a) The text gives the process to convert Fahrenheit to Celsius. We can write an equation using two variables. Wewill use f for temperature in Fahrenheit, and c for temperature in Celsius. Follow the text to see it work.
(F−32) Take the temperature in Fahrenheit and subtract 32.F−32
1.8Then divide the result by 1.8.
C =F−32
1.8This gives temperature in degrees Celsius.
In order to convert from one temperature scale to another, simply substitute in for the known temperature and solvefor the unknown.
b) To convert 50 degrees Fahrenheit to degrees Celsius substitute F = 50 into the equation.
C =50−32
1.8Evaluate numerator.
C =181.8
Perform division operation.
Solution
CHAPTER 3. EQUATIONS OF LINES

164 www.ck12.org
C = 10 , so 50 degrees Fahrenheit is equal to 10 degrees Celsius.
c) To convert 25 degrees Celsius to degrees Fahrenheit substitute C = 25 into the equation:
25 =F−32
1.8Multiply both sides by 1.8
45 = F−32
+32 = + 32 Add 32 to both sides.
77 = F
Solution
25 degrees Celsius is equal to 77 degrees Fahrenheit.
d) To convert -40 degrees Celsius to degrees Fahrenheit substitute C =−40 into the equation.
−40 =F−32
1.8Multiply both sides by 1.8.
−72 = F−32
+32 = + 32 Add 32 to both sides.
−40 = F
Solution
-40 degrees Celsius is equal to -40 degrees Fahrenheit.
Lesson Summary
• Some equations require more than one operation to solve. Generally it, is good to go from the outside in. Ifthere are parentheses around an expression with a variable in it, cancel what is outside the parentheses first.
• Terms with the same variable in them (or no variable in them) are like terms. Combine like terms (addingor subtracting them from each other) to simplify the expression and solve for the unknown.
Review Questions
1. Solve the following equations for the unknown variable.
a. 1.3x−0.7x = 12b. 6x−1.3 = 3.2c. 5x− (3x+2) = 1d. 4(x+3) = 1e. 5q−7 = 2
3f. 3
5 x+ 52 = 2
3g. s− 3s
8 = 56
h. 0.1y+11 = 0i. 5q−7
12 = 23
j. 5(q−7)12 = 2
3
3.2. TWO-STEP EQUATIONS

www.ck12.org 165
k. 33t−99 = 0l. 5p−2 = 32
2. Jade is stranded downtown with only $10 to get home. Taxis cost $0.75 per mile, but there is an additional$2.35 hire charge. Write a formula and use it to calculate how many miles she can travel with her money.Determine how many miles she can ride.
3. Jasmin’s Dad is planning a surprise birthday party for her. He will hire a bouncy castle, and will provide partyfood for all the guests. The bouncy castle costs $150 dollars for the afternoon, and the food will cost $3.00 perperson. Andrew, Jasmin’s Dad, has a budget of $300. Write an equation to help him determine the maximumnumber of guests he can invite.
Review Answers
1. a. x = 20b. x = 0.75c. x = 1.5d. x =−2.75e. q = 23
15f. x =−55
18g. s = 4
3h. y =−110i. q = 3j. q = 43
5k. t = 3l. p = 34
52. 0.75x+2.35 = 10;x = 10.2 miles3. 3x+150 = 300;x = 50 guests
CHAPTER 3. EQUATIONS OF LINES
166 www.ck12.org
3.3 Multi-Step Equations
Learning Objectives
• Solve a multi-step equation by combining like terms.• Solve a multi-step equation using the distributive property.• Solve real-world problems using multi-step equations.
Solving Multi-Step Equations by Combining Like Terms
We have seen that when we solve for an unknown variable, it can be a simple matter of moving terms around in oneor two steps. We can now look at solving equations that take several steps to isolate the unknown variable. Suchequations are referred to as multi-step equations.
In this section, we will simply be combining the steps we already know how to do. Our goal is to end up with all theconstants on one side of the equation and all of the variables on the other side. We will do this by collecting “liketerms”. Don’t forget, like terms have the same combination of variables in them.
Example 1
Solve 3x+43 −5x = 6
This problem involves a fraction. Before we can combine the variable terms we need to deal with it. Let’s put all theterms on the left over a common denominator of three.
3x+43− 15x
3= 6 Next we combine the fractions.
3x+4−15x3
= 6 Combine like terms.
4−12x3
= 6 Multiply both sides by 3.
4−12x = 18 Subtract 4 from both sides.
−4 −4
−12x = 14 Divide both sides by −12−12−12
x =−1412
Solution
x =−76
3.3. MULTI-STEP EQUATIONS

www.ck12.org 167
Solving Multi-Step Equations Using the Distributive Property
You have seen in some of the examples that we can choose to divide out a constant or distribute it. The choice comesdown to whether on not we would get a fraction as a result. We are trying to simplify the expression. If we candivide out large numbers without getting a fraction, then we avoid large coefficients. Most of the time, however, wewill have to distribute and then collect like terms.
Example 2
Solve 17(3x+4) = 7
This equation has the x buried in parentheses. In order to extract it we can proceed in one of two ways. We caneither distribute the seventeen on the left, or divide both sides by seventeen to remove it from the left. If we divideby seventeen, however, we will end up with a fraction. We wish to avoid fractions if possible!
17(3x+4) = 7 Distribute the 17.
51x+68 = 7
−68 −68 Subtract 68 from both sides.
51x =−61 Divide by 51.
Solution
x =−6151
Example 3
Solve 4(3x−4)−7(2x+3) = 3
This time we will need to collect like terms, but they are hidden inside the brackets. We start by expanding theparentheses.
12x−16−14x−21 = 3 Collect the like terms (12x and −14x).
(12x−14x)+(−16−21) = 3 Evaluate each set of like terms.
−2x−37 = 3
+37 +37 Add 37 to both sides.
−2x = 40−2x−2
=40−2
Divide both sides by −2.
Solution
x =−20
Example 4
Solve the following equation for x .
0.1(3.2+2x)+12
(3− x
5
)= 0
This function contains both fractions and decimals. We should convert all terms to one or the other. It is often easierto convert decimals to fractions, but the fractions in this equation are easily moved to decimal form. Decimals donot require a common denominator!
CHAPTER 3. EQUATIONS OF LINES

168 www.ck12.org
Rewrite in decimal form.
0.1(3.2+2x)+0.5(3−0.2x) = 0 Multiply out decimals:
0.32+0.2x+1.5−0.1x = 0 Collect like terms:
(0.2x−0.1x)+(0.32+1.5) = 0 Evaluate each collection:
0.1x+1.82 = 0 Subtract 1.82 from both sides
−1.82 −1.82
0.1x =−1.82 Divide by −0.10.1x0.1
=−1.82
0.1
Solution
x = 18.2
Solve Real-World Problems Using Multi-Step Equations
Real-world problems require you to translate from a problem in words to an equation. First, look to see what theequation is asking. What is the unknown you have to solve for? That will determine the quantity we will use forour variable. The text explains what is happening. Break it down into small, manageable chunks, and follow whatis going on with our variable all the way through the problem.
Example 5
A grower’s cooperative has a farmer’s market in the town center every Saturday. They sell what they have grownand split the money into several categories. 8.5% of all the money taken is removed for sales tax. $150 is removedto pay the rent on the space they occupy. What remains is split evenly between the seven growers. How much moneyis taken in total if each grower receives a $175 share?
Let us translate the text above into an equation. The unknown is going to be the total money taken in dollars. Wewill call this x .
“8.5% of all the money taken is removed for sales tax”. This means that 91.5% of the money remains. This is 0.915x.
(0.915x−150)
“$150 is removed to pay the rent on the space they occupy”
0.915x−1507
“What remains is split evenly between the 7 growers”
If each grower’s share is $175, then we can write the following equation.
3.3. MULTI-STEP EQUATIONS

www.ck12.org 169
0.915x−1507
= 175 Multiply by both sides 7.
0.915x−150 = 1225 Add 150 to both sides.
0.915x = 1375 Divide by 0.915.0.915x0.915
=13730.915
= 1502.7322 . . . Round to two decimal places.
Solution
If the growers are each to receive a $175 share then they must take at least $1,502.73.
Example 6
A factory manager is packing engine components into wooden crates to be shipped on a small truck. The truck isdesigned to hold sixteen crates, and will safely carry a 1200 lb cargo. Each crate weighs twelve lbs empty. Howmuch weight should the manager instruct the workers to put in each crate in order to get the shipment weight asclose as possible to 1200 lbs?
The unknown quantity is the weight to put in each box. This is x . Each crate, when full will weigh:
(x+12) 16 crates must weigh.
16(x+12) And this must equal 16 lbs.
16(x+12) = 1200 Isolate x first, divide both sides by 16.
x+12 = 75 Next subtract 12 from both sides.
x = 63
Solution
The manager should tell the workers to put 63 lbs of components in each crate.
Ohm’s Law
The electrical current, I (amps), passing through an electronic component varies directly with the applied voltage, V(volts), according to the relationship:
V = I ·R where R is the resistance (measured in Ohms - Ω )
CHAPTER 3. EQUATIONS OF LINES
170 www.ck12.org
Example 7
A scientist is trying to deduce the resistance of an unknown component. He labels the resistance of the unknowncomponent xΩ . The resistance of a circuit containing a number of these components is (5x+ 20)Ω . If a 120volt potential difference across the circuit produces a current of 2.5 amps, calculate the resistance of the unknowncomponent.
Substitute V = 120, I = 2.5 and R = 5x+20 into V = I ·R :
120 = 2.5(5x+20) Distribute the 2.5.
120 = 12.5x+50 Subtract 50 from both sides.
−50 −50
70 = 12.5x Divide both sides by 12.5.70
12.5=
12.5x12.5
5.6Ω = x
Solution
The unknown components have a resistance of 5.6Ω .
Distance, Speed and Time
The speed of a body is the distance it travels per unit of time. We can determine how far an object moves in a certainamount of time by multiplying the speed by the time. Here is our equation.
distance = speed× time
Example 8
Shanice’s car is traveling 10 miles per hour slower than twice the speed of Brandon’s car. She covers 93 miles in 1hour 30 minutes. How fast is Brandon driving?
Here we have two unknowns in this problem. Shanice’s speed and Brandon’s speed. We do know that Shanice’sspeed is ten less than twice Brandon’s speed. Since the question is asking for Brandon’s speed, it is his speed inmiles per hour that will be x .
Substituting into the distance time equation yields:
3.3. MULTI-STEP EQUATIONS
www.ck12.org 171
93 = 2x−10×1.5 Divide by 1.5.
62 = 2x−10
+10 +10 Add 10 to both sides.
72 = 2x722
=2x2
Divide both sides by 2.
36 = x
Solution
Peter is driving at 36 miles per hour.
This example may be checked by considering the situation another way: We can use the fact that Shanice’s covers93 miles in 1 hour 30 minutes to determine her speed (we will call this y as x has already been defined as Brandon’sspeed):
93 = y ·1.5931.5
=1.5y1.5
Divide both sides by 1.5.
y = 62 mph
We can then use this information to determine Shanice’s speed by converting the text to an equation.
“Shanice’s car is traveling at 10 miles per hour slower than twice the speed of Peter’s car”
Translates to
y = 2x−10
It is then a simple matter to substitute in our value in for y and then solve for x :
62 = (2x−10)
+10 +10 Add 10 to both sides.
72 = 2x
72 = 2x Divide both sides by 2.722
=2x2
x = 36 miles per hour.
Solution
Brandon is driving at 36 miles per hour.
You can see that we arrive at exactly the same answer whichever way we solve the problem. In algebra, there isalmost always more than one method of solving a problem. If time allows, it is an excellent idea to try to solve theproblem using two different methods and thus confirm that you have calculated the answer correctly.
Speed of Sound
CHAPTER 3. EQUATIONS OF LINES
172 www.ck12.org
The speed of sound in dry air, v , is given by the following equation.
v = 331+0.6T where T is the temperature in Celsius and v is the speed of sound in meters per second.
Example 9
Tashi hits a drainpipe with a hammer and 250 meters away Minh hears the sound and hits his own drainpipe.Unfortunately, there is a one second delay between him hearing the sound and hitting his own pipe. Tashi accuratelymeasures the time from her hitting the pipe and hearing Mihn’s pipe at 2.46 seconds. What is the temperature of theair?
This complex problem must be carefully translated into equations:
Distance traveled = (331+0.6T )× time
time = (2.46−1) Do not forget, for one second the sound is not traveling
Distance = 2×250
Our equation is:
2(250) = (331+0.6T ) · (2.46−1) Simplify terms.5001.46
=1.46(331+0.6T )
1.46Divide by 1.46.
342.47−331 = 331+0.6T −331 Subtract 331 from both sides.11.47
0.6=
0.6T0.6
Divide by 0.6.
19.1 = T
Solution
The temperature is 19.1 degrees Celsius.
Lesson Summary
• If dividing a number outside of parentheses will produce fractions, it is often better to use the DistributiveProperty (for example, 3(x+ 2) = 3x+ 6 ) to expand the terms and then combine like terms to solve theequation.
Review Questions
1. Solve the following equations for the unknown variable.
a. 3(x−1)−2(x+3) = 0b. 7(w+20)−w = 5c. 9(x−2) = 3x+3d. 2
(5a− 1
3
)= 2
7e. 2
9
(i+ 2
3
)= 2
5f. 4
(v+ 1
4
)= 35
2
3.3. MULTI-STEP EQUATIONS
www.ck12.org 173
g. s−411 = 2
5h. p
16 −2p3 = 1
9
2. An engineer is building a suspended platform to raise bags of cement. The platform has a mass of 200 kg, andeach bag of cement is 40 kg. He is using two steel cables, each capable of holding 250 kg. Write an equationfor the number of bags he can put on the platform at once, and solve it.
3. A scientist is testing a number of identical components of unknown resistance which he labels xΩ . Heconnects a circuit with resistance (3x+ 4)Ω to a steady 12 Volt supply and finds that this produces a currentof 1.2 Amps. What is the value of the unknown resistance?
4. Lydia inherited a sum of money. She split it into five equal chunks. She invested three parts of the money ina high interest bank account which added 10% to the value. She placed the rest of her inheritance plus $500in the stock market but lost 20% on that money. If the two accounts end up with exactly the same amount ofmoney in them, how much did she inherit?
5. Pang drove to his mother’s house to drop off her new TV. He drove at 50 miles per hour there and back, andspent 10 minutes dropping off the TV. The entire journey took him 94 minutes. How far away does his motherlive?
Review Answers
1. (a) x = 9 (b) w =−22.5 (c) x = 3.5 (d) a = 221 (e) i = 17
15 (f) v = 338 (g) s = 42
5 (h) p =−1687
2. 2(250) = 200+40x;x = 7.5→ 7 bags3. 2Ω
4. $1, 176.505. 35 miles
CHAPTER 3. EQUATIONS OF LINES

174 www.ck12.org
3.4 Equations with Variables on Both Sides
Learning Objectives
• Solve an equation with variables on both sides.• Solve an equation with grouping symbols.• Solve real-world problems using equations with variables on both sides.
Solve an Equation with Variables on Both Sides
When the variable appears on both sides of the equation, we need to manipulate our equation such that all variablesappear on one side, and only constants remain on the other.
Example 1
Dwayne was told by his chemistry teacher to measure the weight of an empty beaker using a balance. Dwayne foundonly one lb weights, and so devised the following way of balancing the scales.
Knowing that each weight is one lb, calculate the weight of one beaker.
Solution
We know that the system balances, so the weights on each side must be equal. We can write an algebraic expressionbased on this fact. The unknown quantity, the weight of the beaker, will be our x . We can see that on the lefthand scale we have one beaker and four weights. On the right scale, we have four beakers and three weights. Thebalancing of the scales is analogous to the balancing of the following equation.
x+4 = 4x+3
“One beaker plus 4 lbs equals 4 beakers plus 3 lbs”
To solve for the weight of the beaker, we want all the constants (numbers) on one side and all the variables (termswith x in) on the other side. Look at the balance. There are more beakers on the right and more weights on the left.We will aim to end up with only x terms (beakers) on the right, and only constants (weights) on the left.
3.4. EQUATIONS WITH VARIABLES ON BOTH SIDES
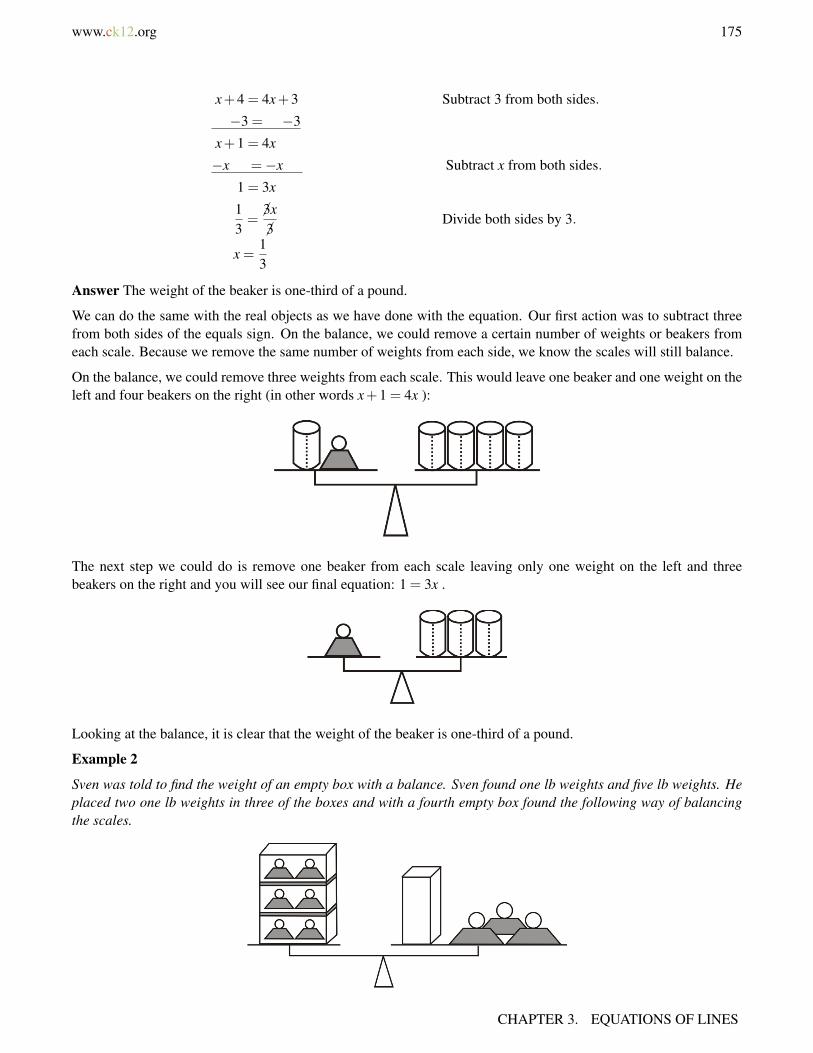
www.ck12.org 175
x+4 = 4x+3 Subtract 3 from both sides.
−3 = −3
x+1 = 4x
−x =−x Subtract x from both sides.
1 = 3x
13=3x
3Divide both sides by 3.
x =13
Answer The weight of the beaker is one-third of a pound.
We can do the same with the real objects as we have done with the equation. Our first action was to subtract threefrom both sides of the equals sign. On the balance, we could remove a certain number of weights or beakers fromeach scale. Because we remove the same number of weights from each side, we know the scales will still balance.
On the balance, we could remove three weights from each scale. This would leave one beaker and one weight on theleft and four beakers on the right (in other words x+1 = 4x ):
The next step we could do is remove one beaker from each scale leaving only one weight on the left and threebeakers on the right and you will see our final equation: 1 = 3x .
Looking at the balance, it is clear that the weight of the beaker is one-third of a pound.
Example 2
Sven was told to find the weight of an empty box with a balance. Sven found one lb weights and five lb weights. Heplaced two one lb weights in three of the boxes and with a fourth empty box found the following way of balancingthe scales.
CHAPTER 3. EQUATIONS OF LINES
176 www.ck12.org
Knowing that small weights are one lb and big weights are five lbs, calculate the weight of one box.
We know that the system balances, so the weights on each side must be equal. We can write an algebraic expressionbased on this equality. The unknown quantity, the weight of each empty box, in pounds, will be our x . A box withtwo 1 lb weights in it weighs (x+2) . Here is the equation.
3(x+2) = x+3(5) Distribute the 3.
3x+6 = x+15
−x =−x Subtract x from both sides.
2x+6 = 15
−6 =−6 Subtract 6 from both sides.
2x = 9 Divide both sides by 2.
x = 4.5
Solution
Each box weighs 4.5 lbs.
Multimedia Link To see more examples of solving equations with variables on both sides of the equation, see http://www.youtube.com/watch?v=Zn-GbH2S0Dk
MEDIAClick image to the left for more content.
. This video has several more examples of solving equations and may help you practice the procedure of solvinglinear equations with variables on both sides of the equation.
Solve an Equation with Grouping Symbols
When we have a number of like terms on one side of the equal sign we collect like terms then add them in orderto solve for our variable. When we move variables from one side of the equation to the other we sometimes call itgrouping symbols. Essentially we are doing exactly what we would do with the constants. We can add and subtractvariable terms just as we would with numbers. In fractions, occasionally we will have to multiply and divide byvariables in order to get them all on the numerator.
Example 3
Solve 3x+4 = 5x
Solution
This equation has x on both sides. However, there is only a number term on the left. We will therefore move all thex terms to the right of the equal sign leaving the constant on the left.
3.4. EQUATIONS WITH VARIABLES ON BOTH SIDES
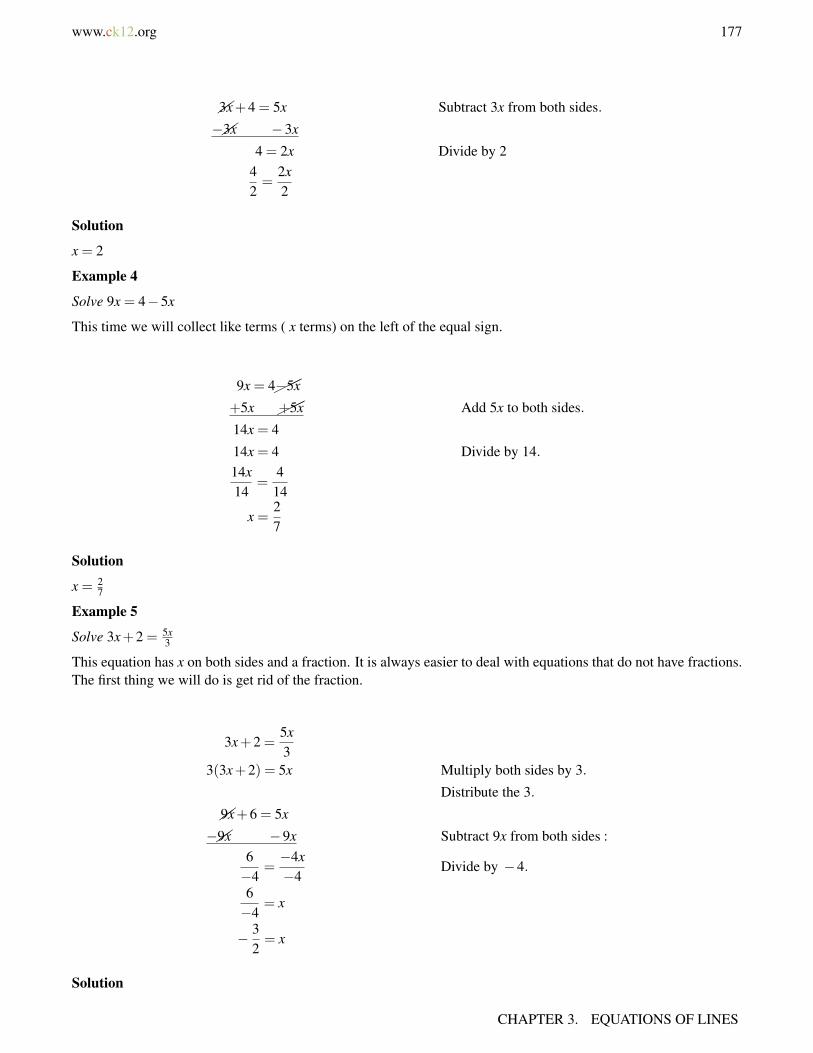
www.ck12.org 177
3x+4 = 5x Subtract 3x from both sides.
−3x −3x
4 = 2x Divide by 242=
2x2
Solution
x = 2
Example 4
Solve 9x = 4−5x
This time we will collect like terms ( x terms) on the left of the equal sign.
9x = 4−5x
+5x +5x Add 5x to both sides.
14x = 4
14x = 4 Divide by 14.14x14
=414
x =27
Solution
x = 27
Example 5
Solve 3x+2 = 5x3
This equation has x on both sides and a fraction. It is always easier to deal with equations that do not have fractions.The first thing we will do is get rid of the fraction.
3x+2 =5x3
3(3x+2) = 5x Multiply both sides by 3.
Distribute the 3.
9x+6 = 5x
−9x −9x Subtract 9x from both sides :6−4
=−4x−4
Divide by −4.
6−4
= x
− 32= x
Solution
CHAPTER 3. EQUATIONS OF LINES
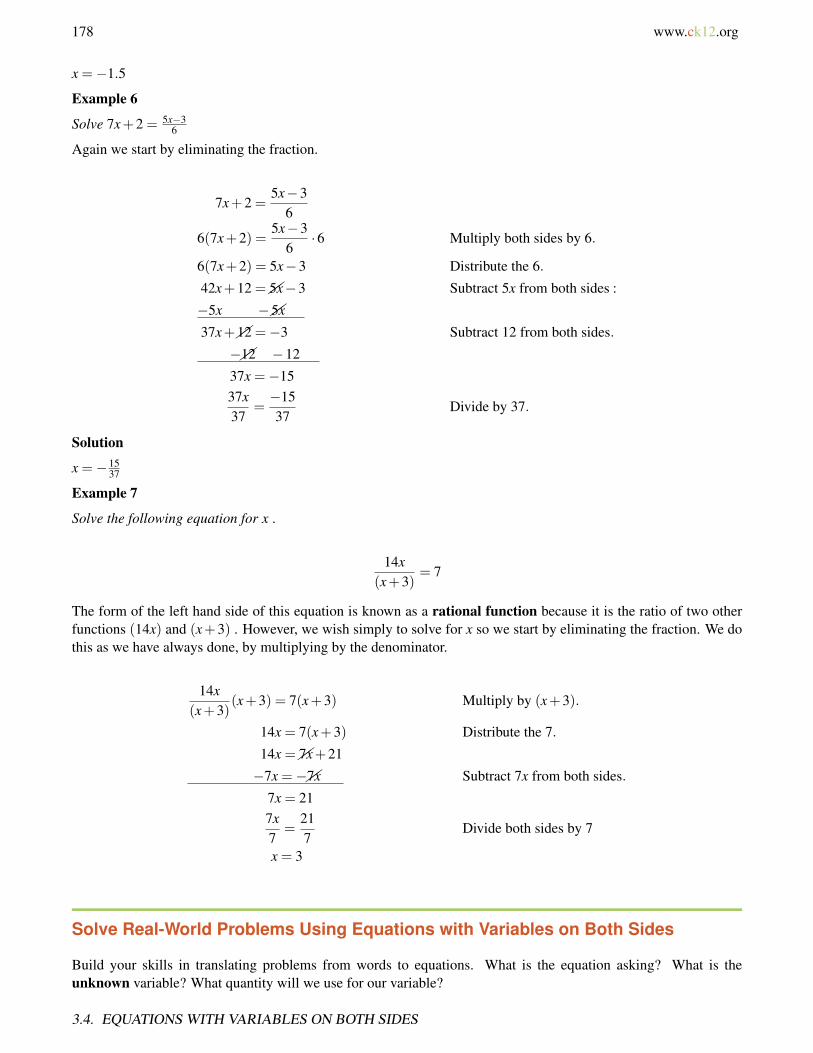
178 www.ck12.org
x =−1.5
Example 6
Solve 7x+2 = 5x−36
Again we start by eliminating the fraction.
7x+2 =5x−3
6
6(7x+2) =5x−3
6·6 Multiply both sides by 6.
6(7x+2) = 5x−3 Distribute the 6.
42x+12 =5x−3 Subtract 5x from both sides :
−5x −5x
37x+12 =−3 Subtract 12 from both sides.
−12 −12
37x =−1537x37
=−1537
Divide by 37.
Solution
x =−1537
Example 7
Solve the following equation for x .
14x(x+3)
= 7
The form of the left hand side of this equation is known as a rational function because it is the ratio of two otherfunctions (14x) and (x+3) . However, we wish simply to solve for x so we start by eliminating the fraction. We dothis as we have always done, by multiplying by the denominator.
14x(x+3)
(x+3) = 7(x+3) Multiply by (x+3).
14x = 7(x+3) Distribute the 7.
14x =7x+21
−7x =−7x Subtract 7x from both sides.
7x = 217x7
=217
Divide both sides by 7
x = 3
Solve Real-World Problems Using Equations with Variables on Both Sides
Build your skills in translating problems from words to equations. What is the equation asking? What is theunknown variable? What quantity will we use for our variable?
3.4. EQUATIONS WITH VARIABLES ON BOTH SIDES

www.ck12.org 179
The text explains what is happening. Break it down into small, manageable chunks, and follow what is going onwith our variable all the way through the problem.
More on Ohm’s Law
The electrical current, I (amps), passing through an electronic component varies directly with the applied voltage, V(volts), according to the relationship:
V = I ·R where R is the resistance (measured in Ohms)
The resistance R of a number of components wired in a series (one after the other) is given by: R = r1 + r2 + r3 +r4 + . . .
Example 8
In an attempt to find the resistance of a new component, a scientist tests it in series with standard resistors. A fixedvoltage causes a 4.8 amp current in a circuit made up from the new component plus a 15Ω resistor in series. Whenthe component is placed in a series circuit with a 50Ω resistor the same voltage causes a 2.0 amp current to flow.Calculate the resistance of the new component.
This is a complex problem to translate, but once we convert the information into equations it is relatively straightforward to solve. Firstly we are trying to find the resistance of the new component (in Ohms, Ω ). This is our x . Wedo not know the voltage that is being used, but we can leave that as simple V . Our first situation has the unknownresistance plus 15Ω . The current is 4.8 amps. Substitute into the formula V = I ·R .
V = 4.8(x+15)
Our second situation has the unknown resistance plus 50Ω . The current is 2.0 amps.
V = 2(x+50)
We know the voltage is fixed, so the V in the first equation must equal the V in the second. This means that:
CHAPTER 3. EQUATIONS OF LINES
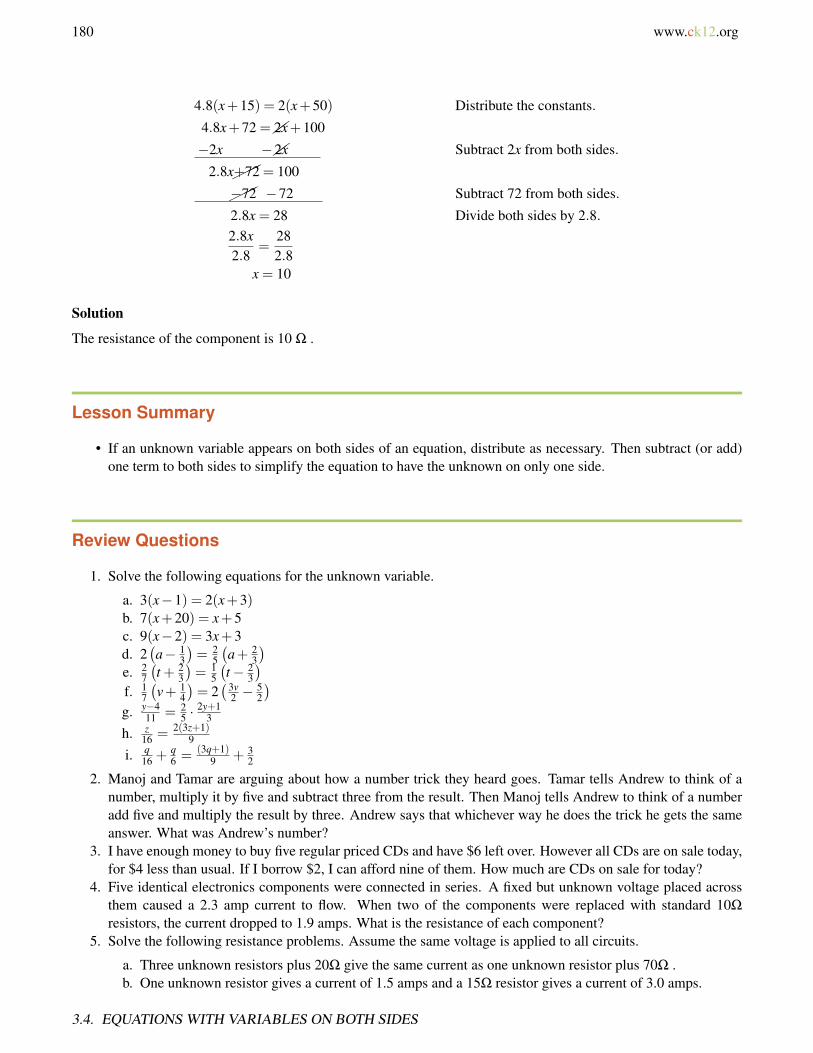
180 www.ck12.org
4.8(x+15) = 2(x+50) Distribute the constants.
4.8x+72 =2x+100
−2x −2x Subtract 2x from both sides.
2.8x+72 = 100
−72 −72 Subtract 72 from both sides.
2.8x = 28 Divide both sides by 2.8.2.8x2.8
=282.8
x = 10
Solution
The resistance of the component is 10 Ω .
Lesson Summary
• If an unknown variable appears on both sides of an equation, distribute as necessary. Then subtract (or add)one term to both sides to simplify the equation to have the unknown on only one side.
Review Questions
1. Solve the following equations for the unknown variable.
a. 3(x−1) = 2(x+3)b. 7(x+20) = x+5c. 9(x−2) = 3x+3d. 2
(a− 1
3
)= 2
5
(a+ 2
3
)e. 2
7
(t + 2
3
)= 1
5
(t− 2
3
)f. 1
7
(v+ 1
4
)= 2
(3v2 −
52
)g. y−4
11 = 25 ·
2y+13
h. z16 = 2(3z+1)
9
i. q16 +
q6 = (3q+1)
9 + 32
2. Manoj and Tamar are arguing about how a number trick they heard goes. Tamar tells Andrew to think of anumber, multiply it by five and subtract three from the result. Then Manoj tells Andrew to think of a numberadd five and multiply the result by three. Andrew says that whichever way he does the trick he gets the sameanswer. What was Andrew’s number?
3. I have enough money to buy five regular priced CDs and have $6 left over. However all CDs are on sale today,for $4 less than usual. If I borrow $2, I can afford nine of them. How much are CDs on sale for today?
4. Five identical electronics components were connected in series. A fixed but unknown voltage placed acrossthem caused a 2.3 amp current to flow. When two of the components were replaced with standard 10Ω
resistors, the current dropped to 1.9 amps. What is the resistance of each component?5. Solve the following resistance problems. Assume the same voltage is applied to all circuits.
a. Three unknown resistors plus 20Ω give the same current as one unknown resistor plus 70Ω .b. One unknown resistor gives a current of 1.5 amps and a 15Ω resistor gives a current of 3.0 amps.
3.4. EQUATIONS WITH VARIABLES ON BOTH SIDES
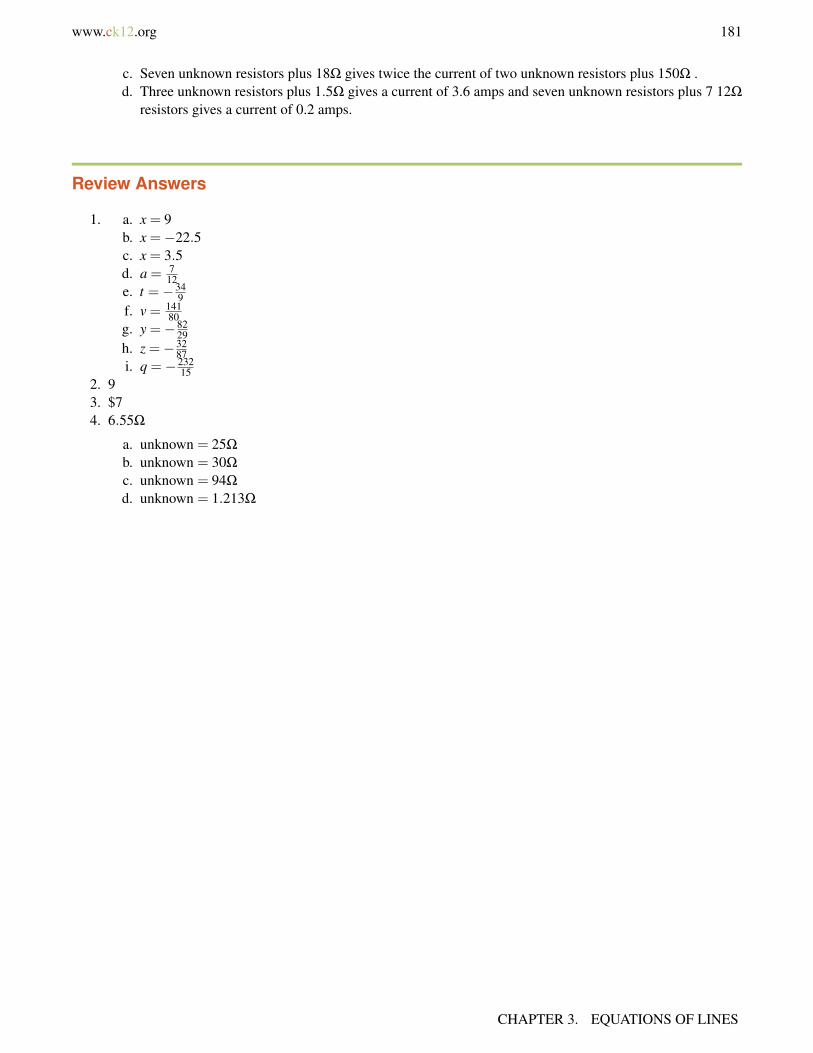
www.ck12.org 181
c. Seven unknown resistors plus 18Ω gives twice the current of two unknown resistors plus 150Ω .d. Three unknown resistors plus 1.5Ω gives a current of 3.6 amps and seven unknown resistors plus 7 12Ω
resistors gives a current of 0.2 amps.
Review Answers
1. a. x = 9b. x =−22.5c. x = 3.5d. a = 7
12e. t =−34
9f. v = 141
80g. y =−82
29h. z =−32
87i. q =−232
152. 93. $74. 6.55Ω
a. unknown = 25Ω
b. unknown = 30Ω
c. unknown = 94Ω
d. unknown = 1.213Ω
CHAPTER 3. EQUATIONS OF LINES

182 www.ck12.org
3.5 Ratios and Proportions
Learning Objectives
• Write and understand a ratio.• Write and solve a proportion.• Solve proportions using cross products.
Introduction
Nadia is counting out money with her little brother. She gives her brother all the nickels and pennies. She keeps thequarters and dimes for herself. Nadia has four quarters (worth 25 cents each) and six dimes (worth 10 cents each).Her brother has fifteen nickels (worth 5 cents each) and five pennies (worth one cent each) and is happy because hehas more coins than his big sister. How would you explain to him that he is actually getting a bad deal?
Write a ratio
A ratio is a way to compare two numbers, measurements or quantities. When we write a ratio, we divide one numberby another and express the answer as a fraction. There are two distinct ratios in the problem above. For example,the ratio of the number of Nadia’s coins to her brother’s is:
4+615+5
=1020
When we write a ratio, the correct way is to simplify the fraction.
1020
=2 · 5
2 · 2 · 5=
12
In other words, Nadia has half the number of coins as her brother.
Another ratio we could look at in the problem is the value of the coins. The value of Nadia’s coins is (4× 25)+(6×10) = 160 cents . The value of her brother’s coins is (15×5)+ (5×1) = 80 cents . The ratio of the value ofNadia’s coins to her brother’s is:
16080
=21
So the value of Nadia’s money is twice the value of her brother’s.
3.5. RATIOS AND PROPORTIONS

www.ck12.org 183
Notice that even though the denominator is one, it is still written. A ratio with a denominator of one is called a unitrate. In this case, it means Nadia is gaining money at twice the rate of her brother.
Example 1
The price of a Harry Potter Book on Amazon.com is $10.00. The same book is also available used for $6.50. Findtwo ways to compare these prices.
Clearly, the cost of a new book is greater than the used book price. We can compare the two numbers using adifference equation:
Difference in price = 10.00−$6.50 = $3.50
We can also use a ratio to compare the prices:
new priceused price
=$10.00$6.50
We can cancel the units of $ as they are the same.
106.50
=1000650
=2013
We remove the decimals and simplify the fraction.
Solution
The new book is $3.50 more than the used book.
The new book costs 2013 times the cost of the used book.
Example 2
The State Dining Room in the White House measures approximately 48 feet long by 36 feet wide. Compare the lengthof room to the width, and express your answer as a ratio.
Solution48 f eet36 f eet =
4836 = 4
3
Example 3
CHAPTER 3. EQUATIONS OF LINES
184 www.ck12.org
A tournament size shuffleboard table measures 30 inches wide by 14 feet long. Compare the length of the table to itswidth and express the answer as a ratio.
We could write the ratio immediately as:14 f eet
30 inches Notice that we cannot cancel the units.
Sometimes it is OK to leave the units in, but as we are comparing two lengths, it makes sense to convert all themeasurements to the same units.
Solution14 f eet
30 inches =14×12 inches
30 inches = 16830 = 28
5
Example 4
A family car is being tested for fuel efficiency. It drives non-stop for 100 miles, and uses 3.2 gallons of gasoline.Write the ratio of distance traveled to fuel used as a unit rate.
Ratio =100 miles
3.2 gallons
A unit rate has a denominator of one, so we need to divide both numerator and denominator by 3.2.
Unit Rate
(1003.2
)miles(3.2
3.2
)gallons
=31.25 miles
1 gallon
Solution
The ratio of distance to fuel used is 31.25 miles1 gallon or 31.25 miles per gallon.
Write and Solve a Proportion
When two ratios are equal to each other, we call it a proportion.
1015
=69
This statement is a proportion. We know the statement is true because we can reduce both fractions to 23 .
Check this yourself to make sure!
We often use proportions in science and business. For example, when scaling up the size of something. We use themto solve for an unknown, so we will use algebra and label our unknown variable x . We assume that a certain ratioholds true whatever the size of the thing we are enlarging (or reducing). The next few examples demonstrate this.
3.5. RATIOS AND PROPORTIONS
www.ck12.org 185
Example 5
A small fast food chain operates 60 stores and makes $1.2 million profit every year. How much profit would the chainmake if it operated 250 stores?
First, we need to write a ratio. This will be the ratio of profit to number of stores.
Ratio =$1,200,000
60 stores
We now need to determine our unknown, x which will be in dollars. It is the profit of 250 stores. Here is the ratiothat compares unknown dollars to 250 stores.
Ratio =$x
250 stores
We now write equal ratios and solve the resulting proportion.
$1,200,00060 stores
=$x
250 storesor
1,200,00060
=x
250
Note that we can drop the units – not because they are the same on the numerator and denominator, but because theyare the same on both sides of the equation.
1,200,00060
=x
250Simplify fractions.
20,000 =x
250Multiply both sides by 250.
5,000,000 = x
Solution
If the chain operated 250 stores the annual profit would be 5 million dollars.
CHAPTER 3. EQUATIONS OF LINES
186 www.ck12.org
Example 6
A chemical company makes up batches of copper sulfate solution by adding 250 kg of copper sulfate powder to 1000liters of water. A laboratory chemist wants to make a solution of identical concentration, but only needs 350 ml (0.35liters) of solution. How much copper sulfate powder should the chemist add to the water?
First we write our ratio. The mass of powder divided by the volume of water used by the chemical company.
Ratio =250 kg
1000 litersWe can reduce this to :
1 kg4 liters
Our unknown is the mass in kilograms of powder to add. This will be x . The volume of water will be 0.35 liters.
Ratio =x kg
0.35 liters
Our proportion comes from setting the two ratios equal to each other:1 kg
4 liters =x kg
0.35 liters which becomes 14 = x
0.35
We now solve for x .
14=
x0.35
Multiply both sides by 0.35.
0.35 · 14=
x0.35
·0.35
x = 0.0875
Solution
The mass of copper sulfate that the chemist should add is 0.0875 kg or 87.5 grams.
Solve Proportions Using Cross Products
One neat way to simplify proportions is to cross multiply. Consider the following proportion.
164
=205
If we want to eliminate the fractions, we could multiply both sides by 4 and then multiply both sides by 5. In factwe could do both at once:
4 ·5 ·164
= 4 · 5 ·205
5 ·16 = 4 ·20
Now comparing this to the proportion we started with, we see that the denominator from the left hand side ends upmultiplying with the numerator on the right hand side.
3.5. RATIOS AND PROPORTIONS
www.ck12.org 187
You can also see that the denominator from the right hand side ends up multiplying the numerator on the left handside.
In effect the two denominators have multiplied across the equal sign:
This movement of denominators is known as cross multiplying. It is extremely useful in solving proportions,especially when the unknown variable is on the denominator.
Example 7
Solve the proportion for x .43 = 9
x
Cross multiply:
x ·4 = 9 ·34x4
=274
Divide both sides by 4.
Solution
x = 6.75
Example 8
Solve the following proportion for x .
0.53
=56x
Cross multiply:
x ·0.5 = 56 ·30.5x0.5
=1680.5
Divide both sides by 0.5.
Solution:
x = 336
Solve Real-World Problems Using Proportions
When we are faced with a word problem that requires us to write a proportion, we need to identify both the unknown(which will be the quantity we represent as x ) and the ratio which will stay fixed.
CHAPTER 3. EQUATIONS OF LINES

188 www.ck12.org
Example 9
A cross-country train travels at a steady speed. It covers 15 miles in 20 minutes. How far will it travel in 7 hoursassuming it continues at the same speed?
This example is a Distance = speed× time problem. We came across a similar problem in Lesson 3.3. Recall thatthe speed of a body is the quantity distance/time. This will be our ratio. We simply plug in the known quantities. Wewill, however convert to hours from minutes.
Ratio =15 miles
20 minutes=
15 miles13 hour
This is a very awkward looking ratio, but since we will be cross multiplying we will leave it as it is. Next, we set upour proportion.
15 miles13 hour
=x miles7 hours
Cancel the units and cross-multiply.
7 ·15 =13· x Multiply both sides by 3.
3 ·7 ·15 = 3 · 13· x
315 = x
Solution
The train will travel 315 miles in 7 hours.
Example 10
Rain is falling at 1 inch every 1.5 hours. How high will the water level be if it rains at the same rate for 3 hours?
Although it may not look it, this again uses the Distance = speed× time relationship. The distance the water rises ininches will be our x . The ratio will again be distance
time .
1 inch1.5 hours
=x inch
3 hoursCancel units and cross multiply.
3(1)1.5
=1.5x1.5
Divide by 1.5
2 = x
3.5. RATIOS AND PROPORTIONS

www.ck12.org 189
Solution
The water will be 2 inches high if it rains for 3 hours.
Example 11
In the United Kingdom, Alzheimer’s disease is said to affect one in fifty people over 65 years of age. If approximately250000 people over 65 are affected in the UK, how many people over 65 are there in total?
The fixed ratio in this case will be the 1 person in 50. The unknown (x) is the number of persons over 65. Note thatin this case, the ratio does not have units, as they will cancel between the numerator and denominator.
We can go straight to the proportion.
150
=250000
xCross multiply :
1 · x = 250000 ·50
x = 12,500,000
Solution
There are approximately 12.5 million people over the age of 65.
Multimedia Link For some advanced ratio problems and applications see http://www.youtube.com/watch?v=PASSD2OcU0c (9:57)
MEDIAClick image to the left for more content.
. Can you think of an easier way to set up and solve these problems?
Lesson Summary
• A ratio is a way to compare two numbers, measurements or quantities by dividing one number by the otherand expressing the answer as a fraction. 2
3 ,32 miles
1.4 gallons , and x13 are all ratios.
CHAPTER 3. EQUATIONS OF LINES
190 www.ck12.org
• A proportion is formed when two ratios are set equal to each other.• Cross multiplication is useful for solving equations in the form of proportions. To cross multiply, multiply
the bottom of each ratio by the top of the other ratio and set them equal. For instance, cross multiplying
11 ·3 = 5 · x .
Review Questions
1. Write the following comparisons as ratios. Simplify fractions where possible.
a. $150 to $3b. 150 boys to 175 girlsc. 200 minutes to 1 hourd. 10 days to 2 weeks
2. Write the following ratios as a unit rate.
a. 54 hotdogs to 12 minutesb. 5000 lbs to 250 in2
c. 20 computers to 80 studentsd. 180 students to 6 teacherse. 12 meters to 4 floorsf. 18 minutes to 15 appointments
3. Solve the following proportions.
a. 136 = 5
xb. 1.25
7 = 3.6x
c. 619 = x
11d. 1
x = 0.015
e. 3004 = x
99f. 2.75
9 = x( 2
9)g. 1.3
4 = x1.3
h. 0.11.01 = 1.9
x
4. A restaurant serves 100 people per day and takes $908. If the restaurant were to serve 250 people per day,what might the taking be?
5. The highest mountain in Canada is Mount Yukon. It is 29867 the size of Ben Nevis, the highest peak in Scotland.
Mount Elbert in Colorado is the highest peak in the Rocky Mountains. Mount Elbert is 22067 the height of Ben
Nevis and 4448 the size of Mont Blanc in France. Mont Blanc is 4800 meters high. How high is Mount Yukon?
6. At a large high school it is estimated that two out of every three students have a cell phone, and one in fiveof all students have a cell phone that is one year old or less. Out of the students who own a cell phone, whatproportion owns a phone that is more than one year old?
Review Answers
1. a. 501
b. 67
3.5. RATIOS AND PROPORTIONS

www.ck12.org 191
c. 103
d. 57
a. 4.5 hot-dogs per minuteb. 20 lbs per in2
c. 0.25 computers per studentd. 30 students per teachere. 3 meters per floorf. 1.2 minutes per appointment
a. x = 3013
b. x = 20.16c. x = 66
19d. x = 500e. x = 7425f. x = 11
162g. x = 0.4225h. x = 100
1919
2. $22703. 5960 meters.4. 3
10 or 30%
CHAPTER 3. EQUATIONS OF LINES

192 www.ck12.org
3.6 Scale and Indirect Measurement
Learning Objectives
• Use scale on a map.• Solve problems using scale drawings.• Use similar figures to measure indirectly.
Introduction
We are occasionally faced with having to make measurements of things that would be difficult to measure directly:the height of a tall tree, the width of a wide river, height of moon’s craters, even the distance between two citiesseparated by mountainous terrain. In such circumstances, measurements can be made indirectly, using proportionsand similar triangles. Such indirect methods link measurement with geometry and numbers. In this lesson, we willexamine some of the methods for making indirect measurements.
Use Scale on a Map
A map is a two-dimensional, geometrically accurate representation of a section of the Earth’s surface. Maps areused to show, pictorially, how various geographical features are arranged in a particular area. The scale of the mapdescribes the relationship between distances on a map and the corresponding distances on the earth’s surface. Thesemeasurements are expressed as a fraction or a ratio.
So far we have only written ratios as fractions, but outside of mathematics books, ratios are often written as twonumbers separated by a colon (:). Here is a table that compares ratios written in two different ways.
TABLE 3.1:
Ratio Is Read As Equivalent To1:20 one to twenty
( 120
)2:3 two to three
(23
)1:1000 one to one-thousand
( 11000
)
Look at the last row. In a map with a scale of 1:1000 (“one to one-thousand”) one unit of measurement on the map(1 inch or 1 centimeter for example) would represent 1000 of the same units on the ground. A 1:1 (one to one) mapwould be a map as large as the area it shows!
Example 1
Anne is visiting a friend in London, and is using the map below to navigate from Fleet Street to Borough Road. Sheis using a 1:100,000 scale map, where 1 cm on the map represents 1 km in real life. Using a ruler, she measures thedistance on the map as 8.8 cm. How far is the real distance from the start of her journey to the end?
3.6. SCALE AND INDIRECT MEASUREMENT
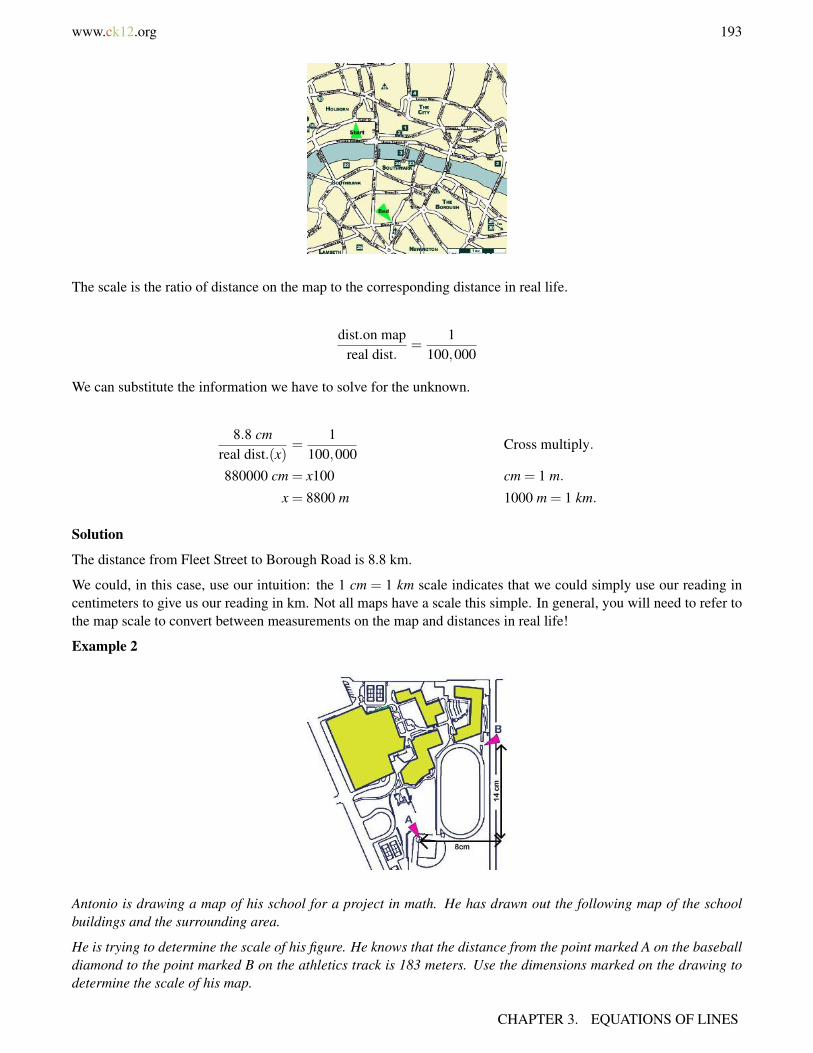
www.ck12.org 193
The scale is the ratio of distance on the map to the corresponding distance in real life.
dist.on mapreal dist.
=1
100,000
We can substitute the information we have to solve for the unknown.
8.8 cmreal dist.(x)
=1
100,000Cross multiply.
880000 cm = x100 cm = 1 m.
x = 8800 m 1000 m = 1 km.
Solution
The distance from Fleet Street to Borough Road is 8.8 km.
We could, in this case, use our intuition: the 1 cm = 1 km scale indicates that we could simply use our reading incentimeters to give us our reading in km. Not all maps have a scale this simple. In general, you will need to refer tothe map scale to convert between measurements on the map and distances in real life!
Example 2
Antonio is drawing a map of his school for a project in math. He has drawn out the following map of the schoolbuildings and the surrounding area.
He is trying to determine the scale of his figure. He knows that the distance from the point marked A on the baseballdiamond to the point marked B on the athletics track is 183 meters. Use the dimensions marked on the drawing todetermine the scale of his map.
CHAPTER 3. EQUATIONS OF LINES
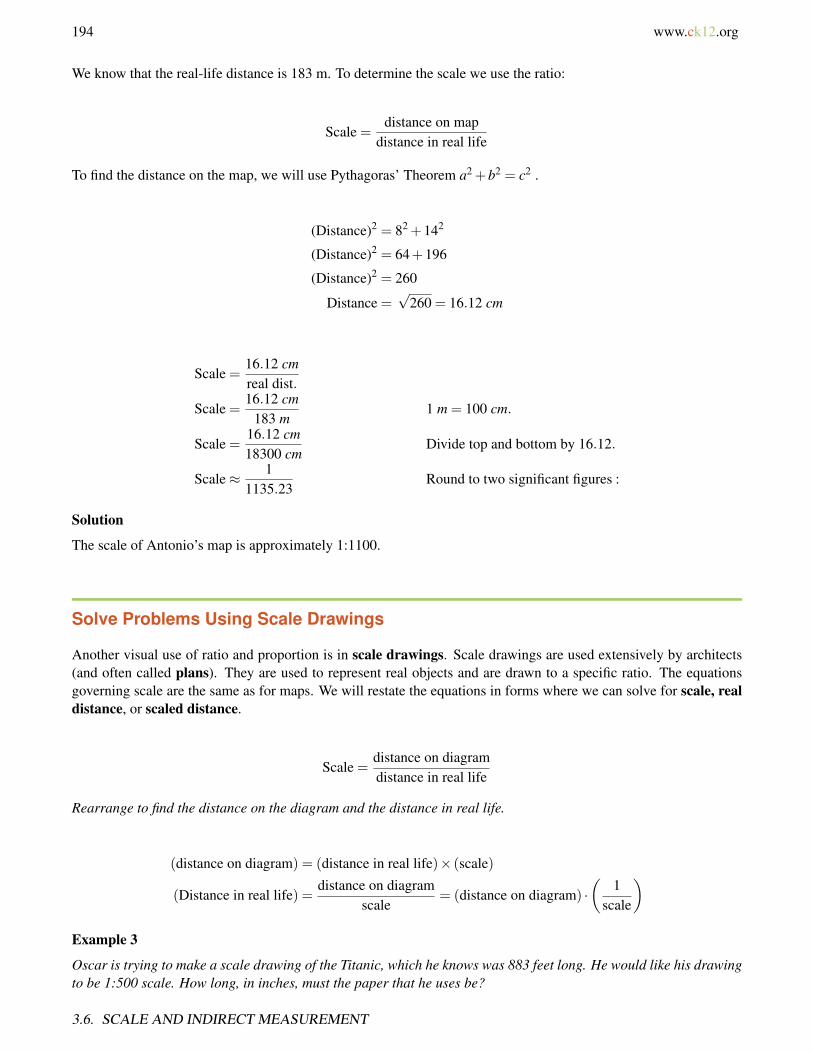
194 www.ck12.org
We know that the real-life distance is 183 m. To determine the scale we use the ratio:
Scale =distance on map
distance in real life
To find the distance on the map, we will use Pythagoras’ Theorem a2 +b2 = c2 .
(Distance)2 = 82 +142
(Distance)2 = 64+196
(Distance)2 = 260
Distance =√
260 = 16.12 cm
Scale =16.12 cmreal dist.
Scale =16.12 cm
183 m1 m = 100 cm.
Scale =16.12 cm18300 cm
Divide top and bottom by 16.12.
Scale≈ 11135.23
Round to two significant figures :
Solution
The scale of Antonio’s map is approximately 1:1100.
Solve Problems Using Scale Drawings
Another visual use of ratio and proportion is in scale drawings. Scale drawings are used extensively by architects(and often called plans). They are used to represent real objects and are drawn to a specific ratio. The equationsgoverning scale are the same as for maps. We will restate the equations in forms where we can solve for scale, realdistance, or scaled distance.
Scale =distance on diagramdistance in real life
Rearrange to find the distance on the diagram and the distance in real life.
(distance on diagram) = (distance in real life)× (scale)
(Distance in real life) =distance on diagram
scale= (distance on diagram) ·
(1
scale
)Example 3
Oscar is trying to make a scale drawing of the Titanic, which he knows was 883 feet long. He would like his drawingto be 1:500 scale. How long, in inches, must the paper that he uses be?
3.6. SCALE AND INDIRECT MEASUREMENT

www.ck12.org 195
We can reason intuitively that since the scale is 1:500 that the paper must be 883500 = 1.766 f eet long.
Converting to inches gives the length at 12(1.766) in = 21.192 in .
Solution
Oscar’s paper should be at least 22 inches long.
Example 4
The Rose Bowl stadium in Pasadena California measures 880 feet from north to south and 695 feet from east to west.A scale diagram of the stadium is to be made. If 1 inch represents 100 feet, what would be the dimensions of thestadium drawn on a sheet of paper? Will if fit on a standard (U.S.) sheet of paper (8.5 in×11 in) ?
We will use the following relationship.
(distance on diagram) = (distance in real life)× (scale)
Scale = 1 inch to 100 f eet =(
1 inch100 f eet
)Width on paper = 880 f eet×
(1 inch
100 f eet
)= 8.8 inches
Height on paper = 695 f eet×(
1 inch100 f eet
)= 6.95 inches
Solution
The dimensions of the scale diagram would be 8.8 in×6.95 in . Yes, this will fit on a 8.5 in×11 in sheet of paper.
Example 5
The scale drawing below is sent to kids who attend Summer Camp. Use the scale to estimate the following:
a) The distance from the mess hall to the swimming pool via the path shown.
b) The distance from the lodge to the swimming pool via the horse corral.
c) The direct distance from the mess hall to the lodge
To proceed with this problem, we need a ruler. It does not matter whether we use a ruler marked in inches orcentimeters, but a centimeter scale is easier, as it is marked in tenths. For this example, the ruler used will be acentimeter ruler.
CHAPTER 3. EQUATIONS OF LINES

196 www.ck12.org
We first need to convert the scale on the diagram into something we can use. Often the scale will be stated on thediagram but it is always worth checking, as the diagram may have been enlarged or reduced from its original size.Here we see that 500 feet on the diagram is equivalent to 3.0 cm on the ruler. The scale we will use is therefore3 cm = 500 f t . We can write this as a ratio.
Scale =(
3 cm500 f t
)Do not worry about canceling units this time!
a) We are now ready to move to the next step. Measuring distances on the diagram. First, we need to know thedistance from the mess hall to the swimming pool. We measure the distance with our ruler. We find that the distanceis 5.6 cm. We divide this by the scale to find the real distance.
disance on diagramscale
=5.6 cm(
3 cm500 f t
) = 5.6 cm ·(
500 f t3 cm
)
Multiply this out. Note that the centimeter units will cancel leaving the answer in feet.
Solution
The distance from the mess hall to the swimming pool is approximately 930 feet (rounded to the nearest 10 feet).
b) To find the distance from the lodge to the swimming pool, we have to measure two paths. The first is the distancefrom the lodge to the horse corral. This is found to be 3.4 cm.
The distance from the corral to the swimming pool is 5.5 cm.
The total distance on the diagram is (3.4+5.5) = 8.9 cm .
Distance in real life =disance on diagram
scale≈ 8.9 cm
(500 f t3 cm
)
Solution
The distance from the lodge to the pool is approximately 1480 feet.
3.6. SCALE AND INDIRECT MEASUREMENT

www.ck12.org 197
c) To find the direct distance from the lodge to the mess hall, we simply use the ruler to measure the distance fromone point to the other. We do not have to go round the paths in this case.
Distance on diagram = 6.2 cm
Distance in real life =distance on diagram
scale≈ 6.2 cm ·
(500 f t3 cm
)
Solution
The distance from the lodge to the mess hall is approximately 1030 feet.
Use Similar Figures to Measure Indirectly
Similar figures are often used to make indirect measurements. Two shapes are said to be similar if they are thesame shape but one is an enlarged (or reduced) version of the other. Similar triangles have the same angles, and aresaid to be “in proportion.” The ratio of every measurable length in one figure to the corresponding length in the otheris the same. Similar triangles crop up often in indirect measurement.
Example 6
Anatole is visiting Paris, and wants to know the height of the Eiffel Tower. Unable to speak French, he decides tomeasure it in three ways.
a. He measures out a point 500 meters from the base of the tower, and places a small mirror flat on the ground.b. He stands behind the mirror in such a spot that standing upright he sees the top of the tower reflected in the
mirror.c. He measures both the distance from the spot where he stands to the mirror (2.75 meters) and the height of his
eyes from the ground (1.8 meters).
CHAPTER 3. EQUATIONS OF LINES

198 www.ck12.org
Explain how he is able to determine the height of the Eiffel Tower from these numbers and determine what thatheight is.
First, we will draw and label a scale diagram of the situation.
A fact about refection is that the angle that the light reflects off the mirror is the same as the angle that it hits themirror.
Both triangles are right triangles, and both have one other angle in common. That means that all three angles in thelarge triangle match the angles in the smaller triangle. We say the triangles are similar: exactly the same shape, butenlarged or reduced.
• This means that the ratio of the long leg in the large triangle to the length of the long leg in the small triangleis the same ratio as the length of the short leg in the large triangle to the length of the short leg in the smalltriangle.
500m2.75m
=x
1.8m
1.8 · 5002.75
=x
1.8·1.8
327.3 = x
Solution
The Eiffel Tower, according to this calculation, is approximately 327.3 meters high.
Example 7
Bernard is looking at a lighthouse and wondering how high it is. He notices that it casts a long shadow, which hemeasures at 200 meters long. At the same time he measures his own shadow at 3.1 meters long. Bernard is 1.9meters tall. How tall is the lighthouse?
We will again draw a scale diagram:
Again, we see that we have two right triangles. The angle that the sun causes the shadow from the lighthouse to fallis the same angle that Bernard shadow falls. We have two similar triangles, so we can again say that the ratio of thecorresponding sides is the same.
3.6. SCALE AND INDIRECT MEASUREMENT

www.ck12.org 199
200m3.1m
=x
1.9m
1.9 · 2003.1
=x
1.9·1.9
122.6 = x
Solution
The lighthouse is 122.6 meters tall.
Lesson Summary
• Scale is a proportion that relates map distance to real life distance. scale = distance on mapdistance in real life
• Two shapes, like triangles, are said to be similar if they have the same angles. The sides of similar trianglesare in proportion. The ratio of every measurable length in one triangle to the corresponding length in theother is the same.
Review Questions
1. Use the map in Example One. Using the scale printed on the map, determine the distances (rounded to thenearest half km) between:
a. Points 1 and 4b. Points 22 and 25c. Points 18 and 13d. Tower Bridge and London Bridge
2. The scale diagram in Example Five does not show the buildings themselves in correct proportion. Use thescale to estimate:
a. The real length the indicated pool would be if it was drawn in proportion.b. The real height the lodge would be if it was drawn in proportion.c. The length a 50 ft pool on the diagram.d. The height a 20 ft high tree would be on the diagram.
CHAPTER 3. EQUATIONS OF LINES

200 www.ck12.org
3. Use the scale diagram to the right to determine:
a. The length of the helicopter (cabin to tail)b. The height of the helicopter (floor to rotors)c. The length of one main rotord. The width of the cabine. the diameter of the rear rotor system
4. On a sunny morning, the shadow of the Empire State Building is 600 feet long. At the same time, the shadowof a yardstick (3 feet long) is 1 foot, 5 1
4 inches . How high is the Empire State building?
Review Answers
1. a. 3 kmb. 7 kmc. 12 1
2 kmd. 4 1
2 km
a. Pool = 600 f eet longb. Lodge = 250 f eet highc. Pool should be 0.3 cmd. Tree should be 0.12 cm
a. length = 21 f tb. height = 10 f tc. Main rotor = 12 f td. cabin width = 5 1
2 f te. rotor diameter = 4 f t
2. 1250 ft
3.6. SCALE AND INDIRECT MEASUREMENT
www.ck12.org 201
3.7 Percent Problems
Learning Objectives
• Find a percent of a number.• Use the percent equation.• Find the percent of change.
Introduction
A percent is simply a ratio with a base unit of 100. When we write a ratio as a fraction, the base unit is thedenominator. Whatever percentage we want to represent is the number on the numerator. For example, the followingratios and percents are equivalent.
TABLE 3.2:
Fraction Percent Fraction Percent( 50100
)50%
( 501000
)=( 0.5
100
)0.5%( 10
100
)10%
( 125
)=( 4
100
)4%( 99
100
)99%
(35
)=( 60
100
)60%(125
100
)12.5%
(1
10,000
)=(0.01
100
)0.01%
Fractions are easily converted to decimals, just as fractions with denominators of 10, 100, 1000, 10000 are convertedto decimals. When we wish to convert a percent to a decimal, we divide by 100, or simply move the decimal pointtwo units to the left.
TABLE 3.3:
Percent Decimal Percent Decimal Percent Decimal10% 0.1 0.05% .0005 0% 099% 0.99 0.25% .0025 100% 1
Find a Percent of a Number
One thing we need to do before we work with percents is to practice converting between fractions, decimals andpercentages. We will start by converting decimals to percents.
Example 1
Express 0.2 as a percent.
The word percent means “for every hundred”. Therefore, to find the percent, we want to change the decimal to afraction with a denominator of 100. For the decimal 0.2 we know the following is true:
CHAPTER 3. EQUATIONS OF LINES
202 www.ck12.org
0.2 = 0.2×100×(
1100
)Since 100×
(1
100
)= 1
0.2 = 20×(
1100
)0.2 =
(20
100
)= 20%
Solution
0.2 = 20%
We can take any number and multiply it by 100× 1100 without changing that number. This is the key to converting
numbers to percents.
Example 2
Express 0.07 as a percent.
0.07 = 0.07×100×(
1100
)0.07 = 7×
(1
100
)0.07 =
(7
100
)= 7%
Solution
0.07 = 7%
It is a simple process to convert percentages to decimals. Just remember that a percent is a ratio with a base (ordenominator) of 100.
Example 3
Express 35% as a decimal.
35% =
(35100
)= 0.35
Example 4
Express 0.5% as a decimal.
3.7. PERCENT PROBLEMS
www.ck12.org 203
0.5% =
(0.5100
)=
(5
1000
)= 0.005
In practice, it is often easier to convert a percent to a decimal by moving the decimal point two spaces to the left.
The same trick works when converting a decimal to a percentage, just shift the decimal point two spaces to the rightinstead.
When converting fractions to percents, we can substitute x100 for x% , where x is the unknown percentage we can
solve for.
Example 5
Express 35 as a percent.
We start by representing the unknown as x% or x100 .
(35
)=
x100
Cross multiply.
5x = 100 ·3 Divide both sides by 5 to solve for x.
5x = 300
x =300
5= 60
Solution(35
)= 60%
Example 6
Express 1340 as a percent.
Again, represent the unknown percent as x100 , cross-multiply, and solve for x .
1340
=x
10040x = 1300
x =130040
= 32.5
CHAPTER 3. EQUATIONS OF LINES
204 www.ck12.org
Solution(1340
)= 32.5%
Converting percentages to simplified fractions is a case of writing the percentage ratio with all numbers written asprime factors:
Example 7
Express 28% as a simplified fraction.
First write as a ratio, and convert numbers to prime factors.
28%(
28100
)=
(2 ·2 ·7
5 ·5 ·2 ·2·
)
Now cancel factors that appear on both numerator and denominator.
(2 · 2 ·72 · 2 ·5 ·5
)=
725
Solution
28% =( 7
25
)Multimedia Link The following video shows several more examples of finding percents and might be useful forreinforcing the procedure of finding the percent of a number. http://www.youtube.com/watch?v=_SpE4hQ8D_o(9:55)
MEDIAClick image to the left for more content.
Use the Percent Equation
The percent equation is often used to solve problems.
Percent Equation: Rate × Total = Part or “R% of Total is Part”
Rate is the ratio that the percent represents (R% in the second version).
Total is often called the base unit.
Part is the amount we are comparing with the base unit.
3.7. PERCENT PROBLEMS

www.ck12.org 205
Example 8
Find 25% of $80
Use the percent equation. We are looking for the part. The total is $80. ‘of’ means multiply. R% is 25% so the rateis 25
100 or 0.25.
0.25 ·$80 = $20
Solution
25% of $80 is $20.
Remember, to convert a percent to a decimal, you just need to move the decimal point two places to the left!
Example 9
Find 17% of $93
Use the percent equation. We are looking for the part. The total is $93. R% is 17% so the rate is 0.17.
0.17 ·93 = 15.81
Solution
17% of $93 is $15.81.
Example 10
Express $90 as a percentage of $160.
Use the percent equation. This time we are looking for the rate. We are given the part ($90) and the total ($160).We will substitute in the given values.
Rate×160 = 90 Divide both sides by 160
Rate =(
90160
)= 0.5625 = 0.5625
(100100
)=
56.25100
Solution
$90 is 56.25% of 160.
Example 11
$50 is 15% of what total sum?
Use the percent equation. This time we are looking for the total. We are given the part ($50) and the rate (15% or0.15). The total is our unknown in dollars, or x . We will substitute in these given values.
CHAPTER 3. EQUATIONS OF LINES

206 www.ck12.org
0.15x = 50 Solve for x by dividing both sides by 0.15.
x =50
0.15≈ 333.33
Solution
$50 is 15% of $333.33.
Find Percent of Change
A useful way to express changes in quantities is through percents. You have probably seen signs such as “20% extrafree”, or “save 35% today.” When we use percents to represent a change, we generally use the formula.
Percent change =(
final amount−original amountoriginal amount
)×100%
Or
percent change100
=
(actual change
original amount
)
A positive percent change would thus be an increase, while a negative change would be a decrease.
Example 12
A school of 500 students is expecting a 20% increase in students next year. How many students will the school have?
The percent change is +20. It is positive because it is an increase. The original amount is 500. We will show thecalculation using both versions of the above equation. First we will substitute into the first formula.
Percent change =(
final amount−original amountoriginal amount
)×100%
20% =
(final amount−500
500
)×100% Divide both sides by 100%.
Let x = final amount.
0.2 =x−500
500Multiply both sides by 500.
100 = x−500 Add 500 to both sides.
600 = x
Solution
The school will have 600 students next year.
Example 13
A $150 mp3 player is on sale for 30% off. What is the price of the player?
The percent change is given, as is the original amount. We will substitute in these values to find the final amount indollars (our unknown x ). Note that a decrease means the change is negative. We will use the first equation.
3.7. PERCENT PROBLEMS
www.ck12.org 207
Percent change =(
final amount−original amountoriginal amount
)×100%(
x−150150
)·100% =−30% Divide both sides by 100%.(
x−150150
)=
30%100%
=−0.3% Multiply both sides by 150.
x−150 = 150(−0.3) =−45 Add 150 to both sides.
x =−45+150
Solution
The mp3 player is on sale for $105.
We can also substitute straight into the second equation and solve for the change y .
percent change100
=
(actual change
original amount
)−30100
=y
150Multiply both sides by 150.
150(−0.3) = y
y =−45
Solution
Since the actual change is -45($), the final price is $150−$45 = $105 .
A mark-up is an increase from the price a store pays for an item from its supplier to the retail price it charges to thepublic. For example, a 100% mark-up (commonly known in business as keystone) means that the price is doubled.Half of the retail price covers the cost of the item from the supplier, half is profit.
Example 14 – Mark-up
A furniture store places a 30% mark-up on everything it sells. It offers its employees a 20% discount from the salesprice. The employees are demanding a 25% discount, saying that the store would still make a profit. The managersays that at a 25% discount from the sales price would cause the store to lose money. Who is right?
We will consider this problem two ways. First, let us consider an item that the store buys from its supplier for $1000.
Item price $1000
Mark-up $300 (30% of 1000 = 0.30 ·1000 = 300)
Final retail price $1300
CHAPTER 3. EQUATIONS OF LINES

208 www.ck12.org
So a $1000 item would retail for $1300. $300 is the profit available to the store. Now, let us consider discounts.
Retail Price $1300
20% discount 0.20×$1300 = $260
25% discount 0.25×$1300 = $325
So with a 20% discount, employees pay $1300−$260 = $1040
With a 25% discount, employees pay $1300−$325 = $975
With a 20% discount, employees pay $40 more than the cost of the item.
At a 25% discount they pay $975, which is $25 less than the cost.
Finally, we will work algebraically. Consider an item whose wholesale price is x .
Mark-up = 0.3x
Final retail price = 1.3x
Price at 20% discount = 0.80×1.3x = 1.04x
Price at 25% discount = 0.75×1.3x = 0.975x
Solution
The manager is right. A 20% discount from retail means the store makes around 4% profit. At a 25% discount, thestore has a 2.5% loss.
Solve Real-World Problems Using Percents
Example 15
In 2004 the US Department of Agriculture had 112071 employees, of which 87846 were Caucasian. Of theremaining minorities, African-American and Hispanic employees had the two largest demographic groups, with11754 and 6899 employees respectively.*
a) Calculate the total percentage of minority (non-Caucasian) employees at the USDA.
b) Calculate the percentage of African-American employees at the USDA.
c) Calculate the percentage of minority employees who were neither African-American nor Hispanic.
a) Use the percent equation Rate×Total = Part .
The total number of employees is 112071. We know that the number of Caucasian employees is 87846, whichmeans that there must be (112071−87846) = 24225 non-Caucasian employees. This is the part.
Rate×112071 = 24225 Divide both sides by 112071.
Rate = 0.216 Multiply by 100 to obtain percent :
Rate = 21.6%
Solution
3.7. PERCENT PROBLEMS

www.ck12.org 209
21.6% of USDA employees in 2004 were from minority groups.
b) Total = 112071 Part = 11754
Rate×112071 = 11754 Divide both sides by 112071.
Rate = 0.105 Multiply by 100 to obtain percent :
Rate = 10.5%
Solution
10.5% of USDA employees in 2004 were African-American.
c) We now know there are 24225 non-Caucasian employees. This is now our total. That means there must be(24225− 11754− 6899) = 5572 minority employees who are neither African-American nor Hispanic. The part is5572.
Rate×24225 = 5572 Divide both sides by 24225
Rate = 0.230 Multiply by 100 to obtain percent.
Rate = 23%
Solution
23% of USDA minority employees in 2004 were neither African-American nor Hispanic.
Example 16
In 1995 New York had 18136000 residents. There were 827025 reported crimes, of which 152683 were violent. By2005 the population was 19254630 and there were 85839 violent crimes out of a total of 491829 reported crimes.Calculate the percentage change from 1995 to 2005 in: †
a) Population of New York
b) Total reported crimes
c) violent crimes
This is a percentage change problem. Remember the formula for percentage change.
Percent change =(
final amount−original amountoriginal amount
)×100%
In these cases, the final amount is the 2005 statistic. The initial amount is the 1995 statistic.
a) Population:
Percent change =(
19,254,630−18,136,00018,136,000
)×100%
Percent change =(
1,118,63018,136,000
)×100%
Percent change = 0.0617×100
Percent change = 6.17%
CHAPTER 3. EQUATIONS OF LINES

210 www.ck12.org
Solution
The population grew by 6.17%.
b) Total reported crimes
Percent change =(
491,829−827,025827,025
)×100%
Percent change =(−335,196827,025
)×100%
Percent change =−0.4053×100
Percent change =−40.53%
Solution
The total number of reported crimes fell by 40.53%.
c) Violent crimes
Percent change =(
85,839−152,683152,683
)×100%
Percent change =(−66,844152,683
)×100%
Percent change =−0.4377×100
Percent change =−43.77%
Solution
The total number of reported crimes fell by 43.77%. † Source: New York Law Enforcement Agency Uniform CrimeReports
Lesson Summary
• A percent is simply a ratio with a base unit of 100, i.e. 13% = 13100 .
• The percent equation is: Rate × Total = Part or “R% of Total is Part”.• Percent change =
final amount−original amountoriginal amount × 100 . A positive percent change means the value in-
creased, while a negative percent change means the value decreased.
Review Questions
1. Express the following decimals as a percent.
a. 0.011b. 0.001c. 0.91d. 1.75e. 20
3.7. PERCENT PROBLEMS
www.ck12.org 211
2. Express the following fractions as a percent (round to two decimal places when necessary).
a. 16
b. 524
c. 67
d. 117
e. 1397
3. Express the following percentages as a reduced fraction.
a. 11%b. 65%c. 16%d. 12.5%e. 87.5%
4. Find the following.
a. 30% of 90b. 16.7% of 199c. 11.5% of 10.01d. y% of 3x
5. A TV is advertised on sale. It is 35% off and has a new price of $195. What was the pre-sale price?6. An employee at a store is currently paid $9.50 per hour. If she works a full year she gets a 12% pay rise. What
will her new hourly rate be after the raise?7. Store A and Store B both sell bikes, and both buy bikes from the same supplier at the same prices. Store A
has a 40% mark-up for their prices, while store B has a 250% mark-up. Store B has a permanent sale and willalways sell at 60% off those prices. Which store offers the better deal?
Review Answers
1. a. 1.1%b. 0.1%c. 91%d. 175%e. 2000%
a. 16.67%b. 20.83%c. 85.71%d. 157.14%e. -13.40%
a. 11100
b. 1320
c. 425
d. 18
e. 78
a. 27b. 33.233c. -1.15115d. 3xy
100
CHAPTER 3. EQUATIONS OF LINES

212 www.ck12.org
2. $3003. $10.644. Both stores’ final sale prices are identical.
3.7. PERCENT PROBLEMS

www.ck12.org 213
3.8 Problem Solving Strategies: Use aFormula
Learning Objectives
• Read and understand given problem situations.• Develop and apply the strategy: use a formula.• Plan and compare alternative approaches to solving problems.
Introduction
In this chapter, we have been solving problems in which quantities vary directly with one another other. In thissection, we will look at few examples of ratios and percents occurring in real-world problems. We will follow theProblem Solving Plan.
Step 1 Understand the problem
Read the problem carefully. Once you have read the problem, list all the components and data that are involved.This is where you will be assigning your variables.
Step 2 Devise a plan – Translate
Come up with a way to solve the problem. Set up an equation or formula.
Step 3 Carry out the plan – Solve
This is where you solve the formula you came up with in Step 2.
Step 4 Look – Check and Interpret
Check to see if you used all your information and that the answer makes sense.
It is important that you first know what you are looking for when solving problems in mathematics. Math problemsoften require that you extract information and use it in a definite procedure. You must collect the appropriateinformation and use it (using a strategy or strategies) to solve the problem Many times, you will be writing out anequation which will enable you to find the answer.
Example 1
An architect is designing a room that is going to be twice as long as it is wide. The total square footage of the roomis going to be 722 square feet. What are the dimensions in feet of the room?
CHAPTER 3. EQUATIONS OF LINES
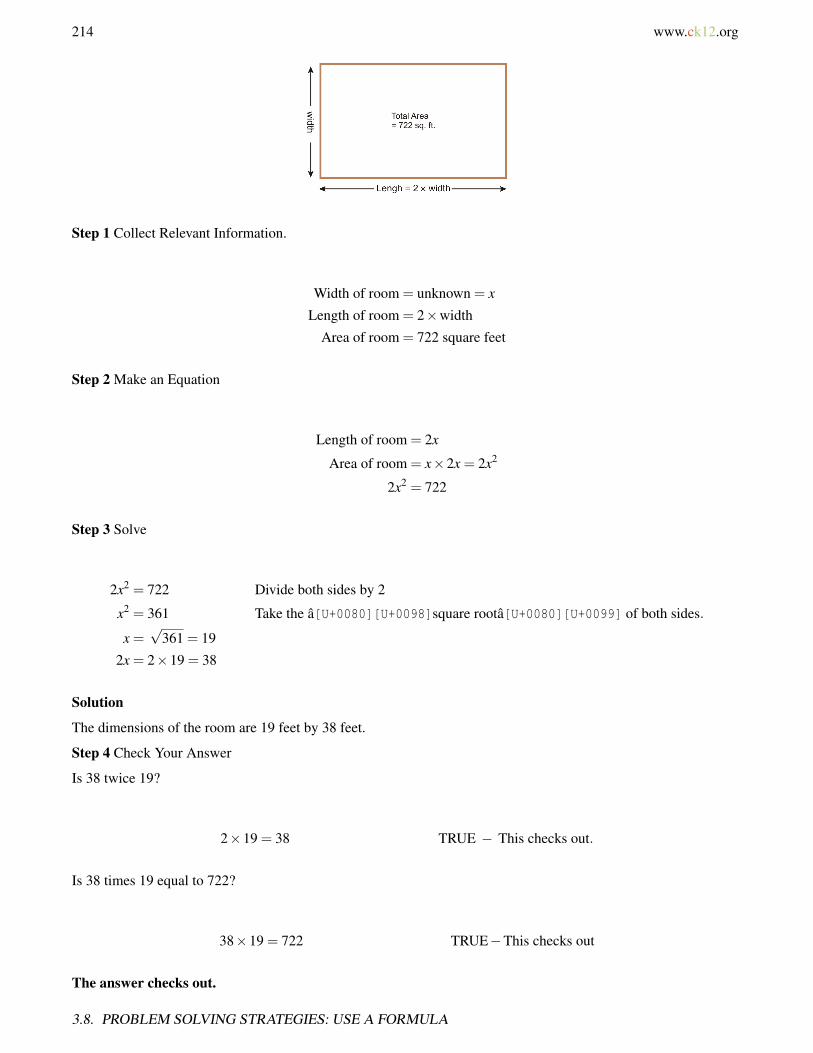
214 www.ck12.org
Step 1 Collect Relevant Information.
Width of room = unknown = x
Length of room = 2×width
Area of room = 722 square feet
Step 2 Make an Equation
Length of room = 2x
Area of room = x×2x = 2x2
2x2 = 722
Step 3 Solve
2x2 = 722 Divide both sides by 2
x2 = 361 Take the â[U+0080][U+0098]square rootâ[U+0080][U+0099] of both sides.
x =√
361 = 19
2x = 2×19 = 38
Solution
The dimensions of the room are 19 feet by 38 feet.
Step 4 Check Your Answer
Is 38 twice 19?
2×19 = 38 TRUE − This checks out.
Is 38 times 19 equal to 722?
38×19 = 722 TRUE−This checks out
The answer checks out.
3.8. PROBLEM SOLVING STRATEGIES: USE A FORMULA

www.ck12.org 215
Example 2
A passenger jet initially climbs at 2000 feet per minute after take-off from an airport at sea level. At the four minutemark this rate slows to 500 feet per minute. How many minutes pass before the jet is at 20000 feet?
Step 1
Initial climb rate =2000 f eet1 minute
Initial climb time = 4 minutes
Final climb rate =500 f eet1 minute
Final climb time = unknown = x
Final altitude = 20000 f eet
The first two pieces on information can be combined. Here is the result.
Height at four minute mark = 4 minutes · 2000 f eet1 minute = 8000 f eet.
Step 2 Write an equation.
Since we know that the height at four minutes is 8000 feet, we need to find the time taken to climb the final(20000−8000) = 12000 f eet .
We will use distance = speed× time to give us an equation for time.
time =distancespeed
= distance ·(
1speed
)
Step 3 Solve.
x = 12,000 f eet ·(
1 minute500 f eet
)Note that the units of feet will also cancel
x = 24 minutes
total time = x+4
Solution
The time taken to reach 20000 feet is 28 minutes.
Step 4 check your answer
CHAPTER 3. EQUATIONS OF LINES

216 www.ck12.org
What is 4 times 2000?
4×2000 = 8000 The initial climb is through 8000 f eet.
What is 24 times 500?
24×500 = 12000 The second part of the climb is through 8000 f eet.
The total climb = initial climb + secondary climb = (8000+12000) = 20000 f eet .
The answer checks out.
Example 3
The time taken for a moving body to travel a given distance is given by time = distancespeed . The speed of sound in air
is approximately 340 meters per second. In water, sound travels much faster at around 1500 meters per second. Asmall meteor hits the ocean surface 10 km away. What would be the delay in seconds between the sound heard aftertraveling through the air and the same sound traveling through the ocean?
Step 1 We will write out the most important information.
Distance = 10,000 meters
Speed in air =340 meters1 second
Speed in water =1500 meters
1 secondTime through air = unknown x
Time through water = unknown y
Delay = x− y
Step 2 We will convert this information into equations.
Time in air x = 10,000 meters · 1 second340 meters
Time in water y = 10,000 meters · 1 second15000 meters
Step 3 Solve for x,y and the delay.
x = 29.41 seconds
y = 6.67 seconds
Delay = x− y = (29.41−6.67) seconds
3.8. PROBLEM SOLVING STRATEGIES: USE A FORMULA
www.ck12.org 217
Solution
The delay between the two sound waves arriving is 22.7 seconds.
Step 4 Check that the answer works.
We need to think of a different way to explain the concept.
The actual time that the sound takes in air is 29.41 seconds. In that time, it crosses the following distance.
Distance = speed× time = 340×29.41 = 9999 meters
The actual time that the sound takes in water is 6.67 seconds. In that time, it crosses the following distance of.
Distance = speed× time = 1500×6.67 = 10005 meters
Both results are close to the 10000 meters that we know the sound traveled. The slight error comes from roundingour answer.
The answer checks out.
Example 4:
Deandra is looking over her paycheck. Her boss took tax from her earnings at a rate of 15%. A deduction to coverhealth insurance took one-twelfth of what was left. Deandra always saves one-third of what she gets paid after allthe deductions. If Deandra worked 16 hours at $7.50 per hour, how much will she save this week?
Step 1 Collect relevant information.
Deductions:
Tax = 15% = 0.15
Health =1
12
Savings =13
Hours = 16
Rate = $7.50 per hour
Savings amount = unknown x
Step 2 Write an equation.
Deandra’s earnings before deductions = 16×$7.50 = $120
Fraction remaining after tax = 1−0.15 = 0.85
Fraction remaining after health = 0.85(1− 1
12
)= 0.85
(1112
)≈ 0.85 ·0.91667≈ 0.779167
Fraction to be saved = 13 ·0.779167≈ 0.25972
Step 3 Solve
Amount to save = 0.25972 ·$120 = $31.1664 Round to two decimal places.
Solution
Deandra saves $31.17.
CHAPTER 3. EQUATIONS OF LINES
218 www.ck12.org
Step 4 Check your answer by working backwards.
If Deandra saves $31.17, then her take-home pay was 3×$31.17 = $93.51
If Deandra was paid $93.51, then before health deductions health she had $93.51 · 1211 = $102.01
If Deandra had $102.01 after tax, then before tax she had $102.01 · 10085 = $120.01
If Deandra earned $120.01 at $7.50 per hour, then she worked for $102.01$7.50 = 16.002 hours
This is extremely close to the hours we know she worked (the difference comes from the fact we rounded to thenearest penny).
The answer checks out.
Lesson Summary
The four steps of the Problem Solving Plan are:
a. Understand the problemb. Devise a plan – Translatec. Carry out the plan – Solved. Look – Check and Interpret
Review Questions
Use the information in the problems to create and solve an equation.
1. Patricia is building a sandbox for her daughter. It is to be five feet wide and eight feet long. She wants theheight of the sand box to be four inches above the height of the sand. She has 30 cubic feet of sand. How highshould the sand box be?
2. A 500 sheet stack of copy paper is 1.75 inches high. The paper tray on a commercial copy machine holds atwo foot high stack of paper. Approximately how many sheets is this?
3. It was sale day in Macy’s and everything was 20% less than the regular price. Peter bought a pair of shoes,and using a coupon, got an additional 10% off the discounted price. The price he paid for the shoes was $36.How much did the shoes cost originally?
4. Peter is planning to show a video file to the school at graduation, but is worried that the distance that theaudience sits from the speakers will cause the sound and the picture to be out of sync. If the audience sits 20meters from the speakers, what is the delay between the picture and the sound? (The speed of sound in air is340 meters per second).
5. Rosa has saved all year and wishes to spend the money she has on new clothes and a vacation. She will spend30% more on the vacation than on clothes. If she saved $1000 in total, how much money (to the nearest wholedollar) can she spend on the vacation?
6. On a DVD, data is stored between a radius of 2.3 cm and 5.7 cm. Calculate the total area available for datastorage in square cm.
7. If a Blu-ray T M DVD stores 25 gigabytes (GB), what is the storage density, in GB per square cm?
3.8. PROBLEM SOLVING STRATEGIES: USE A FORMULA

www.ck12.org 219
Review Answers
1. 13 inches2. Approximately 6860 sheets3. $504. 0.06 seconds5. Approximately $5656. 85.45 cm2
7. 0.293 GB/cm2
Texas Instruments Resources
In the CK-12 Texas Instruments Algebra I FlexBook, there are graphing calculator activities designed to supple-ment the objectives for some of the lessons in this chapter. See http://www.ck12.org/flexr/chapter/9613.
CHAPTER 3. EQUATIONS OF LINES
220 www.ck12.org
CHAPTER 4 Graphs of Equations andFunctions
CHAPTER OUTLINE
4.1 THE COORDINATE PLANE
4.2 GRAPHS OF LINEAR EQUATIONS
4.3 GRAPHING USING INTERCEPTS
4.4 SLOPE AND RATE OF CHANGE
4.5 GRAPHS USING SLOPE-INTERCEPT FORM
4.6 DIRECT VARIATION MODELS
4.7 LINEAR FUNCTION GRAPHS
4.8 PROBLEM-SOLVING STRATEGIES - GRAPHS
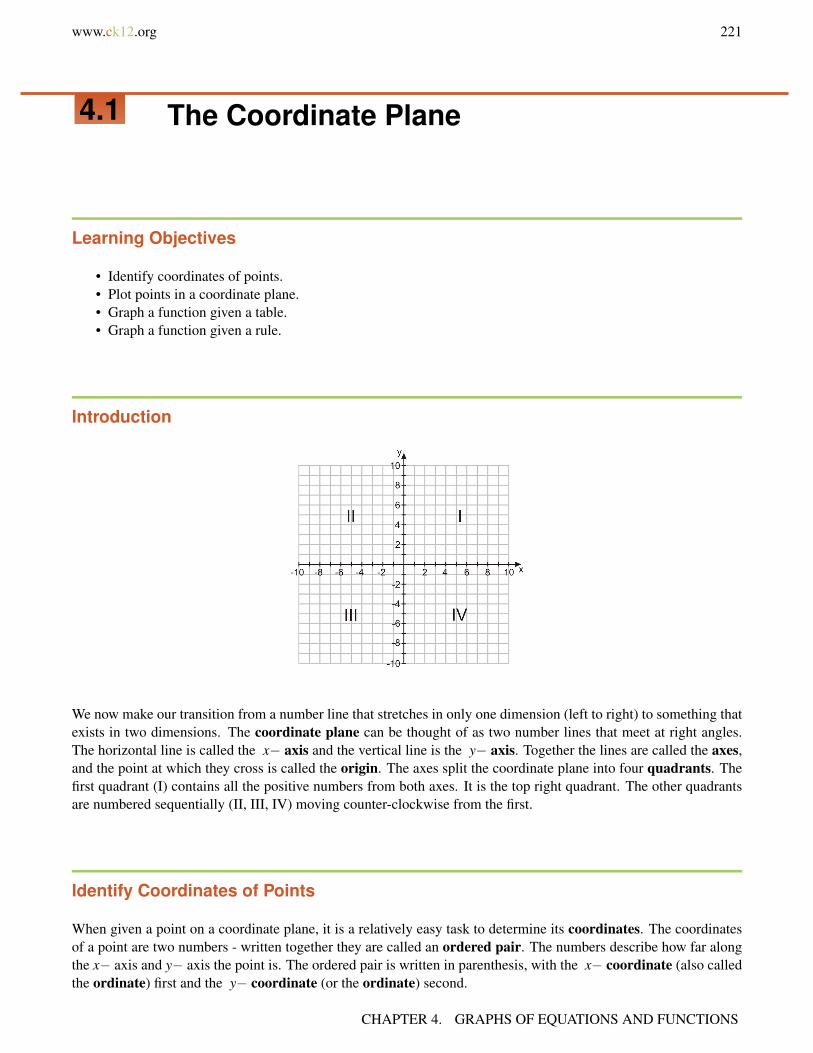
www.ck12.org 221
4.1 The Coordinate Plane
Learning Objectives
• Identify coordinates of points.• Plot points in a coordinate plane.• Graph a function given a table.• Graph a function given a rule.
Introduction
We now make our transition from a number line that stretches in only one dimension (left to right) to something thatexists in two dimensions. The coordinate plane can be thought of as two number lines that meet at right angles.The horizontal line is called the x− axis and the vertical line is the y− axis. Together the lines are called the axes,and the point at which they cross is called the origin. The axes split the coordinate plane into four quadrants. Thefirst quadrant (I) contains all the positive numbers from both axes. It is the top right quadrant. The other quadrantsare numbered sequentially (II, III, IV) moving counter-clockwise from the first.
Identify Coordinates of Points
When given a point on a coordinate plane, it is a relatively easy task to determine its coordinates. The coordinatesof a point are two numbers - written together they are called an ordered pair. The numbers describe how far alongthe x− axis and y− axis the point is. The ordered pair is written in parenthesis, with the x− coordinate (also calledthe ordinate) first and the y− coordinate (or the ordinate) second.
CHAPTER 4. GRAPHS OF EQUATIONS AND FUNCTIONS
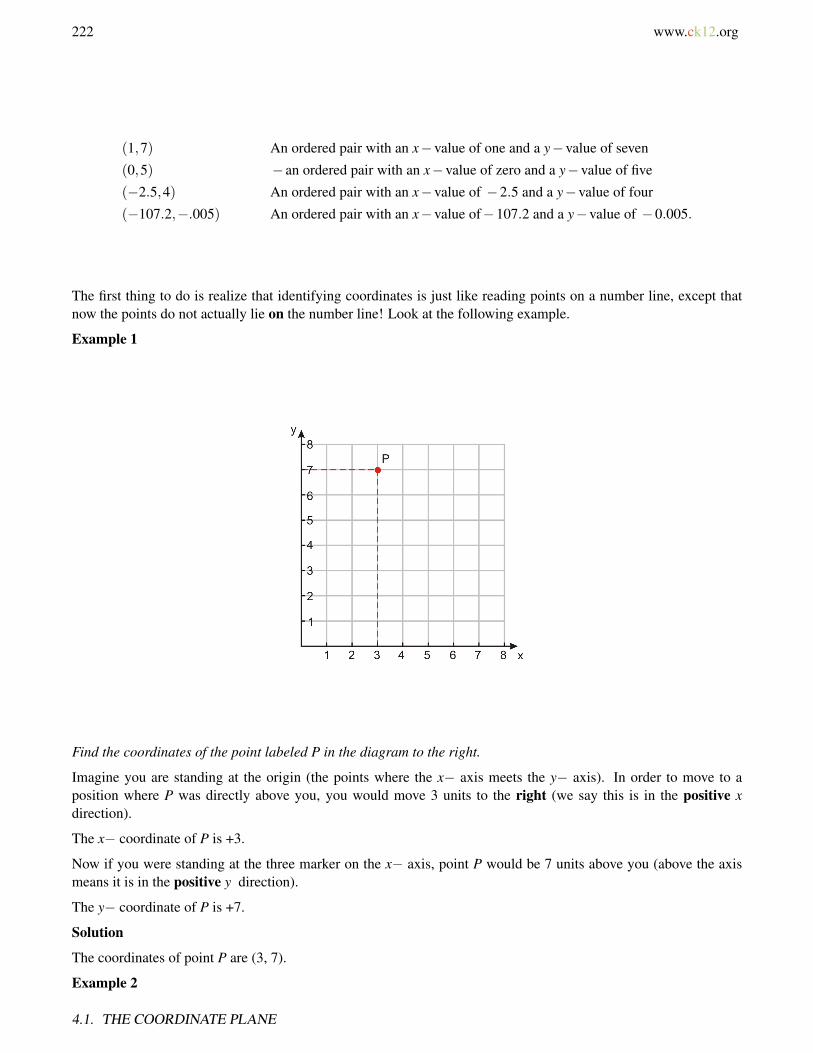
222 www.ck12.org
(1,7) An ordered pair with an x−value of one and a y−value of seven
(0,5) − an ordered pair with an x−value of zero and a y−value of five
(−2.5,4) An ordered pair with an x−value of −2.5 and a y−value of four
(−107.2,−.005) An ordered pair with an x−value of−107.2 and a y−value of −0.005.
The first thing to do is realize that identifying coordinates is just like reading points on a number line, except thatnow the points do not actually lie on the number line! Look at the following example.
Example 1
Find the coordinates of the point labeled P in the diagram to the right.
Imagine you are standing at the origin (the points where the x− axis meets the y− axis). In order to move to aposition where P was directly above you, you would move 3 units to the right (we say this is in the positive xdirection).
The x− coordinate of P is +3.
Now if you were standing at the three marker on the x− axis, point P would be 7 units above you (above the axismeans it is in the positive y direction).
The y− coordinate of P is +7.
Solution
The coordinates of point P are (3, 7).
Example 2
4.1. THE COORDINATE PLANE

www.ck12.org 223
Find the coordinates of the points labeled Q and R in the diagram to the right.
In order to get to Q we move three units to the right, in the positive −x direction, then two units down. This time weare moving in the negative y direction. The x coordinate of Q is +3, the y coordinate of Q is -2.
The coordinates of R are found in a similar way. The x coordinate is +5 (five units in positive x ) and the y−coordinate is again -2.
Solution
Q(3,−2)
R(5,−2)
Example 3
Triangle ABC is shown in the diagram to the right. Find the coordinates of the vertices A,B and C .
Point A :
x− coordinate =−2
y− coordinate =+5
Point B :
x− coordinate =+3
y− coordinate =−3
Point C :
CHAPTER 4. GRAPHS OF EQUATIONS AND FUNCTIONS

224 www.ck12.org
x− coordinate =−4
y− coordinate =−1
Solution
A(−2,5)B(3,−3)C(−4,−1)
Plot Points in a Coordinate Plane
Plotting points is a simple matter once you understand how to read coordinates and read the scale on a graph. As anote on scale, in the next two examples pay close attention to the labels on the axes.
Example 4
Plot the following points on the coordinate plane.
A(2,7) B(−5,6) C(−6,0) D(−3,−3) E(0,2) F(7,−5)
Point A(2,7) is 2 units right, 7 units up. It is in Quadrant I.
Point B(−5,6) is 5 units left, 6 units up. It is in Quadrant II.
Point C(−6,0) is 6 units left, 0 units up. It is on the x axis.
Point D(−3,−3) is 3 units left, 3 units down. It is in Quadrant III.
Point E(0,2) is 2 units up from the origin. It is on the y axis.
Point F(7,−5) is 7 units right, 5 units down. It is in Quadrant IV.
Example 5
Plot the following points on the coordinate plane.
A(2.5,0.5) B(π,1.2) C(2,1.75) D(0.1,1.2) E(0,0)
4.1. THE COORDINATE PLANE
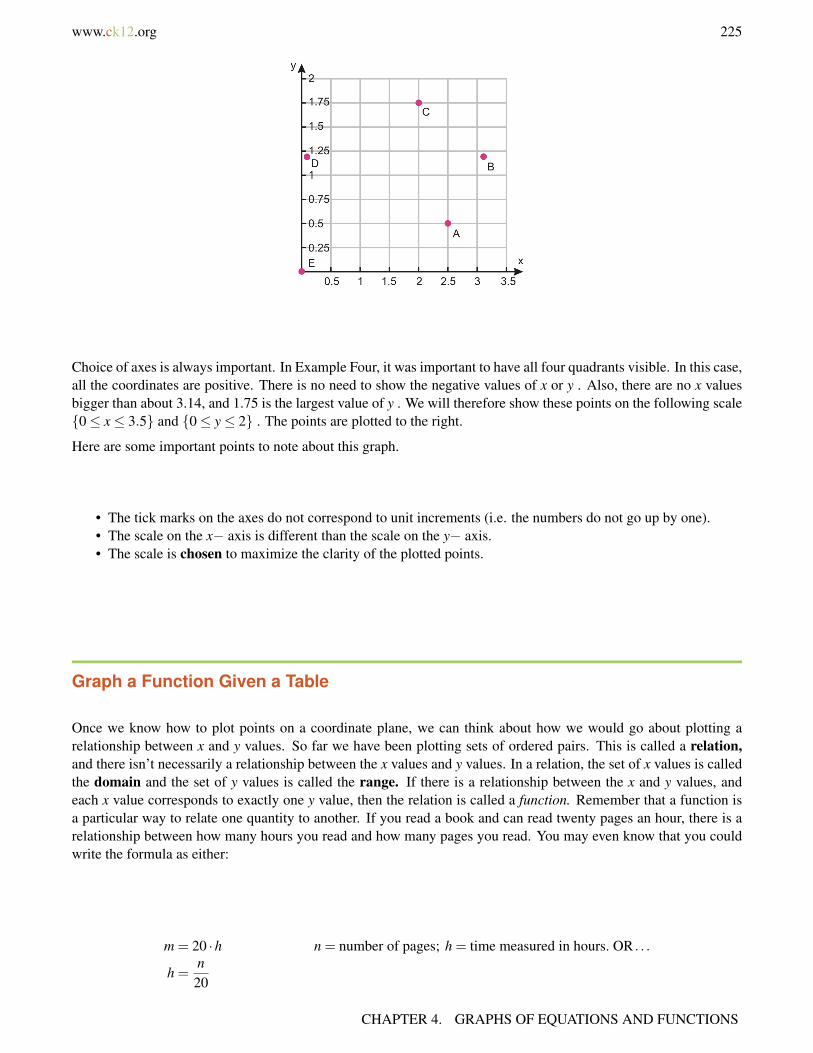
www.ck12.org 225
Choice of axes is always important. In Example Four, it was important to have all four quadrants visible. In this case,all the coordinates are positive. There is no need to show the negative values of x or y . Also, there are no x valuesbigger than about 3.14, and 1.75 is the largest value of y . We will therefore show these points on the following scale0≤ x≤ 3.5 and 0≤ y≤ 2 . The points are plotted to the right.
Here are some important points to note about this graph.
• The tick marks on the axes do not correspond to unit increments (i.e. the numbers do not go up by one).• The scale on the x− axis is different than the scale on the y− axis.• The scale is chosen to maximize the clarity of the plotted points.
Graph a Function Given a Table
Once we know how to plot points on a coordinate plane, we can think about how we would go about plotting arelationship between x and y values. So far we have been plotting sets of ordered pairs. This is called a relation,and there isn’t necessarily a relationship between the x values and y values. In a relation, the set of x values is calledthe domain and the set of y values is called the range. If there is a relationship between the x and y values, andeach x value corresponds to exactly one y value, then the relation is called a function. Remember that a function isa particular way to relate one quantity to another. If you read a book and can read twenty pages an hour, there is arelationship between how many hours you read and how many pages you read. You may even know that you couldwrite the formula as either:
m = 20 ·h n = number of pages; h = time measured in hours. OR . . .
h =n
20
CHAPTER 4. GRAPHS OF EQUATIONS AND FUNCTIONS
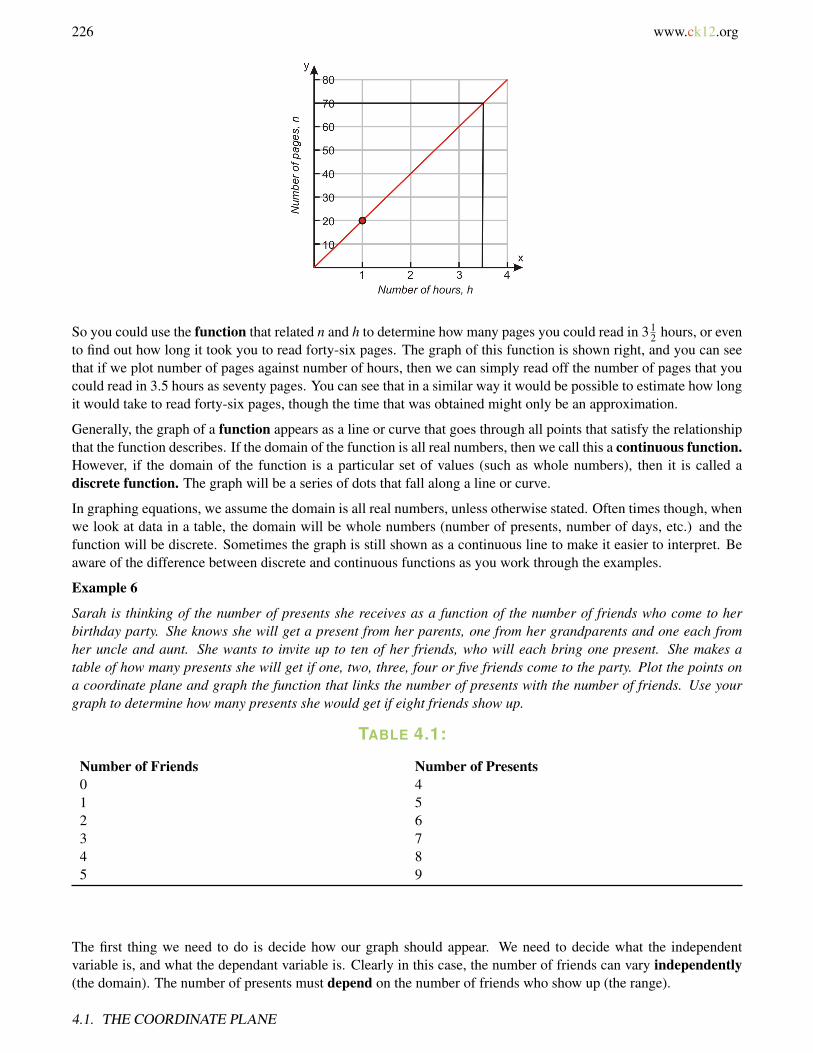
226 www.ck12.org
So you could use the function that related n and h to determine how many pages you could read in 3 12 hours, or even
to find out how long it took you to read forty-six pages. The graph of this function is shown right, and you can seethat if we plot number of pages against number of hours, then we can simply read off the number of pages that youcould read in 3.5 hours as seventy pages. You can see that in a similar way it would be possible to estimate how longit would take to read forty-six pages, though the time that was obtained might only be an approximation.
Generally, the graph of a function appears as a line or curve that goes through all points that satisfy the relationshipthat the function describes. If the domain of the function is all real numbers, then we call this a continuous function.However, if the domain of the function is a particular set of values (such as whole numbers), then it is called adiscrete function. The graph will be a series of dots that fall along a line or curve.
In graphing equations, we assume the domain is all real numbers, unless otherwise stated. Often times though, whenwe look at data in a table, the domain will be whole numbers (number of presents, number of days, etc.) and thefunction will be discrete. Sometimes the graph is still shown as a continuous line to make it easier to interpret. Beaware of the difference between discrete and continuous functions as you work through the examples.
Example 6
Sarah is thinking of the number of presents she receives as a function of the number of friends who come to herbirthday party. She knows she will get a present from her parents, one from her grandparents and one each fromher uncle and aunt. She wants to invite up to ten of her friends, who will each bring one present. She makes atable of how many presents she will get if one, two, three, four or five friends come to the party. Plot the points ona coordinate plane and graph the function that links the number of presents with the number of friends. Use yourgraph to determine how many presents she would get if eight friends show up.
TABLE 4.1:
Number of Friends Number of Presents0 41 52 63 74 85 9
The first thing we need to do is decide how our graph should appear. We need to decide what the independentvariable is, and what the dependant variable is. Clearly in this case, the number of friends can vary independently(the domain). The number of presents must depend on the number of friends who show up (the range).
4.1. THE COORDINATE PLANE

www.ck12.org 227
We will therefore plot friends on the x− axis and presents on the y− axis. Let’s add another column to our tablecontaining the coordinates that each (friends, presents) ordered pair gives us.
TABLE 4.2:
No. of friends (x) no. of presents (y) coordinates (x,y)0 4 (0, 4)1 5 (1, 5)2 6 (2, 6)3 7 (3, 7)4 8 (4, 8)5 9 (5, 9)
Next we need to set up our axes. It is clear that the number of friends and number of presents both must be positive,so we do not need to worry about anything other than Quadrant I. We need to choose a suitable scale for the x and yaxes. We need to consider no more than eight friends (look again at the question to confirm this), but it always paysto allow a little extra room on your graph. We also need the y scale to accommodate the presents for eight people.We can see that this is still going to be under 20!
The scale of the graph on the right shows room for up to 12 friends and 15 presents. This will be fine, but there aremany other scales that would be equally as good!
Now we proceed to plot the points. The first five points are the coordinates from our table. You can see they alllay on a straight line, so the function that describes the relationship between x and y will be linear. To graph thefunction, we simply draw a line that goes through all five points. This line represents the function.
This is a discrete problem since Sarah can only invite a whole numbers of friends. For instance, it would beimpossible for 2.4 friends to show up. Keep in mind that the only permissible points for the function are those pointson the line which have integer x and y values.
The graph easily lets us find other values for the function. For example, the question asks how many presents Sarahwould get if eight friends come to her party. Don’t forget that x represents the number of friends and y representsthe number of presents. If we look at x = 8 we can see that the function has a y value of 12.
Solution
If 8 friends show up, Sarah will receive a total of 12 presents.
CHAPTER 4. GRAPHS OF EQUATIONS AND FUNCTIONS

228 www.ck12.org
Graph a Function Given a Rule
If we are given a rule instead of a table, we can proceed to graph the function in one of two ways. We will use thefollowing example to show each way.
Example 7
Ali is trying to work out a trick that his friend showed him. His friend started by asking him to think of a number.Then double it. Then add five to what he got. Ali has written down a rule to describe the first part of the trick. He isusing the letter x to stand for the number he thought of and the letter y to represent the result of applying the rule.He wrote his rule in the form of an equation.
y = 2x+5
Help him visualize what is going on by graphing the function that this rule describes.
Method One - Construct a Table of Values
If we wish to plot a few points to see what is going on with this function, then the best way is to construct a tableand populate it with a few x,y pairs. We will use 0, 1, 2 and 3 for x values.
TABLE 4.3:
x y0 2 ·0+5 = 0+5 = 51 2 ·1+5 = 2+5 = 72 2 ·2+5 = 4+5 = 93 2 ·3+5 = 6+5 = 11
Next, we plot the points and join them with our line.
This method is nice and simple. Plus, with linear relationships there is no need to plot more than two or three points.In this case, the function is continuous because the domain (the number Ali is asked to think of) is all real numbers,even though he may only be thinking of positive whole numbers.
4.1. THE COORDINATE PLANE

www.ck12.org 229
Method Two - Intercept and Slope
One other way to graph this function (and one that we will learn in more detail in the next lesson) is the slope-intercept method. To do this, follow the following steps:
1. Find the y value when x = 0 .
y(0) = 2 ·0+5 = 5 So our y− intercept is (0, 5)
2. Look at the coefficient multiplying the x .
Every time we increase x by one, y increases by two so our slope is +2.
3. Plot the line with the given slope that goes through the intercept. We start at the point (0, 5) and move over one inthe x direction, then up two in the y direction. This gives the slope for our line, which we extend in both directions.
We will properly examine this last method in the next lesson!
Lesson Summary
• The coordinate plane is a two-dimensional space defined by a horizontal number line (the x− axis) anda vertical number line (the y− axis). The origin is the point where these two lines meet. Four areas, orquadrants, are formed as shown in the diagram at right.
CHAPTER 4. GRAPHS OF EQUATIONS AND FUNCTIONS

230 www.ck12.org
• Each point on the coordinate plane has a set of coordinates, two numbers written as an ordered pair whichdescribe how far along the x− axis and y− axis the point is. The x− coordinate is always written first, thenthe y− coordinate. Here is an exaxmple (x,y) .
• Functions are a way that we can relate one quantity to another. Functions can be plotted on the coordinateplane.
Review Questions
1. Identify the coordinates of each point, A−F , on the graph to the right.2. Plot the following points on a graph and identify which quadrant each point lies in:
a. (4, 2)b. (-3, 5.5)c. (4, -4)d. (-2, -3)
3. The following three points are three vertices of square ABCD . Plot them on a graph then determine what thecoordinates of the fourth point, D , would be. Plot that point and label it. A(−4,−4)B(3,−4)C(3,3)
4. Becky has a large bag of M#38;Ms that she knows she should share with Jaeyun. Jaeyun has a packet ofStarburst. Becky tells Jaeyun that for every Starburst he gives her, she will give him three M#38;Ms in return.If x is the number of Starburst that Jaeyun gives Becky, and y is the number of M#38;Ms he gets in return thencomplete each of the following.
a. Write an algebraic rule for y in terms of xb. Make a table of values for y with x values of 0, 1, 2, 3, 4, 5.c. Plot the function linking x and y on the following scale 0≤ x≤ 10,0≤ y≤ 10 .
Review Answers
1. A(5,6) B(−5,5) C(−2,3) D(−2,−2) E(3,−4) F(2,−6)
4.1. THE COORDINATE PLANE
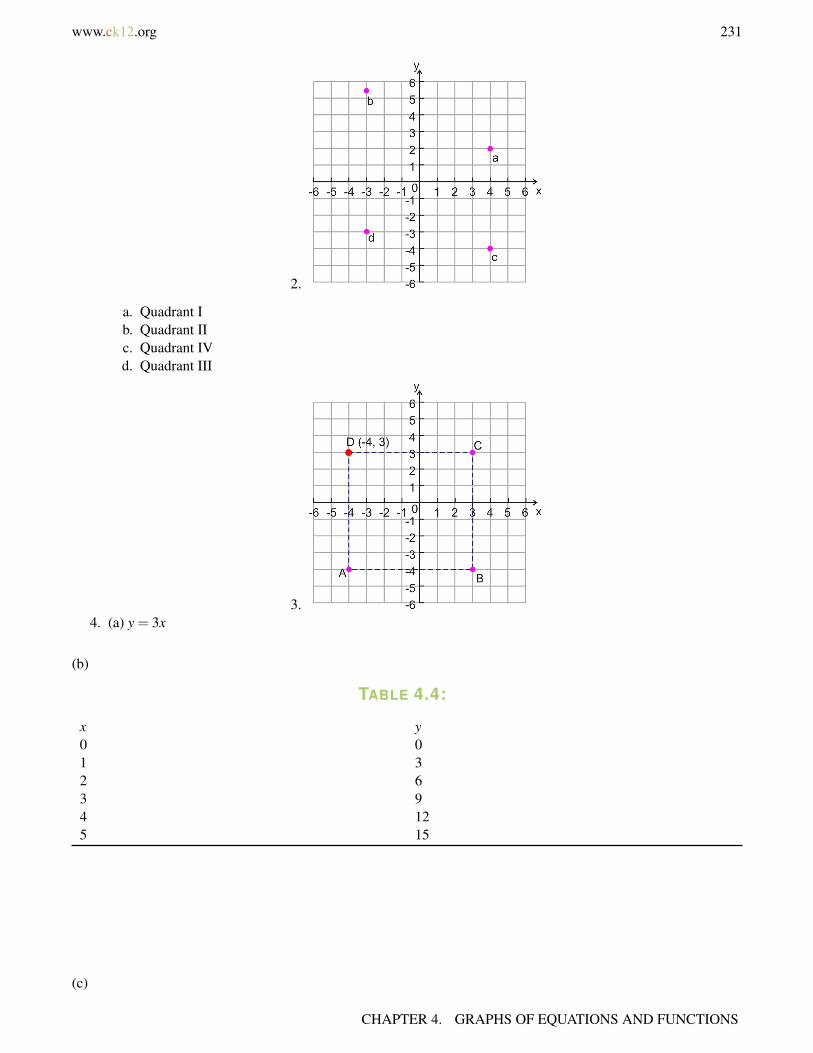
www.ck12.org 231
2.
a. Quadrant Ib. Quadrant IIc. Quadrant IVd. Quadrant III
3.4. (a) y = 3x
(b)
TABLE 4.4:
x y0 01 32 63 94 125 15
(c)
CHAPTER 4. GRAPHS OF EQUATIONS AND FUNCTIONS
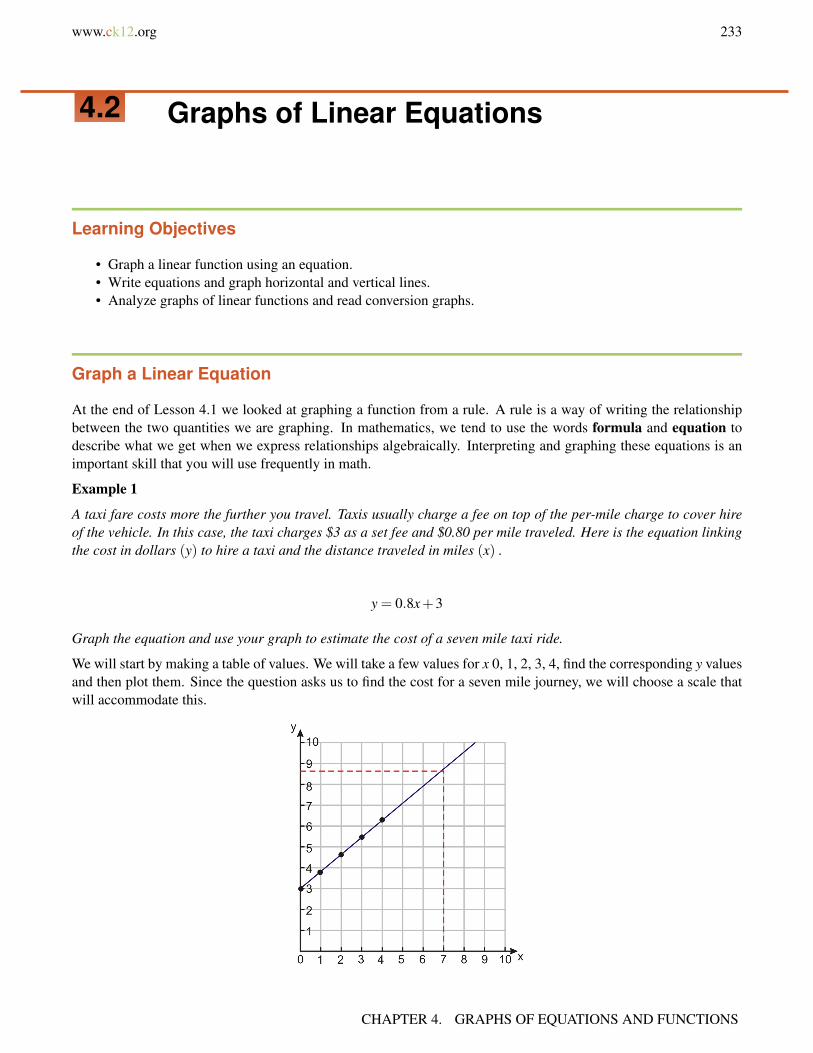
www.ck12.org 233
4.2 Graphs of Linear Equations
Learning Objectives
• Graph a linear function using an equation.• Write equations and graph horizontal and vertical lines.• Analyze graphs of linear functions and read conversion graphs.
Graph a Linear Equation
At the end of Lesson 4.1 we looked at graphing a function from a rule. A rule is a way of writing the relationshipbetween the two quantities we are graphing. In mathematics, we tend to use the words formula and equation todescribe what we get when we express relationships algebraically. Interpreting and graphing these equations is animportant skill that you will use frequently in math.
Example 1
A taxi fare costs more the further you travel. Taxis usually charge a fee on top of the per-mile charge to cover hireof the vehicle. In this case, the taxi charges $3 as a set fee and $0.80 per mile traveled. Here is the equation linkingthe cost in dollars (y) to hire a taxi and the distance traveled in miles (x) .
y = 0.8x+3
Graph the equation and use your graph to estimate the cost of a seven mile taxi ride.
We will start by making a table of values. We will take a few values for x 0, 1, 2, 3, 4, find the corresponding y valuesand then plot them. Since the question asks us to find the cost for a seven mile journey, we will choose a scale thatwill accommodate this.
CHAPTER 4. GRAPHS OF EQUATIONS AND FUNCTIONS
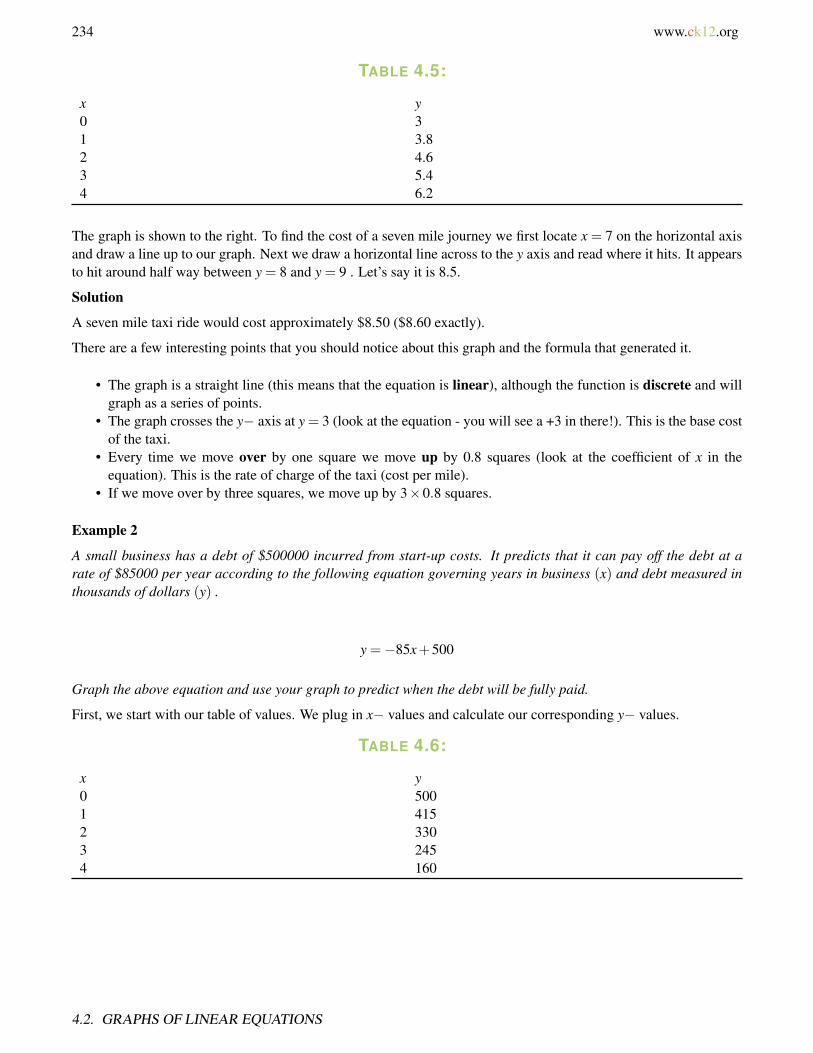
234 www.ck12.org
TABLE 4.5:
x y0 31 3.82 4.63 5.44 6.2
The graph is shown to the right. To find the cost of a seven mile journey we first locate x = 7 on the horizontal axisand draw a line up to our graph. Next we draw a horizontal line across to the y axis and read where it hits. It appearsto hit around half way between y = 8 and y = 9 . Let’s say it is 8.5.
Solution
A seven mile taxi ride would cost approximately $8.50 ($8.60 exactly).
There are a few interesting points that you should notice about this graph and the formula that generated it.
• The graph is a straight line (this means that the equation is linear), although the function is discrete and willgraph as a series of points.
• The graph crosses the y− axis at y = 3 (look at the equation - you will see a +3 in there!). This is the base costof the taxi.
• Every time we move over by one square we move up by 0.8 squares (look at the coefficient of x in theequation). This is the rate of charge of the taxi (cost per mile).
• If we move over by three squares, we move up by 3×0.8 squares.
Example 2
A small business has a debt of $500000 incurred from start-up costs. It predicts that it can pay off the debt at arate of $85000 per year according to the following equation governing years in business (x) and debt measured inthousands of dollars (y) .
y =−85x+500
Graph the above equation and use your graph to predict when the debt will be fully paid.
First, we start with our table of values. We plug in x− values and calculate our corresponding y− values.
TABLE 4.6:
x y0 5001 4152 3303 2454 160
4.2. GRAPHS OF LINEAR EQUATIONS
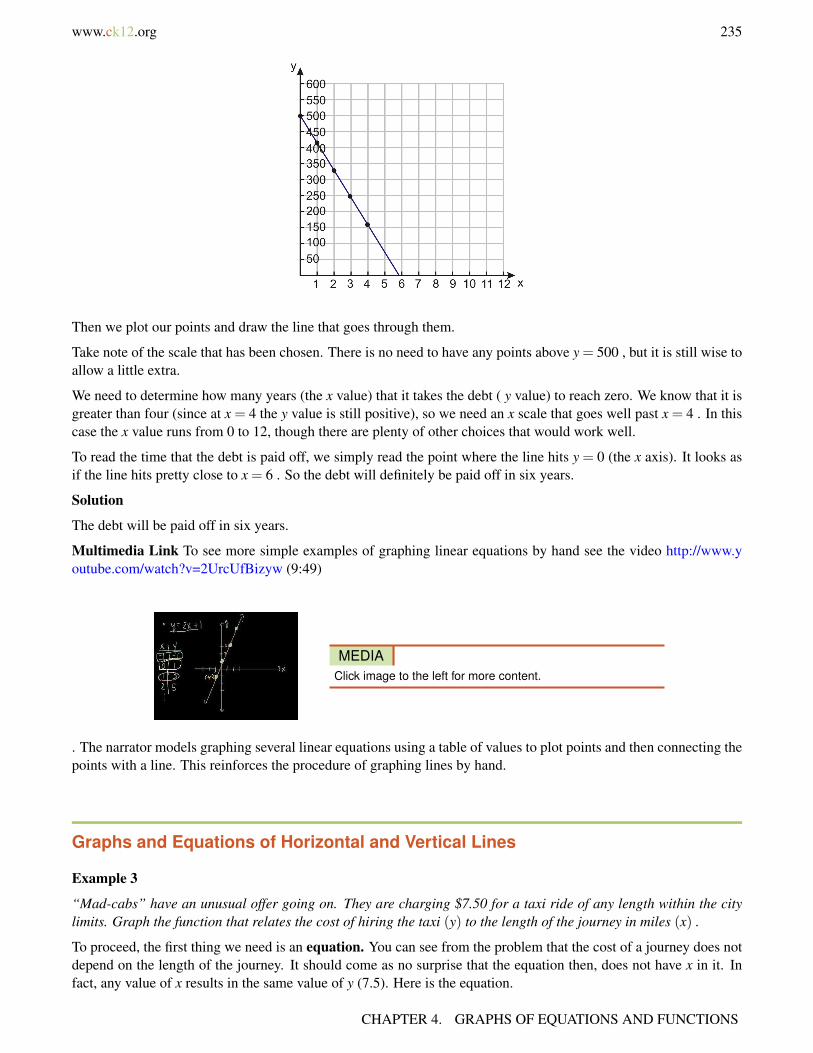
www.ck12.org 235
Then we plot our points and draw the line that goes through them.
Take note of the scale that has been chosen. There is no need to have any points above y = 500 , but it is still wise toallow a little extra.
We need to determine how many years (the x value) that it takes the debt ( y value) to reach zero. We know that it isgreater than four (since at x = 4 the y value is still positive), so we need an x scale that goes well past x = 4 . In thiscase the x value runs from 0 to 12, though there are plenty of other choices that would work well.
To read the time that the debt is paid off, we simply read the point where the line hits y = 0 (the x axis). It looks asif the line hits pretty close to x = 6 . So the debt will definitely be paid off in six years.
Solution
The debt will be paid off in six years.
Multimedia Link To see more simple examples of graphing linear equations by hand see the video http://www.youtube.com/watch?v=2UrcUfBizyw (9:49)
MEDIAClick image to the left for more content.
. The narrator models graphing several linear equations using a table of values to plot points and then connecting thepoints with a line. This reinforces the procedure of graphing lines by hand.
Graphs and Equations of Horizontal and Vertical Lines
Example 3
“Mad-cabs” have an unusual offer going on. They are charging $7.50 for a taxi ride of any length within the citylimits. Graph the function that relates the cost of hiring the taxi (y) to the length of the journey in miles (x) .
To proceed, the first thing we need is an equation. You can see from the problem that the cost of a journey does notdepend on the length of the journey. It should come as no surprise that the equation then, does not have x in it. Infact, any value of x results in the same value of y (7.5). Here is the equation.
CHAPTER 4. GRAPHS OF EQUATIONS AND FUNCTIONS

236 www.ck12.org
y = 7.5
The graph of this function is shown to the right. You can see that the graph y = 7.5 is simply a horizontal line.
Any time you see an equation of the form y = constant then the graph is a horizontal line that intercepts the y− axisat the value of the constant.
Similarly, when you see an equation of the form x = constant then the graph is a vertical line that intercepts the x−axis at the value of the constant. Notice that this a relation, and not a function because each x value (there’s only onein this case) corresponds to many (actually an infinite number) y values.
Example 4
Plot the following graphs.
(a) y = 4
(b) y =−4
(c) x = 4
(d) x =−4
(a) y = 4 is a horizontal line that crosses the y− axis at 4
(b) y =−4 is a horizontal line that crosses the y− axis at -4
4.2. GRAPHS OF LINEAR EQUATIONS
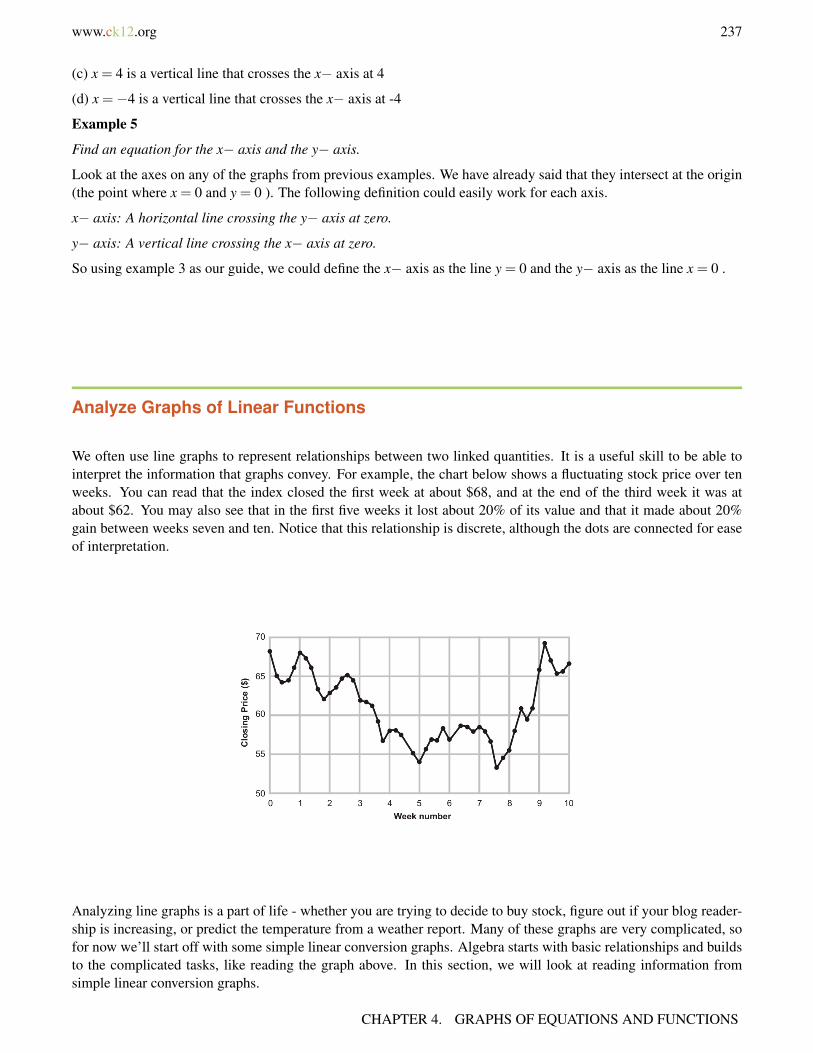
www.ck12.org 237
(c) x = 4 is a vertical line that crosses the x− axis at 4
(d) x =−4 is a vertical line that crosses the x− axis at -4
Example 5
Find an equation for the x− axis and the y− axis.
Look at the axes on any of the graphs from previous examples. We have already said that they intersect at the origin(the point where x = 0 and y = 0 ). The following definition could easily work for each axis.
x− axis: A horizontal line crossing the y− axis at zero.
y− axis: A vertical line crossing the x− axis at zero.
So using example 3 as our guide, we could define the x− axis as the line y = 0 and the y− axis as the line x = 0 .
Analyze Graphs of Linear Functions
We often use line graphs to represent relationships between two linked quantities. It is a useful skill to be able tointerpret the information that graphs convey. For example, the chart below shows a fluctuating stock price over tenweeks. You can read that the index closed the first week at about $68, and at the end of the third week it was atabout $62. You may also see that in the first five weeks it lost about 20% of its value and that it made about 20%gain between weeks seven and ten. Notice that this relationship is discrete, although the dots are connected for easeof interpretation.
Analyzing line graphs is a part of life - whether you are trying to decide to buy stock, figure out if your blog reader-ship is increasing, or predict the temperature from a weather report. Many of these graphs are very complicated, sofor now we’ll start off with some simple linear conversion graphs. Algebra starts with basic relationships and buildsto the complicated tasks, like reading the graph above. In this section, we will look at reading information fromsimple linear conversion graphs.
CHAPTER 4. GRAPHS OF EQUATIONS AND FUNCTIONS

238 www.ck12.org
Example 6
The graph shown at the right shows a chart for converting marked prices in a downtown store into prices that includesales tax. Use the graph to determine the cost inclusive of sales tax for a $6.00 pen in the store.
To find the relevant price with tax we find the correct pre-tax price on the x− axis. This is the point x = 6 .
Draw the line x = 6 up until it meets the function, then draw a horizontal line to the y− axis. This line hits at y≈ 6.75(about three fourths of the way from y = 6 to y = 7 ).
Solution
The approximate cost including tax is $6.75
Example 7
The chart for converting temperature from Fahrenheit to Celsius is shown to the right. Use the graph to convert thefollowing:
a. 70 Fahrenheit to Celsiusb. 0 Fahrenheit to Celsiusc. 30 Celsius to Fahrenheitd. 0 Celsius to Fahrenheit
1. To find 70 Fahrenheit we look along the Fahrenheit-axis (in other words the x− axis) and draw the line x = 70up to the function. We then draw a horizontal line to the Celsius-axis ( y− axis). The horizontal line hits the axis ata little over 20 (21 or 22).
Solution
4.2. GRAPHS OF LINEAR EQUATIONS
www.ck12.org 239
70 Fahrenheit is approximately equivalent to 21 Celsius
2. To find 0 Fahrenheit, we are actually looking at the y− axis. Don’t forget that this axis is simply the line x = 0 .We just look to see where the line hits the y− axis. It hits just below the half way point between -15 and -20.
Solution
0 Fahrenheit is approximately equivalent to −18 Celsius.
3. To find 30 Celsius, we look up the Celsius-axis and draw the line y = 30 along to the function. When this hori-zontal line hits the function, draw a line straight down to the Fahrenheit-axis. The line hits the axis at approximately85.
Solution
30 Celsius is approximately equivalent to 85 Fahrenheit.
4. To find 0 Celsius we are looking at the Fahrenheit-axis (the line y = 0 ). We just look to see where the functionhits the x− axis. It hits just right of 30.
Solution
0 Celsius is equivalent to 32 Fahrenheit.
Lesson Summary
• Equations with the variables y and x can be graphed by making a chart of values that fit the equation and thenplotting the values on a coordinate plane. This graph is simply another representation of the equation and canbe analyzed to solve problems.
• Horizontal lines are defined by the equation y = constant and vertical lines are defined by the equation x =constant .
• Be aware that although we graph the function as a line to make it easier to interpret, the function may actuallybe discrete.
Review Questions
1. Make a table of values for the following equations and then graph them.
a. y = 2x+7b. y = 0.7x−4c. y = 6−1.25x
2. “Think of a number. Triple it, and then subtract seven from your answer”. Make a table of values and plotthe function that represents this sentence.
CHAPTER 4. GRAPHS OF EQUATIONS AND FUNCTIONS

240 www.ck12.org
3. Write the equations for the five ( A through E ) lines plotted in the graph to the right.4. At the Airport, you can change your money from dollars into Euros. The service costs $5, and for every
additional dollar you get 0.7 Euros. Make a table for this and plot the function on a graph. Use your graph todetermine how many Euros you would get if you give the office $50.
5. The graph to below shows a conversion chart for converting between weight in kilograms to weight in pounds.Use it to convert the following measurements.
a. 4 kilograms into weight in poundsb. 9 kilograms into weight in poundsc. 12 pounds into weight in kilogramsd. 17 pounds into weight in kilograms
4.2. GRAPHS OF LINEAR EQUATIONS

www.ck12.org 241
Review Answers
1.2. y = 3x−7
3. A : y = 5, B : y =−2, C : y =−7, D : x =−4, E : x = 64. y = 0.7(x−5)
a. 9 lbb. 20 lbc. 5.5 kgd. 7.75 kg
CHAPTER 4. GRAPHS OF EQUATIONS AND FUNCTIONS
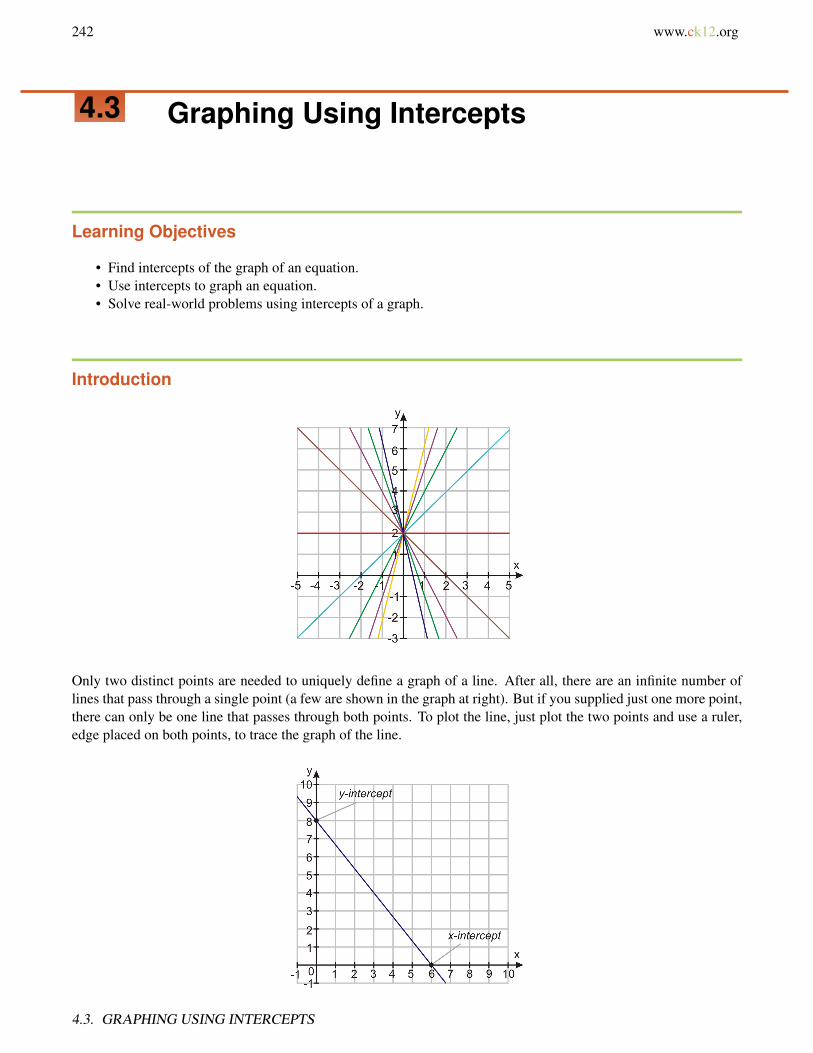
242 www.ck12.org
4.3 Graphing Using Intercepts
Learning Objectives
• Find intercepts of the graph of an equation.• Use intercepts to graph an equation.• Solve real-world problems using intercepts of a graph.
Introduction
Only two distinct points are needed to uniquely define a graph of a line. After all, there are an infinite number oflines that pass through a single point (a few are shown in the graph at right). But if you supplied just one more point,there can only be one line that passes through both points. To plot the line, just plot the two points and use a ruler,edge placed on both points, to trace the graph of the line.
4.3. GRAPHING USING INTERCEPTS
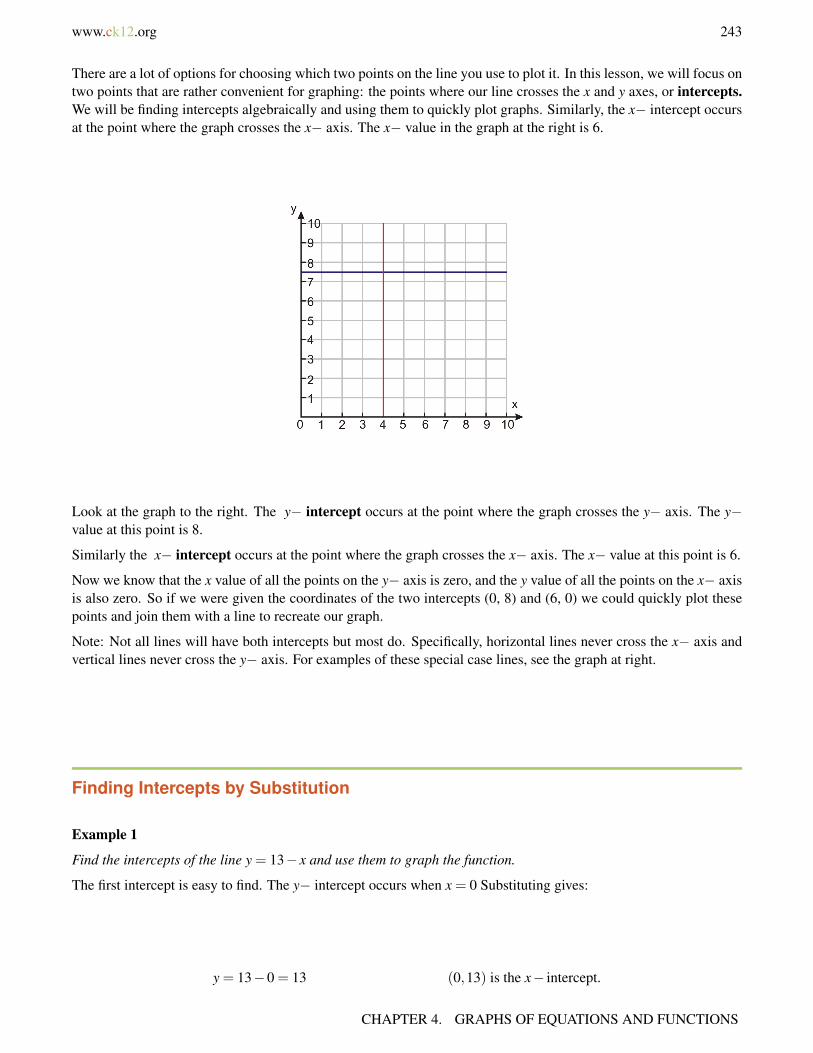
www.ck12.org 243
There are a lot of options for choosing which two points on the line you use to plot it. In this lesson, we will focus ontwo points that are rather convenient for graphing: the points where our line crosses the x and y axes, or intercepts.We will be finding intercepts algebraically and using them to quickly plot graphs. Similarly, the x− intercept occursat the point where the graph crosses the x− axis. The x− value in the graph at the right is 6.
Look at the graph to the right. The y− intercept occurs at the point where the graph crosses the y− axis. The y−value at this point is 8.
Similarly the x− intercept occurs at the point where the graph crosses the x− axis. The x− value at this point is 6.
Now we know that the x value of all the points on the y− axis is zero, and the y value of all the points on the x− axisis also zero. So if we were given the coordinates of the two intercepts (0, 8) and (6, 0) we could quickly plot thesepoints and join them with a line to recreate our graph.
Note: Not all lines will have both intercepts but most do. Specifically, horizontal lines never cross the x− axis andvertical lines never cross the y− axis. For examples of these special case lines, see the graph at right.
Finding Intercepts by Substitution
Example 1
Find the intercepts of the line y = 13− x and use them to graph the function.
The first intercept is easy to find. The y− intercept occurs when x = 0 Substituting gives:
y = 13−0 = 13 (0,13) is the x− intercept.
CHAPTER 4. GRAPHS OF EQUATIONS AND FUNCTIONS
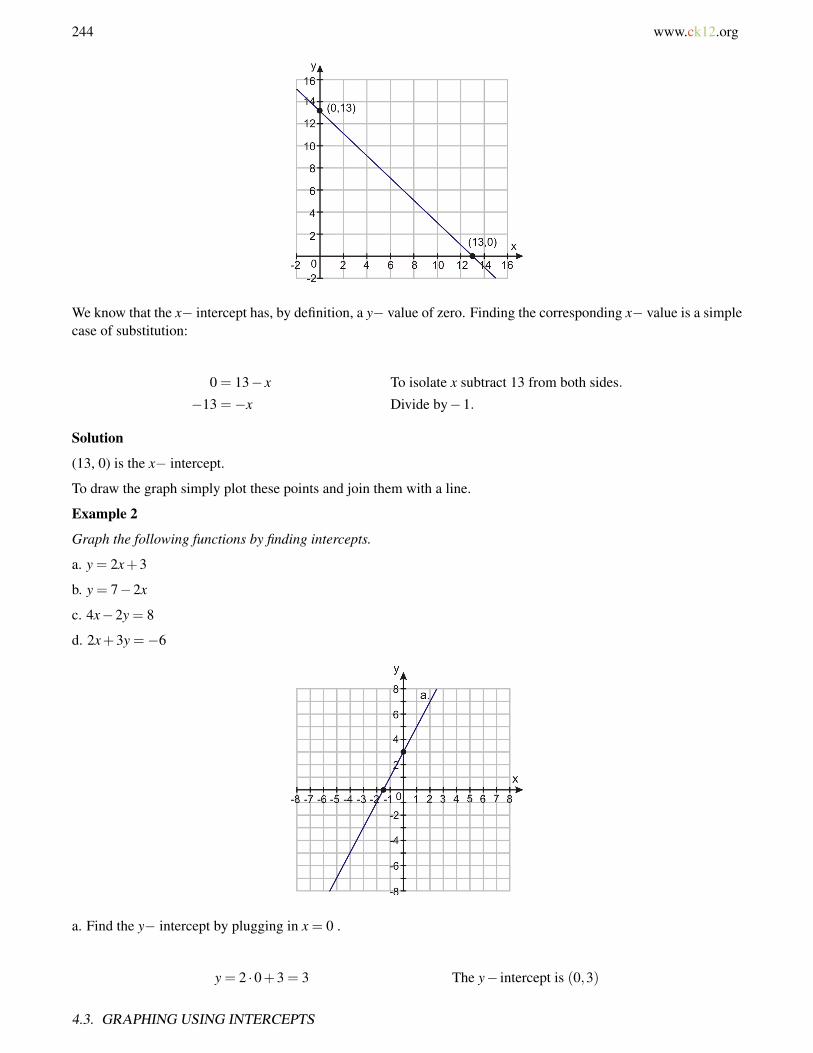
244 www.ck12.org
We know that the x− intercept has, by definition, a y− value of zero. Finding the corresponding x− value is a simplecase of substitution:
0 = 13− x To isolate x subtract 13 from both sides.
−13 =−x Divide by−1.
Solution
(13, 0) is the x− intercept.
To draw the graph simply plot these points and join them with a line.
Example 2
Graph the following functions by finding intercepts.
a. y = 2x+3
b. y = 7−2x
c. 4x−2y = 8
d. 2x+3y =−6
a. Find the y− intercept by plugging in x = 0 .
y = 2 ·0+3 = 3 The y− intercept is (0,3)
4.3. GRAPHING USING INTERCEPTS

www.ck12.org 245
Find the x− intercept by plugging in y = 0 .
0 = 2x+3 Subtract 3 from both sides.
−3 = 2x Divide by 2.
−32= x The x− intercept is (−1.5,0).
b. Find the y− intercept by plugging in x = 0 .
y = 7−2 ·0 = 7 The y− intercept is (0,7).
Find the x− intercept by plugging in y = 0 .
0 = 7−2x Subtract 7 from both sides.
−7 =−2x Divide by −2.72= x The x− intercept is (3.5,0).
CHAPTER 4. GRAPHS OF EQUATIONS AND FUNCTIONS

246 www.ck12.org
c. Find the y− intercept by plugging in x = 0 .
4 ·0−2y = 8
−2y = 8 Divide by −2.
y =−4 The y− intercept is (0,−4).
Find the x− intercept by plugging in y = 0 .
4x−2 ·0 = 8
4x = 8 Divide by 4.
x = 2 The x− intercept is (2,0).
d. Find the y− intercept by plugging in x = 0 .
2 ·0+3y =−6
3y =−6 Divide by 3.
y =−2 The y− intercept is (0,−2).
Find the x− intercept by plugging in y = 0 .
2x+3 ·0 =−6
2x =−6 Divide by 2.
x =−3 The x− intercept is (−3,0)
Finding Intercepts for Standard Form Equations Using the Cover-Up Method
Look at the last two equations in Example 2. These equations are written in standard form. Standard form equationsare always written “positive coefficient times x plus (or minus) positive coefficient times y equals value”. Note
4.3. GRAPHING USING INTERCEPTS
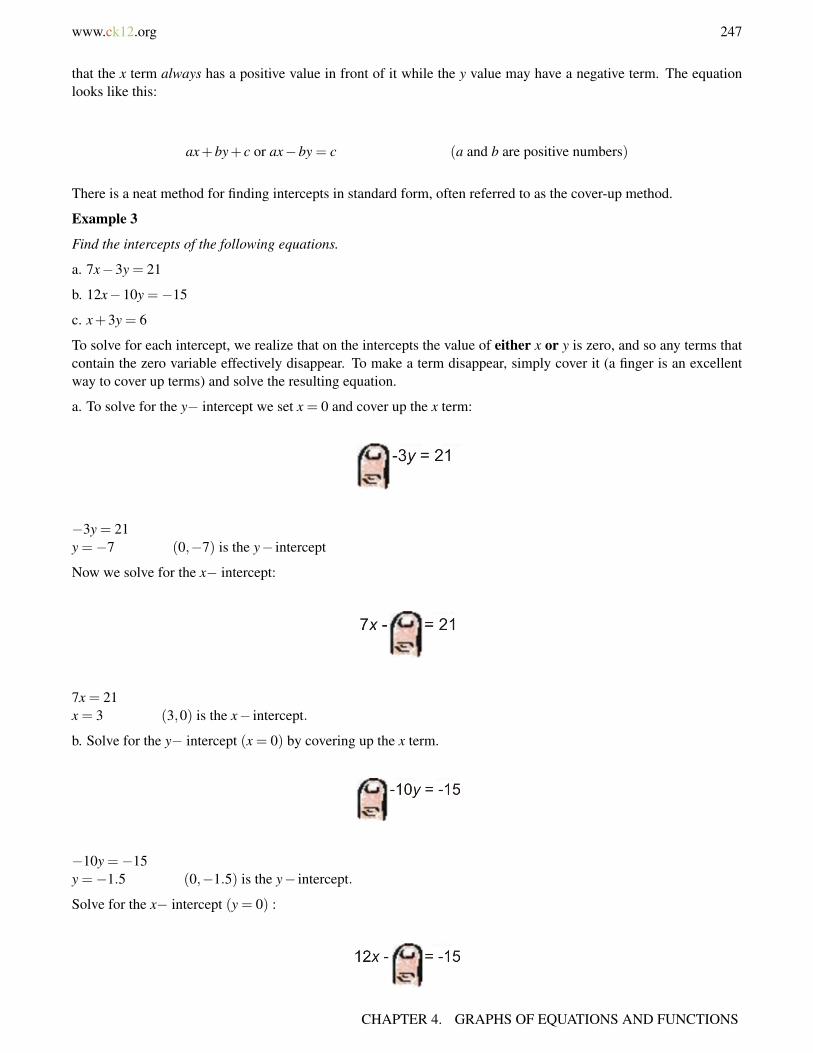
www.ck12.org 247
that the x term always has a positive value in front of it while the y value may have a negative term. The equationlooks like this:
ax+by+ c or ax−by = c (a and b are positive numbers)
There is a neat method for finding intercepts in standard form, often referred to as the cover-up method.
Example 3
Find the intercepts of the following equations.
a. 7x−3y = 21
b. 12x−10y =−15
c. x+3y = 6
To solve for each intercept, we realize that on the intercepts the value of either x or y is zero, and so any terms thatcontain the zero variable effectively disappear. To make a term disappear, simply cover it (a finger is an excellentway to cover up terms) and solve the resulting equation.
a. To solve for the y− intercept we set x = 0 and cover up the x term:
−3y = 21y =−7 (0,−7) is the y− intercept
Now we solve for the x− intercept:
7x = 21x = 3 (3,0) is the x− intercept.
b. Solve for the y− intercept (x = 0) by covering up the x term.
−10y =−15y =−1.5 (0,−1.5) is the y− intercept.
Solve for the x− intercept (y = 0) :
CHAPTER 4. GRAPHS OF EQUATIONS AND FUNCTIONS
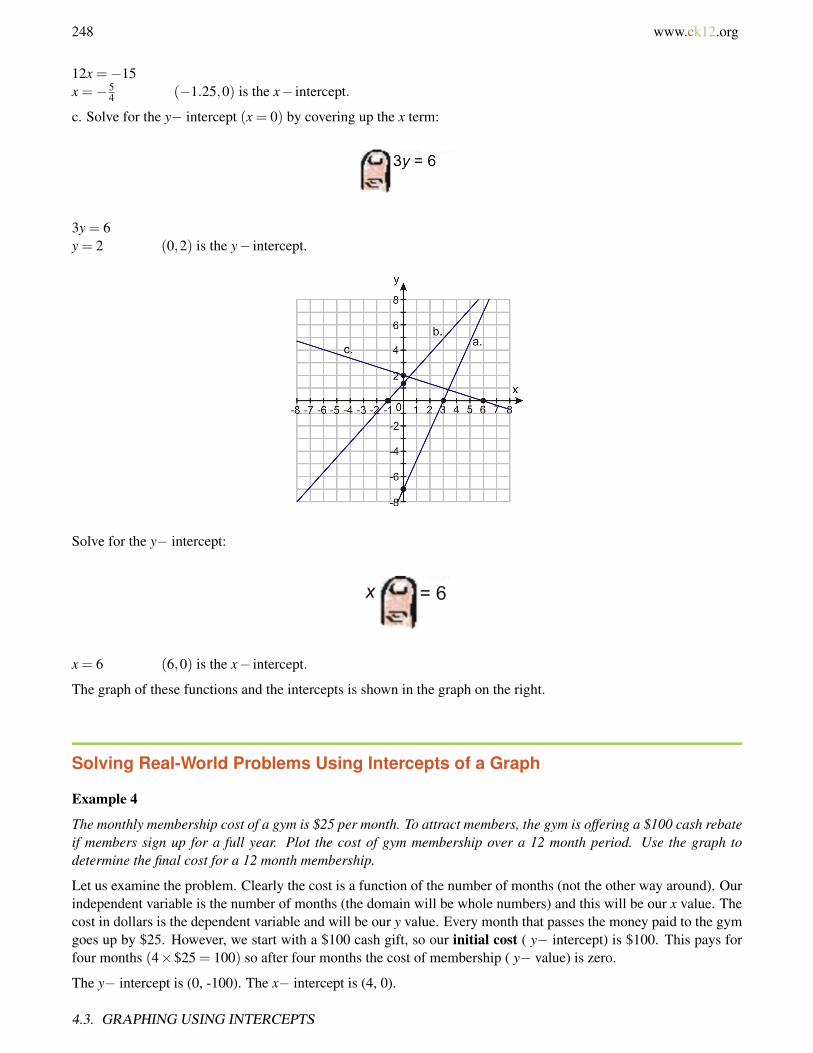
248 www.ck12.org
12x =−15x =−5
4 (−1.25,0) is the x− intercept.
c. Solve for the y− intercept (x = 0) by covering up the x term:
3y = 6y = 2 (0,2) is the y− intercept.
Solve for the y− intercept:
x = 6 (6,0) is the x− intercept.
The graph of these functions and the intercepts is shown in the graph on the right.
Solving Real-World Problems Using Intercepts of a Graph
Example 4
The monthly membership cost of a gym is $25 per month. To attract members, the gym is offering a $100 cash rebateif members sign up for a full year. Plot the cost of gym membership over a 12 month period. Use the graph todetermine the final cost for a 12 month membership.
Let us examine the problem. Clearly the cost is a function of the number of months (not the other way around). Ourindependent variable is the number of months (the domain will be whole numbers) and this will be our x value. Thecost in dollars is the dependent variable and will be our y value. Every month that passes the money paid to the gymgoes up by $25. However, we start with a $100 cash gift, so our initial cost ( y− intercept) is $100. This pays forfour months (4×$25 = 100) so after four months the cost of membership ( y− value) is zero.
The y− intercept is (0, -100). The x− intercept is (4, 0).
4.3. GRAPHING USING INTERCEPTS
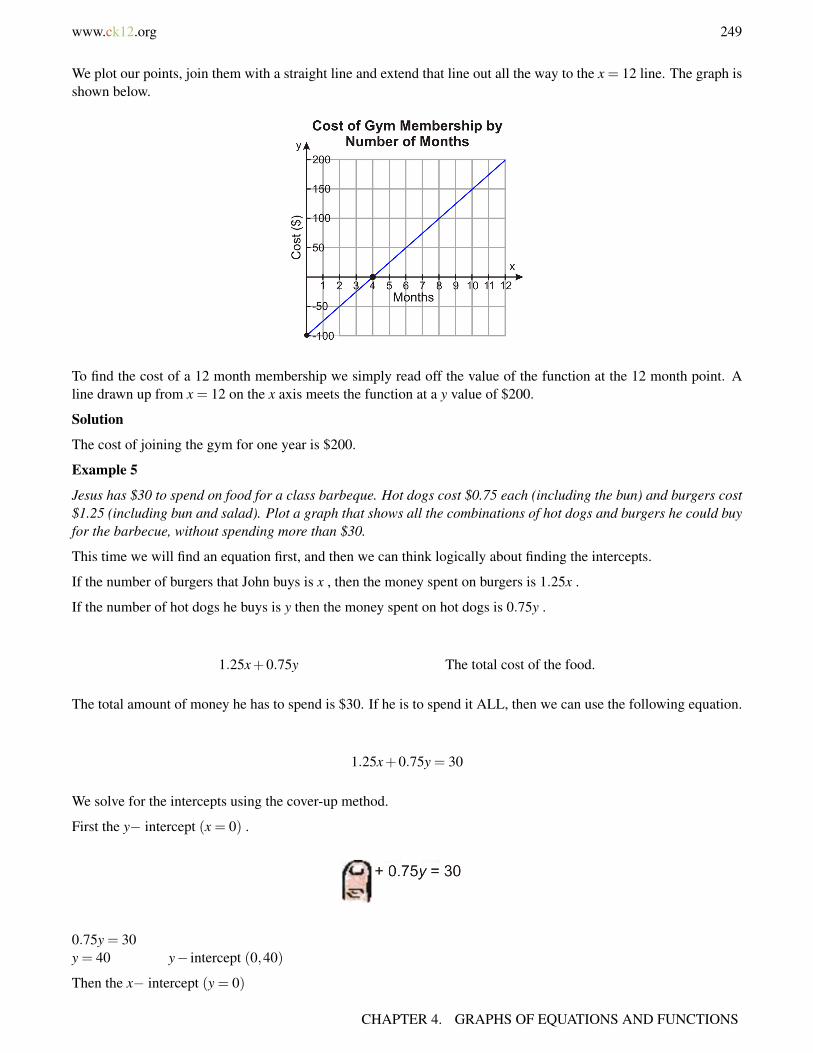
www.ck12.org 249
We plot our points, join them with a straight line and extend that line out all the way to the x = 12 line. The graph isshown below.
To find the cost of a 12 month membership we simply read off the value of the function at the 12 month point. Aline drawn up from x = 12 on the x axis meets the function at a y value of $200.
Solution
The cost of joining the gym for one year is $200.
Example 5
Jesus has $30 to spend on food for a class barbeque. Hot dogs cost $0.75 each (including the bun) and burgers cost$1.25 (including bun and salad). Plot a graph that shows all the combinations of hot dogs and burgers he could buyfor the barbecue, without spending more than $30.
This time we will find an equation first, and then we can think logically about finding the intercepts.
If the number of burgers that John buys is x , then the money spent on burgers is 1.25x .
If the number of hot dogs he buys is y then the money spent on hot dogs is 0.75y .
1.25x+0.75y The total cost of the food.
The total amount of money he has to spend is $30. If he is to spend it ALL, then we can use the following equation.
1.25x+0.75y = 30
We solve for the intercepts using the cover-up method.
First the y− intercept (x = 0) .
0.75y = 30y = 40 y− intercept (0,40)
Then the x− intercept (y = 0)
CHAPTER 4. GRAPHS OF EQUATIONS AND FUNCTIONS
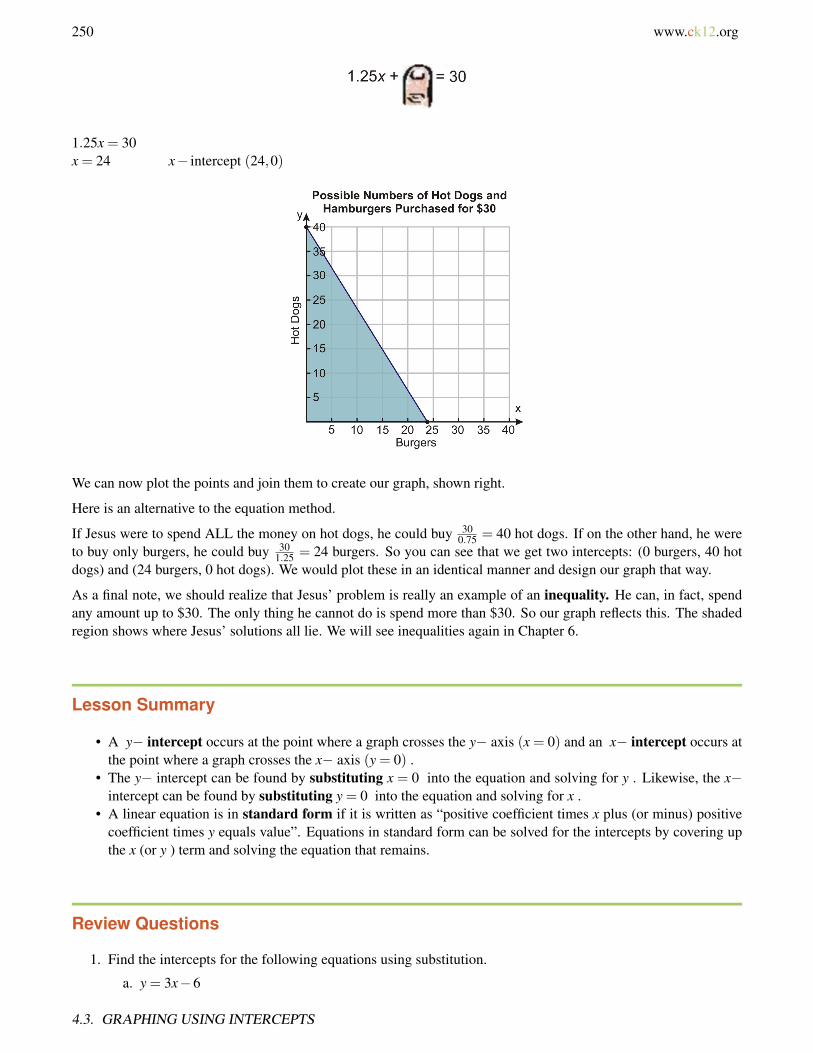
250 www.ck12.org
1.25x = 30x = 24 x− intercept (24,0)
We can now plot the points and join them to create our graph, shown right.
Here is an alternative to the equation method.
If Jesus were to spend ALL the money on hot dogs, he could buy 300.75 = 40 hot dogs. If on the other hand, he were
to buy only burgers, he could buy 301.25 = 24 burgers. So you can see that we get two intercepts: (0 burgers, 40 hot
dogs) and (24 burgers, 0 hot dogs). We would plot these in an identical manner and design our graph that way.
As a final note, we should realize that Jesus’ problem is really an example of an inequality. He can, in fact, spendany amount up to $30. The only thing he cannot do is spend more than $30. So our graph reflects this. The shadedregion shows where Jesus’ solutions all lie. We will see inequalities again in Chapter 6.
Lesson Summary
• A y− intercept occurs at the point where a graph crosses the y− axis (x = 0) and an x− intercept occurs atthe point where a graph crosses the x− axis (y = 0) .
• The y− intercept can be found by substituting x = 0 into the equation and solving for y . Likewise, the x−intercept can be found by substituting y = 0 into the equation and solving for x .
• A linear equation is in standard form if it is written as “positive coefficient times x plus (or minus) positivecoefficient times y equals value”. Equations in standard form can be solved for the intercepts by covering upthe x (or y ) term and solving the equation that remains.
Review Questions
1. Find the intercepts for the following equations using substitution.
a. y = 3x−6
4.3. GRAPHING USING INTERCEPTS

www.ck12.org 251
b. y =−2x+4c. y = 14x−21d. y = 7−3x
2. Find the intercepts of the following equations using the cover-up method.
a. 5x−6y = 15b. 3x−4y =−5c. 2x+7y =−11d. 5x+10y = 25
3. Use any method to find the intercepts and then graph the following equations.
a. y = 2x+3b. 6(x−1) = 2(y+3)c. x− y = 5d. x+ y = 8
4. At the local grocery store strawberries cost $3.00 per pound and bananas cost $1.00 per pound. If I have $10to spend between strawberries and bananas, draw a graph to show what combinations of each I can buy andspend exactly $10.
5. A movie theater charges $7.50 for adult tickets and $4.50 for children. If the theater takes $900 in ticket salesfor a particular screening, draw a graph which depicts the possibilities for the number of adult tickets and thenumber of child tickets sold.
6. Why can’t we use the intercept method to graph the following equation? 3(x+2) = 2(y+3)
Review Answers
1. a. (0, -6), (2, 0)b. (0, 4), (2, 0)c. (0, -21), (1.5, 0)d. (0, 7),
(73 ,0)
a. (0, -2.5), (3, 0)b. (0, 1.25),
(−5
3 ,0)
c.(0,−11
7
),(−11
2 ,0)
d. (0, 2.5), (5, 0)
2.
CHAPTER 4. GRAPHS OF EQUATIONS AND FUNCTIONS
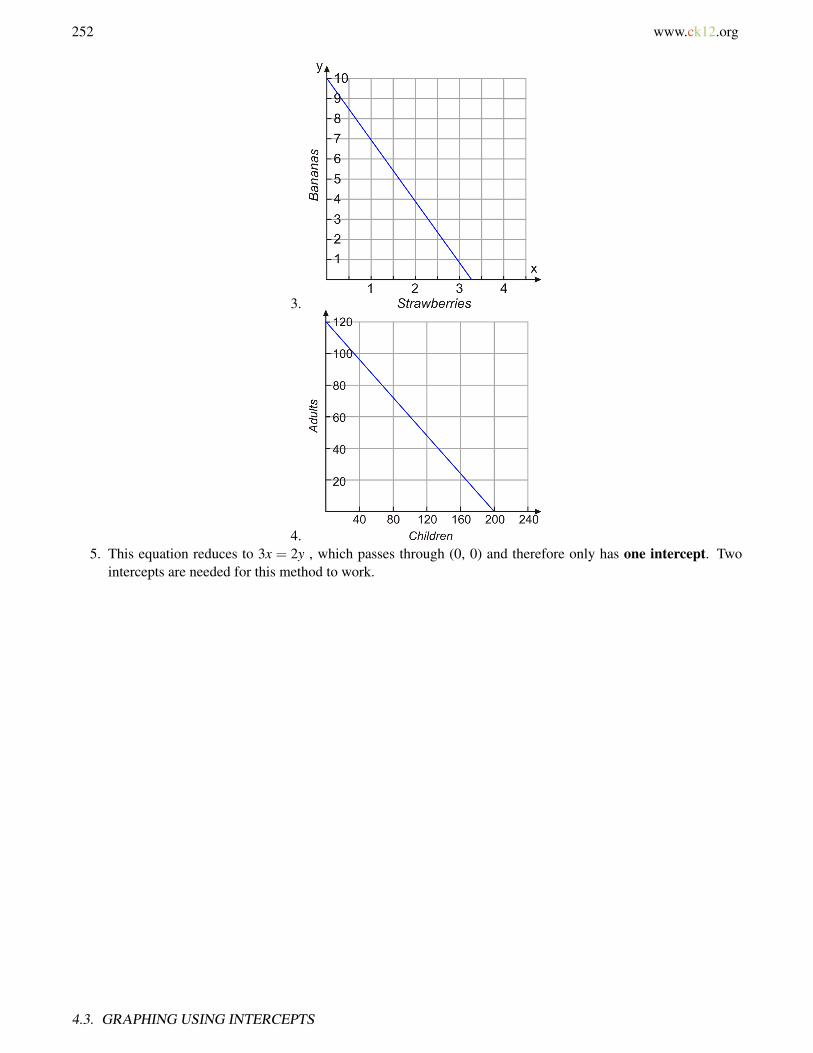
252 www.ck12.org
3.
4.5. This equation reduces to 3x = 2y , which passes through (0, 0) and therefore only has one intercept. Two
intercepts are needed for this method to work.
4.3. GRAPHING USING INTERCEPTS
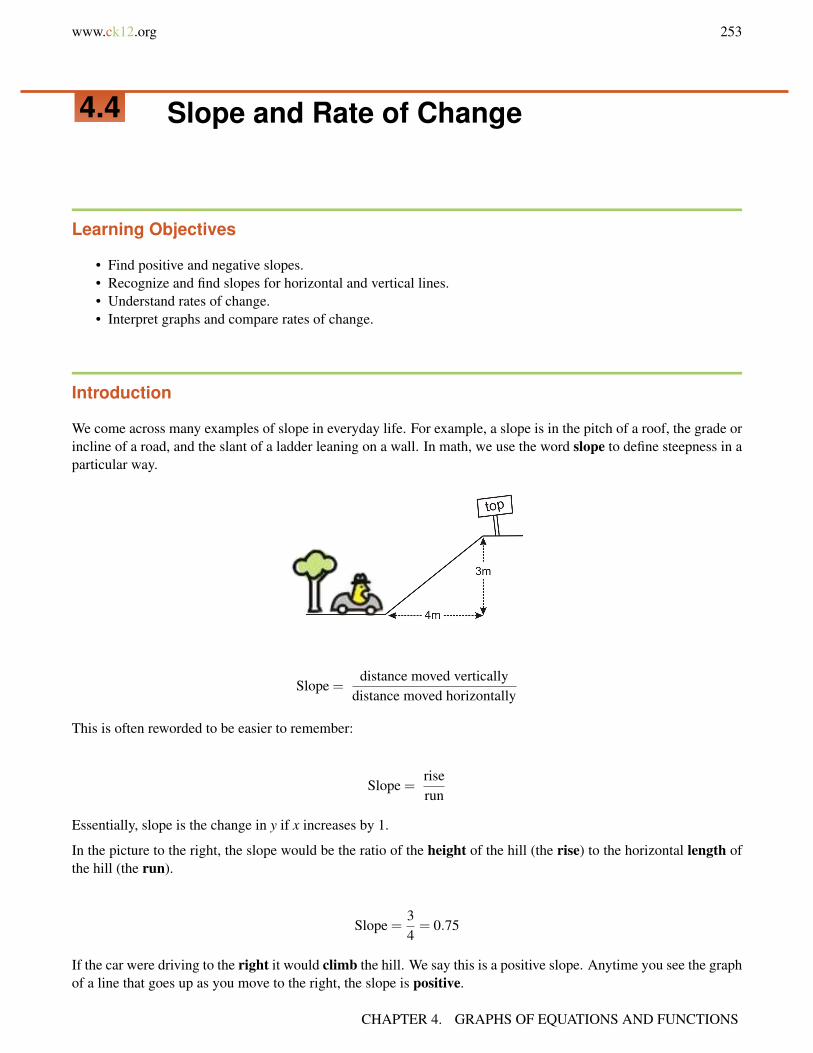
www.ck12.org 253
4.4 Slope and Rate of Change
Learning Objectives
• Find positive and negative slopes.• Recognize and find slopes for horizontal and vertical lines.• Understand rates of change.• Interpret graphs and compare rates of change.
Introduction
We come across many examples of slope in everyday life. For example, a slope is in the pitch of a roof, the grade orincline of a road, and the slant of a ladder leaning on a wall. In math, we use the word slope to define steepness in aparticular way.
Slope =distance moved vertically
distance moved horizontally
This is often reworded to be easier to remember:
Slope =riserun
Essentially, slope is the change in y if x increases by 1.
In the picture to the right, the slope would be the ratio of the height of the hill (the rise) to the horizontal length ofthe hill (the run).
Slope =34= 0.75
If the car were driving to the right it would climb the hill. We say this is a positive slope. Anytime you see the graphof a line that goes up as you move to the right, the slope is positive.
CHAPTER 4. GRAPHS OF EQUATIONS AND FUNCTIONS

254 www.ck12.org
If the car were to keep driving after it reached the top of the hill, it may come down again. If the car is driving tothe right and descending, then we would say that the slope is negative. The picture at right has a negative slope of-0.75.
Do not get confused! If the car turns around and drives back down the hill shown, we would still classify the slopeas positive. This is because the rise would be -3, but the run would be -4 (think of the x− axis - if you move fromright to left you are moving in the negative x− direction). Our ratio for moving left is:
Slope =−3−4
= 0.75 A negative divided by a negative is a positive.
So as we move from left to right, positive slopes increase while negative slopes decrease.
Find a Positive Slope
We have seen that a function with a positive slope increases in y as we increase x . A simple way to find a valuefor the slope is to draw a right angled triangle whose hypotenuse runs along the line. It is then a simple matter ofmeasuring the distances on the triangle that correspond to the rise (the vertical dimension) and the run (the horizontaldimension).
Example 1
Find the slopes for the three graphs shown right.
There are already right-triangles drawn for each of the lines. In practice, you would have to do this yourself. Notethat it is easiest to make triangles whose vertices are lattice points (i.e. the coordinates are all integers).
a. The rise shown in this triangle is 4 units, the run is 2 units.
Slope =42= 2
b. The rise shown in this triangle is 4 units, the run is also 4 units.
Slope =44= 1
c. The rise shown in this triangle is 2 units, the run is 4 units.
4.4. SLOPE AND RATE OF CHANGE
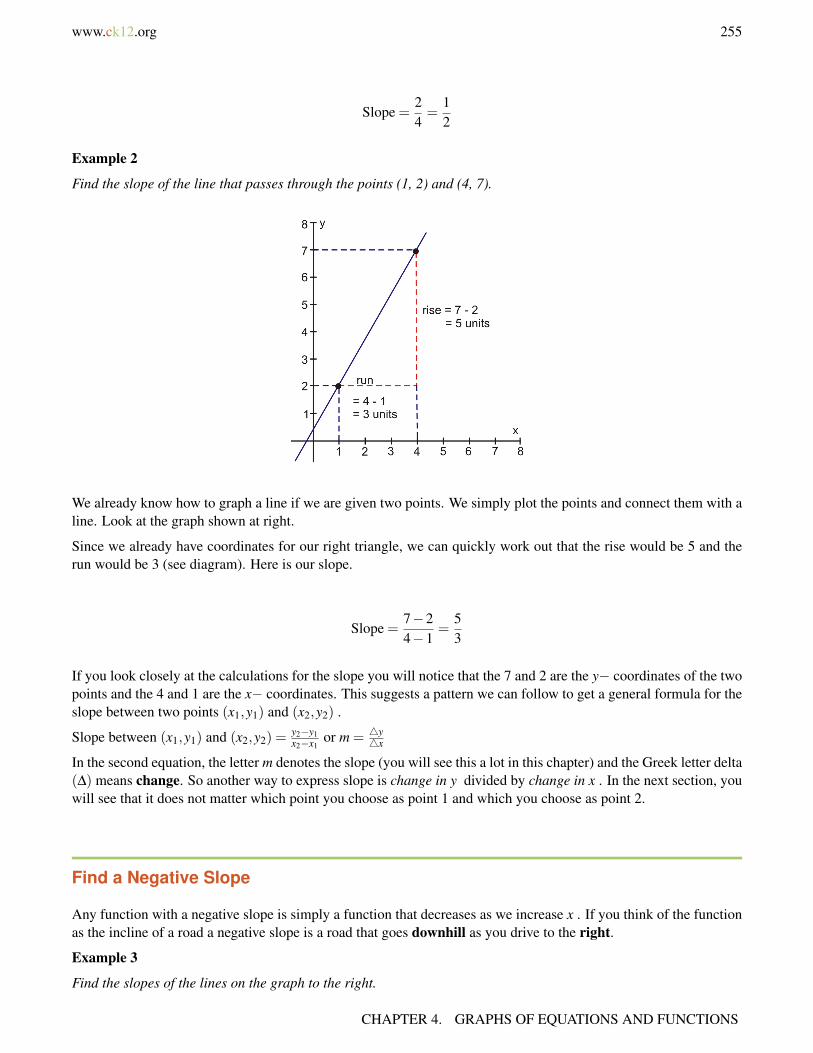
www.ck12.org 255
Slope =24=
12
Example 2
Find the slope of the line that passes through the points (1, 2) and (4, 7).
We already know how to graph a line if we are given two points. We simply plot the points and connect them with aline. Look at the graph shown at right.
Since we already have coordinates for our right triangle, we can quickly work out that the rise would be 5 and therun would be 3 (see diagram). Here is our slope.
Slope =7−24−1
=53
If you look closely at the calculations for the slope you will notice that the 7 and 2 are the y− coordinates of the twopoints and the 4 and 1 are the x− coordinates. This suggests a pattern we can follow to get a general formula for theslope between two points (x1,y1) and (x2,y2) .
Slope between (x1,y1) and (x2,y2) =y2−y1x2−x1
or m = 4y4x
In the second equation, the letter m denotes the slope (you will see this a lot in this chapter) and the Greek letter delta(∆) means change. So another way to express slope is change in y divided by change in x . In the next section, youwill see that it does not matter which point you choose as point 1 and which you choose as point 2.
Find a Negative Slope
Any function with a negative slope is simply a function that decreases as we increase x . If you think of the functionas the incline of a road a negative slope is a road that goes downhill as you drive to the right.
Example 3
Find the slopes of the lines on the graph to the right.
CHAPTER 4. GRAPHS OF EQUATIONS AND FUNCTIONS
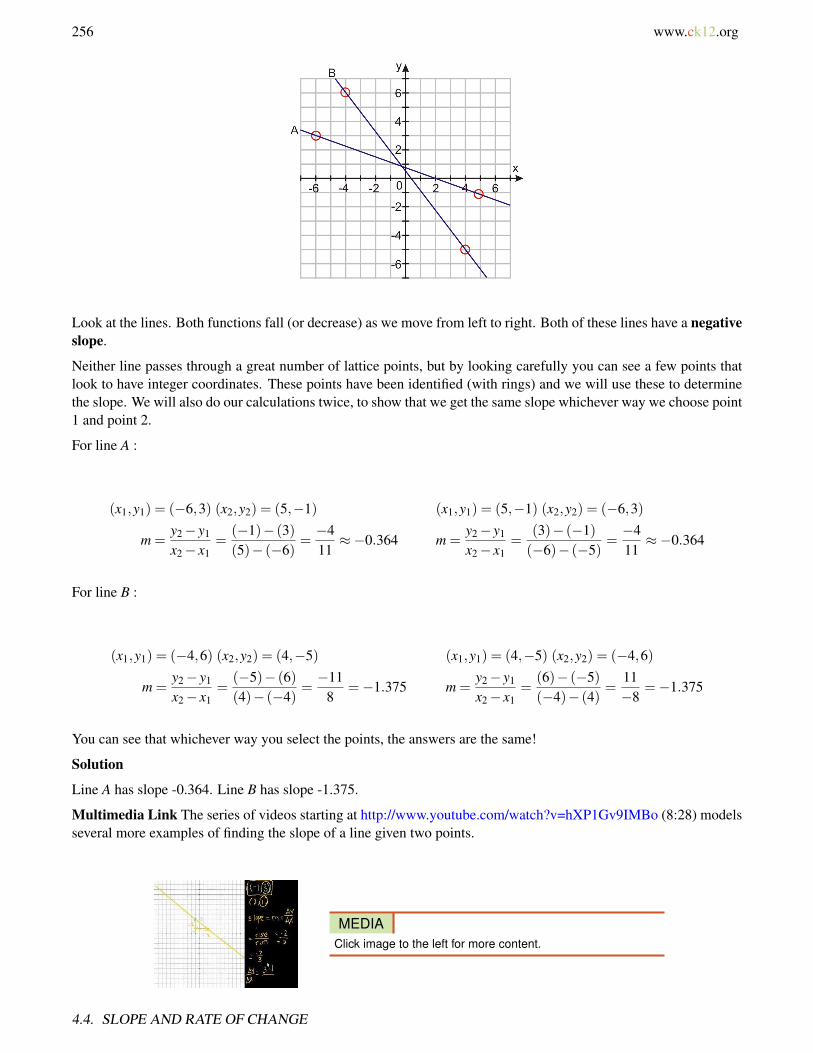
256 www.ck12.org
Look at the lines. Both functions fall (or decrease) as we move from left to right. Both of these lines have a negativeslope.
Neither line passes through a great number of lattice points, but by looking carefully you can see a few points thatlook to have integer coordinates. These points have been identified (with rings) and we will use these to determinethe slope. We will also do our calculations twice, to show that we get the same slope whichever way we choose point1 and point 2.
For line A :
(x1,y1) = (−6,3) (x2,y2) = (5,−1) (x1,y1) = (5,−1) (x2,y2) = (−6,3)
m =y2− y1
x2− x1=
(−1)− (3)(5)− (−6)
=−411≈−0.364 m =
y2− y1
x2− x1=
(3)− (−1)(−6)− (−5)
=−411≈−0.364
For line B :
(x1,y1) = (−4,6) (x2,y2) = (4,−5) (x1,y1) = (4,−5) (x2,y2) = (−4,6)
m =y2− y1
x2− x1=
(−5)− (6)(4)− (−4)
=−11
8=−1.375 m =
y2− y1
x2− x1=
(6)− (−5)(−4)− (4)
=11−8
=−1.375
You can see that whichever way you select the points, the answers are the same!
Solution
Line A has slope -0.364. Line B has slope -1.375.
Multimedia Link The series of videos starting at http://www.youtube.com/watch?v=hXP1Gv9IMBo (8:28) modelsseveral more examples of finding the slope of a line given two points.
MEDIAClick image to the left for more content.
4.4. SLOPE AND RATE OF CHANGE

www.ck12.org 257
Find the Slopes of Horizontal and Vertical lines
Example 4
Determine the slopes of the two lines on the graph at the right.
There are two lines on the graph. A(y = 3) and B(x = 5) .
Let’s pick two points on line A . say, (x1,y1) = (−4,3) and (x2,y2) = (5,3) and use our equation for slope.
m =y2− y1
x2− x1=
(3)− (3)(5)− (−4)
=09= 0
If you think about it, this makes sense. If there is no change in y as we increase x then there is no slope, or to becorrect, a slope of zero. You can see that this must be true for all horizontal lines.
Horizontal lines (y = constant) all have a slope of 0.
Now consider line B . Pick two distinct points on this line and plug them in to the slope equation.
(x1,y1) = (5,−3) and (x2,y2) = (5,4) .
m =y2− y1
x2− x1=
(4)− (−3)(5)− (5)
=70
A division by zero!
Divisions by zero lead to infinities. In math we often use the term undefined for any division by zero.
Vertical lines (x = constant) all have an infinite (or undefined) slope.
Find a Rate of Change
The slope of a function that describes real, measurable quantities is often called a rate of change. In that case, theslope refers to a change in one quantity (y) per unit change in another quantity (x) .
Example 5
Andrea has a part time job at the local grocery store. She saves for her vacation at a rate of $15 every week. Expressthis rate as money saved per day and money saved per year.
CHAPTER 4. GRAPHS OF EQUATIONS AND FUNCTIONS

258 www.ck12.org
Converting rates of change is fairly straight forward so long as you remember the equations for rate (i.e. the equationsfor slope) and know the conversions. In this case 1 week = 7 days and 52 weeks = 1 year .
rate =$15
1 week· 1 week
7 days=
$157 days
=157
dollars per day≈ $2.14 per day
rate =$15
1 week· 52 week
1 year= $15 · 52
year= $780 per year
Example 6
A candle has a starting length of 10 inches. Thirty minutes after lighting it, the length is 7 inches. Determine the rateof change in length of the candle as it burns. Determine how long the candle takes to completely burn to nothing.
In this case, we will graph the function to visualize what is happening.
We have two points to start with. We know that at the moment the candle is lit (time = 0) the length of the candle is10 inches. After thirty minutes (time = 30) the length is 7 inches. Since the candle length is a function of time wewill plot time on the horizontal axis, and candle length on the vertical axis. Here is a graph showing this information.
The rate of change of the candle is simply the slope. Since we have our two points (x1,y1) = (0,10) and (x2,y2) =(30,7) we can move straight to the formula.
Rate of change =y2− y1
x2− x1=
(7 inches)− (10 inches)(30 minutes)− (0 minutes)
=−3 inches30 minutes
=−0.1 inches per minute
The slope is negative. A negative rate of change means that the quantity is decreasing with time.
We can also convert our rate to inches per hour.
rate =−0.1 inches
1 minute· 60 minutes
1 hour=−6 inches
1 hour=−6 inches per hour
To find the point when the candle reaches zero length we can simply read off the graph (100 minutes). We can usethe rate equation to verify this algebraically.
Length burned = rate× time
0.1×100 = 10
Since the candle length was originally 10 inches this confirms that 100 minutes is the correct amount of time.
4.4. SLOPE AND RATE OF CHANGE

www.ck12.org 259
Interpret a Graph to Compare Rates of Change
Example 7
Examine the graph below. It represents a journey made by a large delivery truck on a particular day. During the day,the truck made two deliveries, each one taking one hour. The driver also took a one hour break for lunch. Identifywhat is happening at each stage of the journey (stages A through E)
Here is the driver’s journey.
A. The truck sets off and travels 80 miles in 2 hours.
B. The truck covers no distance for 1 hours.
C. The truck covers (120−80) = 40 miles in 1 hours
D. the truck covers no distance for 2 hours.
E. The truck covers -120 miles in 2 hours.
Lets look at the rates of change for each section.
A. Rate of change = ∆y∆x =
80 miles2 hours = 40 miles per hour
• The rate of change is a velocity! This is a very important concept and one that deserves a special note!
The slope (or rate of change) of a distance-time graph is a velocity.
You may be more familiar with calling miles per hour a speed. Speed is the magnitude of a velocity, or, putanother way, velocity has a direction, speed does not. This is best illustrated by working through the example.
On the first part of the journey sees the truck travel at a constant velocity of 40 mph for 2 hours covering a distanceof 80 miles.
B. Slope = 0 so rate of change = 0 mph. The truck is stationary for one hour. This could be a lunch break, but as itis only 2 hours since the truck set off it is likely to be the first delivery stop.
C. Rate of change = ∆y∆x =
(120−80) miles(4−3) hours = 40 miles per hour . The truck is traveling at 40 mph.
D. Slope = 0 so rate of change = 0 mph. The truck is stationary for two hours. It is likely that the driver used these2 hours for a lunch break plus the second delivery stop. At this point the truck is 120 miles from the start position.
E. Rate of change = 4y4x = (0−120) miles
(8−6) hours = −120 miles2 hours = −60 miles per hour . The truck is traveling at negative 60
mph.
CHAPTER 4. GRAPHS OF EQUATIONS AND FUNCTIONS

260 www.ck12.org
Wait, a negative velocity? Does this mean that the truck is reversing? Well, probably not. What it means is that thedistance (and don’t forget that is the distance measured from the starting position) is decreasing with time. The truckis simply driving in the opposite direction. In this case, back to where it started from. So, the speed of the truckwould be 60 mph, but the velocity (which includes direction) is negative because the truck is getting closer to whereit started from. The fact that it no longer has two heavy loads means that it travels faster (60 mph as opposed to 40mph) covering the 120 mile return trip in 2 hours.
Lesson Summary
• Slope is a measure of change in the vertical direction for each step in the horizontal direction. Slope is oftenrepresented as “ m ”.
• Slope = riserun or m = 4y
4x
• The slope between two points (x1,y1) and (x2,y2) =y2−y1x2−x1
• Horizontal lines (y = constant) all have a slope of 0.• Vertical lines (x = constant) all have an infinite (or undefined) slope.• The slope (or rate of change) of a distance-time graph is a velocity.
Review Questions
1. Use the slope formula to find the slope of the line that passes through each pair of points.
a. (-5, 7) and (0, 0)b. (-3, -5) and (3, 11)c. (3, -5) and (-2, 9)d. (-5, 7) and (-5, 11)e. (9, 9) and (-9, -9)f. (3, 5) and (-2, 7)
2. Use the points indicated on each line of the graphs to determine the slopes of the following lines.
4.4. SLOPE AND RATE OF CHANGE

www.ck12.org 261
3. The graph below is a distance-time graph for Mark’s three and a half mile cycle ride to school. During thisride, he rode on cycle paths but the terrain was hilly. He rode slower up hills and faster down them. He stoppedonce at a traffic light and at one point he stopped to mend a tire puncture. Identify each section of the graphaccordingly.
Review Answers
a. -1.4
CHAPTER 4. GRAPHS OF EQUATIONS AND FUNCTIONS

262 www.ck12.org
b. 2.67c. -2.8d. undefinede. 1f. -0.4
a. 3b. 0.5c. -2d. 1e. undefinedf. 1
3
a. uphillb. stopped (traffic light)c. uphilld. downhille. stopped (puncture)f. uphill
4.4. SLOPE AND RATE OF CHANGE

www.ck12.org 263
4.5 Graphs Using Slope-Intercept Form
Learning Objectives
• Identify the slope and y− intercept of equations and graphs.• Graph an equation in slope-intercept form.• Understand what happens when you change the slope or intercept of a line.• Identify parallel lines from their equations.
Identify Slope and y-intercept
One of the most common ways of writing linear equations prior to graphing them is called slope-intercept form.We have actually seen several slope-intercept equations so far. They take the following form:
y = mx+b where m is the slope and the point (0,b) is the y− intercept.
We know that the y− intercept is the point at which the line passes through the y− axis. The slope is a measureof the steepness of the line. Hopefully, you can see that if we know one point on a line and the slope of that line,we know what the line is. Being able to quickly identify the y− intercept and slope will aid us in graphing linearfunctions.
Example 1
Identify the slope and y− intercept of the following equations.
a) y = 3x+2
b) y = 0.5x−3
c) y =−7x
d) y =−4
Solution
a)
Comparing, we see that m = 3 and b = 2 .
y = 3x+2 has a slope of 3 and a y− intercept of (0, 2)
b)
CHAPTER 4. GRAPHS OF EQUATIONS AND FUNCTIONS
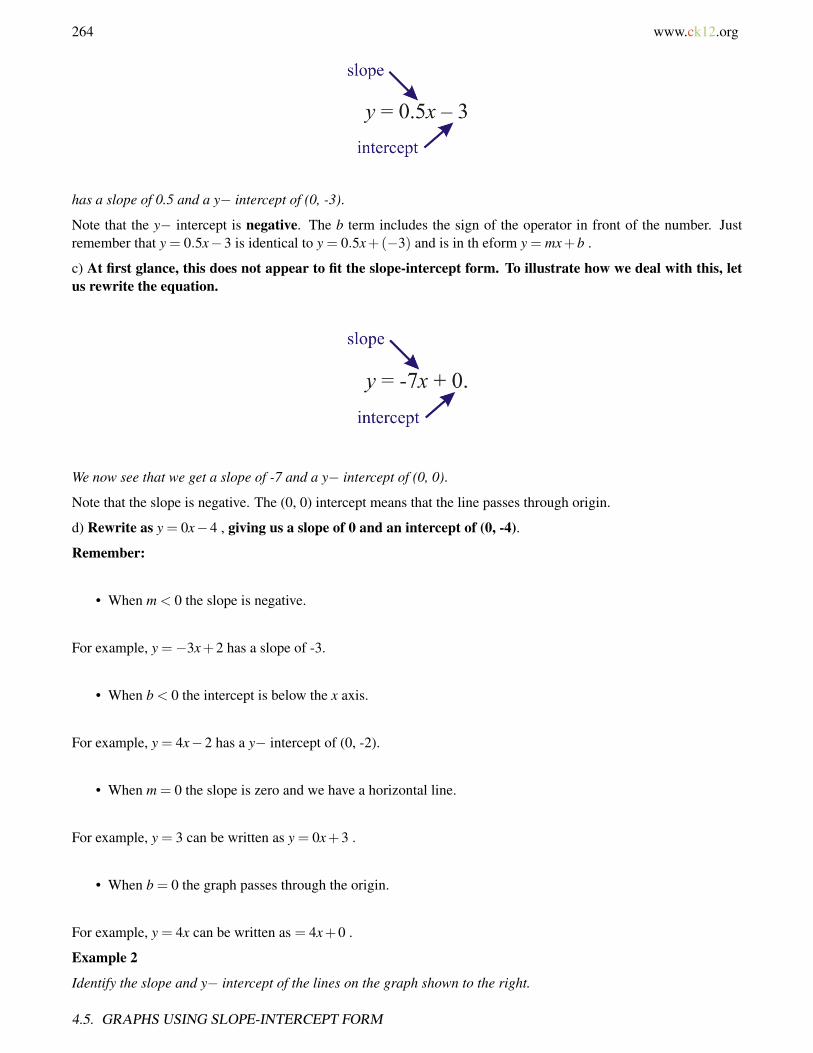
264 www.ck12.org
has a slope of 0.5 and a y− intercept of (0, -3).
Note that the y− intercept is negative. The b term includes the sign of the operator in front of the number. Justremember that y = 0.5x−3 is identical to y = 0.5x+(−3) and is in th eform y = mx+b .
c) At first glance, this does not appear to fit the slope-intercept form. To illustrate how we deal with this, letus rewrite the equation.
We now see that we get a slope of -7 and a y− intercept of (0, 0).
Note that the slope is negative. The (0, 0) intercept means that the line passes through origin.
d) Rewrite as y = 0x−4 , giving us a slope of 0 and an intercept of (0, -4).
Remember:
• When m < 0 the slope is negative.
For example, y =−3x+2 has a slope of -3.
• When b < 0 the intercept is below the x axis.
For example, y = 4x−2 has a y− intercept of (0, -2).
• When m = 0 the slope is zero and we have a horizontal line.
For example, y = 3 can be written as y = 0x+3 .
• When b = 0 the graph passes through the origin.
For example, y = 4x can be written as = 4x+0 .
Example 2
Identify the slope and y− intercept of the lines on the graph shown to the right.
4.5. GRAPHS USING SLOPE-INTERCEPT FORM
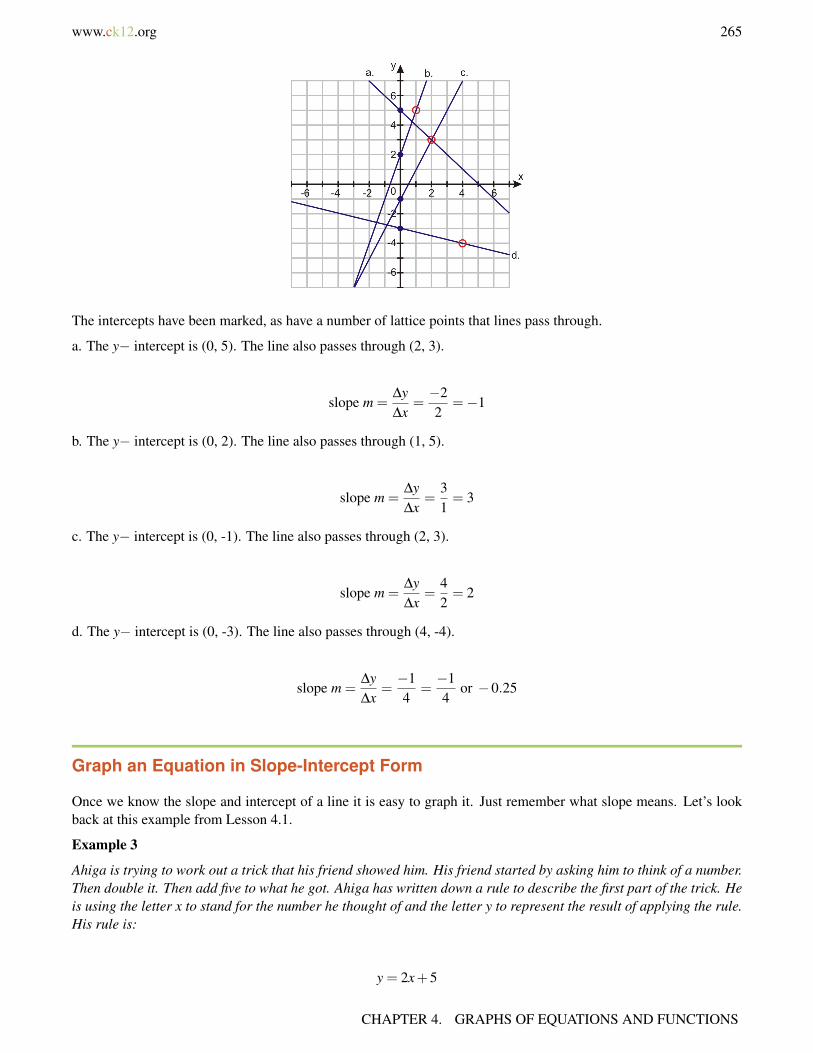
www.ck12.org 265
The intercepts have been marked, as have a number of lattice points that lines pass through.
a. The y− intercept is (0, 5). The line also passes through (2, 3).
slope m =∆y∆x
=−22
=−1
b. The y− intercept is (0, 2). The line also passes through (1, 5).
slope m =∆y∆x
=31= 3
c. The y− intercept is (0, -1). The line also passes through (2, 3).
slope m =∆y∆x
=42= 2
d. The y− intercept is (0, -3). The line also passes through (4, -4).
slope m =∆y∆x
=−14
=−14
or −0.25
Graph an Equation in Slope-Intercept Form
Once we know the slope and intercept of a line it is easy to graph it. Just remember what slope means. Let’s lookback at this example from Lesson 4.1.
Example 3
Ahiga is trying to work out a trick that his friend showed him. His friend started by asking him to think of a number.Then double it. Then add five to what he got. Ahiga has written down a rule to describe the first part of the trick. Heis using the letter x to stand for the number he thought of and the letter y to represent the result of applying the rule.His rule is:
y = 2x+5
CHAPTER 4. GRAPHS OF EQUATIONS AND FUNCTIONS
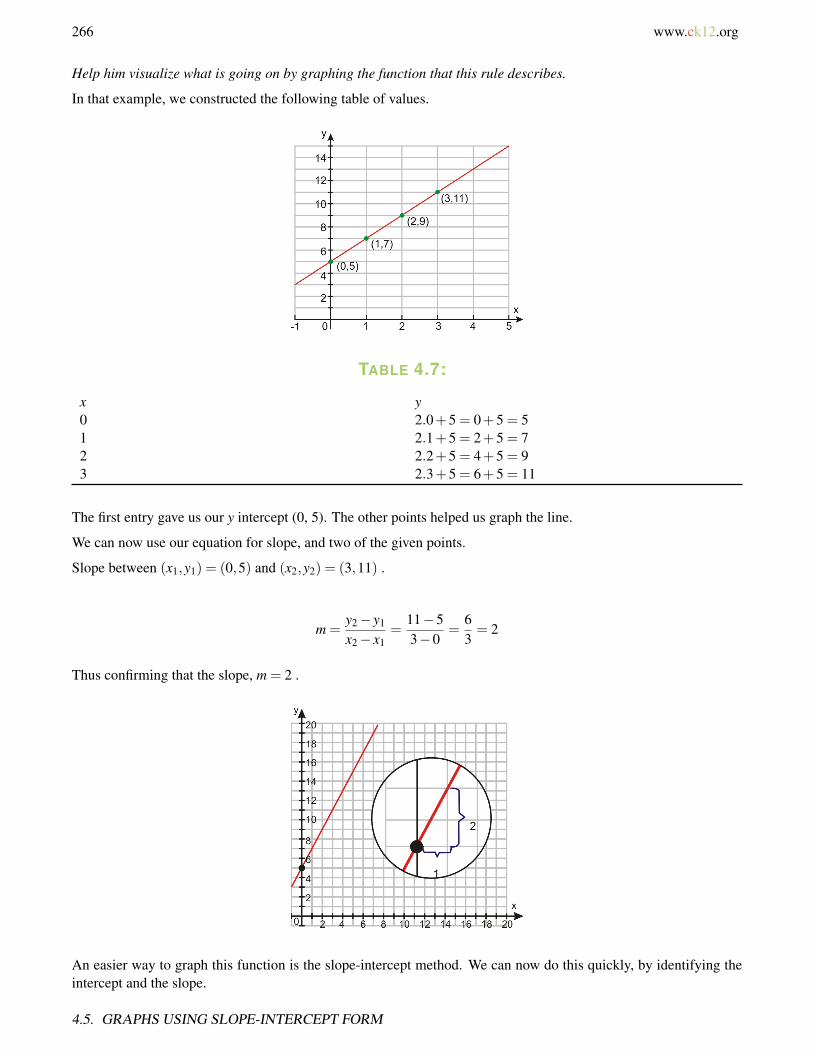
266 www.ck12.org
Help him visualize what is going on by graphing the function that this rule describes.
In that example, we constructed the following table of values.
TABLE 4.7:
x y0 2.0+5 = 0+5 = 51 2.1+5 = 2+5 = 72 2.2+5 = 4+5 = 93 2.3+5 = 6+5 = 11
The first entry gave us our y intercept (0, 5). The other points helped us graph the line.
We can now use our equation for slope, and two of the given points.
Slope between (x1,y1) = (0,5) and (x2,y2) = (3,11) .
m =y2− y1
x2− x1=
11−53−0
=63= 2
Thus confirming that the slope, m = 2 .
An easier way to graph this function is the slope-intercept method. We can now do this quickly, by identifying theintercept and the slope.
4.5. GRAPHS USING SLOPE-INTERCEPT FORM

www.ck12.org 267
Look at the graph we drew, the line intersects the y− axis at 5, and every time we move to the right by one unit, wemove up by two units.
So what about plotting a function with a negative slope? Just remember that a negative slope means the functiondecreases as we increase x .
Example 4
Graph the following function. y =−3x+5
• Identify y− intercept b = 5• Plot intercept (0, 5)• Identify slope m =−3• Draw a line through the intercept that has a slope of -3.
To do this last part remember that slope = riserun so for every unit we move to the right the function increases by -3
(in other words, for every square we move right, the function comes down by 3).
Changing the Slope of a Line
CHAPTER 4. GRAPHS OF EQUATIONS AND FUNCTIONS
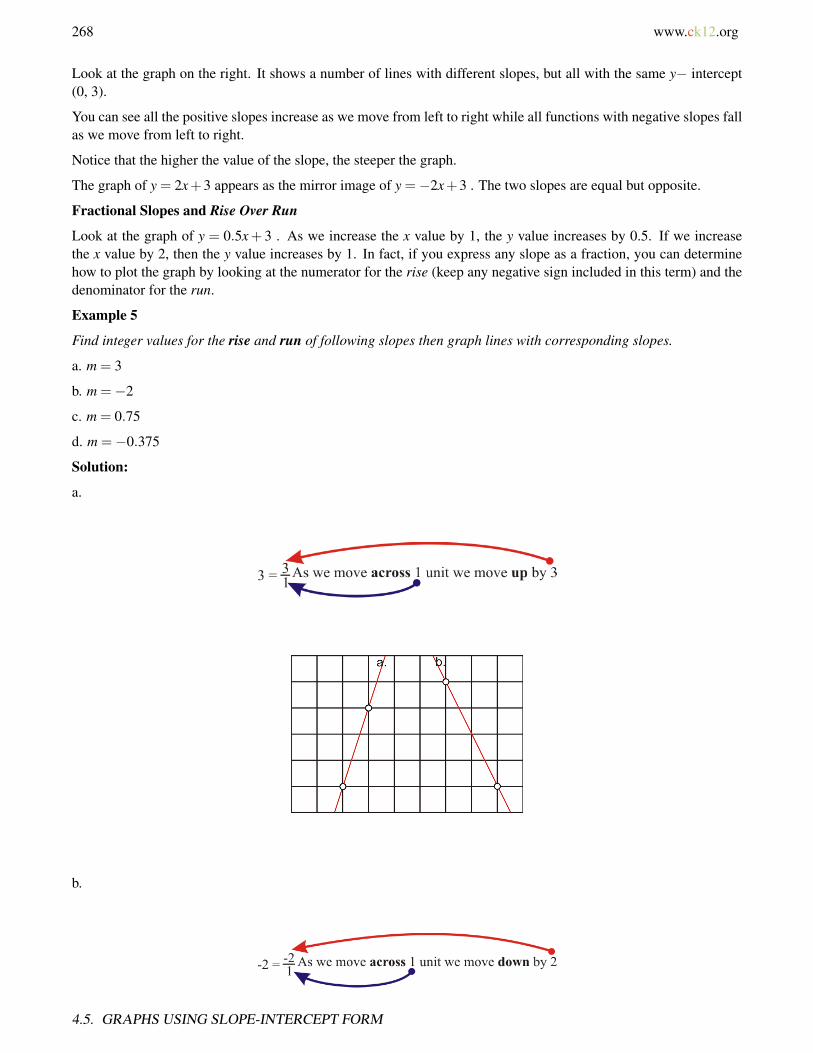
268 www.ck12.org
Look at the graph on the right. It shows a number of lines with different slopes, but all with the same y− intercept(0, 3).
You can see all the positive slopes increase as we move from left to right while all functions with negative slopes fallas we move from left to right.
Notice that the higher the value of the slope, the steeper the graph.
The graph of y = 2x+3 appears as the mirror image of y =−2x+3 . The two slopes are equal but opposite.
Fractional Slopes and Rise Over Run
Look at the graph of y = 0.5x+ 3 . As we increase the x value by 1, the y value increases by 0.5. If we increasethe x value by 2, then the y value increases by 1. In fact, if you express any slope as a fraction, you can determinehow to plot the graph by looking at the numerator for the rise (keep any negative sign included in this term) and thedenominator for the run.
Example 5
Find integer values for the rise and run of following slopes then graph lines with corresponding slopes.
a. m = 3
b. m =−2
c. m = 0.75
d. m =−0.375
Solution:
a.
b.
4.5. GRAPHS USING SLOPE-INTERCEPT FORM
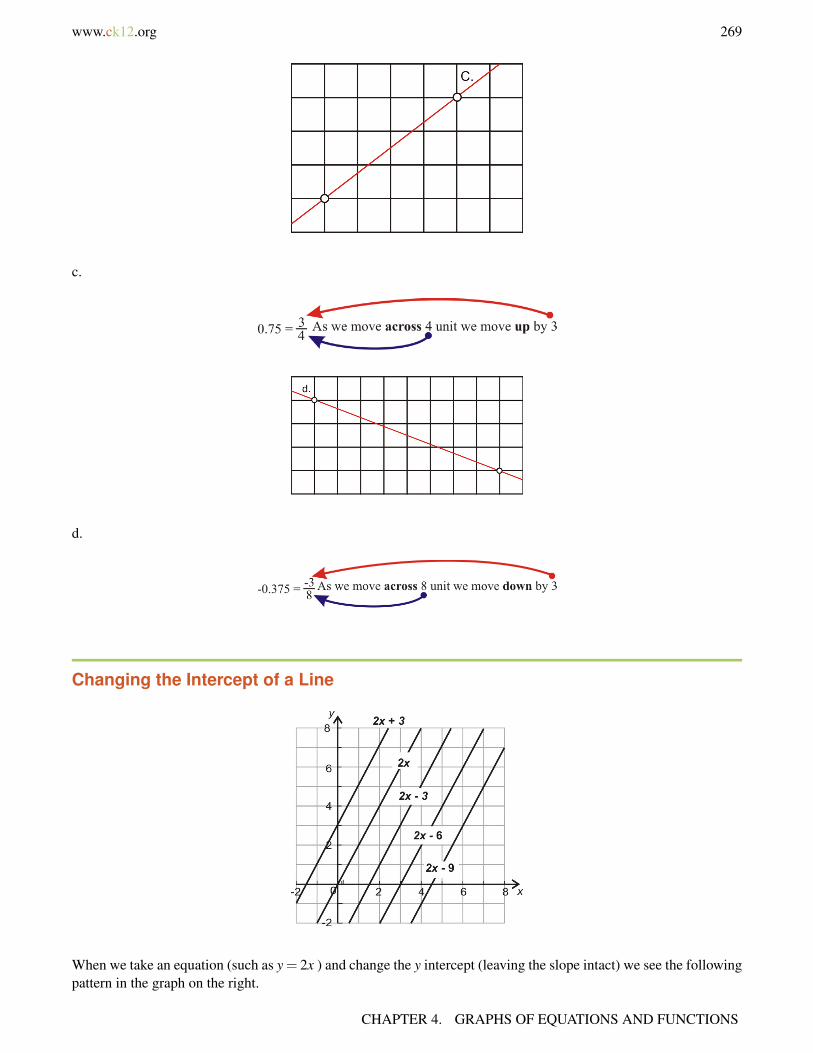
www.ck12.org 269
c.
d.
Changing the Intercept of a Line
When we take an equation (such as y = 2x ) and change the y intercept (leaving the slope intact) we see the followingpattern in the graph on the right.
CHAPTER 4. GRAPHS OF EQUATIONS AND FUNCTIONS
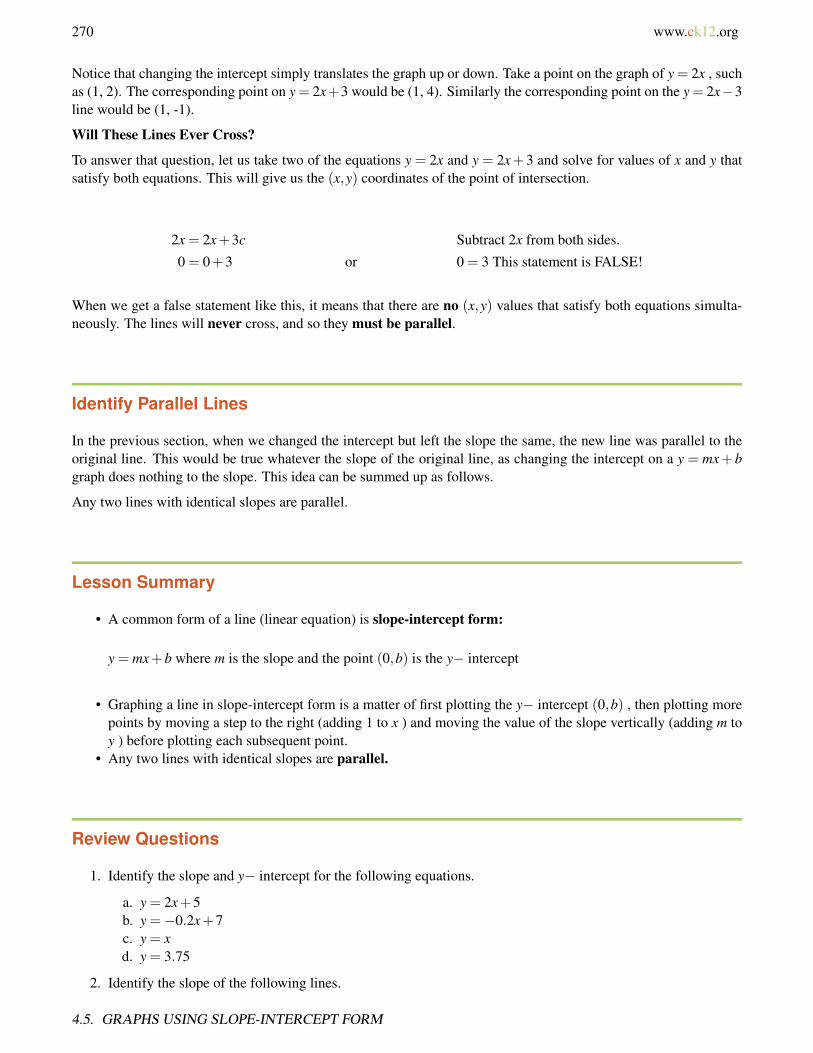
270 www.ck12.org
Notice that changing the intercept simply translates the graph up or down. Take a point on the graph of y = 2x , suchas (1, 2). The corresponding point on y = 2x+3 would be (1, 4). Similarly the corresponding point on the y = 2x−3line would be (1, -1).
Will These Lines Ever Cross?
To answer that question, let us take two of the equations y = 2x and y = 2x+3 and solve for values of x and y thatsatisfy both equations. This will give us the (x,y) coordinates of the point of intersection.
2x = 2x+3c Subtract 2x from both sides.
0 = 0+3 or 0 = 3 This statement is FALSE!
When we get a false statement like this, it means that there are no (x,y) values that satisfy both equations simulta-neously. The lines will never cross, and so they must be parallel.
Identify Parallel Lines
In the previous section, when we changed the intercept but left the slope the same, the new line was parallel to theoriginal line. This would be true whatever the slope of the original line, as changing the intercept on a y = mx+ bgraph does nothing to the slope. This idea can be summed up as follows.
Any two lines with identical slopes are parallel.
Lesson Summary
• A common form of a line (linear equation) is slope-intercept form:
y = mx+b where m is the slope and the point (0,b) is the y− intercept
• Graphing a line in slope-intercept form is a matter of first plotting the y− intercept (0,b) , then plotting morepoints by moving a step to the right (adding 1 to x ) and moving the value of the slope vertically (adding m toy ) before plotting each subsequent point.
• Any two lines with identical slopes are parallel.
Review Questions
1. Identify the slope and y− intercept for the following equations.
a. y = 2x+5b. y =−0.2x+7c. y = xd. y = 3.75
2. Identify the slope of the following lines.
4.5. GRAPHS USING SLOPE-INTERCEPT FORM
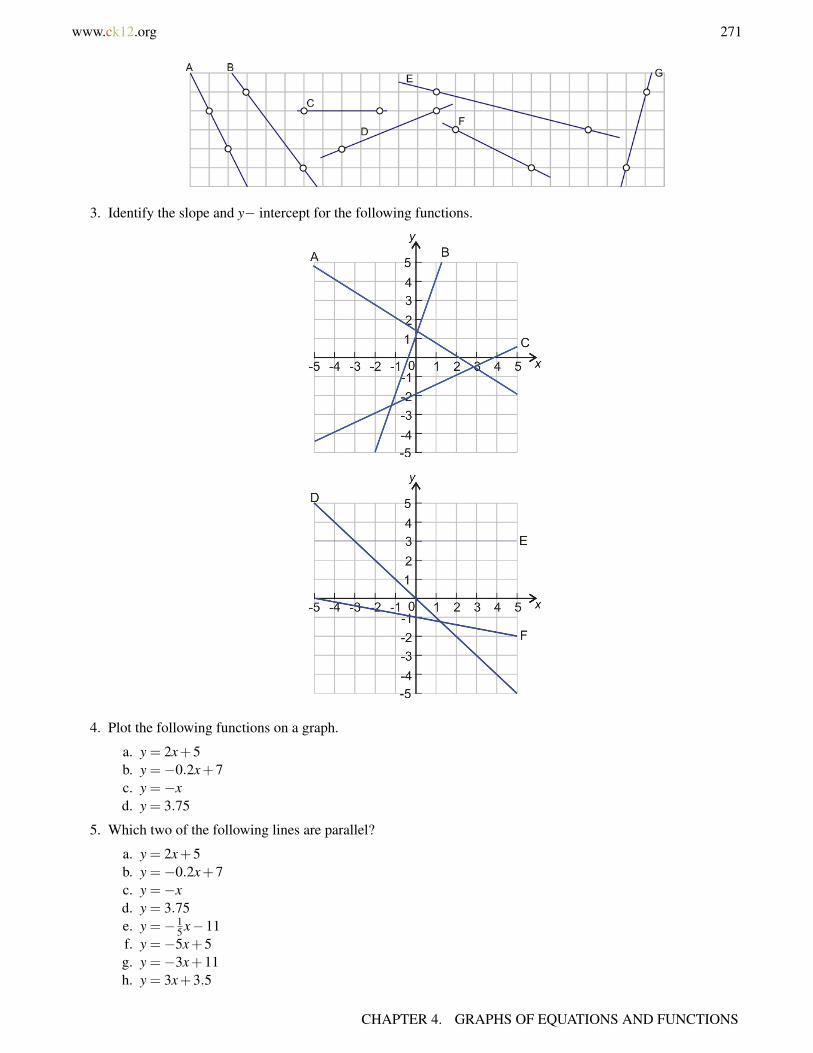
www.ck12.org 271
3. Identify the slope and y− intercept for the following functions.
4. Plot the following functions on a graph.
a. y = 2x+5b. y =−0.2x+7c. y =−xd. y = 3.75
5. Which two of the following lines are parallel?
a. y = 2x+5b. y =−0.2x+7c. y =−xd. y = 3.75e. y =−1
5 x−11f. y =−5x+5g. y =−3x+11h. y = 3x+3.5
CHAPTER 4. GRAPHS OF EQUATIONS AND FUNCTIONS

272 www.ck12.org
Review Answers
1. a. m = 2,(0,5)b. m =−0.2,(0,7)c. m = 1,(0,0)d. m = 0,(0,3.75)
a. m =−2b. m =−4
3c. m = 0d. m = 2
5e. m =−0.25f. m =−0.5g. m = 4
a. y =−23 x+1.5
b. y = 3x+1c. y = 0.5x−2d. y =−xe. y = 3f. y =−0.2x−1
2.3. b and e
4.5. GRAPHS USING SLOPE-INTERCEPT FORM
www.ck12.org 273
4.6 Direct Variation Models
Learning Objectives
• Identify direct variation.• Graph direct variation equations.• Solve real-world problems using direct variation models.
Introduction
Suppose you see someone buy five pounds of strawberries at the grocery store. The clerk weighs the strawberriesand charges $12.50 for them. Now suppose you wanted two pounds of strawberries for yourself. How much wouldyou expect to pay for them?
Identify Direct Variation
The preceding problem is an example of a direct variation. We would expect that the strawberries are priced on a“per pound” basis, and that if you buy two-fifths of the amount of strawberries, you would pay two-fifths of $12.50for your strawberries.
25×$12.50 = $5.00
Similarly, if you bought 10 pounds of strawberries (twice the amount) you would pay 2×$12.50 and if you did notbuy any strawberries you would pay nothing.
If variable y varies directly with variable x , then we write the relationship as:
y = k · x
k is called the constant of proportionality.
CHAPTER 4. GRAPHS OF EQUATIONS AND FUNCTIONS
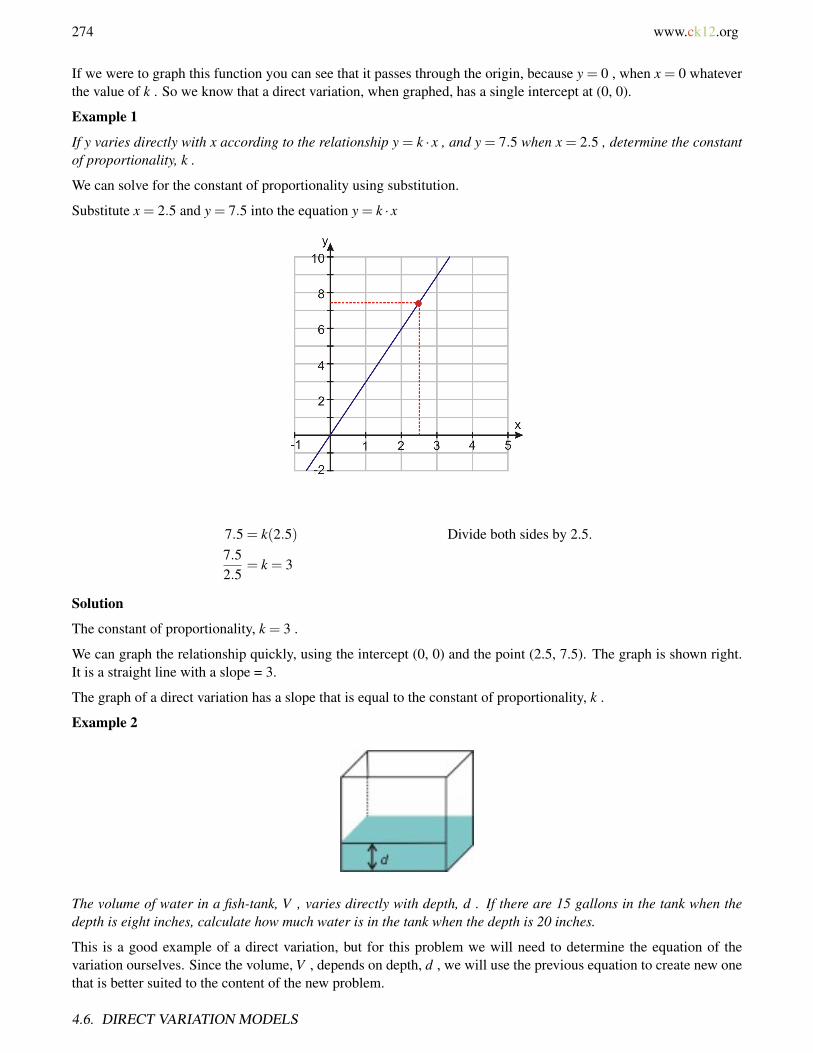
274 www.ck12.org
If we were to graph this function you can see that it passes through the origin, because y = 0 , when x = 0 whateverthe value of k . So we know that a direct variation, when graphed, has a single intercept at (0, 0).
Example 1
If y varies directly with x according to the relationship y = k · x , and y = 7.5 when x = 2.5 , determine the constantof proportionality, k .
We can solve for the constant of proportionality using substitution.
Substitute x = 2.5 and y = 7.5 into the equation y = k · x
7.5 = k(2.5) Divide both sides by 2.5.7.52.5
= k = 3
Solution
The constant of proportionality, k = 3 .
We can graph the relationship quickly, using the intercept (0, 0) and the point (2.5, 7.5). The graph is shown right.It is a straight line with a slope = 3.
The graph of a direct variation has a slope that is equal to the constant of proportionality, k .
Example 2
The volume of water in a fish-tank, V , varies directly with depth, d . If there are 15 gallons in the tank when thedepth is eight inches, calculate how much water is in the tank when the depth is 20 inches.
This is a good example of a direct variation, but for this problem we will need to determine the equation of thevariation ourselves. Since the volume, V , depends on depth, d , we will use the previous equation to create new onethat is better suited to the content of the new problem.
4.6. DIRECT VARIATION MODELS
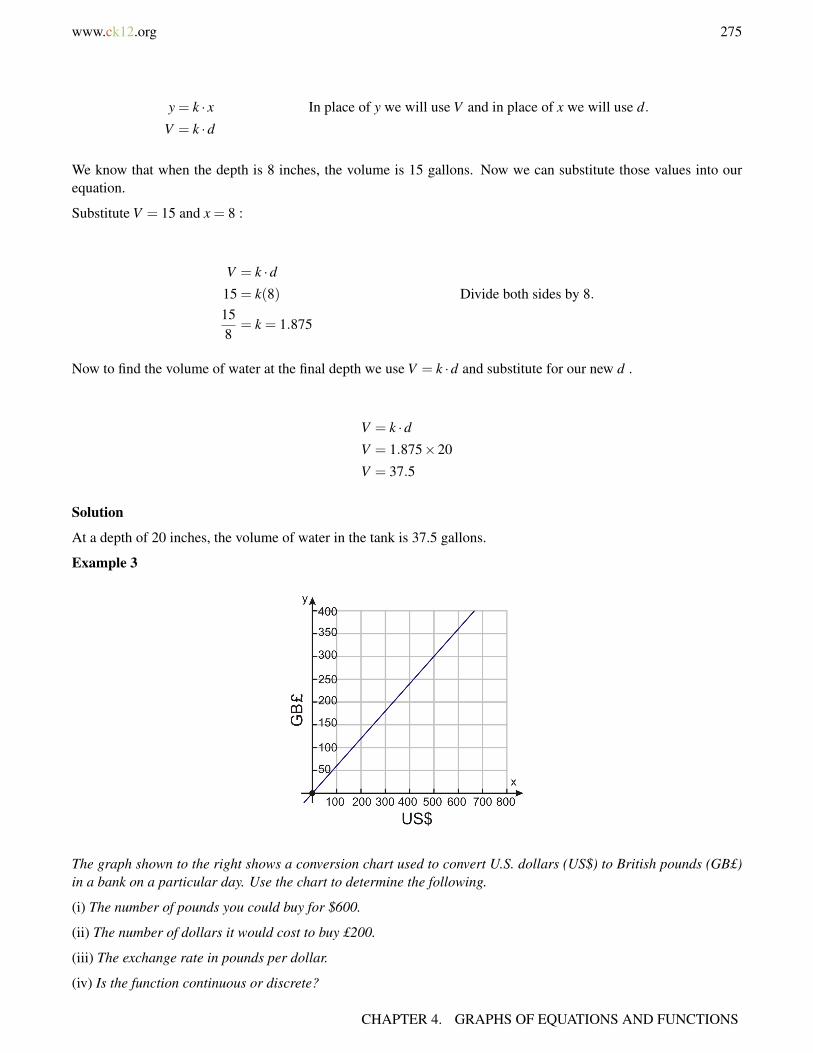
www.ck12.org 275
y = k · x In place of y we will use V and in place of x we will use d.
V = k ·d
We know that when the depth is 8 inches, the volume is 15 gallons. Now we can substitute those values into ourequation.
Substitute V = 15 and x = 8 :
V = k ·d15 = k(8) Divide both sides by 8.158
= k = 1.875
Now to find the volume of water at the final depth we use V = k ·d and substitute for our new d .
V = k ·dV = 1.875×20
V = 37.5
Solution
At a depth of 20 inches, the volume of water in the tank is 37.5 gallons.
Example 3
The graph shown to the right shows a conversion chart used to convert U.S. dollars (US$) to British pounds (GB£)in a bank on a particular day. Use the chart to determine the following.
(i) The number of pounds you could buy for $600.
(ii) The number of dollars it would cost to buy £200.
(iii) The exchange rate in pounds per dollar.
(iv) Is the function continuous or discrete?
CHAPTER 4. GRAPHS OF EQUATIONS AND FUNCTIONS
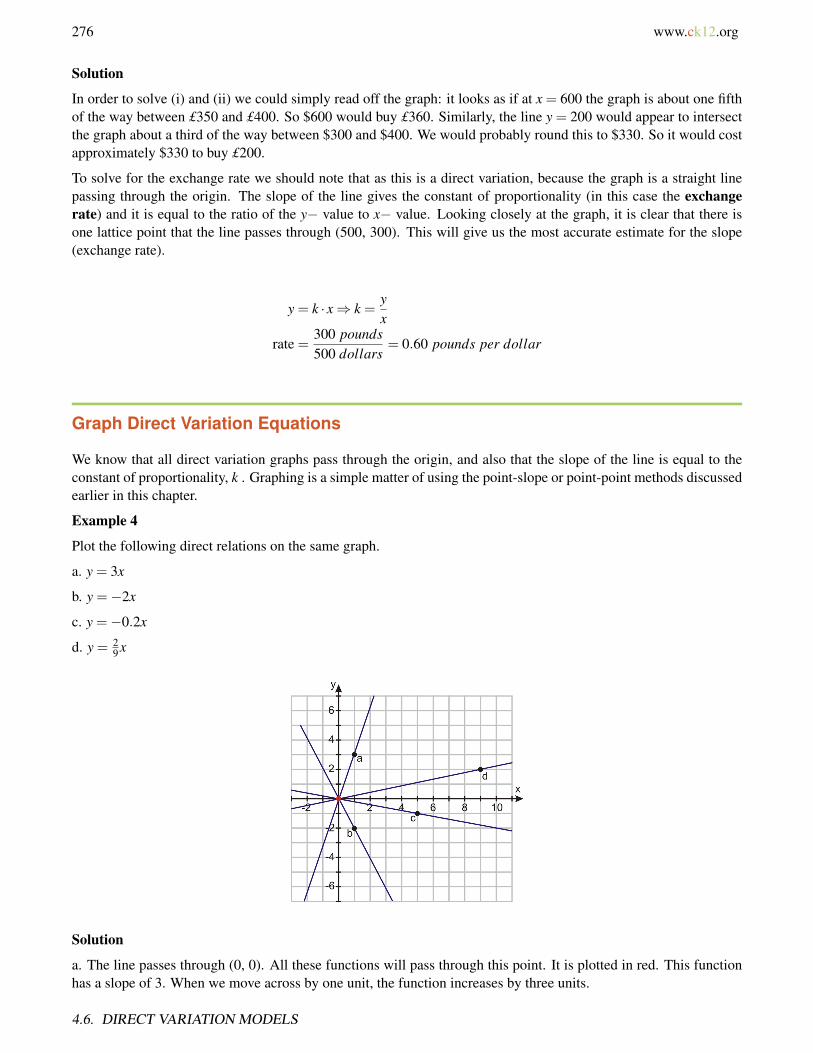
276 www.ck12.org
Solution
In order to solve (i) and (ii) we could simply read off the graph: it looks as if at x = 600 the graph is about one fifthof the way between £350 and £400. So $600 would buy £360. Similarly, the line y = 200 would appear to intersectthe graph about a third of the way between $300 and $400. We would probably round this to $330. So it would costapproximately $330 to buy £200.
To solve for the exchange rate we should note that as this is a direct variation, because the graph is a straight linepassing through the origin. The slope of the line gives the constant of proportionality (in this case the exchangerate) and it is equal to the ratio of the y− value to x− value. Looking closely at the graph, it is clear that there isone lattice point that the line passes through (500, 300). This will give us the most accurate estimate for the slope(exchange rate).
y = k · x⇒ k =yx
rate =300 pounds500 dollars
= 0.60 pounds per dollar
Graph Direct Variation Equations
We know that all direct variation graphs pass through the origin, and also that the slope of the line is equal to theconstant of proportionality, k . Graphing is a simple matter of using the point-slope or point-point methods discussedearlier in this chapter.
Example 4
Plot the following direct relations on the same graph.
a. y = 3x
b. y =−2x
c. y =−0.2x
d. y = 29 x
Solution
a. The line passes through (0, 0). All these functions will pass through this point. It is plotted in red. This functionhas a slope of 3. When we move across by one unit, the function increases by three units.
4.6. DIRECT VARIATION MODELS
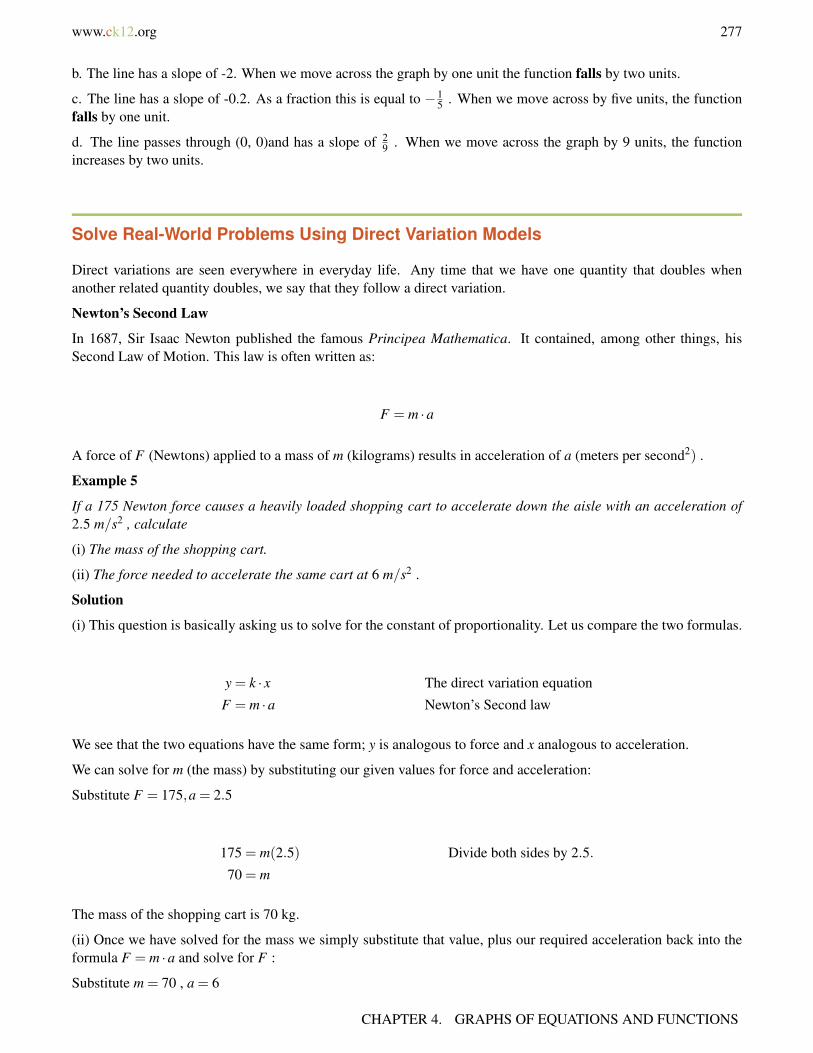
www.ck12.org 277
b. The line has a slope of -2. When we move across the graph by one unit the function falls by two units.
c. The line has a slope of -0.2. As a fraction this is equal to −15 . When we move across by five units, the function
falls by one unit.
d. The line passes through (0, 0)and has a slope of 29 . When we move across the graph by 9 units, the function
increases by two units.
Solve Real-World Problems Using Direct Variation Models
Direct variations are seen everywhere in everyday life. Any time that we have one quantity that doubles whenanother related quantity doubles, we say that they follow a direct variation.
Newton’s Second Law
In 1687, Sir Isaac Newton published the famous Principea Mathematica. It contained, among other things, hisSecond Law of Motion. This law is often written as:
F = m ·a
A force of F (Newtons) applied to a mass of m (kilograms) results in acceleration of a (meters per second2) .
Example 5
If a 175 Newton force causes a heavily loaded shopping cart to accelerate down the aisle with an acceleration of2.5 m/s2 , calculate
(i) The mass of the shopping cart.
(ii) The force needed to accelerate the same cart at 6 m/s2 .
Solution
(i) This question is basically asking us to solve for the constant of proportionality. Let us compare the two formulas.
y = k · x The direct variation equation
F = m ·a Newton’s Second law
We see that the two equations have the same form; y is analogous to force and x analogous to acceleration.
We can solve for m (the mass) by substituting our given values for force and acceleration:
Substitute F = 175,a = 2.5
175 = m(2.5) Divide both sides by 2.5.
70 = m
The mass of the shopping cart is 70 kg.
(ii) Once we have solved for the mass we simply substitute that value, plus our required acceleration back into theformula F = m ·a and solve for F :
Substitute m = 70 , a = 6
CHAPTER 4. GRAPHS OF EQUATIONS AND FUNCTIONS
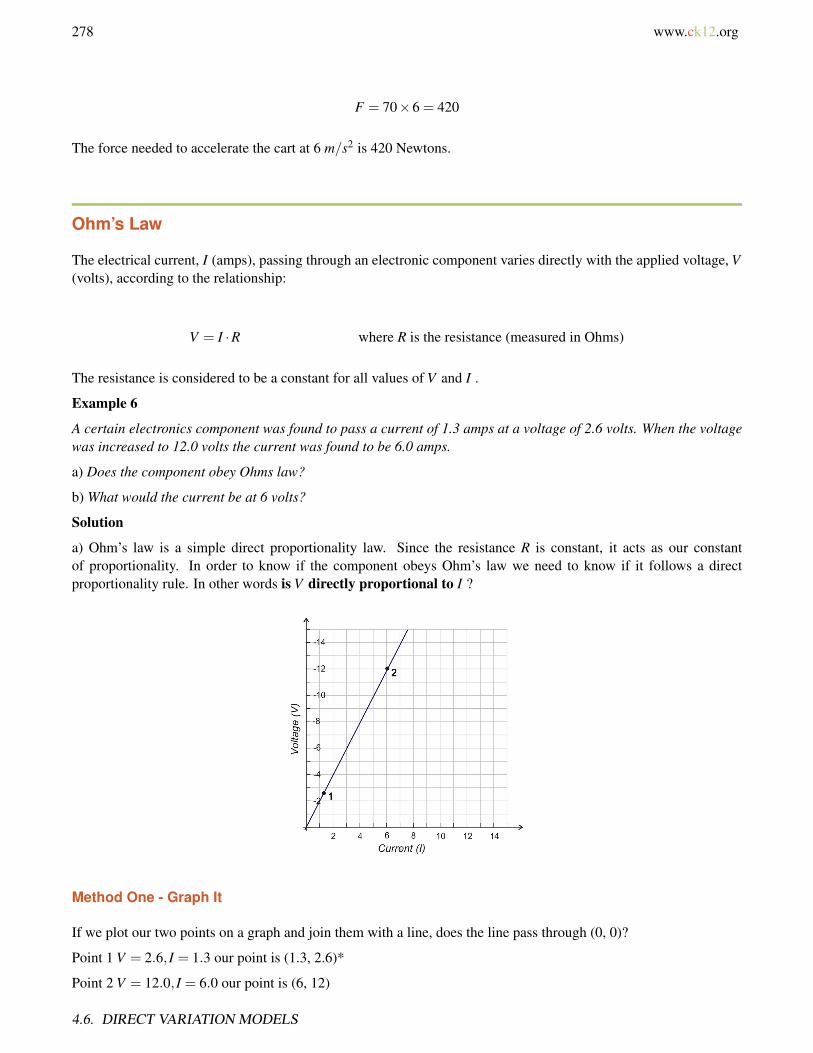
278 www.ck12.org
F = 70×6 = 420
The force needed to accelerate the cart at 6 m/s2 is 420 Newtons.
Ohm’s Law
The electrical current, I (amps), passing through an electronic component varies directly with the applied voltage, V(volts), according to the relationship:
V = I ·R where R is the resistance (measured in Ohms)
The resistance is considered to be a constant for all values of V and I .
Example 6
A certain electronics component was found to pass a current of 1.3 amps at a voltage of 2.6 volts. When the voltagewas increased to 12.0 volts the current was found to be 6.0 amps.
a) Does the component obey Ohms law?
b) What would the current be at 6 volts?
Solution
a) Ohm’s law is a simple direct proportionality law. Since the resistance R is constant, it acts as our constantof proportionality. In order to know if the component obeys Ohm’s law we need to know if it follows a directproportionality rule. In other words is V directly proportional to I ?
Method One - Graph It
If we plot our two points on a graph and join them with a line, does the line pass through (0, 0)?
Point 1 V = 2.6, I = 1.3 our point is (1.3, 2.6)*
Point 2 V = 12.0, I = 6.0 our point is (6, 12)
4.6. DIRECT VARIATION MODELS
www.ck12.org 279
Plotting the points and joining them gives the following graph.
The graph does appear to pass through the origin, so...
Yes, the component obeys Ohms law.
Method Two - Solve for R
We can quickly determine the value of R in each case. It is the ratio of the voltage to the resistance.
Case 1 R =VI=
2.61.3
= 2 Ohms
Case 2 R =VI=
126
= 2 Ohms
The values for R agree! This means that the line that joins point 1 to the origin is the same as the line that joins point2 to the origin. The component obeys Ohms law.
b) To find the current at 6 volts, simply substitute the values for V and R into V = I ·R
Substitute V = 6,R = 2
• In physics, it is customary to plot voltage on the horizontal axis as this is most often the independent variable.In that situation, the slope gives the conductance, σ . However, by plotting the current on the horizontal axis,the slope is equal to the resistance, R .
6 = I(2) Divide both sides by 2.
3 = I
Solution
The current through the component at a voltage of 6 volts is 3 amps.
Lesson Summary
• If a variable y varies directly with variable x , then we write the relationship as
y = k · x
Where k is a constant called the constant of proportionality.
• Direct variation is very common in many areas of science.
CHAPTER 4. GRAPHS OF EQUATIONS AND FUNCTIONS

280 www.ck12.org
Review Questions
1. Plot the following direct variations on the same graph.
a. y = 43 x
b. y =−23 x
c. y =−16 x
d. y = 1.75x
2. Dasan’s mom takes him to the video arcade for his birthday. In the first 10 minutes, he spends $3.50 playinggames. If his allowance for the day is $20.00, how long can he keep playing games before his money is gone?
3. The current standard for low-flow showerheads heads is 2.5 gallons per minute. Calculate how long it wouldtake to fill a 30 gallon bathtub using such a showerhead to supply the water.
4. Amen is using a hose to fill his new swimming pool for the first time. He starts the hose at 10 P.M. and leavesit running all night. At 6 AM he measures the depth and calculates that the pool is four sevenths full. At whattime will his new pool be full?
5. Land in Wisconsin is for sale to property investors. A 232 acre lot is listed for sale for $200500. Assumingthe same price per acre, how much would a 60 acre lot sell for?
6. The force (F) needed to stretch a spring by a distance x is given by the equation F = k · x , where k is thespring constant (measured in Newtons per centimeter, (N/cm). If a 12 Newton force stretches a certain springby 10 cm, calculate:
a. The spring constant, kb. The force needed to stretch the spring by 7 cm.c. The distance the spring would stretch with a 23 Newton force.
Review Answers
1.2. 57 minutes 8 seconds3. 12 minutes4. 12:00 Midday5. $51, 853
a. k = 1.2 N/cmb. 8.4 Newtonsc. 19.17 cm
4.6. DIRECT VARIATION MODELS
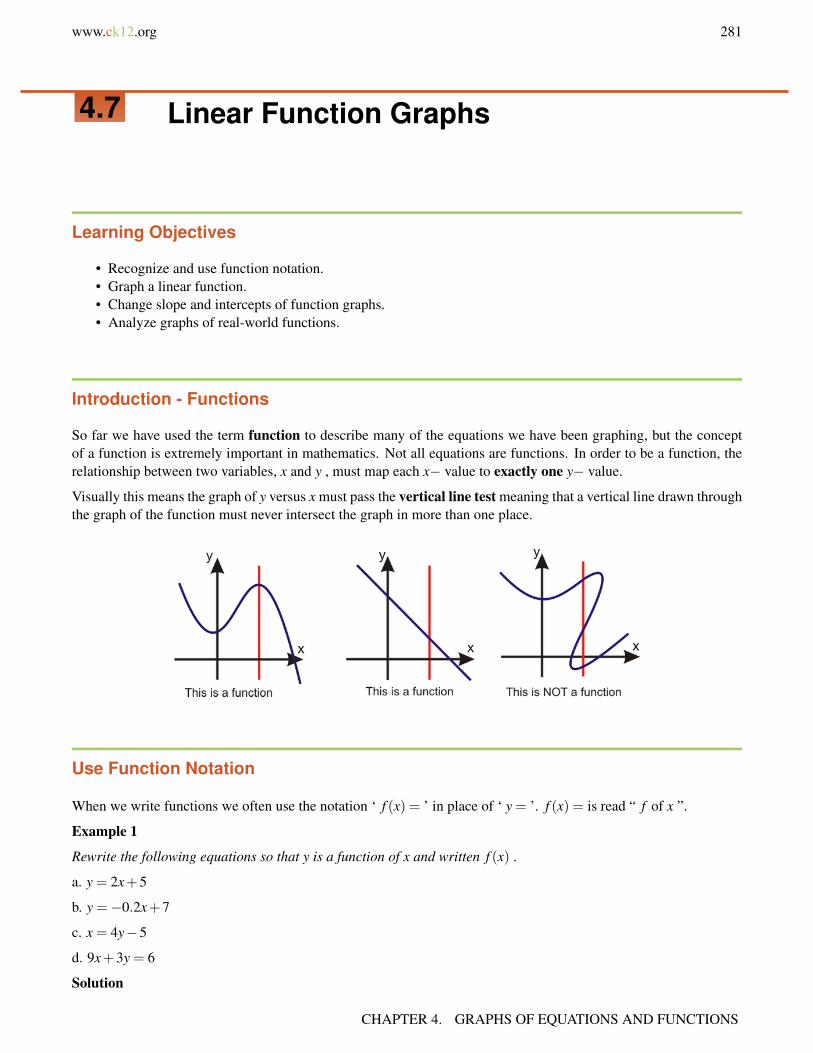
www.ck12.org 281
4.7 Linear Function Graphs
Learning Objectives
• Recognize and use function notation.• Graph a linear function.• Change slope and intercepts of function graphs.• Analyze graphs of real-world functions.
Introduction - Functions
So far we have used the term function to describe many of the equations we have been graphing, but the conceptof a function is extremely important in mathematics. Not all equations are functions. In order to be a function, therelationship between two variables, x and y , must map each x− value to exactly one y− value.
Visually this means the graph of y versus x must pass the vertical line test meaning that a vertical line drawn throughthe graph of the function must never intersect the graph in more than one place.
Use Function Notation
When we write functions we often use the notation ‘ f (x) = ’ in place of ‘ y = ’. f (x) = is read “ f of x ”.
Example 1
Rewrite the following equations so that y is a function of x and written f (x) .
a. y = 2x+5
b. y =−0.2x+7
c. x = 4y−5
d. 9x+3y = 6
Solution
CHAPTER 4. GRAPHS OF EQUATIONS AND FUNCTIONS

282 www.ck12.org
a. Simply replace y with f (x) . f (x) = 2x+5
b. f (x) =−0.2x+7
c. Rearrange to isolate y .
x = 4y−5 Add 5 to both sides.
x+5 = 4y Divide by 4.x+5
4= y
f (x) =x+5
4
d. Rearrange to isolate y .
9x+3y = 6 Subtract 9x from both sides.
3y = 6−9x Divide by 3.
y =6− x
3= 2−3x
f (x) = 2−3x
You can think of a function as a machine made up from a number of separate processes. For example, you can lookat the function 3x+2 and break it down to the following instructions.
• Take a number• Multiply it by 3• Add 2
We can visualize these processes like this:
In this case, the number we chose was 2. Multiplied by 3 it becomes 6. When we add 2 our output is 8.
Let’s try that again. This time we will put -3 through our machine to get 7.
On the bottom of this process tree you can see what happens when we put the letter n (the variable used to representany number) through the function. We can write the results of these processes.
• f (2) = 8• f (−3) =−7• f (n) = 3n+2
4.7. LINEAR FUNCTION GRAPHS

www.ck12.org 283
Example 2
A function is defined as f (x) = 6x−36 . Evaluate the following:
a. f (2)
b. f (0)
c. f (36)
d. f (z)
e. f (p)
Solution
a. Substitute x = 2 into the function f (x) f (2) = 6 ·2−36 = 12−36 =−24
b. Substitute x = 0 into the function f (x) f (0) = 6 ·0−36 = 0−36 =−36
c. Substitute x = 36 into the function f (x) f (36) = 6 ·36−36 = 216−36 = 180
d. Substitute x = z into the function f (x) f (z) = 6z+36
e. Substitute x = p into the function f (x) f (p) = 6p+36
Graph a Linear Function
You can see that the notation ‘ f (x) = ’ and ‘ y = ’ are interchangeable. This means that we can use all the conceptswe have learned so far to graph functions.
Example 3
Graph the function f (x) = 3x+54
Solution
We can write this function in slope intercept form ( y = mx+b form).
f (x) =34
x+54= 0.75x+1.25
So our graph will have a y− intercept of (0, 1.25) and a slope of 0.75.
CHAPTER 4. GRAPHS OF EQUATIONS AND FUNCTIONS
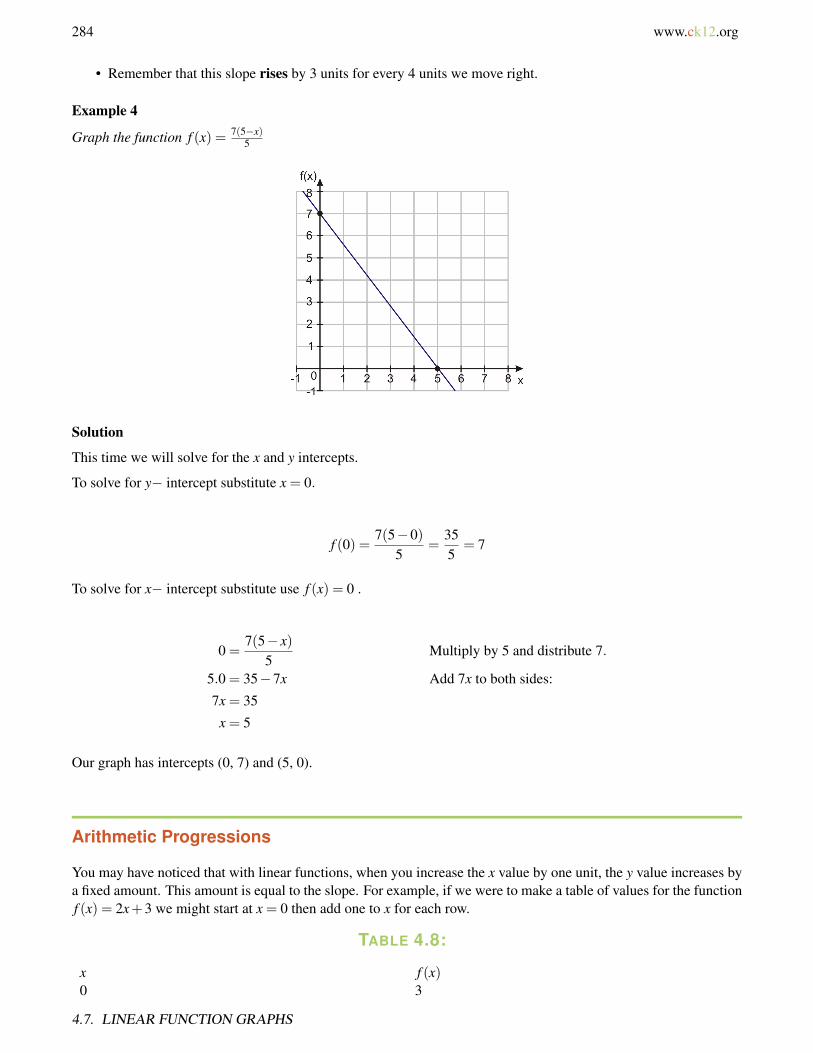
284 www.ck12.org
• Remember that this slope rises by 3 units for every 4 units we move right.
Example 4
Graph the function f (x) = 7(5−x)5
Solution
This time we will solve for the x and y intercepts.
To solve for y− intercept substitute x = 0.
f (0) =7(5−0)
5=
355
= 7
To solve for x− intercept substitute use f (x) = 0 .
0 =7(5− x)
5Multiply by 5 and distribute 7.
5.0 = 35−7x Add 7x to both sides:
7x = 35
x = 5
Our graph has intercepts (0, 7) and (5, 0).
Arithmetic Progressions
You may have noticed that with linear functions, when you increase the x value by one unit, the y value increases bya fixed amount. This amount is equal to the slope. For example, if we were to make a table of values for the functionf (x) = 2x+3 we might start at x = 0 then add one to x for each row.
TABLE 4.8:
x f (x)0 3
4.7. LINEAR FUNCTION GRAPHS

www.ck12.org 285
TABLE 4.8: (continued)
x f (x)1 52 73 94 11
Look at the values for f (x) . They go up by two (the slope) each time. When we consider continually adding afixed value to numbers, we get sequences like 3,5,7,9,11 . . . . We call these arithmetic progressions. Theyare characterized by the fact that each number is greater than (or lesser than) than the preceding number by a fixedamount. This amount is called the common difference. The common difference can be found by taking twoconsecutive terms in a sequence and subtracting the first from the second.
Example 5
Find the common difference for the following arithmetic progressions:
a. 7,11,15,19 . . .
b. 12,1,−10,−21 . . .
c. 7,12,17 . . .
Solution
a. 11−7 = 415−11 = 419−15 = 4.
The common difference is 4.
b. 1−12 =−11 . The common difference is -11.
c. There are not two consecutive terms here, but we know that to get the term after 7, we would add the commondifference. Then to get to 12, we would add the common difference again. Twice the common difference is 12−7= 5. So the common difference is 2.5.
Arithmetic sequences and linear functions are very closely related. You just learned that to get to the next termin a arithmetic sequence you add the common difference to last term. We have seen that with linear functions thefunction increases by the value of the slope every time the x− value is increased by one. As a result, arithmeticsequences and linear functions look very similar.
CHAPTER 4. GRAPHS OF EQUATIONS AND FUNCTIONS

286 www.ck12.org
The graph to the right shows the arithmetic progression −2,0,2,4,6 . . . with the function y = 2x− 4 . The fun-damental difference between the two graphs is that an arithmetic sequence is discrete while a linear function iscontinuous.
• Discrete means that the sequence has x values only at distinct points (the 1st term, 2nd term, etc). The domainis not all real numbers (often it is whole numbers).
• Continuous means that the function has values for all possible values of x , the integers and also all of thenumbers in between. The domain is all real numbers.
We can write a formula for an arithmetic progression. We will define the first term as a1 and d as the commondifference. The sequence becomes the following.
a1,a1 +d,a1 +2d,a1 +3d, . . . ,a1 +n ·d
• To find the second term (a2) we take the first term (a1) and add d .• To find the third term (a3) we take the first term (a1) and add 2d .• To find the n th term (an) we take the first term (a1) and add (n−1)d .
Analyze Graphs of Real-World Functions
Example 6
Use the diagram below to determine the three decades since 1940 in which the infant mortality rate decreased most.
Let’s make a table of the infant mortality rate in the years 1940, 1950, 1960, 1970, 1980, 1990, 2000.
TABLE 4.9: Infant Mortality Rates: United States, 1940-2004
Year Mortality rate (per 100,000) change over decade1940 47 N/A1950 30 -171960 26 -41970 20 -61980 13 -71990 9 -42000 7 -2
4.7. LINEAR FUNCTION GRAPHS
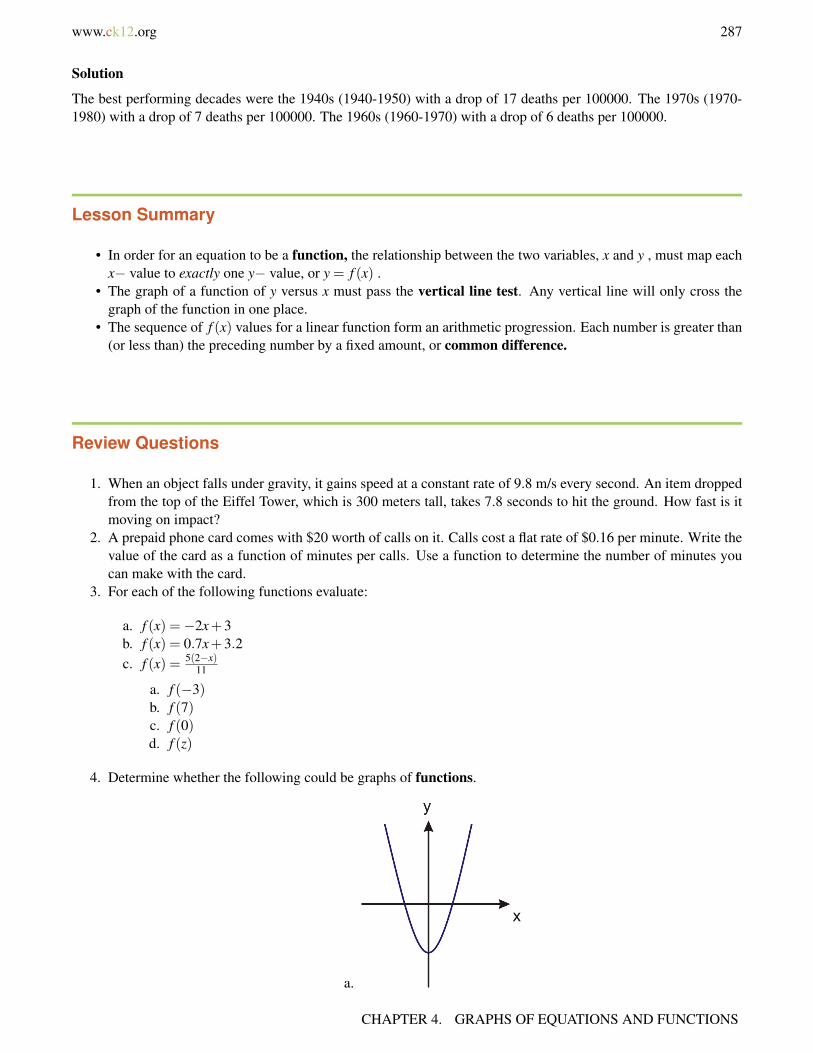
www.ck12.org 287
Solution
The best performing decades were the 1940s (1940-1950) with a drop of 17 deaths per 100000. The 1970s (1970-1980) with a drop of 7 deaths per 100000. The 1960s (1960-1970) with a drop of 6 deaths per 100000.
Lesson Summary
• In order for an equation to be a function, the relationship between the two variables, x and y , must map eachx− value to exactly one y− value, or y = f (x) .
• The graph of a function of y versus x must pass the vertical line test. Any vertical line will only cross thegraph of the function in one place.
• The sequence of f (x) values for a linear function form an arithmetic progression. Each number is greater than(or less than) the preceding number by a fixed amount, or common difference.
Review Questions
1. When an object falls under gravity, it gains speed at a constant rate of 9.8 m/s every second. An item droppedfrom the top of the Eiffel Tower, which is 300 meters tall, takes 7.8 seconds to hit the ground. How fast is itmoving on impact?
2. A prepaid phone card comes with $20 worth of calls on it. Calls cost a flat rate of $0.16 per minute. Write thevalue of the card as a function of minutes per calls. Use a function to determine the number of minutes youcan make with the card.
3. For each of the following functions evaluate:
a. f (x) =−2x+3b. f (x) = 0.7x+3.2c. f (x) = 5(2−x)
11
a. f (−3)b. f (7)c. f (0)d. f (z)
4. Determine whether the following could be graphs of functions.
a.
CHAPTER 4. GRAPHS OF EQUATIONS AND FUNCTIONS

288 www.ck12.org
b.
c.
d.
5. The roasting guide for a turkey suggests cooking for 100 minutes plus an additional 8 minutes per pound.
a. Write a function for the roasting time the given the turkey weight in pounds (x) .b. Determine the time needed to roast a 10 lb turkey.c. Determine the time needed to roast a 27 lb turkey.d. Determine the maximum size turkey you could roast in 4 1
2 hours .
6. Determine the missing terms in the following arithmetic progressions.
a. −11,17, ,73b. 2, ,−4c. 13, , , ,0
Review Answers
1. 76.44 m/s2. f (x) = 2000−16x; 125 minutes
a. 9b. -11c. 3d. f (z) =−2z+3
4.7. LINEAR FUNCTION GRAPHS

www.ck12.org 289
a. 1.1b. 8.1c. 3.2d. f (z) = 0.7z+3.2
a. 2.27b. -2.27c. 0.909d. f (z) = 10
11 −511 z
a. yesb. noc. nod. yes
a. f (x) = 8x+100b. 180 min = 3 hrsc. 316 min = 5 hrs 16 mind. 21.25 lbs.
a. 45b. -1c. 9.75, 6.5, 3.25
CHAPTER 4. GRAPHS OF EQUATIONS AND FUNCTIONS

290 www.ck12.org
4.8 Problem-Solving Strategies - Graphs
Learning Objectives
• Read and understand given problem situations.• Use the strategy: read a graph.• Develop and apply the strategy: make a graph.• Solve real-world problems using selected strategies as part of a plan.
Introduction
In this chapter, we have been solving problems where quantities are linearly related to each other. In this section,we will look at a few examples of linear relationships that occur in real-world problems. Remember back to ourProblem Solving Plan.
Step 1:
Understand the problem
Read the problem carefully. Once the problem is read, list all the components and data that are involved. This iswhere you will be assigning your variables.
Step 2:
Devise a plan - Translate
Come up with a way to solve the problem. Set up an equation, draw a diagram, make a chart or construct a table asa start to solving your problem.
Step 3:
Carry out the plan - Solve
This is where you solve the equation you came up with in Step 2.
Step 4:
Look - Check and Interpret
Check to see if your answer makes sense.
Let’s look at an example that investigates a geometrical relationship.
4.8. PROBLEM-SOLVING STRATEGIES - GRAPHS
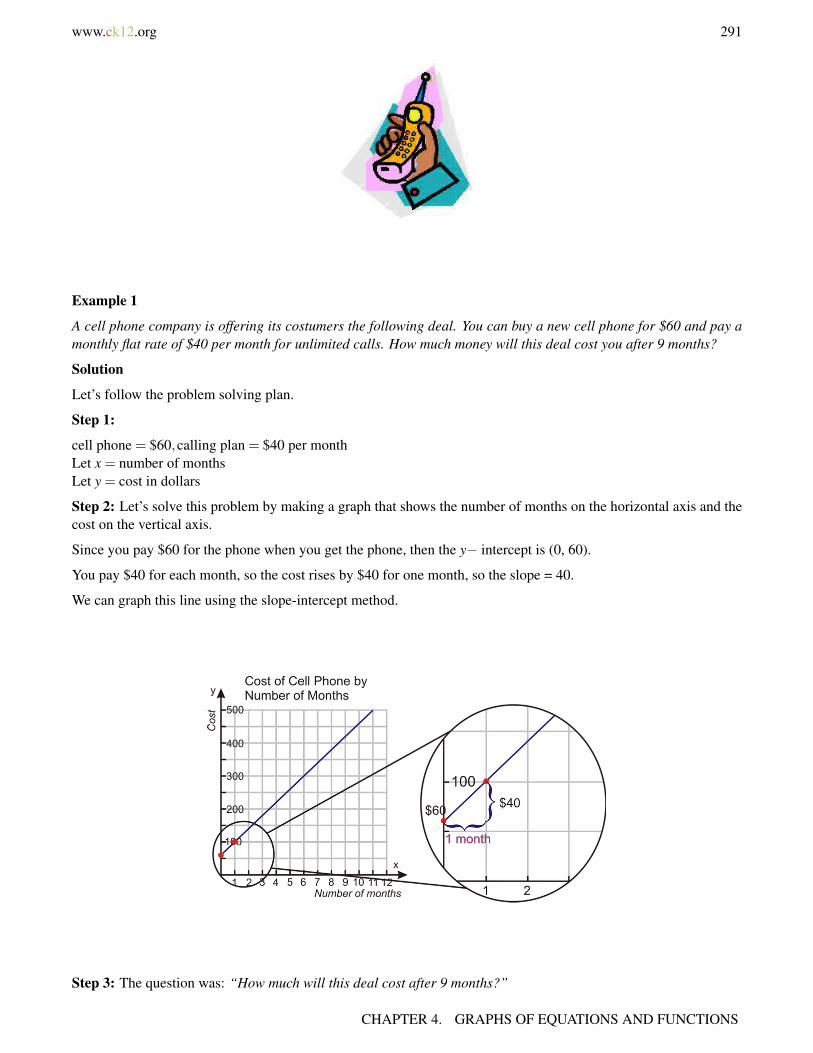
www.ck12.org 291
Example 1
A cell phone company is offering its costumers the following deal. You can buy a new cell phone for $60 and pay amonthly flat rate of $40 per month for unlimited calls. How much money will this deal cost you after 9 months?
Solution
Let’s follow the problem solving plan.
Step 1:
cell phone = $60,calling plan = $40 per monthLet x = number of monthsLet y = cost in dollars
Step 2: Let’s solve this problem by making a graph that shows the number of months on the horizontal axis and thecost on the vertical axis.
Since you pay $60 for the phone when you get the phone, then the y− intercept is (0, 60).
You pay $40 for each month, so the cost rises by $40 for one month, so the slope = 40.
We can graph this line using the slope-intercept method.
Step 3: The question was: “How much will this deal cost after 9 months?”
CHAPTER 4. GRAPHS OF EQUATIONS AND FUNCTIONS

292 www.ck12.org
We can now read the answer from the graph. We draw a vertical line from 9 months until it meets the graph, andthen draw a horizontal line until it meets the vertical axis.
We see that after 9 months you pay approximately $420.
Step 4: To check if this is correct, let’s think of the deal again. Originally, you pay $60 and then $40 for 9 months.
Phone = $60
Calling plan = $40×9 = $360
Total cost = $420.
The answer checks out.
Example 2
A stretched spring has a length of 12 inches when a weight of 2 lbs is attached to the spring. The same spring hasa length of 18 inches when a weight of 5 lbs is attached to the spring. It is known from physics that within certainweight limits, the function that describes how much a spring stretches with different weights is a linear function.What is the length of the spring when no weights are attached?
Solution
Let’s apply problem solving techniques to our problem.
Step 1:
We know: the length of the spring = 12 inches when weight = 2 lbs.
4.8. PROBLEM-SOLVING STRATEGIES - GRAPHS

www.ck12.org 293
the length of the spring = 18 inches when weight = 5 lbs.
We want: the length of the spring when the weight = 0 lbs.
Let x = the weight attached to the spring.
Let y = the length of the spring
Step 2
Let’s solve this problem by making a graph that shows the weight on the horizontal axis and the length of the springon the vertical axis.
We have two points we can graph.
When the weight is 2 lbs, the length of the spring is 12 inches. This gives point (2, 12).
When the weight is 5 lbs, the length of the spring is 18 inches. This gives point (5, 18).
If we join these two points by a line and extend it in both directions we get the relationship between weight andlength of the spring.
Step 3
The question was: “What is the length of the spring when no weights are attached?”
We can answer this question by reading the graph we just made. When there is no weight on the spring, the x valueequals to zero, so we are just looking for the y− intercept of the graph. Looking at the graph we see that the y−intercept is approximately 8 inches.
Step 4
To check if this correct, let’s think of the problem again.
You can see that the length of the spring goes up by 6 inches when the weight is increased by 3 lbs, so the slope ofthe line is 6 inches
3 lbs = 2 inches/lb .
To find the length of the spring when there is no weight attached, we look at the spring when there are 2 lbs attached.For each pound we take off, the spring will shorten by 2 inches. Since we take off 2 lbs, the spring will be shorterby 4 inches. So, the length of the spring with no weights is 12 inches −4 inches = 8 inches .
The answer checks out.
CHAPTER 4. GRAPHS OF EQUATIONS AND FUNCTIONS

294 www.ck12.org
Example 3
Christine took one hour to read 22 pages of Harry Potter and the Order of the Phoenix. She has 100 pages left toread in order to finish the book. Assuming that she reads at a constant rate of pages per hour, how much time shouldshe expect to spend reading in order to finish the book?
Solution: Let’s apply the problem solving techniques:
Step 1
We know that it takes Christine takes 1 hour to read 22 pages.
We want to know how much time it takes her to read 100 pages.
Let x = the time expressed in hours.
Let y = the number of pages.
Step 2
Let’s solve this problem by making a graph that shows the number of hours spent reading on the horizontal axis andthe number of pages on the vertical axis.
We have two points we can graph.
Christine takes one hour to read 22 pages. This gives point (1, 22).
A second point is not given but we know that Christine takes 0 hours to read 0 pages. This gives the point (0, 0).
If we join these two points by a line and extend it in both directions we get the relationship between the amount oftime spent reading and the number of pages read.
Step 3
The question was: “How much time should Christine expect to spend reading 100 pages?”
We find the answer from reading the graph - we draw a horizontal line from 100 pages until it meets the graph and
4.8. PROBLEM-SOLVING STRATEGIES - GRAPHS
www.ck12.org 295
then we draw the vertical until it meets the horizontal axis. We see that it takes approximately 4.5 hours to read theremaining 100 pages.
Step 4
To check if this correct, let’s think of the problem again.
We know that Christine reads 22 pages per hour. This is the slope of the line or the rate at which she is reading.To find how many hours it takes her to read 100 pages, we divide the number of pages by the rate. In this case,
100 pages22 pages per hour = 4.54 hours . This is very close to what we gathered from reading the graph.
The answer checks out.
Example 4
Aatif wants to buy a surfboard that costs $249. He was given a birthday present of $50 and he has a summer job thatpays him $6.50 per hour. To be able to buy the surfboard, how many hours does he need to work?
Solution
Let’s apply the problem solving techniques.
Step 1
We know - Surfboard costs $249.
He has $50.
His job pays $6.50 per hour.
We want - How many hours does Aatif need to work to buy the surfboard?
Let x = the time expressed in hours
Let y = Aatif’s earnings
Step 2
Let’s solve this problem by making a graph that shows the number of hours spent working on the horizontal axis andAatif’s earnings on the vertical axis.
Peter has $50 at the beginning. This is the y− intercept of (0, 50).
He earns $6.50 per hour. This is the slope of the line.
We can graph this line using the slope-intercept method. We graph the y− intercept of (0, 50) and we know that foreach unit in the horizontal direction the line rises by 6.5 units in the vertical direction. Here is the line that describesthis situation.
CHAPTER 4. GRAPHS OF EQUATIONS AND FUNCTIONS

296 www.ck12.org
Step 3
The question was “How many hours does Aatif need to work in order to buy the surfboard?”
We find the answer from reading the graph. Since the surfboard costs $249, we draw a horizontal line from $249on the vertical axis until it meets the graph and then we draw a vertical line downwards until it meets the horizontalaxis. We see that it takes approximately 31 hours to earn the money.
Step 4
To check if this correct, let’s think of the problem again.
We know that Aatif has $50 and needs $249 to buy the surfboard. So, he needs to earn $249− $50 = $199 fromhis job.
His job pays $6.50 per hour. To find how many hours he need to work we divide $199$6.50 per hour = 30.6 hours . This
is very close to the result we obtained from reading the graph.
The answer checks out.
Lesson Summary
The four steps of the problem solving plan are:
a. Understand the problemb. Devise a plan - Translate. Build a graph.c. Carry out the plan - Solve. Use the graph to answer the question asked.d. Look - Check and Interpret
Review Questions
Solve the following problems by making a graph and reading a graph.
1. A gym is offering a deal to new members. Customers can sign up by paying a registration fee of $200 and amonthly fee of $39. How much will this membership cost a member by the end of the year?
4.8. PROBLEM-SOLVING STRATEGIES - GRAPHS

www.ck12.org 297
2. A candle is burning at a linear rate. The candle measures five inches two minutes after it was lit. It measuresthree inches eight minutes after it was lit. What was the original length of the candle?
3. Tali is trying to find the width of a page of his telephone book. In order to do this, he takes a measurement andfinds out that 550 pages measures 1.25 inches. What is the width of one page of the phone book?
4. Bobby and Petra are running a lemonade stand and they charge 45 cents for each glass of lemonade. In orderto break even they must make $25. How many glasses of lemonade must they sell to break even?
Review Answers
1. $6682. 5.67 inches3. 0.0023 inches4. 56 glasses
Texas Instruments Resources
In the CK-12 Texas Instruments Algebra I FlexBook, there are graphing calculator activities designed to supple-ment the objectives for some of the lessons in this chapter. See http://www.ck12.org/flexr/chapter/9614.
CHAPTER 4. GRAPHS OF EQUATIONS AND FUNCTIONS

298 www.ck12.org
CHAPTER 5 Writing Linear EquationsCHAPTER OUTLINE
5.1 LINEAR EQUATIONS IN SLOPE-INTERCEPT FORM
5.2 LINEAR EQUATIONS IN POINT-SLOPE FORM
5.3 LINEAR EQUATIONS IN STANDARD FORM
5.4 EQUATIONS OF PARALLEL AND PERPENDICULAR LINES
5.5 FITTING A LINE TO DATA
5.6 PREDICTING WITH LINEAR MODELS
5.7 PROBLEM SOLVING STRATEGIES: USE A LINEAR MODEL
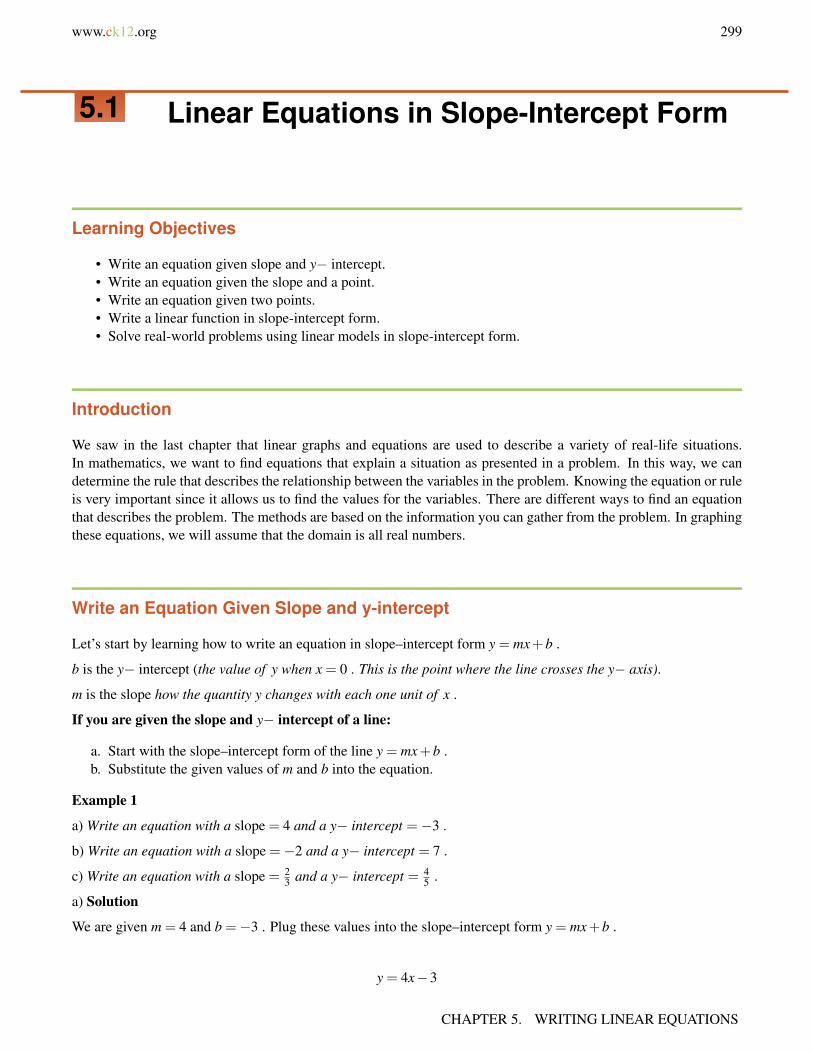
www.ck12.org 299
5.1 Linear Equations in Slope-Intercept Form
Learning Objectives
• Write an equation given slope and y− intercept.• Write an equation given the slope and a point.• Write an equation given two points.• Write a linear function in slope-intercept form.• Solve real-world problems using linear models in slope-intercept form.
Introduction
We saw in the last chapter that linear graphs and equations are used to describe a variety of real-life situations.In mathematics, we want to find equations that explain a situation as presented in a problem. In this way, we candetermine the rule that describes the relationship between the variables in the problem. Knowing the equation or ruleis very important since it allows us to find the values for the variables. There are different ways to find an equationthat describes the problem. The methods are based on the information you can gather from the problem. In graphingthese equations, we will assume that the domain is all real numbers.
Write an Equation Given Slope and y-intercept
Let’s start by learning how to write an equation in slope–intercept form y = mx+b .
b is the y− intercept (the value of y when x = 0 . This is the point where the line crosses the y− axis).
m is the slope how the quantity y changes with each one unit of x .
If you are given the slope and y− intercept of a line:
a. Start with the slope–intercept form of the line y = mx+b .b. Substitute the given values of m and b into the equation.
Example 1
a) Write an equation with a slope = 4 and a y− intercept =−3 .
b) Write an equation with a slope =−2 and a y− intercept = 7 .
c) Write an equation with a slope = 23 and a y− intercept = 4
5 .
a) Solution
We are given m = 4 and b =−3 . Plug these values into the slope–intercept form y = mx+b .
y = 4x−3
CHAPTER 5. WRITING LINEAR EQUATIONS
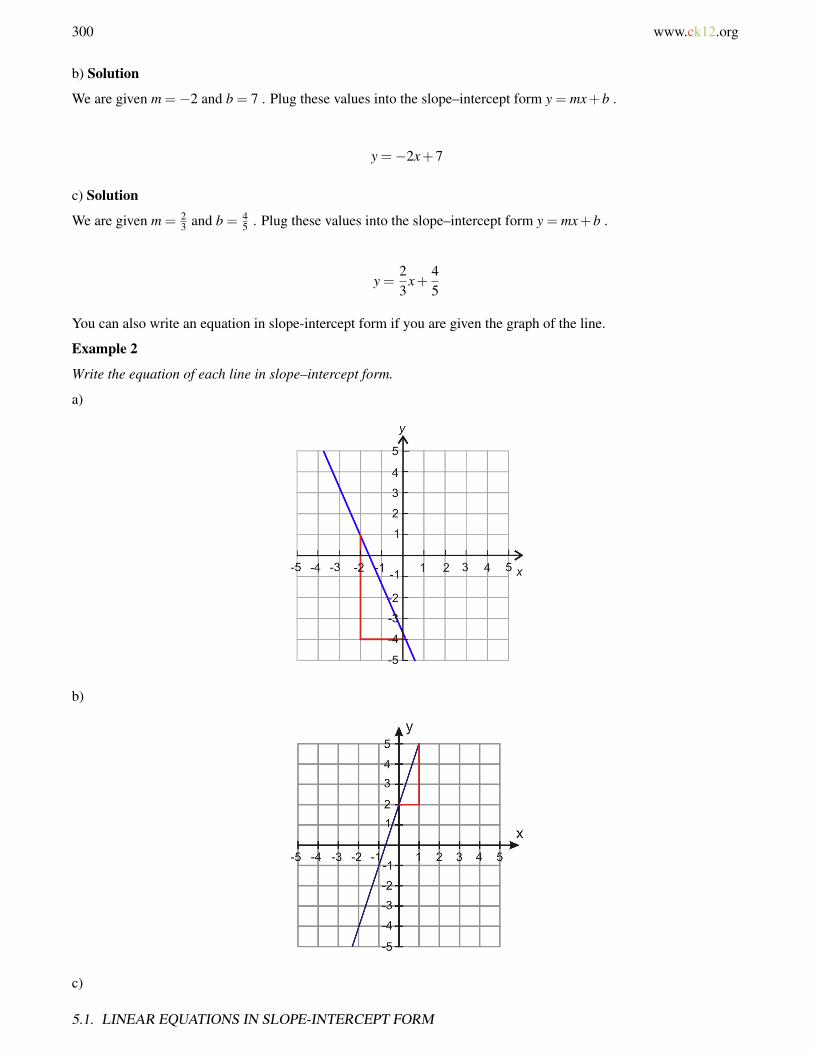
300 www.ck12.org
b) Solution
We are given m =−2 and b = 7 . Plug these values into the slope–intercept form y = mx+b .
y =−2x+7
c) Solution
We are given m = 23 and b = 4
5 . Plug these values into the slope–intercept form y = mx+b .
y =23
x+45
You can also write an equation in slope-intercept form if you are given the graph of the line.
Example 2
Write the equation of each line in slope–intercept form.
a)
b)
c)
5.1. LINEAR EQUATIONS IN SLOPE-INTERCEPT FORM
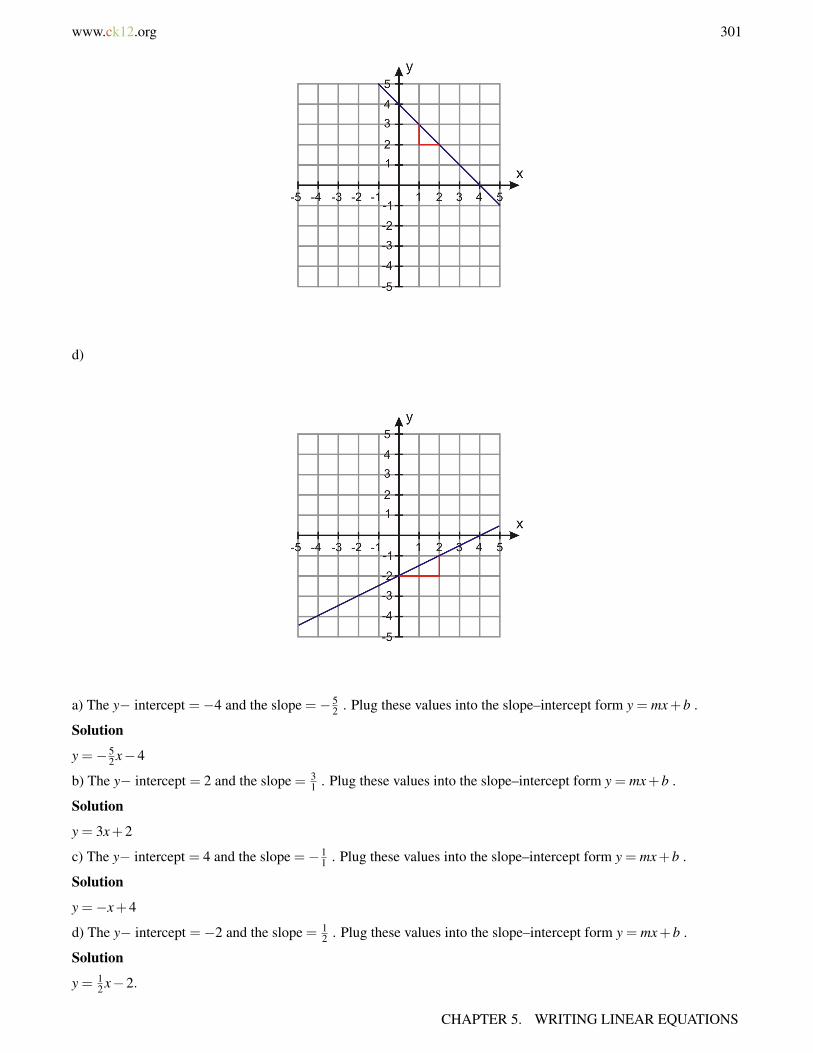
www.ck12.org 301
d)
a) The y− intercept =−4 and the slope =−52 . Plug these values into the slope–intercept form y = mx+b .
Solution
y =−52 x−4
b) The y− intercept = 2 and the slope = 31 . Plug these values into the slope–intercept form y = mx+b .
Solution
y = 3x+2
c) The y− intercept = 4 and the slope =−11 . Plug these values into the slope–intercept form y = mx+b .
Solution
y =−x+4
d) The y− intercept =−2 and the slope = 12 . Plug these values into the slope–intercept form y = mx+b .
Solution
y = 12 x−2.
CHAPTER 5. WRITING LINEAR EQUATIONS
302 www.ck12.org
Write an Equation Given the Slope and a Point
Often, we don’t know the value of the y− intercept, but we know the value of y for a non-zero value of x . In thiscase we can still use the slope–intercept form to find the equation of the line.
For example, we are told that the slope of a line is two and that the line passes through the point (1, 4). To find theequation of the line, we start with the slope–intercept form of a line.
y = mx+b
Plug in the value of the slope.
We don’t know the value of b but we know that the slope is two, and that point (1, 4) is on this line. Where the xvalue is one, and the y value is four. We plug this point in the equation and solve for b .
4 = 2(1)+b
4 = 2+b
−2 =−2
2 = b
Therefore the equation of this line is y = 2x+2 .
If you are given the slope and a point on the line:
a. Start with the slope–intercept form of the line y = mx+b .b. Plug in the given value of m into the equation.c. Plug the x and y values of the given point and solve for b .d. Plug the value of b into the equation.
Example 3
Write the equation of the line in slope–intercept form.
a) The slope of the line is 4 and the line contains point (-1, 5).
b) The slope of the line is −23 and the line contains point (2, -2).
c) The slope of the line is -3 and the line contains point (3, -5).
Solution
a)
Start with the slopeâ[U+0080][U+0093]intercept form of the line y = mx+b
Plug in the slope. y = 4x+b
Plug point (−1,5) into the equation. 5 = 4(−1)+b⇒ b = 9
Plug the value of b into the equation. y = 4x+9
b)
5.1. LINEAR EQUATIONS IN SLOPE-INTERCEPT FORM

www.ck12.org 303
Start with the slopeâ[U+0080][U+0093]intercept form of the line y = mx+b
Plug in the slope. y =−23
x+b
Plug point (2,−2) into the equation. −2 =−23(2)+b⇒ b =−2+
43=−2
3
Plug the value of b into the equation. y =−23
x− 23
c)
Start with the slopeâ[U+0080][U+0093]intercept form of the line y = mx+b
Plug in the slope. y =−3x+b
Plug point (3,−5) into the equation. −5 =−3(3)+b⇒ b = 4
Plug the value of b into the equation. y =−3x+4
Write an Equation Given Two Points
One last case is when we are just given two points on the line and we are asked to write the line of the equation inslope–intercept form.
For example, we are told that the line passes through the points (-2, 3) and (5, 2). To find the equation of the line westart with the slope–intercept form of a line
y = mx+b
Since we don’t know the slope, we find it using the slope formula m = y2−y1x2−x1
.
Now substitute the x1 and x2 and the y1 and y2 values into the slope formula to solve for the slope.
m =2−3
5− (−2)=−1
7
We plug the value of the slope into the slope–intercept form y =−17 x+b
We don’t know the value of b but we know two points on the line. We can plug either point into the equation andsolve for b . Let’s use point (-2, 3).
Therefore, the equation of this line is y =−17 x+ 19
7 .
If you are given two points on the line:
a. Start with the slope–intercept form of the line y = mx+bb. Use the two points to find the slope using the slope formula m = y2−y1
x2−x1.
c. Plug the given value of m into the equation.d. Plug the x and y values of one of the given points into the equation and solve for b .e. Plug the value of b into the equation.
CHAPTER 5. WRITING LINEAR EQUATIONS
304 www.ck12.org
f. Plug the other point into the equation to check the values of m and b .
Example 4
Write the equations of each line in slope–intercept form.
a) The line contains the points (3, 2) and (-2, 4).
b) The line contains the points (-4, 1) and (-2, 3).
Solution:
a)
a. Start with the slope–intercept form of the line y = mx+b .b. Find the slope of the line. m = y2−y1
x2−x1= 4−2−2−3 =−2
5c. Plug in the value of the slope. y =−2
5 x+bd. Plug point (3, 2) into the equation. 2 =−2
5(3)+b⇒ b = 2+ 65 = 16
5e. Plug the value of b into the equation. y =−2
5 x+ 165
f. Plug point (-2, 4) into the equation to check. 4 =−25(−2)+ 16
5 = 45 +
165 = 20
5 = 4
b)
a. Start with the slope–intercept form of the line y = mx+b .b. Find the slope of the line. m = y2−y1
x2−x1= 3−1−2−(−4) =
22 = 1
c. Plug in the value of the slope. y = x+bd. Plug point (-2, 3) into the equation. 3 =−2+b⇒ b = 5e. Plug the value of b into the equation. y = x+5f. Plug point (-4, 1) into the equation to check. 1 =−4+5 = 1
Write a Linear Function in Slope-Intercept Form
Remember that you write a linear function in the form f (x) = mx+ b . Here f (x) represents the y values of theequation or the graph. So y = f (x) and they are often used interchangeably. Using the functional notation in anequation gives us more information.
For instance, the expression f (x) = mx+ b shows clearly that x is the independent variable because you plug invalues of x into the function and perform a series of operations on the value of x in order to calculate the values ofthe dependent variable, y .
In this case when you plug x into the function, the function tells you to multiply it by m and then add b to the result.This generates all the values of y you need.
Example 5
Consider the linear function f (x) = 3x−4 . Find f (2), f (0) and f (−1) .
Solution
All the numbers in the parentheses are the values of x that you need to plug into the equation of the function.
5.1. LINEAR EQUATIONS IN SLOPE-INTERCEPT FORM

www.ck12.org 305
When you plug values into a function, it is best to plug in the whole parenthesis, not just the value inside the paren-thesis. We often plug expressions into the function instead of numbers, and it is important to keep the expressioninside the parenthesis in order to perform the correct order of operations. For example, we want to find f (2x− 1)for the same function we used before.
Functional notation is a very compact way of giving information. For example you are told that f (3) = 2 .
To read this information, remember a few things.
The value inside the parentheses is the x− value.
The value equal to the function is the dependent value (i.e. the y− value for lines).
So, f (3) = 2 tells you that x = 3 and y = 2 or that point (3, 2) is on the line.
We will now use functional notation to write equations of lines in slope–intercept form.
Example 6
Find the equation of the following lines in slope–intercept form
a) m =−2 and f (0) = 5 .
b) m = 3.5 and f (−2) = 1 .
c) f (−1) = 1 and f (1) =−1 .
Solution
a) We are told that m =−2 and the line contains point (0, 5), so b = 5 .
Plug the values of m and b into the slope–intercept form f (x) = mx+b .
f (x) =−2x+5.
b) We are told that m = 3.5 and line contains point (-2, 1).
CHAPTER 5. WRITING LINEAR EQUATIONS
306 www.ck12.org
Start with slopeâ[U+0080][U+0093]intercept form. f (x) = mx+b
Plug in the value of the slope. f (x) = 3.5x+b
Plug in the point (−2,1). 1 = 3.5(−2)+⇒ b = 1+7 = 8
Plug the value of b in the equation. f (x) = 3.5x+8
c) We are told that the line contains the points (-1, 1) and (1, -1).
Start with slopeâ[U+0080][U+0093]intercept form. f (x) = mx+b
Find the slope. m =−1−1
1− (−1)=−22
=−1
Plug in the value of the slope. f (x) =−1x+b
Plug in the point (−1,1).1 =−1(−1)+b⇒ b = 0
Plug the value of b in the equation. f (x) =−x
Solve Real-World Problems Using Linear Models in Slope-Intercept Form
Let’s apply the methods we just learned to a few application problems that can be modeled using a linear relationship.
Example 7
Nadia has $200 in her savings account. She gets a job that pays $7.50 per hour and she deposits all her earningsin her savings account. Write the equation describing this problem in slope–intercept form. How many hours wouldNadia need to work to have $500 in her account?
Let’s define our variables
y = amount of money in Nadia’s savings account
x = number of hours
You can see that the problem gives us the y− intercept and the slope of the equation.
We are told that Nadia has $200 in her savings account, so b = 200 .
We are told that Nadia has a job that pays $7.50 per hour, so m = 7.50 .
If we plug these values in the slope–intercept form y = mx+b we obtain y = 7.5x+200 .
To answer the question, we plug in y = 500 and solve for x . 500 = 7.5x+200⇒ 7.5x = 300⇒ x = 40 hours .
Solution
Nadia must work 40 hours if she is to have $500 in her account.
5.1. LINEAR EQUATIONS IN SLOPE-INTERCEPT FORM

www.ck12.org 307
Example 8
A stalk of bamboo of the family Phyllostachys nigra grows at steady rate of 12 inches per day and achieves its fullheight of 720 inches in 60 days. Write the equation describing this problem in slope–intercept form.
How tall is the bamboo 12 days after it started growing?
Let’s define our variables
y = the height of the bamboo plant in inches
x = number of days
You can see that the problem gives us the slope of the equation and a point on the line.
We are told that the bamboo grows at a rate of 12 inches per day, so m = 12 .
We are told that the plant grows to 720 inches in 60 days, so we have the point (60, 720).
Start with the slopeâ[U+0080][U+0093]intercept form of the line y = mx+b
Plug in the slope. y = 12x+b
Plug in point (60,720). 720 = 12(60)+b⇒ b = 0
Plug the value of b back into the equation. y = 12x
To answer the question, plug in x = 12 to obtain y = 12(12) = 144 inches .
Solution
The bamboo is 144 inches (12 feet!) tall 12 days after it started growing.
Example 9
Petra is testing a bungee cord. She ties one end of the bungee cord to the top of a bridge and to the other end sheties different weights and measures how far the bungee stretches. She finds that for a weight of 100 lb, the bungeestretches to 265 feet and for a weight of 120 lb, the bungee stretches to 275 feet. Physics tells us that in a certainrange of values, including the ones given here, the amount of stretch is a linear function of the weight. Write theequation describing this problem in slope–intercept form. What should we expect the stretched length of the cord tobe for a weight of 150 lbs?
Let’s define our variables
y = the stretched length of the bungee cord in feet in feet
x = the weight attached to the bungee cord in pounds
You can see that the problem gives us two points on the line.
We are told that for a weight of 100 lbs the cord stretches to 265 feet, so we have point (100, 265).
We are told that for a weight of 200 lbs the cord stretches to 275 feet, so we have point (120, 270).
CHAPTER 5. WRITING LINEAR EQUATIONS

308 www.ck12.org
Start with the slopeâ[U+0080][U+0093]intercept form of the line y = mx+b
Find the slope of the line. m =y2− y1
x2− x1=
270−265120−100
=5
20=
14
Plug in the value of the slope. y =14
x+b
Plug point (100,265) into the equation. 265 =14(100)+b⇒ b = 265−25 = 240
Plug the value of b into the equation. y =14
x+240
To answer the question, we plug in x = 150 . y = 14(150)+240⇒ y = 37.5+240 = 277.5 f eet
Solution
For a weight of 150 lbs we expect the stretched length of the cord to be 277.5 feet.
Lesson Summary
• The equation of a line in slope-intercept form is y = mx+b .
Where m is the slope and (0,b) is the y− intercept).
• If you are given the slope and y− intercept of a line:
a. Simply plug m and b into the equation.
• If you are given the slope and a point on the line:
a. Plug in the given value of m into the equation.b. Plug the x and y values of the given point and solve for b .c. Plug the value of b into the equation.
• If you are given two points on the line:
a. Use the two points to find the slope using the slope formula m = y2−y1x2−x1
.b. Plug the value of m into the equation.c. Plug the x and y values of one of the given points and solve for b .d. Plug the value of b into the equation.e. Plug the other point into the equation to check the values of m and b .
Review Questions
Find the equation of the line in slope–intercept form.
1. The line has slope of 7 and y− intercept of -2.
5.1. LINEAR EQUATIONS IN SLOPE-INTERCEPT FORM
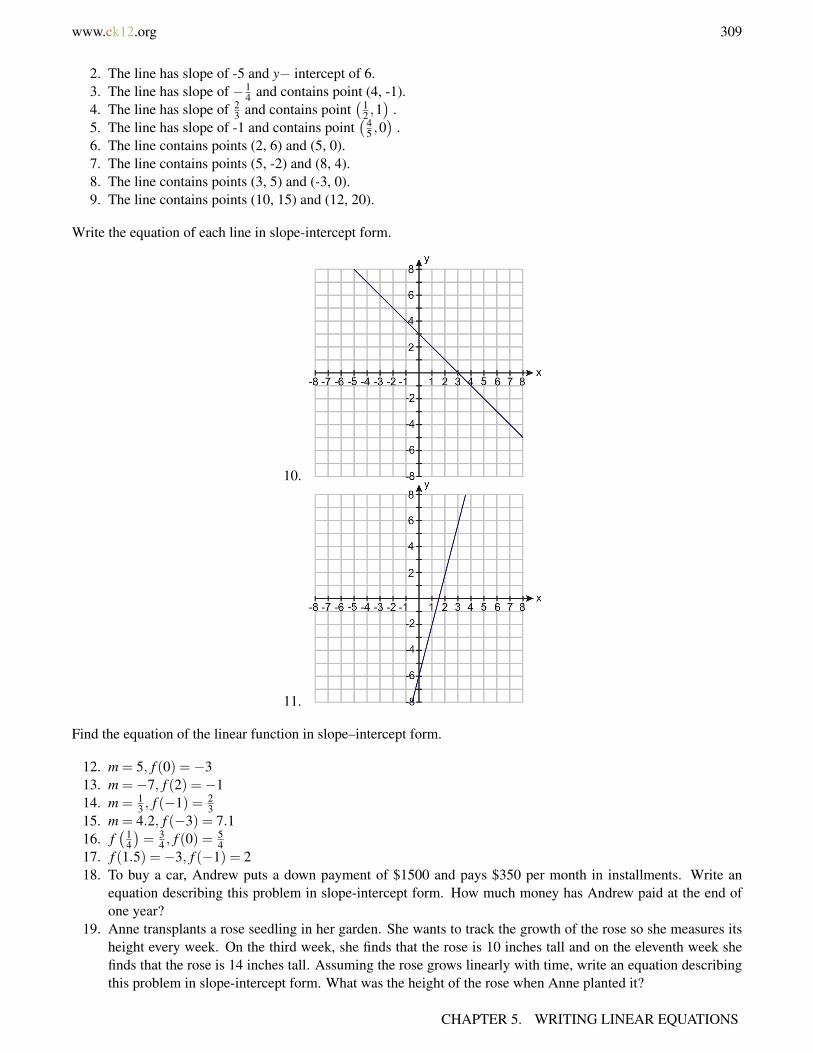
www.ck12.org 309
2. The line has slope of -5 and y− intercept of 6.3. The line has slope of −1
4 and contains point (4, -1).4. The line has slope of 2
3 and contains point(1
2 ,1)
.5. The line has slope of -1 and contains point
(45 ,0)
.6. The line contains points (2, 6) and (5, 0).7. The line contains points (5, -2) and (8, 4).8. The line contains points (3, 5) and (-3, 0).9. The line contains points (10, 15) and (12, 20).
Write the equation of each line in slope-intercept form.
10.
11.
Find the equation of the linear function in slope–intercept form.
12. m = 5, f (0) =−313. m =−7, f (2) =−114. m = 1
3 , f (−1) = 23
15. m = 4.2, f (−3) = 7.116. f
(14
)= 3
4 , f (0) = 54
17. f (1.5) =−3, f (−1) = 218. To buy a car, Andrew puts a down payment of $1500 and pays $350 per month in installments. Write an
equation describing this problem in slope-intercept form. How much money has Andrew paid at the end ofone year?
19. Anne transplants a rose seedling in her garden. She wants to track the growth of the rose so she measures itsheight every week. On the third week, she finds that the rose is 10 inches tall and on the eleventh week shefinds that the rose is 14 inches tall. Assuming the rose grows linearly with time, write an equation describingthis problem in slope-intercept form. What was the height of the rose when Anne planted it?
CHAPTER 5. WRITING LINEAR EQUATIONS

310 www.ck12.org
20. Ravi hangs from a giant spring whose length is 5 m. When his child Nimi hangs from the spring its length is 2m. Ravi weighs 160 lbs. and Nimi weighs 40 lbs. Write the equation for this problem in slope-intercept form.What should we expect the length of the spring to be when his wife Amardeep, who weighs 140 lbs., hangsfrom it?
Review Answers
1. y = 7x−22. y =−5x+63. y =−1
4 x4. y = 2
3 x+ 23
5. y =−1x+ 45
6. y =−2x+107. y = 2x−128. y = 5
6 x+ 52
9. y = 52 x−10
10. y =−x+311. y = 4x−612. f (x) = 5x−313. f (x) =−7x+1314. f (x) = 1
3 x+115. f (x) = 4.2x+19.716. f (x) =−2x+ 5
417. f (x) =−2x18. y = 350x+1500;y = $570019. y = 0.5x+8.5;y = 8.5 inches20. y = .025x+1 or y = 1
40 x+1;y = 4.5 m
5.1. LINEAR EQUATIONS IN SLOPE-INTERCEPT FORM
www.ck12.org 311
5.2 Linear Equations in Point-Slope Form
Learning Objectives
• Write an equation in point-slope form.• Graph an equation in point-slope form.• Write a linear function in point-slope form.• Solve real-world problems using linear models in point-slope form.
Introduction
In the last lesson, we saw how to write the equation of a straight line in slope-intercept form. We can rewrite thisequation in another way that sometimes makes solving the problem easier. The equation of a straight line that weare going to talk about is called point-slope form.
y− y0 = m(x− x0)
Here m is the slope and (x0,y0) is a point on the line. Let’s see how we can use this form of the equation in the threecases that we talked about in the last section.
Case 1: You know the slope of the line and the y− intercept.
Case 2: You know the slope of the line and a point on the line.
Case 3: You know two points on the line.
Write an Equation in Point-Slope Form
Case 1 You know the slope and the y− intercept.
a. Start with the equation in point-slope form y− y0 = m(x− x0) .b. Plug in the value of the slope.c. Plug in 0 for x0 and b for y0 .
Example 1
Write the equation of the line in point-slope form, given that the slope =−5 and the y− intercept = 4 .
Solution:
a. Start with the equation in point-slope form. y− y0 = m(x− x0)b. Plug in the value of the slope. y− y0 =−5(x− x0)
CHAPTER 5. WRITING LINEAR EQUATIONS

312 www.ck12.org
c. Plug in 0 for x0 and 4 for y0 . y− (−4) =−5(x− (0))
Therefore, the equation is y+4 =−5x
Case 2 You know the slope and a point on the line.
a. Start with the equation in point-slope form y− y0 = m(x− x0) .b. Plug in the value of the slope.c. Plug in the x and y values in place of x0 and y0 .
Example 2
Write the equation of the line in point-slope form, given that the slope = 35 and the point (2,6) is on the line.
Solution:
a. Start with the equation in point-slope form. y− y0 = m(x− x0)b. Plug in the value of the slope. y− y0 =
35(x− x0)
c. Plug in 2 for x0 and 6 for y0 . y− (6) = 35(x− (2))
The equation is y−6 = 35(x−2)
Notice that the equation in point-slope form is not solved for y .
Case 3 You know two points on the line.
a. Start with the equation in point-slope form y− y0 = m(x− x0) .b. Find the slope using the slope formula. m = y2−y1
x2−x1c. Plug in the value of the slope.d. Plug in the x and y values of one of the given points in place of x0 and y0
Example 3
Write the equation of the line in point-slope form, given that the line contains points (-4, -2) and (8, 12).
Solution
1. Start with the equation in point-slope form. y− y0 = m(x− x0)
2. Find the slope using the slope formula. m = 12−(−2)8−(−4) = 14
12 = 76
3. Plug in the value of the slope. y− y0 =76(x− x0)
4. Plug in -4 for x0 and -2 for y0 . y− (−2) = 76(x− (−4))
Therefore, the equation is y+2 = 76(x+4) Answer 1
In the last example, you were told that for the last step you could choose either of the points you were given to plugin for the point (x0,y0) but it might not seem like you would get the same answer if you plug the second point ininstead of the first. Let’s redo Step 4.
4. Plug in 8 for x0 and 12 for y0 y−12 = 76(x−8) Answer 2
This certainly does not see like the same answer as we got by plugging in the first point. What is going on?
Notice that the equation in point-slope form is not solved for y . Let’s change both answers into slope-intercept formby solving for y .
5.2. LINEAR EQUATIONS IN POINT-SLOPE FORM

www.ck12.org 313
Answer 1 Answer 2
y+2 =76(x+4) y−12 =
76(x−8)
y+2 =76
x+286
y−12 =76
x− 566
y =76
x+143−2 y =
76
x− 283+12
y =76
x+83
y =76
x+83
Now that the two answers are solved for y , you can see that they simplify to the same thing. In point-slope formyou can get an infinite number of right answers, because there are an infinite number of points on a line. The slopeof the line will always be the same but the answer will look different because you can substitute any point on theline for (x0,y0) . However, regardless of the point you pick, the point-slope form should always simplify to the sameslope-intercept equation for points that are on the same line.
In the last example you saw that sometimes we need to change between different forms of the equation. To changefrom point-slope form to slope-intercept form, we just solve for y .
Example 4
Re-write the following equations in slope-intercept form.
a) y−5 = 3(x−2)
b) y+7 =−(x+4)
Solution
a) To re-write in slope-intercept form, solve for y .
y−5 = 3(x−2)
−5 = 3x−6
y = 3x−1
b) To re-write in slope-intercept form, solve for y .
y+7 =−(x+4)
y+7 =−x−4
y =−x−11
Graph an Equation in Point-Slope Form
If you are given an equation in point-slope form, it is not necessary to re-write it in slope-intercept form in orderto graph it. The point-slope form of the equation gives you enough information so you can graph the line y− y0 =m(x− x0) . From this equation, we know a point on the line (x0,y0) and the slope of the line.
To graph the line, you first plot the point (x0,y0) . Then the slope tells you how many units you should go up or downand how many units you should go to the right to get to the next point on the line. Let’s demonstrate this methodwith an example.
CHAPTER 5. WRITING LINEAR EQUATIONS
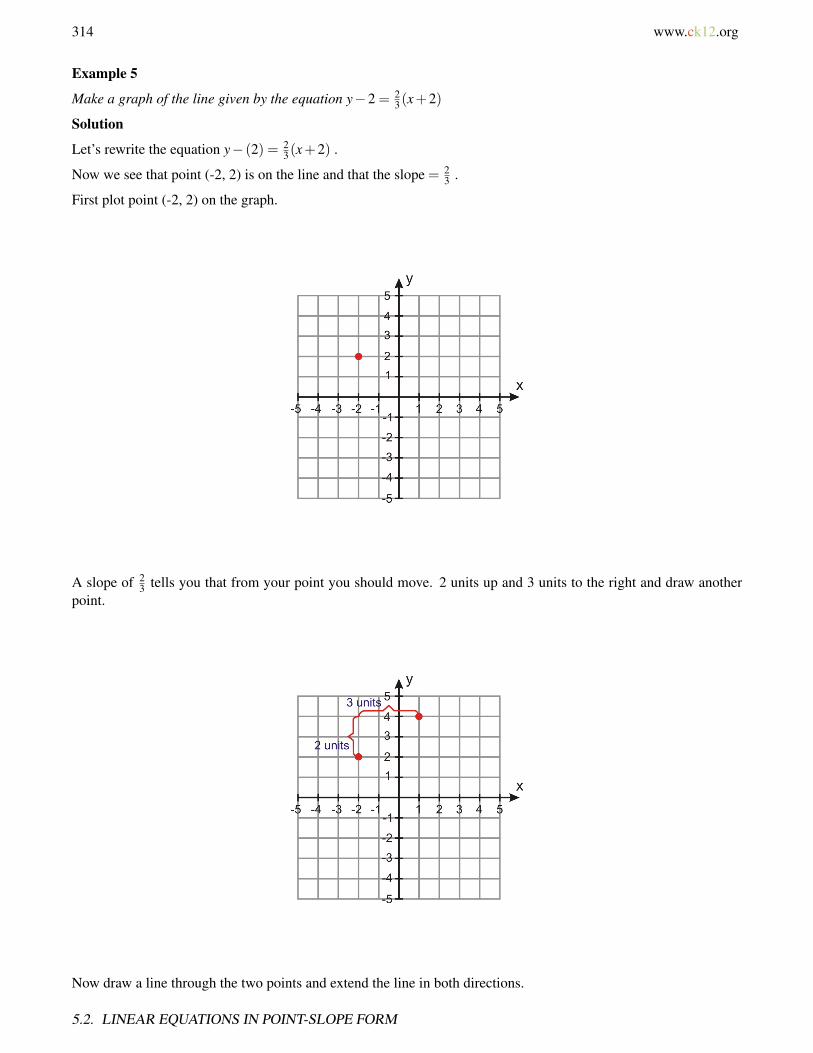
314 www.ck12.org
Example 5
Make a graph of the line given by the equation y−2 = 23(x+2)
Solution
Let’s rewrite the equation y− (2) = 23(x+2) .
Now we see that point (-2, 2) is on the line and that the slope = 23 .
First plot point (-2, 2) on the graph.
A slope of 23 tells you that from your point you should move. 2 units up and 3 units to the right and draw another
point.
Now draw a line through the two points and extend the line in both directions.
5.2. LINEAR EQUATIONS IN POINT-SLOPE FORM
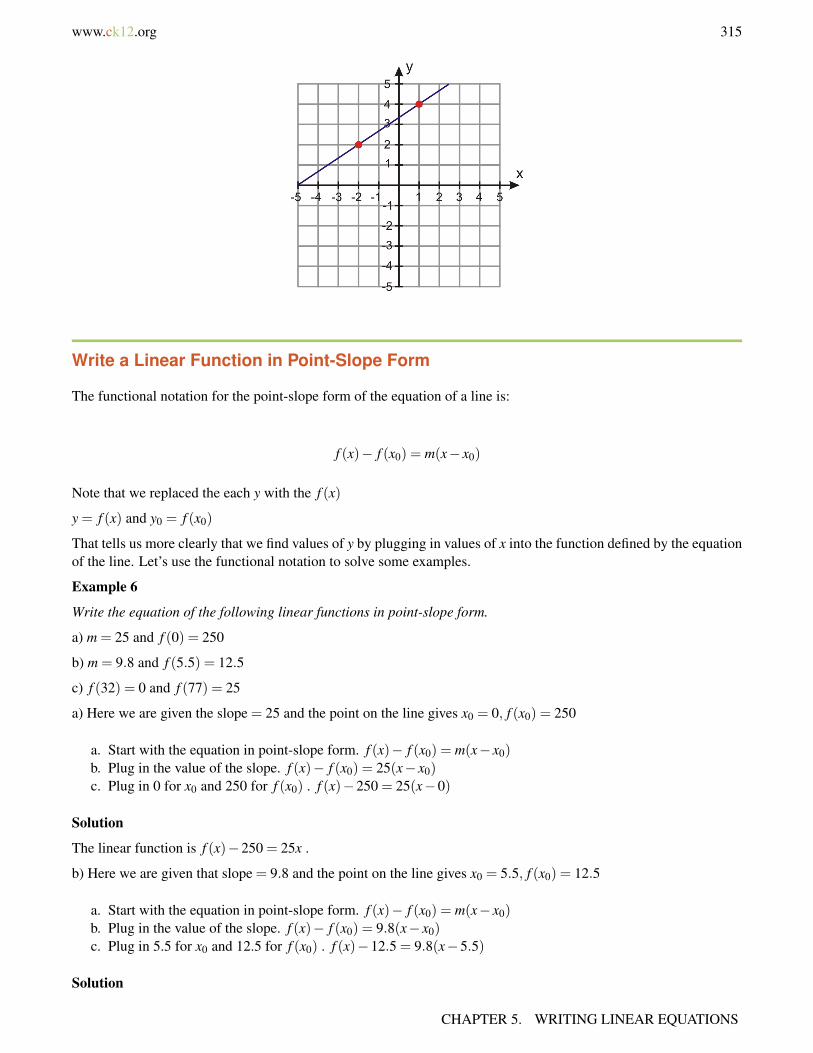
www.ck12.org 315
Write a Linear Function in Point-Slope Form
The functional notation for the point-slope form of the equation of a line is:
f (x)− f (x0) = m(x− x0)
Note that we replaced the each y with the f (x)
y = f (x) and y0 = f (x0)
That tells us more clearly that we find values of y by plugging in values of x into the function defined by the equationof the line. Let’s use the functional notation to solve some examples.
Example 6
Write the equation of the following linear functions in point-slope form.
a) m = 25 and f (0) = 250
b) m = 9.8 and f (5.5) = 12.5
c) f (32) = 0 and f (77) = 25
a) Here we are given the slope = 25 and the point on the line gives x0 = 0, f (x0) = 250
a. Start with the equation in point-slope form. f (x)− f (x0) = m(x− x0)b. Plug in the value of the slope. f (x)− f (x0) = 25(x− x0)c. Plug in 0 for x0 and 250 for f (x0) . f (x)−250 = 25(x−0)
Solution
The linear function is f (x)−250 = 25x .
b) Here we are given that slope = 9.8 and the point on the line gives x0 = 5.5, f (x0) = 12.5
a. Start with the equation in point-slope form. f (x)− f (x0) = m(x− x0)b. Plug in the value of the slope. f (x)− f (x0) = 9.8(x− x0)c. Plug in 5.5 for x0 and 12.5 for f (x0) . f (x)−12.5 = 9.8(x−5.5)
Solution
CHAPTER 5. WRITING LINEAR EQUATIONS

316 www.ck12.org
The linear function is f (x)−12.5 = 9.8(x−5.5) .
c) Here we are given two points (32, 0) and (77, 25).
a. Start with the equation in point-slope form. f (x)− f (x0) = m(x− x0)b. Find the value of the slope. m = 25−0
77−32 = 2545 = 5
9c. Plug in the value of the slope. f (x)− f (x0) =
59(x− x0)
d. Plug in 32 for and 0 for f (x0) . f (x)−0 = 59(x−32)
Solution
The linear function is f (x)−0 = 59(x−32) .
Solve Real-World Problems Using Linear Models in Point-Slope Form
Let’s solve some word problems where we need to write the equation of a straight line in point-slope form.
Example 7
Marciel rented a moving truck for the day. Marciel only remembers that the rental truck company charges $40 perday and some amount of cents per mile. Marciel drives 46 miles and the final amount of the bill (before tax) is $63.What is the amount per mile the truck rental company charges per day? Write an equation in point-slope form thatdescribes this situation. How much would it cost to rent this truck if Marciel drove 220 miles?
Let’s define our variables:
x = distance in miles
y = cost of the rental truck in dollars
We see that we are given the y− intercept and the point (46, 63).
Peter pays a flat fee of $40 for the day. This is the y− intercept.
He pays $63 for 46 miles – this is the coordinate point (46, 63).
Start with the point-slope form of the line. (y− y0) = m(x− x0)
Plug in the coordinate point. 63− y0 = m(46− x0)
Plug in point (0,40). 63−40 = m(46−0)
Solve for the slope. 23 = m(46)→ m =2346
= 0.5
The slope is : 0.5 dollars per mile
So, the truck company charges 50 cents per mile. ($0.5 = 50 cents)Equation of line is : y = 0.5x+40
5.2. LINEAR EQUATIONS IN POINT-SLOPE FORM

www.ck12.org 317
To answer the question of 220 miles we plug in x = 220 .
Solution
y−40 = 0.5(220)⇒ y = $150
Example 8
Anne got a job selling window shades. She receives a monthly base salary and a $6 commission for each windowshade she sells. At the end of the month, she adds up her sales and she figures out that she sold 200 window shadesand made $2500. Write an equation in point-slope form that describes this situation. How much is Anne’s monthlybase salary?
Let’s define our variables
x = number of window shades sold
y = Anne’s monthly salary in dollars
We see that we are given the slope and a point on the line:
Anne gets $6 for each shade, so the slope = 6 dollars/shade.
She sold 200 shades and made $2500, so the point is (200, 2500).
Start with the point-slope form of the line. y− y0 = m(x− x0)
Plug in the coordinate point. y− y0 = 6(x− x0)
Plug in point (200,2500). y−2500 = 6(x−200)
Anne’s base salary is found by plugging in x = 0 . We obtain y−2500 =−1200⇒ y = $1300
Solution
Anne’s monthly base salary is $1300.
Lesson Summary
• The point-slope form of an equation for a line is: y− y0 = m(x− x0) .• If you are given the slope and a point on the line:
1. Simply plug the point and the slope into the equation.
• If you are given the slope and y− intercept of a line:
1. Plug the value of m into the equation2. Plug the y− intercept point into the equation y0 = y− intercept and x0 = 0 .
CHAPTER 5. WRITING LINEAR EQUATIONS
318 www.ck12.org
• If you are given two points on the line:
1. Use the two points to find the slope using the slope formula m = y2−y1x2−x1
.2. Plug the value of m into the equation.3. Plug either of the points into the equation as (x0,y0) .
• The functional notation of point-slope form is f (x)− f (x0) = m(x− x0) .
Review Questions
Write the equation of the line in point-slope form.
1. The line has slope − 110 and goes through point (10, 2).
2. The line has slope -75 and goes through point (0, 125).3. The line has slope 10 and goes through point (8, -2).4. The line goes through the points (-2, 3) and (-1, -2).5. The line contains points (10, 12) and (5, 25).6. The line goes through points (2, 3) and (0, 3).7. The line has a slope 3
5 and a y− intercept -3.8. The line has a slope -6 and a y− intercept 0.5.
Write the equation of the linear function in point-slope form.
9. m =−15 and f (0) = 7
10. m =−12 and f (−2) = 511. f (−7) = 5 and f (3) =−412. f (6) = 0 and f (0) = 613. m = 3 and f (2) =−914. m =−9
5 and f (0) = 3215. Nadia is placing different weights on a spring and measuring the length of the stretched spring. She finds that
for a 100 gram weight the length of the stretched spring is 20 cm and for a 300 gram weight the length ofthe stretched spring is 25 cm. Write an equation in point-slope form that describes this situation. What is theunstretched length of the spring?
16. Andrew is a submarine commander. He decides to surface his submarine to periscope depth. It takes him20 minutes to get from a depth of 400 feet to a depth of 50 feet. Write an equation in point-slope form thatdescribes this situation. What was the submarine’s depth five minutes after it started surfacing?
Review Answers
1. y−2 =− 110(x−10)
2. y−125 =−75x3. y+2 = 10(x−8)4. y+2 =−5(x+1) or y−3 =−5(x+2)5. y−25 =−13
5 (x−5) or y−12 =−135 (x−10)
6. y−3 = 07. y+3 = 3
5 x8. y−0.5 =−6x9. f (x)−7 =−1
5 x
5.2. LINEAR EQUATIONS IN POINT-SLOPE FORM
www.ck12.org 319
10. f (x)−5 =−12(x+2)11. f (x)−5 =− 9
10(x+7) or f (x)+4 =− 910(x−3)
12. f (x) =−x(x−6) or f (x)−6 =−x13. f (x)+9 = 3(x−2)14. f (x)−32 = 9
5 x15. y−20 = 1
40(x−100) unstretched length = 17.5 cm16. y−50 =−17.5(x−20) or y−400 =−17.5x depth = 312.5 f eet
CHAPTER 5. WRITING LINEAR EQUATIONS
320 www.ck12.org
5.3 Linear Equations in Standard Form
Learning Objectives
• Write equivalent equations in standard form.• Find the slope and y− intercept from an equation in standard form.• Write equations in standard form from a graph.• Solve real-world problems using linear models in standard form.
Introduction
In this section, we are going to talk about the standard form for the equation of a straight line. The following linearequation is said to be in standard form.
ax+by = c
Here a,b and c are constants that have no factors in common and the constant a is a non-negative value. Notice thatthe b in the standard form is different than the b in the slope-intercept form. There are a few reasons why standardform is useful and we will talk about these in this section. The first reason is that standard form allows us to writeequations for vertical lines which is not possible in slope-intercept form.
For example, let’s find the equation of the line that passes through points (2, 6) and (2, 9).
Let’s try the slope-intercept form y = mx+b
We need to find the slope m = 9−62−2 = 3
0 . The slope is undefined because we cannot divide by zero.
The point-slope form y− y0 = m(x− x0) also needs the slope, so we cannot write an equation for this line in eitherthe slope-intercept or the point-slope form.
Since we have two points in a plane, we know that a line passes through these two points, but how do we find theequation of that line? It turns out that this line has no y value in it. Notice that the value of x in both points is twofor the different values of y , so we can say that it does not matter what y is because x will always equal two. Here isthe equation in standard form.
1 · x+0 · y = 2 or x = 2
The line passing through point (2, 6) and (2, 9) is a vertical line passing through x = 2 . Note that the equationof a horizontal line would have no x variable, since y would always be the same regardless of the value of x . Forexample, a horizontal line passing through point (0, 5) has this equation in standard form.
0 · x+1 · y = 5 or y = 5
5.3. LINEAR EQUATIONS IN STANDARD FORM
www.ck12.org 321
Write Equivalent Equations in Standard Form
So far you have learned how to write equations of lines in slope-intercept form and point-slope form. Now you willsee how to rewrite equations in standard form.
Example 1
Rewrite the following equations in standard form.
a) y = 5x−7
b) y−2 =−3(x+3)
c) y = 23 x+ 1
2
Solution
We need to rewrite the equations so that all the variables are on one side of the equation and the coefficient of x isnot negative.
a) y = 5x−7
Subtract y from both sides. 0 = 5x− y−7
Add 7 to both sides. 7 = 5x− y
The equation in standard form is : 5x− y = 7
b) y−2 =−3(x+3)
Distribute the −3 on the right-hand-side. y−2 =−3x−9
Add 3x to both sides. y+3x−2 =−9
Add 2 to both sides. y+3x =−7
The equation in standard form is : y+3x =−7
c) y = 23 x+ 1
2
Find the common denominator for all terms in the equation. In this case, the common denominator equals 6.
Multiply all terms in the equation by 6. 6(
y =23
x+12
)⇒ 6y = 4x+3
Subtract 6y from both sides. 0 = 4x−6y+3
Subtract 3 from both sides. −3 = 4x−6y
The equation in standard form is : 4x−6y =−3
Find the Slope and y-intercept From an Equation in Standard Form
The slope-intercept form and the point-slope form of the equation for a straight line both contain the slope of theequation explicitly, but the standard form does not. Since the slope is such an important feature of a line, it is usefulto figure out how you would find the slope if you were given the equation of the line in standard form.
CHAPTER 5. WRITING LINEAR EQUATIONS
322 www.ck12.org
ax+by = c
Let’s rewrite this equation in slope-intercept form by solving the equation for y .
Subtract ax from both sides. by =−ax+ c
Divide all terms by b. y =−ab
x+cb
If we compare with the slope-intercept form y = mx+b , we see that the slope, m =−ab and the y− intercept = c
b .Again, notice that the b in the standard form is different than the b in the slope-intercept form.
Example 2
Find the slope and the y− intercept of the following equations written in standard form:
a) 3x+5y = 6
b) 2x−3y =−8
c) x−5y = 10
Solution
The slope m =−ab and the y− intercept = c
b .
a) 3x+5y = 6 m =−35 and y− intercept = 6
5
b) 2x−3y =−8 m = 23 and y− intercept = 8
3
c) x−5y = 10 m = 15 and y− intercept = 10
−5 =−2
Write Equations in Standard Form From a Graph
If we are given a graph of a straight line, it is fairly simple to write the equation in slope-intercept form by readingthe slope and y− intercept from the graph. Let’s now see how to write the equation of the line in standard form ifwe are given the graph of the line.
First, remember that to graph an equation from standard form we can use the cover-up method to find the interceptsof the line. For example, let’s graph the line given by the equation 3x−2y = 6 .
To find the x− intercept, cover up the y term (remember, x− intercept is where y = 0 ).
3x = 6⇒ x = 2
The x− intercept is (2, 0)
To find the y− intercept, cover up the x term (remember, y− intercept is where x = 0 ).
5.3. LINEAR EQUATIONS IN STANDARD FORM

www.ck12.org 323
3y = 6⇒ y =−3
The y− intercept is (0, -3)
We plot the intercepts and draw a line through them that extends in both directions.
Now we want to apply this process in reverse. If we have the graph of the line, we want to write the equation of theline in standard form.
Example 3
Find the equation of the line and write in standard form.
a)
b)
CHAPTER 5. WRITING LINEAR EQUATIONS

324 www.ck12.org
c)
Solution
a) We see that the x− intercept is (3,0)⇒ x = 3 and the y− intercept is (0,−4)⇒ y =−4 .
We saw that in standard form ax+by = c ,
if we “cover up” the y term, we get ax = c
if we “cover up” the x term, we get by = c
We need to find the numbers that when multiplied with the intercepts give the same answer in both cases. In thiscase, we see that multiplying x = 3 by 4 and multiplying y =−4 by -3 gives the same result.
(x = 3)×4⇒ 4x = 12 and (y =−4)× (−3)⇒−3y = 12
Therefore, a = 4,b =−3 and c = 12 and the standard form is:
4x−3y = 12
b) We see that the x− intercept is (3,0)⇒ x = 3 and the y− intercept is (0,3)⇒ y = 3 .
The values of the intercept equations are already the same, so a = 1,b = 1 and c = 3 . The standard form is:
5.3. LINEAR EQUATIONS IN STANDARD FORM

www.ck12.org 325
x+ y = 3
c) We see that the x− intercept is(3
3 ,0)⇒ x = 3
2 and the y− intercept is (0,4)⇒ y = 4 .
Let’s multiply the x− intercept equation by 2⇒ 2x = 3
Then we see we can multiply the x− intercept again by 4 and the y− intercept by 3.
⇒ 8x = 12 and 3y = 12
The standard form is 8x+3y = 12 .
Solve Real-World Problems Using Linear Models in Standard Form
Here are two examples of real-world problems where the standard form of the equation is useful.
Example 4
Nimitha buys fruit at her local farmer’s market. This Saturday, oranges cost $2 per pound and cherries cost $3 perpound. She has $12 to spend on fruit. Write an equation in standard form that describes this situation. If she buys 4pounds of oranges, how many pounds of cherries can she buy?
Solution
Let’s define our variables
x = pounds of oranges
y = pounds of cherries
The equation that describes this situation is: 2x+3y = 12
If she buys 4 pounds of oranges, we plug x = 4 in the equation and solve for y .
2(4)+3y = 12⇒ 3y = 12−8⇒ 3y = 4⇒ y =43
Nimitha can buy 1 13 pounds of cherries.
CHAPTER 5. WRITING LINEAR EQUATIONS
326 www.ck12.org
Example 5
Jethro skateboards part of the way to school and walks for the rest of the way. He can skateboard at 7 miles perhour and he can walk at 3 miles per hour. The distance to school is 6 miles. Write an equation in standard form thatdescribes this situation. If Jethro skateboards for 1
2 an hour, how long does he need to walk to get to school?
Solution
Let’s define our variables.
x = hours Jethro skateboards
y = hours Jethro walks
The equation that describes this situation is 7x+3y = 6
If Jethro skateboards 12 an hour, we plug x = 0.5 in the equation and solve for y .
7(0.5)+3y = 6⇒ 3y = 6−3.5⇒ 3y = 2.5⇒ y =56
Jethro must walk 56 of an hour.
Lesson Summary
• A linear equation in the form ax+by = c is said to be in standard form. Where a,b and c are constants ( b isdifferent than the y− intercept b ) and a is non-negative.
• Given an equation in standard form, ax+by = c , the slope, a =−ab , and the y− intercept = c
b .• The cover-up method is useful for graphing an equation in standard form. To find the y− intercept, cover up
the x term and solve the remaining equation for y . Likewise, to find the x− intercept, cover up the y term andsolve the remaining equation for x .
Review Questions
Rewrite the following equations in standard form.
1. y = 3x−82. y−7 =−5(x−12)3. 2y = 6x+94. y = 9
4 x+ 14
5. y+ 35 = 2
3(x−2)
5.3. LINEAR EQUATIONS IN STANDARD FORM
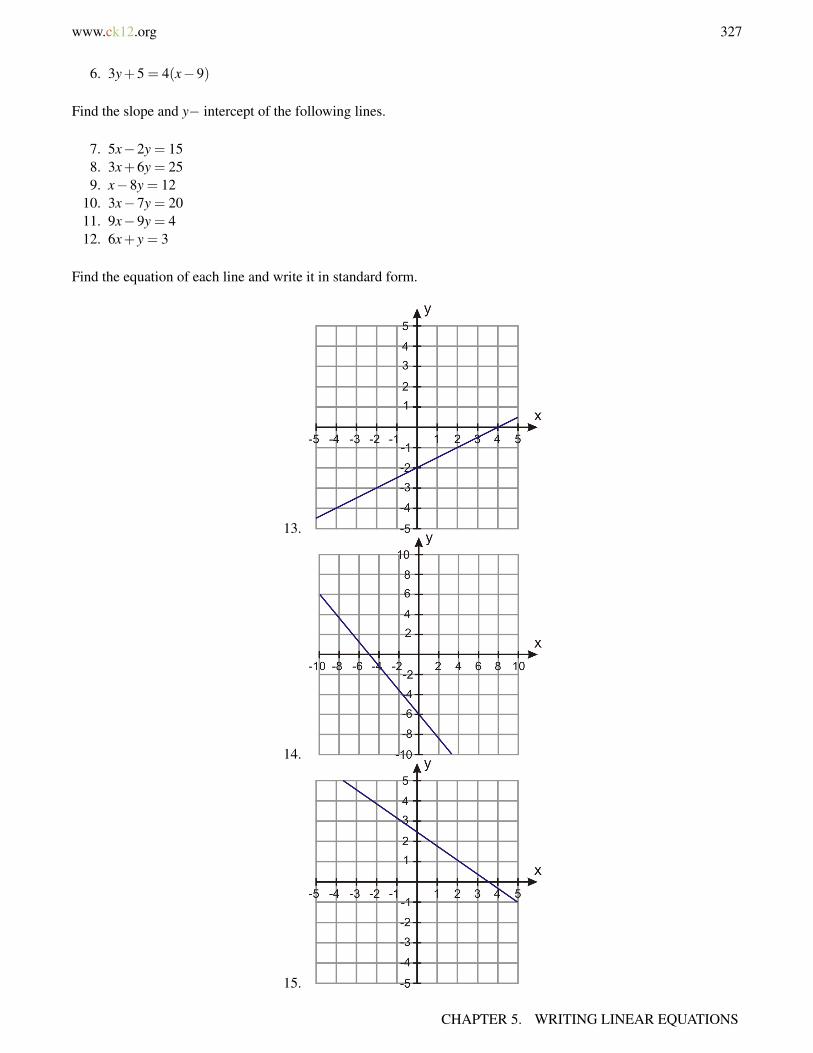
www.ck12.org 327
6. 3y+5 = 4(x−9)
Find the slope and y− intercept of the following lines.
7. 5x−2y = 158. 3x+6y = 259. x−8y = 12
10. 3x−7y = 2011. 9x−9y = 412. 6x+ y = 3
Find the equation of each line and write it in standard form.
13.
14.
15.
CHAPTER 5. WRITING LINEAR EQUATIONS
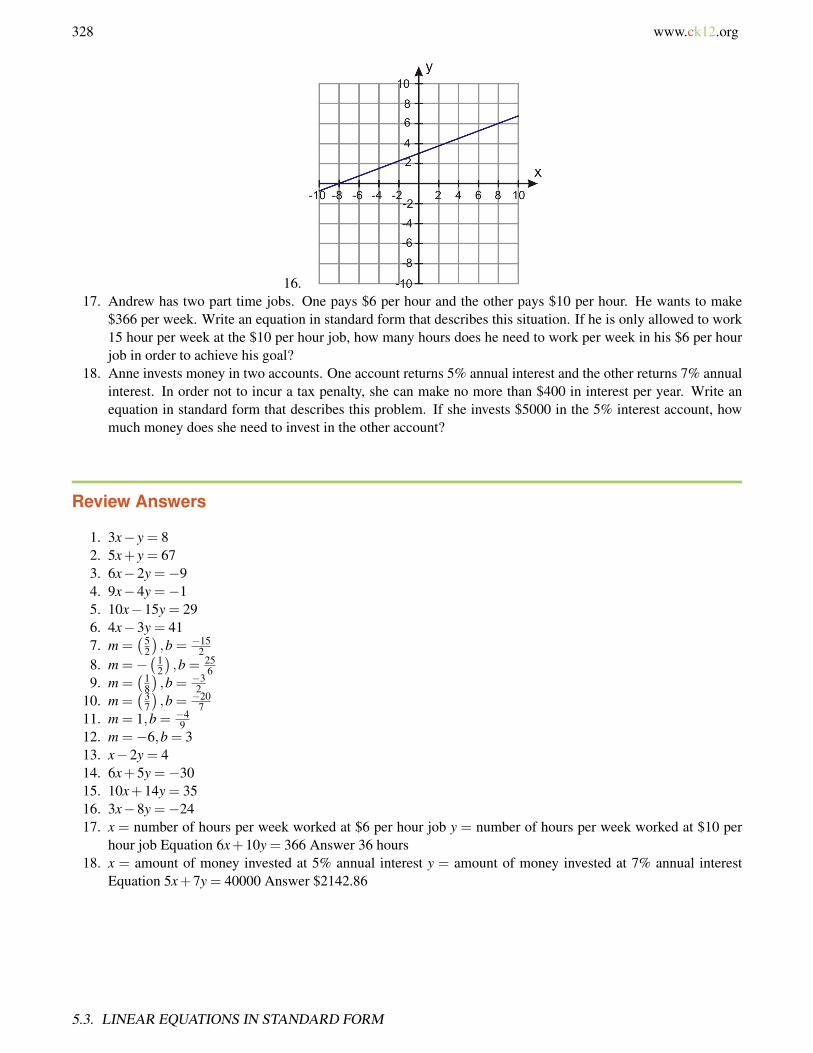
328 www.ck12.org
16.17. Andrew has two part time jobs. One pays $6 per hour and the other pays $10 per hour. He wants to make
$366 per week. Write an equation in standard form that describes this situation. If he is only allowed to work15 hour per week at the $10 per hour job, how many hours does he need to work per week in his $6 per hourjob in order to achieve his goal?
18. Anne invests money in two accounts. One account returns 5% annual interest and the other returns 7% annualinterest. In order not to incur a tax penalty, she can make no more than $400 in interest per year. Write anequation in standard form that describes this problem. If she invests $5000 in the 5% interest account, howmuch money does she need to invest in the other account?
Review Answers
1. 3x− y = 82. 5x+ y = 673. 6x−2y =−94. 9x−4y =−15. 10x−15y = 296. 4x−3y = 417. m =
(52
),b = −15
28. m =−
(12
),b = 25
69. m =
(18
),b = −3
210. m =
(37
),b = −20
711. m = 1,b = −4
912. m =−6,b = 313. x−2y = 414. 6x+5y =−3015. 10x+14y = 3516. 3x−8y =−2417. x = number of hours per week worked at $6 per hour job y = number of hours per week worked at $10 per
hour job Equation 6x+10y = 366 Answer 36 hours18. x = amount of money invested at 5% annual interest y = amount of money invested at 7% annual interest
Equation 5x+7y = 40000 Answer $2142.86
5.3. LINEAR EQUATIONS IN STANDARD FORM

www.ck12.org 329
5.4 Equations of Parallel and PerpendicularLines
Learning Objectives
• Determine whether lines are parallel or perpendicular.• Write equations of perpendicular lines.• Write equations of parallel lines.• Investigate families of lines.
Introduction
In this section, you will learn how parallel lines are related to each other on the coordinate plane. You will alsolearn how perpendicular lines are related to each other. Let’s start by looking at a graph of two parallel lines.
The two lines will never meet because they are parallel. We can clearly see that the two lines have different y−intercepts, more specifically 6 and -4.
How about the slopes of the lines? Are they related in any way? Because the lines never meet, they must rise at thesame rate. This means that the slopes of the two lines are the same.
Indeed, if we calculate the slopes of the lines, we find the following results.
Line A: m = 6−20−(−2) =
42 = 2
Line B: m = 0−(−4)2−0 = 4
2 = 2
For Parallel Lines: the slopes are the same, m1 = m2 , and the y− intercepts are different.
CHAPTER 5. WRITING LINEAR EQUATIONS
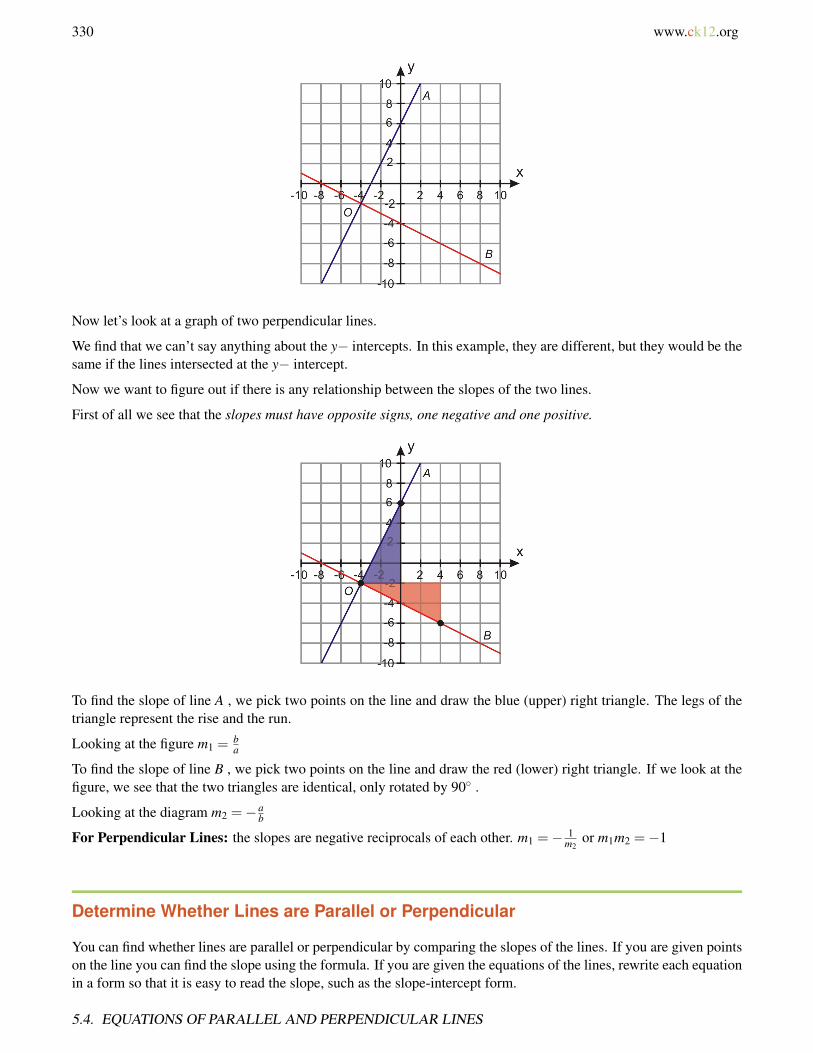
330 www.ck12.org
Now let’s look at a graph of two perpendicular lines.
We find that we can’t say anything about the y− intercepts. In this example, they are different, but they would be thesame if the lines intersected at the y− intercept.
Now we want to figure out if there is any relationship between the slopes of the two lines.
First of all we see that the slopes must have opposite signs, one negative and one positive.
To find the slope of line A , we pick two points on the line and draw the blue (upper) right triangle. The legs of thetriangle represent the rise and the run.
Looking at the figure m1 =ba
To find the slope of line B , we pick two points on the line and draw the red (lower) right triangle. If we look at thefigure, we see that the two triangles are identical, only rotated by 90 .
Looking at the diagram m2 =−ab
For Perpendicular Lines: the slopes are negative reciprocals of each other. m1 =− 1m2
or m1m2 =−1
Determine Whether Lines are Parallel or Perpendicular
You can find whether lines are parallel or perpendicular by comparing the slopes of the lines. If you are given pointson the line you can find the slope using the formula. If you are given the equations of the lines, rewrite each equationin a form so that it is easy to read the slope, such as the slope-intercept form.
5.4. EQUATIONS OF PARALLEL AND PERPENDICULAR LINES
www.ck12.org 331
Example 1
Determine whether the lines are parallel or perpendicular or neither.
a) One line passes through points (2, 11) and (-1, 2); another line passes through points (0, -4) and (-2, -10).
b) One line passes through points (-2, -7) and (1, 5); another line passes through points (4, 1) and (-8, 4).
c) One lines passes through points (3, 1) and (-2, -2); another line passes through points (5, 5) and (4, -6).
Solution
Find the slope of each line and compare them.
a) m1 =2−11−1−2 = −9
−3 = 3 and m2 =−10−(−4)−2−0 = −6
−2 = 3
The slopes are equal, so the lines are parallel.
b) m1 =5−(−7)1−(−2) =
123 = 4 and m2 =
4−1−8−4 = 3
−12 =−14
The slopes are negative reciprocals of each other, so the lines are perpendicular.
c) m1 =−2−1−2−3 = −3
−5 = 35 and m2 =
−6−54−5 = −13
−1 = 13
The slopes are not the same or negative reciprocals of each other, so the lines are neither parallel nor perpendicular.
Example 2
Determine whether the lines are parallel or perpendicular or neither.
a) Line 1: 3x+4y = 2 Line 2: 8x−6y = 5
b) Line 1: 2x = y−10 Line 2: y =−2x+5
c) Line 1: 7y+1 = 7x Line 2: x+5 = y
Solution
Write each equation in slope-intercept form.
a) Line 1 3x+4y = 2⇒ 4y =−3x+2⇒ y =−34 x+ 1
2 ⇒ slope =−34
Line 2: 8x−6y = 5⇒ 8x−5 = 6y⇒ y = 86 x− 5
6 ⇒ y = 43 x− 5
6 ⇒ slope = 43
The slopes are negative reciprocals of each other, so the lines are perpendicular to each other.
b) Line 1 2x = y−10⇒ y = 2x+10⇒ slope = 2
Line 2 y =−2x+5⇒ slope =−2
The slopes are not the same or negative reciprocals of each other, so the lines are neither parallel nor perpendicular.
c) Line 1 7y+1 = 7x⇒ 7y = 7x−1⇒ y = x− 17 ⇒ slope = 1
Line 2: x+5 = y⇒ y = x+5⇒ slope = 1
The slopes are the same so the lines are parallel.
Write Equations of Perpendicular Lines
We can use the properties of perpendicular lines to write an equation of a line perpendicular to a given line. You willbe given the equation of a line and asked to find the equation of the perpendicular line passing through a specificpoint. Here is the general method for solving a problem like this.
• Find the slope of the given line from its equation. You might need to rewrite the equation in a form such asthe slope-intercept form.
CHAPTER 5. WRITING LINEAR EQUATIONS

332 www.ck12.org
• Find the slope of the perpendicular line by writing the negative reciprocal of the slope of the given line.• Use the slope and the point to write the equation of the perpendicular line in point-slope form.
Example 3
Find the equation perpendicular to the line y =−3x+5 that passes through point (2, 6).
Solution
Find the slope of the given line y =−3x+5 has a slope =−3 .
The slope of the perpendicular line is the negative reciprocal m = 13
Now, we are trying to find the equation of a line with slope m = 13 that passes through point (2, 6).
Use the point-slope form with the slope and the point y−6 = 13(x−2)
The equation of the line could also be written as y = 13 x+ 16
3
Example 4
Find the equation of the line perpendicular to x−5y = 15 that passes through the point (-2, 5).
Solution
Rewrite the equation in slope-intercept form x−5y = 15⇒−5y =−x+15⇒ y = 15 x−3
The slope of the given line is m = 15 and the slope of the perpendicular is the negative reciprocal or m =−5 . We are
looking for a line with a slope m =−5 that passes through the point (-2, 5).
Use the point-slope form with the slope and the point y−5 =−5(x+2)
The equation of the line could also be written as y =−5x−5
Example 5
Find the equation of the line perpendicular to y =−2 that passes through the point (4, -2).
Solution
The equation is already in slope intercept form but it has an x term of 0 y = 0x−2 . This means the slope is m = 0 .
We’d like a line with slope that is the negative reciprocal of 0. The reciprocal of 0 is m = 10 = unde f ined . Hmmm...
It seems like we have a problem. But, look again at the desired slope in terms of the definition of slope m = riserun = 1
0. So our desired line will move 0 units in x for every 1 unit it rises in y . This is a vertical line, so the solution is thevertical line that passes through (4, -2). This is a line with an x coordinate of 4 at every point along it.
The equation of the line is: x = 4
Write Equations of Parallel Lines
We can use the properties of parallel lines to write an equation of a line parallel to a given line. You will be giventhe equation of a line and asked to find the equation of the parallel line passing through a specific point. Here is thegeneral method for solving a problem like this.
• Find the slope of the given line from its equation. You might need to rewrite the equation in a form such asthe slope-intercept form.
• The slope of the parallel line is the same as that of the given line.• Use the slope and the point to write the equation of the perpendicular line in slope-intercept form or point-slope
form.
Example 6
5.4. EQUATIONS OF PARALLEL AND PERPENDICULAR LINES
www.ck12.org 333
Find the equation parallel to the line y = 6x−9 that passes through point (-1, 4).
Solution
Find the slope of the given line y = 6x−9 has a slope = 6 .
Since parallel lines have the same slope, we are trying to find the equation of a line with slope m = 6 that passesthrough point (-1, 4).
Start with the slope-intercept form. y = mx+b
Plug in the slope y = 6x+b
Plug in point (−1,4). 4 = 6(−1)+b⇒ b = 4+6⇒ b = 10
The equation of the line is y = 6x+10 .
Example 7
Find the equation of the line parallel to 7−4y = 0 that passes through the point (9, 2).
Solution
Rewrite the equation in slope-intercept form.
7−4y = 0⇒ 4y−7 = 0⇒ 4y = 7⇒ y =74⇒ y = 0x+
74
The slope of the given line is m = 0 . This is a horizontal line.
Since the slopes of parallel lines are the same, we are looking for a line with slope m = 0 that passes through thepoint (9, 2).
Start with the slope-intercept form. y = 0x+b
Plug in the slope. y = 0x+b
Plug in point (9,2). 2 = 0(9)+b
⇒ b = 2
The equation of the line is y = 2 .
Example 8
Find the equation of the line parallel to 6x−5y = 12 that passes through the point (-5, -3).
Solution
Rewrite the equation in slope-intercept form.
3x−5y = 12⇒ 5y = 6x−12⇒ y =65
x− 125
The slope of the given line is m = 65 .
Since the slopes of parallel lines are the same, we are looking for a line with slope m = 65 that passes through the
point (-5, -3).
CHAPTER 5. WRITING LINEAR EQUATIONS
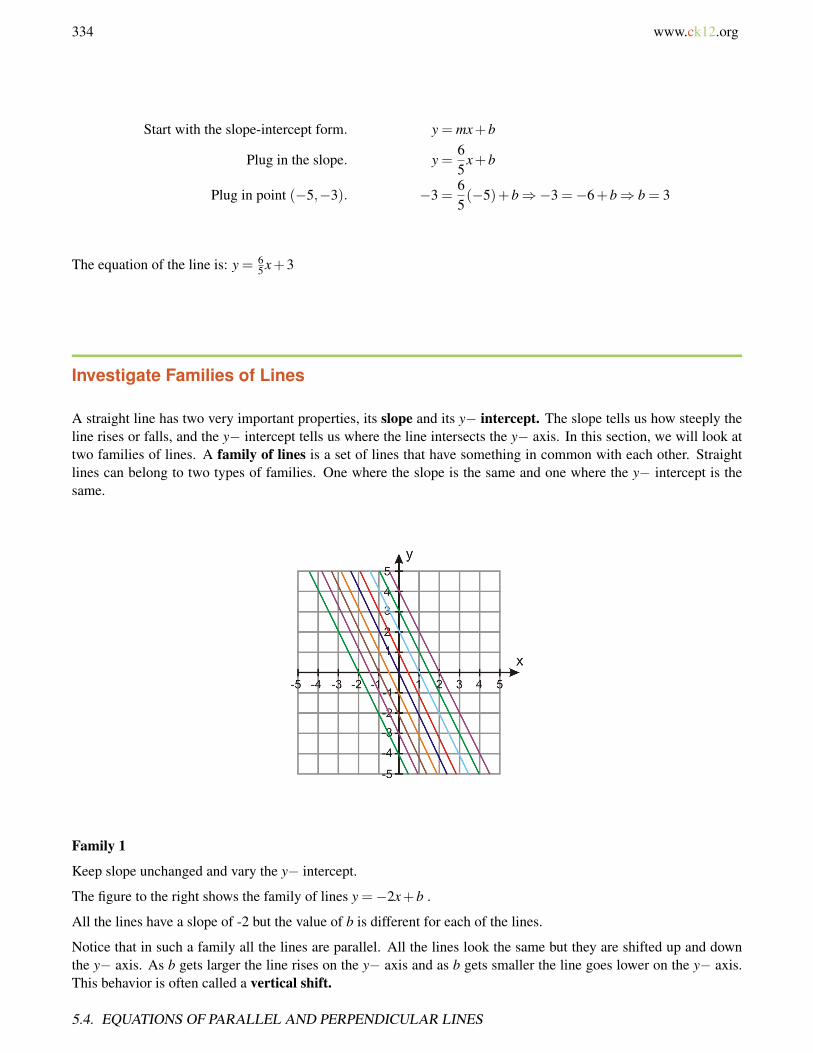
334 www.ck12.org
Start with the slope-intercept form. y = mx+b
Plug in the slope. y =65
x+b
Plug in point (−5,−3). −3 =65(−5)+b⇒−3 =−6+b⇒ b = 3
The equation of the line is: y = 65 x+3
Investigate Families of Lines
A straight line has two very important properties, its slope and its y− intercept. The slope tells us how steeply theline rises or falls, and the y− intercept tells us where the line intersects the y− axis. In this section, we will look attwo families of lines. A family of lines is a set of lines that have something in common with each other. Straightlines can belong to two types of families. One where the slope is the same and one where the y− intercept is thesame.
Family 1
Keep slope unchanged and vary the y− intercept.
The figure to the right shows the family of lines y =−2x+b .
All the lines have a slope of -2 but the value of b is different for each of the lines.
Notice that in such a family all the lines are parallel. All the lines look the same but they are shifted up and downthe y− axis. As b gets larger the line rises on the y− axis and as b gets smaller the line goes lower on the y− axis.This behavior is often called a vertical shift.
5.4. EQUATIONS OF PARALLEL AND PERPENDICULAR LINES

www.ck12.org 335
Family 2
Keep the y− intercept unchanged and vary the slope.
The figure to the right shows the family of lines y = mx+2 .
All lines have a y− intercept of two but the value of the slope is different for each of the lines. The lines “start”with y = 2 (red line) which has a slope of zero. They get steeper as the slope increases until it gets to the line x = 0(purple line) which has an undefined slope.
Example 9
Write the equation of the family of lines satisfying the given condition:
a) Parallel to the x− axis
b) Through the point (0, -1)
c) Perpendicular to 2x+7y−9 = 0
d) Parallel to x+4y−12 = 0
Solution
a) All lines parallel to the x− axis will have a slope of zero. It does not matter what the y− intercept is.
The family of lines is y = 0 · x+b or y = b .
b) All lines passing through the point (0, -1) have the same y− intercept, b =−1 .
The family of lines is y = mx−1 .
CHAPTER 5. WRITING LINEAR EQUATIONS
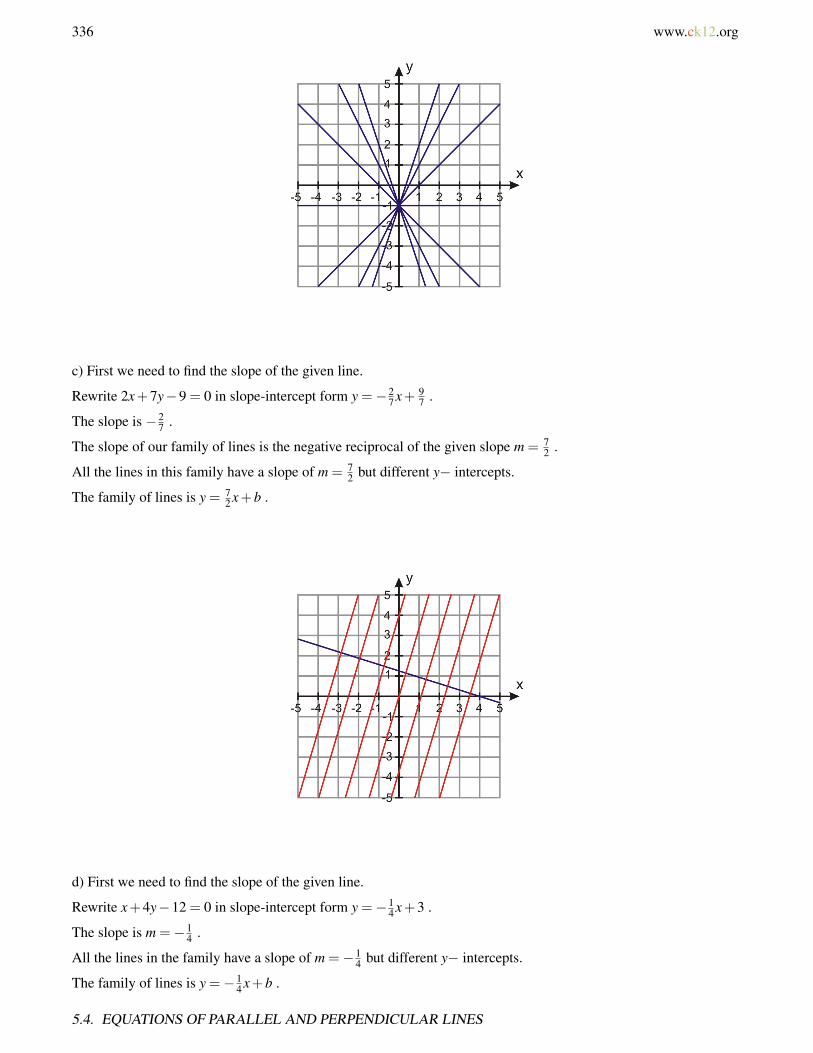
336 www.ck12.org
c) First we need to find the slope of the given line.
Rewrite 2x+7y−9 = 0 in slope-intercept form y =−27 x+ 9
7 .
The slope is −27 .
The slope of our family of lines is the negative reciprocal of the given slope m = 72 .
All the lines in this family have a slope of m = 72 but different y− intercepts.
The family of lines is y = 72 x+b .
d) First we need to find the slope of the given line.
Rewrite x+4y−12 = 0 in slope-intercept form y =−14 x+3 .
The slope is m =−14 .
All the lines in the family have a slope of m =−14 but different y− intercepts.
The family of lines is y =−14 x+b .
5.4. EQUATIONS OF PARALLEL AND PERPENDICULAR LINES

www.ck12.org 337
Lesson Summary
• Parallel lines have the same slopes, m1 = m2 , but different y− intercepts.• Perpendicular lines have slopes which are the negative reciprocals of each other.
m1 =−1
m2or m1m2 =−1
• To find the line parallel (or perpendicular) to a specific line which passes through a given point:
a. Find the slope of the given line from its equation.b. Compute the slope parallel (or perpendicular) to the line.c. Use the computed slope and the specified point to write the equation of the new line in point-slope form.d. Transform from point-slope form to another form if required.
• A family of lines is a set of lines that have something in common with each other. There are two types of linefamilies. One where the slope is the same and one where the y− intercept is the same.
Review Questions
Determine whether the lines are parallel, perpendicular or neither.
1. One line passes through points (-1, 4) and (2, 6); another line passes through points (2, -3) and (8, 1).2. One line passes through points (4, -3) and (-8, 0); another line passes through points (-1, -1) and (-2, 6).3. One line passes through points (-3, 14) and (1, -2); another line passes through points (0, -3) and (-2, 5).4. One line passes through points (3, 3) and (-6, -3); another line passes through points (2, -8) and (-6, 4).5. Line 1: 4y+ x = 8 Line 2: 12y+3x = 16. Line 1: 5y+3x+1 Line 2: 6y+10x =−37. Line 1: 2y−3x+5 = 0 Line 2: y+6x =−38. Find the equation of the line parallel to 5x−2y = 2 that passes through point (3, -2).9. Find the equation of the line perpendicular to y =−2
5 x−3 that passes through point (2, 8).
CHAPTER 5. WRITING LINEAR EQUATIONS

338 www.ck12.org
10. Find the equation of the line parallel to 7y+2x−10 = 0 that passes through the point (2, 2).11. Find the equation of the line perpendicular to y+5 = 3(x−2) that passes through the point (6, 2). Write the
equation of the family of lines satisfying the given condition.12. All lines pass through point (0, 4).13. All lines are perpendicular to 4x+3y−1 = 0 .14. All lines are parallel to y−3 = 4x+2 .15. All lines pass through point (0, -1).
Review Answers
1. parallel2. neither3. parallel4. perpendicular5. parallel6. perpendicular7. neither8. y = 5
2 x− 192
9. y = 52 x+3
10. y =−27 x+ 18
711. y =−1
3 x+412. y = mx+413. y = 3
4 x+b14. y = 4x+b15. y = mx−1
5.4. EQUATIONS OF PARALLEL AND PERPENDICULAR LINES
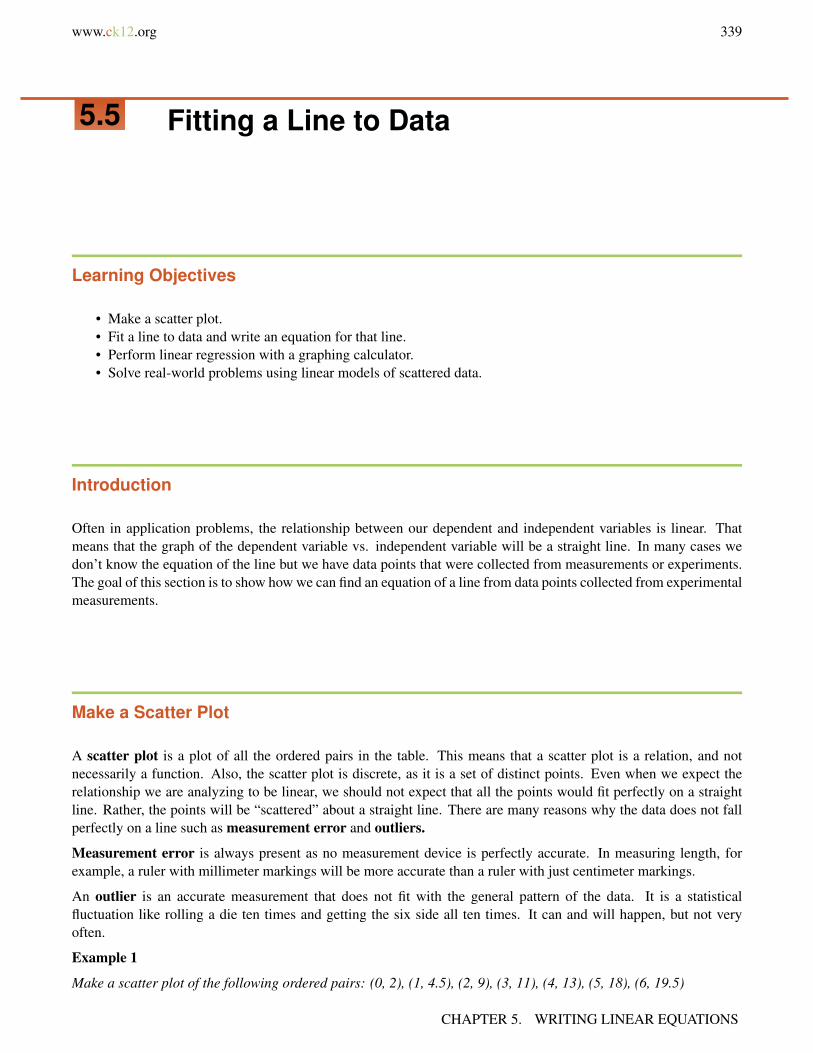
www.ck12.org 339
5.5 Fitting a Line to Data
Learning Objectives
• Make a scatter plot.• Fit a line to data and write an equation for that line.• Perform linear regression with a graphing calculator.• Solve real-world problems using linear models of scattered data.
Introduction
Often in application problems, the relationship between our dependent and independent variables is linear. Thatmeans that the graph of the dependent variable vs. independent variable will be a straight line. In many cases wedon’t know the equation of the line but we have data points that were collected from measurements or experiments.The goal of this section is to show how we can find an equation of a line from data points collected from experimentalmeasurements.
Make a Scatter Plot
A scatter plot is a plot of all the ordered pairs in the table. This means that a scatter plot is a relation, and notnecessarily a function. Also, the scatter plot is discrete, as it is a set of distinct points. Even when we expect therelationship we are analyzing to be linear, we should not expect that all the points would fit perfectly on a straightline. Rather, the points will be “scattered” about a straight line. There are many reasons why the data does not fallperfectly on a line such as measurement error and outliers.
Measurement error is always present as no measurement device is perfectly accurate. In measuring length, forexample, a ruler with millimeter markings will be more accurate than a ruler with just centimeter markings.
An outlier is an accurate measurement that does not fit with the general pattern of the data. It is a statisticalfluctuation like rolling a die ten times and getting the six side all ten times. It can and will happen, but not veryoften.
Example 1
Make a scatter plot of the following ordered pairs: (0, 2), (1, 4.5), (2, 9), (3, 11), (4, 13), (5, 18), (6, 19.5)
CHAPTER 5. WRITING LINEAR EQUATIONS
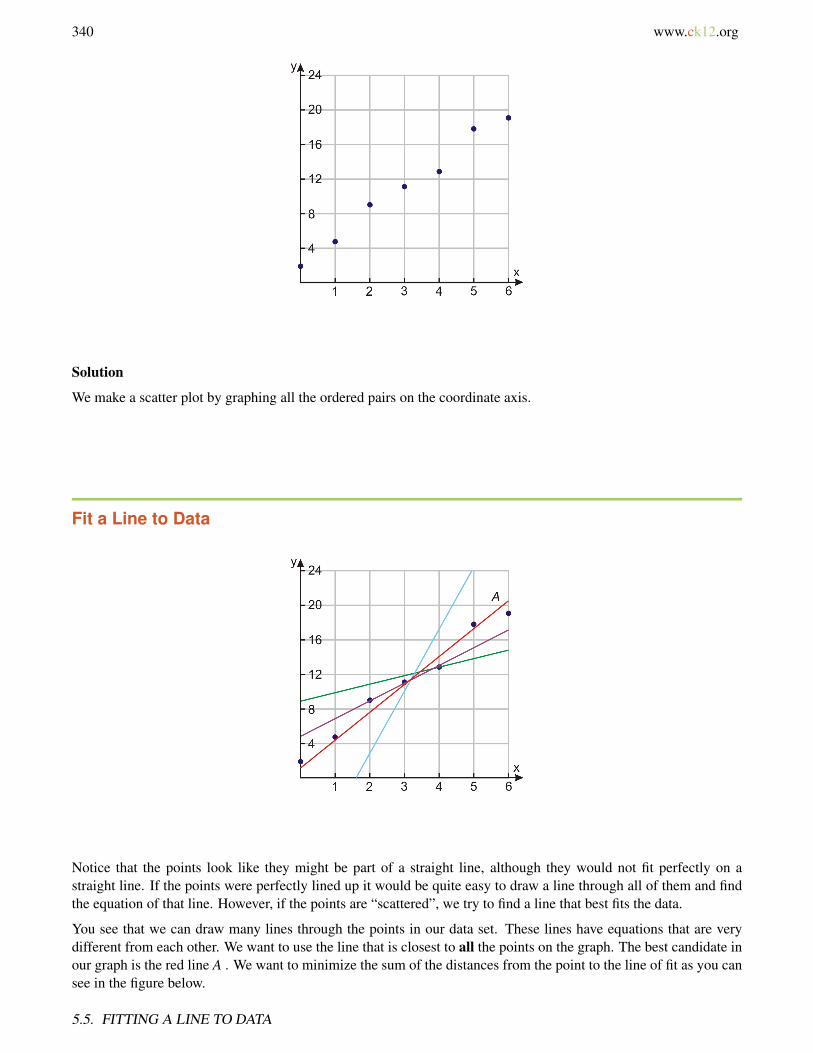
340 www.ck12.org
Solution
We make a scatter plot by graphing all the ordered pairs on the coordinate axis.
Fit a Line to Data
Notice that the points look like they might be part of a straight line, although they would not fit perfectly on astraight line. If the points were perfectly lined up it would be quite easy to draw a line through all of them and findthe equation of that line. However, if the points are “scattered”, we try to find a line that best fits the data.
You see that we can draw many lines through the points in our data set. These lines have equations that are verydifferent from each other. We want to use the line that is closest to all the points on the graph. The best candidate inour graph is the red line A . We want to minimize the sum of the distances from the point to the line of fit as you cansee in the figure below.
5.5. FITTING A LINE TO DATA

www.ck12.org 341
Finding this line mathematically is a complex process and is not usually done by hand. We usually “eye-ball” theline or find it exactly by using a graphing calculator or computer software such as Excel. The line in the graph aboveis “eye-balled,” which means we drew a line that comes closest to all the points in the scatter plot.
When we use the line of best fit we are assuming that there is a continuous linear function that will approximate thediscrete values of the scatter plot. We can use this to interpret unknown values.
Write an Equation for a Line of Best Fit
Once you draw the line of best fit, you can find its equation by using two points on the line. Finding the equation ofthe line of best fit is also called linear regression.
Caution: Make sure you don’t get caught making a common mistake. In many instances the line of best fit will notpass through many or any of the points in the original data set. This means that you can’t just use two random pointsfrom the data set. You need to use two points that are on the line.
We see that two of the data points are very close to the line of best fit, so we can use these points to find the equationof the line (1, 4.5) and (3, 11).
Start with the slope-intercept form of a line y = mx+b .
Find the slope m = 11−4.53−1 = 6.5
2 = 3.25
Then y = 3.25x+b
Plug (3, 11) into the equation. 11 = 3.25(3)+b⇒ b = 1.25
The equation for the line that fits the data best is y = 3.25x+1.25 .
CHAPTER 5. WRITING LINEAR EQUATIONS

342 www.ck12.org
Perform Linear Regression with a Graphing Calculator
Drawing a line of fit can be a good approximation but you can’t be sure that you are getting the best results becauseyou are guessing where to draw the line. Two people working with the same data might get two different equationsbecause they would be drawing different lines. To get the most accurate equation for the line, we can use a graphingcalculator. The calculator uses a mathematical algorithm to find the line that minimizes the sum of the squares.
Example 2
Use a graphing calculator to find the equation of the line of best fit for the following data (3, 12), (8, 20), (1, 7), (10,23), (5, 18), (8, 24), (11, 30), (2, 10).
Solution
Step 1 Input the data in your calculator.
Press [STAT] and choose the [EDIT] option.
Input the data into the table by entering the x values in the first column and the y values in the second column.
Step 2 Find the equation of the line of best fit.
Press [STAT] again use right arrow to select [CALC] at the top of the screen.
Chose option number 4: LinReg(ax+b) and press [ENTER]
The calculator will display LinReg(ax+b)
Press [ENTER] and you will be given the a and b values.
Here a represents the slope and b represents the y− intercept of the equation. The linear regression line is y =2.01x+5.94 .
5.5. FITTING A LINE TO DATA
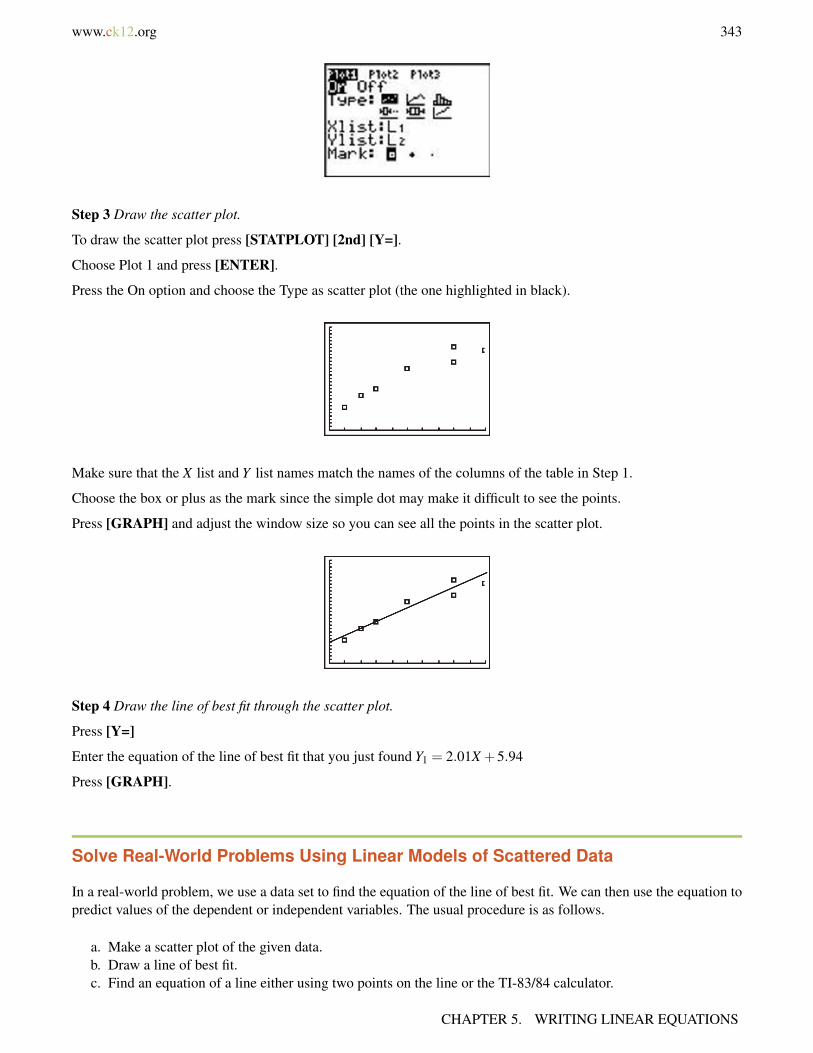
www.ck12.org 343
Step 3 Draw the scatter plot.
To draw the scatter plot press [STATPLOT] [2nd] [Y=].
Choose Plot 1 and press [ENTER].
Press the On option and choose the Type as scatter plot (the one highlighted in black).
Make sure that the X list and Y list names match the names of the columns of the table in Step 1.
Choose the box or plus as the mark since the simple dot may make it difficult to see the points.
Press [GRAPH] and adjust the window size so you can see all the points in the scatter plot.
Step 4 Draw the line of best fit through the scatter plot.
Press [Y=]
Enter the equation of the line of best fit that you just found Y1 = 2.01X +5.94
Press [GRAPH].
Solve Real-World Problems Using Linear Models of Scattered Data
In a real-world problem, we use a data set to find the equation of the line of best fit. We can then use the equation topredict values of the dependent or independent variables. The usual procedure is as follows.
a. Make a scatter plot of the given data.b. Draw a line of best fit.c. Find an equation of a line either using two points on the line or the TI-83/84 calculator.
CHAPTER 5. WRITING LINEAR EQUATIONS
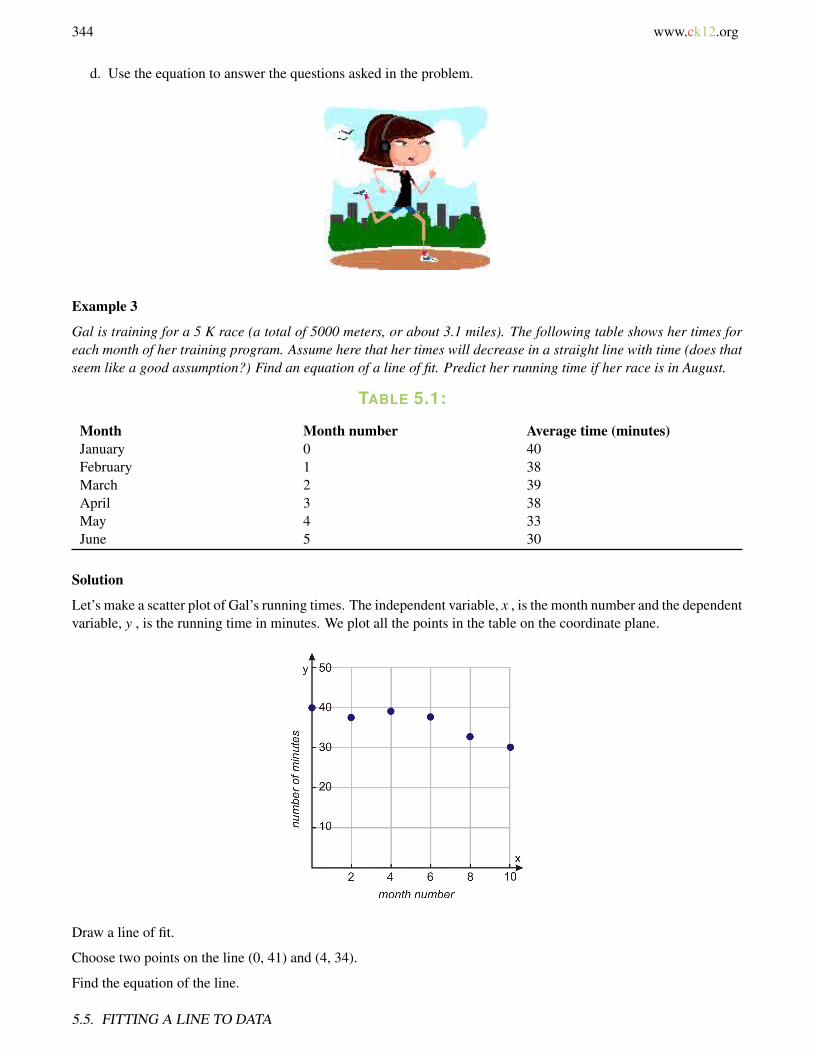
344 www.ck12.org
d. Use the equation to answer the questions asked in the problem.
Example 3
Gal is training for a 5 K race (a total of 5000 meters, or about 3.1 miles). The following table shows her times foreach month of her training program. Assume here that her times will decrease in a straight line with time (does thatseem like a good assumption?) Find an equation of a line of fit. Predict her running time if her race is in August.
TABLE 5.1:
Month Month number Average time (minutes)January 0 40February 1 38March 2 39April 3 38May 4 33June 5 30
Solution
Let’s make a scatter plot of Gal’s running times. The independent variable, x , is the month number and the dependentvariable, y , is the running time in minutes. We plot all the points in the table on the coordinate plane.
Draw a line of fit.
Choose two points on the line (0, 41) and (4, 34).
Find the equation of the line.
5.5. FITTING A LINE TO DATA
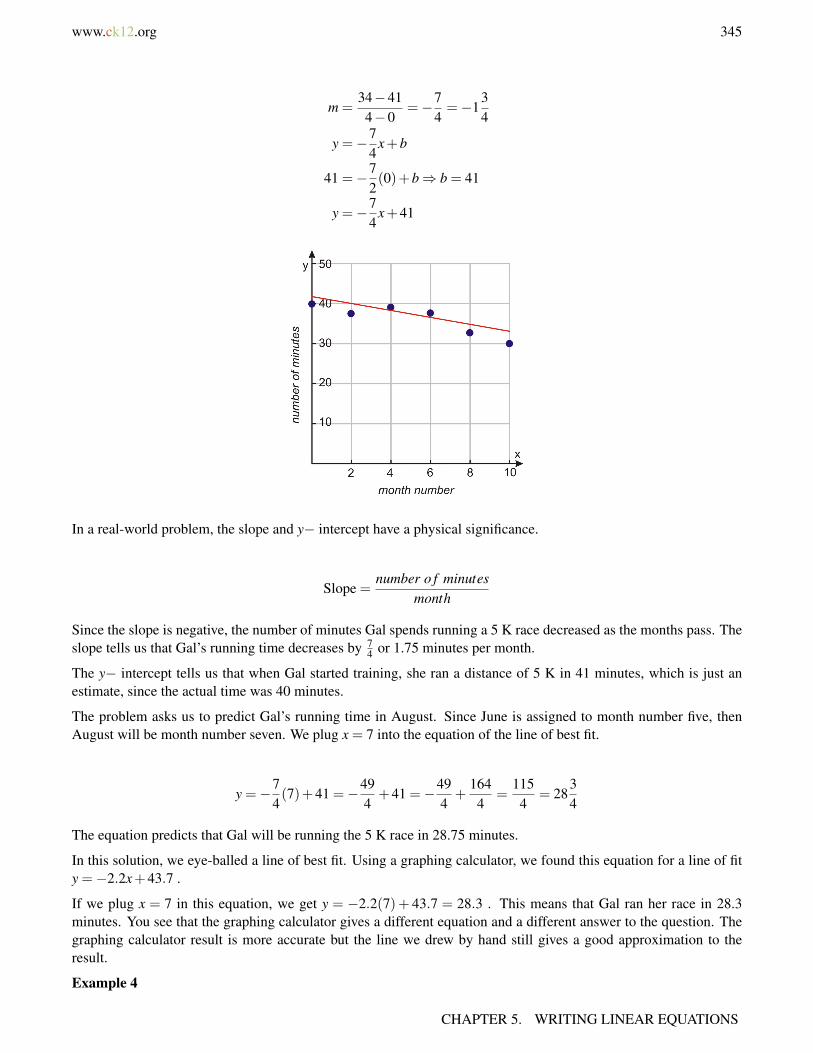
www.ck12.org 345
m =34−414−0
=−74=−1
34
y =−74
x+b
41 =−72(0)+b⇒ b = 41
y =−74
x+41
In a real-world problem, the slope and y− intercept have a physical significance.
Slope =number o f minutes
month
Since the slope is negative, the number of minutes Gal spends running a 5 K race decreased as the months pass. Theslope tells us that Gal’s running time decreases by 7
4 or 1.75 minutes per month.
The y− intercept tells us that when Gal started training, she ran a distance of 5 K in 41 minutes, which is just anestimate, since the actual time was 40 minutes.
The problem asks us to predict Gal’s running time in August. Since June is assigned to month number five, thenAugust will be month number seven. We plug x = 7 into the equation of the line of best fit.
y =−74(7)+41 =−49
4+41 =−49
4+
1644
=1154
= 2834
The equation predicts that Gal will be running the 5 K race in 28.75 minutes.
In this solution, we eye-balled a line of best fit. Using a graphing calculator, we found this equation for a line of fity =−2.2x+43.7 .
If we plug x = 7 in this equation, we get y = −2.2(7)+ 43.7 = 28.3 . This means that Gal ran her race in 28.3minutes. You see that the graphing calculator gives a different equation and a different answer to the question. Thegraphing calculator result is more accurate but the line we drew by hand still gives a good approximation to theresult.
Example 4
CHAPTER 5. WRITING LINEAR EQUATIONS
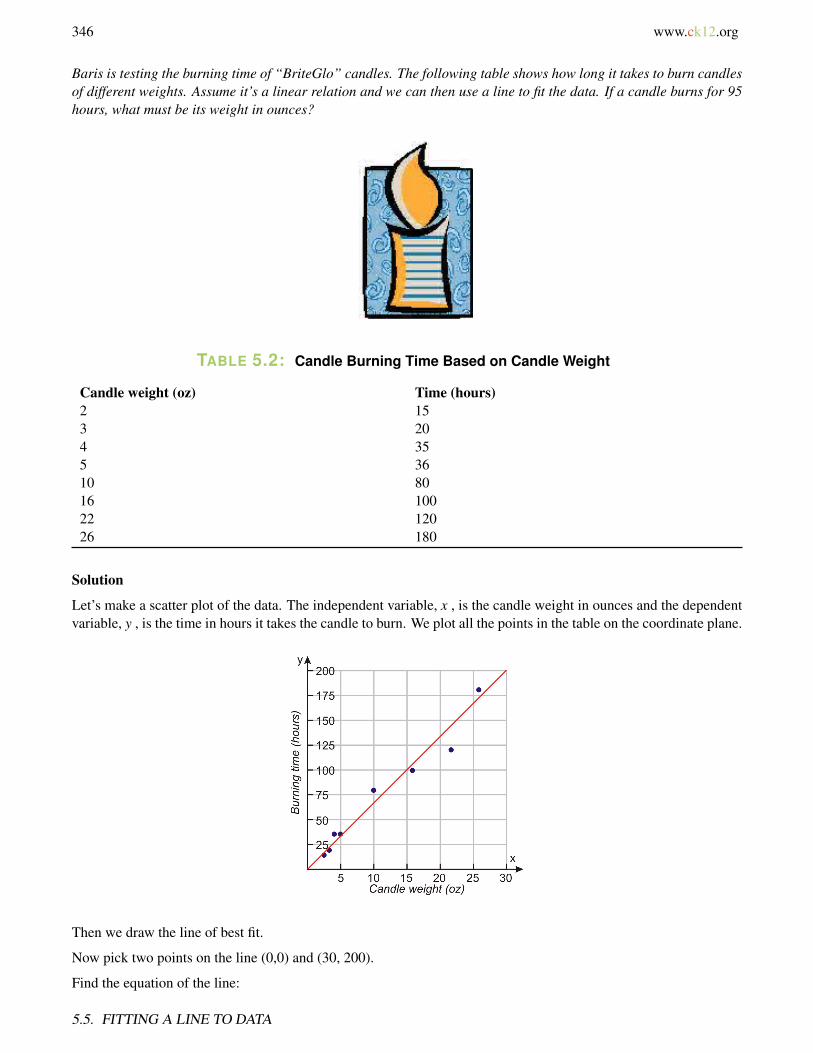
346 www.ck12.org
Baris is testing the burning time of “BriteGlo” candles. The following table shows how long it takes to burn candlesof different weights. Assume it’s a linear relation and we can then use a line to fit the data. If a candle burns for 95hours, what must be its weight in ounces?
TABLE 5.2: Candle Burning Time Based on Candle Weight
Candle weight (oz) Time (hours)2 153 204 355 3610 8016 10022 12026 180
Solution
Let’s make a scatter plot of the data. The independent variable, x , is the candle weight in ounces and the dependentvariable, y , is the time in hours it takes the candle to burn. We plot all the points in the table on the coordinate plane.
Then we draw the line of best fit.
Now pick two points on the line (0,0) and (30, 200).
Find the equation of the line:
5.5. FITTING A LINE TO DATA
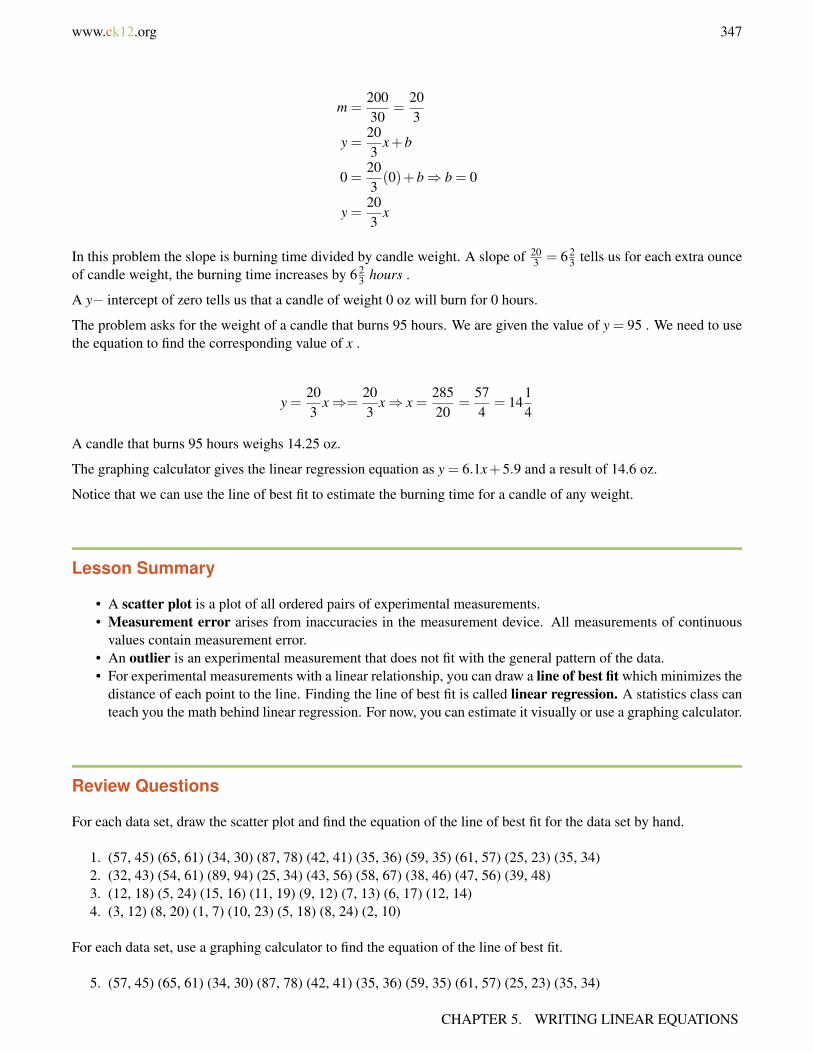
www.ck12.org 347
m =20030
=203
y =203
x+b
0 =203(0)+b⇒ b = 0
y =203
x
In this problem the slope is burning time divided by candle weight. A slope of 203 = 6 2
3 tells us for each extra ounceof candle weight, the burning time increases by 6 2
3 hours .
A y− intercept of zero tells us that a candle of weight 0 oz will burn for 0 hours.
The problem asks for the weight of a candle that burns 95 hours. We are given the value of y = 95 . We need to usethe equation to find the corresponding value of x .
y =203
x⇒=203
x⇒ x =28520
=574
= 1414
A candle that burns 95 hours weighs 14.25 oz.
The graphing calculator gives the linear regression equation as y = 6.1x+5.9 and a result of 14.6 oz.
Notice that we can use the line of best fit to estimate the burning time for a candle of any weight.
Lesson Summary
• A scatter plot is a plot of all ordered pairs of experimental measurements.• Measurement error arises from inaccuracies in the measurement device. All measurements of continuous
values contain measurement error.• An outlier is an experimental measurement that does not fit with the general pattern of the data.• For experimental measurements with a linear relationship, you can draw a line of best fit which minimizes the
distance of each point to the line. Finding the line of best fit is called linear regression. A statistics class canteach you the math behind linear regression. For now, you can estimate it visually or use a graphing calculator.
Review Questions
For each data set, draw the scatter plot and find the equation of the line of best fit for the data set by hand.
1. (57, 45) (65, 61) (34, 30) (87, 78) (42, 41) (35, 36) (59, 35) (61, 57) (25, 23) (35, 34)2. (32, 43) (54, 61) (89, 94) (25, 34) (43, 56) (58, 67) (38, 46) (47, 56) (39, 48)3. (12, 18) (5, 24) (15, 16) (11, 19) (9, 12) (7, 13) (6, 17) (12, 14)4. (3, 12) (8, 20) (1, 7) (10, 23) (5, 18) (8, 24) (2, 10)
For each data set, use a graphing calculator to find the equation of the line of best fit.
5. (57, 45) (65, 61) (34, 30) (87, 78) (42, 41) (35, 36) (59, 35) (61, 57) (25, 23) (35, 34)
CHAPTER 5. WRITING LINEAR EQUATIONS
348 www.ck12.org
6. (32, 43) (54, 61) (89, 94) (25, 34) (43, 56) (58, 67) (38, 46) (47, 56) (95, 105) (39, 48)7. (12, 18) (3, 26) (5, 24) (15, 16) (11, 19) (0, 27) (9, 12) (7, 13) (6, 17) (12, 14)8. Shiva is trying to beat the samosa eating record. The current record is 53.5 samosas in 12 minutes. The
following table shows how many samosas he eats during his daily practice for the first week of his training.Will he be ready for the contest if it occurs two weeks from the day he started training? What are the meaningsof the slope and the y− intercept in this problem?
TABLE 5.3:
Day No. of Samosas1 302 343 364 365 406 437 45
9. Nitisha is trying to find the elasticity coefficient of a Superball. She drops the ball from different heights andmeasures the maximum height of the resulting bounce. The table below shows her data. Draw a scatter plotand find the equation. What is the initial height if the bounce height is 65 cm? What are the meanings of theslope and the y− intercept in this problem?
TABLE 5.4:
Initial height (cm) Bounce height (cm)30 2235 2640 2945 3450 3855 4060 4565 5070 52
10. The following table shows the median California family income from 1995 to 2002 as reported by the USCensus Bureau. Draw a scatter plot and find the equation. What would you expect the median annual incomeof a Californian family to be in year 2010? What are the meanings of the slope and the y− intercept in thisproblem?
TABLE 5.5:
Year Income1995 538071996 552171997 552091998 554151999 631002000 63206
5.5. FITTING A LINE TO DATA
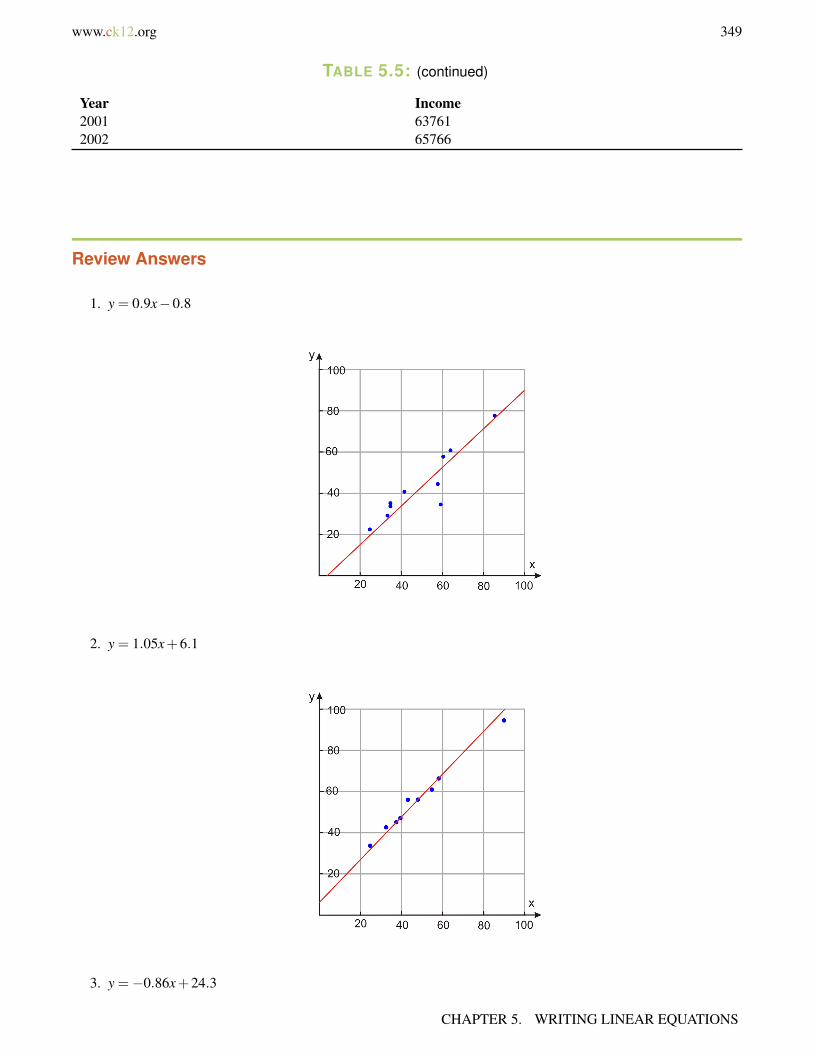
www.ck12.org 349
TABLE 5.5: (continued)
Year Income2001 637612002 65766
Review Answers
1. y = 0.9x−0.8
2. y = 1.05x+6.1
3. y =−0.86x+24.3
CHAPTER 5. WRITING LINEAR EQUATIONS

350 www.ck12.org
4. y = 2x+6
5. y = .8x+3.5
6. y = .96x+10.83
7. y =−.8x+25
5.5. FITTING A LINE TO DATA

www.ck12.org 351
8. y = 2.5x+ 27.5
Solution y = 57.5 . Shiva will beat the record.9. y = 0.75x−0.5
y− intercept = how far the ball bounces if it’s dropped from a height of zero. The line is the best fit to the data.We know that dropping it from height of zero should give a bounce of zero and -0.5 cm is pretty close to zero.Drop height = 83.3 cm when bounce height = 65 cm
10. y = 1.75x+53.8
CHAPTER 5. WRITING LINEAR EQUATIONS
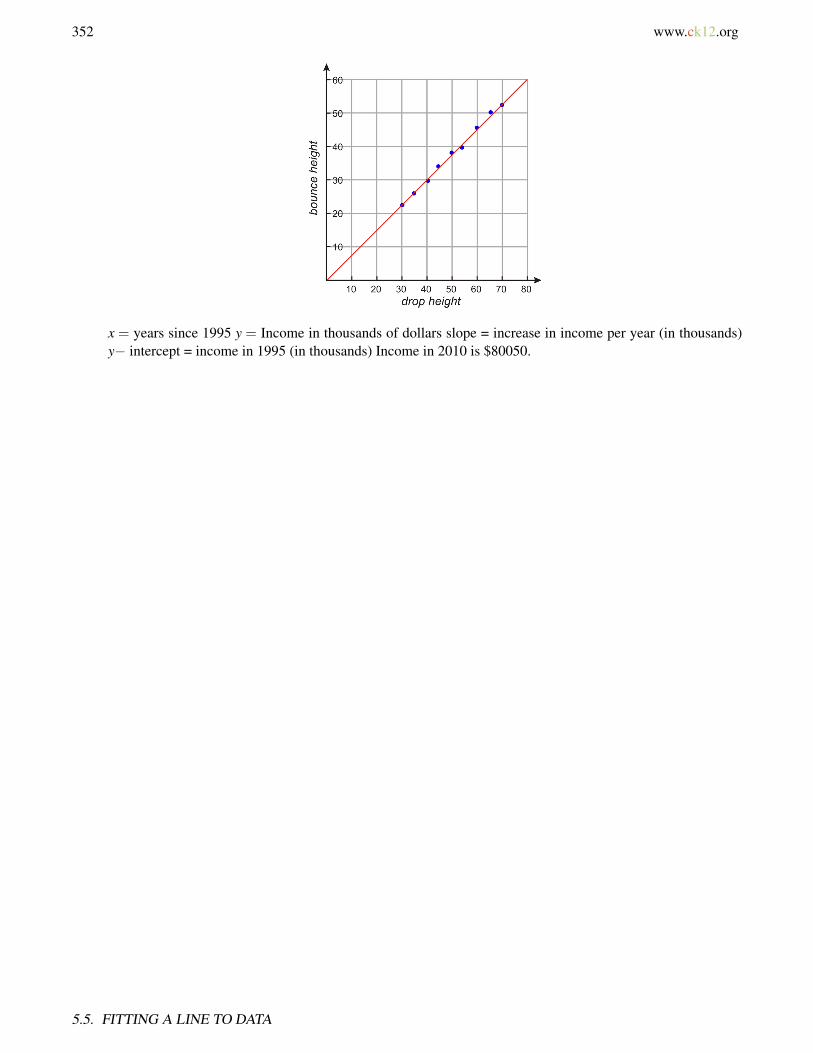
352 www.ck12.org
x = years since 1995 y = Income in thousands of dollars slope = increase in income per year (in thousands)y− intercept = income in 1995 (in thousands) Income in 2010 is $80050.
5.5. FITTING A LINE TO DATA

www.ck12.org 353
5.6 Predicting with Linear Models
Learning Objectives
• Collect and organize data.• Interpolate using an equation.• Extrapolate using an equation.• Predict using an equation.
Introduction
Numerical information appears in all areas of life. You can find it in newspapers, magazines, journals, on thetelevision or on the internet. In the last section, we saw how to find the equation of a line of best fit and how to usethis equation to make predictions. The line of ‘best fit’ is a good method if the relationship between the dependentand the independent variables is linear. In this section, you will learn other methods that help us estimate datavalues. These methods are useful in linear and non-linear relationships equally. The methods you will learn arelinear interpolation which is useful if the information you are looking for is between two known points and linearextrapolation which is useful for estimating a value that is either less than or greater than the known values.
Collect and Organize Data
Data can be collected through surveys or experimental measurements.
Surveys are used to collect information about a population. Surveys of the population are common in politicalpolling, health, social science and marketing research. A survey may focus on opinions or factual informationdepending on its purpose.
Experimental measurements are data sets that are collected during experiments.
The information collected by the US Census Bureau ( http://www.census.gov/ http://www.census.gov/ www.census.gov)or the Center for Disease Control ( http://www.cdc.gov http://www.cdc.gov www.cdc.gov) are examples of datagathered using surveys. The US Census Bureau collects information about many aspects of the US population. Thecensus takes place every ten years and it polls the population of the United States.
Let’s say we are interested in how the median age for first marriages has changed during the 20th century.
Example 1
Median age at first marriage
The US Census gives the following information about the median age at first marriage for males and females.
CHAPTER 5. WRITING LINEAR EQUATIONS
354 www.ck12.org
In 1890, the median age for males was 26.1 and for females it was 22.0.
In 1900, the median age for males was 25.9 and for females it was 21.9.
In 1910, the median age for males was 25.1 and for females it was 21.6.
In 1920, the median age for males was 24.6 and for females it was 21.2.
In 1930, the median age for males was 24.3 and for females it was 21.3.
In 1940, the median age for males was 24.3 and for females it was 21.5.
In 1950, the median age for males was 22.8 and for females it was 20.3.
In 1960, the median age for males was 22.8 and for females it was 20.3.
In 1970, the median age for males was 23.2 and for females it was 20.8.
In 1980, the median age for males was 24.7 and for females it was 22.0.
In 1990, the median age for males was 26.1 and for females it was 23.9.
In 2000, the median age for males was 26.8 and for females it was 25.1.
This is not a very efficient or clear way to display this information. Some better options are organizing the data in atable or a scatter plot.
A table of the data would look like this.
TABLE 5.6: Median Age of Males and Females at First Marriage by Year
Year Median Age of Males Median Age of Females1890 26.1 22.01900 25.9 21.91910 25.1 21.61920 24.6 21.21930 24.3 21.31940 24.3 21.51950 22.8 20.31960 22.8 20.31970 23.2 20.81980 24.7 22.01990 26.1 23.92000 26.8 25.1
A scatter plot of the data would look like this.
Median Age of Males and Females at First Marriage by Year
5.6. PREDICTING WITH LINEAR MODELS

www.ck12.org 355
The Center for Disease Control collects information about the health of the American people and behaviors thatmight lead to bad health. The next example shows the percent of women that smoke during pregnancy.
Example 2
Pregnant women and smoking
The CDC has the following information.
In the year 1990, 18.4 percent of pregnant women smoked.
In the year 1991, 17.7 percent of pregnant women smoked.
In the year 1992, 16.9 percent of pregnant women smoked.
In the year 1993, 15.8 percent of pregnant women smoked.
In the year 1994, 14.6 percent of pregnant women smoked.
In the year 1995, 13.9 percent of pregnant women smoked.
In the year 1996, 13.6 percent of pregnant women smoked.
In the year 2000, 12.2 percent of pregnant women smoked.
In the year 2002, 11.4 percent of pregnant women smoked.
In the year 2003, 10.4 percent of pregnant women smoked.
In the year 2004, 10.2 percent of pregnant women smoked.
Let’s organize this data more clearly in a table and in a scatter plot.
CHAPTER 5. WRITING LINEAR EQUATIONS

356 www.ck12.org
Here is a table of the data.
5.6. PREDICTING WITH LINEAR MODELS
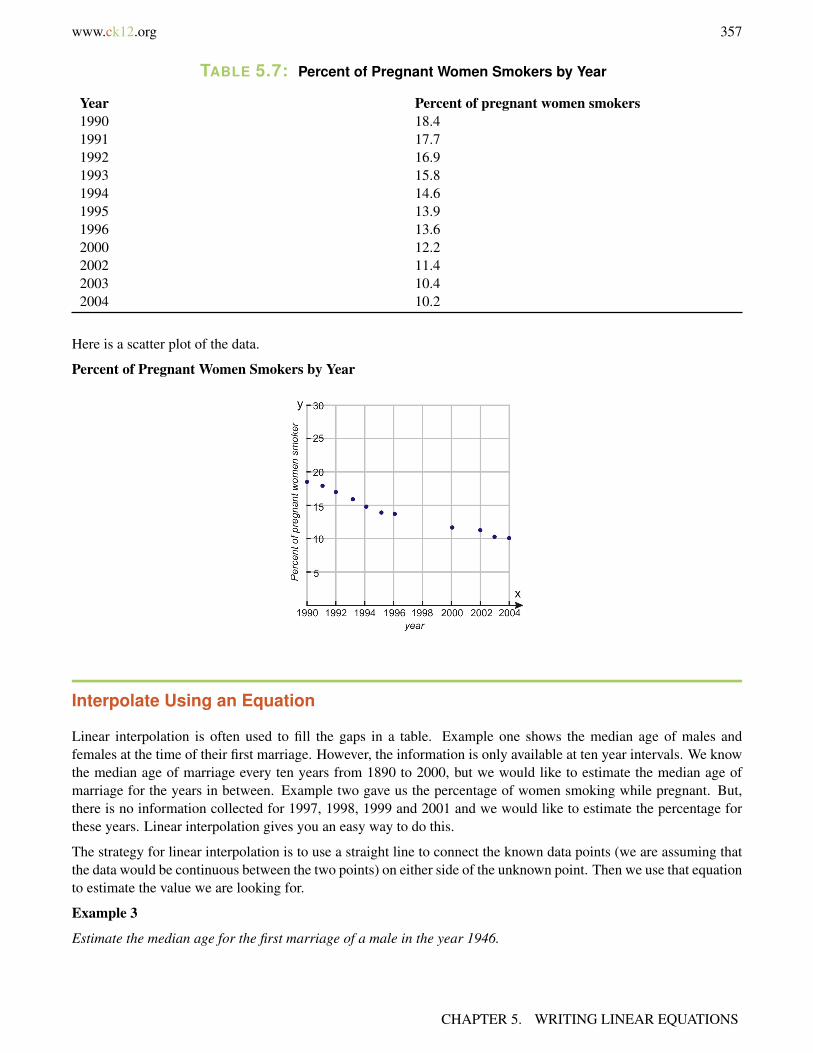
www.ck12.org 357
TABLE 5.7: Percent of Pregnant Women Smokers by Year
Year Percent of pregnant women smokers1990 18.41991 17.71992 16.91993 15.81994 14.61995 13.91996 13.62000 12.22002 11.42003 10.42004 10.2
Here is a scatter plot of the data.
Percent of Pregnant Women Smokers by Year
Interpolate Using an Equation
Linear interpolation is often used to fill the gaps in a table. Example one shows the median age of males andfemales at the time of their first marriage. However, the information is only available at ten year intervals. We knowthe median age of marriage every ten years from 1890 to 2000, but we would like to estimate the median age ofmarriage for the years in between. Example two gave us the percentage of women smoking while pregnant. But,there is no information collected for 1997, 1998, 1999 and 2001 and we would like to estimate the percentage forthese years. Linear interpolation gives you an easy way to do this.
The strategy for linear interpolation is to use a straight line to connect the known data points (we are assuming thatthe data would be continuous between the two points) on either side of the unknown point. Then we use that equationto estimate the value we are looking for.
Example 3
Estimate the median age for the first marriage of a male in the year 1946.
CHAPTER 5. WRITING LINEAR EQUATIONS
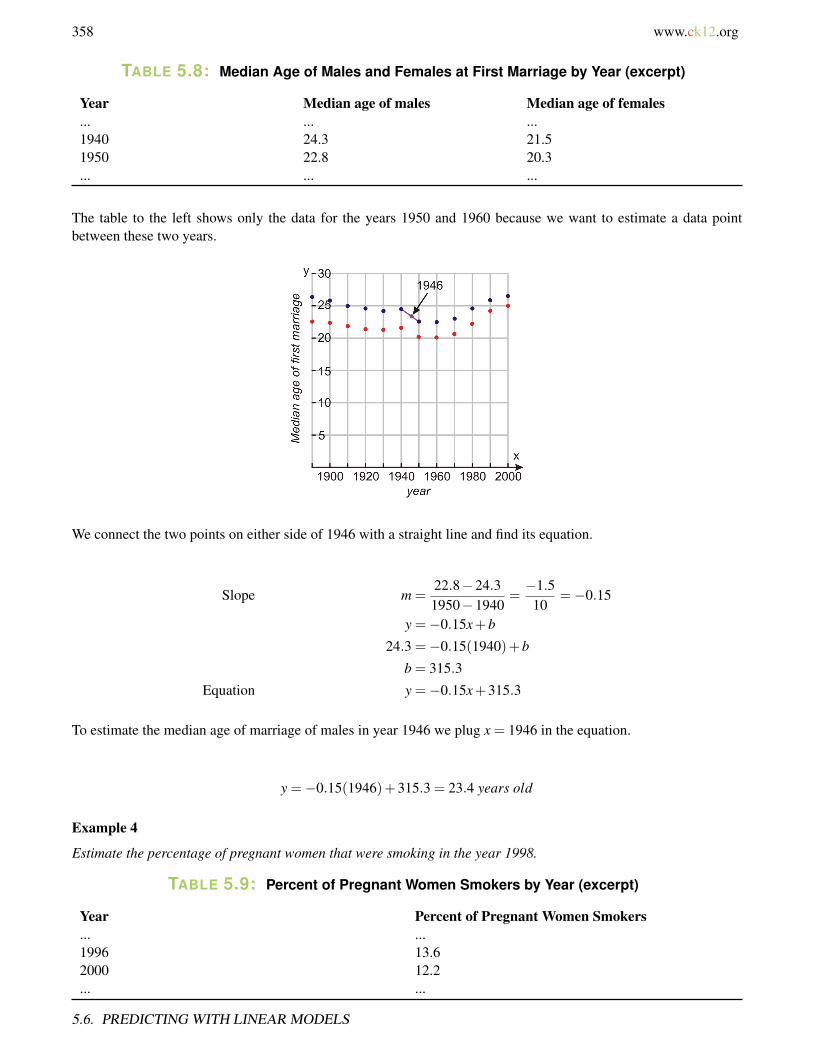
358 www.ck12.org
TABLE 5.8: Median Age of Males and Females at First Marriage by Year (excerpt)
Year Median age of males Median age of females... ... ...1940 24.3 21.51950 22.8 20.3... ... ...
The table to the left shows only the data for the years 1950 and 1960 because we want to estimate a data pointbetween these two years.
We connect the two points on either side of 1946 with a straight line and find its equation.
Slope m =22.8−24.31950−1940
=−1.5
10=−0.15
y =−0.15x+b
24.3 =−0.15(1940)+b
b = 315.3
Equation y =−0.15x+315.3
To estimate the median age of marriage of males in year 1946 we plug x = 1946 in the equation.
y =−0.15(1946)+315.3 = 23.4 years old
Example 4
Estimate the percentage of pregnant women that were smoking in the year 1998.
TABLE 5.9: Percent of Pregnant Women Smokers by Year (excerpt)
Year Percent of Pregnant Women Smokers... ...1996 13.62000 12.2... ...
5.6. PREDICTING WITH LINEAR MODELS

www.ck12.org 359
The table to the left shows only the data for year 1996 and 2000 because we want to estimate a data point betweenthese two years.
Connect the points on either side of 1998 with a straight line and find the equation of that line.
Slope m =12.2−13.62000−1996
=−1.4
4=−0.35
y =−0.35x+b
12.2 =−0.35(2000)+b
b = 712.2
Equation y =−0.35x+712.2
To estimate the percentage of pregnant women who smoked in year 1998 we plug x = 1998 into the equation.
y =−0.35(1998)+712.2 = 12.9%
For non-linear data, linear interpolation is often not accurate enough for our purposes. If the points in the data setchange by a large amount in the interval in which you are interested, then linear interpolation may not give a goodestimate. In that case, it can be replaced by polynomial interpolation which uses a curve instead of a straight lineto estimate values between points.
Extrapolating: How to Use it and When Not to Use it
Linear extrapolation can help us estimate values that are either higher or lower than the range of values of our dataset. The strategy is similar to linear interpolation. However you only use a subset of the data, rather than all of thedata. For linear data, you are ALWAYS more accurate by using the best fit line method of the previous section. Fornon-linear data, it is sometimes useful to extrapolate using the last two or three data points in order to estimate a y−value that is higher than the data range. To estimate a value that is higher than the points in the data set, we connectthe last two data points with a straight line and find its equation. Then we can use this equation to estimate the valuewe are trying to find. To estimate a value that is lower than the points in the data set, we follow the same procedure.But we use the first two points of our data instead.
Example 5
CHAPTER 5. WRITING LINEAR EQUATIONS

360 www.ck12.org
Winning Times
The winning times for the women’s 100 meter race are given in the following table3 . Estimate the winning time inthe year 2010. Is this a good estimate?
TABLE 5.10:
Winner Country Year Time (seconds)Mary Lines UK 1922 12.8Leni Schmidt Germany 1925 12.4Gerturd Glasitsch Germany 1927 12.1Tollien Schuurman Netherlands 1930 12.0Helen Stephens USA 1935 11.8Lulu Mae Hymes USA 1939 11.5Fanny Blankers-Koen Netherlands 1943 11.5Marjorie Jackson Australia 1952 11.4Vera Krepkina Soviet Union 1958 11.3Wyomia Tyus USA 1964 11.2Barbara Ferrell USA 1968 11.1Ellen Strophal East Germany 1972 11.0Inge Helten West Germany 1976 11.0Marlies Gohr East Germany 1982 10.9Florence Griffith Joyner USA 1988 10.5
Solution
We start by making a scatter plot of the data. Connect the last two points on the graph and find the equation of theline.
Winning Times for the Women’s 100 meter Race by Year
5.6. PREDICTING WITH LINEAR MODELS
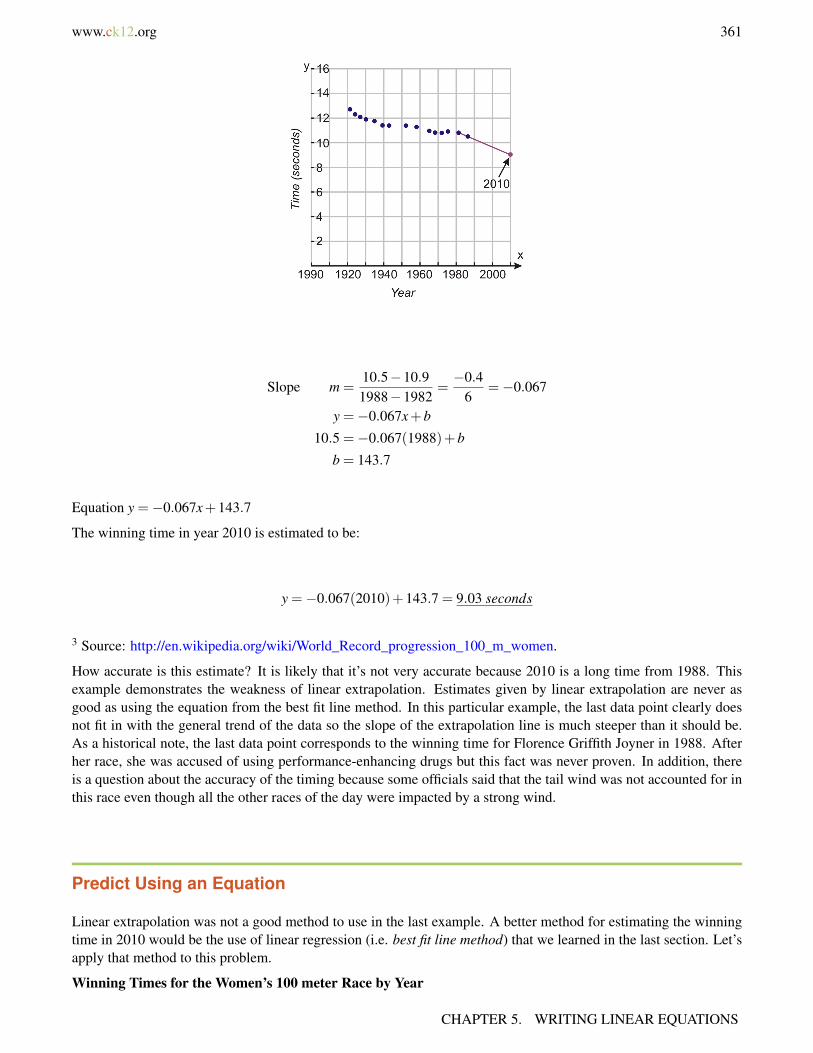
www.ck12.org 361
Slope m =10.5−10.91988−1982
=−0.4
6=−0.067
y =−0.067x+b
10.5 =−0.067(1988)+b
b = 143.7
Equation y =−0.067x+143.7
The winning time in year 2010 is estimated to be:
y =−0.067(2010)+143.7 = 9.03 seconds
3 Source: http://en.wikipedia.org/wiki/World_Record_progression_100_m_women.
How accurate is this estimate? It is likely that it’s not very accurate because 2010 is a long time from 1988. Thisexample demonstrates the weakness of linear extrapolation. Estimates given by linear extrapolation are never asgood as using the equation from the best fit line method. In this particular example, the last data point clearly doesnot fit in with the general trend of the data so the slope of the extrapolation line is much steeper than it should be.As a historical note, the last data point corresponds to the winning time for Florence Griffith Joyner in 1988. Afterher race, she was accused of using performance-enhancing drugs but this fact was never proven. In addition, thereis a question about the accuracy of the timing because some officials said that the tail wind was not accounted for inthis race even though all the other races of the day were impacted by a strong wind.
Predict Using an Equation
Linear extrapolation was not a good method to use in the last example. A better method for estimating the winningtime in 2010 would be the use of linear regression (i.e. best fit line method) that we learned in the last section. Let’sapply that method to this problem.
Winning Times for the Women’s 100 meter Race by Year
CHAPTER 5. WRITING LINEAR EQUATIONS

362 www.ck12.org
We start by drawing the line of best fit and finding its equation. We use the points (1982, 10.9) and (1958, 11.3).
The equation is y =−0.017x+43.9
In year 2010, y =−0.017(2010)+43.9 = 9.73 seconds
This shows a much slower decrease in winning times than linear extrapolation. This method (fitting a line to all ofthe data) is always more accurate for linear data and approximate linear data. However, the line of best fit in thiscase will not be useful in the future. For example, the equation predicts that around the year 2582 the time will beabout zero seconds, and in years that follow the time will be negative!
Lesson Summary
• A survey is a method of collecting information about a population.• Experimental measurements are data sets that are collected during experiments.• Linear interpolation is used to estimate a data value between two experimental measurements. To do so,
compute the line through the two adjacent measurements, then use that line to estimate the intermediate value.• Linear extrapolation is used to estimate a data value either above or below the experimental measurements.
Again, find the line defined by the two closest points and use that line to estimate the value.• The most accurate method of estimating data values from a linear data set is to perform linear regression and
estimate the value from the best-fit line.
Review Questions
1. Use the data from Example one (Median age at first marriage) to estimate the age at marriage for females in1946. Fit a line, by hand, to the data before 1970.
2. Use the data from Example one (Median age at first marriage) to estimate the age at marriage for females in1984. Fit a line, by hand, to the data from 1970 on in order to estimate this accurately.
3. Use the data from Example one (Median age at first marriage) to estimate the age at marriage for males in1995. Use linear interpolation between the 1990 and 2000 data points.
4. Use the data from Example two (Pregnant women and smoking) to estimate the percent of pregnant smokersin 1997. Use linear interpolation between the 1996 and 2000 data points.
5. Use the data from Example two (Pregnant women and smoking) to estimate the percent of pregnant smokersin 2006. Use linear extrapolation with the final two data points.
5.6. PREDICTING WITH LINEAR MODELS

www.ck12.org 363
6. Use the data from Example five (Winning times) to estimate the winning time for the female 100 meter race in1920. Use linear extrapolation because the first two or three data points have a different slope than the rest ofthe data.
7. The table below shows the highest temperature vs. the hours of daylight for the 15th day of each month in theyear 2006 in San Diego, California. Estimate the high temperature for a day with 13.2 hours of daylight usinglinear interpolation.
TABLE 5.11:
Hours of daylight High temperature (F)10.25 6011.0 6212 6213 6613.8 6814.3 7314 8613.4 7512.4 7111.4 6610.5 7310 61
8. Using the table above to estimate the high temperature for a day with 9 hours of daylight using linear extrap-olation. Is the prediction accurate? Find the answer using line of best fit.
Review Answers
1. About 21 years2. 22.8 years3. 26.5 years4. 13.25 percent5. 9.8 percent6. 13.1 seconds7. 70.5 F8. 65 F. Prediction is not very good since we expect cooler temperatures for less daylight hours. The best fit line
method of linear regression predicts 58.5 F.
CHAPTER 5. WRITING LINEAR EQUATIONS
364 www.ck12.org
5.7 Problem Solving Strategies: Use a LinearModel
Learning Objectives
• Read and understand given problem situations.• Develop and apply the strategy: use a linear model.• Plan and compare alternative approaches to solving problems.• Solve real-world problems using selected strategies as part of a plan.
Introduction
In this chapter, we have been estimating values using straight lines. When we use linear interpolation, linear ex-trapolation or predicting results using a line of best fit, it is called linear modeling. In this section, we will look ata few examples where data sets occurring in real-world problems can be modeled using linear relationships. Fromprevious sections remember our problem solving plan:.
Step 1
Understand the problem
Read the problem carefully. Once the problem is read, list all the components and data that are involved. This iswhere you will be assigning your variables
Step 2
Devise a plan – Translate
Come up with a way to solve the problem. Set up an equation, draw a diagram, make a chart or construct a table asa start to solving your problem.
Step 3
Carry out the plan – Solve
This is where you solve the equation you came up with in Step 2.
Step 4
Look – Check and Interpret
Check to see if you used all your information and that the answer makes sense.
Example 1
Dana heard something very interesting at school. Her teacher told her that if you divide the circumference of acircle by its diameter you always get the same number. She tested this statement by measuring the circumferenceand diameter of several circular objects. The following table shows her results.
From this data, estimate the circumference of a circle whose diameter is 12 inches. What about 25 inches? 60inches?
5.7. PROBLEM SOLVING STRATEGIES: USE A LINEAR MODEL
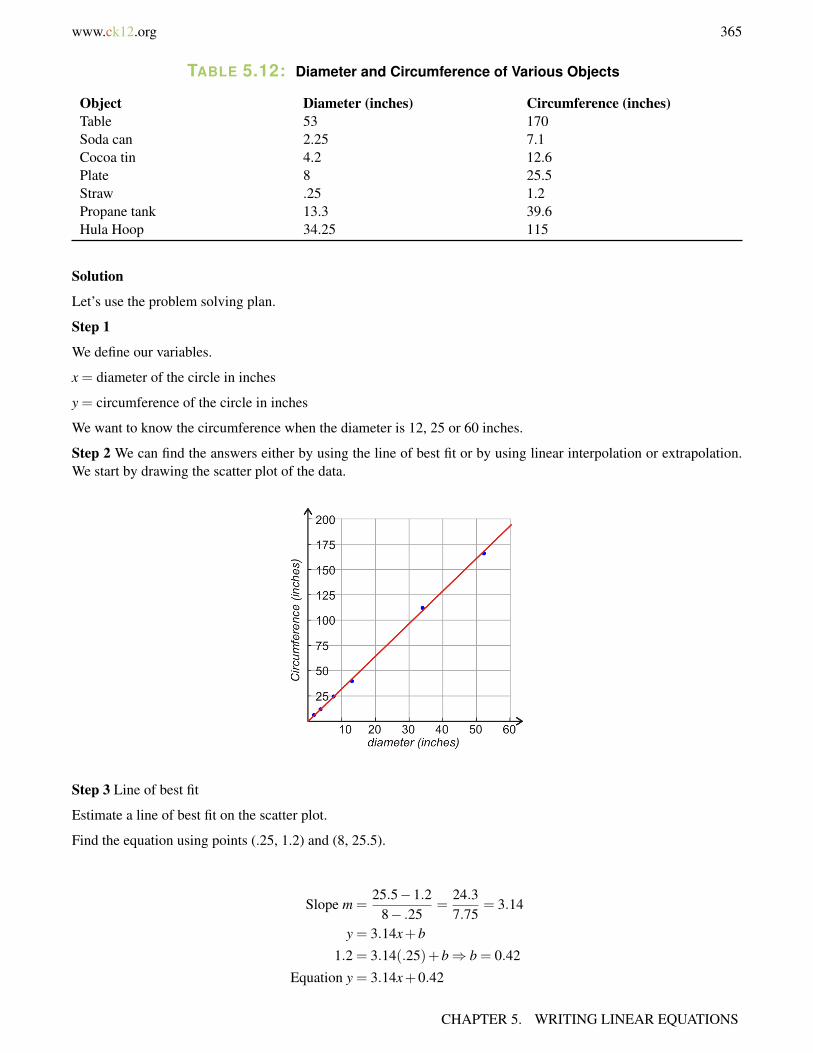
www.ck12.org 365
TABLE 5.12: Diameter and Circumference of Various Objects
Object Diameter (inches) Circumference (inches)Table 53 170Soda can 2.25 7.1Cocoa tin 4.2 12.6Plate 8 25.5Straw .25 1.2Propane tank 13.3 39.6Hula Hoop 34.25 115
Solution
Let’s use the problem solving plan.
Step 1
We define our variables.
x = diameter of the circle in inches
y = circumference of the circle in inches
We want to know the circumference when the diameter is 12, 25 or 60 inches.
Step 2 We can find the answers either by using the line of best fit or by using linear interpolation or extrapolation.We start by drawing the scatter plot of the data.
Step 3 Line of best fit
Estimate a line of best fit on the scatter plot.
Find the equation using points (.25, 1.2) and (8, 25.5).
Slope m =25.5−1.2
8− .25=
24.37.75
= 3.14
y = 3.14x+b
1.2 = 3.14(.25)+b⇒ b = 0.42
Equation y = 3.14x+0.42
CHAPTER 5. WRITING LINEAR EQUATIONS
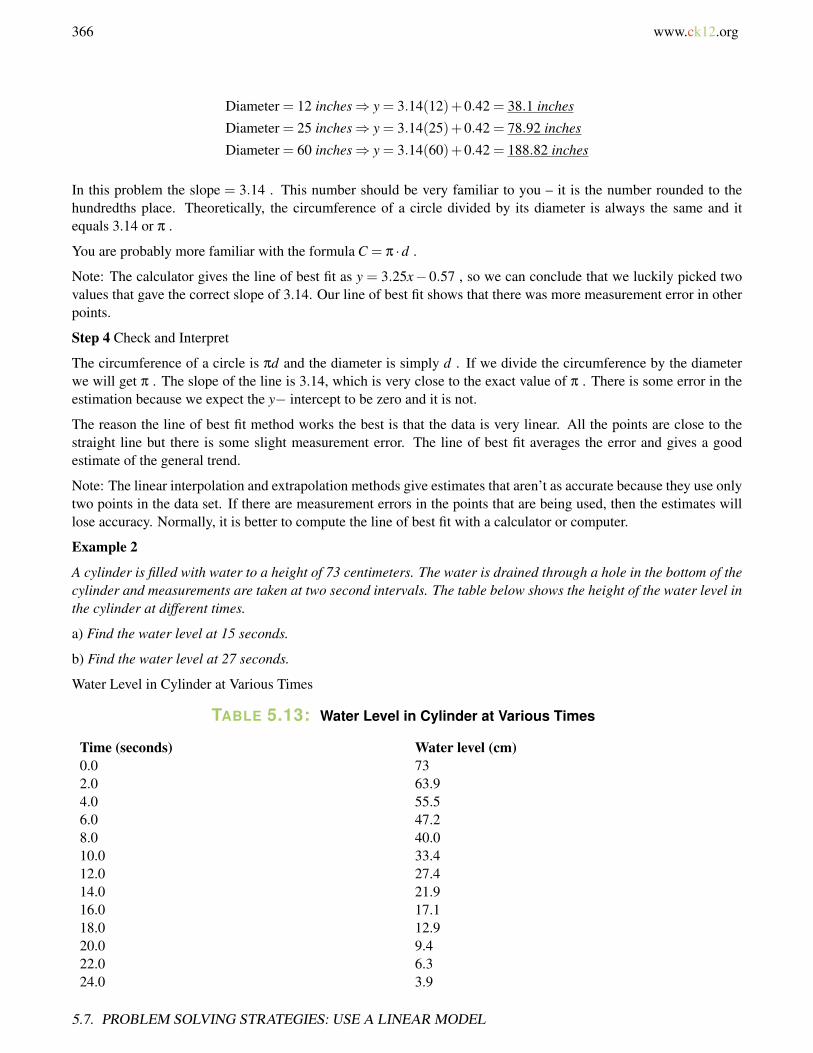
366 www.ck12.org
Diameter = 12 inches⇒ y = 3.14(12)+0.42 = 38.1 inches
Diameter = 25 inches⇒ y = 3.14(25)+0.42 = 78.92 inches
Diameter = 60 inches⇒ y = 3.14(60)+0.42 = 188.82 inches
In this problem the slope = 3.14 . This number should be very familiar to you – it is the number rounded to thehundredths place. Theoretically, the circumference of a circle divided by its diameter is always the same and itequals 3.14 or π .
You are probably more familiar with the formula C = π ·d .
Note: The calculator gives the line of best fit as y = 3.25x− 0.57 , so we can conclude that we luckily picked twovalues that gave the correct slope of 3.14. Our line of best fit shows that there was more measurement error in otherpoints.
Step 4 Check and Interpret
The circumference of a circle is πd and the diameter is simply d . If we divide the circumference by the diameterwe will get π . The slope of the line is 3.14, which is very close to the exact value of π . There is some error in theestimation because we expect the y− intercept to be zero and it is not.
The reason the line of best fit method works the best is that the data is very linear. All the points are close to thestraight line but there is some slight measurement error. The line of best fit averages the error and gives a goodestimate of the general trend.
Note: The linear interpolation and extrapolation methods give estimates that aren’t as accurate because they use onlytwo points in the data set. If there are measurement errors in the points that are being used, then the estimates willlose accuracy. Normally, it is better to compute the line of best fit with a calculator or computer.
Example 2
A cylinder is filled with water to a height of 73 centimeters. The water is drained through a hole in the bottom of thecylinder and measurements are taken at two second intervals. The table below shows the height of the water level inthe cylinder at different times.
a) Find the water level at 15 seconds.
b) Find the water level at 27 seconds.
Water Level in Cylinder at Various Times
TABLE 5.13: Water Level in Cylinder at Various Times
Time (seconds) Water level (cm)0.0 732.0 63.94.0 55.56.0 47.28.0 40.010.0 33.412.0 27.414.0 21.916.0 17.118.0 12.920.0 9.422.0 6.324.0 3.9
5.7. PROBLEM SOLVING STRATEGIES: USE A LINEAR MODEL

www.ck12.org 367
TABLE 5.13: (continued)
Time (seconds) Water level (cm)26.0 2.028.0 0.730.0 0.1
Solution
Let’s use the problem solving plan.
Step 1
Define our variables
x = time in seconds
y = water level in centimeters
We want to know the water level at time 15, 27 and -5 seconds.
Step 2 We can find the answers either by using the line of best fit or by using linear interpolation or extrapolation.We start by drawing the scatter plot of the data.
Step 3 Method 1 Line of best fit
Draw an estimate of the line of best fit on the scatter plot. Find the equation using points (6, 47.2) and (24, 3.9).
Slope m =3.9−47.2
24−6=−43.3
18=−2.4
y =−2.4x+b
47.2 =−2.4(6)+b⇒ b = 61.6
Equation y =−2.4x+61.6
Time = 15 seconds⇒ y =−2.4(15)+61.6 = 25.6 cm
Time = 27 seconds⇒ y =−2.4(27)+61.6 =−3.2 cm
CHAPTER 5. WRITING LINEAR EQUATIONS

368 www.ck12.org
The line of best fit does not show us accurate estimates for the height. The data points do not appear to fit a lineartrend so the line of best fit is close to very few data points.
Method 2: Linear interpolation or linear extrapolation.
We use linear interpolation to find the water level for the times 15 and 27 seconds, because these points are betweenthe points we know.
Time = 15 seconds
Connect points (14, 21.9) and (16, 17.1) and find the equation of the straight line.
m =17.1−21.9
16−14=−4.8
2=−2.4 y =−2.4x+b⇒ 21.9 =−2.4(14)+b⇒ b = 55.5
Equation y =−2.4x+55.5
Plug in x = 15 and obtain y =−2.4(15)+55.5 = 19.5 cm
Time = 27 seconds
Connect points (26, 2) and (28, 0.7) and find the equation of the straight line.
m =0.7−228−26
=−1.3
2=−.65
y =−.65x+b⇒ 2 =−.65(26)+b⇒ b = 18.9
Equation y =−.65x = 18.9
Plug in x = 27 and obtain y =−.65(27)+18.9 = 1.35 cm
We use linear extrapolation to find the water level for time -5 seconds because this point is smaller than the points inour data set.
Step 4 Check and Interpret
In this example, the linear interpolation and extrapolation method gives better estimates of the values that we needto solve the problem. Since the data is not linear, the line of best fit is not close to many of the points in our dataset. The linear interpolation and extrapolation methods give better estimates because we do not expect the data tochange greatly between the points that are known.
5.7. PROBLEM SOLVING STRATEGIES: USE A LINEAR MODEL
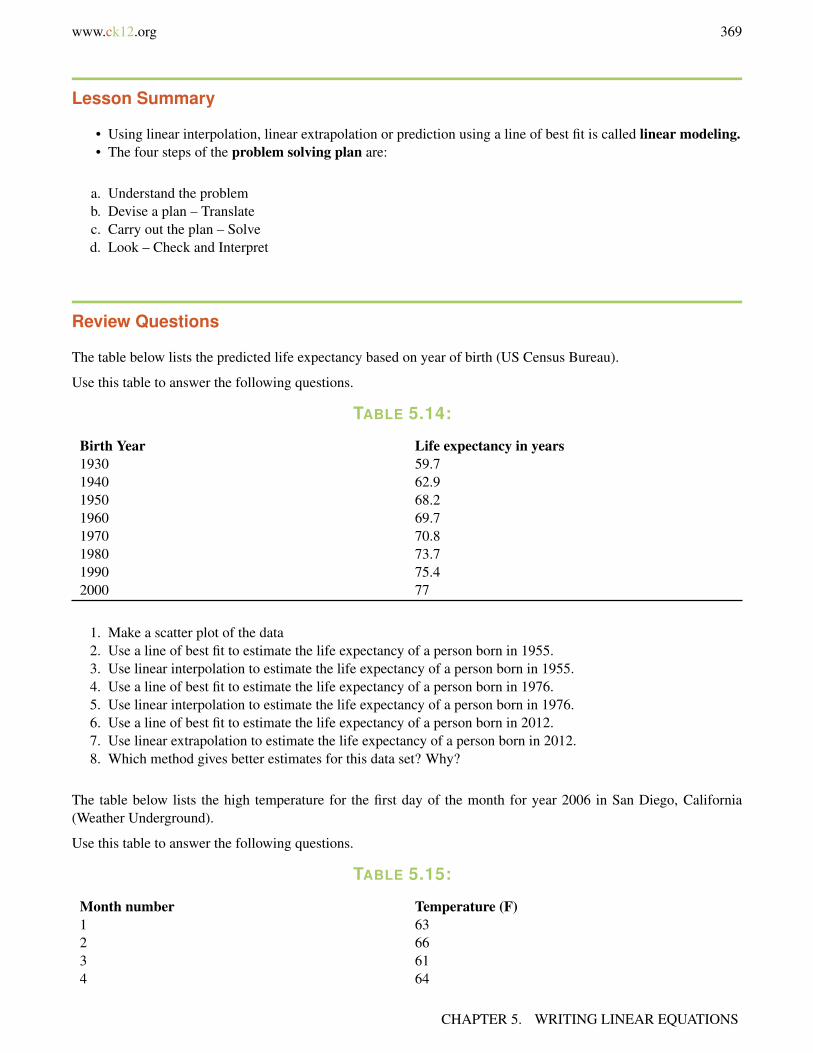
www.ck12.org 369
Lesson Summary
• Using linear interpolation, linear extrapolation or prediction using a line of best fit is called linear modeling.• The four steps of the problem solving plan are:
a. Understand the problemb. Devise a plan – Translatec. Carry out the plan – Solved. Look – Check and Interpret
Review Questions
The table below lists the predicted life expectancy based on year of birth (US Census Bureau).
Use this table to answer the following questions.
TABLE 5.14:
Birth Year Life expectancy in years1930 59.71940 62.91950 68.21960 69.71970 70.81980 73.71990 75.42000 77
1. Make a scatter plot of the data2. Use a line of best fit to estimate the life expectancy of a person born in 1955.3. Use linear interpolation to estimate the life expectancy of a person born in 1955.4. Use a line of best fit to estimate the life expectancy of a person born in 1976.5. Use linear interpolation to estimate the life expectancy of a person born in 1976.6. Use a line of best fit to estimate the life expectancy of a person born in 2012.7. Use linear extrapolation to estimate the life expectancy of a person born in 2012.8. Which method gives better estimates for this data set? Why?
The table below lists the high temperature for the first day of the month for year 2006 in San Diego, California(Weather Underground).
Use this table to answer the following questions.
TABLE 5.15:
Month number Temperature (F)1 632 663 614 64
CHAPTER 5. WRITING LINEAR EQUATIONS
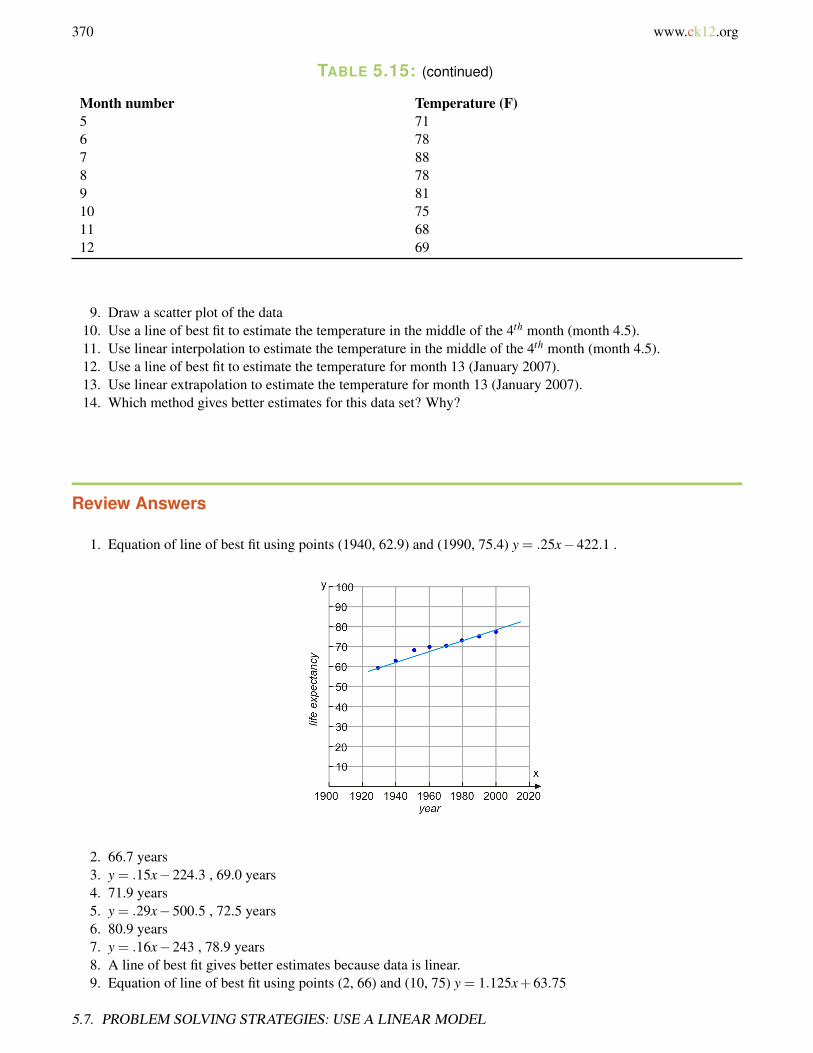
370 www.ck12.org
TABLE 5.15: (continued)
Month number Temperature (F)5 716 787 888 789 8110 7511 6812 69
9. Draw a scatter plot of the data10. Use a line of best fit to estimate the temperature in the middle of the 4th month (month 4.5).11. Use linear interpolation to estimate the temperature in the middle of the 4th month (month 4.5).12. Use a line of best fit to estimate the temperature for month 13 (January 2007).13. Use linear extrapolation to estimate the temperature for month 13 (January 2007).14. Which method gives better estimates for this data set? Why?
Review Answers
1. Equation of line of best fit using points (1940, 62.9) and (1990, 75.4) y = .25x−422.1 .
2. 66.7 years3. y = .15x−224.3 , 69.0 years4. 71.9 years5. y = .29x−500.5 , 72.5 years6. 80.9 years7. y = .16x−243 , 78.9 years8. A line of best fit gives better estimates because data is linear.9. Equation of line of best fit using points (2, 66) and (10, 75) y = 1.125x+63.75
5.7. PROBLEM SOLVING STRATEGIES: USE A LINEAR MODEL
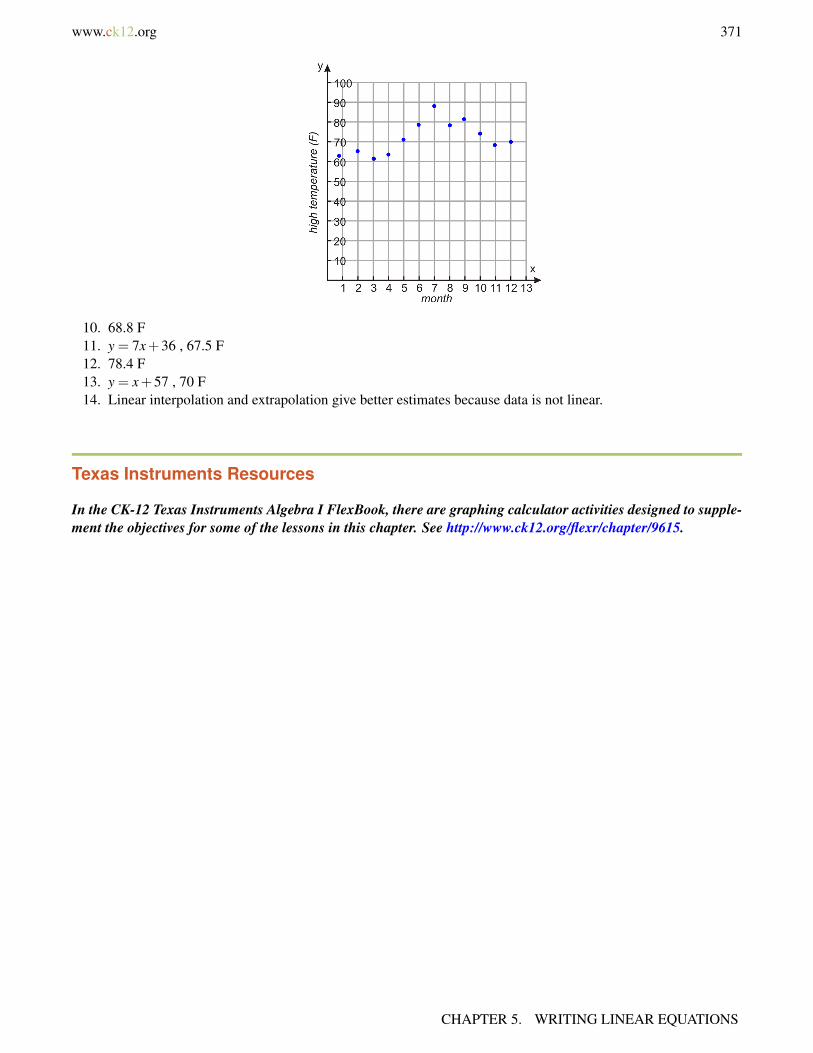
www.ck12.org 371
10. 68.8 F11. y = 7x+36 , 67.5 F12. 78.4 F13. y = x+57 , 70 F14. Linear interpolation and extrapolation give better estimates because data is not linear.
Texas Instruments Resources
In the CK-12 Texas Instruments Algebra I FlexBook, there are graphing calculator activities designed to supple-ment the objectives for some of the lessons in this chapter. See http://www.ck12.org/flexr/chapter/9615.
CHAPTER 5. WRITING LINEAR EQUATIONS

372 www.ck12.org
CHAPTER 6 Graphing Linear Inequalities;Introduction to Probability
CHAPTER OUTLINE
6.1 INEQUALITIES USING ADDITION AND SUBTRACTION
6.2 INEQUALITIES USING MULTIPLICATION AND DIVISION
6.3 MULTI-STEP INEQUALITIES
6.4 COMPOUND INEQUALITIES
6.5 ABSOLUTE VALUE EQUATIONS
6.6 ABSOLUTE VALUE INEQUALITIES
6.7 LINEAR INEQUALITIES IN TWO VARIABLES
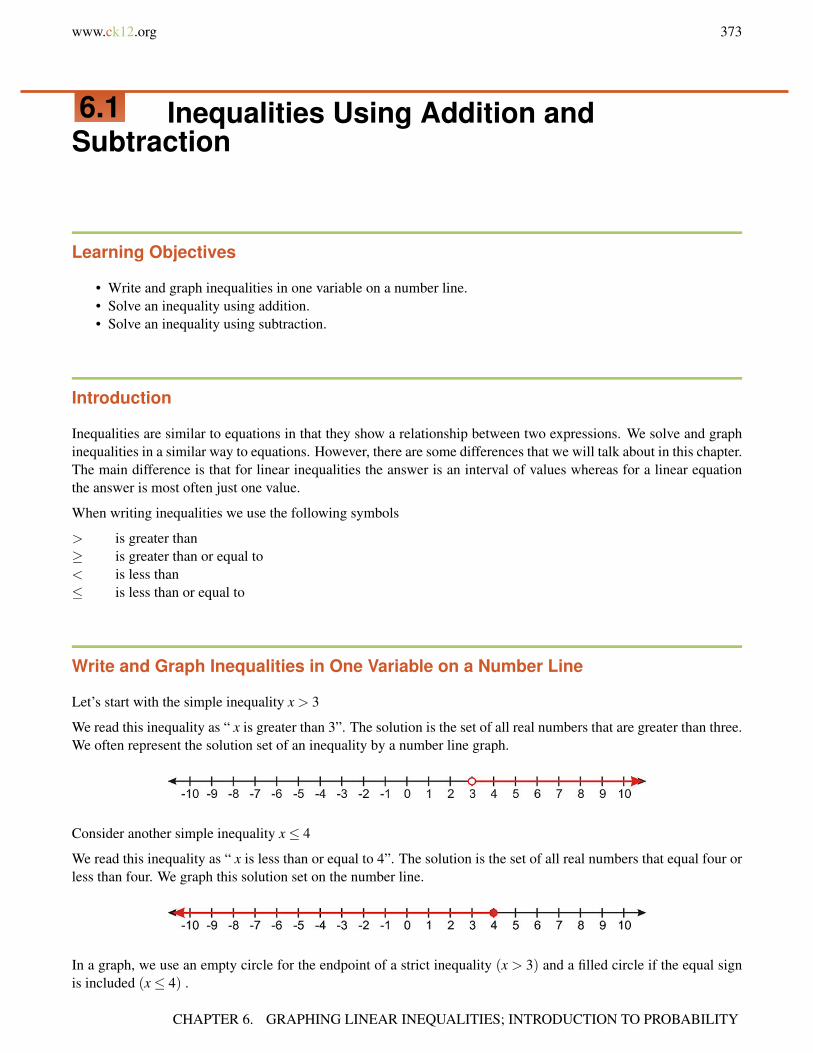
www.ck12.org 373
6.1 Inequalities Using Addition andSubtraction
Learning Objectives
• Write and graph inequalities in one variable on a number line.• Solve an inequality using addition.• Solve an inequality using subtraction.
Introduction
Inequalities are similar to equations in that they show a relationship between two expressions. We solve and graphinequalities in a similar way to equations. However, there are some differences that we will talk about in this chapter.The main difference is that for linear inequalities the answer is an interval of values whereas for a linear equationthe answer is most often just one value.
When writing inequalities we use the following symbols
> is greater than≥ is greater than or equal to< is less than≤ is less than or equal to
Write and Graph Inequalities in One Variable on a Number Line
Let’s start with the simple inequality x > 3
We read this inequality as “ x is greater than 3”. The solution is the set of all real numbers that are greater than three.We often represent the solution set of an inequality by a number line graph.
Consider another simple inequality x≤ 4
We read this inequality as “ x is less than or equal to 4”. The solution is the set of all real numbers that equal four orless than four. We graph this solution set on the number line.
In a graph, we use an empty circle for the endpoint of a strict inequality (x > 3) and a filled circle if the equal signis included (x≤ 4) .
CHAPTER 6. GRAPHING LINEAR INEQUALITIES; INTRODUCTION TO PROBABILITY
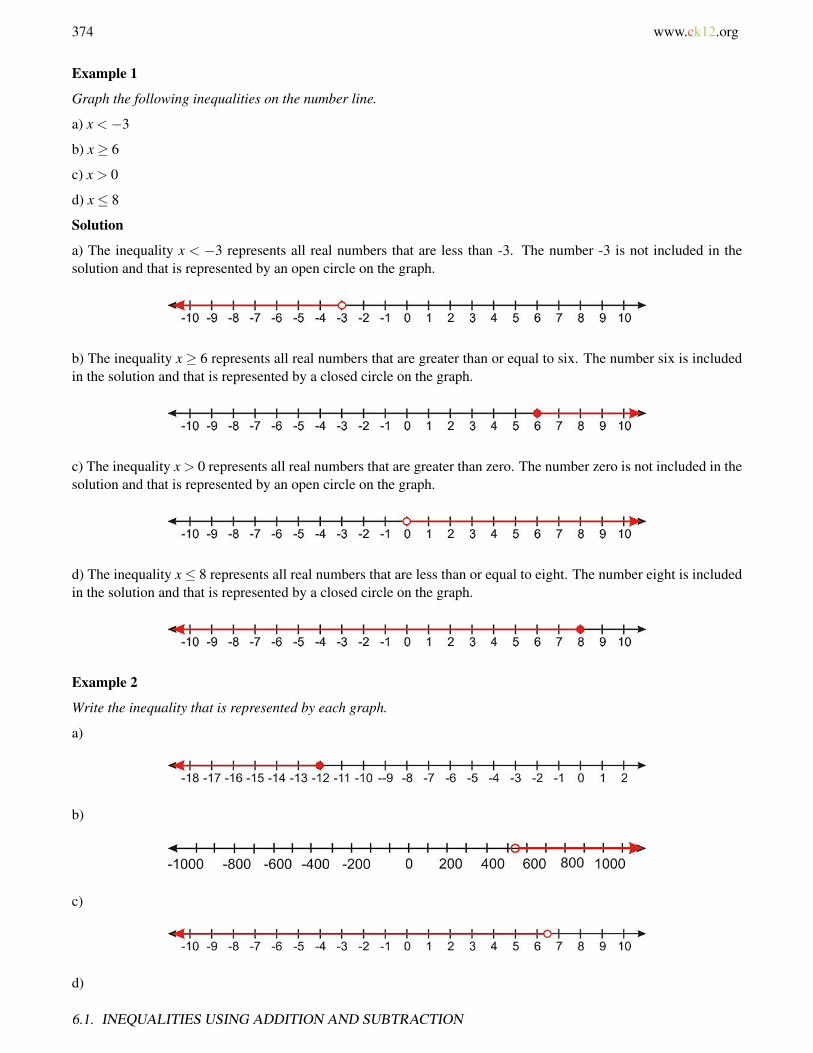
374 www.ck12.org
Example 1
Graph the following inequalities on the number line.
a) x <−3
b) x≥ 6
c) x > 0
d) x≤ 8
Solution
a) The inequality x < −3 represents all real numbers that are less than -3. The number -3 is not included in thesolution and that is represented by an open circle on the graph.
b) The inequality x≥ 6 represents all real numbers that are greater than or equal to six. The number six is includedin the solution and that is represented by a closed circle on the graph.
c) The inequality x > 0 represents all real numbers that are greater than zero. The number zero is not included in thesolution and that is represented by an open circle on the graph.
d) The inequality x≤ 8 represents all real numbers that are less than or equal to eight. The number eight is includedin the solution and that is represented by a closed circle on the graph.
Example 2
Write the inequality that is represented by each graph.
a)
b)
c)
d)
6.1. INEQUALITIES USING ADDITION AND SUBTRACTION
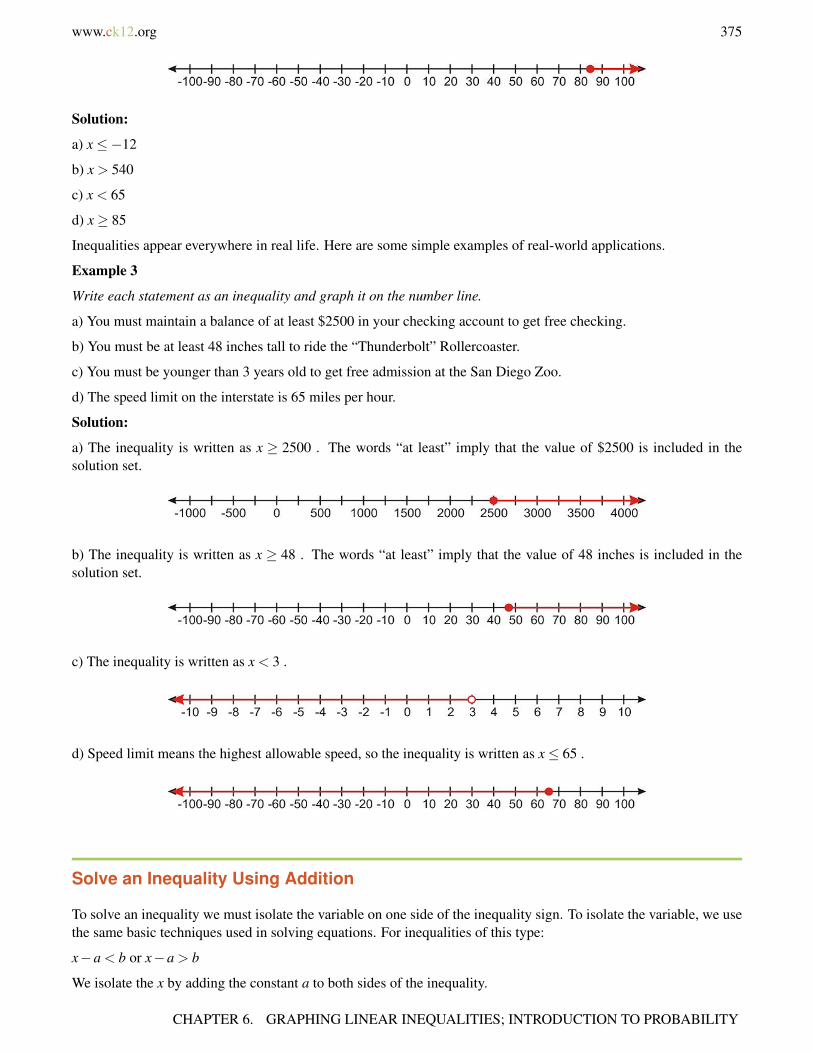
www.ck12.org 375
Solution:
a) x≤−12
b) x > 540
c) x < 65
d) x≥ 85
Inequalities appear everywhere in real life. Here are some simple examples of real-world applications.
Example 3
Write each statement as an inequality and graph it on the number line.
a) You must maintain a balance of at least $2500 in your checking account to get free checking.
b) You must be at least 48 inches tall to ride the “Thunderbolt” Rollercoaster.
c) You must be younger than 3 years old to get free admission at the San Diego Zoo.
d) The speed limit on the interstate is 65 miles per hour.
Solution:
a) The inequality is written as x ≥ 2500 . The words “at least” imply that the value of $2500 is included in thesolution set.
b) The inequality is written as x ≥ 48 . The words “at least” imply that the value of 48 inches is included in thesolution set.
c) The inequality is written as x < 3 .
d) Speed limit means the highest allowable speed, so the inequality is written as x≤ 65 .
Solve an Inequality Using Addition
To solve an inequality we must isolate the variable on one side of the inequality sign. To isolate the variable, we usethe same basic techniques used in solving equations. For inequalities of this type:
x−a < b or x−a > b
We isolate the x by adding the constant a to both sides of the inequality.
CHAPTER 6. GRAPHING LINEAR INEQUALITIES; INTRODUCTION TO PROBABILITY
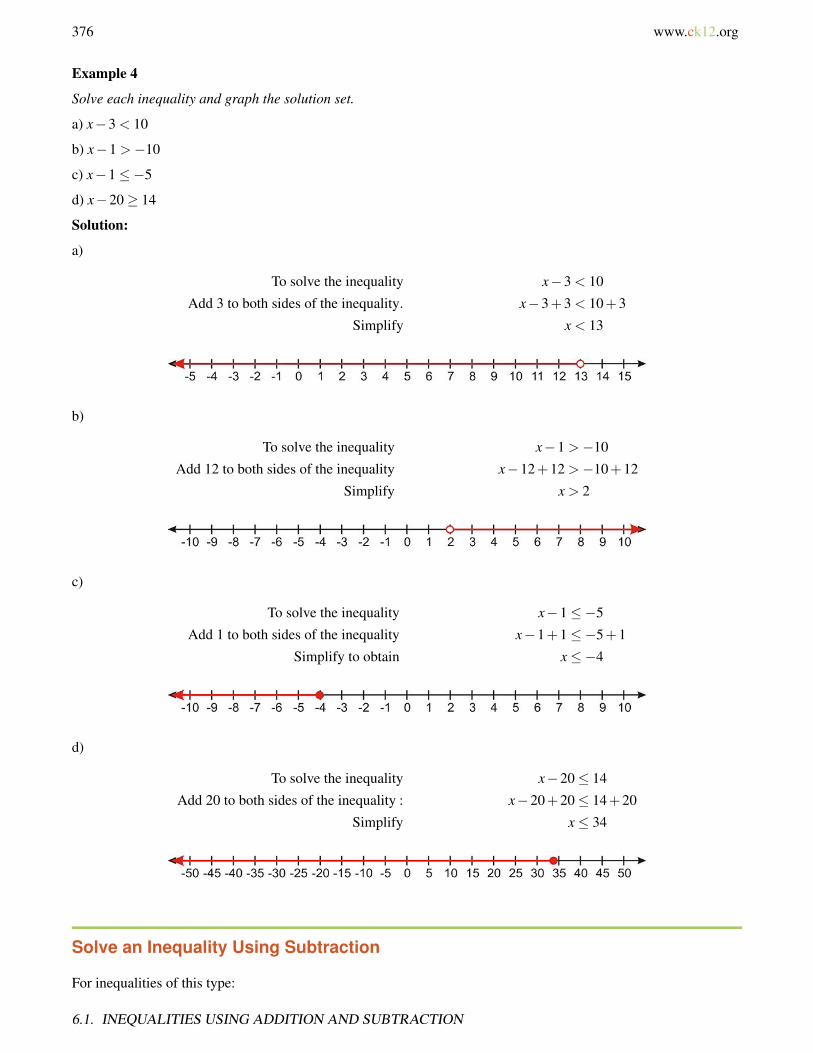
376 www.ck12.org
Example 4
Solve each inequality and graph the solution set.
a) x−3 < 10
b) x−1 >−10
c) x−1≤−5
d) x−20≥ 14
Solution:
a)
To solve the inequality x−3 < 10
Add 3 to both sides of the inequality. x−3+3 < 10+3
Simplify x < 13
b)
To solve the inequality x−1 >−10
Add 12 to both sides of the inequality x−12+12 >−10+12
Simplify x > 2
c)
To solve the inequality x−1≤−5
Add 1 to both sides of the inequality x−1+1≤−5+1
Simplify to obtain x≤−4
d)
To solve the inequality x−20≤ 14
Add 20 to both sides of the inequality : x−20+20≤ 14+20
Simplify x≤ 34
Solve an Inequality Using Subtraction
For inequalities of this type:
6.1. INEQUALITIES USING ADDITION AND SUBTRACTION

www.ck12.org 377
x+1 < b or x+1 > b
We isolate the x by subtracting the constant a on both sides of the inequality.
Example 5
Solve each inequality and graph the solution set.
a) x+2 < 7
b) x+8≤−7
c) x+4 > 13
d) x+5≥−34
Solution:
a)
To solve the inequality x+2 < 7
Subtract 2 on both sides of the inequality x+2−2 < 7−2
Simplify to obtain x < 5
b)
To solve the inequality x+8≤−7
Subtract 8 on both sides of the inequality x+8−8≤−7−8
Simplify to obtain : x≤−15
c)
To solve the inequality x+4 > 13
Subtract 4 on both sides of the inequality x+4−4 > 13−4
Simplify x > 9
d)
To solve the inequality x+5≥ 34
Subtract 5 on both sides of the inequality x+5−5≥−34−5
Simplify to obtain : x≥−534
CHAPTER 6. GRAPHING LINEAR INEQUALITIES; INTRODUCTION TO PROBABILITY

378 www.ck12.org
Lesson Summary
• The answer to an inequality is often an interval of values. Common inequalities are:• #62; is greater than• ≥ is greater than or equal to• #62; is less than• ≤ is less than or equal to• Solving inequalities with addition and subtraction works just like solving an equation. To solve, we isolate
the variable on one side of the equation.
Review Questions
1. Write the inequality represented by the graph.
2. Write the inequality represented by the graph.
3. Write the inequality represented by the graph.
4. Write the inequality represented by the graph.
Graph each inequality on the number line.
5. x <−356. x >−177. x≥ 208. x≤ 3
Solve each inequality and graph the solution on the number line.
9. x−5 < 3510. x+15≥−6011. x−2≤ 112. x−8 >−2013. x+11 > 1314. x+65 < 10015. x−32≤ 016. x+68≥ 75
6.1. INEQUALITIES USING ADDITION AND SUBTRACTION

www.ck12.org 379
Review Answers
1. x≥ 12. x <−103. x≤−104. x > 30
5.
6.
7.
8.
9.
10.
11.
12.
13.
14.
15.
16.
CHAPTER 6. GRAPHING LINEAR INEQUALITIES; INTRODUCTION TO PROBABILITY

380 www.ck12.org
6.2 Inequalities Using Multiplication andDivision
Learning Objectives
• Solve an inequality using multiplication.• Solve an inequality using division.• Multiply or divide an inequality by a negative number.
Introduction
In this section, we consider problems where we find the solution of an inequality by multiplying or dividing bothsides of the inequality by a number.
Solve an Inequality Using Multiplication
Consider the problemx5≤ 3
To find the solution we multiply both sides by 5. 5 · x5≤ 3.5
We obtain x≤ 15
The answer of an inequality can be expressed in four different ways:
a. Inequality notation The answer is simply expressed as x < 15 .b. Set notation The answer is x|x < 15 . You read this as “the set of all values of x , such that x is a real
number less than 15”.c. Interval notation uses brackets to indicate the range of values in the solution.
Square or closed brackets “[” and “]” indicate that the number next to the bracket is included in the solution set.
Round or open brackets “(” and “)” indicate that the number next to the bracket is not included in the solution set.
Interval notation also uses the concept of infinity ∞ and negative infinity −∞ .
The interval notation solution for our problem is (−∞,15) .
a. Solution graph shows the solution on the real number line. A closed circle on a number indicates that thenumber is included in the solution set. While an open circle indicates that the number is not included in theset. For our example, the solution graph is drawn here.
6.2. INEQUALITIES USING MULTIPLICATION AND DIVISION
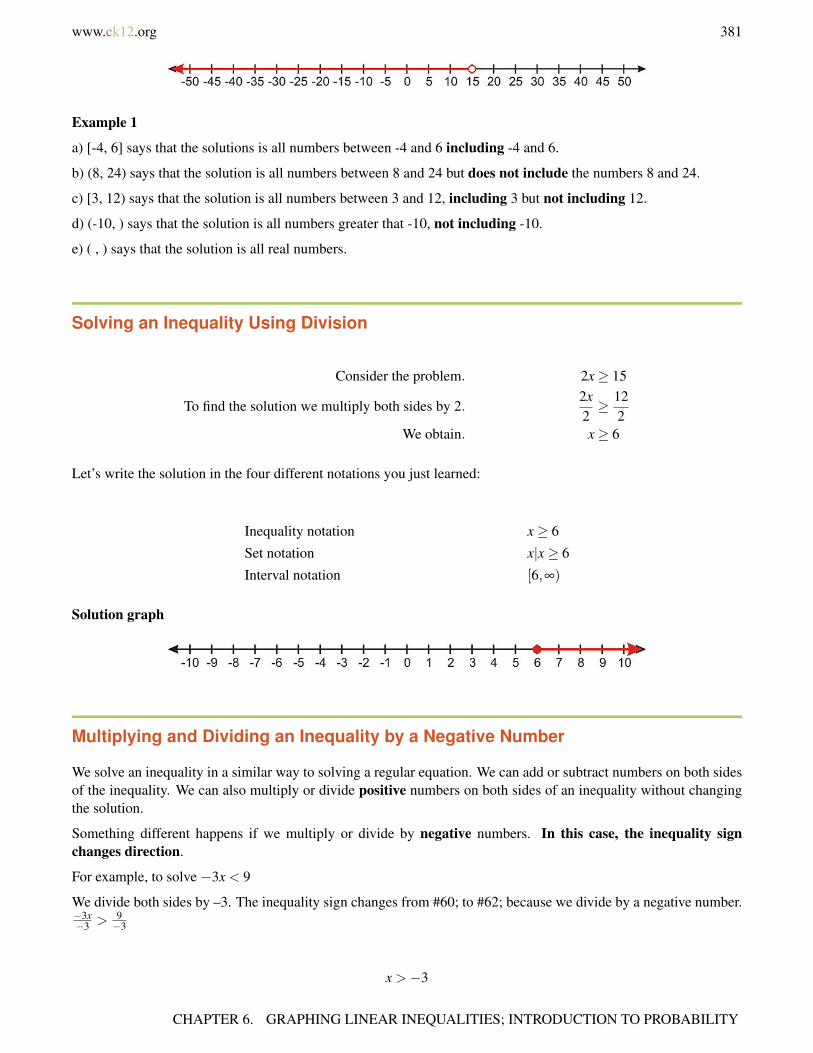
www.ck12.org 381
Example 1
a) [-4, 6] says that the solutions is all numbers between -4 and 6 including -4 and 6.
b) (8, 24) says that the solution is all numbers between 8 and 24 but does not include the numbers 8 and 24.
c) [3, 12) says that the solution is all numbers between 3 and 12, including 3 but not including 12.
d) (-10, ) says that the solution is all numbers greater that -10, not including -10.
e) ( , ) says that the solution is all real numbers.
Solving an Inequality Using Division
Consider the problem. 2x≥ 15
To find the solution we multiply both sides by 2.2x2≥ 12
2We obtain. x≥ 6
Let’s write the solution in the four different notations you just learned:
Inequality notation x≥ 6
Set notation x|x≥ 6
Interval notation [6,∞)
Solution graph
Multiplying and Dividing an Inequality by a Negative Number
We solve an inequality in a similar way to solving a regular equation. We can add or subtract numbers on both sidesof the inequality. We can also multiply or divide positive numbers on both sides of an inequality without changingthe solution.
Something different happens if we multiply or divide by negative numbers. In this case, the inequality signchanges direction.
For example, to solve −3x < 9
We divide both sides by –3. The inequality sign changes from #60; to #62; because we divide by a negative number.−3x−3 > 9
−3
x >−3
CHAPTER 6. GRAPHING LINEAR INEQUALITIES; INTRODUCTION TO PROBABILITY
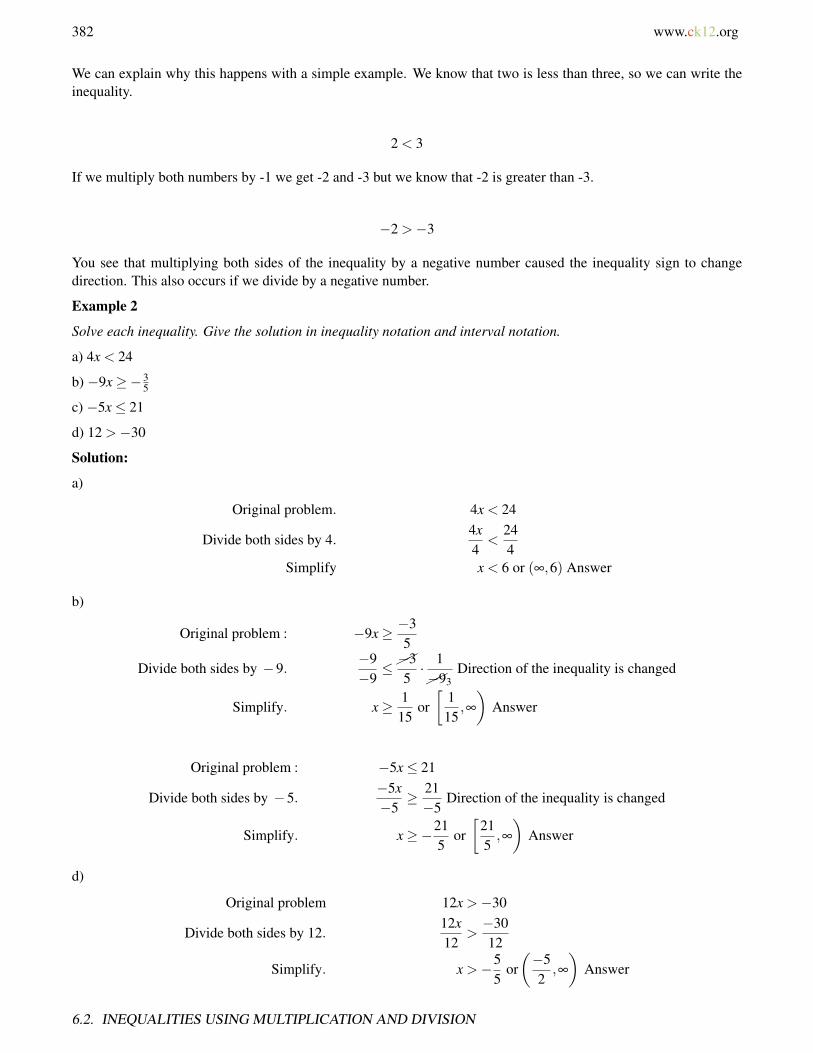
382 www.ck12.org
We can explain why this happens with a simple example. We know that two is less than three, so we can write theinequality.
2 < 3
If we multiply both numbers by -1 we get -2 and -3 but we know that -2 is greater than -3.
−2 >−3
You see that multiplying both sides of the inequality by a negative number caused the inequality sign to changedirection. This also occurs if we divide by a negative number.
Example 2
Solve each inequality. Give the solution in inequality notation and interval notation.
a) 4x < 24
b) −9x≥−35
c) −5x≤ 21
d) 12 >−30
Solution:
a)
Original problem. 4x < 24
Divide both sides by 4.4x4
<244
Simplify x < 6 or (∞,6) Answer
b)
Original problem : −9x≥ −35
Divide both sides by −9.−9−9≤−35· 1−93
Direction of the inequality is changed
Simplify. x≥ 115
or[
115
,∞
)Answer
Original problem : −5x≤ 21
Divide both sides by −5.−5x−5≥ 21−5
Direction of the inequality is changed
Simplify. x≥−215
or[
215,∞
)Answer
d)
Original problem 12x >−30
Divide both sides by 12.12x12
>−3012
Simplify. x >−55
or(−52,∞
)Answer
6.2. INEQUALITIES USING MULTIPLICATION AND DIVISION
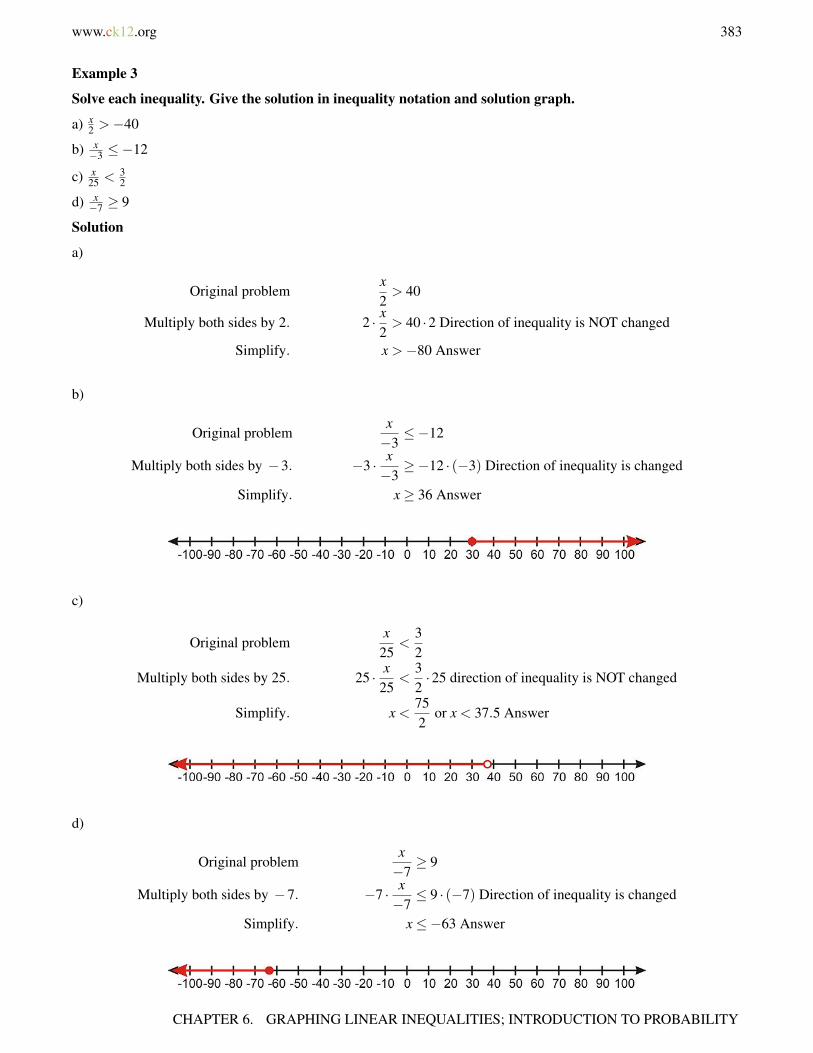
www.ck12.org 383
Example 3
Solve each inequality. Give the solution in inequality notation and solution graph.
a) x2 >−40
b) x−3 ≤−12
c) x25 < 3
2
d) x−7 ≥ 9
Solution
a)
Original problemx2> 40
Multiply both sides by 2. 2 · x2> 40 ·2 Direction of inequality is NOT changed
Simplify. x >−80 Answer
b)
Original problemx−3≤−12
Multiply both sides by −3. −3 · x−3≥−12 · (−3) Direction of inequality is changed
Simplify. x≥ 36 Answer
c)
Original problemx
25<
32
Multiply both sides by 25. 25 · x25
<32·25 direction of inequality is NOT changed
Simplify. x <752
or x < 37.5 Answer
d)
Original problemx−7≥ 9
Multiply both sides by −7. −7 · x−7≤ 9 · (−7) Direction of inequality is changed
Simplify. x≤−63 Answer
CHAPTER 6. GRAPHING LINEAR INEQUALITIES; INTRODUCTION TO PROBABILITY

384 www.ck12.org
Lesson Summary
• There are four ways to represent an inequality:
1. Equation notation x≥ 2
2. Set notation x≥ 2
3. Interval notation [2,∞)
Closed brackets “[” and “]” mean inclusive, parentheses “(”and “)” mean exclusive.
4. Solution graph
• When multiplying or dividing both sides of an inequality by a negative number, you need to reverse theinequality.
Review Questions
Solve each inequality. Give the solution in inequality notation and solution graph.
1. 3x≤ 62. x
5 >− 310
3. −10x > 2504. x−7 ≥−5
Solve each inequality. Give the solution in inequality notation and interval notation.
5. 9x >−34
6. − x15 ≤ 5
7. 620x > 24008. x
20 ≥−7
40
Solve each inequality. Give the solution in inequality notation and set notation.
9. −0.5x≤ 7.510. 75x≥ 12511. x
−3 >−109
12. x−15 < 8
Review Answers
1. x≤ 2 or
6.2. INEQUALITIES USING MULTIPLICATION AND DIVISION
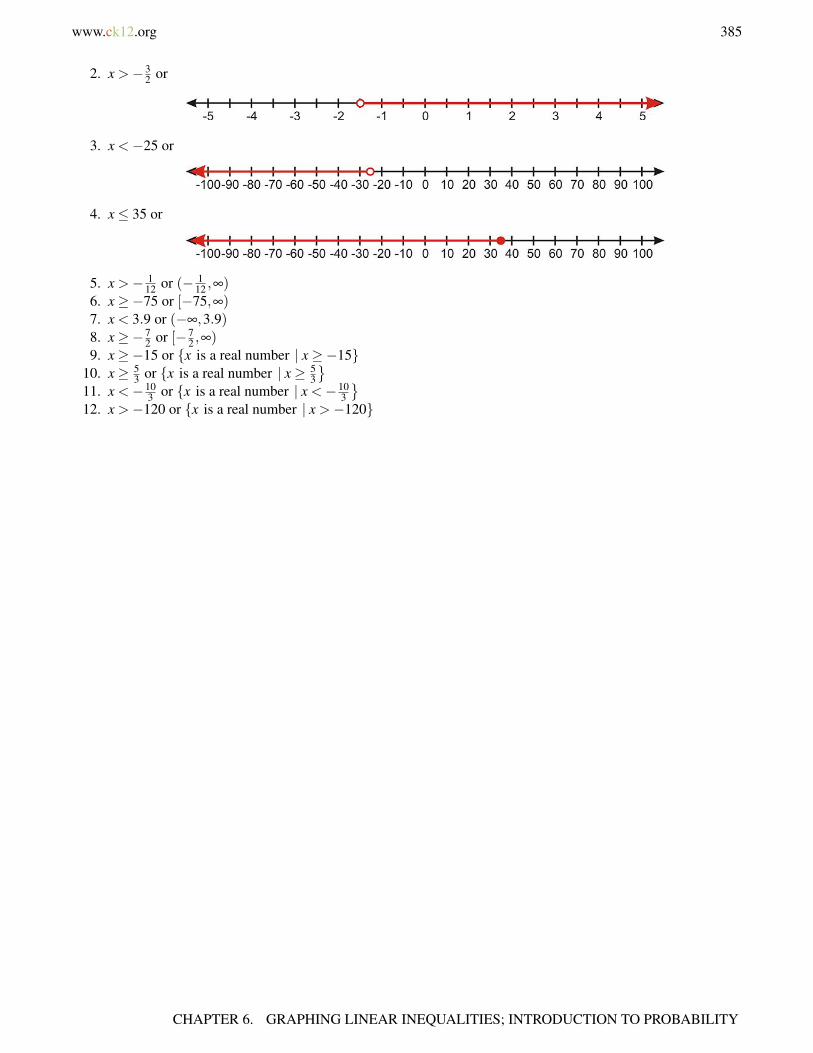
www.ck12.org 385
2. x >−32 or
3. x <−25 or
4. x≤ 35 or
5. x >− 112 or (− 1
12 ,∞)6. x≥−75 or [−75,∞)7. x < 3.9 or (−∞,3.9)8. x≥−7
2 or [−72 ,∞)
9. x≥−15 or x is a real number | x≥−1510. x≥ 5
3 or x is a real number | x≥ 53
11. x <−10
3 or x is a real number | x <−103
12. x >−120 or x is a real number | x >−120
CHAPTER 6. GRAPHING LINEAR INEQUALITIES; INTRODUCTION TO PROBABILITY
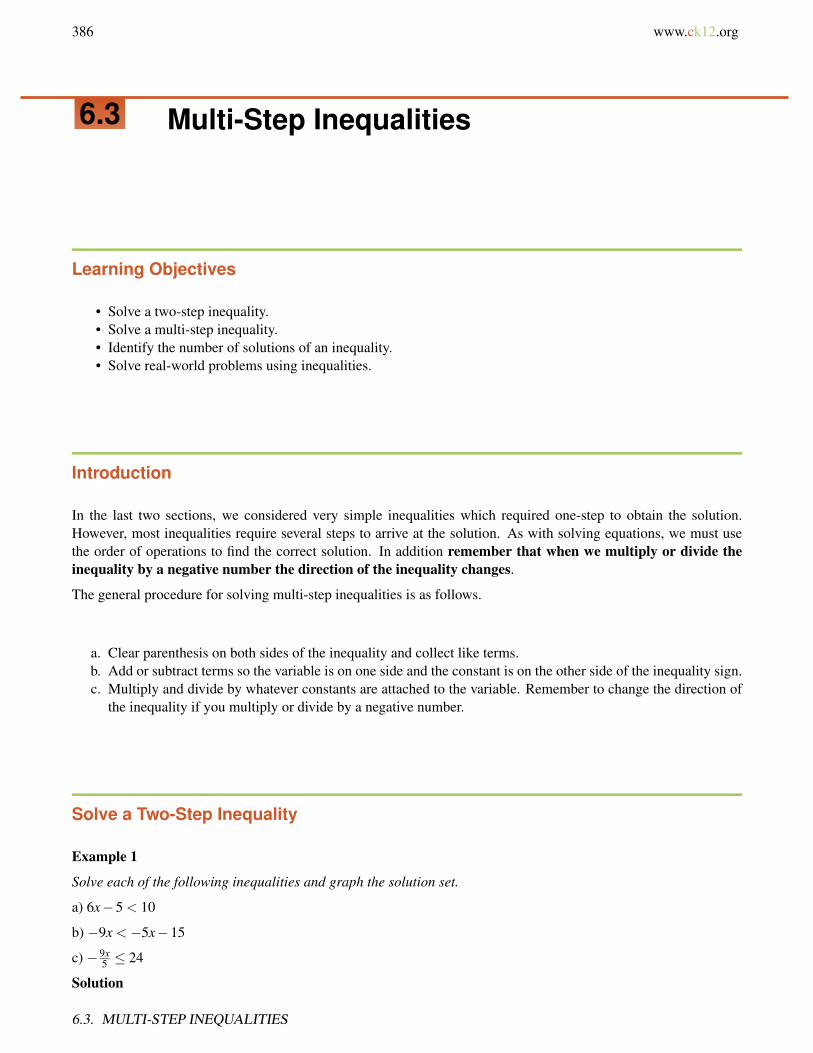
386 www.ck12.org
6.3 Multi-Step Inequalities
Learning Objectives
• Solve a two-step inequality.• Solve a multi-step inequality.• Identify the number of solutions of an inequality.• Solve real-world problems using inequalities.
Introduction
In the last two sections, we considered very simple inequalities which required one-step to obtain the solution.However, most inequalities require several steps to arrive at the solution. As with solving equations, we must usethe order of operations to find the correct solution. In addition remember that when we multiply or divide theinequality by a negative number the direction of the inequality changes.
The general procedure for solving multi-step inequalities is as follows.
a. Clear parenthesis on both sides of the inequality and collect like terms.b. Add or subtract terms so the variable is on one side and the constant is on the other side of the inequality sign.c. Multiply and divide by whatever constants are attached to the variable. Remember to change the direction of
the inequality if you multiply or divide by a negative number.
Solve a Two-Step Inequality
Example 1
Solve each of the following inequalities and graph the solution set.
a) 6x−5 < 10
b) −9x <−5x−15
c) −9x5 ≤ 24
Solution
6.3. MULTI-STEP INEQUALITIES
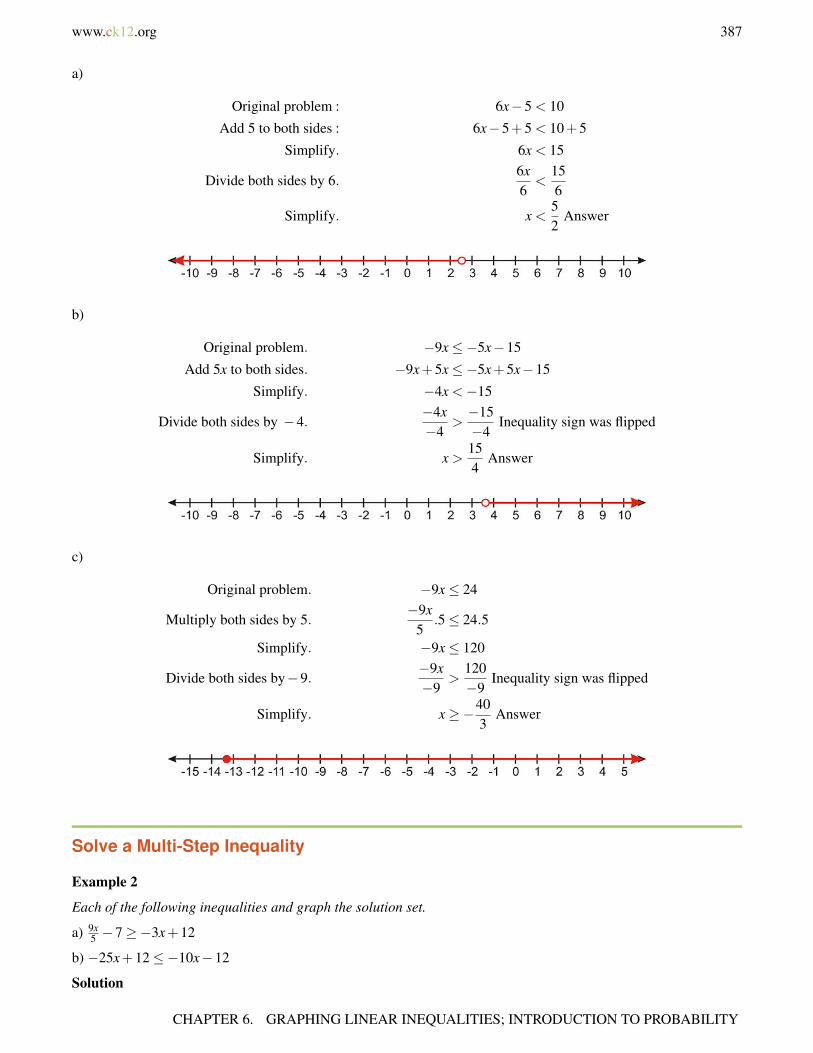
www.ck12.org 387
a)
Original problem : 6x−5 < 10
Add 5 to both sides : 6x−5+5 < 10+5
Simplify. 6x < 15
Divide both sides by 6.6x6
<156
Simplify. x <52
Answer
b)
Original problem. −9x≤−5x−15
Add 5x to both sides. −9x+5x≤−5x+5x−15
Simplify. −4x <−15
Divide both sides by −4.−4x−4
>−15−4
Inequality sign was flipped
Simplify. x >154
Answer
c)
Original problem. −9x≤ 24
Multiply both sides by 5.−9x
5.5≤ 24.5
Simplify. −9x≤ 120
Divide both sides by−9.−9x−9
>120−9
Inequality sign was flipped
Simplify. x≥−403
Answer
Solve a Multi-Step Inequality
Example 2
Each of the following inequalities and graph the solution set.
a) 9x5 −7≥−3x+12
b) −25x+12≤−10x−12
Solution
CHAPTER 6. GRAPHING LINEAR INEQUALITIES; INTRODUCTION TO PROBABILITY
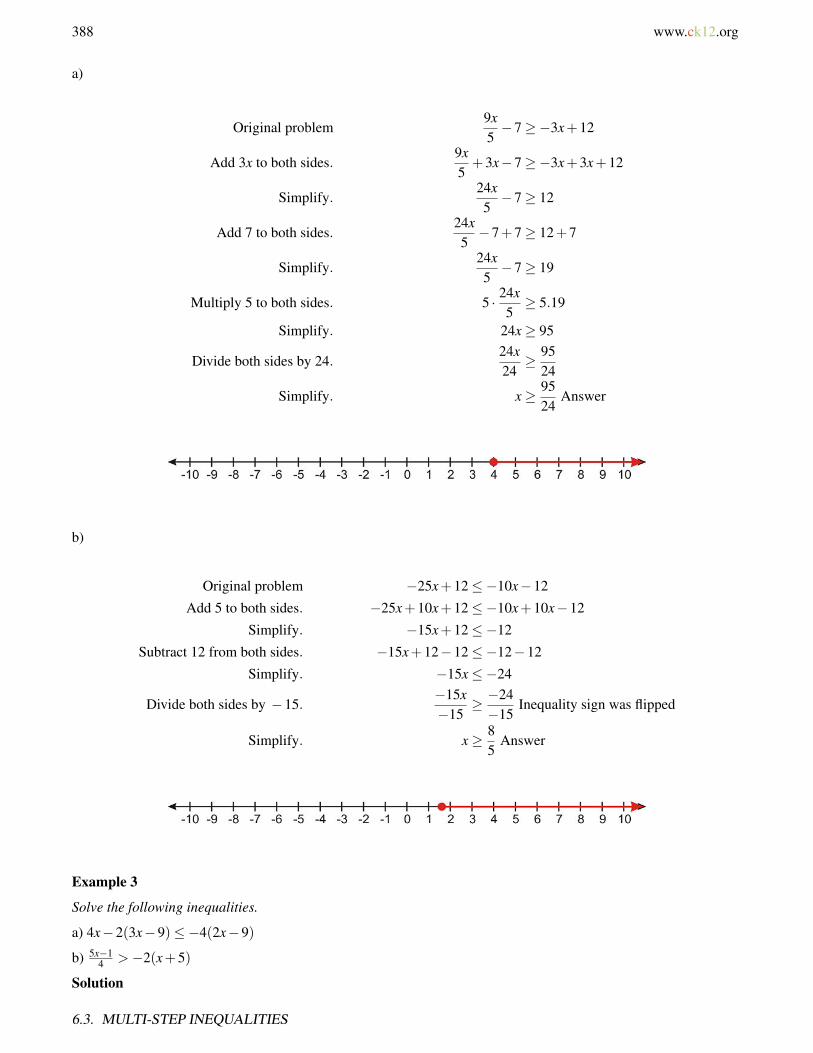
388 www.ck12.org
a)
Original problem9x5−7≥−3x+12
Add 3x to both sides.9x5+3x−7≥−3x+3x+12
Simplify.24x5−7≥ 12
Add 7 to both sides.24x5−7+7≥ 12+7
Simplify.24x5−7≥ 19
Multiply 5 to both sides. 5 · 24x5≥ 5.19
Simplify. 24x≥ 95
Divide both sides by 24.24x24≥ 95
24
Simplify. x≥ 9524
Answer
b)
Original problem −25x+12≤−10x−12
Add 5 to both sides. −25x+10x+12≤−10x+10x−12
Simplify. −15x+12≤−12
Subtract 12 from both sides. −15x+12−12≤−12−12
Simplify. −15x≤−24
Divide both sides by −15.−15x−15
≥ −24−15
Inequality sign was flipped
Simplify. x≥ 85
Answer
Example 3
Solve the following inequalities.
a) 4x−2(3x−9)≤−4(2x−9)
b) 5x−14 >−2(x+5)
Solution
6.3. MULTI-STEP INEQUALITIES

www.ck12.org 389
a)
Original problem 4x−2(3x−9)≤−4(2x−9)
Simplify parentheses. 4x−6x+18≤−8x+36
Collect like terms. −−2x+18≤−8x+36
Add 8x to both sides. −2x+8x+18≤−8x+8x+36
Simplify. −6x+18≤ 36
Subtract 18 from both sides. −6x+18−18≤ 36−18
Simplify. 6x≤ 18
Divide both sides by 6.6x6≤ 18
6Simplify. x≤ 3 Answer
b)
Original problem5x−1
4>−2(x+5)
Simplify parenthesis.5x−1
4>−2x−10
Multiply both sides by 4. 4.5x−1
4> 4(−2x−10)
Simplify. 5x−1 >−8x−40
Add 8x to both sides. 5x+8x−1 >−8x+8x−40
Simplify. 13x−1 >−40
Add 1 to both sides. 13−1+1 >−40+1
Simplify. 13x >−39
Divide both sides by 13.13x13
>−3913
Simplify. x >−3 Answer
Identify the Number of Solutions of an Inequality
Inequalities can have:
• A set that has an infinite number of solutions.• No solutions• A set that has a discrete number of solutions.
Infinite Number of Solutions
The inequalities we have solved so far all have an infinite number of solutions. In the last example, we saw that theinequality5x−1
4 >−2(x+5) has the solution x >−3
This solution says that all real numbers greater than -3 make this inequality true. You can see that the solution to thisproblem is an infinite set of numbers.
CHAPTER 6. GRAPHING LINEAR INEQUALITIES; INTRODUCTION TO PROBABILITY
390 www.ck12.org
No solutions
Consider the inequality x−5(> x+6)
This simplifies to −5 > 6
This statements is not true for any value of x . We say that this inequality has no solution.
Discrete solutions
So far we have assumed that the variables in our inequalities are real numbers. However, in many real life situationswe are trying to solve for variables that represent integer quantities, such as number of people, number of cars ornumber of ties.
Example 4
Raul is buying ties and he wants to spend $200 or less on his purchase. The ties he likes the best cost $50. Howmany ties could he purchase?
Solution
Let x = the number of ties Raul purchases.
We can write an inequality that describes the purchase amount using the formula.
(number of ties) × (price of a tie)≤ $200 or 50x≤ 200
We simplify our answer. x≤ 4
This solution says that Raul bought four or less ties. Since ties are discrete objects, the solution set consists of fivenumbers 0,1,2,3,4 .
Solve Real-World Problems Using Inequalities
Sometimes solving a word problem involves using an inequality.
6.3. MULTI-STEP INEQUALITIES

www.ck12.org 391
Example 5
In order to get a bonus this month, Leon must sell at least 120 newspaper subscriptions. He sold 85 subscriptions inthe first three weeks of the month. How many subscriptions must Leon sell in the last week of the month?
Solution
Step 1
We know that Leon sold 85 subscriptions and he must sell at least 120 subscriptions.
We want to know the least amount of subscriptions he must sell to get his bonus.
Let x = the number of subscriptions Leon sells in the last week of the month.
Step 2
The number of subscriptions per month must be greater than 120.
We write
85+ x≥ 120
Step 3
We solve the inequality by subtracting 85 from both sides x≥ 35
Answer Leon must sell 35 or more subscriptions in the last week to get his bonus.
Step 4:
To check the answer, we see that 85+ 35 = 120 . If he sells 35 or more subscriptions the number of subscriptionssold that month will be 120 or more.
Example 6
Virena’s Scout Troup is trying to raise at least $650 this spring. How many boxes of cookies must they sell at $4.50per box in order to reach their goal?
Solution
Step 1
Virena is trying to raise at least $650
CHAPTER 6. GRAPHING LINEAR INEQUALITIES; INTRODUCTION TO PROBABILITY
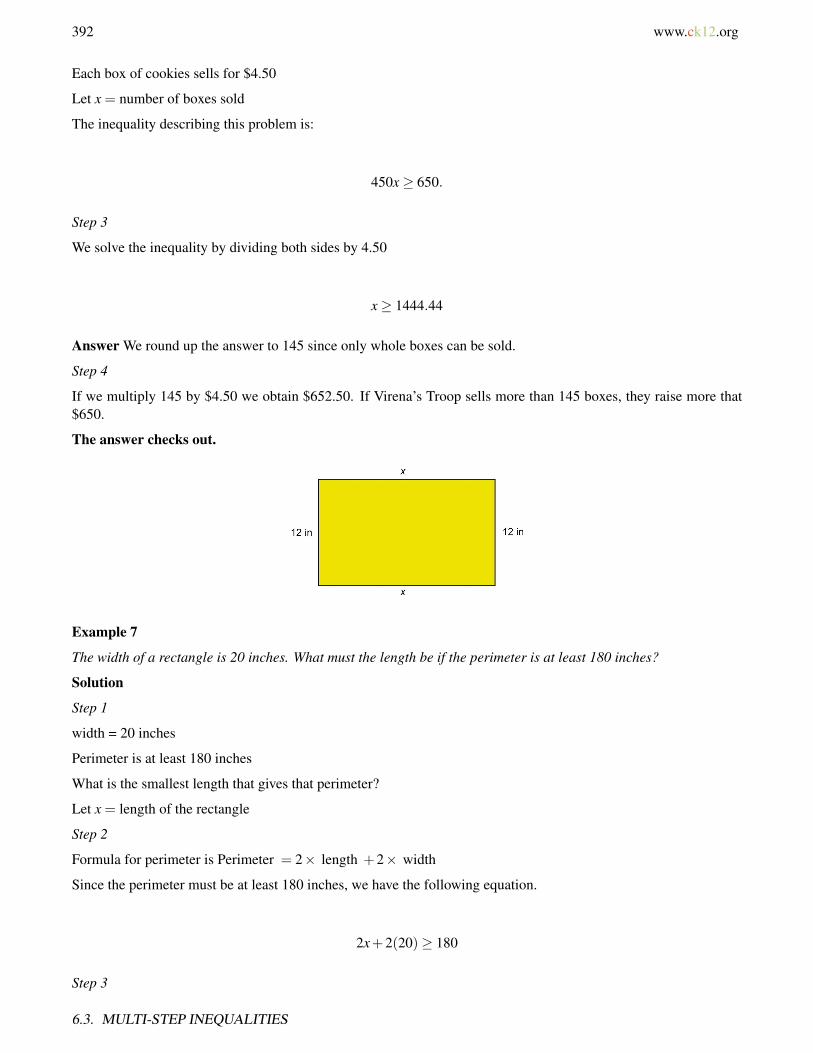
392 www.ck12.org
Each box of cookies sells for $4.50
Let x = number of boxes sold
The inequality describing this problem is:
450x≥ 650.
Step 3
We solve the inequality by dividing both sides by 4.50
x≥ 1444.44
Answer We round up the answer to 145 since only whole boxes can be sold.
Step 4
If we multiply 145 by $4.50 we obtain $652.50. If Virena’s Troop sells more than 145 boxes, they raise more that$650.
The answer checks out.
Example 7
The width of a rectangle is 20 inches. What must the length be if the perimeter is at least 180 inches?
Solution
Step 1
width = 20 inches
Perimeter is at least 180 inches
What is the smallest length that gives that perimeter?
Let x = length of the rectangle
Step 2
Formula for perimeter is Perimeter = 2× length +2× width
Since the perimeter must be at least 180 inches, we have the following equation.
2x+2(20)≥ 180
Step 3
6.3. MULTI-STEP INEQUALITIES

www.ck12.org 393
We solve the inequality.
Simplify.
2x+40≥ 180
Subtract 40 from both sides.
2x≥ 140
Divide both sides by 2.
x≥ 70
Answer The length must be at least 70 inches.
Step 4
If the length is at least 70 inches and the width is 20 inches, then the perimeter can be found by using this equation.
2(70)+2(20) = 180 inches
The answer check out.
Lesson Summary
• The general procedure for solving multi-step inequalities is as follows.
a. Clear parentheses on both sides of the inequality and collect like terms.b. Add or subtract terms so the variable is on one side and the constant is on the other side of the inequality sign.c. Multiply and divide by whatever constants are attached to the variable. Remember to change the direction of
the inequality if you multiply or divide by a negative number.
• Inequalities can have multiple solutions, no solutions, or discrete solutions.
Review Questions
Solve the following inequalities and give the solution in set notation and show the solution graph.
1. 4x+3 <−12. 2x < 7x−363. 5x > 8x+274. 5− x < 9+ x
CHAPTER 6. GRAPHING LINEAR INEQUALITIES; INTRODUCTION TO PROBABILITY

394 www.ck12.org
5. 4−6x≤ 2(2x+3)6. 5(4x+3)≥ 9(x−2)− x7. 2(2x−1)+3 < 5(x+3)−2x8. 8x−5(4x+1)≥−1+2(4x−3)9. 2(7x−2)−3(x+2)< 4x− (3x+4)
10. 23 x− 1
2(4x−1)≥ x+2(x−3)11. At the San Diego Zoo, you can either pay $22.75 for the entrance fee or $71 for the yearly pass which entitles
you to unlimited admission. At most how many times can you enter the zoo for the $22.75 entrance fee beforespending more than the cost of a yearly membership?
12. Proteek’s scores for four tests were 82, 95, 86 and 88. What will he have to score on his last test to average atleast 90 for the term?
Review Answers
1. x | x is a real number, x <−1
2. x | x is a real number, x > 365
3. x | x is a real number, x <−9
4. x | x is a real number, x >−2
5. x | x is a real number, x≥−15
6. x | x is a real number, x≥−3312
7. x | x is a real number, x < 14
8. x | x is a real number, x≤ 110
9. x | x is a real number, x < 35
6.3. MULTI-STEP INEQUALITIES

www.ck12.org 395
10. x | x is a real number, x≤ 32
11. At most 3 times.12. At least 99.
CHAPTER 6. GRAPHING LINEAR INEQUALITIES; INTRODUCTION TO PROBABILITY

396 www.ck12.org
6.4 Compound Inequalities
Learning Objectives
• Write and graph compound inequalities on a number line.• Solve a compound inequality with “and”.• Solve a compound inequality with “or”.• Solve compound inequalities using a graphing calculator (TI family).• Solve real-world problems using compound inequalities
Introduction
In this section, we will solve compound inequalities. In previous sections, we obtained solutions that gave thevariable either as greater than or as less than a number. In this section we are looking for solutions where thevariable can be in two or more intervals on the number line.
There are two types of compound inequalities:
1. Inequalities joined by the word “and”.
The solution is a set of values greater than a number and less than another number.
a < x < b
In this case we want values of the variable for which both inequalities are true.
2. Inequalities joined by the word “or”.
The solution is a set of values greater than a number or less than another number.
x < a or x > b
In this case, we want values for the variable in which at least one of the inequalities is true.
Write and Graph Compound Inequalities on a Number Line
Example 1
Write the inequalities represented by the following number line graphs.
a)
6.4. COMPOUND INEQUALITIES
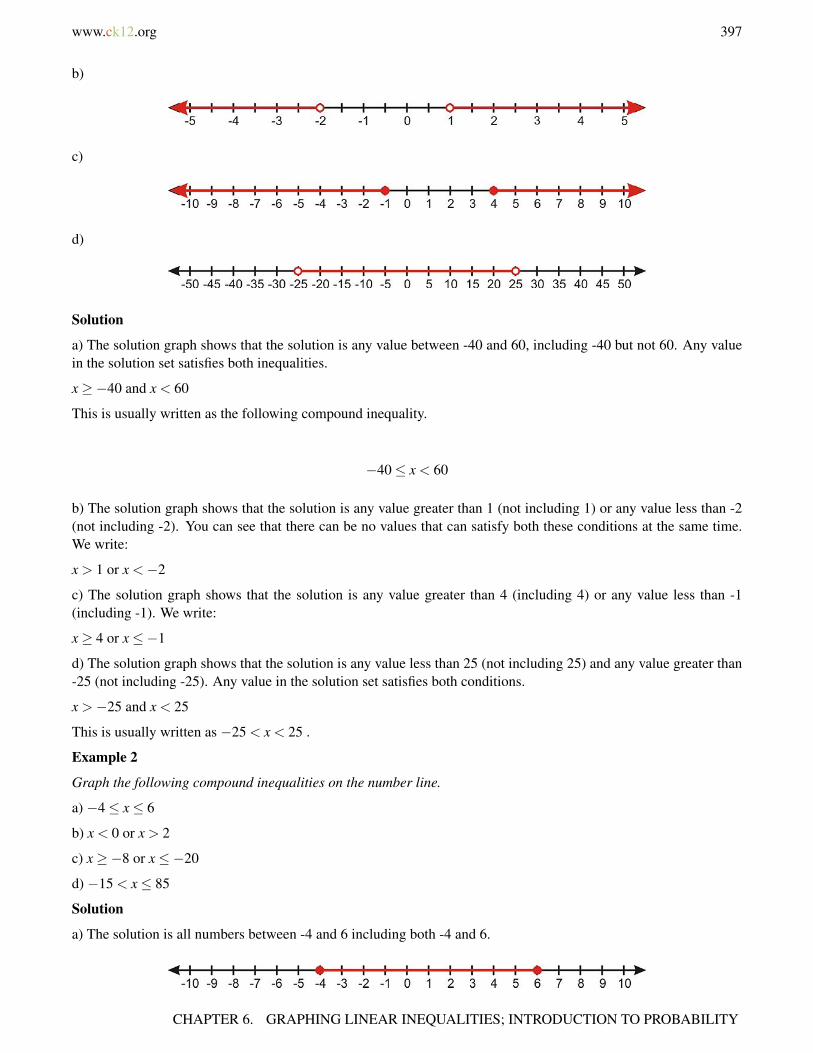
www.ck12.org 397
b)
c)
d)
Solution
a) The solution graph shows that the solution is any value between -40 and 60, including -40 but not 60. Any valuein the solution set satisfies both inequalities.
x≥−40 and x < 60
This is usually written as the following compound inequality.
−40≤ x < 60
b) The solution graph shows that the solution is any value greater than 1 (not including 1) or any value less than -2(not including -2). You can see that there can be no values that can satisfy both these conditions at the same time.We write:
x > 1 or x <−2
c) The solution graph shows that the solution is any value greater than 4 (including 4) or any value less than -1(including -1). We write:
x≥ 4 or x≤−1
d) The solution graph shows that the solution is any value less than 25 (not including 25) and any value greater than-25 (not including -25). Any value in the solution set satisfies both conditions.
x >−25 and x < 25
This is usually written as −25 < x < 25 .
Example 2
Graph the following compound inequalities on the number line.
a) −4≤ x≤ 6
b) x < 0 or x > 2
c) x≥−8 or x≤−20
d) −15 < x≤ 85
Solution
a) The solution is all numbers between -4 and 6 including both -4 and 6.
CHAPTER 6. GRAPHING LINEAR INEQUALITIES; INTRODUCTION TO PROBABILITY
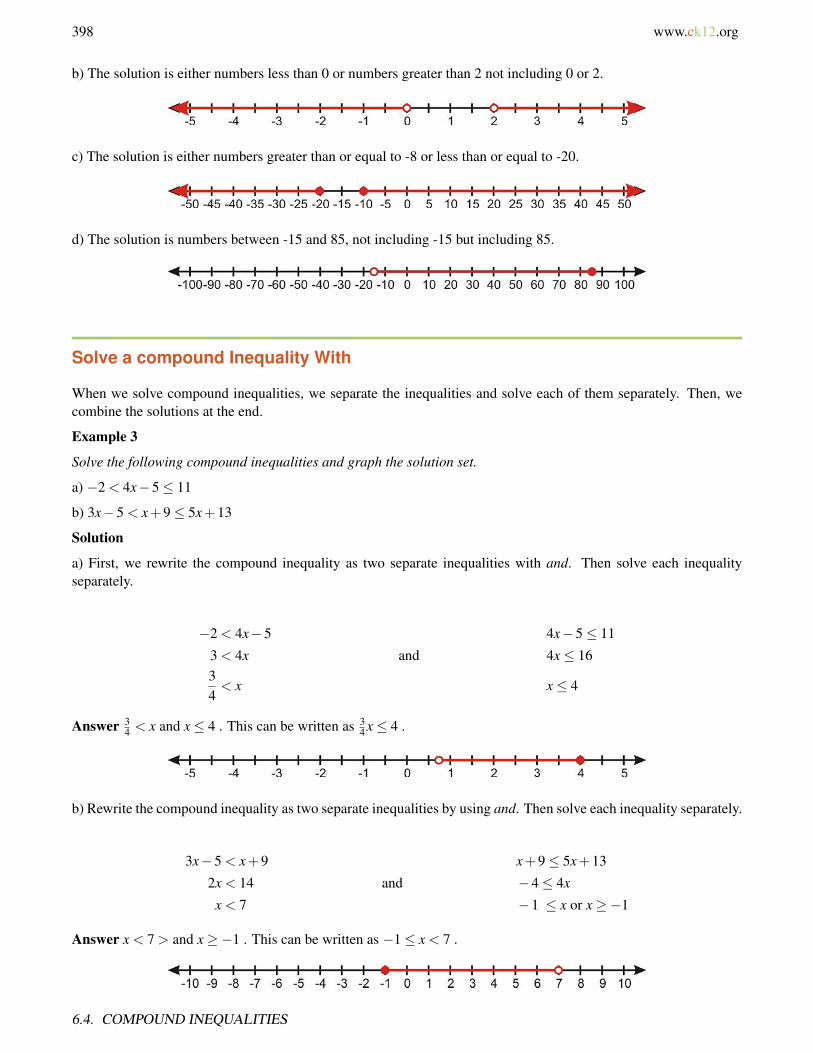
398 www.ck12.org
b) The solution is either numbers less than 0 or numbers greater than 2 not including 0 or 2.
c) The solution is either numbers greater than or equal to -8 or less than or equal to -20.
d) The solution is numbers between -15 and 85, not including -15 but including 85.
Solve a compound Inequality With
When we solve compound inequalities, we separate the inequalities and solve each of them separately. Then, wecombine the solutions at the end.
Example 3
Solve the following compound inequalities and graph the solution set.
a) −2 < 4x−5≤ 11
b) 3x−5 < x+9≤ 5x+13
Solution
a) First, we rewrite the compound inequality as two separate inequalities with and. Then solve each inequalityseparately.
−2 < 4x−5 4x−5≤ 11
3 < 4x and 4x≤ 1634< x x≤ 4
Answer 34 < x and x≤ 4 . This can be written as 3
4 x≤ 4 .
b) Rewrite the compound inequality as two separate inequalities by using and. Then solve each inequality separately.
3x−5 < x+9 x+9≤ 5x+13
2x < 14 and −4≤ 4x
x < 7 −1 ≤ x or x≥−1
Answer x < 7 > and x≥−1 . This can be written as −1≤ x < 7 .
6.4. COMPOUND INEQUALITIES

www.ck12.org 399
Solve a Compound Inequality With “or”
Consider the following example.
Example 4
Solve the following compound inequalities and graph the solution set.
a) 9−2x≤ 3 or 3x+10≤ 6− x
b) x−26 ≤ 2x−4 or x−2
6 > x+5
Solution
a) Solve each inequality separately.
9−2x≤ 3 3x+10≤ 6− x
−2x≤−6 or 4x≤−4
x≥ 3 x≤−1
Answer x≥ 3 or x≤−1
b) Solve each inequality separately.
x−26≤ 2x−4
x−26
> x+5
x−2≤ 6(2x−4) x−2 > 6(x+5)
x−2≤ 12x−24 or x−2 > 6x+30
22≤ 11x −32 > 5x
2≤ x −6.4 > x
Answer x≥ 2 or x <−64
Solve Compound Inequalities Using a Graphing Calculator (TI-83/84 family)
This section explains how to solve simple and compound inequalities with a graphing calculator.
Example 5
Solve the following inequalities using the graphing calculator.
a) 5x+2(x−3)≥ 2
b) 7x−2 < 10x+1 < 9x+5
c) 3x+2≤ 10 or 3x+2≥ 15
CHAPTER 6. GRAPHING LINEAR INEQUALITIES; INTRODUCTION TO PROBABILITY
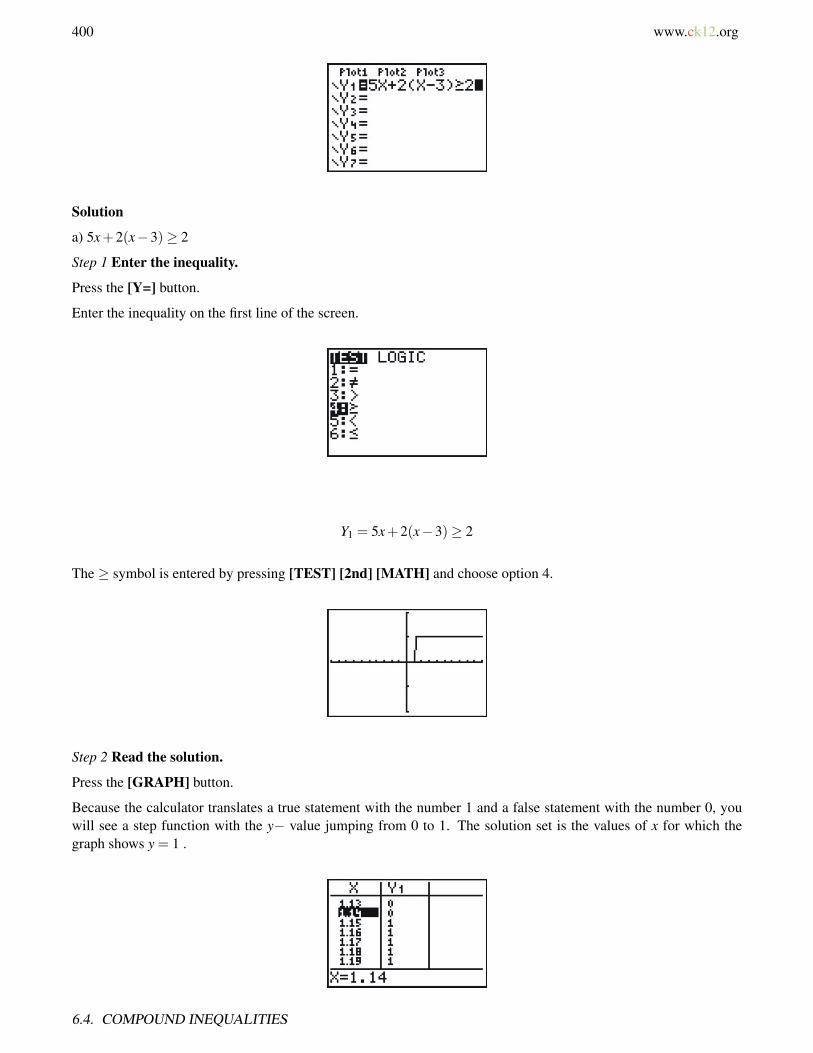
400 www.ck12.org
Solution
a) 5x+2(x−3)≥ 2
Step 1 Enter the inequality.
Press the [Y=] button.
Enter the inequality on the first line of the screen.
Y1 = 5x+2(x−3)≥ 2
The ≥ symbol is entered by pressing [TEST] [2nd] [MATH] and choose option 4.
Step 2 Read the solution.
Press the [GRAPH] button.
Because the calculator translates a true statement with the number 1 and a false statement with the number 0, youwill see a step function with the y− value jumping from 0 to 1. The solution set is the values of x for which thegraph shows y = 1 .
6.4. COMPOUND INEQUALITIES
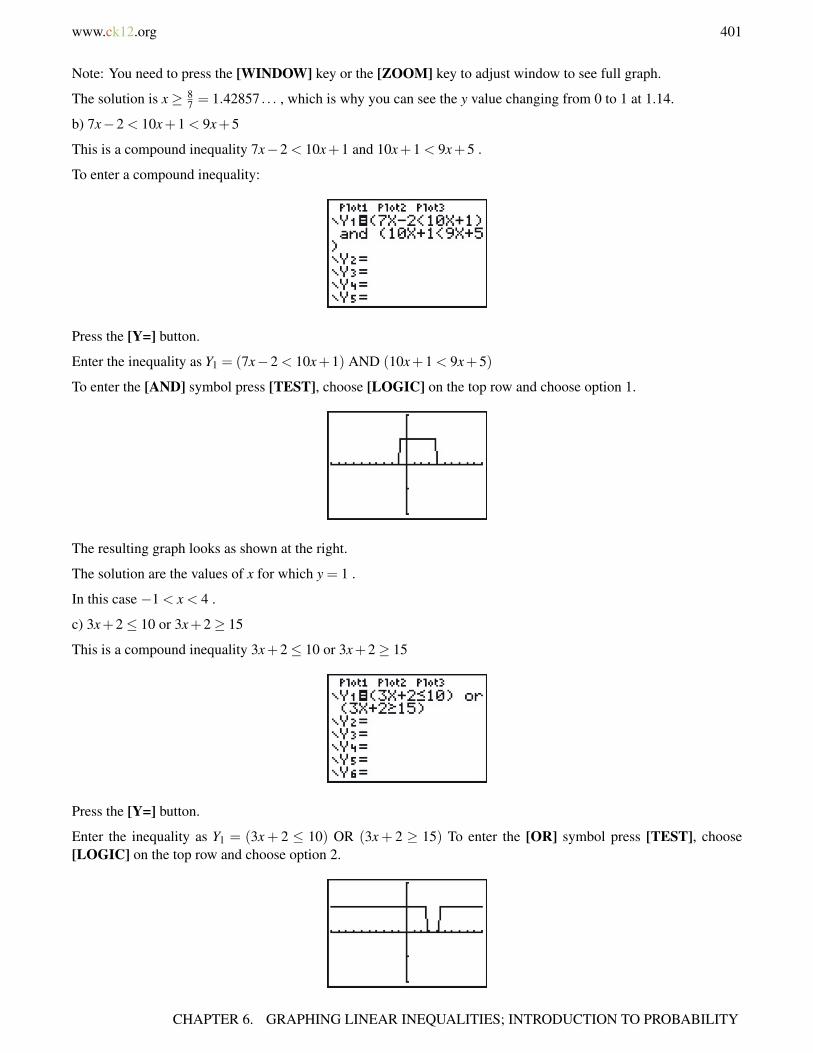
www.ck12.org 401
Note: You need to press the [WINDOW] key or the [ZOOM] key to adjust window to see full graph.
The solution is x≥ 87 = 1.42857 . . . , which is why you can see the y value changing from 0 to 1 at 1.14.
b) 7x−2 < 10x+1 < 9x+5
This is a compound inequality 7x−2 < 10x+1 and 10x+1 < 9x+5 .
To enter a compound inequality:
Press the [Y=] button.
Enter the inequality as Y1 = (7x−2 < 10x+1) AND (10x+1 < 9x+5)
To enter the [AND] symbol press [TEST], choose [LOGIC] on the top row and choose option 1.
The resulting graph looks as shown at the right.
The solution are the values of x for which y = 1 .
In this case −1 < x < 4 .
c) 3x+2≤ 10 or 3x+2≥ 15
This is a compound inequality 3x+2≤ 10 or 3x+2≥ 15
Press the [Y=] button.
Enter the inequality as Y1 = (3x + 2 ≤ 10) OR (3x + 2 ≥ 15) To enter the [OR] symbol press [TEST], choose[LOGIC] on the top row and choose option 2.
CHAPTER 6. GRAPHING LINEAR INEQUALITIES; INTRODUCTION TO PROBABILITY
402 www.ck12.org
The resulting graph looks as shown at the right. The solution are the values of x for which y = 1 . In this case,x≤ 2.7 or x≥ 4.3 .
Solve Real-World Problems Using Compound Inequalities
Many application problems require the use of compound inequalities to find the solution.
Example 6
The speed of a golf ball in the air is given by the formula v =−32t +80 , where t is the time since the ball was hit.When is the ball traveling between 20 ft/sec and 30 ft/sec?
Solution
Step 1
We want to find the times when the ball is traveling between 20 ft/sec and 30 ft/sec.
Step 2
Set up the inequality 20≤ v≤ 30
Step 3
Replace the velocity with the formula v =−32t +80 .
20≤−32t +80≤ 30
Separate the compound inequality and solve each separate inequality.
20≤−32t +80 −32t +80≤ 30
32t ≤ 60 and 50≤ 32t
t ≤ 1.875 1.56≤ t
Answer 1.56≤ t ≤ 1.875
Step 4 To check plug in the minimum and maximum values of t into the formula for the speed.
For t = 1.56,v =−32t +80 =−32(1.56)+80 = 30 f t/sec
6.4. COMPOUND INEQUALITIES

www.ck12.org 403
For t = 1.875,v =−32t +80 =−32(1.875)+80 = 20 f t/sec
So the speed is between 20 and 30ft/sec. The answer checks out.
Example 7
William’s pick-up truck gets between 18 to 22 miles per gallon of gasoline. His gas tank can hold 15 gallons ofgasoline. If he drives at an average speed of 40 miles per hour how much driving time does he get on a full tank ofgas?
Solution
Step 1 We know
The truck gets between 18 and 22 miles/gallon
There are 15 gallons in the truck’s gas tank
William drives at an average of 40 miles/hour
Let t = driving time
Step 2 We use dimensional analysis to get from time per tank to miles per gallon.
tXXXhours1XXXtank
× 1XXXtank15 gallons
× 40 miles1XXXhours
=40t45
milesgallon
Step 3 Since the truck gets between 18 to 22 miles/gallon, we set up the compound inequality.
18≤ 40t15≤ 22
Separate the compound inequality and solve each inequality separately.
18≤ 40t15
40t15≤ 22
270≤ 40t and 40t ≤ 330
6.75≤ t t ≤ 8.25
Answer 6.75≤ t ≤ 8.25 . Andrew can drive between 6.75 and 8.25 hours on a full tank of gas.
Step 4
For t = 6.75 , we get 40t15
40(6.75)15 = 18 miles per gallon.
For t = 8.25 , we get 40t15
40(8.25)15 = 18 miles per gallon.
CHAPTER 6. GRAPHING LINEAR INEQUALITIES; INTRODUCTION TO PROBABILITY
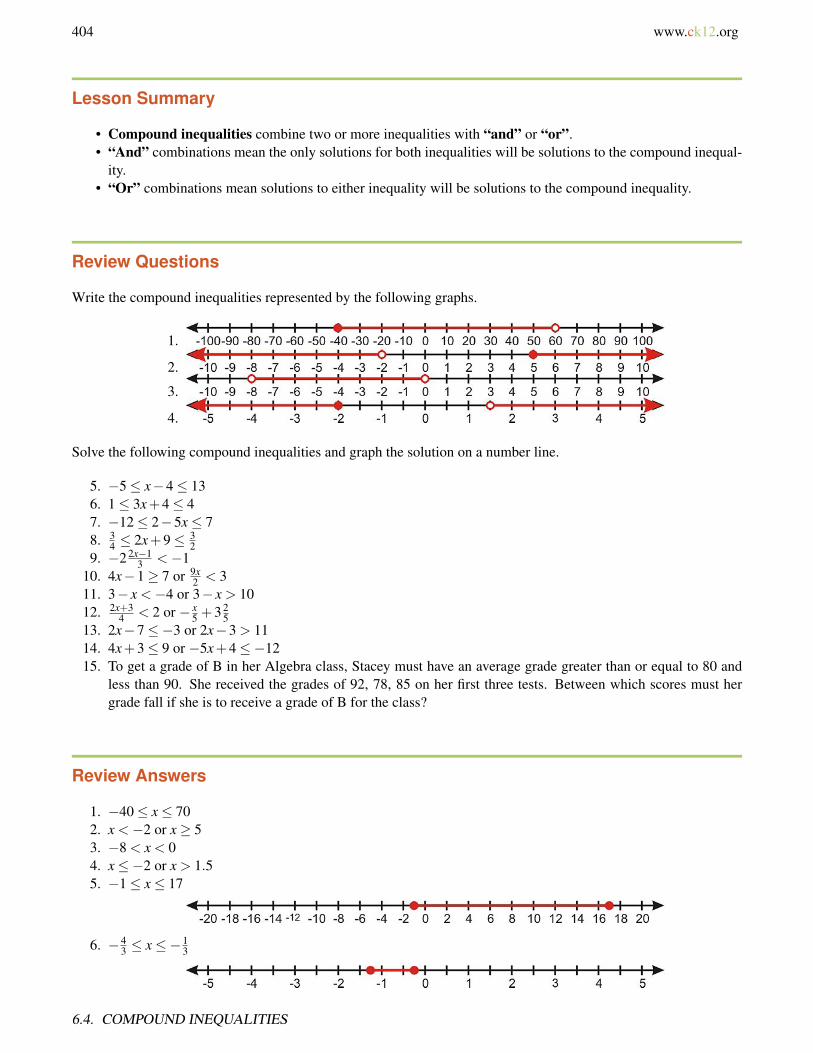
404 www.ck12.org
Lesson Summary
• Compound inequalities combine two or more inequalities with “and” or “or”.• “And” combinations mean the only solutions for both inequalities will be solutions to the compound inequal-
ity.• “Or” combinations mean solutions to either inequality will be solutions to the compound inequality.
Review Questions
Write the compound inequalities represented by the following graphs.
1.
2.
3.
4.
Solve the following compound inequalities and graph the solution on a number line.
5. −5≤ x−4≤ 136. 1≤ 3x+4≤ 47. −12≤ 2−5x≤ 78. 3
4 ≤ 2x+9≤ 32
9. −2 2x−13 <−1
10. 4x−1≥ 7 or 9x2 < 3
11. 3− x <−4 or 3− x > 1012. 2x+3
4 < 2 or − x5 +3 2
513. 2x−7≤−3 or 2x−3 > 1114. 4x+3≤ 9 or −5x+4≤−1215. To get a grade of B in her Algebra class, Stacey must have an average grade greater than or equal to 80 and
less than 90. She received the grades of 92, 78, 85 on her first three tests. Between which scores must hergrade fall if she is to receive a grade of B for the class?
Review Answers
1. −40≤ x≤ 702. x <−2 or x≥ 53. −8 < x < 04. x≤−2 or x > 1.55. −1≤ x≤ 17
6. −43 ≤ x≤−1
3
6.4. COMPOUND INEQUALITIES
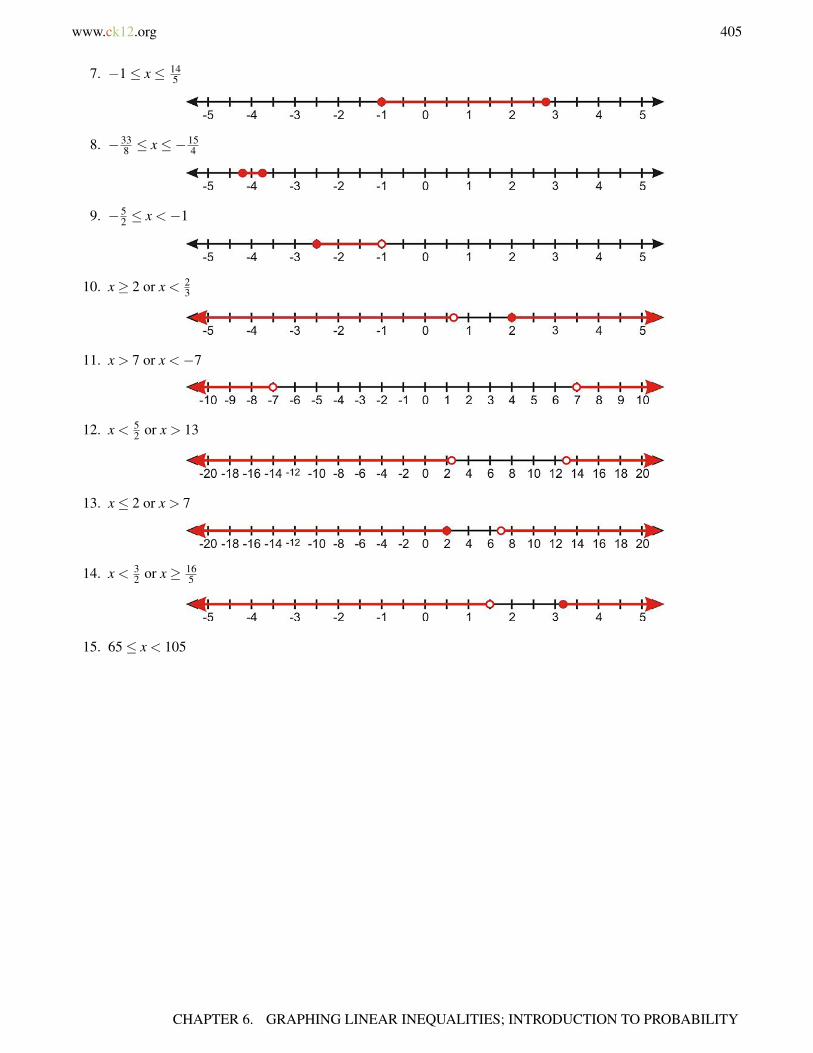
www.ck12.org 405
7. −1≤ x≤ 145
8. −338 ≤ x≤−15
4
9. −52 ≤ x <−1
10. x≥ 2 or x < 23
11. x > 7 or x <−7
12. x < 52 or x > 13
13. x≤ 2 or x > 7
14. x < 32 or x≥ 16
5
15. 65≤ x < 105
CHAPTER 6. GRAPHING LINEAR INEQUALITIES; INTRODUCTION TO PROBABILITY
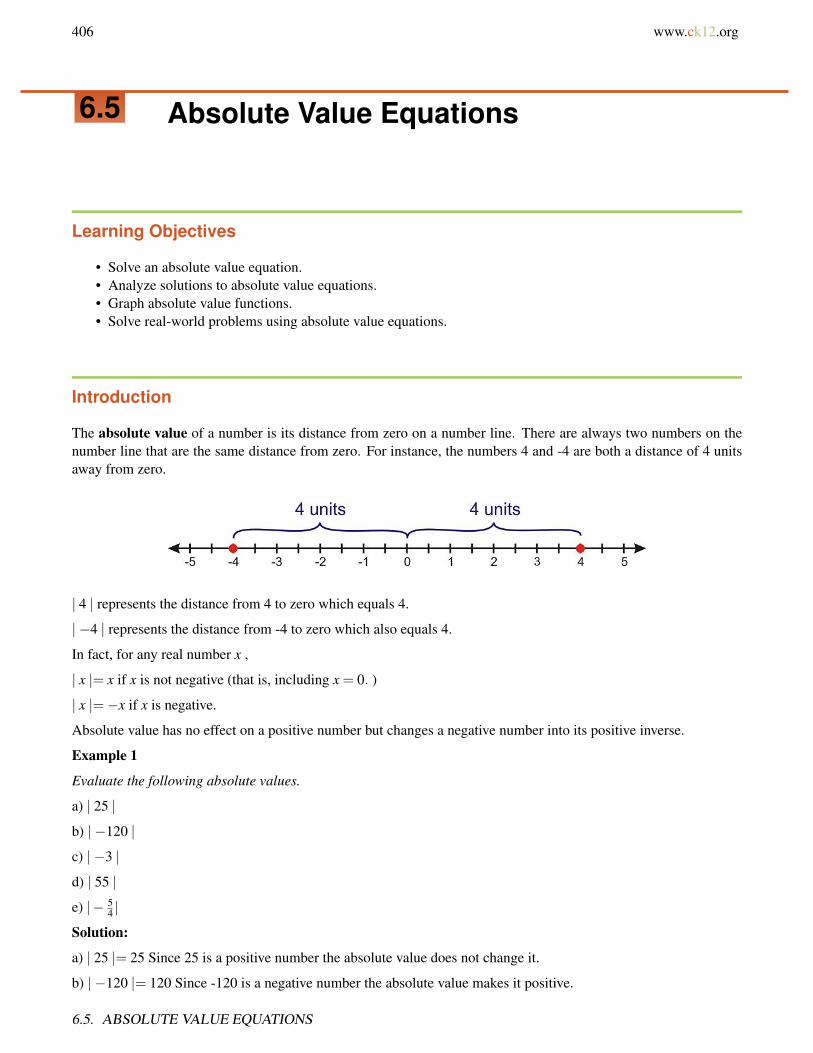
406 www.ck12.org
6.5 Absolute Value Equations
Learning Objectives
• Solve an absolute value equation.• Analyze solutions to absolute value equations.• Graph absolute value functions.• Solve real-world problems using absolute value equations.
Introduction
The absolute value of a number is its distance from zero on a number line. There are always two numbers on thenumber line that are the same distance from zero. For instance, the numbers 4 and -4 are both a distance of 4 unitsaway from zero.
| 4 | represents the distance from 4 to zero which equals 4.
| −4 | represents the distance from -4 to zero which also equals 4.
In fact, for any real number x ,
| x |= x if x is not negative (that is, including x = 0. )
| x |=−x if x is negative.
Absolute value has no effect on a positive number but changes a negative number into its positive inverse.
Example 1
Evaluate the following absolute values.
a) | 25 |
b) | −120 |
c) | −3 |
d) | 55 |
e) |− 54 |
Solution:
a) | 25 |= 25 Since 25 is a positive number the absolute value does not change it.
b) | −120 |= 120 Since -120 is a negative number the absolute value makes it positive.
6.5. ABSOLUTE VALUE EQUATIONS

www.ck12.org 407
c) | −3 |= 3 Since -3 is a negative number the absolute value makes it positive.
d) | 55 |= 55 Since 55 is a positive number the absolute value does not change it.
e) |− 54 |=
54 Since is a negative number the absolute value makes it positive.
Absolute value is very useful in finding the distance between two points on the number line. The distance betweenany two points a and b on the number line is | a−b | or | b−a | .
For example, the distance from 3 to -1 on the number line is | 3− (−1) |=| 4 |= 4 .
We could have also found the distance by subtracting in the reverse order, | −1−3 |=| −4 |= 4 .
This makes sense because the distance is the same whether you are going from 3 to -1 or from -1 to 3.
Example 2
Find the distance between the following points on the number line.
a) 6 and 15
b) -5 and 8
c) -3 and -12
Solutions
Distance is the absolute value of the difference between the two points.
a) Distance =| 6−15 |=| −9 |= 9
b) Distance =| −5−8 |=| −13 |= 13
c) Distance =| −3− (−12) |=| 9 |= 9
Remember: When we computed the change in x and the change in y as part of the slope computation, these valueswere positive or negative, depending on the direction of movement. In this discussion, “distance” means a positivedistance only.
Solve an Absolute Value Equation
We now want to solve equations involving absolute values. Consider the following equation.
| x |= 8
This means that the distance from the number x to zero is 8. There are two possible numbers that satisfy thiscondition 8 and -8.
When we solve absolute value equations we always consider 4 two possibilities.
CHAPTER 6. GRAPHING LINEAR INEQUALITIES; INTRODUCTION TO PROBABILITY
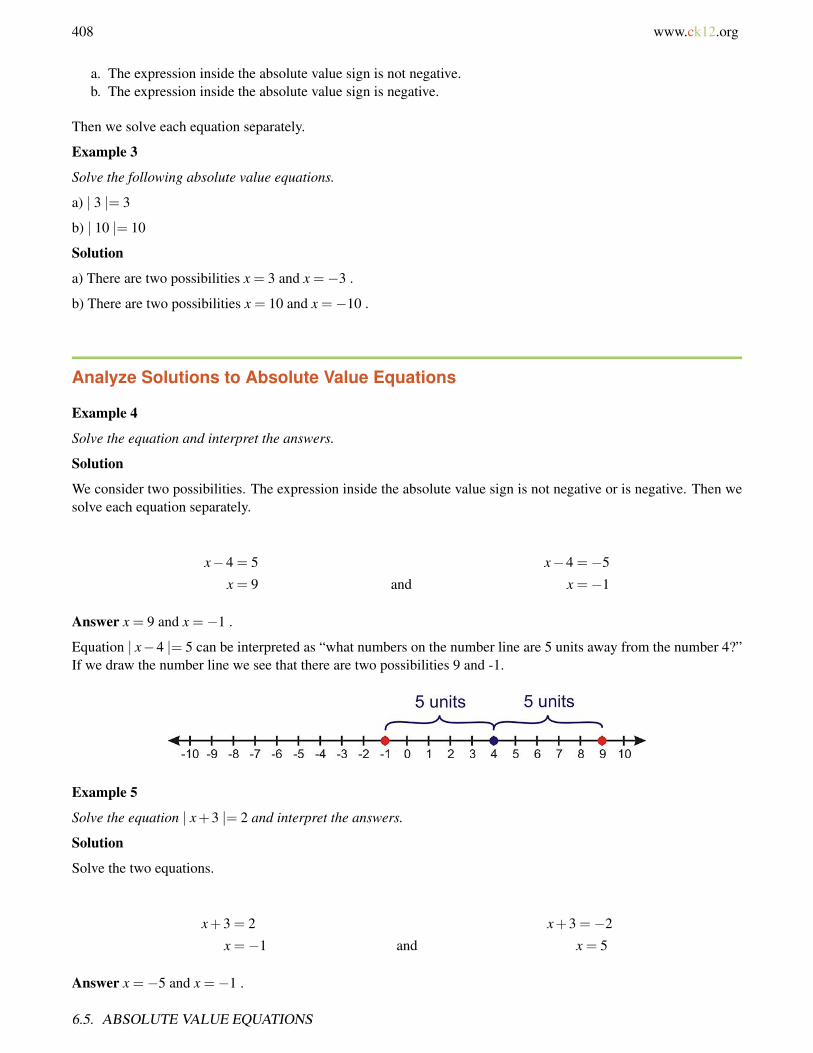
408 www.ck12.org
a. The expression inside the absolute value sign is not negative.b. The expression inside the absolute value sign is negative.
Then we solve each equation separately.
Example 3
Solve the following absolute value equations.
a) | 3 |= 3
b) | 10 |= 10
Solution
a) There are two possibilities x = 3 and x =−3 .
b) There are two possibilities x = 10 and x =−10 .
Analyze Solutions to Absolute Value Equations
Example 4
Solve the equation and interpret the answers.
Solution
We consider two possibilities. The expression inside the absolute value sign is not negative or is negative. Then wesolve each equation separately.
x−4 = 5 x−4 =−5
x = 9 and x =−1
Answer x = 9 and x =−1 .
Equation | x−4 |= 5 can be interpreted as “what numbers on the number line are 5 units away from the number 4?”If we draw the number line we see that there are two possibilities 9 and -1.
Example 5
Solve the equation | x+3 |= 2 and interpret the answers.
Solution
Solve the two equations.
x+3 = 2 x+3 =−2
x =−1 and x = 5
Answer x =−5 and x =−1 .
6.5. ABSOLUTE VALUE EQUATIONS

www.ck12.org 409
Equation | x+ 3 |= 2 can be re-written as | x− (−3) |= 2 . We can interpret this as “what numbers on the numberline are 2 units away from -3?” There are two possibilities -5 and -1.
Example 6
Solve the equation | 2x−7 |= 6 and interpret the answers.
Solution
Solve the two equations.
2x−7 =−6 2x−7 = 6
2x = 13 and 2x = 1
x =132
x =12
Answer x = 132 and x = 1
2
The interpretation of this problem is clearer if the equation | 2x−7 |= 6 was divided by 2 on both sides. We obtain|x− 7
2 |= 3 . The question is “What numbers on the number line are 3 units away from 72 ?” There are two possibilities
132 and 1
2 .
Graph Absolute Value Functions
You will now learn how to graph absolute value functions. Consider the function:
y =| x−1 |
Let’s graph this function by making a table of values.
TABLE 6.1:
x y =| x−1 |−2 y =| −2−1 |=| −3 |= 3-1 y =| −1−1 |=| −2 |= 20 y =| 0−1 |=| −1 |= 11 y =| 1−1 |=| 0 |= 02 y =| 2−1 |=| 1 |= 13 y =| 3−1 |=| 2 |= 24 y =| 4−1 |=| 3 |= 3
CHAPTER 6. GRAPHING LINEAR INEQUALITIES; INTRODUCTION TO PROBABILITY
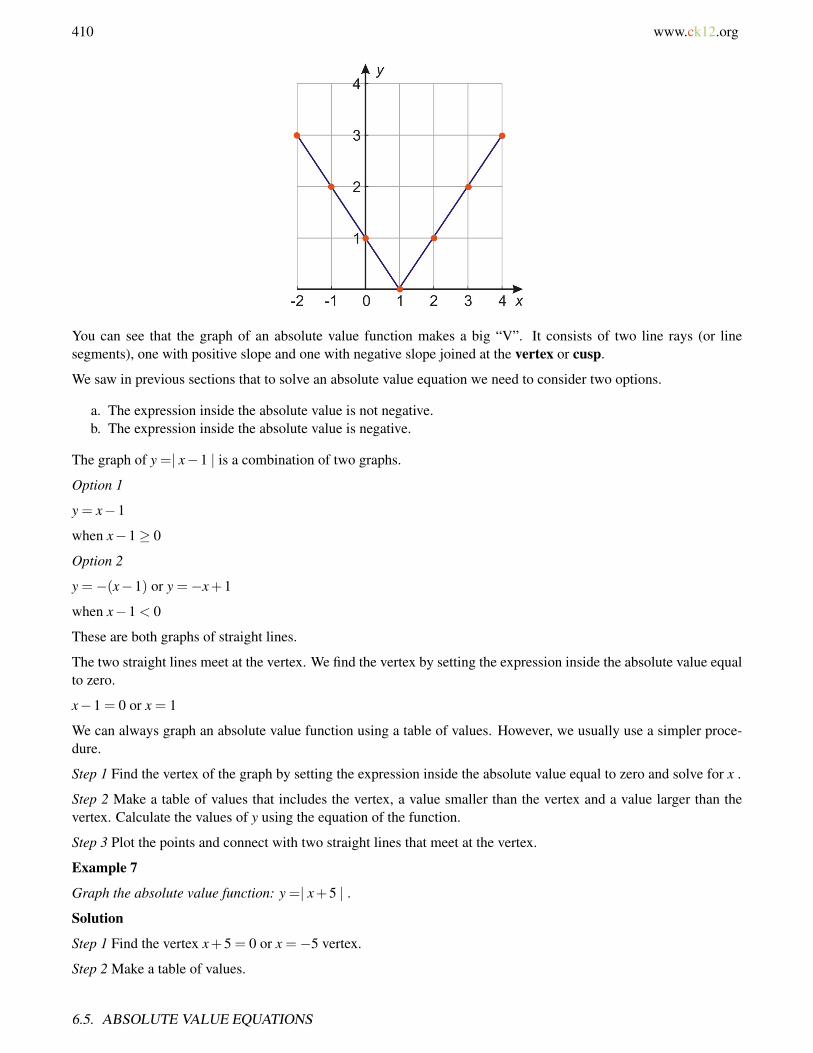
410 www.ck12.org
You can see that the graph of an absolute value function makes a big “V”. It consists of two line rays (or linesegments), one with positive slope and one with negative slope joined at the vertex or cusp.
We saw in previous sections that to solve an absolute value equation we need to consider two options.
a. The expression inside the absolute value is not negative.b. The expression inside the absolute value is negative.
The graph of y =| x−1 | is a combination of two graphs.
Option 1
y = x−1
when x−1≥ 0
Option 2
y =−(x−1) or y =−x+1
when x−1 < 0
These are both graphs of straight lines.
The two straight lines meet at the vertex. We find the vertex by setting the expression inside the absolute value equalto zero.
x−1 = 0 or x = 1
We can always graph an absolute value function using a table of values. However, we usually use a simpler proce-dure.
Step 1 Find the vertex of the graph by setting the expression inside the absolute value equal to zero and solve for x .
Step 2 Make a table of values that includes the vertex, a value smaller than the vertex and a value larger than thevertex. Calculate the values of y using the equation of the function.
Step 3 Plot the points and connect with two straight lines that meet at the vertex.
Example 7
Graph the absolute value function: y =| x+5 | .
Solution
Step 1 Find the vertex x+5 = 0 or x =−5 vertex.
Step 2 Make a table of values.
6.5. ABSOLUTE VALUE EQUATIONS
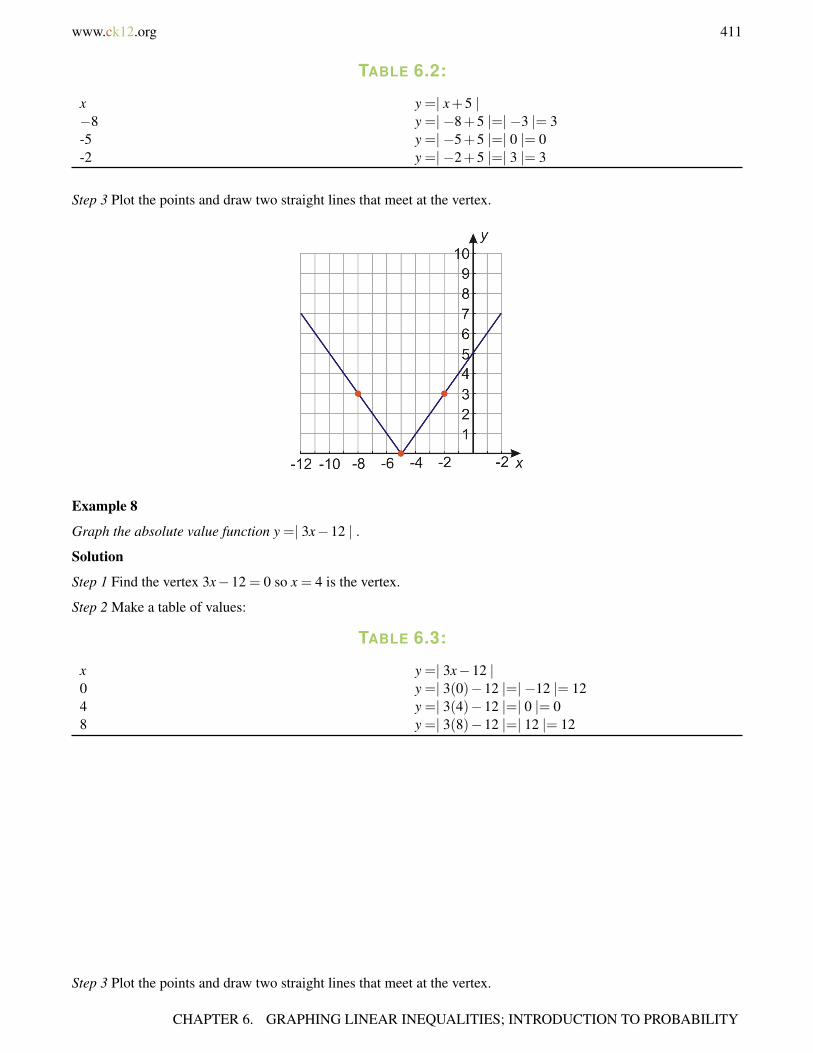
www.ck12.org 411
TABLE 6.2:
x y =| x+5 |−8 y =| −8+5 |=| −3 |= 3-5 y =| −5+5 |=| 0 |= 0-2 y =| −2+5 |=| 3 |= 3
Step 3 Plot the points and draw two straight lines that meet at the vertex.
Example 8
Graph the absolute value function y =| 3x−12 | .
Solution
Step 1 Find the vertex 3x−12 = 0 so x = 4 is the vertex.
Step 2 Make a table of values:
TABLE 6.3:
x y =| 3x−12 |0 y =| 3(0)−12 |=| −12 |= 124 y =| 3(4)−12 |=| 0 |= 08 y =| 3(8)−12 |=| 12 |= 12
Step 3 Plot the points and draw two straight lines that meet at the vertex.
CHAPTER 6. GRAPHING LINEAR INEQUALITIES; INTRODUCTION TO PROBABILITY

412 www.ck12.org
Solve Real-World Problems Using Absolute Value Equations
Example 9
A company packs coffee beans in airtight bags. Each bag should weigh 16 ounces but it is hard to fill each bag to theexact weight. After being filled, each bag is weighed and if it is more than 0.25 ounces overweight or underweight itis emptied and repacked. What are the lightest and heaviest acceptable bags?
Solution
Step 1
We know that each bag should weigh 16 ounces.
A bag can weigh 0.25 ounces more or less than 16 ounces.
We need to find the lightest and heaviest bags that are acceptable.
Let x = weight of the coffee bag in ounces.
Step 2
The equation that describes this problem is written as | x−16 | 0.25 .
Step 3
Consider the positive and negative options and solve each equation separately.
6.5. ABSOLUTE VALUE EQUATIONS
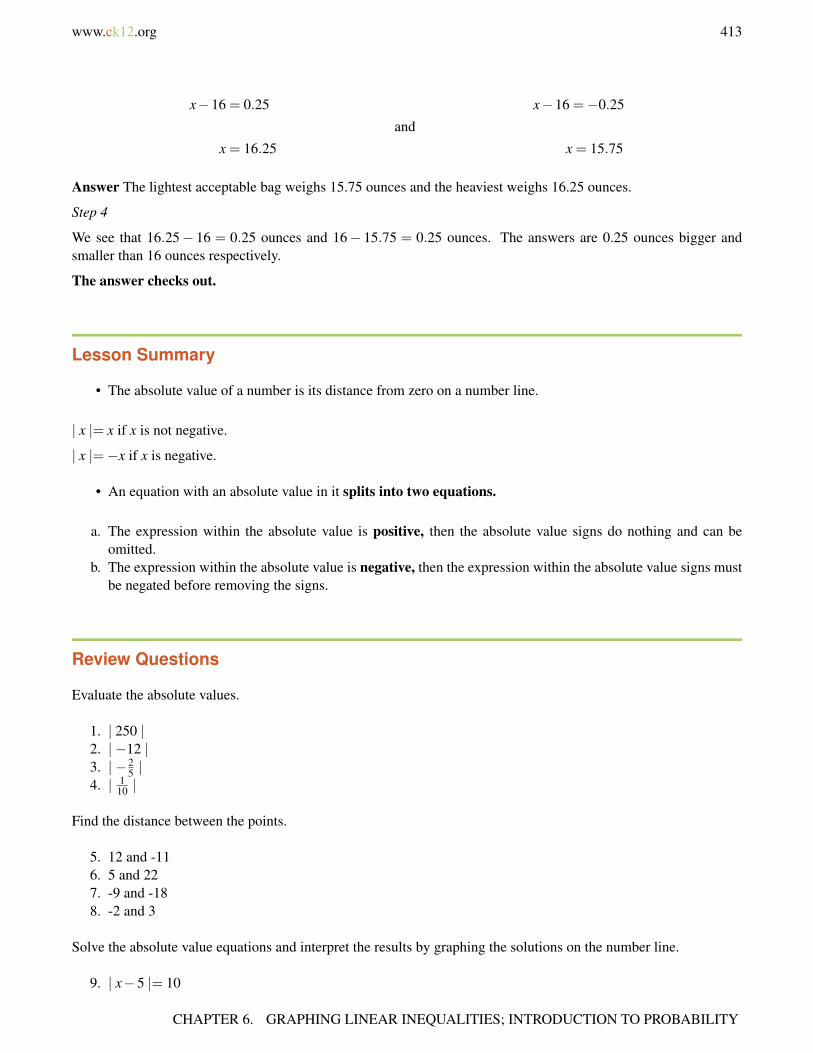
www.ck12.org 413
x−16 = 0.25 x−16 =−0.25
and
x = 16.25 x = 15.75
Answer The lightest acceptable bag weighs 15.75 ounces and the heaviest weighs 16.25 ounces.
Step 4
We see that 16.25− 16 = 0.25 ounces and 16− 15.75 = 0.25 ounces. The answers are 0.25 ounces bigger andsmaller than 16 ounces respectively.
The answer checks out.
Lesson Summary
• The absolute value of a number is its distance from zero on a number line.
| x |= x if x is not negative.
| x |=−x if x is negative.
• An equation with an absolute value in it splits into two equations.
a. The expression within the absolute value is positive, then the absolute value signs do nothing and can beomitted.
b. The expression within the absolute value is negative, then the expression within the absolute value signs mustbe negated before removing the signs.
Review Questions
Evaluate the absolute values.
1. | 250 |2. | −12 |3. | −2
5 |4. | 1
10 |
Find the distance between the points.
5. 12 and -116. 5 and 227. -9 and -188. -2 and 3
Solve the absolute value equations and interpret the results by graphing the solutions on the number line.
9. | x−5 |= 10
CHAPTER 6. GRAPHING LINEAR INEQUALITIES; INTRODUCTION TO PROBABILITY
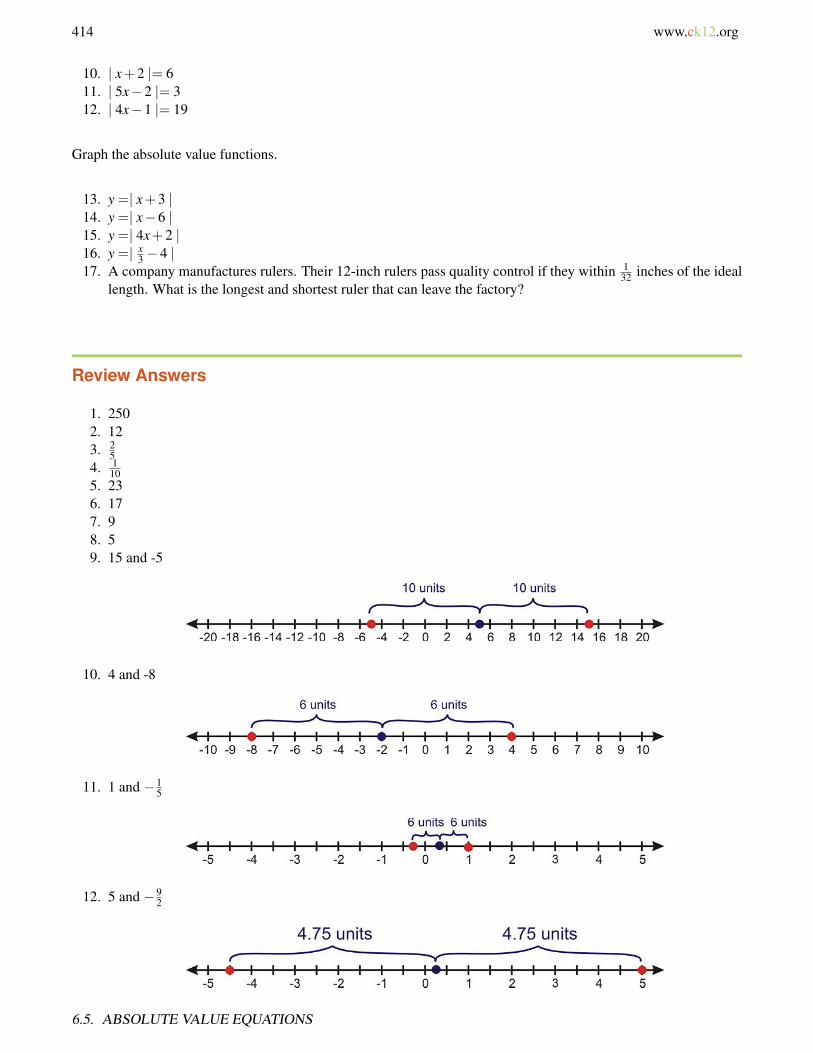
414 www.ck12.org
10. | x+2 |= 611. | 5x−2 |= 312. | 4x−1 |= 19
Graph the absolute value functions.
13. y =| x+3 |14. y =| x−6 |15. y =| 4x+2 |16. y =| x
3 −4 |17. A company manufactures rulers. Their 12-inch rulers pass quality control if they within 1
32 inches of the ideallength. What is the longest and shortest ruler that can leave the factory?
Review Answers
1. 2502. 123. 2
54. 1
105. 236. 177. 98. 59. 15 and -5
10. 4 and -8
11. 1 and −15
12. 5 and −92
6.5. ABSOLUTE VALUE EQUATIONS
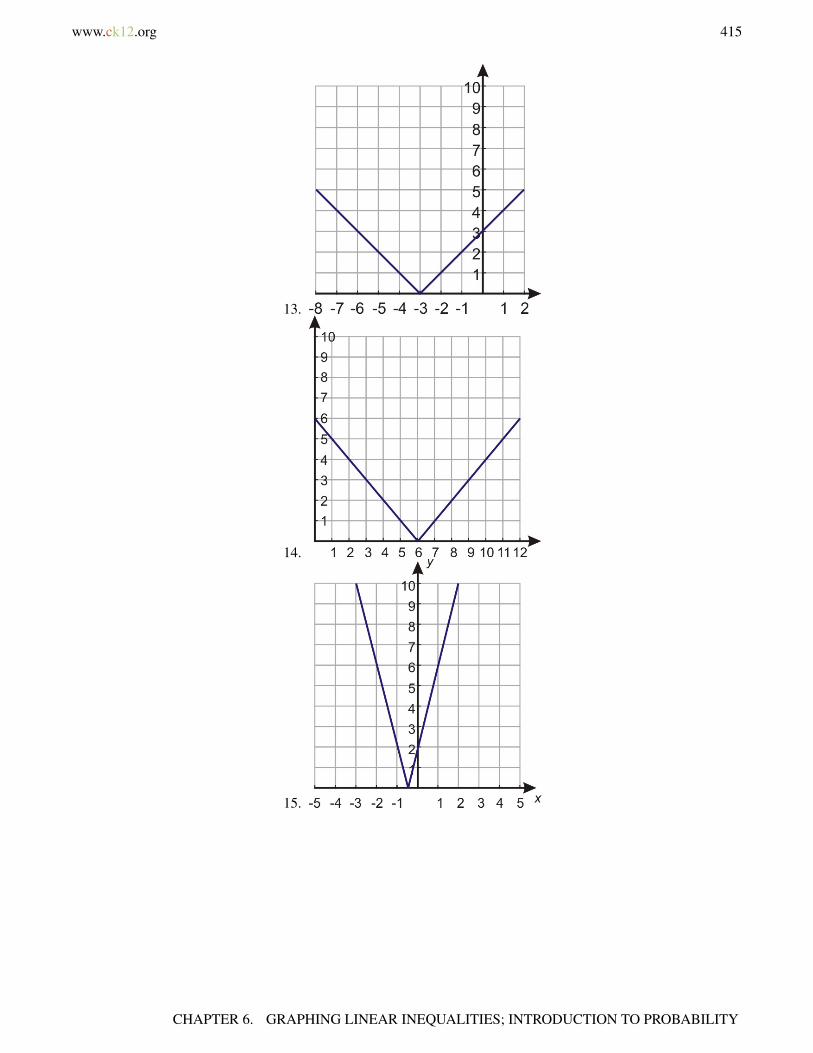
www.ck12.org 415
13.
14.
15.
CHAPTER 6. GRAPHING LINEAR INEQUALITIES; INTRODUCTION TO PROBABILITY
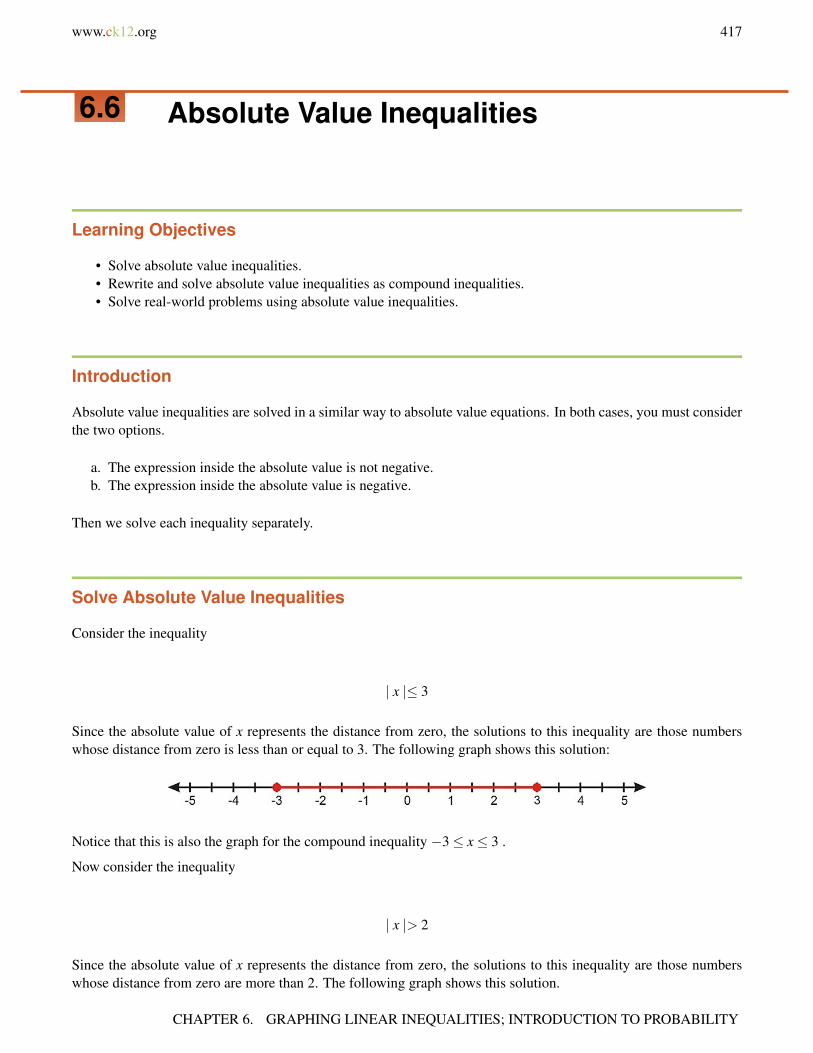
www.ck12.org 417
6.6 Absolute Value Inequalities
Learning Objectives
• Solve absolute value inequalities.• Rewrite and solve absolute value inequalities as compound inequalities.• Solve real-world problems using absolute value inequalities.
Introduction
Absolute value inequalities are solved in a similar way to absolute value equations. In both cases, you must considerthe two options.
a. The expression inside the absolute value is not negative.b. The expression inside the absolute value is negative.
Then we solve each inequality separately.
Solve Absolute Value Inequalities
Consider the inequality
| x |≤ 3
Since the absolute value of x represents the distance from zero, the solutions to this inequality are those numberswhose distance from zero is less than or equal to 3. The following graph shows this solution:
Notice that this is also the graph for the compound inequality −3≤ x≤ 3 .
Now consider the inequality
| x |> 2
Since the absolute value of x represents the distance from zero, the solutions to this inequality are those numberswhose distance from zero are more than 2. The following graph shows this solution.
CHAPTER 6. GRAPHING LINEAR INEQUALITIES; INTRODUCTION TO PROBABILITY

418 www.ck12.org
Notice that this is also the graph for the compound inequality x <−2 or x > 2 .
Example 1
Solve the following inequalities and show the solution graph.
a) | x |< 6
b) | x |≥ 2.5
Solution
a) | x |< 5 represents all numbers whose distance from zero is less than 5.
Answer −5 < x < 5
b) | x |≥ 2.5 represents all numbers whose distance from zero is more than or equal to 2.5.
Answer x≤−2.5 or x≥ 2.5
Rewrite and Solve Absolute Value Inequalities as Compound Inequalities
In the last section you saw that absolute value inequalities are compound inequalities.
Inequalities of the type | x |< a can be rewritten as −a < x < a
Inequalities of the type | x |< b can be rewritten as x <−b or x > b
To solve an absolute value inequality, we separate the expression into two inequalities and solve each of themindividually.
Example 2
Solve the inequality | x−3 |< 7 and show the solution graph.
Solution
Rewrite as a compound inequality.
Write as two separate inequalities.
x−3 < 7 and x−3 < 7
Solve each inequality
x < 10 and x >−4
The solution graph is
6.6. ABSOLUTE VALUE INEQUALITIES
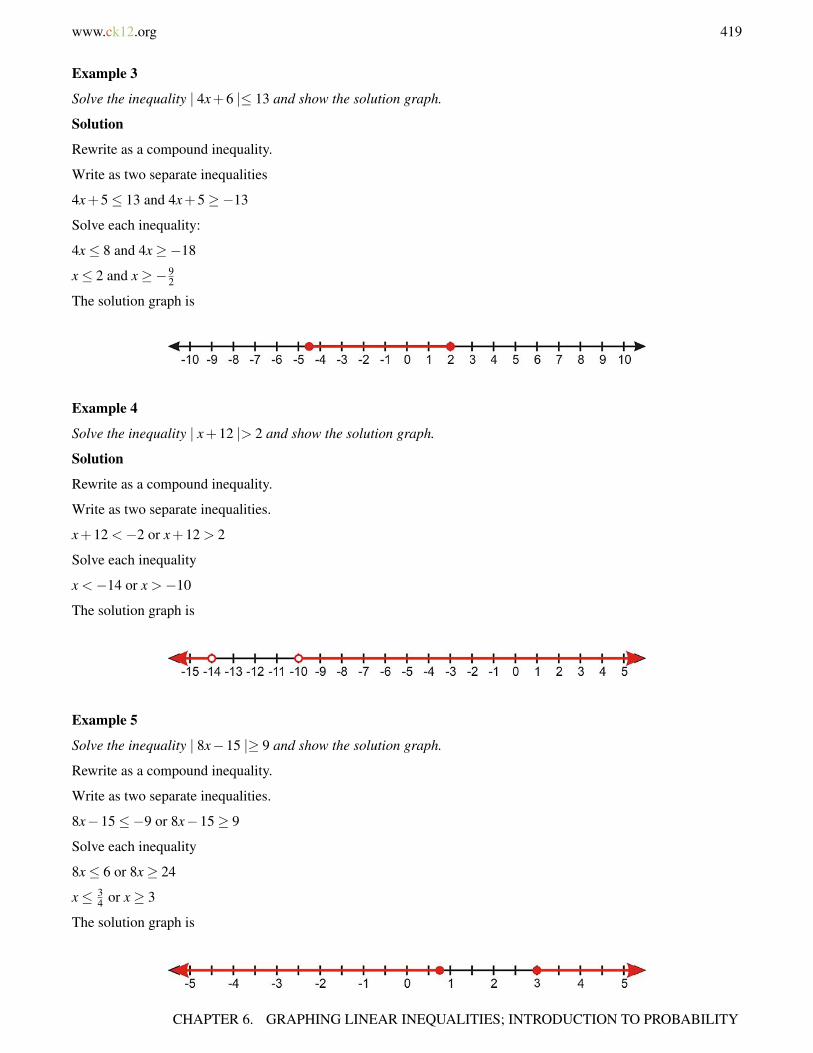
www.ck12.org 419
Example 3
Solve the inequality | 4x+6 |≤ 13 and show the solution graph.
Solution
Rewrite as a compound inequality.
Write as two separate inequalities
4x+5≤ 13 and 4x+5≥−13
Solve each inequality:
4x≤ 8 and 4x≥−18
x≤ 2 and x≥−92
The solution graph is
Example 4
Solve the inequality | x+12 |> 2 and show the solution graph.
Solution
Rewrite as a compound inequality.
Write as two separate inequalities.
x+12 <−2 or x+12 > 2
Solve each inequality
x <−14 or x >−10
The solution graph is
Example 5
Solve the inequality | 8x−15 |≥ 9 and show the solution graph.
Rewrite as a compound inequality.
Write as two separate inequalities.
8x−15≤−9 or 8x−15≥ 9
Solve each inequality
8x≤ 6 or 8x≥ 24
x≤ 34 or x≥ 3
The solution graph is
CHAPTER 6. GRAPHING LINEAR INEQUALITIES; INTRODUCTION TO PROBABILITY

420 www.ck12.org
Solve Real-World Problems Using Absolute Value Inequalities
Absolute value inequalities are useful in problems where we are dealing with a range of values.
Example 6:
The velocity of an object is given by the formula v = 25t−80 where the time is expressed in seconds and the velocityis expressed in feet per seconds. Find the times when the magnitude of the velocity is greater than or equal to 60 feetper second.
Solution
Step 1
We want to find the times when the velocity is greater than or equal to 60 feet per second
Step 2
We are given the formula for the velocity v = 25t−80
Write the absolute value inequality | 25t−80 |≥ 60
Step 3
Solve the inequality
25t−80≥ 60 or 25t−80≤−60
25t ≥ 140 or 25t ≤ 20
t ≥ 5.6 or t ≤ 0.8
Answer: The magnitude of the velocity is greater than 60 ft/sec for times less than 0.8 seconds and for times greaterthan 5.6 seconds.
Step 4 When t = 0.8 seconds, v = 25(0.8)− 80 = −60 f t/sec . The magnitude of the velocity is 60 ft/sec. Thenegative sign in the answer means that the object is moving backwards.
When t = 5.6 seconds, v = 25(0.8)−80 =−60 f t/sec .
To find where the magnitude of the velocity is greater than 60 ft/sec, check values in each of the following timeintervals: t ≤ 0.8 , 0.8≤ t ≤ 5.6 and t ≥ 5.6 .
Check t = 0.5 : v = 25(0.5)−80 =−67.5 f t/sec
Check t = 2 : v = 25(2)−80 =−30 f t/sec
Check t = 6 : v = 25(6)−80 = 70 f t/sec
You can see that the magnitude of the velocity is greater than 60 ft/sec for t ≥ 5.6 or t ≤ 0.8 .
The answer checks out.
Lesson Summary
• Like absolute value equations, inequalities with absolute value split into two inequalities. One where theexpression within the absolute value is negative and one where it is positive.
• Inequalities of the type | x |< a can be rewritten as −a < x < a .• Inequalities of the type | x |> b can be rewritten as −x <−b or x > b .
6.6. ABSOLUTE VALUE INEQUALITIES

www.ck12.org 421
Review Questions
Solve the following inequalities and show the solution graph.
1. |x|≤ 62. |x|> 3.53. |x|< 124. | x5 |≤ 65. |7x|≥ 216. |x−5|> 87. |x+7|< 38. |x− 3
4 | ≤12
9. |2x−5|≥ 1310. |5x+3|< 711. | x3 −4| ≤ 212. |2x
7 +9|> 57
13. A three month old baby boy weighs an average of 13 pounds. He is considered healthy if he is 2.5 lbs more orless than the average weight. Find the weight range that is considered healthy for three month old boys.
Review Answers
1. −6≤ x≤ 6
2. x <−3.5 or x > 3.5
3. −12 < x < 12
4. x <−10 or x > 10
5. x≤−3 or x≥ 3
6. x <−3 or x > 13
7. −10 < x <−4
8. 14 ≤ x≤ 5
4
CHAPTER 6. GRAPHING LINEAR INEQUALITIES; INTRODUCTION TO PROBABILITY
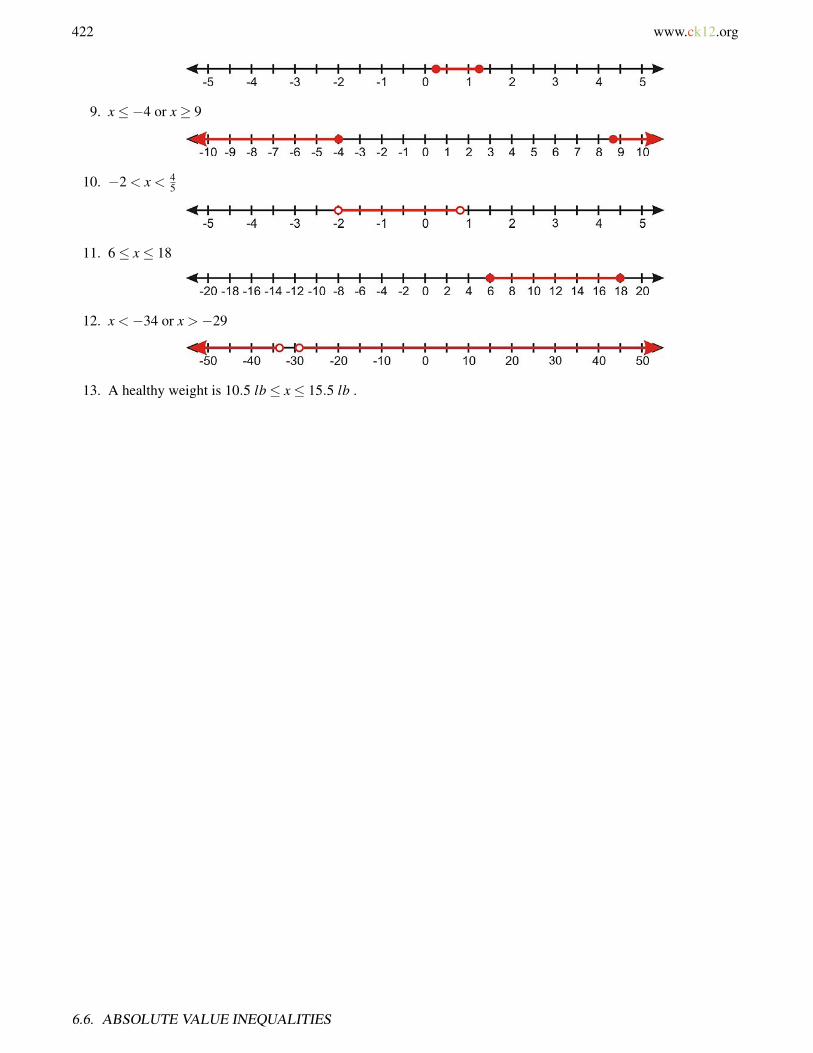
422 www.ck12.org
9. x≤−4 or x≥ 9
10. −2 < x < 45
11. 6≤ x≤ 18
12. x <−34 or x >−29
13. A healthy weight is 10.5 lb≤ x≤ 15.5 lb .
6.6. ABSOLUTE VALUE INEQUALITIES

www.ck12.org 423
6.7 Linear Inequalities in Two Variables
Learning Objectives
• Graph linear inequalities in one variable on the coordinate plane.• Graph linear inequalities in two variables.• Solve real-world problems using linear inequalities
Introduction
A linear inequality in two variables takes the form
y > mx+b or y < mx+b
Linear inequalities are closely related to graphs of straight lines. A straight line has the equation y = mx+b . Whenwe graph a line in the coordinate plane, we can see that it divides the plane in two halves.
The solution to a linear inequality includes all the points in one of the plane halves. We can tell which half of theplane the solution is by looking at the inequality sign.
#62; The solution is the half plane above the line.
≥ The solution is the half plane above the line and also all the points on the line.
#60; The solution is the half plane below the line.
≤ The solution is the half plane below the line and also all the points on the line.
(Above the line means for a given x− coordinate, all points with y− values greater than the y− value are on the line)
For a strict inequality, we draw a dashed line to show that the points on the line are not part of the solution.
For an inequality that includes the equal sign, we draw a solid line to show that the points on the line are part of thesolution.
Here is what you should expect linear inequality graphs to look like.
CHAPTER 6. GRAPHING LINEAR INEQUALITIES; INTRODUCTION TO PROBABILITY
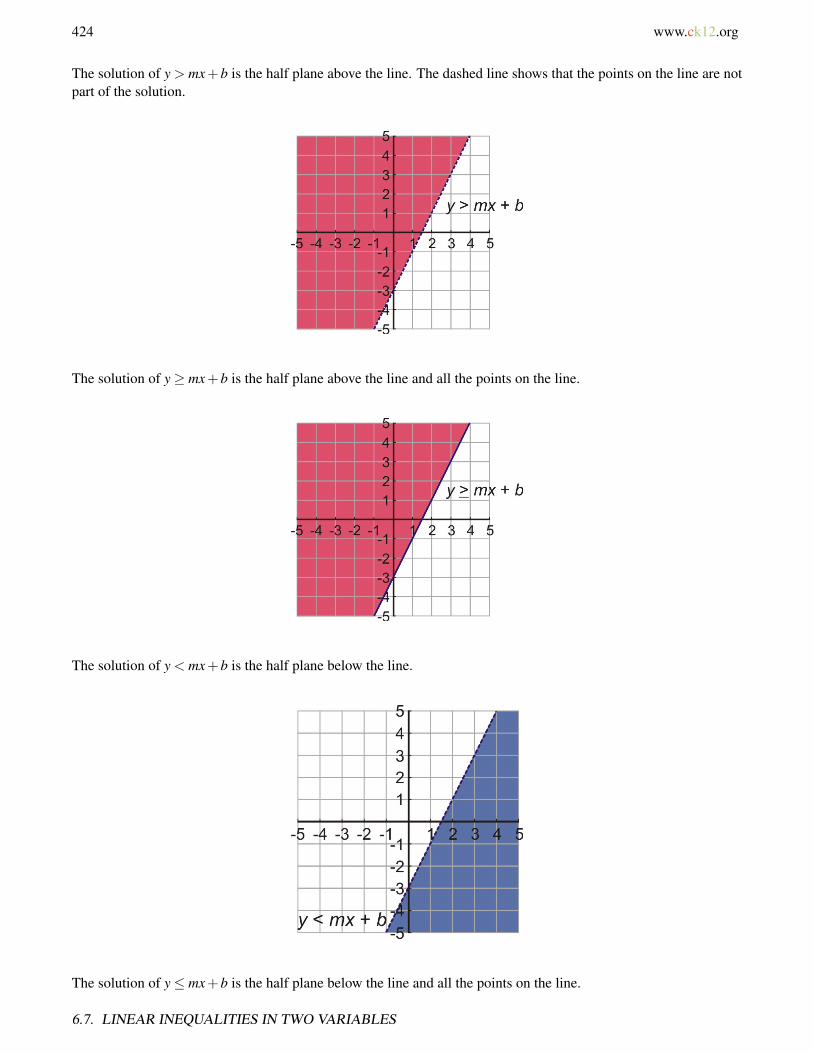
424 www.ck12.org
The solution of y > mx+b is the half plane above the line. The dashed line shows that the points on the line are notpart of the solution.
The solution of y≥ mx+b is the half plane above the line and all the points on the line.
The solution of y < mx+b is the half plane below the line.
The solution of y≤ mx+b is the half plane below the line and all the points on the line.
6.7. LINEAR INEQUALITIES IN TWO VARIABLES
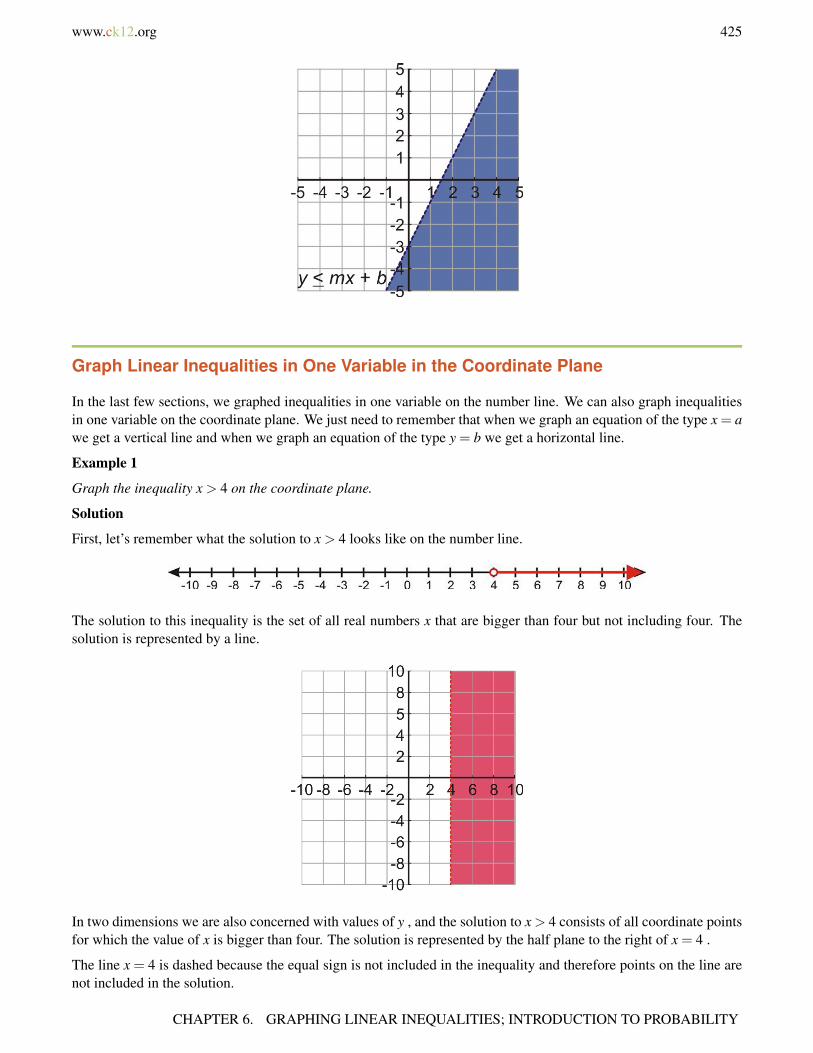
www.ck12.org 425
Graph Linear Inequalities in One Variable in the Coordinate Plane
In the last few sections, we graphed inequalities in one variable on the number line. We can also graph inequalitiesin one variable on the coordinate plane. We just need to remember that when we graph an equation of the type x = awe get a vertical line and when we graph an equation of the type y = b we get a horizontal line.
Example 1
Graph the inequality x > 4 on the coordinate plane.
Solution
First, let’s remember what the solution to x > 4 looks like on the number line.
The solution to this inequality is the set of all real numbers x that are bigger than four but not including four. Thesolution is represented by a line.
In two dimensions we are also concerned with values of y , and the solution to x > 4 consists of all coordinate pointsfor which the value of x is bigger than four. The solution is represented by the half plane to the right of x = 4 .
The line x = 4 is dashed because the equal sign is not included in the inequality and therefore points on the line arenot included in the solution.
CHAPTER 6. GRAPHING LINEAR INEQUALITIES; INTRODUCTION TO PROBABILITY
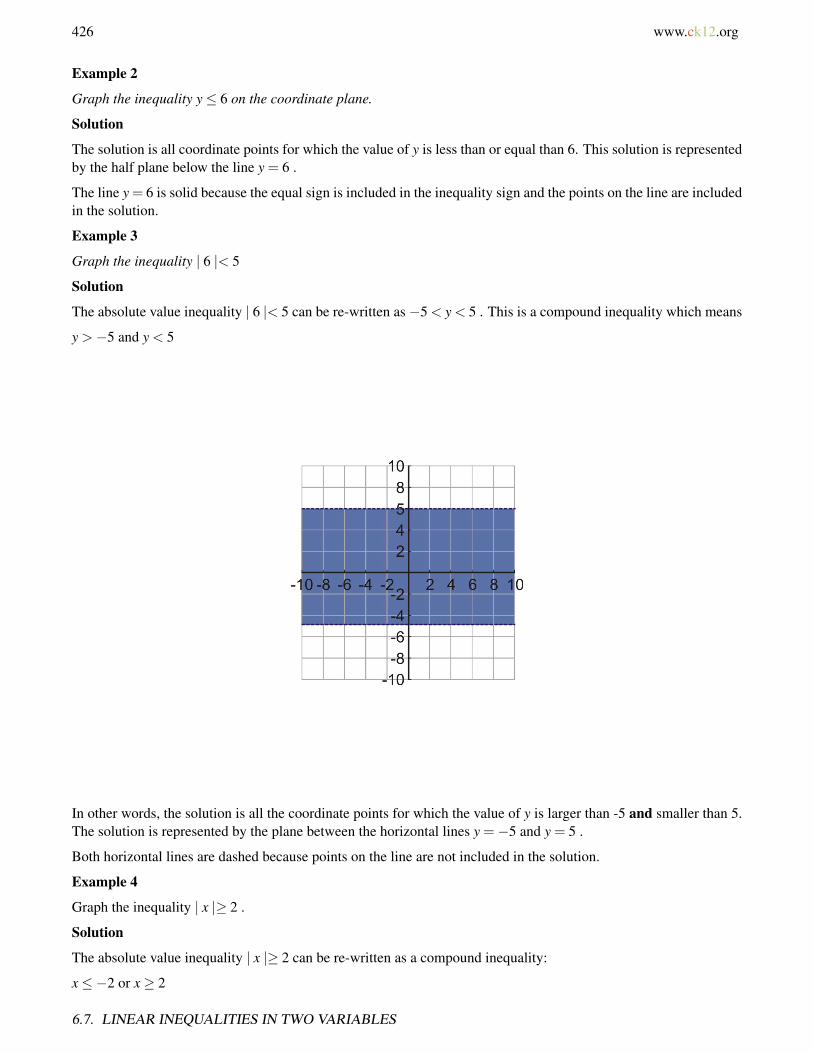
426 www.ck12.org
Example 2
Graph the inequality y≤ 6 on the coordinate plane.
Solution
The solution is all coordinate points for which the value of y is less than or equal than 6. This solution is representedby the half plane below the line y = 6 .
The line y = 6 is solid because the equal sign is included in the inequality sign and the points on the line are includedin the solution.
Example 3
Graph the inequality | 6 |< 5
Solution
The absolute value inequality | 6 |< 5 can be re-written as −5 < y < 5 . This is a compound inequality which means
y >−5 and y < 5
In other words, the solution is all the coordinate points for which the value of y is larger than -5 and smaller than 5.The solution is represented by the plane between the horizontal lines y =−5 and y = 5 .
Both horizontal lines are dashed because points on the line are not included in the solution.
Example 4
Graph the inequality | x |≥ 2 .
Solution
The absolute value inequality | x |≥ 2 can be re-written as a compound inequality:
x≤−2 or x≥ 2
6.7. LINEAR INEQUALITIES IN TWO VARIABLES
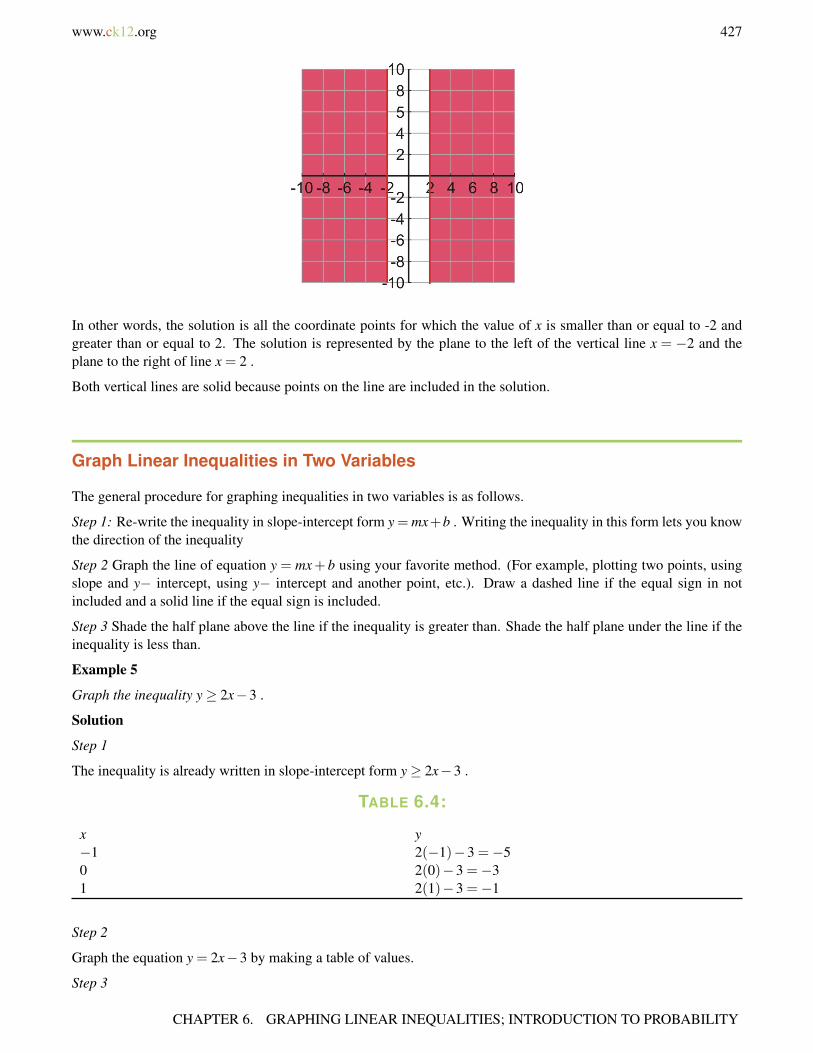
www.ck12.org 427
In other words, the solution is all the coordinate points for which the value of x is smaller than or equal to -2 andgreater than or equal to 2. The solution is represented by the plane to the left of the vertical line x = −2 and theplane to the right of line x = 2 .
Both vertical lines are solid because points on the line are included in the solution.
Graph Linear Inequalities in Two Variables
The general procedure for graphing inequalities in two variables is as follows.
Step 1: Re-write the inequality in slope-intercept form y = mx+b . Writing the inequality in this form lets you knowthe direction of the inequality
Step 2 Graph the line of equation y = mx+b using your favorite method. (For example, plotting two points, usingslope and y− intercept, using y− intercept and another point, etc.). Draw a dashed line if the equal sign in notincluded and a solid line if the equal sign is included.
Step 3 Shade the half plane above the line if the inequality is greater than. Shade the half plane under the line if theinequality is less than.
Example 5
Graph the inequality y≥ 2x−3 .
Solution
Step 1
The inequality is already written in slope-intercept form y≥ 2x−3 .
TABLE 6.4:
x y−1 2(−1)−3 =−50 2(0)−3 =−31 2(1)−3 =−1
Step 2
Graph the equation y = 2x−3 by making a table of values.
Step 3
CHAPTER 6. GRAPHING LINEAR INEQUALITIES; INTRODUCTION TO PROBABILITY
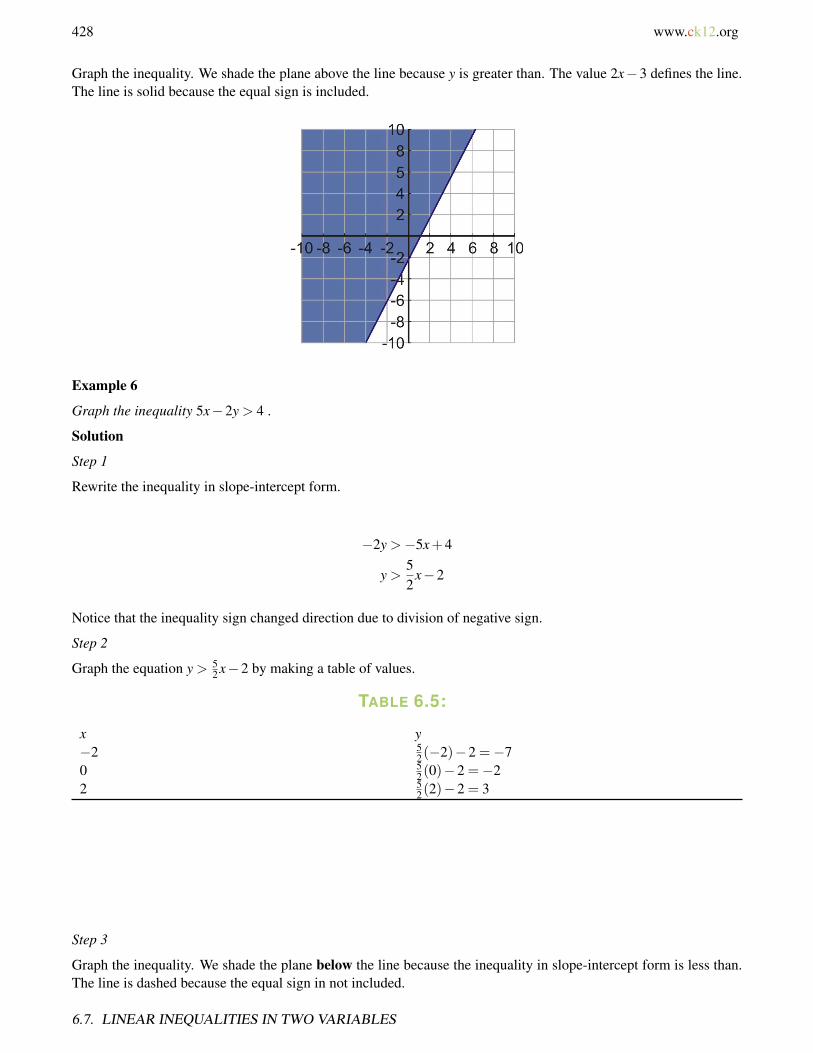
428 www.ck12.org
Graph the inequality. We shade the plane above the line because y is greater than. The value 2x−3 defines the line.The line is solid because the equal sign is included.
Example 6
Graph the inequality 5x−2y > 4 .
Solution
Step 1
Rewrite the inequality in slope-intercept form.
−2y >−5x+4
y >52
x−2
Notice that the inequality sign changed direction due to division of negative sign.
Step 2
Graph the equation y > 52 x−2 by making a table of values.
TABLE 6.5:
x y−2 5
2(−2)−2 =−70 5
2(0)−2 =−22 5
2(2)−2 = 3
Step 3
Graph the inequality. We shade the plane below the line because the inequality in slope-intercept form is less than.The line is dashed because the equal sign in not included.
6.7. LINEAR INEQUALITIES IN TWO VARIABLES
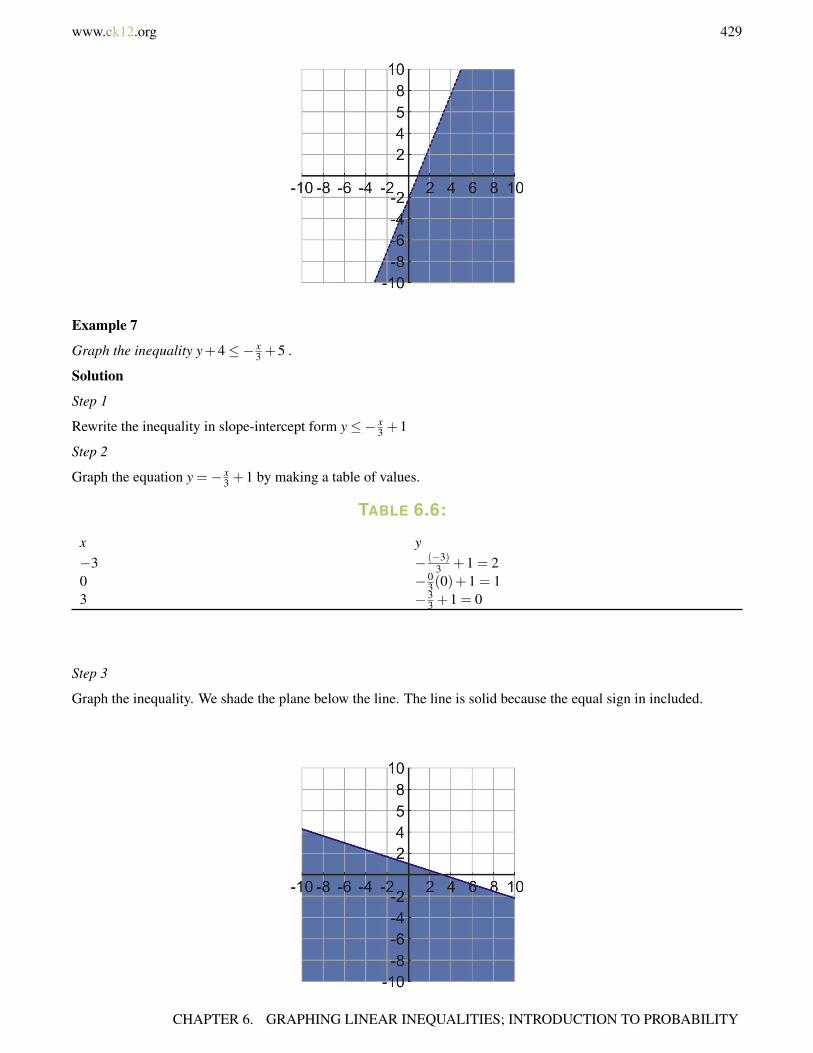
www.ck12.org 429
Example 7
Graph the inequality y+4≤− x3 +5 .
Solution
Step 1
Rewrite the inequality in slope-intercept form y≤− x3 +1
Step 2
Graph the equation y =− x3 +1 by making a table of values.
TABLE 6.6:
x y−3 − (−3)
3 +1 = 20 −0
3(0)+1 = 13 −3
3 +1 = 0
Step 3
Graph the inequality. We shade the plane below the line. The line is solid because the equal sign in included.
CHAPTER 6. GRAPHING LINEAR INEQUALITIES; INTRODUCTION TO PROBABILITY
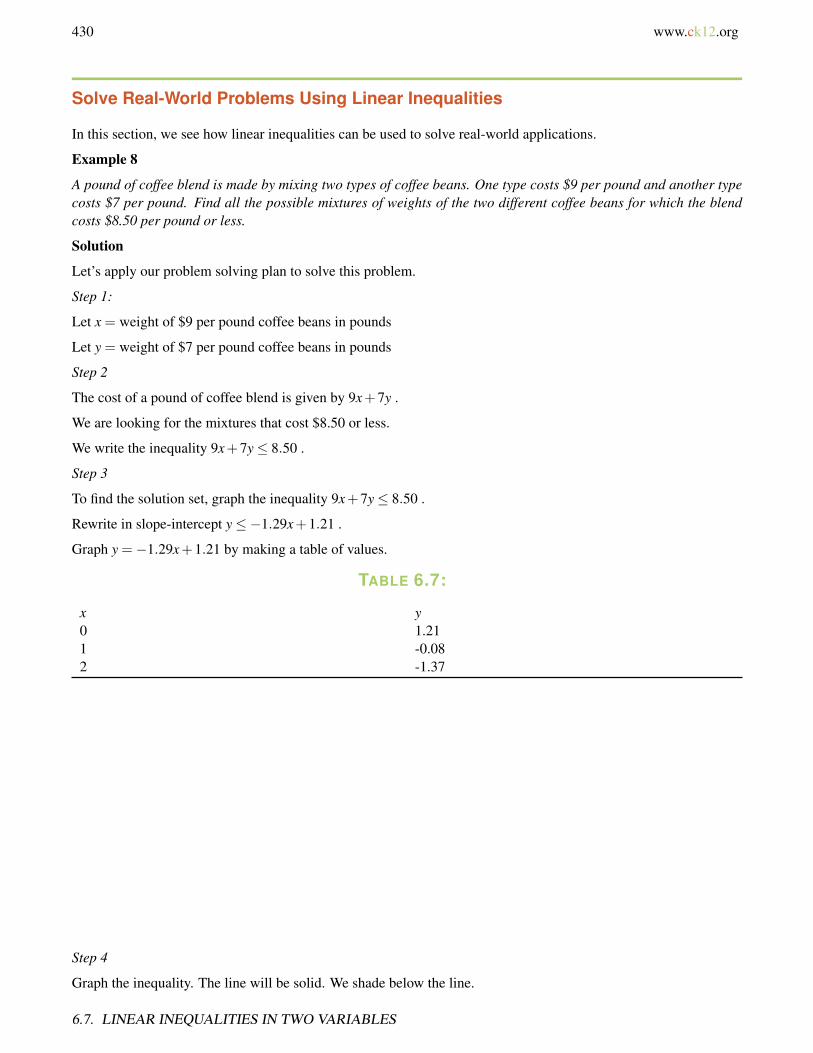
430 www.ck12.org
Solve Real-World Problems Using Linear Inequalities
In this section, we see how linear inequalities can be used to solve real-world applications.
Example 8
A pound of coffee blend is made by mixing two types of coffee beans. One type costs $9 per pound and another typecosts $7 per pound. Find all the possible mixtures of weights of the two different coffee beans for which the blendcosts $8.50 per pound or less.
Solution
Let’s apply our problem solving plan to solve this problem.
Step 1:
Let x = weight of $9 per pound coffee beans in pounds
Let y = weight of $7 per pound coffee beans in pounds
Step 2
The cost of a pound of coffee blend is given by 9x+7y .
We are looking for the mixtures that cost $8.50 or less.
We write the inequality 9x+7y≤ 8.50 .
Step 3
To find the solution set, graph the inequality 9x+7y≤ 8.50 .
Rewrite in slope-intercept y≤−1.29x+1.21 .
Graph y =−1.29x+1.21 by making a table of values.
TABLE 6.7:
x y0 1.211 -0.082 -1.37
Step 4
Graph the inequality. The line will be solid. We shade below the line.
6.7. LINEAR INEQUALITIES IN TWO VARIABLES
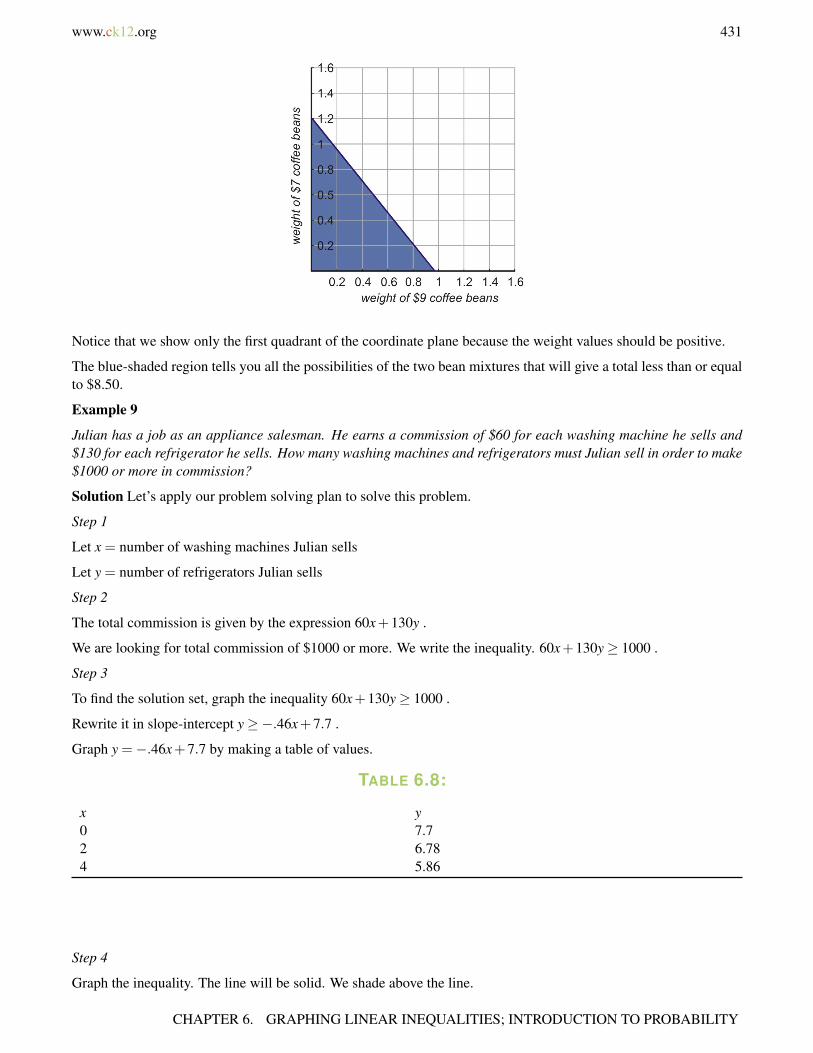
www.ck12.org 431
Notice that we show only the first quadrant of the coordinate plane because the weight values should be positive.
The blue-shaded region tells you all the possibilities of the two bean mixtures that will give a total less than or equalto $8.50.
Example 9
Julian has a job as an appliance salesman. He earns a commission of $60 for each washing machine he sells and$130 for each refrigerator he sells. How many washing machines and refrigerators must Julian sell in order to make$1000 or more in commission?
Solution Let’s apply our problem solving plan to solve this problem.
Step 1
Let x = number of washing machines Julian sells
Let y = number of refrigerators Julian sells
Step 2
The total commission is given by the expression 60x+130y .
We are looking for total commission of $1000 or more. We write the inequality. 60x+130y≥ 1000 .
Step 3
To find the solution set, graph the inequality 60x+130y≥ 1000 .
Rewrite it in slope-intercept y≥−.46x+7.7 .
Graph y =−.46x+7.7 by making a table of values.
TABLE 6.8:
x y0 7.72 6.784 5.86
Step 4
Graph the inequality. The line will be solid. We shade above the line.
CHAPTER 6. GRAPHING LINEAR INEQUALITIES; INTRODUCTION TO PROBABILITY
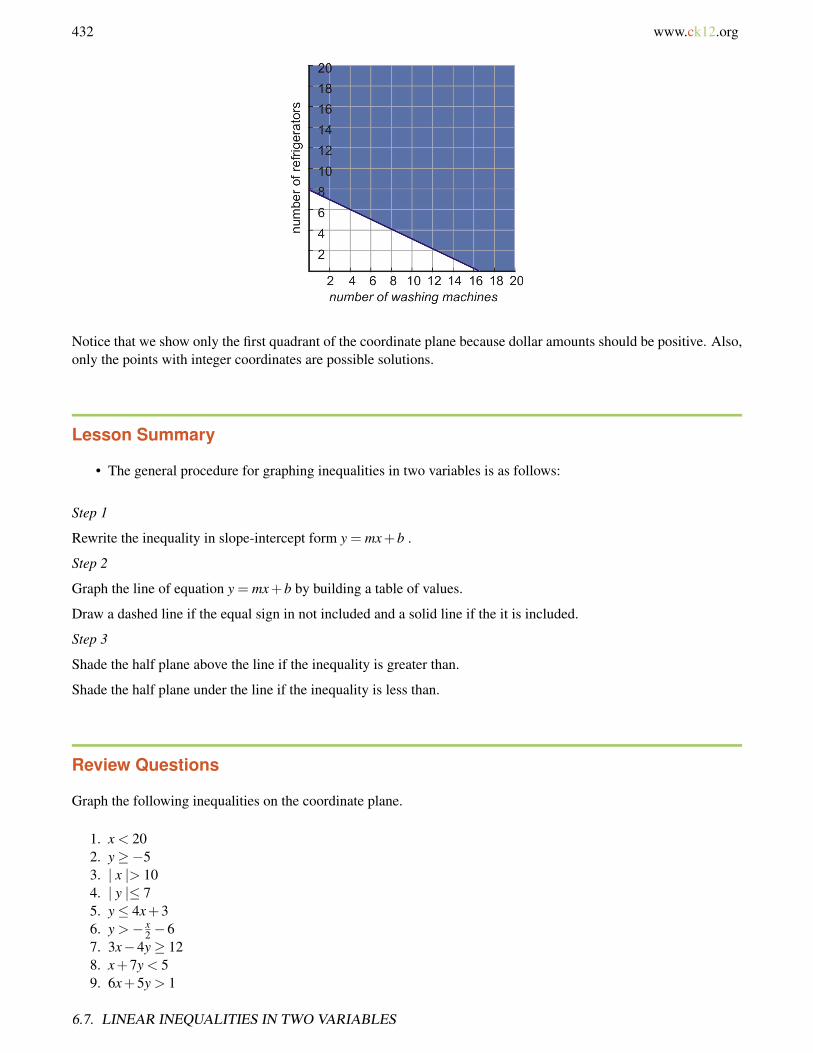
432 www.ck12.org
Notice that we show only the first quadrant of the coordinate plane because dollar amounts should be positive. Also,only the points with integer coordinates are possible solutions.
Lesson Summary
• The general procedure for graphing inequalities in two variables is as follows:
Step 1
Rewrite the inequality in slope-intercept form y = mx+b .
Step 2
Graph the line of equation y = mx+b by building a table of values.
Draw a dashed line if the equal sign in not included and a solid line if the it is included.
Step 3
Shade the half plane above the line if the inequality is greater than.
Shade the half plane under the line if the inequality is less than.
Review Questions
Graph the following inequalities on the coordinate plane.
1. x < 202. y≥−53. | x |> 104. | y |≤ 75. y≤ 4x+36. y >− x
2 −67. 3x−4y≥ 128. x+7y < 59. 6x+5y > 1
6.7. LINEAR INEQUALITIES IN TWO VARIABLES

www.ck12.org 433
10. y+5≤−4x+1011. x− 1
2 y≥ 512. 30x+5y < 10013. An ounce of gold costs $670 and an ounce of silver costs $13. Find all possible weights of silver and gold that
makes an alloy that costs less than $600 per ounce.14. A phone company charges 50 cents cents per minute during the daytime and 10 cents per minute at night.
How many daytime minutes and night time minutes would you have to use to pay more than $20 over a 24hour period?
Review Answers
1.
2.
CHAPTER 6. GRAPHING LINEAR INEQUALITIES; INTRODUCTION TO PROBABILITY
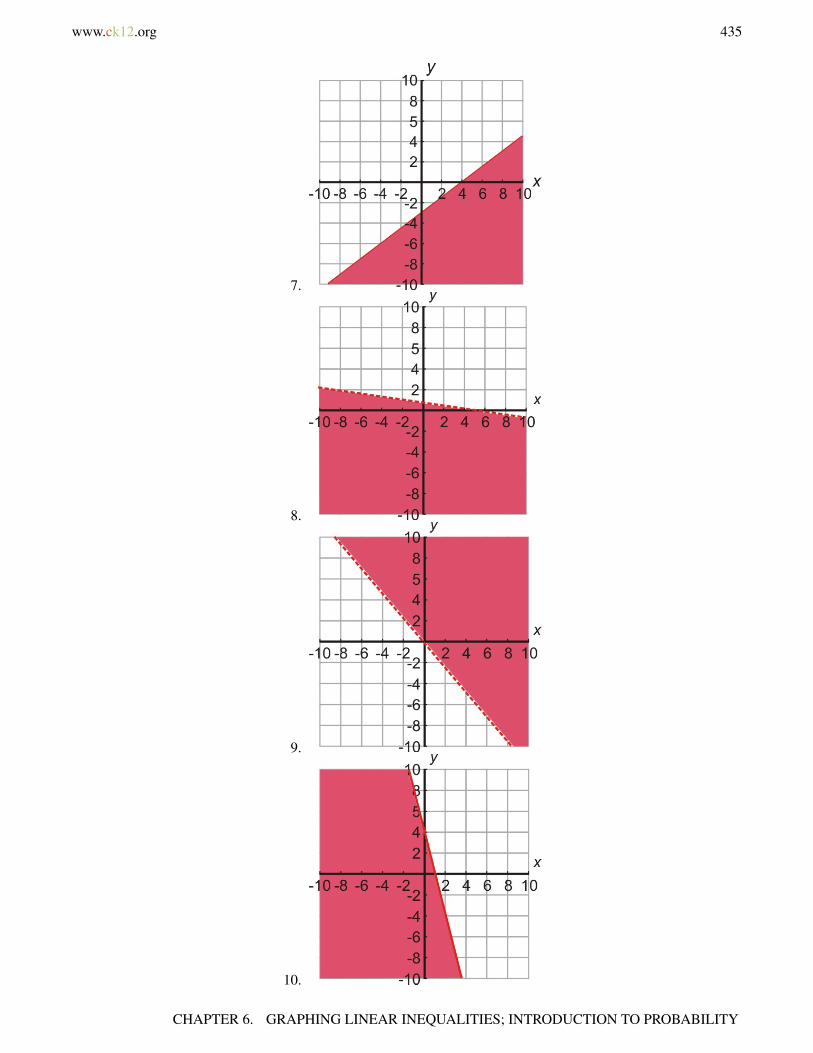
www.ck12.org 435
7.
8.
9.
10.
CHAPTER 6. GRAPHING LINEAR INEQUALITIES; INTRODUCTION TO PROBABILITY
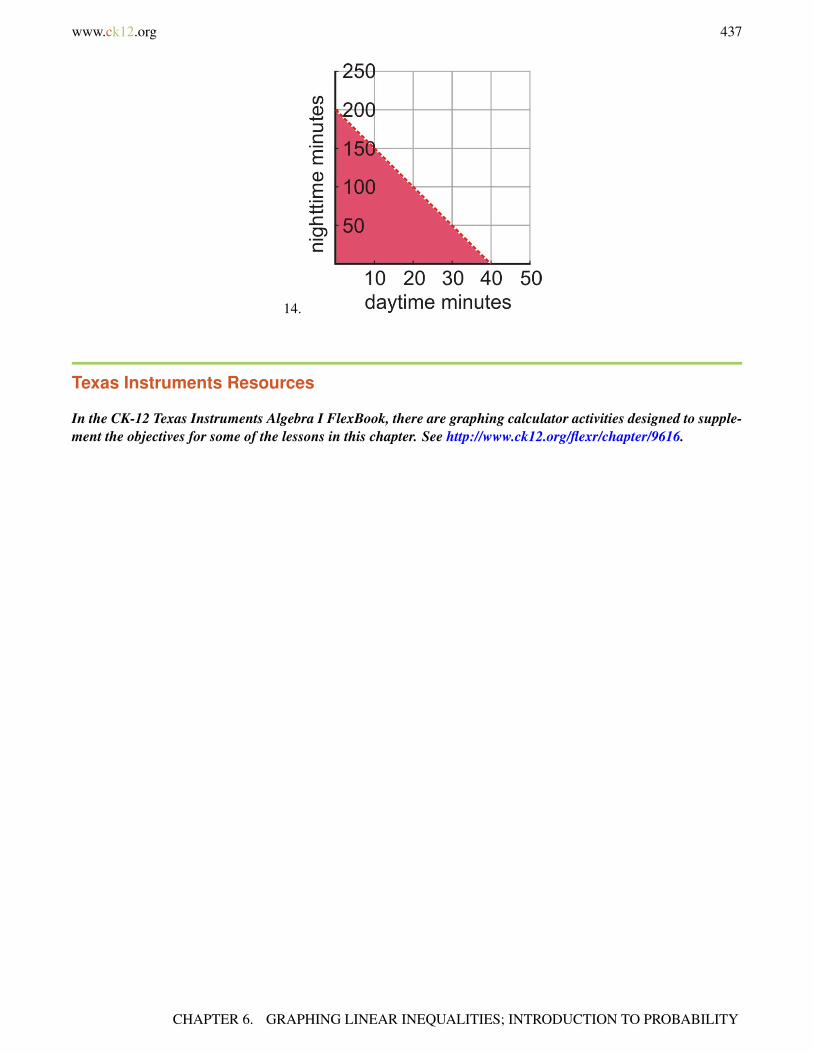
www.ck12.org 437
14.
Texas Instruments Resources
In the CK-12 Texas Instruments Algebra I FlexBook, there are graphing calculator activities designed to supple-ment the objectives for some of the lessons in this chapter. See http://www.ck12.org/flexr/chapter/9616.
CHAPTER 6. GRAPHING LINEAR INEQUALITIES; INTRODUCTION TO PROBABILITY

438 www.ck12.org
CHAPTER 7 Solving Systems of Equationsand Inequalities
CHAPTER OUTLINE
7.1 LINEAR SYSTEMS BY GRAPHING
7.2 SOLVING LINEAR SYSTEMS BY SUBSTITUTION
7.3 SOLVING LINEAR SYSTEMS BY ELIMINATION THROUGH ADDITION OR SUBTRACTION
7.4 SOLVING SYSTEMS OF EQUATIONS BY MULTIPLICATION
7.5 SPECIAL TYPES OF LINEAR SYSTEMS
7.6 SYSTEMS OF LINEAR INEQUALITIES
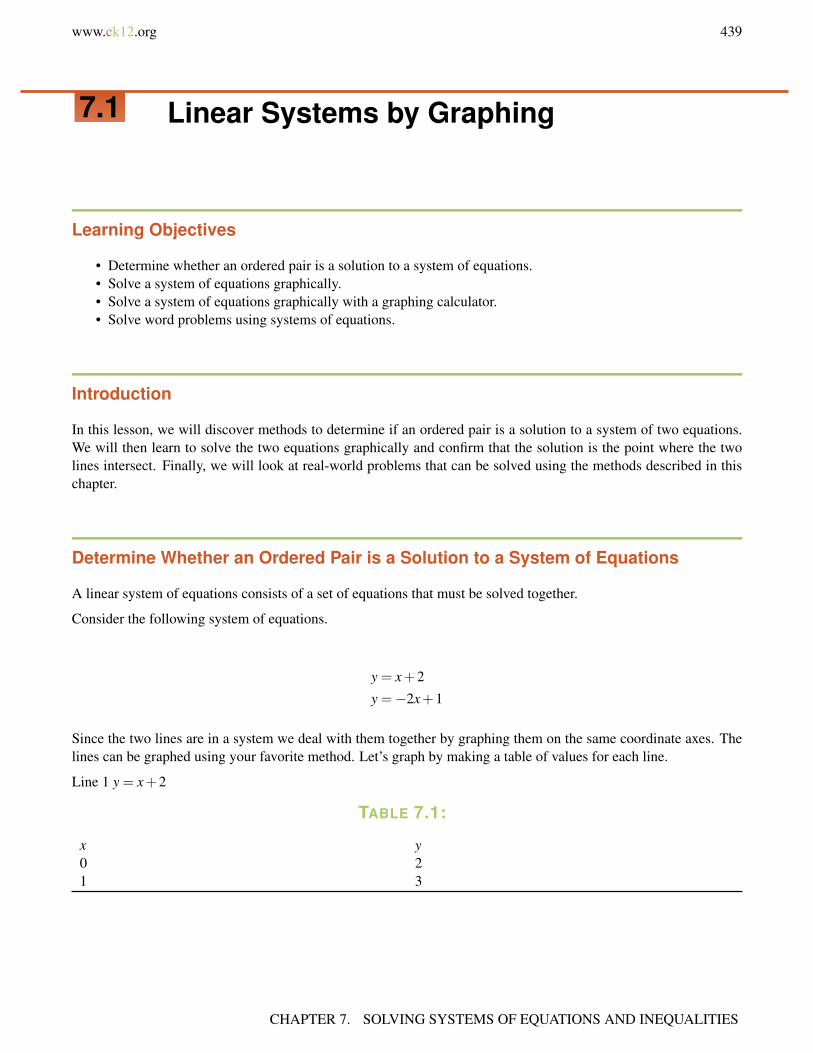
www.ck12.org 439
7.1 Linear Systems by Graphing
Learning Objectives
• Determine whether an ordered pair is a solution to a system of equations.• Solve a system of equations graphically.• Solve a system of equations graphically with a graphing calculator.• Solve word problems using systems of equations.
Introduction
In this lesson, we will discover methods to determine if an ordered pair is a solution to a system of two equations.We will then learn to solve the two equations graphically and confirm that the solution is the point where the twolines intersect. Finally, we will look at real-world problems that can be solved using the methods described in thischapter.
Determine Whether an Ordered Pair is a Solution to a System of Equations
A linear system of equations consists of a set of equations that must be solved together.
Consider the following system of equations.
y = x+2
y =−2x+1
Since the two lines are in a system we deal with them together by graphing them on the same coordinate axes. Thelines can be graphed using your favorite method. Let’s graph by making a table of values for each line.
Line 1 y = x+2
TABLE 7.1:
x y0 21 3
CHAPTER 7. SOLVING SYSTEMS OF EQUATIONS AND INEQUALITIES

440 www.ck12.org
Line 2 y =−2x+1
TABLE 7.2:
x y0 11 -1
A solution for a single equation is any point that lies on the line for that equation. A solution for a system ofequations is any point that lies on both lines in the system.
For Example
• Point A is not a solution to the system because it does not lie on either of the lines.• Point B is not a solution to the system because it lies only on the blue line but not on the red line.• Point C is a solution to the system because it lies on both lines at the same time.
In particular, this point marks the intersection of the two lines. It solves both equations, so it solves the system.For a system of equations, the geometrical solution is the intersection of the two lines in the system. The algebraicsolution is the ordered paid that solves both equations.
You can confirm the solution by plugging it into the system of equations, and confirming that the solution works ineach equation.
Example 1
Determine which of the points (1, 3), (0, 2) or (2, 7) is a solution to the following system of equations.
y = 4x−1
y = 2x+3
Solution
To check if a coordinate point is a solution to the system of equations, we plug each of the x and y values into theequations to see if they work.
Point (1, 3)
7.1. LINEAR SYSTEMS BY GRAPHING
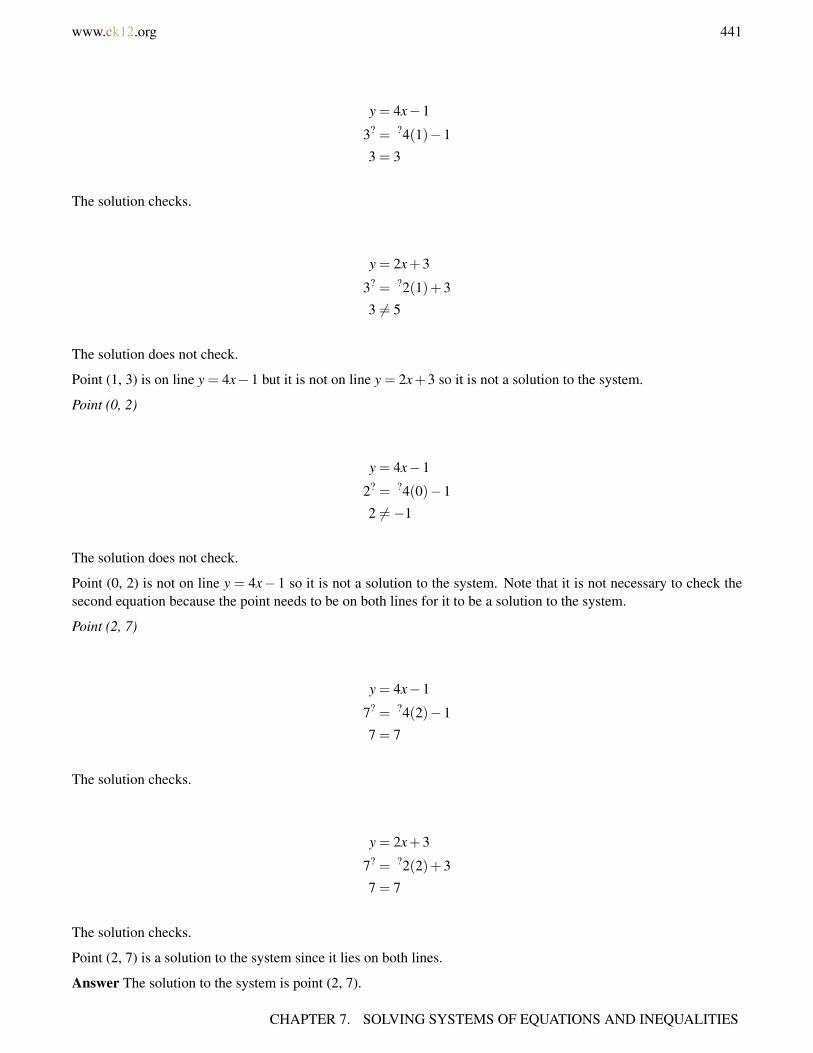
www.ck12.org 441
y = 4x−1
3? = ?4(1)−1
3 = 3
The solution checks.
y = 2x+3
3? = ?2(1)+3
3 6= 5
The solution does not check.
Point (1, 3) is on line y = 4x−1 but it is not on line y = 2x+3 so it is not a solution to the system.
Point (0, 2)
y = 4x−1
2? = ?4(0)−1
2 6=−1
The solution does not check.
Point (0, 2) is not on line y = 4x− 1 so it is not a solution to the system. Note that it is not necessary to check thesecond equation because the point needs to be on both lines for it to be a solution to the system.
Point (2, 7)
y = 4x−1
7? = ?4(2)−1
7 = 7
The solution checks.
y = 2x+3
7? = ?2(2)+3
7 = 7
The solution checks.
Point (2, 7) is a solution to the system since it lies on both lines.
Answer The solution to the system is point (2, 7).
CHAPTER 7. SOLVING SYSTEMS OF EQUATIONS AND INEQUALITIES
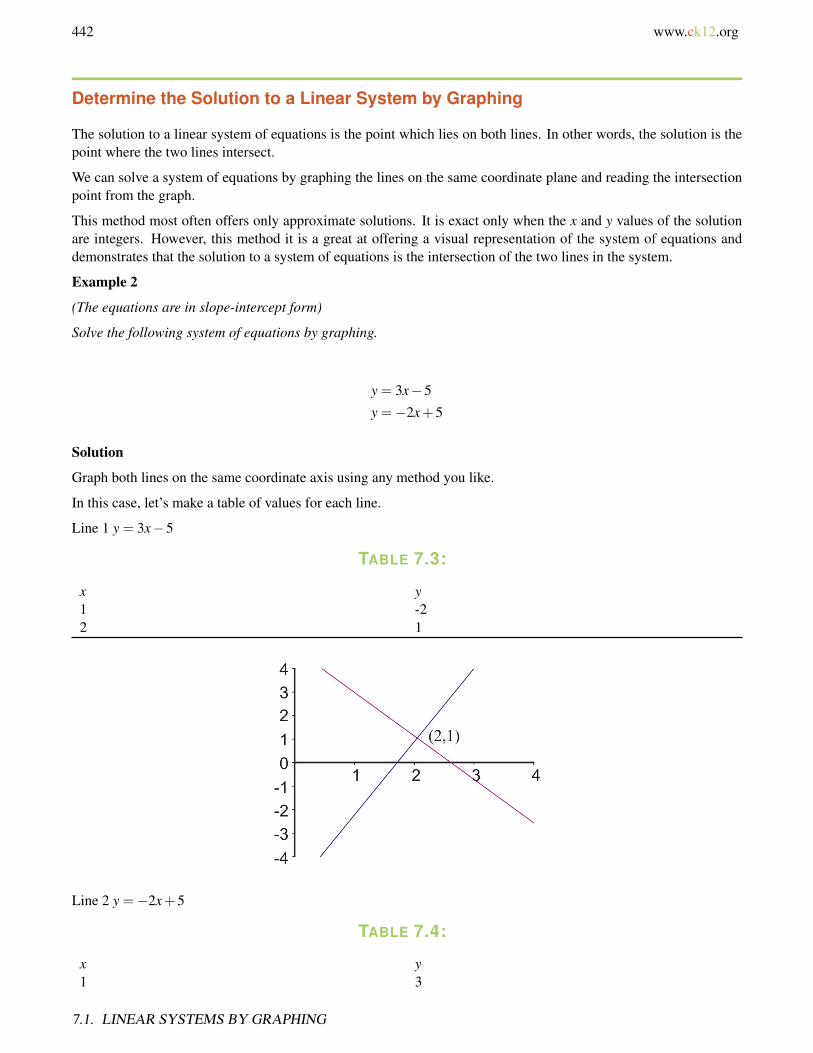
442 www.ck12.org
Determine the Solution to a Linear System by Graphing
The solution to a linear system of equations is the point which lies on both lines. In other words, the solution is thepoint where the two lines intersect.
We can solve a system of equations by graphing the lines on the same coordinate plane and reading the intersectionpoint from the graph.
This method most often offers only approximate solutions. It is exact only when the x and y values of the solutionare integers. However, this method it is a great at offering a visual representation of the system of equations anddemonstrates that the solution to a system of equations is the intersection of the two lines in the system.
Example 2
(The equations are in slope-intercept form)
Solve the following system of equations by graphing.
y = 3x−5
y =−2x+5
Solution
Graph both lines on the same coordinate axis using any method you like.
In this case, let’s make a table of values for each line.
Line 1 y = 3x−5
TABLE 7.3:
x y1 -22 1
Line 2 y =−2x+5
TABLE 7.4:
x y1 3
7.1. LINEAR SYSTEMS BY GRAPHING

www.ck12.org 443
TABLE 7.4: (continued)
x y2 1
Answer The solution to the system is given by the intersection point of the two lines. The graph shows that the linesintersect at point (2, 1). So the solution is x = 2,y = 1 or (2, 1).
Example 3
(The equations are in standard form)
Solve the following system of equations by graphing
2x+3y = 6
4x− y =−2
Solution
Graph both lines on the same coordinate axis using your method of choice.
Here we will graph the lines by finding the x− and y− intercepts of each of the lines.
Line 1 2x+3y = 6
x− intercept set y = 0⇒ 2x = 6⇒ x = 3 which results in point (3, 0).
y− intercept set x = 0⇒ 3y = 6⇒ y = 2 which results in point (0, 2).
Line 2 −4x+ y = 2
x− intercept: set y = 0⇒−4x = 2⇒ x =−12 which results in point
(−1
2 ,0)
.
y− intercept: set x = 0⇒ y = 2 which results in point (0, 2)
Answer The graph shows that the lines intersect at point (0, 2). Therefore, the solution to the system of equations isx = 0, y = 2 .
Example 4:
Solve the following system by graphing.
y = 3
x+ y = 2
CHAPTER 7. SOLVING SYSTEMS OF EQUATIONS AND INEQUALITIES
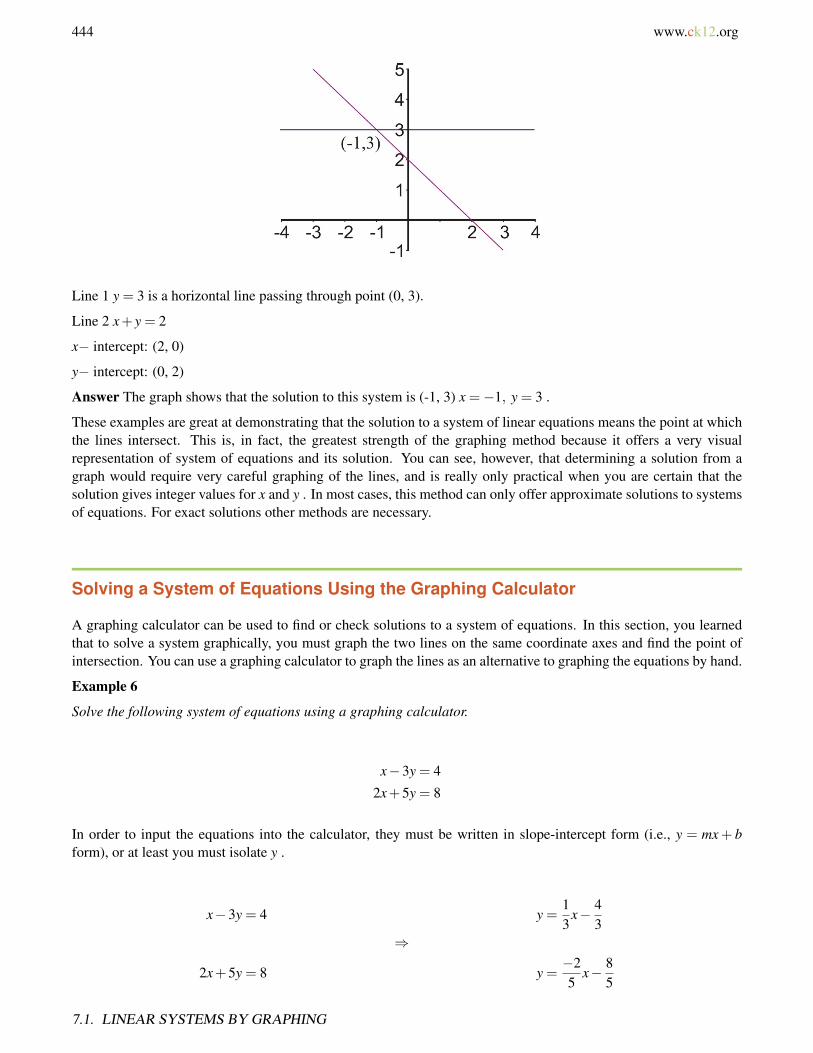
444 www.ck12.org
Line 1 y = 3 is a horizontal line passing through point (0, 3).
Line 2 x+ y = 2
x− intercept: (2, 0)
y− intercept: (0, 2)
Answer The graph shows that the solution to this system is (-1, 3) x =−1, y = 3 .
These examples are great at demonstrating that the solution to a system of linear equations means the point at whichthe lines intersect. This is, in fact, the greatest strength of the graphing method because it offers a very visualrepresentation of system of equations and its solution. You can see, however, that determining a solution from agraph would require very careful graphing of the lines, and is really only practical when you are certain that thesolution gives integer values for x and y . In most cases, this method can only offer approximate solutions to systemsof equations. For exact solutions other methods are necessary.
Solving a System of Equations Using the Graphing Calculator
A graphing calculator can be used to find or check solutions to a system of equations. In this section, you learnedthat to solve a system graphically, you must graph the two lines on the same coordinate axes and find the point ofintersection. You can use a graphing calculator to graph the lines as an alternative to graphing the equations by hand.
Example 6
Solve the following system of equations using a graphing calculator.
x−3y = 4
2x+5y = 8
In order to input the equations into the calculator, they must be written in slope-intercept form (i.e., y = mx+ bform), or at least you must isolate y .
x−3y = 4 y =13
x− 43
⇒
2x+5y = 8 y =−25
x− 85
7.1. LINEAR SYSTEMS BY GRAPHING
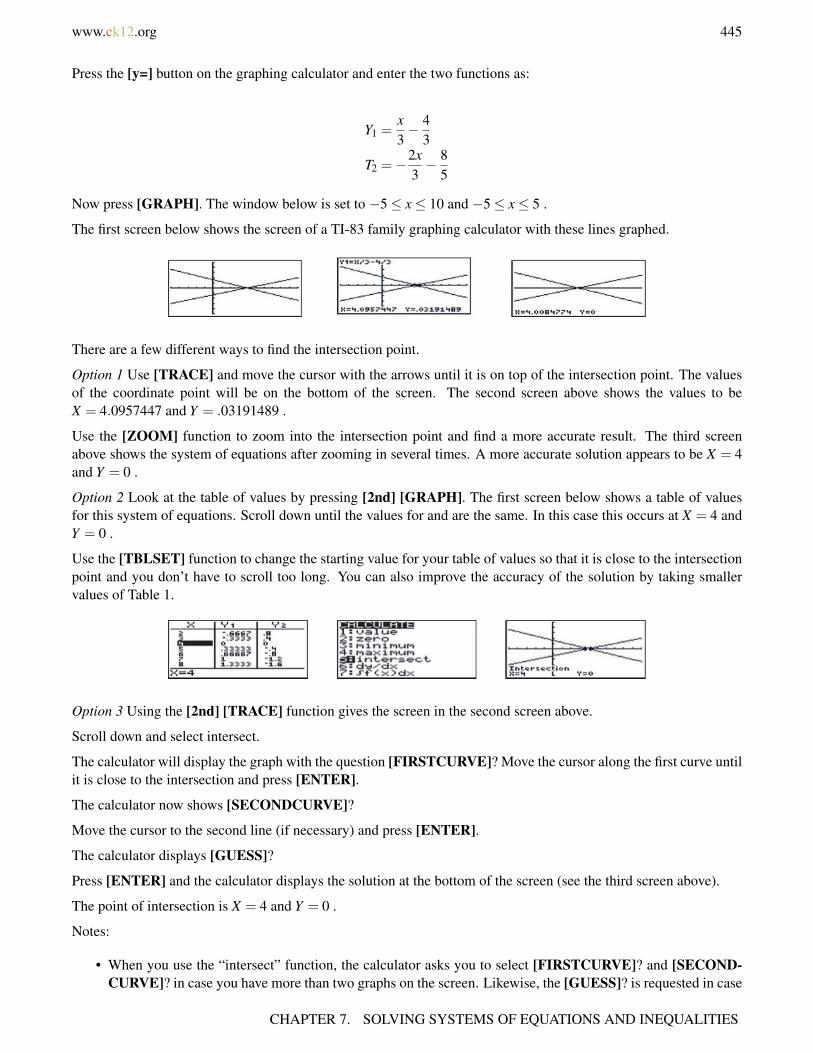
www.ck12.org 445
Press the [y=] button on the graphing calculator and enter the two functions as:
Y1 =x3− 4
3
T2 =−2x3− 8
5
Now press [GRAPH]. The window below is set to −5≤ x≤ 10 and −5≤ x≤ 5 .
The first screen below shows the screen of a TI-83 family graphing calculator with these lines graphed.
There are a few different ways to find the intersection point.
Option 1 Use [TRACE] and move the cursor with the arrows until it is on top of the intersection point. The valuesof the coordinate point will be on the bottom of the screen. The second screen above shows the values to beX = 4.0957447 and Y = .03191489 .
Use the [ZOOM] function to zoom into the intersection point and find a more accurate result. The third screenabove shows the system of equations after zooming in several times. A more accurate solution appears to be X = 4and Y = 0 .
Option 2 Look at the table of values by pressing [2nd] [GRAPH]. The first screen below shows a table of valuesfor this system of equations. Scroll down until the values for and are the same. In this case this occurs at X = 4 andY = 0 .
Use the [TBLSET] function to change the starting value for your table of values so that it is close to the intersectionpoint and you don’t have to scroll too long. You can also improve the accuracy of the solution by taking smallervalues of Table 1.
Option 3 Using the [2nd] [TRACE] function gives the screen in the second screen above.
Scroll down and select intersect.
The calculator will display the graph with the question [FIRSTCURVE]? Move the cursor along the first curve untilit is close to the intersection and press [ENTER].
The calculator now shows [SECONDCURVE]?
Move the cursor to the second line (if necessary) and press [ENTER].
The calculator displays [GUESS]?
Press [ENTER] and the calculator displays the solution at the bottom of the screen (see the third screen above).
The point of intersection is X = 4 and Y = 0 .
Notes:
• When you use the “intersect” function, the calculator asks you to select [FIRSTCURVE]? and [SECOND-CURVE]? in case you have more than two graphs on the screen. Likewise, the [GUESS]? is requested in case
CHAPTER 7. SOLVING SYSTEMS OF EQUATIONS AND INEQUALITIES
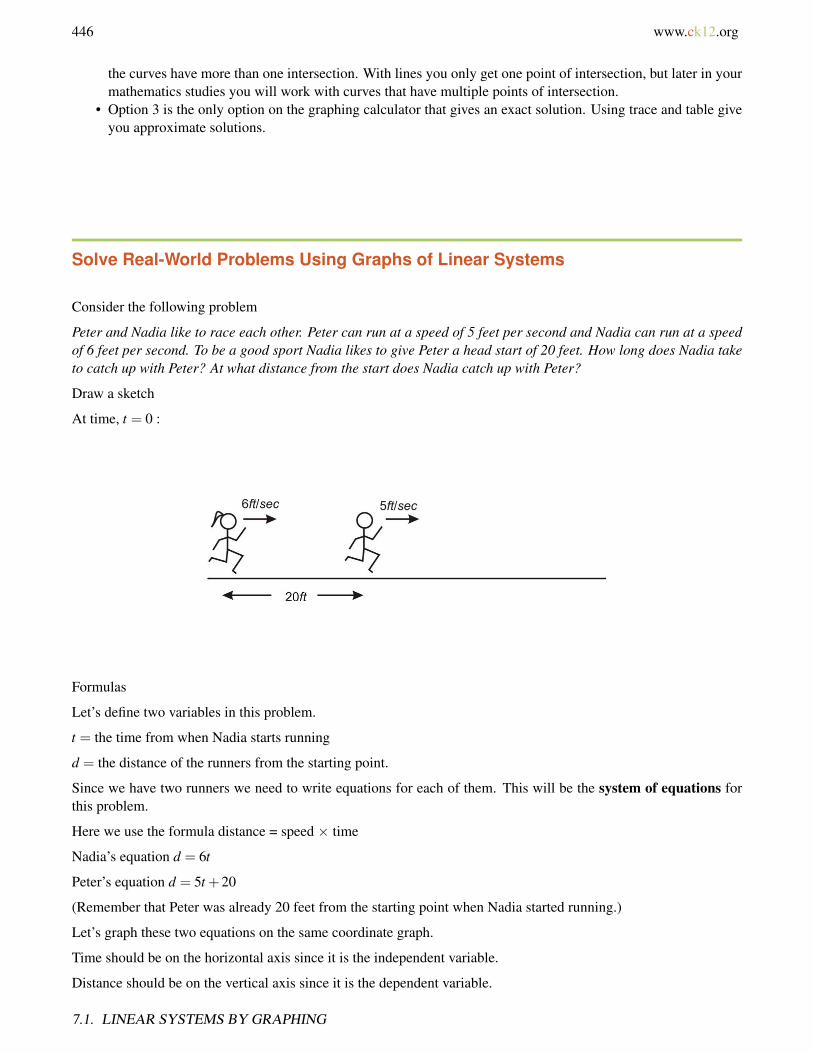
446 www.ck12.org
the curves have more than one intersection. With lines you only get one point of intersection, but later in yourmathematics studies you will work with curves that have multiple points of intersection.
• Option 3 is the only option on the graphing calculator that gives an exact solution. Using trace and table giveyou approximate solutions.
Solve Real-World Problems Using Graphs of Linear Systems
Consider the following problem
Peter and Nadia like to race each other. Peter can run at a speed of 5 feet per second and Nadia can run at a speedof 6 feet per second. To be a good sport Nadia likes to give Peter a head start of 20 feet. How long does Nadia taketo catch up with Peter? At what distance from the start does Nadia catch up with Peter?
Draw a sketch
At time, t = 0 :
Formulas
Let’s define two variables in this problem.
t = the time from when Nadia starts running
d = the distance of the runners from the starting point.
Since we have two runners we need to write equations for each of them. This will be the system of equations forthis problem.
Here we use the formula distance = speed × time
Nadia’s equation d = 6t
Peter’s equation d = 5t +20
(Remember that Peter was already 20 feet from the starting point when Nadia started running.)
Let’s graph these two equations on the same coordinate graph.
Time should be on the horizontal axis since it is the independent variable.
Distance should be on the vertical axis since it is the dependent variable.
7.1. LINEAR SYSTEMS BY GRAPHING
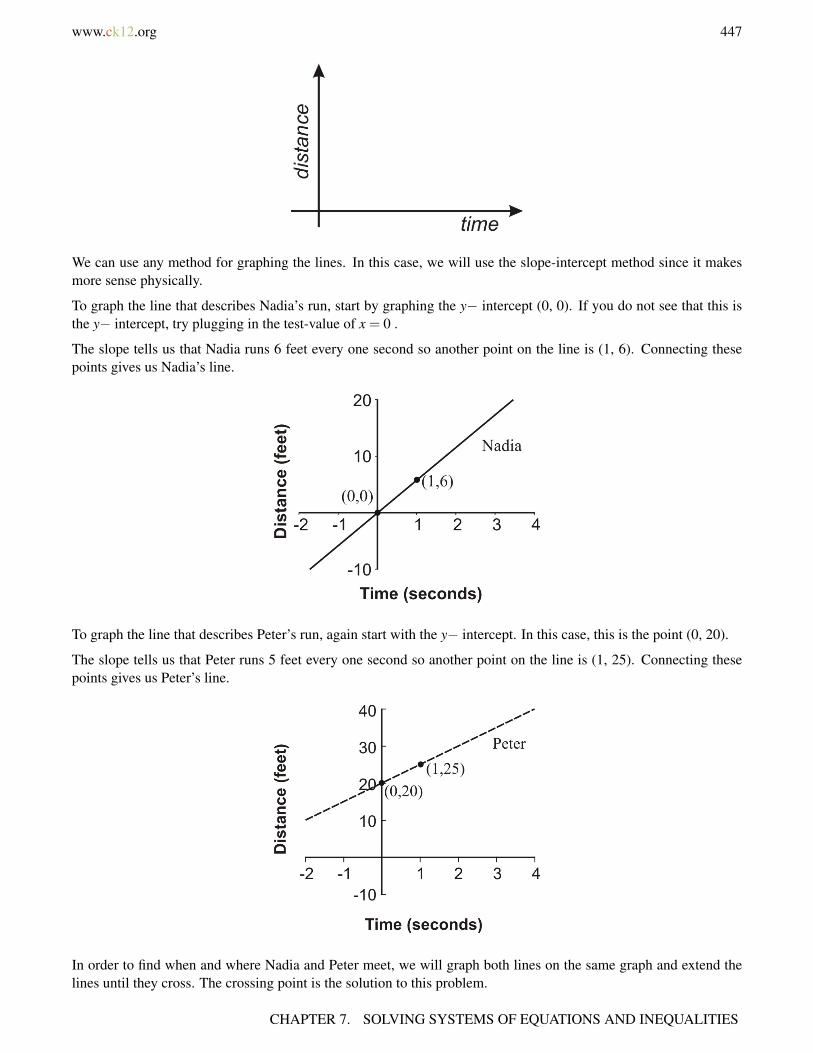
www.ck12.org 447
We can use any method for graphing the lines. In this case, we will use the slope-intercept method since it makesmore sense physically.
To graph the line that describes Nadia’s run, start by graphing the y− intercept (0, 0). If you do not see that this isthe y− intercept, try plugging in the test-value of x = 0 .
The slope tells us that Nadia runs 6 feet every one second so another point on the line is (1, 6). Connecting thesepoints gives us Nadia’s line.
To graph the line that describes Peter’s run, again start with the y− intercept. In this case, this is the point (0, 20).
The slope tells us that Peter runs 5 feet every one second so another point on the line is (1, 25). Connecting thesepoints gives us Peter’s line.
In order to find when and where Nadia and Peter meet, we will graph both lines on the same graph and extend thelines until they cross. The crossing point is the solution to this problem.
CHAPTER 7. SOLVING SYSTEMS OF EQUATIONS AND INEQUALITIES
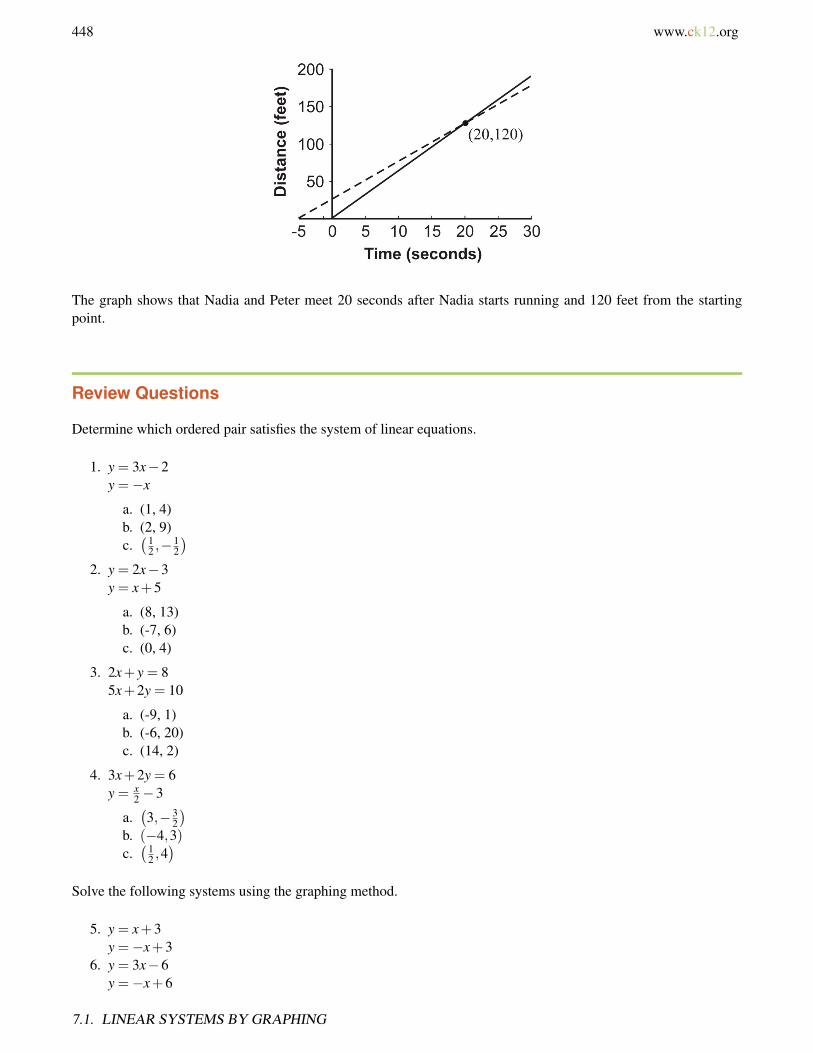
448 www.ck12.org
The graph shows that Nadia and Peter meet 20 seconds after Nadia starts running and 120 feet from the startingpoint.
Review Questions
Determine which ordered pair satisfies the system of linear equations.
1. y = 3x−2y =−x
a. (1, 4)b. (2, 9)c.(1
2 ,−12
)2. y = 2x−3
y = x+5
a. (8, 13)b. (-7, 6)c. (0, 4)
3. 2x+ y = 85x+2y = 10
a. (-9, 1)b. (-6, 20)c. (14, 2)
4. 3x+2y = 6y = x
2 −3
a.(3,−3
2
)b. (−4,3)c.(1
2 ,4)
Solve the following systems using the graphing method.
5. y = x+3y =−x+3
6. y = 3x−6y =−x+6
7.1. LINEAR SYSTEMS BY GRAPHING
www.ck12.org 449
7. 2x = 4y =−3
8. y =−x+5− x+ y = 1
9. x+2y = 85x+2y = 0
10. 3x+2y = 124x− y = 5
11. 5x+2y =−4x− y = 2
12. 2x+4 = 3yx−2y+4 = 0
13. y = x2 −3
2x−5y = 514. y = 4
x = 8−3y
Solve the following problems by using the graphing method.
15. Mary’s car is 10 years old and has a problem. The repair man indicates that it will cost her $1200 to repair hercar. She can purchase a different, more efficient car for $4500. Her present car averages about $2000 per yearfor gas while the new car would average about $1500 per year. Find the number of years for when the totalcost of repair would equal the total cost of replacement.
16. Juan is considering two cell phone plans. The first company charges $120 for the phone and $30 per monthfor the calling plan that Juan wants. The second company charges $40 for the same phone, but charges $45per month for the calling plan that Juan wants. After how many months would the total cost of the two plansbe the same?
17. A tortoise and hare decide to race 30 feet. The hare, being much faster, decided to give the tortoise a headstart of 20 feet. The tortoise runs at 0.5 feet/sec and the hare runs at 5.5 feet per second. How long will it beuntil the hare catches the tortoise?
Review Answers
1. (c)2. (a)3. (b)4. (a)5. (0, 3)6. (3, 3)7. (2, -3)8. (2, 3)9. (-2, 5)
10. (2, 3)11. (0, -2)12. (4, 4)13. (20, 7)14. (-4, 4)15. 6.6 years16. 5.33 months
CHAPTER 7. SOLVING SYSTEMS OF EQUATIONS AND INEQUALITIES

www.ck12.org 451
7.2 Solving Linear Systems by Substitution
Learning Objectives
• Solve systems of equations with two variables by substituting for either variable.• Manipulate standard form equations to isolate a single variable.• Solve real-world problems using systems of equations.• Solve mixture problems using systems of equations.
Introduction
In this lesson, we will learn to solve a system of two equations using the method of substitution.
Solving Linear Systems Using Substitution of Variable Expressions
Let’s look again at the problem involving Peter and Nadia racing.
Peter and Nadia like to race each other. Peter can run at a speed of 5 feet per second and Nadia can run at a speedof 6 feet per second. To be a good sport Nadia likes to give Peter a head start of 20 feet. How long does Nadia taketo catch up with Peter? At what distance from the start does Nadia catch up with Peter?
In that example, we came up with two equations.
Nadiaâ[U+0080][U+0099]s equation d = 6t
Peterâ[U+0080][U+0099]s equation d = 5t +20
We have seen that each relationship produces its own line on a graph, but that to solve the system we find the pointat which the lines intersect (Lesson 1). At that point the values for d and t satisfy both relationships.
In this simple example, this means that the d in Nadia’s equation is the same as the d in Peter’s. We can set the twoequations equal to each other to solve for t .
6t = 5t +20 Subtract 5t from both sides.
t = 20 Substitute this value for t into Nadiaâ[U+0080][U+0099]s equation.
d = 6 ·20 = 120
Even if the equations are not so obvious, we can use simple algebraic manipulation to find an expression for onevariable in terms of the other. We can rearrange Peter’s equation to isolate t .
CHAPTER 7. SOLVING SYSTEMS OF EQUATIONS AND INEQUALITIES
452 www.ck12.org
d = 5t +20 Subtract 20 from both sides.
d−20 = 5t Divide by 5.d−20
5= t
We can now substitute this expression for t into Nadia’s equation (d = 6t) to solve it.
d = 6(
d−205
)Multiply both sides by 5.
5d = 6(d−20) Distribute the 6.
5d = 6d−120 Subtract 6d from both sides.
−d =−120 Divide by −1.
d = 120 Substitute value for d into our expression for t.
t =120−20
5=
1005
= 20
We find that Nadia and Peter meet 20 seconds after they start racing, at a distance of 120 yards away.
The method we just used is called the Substitution Method. In this lesson, you will learn several techniques forisolating variables in a system of equations, and for using the expression you get for solving systems of equationsthat describe situations like this one.
Example 1
Let us look at an example where the equations are written in standard form.
Solve the system
2x+3y = 6
−4x+ y = 2
Again, we start by looking to isolate one variable in either equation. If you look at the second equation, you shouldsee that the coefficient of y is 1. It makes sense to use this equation to solve for y .
Solve the second equation for the y variable:
−4x+ y = 2 Add 4x to both sides.
y = 2+4x
Substitute this expression into the second equation.
2x+3(2+4x) = 6 Distribute the 3.
2x+6+12x = 6 Collect like terms.
14x+6 = 6 Subtract 6 from both sides.
14x = 0
x = 0
7.2. SOLVING LINEAR SYSTEMS BY SUBSTITUTION

www.ck12.org 453
Substitute back into our expression for y .
y = 2+4 ·0 = 2
As you can see, we end up with the same solution (x = 0,y = 2) that we found when we graphed these functions(Lesson 7.1). As long as you are careful with the algebra, the substitution method can be a very efficient way tosolve systems.
Next, consider a more complicated example. In the following example the solution gives fractional answers for bothx and y , and so would be very difficult to solve by graphing alone!
Example 2
Solve the system
2x+3y = 3
2x−3y =−1
Again, we start by looking to isolate one variable in either equation. Right now it doesn’t matter which equation weuse or which variable we solve for.
Solve the first equation for x
2x+3y = 3 Subtract 3y from both sides.
2x = 3−3y Divide both sides by 2.
x =3−3y
2
Substitute this expression into the second equation.
2.12(3−3y)−3y =−1 Cancel the fraction and rewrite terms.
3−3y−3y =−1 Collect like terms.
3−6y =−1 Subtract 3 from both sides.
−6y =−4 Divide by −6.
y =23
Substitute into the expression and solve for x .
x =12
(3− 3
23
)x =
12
So our solution is, x = 12 ,y =
23 . You can see why the graphical solution
(12 ,
23
)might be difficult to read accurately.
CHAPTER 7. SOLVING SYSTEMS OF EQUATIONS AND INEQUALITIES
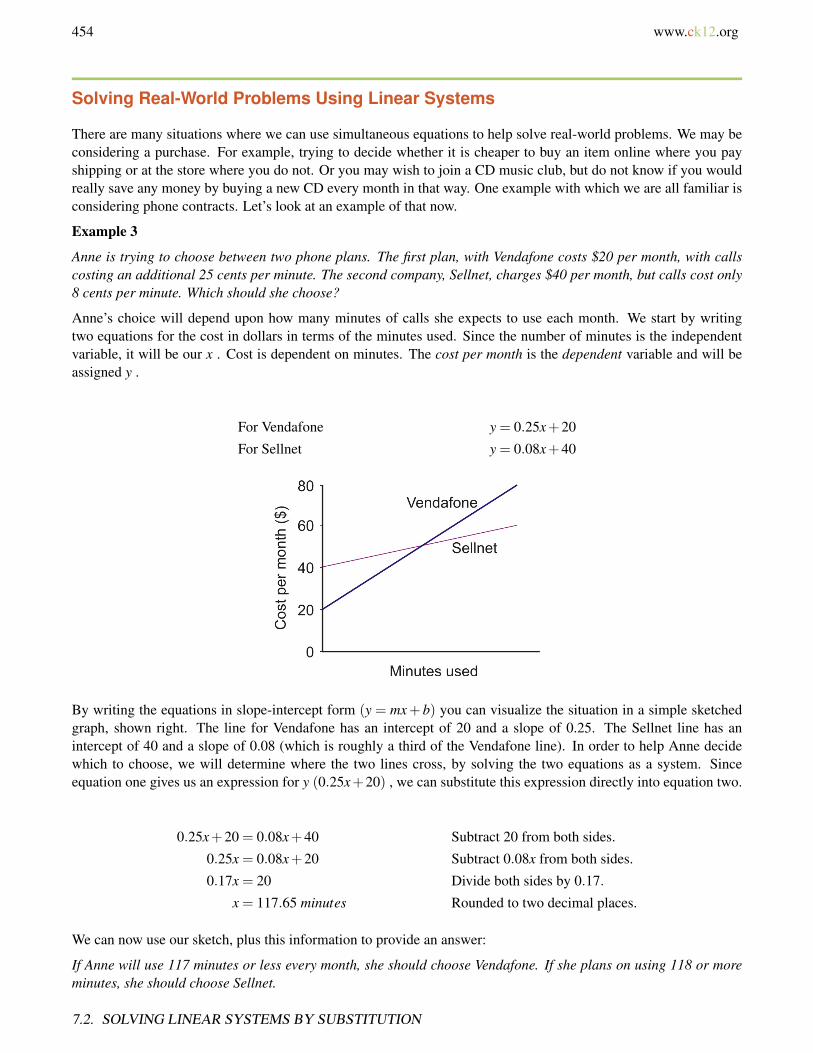
454 www.ck12.org
Solving Real-World Problems Using Linear Systems
There are many situations where we can use simultaneous equations to help solve real-world problems. We may beconsidering a purchase. For example, trying to decide whether it is cheaper to buy an item online where you payshipping or at the store where you do not. Or you may wish to join a CD music club, but do not know if you wouldreally save any money by buying a new CD every month in that way. One example with which we are all familiar isconsidering phone contracts. Let’s look at an example of that now.
Example 3
Anne is trying to choose between two phone plans. The first plan, with Vendafone costs $20 per month, with callscosting an additional 25 cents per minute. The second company, Sellnet, charges $40 per month, but calls cost only8 cents per minute. Which should she choose?
Anne’s choice will depend upon how many minutes of calls she expects to use each month. We start by writingtwo equations for the cost in dollars in terms of the minutes used. Since the number of minutes is the independentvariable, it will be our x . Cost is dependent on minutes. The cost per month is the dependent variable and will beassigned y .
For Vendafone y = 0.25x+20
For Sellnet y = 0.08x+40
By writing the equations in slope-intercept form (y = mx+ b) you can visualize the situation in a simple sketchedgraph, shown right. The line for Vendafone has an intercept of 20 and a slope of 0.25. The Sellnet line has anintercept of 40 and a slope of 0.08 (which is roughly a third of the Vendafone line). In order to help Anne decidewhich to choose, we will determine where the two lines cross, by solving the two equations as a system. Sinceequation one gives us an expression for y (0.25x+20) , we can substitute this expression directly into equation two.
0.25x+20 = 0.08x+40 Subtract 20 from both sides.
0.25x = 0.08x+20 Subtract 0.08x from both sides.
0.17x = 20 Divide both sides by 0.17.
x = 117.65 minutes Rounded to two decimal places.
We can now use our sketch, plus this information to provide an answer:
If Anne will use 117 minutes or less every month, she should choose Vendafone. If she plans on using 118 or moreminutes, she should choose Sellnet.
7.2. SOLVING LINEAR SYSTEMS BY SUBSTITUTION
www.ck12.org 455
Mixture Problems
Systems of equations crop up frequently when considering chemicals in solutions, and can even be seen in thingslike mixing nuts and raisins or examining the change in your pocket! Let’s look at some examples of these.
Example 4
Nadia empties her purse and finds that it contains only nickels (worth 5 cents each) and dimes (worth 10 cents each).If she has a total of 7 coins and they have a combined value of 55 cents, how many of each coin does she have?
Since we have two types of coins, let’s call the number of nickels x and the number of dimes will be our y . We aregiven two key pieces of information to make our equations, the number of coins and their value.
Number of coins equation x+ y = 7 (number of nickels)+ (number of dimes)
The value equation 5x+10y = 55 Since nickels are worth five cents and dimes ten cents
We can quickly rearrange the first equation to isolate x .
x = 7− y Now substitute into equation two.
5(7− y)+10y = 55 Distribute the 5.
35−5y+10y = 55 Collect like terms.
35+5y = 55 Subtract 35 from both sides.
5y = 20 Divide by 5.
y = 4 Substitute back into equation one.
+4 = 7 Subtract 4 from both sides.
x = 3
Solution
Nadia has 3 nickels and 4 dimes.
Sometimes the question asks you to determine (from concentrations) how much of a particular substance to use.The substance in question could be something like coins as above, or it could be a chemical in solution, or evenheat. In such a case, you need to know the amount of whatever substance is in each part. There are several commonsituations where to get one equation you simply add two given quantities, but to get the second equation you needto use a product. Three examples are below.
CHAPTER 7. SOLVING SYSTEMS OF EQUATIONS AND INEQUALITIES

456 www.ck12.org
TABLE 7.5:
Type of Mixture First Equation Second EquationCoins (items with $ value) Total number of items (n1 n2) Total value (item value × no. of
items)Chemical solutions Total solution volume (V1 +V2) Amount of solute (vol × concentra-
tion)Density of two substances Total amount or volume of mix Total mass (volume × density)
For example, when considering mixing chemical solutions, we will most likely need to consider the total amount ofsolute in the individual parts and in the final mixture. A solute is simply the chemical that is dissolved in a solution.An example of a solute is salt when added to water to make a brine. Even if the chemical is more exotic, we are stillinterested in the total amount of that chemical in each part. To find this, simply multiply the amount of the mixtureby the fractional concentration. To illustrate, let’s look at an example where you are given amounts relative to thewhole.
Example 5
A chemist needs to prepare 500 ml of copper-sulfate solution with a 15% concentration. In order to do this, hewishes to use a high concentration solution (60%) and dilute it with a low concentration solution (5%). How muchof each solution should he use?
To set this problem up, we first need to define our variables. Our unknowns are the amount of concentrated solution(x) and the amount of dilute solution (y) . We will also convert the percentages (60%, 15% and 5%) into decimals(0.6, 0.15 and 0.05). The two pieces of critical information we need is the final volume (500 ml) and the final amountof solute (15% of 500 ml = 75 ml ). Our equations will look like this.
Volume equation x+ y = 500
Solute equation 0.6x+0.05y = 75
You should see that to isolate a variable for substitution it would be easier to start with equation one.
7.2. SOLVING LINEAR SYSTEMS BY SUBSTITUTION

www.ck12.org 457
x+ y = 500 Subtract y from both sides.
x = 500− y Now substitute into equation two.
0.6(500− y)+0.05y = 75 Distribute the 6.
300−0.6y+0.05y = 75 Collect like terms.
300−0.55y = 75 Subtract 300 from both sides.
−0.55y =−225 Divide both sides by −0.55.
y = 409 ml Substitute back into equation for x.
x = 500−409 = 91 ml
Solution
The chemist should mix 91 ml of the 60% solution with 409 ml of the 5% solution.
Review Questions
1. Solve the system: x+2y = 93x+5y = 20
2. solve the system. x−3y = 102x+ y = 13
3. Of the two non-right angles in a right angled triangle, one measures twice that of the other. What are theangles?
4. The sum of two numbers is 70. They differ by 11. What are the numbers?5. A rectangular field is enclosed by a fence on three sides and a wall on the fourth side. The total length of the
fence is 320 yards. If the field has a total perimeter of 400 yards, what are the dimensions of the field?
6. A ray cuts a line forming two angles. The difference between the two angles is 18 . What does each anglemeasure?
7. I have $15 and wish to buy five pounds of mixed nuts for a party. Peanuts cost $2.20 per pound. Cashews cost$4.70 per pound. How many pounds of each should I buy?
CHAPTER 7. SOLVING SYSTEMS OF EQUATIONS AND INEQUALITIES
458 www.ck12.org
8. A chemistry experiment calls for one liter of sulfuric acid at a 15% concentration, but the supply room onlystocks sulfuric acid in concentrations of 10% and in 35%. How many liters of each should be mixed to givethe acid needed for the experiment?
9. Bachelle wants to know the density of her bracelet, which is a mix of gold and silver. Density is total massdivided by total volume. The density of gold is 19.3 g/cc and the density of silver is 10.5 g/cc. The jewelertold her that the volume of silver used was 10 cc and the volume of gold used was 20 cc. Find the combineddensity of her bracelet.
Review Answers
1. x =−5,y = 72. x = 7,y =−13. x = 30,y = 60
4. 29.5 and 40.55. x = 120 yards,y = 80 yards6. x = 81,y = 99
7. 3.4 pounds of peanuts, 1.6 pounds of cashews8. 0.8 liters of 10%, 0.2 liters of 35%9. 16.4 g/cc
7.2. SOLVING LINEAR SYSTEMS BY SUBSTITUTION
www.ck12.org 459
7.3 Solving Linear Systems by Eliminationthrough Addition or Subtraction
Learning Objectives
• Solve a linear system of equations using elimination by addition.• Solve a linear system of equations using elimination by subtraction.• Solve real-world problems using linear systems by elimination.
Introduction
In this lesson, we will look at using simple addition and subtraction to simplify our system of equations to a singleequation involving a single variable. Because we go from two unknowns ( x and y ) to a single unknown (either xor y ) this method is often referred to as solving by elimination. We eliminate one variable in order to make ourequations solvable! To illustrate this idea, let’s look at the simple example of buying apples and bananas.
Example 1
If one apple plus one banana costs $1.25 and one apple plus two bananas costs $2.00, how much does it cost forone banana? One apple?
It shouldn’t take too long to discover that each banana costs $0.75. You can see this by looking at the differencebetween the two situations. Algebraically, using a and b as the cost for apples and bananas, we get the followingequations.
a+b = 1.25
a+2b = 2.00
If you look at the difference between the two equations you see that the difference in items purchased is one banana,and the difference in money paid is 75 cents. So one banana costs 75 cents.
(a+2b)− (a+b) = 2.00−1.25⇒ b = 0.75
To find out how much one apple costs, we subtract $0.75 from the cost of one apple and one banana. So an applecosts 50 cents.
a+0.75 = 1.25⇒ a = 1.25−0.75⇒ a = 0.50
To solve systems using addition and subtraction, we will be using exactly this idea. By looking at the sum ordifference of the two equations, we can determine a value for one of the unknowns.
CHAPTER 7. SOLVING SYSTEMS OF EQUATIONS AND INEQUALITIES
460 www.ck12.org
Solving Linear Systems Using Addition of Equations
Often considered the easiest and most powerful method of solving systems of equations, the addition (or elimination)method requires us to combine two equations in such a way that the resulting equation has only one variable. We canthen use simple linear algebra methods of solving for that variable. If required, we can always substitute the valuewe get for that variable back in either one of the original equations to solve for the remaining unknown variable.
Example 2
Solve the system by addition:
3x+2y = 11
5x−2y = 13
We will add everything on the left of the equals sign from both equations, and this will be equal to the sum ofeverything on the right.
(3x+2y)+(5x−2y) = 11+13⇒ 8x = 24⇒ x = 3
A simpler way to visualize this is to keep the equations as they appear above, and to add in columns. However, justlike adding units tens and hundreds, you MUST keep x ’s and y ’s in their own columns. You may also wish to useterms like “ 0y ” as a placeholder!
3x+2y = 11
+(3x−2y) = 13
8x+0y = 24
Again we get 8x = 24 or x = 3 .
To find a value for y we simply substitute our value for x back in.
Substitute x = 3 into the second equation.
5 ·3−2y = 13 Since 5×3 = 15, we subtract 15 from both sides.
−2y =−2 Divide by 2 to get the value for y.
y = 1
The first example has a solution at x = 3 and y = 1 . You should see that the method of addition works when thecoefficients of one of the variables are opposites. In this case it is the coefficients of y that are opposites, being +2 inthe first equation and -2 in the second.
There are other, similar, methods we can use when the coefficients are not opposites, but for now let’s look at anotherexample that can be solved with the method of addition.
Example 3
7.3. SOLVING LINEAR SYSTEMS BY ELIMINATION THROUGH ADDITION OR SUBTRACTION
www.ck12.org 461
Andrew is paddling his canoe down a fast moving river. Paddling downstream he travels at 7 miles per hour, relativeto the river bank. Paddling upstream, he moves slower, traveling at 1.5 miles per hour. If he paddles equally hard inboth directions, calculate, in miles per hour, the speed of the river and the speed Andrew would travel in calm water.
Step One First, we convert our problem into equations. We have two unknowns to solve for, so we will call the speedthat Andrew paddles at x , and the speed of the river y . When traveling downstream, Andrew’s speed is boosted bythe river current, so his total speed is the canoe speed plus the speed of the river (x+ y) . Upstream, his speed ishindered by the speed of the river. His speed upstream is (x− y) .
Downstream Equation x+ y = 7
Upstream Equation x− y = 1.5
Step Two Next, we are going to eliminate one of the variables. If you look at the two equations, you can see thatthe coefficient of y is +1 in the first equation and -1 in the second. Clearly (+1)+(−1) = 0 , so this is the variablewe will eliminate. To do this we add equation 1 to equation 2. We must be careful to collect like terms, and thateverything on the left of the equals sign stays on the left, and everything on the right stays on the right:
(x+ y)+(x− y) = 7+1.5⇒ 2x = 8.5⇒ x = 4.25
Or, using the column method we used in example one.
x+ y = 7
+ (x− y) = 1.5
2x+0y = 8.5
Again you see we get 2x = 8.5 , or x = 4.25 . To find a corresponding value for y , we plug our value for x into eitherequation and isolate our unknown. In this example, we’ll plug it into the first equation.
Substitute x = 3 into the second equation:
4.25+ y = 7 Subtract 4.25 from both sides.
y = 2.75
Solution
Andrew paddles at 4.25 miles per hour. The river moves at 2.75 miles per hour.
CHAPTER 7. SOLVING SYSTEMS OF EQUATIONS AND INEQUALITIES
462 www.ck12.org
Solving Linear Systems Using Subtraction of Equations
Another, very similar method for solving systems is subtraction. In this instance, you are looking to have identicalcoefficients for x or y (including the sign) and then subtract one equation from the other. If you look at Example oneyou can see that the coefficient for x in both equations is +1. You could have also used the method of subtraction.
(x+ y)− (x− y) = 200−80⇒ 2y = 120⇒ y = 60
or
x+ y = 200
+ (x− y) =−80
0x+2y = 120
So again we get y = 60 , from which we can determine x . The method of subtraction looks equally straightforward,and it is so long as you remember the following:
a. Always put the equation you are subtracting in parentheses, and distribute the negative.b. Don’t forget to subtract the numbers on the right hand side.c. Always remember that subtracting a negative is the same as adding a positive.
Example 4
Peter examines the coins in the fountain at the mall. He counts 107 coins, all of which are either pennies or nickels.The total value of the coins is $3.47. How many of each coin did he see?
We have two types of coins. Let’s call the number of pennies x and the number of nickels y . The total value ofpennies is just x , since they are worth one cent each. The total value of nickels is 5y . We are given two key piecesof information to make our equations. The number of coins and their value.
Number of Coins Equation x+ y = 107 (number of pennies)+ (number of nickels)
The Value Equation: x+5y = 347 pennies are worth 1c,nickels are worth 5c.
We will jump straight to the subtraction of the two equations.
x+ y = 107
+ (x+5y) =−347
4y =−240
Let’s substitute this value back into the first equation.
x+60 = 107 Subtract 60 from both sides.
x = 47
So Peter saw 47 pennies (worth 47 cents) and 60 nickels (worth $3.00) for a total of $3.47.
We have now learned three techniques for solving systems of equations.
7.3. SOLVING LINEAR SYSTEMS BY ELIMINATION THROUGH ADDITION OR SUBTRACTION
www.ck12.org 463
a. Graphingb. Substitutionc. Elimination
You should be starting to gain an understanding of which method to use when given a particular problem. Forexample, graphing is a good technique for seeing what the equations are doing, and when one service is lessexpensive than another. Graphing alone may not be ideal when an exact numerical solution is needed.
Similarly, substitution is a good technique when one of the coefficients in your equation is +1 or -1.
Addition or subtraction is ideal when the coefficient of one of the variables matches the coefficient of the samevariable in the other equation. In the next lesson, we will learn the last technique for solving systems of equationsexactly, when none of the coefficients match and the coefficient is not one.
Multimedia Link The following video contains three examples of solving systems of equations using multiplicationand addition and subtraction as well as multiplication (which is the next topic). http://www.youtube.com/watch?v=nok99JOhcjo (9:57)
MEDIAClick image to the left for more content.
. Note that the narrator is not always careful about showing his work, and you should try to be neater in yourmathematical writing.
Review Questions
1. Solve the system: 3x+4y = 2.55x−4y = 25.5
2. Solve the system 5x+7y =−315x−9y = 17
3. Solve the system 3y−4x =−335x−3y = 40.5
4. Nadia and Peter visit the candy store. Nadia buys three candy bars and four fruit roll-ups for $2.84. Peter alsobuys three candy bars, but can only afford one additional fruit roll-up. His purchase costs $1.79. What is thecost of each candy bar and each fruit roll-up?
5. A small plane flies from Los Angeles to Denver with a tail wind (the wind blows in the same direction as theplane) and an air-traffic controller reads its ground-speed (speed measured relative to the ground) at 275 milesper hour. Another, identical plane, moving in the opposite direction has a ground-speed of 227 miles per hour.Assuming both planes are flying with identical air-speeds, calculate the speed of the wind.
6. An airport taxi firm charges a pick-up fee, plus an additional per-mile fee for any rides taken. If a 12 milesjourney costs $14.29 and a 17 miles journey costs $19.91, calculate:
a. the pick-up feeb. the per-mile ratec. the cost of a seven mile trip
7. Calls from a call-box are charged per minute at one rate for the first five minutes, then a different rate for eachadditional minute. If a seven minute call costs $4.25 and a 12 minute call costs $5.50, find each rate.
CHAPTER 7. SOLVING SYSTEMS OF EQUATIONS AND INEQUALITIES
464 www.ck12.org
8. A plumber and a builder were employed to fit a new bath, each working a different number of hours. Theplumber earns $35 per hour, and the builder earns $28 per hour. Together they were paid $330.75, but theplumber earned $106.75 more than the builder. How many hours did each work?
9. Paul has a part time job selling computers at a local electronics store. He earns a fixed hourly wage, but canearn a bonus by selling warranties for the computers he sells. He works 20 hours per week. In his first week,he sold eight warranties and earned $220. In his second week, he managed to sell 13 warranties and earned$280. What is Paul’s hourly rate, and how much extra does he get for selling each warranty?
Review Answers
1. x = 3.5,y =−22. x =−2,y =−33. x = 7.5,y =−14. Candy bars cost 48 cents each and fruit roll-ups cost 35 cents each.5. The wind speed is 24 mph
a. $.80b. $1.12c. $8.64
6. 75 cents per minute for the first 5 mins, 25 cents per minute additional7. The plumber works 6.25 hours, the builder works 4 hours8. Paul earns a base of $7.00 per hour
7.3. SOLVING LINEAR SYSTEMS BY ELIMINATION THROUGH ADDITION OR SUBTRACTION

www.ck12.org 465
7.4 Solving Systems of Equations byMultiplication
Learning objectives
• Solve a linear system by multiplying one equation.• Solve a linear system of equations by multiplying both equations.• Compare methods for solving linear systems.• Solve real-world problems using linear systems by any method.
Introduction
We have now learned three techniques for solving systems of equations.
• Graphing, Substitution and Elimination (through addition and subtraction).
Each one of these methods has both strengths and weaknesses.
• Graphing is a good technique for seeing what the equations are doing, and when one service is less expensivethan another, but graphing alone to find a solution can be imprecise and may not be good enough when anexact numerical solution is needed.
• Substitution is a good technique when one of the coefficients in an equation is +1 or -1, but can lead to morecomplicated formulas when there are no unity coefficients.
• Addition or Subtraction is ideal when the coefficients of either x or y match in both equations, but so far wehave not been able to use it when coefficients do not match.
In this lesson, we will again look at the method of elimination that we learned in Lesson 7.3. However, the equationswe will be working with will be more complicated and one can not simply add or subtract to eliminate one variable.Instead, we will first have to multiply equations to ensure that the coefficients of one of the variables are matched inthe two equations.
Quick Review: Multiplying Equations
Consider the following questions
a. If 10 apples cost $5, how much would 30 apples cost?b. If 3 bananas plus 2 carrots cost $4, how much would 6 bananas plus 4 carrots cost?
You can look at the first equation, and it should be obvious that each apple costs $0.50. 30 apples should cost $15.00.
Looking at the second equation, it is not clear what the individual price is for either bananas or carrots. Yet we knowthat the answer to question two is $8.00. How?
If we look again at question one, we see that we can write the equation 10a = 5 ( a being the cost of one apple).
CHAPTER 7. SOLVING SYSTEMS OF EQUATIONS AND INEQUALITIES
466 www.ck12.org
To find the cost of 30, we can either solve for a them multiply by 30, or we can multiply both sides of the equationby three.
30a = 15
a =12
or 0.5
Now look at the second question. We could write the equation 3b+2c = 4 .
We see that we need to solve for (6b+4c) which is simply two times the quantity (3b+2c) !
Algebraically, we are simply multiplying the entire equation by two.
2(3b+2c) = 2 ·4 Distribute and multiply.
6b+4c = 8
So when we multiply an equation, all we are doing is multiplying every term in the equation by a fixed amount.
Solving a Linear System by Multiplying One Equation
We can multiply every term in an equation by a fixed number (a scalar), it is clear that we could use the additionmethod on a whole new set of linear systems. We can manipulate the equations in a system to ensure that thecoefficients of one of the variables match. In the simplest case, the coefficient as a variable in one equation will be amultiple of the coefficient in the other equation.
Example 1
Solve the system.
7x+4y = 17
5x−2y = 11
It is quite simple to see that by multiplying the second equation by two the coefficients of y will be +4 and -4,allowing us to complete the solution by addition.
Take two times equation two and add it to equation one. Then divide both sides by 17 to find x .
10x−4y = 22
+(7x+4y) = 17
17y = 34
x = 2
Now simply substitute this value for x back into equation one.
7 ·2+4y = 17 Since 7×2 = 14, subtract 14 from both sides.
4y = 3 Divide by 4.
y = 0.75
7.4. SOLVING SYSTEMS OF EQUATIONS BY MULTIPLICATION

www.ck12.org 467
Example 2
Anne is rowing her boat along a river. Rowing downstream, it takes her two minutes to cover 400 yards. Rowingupstream, it takes her eight minutes to travel the same 400 yards. If she was rowing equally hard in both directions,calculate, in yards per minute, the speed of the river and the speed Anne would travel in calm water.
Step One First we convert our problem into equations. We need to know that distance traveled is equal to speed xtime. We have two unknowns, so we will call the speed of the river x , and the speed that Anne rows at y . Whentraveling downstream her total speed is the boat speed plus the speed of the river (x+ y) . Upstream her speed ishindered by the speed of the river. Her speed upstream is (x− y) .
Downstream Equation 2(x+ y) = 400
Upstream Equation 8(x− y) = 400
Distributing gives us the following system.
2x+2y = 400
8x−8y = 400
Right now, we cannot use the method of elimination as none of the coefficients match. But, if we were to multiplythe top equation by four, then the coefficients of y would be +8 and -8. Let’s do that.
8x−8y = 1,600
+ (8x−8y) = 400
16x = 2,000
Now we divide by 16 to obtain x = 125 .
Substitute this value back into the first equation.
2(125+ y) = 400 Divide both sides by 2.
125+ y = 200 Subtract 125 from both sides.
y = 75
Solution
Anne rows at 125 yards per minute, and the river flows at 75 yards per minute.
Solve a Linear System by Multiplying Both Equations
It is a straightforward jump to see what would happen if we have no matching coefficients and no coefficients thatare simple multiples of others. Just think about the following fraction sum.
12+
13=
36+
26=
56
CHAPTER 7. SOLVING SYSTEMS OF EQUATIONS AND INEQUALITIES
468 www.ck12.org
This is an example of finding a lowest common denominator. In a similar way, we can always find a lowestcommon multiple of two numbers (the lowest common multiple of 2 and 3 is 6). This way we can always find away to multiply equations such that two coefficients match.
Example 3
Andrew and Anne both use the I-Haul truck rental company to move their belongings from home to the dorm roomson the University of Chicago campus. I-Haul has a charge per day and an additional charge per mile. Andrewtravels from San Diego, California, a distance of 2,060 miles in five days. Anne travels 880 miles from Norfolk,Virginia, and it takes her three days. If Anne pays $840 and Andrew pays $1845, what does I-Haul charge
a) per day?
b) per mile traveled?
First, we will set-up our equations. Again we have two unknowns, the daily rate (we will call this x ), and the rateper mile (let’s call this y ).
Anneâ[U+0080][U+0099]s equation 3x+880y = 840
Andrewâ[U+0080][U+0099]s Equation 5x+2060y = 1845
We cannot simply multiply a single equation by an integer number in order to arrive at matching coefficients. Butif we look at the coefficients of x (as they are easier to deal with than the coefficients of y ) we see that they bothhave a common multiple of 15 (in fact 15 is the lowest common multiple). So this time we need to multiply bothequations:
Multiply Anne’s equation by five:
15x+4400y = 4200
Multiply Andrew’s equation by three:
15x+6180y = 5535
Subtract:
15x+4400y = 4200
− (15x+6180y) = 5535
−1780y =−1335
Divide both sides by -1780
y = 0.75
Substitute this back into Anne’s equation.
3x+880(0.75) = 840 Since 880×0.75 = 660, subtract 660 from both sides.
3x = 180 Divide both sides by 3.
x = 60
7.4. SOLVING SYSTEMS OF EQUATIONS BY MULTIPLICATION

www.ck12.org 469
Solution
I-Haul charges $60 per day plus $0.75 per mile.
Comparing Methods for Solving Linear Systems
Now that we have covered the major methods for solving linear equations, let’s review. For simplicity, we will lookat the four methods (we will consider addition and subtraction one method) in table form. This should help youdecide which method would be better for a given situation.
TABLE 7.6:
Method: Best used when you... Advantages: Comment:Graphing ...don’t need an accurate
answer.Often easier to see num-ber and quality of inter-sections on a graph. Witha graphing calculator, itcan be the fastest methodsince you don’t have to doany computation.
Can lead to imprecise an-swers with non-integer so-lutions.
Substitution ...have an explicit equa-tion for one variable (e.g.y = 14x+2 )
Works on all systems. Re-duces the system to onevariable, making it easierto solve.
You are not often givenexplicit functions in sys-tems problems, thus it canlead to more complicatedformulas
Elimination by Additionor Subtraction
...have matching coeffi-cients for one variable inboth equations.
Easy to combine equa-tions to eliminate onevariable. Quick to solve.
It is not very likely thata given system will havematching coefficients.
Elimination by Multipli-cation and then Additionand Subtraction
...do not have any vari-ables defined explicitly orany matching coefficients.
Works on all systems.Makes it possible to com-bine equations to elimi-nate one variable.
Often more algebraic ma-nipulation is needed toprepare the equations.
The table above is only a guide. You may like to use the graphical method for every system in order to betterunderstand what is happening, or you may prefer to use the multiplication method even when a substitution wouldwork equally well.
Example 4
Two angles are complementary when the sum of their angles is 90 . Angles A and B are complementary angles, andtwice the measure of angle A is 9 more than three times the measure of angle B . Find the measure of each angle.
First, we write out our two equations. We will use x to be the measure of Angle A and y to be the measure of AngleB . We get the following system
x+ y = 90
2x = 3y+9
The first method we will use to solve this system is the graphical method. For this we need to convert the twoequations to y = mx+b form
CHAPTER 7. SOLVING SYSTEMS OF EQUATIONS AND INEQUALITIES
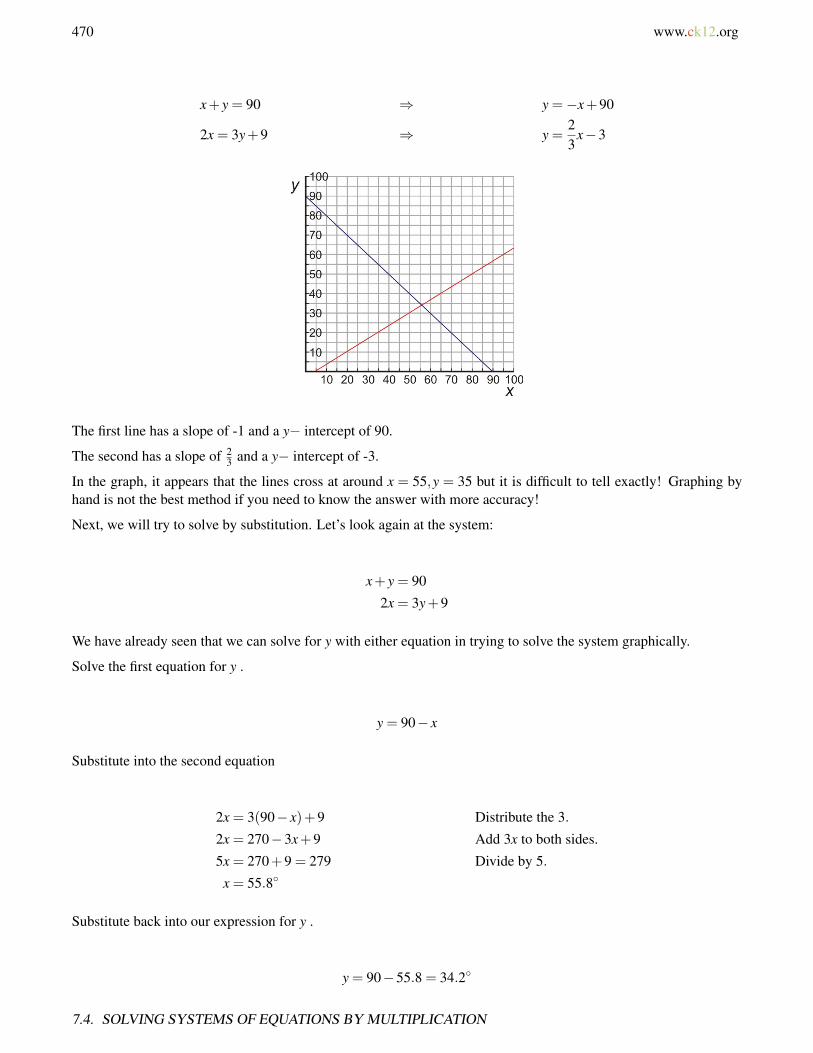
470 www.ck12.org
x+ y = 90 ⇒ y =−x+90
2x = 3y+9 ⇒ y =23
x−3
The first line has a slope of -1 and a y− intercept of 90.
The second has a slope of 23 and a y− intercept of -3.
In the graph, it appears that the lines cross at around x = 55,y = 35 but it is difficult to tell exactly! Graphing byhand is not the best method if you need to know the answer with more accuracy!
Next, we will try to solve by substitution. Let’s look again at the system:
x+ y = 90
2x = 3y+9
We have already seen that we can solve for y with either equation in trying to solve the system graphically.
Solve the first equation for y .
y = 90− x
Substitute into the second equation
2x = 3(90− x)+9 Distribute the 3.
2x = 270−3x+9 Add 3x to both sides.
5x = 270+9 = 279 Divide by 5.
x = 55.8
Substitute back into our expression for y .
y = 90−55.8 = 34.2
7.4. SOLVING SYSTEMS OF EQUATIONS BY MULTIPLICATION
www.ck12.org 471
Solution
Angle A measures 55.8 . Angle B measures 34.2
Finally, we will examine the method of elimination by multiplication.
Rearrange equation one to standard form
x+ y = 90⇒ 2x+2y = 180
Multiply equation two by two.
2x = 3y+9⇒ 2x−3y = 9
Subtract.
2x+2y = 180
− (2x−2y) =−9
5y = 171
Divide both sides by 5
y = 34.2
Substitute this value into the very first equation.
x+34.2 = 90 Subtract 34.2 from both sides.
x = 55.8
Solution
Angle A measures 55.8 . Angle B measures 34.2 .
Even though this system looked ideal for substitution, the method of multiplication worked well, also. Once thealgebraic manipulation was performed on the equations, it was a quick solution. You will need to decide yourselfwhich method to use in each case you see from now on. Try to master all techniques, and recognize which techniquewill be most efficient for each system you are asked to solve.
Multimedia Link For even more practice, we have this video. One common type of problem involving systemsof equations (especially on standardized tests) is “age problems”. In the following video the narrator shows twoexamples of age problems, one involving a single person and one involving two people. http://www.youtube.com/watch?v=bAUT_Pux73w (7:13)
MEDIAClick image to the left for more content.
.
CHAPTER 7. SOLVING SYSTEMS OF EQUATIONS AND INEQUALITIES
472 www.ck12.org
Review Questions
1. Solve the following systems using multiplication.
a. 5x−10y = 153x−2y = 3
b. 5x− y = 103x−2y =−1
c. 5x+7y = 157x−3y = 5
d. 9x+5y = 912x+8y = 12.8
e. 4x−3y = 13x−4y = 4
f. 7x−3y =−36x+4y = 3
2. Solve the following systems using any method.
a. x = 3yx−2y =−3
b. y = 3x+2y =−2x+7
c. 5x−5y = 55x+5y = 35
d. y =−3x−33x−2y+12 = 0
e. 3x−4y = 34y+5x = 10
f. 9x−2y =−42x−6y = 1
3. Supplementary angles are two angles whose sum is 180 . Angles A and B are supplementary angles. Themeasure of Angle A is 18 less than twice the measure of Angle B . Find the measure of each angle.
4. A farmer has fertilizer in 5% and 15% solutions. How much of each type should he mix to obtain 100 litersof fertilizer in a 12% solution?
5. A 150 yards pipe is cut to provide drainage for two fields. If the length of one piece is three yards less thattwice the length of the second piece, what are the lengths of the two pieces?
6. Mr. Stein invested a total of $100, 000 in two companies for a year. Company A’s stock showed a 13% annualgain, while Company B showed a 3% loss for the year. Mr. Stein made an 8% return on his investment overthe year. How much money did he invest in each company?
7. A baker sells plain cakes for $7 or decorated cakes for $11. On a busy Saturday the baker started with 120cakes, and sold all but three. His takings for the day were $991. How many plain cakes did he sell that day,and how many were decorated before they were sold?
8. Twice John’s age plus five times Claire’s age is 204. Nine times John’s age minus three times Claire’s age isalso 204. How old are John and Claire?
Review Answers
1. a. x = 0,y =−1.5
7.4. SOLVING SYSTEMS OF EQUATIONS BY MULTIPLICATION
www.ck12.org 473
b. x = 3,y = 5c. x = 1.25,y = 1.25d. x = 2
3 ,y =35
e. x =−87 ,y =−
137
f. x =− 346 ,y =
3946
a. x =−9,y =−3b. x = 1,y = 5c. x = 4,y = 3d. x =−2,y = 3e. x = 13
8 ,y =1532
f. x =−1325 ,y =−
1750
2. A = 114,B = 66
3. 30 liters of 5%, 70 liters of 15%4. 51 yards and 99 yards5. $68, 750 in Company A, $31, 250 in Company B6. 74 plain, 43 decorated7. John is 32, Claire is 28
CHAPTER 7. SOLVING SYSTEMS OF EQUATIONS AND INEQUALITIES
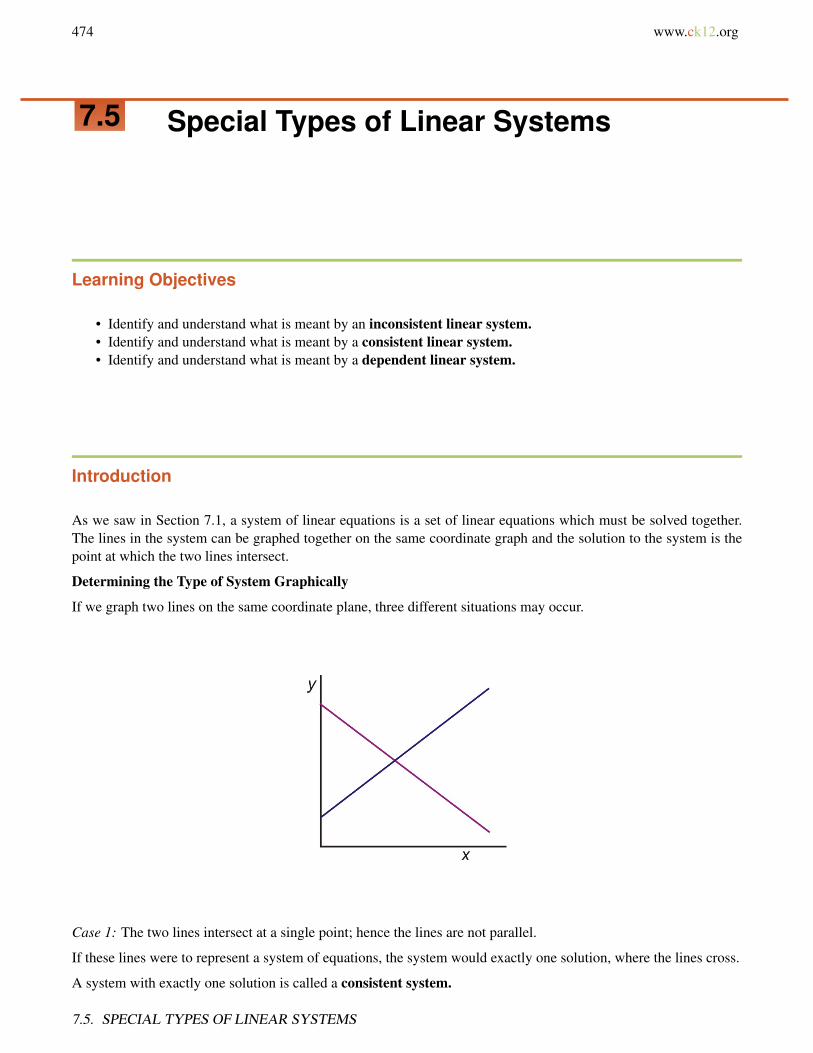
474 www.ck12.org
7.5 Special Types of Linear Systems
Learning Objectives
• Identify and understand what is meant by an inconsistent linear system.• Identify and understand what is meant by a consistent linear system.• Identify and understand what is meant by a dependent linear system.
Introduction
As we saw in Section 7.1, a system of linear equations is a set of linear equations which must be solved together.The lines in the system can be graphed together on the same coordinate graph and the solution to the system is thepoint at which the two lines intersect.
Determining the Type of System Graphically
If we graph two lines on the same coordinate plane, three different situations may occur.
Case 1: The two lines intersect at a single point; hence the lines are not parallel.
If these lines were to represent a system of equations, the system would exactly one solution, where the lines cross.
A system with exactly one solution is called a consistent system.
7.5. SPECIAL TYPES OF LINEAR SYSTEMS

www.ck12.org 475
Case 2: The two lines do not intersect. The two lines are parallel.
If the lines represent a system of equations, then the system has no solutions.
A system with no solutions is called an inconsistent system.
Case 3: The two lines are identical. They intersect at all points on the line.
If this were a system of equations it would have an infinite number of solutions. Reason being, the two equationsare really the same.
Such a system is called a dependent system.
To identify a system as consistent, inconsistent, or dependent, we can graph the two lines on the same graph andmatch the system with one of the three cases we discussed.
Another option is to write each line in slope-intercept form and compare the slopes and y− intercepts of the twolines. To do this we must remember that:
• Lines that intersect have different slopes.• Lines that are parallel have the same slope but different y− intercepts.• Lines that have the same slope and the same y− intercepts are identical.
Example 1
Determine whether the following system has exactly one solution, no solutions, or an infinite number of solutions.
y = 3x+2
y =−2x+1
Solution
CHAPTER 7. SOLVING SYSTEMS OF EQUATIONS AND INEQUALITIES

476 www.ck12.org
The equations are already in slope-intercept form. The slope of the first equation is 3 and the slope of the secondequation is -2. Since the slopes are different, the lines must intersect at a single point. Therefore, the system hasexactly one solution. This is a consistent system.
Example 2
Determine whether the following system has exactly one solution, no solutions, or an infinite number of solutions.
2x−5y = 2
4x+ y = 5
Solution
We must rewrite the equations so they are in slope-intercept form.
2x−5y = 2 −5y =−2x+2 y =25
x− 25
⇒ ⇒4x+ y = 5 y =−4x+5 y =−4x+5
The slopes of the two equations are different. Therefore, the lines must cross at a single point, and the system hasexactly one solution. This is a consistent system.
Example 3
Determine whether the following system has exactly one solution, no solutions, or an infinite number of solutions.
3x = 5−4y
6x+8y = 7
Solution
We must rewrite the equations so they are in slope-intercept form.
3x = 5−4y 4y =−3x+5 y =−34
x− 54
⇒ ⇒
6x+8y = 7 8y =−6x+7 y =−34
x+78
The slopes of the two equations are the same but the y− intercepts are different, therefore the lines never cross andthe system has no solutions. This is an inconsistent system.
Example 4
Determine whether the following system has exactly one solution, no solutions, or an infinite number of solutions.
x+ y = 3
3x+3y = 9
7.5. SPECIAL TYPES OF LINEAR SYSTEMS
www.ck12.org 477
Solution
We must rewrite the equations so they are in slope-intercept form.
x+ y = 3 y =−x+3 y =−x+3
⇒ ⇒3x+3y = 9 3y =−3x+9 y =−x+3
The lines are identical. Therefore the system has an infinite number of solutions. It is a dependent system.
Determining the Type of System Algebraically
A third option for identifying systems as consistent, inconsistent or dependent is to solve the system algebraicallyusing any method and use the result as a guide.
Example 5
Solve the following system of equations. Identify the system as consistent, inconsistent or dependent.
10x−3y = 3
2x+ y = 9
Solution
Let’s solve this system using the substitution method.
Solve the second equation for the y variable.
2x+ y = 9⇒ y =−2x+9
Substitute for y in the first equation.
10x−3y = 3
10x−3(−2x+9) = 3
10x+6x−27 = 3
16x = 30
x =158
Substitute the value of x back into the second equation and solve for y .
2x+ y = 9⇒ y =−2x+9⇒ y =−2 · 158+9⇒ y =
214
Answer The solution to the system is(15
8 ,214
). The system is consistent since it has only one solution.
Another method to determine if the system of equations is an inconsistent, consistent or dependent system is to solvethem algebraically using the elimination or substitution method.
Example 6
CHAPTER 7. SOLVING SYSTEMS OF EQUATIONS AND INEQUALITIES
478 www.ck12.org
Solve the following system of equations. Identify the system as consistent, inconsistent or dependent.
3x−2y = 4
9x−6y = 1
Solution
Let’s solve this system by the method of multiplication.
Multiply the first equation by 3.
3(3x−2y = 4) 9x−6y = 12
⇒9x−6y = 1 9x−6y = 1
Add the two equations.
9x−6y = 12
9x−6y = 1
0 = 13 This Statement is not true
Answer If, by trying to obtain a solution to a system, we arrive at a statement that is not true, then the system isinconsistent.
Example 7
Solve the following system of equations. Identify the system as consistent, inconsistent or dependent.
4x+ y = 3
12x+3y = 9
Solution
Let’s solve this system by substitution.
Solve the first equation for y .
4x+ y = 3⇒ y =−4x+3
Substitute this expression for y in the second equation.
12x+3y = 9
12x+3(−4x+3) = 9
12x−12x+9 = 9
9 = 9
7.5. SPECIAL TYPES OF LINEAR SYSTEMS

www.ck12.org 479
This is always a true statement.
Answer If, by trying to obtain a solution to a system, we arrive at a statement that is always true, then the system isdependent.
A second glance at the system in this example reveals that the second equation is three times the first equation sothe two lines are identical. The system has an infinite number of solutions because they are really the same equationand trace out the same line.
Let’s clarify this statement. An infinite number of solutions does not mean that any ordered pair (x,y) satisfies thesystem of equations. Only ordered pairs that solve the equation in the system are also solutions to the system.
For example, (1, 2) is not a solution to the system because when we plug it into the equations it does not check out.
4x+ y = 3
4(1)+2 6= 3
To find which ordered pair satisfies this system, we can pick any value for x and find the corresponding value for y .
For x = 1,4(1)+ y = 3⇒ y =−1
For x = 2,4(2)+ y = 3⇒ y =−3
Let’s summarize our finding for determining the type of system algebraically.
• A consistent system will always give exactly one solution.• An inconsistent system will always give a FALSE statement (for example 9 = 0 ).• A dependent system will always give a TRUE statement (such as 9 = 9 or 0 = 0 ).
Applications
In this section, we will look at a few application problems and see how consistent, inconsistent and dependentsystems might arise in practice.
Example 8
A movie rental store CineStar offers customers two choices. Customers can pay a yearly membership of $45 andthen rent each movie for $2 or they can choose not to pay the membership fee and rent each movie for $3.50. Howmany movies would you have to rent before membership becomes the cheaper option?
Solution
Let’s translate this problem into algebra. Since there are two different options to consider, we will write two differentequations and form a system.
The choices are membership option and no membership option.
Our variables are
The number of movies you rent, let’s call this x .
The total cost for renting movies, let’s call this y .
TABLE 7.7:
flat fee rental fee totalmembership $45 2x y = 45+2xno membership $0 3.50x y = 3.5x
CHAPTER 7. SOLVING SYSTEMS OF EQUATIONS AND INEQUALITIES
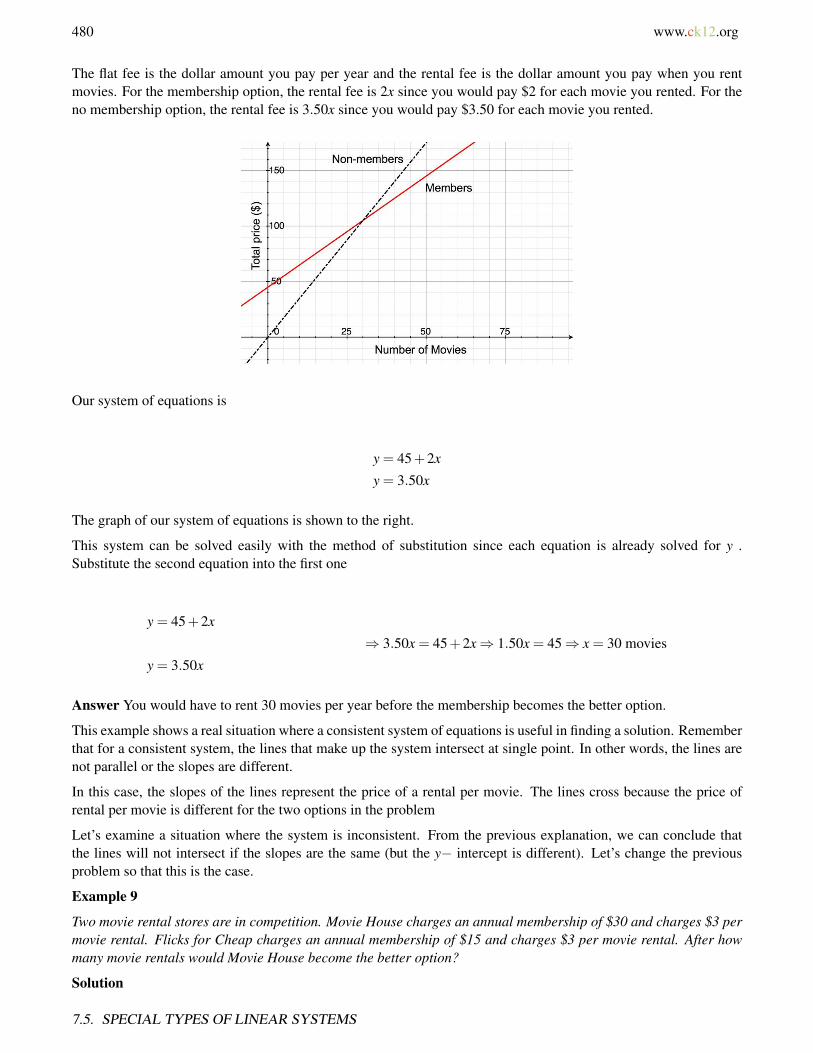
480 www.ck12.org
The flat fee is the dollar amount you pay per year and the rental fee is the dollar amount you pay when you rentmovies. For the membership option, the rental fee is 2x since you would pay $2 for each movie you rented. For theno membership option, the rental fee is 3.50x since you would pay $3.50 for each movie you rented.
Our system of equations is
y = 45+2x
y = 3.50x
The graph of our system of equations is shown to the right.
This system can be solved easily with the method of substitution since each equation is already solved for y .Substitute the second equation into the first one
y = 45+2x
⇒ 3.50x = 45+2x⇒ 1.50x = 45⇒ x = 30 movies
y = 3.50x
Answer You would have to rent 30 movies per year before the membership becomes the better option.
This example shows a real situation where a consistent system of equations is useful in finding a solution. Rememberthat for a consistent system, the lines that make up the system intersect at single point. In other words, the lines arenot parallel or the slopes are different.
In this case, the slopes of the lines represent the price of a rental per movie. The lines cross because the price ofrental per movie is different for the two options in the problem
Let’s examine a situation where the system is inconsistent. From the previous explanation, we can conclude thatthe lines will not intersect if the slopes are the same (but the y− intercept is different). Let’s change the previousproblem so that this is the case.
Example 9
Two movie rental stores are in competition. Movie House charges an annual membership of $30 and charges $3 permovie rental. Flicks for Cheap charges an annual membership of $15 and charges $3 per movie rental. After howmany movie rentals would Movie House become the better option?
Solution
7.5. SPECIAL TYPES OF LINEAR SYSTEMS

www.ck12.org 481
It should already be clear to see that Movie House will never become the better option, since its membership is moreexpensive and it charges the same amount per move as Flicks for Cheap.
The lines that describe each option have different y− intercepts, namely 30 for Movie House and 15 for Flicks forCheap. They have the same slope, three dollars per movie. This means that the lines are parallel and the system isinconsistent.
Let’s see how this works algebraically:
Our variables are:
The number of movies you rent, let’s call this x .
The total cost for renting movies, let’s call this y .
TABLE 7.8:
flat fee rental fee totalMovie House $30 3x y = 30+3xFlicks for Cheap $15 3x y = 15+3x
The system of equations that describes this problem is
y = 30+3x
y = 15+3x
Let’s solve this system by substituting the second equation into the first equation.
y = 30+3x
⇒ 15+3x = 30+3x⇒ 15 = 30
y = 15+3x
This statement is always false.
Answer This means that the system is inconsistent.
Example 10
Peter buys two apples and three bananas for $4. Nadia buys four apples and six bananas for $8 from the same store.How much does one banana and one apple costs?
Solution
We must write two equations, one for Peter’s purchase and one for Nadia’s purchase.
Let’s define our variables as
a is the cost of one apple
b is the cost of one banana
TABLE 7.9:
Cost of Apples Cost of Bananas Total CostPeter 2a 3b 2a+3b = 4Nadia 4a 6b 4a+6b = 8
CHAPTER 7. SOLVING SYSTEMS OF EQUATIONS AND INEQUALITIES
482 www.ck12.org
The system of equations that describes this problem is:
2a+3b = 4
4a+6b = 8
Let’s solve this system by multiplying the first equation by -2 and adding the two equations.
−2(2a+3b = 4) −4a−6b =−8
4a+6b = 8 ⇒ 4a+6b = 8
0+0 = 0
This statement is always true. This means that the system is dependent.
Looking at the problem again, we see that we were given exactly the same information in both statements. If Peterbuys two apples and three bananas for $4 it makes sense that if Nadia buys twice as many apples (four apples) andtwice as many bananas (six bananas) she will pay twice the price ($8). Since the second equation does not give anynew information, it is not possible to find out the price of each piece of fruit.
Answer The two equations describe the same line. This means that the system is dependent.
Review Questions
1. Express each equation in slope-intercept form. Without graphing, state whether the system of equations isconsistent, inconsistent or dependent.
a. 3x−4y = 13y =−3x−7
b. 3x5 + y = 3
1.2x+2y = 6c. 3x−4y = 13
y =−3x−7d. 3x−3y = 3
x− y = 1e. 0.5x− y = 30
0.5x− y =−30f. 4x−2y =−2
3x+2y =−12
2. Find the solution of each system of equations using the method of your choice. Please state whether the systemis inconsistent or dependent.
a. 3x+2y = 4−2x+2y = 24
b. 5x−2y = 32x−3y = 10
c. 3x−4y = 13y =−3x− y
d. 5x−4y = 1−10x+8y =−30
7.5. SPECIAL TYPES OF LINEAR SYSTEMS
www.ck12.org 483
e. 4x+5y = 03x = 6y+4.5
f. −2y+4x = 8y−2x =−4
g. x− y2 = 3
23x+ y = 6
h. 0.05x+0.25y = 6x+ y = 24
i. x+ 2y3 = 6
3x+2y = 2
3. A movie house charges $4.50 for children and $8.00 for adults. On a certain day, 1200 people enter the moviehouse and $8, 375 is collected. How many children and how many adults attended?
4. Andrew placed two orders with an internet clothing store. The first order was for thirteen ties and four pairsof suspenders, and totaled $487. The second order was for six ties and two pairs of suspenders, and totaled$232. The bill does not list the per-item price but all ties have the same price and all suspenders have the sameprice. What is the cost of one tie and of one pair of suspenders?
5. An airplane took four hours to fly 2400 miles in the direction of the jet-stream. The return trip against thejet-stream took five hours. What were the airplane’s speed in still air and the jet-stream’s speed?
6. Nadia told Peter that she went to the farmer’s market and she bought two apples and one banana and that itcost her $2.50. She thought that Peter might like some fruit so she went back to the seller and bought fourmore apples and two more bananas. Peter thanked Nadia, but told her that he did not like bananas, so willonly pay her for four apples. Nadia told him that the second time she paid $6.00 for fruit. Please help Peterfigure out how much to pay Nadia paid for four apples.
Review Answers
1. a. consistentb. dependentc. consistentd. dependente. inconsistentf. consistent
a. x =−4,y = 8b. x =−1,y =−4c. x =−1,y =−4d. inconsistente. x =−2.5,y = 2f. dependentg. x = 9
5 ,y =35
h. x = 0,y = 24i. dependent
2. 350 children, 850 Adults3. Ties = $23,suspenders = $474. Airplane speed = 540 mph, jet-stream speed = 60 mph5. This represents an inconsistent system. Someone is trying to overcharge! It is not possible to determine the
price of apples alone.
CHAPTER 7. SOLVING SYSTEMS OF EQUATIONS AND INEQUALITIES

484 www.ck12.org
7.6 Systems of Linear Inequalities
Learning Objectives
• Graph linear inequalities in two variables.• Solve systems of linear inequalities.• Solve optimization problems.
Introduction
In the last chapter, you learned how to graph a linear inequality in two variables. To do that you graphed the equationof the straight line on the coordinate plane. The line was solid for signs where the equal sign is included. The linewas dashed for < or > where signs the equal sign is not included. Then you shaded above the line (if y > or y ≥ )or below the line (if y < or y≤ ).
In this section, we will learn how to graph two or more linear inequalities on the same coordinate plane. Theinequalities are graphed separately on the same graph and the solution for the system is the common shaded regionbetween all the inequalities in the system. One linear inequality in two variables divides the plane into two half-planes. A system of two or more linear inequalities can divide the plane into more complex shapes. Let’s start bysolving a system of two inequalities.
Graph a System of Two Linear Inequalities
Example 1
Solve the following system.
2x+3y≤ 18
x−4y≤ 12
Solution
Solving systems of linear inequalities means graphing and finding the intersections. So we graph each inequality,and then find the intersection regions of the solution.
Let’s rewrite each equation in slope-intercept form. This form is useful for graphing but also in deciding whichregion of the coordinate plane to shade. Our system becomes
7.6. SYSTEMS OF LINEAR INEQUALITIES

www.ck12.org 485
3y≤−2x+18 y≤ −23
x+6
⇒
−4y≤−x+12 y≥ x4−3
Notice that the inequality sign in the second equation changed because we divided by a negative number.
For this first example, we will graph each inequality separately and then combine the results.
We graph the equation of the line in the first inequality and draw the following graph.
The line is solid because the equal sign is included in the inequality. Since the inequality is less than or equal to, weshade below the line.
We graph the second equation in the inequality and obtain the following graph.
CHAPTER 7. SOLVING SYSTEMS OF EQUATIONS AND INEQUALITIES

486 www.ck12.org
The line is solid again because the equal sign is included in the inequality. We now shade above because y is greaterthan or equal.
When we combine the graphs, we see that the blue and red shaded regions overlap. This overlap is where bothinequalities work. Thus the purple region denotes the solution of the system.
The kind of solution displayed in this example is called unbounded, because it continues forever in at least onedirection (in this case, forever upward and to the left).
7.6. SYSTEMS OF LINEAR INEQUALITIES

www.ck12.org 487
Example 2
There are also situations where a system of inequalities has no solution. For example, let’s solve this system.
y≤ 2x−4
y > 2x+6
Solution: We start by graphing the first line. The line will be solid because the equal sign is included in theinequality. We must shade downwards because y is less than.
Next we graph the second line on the same coordinate axis. This line will be dashed because the equal sign is notincluded in the inequality. We must shade upward because y is greater than.
This graph shows no overlapping between the two shaded regions. We know that the lines will never intersectbecause they are parallel. The slope equals two for both lines. The regions will never overlap even if we extend thelines further.
This is an example of a system of inequalities with no solution.
For a system of inequalities, we can still obtain a solution even if the lines are parallel. Let’s change the system ofinequalities in Example 2 so the inequality signs for the two expressions are reversed.
CHAPTER 7. SOLVING SYSTEMS OF EQUATIONS AND INEQUALITIES

488 www.ck12.org
y≥ 2x−4
y < 2x+6
The procedure for solving this system is almost identical to the previous one, except we shade upward for the firstinequality and we shade downward for the second inequality. Here is the result.
In this case, the shaded regions do overlap and the system of inequalities has the solution denoted by the purpleregion.
Graph a System of More Than Two Linear Inequalities
In the previous section, we saw how to find the solution to a system of two linear inequalities. The solutions for thesekinds of systems are always unbounded. In other words, the region where the shadings overlap continues infinitely inat least one direction. We can obtain bounded solutions by solving systems that contain more than two inequalities.In such cases the solution region will be bounded on four sides.
Let’s examine such a solution by solving the following example.
Example 3
Find the solution to the following system of inequalities.
3x− y < 4
4y+9x < 8
x≥ 0
y≥ 0
Solution
Let’s start by writing our equation in slope-intercept form.
7.6. SYSTEMS OF LINEAR INEQUALITIES
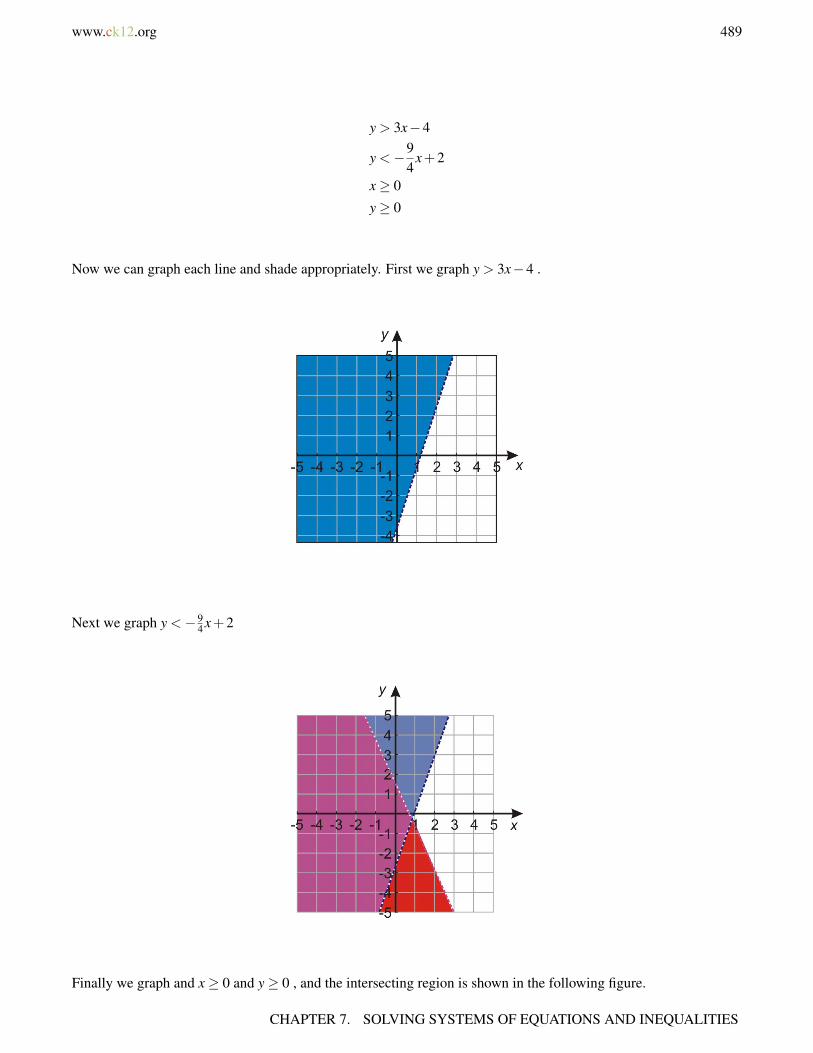
www.ck12.org 489
y > 3x−4
y <−94
x+2
x≥ 0
y≥ 0
Now we can graph each line and shade appropriately. First we graph y > 3x−4 .
Next we graph y <−94 x+2
Finally we graph and x≥ 0 and y≥ 0 , and the intersecting region is shown in the following figure.
CHAPTER 7. SOLVING SYSTEMS OF EQUATIONS AND INEQUALITIES

490 www.ck12.org
The solution is bounded because there are lines on all sides of the solution region. In other words the solution regionis a bounded geometric figure, in this case a triangle.
Write a System of Linear Inequalities
There are many interesting application problems that involve the use of system of linear inequalities. However,before we fully solve application problems, let’s see how we can translate some simple word problems into algebraicequations.
For example, you go to your favorite restaurant and you want to be served by your best friend who happens towork there. However, your friend works in a certain region of the restaurant. The restaurant is also known for itsgreat views but you have to sit in a certain area of the restaurant that offers these view. Solving a system of linearinequalities will allow you to find the area in the restaurant where you can sit to get the best views and be served byyour friend.
Typically, systems of linear inequalities deal with problems where you are trying to find the best possible situationgiven a set of constraints.
Example 4
Write a system of linear inequalities that represents the following conditions.
The sum of twice a number x and three times another number y is greater than 6, and y is less than three times x .
Solution
Let’s take each statement in turn and write it algebraically:
1. The sum of twice a number x and three times another number y is greater than 6.
This can be written as
7.6. SYSTEMS OF LINEAR INEQUALITIES
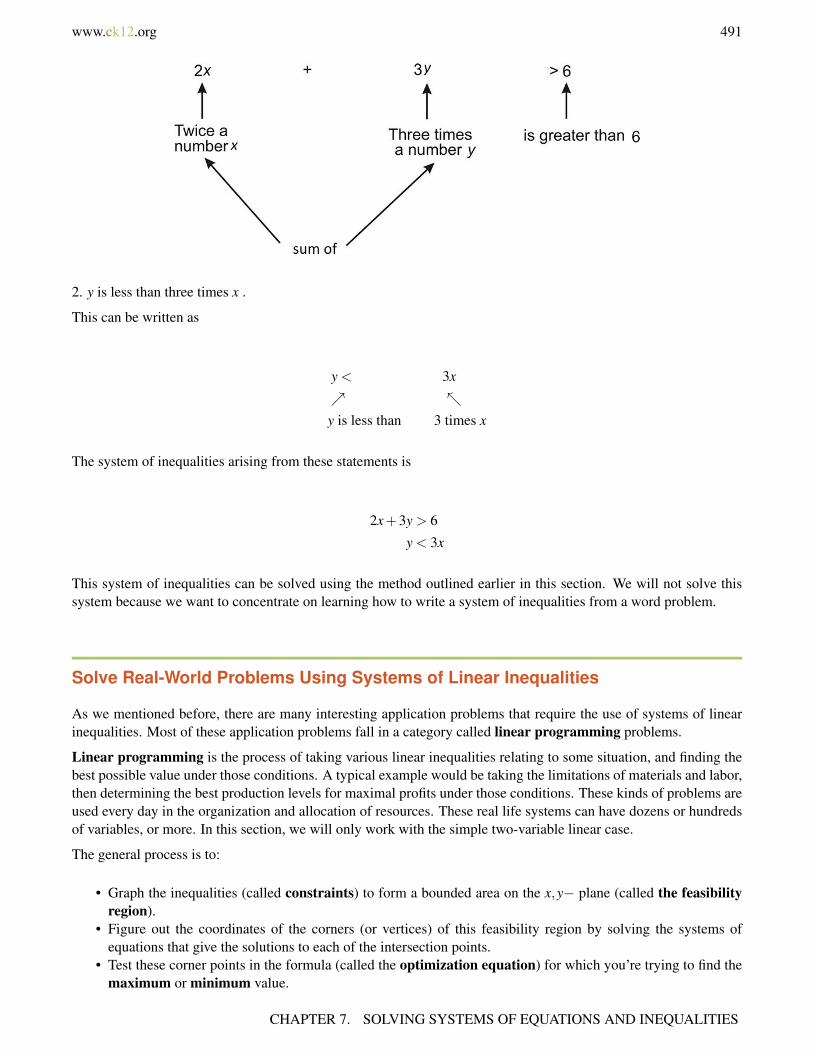
www.ck12.org 491
2. y is less than three times x .
This can be written as
y < 3x
y is less than 3 times x
The system of inequalities arising from these statements is
2x+3y > 6
y < 3x
This system of inequalities can be solved using the method outlined earlier in this section. We will not solve thissystem because we want to concentrate on learning how to write a system of inequalities from a word problem.
Solve Real-World Problems Using Systems of Linear Inequalities
As we mentioned before, there are many interesting application problems that require the use of systems of linearinequalities. Most of these application problems fall in a category called linear programming problems.
Linear programming is the process of taking various linear inequalities relating to some situation, and finding thebest possible value under those conditions. A typical example would be taking the limitations of materials and labor,then determining the best production levels for maximal profits under those conditions. These kinds of problems areused every day in the organization and allocation of resources. These real life systems can have dozens or hundredsof variables, or more. In this section, we will only work with the simple two-variable linear case.
The general process is to:
• Graph the inequalities (called constraints) to form a bounded area on the x,y− plane (called the feasibilityregion).
• Figure out the coordinates of the corners (or vertices) of this feasibility region by solving the systems ofequations that give the solutions to each of the intersection points.
• Test these corner points in the formula (called the optimization equation) for which you’re trying to find themaximum or minimum value.
CHAPTER 7. SOLVING SYSTEMS OF EQUATIONS AND INEQUALITIES

492 www.ck12.org
Example 5
Find the maximum and minimum value of z = 2x+5y given the constraints.
2x− y≤ 12
4x+3y≥ 0
x− y≤ 6
Solution
Step 1: Find the solution to this system of linear inequalities by graphing and shading appropriately. To graph wemust rewrite the equations in slope-intercept form.
y≥ 2x−12
y≥−43
x
y≥ x−6
These three linear inequalities are called the constraints.
The solution is the shaded region in the graph. This is called the feasibility region. That means all possible solutionsoccur in that region. However in order to find the optimal solution we must go to the next steps.
Step 2
Next, we want to find the corner points. In order to find them exactly, we must form three systems of linear equationsand solve them algebraically.
System 1:
y = 2x−12
y =−43
x
7.6. SYSTEMS OF LINEAR INEQUALITIES

www.ck12.org 493
Substitute the first equation into the second equation:
−43
x = 2x−12⇒−4x = 6x−36⇒−10x =−36⇒ x = 3.6
y = 2x−12⇒ y−2(3.6)−12⇒ y =−4.8
The intersection point of lines is (3.6, -4.8)
System 2:
y = 2x−12
y = x−6
Substitute the first equation into the second equation.
x−6 = 2x−12⇒ 6 = x⇒ x = 6
y = x−6⇒ y = 6−6⇒ y = 0
The intersection point of lines is (6, 0).
System 3:
y =−43
x
y = x−6
Substitute the first equation into the second equation.
x−6 =−43
x⇒ 3x−18 =−4x⇒ 7x = 18⇒ x = 2.57
y = x−6⇒ y = 2.57−6⇒ y =−3.43
The intersection point of lines is (2.57, -3.43).
So the corner points are (3.6, -4.8), (6, 0) and (2.57, -3.43).
Step 3
Somebody really smart proved that, for linear systems like this, the maximum and minimum values of the optimiza-tion equation will always be on the corners of the feasibility region. So, to find the solution to this exercise, we needto plug these three points into z = 2x+5y .
(3.6,−4.8) z = 2(3.6)+5(−4.8) =−16.8
(6,0) z = 2(6)+5(0) = 12
(2.57,−3.43) z = 2(2.57)+5(−3.43) =−12.01
The highest value of 12 occurs at point (6, 0) and the lowest value of -16.8 occurs at (3.6, -4.8).
CHAPTER 7. SOLVING SYSTEMS OF EQUATIONS AND INEQUALITIES

494 www.ck12.org
In the previous example, we learned how to apply the method of linear programming out of context of an applicationproblem. In the next example, we will look at a real-life application.
Example 6
You have $10, 000 to invest, and three different funds from which to choose. The municipal bond fund has a 5%return, the local bank’s CDs have a 7% return, and a high-risk account has an expected 10% return. To minimizerisk, you decide not to invest any more than $1, 000 in the high-risk account. For tax reasons, you need to invest atleast three times as much in the municipal bonds as in the bank CDs. Assuming the year-end yields are as expected,what are the optimal investment amounts?
Solution
Let’s define some variables.
x is the amount of money invested in the municipal bond at 5% return.
y is the amount of money invested in the bank’s CD at 7% return.
10000− x− y is the amount of money invested in the high-risk account at 10% return.
z is the total interest returned from all the investments or z = .05x+ .07y+ .1(10000− x− y) or z = 1000−0.05x−0.03y . This is the amount that we are trying to maximize. Our goal is to find the values of x and y that maximizesthe value of z .
Now, let’s write inequalities for the constraints.
You decide not to invest more than $1000 in the high-risk account.
10000− x− y≤ 1000
You need to invest at least three times as much in the municipal bonds as in the bank CDs.
3y ≤ x
Also we write expressions for the fact that we invest more than zero dollars in each account.
x≥ 0
y≥ 0
10000− x− y≥ 0
To summarize, we must maximize the expression z = 1000− .05x− .03y .
Using the constraints,
10000− x− y≤ 1000 y≥ 9000− x
3y≤ x y≤ x3
x≥ 0 Letâ[U+0080][U+0099]s rewrite each in slope-intercept form. x≥ 0
y≥ 0 y≥ 0
10000− x− y≥ 0 y≤ 10000− x
7.6. SYSTEMS OF LINEAR INEQUALITIES
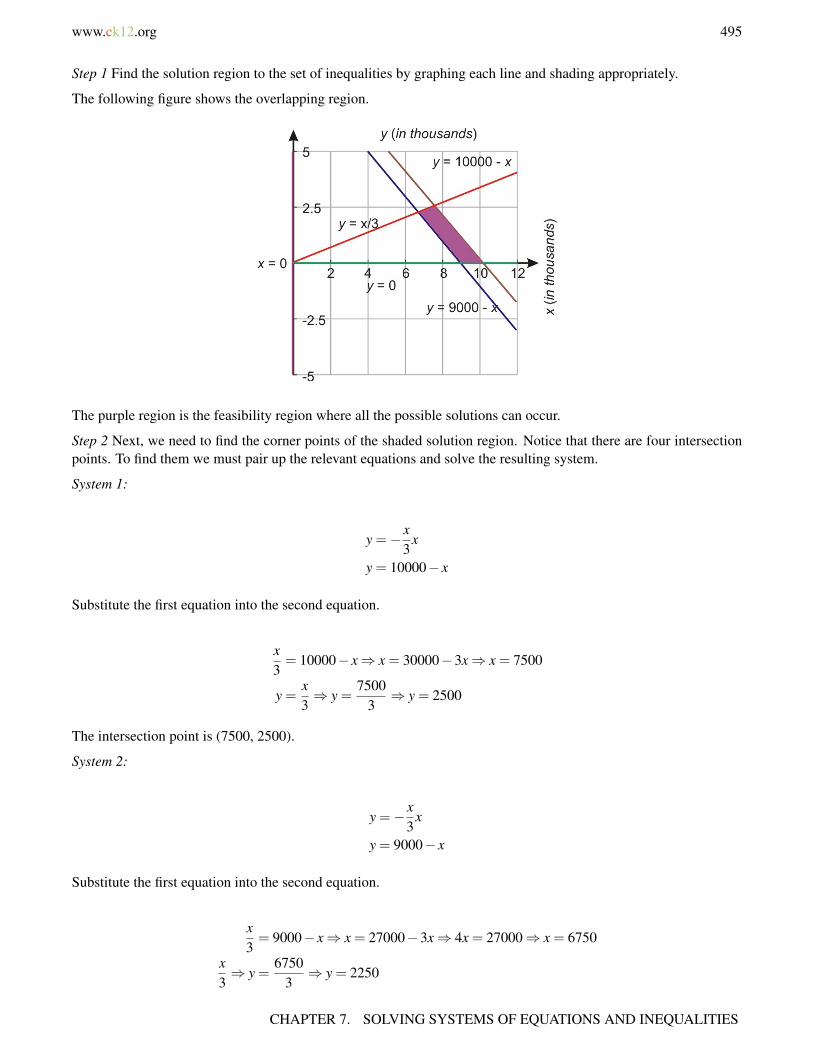
www.ck12.org 495
Step 1 Find the solution region to the set of inequalities by graphing each line and shading appropriately.
The following figure shows the overlapping region.
The purple region is the feasibility region where all the possible solutions can occur.
Step 2 Next, we need to find the corner points of the shaded solution region. Notice that there are four intersectionpoints. To find them we must pair up the relevant equations and solve the resulting system.
System 1:
y =− x3
x
y = 10000− x
Substitute the first equation into the second equation.
x3= 10000− x⇒ x = 30000−3x⇒ x = 7500
y =x3⇒ y =
75003⇒ y = 2500
The intersection point is (7500, 2500).
System 2:
y =− x3
x
y = 9000− x
Substitute the first equation into the second equation.
x3= 9000− x⇒ x = 27000−3x⇒ 4x = 27000⇒ x = 6750
x3⇒ y =
67503⇒ y = 2250
CHAPTER 7. SOLVING SYSTEMS OF EQUATIONS AND INEQUALITIES
496 www.ck12.org
The intersection point is (6750, 2250).
System 3:
y = 0
y = 10000− x
The intersection point is (10000, 0).
System 4:
y = 0
y = 9000− x
The intersection point is (9000, 0).
Step 3: In order to find the maximum value for z , we need to plug all intersection points into z and take the largestnumber.
(7500,2500) z = 1000−0.05(7500)−0.03(2500) = 550
(6750,2250) z = 1000−0.05(6750)−0.03(2250) = 595
(10000,0) z = 1000−0.05(10000)−0.03(0) = 500
(9000,0) z = 1000−0.05(9000)−0.03(0) = 550
Answer
The maximum return on the investment of $595 occurs at point (6750, 2250). This means that
$6, 750 is invested in the municipal bonds.
$2, 250 is invested in the bank CDs.
$1, 000 is invested in the high-risk account.
Review Questions
Find the solution region of the following systems of inequalities
1. x− y <−62y≥ 3x+17
2. 4y−5x < 8−5x≥ 16−8y
3. 5x− y≥ 52y− x≥−10
4. 5x+2y≥−253x−2y≤ 17x−6y≥ 27
7.6. SYSTEMS OF LINEAR INEQUALITIES
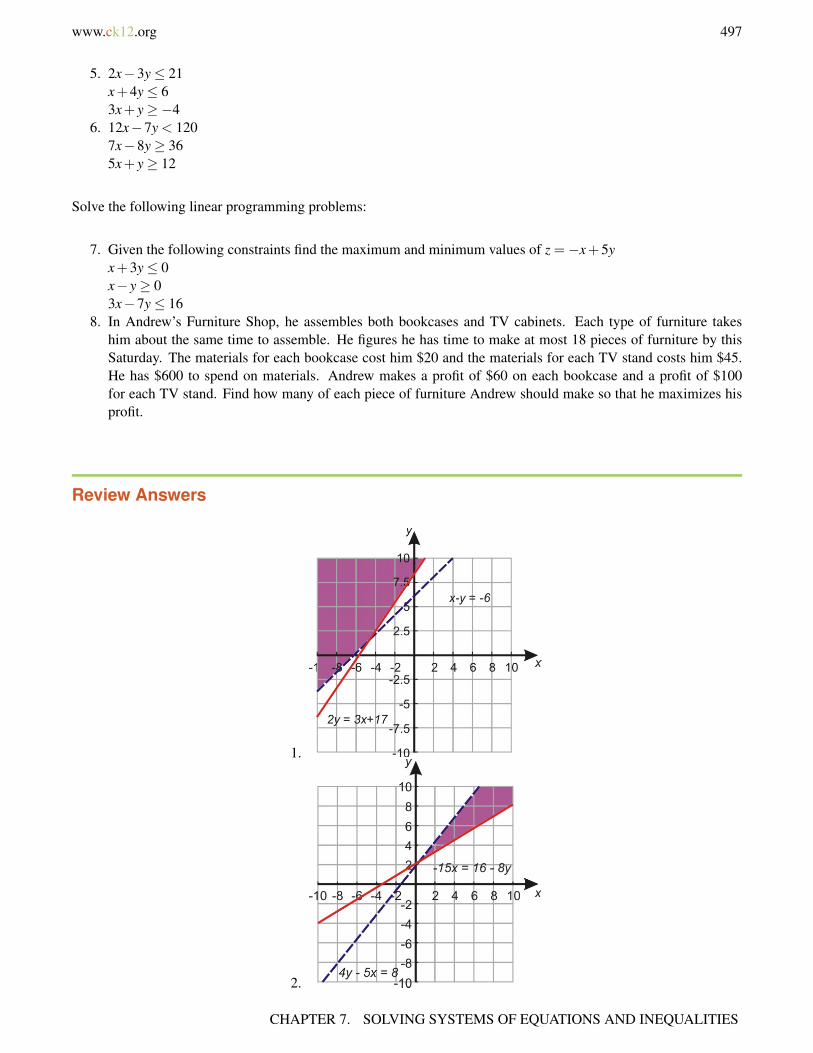
www.ck12.org 497
5. 2x−3y≤ 21x+4y≤ 63x+ y≥−4
6. 12x−7y < 1207x−8y≥ 365x+ y≥ 12
Solve the following linear programming problems:
7. Given the following constraints find the maximum and minimum values of z =−x+5yx+3y≤ 0x− y≥ 03x−7y≤ 16
8. In Andrew’s Furniture Shop, he assembles both bookcases and TV cabinets. Each type of furniture takeshim about the same time to assemble. He figures he has time to make at most 18 pieces of furniture by thisSaturday. The materials for each bookcase cost him $20 and the materials for each TV stand costs him $45.He has $600 to spend on materials. Andrew makes a profit of $60 on each bookcase and a profit of $100for each TV stand. Find how many of each piece of furniture Andrew should make so that he maximizes hisprofit.
Review Answers
1.
2.
CHAPTER 7. SOLVING SYSTEMS OF EQUATIONS AND INEQUALITIES

www.ck12.org 499
7. Maximum of z = 0 at point (0, 0), minimum of z =−16 at point (-4, -4)8. Maximum profit of $1, 440 by making 9 bookcases and 9 TV stands.
Texas Instruments Resources
In the CK-12 Texas Instruments Algebra I FlexBook, there are graphing calculator activities designed to supple-ment the objectives for some of the lessons in this chapter. See http://www.ck12.org/flexr/chapter/9617.
CHAPTER 7. SOLVING SYSTEMS OF EQUATIONS AND INEQUALITIES
500 www.ck12.org
CHAPTER 8 Exponential FunctionsCHAPTER OUTLINE
8.1 EXPONENT PROPERTIES INVOLVING PRODUCTS
8.2 EXPONENT PROPERTIES INVOLVING QUOTIENTS
8.3 ZERO, NEGATIVE, AND FRACTIONAL EXPONENTS
8.4 SCIENTIFIC NOTATION
8.5 EXPONENTIAL GROWTH FUNCTIONS
8.6 EXPONENTIAL DECAY FUNCTIONS
8.7 GEOMETRIC SEQUENCES AND EXPONENTIAL FUNCTIONS
8.8 PROBLEM-SOLVING STRATEGIES
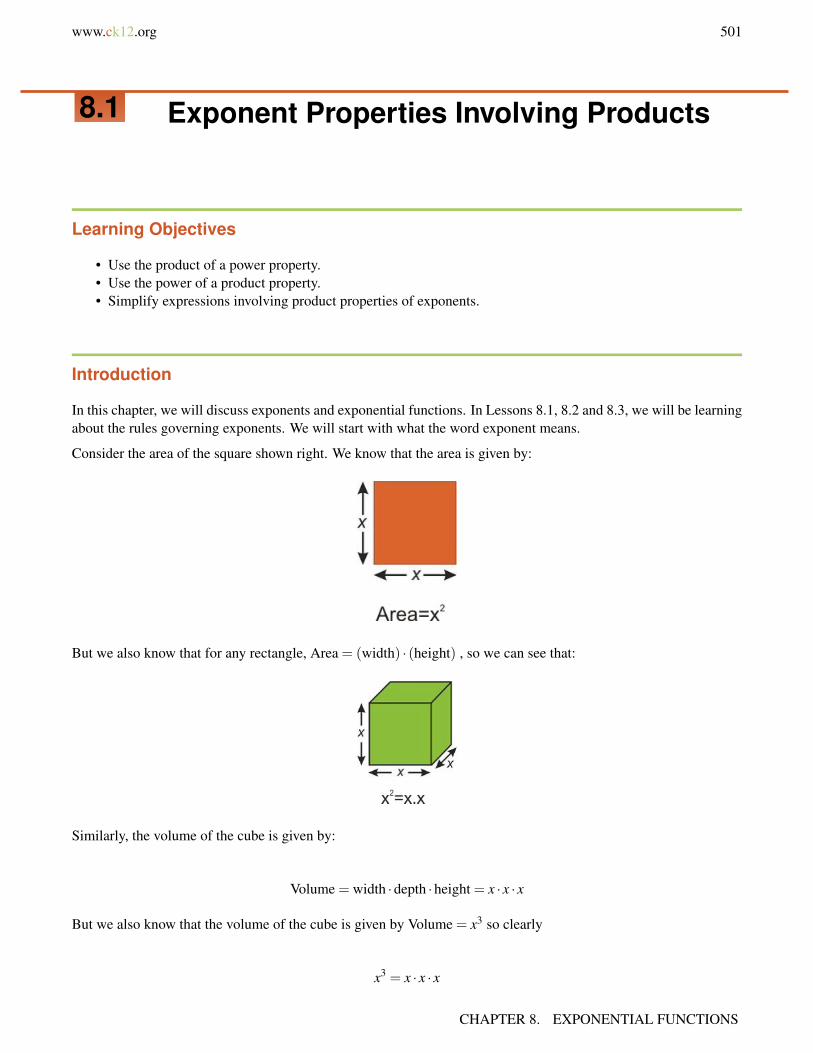
www.ck12.org 501
8.1 Exponent Properties Involving Products
Learning Objectives
• Use the product of a power property.• Use the power of a product property.• Simplify expressions involving product properties of exponents.
Introduction
In this chapter, we will discuss exponents and exponential functions. In Lessons 8.1, 8.2 and 8.3, we will be learningabout the rules governing exponents. We will start with what the word exponent means.
Consider the area of the square shown right. We know that the area is given by:
But we also know that for any rectangle, Area = (width) · (height) , so we can see that:
Similarly, the volume of the cube is given by:
Volume = width ·depth ·height = x · x · x
But we also know that the volume of the cube is given by Volume = x3 so clearly
x3 = x · x · x
CHAPTER 8. EXPONENTIAL FUNCTIONS

502 www.ck12.org
You probably know that the power (the small number to the top right of the x ) tells you how many x ’s to multiplytogether. In these examples the x is called the base and the power (or exponent) tells us how many factors of thebase there are in the full expression.
x2 = x · x︸︷︷︸2 factors of x
x7 = x · x · x · x · x · x · x︸ ︷︷ ︸7 factors of x
x3 = x · x · x︸ ︷︷ ︸3 factors of x
xn = x · x · · · · · · · x︸ ︷︷ ︸n factors of x
Example 1
Write in exponential form.
(a) 2 ·2
(b) (−3)(−3)(−3)
(c) y · y · y · y · y
(d) (3a)(3a)(3a)(3a)
Solution
(a) 2 ·2 = 22 because we have 2 factors of 2
(b) (−3)(−3)(−3) = (−3)3 because we have 3 factors of (−3)
(c) y · y · y · y · y = y5 because we have 5 factors of y
(d) (3a)(3a)(3a)(3a) = (3a)4 because we have 4 factors of 3a
When we deal with numbers, we usually just simplify. We’d rather deal with 16 than with 24 . However, withvariables, we need the exponents, because we’d rather deal with x7 than with x · x · x · x · x · x · x .
Let’s simplify Example 1 by evaluating the numbers.
Example 2
Simplify.
(a) 2 ·2
(b) (−3)(−3)(−3)
(c) y · y · y · y · y
(d) (3a)(3a)(3a)(3a)
Solution
(a) 2 ·2 = 22 = 4
(b) (−3)(−3)(−3) = (−3)3 =−27
(c) y · y · y · y · y = y5
(d) (3a)(3a)(3a)(3a) = (3a)4 = 34 ·a4 = 81a4
Note: You must be careful when taking powers of negative numbers. Remember these rules.
(negative number) · (positive number) = negative number
(negative number) · (negative number) = positive number
8.1. EXPONENT PROPERTIES INVOLVING PRODUCTS

www.ck12.org 503
For even powers of negative numbers, the answer is always positive. Since we have an even number of factors, wemake pairs of negative numbers and all the negatives cancel out.
(−2)6 = (−2)(−2)(−2)(−2)(−2)(−2) = (−2)(−2)︸ ︷︷ ︸+4
·(−2)(−2)︸ ︷︷ ︸+4
·(−2)(−2)︸ ︷︷ ︸+4
=+64
For odd powers of negative numbers, the answer is always negative. Since we have an odd number of factors, wecan make pairs of negative numbers to get positive numbers but there is always an unpaired negative factor, so theanswer is negative:
Ex: (−2)5 = (−2)(−2)(−2)(−2)(−2) = (−2)(−2)︸ ︷︷ ︸+4
·(−2)(−2)︸ ︷︷ ︸+4
·(−2)︸ ︷︷ ︸−2
=−32
Use the Product of Powers Property
What happens when we multiply one power of x by another? See what happens when we multiply x to the power 5by x cubed. To illustrate better we will use the full factored form for each:
(x · x · x · x · x)︸ ︷︷ ︸x5
·(x · x · x)︸ ︷︷ ︸x3
= (x · x · x · x · x · x · x · x)︸ ︷︷ ︸x8
So x5 · x3 = x8 . You may already see the pattern to multiplying powers, but let’s confirm it with another example.We will multiply x squared by x to the power 4:
(x · x)︸ ︷︷ ︸x2
·(x · x · x · x)︸ ︷︷ ︸x4
= (x · x · x · x · x · x)︸ ︷︷ ︸x6
So x2 ·x4 = x6 . Look carefully at the powers and how many factors there are in each calculation. 5 factors of x times3 factors of x equals (5+3) = 8 factors of x . 2 factors of x times 4 factors of x equals (2+4) = 6 factors of x .
You should see that when we take the product of two powers of x , the number of factors of x in the answer is thesum of factors in the terms you are multiplying. In other words the exponent of x in the answer is the sum of theexponents in the product.
Product rule for exponents: xn · xm = xn+m
Example 3
Multiply x4 · x5 .
Solution
x4 · x5 = x4+5 = x9
When multiplying exponents of the same base, it is a simple case of adding the exponents. It is important that whenyou use the product rule you avoid easy-to-make mistakes. Consider the following.
Example 4
CHAPTER 8. EXPONENTIAL FUNCTIONS
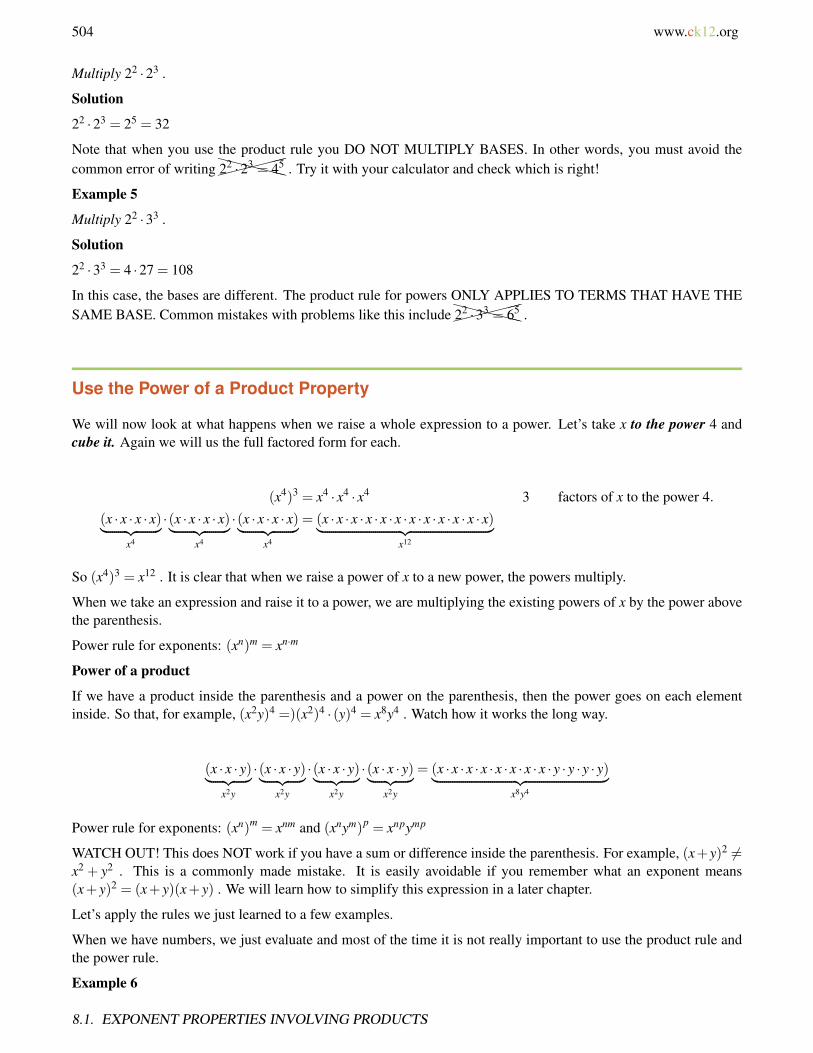
504 www.ck12.org
Multiply 22 ·23 .
Solution
22 ·23 = 25 = 32
Note that when you use the product rule you DO NOT MULTIPLY BASES. In other words, you must avoid thecommon error of writing
XXXXXX22 ·23 = 45 . Try it with your calculator and check which is right!
Example 5
Multiply 22 ·33 .
Solution
22 ·33 = 4 ·27 = 108
In this case, the bases are different. The product rule for powers ONLY APPLIES TO TERMS THAT HAVE THESAME BASE. Common mistakes with problems like this include
XXXXXX22 ·33 = 65 .
Use the Power of a Product Property
We will now look at what happens when we raise a whole expression to a power. Let’s take x to the power 4 andcube it. Again we will us the full factored form for each.
(x4)3 = x4 · x4 · x4 3 factors of x to the power 4.
(x · x · x · x)︸ ︷︷ ︸x4
·(x · x · x · x)︸ ︷︷ ︸x4
·(x · x · x · x)︸ ︷︷ ︸x4
= (x · x · x · x · x · x · x · x · x · x · x · x)︸ ︷︷ ︸x12
So (x4)3 = x12 . It is clear that when we raise a power of x to a new power, the powers multiply.
When we take an expression and raise it to a power, we are multiplying the existing powers of x by the power abovethe parenthesis.
Power rule for exponents: (xn)m = xn·m
Power of a product
If we have a product inside the parenthesis and a power on the parenthesis, then the power goes on each elementinside. So that, for example, (x2y)4 =)(x2)4 · (y)4 = x8y4 . Watch how it works the long way.
(x · x · y)︸ ︷︷ ︸x2y
·(x · x · y)︸ ︷︷ ︸x2y
·(x · x · y)︸ ︷︷ ︸x2y
·(x · x · y)︸ ︷︷ ︸x2y
= (x · x · x · x · x · x · x · x · y · y · y · y)︸ ︷︷ ︸x8y4
Power rule for exponents: (xn)m = xnm and (xnym)p = xnpymp
WATCH OUT! This does NOT work if you have a sum or difference inside the parenthesis. For example, (x+y)2 6=x2 + y2 . This is a commonly made mistake. It is easily avoidable if you remember what an exponent means(x+ y)2 = (x+ y)(x+ y) . We will learn how to simplify this expression in a later chapter.
Let’s apply the rules we just learned to a few examples.
When we have numbers, we just evaluate and most of the time it is not really important to use the product rule andthe power rule.
Example 6
8.1. EXPONENT PROPERTIES INVOLVING PRODUCTS
www.ck12.org 505
Simplify the following expressions.
(a) 34 ·37
(b) 26 ·2
(c) (42)3
Solution
In each of the examples, we want to evaluate the numbers.
(a) Use the product rule first: 35 ·37 = 312
Then evaluate the result: 312 = 531,441
OR
We can evaluate each part separately and then multiply them. 35 ·37 = 243 ·2,187 = 531,441 .
(b) Use the product rule first. 26 ·2 = 27
Then evaluate the result. 27 = 128
OR
We can evaluate each part separately and then multiply them. 26 ·2 = 64 ·2 = 128
(c) Use the power rule first. (42)3 = 46
Then evaluate the result. 46 = 4096
OR
We evaluate inside the parenthesis first. (42)3 = (16)3
Then apply the power outside the parenthesis. (16)3 = 4096
When we have just one variable in the expression then we just apply the rules.
Example 7
Simplify the following expressions.
(a) x2 · x7
(b) (y3)5
Solution
(a) Use the product rule. x2 · x7 = x2+7 = x9
(b) Use the power rule. (y3)5 = y3·5 = y15
When we have a mix of numbers and variables, we apply the rules to the numbers or to each variable separately.
Example 8
Simplify the following expressions.
(a) (3x2y3) · (4xy2)
(b) (4xyz) · (x2y3) · (2yz4)
(c) (2a3b3)2
Solution
(a) We group like terms together.
CHAPTER 8. EXPONENTIAL FUNCTIONS
506 www.ck12.org
(3x2y3) · (4xy2) = (3 ·4) · (x2 · x) · (y3 · y2)
We multiply the numbers and apply the product rule on each grouping.
12x3y5
(b) We groups like terms together.
(4xyz) · (x2y3) · (2yz4) = (4 ·2) · (x · x2) · (y · y3 · y) · (z · z4)
We multiply the numbers and apply the product rule on each grouping.
8x3y5z5
(c) We apply the power rule for each separate term in the parenthesis.
(2a3b3)2 = 22 · (a3)2 · (b3)2
We evaluate the numbers and apply the power rule for each term.
4a6b6
In problems that we need to apply the product and power rules together, we must keep in mind the order of operation.Exponent operations take precedence over multiplication.
Example 9
Simplify the following expressions.
(a) (x2)2 · x3
(b) (2x2y) · (3xy2)3
(c) (4a2b3)2 · (2ab4)3
Solution
(a) (x2)2 · x3
We apply the power rule first on the first parenthesis.
(x2)2 · x3 = x4 · x3
Then apply the product rule to combine the two terms.
x4 · x3 = x7
8.1. EXPONENT PROPERTIES INVOLVING PRODUCTS
www.ck12.org 507
(b) (2x2y) · (3xy2)3
We must apply the power rule on the second parenthesis first.
(2x2y) · (3xy2)3 = (2x2y) · (27x3y6)
Then we can apply the product rule to combine the two parentheses.
(2x2y) · (27x3y6) = 54x5y7
(c) (4a2b3)2 · (2ab4)3
We apply the power rule on each of the parentheses separately.
(4a2b3)2 · (2ab4)3 = (16a4b6) · (8a3b12)
Then we can apply the product rule to combine the two parentheses.
(16a4b6) · (8a3b12) = 128a7b18
Review Questions
Write in exponential notation.
1. 4 ·4 ·4 ·4 ·42. 3x ·3x ·3x3. (−2a)(−2a)(−2a)(−2a)4. 6 ·6 ·6 · x · x · y · y · y · y
Find each number:
5. 54
6. (−2)6
7. (0.1)5
8. (−0.6)3
Multiply and simplify.
9. 63 ·66
10. 22 ·24 ·26
11. 32 ·43
12. x2 · x4
13. (−2y4)(−3y)14. (4a2)(−3a)(−5a4)
Simplify.
CHAPTER 8. EXPONENTIAL FUNCTIONS

508 www.ck12.org
15. (a3)4
16. (xy)2
17. (3a2b3)4
18. (−2xy4z2)5
19. (−8x)3(5x)2
20. (4a2)(−2a3)4
21. (12xy)(12xy)2
22. (2xy2)(−x2y)2(3x2y2)
Review Answers
1. 45
2. (3x)3
3. (−2a)4
4. 63x2y4
5. 6256. 647. 0.000018. -0.2169. 10077696
10. 409611. 57612. x6
13. 6y5
14. 60a7
15. a12
16. x2y2
17. 81a8b12
18. −32x5y20z10
19. 12800x5
20. 64a14
21. 1728x3y3
22. 6x7y6
8.1. EXPONENT PROPERTIES INVOLVING PRODUCTS
www.ck12.org 509
8.2 Exponent Properties Involving Quotients
Learning Objectives
• Use the quotient of powers property.• Use the power of a quotient property.• Simplify expressions involving quotient properties of exponents.
Use the Quotient of Powers Property
You saw in the last section that we can use exponent rules to simplify products of numbers and variables. In thissection, you will learn that there are similar rules you can use to simplify quotients. Let’s take an example of aquotient, x7 divided by x4 .
x7
x4 = x ·x ·x ·x · x · x · xx ·x ·x ·x
=x · x · x
1= x3
You should see that when we divide two powers of x , the number of factors of x in the solution is the differencebetween the factors in the numerator of the fraction, and the factors in the denominator. In other words, whendividing expressions with the same base, keep the base and subtract the exponent in the denominator from theexponent in the numerator.
Quotient Rule for Exponents: xn
xm = xn−m
When we have problems with different bases, we apply the quotient rule separately for each base.
x5y3
x3y2 = x ·x ·x · x · xx ·x ·x
· y ·y · yy ·y
=x · x1· y
1= x2y OR
x5y3
x3y2 = x5−3 · y3−2 = x2y
Example 1
Simplify each of the following expressions using the quotient rule.
(a) x10
x5
(b) a6
a
(c) a5b4
a3b2
Solution
Apply the quotient rule.
(a) x10
x5 = x10−5 = x5
(b) a6
a = a6−1 = a5
CHAPTER 8. EXPONENTIAL FUNCTIONS

510 www.ck12.org
(c) a5b4
a3b2 = a5−3 ·b4−2 = a2b2
Now let’s see what happens if the exponent on the denominator is bigger than the exponent in the numerator.
Example 2
Divide. x4÷ x7 Apply the quotient rule.
x4
x7 = x4−7 = x−3
A negative exponent!? What does that mean?
Let’s do the division longhand by writing each term in factored form.
x4
x6 = x ·x ·x ·xx ·x ·x ·x · x · x
=1
x · x=
1x2
We see that when the exponent in the denominator is bigger than the exponent in the numerator, we still subtract thepowers. This time we subtract the smaller power from the bigger power and we leave the x ’s in the denominator.
When you simplify quotients, to get answers with positive exponents you subtract the smaller exponent from thebigger exponent and leave the variable where the bigger power was.
• We also discovered what a negative power means x−3 = 1x3 . We’ll learn more on this in the next section!
Example 3
Simplify the following expressions, leaving all powers positive.
(a) x2
x6
(b) a2b6
a5b
Solution
(a) Subtract the exponent in the numerator from the exponent in the denominator and leave the x ’s in the denomina-tor.
x2
x6 =1
x6−2 =1x4
(b) Apply the rule on each variable separately.
a2b6
a5b=
1a5−2 ·
b6−1
1=
b5
a3
The Power of a Quotient Property
When we apply a power to a quotient, we can learn another special rule. Here is an example.
8.2. EXPONENT PROPERTIES INVOLVING QUOTIENTS

www.ck12.org 511
(x3
y2
)4
=
(x3
y2
)·(
x3
y2
)·(
x3
y2
)·(
x3
y2
)=
(x · x · x) · (x · x · x) · (x · x · x) · (x · x · x)(y · y) · (y · y) · (y · y) · (y · y)
=x12
y8
Notice that the power on the outside of the parenthesis multiplies with the power of the x in the numerator and thepower of the y in the denominator. This is called the power of a quotient rule.
Power Rule for Quotients(
xn
ym
)p= xn·p
ym·p
Simplifying Expressions Involving Quotient Properties of Exponents
Let’s apply the rules we just learned to a few examples.
• When we have numbers with exponents and not variables with exponents, we evaluate.
Example 4
Simplify the following expressions.
(a) 45
42
(b) 53
57
(c)(
34
52
)2
Solution
In each of the examples, we want to evaluate the numbers.
(a) Use the quotient rule first.
45
42 = 45−2 = 43
Then evaluate the result.
43 = 64
OR
We can evaluate each part separately and then divide.
102416
= 64
(b) Use the quotient rule first.
53
57 =1
57−3 =154
CHAPTER 8. EXPONENTIAL FUNCTIONS

512 www.ck12.org
Then evaluate the result.
154 =
1625
OR
We can evaluate each part separately and then reduce.
53
57 =125
78125=
1625
It makes more sense to apply the quotient rule first for examples (a) and (b). In this way the numbers we areevaluating are smaller because they are simplified first before applying the power.
(c) Use the power rule for quotients first.
(34
52
)2
=38
54
Then evaluate the result.
38
54 =6561625
OR
We evaluate inside the parenthesis first.
(34
52
)2
=
(8125
)2
Then apply the power outside the parenthesis.
(8125
)2
=6561625
When we have just one variable in the expression, then we apply the rules straightforwardly.
Example 5: Simplify the following expressions:
(a) x12
x5
(b)(
x4
x
)5
Solution:
(a) Use the quotient rule.
8.2. EXPONENT PROPERTIES INVOLVING QUOTIENTS
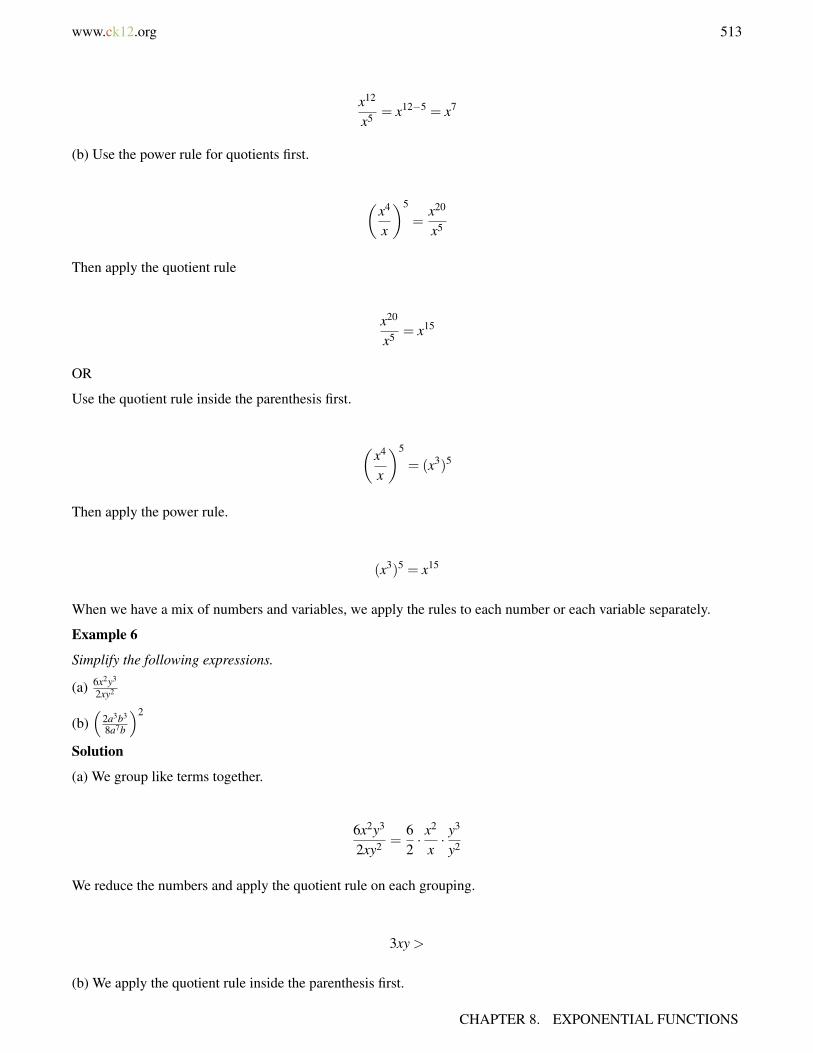
www.ck12.org 513
x12
x5 = x12−5 = x7
(b) Use the power rule for quotients first.
(x4
x
)5
=x20
x5
Then apply the quotient rule
x20
x5 = x15
OR
Use the quotient rule inside the parenthesis first.
(x4
x
)5
= (x3)5
Then apply the power rule.
(x3)5 = x15
When we have a mix of numbers and variables, we apply the rules to each number or each variable separately.
Example 6
Simplify the following expressions.
(a) 6x2y3
2xy2
(b)(
2a3b3
8a7b
)2
Solution
(a) We group like terms together.
6x2y3
2xy2 =62· x
2
x· y
3
y2
We reduce the numbers and apply the quotient rule on each grouping.
3xy >
(b) We apply the quotient rule inside the parenthesis first.
CHAPTER 8. EXPONENTIAL FUNCTIONS
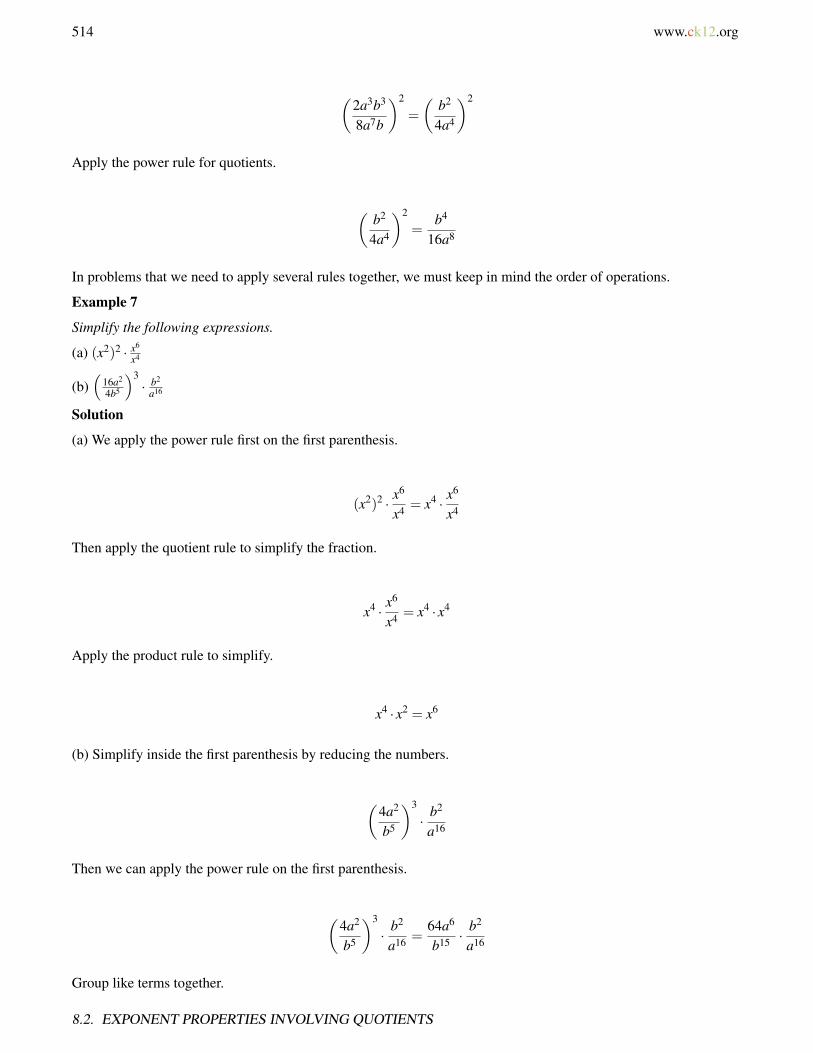
514 www.ck12.org
(2a3b3
8a7b
)2
=
(b2
4a4
)2
Apply the power rule for quotients.
(b2
4a4
)2
=b4
16a8
In problems that we need to apply several rules together, we must keep in mind the order of operations.
Example 7
Simplify the following expressions.
(a) (x2)2 · x6
x4
(b)(
16a2
4b5
)3· b2
a16
Solution
(a) We apply the power rule first on the first parenthesis.
(x2)2 · x6
x4 = x4 · x6
x4
Then apply the quotient rule to simplify the fraction.
x4 · x6
x4 = x4 · x4
Apply the product rule to simplify.
x4 · x2 = x6
(b) Simplify inside the first parenthesis by reducing the numbers.
(4a2
b5
)3
· b2
a16
Then we can apply the power rule on the first parenthesis.
(4a2
b5
)3
· b2
a16 =64a6
b15 ·b2
a16
Group like terms together.
8.2. EXPONENT PROPERTIES INVOLVING QUOTIENTS
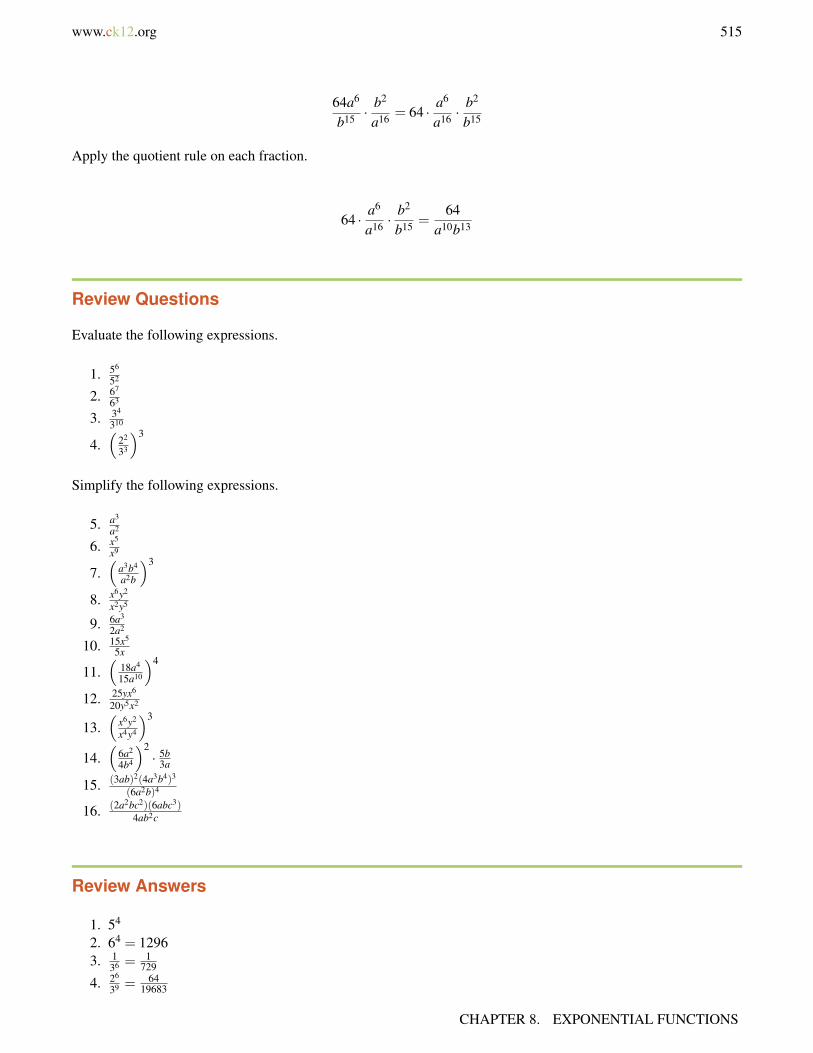
www.ck12.org 515
64a6
b15 ·b2
a16 = 64 · a6
a16 ·b2
b15
Apply the quotient rule on each fraction.
64 · a6
a16 ·b2
b15 =64
a10b13
Review Questions
Evaluate the following expressions.
1. 56
52
2. 67
63
3. 34
310
4.(
22
33
)3
Simplify the following expressions.
5. a3
a2
6. x5
x9
7.(
a3b4
a2b
)3
8. x6y2
x2y5
9. 6a3
2a2
10. 15x5
5x
11.(
18a4
15a10
)4
12. 25yx6
20y5x2
13.(
x6y2
x4y4
)3
14.(
6a2
4b4
)2· 5b
3a
15. (3ab)2(4a3b4)3
(6a2b)4
16. (2a2bc2)(6abc3)4ab2c
Review Answers
1. 54
2. 64 = 12963. 1
36 =1
729
4. 26
39 =64
19683
CHAPTER 8. EXPONENTIAL FUNCTIONS

516 www.ck12.org
5. a6. 1
x4
7. a3b9
8. x4
y3
9. 3a10. 3x4
11. 1296625a4
12. 5x4
4y4
13. x6
y6
14. 15a3
4b7
15. 4a3b10
916. 3a2c4
8.2. EXPONENT PROPERTIES INVOLVING QUOTIENTS
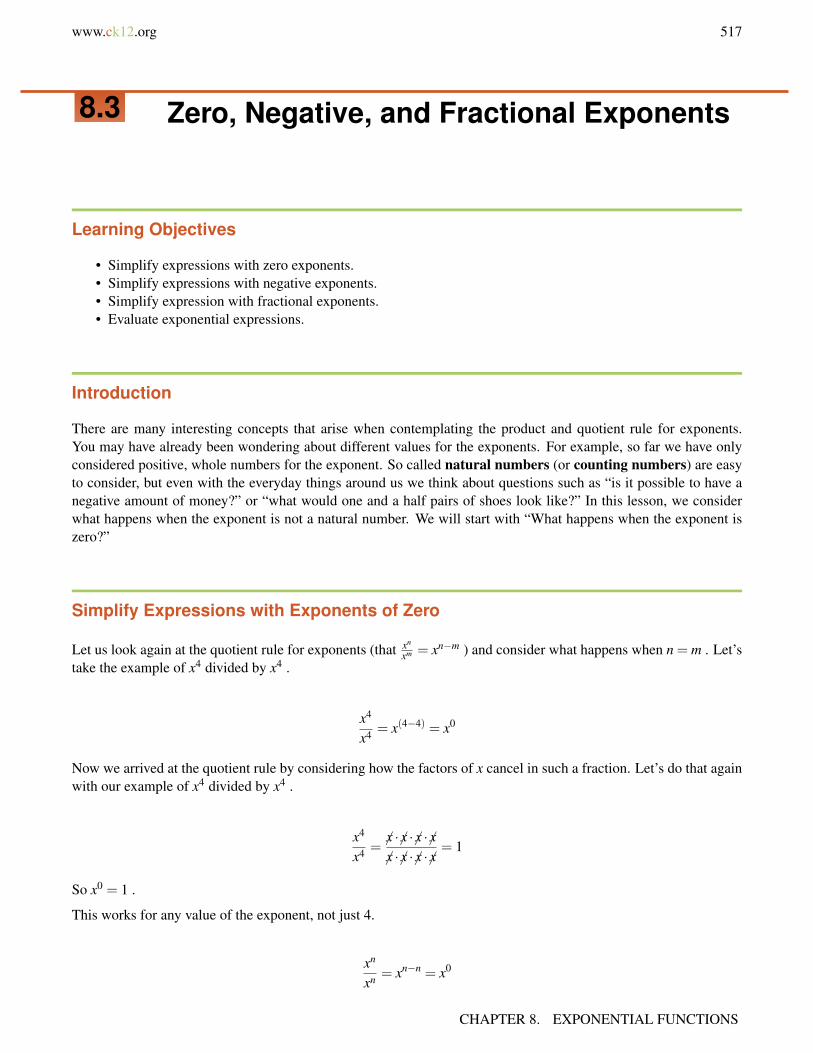
www.ck12.org 517
8.3 Zero, Negative, and Fractional Exponents
Learning Objectives
• Simplify expressions with zero exponents.• Simplify expressions with negative exponents.• Simplify expression with fractional exponents.• Evaluate exponential expressions.
Introduction
There are many interesting concepts that arise when contemplating the product and quotient rule for exponents.You may have already been wondering about different values for the exponents. For example, so far we have onlyconsidered positive, whole numbers for the exponent. So called natural numbers (or counting numbers) are easyto consider, but even with the everyday things around us we think about questions such as “is it possible to have anegative amount of money?” or “what would one and a half pairs of shoes look like?” In this lesson, we considerwhat happens when the exponent is not a natural number. We will start with “What happens when the exponent iszero?”
Simplify Expressions with Exponents of Zero
Let us look again at the quotient rule for exponents (that xn
xm = xn−m ) and consider what happens when n = m . Let’stake the example of x4 divided by x4 .
x4
x4 = x(4−4) = x0
Now we arrived at the quotient rule by considering how the factors of x cancel in such a fraction. Let’s do that againwith our example of x4 divided by x4 .
x4
x4 = x ·x ·x ·xx ·x ·x ·x
= 1
So x0 = 1 .
This works for any value of the exponent, not just 4.
xn
xn = xn−n = x0
CHAPTER 8. EXPONENTIAL FUNCTIONS

518 www.ck12.org
Since there is the same number of factors in the numerator as in the denominator, they cancel each other out and weobtain x0 = 1 . The zero exponent rule says that any number raised to the power zero is one.
Zero Rule for Exponents: x0 = 1, x 6= 0
Simplify Expressions With Negative Exponents
Again we will look at the quotient rule for exponents (that xn
xm = xn−m ) and this time consider what happens whenm > n . Let’s take the example of x4 divided by x6 .x4
x6 = x(4−6) = x−2 for x 6= 0.
By the quotient rule our exponent for x is -2. But what does a negative exponent really mean? Let’s do the samecalculation long-hand by dividing the factors of x4 by the factors of x6 .
x4
x6 = x ·x ·x ·xx ·x ·x ·x · x · x
=1
x · x=
1x2
So we see that x to the power -2 is the same as one divided by x to the power +2. Here is the negative power rule forexponents.
Negative Power Rule for Exponents 1xn = x−n x 6= 0
You will also see negative powers applied to products and fractions. For example, here it is applied to a product.
(x3y)−2 = x−6y−2 using the power rule
x−6y−2 =1x6 ·
1y2 =
1x6y2 using the negative power rule separately on each variable
Here is an example of a negative power applied to a quotient.
(ab
)−3=
a−3
b−3 using the power rule for quotients
a−3
b−3 =a−3
1· 1
b−3 =1a3 ·
b3
1using the negative power rule on each variable separately
1a3 ·
b3
1=
b3
a3 simplifying the division of fractions
b3
a3 =
(ba
)3
using the power rule for quotients in reverse.
The last step is not necessary but it helps define another rule that will save us time. A fraction to a negative power is“flipped”.
Negative Power Rule for Fractions(
xy
)−n=( y
x
)n, x 6= 0,y 6= 0
In some instances, it is more useful to write expressions without fractions and that makes use of negative powers.
Example 1
Write the following expressions without fractions.
8.3. ZERO, NEGATIVE, AND FRACTIONAL EXPONENTS
www.ck12.org 519
(a) 1x
(b) 2x2
(c) x2
y3
(d) 3xy
Solution
We apply the negative rule for exponents 1xn = x−n on all the terms in the denominator of the fractions.
(a) 1x = x−1
(b) 2x2 = 2x−2
(c) x2
y3 = x2y−3
(d) 3xy = 3x−1y−1
Sometimes, it is more useful to write expressions without negative exponents.
Example 2
Write the following expressions without negative exponents.
(a) 3x−3
(b) a2b−3c−1
(c) 4x−1y3
(d) 2x−2
y−3
Solution
We apply the negative rule for exponents 1xn = x−n on all the terms that have negative exponents.
(a) 3x−3 = 3x3
(b) a2b−3c−1 = a2
b3c
(c) 4x−1y3 = 4y3
x
(d) 2x−2
y−3 = 2y3
x2
Example 3
Simplify the following expressions and write them without fractions.
(a) 4a2b3
2a5b
(b)(
x3y2
)3· x2y
4
Solution
(a) Reduce the numbers and apply quotient rule on each variable separately.
4a2b3
6a5b= 2 ·a2−5 ·b3−1 = 2a−3b2
(b) Apply the power rule for quotients first.
CHAPTER 8. EXPONENTIAL FUNCTIONS
520 www.ck12.org
(2xy2
)3
· x2y4
=8x2
y6 ·x2y4
Then simplify the numbers, use product rule on the x ’s and the quotient rule on the y ’s.
8x3
y6 ·x2y4
= 2 · x3+2 · y1−6 = 2x5y−5
Example 4
Simplify the following expressions and write the answers without negative powers.
(a)(
ab−2
b3
)2
(b) x−3y2
x2y−2
Solution
(a) Apply the quotient rule inside the parenthesis.
(ab−2
b3
)2
= (ab−5)2
Apply the power rule.
(ab−5)2 = a2b−10 =a2
b10
(b) Apply the quotient rule on each variable separately.
x−3y2
x2y−2 = x−3−2y2−(−2) = x−5y4 =y4
x5
Simplify Expressions With Fractional Exponents
The exponent rules you learned in the last three sections apply to all powers. So far we have only looked at positiveand negative integers. The rules work exactly the same if the powers are fractions or irrational numbers. Fractionalexponents are used to express the taking of roots and radicals of something (square roots, cube roots, etc.). Here isan exmaple.√
a = a12 and 3√a = a
13 and
5√a2 =
(a2) 1
5 = a25 = a
25
Roots as Fractional Exponents m√an = anm
We will examine roots and radicals in detail in a later chapter. In this section, we will examine how exponent rulesapply to fractional exponents.
Example 5
8.3. ZERO, NEGATIVE, AND FRACTIONAL EXPONENTS
www.ck12.org 521
Simplify the following expressions.
(a) a12 ·a 1
3
(b)(
a13
)2
(c) a52
a12
(d)(
x2
y3
) 13
Solution
(a) Apply the product rule.
a12 ·a
13 = a
12+
13 = a
56
(b) Apply the power rule.
(a
13
)2= a
23
(c) Apply the quotient rule.
a52
a12= a
52−
12 = a
42 = a2
(d) Apply the power rule for quotients.
(x2
y3
) 13
=x
23
y
Evaluate Exponential Expressions
When evaluating expressions we must keep in mind the order of operations. You must remember PEMDAS.
Evaluate inside the Parenthesis.
Evaluate Exponents.
Perform Multiplication and Division operations from left to right.
Perform Addition and Subtraction operations from left to right.
Example 6
Evaluate the following expressions to a single number.
(a) 50
(b) 72
(c)(2
3
)3
CHAPTER 8. EXPONENTIAL FUNCTIONS

522 www.ck12.org
(d) 3−3
(e) 16
12
(f) 8
-13
Solution
(a) 50 = 1 Remember that a number raised to the power 0 is always 1.
(b) 72 = 7 ·7 = 49
(c)(2
3
)3= 23
33 =827
(d) 3−3 = 133 =
127
(e) 16
12 =√
16 = 4 Remember that an exponent of 12 means taking the square root.
(f) 8
-13 = 1 8
13 = 1 3√8= 12
Remember that an exponent of 13 means taking the cube root.
Example 7
Evaluate the following expressions to a single number.
(a) 3 ·55−10 ·5+1
(b) 2·42−3·52
32
(c)(
33
22
)−2· 3
4
Solution
(a) Evaluate the exponent.
3 ·52−10 ·6+1 = 3 ·25−10 ·5+1
Perform multiplications from left to right.
3 ·25−10 ·5+1 = 75−50+1
Perform additions and subtractions from left to right.
75−50+1 = 26
(b) Treat the expressions in the numerator and denominator of the fraction like they are in parenthesis.
(2 ·42−3 ·52)
(32−22)=
(2 ·16−3 ·25)(9−4)
=(32−75)
5=−43
5
8.3. ZERO, NEGATIVE, AND FRACTIONAL EXPONENTS

www.ck12.org 523
(c)(
33
22
)−2· 3
4 =(
22
33
)2· 3
4 = 24
36 · 34 = 24
36 · 322 =
22
35 =4
243
Example 8
Evaluate the following expressions for x = 2,y =−1,z = 3 .
(a) 2x2−3y3 +4z
(b) (x2− y2)2
(c)(
3x2y5
4z
)−2
Solution
(a) 2x2−3y3 +4z = 2 ·22−3 · (−1)3 +4 ·3 = 2 ·4−3 · (−1)+4 ·3 = 8+3+12 = 23
(b) (x2− y2)2 = (22− (−1)2)2 = (4−1)2 = 32 = 9
(c)(
3x2−y5
4z
)−2=(
3·22·(−1)5
4·3
)−2=(
3·4·(−1)12
)−2=(−12
12
)−2=(−1
1
)−2=( 1−1
)2= (−1)2 = 1
Review Questions
Simplify the following expressions, be sure that there aren’t any negative exponents in the answer.
1. x−1 · y2
2. x−4
3. x−3
x−7
4. x−3y−5
z−7
5.(
x12 y−
23
)(x2y
13
)6.(a
b
)−2
7. (3a−2b2c3)3
8. x−3 · x3
Simplify the following expressions so that there aren’t any fractions in the answer.
9. a−3(a5)a−6
10. 5x6y2
x8y
11. (4ab6)3
(ab)5
12.(
3xy
133
13. 3x2y32 xy
12 (3x^3)(4x^4)(2y)2
a−2b−3
c−1
x
12 y^5 2 x
32 y^3 2
CHAPTER 8. EXPONENTIAL FUNCTIONS

524 www.ck12.org
Evaluate the following expressions to a single number.
17. 3−2
18. (6.2)0
19. 8−4 ·86
20.(
1612
)3
21. x24x3y44y2 if x = 2 and y =−122. a4(b2)3 +2ab if a =−2 and b = 123. 5x2−2y3 +3z if x = 3 , y = 2 , and z = 4
24.(
a2
b3
)−2if a = 5 and b = 3
Review Answers
1. y2
x2. 1
x4
3. x4
4. z7
x3y5
5. x52 y
13(b
a
)2or b2
a2
27b6c9
a6
1
a8
5x−2y
64a−2b13
27x2y−1
3xy
6x7y−2
a−2b−3c
x−1y
0.111
1
64
64
512
8.3. ZERO, NEGATIVE, AND FRACTIONAL EXPONENTS

526 www.ck12.org
8.4 Scientific Notation
Learning Objectives
• Write numbers in scientific notation.• Evaluate expressions in scientific notation.• Evaluate expressions in scientific notation using a graphing calculator.
Introduction – Powers of 10
Consider the number six hundred and forty three thousand, two hundred and ninety seven. We write it as 643,297and each digit’s position has a “value” assigned to it. You may have seen a table like this before.
hundred-thousands ten-thousands thousands hundreds tens units (ones)
6 4 3 2 9 7
We have seen that when we write an exponent above a number it means that we have to multiply a certain number offactors of that number together. We have also seen that a zero exponent always gives us one, and negative exponentsmake fractional answers. Look carefully at the table above. Do you notice that all the column headings are powersof ten? Here they are listed.
100,000 = 105
10,000 = 104
1,000 = 103
100 = 102
10 = 101
Even the “units” column is really just a power of ten. Unit means 1 and 1 = 100 .
If we divide 643,297 by 100,000 we get 6.43297. If we multiply this by 100,000 we get back to our original number.But we have just seen that 100,000 is the same as 105 , so if we multiply 6.43297 by 105 we should also get ouroriginal answer. In other words
6.43297×105 = 643,297
So we have found a new way of writing numbers! What do you think happens when we continue the powers of ten?Past the units column down to zero we get into decimals, here the exponent becomes negative.
8.4. SCIENTIFIC NOTATION
www.ck12.org 527
Writing Numbers Greater Than One in Scientific Notation
Scientific notation numbers are always written in the following form.
a×10b
Where 1 ≤ a < 10 and b , the exponent, is an integer. This notation is especially useful for numbers that are eithervery small or very large. When we use scientific notation to write numbers, the exponent on the 10 determines theposition of the decimal point.
Look at the following examples.
1.07×104 = 10,700
1.07×103 = 1,070
1.07×102 = 107
1.07×101 = 10.7
1.07×100 = 1.07
1.07×10−1 = 0.107
1.07×10−2 = 0.0107
1.07×10−3 = 0.00107
1.07×10−4 = 0.000107
Look at the first term of the list and examine the position of the decimal point in both expressions.
So the exponent on the ten acts to move the decimal point over to the right. An exponent of 4 moves it 4 places andan exponent of 3 would move it 3 places.
Example 1
Write the following numbers in scientific notation.
(a) 63
CHAPTER 8. EXPONENTIAL FUNCTIONS
528 www.ck12.org
(b) 9,654
(c) 653,937,000
(d) 1,000,000,006
(a) 63 = 6.3×10 = 6.3×101
(b) 9,654 = 9.654×1,000 = 9.654×10³
(c) 653,937,000 = 6.53937000×100,000,000 = 6.53937×10⁸
(d) 1,000,000,006 = 1.000000006×1,000,000,000 = 1.000000006×10⁹
Example 2
The Sun is approximately 93 million miles for Earth. Write this distance in scientific notation.
This time we will simply write out the number long-hand (with a decimal point) and count decimal places.
Solution
93,000,000,0︸ ︷︷ ︸7 decimal places
= 9.3×10⁷ miles
A Note on Significant Figures
We often combine scientific notation with rounding numbers. If you look at Example 2, the distance you are givenhas been rounded. It is unlikely that the distance is exactly 93 million miles! Looking back at the numbers inExample 1, if we round the final two answers to 2 significant figures (2 s.f.) they become:
1(c) 6.5×10⁸
1(d) 1.0×10⁹
Note that the zero after the decimal point has been left in for Example 1(d) to indicate that the result has beenrounded. It is important to know when it is OK to round and when it is not.
Writing Numbers Less Than One in Scientific Notation
We have seen how we can use scientific notation to express large numbers, but it is equally good at expressingextremely small numbers. Consider the following example.
Example 3
The time taken for a light beam to cross a football pitch is 0.0000004 seconds. Express this time in scientific notation.
We will proceed in a similar way as before.
0.0000004 = 4×0.0000001 = 4× 110,000,000
= 4× 1107 = 4×10⁻⁷
So...
Just as a positive exponent on the ten moves the decimal point that many places to the right, a negative exponentmoves the decimal place that many places to the left.
8.4. SCIENTIFIC NOTATION
www.ck12.org 529
Example 4
Express the following numbers in scientific notation.
(a) 0.003
(b) 0.000056
(c) 0.00005007
(d) 0.00000000000954
Let’s use the method of counting how many places we would move the decimal point before it is after the firstnon-zero number. This will give us the value for our negative exponent.
(a) 0.003︸ ︷︷ ︸3 decimal places
= 3×10⁻³
(b) 0.000056︸ ︷︷ ︸5 decimal places
= 5.6×10⁻⁵
(c) 0.00005007︸ ︷︷ ︸5 decimal places
= 5.007×10⁻⁵
(d) 0.0000000000954︸ ︷︷ ︸12 decimal places
= 9.54×10⁻¹²
Evaluating Expressions in Scientific Notation
When we are faced with products and quotients involving scientific notation, we need to remember the rules forexponents that we learned earlier. It is relatively straightforward to work with scientific notation problems if youremember to deal with all the powers of 10 together. The following examples illustrate this.
Example 5
Evaluate the following expressions and write your answer in scientific notation.
(a) (3.2×106) · (8.7×1011)
(b) (5.2×10−4) · (3.8×10−19)
(c) (1.7×106) · (2.7×10−11)
The key to evaluating expressions involving scientific notation is to keep the powers of 10 together and deal withthem separately. Remember that when we use scientific notation, the leading number must be between 1 and 10.We need to move the decimal point over one place to the left. See how this adds 1 to the exponent on the 10.
(a)
(3.2×106) · (8.7×1011) = 3.2×8.7︸ ︷︷ ︸27.84
×106×1011︸ ︷︷ ︸1017
(3.2×106) · (8.7×1011) = 2.784×101×1017
Solution
(3.2×106) · (8.7×1011) = 2.784×10¹⁸
CHAPTER 8. EXPONENTIAL FUNCTIONS

530 www.ck12.org
(b)
(5.2×10−4) · (3.8×10−19) = 5.2×3.8︸ ︷︷ ︸19.76
×10−4×10−19︸ ︷︷ ︸10−23
= 1.976×101×10−23
Solution
(5.2×10−4) · (3.8×10−19) = 1.976×10⁻²²
(c)
(1.7×106) · (2.7×10−11) = 1.7×2.7︸ ︷︷ ︸4.59
×106×10−11︸ ︷︷ ︸10−5
Solution
(1.7×106) · (2.7×10−11) = 4.59×10⁻⁵
Example 6
Evaluate the following expressions. Round to 3 significant figures and write your answer in scientific notation.
(a) (3.2×10⁶)÷ (8.7×10¹¹)
(b) (5.2×10⁻⁴)÷ (3.8×10⁻¹⁹)
(c) (1.7×10⁶)÷ (2.7×10⁻¹¹)
It will be easier if we convert to fractions and THEN separate out the powers of 10.
(a)
(3.2×10⁶)÷ (8.7×10¹¹) =3.2×10⁶
8.7×10¹¹ Next we separate the powers of 10.
=3.28.7× 106
1011 Evaluate each fraction (round to 3 s.f.):
= 0.368×10(6−11) Remember how to write scientific notation!
= 3.68×10−1×10−5
Solution
(3.2×10⁶)÷ (8.7×10¹¹) = 3.86×10⁻⁶ (rounded to 3 significant figures)
(b)
(5.2×10⁻⁴)÷ (3.8×10¹⁹) =5.2×10⁻⁴
3.8×10⁻¹⁹ Separate the powers of 10.
=5.23.8× 10−4
10−19 Evaluate each fraction (round to 3 s.f.).
= 1.37×10((−4)− (−19))
= 1.37×10¹⁵
Solution
(5.2×10⁻⁴)÷ (3.8×10⁻¹⁹) = 1.37×10¹⁵ (rounded to 3 significant figures)
8.4. SCIENTIFIC NOTATION
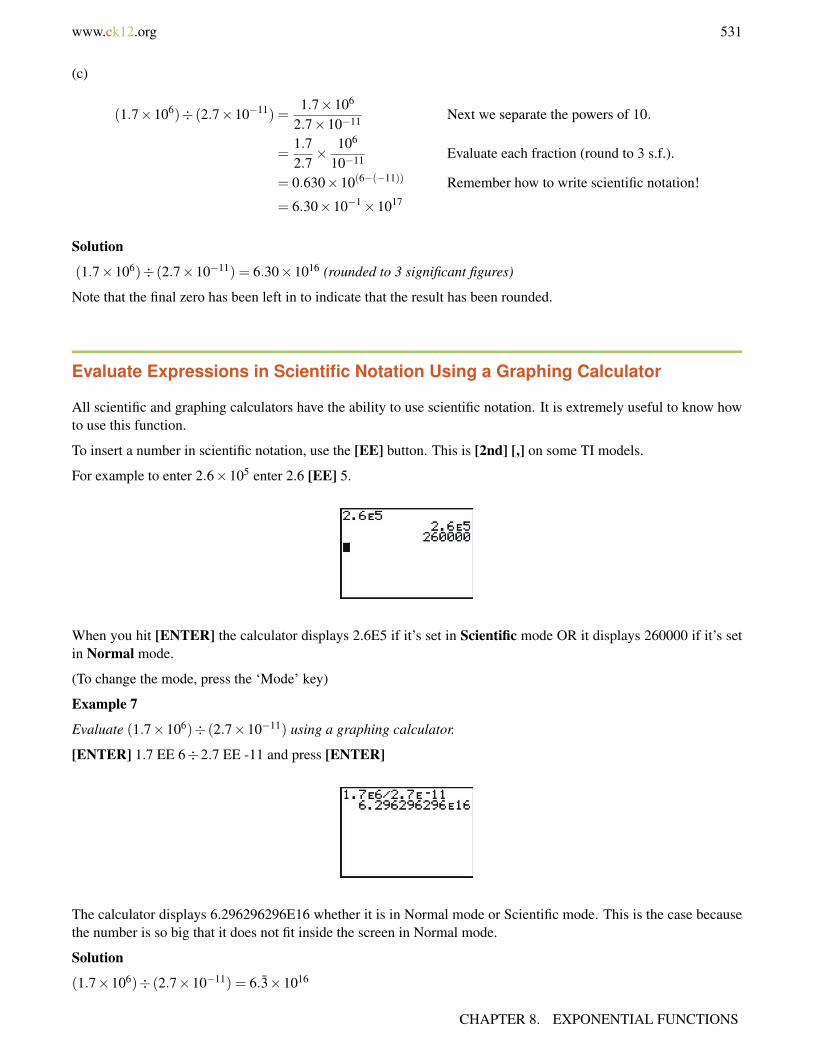
www.ck12.org 531
(c)
(1.7×10⁶)÷ (2.7×10⁻¹¹) =1.7×10⁶
2.7×10⁻¹¹ Next we separate the powers of 10.
=1.72.7× 106
10−11 Evaluate each fraction (round to 3 s.f.).
= 0.630×10(6−(−11)) Remember how to write scientific notation!
= 6.30×10−1×1017
Solution
(1.7×10⁶)÷ (2.7×10⁻¹¹) = 6.30×10¹⁶ (rounded to 3 significant figures)
Note that the final zero has been left in to indicate that the result has been rounded.
Evaluate Expressions in Scientific Notation Using a Graphing Calculator
All scientific and graphing calculators have the ability to use scientific notation. It is extremely useful to know howto use this function.
To insert a number in scientific notation, use the [EE] button. This is [2nd] [,] on some TI models.
For example to enter 2.6×10⁵ enter 2.6 [EE] 5.
When you hit [ENTER] the calculator displays 2.6E5 if it’s set in Scientific mode OR it displays 260000 if it’s setin Normal mode.
(To change the mode, press the ‘Mode’ key)
Example 7
Evaluate (1.7×10⁶)÷ (2.7×10⁻¹¹) using a graphing calculator.
[ENTER] 1.7 EE 6÷2.7 EE -11 and press [ENTER]
The calculator displays 6.296296296E16 whether it is in Normal mode or Scientific mode. This is the case becausethe number is so big that it does not fit inside the screen in Normal mode.
Solution
(1.7×10⁶)÷ (2.7×10⁻¹¹) = 6.3×10¹⁶
CHAPTER 8. EXPONENTIAL FUNCTIONS

532 www.ck12.org
Example 8
Evaluate (2.3×106)× (4.9×10−10) using a graphing calculator.
[ENTER] 2.3 EE 6×4.9 EE -10 and press [ENTER]
The calculator displays .001127 in Normal mode or 1.127E-3 in Scientific mode.
Solution
(2.3×106)× (4.9×10−10) = 1.127×10⁻³
Example 9
Evaluate (4.5×10¹⁴)3 using a graphing calculator.
[ENTER] (4.5EE14)3 and press [ENTER].
The calculator displays 9.1125E43
Solution
(4.5×10¹⁴)3 = 9.1125×1043
Solve Real-World Problems Using Scientific Notation
Example 10
The mass of a single lithium atom is approximately one percent of one millionth of one billionth of one billionth ofone kilogram. Express this mass in scientific notation.
We know that percent means we divide by 100, and so our calculation for the mass (in kg) is
1100× 1
1,000,000× 1
1,000,000,000× 1
1,000,000,000= 10−2×10−6×10−9×10−9×10−9
Next, we use the product of powers rule we learned earlier in the chapter.
10−2×10−6×10−9×10−9 = 10((−2)+(−6)+(−9)+(−9)) = 10−26 kg.
Solution
8.4. SCIENTIFIC NOTATION

www.ck12.org 533
The mass of one lithium atom is approximately 1×10⁻²⁶ kg .
Example 11
You could fit about 3 million E. coli bacteria on the head of a pin. If the size of the pin head in question is 1.2×10⁻⁵ m2 , calculate the area taken up by one E. coli bacterium. Express your answer in scientific notation.
Since we need our answer in scientific notation it makes sense to convert 3 million to that format first:
3,000,000 = 3×10⁶
Next, we need an expression involving our unknown. The area taken by one bacterium. Call this A .
3×10⁶ ·A = 1.2×10⁻⁵ Since 3 million of them make up the area of the pin-head.
Isolate A :
A =1
3×106 ·1.2×10−5 Rearranging the terms gives
A =1.23· 1
106 ×10−5 Then using the definition of a negative exponent
A =1.23×10−6×10−5 Evaluate combine exponents using the product rule.
A = 0.4×10⁻¹¹ We cannot, however, leave our answer like this.
Solution
The area of one bacterium A = 4.0×10⁻¹² m2
Notice that we had to move the decimal point over one place to the right, subtracting 1 from the exponent on the 10.
Review Questions
1. Write the numerical value of the following.
a. 3.102×10²
b. 7.4×10⁴
c. 1.75×10⁻³
d. 2.9×10⁻⁵
e. 9.99×10⁻⁹
2. Write the following numbers in scientific notation.
a. 120,000b. 1,765,244c. 12d. 0.00281e. 0.000000027
3. The moon is approximately a sphere with radius r = 1.08×10³ miles. Use the formula Surface Area = 4πr2
to determine the surface area of the moon, in square miles. Express your answer in scientific notation, roundedto 2 significant figures.
CHAPTER 8. EXPONENTIAL FUNCTIONS

534 www.ck12.org
4. The charge on one electron is approximately 1.60×10⁻¹⁹ coulombs. One Faraday is equal to the total chargeon 6.02×10²³ electrons. What, in coulombs, is the charge on one Faraday?
5. Proxima Centauri, the next closest star to our Sun is approximately 2.5× 10¹³ miles away. If light fromProxima Centauri takes 3.7×10⁴ hours to reach us from there, calculate the speed of light in miles per hour.Express your answer in scientific notation, rounded to 2 significant figures.
Review Answers
1. a. 310.2b. 74.000c. 0.00175d. 0.000029e. 0.00000000999
a. 1.2×10⁵
b. 1.765224×10¹⁰
c. 1.2×101
d. 2.81×10⁻³
e. 2.7×10⁻⁸
2. 1.5×10⁷ miles2
3. 96,320 or 9.632×10⁴
4. 6.8×10⁸ miles per hour
8.4. SCIENTIFIC NOTATION
www.ck12.org 535
8.5 Exponential Growth Functions
Learning Objectives
• Graph an exponential growth function.• Compare graphs of exponential growth functions.• Solve real-world problems involving exponential growth.
Introduction
Exponential functions are different than other functions you have seen before because now the variable appears asthe exponent (or power) instead of the base. In this section, we will be working with functions where the base is aconstant number and the exponent is the variable. Here is an example.
y = 2x
This particular function describes something that doubles each time x increases by one. Let’s look at a particularsituation where this might occur.
A colony of bacteria has a population of three thousand at noon on Sunday. During the next week, the colony’spopulation doubles every day. What is the population of the bacteria colony at noon on Saturday?
Let’s make a table of values and calculate the population each day.
Day 0(Sunday) 1(Monday) 2(Tuesday) 3(Wednesday) 4(Thursday) 5(Friday) 6(Saturday)
Population (in thousands) 3 6 12 24 48 96 192
To get the population of bacteria for the next day we simply multiply the current day’s population by 2.
We start with a population of 3 (thousand): P = 3
To find the population on Monday we double P = 3 ·2The population on Tuesday will be double that on Monday P = 3 ·2 ·2
The population on Wednesday will be double that on Tuesday P = 3 ·2 ·2 ·2Thursday is double that on Wednesday P = 3 ·2 ·2 ·2 ·2
Friday is double that on Thursday P = 3 ·2 ·2 ·2 ·2 ·2Saturday is double that on Friday P = 3 ·2 ·2 ·2 ·2 ·2 ·2
You can see that this function describes a population that is multiplied by 2 each time a day passes.
If we define x as the number of days since Sunday at noon, then we can write the following.
P = 3.2x This is a formula that we can use to calculate the population on any day.
CHAPTER 8. EXPONENTIAL FUNCTIONS
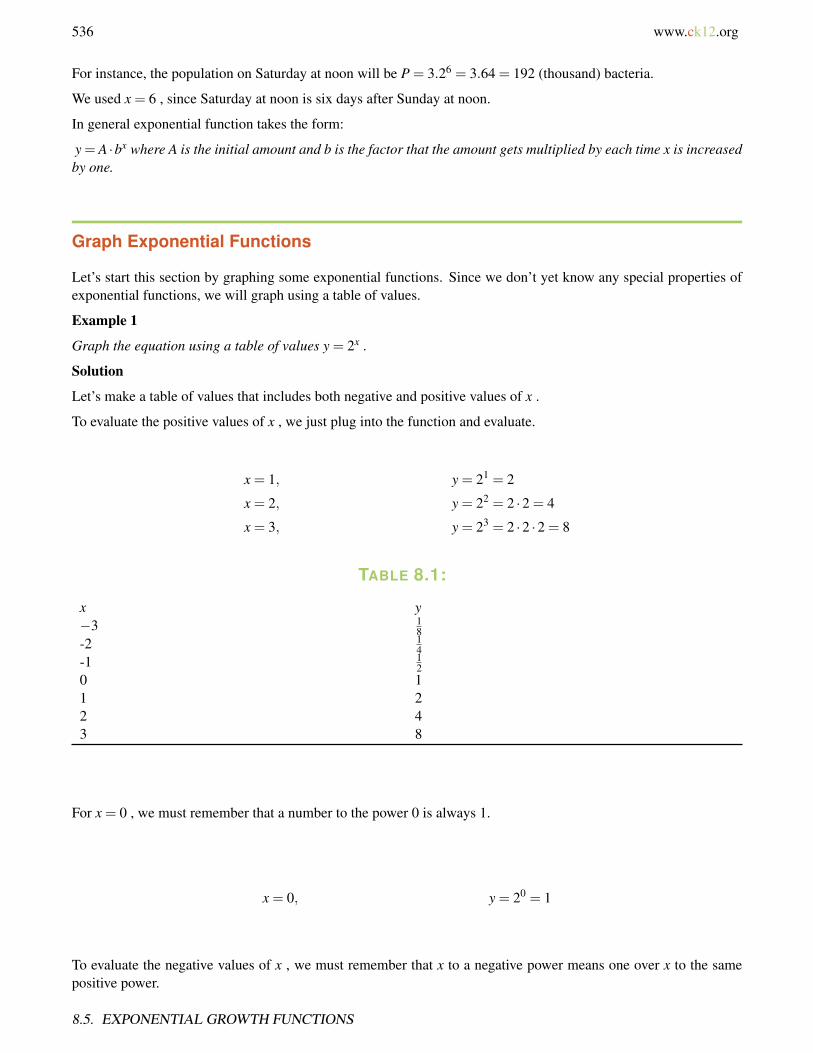
536 www.ck12.org
For instance, the population on Saturday at noon will be P = 3.26 = 3.64 = 192 (thousand) bacteria.
We used x = 6 , since Saturday at noon is six days after Sunday at noon.
In general exponential function takes the form:
y = A ·bx where A is the initial amount and b is the factor that the amount gets multiplied by each time x is increasedby one.
Graph Exponential Functions
Let’s start this section by graphing some exponential functions. Since we don’t yet know any special properties ofexponential functions, we will graph using a table of values.
Example 1
Graph the equation using a table of values y = 2x .
Solution
Let’s make a table of values that includes both negative and positive values of x .
To evaluate the positive values of x , we just plug into the function and evaluate.
x = 1, y = 21 = 2
x = 2, y = 22 = 2 ·2 = 4
x = 3, y = 23 = 2 ·2 ·2 = 8
TABLE 8.1:
x y−3 1
8-2 1
4-1 1
20 11 22 43 8
For x = 0 , we must remember that a number to the power 0 is always 1.
x = 0, y = 20 = 1
To evaluate the negative values of x , we must remember that x to a negative power means one over x to the samepositive power.
8.5. EXPONENTIAL GROWTH FUNCTIONS
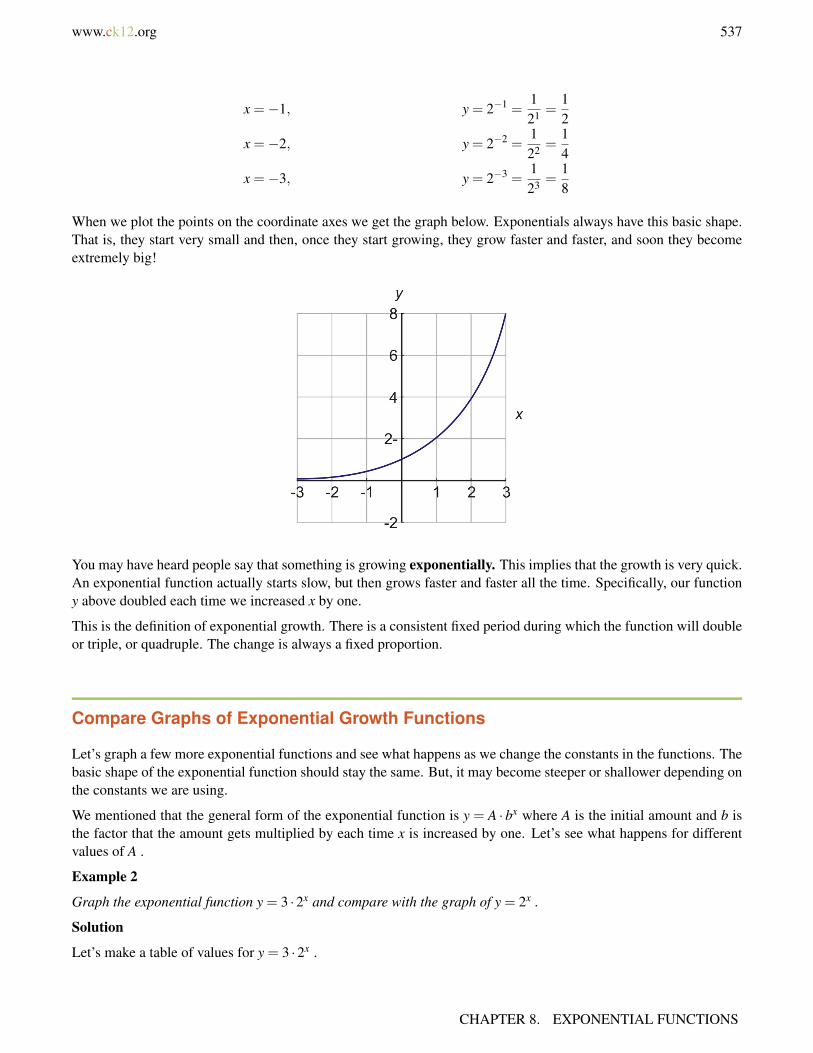
www.ck12.org 537
x =−1, y = 2−1 =121 =
12
x =−2, y = 2−2 =122 =
14
x =−3, y = 2−3 =123 =
18
When we plot the points on the coordinate axes we get the graph below. Exponentials always have this basic shape.That is, they start very small and then, once they start growing, they grow faster and faster, and soon they becomeextremely big!
You may have heard people say that something is growing exponentially. This implies that the growth is very quick.An exponential function actually starts slow, but then grows faster and faster all the time. Specifically, our functiony above doubled each time we increased x by one.
This is the definition of exponential growth. There is a consistent fixed period during which the function will doubleor triple, or quadruple. The change is always a fixed proportion.
Compare Graphs of Exponential Growth Functions
Let’s graph a few more exponential functions and see what happens as we change the constants in the functions. Thebasic shape of the exponential function should stay the same. But, it may become steeper or shallower depending onthe constants we are using.
We mentioned that the general form of the exponential function is y = A · bx where A is the initial amount and b isthe factor that the amount gets multiplied by each time x is increased by one. Let’s see what happens for differentvalues of A .
Example 2
Graph the exponential function y = 3 ·2x and compare with the graph of y = 2x .
Solution
Let’s make a table of values for y = 3 ·2x .
CHAPTER 8. EXPONENTIAL FUNCTIONS
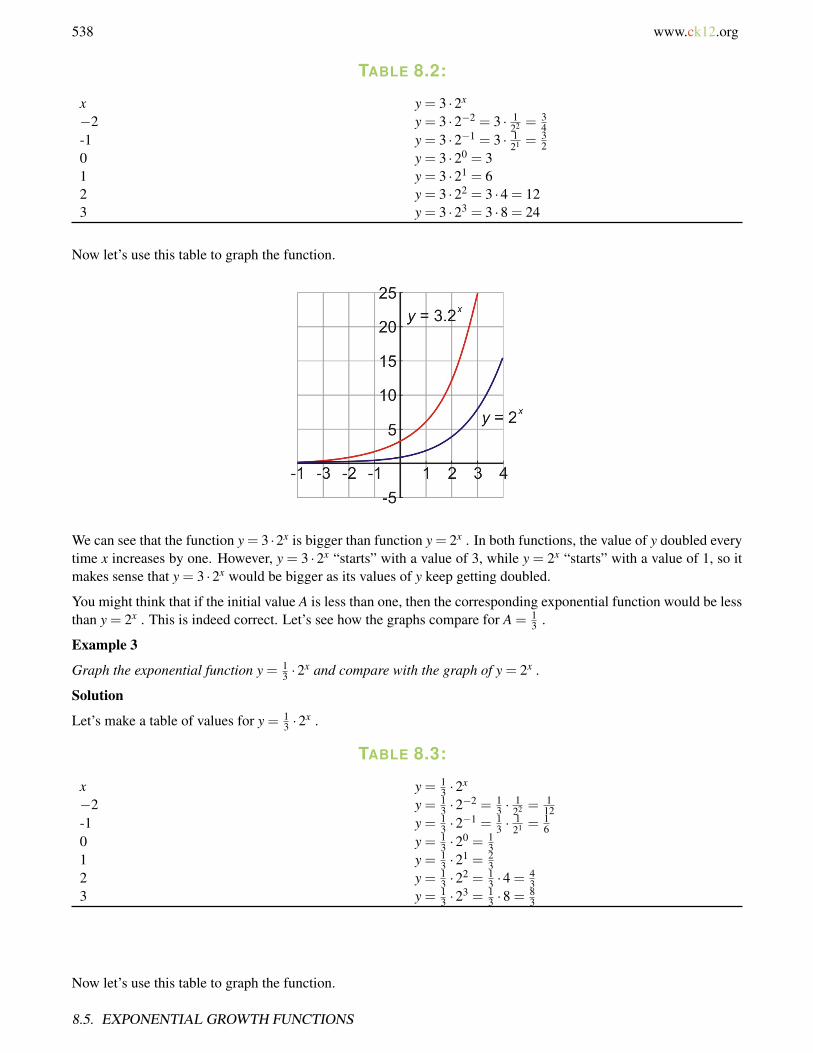
538 www.ck12.org
TABLE 8.2:
x y = 3 ·2x
−2 y = 3 ·2−2 = 3 · 122 =
34
-1 y = 3 ·2−1 = 3 · 121 =
32
0 y = 3 ·20 = 31 y = 3 ·21 = 62 y = 3 ·22 = 3 ·4 = 123 y = 3 ·23 = 3 ·8 = 24
Now let’s use this table to graph the function.
We can see that the function y = 3 ·2x is bigger than function y = 2x . In both functions, the value of y doubled everytime x increases by one. However, y = 3 ·2x “starts” with a value of 3, while y = 2x “starts” with a value of 1, so itmakes sense that y = 3 ·2x would be bigger as its values of y keep getting doubled.
You might think that if the initial value A is less than one, then the corresponding exponential function would be lessthan y = 2x . This is indeed correct. Let’s see how the graphs compare for A = 1
3 .
Example 3
Graph the exponential function y = 13 ·2
x and compare with the graph of y = 2x .
Solution
Let’s make a table of values for y = 13 ·2
x .
TABLE 8.3:
x y = 13 ·2
x
−2 y = 13 ·2
−2 = 13 ·
122 =
112
-1 y = 13 ·2
−1 = 13 ·
121 =
16
0 y = 13 ·2
0 = 13
1 y = 13 ·2
1 = 23
2 y = 13 ·2
2 = 13 ·4 = 4
33 y = 1
3 ·23 = 1
3 ·8 = 83
Now let’s use this table to graph the function.
8.5. EXPONENTIAL GROWTH FUNCTIONS
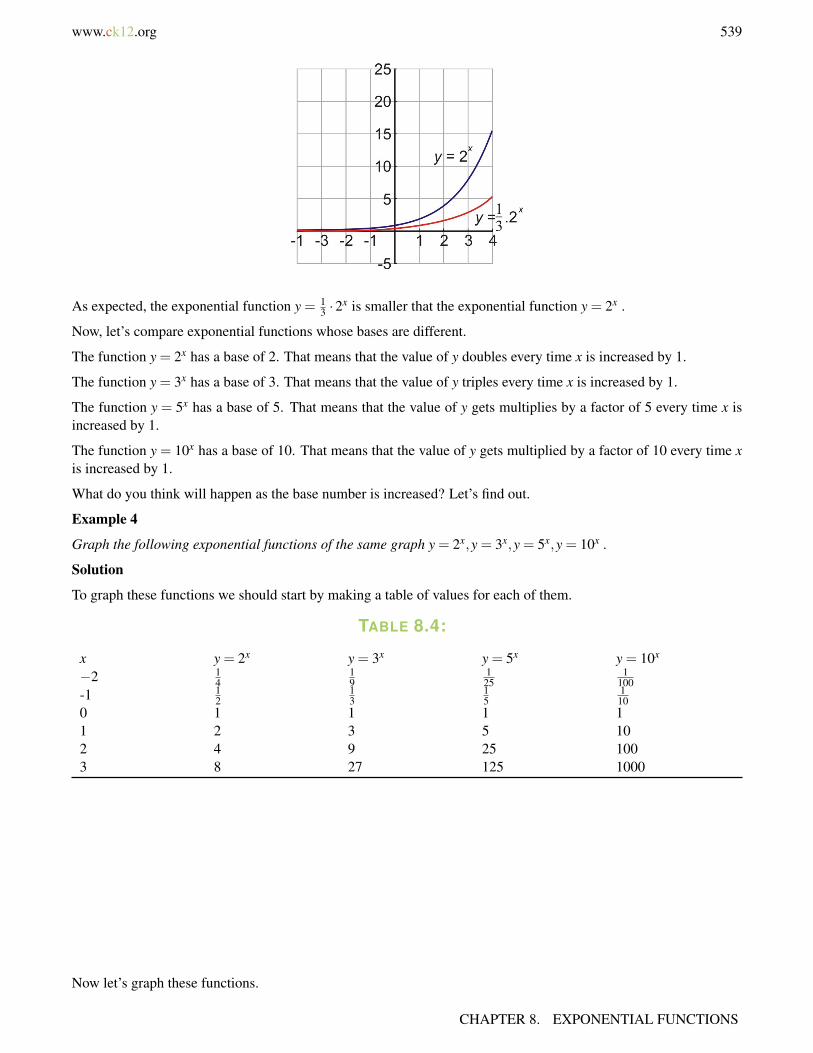
www.ck12.org 539
As expected, the exponential function y = 13 ·2
x is smaller that the exponential function y = 2x .
Now, let’s compare exponential functions whose bases are different.
The function y = 2x has a base of 2. That means that the value of y doubles every time x is increased by 1.
The function y = 3x has a base of 3. That means that the value of y triples every time x is increased by 1.
The function y = 5x has a base of 5. That means that the value of y gets multiplies by a factor of 5 every time x isincreased by 1.
The function y = 10x has a base of 10. That means that the value of y gets multiplied by a factor of 10 every time xis increased by 1.
What do you think will happen as the base number is increased? Let’s find out.
Example 4
Graph the following exponential functions of the same graph y = 2x,y = 3x,y = 5x,y = 10x .
Solution
To graph these functions we should start by making a table of values for each of them.
TABLE 8.4:
x y = 2x y = 3x y = 5x y = 10x
−2 14
19
125
1100
-1 12
13
15
110
0 1 1 1 11 2 3 5 102 4 9 25 1003 8 27 125 1000
Now let’s graph these functions.
CHAPTER 8. EXPONENTIAL FUNCTIONS
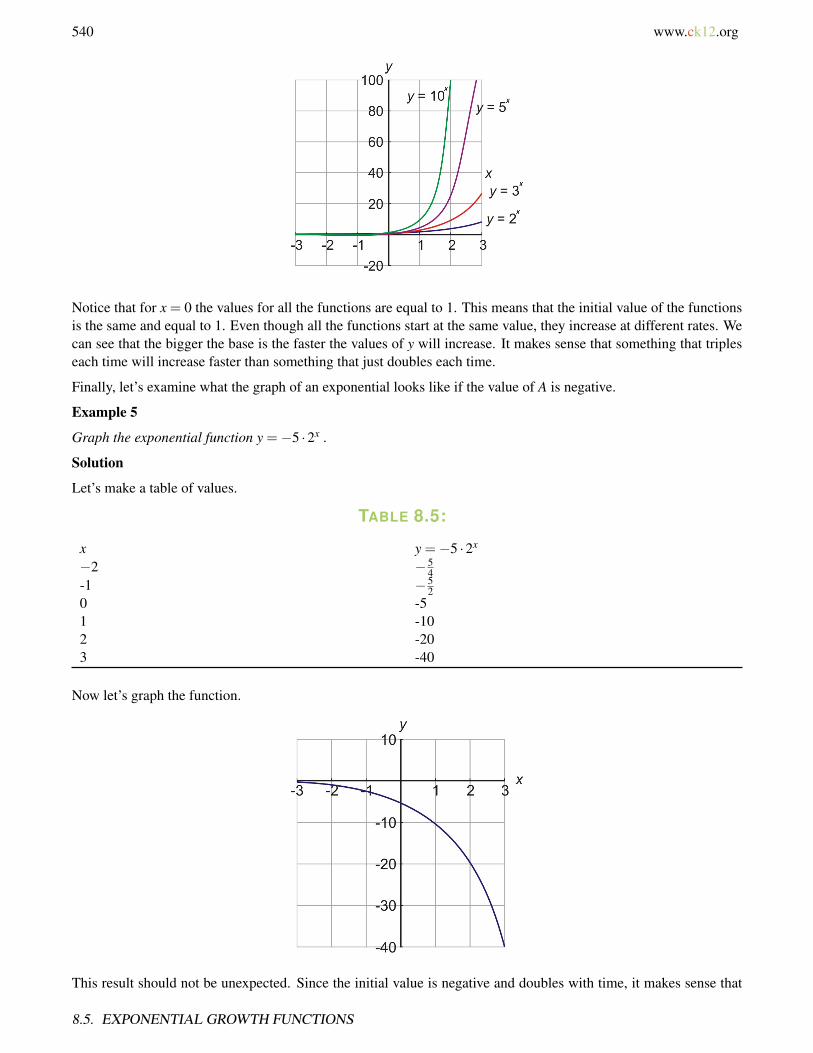
540 www.ck12.org
Notice that for x = 0 the values for all the functions are equal to 1. This means that the initial value of the functionsis the same and equal to 1. Even though all the functions start at the same value, they increase at different rates. Wecan see that the bigger the base is the faster the values of y will increase. It makes sense that something that tripleseach time will increase faster than something that just doubles each time.
Finally, let’s examine what the graph of an exponential looks like if the value of A is negative.
Example 5
Graph the exponential function y =−5 ·2x .
Solution
Let’s make a table of values.
TABLE 8.5:
x y =−5 ·2x
−2 −54
-1 −52
0 -51 -102 -203 -40
Now let’s graph the function.
This result should not be unexpected. Since the initial value is negative and doubles with time, it makes sense that
8.5. EXPONENTIAL GROWTH FUNCTIONS

www.ck12.org 541
the value of y increasess, but in a negative direction. Notice that the shape of the graph remains that of a typicalexponential function, but is now a mirror image about the horizontal axis (i.e. upside down).
Solve Real-World Problems Involving Exponential Growth
We will now examine some real-world problems where exponential growth occurs.
Example 6
The population of a town is estimated to increase by 15% per year. The population today is 20 thousand. Make agraph of the population function and find out what the population will be ten years from now.
Solution
First, we need to write a function that describes the population of the town. The general form of an exponentialfunction is.
y = A ·bx
Define y as the population of the town.
Define x as the number of years from now.
A is the initial population, so A = 20 (thousand)
Finally, we must find what b is. We are told that the population increases by 15% each year.
To calculate percents, it is necessary to change them into decimals. 15% is equivalent to 0.15.
15% of A is equal to 0.15A . This represents the increase in population from one year to the next.
In order to get the total population for the following year we must add the current population to the increase inpopulation. In other words A+0.15A = 1.15A . We see from this that the population must be multiplied by a factorof 1.15 each year.
This means that the base of the exponential is b = 1.15 .
The formula that describes this problem is y = 20 · (1.15)x
Now let’s make a table of values.
TABLE 8.6:
x y = 20 · (1.15)x
−10 4.9-5 9.90 205 40.210 80.9
Now let’s graph the function.
CHAPTER 8. EXPONENTIAL FUNCTIONS

542 www.ck12.org
Notice that we used negative values of x in our table of values. Does it make sense to think of negative time? In thiscase x =−5 represents what the population was five years ago, so it can be useful information. The question askedin the problem was “What will be the population of the town ten years from now?”
To find the population exactly, we use x = 10 in the formula. We found y = 20 · (1.15)10 = 89,911 .
Example 7
Peter earned $1500 last summer. If he deposited the money in a bank account that earns 5% interest compoundedyearly, how much money will he have after five years?
Solution
This problem deals with interest which is compounded yearly. This means that each year the interest is calculated onthe amount of money you have in the bank. That interest is added to the original amount and next year the interest iscalculated on this new amount. In this way, you get paid interest on the interest.
Let’s write a function that describes the amount of money in the bank. The general form of an exponential functionis
y = A ·bx
Define y as the amount of money in the bank.
Define x as the number of years from now.
A is the initial amount, so A = 1500 .
Now we must find what b is.
We are told that the interest is 5% each year.
Change percents into decimals 5% is equivalent to 0.05.
5% of A is equal to 0.05A This represents the interest earned per year.
In order to get the total amount of money for the following year, we must add the interest earned to the initial amount.
A+0.05A = 1.05A
We see from this that the amount of money must be multiplied by a factor of 1.05 each year.
This means that the base of the exponential is b = 1.05
The formula that describes this problem is y = 1500 · (1.05)x
To find the total amount of money in the bank at the end of five years, we simply use x = 5 in our formula.
8.5. EXPONENTIAL GROWTH FUNCTIONS
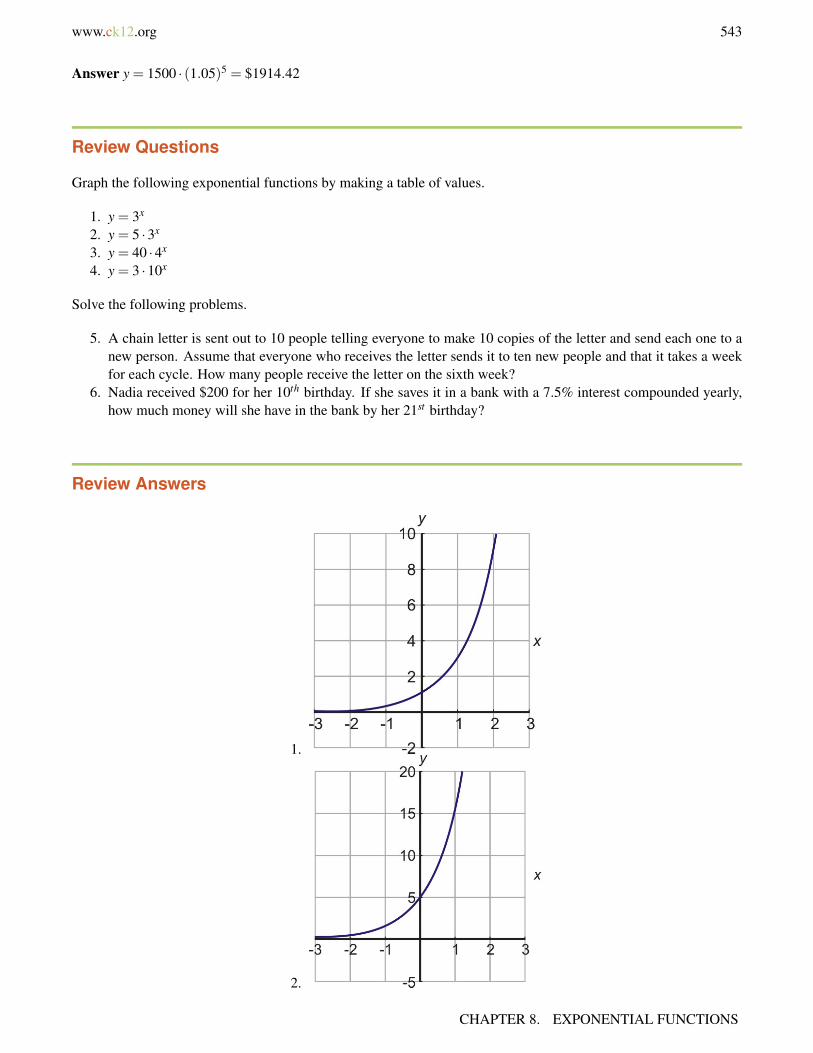
www.ck12.org 543
Answer y = 1500 · (1.05)5 = $1914.42
Review Questions
Graph the following exponential functions by making a table of values.
1. y = 3x
2. y = 5 ·3x
3. y = 40 ·4x
4. y = 3 ·10x
Solve the following problems.
5. A chain letter is sent out to 10 people telling everyone to make 10 copies of the letter and send each one to anew person. Assume that everyone who receives the letter sends it to ten new people and that it takes a weekfor each cycle. How many people receive the letter on the sixth week?
6. Nadia received $200 for her 10th birthday. If she saves it in a bank with a 7.5% interest compounded yearly,how much money will she have in the bank by her 21st birthday?
Review Answers
1.
2.
CHAPTER 8. EXPONENTIAL FUNCTIONS

www.ck12.org 545
8.6 Exponential Decay Functions
Learning Objectives
• Graph an exponential decay function.• Compare graphs of exponential decay functions.• Solve real-world problems involving exponential decay.
Introduction
In the last section, we looked at graphs of exponential functions. We saw that exponentials functions describe aquantity that doubles, triples, quadruples, or simply gets multiplied by the same factor. All the functions we lookedat in the last section were exponentially increasing functions. They started small and then became large very fast. Inthis section, we are going to look at exponentially decreasing functions. An example of such a function is a quantitythat gets decreased by one half each time. Let’s look at a specific example.
For her fifth birthday, Nadia’s grandmother gave her a full bag of candy. Nadia counted her candy and found outthat there were 160 pieces in the bag. As you might suspect Nadia loves candy so she ate half the candy on the firstday. Her mother told her that if she eats it at that rate it will be all gone the next day and she will not have anymoreuntil her next birthday. Nadia devised a clever plan. She will always eat half of the candy that is left in the bag eachday. She thinks that she will get candy every day and her candy will never run out. How much candy does Nadiahave at the end of the week? Would the candy really last forever?
Let’s make a table of values for this problem.
Day 0 1 2 3 4 5 6 7
No. of Candies 160 80 40 20 10 5 2.5 1.25
You can see that if Nadia eats half the candies each day, then by the end of the week she only has 1.25 candies leftin her bag.
Let’s write an equation for this exponential function.
Nadia started with 160 pieces. y = 160
After the first she has12
of that amount. y = 160 · 12
After the second day she has12
of the last amount. y = 160 · 12· 1
2
You see that in order to get the amount of candy left at the end of each day we keep multiplying by 12 .
We can write the exponential function as
CHAPTER 8. EXPONENTIAL FUNCTIONS
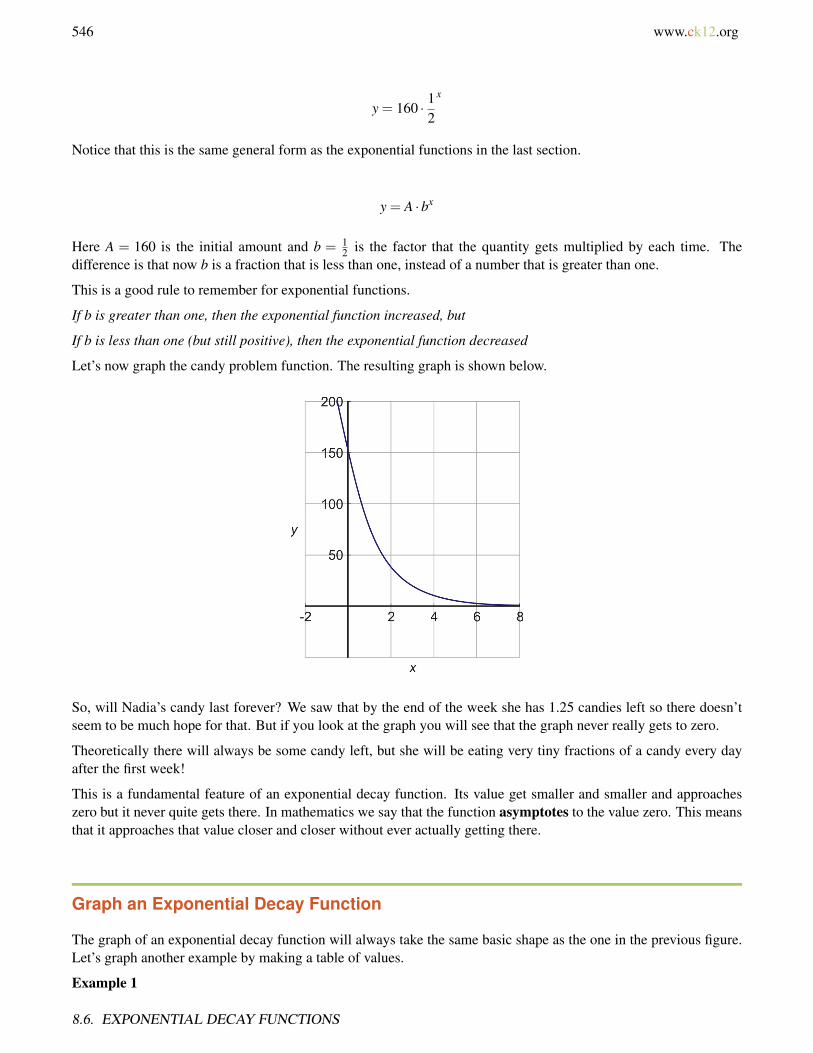
546 www.ck12.org
y = 160 · 12
x
Notice that this is the same general form as the exponential functions in the last section.
y = A ·bx
Here A = 160 is the initial amount and b = 12 is the factor that the quantity gets multiplied by each time. The
difference is that now b is a fraction that is less than one, instead of a number that is greater than one.
This is a good rule to remember for exponential functions.
If b is greater than one, then the exponential function increased, but
If b is less than one (but still positive), then the exponential function decreased
Let’s now graph the candy problem function. The resulting graph is shown below.
So, will Nadia’s candy last forever? We saw that by the end of the week she has 1.25 candies left so there doesn’tseem to be much hope for that. But if you look at the graph you will see that the graph never really gets to zero.
Theoretically there will always be some candy left, but she will be eating very tiny fractions of a candy every dayafter the first week!
This is a fundamental feature of an exponential decay function. Its value get smaller and smaller and approacheszero but it never quite gets there. In mathematics we say that the function asymptotes to the value zero. This meansthat it approaches that value closer and closer without ever actually getting there.
Graph an Exponential Decay Function
The graph of an exponential decay function will always take the same basic shape as the one in the previous figure.Let’s graph another example by making a table of values.
Example 1
8.6. EXPONENTIAL DECAY FUNCTIONS
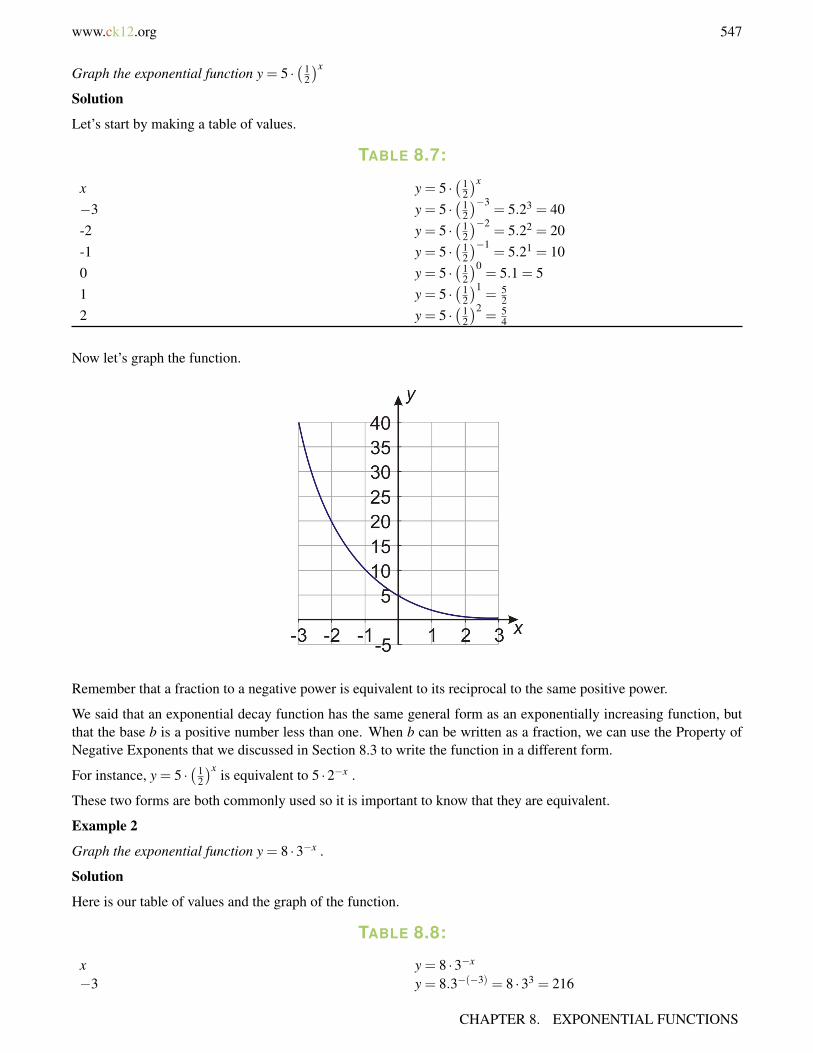
www.ck12.org 547
Graph the exponential function y = 5 ·(1
2
)x
Solution
Let’s start by making a table of values.
TABLE 8.7:
x y = 5 ·(1
2
)x
−3 y = 5 ·(1
2
)−3= 5.23 = 40
-2 y = 5 ·(1
2
)−2= 5.22 = 20
-1 y = 5 ·(1
2
)−1= 5.21 = 10
0 y = 5 ·(1
2
)0= 5.1 = 5
1 y = 5 ·(1
2
)1= 5
2
2 y = 5 ·(1
2
)2= 5
4
Now let’s graph the function.
Remember that a fraction to a negative power is equivalent to its reciprocal to the same positive power.
We said that an exponential decay function has the same general form as an exponentially increasing function, butthat the base b is a positive number less than one. When b can be written as a fraction, we can use the Property ofNegative Exponents that we discussed in Section 8.3 to write the function in a different form.
For instance, y = 5 ·(1
2
)x is equivalent to 5 ·2−x .
These two forms are both commonly used so it is important to know that they are equivalent.
Example 2
Graph the exponential function y = 8 ·3−x .
Solution
Here is our table of values and the graph of the function.
TABLE 8.8:
x y = 8 ·3−x
−3 y = 8.3−(−3) = 8 ·33 = 216
CHAPTER 8. EXPONENTIAL FUNCTIONS

548 www.ck12.org
TABLE 8.8: (continued)
x y = 8 ·3−x
-2 y = 8.3−(−2) = 8 ·32 = 72-1 y = 8.3−(−1) = 8 ·31 = 240 y = 8 ·30 = 81 y = 8 ·3−1 = 8
32 y = 8 ·3−2 = 8
9
Compare Graphs of Exponential Decay Functions
You might have noticed that an exponentially decaying function is very similar to an exponentially increasing func-tion. The two types of functions behave similarly, but they are backwards from each other.
The increasing function starts very small and increases very quickly and ends up very, very big. While the decreasingfunction starts very big and decreases very quickly to soon become very, very small. Let’s graph two such functionstogether on the same graph and compare them.
Example 3
Graph the functions y = 4x and y = 4−x on the same coordinate axes.
Solution
Here is the table of values and the graph of the two functions.
Looking at the values in the table we see that the two functions are “backwards” of each other in the sense that thevalues for the two functions are reciprocals.
TABLE 8.9:
x y = 4x y = 4−x
−3 y = 4−3 = 164 y = 4−(−3) = 64
-2 y = 4−2 = 116 y = 4−(−2) = 16
-1 y = 4−1 = 14 y = 4−(−1) = 4
0 y = 40 = 1 y = 40 = 11 y = 41 = 4 y = 4−1 = 1
42 y = 42 = 16 y = 4−2 = 1
163 y = 43 = 64 y = 4−3 = 1
64
8.6. EXPONENTIAL DECAY FUNCTIONS
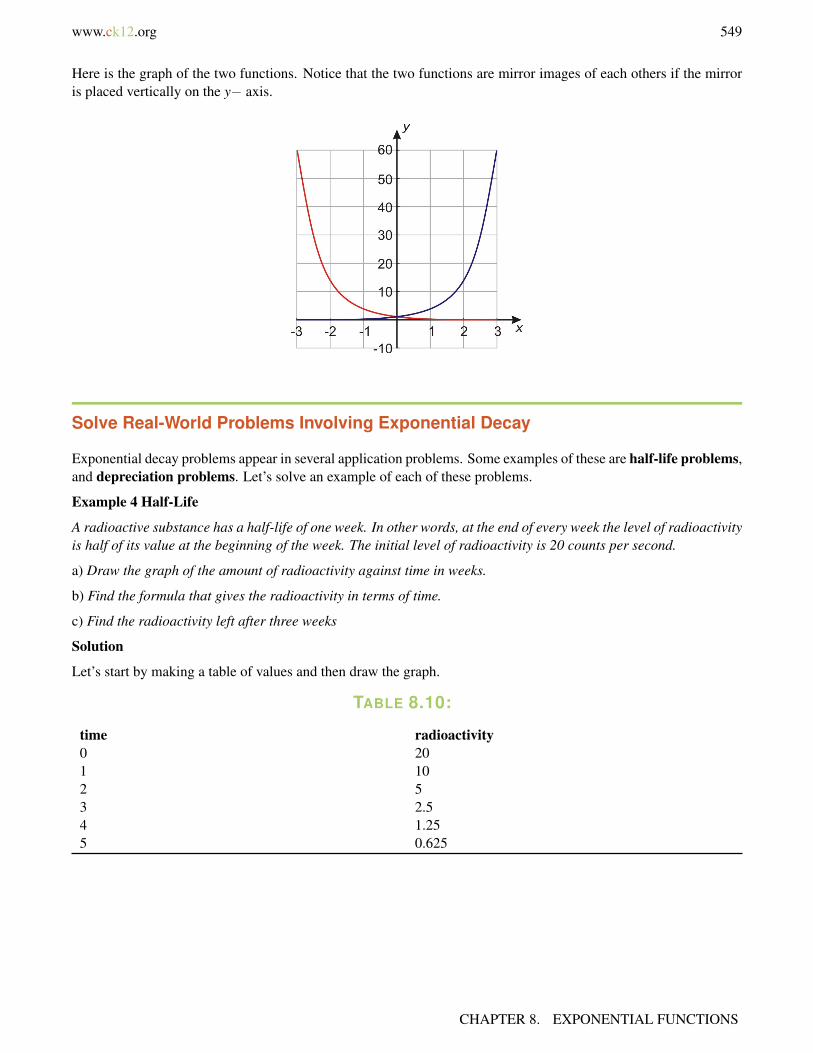
www.ck12.org 549
Here is the graph of the two functions. Notice that the two functions are mirror images of each others if the mirroris placed vertically on the y− axis.
Solve Real-World Problems Involving Exponential Decay
Exponential decay problems appear in several application problems. Some examples of these are half-life problems,and depreciation problems. Let’s solve an example of each of these problems.
Example 4 Half-Life
A radioactive substance has a half-life of one week. In other words, at the end of every week the level of radioactivityis half of its value at the beginning of the week. The initial level of radioactivity is 20 counts per second.
a) Draw the graph of the amount of radioactivity against time in weeks.
b) Find the formula that gives the radioactivity in terms of time.
c) Find the radioactivity left after three weeks
Solution
Let’s start by making a table of values and then draw the graph.
TABLE 8.10:
time radioactivity0 201 102 53 2.54 1.255 0.625
CHAPTER 8. EXPONENTIAL FUNCTIONS
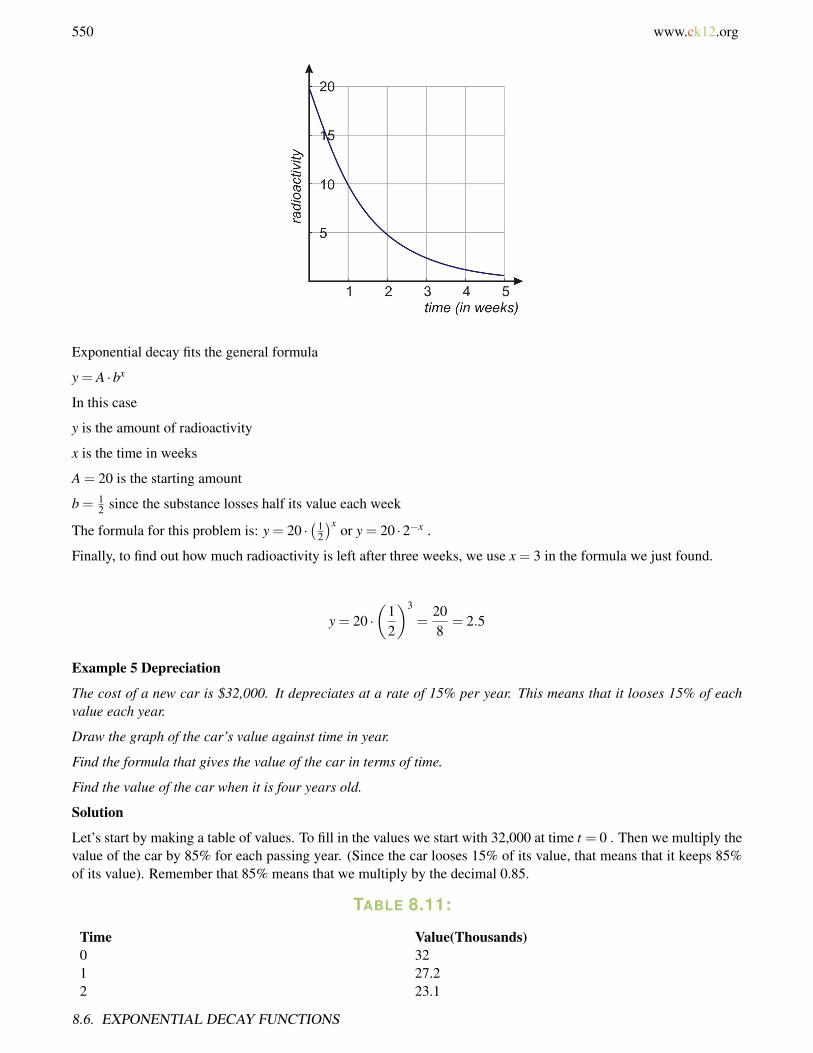
550 www.ck12.org
Exponential decay fits the general formula
y = A ·bx
In this case
y is the amount of radioactivity
x is the time in weeks
A = 20 is the starting amount
b = 12 since the substance losses half its value each week
The formula for this problem is: y = 20 ·(1
2
)x or y = 20 ·2−x .
Finally, to find out how much radioactivity is left after three weeks, we use x = 3 in the formula we just found.
y = 20 ·(
12
)3
=208
= 2.5
Example 5 Depreciation
The cost of a new car is $32,000. It depreciates at a rate of 15% per year. This means that it looses 15% of eachvalue each year.
Draw the graph of the car’s value against time in year.
Find the formula that gives the value of the car in terms of time.
Find the value of the car when it is four years old.
Solution
Let’s start by making a table of values. To fill in the values we start with 32,000 at time t = 0 . Then we multiply thevalue of the car by 85% for each passing year. (Since the car looses 15% of its value, that means that it keeps 85%of its value). Remember that 85% means that we multiply by the decimal 0.85.
TABLE 8.11:
Time Value(Thousands)0 321 27.22 23.1
8.6. EXPONENTIAL DECAY FUNCTIONS

www.ck12.org 551
TABLE 8.11: (continued)
Time Value(Thousands)3 19.74 16.75 14.2
Now draw the graph
Let’s start with the general formula
y = A ·bx
In this case:
y is the value of the car
x is the time in years
A = 32 is the starting amount in thousands
b = 0.85 since we multiply the amount by this factor to get the value of the car next year
The formula for this problem is y = 32 · (0.85)x .
Finally, to find the value of the car when it is four years old, we use x = 4 in the formula we just found.
y = 32 · (0.85)4 = 16.7 thousand dollars or $16,704 if we don’t round.
Review Questions
Graph the following exponential decay functions.
1. y = 15
x
2. y = 4 ·(2
3
)x
3. y = 3−x
4. y = 34 ·6
−x
Solve the following application problems.
CHAPTER 8. EXPONENTIAL FUNCTIONS

552 www.ck12.org
5. The cost of a new ATV (all-terrain vehicle) is $7200. It depreciates at 18% per year. Draw the graph of thevehicle’s value against time in years. Find the formula that gives the value of the ATV in terms of time. Findthe value of the ATV when it is ten year old.
6. A person is infected by a certain bacterial infection. When he goes to the doctor the population of bacteria is2 million. The doctor prescribes an antibiotic that reduces the bacteria population to 1
4 of its size each day.
a. Draw the graph of the size of the bacteria population against time in days.b. Find the formula that gives the size of the bacteria population in term of time.c. Find the size of the bacteria population ten days after the drug was first taken.d. Find the size of the bacteria population after 2 weeks (14 days)
Review Answers
1.
2.
8.6. EXPONENTIAL DECAY FUNCTIONS
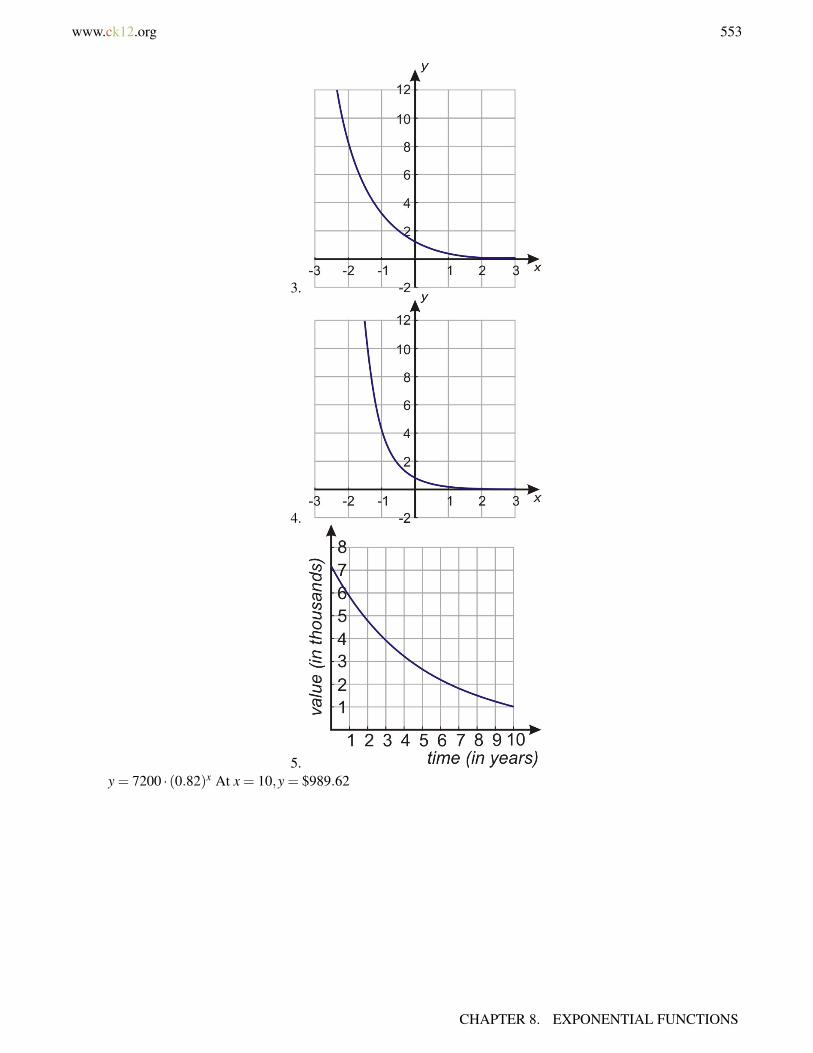
www.ck12.org 553
3.
4.
5.y = 7200 · (0.82)x At x = 10,y = $989.62
CHAPTER 8. EXPONENTIAL FUNCTIONS

554 www.ck12.org
a.b. Formula y = 2,000,000 ·4− x or y = 2,000,000 · (0.25)x
c. At x = 5,y = 1953 bacteriad. At x = 10,y = 1.9 ( ≈ 2 bacteria)e. At x = 14,y = 0.007 (bacteria effectively gone)
8.6. EXPONENTIAL DECAY FUNCTIONS
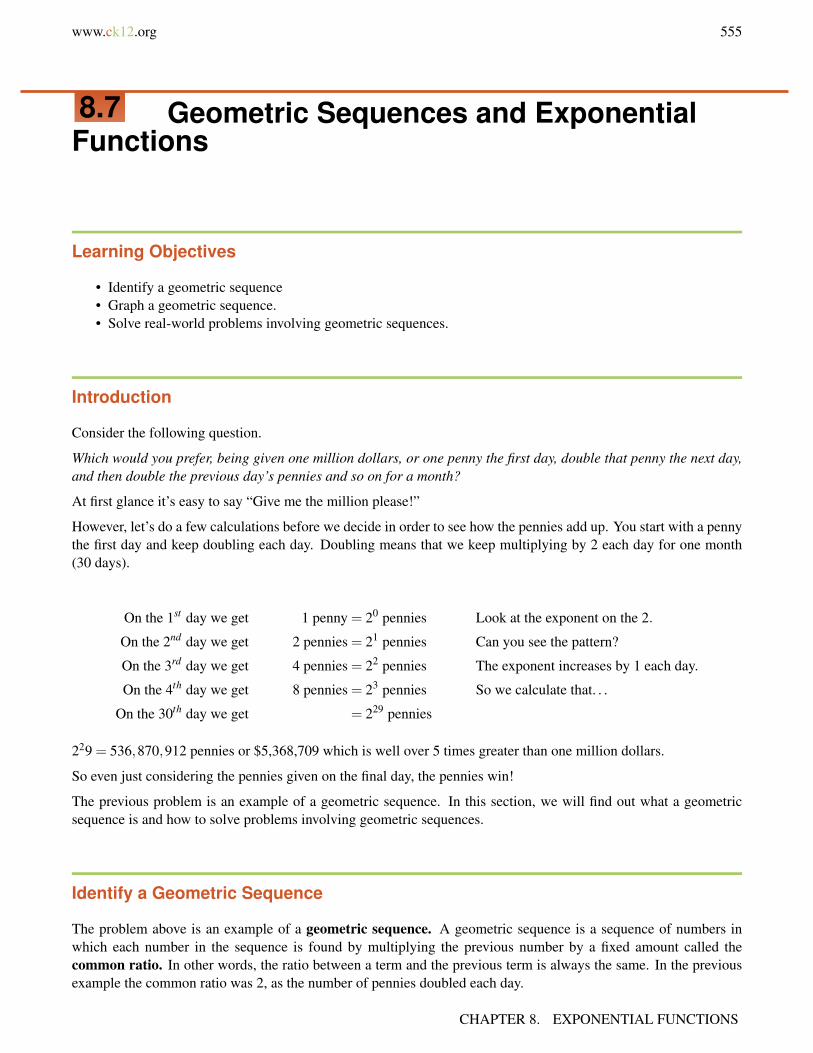
www.ck12.org 555
8.7 Geometric Sequences and ExponentialFunctions
Learning Objectives
• Identify a geometric sequence• Graph a geometric sequence.• Solve real-world problems involving geometric sequences.
Introduction
Consider the following question.
Which would you prefer, being given one million dollars, or one penny the first day, double that penny the next day,and then double the previous day’s pennies and so on for a month?
At first glance it’s easy to say “Give me the million please!”
However, let’s do a few calculations before we decide in order to see how the pennies add up. You start with a pennythe first day and keep doubling each day. Doubling means that we keep multiplying by 2 each day for one month(30 days).
On the 1st day we get 1 penny = 20 pennies Look at the exponent on the 2.
On the 2nd day we get 2 pennies = 21 pennies Can you see the pattern?
On the 3rd day we get 4 pennies = 22 pennies The exponent increases by 1 each day.
On the 4th day we get 8 pennies = 23 pennies So we calculate that. . .
On the 30th day we get = 229 pennies
229 = 536,870,912 pennies or $5,368,709 which is well over 5 times greater than one million dollars.
So even just considering the pennies given on the final day, the pennies win!
The previous problem is an example of a geometric sequence. In this section, we will find out what a geometricsequence is and how to solve problems involving geometric sequences.
Identify a Geometric Sequence
The problem above is an example of a geometric sequence. A geometric sequence is a sequence of numbers inwhich each number in the sequence is found by multiplying the previous number by a fixed amount called thecommon ratio. In other words, the ratio between a term and the previous term is always the same. In the previousexample the common ratio was 2, as the number of pennies doubled each day.
CHAPTER 8. EXPONENTIAL FUNCTIONS
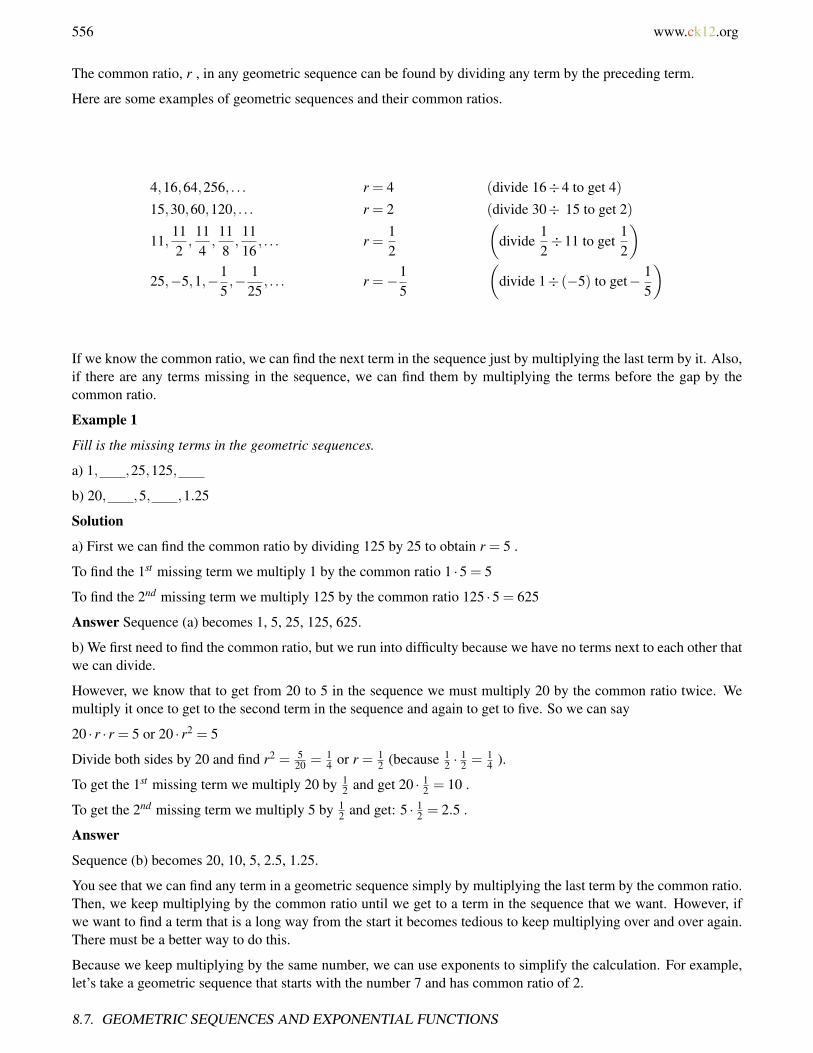
556 www.ck12.org
The common ratio, r , in any geometric sequence can be found by dividing any term by the preceding term.
Here are some examples of geometric sequences and their common ratios.
4,16,64,256, . . . r = 4 (divide 16÷4 to get 4)
15,30,60,120, . . . r = 2 (divide 30÷ 15 to get 2)
11,112,114,118,1116
, . . . r =12
(divide
12÷11 to get
12
)25,−5,1,−1
5,− 1
25, . . . r =−1
5
(divide 1÷ (−5) to get− 1
5
)
If we know the common ratio, we can find the next term in the sequence just by multiplying the last term by it. Also,if there are any terms missing in the sequence, we can find them by multiplying the terms before the gap by thecommon ratio.
Example 1
Fill is the missing terms in the geometric sequences.
a) 1, ,25,125,
b) 20, ,5, ,1.25
Solution
a) First we can find the common ratio by dividing 125 by 25 to obtain r = 5 .
To find the 1st missing term we multiply 1 by the common ratio 1 ·5 = 5
To find the 2nd missing term we multiply 125 by the common ratio 125 ·5 = 625
Answer Sequence (a) becomes 1, 5, 25, 125, 625.
b) We first need to find the common ratio, but we run into difficulty because we have no terms next to each other thatwe can divide.
However, we know that to get from 20 to 5 in the sequence we must multiply 20 by the common ratio twice. Wemultiply it once to get to the second term in the sequence and again to get to five. So we can say
20 · r · r = 5 or 20 · r2 = 5
Divide both sides by 20 and find r2 = 520 = 1
4 or r = 12 (because 1
2 ·12 = 1
4 ).
To get the 1st missing term we multiply 20 by 12 and get 20 · 1
2 = 10 .
To get the 2nd missing term we multiply 5 by 12 and get: 5 · 1
2 = 2.5 .
Answer
Sequence (b) becomes 20, 10, 5, 2.5, 1.25.
You see that we can find any term in a geometric sequence simply by multiplying the last term by the common ratio.Then, we keep multiplying by the common ratio until we get to a term in the sequence that we want. However, ifwe want to find a term that is a long way from the start it becomes tedious to keep multiplying over and over again.There must be a better way to do this.
Because we keep multiplying by the same number, we can use exponents to simplify the calculation. For example,let’s take a geometric sequence that starts with the number 7 and has common ratio of 2.
8.7. GEOMETRIC SEQUENCES AND EXPONENTIAL FUNCTIONS
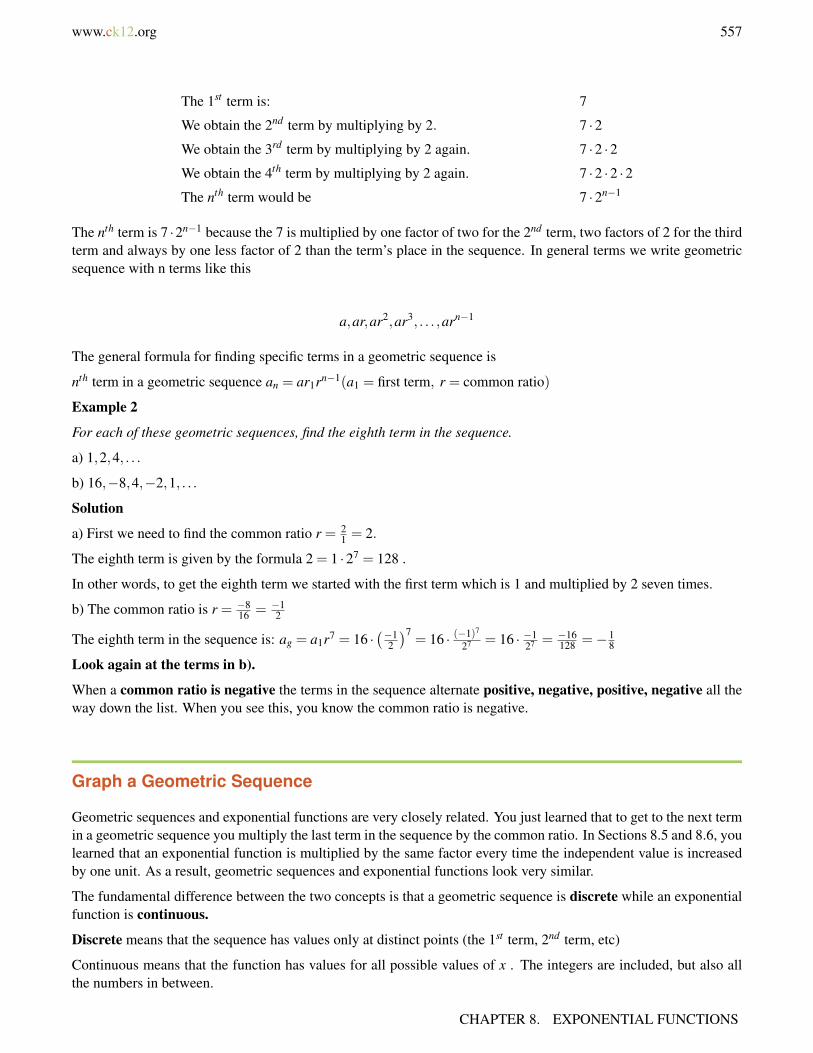
www.ck12.org 557
The 1st term is: 7
We obtain the 2nd term by multiplying by 2. 7 ·2We obtain the 3rd term by multiplying by 2 again. 7 ·2 ·2We obtain the 4th term by multiplying by 2 again. 7 ·2 ·2 ·2The nth term would be 7 ·2n−1
The nth term is 7 ·2n−1 because the 7 is multiplied by one factor of two for the 2nd term, two factors of 2 for the thirdterm and always by one less factor of 2 than the term’s place in the sequence. In general terms we write geometricsequence with n terms like this
a,ar,ar2,ar3, . . . ,arn−1
The general formula for finding specific terms in a geometric sequence is
nth term in a geometric sequence an = ar1rn−1(a1 = first term, r = common ratio)
Example 2
For each of these geometric sequences, find the eighth term in the sequence.
a) 1,2,4, . . .
b) 16,−8,4,−2,1, . . .
Solution
a) First we need to find the common ratio r = 21 = 2.
The eighth term is given by the formula 2 = 1 ·27 = 128 .
In other words, to get the eighth term we started with the first term which is 1 and multiplied by 2 seven times.
b) The common ratio is r = −816 = −1
2
The eighth term in the sequence is: ag = a1r7 = 16 ·(−1
2
)7= 16 · (−1)7
27 = 16 · −127 = −16
128 =−18
Look again at the terms in b).
When a common ratio is negative the terms in the sequence alternate positive, negative, positive, negative all theway down the list. When you see this, you know the common ratio is negative.
Graph a Geometric Sequence
Geometric sequences and exponential functions are very closely related. You just learned that to get to the next termin a geometric sequence you multiply the last term in the sequence by the common ratio. In Sections 8.5 and 8.6, youlearned that an exponential function is multiplied by the same factor every time the independent value is increasedby one unit. As a result, geometric sequences and exponential functions look very similar.
The fundamental difference between the two concepts is that a geometric sequence is discrete while an exponentialfunction is continuous.
Discrete means that the sequence has values only at distinct points (the 1st term, 2nd term, etc)
Continuous means that the function has values for all possible values of x . The integers are included, but also allthe numbers in between.
CHAPTER 8. EXPONENTIAL FUNCTIONS

558 www.ck12.org
As a result of this difference, we use a geometric series to describe quantities that have values at discrete points, andwe use exponential functions to describe quantities that have values that change continuously.
Here are two examples one discrete and one continuous.
Example 3 Discrete sequence
An ant walks past several stacks of Lego blocks. There is one block in the first stack, 3 blocks in the 2nd stack and 9blocks in the 3rd stack. In fact, in each successive stack there are triple the number of blocks than there were in theprevious stack.
In this example, each stack has a distinct number of blocks and the next stack is made by adding a certain number ofwhole pieces all at once. More importantly, however, there are no values of the sequence between the stacks. Youcannot ask how high the stack is between the 2nd and 3rd stack, as no stack exists at that position!
Example 4 Continuous Function
A population of bacteria in a Petri dish increases by a factor of three every 24 hours. The starting population is 1million bacteria. This means that on the first day the population increases to 3 million on the second day to 9 millionand so on.
In this example, the population of bacteria is continuous. Even though we only measured the population every 24hours we know that it does not get from 1 million to 3 million all at once but that the population changes bit bybit over the 24 hours. In other words, the bacteria are always there, and you can, if you so wish, find out what thepopulation is at any time during a 24 hours period.
When we graph an exponential function, we draw the graph with a solid curve to signify that the function has valuesat any time during the day. On the other hand, when we graph a geometric sequence, we draw discrete points tosignify that the sequence only has value at those points but not in between.
Here are graphs for the two examples we gave before:
Solve Real-World Problems Involving Geometric Sequences
Let’s solve two application problems involving geometric sequences.
Example 5 Grains of rice on a chessboard
A courtier presented the Indian king with a beautiful, hand-made chessboard. The king asked what he would like inreturn for his gift and the courtier surprised the king by asking for one grain of rice on the first square, two grainson the second, four grains on the third, etc. The king readily agreed and asked for the rice to be brought. (FromMeadows et al. 1972, p.29 via Porritt 2005) How many grains of rice does the king have to put on the last square?
8.7. GEOMETRIC SEQUENCES AND EXPONENTIAL FUNCTIONS
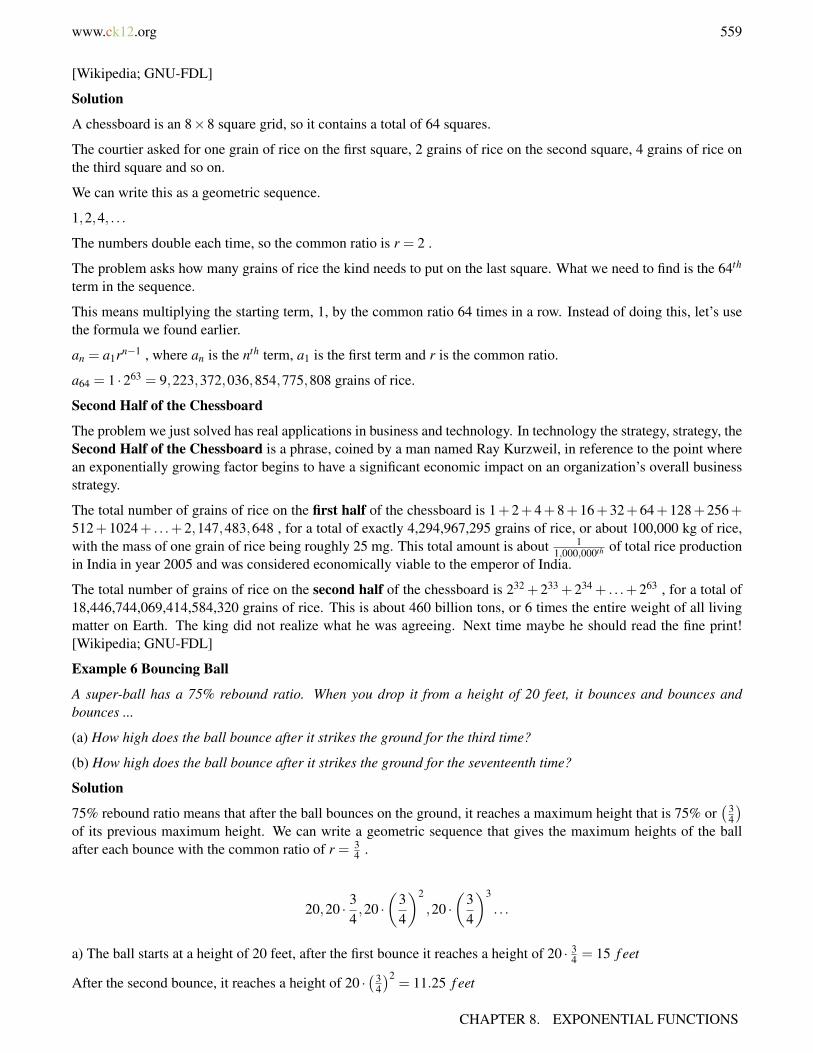
www.ck12.org 559
[Wikipedia; GNU-FDL]
Solution
A chessboard is an 8×8 square grid, so it contains a total of 64 squares.
The courtier asked for one grain of rice on the first square, 2 grains of rice on the second square, 4 grains of rice onthe third square and so on.
We can write this as a geometric sequence.
1,2,4, . . .
The numbers double each time, so the common ratio is r = 2 .
The problem asks how many grains of rice the kind needs to put on the last square. What we need to find is the 64th
term in the sequence.
This means multiplying the starting term, 1, by the common ratio 64 times in a row. Instead of doing this, let’s usethe formula we found earlier.
an = a1rn−1 , where an is the nth term, a1 is the first term and r is the common ratio.
a64 = 1 ·263 = 9,223,372,036,854,775,808 grains of rice.
Second Half of the Chessboard
The problem we just solved has real applications in business and technology. In technology the strategy, strategy, theSecond Half of the Chessboard is a phrase, coined by a man named Ray Kurzweil, in reference to the point wherean exponentially growing factor begins to have a significant economic impact on an organization’s overall businessstrategy.
The total number of grains of rice on the first half of the chessboard is 1+2+4+8+16+32+64+128+256+512+1024+ . . .+2,147,483,648 , for a total of exactly 4,294,967,295 grains of rice, or about 100,000 kg of rice,with the mass of one grain of rice being roughly 25 mg. This total amount is about 1
1,000,000th of total rice productionin India in year 2005 and was considered economically viable to the emperor of India.
The total number of grains of rice on the second half of the chessboard is 232 +233 +234 + . . .+263 , for a total of18,446,744,069,414,584,320 grains of rice. This is about 460 billion tons, or 6 times the entire weight of all livingmatter on Earth. The king did not realize what he was agreeing. Next time maybe he should read the fine print![Wikipedia; GNU-FDL]
Example 6 Bouncing Ball
A super-ball has a 75% rebound ratio. When you drop it from a height of 20 feet, it bounces and bounces andbounces ...
(a) How high does the ball bounce after it strikes the ground for the third time?
(b) How high does the ball bounce after it strikes the ground for the seventeenth time?
Solution
75% rebound ratio means that after the ball bounces on the ground, it reaches a maximum height that is 75% or(3
4
)of its previous maximum height. We can write a geometric sequence that gives the maximum heights of the ballafter each bounce with the common ratio of r = 3
4 .
20,20 · 34,20 ·
(34
)2
,20 ·(
34
)3
. . .
a) The ball starts at a height of 20 feet, after the first bounce it reaches a height of 20 · 34 = 15 f eet
After the second bounce, it reaches a height of 20 ·(3
4
)2= 11.25 f eet
CHAPTER 8. EXPONENTIAL FUNCTIONS

560 www.ck12.org
After the third bounce, it reaches a height of 20 ·(3
4
)3= 8.44 f eet
Notice that the height after the first bounce corresponds to the second term in the sequence, the height after thesecond bounce corresponds to the third term in the sequence and so on.
b) This means that the height after the seventeenth bounce corresponds to the 18th term in the sequence. You canfind the height by using the formula for the 18th term:
a18 = 20 ·(
34
)17
= 0.15 f eet
Here is a graph that represents this information.
Review Questions
Determine the first five terms of each geometric sequence.
1. a1 = 2,r = 32. a1 = 90,r =−1
33. a1 = 6,r =−2
Find the missing terms in each geometric series:
4. 3, ,48,192,5. 81, , , ,16. 9
4 , , , 23 ,
Find the indicated term of each geometric series.
7. a1 = 4,r = 2 Find a6 .8. a1 =−7,r =−3
4 Find a4 .9. a1 =−10,r =−3 Find a10 .
10. Anne goes bungee jumping off a bridge above water. On the initial jump, the bungee cord stretches by 120feet. On the next bounce, the stretch is 60% of the original jump and each additional bounce stretches the ropeby 60% of the previous stretch.
a. What will the rope stretch be on the third bounce?b. What will be the rope stretch be on the 12th bounce?
8.7. GEOMETRIC SEQUENCES AND EXPONENTIAL FUNCTIONS

www.ck12.org 561
Review Answers
1. 2,6,18,54,1622. 90,−30,10,−10
3 ,109
3. 6,−12,24,−48,964. 3,12,48,192,7685. 81,27,9,3,16. 9
4 ,32 ,1,
23 ,
49
7. a6 = 1288. a4 = 2.959. a10 = 196830
a. 43.2 feetb. 0.44 feet
CHAPTER 8. EXPONENTIAL FUNCTIONS

562 www.ck12.org
8.8 Problem-Solving Strategies
Learning Objectives
• Read and understand given problem situations.• Make tables and identify patterns.• Solve real-world problems using selected strategies as part of a plan.
Introduction
Problem solving appears everywhere, in your regular life as well as in all jobs and careers. Of course, in this manualwe concentrate on solving problems that involve algebra. From previous sections, remember our problem solvingplan.
Step 1
Understand the problem.
Read the problem carefully. Once the problem is read, list all the components and data that are involved. This iswhere you will be assigning your variables.
Step 2
Devise a plan – Translate.
Come up with a way to solve the problem. Set up an equation, draw a diagram, make a chart or construct a table asa start to solving your problem.
Step 3
Carry out the plan – Solve.
This is where you solve the equation you came up with in Step 2.
Step 4
Look – Check and Interpret.
Check to see if you used all your information and that the answer makes sense.
Examples of Exponential Word Problems
In this section, we will be applying this problem solving strategy to solving real-world problems where exponentialfunctions appear. Compound interest, loudness of sound, population increase, population decrease or radioactivedecay are all applications of exponential functions. In these problems, we will use the methods of constructing atable and identifying a pattern to help us devise a plan for solving the problems.
Example 1 Compound Interest
8.8. PROBLEM-SOLVING STRATEGIES
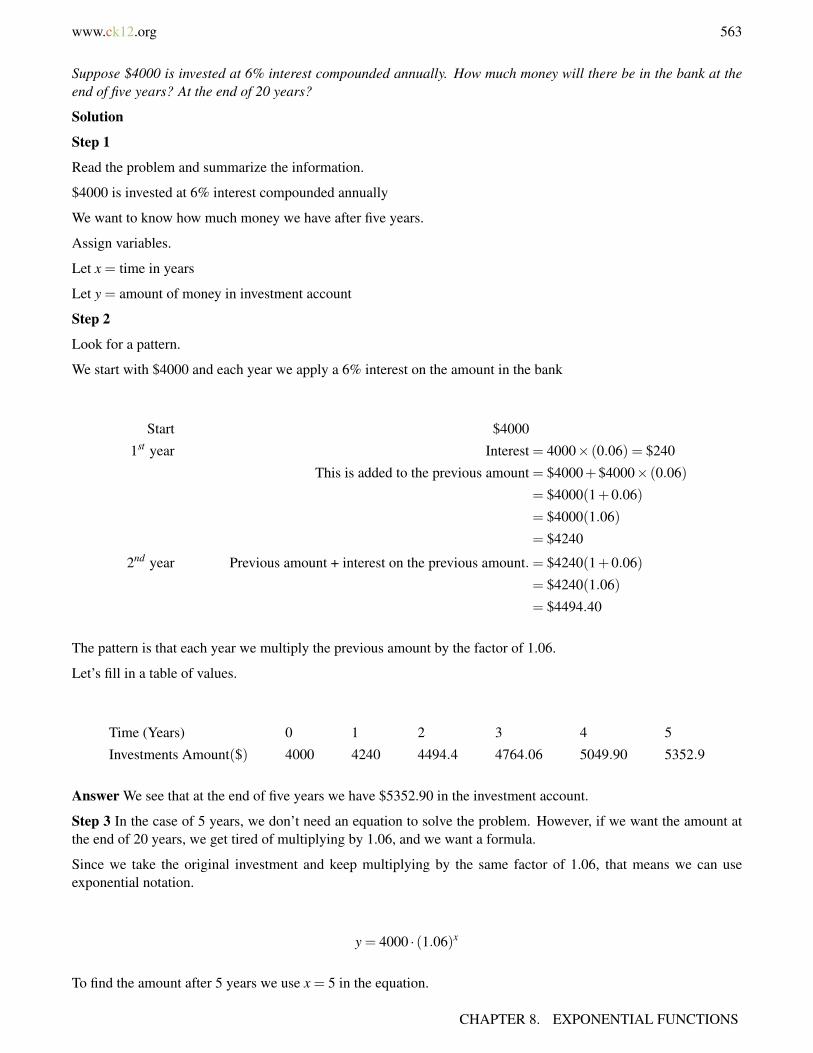
www.ck12.org 563
Suppose $4000 is invested at 6% interest compounded annually. How much money will there be in the bank at theend of five years? At the end of 20 years?
Solution
Step 1
Read the problem and summarize the information.
$4000 is invested at 6% interest compounded annually
We want to know how much money we have after five years.
Assign variables.
Let x = time in years
Let y = amount of money in investment account
Step 2
Look for a pattern.
We start with $4000 and each year we apply a 6% interest on the amount in the bank
Start $4000
1st year Interest = 4000× (0.06) = $240
This is added to the previous amount = $4000+$4000× (0.06)
= $4000(1+0.06)
= $4000(1.06)
= $4240
2nd year Previous amount + interest on the previous amount.= $4240(1+0.06)
= $4240(1.06)
= $4494.40
The pattern is that each year we multiply the previous amount by the factor of 1.06.
Let’s fill in a table of values.
Time (Years) 0 1 2 3 4 5
Investments Amount($) 4000 4240 4494.4 4764.06 5049.90 5352.9
Answer We see that at the end of five years we have $5352.90 in the investment account.
Step 3 In the case of 5 years, we don’t need an equation to solve the problem. However, if we want the amount atthe end of 20 years, we get tired of multiplying by 1.06, and we want a formula.
Since we take the original investment and keep multiplying by the same factor of 1.06, that means we can useexponential notation.
y = 4000 · (1.06)x
To find the amount after 5 years we use x = 5 in the equation.
CHAPTER 8. EXPONENTIAL FUNCTIONS

564 www.ck12.org
y = 4000 · (1.06)5 = $5352.90
To find the amount after 20 years we use x = 20 in the equation.
y = 4000 · (1.06)20 = $12828.54
Step 4 Looking back over the solution, we see that we obtained the answers to the questions we were asked and theanswers make sense.
To check our answers we can plug in some low values of x to see if they match the values in the table:
x = 0, y = 4000 · (1.06)0 = 4000
x = 1, y = 4000 · (1.06)1 = 4240
x = 2, y = 4000 · (1.06)2 = 4494.4
The answers make sense because after the first year the amount goes up by $240 (6% of $4000).
The amount of increase gets larger each year and that makes sense because the interest is 6% of an amount that islarger and larger every year.
Example 2 Population decrease
In 2002, the population of school children in a city was 90,000. This population decreases at a rate of 5% each year.What will be the population of school children in year 2010?
Solution
Step 1
Read the problem and summarize the information.
In 2002, population => 90,000 .
Rate of decrease = 5% each year.
What is the population in year 2010?
Assign variables.
Let x = time since 2002 (in years)
Let y = population of school children
Step 2
Look for a pattern.
Let’s start in 2002.
Population = 90,000
Rate of decrease is 5% each year, so we need to find the amount of increase by 90,000× 0.05 and subtract thisincrease from the original number 90,000−90,000×0.05 = 90,000(1−0.05) = 90,000×0.95 .
In 2003 Population = 90,000×0.95
In 2004 Population = 90,000×0.95×0.95
8.8. PROBLEM-SOLVING STRATEGIES

www.ck12.org 565
The pattern is that for each year we multiply by a factor of 0.95
Let’s fill in a table of values:
Year 2002 2003 2004 2005 2006 2007
Population 90,000 85,500 81,225 77,164 73,306 69,640
Step 3
Let’s find a formula for this relationship.
Since we take the original population and keep multiplying by the same factor of 0.95, this pattern fits to an expo-nential formula.
y = 90000 · (0.95)x
To find the population in year 2010, plug in x = 8 (number of years since 2002)
y = 90000 · (0.95)8 = 59,708 school children
Step 4
Looking back over the solution, we see that we answered the question we were asked and that it makes sense.
The answer makes sense because the numbers decrease each year as we expected. We can check that the formula iscorrect by plugging in the values of x from the table to see if the values match those given by the formula.
Year 2002,x = 0 Population = y = 90000 · (0.95)0 = 90,000
Year 2003,x = 1 Population = y = 90000 · (0.95)1 = 85,500
Year 2004,x = 2 Population = y = 90000 · (0.95)2 = 81,225
Example 3 Loudness of sound
Loudness is measured in decibels (dB). An increase in loudness of 10 decibels means the sound intensity increasesby a factor of 10. Sound that is barely audible has a decibel level of 0 dB and an intensity level of 10−12 W/m2 .Sound painful to the ear has a decibel level of 130 dB and an intensity level of 10 W/m2 .
(a) The decibel level of normal conversation is 60 dB. What is the intensity of the sound of normal conversation?
(b) The decibel level of a subway train entering a station is 100 dB. What is the intensity of the sound of the train?
Solution:
Step 1
Read the problem and summarize the information.
For 10 decibels, sound intensity increases by a factor of 10.
Barely audible sound = 0 dB = 10−12 W/m2
Ear-splitting sound = 130 dB = 10 W/m2
Find intensity at 60 dB and find intensity at 100 dB.
Assign variables.
Let x = sound level in decibels (dB)
CHAPTER 8. EXPONENTIAL FUNCTIONS
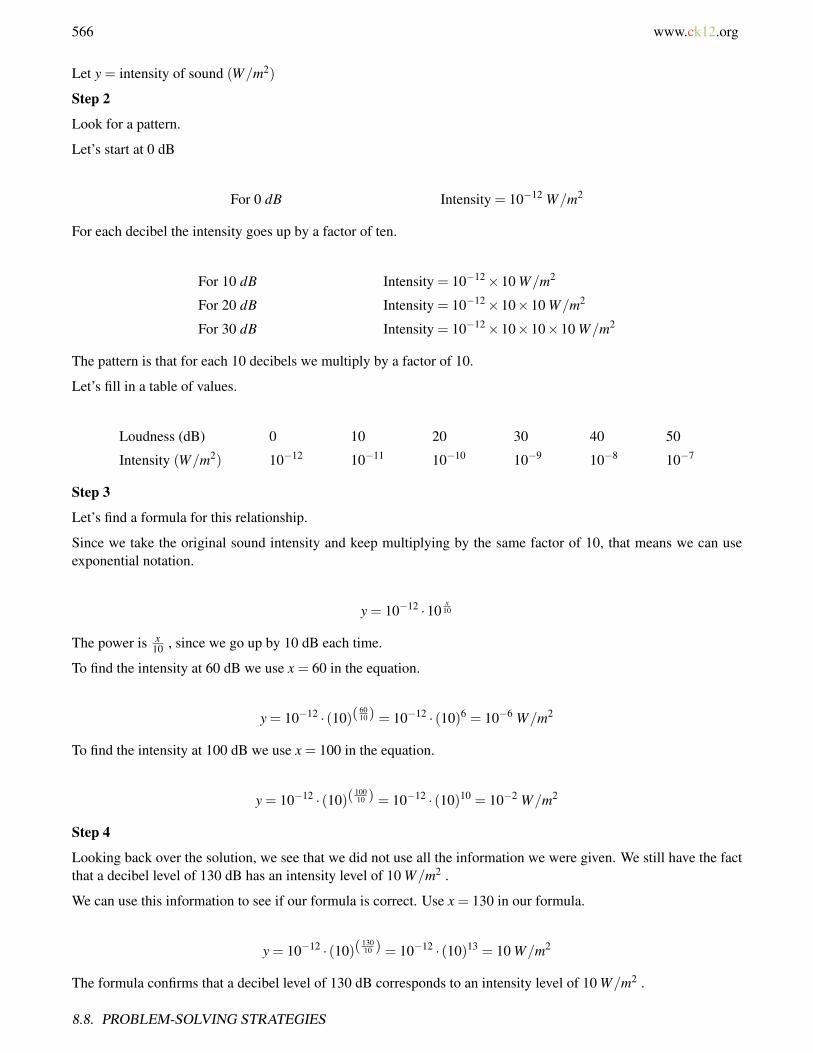
566 www.ck12.org
Let y = intensity of sound (W/m2)
Step 2
Look for a pattern.
Let’s start at 0 dB
For 0 dB Intensity = 10−12 W/m2
For each decibel the intensity goes up by a factor of ten.
For 10 dB Intensity = 10−12×10 W/m2
For 20 dB Intensity = 10−12×10×10 W/m2
For 30 dB Intensity = 10−12×10×10×10 W/m2
The pattern is that for each 10 decibels we multiply by a factor of 10.
Let’s fill in a table of values.
Loudness (dB) 0 10 20 30 40 50
Intensity (W/m2) 10−12 10−11 10−10 10−9 10−8 10−7
Step 3
Let’s find a formula for this relationship.
Since we take the original sound intensity and keep multiplying by the same factor of 10, that means we can useexponential notation.
y = 10−12 ·10x
10
The power is x10 , since we go up by 10 dB each time.
To find the intensity at 60 dB we use x = 60 in the equation.
y = 10−12 · (10)(6010) = 10−12 · (10)6 = 10−6 W/m2
To find the intensity at 100 dB we use x = 100 in the equation.
y = 10−12 · (10)(10010 ) = 10−12 · (10)10 = 10−2 W/m2
Step 4
Looking back over the solution, we see that we did not use all the information we were given. We still have the factthat a decibel level of 130 dB has an intensity level of 10 W/m2 .
We can use this information to see if our formula is correct. Use x = 130 in our formula.
y = 10−12 · (10)(13010 ) = 10−12 · (10)13 = 10 W/m2
The formula confirms that a decibel level of 130 dB corresponds to an intensity level of 10 W/m2 .
8.8. PROBLEM-SOLVING STRATEGIES
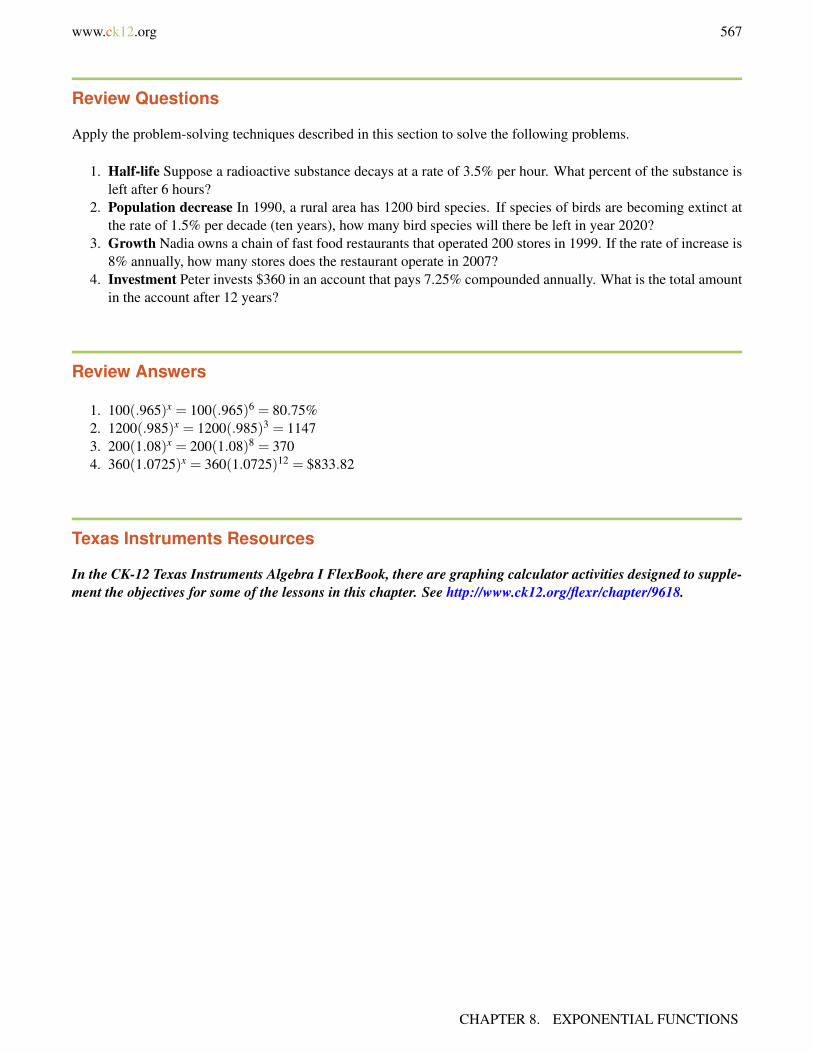
www.ck12.org 567
Review Questions
Apply the problem-solving techniques described in this section to solve the following problems.
1. Half-life Suppose a radioactive substance decays at a rate of 3.5% per hour. What percent of the substance isleft after 6 hours?
2. Population decrease In 1990, a rural area has 1200 bird species. If species of birds are becoming extinct atthe rate of 1.5% per decade (ten years), how many bird species will there be left in year 2020?
3. Growth Nadia owns a chain of fast food restaurants that operated 200 stores in 1999. If the rate of increase is8% annually, how many stores does the restaurant operate in 2007?
4. Investment Peter invests $360 in an account that pays 7.25% compounded annually. What is the total amountin the account after 12 years?
Review Answers
1. 100(.965)x = 100(.965)6 = 80.75%2. 1200(.985)x = 1200(.985)3 = 11473. 200(1.08)x = 200(1.08)8 = 3704. 360(1.0725)x = 360(1.0725)12 = $833.82
Texas Instruments Resources
In the CK-12 Texas Instruments Algebra I FlexBook, there are graphing calculator activities designed to supple-ment the objectives for some of the lessons in this chapter. See http://www.ck12.org/flexr/chapter/9618.
CHAPTER 8. EXPONENTIAL FUNCTIONS

568 www.ck12.org
CHAPTER 9 Factoring Polynomials; Moreon Probability
CHAPTER OUTLINE
9.1 ADDITION AND SUBTRACTION OF POLYNOMIALS
9.2 MULTIPLICATION OF POLYNOMIALS
9.3 SPECIAL PRODUCTS OF POLYNOMIALS
9.4 POLYNOMIAL EQUATIONS IN FACTORED FORM
9.5 FACTORING QUADRATIC EXPRESSIONS
9.6 FACTORING SPECIAL PRODUCTS
9.7 FACTORING POLYNOMIALS COMPLETELY

www.ck12.org 569
9.1 Addition and Subtraction of Polynomials
Learning Objectives
• Write a polynomial expression in standard form.• Classify polynomial expression by degree• Add and subtract polynomials• Problem solving using addition and subtraction of polynomials
Introduction
So far we have seen functions described by straight lines (linear functions) and functions where the variable appearedin the exponent (exponential functions). In this section we will introduce polynomial functions. A polynomial ismade up of different terms that contain positive integer powers of the variables. Here is an example of a polynomial.
4x3 +2x2−3x+1
Each part of the polynomial that is added or subtracted is called a term of the polynomial. The example above is apolynomial with four terms.
The numbers appearing in each term in front of the variable are called the coefficients. The number appearing all byitself without a variable is called a constant.
In this case, the coefficient of x3 is 4, the coefficient of x2 is 2, the coefficient of x is -3 and the constant is 1.
Degrees of Polynomials and Standard Form
Each term in the polynomial has a degree. This is the power of the variable in that term.
CHAPTER 9. FACTORING POLYNOMIALS; MORE ON PROBABILITY
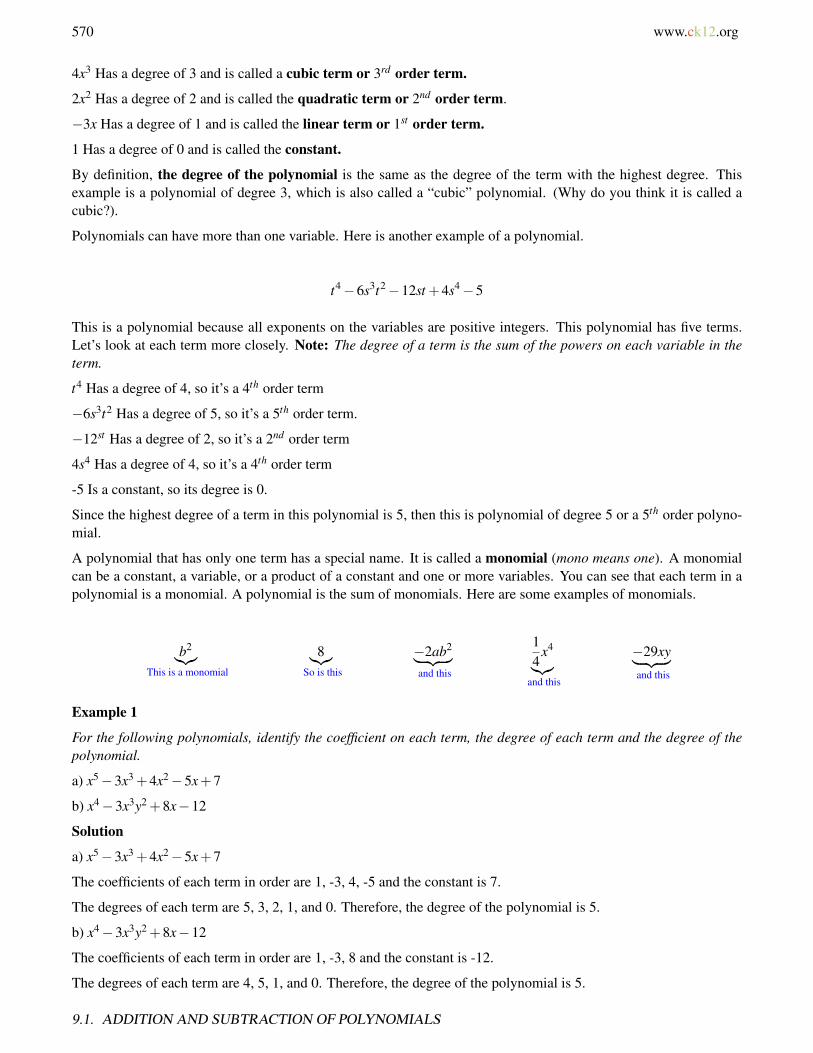
570 www.ck12.org
4x3 Has a degree of 3 and is called a cubic term or 3rd order term.
2x2 Has a degree of 2 and is called the quadratic term or 2nd order term.
−3x Has a degree of 1 and is called the linear term or 1st order term.
1 Has a degree of 0 and is called the constant.
By definition, the degree of the polynomial is the same as the degree of the term with the highest degree. Thisexample is a polynomial of degree 3, which is also called a “cubic” polynomial. (Why do you think it is called acubic?).
Polynomials can have more than one variable. Here is another example of a polynomial.
t4−6s3t2−12st +4s4−5
This is a polynomial because all exponents on the variables are positive integers. This polynomial has five terms.Let’s look at each term more closely. Note: The degree of a term is the sum of the powers on each variable in theterm.
t4 Has a degree of 4, so it’s a 4th order term
−6s3t2 Has a degree of 5, so it’s a 5th order term.
−12st Has a degree of 2, so it’s a 2nd order term
4s4 Has a degree of 4, so it’s a 4th order term
-5 Is a constant, so its degree is 0.
Since the highest degree of a term in this polynomial is 5, then this is polynomial of degree 5 or a 5th order polyno-mial.
A polynomial that has only one term has a special name. It is called a monomial (mono means one). A monomialcan be a constant, a variable, or a product of a constant and one or more variables. You can see that each term in apolynomial is a monomial. A polynomial is the sum of monomials. Here are some examples of monomials.
b2︸︷︷︸This is a monomial
8︸︷︷︸So is this
−2ab2︸ ︷︷ ︸and this
14
x4︸︷︷︸and this
−29xy︸ ︷︷ ︸and this
Example 1
For the following polynomials, identify the coefficient on each term, the degree of each term and the degree of thepolynomial.
a) x5−3x3 +4x2−5x+7
b) x4−3x3y2 +8x−12
Solution
a) x5−3x3 +4x2−5x+7
The coefficients of each term in order are 1, -3, 4, -5 and the constant is 7.
The degrees of each term are 5, 3, 2, 1, and 0. Therefore, the degree of the polynomial is 5.
b) x4−3x3y2 +8x−12
The coefficients of each term in order are 1, -3, 8 and the constant is -12.
The degrees of each term are 4, 5, 1, and 0. Therefore, the degree of the polynomial is 5.
9.1. ADDITION AND SUBTRACTION OF POLYNOMIALS

www.ck12.org 571
Example 2
Identify the following expressions as polynomials or non-polynomials.
a) 5x2−2x
b) 3x2−2x−2
c) x√
x−1
d) 5x3+1
e) 4x13
f) 4xy2−2x2y−3+ y3−3x3
Solution
(a) 5x2−2x This is a polynomial.
(b) 3x2−2x−2 This is not a polynomial because it has a negative exponent.
(c) x√
x−1 This is not a polynomial because is has a square root.
(d) 5x3+1 This is not a polynomial because the power of x appears in the denominator.
(e) 4x13 This is not a polynomial because it has a fractional exponent.
(f) 4xy2−2xy−3+ y3−3x3 This is a polynomial.
You saw that each term in a polynomial has a degree. The degree of the highest term is also the degree of thepolynomial. Often, we arrange the terms in a polynomial so that the term with the highest degree is first and it isfollowed by the other terms in order of decreasing power. This is called standard form.
The following polynomials are in standard form.
4x4−3x3 +2x2− x+1
a4b3−2a3b3 +3a4b−5ab2 +2
The first term of a polynomial in standard form is called the leading term and the coefficient of the leading term iscalled the leading coefficient.
The first polynomial above has a leading term of 4x4 and a leading coefficient of 4.
The second polynomial above has a leading term of a4b3 and a leading coefficient of 1.
Example 3
Rearrange the terms in the following polynomials so that they are in standard form. Indicate the leading term andleading coefficient of each polynomial.
(a) 7−3x3 +4x
(b) ab−a3 +2b
(c) −4b+4+b2
Solution
(a) 7−3x3 +4x is rearranged as −3x3 +4x+7 . The leading term is −3x3 and the leading coefficient is -3.
(b) ab−a3 +2b is rearranged as −a3 +ab+2b . The leading term is −a3 and the leading coefficient is -1.
(c) −4b+4+b2 is rearranged as b2−4b+4 . The leading term is b2 and the leading coefficient is 1.
CHAPTER 9. FACTORING POLYNOMIALS; MORE ON PROBABILITY

572 www.ck12.org
Simplifying Polynomials
A polynomial is simplified if it has no terms that are alike. Like terms are terms in the polynomial that have thesame variable(s) with the same exponents, but they can have different coefficients.
2x2y and 5x2y are like terms.
6x2y and 6xy2 are not like terms.
If we have a polynomial that has like terms, we simplify by combining them.
x2 +6xy−4xy+ y2
Like terms
This sample polynomial simplified by combining the like terms 6xy−4xy= 2xy . We write the simplified polynomialas
x2 +2xy+ y2
Example 4
Simplify the following polynomials by collecting like terms and combining them.
(a) 2x−4x2 +6+ x2−4+4x
(b) a3b3−5ab4 +2a3b−a3b3 +3ab4−a2b
Solution
(a) 2x−4x2 +6+ x2−4+4x
Rearrange the terms so that like terms are grouped together
= (−4x2 + x2)+(2x+4x)+(6−4)
Combine each set of like terms by adding or subtracting the coefficients
=−3x2 +6x+2
(b) a3b3−5ab4 +2a3b−a3b3 +3ab4−a2b
Rearrange the terms so that like terms are grouped together:
= (a3b3−a3b3)+(−5ab4 +3ab4)+2a3b−a2b
Combine each set of like terms:
= 0−2ab4 +2a3b−a2b=−2ab4 +2a3b−a2b
Add and Subtract Polynomials
Polynomial addition
To add two or more polynomials, write their sum and then simplify by combining like terms.
9.1. ADDITION AND SUBTRACTION OF POLYNOMIALS
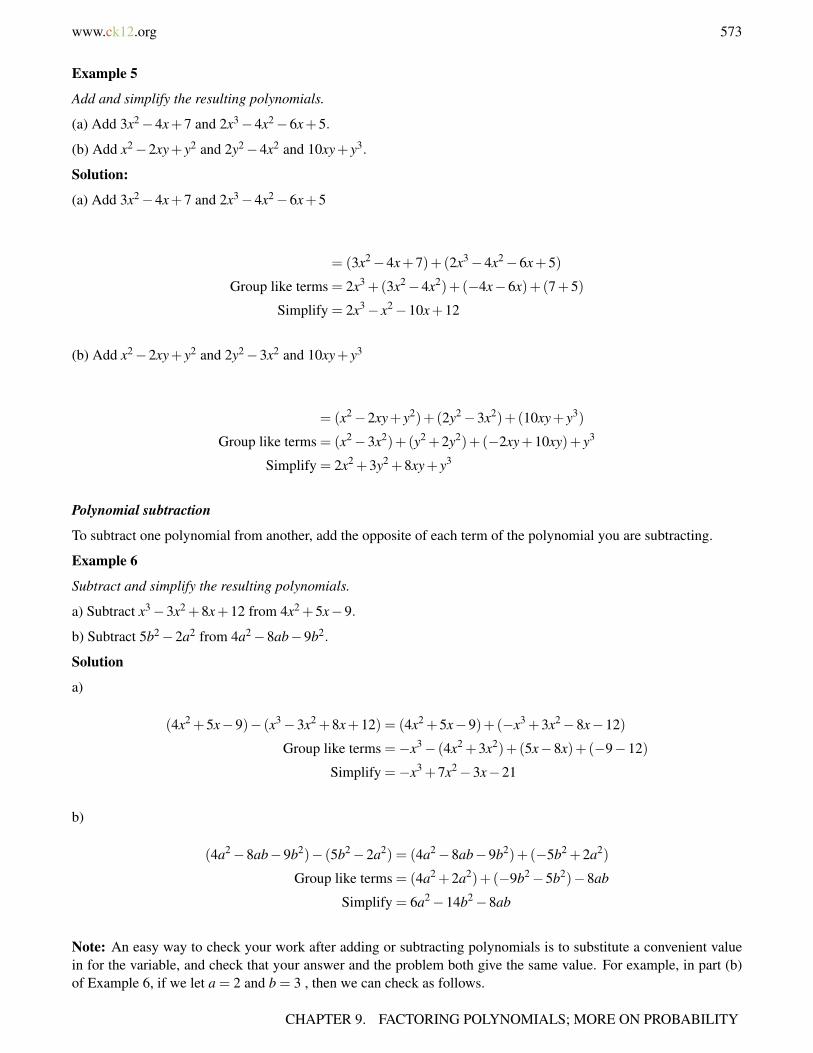
www.ck12.org 573
Example 5
Add and simplify the resulting polynomials.
(a) Add 3x2−4x+7 and 2x3−4x2−6x+5.
(b) Add x2−2xy+ y2 and 2y2−4x2 and 10xy+ y3.
Solution:
(a) Add 3x2−4x+7 and 2x3−4x2−6x+5
= (3x2−4x+7)+(2x3−4x2−6x+5)
Group like terms = 2x3 +(3x2−4x2)+(−4x−6x)+(7+5)
Simplify = 2x3− x2−10x+12
(b) Add x2−2xy+ y2 and 2y2−3x2 and 10xy+ y3
= (x2−2xy+ y2)+(2y2−3x2)+(10xy+ y3)
Group like terms = (x2−3x2)+(y2 +2y2)+(−2xy+10xy)+ y3
Simplify = 2x2 +3y2 +8xy+ y3
Polynomial subtraction
To subtract one polynomial from another, add the opposite of each term of the polynomial you are subtracting.
Example 6
Subtract and simplify the resulting polynomials.
a) Subtract x3−3x2 +8x+12 from 4x2 +5x−9.
b) Subtract 5b2−2a2 from 4a2−8ab−9b2.
Solution
a)
(4x2 +5x−9)− (x3−3x2 +8x+12) = (4x2 +5x−9)+(−x3 +3x2−8x−12)
Group like terms =−x3− (4x2 +3x2)+(5x−8x)+(−9−12)
Simplify =−x3 +7x2−3x−21
b)
(4a2−8ab−9b2)− (5b2−2a2) = (4a2−8ab−9b2)+(−5b2 +2a2)
Group like terms = (4a2 +2a2)+(−9b2−5b2)−8ab
Simplify = 6a2−14b2−8ab
Note: An easy way to check your work after adding or subtracting polynomials is to substitute a convenient valuein for the variable, and check that your answer and the problem both give the same value. For example, in part (b)of Example 6, if we let a = 2 and b = 3 , then we can check as follows.
CHAPTER 9. FACTORING POLYNOMIALS; MORE ON PROBABILITY

574 www.ck12.org
Given Solution
(4a2−8ab−9b2)− (5b2−2a2) 6a2−14b2−8ab
(4(2)2−8(2)(3)−9(3)2)− (5(3)2−2(2)2) 6(2)2−14(3)2−8(2)(3)
(4(4)−8(2)(3)−9(9))− (5(9)−2(4)) 6(4)−14(9)−8(2)(3)
(−113)−37 24−126−48
−150 −150
Since both expressions evaluate to the same number when we substitute in arbitrary values for the variables, we canbe reasonably sure that our answer is correct. Note, when you use this method, do not choose 0 or 1 for checkingsince these can lead to common problems.
Problem Solving Using Addition or Subtraction of Polynomials
An application of polynomials is their use in finding areas of a geometric object. In the following examples, we willsee how the addition or subtraction of polynomials might be useful in representing different areas.
Example 7
Write a polynomial that represents the area of each figure shown.
a)
b)
c)
9.1. ADDITION AND SUBTRACTION OF POLYNOMIALS

www.ck12.org 575
d)
Solutions
a) This shape is formed by two squares and two rectangles.
The blue square has area: y · y = y2
The yellow square has area: x · x = x2
The pink rectangles each have area: x · y = xy
To find the total area of the figure we add all the separate areas.
Total area = y2 + x2 + xy+ xy
= y2 + x2 +2xy
b) This shape is formed by two squares and one rectangle.
The yellow squares each have an area: a ·a = a2.
The orange rectangle has area: 2a ·b = 2ab.
To find the total area of the figure we add all the separate areas.
Total area = a2 +a2 +2ab
= 2a2 +2ab
CHAPTER 9. FACTORING POLYNOMIALS; MORE ON PROBABILITY

576 www.ck12.org
c) To find the area of the green region we find the area of the big square and subtract the area of the little square.
The big square has area y · y = y2.
The little square has area x · x = x2.
Area of the green region = y2− x2
d) To find the area of the figure we can find the area of the big rectangle and add the areas of the pink squares.
The pink squares each have area: a ·a = a2.
The blue rectangle has area: 3a ·a = 3a2.
To find the total area of the figure we add all the separate areas.
Total area = a2 +a2 +a2 +3a2 = 6a2
Another way to find this area is to find the area of the big square and subtract the areas of the three yellow squares.
The big square has area: 3a ·3a = 9a2.
The yellow squares each have areas: a ·a = a2.
To find the total area of the figure we subtract:
9.1. ADDITION AND SUBTRACTION OF POLYNOMIALS
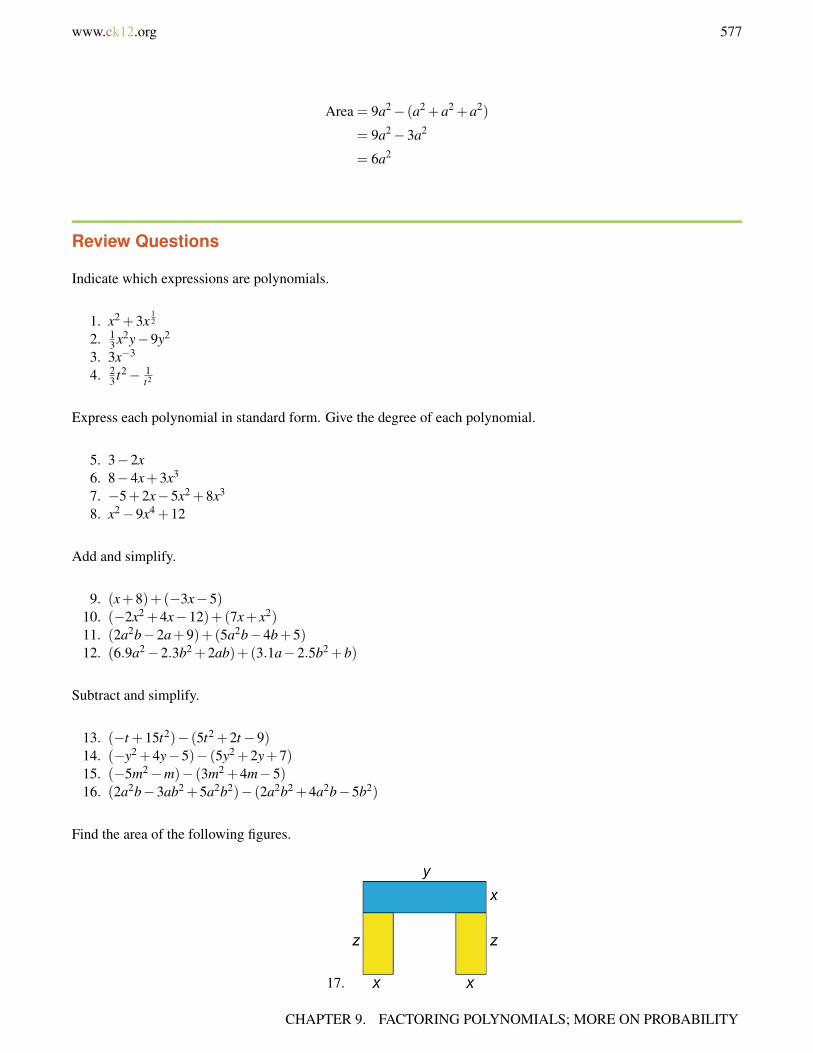
www.ck12.org 577
Area = 9a2− (a2 +a2 +a2)
= 9a2−3a2
= 6a2
Review Questions
Indicate which expressions are polynomials.
1. x2 +3x12
2. 13 x2y−9y2
3. 3x−3
4. 23 t2− 1
t2
Express each polynomial in standard form. Give the degree of each polynomial.
5. 3−2x6. 8−4x+3x3
7. −5+2x−5x2 +8x3
8. x2−9x4 +12
Add and simplify.
9. (x+8)+(−3x−5)10. (−2x2 +4x−12)+(7x+ x2)11. (2a2b−2a+9)+(5a2b−4b+5)12. (6.9a2−2.3b2 +2ab)+(3.1a−2.5b2 +b)
Subtract and simplify.
13. (−t +15t2)− (5t2 +2t−9)14. (−y2 +4y−5)− (5y2 +2y+7)15. (−5m2−m)− (3m2 +4m−5)16. (2a2b−3ab2 +5a2b2)− (2a2b2 +4a2b−5b2)
Find the area of the following figures.
17.
CHAPTER 9. FACTORING POLYNOMIALS; MORE ON PROBABILITY

578 www.ck12.org
18.
19.
20.
Review Answers
1. No2. yes3. no4. no5. −2x+3; Degree = 16. 3x3−4x+8; Degree = 37. 8x3−5x2 +2x−5; Degree = 38. −9x4 + x2 +12; Degree = 49. −2x+3
10. −x2 +11x−1211. 7a2b−2a−4b+1412. 6.9a2−4.8b2 +2ab+3.1a+b13. −3t +914. −6y2 +2y−1215. −8m2−5m+516. −2a2b−3ab2 +3a2b2 +5b2
17. Area = 2xz− xy18. Area = 4ab+ac19. 2xy−2x2
20. Area = 3ab
9.1. ADDITION AND SUBTRACTION OF POLYNOMIALS

www.ck12.org 579
9.2 Multiplication of Polynomials
Learning Objectives
• Multiply a polynomial by a monomial• Multiply a polynomial by a binomial• Solve problems using multiplication of polynomials
Introduction
When multiplying polynomials we must remember the exponent rules that we learned in the last chapter.
The Product Rule xn · xm = xn+m
This says that if we multiply expressions that have the same base, we just add the exponents and keep the baseunchanged.
If the expressions we are multiplying have coefficients and more than one variable, we multiply the coefficients justas we would any number and we apply the product rule on each variable separately.
(2x2y3) · (3x2y) = (2 ·3) · (x2+2) · (y3+1) = 6x4y4
Multiplying a Polynomial by a Monomial
We begin this section by multiplying a monomial by a monomial. As you saw above, we need to multiply thecoefficients separately and then apply the exponent rules to each variable separately. Let’s try some examples.
Example 1
Multiply the following monomials.
a) (2x2)(5x3)
b) (−3y4)(2y2)
c) (3xy5)(−6x4y2)
d) (−12a2b3c4)(−3a2b2)
Solution
a) (2x2)(5x3) = (2 ·5) · (x2 · x3) = 10x2+3 = 10x5
b) (−3y4)(2y2) = (−3 ·2) · (y4 · y2) =−6y4+2 =−6y6
c) (3xy5)(−6x4y2) = 18x1+4y5+2 =−18x5y7
d) (−12a2b3c4)(−3a2b2) = 36a2+2b3+2c4 = 36a4b5c4
CHAPTER 9. FACTORING POLYNOMIALS; MORE ON PROBABILITY
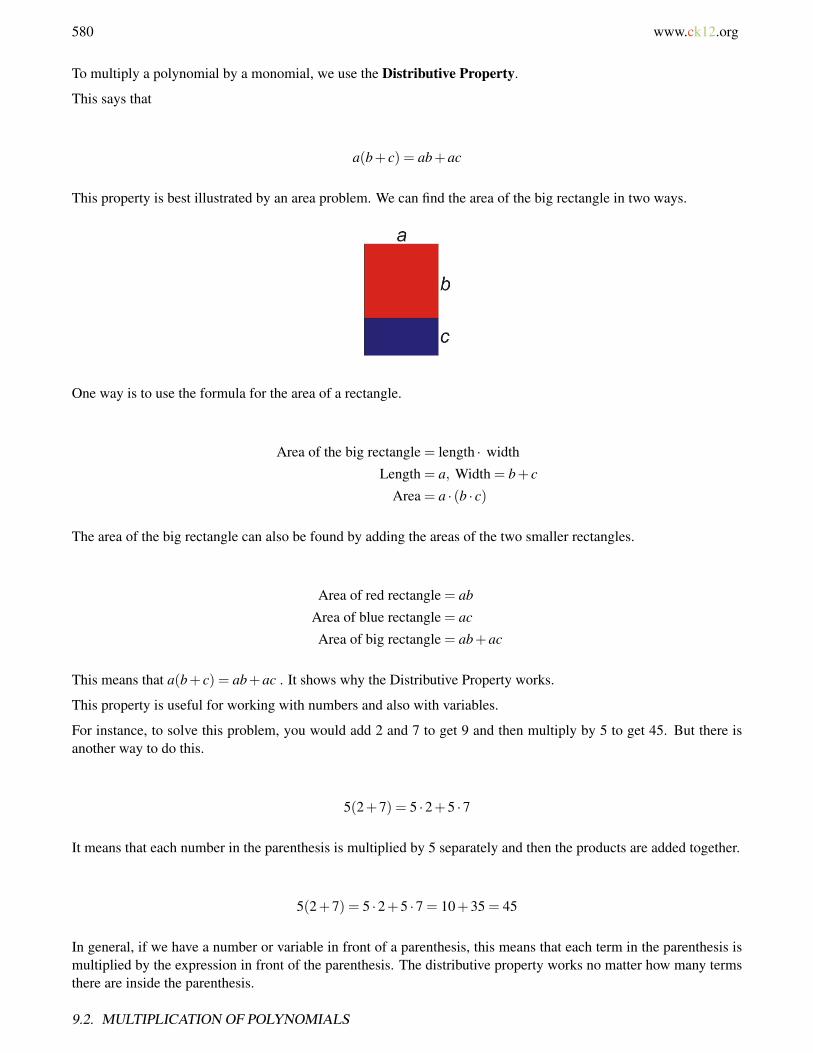
580 www.ck12.org
To multiply a polynomial by a monomial, we use the Distributive Property.
This says that
a(b+ c) = ab+ac
This property is best illustrated by an area problem. We can find the area of the big rectangle in two ways.
One way is to use the formula for the area of a rectangle.
Area of the big rectangle = length · width
Length = a, Width = b+ c
Area = a · (b · c)
The area of the big rectangle can also be found by adding the areas of the two smaller rectangles.
Area of red rectangle = ab
Area of blue rectangle = ac
Area of big rectangle = ab+ac
This means that a(b+ c) = ab+ac . It shows why the Distributive Property works.
This property is useful for working with numbers and also with variables.
For instance, to solve this problem, you would add 2 and 7 to get 9 and then multiply by 5 to get 45. But there isanother way to do this.
5(2+7) = 5 ·2+5 ·7
It means that each number in the parenthesis is multiplied by 5 separately and then the products are added together.
5(2+7) = 5 ·2+5 ·7 = 10+35 = 45
In general, if we have a number or variable in front of a parenthesis, this means that each term in the parenthesis ismultiplied by the expression in front of the parenthesis. The distributive property works no matter how many termsthere are inside the parenthesis.
9.2. MULTIPLICATION OF POLYNOMIALS

www.ck12.org 581
a(b+ c+d + e+ f + . . .) = a.b+a.c+a.d +a.e+a. f + . . .
The “...” means “and so on”.
Let’s now apply this property to multiplying polynomials by monomials.
Example 2
Multiply
a) 3(x2 +3x−5)
b) 4x(3x2−7)
c) −7y(4y2−2y+1)
Solution
a) 3(x2 +3x−5) = 3(x2)+3(3x)−3(5) = 3x2 +9x−15
b) 4x(3x2−7) = (4x)(3x2)+(4x)(−7) = 12x3−28x
c) −7y(4y2−2y+1) = (−7y)(4y2)+(−7y)(−2y)+(−7y)(1) =−28y3 +14y2−7y
Notice that the use of the Distributive Property simplifies the problems to just multiplying monomials by monomialsand adding all the separate parts together.
Example 3
Multiply
a) 2x3(−3x4 +2x3−10x2 +7x+9)
b) −7a2bc3(5a2−3b2−9c2)
Solution
a)
2x3(−3x4 +2x3−10x2 +7x+9) = (2x3)(−3x4)+(2x3)(2x3)+(2x3)(−10x2)+(2x3)(7x)+(2x3)(9)
=−6x7 +4x6−20x5 +14x4 +18x3
b)
−7a2bc3(5a2−3b2−9c2) = (−7a2bc3)(5a2)+(−7a2bc3)(−3b2)+(−7a2bc3)(−9c2)
=−35a4bc3 +21a2b3c3 +63a2bc5
Multiply a Polynomial by a Binomial
Let’s start by multiplying two binomials together. A binomial is a polynomial with two terms, so a product of twobinomials will take the form.
(a+b)(c+d)
The Distributive Property also applies in this situation. Let’s think of the first parenthesis as one term. The Distribu-tive Property says that the term in front of the parenthesis multiplies with each term inside the parenthesis separately.Then, we add the results of the products.
CHAPTER 9. FACTORING POLYNOMIALS; MORE ON PROBABILITY

582 www.ck12.org
(a+b)(c+d) = (a+b) · c+(a+b) ·d
Let’s rewrite this answer as c · (a+b)+d · (a+b)
We see that we can apply the distributive property on each of the parenthesis in turn.
c · (a+b)+d · (a+b) = c ·a+ c ·b+d ·a+d ·b (or ca+ cb+da+db)
What you should notice is that when multiplying any two polynomials, every term in one polynomial is multipliedby every term in the other polynomial.
Let’s look at some examples of multiplying polynomials.
Example 4
Multiply and simplify (2x+1)(x+3)
Solution
We must multiply each term in the first polynomial with each term in the second polynomial.
Let’s try to be systematic to make sure that we get all the products.
First, multiply the first term in the first parenthesis by all the terms in the second parenthesis.
We are now done with the first term.
Now we multiply the second term in the first parenthesis by all terms in the second parenthesis and add them to theprevious terms.
We are done with the multiplication and we can simplify.
(2x)(x)+(2x)(3)+(1)(x)+(1)(3) = 2x2 +6x+ x+3
= 2x2 +7x+3
This way of multiplying polynomials is called in-line multiplication or horizontal multiplication.
Another method for multiplying polynomials is to use vertical multiplication similar to the vertical multiplicationyou learned with regular numbers. Let’s demonstrate this method with the same example.
2x + 1
x + 3
6x + 3 ← Multiply each term on top by 3
Multiply each term on top by x→2x2 + x
2x2 + 7x + 3← Arrange like terms on top of each other
and add vertically
9.2. MULTIPLICATION OF POLYNOMIALS
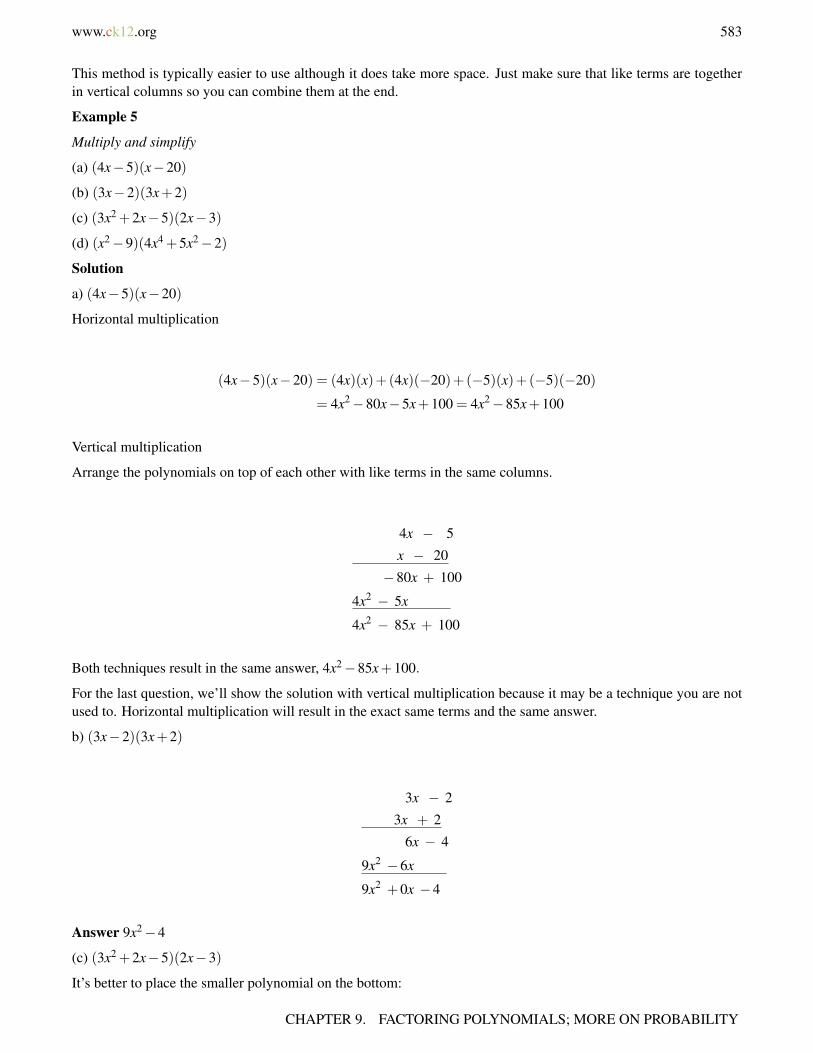
www.ck12.org 583
This method is typically easier to use although it does take more space. Just make sure that like terms are togetherin vertical columns so you can combine them at the end.
Example 5
Multiply and simplify
(a) (4x−5)(x−20)
(b) (3x−2)(3x+2)
(c) (3x2 +2x−5)(2x−3)
(d) (x2−9)(4x4 +5x2−2)
Solution
a) (4x−5)(x−20)
Horizontal multiplication
(4x−5)(x−20) = (4x)(x)+(4x)(−20)+(−5)(x)+(−5)(−20)
= 4x2−80x−5x+100 = 4x2−85x+100
Vertical multiplication
Arrange the polynomials on top of each other with like terms in the same columns.
4x − 5
x − 20
−80x + 100
4x2 − 5x
4x2 − 85x + 100
Both techniques result in the same answer, 4x2−85x+100.
For the last question, we’ll show the solution with vertical multiplication because it may be a technique you are notused to. Horizontal multiplication will result in the exact same terms and the same answer.
b) (3x−2)(3x+2)
3x − 2
3x + 2
6x − 4
9x2 −6x
9x2 +0x −4
Answer 9x2−4
(c) (3x2 +2x−5)(2x−3)
It’s better to place the smaller polynomial on the bottom:
CHAPTER 9. FACTORING POLYNOMIALS; MORE ON PROBABILITY
584 www.ck12.org
3x2 +2x−5
2x−3
−9x2−6x+15
6x3 +4x2−10x
6x3−5x2−16x+15
Answer 6x3−5x2−16x+15
(d) (x2−9)(4x4 +5x2−2)
Set up the multiplication vertically and leave gaps for missing powers of x :
4x4 + 5x2 − 2
x2 − 9
−36x4− 45x2 +18
4x6 + 5x4 − 2x2
4x6−31x4−47x2 +18
Answer 4x6−31x4−47x2 +18
Multimedia Link The following video shows how multiplying two binomials together is related to the distributiveproperty. http://www.youtube.com/watch?v=Sc0e6xrRJYY (7:59)
MEDIAClick image to the left for more content.
.
Solve Real-World Problems Using Multiplication of Polynomials
In this section, we will see how multiplication of polynomials is applied to finding the areas and volumes of geomet-ric shapes.
Example 6
Find the areas of the following figures
a)
9.2. MULTIPLICATION OF POLYNOMIALS

www.ck12.org 585
b)
Find the volumes of the following figures
c)
d)
Solution
CHAPTER 9. FACTORING POLYNOMIALS; MORE ON PROBABILITY
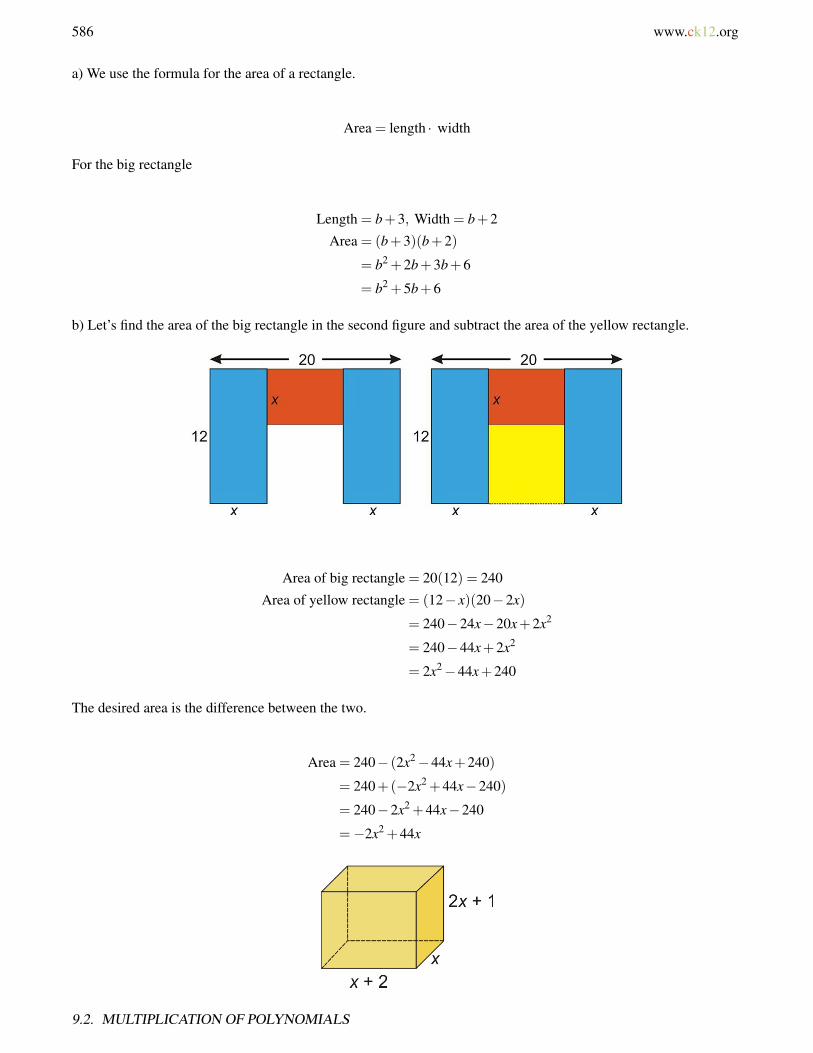
586 www.ck12.org
a) We use the formula for the area of a rectangle.
Area = length · width
For the big rectangle
Length = b+3, Width = b+2
Area = (b+3)(b+2)
= b2 +2b+3b+6
= b2 +5b+6
b) Let’s find the area of the big rectangle in the second figure and subtract the area of the yellow rectangle.
Area of big rectangle = 20(12) = 240
Area of yellow rectangle = (12− x)(20−2x)
= 240−24x−20x+2x2
= 240−44x+2x2
= 2x2−44x+240
The desired area is the difference between the two.
Area = 240− (2x2−44x+240)
= 240+(−2x2 +44x−240)
= 240−2x2 +44x−240
=−2x2 +44x
9.2. MULTIPLICATION OF POLYNOMIALS
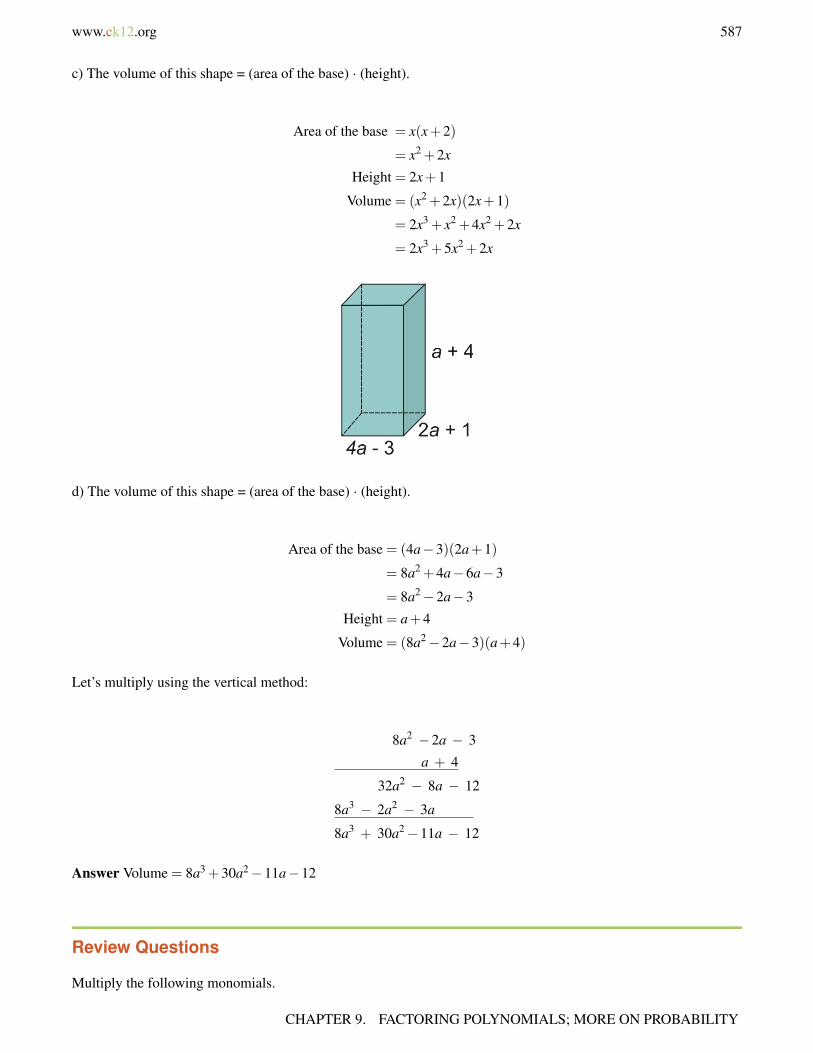
www.ck12.org 587
c) The volume of this shape = (area of the base) · (height).
Area of the base = x(x+2)
= x2 +2x
Height = 2x+1
Volume = (x2 +2x)(2x+1)
= 2x3 + x2 +4x2 +2x
= 2x3 +5x2 +2x
d) The volume of this shape = (area of the base) · (height).
Area of the base = (4a−3)(2a+1)
= 8a2 +4a−6a−3
= 8a2−2a−3
Height = a+4
Volume = (8a2−2a−3)(a+4)
Let’s multiply using the vertical method:
8a2 −2a − 3
a + 4
32a2 − 8a − 12
8a3 − 2a2 − 3a
8a3 + 30a2−11a − 12
Answer Volume = 8a3 +30a2−11a−12
Review Questions
Multiply the following monomials.
CHAPTER 9. FACTORING POLYNOMIALS; MORE ON PROBABILITY
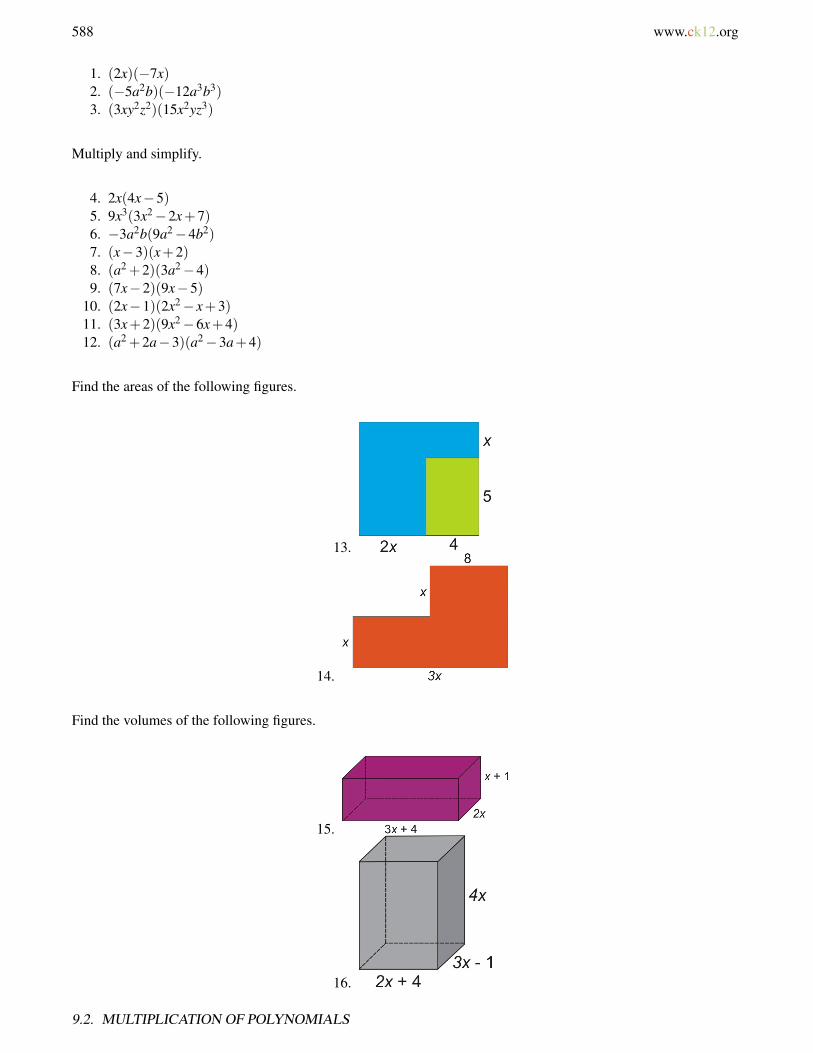
588 www.ck12.org
1. (2x)(−7x)2. (−5a2b)(−12a3b3)3. (3xy2z2)(15x2yz3)
Multiply and simplify.
4. 2x(4x−5)5. 9x3(3x2−2x+7)6. −3a2b(9a2−4b2)7. (x−3)(x+2)8. (a2 +2)(3a2−4)9. (7x−2)(9x−5)
10. (2x−1)(2x2− x+3)11. (3x+2)(9x2−6x+4)12. (a2 +2a−3)(a2−3a+4)
Find the areas of the following figures.
13.
14.
Find the volumes of the following figures.
15.
16.
9.2. MULTIPLICATION OF POLYNOMIALS
www.ck12.org 589
Review Answers
1. −14x2
2. 60a5b4
3. 45x3y3z5
4. 8x2−10x5. 27x5−18x4 +63x3
6. −27a4b+12a2b3
7. x2− x−68. 3a4 +2a2−89. 63x2−53x+10
10. 4x3−4x2 +7x−311. 27x3 +812. a4−a3−5a2 +17a−1213. (2x+4)(x+6) = 2x2 +16x+2414. x(3x+8) = 3x2 +8x15. 6x3 +14x2 +8x16. 24x3−28x2−12x
CHAPTER 9. FACTORING POLYNOMIALS; MORE ON PROBABILITY

590 www.ck12.org
9.3 Special Products of Polynomials
Learning Objectives
• Find the square of a binomial• Find the product of binomials using sum and difference formula• Solve problems using special products of polynomials
Introduction
We saw that when we multiply two binomials we need to make sure that each term in the first binomial multiplieswith each term in the second binomial. Let’s look at another example.
Multiply two linear (i.e. with degree = 1 ) binomials:
(2x+3)(x+4)
When we multiply, we obtain a quadratic (i.e. with degree = 2 ) polynomial with four terms.
2x2 +8x+3x+12
The middle terms are like terms and we can combine them. We simplify and get:
2x2 +11x+12
This is a quadratic or 2nd degree trinomial (polynomial with three terms).
You can see that every time we multiply two linear binomials with one variable, we will obtain a quadratic polyno-mial. In this section we will talk about some special products of binomials.
Find the Square of a Binomial
A special binomial product is the square of a binomial. Consider the following multiplication.
(x+4)(x+4)
9.3. SPECIAL PRODUCTS OF POLYNOMIALS
www.ck12.org 591
Since we are multiplying the same expression by itself that means that we are squaring the expression. This meansthat:
(x+4)(x+4) = (x+4)2
Letâ[U+0080][U+0099]s multiply: (x+4)(x+4) = x2 +4x+4x+16
And combine like terms: = x2 +8x+16
Notice that the middle terms are the same. Is this a coincidence? In order to find that out, let’s square a generallinear binomial.
(a+b)2 = (a+b)(a+b) = a2 +ab+ab+b2
= a2 +2ab+b2
It looks like the middle terms are the same again. So far we have squared the sum of binomials. Let’s now square adifference of binomials.
(a−b)2 = (a−b)(a−b) = a2−ab−ab+b2
= a2−2ab+b2
We notice a pattern when squaring binomials. To square a binomial, add the square of the first term, add or subtracttwice the product of the terms, and the square of the second term. You should remember these formulas:
Square of a Binomial
(a+b)2 = a2 +2ab+b2 and (a−b)2 = a2−2ab−b2
Remember! A polynomial that is raised to an exponent means that we multiply the polynomial by itself howevermany times the exponent indicates. For instance
(a+b)2 = (a+b)(a+b)
Don’t make the common mistake (a+b)2 = a2 +b2 . To see why (a+b)2 6= a2 +b2 try substituting numbers for aand b into the equation (for example, a = 4 and b = 3 ), and you will see that it is not a true statement. The middleterm, 2ab , is needed to make the equation work.
We can apply the formulas for squaring binomials to any number of problems.
Example 1
Square each binomial and simplify.
(a) (x+10)2
(b) (2x−3)2
(c) (x2 +4)2
(d) (5x−2y)2
Solution
Let’s use the square of a binomial formula to multiply each expression.
CHAPTER 9. FACTORING POLYNOMIALS; MORE ON PROBABILITY
592 www.ck12.org
a) (x+10)2
If we let a = x and b = 10 , then
(a2 + b) = a2 + 2a b + b2
↓ ↓ ↓ ↓ ↓ ↓(x + 10)2 = (x)2 +2(x)(10)+(10)2
= x2 +20x+100
b) (2x−3)2
If we let a = 2x and b = 3 , then
(a−b)2 = a2−2ab+b2
(2x−3)2 = (2x)2−2(2x)(3)+(3)2
= 4x2−12x+9
c) (x+4)2
If we let a = x2 and b = 4 , then
(x2 +4)2 = (x2)2 +2(x2)(4)+(4)2
= x4 +8x2 +16
d) (5x−2y)2
If we let a = 5x and b = 2y , then
(5x−2y)2 = (5x)2−2(5x)(2y)+(2y)2
= 25x2−20xy+4y2
Find the Product of Binomials Using Sum and Difference Patterns
Another special binomial product is the product of a sum and a difference of terms. For example, let’s multiply thefollowing binomials.
(x+4)(x−4) = x2−4x+4x−16
= x2−16
Notice that the middle terms are opposites of each other, so they cancel out when we collect like terms. This is nota coincidence. This always happens when we multiply a sum and difference of the same terms.
9.3. SPECIAL PRODUCTS OF POLYNOMIALS
www.ck12.org 593
(a+b)(a−b) = a2−ab−b2
= a2−b2
When multiplying a sum and difference of the same two terms, the middle terms cancel out. We get the square ofthe first term minus the square of the second term. You should remember this formula.
Sum and Difference Formula
(a+b)(a−b) = a2−b2
Let’s apply this formula to a few examples.
Example 2
Multiply the following binomials and simplify.
(a) (x+3)(x−3)
(b) (5x+9)(5x−9)
(c) (2x3 +7)(2x3−7)
(d) (4x+5y)(4x−5y)
Solution
(a) Let a = x and b = 3 , then
(a+b)(a−b) = a2 − b2
↓ ↓ ↓ ↓ ↓ ↓(x+3)(x−3) = (x)2− (3)2
= x2−9
(b) Let a = 5x and b = 9 , then
(a + b)(a − b) = a2 − b2
↓ ↓ ↓ ↓ ↓ ↓(5x+9)(5x−9) = (5x)2− (9)2
= 25x2−81
(c) Let a = 2x3 and b = 7 , then
(2x3 +7)(2x3−7) = (2x3)2− (7)2
= 4x6−49
(d) Let a = 4x and b = 5y , then
(4x+5y)(4x−5y) = (4x)2− (5y)2
= 16x2−25y2
CHAPTER 9. FACTORING POLYNOMIALS; MORE ON PROBABILITY
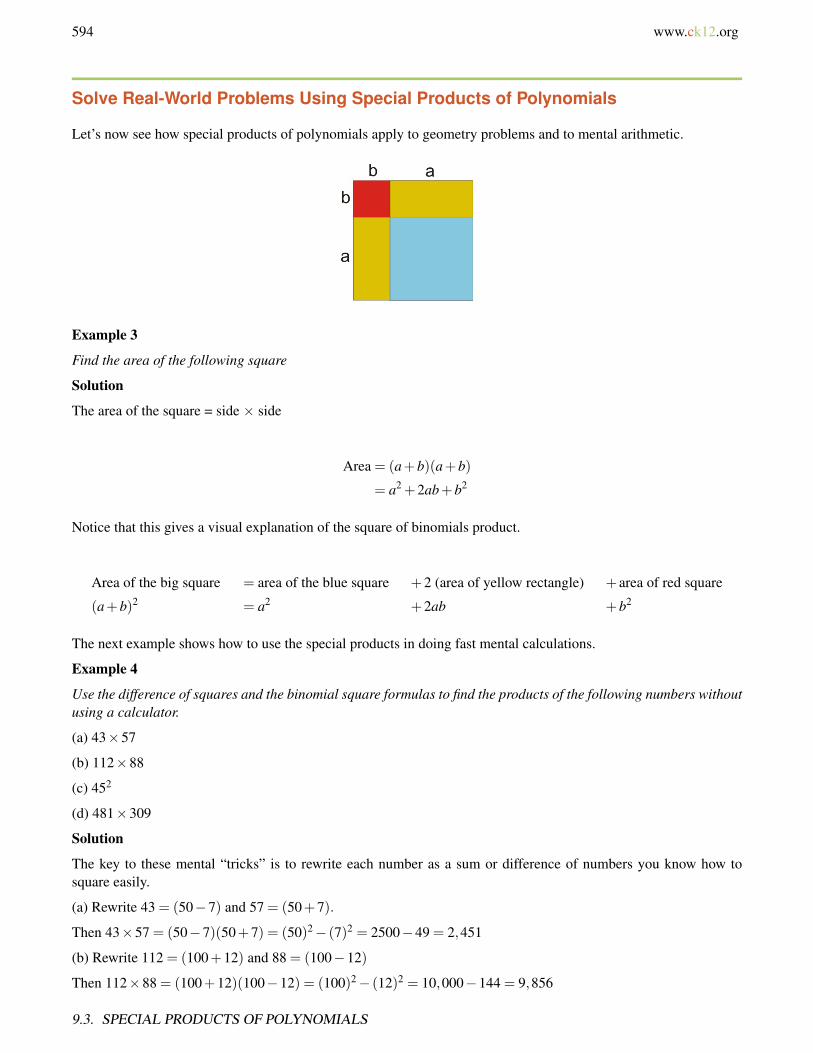
594 www.ck12.org
Solve Real-World Problems Using Special Products of Polynomials
Let’s now see how special products of polynomials apply to geometry problems and to mental arithmetic.
Example 3
Find the area of the following square
Solution
The area of the square = side × side
Area = (a+b)(a+b)
= a2 +2ab+b2
Notice that this gives a visual explanation of the square of binomials product.
Area of the big square = area of the blue square +2 (area of yellow rectangle) + area of red square
(a+b)2 = a2 +2ab +b2
The next example shows how to use the special products in doing fast mental calculations.
Example 4
Use the difference of squares and the binomial square formulas to find the products of the following numbers withoutusing a calculator.
(a) 43×57
(b) 112×88
(c) 452
(d) 481×309
Solution
The key to these mental “tricks” is to rewrite each number as a sum or difference of numbers you know how tosquare easily.
(a) Rewrite 43 = (50−7) and 57 = (50+7).
Then 43×57 = (50−7)(50+7) = (50)2− (7)2 = 2500−49 = 2,451
(b) Rewrite 112 = (100+12) and 88 = (100−12)
Then 112×88 = (100+12)(100−12) = (100)2− (12)2 = 10,000−144 = 9,856
9.3. SPECIAL PRODUCTS OF POLYNOMIALS
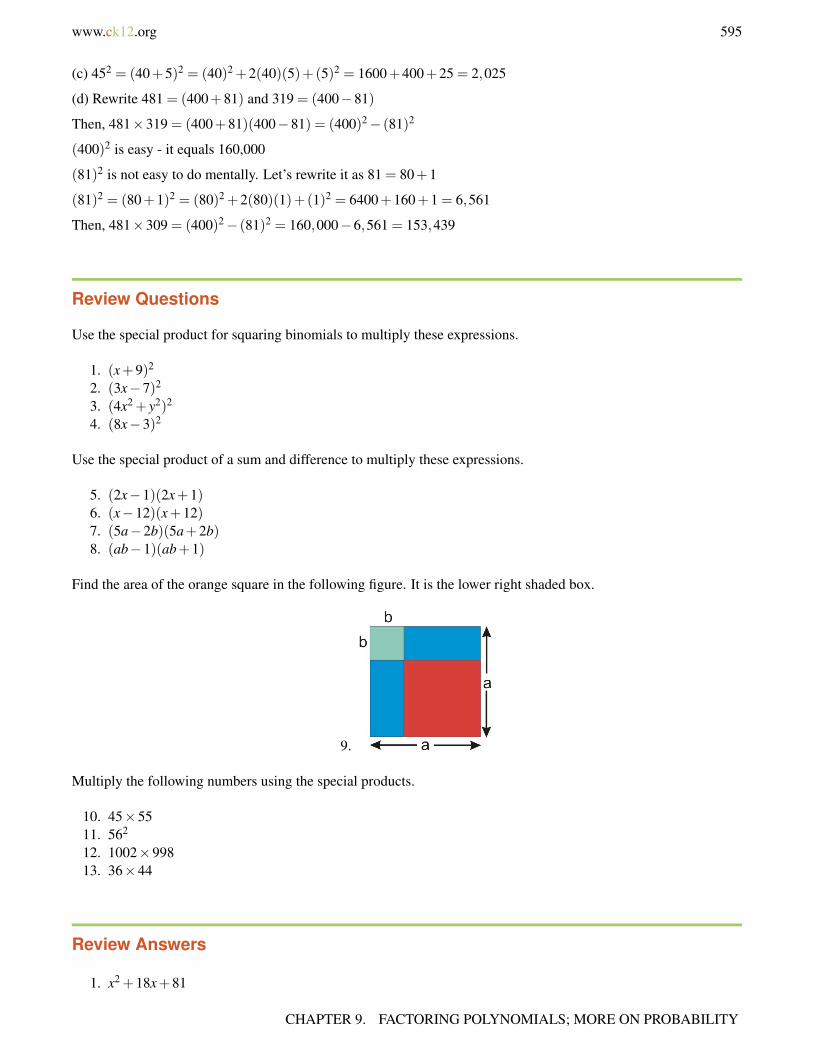
www.ck12.org 595
(c) 452 = (40+5)2 = (40)2 +2(40)(5)+(5)2 = 1600+400+25 = 2,025
(d) Rewrite 481 = (400+81) and 319 = (400−81)
Then, 481×319 = (400+81)(400−81) = (400)2− (81)2
(400)2 is easy - it equals 160,000
(81)2 is not easy to do mentally. Let’s rewrite it as 81 = 80+1
(81)2 = (80+1)2 = (80)2 +2(80)(1)+(1)2 = 6400+160+1 = 6,561
Then, 481×309 = (400)2− (81)2 = 160,000−6,561 = 153,439
Review Questions
Use the special product for squaring binomials to multiply these expressions.
1. (x+9)2
2. (3x−7)2
3. (4x2 + y2)2
4. (8x−3)2
Use the special product of a sum and difference to multiply these expressions.
5. (2x−1)(2x+1)6. (x−12)(x+12)7. (5a−2b)(5a+2b)8. (ab−1)(ab+1)
Find the area of the orange square in the following figure. It is the lower right shaded box.
9.
Multiply the following numbers using the special products.
10. 45×5511. 562
12. 1002×99813. 36×44
Review Answers
1. x2 +18x+81
CHAPTER 9. FACTORING POLYNOMIALS; MORE ON PROBABILITY

596 www.ck12.org
2. 9x2−42x+493. 16x4 +8x2y2 + y4
4. 64x2−48x+95. 4x2−16. x2−1447. 25a2−4b2
8. a2b2−19. Area = (a−b)2 = a2−2ab+b2
10. (50−5)(50+5) = 247511. (50+6)2 = 313612. (1000+2)(1000−2) = 999,99613. (40−4)(40+4) = 1584
9.3. SPECIAL PRODUCTS OF POLYNOMIALS
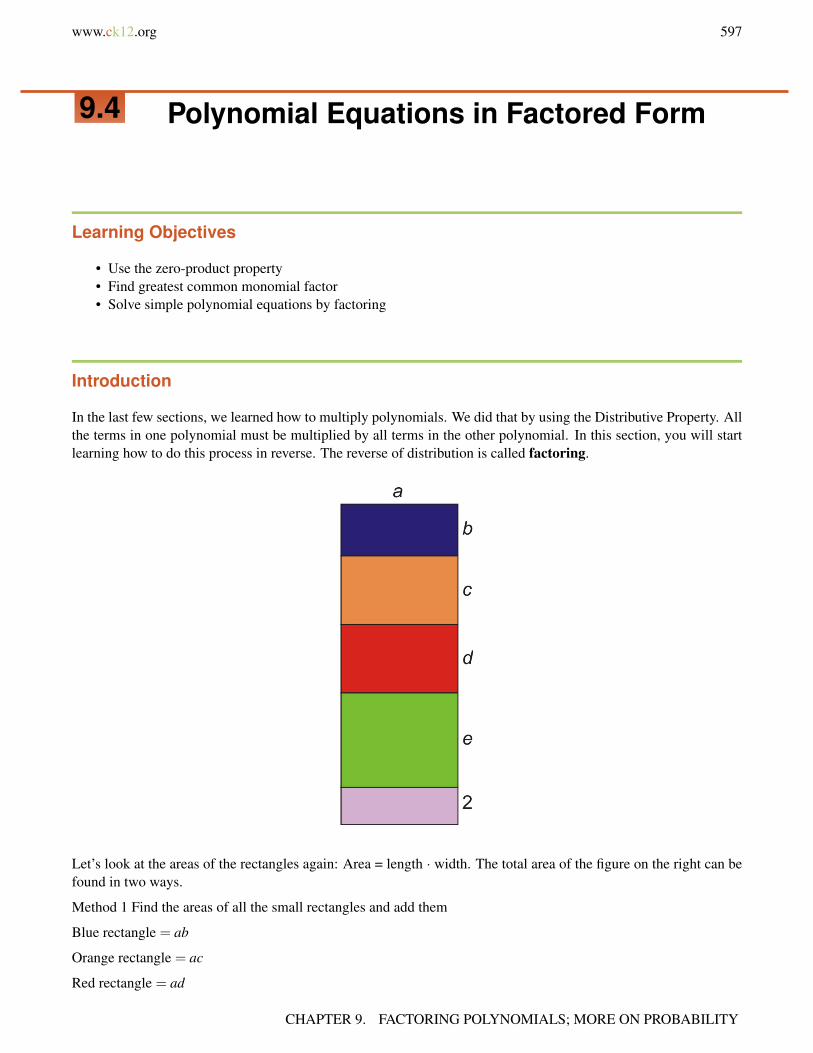
www.ck12.org 597
9.4 Polynomial Equations in Factored Form
Learning Objectives
• Use the zero-product property• Find greatest common monomial factor• Solve simple polynomial equations by factoring
Introduction
In the last few sections, we learned how to multiply polynomials. We did that by using the Distributive Property. Allthe terms in one polynomial must be multiplied by all terms in the other polynomial. In this section, you will startlearning how to do this process in reverse. The reverse of distribution is called factoring.
Let’s look at the areas of the rectangles again: Area = length · width. The total area of the figure on the right can befound in two ways.
Method 1 Find the areas of all the small rectangles and add them
Blue rectangle = ab
Orange rectangle = ac
Red rectangle = ad
CHAPTER 9. FACTORING POLYNOMIALS; MORE ON PROBABILITY
598 www.ck12.org
Green rectangle = ae
Pink rectangle = 2a
Total area = ab+ac+ad +ae+2a
Method 2 Find the area of the big rectangle all at once
Length = a
Width = b+ c+d + e+2
Area = a(b+ c+d + e = 2)
Since the area of the rectangle is the same no matter what method you use then the answers are the same:
ab+ac+ad +ae+2a = a(b+ c+d + e+2)
Factoring means that you take the factors that are common to all the terms in a polynomial. Then, multiply them bya parenthesis containing all the terms that are left over when you divide out the common factors.
Use the Zero-Product Property
Polynomials can be written in expanded form or in factored form. Expanded form means that you have sums anddifferences of different terms:
6x4 +7x3−26x2 +17x+30
Notice that the degree of the polynomials is four. It is written in standard form because the terms are written in orderof decreasing power.
Factored form means that the polynomial is written as a product of different factors. The factors are also polynomials,usually of lower degree. Here is the same polynomial in factored form.
x−1︸ ︷︷ ︸1st f actor
x+2︸ ︷︷ ︸2nd f actor
2x−3︸ ︷︷ ︸3rd f actor
3x+5︸ ︷︷ ︸4th f actor
Notice that each factor in this polynomial is a binomial. Writing polynomials in factored form is very useful becauseit helps us solve polynomial equations. Before we talk about how we can solve polynomial equations of degree 2 orhigher, let’s review how to solve a linear equation (degree 1).
Example 1
Solve the following equations
a) x−4 = 0
b) 3x−5 = 0
Solution
Remember that to solve an equation you are trying to find the value of x :
9.4. POLYNOMIAL EQUATIONS IN FACTORED FORM
www.ck12.org 599
a)
x −4 = 0
+4 =+4
x = 4
b)
3x −5 = 0
+5 =+5
3x = 53x3
=53
x =53
Now we are ready to think about solving equations like 2x2 + 5x = 42 . Notice we can’t isolate x in any way thatyou have already learned. But, we can subtract 42 on both sides to get 2x2 +5x−42 = 0 . Now, the left hand side ofthis equation can be factored!
Factoring a polynomial allows us to break up the problem into easier chunks. For example, 2x2 + 5x− 42 = (x+6)(2x−7) . So now we want to solve: (x+6)(2x−7) = 0
How would we solve this? If we multiply two numbers together and their product is zero, what can we say aboutthese numbers? The only way a product is zero is if one or both of the terms are zero. This property is called theZero-product Property.
How does that help us solve the polynomial equation? Since the product equals 0, then either of the terms or factorsin the product must equal zero. We set each factor equal to zero and we solve.
(x+6) = 0 OR (2x−7) = 0
We can now solve each part individually and we obtain:
x+6 = 0 or 2x−7 = 0
2x = 7
x =−6 or x =−72
Notice that the solution is x =−6 OR x = 72 . The OR says that either of these values of x would make the product
of the two factors equal to zero. Let’s plug the solutions back into the equation and check that this is correct.
Check x =−6;
(x+6)(2x−7) =
(−6+6)(2(6)−7) =
(0)(5) = 0
CHAPTER 9. FACTORING POLYNOMIALS; MORE ON PROBABILITY

600 www.ck12.org
Check x =72
(x+6)(2x−7) =(72+6)(
2 · 72−7)=(
192
)(7−7) =(
192
)(0) = 0
Both solutions check out. You should notice that the product equals to zero because each solution makes one of thefactors simplify to zero. Factoring a polynomial is very useful because the Zero-product Property allows us to breakup the problem into simpler separate steps.
If we are not able to factor a polynomial the problem becomes harder and we must use other methods that you willlearn later.
As a last note in this section, keep in mind that the Zero-product Property only works when a product equals to zero.For example, if you multiplied two numbers and the answer was nine you could not say that each of the numberswas nine. In order to use the property, you must have the factored polynomial equal to zero.
Example 2
Solve each of the polynomials
a) (x−9)(3x+4) = 0
b) x(5x−4) = 0
c) 4x(x+6)(4x−9) = 0
Solution
Since all polynomials are in factored form, we set each factor equal to zero and solve the simpler equations separately
a) (x−9)(3x+4) = 0 can be split up into two linear equations
x−9 = 0 or 3x+4 = 0
3x =−4
x = 9 or x =−43
b) x(5x−4) = 0 can be split up into two linear equations
5x−4 = 0
x = 0 or 5x = 4
x =45
c) 4x(x+6)(4x−9) = 0 can be split up into three linear equations.
9.4. POLYNOMIAL EQUATIONS IN FACTORED FORM
www.ck12.org 601
4x = 0 4x−9 = 0
x =04
or x+6 = 0 or 4x = 9
x = 0 x =−6 x =94
Find Greatest Common Monomial Factor
Once we get a polynomial in factored form, it is easier to solve the polynomial equation. But first, we need to learnhow to factor. There are several factoring methods you will be learning in the next few sections. In most cases,factoring takes several steps to complete because we want to factor completely. That means that we factor until wecannot factor anymore.
Let’s start with the simplest case, finding the greatest monomial factor. When we want to factor, we always look forcommon monomials first. Consider the following polynomial, written in expanded form.
ax+bx+ cx+dx
A common factor can be a number, a variable or a combination of numbers and variables that appear in all terms ofthe polynomial. We are looking for expressions that divide out evenly from each term in the polynomial. Notice thatin our example, the factor x appears in all terms. Therefore x is a common factor
ax+bx+ cx+dx
Since x is a common factor, we factor it by writing in front of a parenthesis:
x ( )
Inside the parenthesis, we write what is left over when we divide x from each term.
x(a+b+ c+d)
Let’s look at more examples.
Example 3
Factor
a) 2x+8
b) 15x−25
c) 3a+9b+6
Solution
a) We see that the factor 2 divides evenly from both terms.
CHAPTER 9. FACTORING POLYNOMIALS; MORE ON PROBABILITY

602 www.ck12.org
2x+8 = 2(x)+2(4)
We factor the 2 by writing it in front of a parenthesis.
2( )
Inside the parenthesis, we write what is left from each term when we divide by 2.
2(x+4) This is the factored form.
b) We see that the factor of 5 divides evenly from all terms.
Rewrite 15x−25 = 5(3x)−5(5)
Factor 5 to get 5(3x−5)
c) We see that the factor of 3 divides evenly from all terms.
Rewrite 3a+9b+6 = 3(a)+3(3b)+3(2)
Factor 3 to get 3(a+3b+2)
Here are examples where different powers of the common factor appear in the polynomial
Example 4
Find the greatest common factor
a) a3−3a2 +4a
b) 12a4−5a3 +7a2
Solution
a) Notice that the factor a appears in all terms of a3− 3a2 + 4a but each term has a different power of a . Thecommon factor is the lowest power that appears in the expression. In this case the factor is a .
Let’s rewrite a3−3a2 +4a = a(a2)+a(−3a)+a(4)
Factor a to get a(a2−3a+4)
b) The factor a appears in all the term and the lowest power is a2 .
We rewrite the expression as 12a4−5a3 +7a2 = 12a2 ·a2−5a ·a2 +7 ·a2
Factor a2 to get a2(12a2−5a+7)
Let’s look at some examples where there is more than one common factor.
Example 5:
Factor completely
a) 3ax+9a
b) x3y+ xy
c) 5x3y−15x2y2 +25xy3
Solution
a) Notice that 3 is common to both terms.
When we factor 3 we get 3(ax+3a)
This is not completely factored though because if you look inside the parenthesis, we notice that a is also a commonfactor.
When we factor a we get 3 ·a(x+3)
This is the answer because there are no more common factors.
9.4. POLYNOMIAL EQUATIONS IN FACTORED FORM
www.ck12.org 603
A different option is to factor all common factors at once.
Since both 3 and a are common we factor the term 3a and get 3a(x+3) .
b) Notice that both x and y are common factors.
Let’s rewrite the expression x3y+ xy = xy(x2)+ xy(1)
When we factor xy we obtain xy(x2 +1)
c) The common factors are 5xy .
When we factor 5xy we obtain 5xy(x2−3xy+5y2)
Solve Simple Polynomial Equations by Factoring
Now that we know the basics of factoring, we can solve some simple polynomial equations. We already saw howwe can use the Zero-product Property to solve polynomials in factored form. Here you will learn how to solvepolynomials in expanded form. These are the steps for this process.
Step 1
If necessary, re-write the equation in standard form such that:
Polynomial expression = 0
Step 2
Factor the polynomial completely
Step 3
Use the zero-product rule to set each factor equal to zero
Step 4
Solve each equation from step 3
Step 5
Check your answers by substituting your solutions into the original equation
Example 6
Solve the following polynomial equations
a) x2−2x = 0
b) 2x2 = 5x
c) 9x2y−6xy = 0
Solution:
a) x2−2x = 0
Rewrite this is not necessary since the equation is in the correct form.
Factor The common factor is x , so this factors as: x(x−2) = 0.
Set each factor equal to zero.
x = 0 or x−2 = 0
Solve
CHAPTER 9. FACTORING POLYNOMIALS; MORE ON PROBABILITY
604 www.ck12.org
x = 0 or x = 2
Check Substitute each solution back into the original equation.
x = 0 ⇒ (0)2−2(0) = 0 works out
x = 2 ⇒ (2)2−2(2) = 4−4 = 0 works out
Answer x = 0,x = 2
b) 2x2 = 5x
Rewrite 2x2 = 5x⇒ 2x2−5x = 0.
Factor The common factor is x , so this factors as: x(2x−5) = 0 .
Set each factor equal to zero:.
x = 0 or 2x−5 = 0
Solve
x = 0 or 2x = 5
x =52
Check Substitute each solution back into the original equation.
x = 0⇒ 2(0)2 = 5(0)⇒ 0 = 0 works out
x =52⇒ 2
(52
)2
= 5 · 52⇒ 2 · 25
4=
252⇒ 25
2=
252
works out
Answer x = 0,x = 52
c) 9x2y−6xy = 0
Rewrite Not necessary
Factor The common factor is 3xy , so this factors as 3xy(3x−2) = 0 .
Set each factor equal to zero.
3 = 0 is never true, so this part does not give a solution
x = 0 or y = 0 or 3x−2 = 0
Solve
9.4. POLYNOMIAL EQUATIONS IN FACTORED FORM

www.ck12.org 605
x = 0 or y = 0 or 3x = 2
x =23
Check Substitute each solution back into the original equation.
x = 0⇒ 9(0)y−6(0)y = 0−0 = 0 works out
y = 0⇒ 9x2(0)−6x = 0−0 = 0 works out
23⇒ 9 ·
(23
)2
y−6 · 23
y = 9 · 49
y−4y = 4y−4y = 0 works out
Answer x = 0,y = 0,x = 23
Review Questions
Factor the common factor in the following polynomials.
1. 3x3−21x2. 5x6 +15x4
3. 4x3 +10x2−2x4. −10x6 +12x5−4x4
5. 12xy+24xy2 +36xy3
6. 5a3−7a7. 45y12 +30y10
8. 16xy2z +4x3y
Solve the following polynomial equations.
9. x(x+12) = 010. (2x+1)(2x−1) = 011. (x−5)(2x+7)(3x−4) = 012. 2x(x+9)(7x−20) = 013. 18y−3y2 = 014. 9x2 = 27x15. 4a2 +a = 016. b2− 5
3b = 0
Review Answers
1. 3x(x2−7)2. 5x4(x2 +3)3. 2x(2x2 +5x−1)4. 2x4(−5x2 +6x−2)
CHAPTER 9. FACTORING POLYNOMIALS; MORE ON PROBABILITY

606 www.ck12.org
5. 12xy(1+2y+3y2)6. a(5a2−7)7. 15y10(3y2 +2)8. 4xy(4yz+ x2)9. x = 0,x =−12
10. x =−12 ,x =
12
11. x = 5,x =−72 ,x =
43
12. x = 0,x =−9,x = 207
13. y = 0,y = 614. x = 0,x = 315. a = 0,a =−1
416. b = 0,b = 5
3
9.4. POLYNOMIAL EQUATIONS IN FACTORED FORM

www.ck12.org 607
9.5 Factoring Quadratic Expressions
Learning Objectives
• Write quadratic equations in standard form.• Factor quadratic expressions for different coefficient values.• Factor when a =−1 .
Write Quadratic Expressions in Standard Form
Quadratic polynomials are polynomials of 2nd degree. The standard form of a quadratic polynomial is written as
ax2 +bx+ c
Here a,b, and c stand for constant numbers. Factoring these polynomials depends on the values of these constants.In this section, we will learn how to factor quadratic polynomials for different values of a,b, and c . In the lastsection, we factored common monomials, so you already know how to factor quadratic polynomials where c = 0 .
For example for the quadratic ax2 +bx , the common factor is x and this expression is factored as x(ax+b) . Whenall the coefficients are not zero these expressions are also called Quadratic Trinomials, since they are polynomialswith three terms.
Factor when a = 1, b is Positive, and c is Positive
Let’s first consider the case where a = 1,b is positive and c is positive. The quadratic trinomials will take thefollowing form.
x2 +bx+ c
You know from multiplying binomials that when you multiply two factors (x+m)(x+ n) you obtain a quadraticpolynomial. Let’s multiply this and see what happens. We use The Distributive Property.
(x+m)(x+n) = x2 +nx+mx+mn
To simplify this polynomial we would combine the like terms in the middle by adding them.
(x+m)(x+n) = x2 +(n+m)x+mn
CHAPTER 9. FACTORING POLYNOMIALS; MORE ON PROBABILITY

608 www.ck12.org
To factor we need to do this process in reverse.
We see that x2 +(n+m)x+mn
Is the same form as x2 +bx+ c
This means that we need to find two numbers m and n where
n+m = b and mn = c
To factor x2 +bx+ c , the answer is the product of two parentheses.
(x+m)(x+n)
so that n+m = b and mn = c
Let’s try some specific examples.
Example 1
Factor x2 +5x+6
Solution We are looking for an answer that is a product of two binomials in parentheses.
(x+ )(x+ )
To fill in the blanks, we want two numbers m and n that multiply to 6 and add to 5. A good strategy is to list thepossible ways we can multiply two numbers to give us 6 and then see which of these pairs of numbers add to 5. Thenumber six can be written as the product of.
6 = 1 ·6 and 1+6 = 7
6 = 2 ·3 and 2+3 = 5 ← This is the correct choice.
So the answer is (x+2)(x+3) .
We can check to see if this is correct by multiplying (x+2)(x+3) .
x + 2
x + 3
3x + 6
x2 + 2x
x2 + 5x + 9
The answer checks out.
Example 2
Factor x2 +7x+12
Solution
9.5. FACTORING QUADRATIC EXPRESSIONS
www.ck12.org 609
We are looking for an answer that is a product of two parentheses (x+ )(x+ ) .
The number 12 can be written as the product of the following numbers.
12 = 1 ·12 and 1+12 = 13
12 = 2 ·6 and 2+6 = 8
12 = 3 ·4 and 3+4 = 7 ← This is the correct choice.
The answer is (x+3)(x+4) .
Example 3
Factor x2 +8x+12 .
Solution
We are looking for an answer that is a product of the two parentheses (x+ )(x+ ) .
The number 12 can be written as the product of the following numbers.
12 = 1 ·12 and 1+12 = 13
12 = 2 ·6 and 2+6 = 8 ← This is the correct choice.
12 = 3 ·4 and 3+4 = 7
The answer is (x+2)(x+6).
Example 4
Factor x2 +12x+36 .
Solution
We are looking for an answer that is a product of the two parentheses (x+ )(x+ ) .
The number 36 can be written as the product of the following numbers.
36 = 1 ·36 and 1+36 = 37
36 = 2 ·18 and 2+18 = 20
36 = 3 ·12 and 3+12 = 15
36 = 4 ·9 and 4+9 = 13
36 = 6 ·6 and 6+6 = 12 ← This is the correct choice
The answer is (x+6)(x+6) .
Factor when a = 1, b is Negative and c is Positive
Now let’s see how this method works if the middle coefficient (b) is negative.
Example 5
Factor x2−6x+8.
CHAPTER 9. FACTORING POLYNOMIALS; MORE ON PROBABILITY

610 www.ck12.org
Solution
We are looking for an answer that is a product of the two parentheses (x+ )(x+ ) .
The number 8 can be written as the product of the following numbers.
8 = 1 ·8 and 1+8 = 9 Notice that these are two different choices.
But also,
8 = (−1) · (−8) and −1+(−8) =−9 Notice that these are two different choices.
8 = 2 ·4 and 2+4 = 6
But also,
8 = (−2) · (−4) and −2+(−4) =−6 ← This is the correct choice.
The answer is (x−2)(x−4)
We can check to see if this is correct by multiplying (x−2)(x−4) .
x − 2
x − 4
− 4x + 8
x2 − 2x
x2 − 6x + 8
The answer checks out.
Example 6
Factor x−17x+16
Solution
We are looking for an answer that is a product of two parentheses: (x± )(x± ) .
The number 16 can be written as the product of the following numbers:
16 = 1 ·16 and 1+16 = 17
16 = (−1) · (−16) and −1+(−16) =−17 ← This is the correct choice.
16 = 2 ·8 and 2+8 = 10
16 = (−2) · (−8) and −2+(−8) =−10
16 = 4 ·4 and 4+4 = 8
16 = (−4) · (−4) and −4+(−4) =−8
The answer is (x−1)(x−16) .
9.5. FACTORING QUADRATIC EXPRESSIONS

www.ck12.org 611
Factor when a = 1 and c is Negative
Now let’s see how this method works if the constant term is negative.
Example 7
Factor x2 +2x−15
Solution
We are looking for an answer that is a product of two parentheses (x± )(x± ) .
In this case, we must take the negative sign into account. The number -15 can be written as the product of thefollowing numbers.
−15 =−1 ·15 and −1+15 = 14 Notice that these are two different choices.
And also,
−15 = 1 · (−15) and 1+(−15) =−14 Notice that these are two different choices.
−15 =−3 ·5 and −3+5 = 2 ← This is the correct choice.
−15 = 3 · (−5) and 3+(−5) =−2
The answer is (x−3)(x+5) .
We can check to see if this is correct by multiplying (x−3)(x+5) .
x − 3
x + 5
5x − 15
x2 − 3x
x2 + 2x − 15
The answer checks out.
Example 8
Factor x2−10x−24
Solution
We are looking for an answer that is a product of two parentheses (x± )(x± ) .
The number -24 can be written as the product of the following numbers.
CHAPTER 9. FACTORING POLYNOMIALS; MORE ON PROBABILITY
612 www.ck12.org
−24 =−1 ·24 and −1+24 = 23
−24 = 1 · (−24) and 1+(−24) =−23
−24 =−2 ·12 and −2+12 = 10
−24 = 2 · (−12) and 2+(−12) =−10 ← This is the correct choice.
−24 =−3 ·8 and −3+8 = 5
−24 = 3 · (−8) and 3+(−8) =−5
−24 =−4 ·6 and −4+6 = 2
−24 = 4 · (−6) and 4+(−6) =−2
The answer is (x−12)(x+2).
Example 9
Factor x2 +34x−35
Solution
We are looking for an answer that is a product of two parentheses (x± )(x± )
The number -35 can be written as the product of the following numbers:
−35 =−1 ·35 and −1+35 = 34 ← This is the correct choice.
−35 = 1 · (−35) and 1+(−35) =−34
−35 =−5 ·7 and −5+7 = 2
−35 = 5 · (−7) and 5+(−7) =−2
The answer is (x−1)(x+35) .
Factor when a = - 1
When a =−1 , the best strategy is to factor the common factor of -1 from all the terms in the quadratic polynomial.Then, you can apply the methods you have learned so far in this section to find the missing factors.
Example 10
Factor x2 + x+6.
Solution
First factor the common factor of -1 from each term in the trinomial. Factoring -1 changes the signs of each term inthe expression.
−x2 + x+6 =−(x2− x−6)
We are looking for an answer that is a product of two parentheses (x± )(x± )
Now our job is to factor x2− x−6 .
The number -6 can be written as the product of the following numbers.
9.5. FACTORING QUADRATIC EXPRESSIONS
www.ck12.org 613
−6 =−1 ·6 and −1+6 = 5
−6 = 1 · (−6) and 1+(−6) =−5
−6 =−2 ·3 and −2+3 = 1
−6 = 2 · (−3) and 2+(−3) =−1 ← This is the correct choice.
The answer is −(x−3)(x+2) .
To Summarize,
A quadratic of the form x+bx+ c factors as a product of two parenthesis (x+m)(x+n) .
• If b and c are positive then both m and n are positive
– Example x2 +8x+12 factors as (x+6)(x+2) .
• If b is negative and c is positive then both m and n are negative.
– Example x2−6x+8 factors as (x−2)(x−4) .
• If c is negative then either m is positive and n is negative or vice-versa
– Example x2 +2x−15 factors as (x+5)(x−3) .– Example x2 +34x−35 factors as (x+35)(x−1) .
• If a =−1 , factor a common factor of -1 from each term in the trinomial and then factor as usual. The answerwill have the form −(x+m)(x+n) .
– Example −x2 + x+6 factors as −(x−3)(x+2) .
Review Questions
Factor the following quadratic polynomials.
1. x2 +10x+92. x2 +15x+503. x2 +10x+214. x2 +16x+485. x2−11x+246. x2−13x+427. x2−14x+338. x2−9x+209. x2 +5x−14
10. x2 +6x−2711. x2 +7x−7812. x2 +4x−3213. x2−12x−4514. x2−5x−5015. x2−3x−4016. x2− x−5617. −x2−2x−118. −x2−5x+2419. −x2 +18x−72
CHAPTER 9. FACTORING POLYNOMIALS; MORE ON PROBABILITY
614 www.ck12.org
20. −x2 +25x−15021. x2 +21x+10822. −x2 +11x−3023. x2 +12x−6424. x2−17x−60
Review Answers
1. (x+1)(x+9)2. (x+5)(x+10)3. (x+7)(x+3)4. (x+12)(x+4)5. (x−3)(x−8)6. (x−7)(x−6)7. (x−11)(x−3)8. (x−5)(x−4)9. (x−2)(x+7)
10. (x−3)(x+9)11. (x−6)(x+13)12. (x−4)(x+8)13. (x−15)(x+3)14. (x−10)(x+5)15. (x−8)(x+5)16. (x−8)(x+7)17. −(x+1)(x+1)18. −(x−3)(x+8)19. −(x−6)(x−12)20. −(x−15)(x−10)21. (x+9)(x+12)22. −(x−5)(x−6)23. (x−4)(x+16)24. (x−20)(x+3)
9.5. FACTORING QUADRATIC EXPRESSIONS
www.ck12.org 615
9.6 Factoring Special Products
Learning Objectives
• Factor the difference of two squares.• Factor perfect square trinomials.• Solve quadratic polynomial equation by factoring.
Introduction
When you learned how to multiply binomials we talked about two special products.
The Sum and Difference Formula (a+b)(a−b) = a2−b2
The Square of a Binomial Sormula (a+b)2 = a2 +2ab+b2
(a−b)2 = a2−2ab+b2
In this section we will learn how to recognize and factor these special products.
Factor the Difference of Two Squares
We use the sum and difference formula to factor a difference of two squares. A difference of two squares can be aquadratic polynomial in this form.
a2−b2
Both terms in the polynomial are perfect squares. In a case like this, the polynomial factors into the sum anddifference of the square root of each term.
a2−b2 = (a+b)(a−b)
In these problems, the key is figuring out what the a and b terms are. Let’s do some examples of this type.
Example 1
Factor the difference of squares.
a) x2−9
CHAPTER 9. FACTORING POLYNOMIALS; MORE ON PROBABILITY

616 www.ck12.org
b) x2−100
c) x2−1
Solution
a) Rewrite as x2−9 as x2−32 . Now it is obvious that it is a difference of squares.
The difference of squares formula is a2−b2 = (a+b)(a−b)
Letâ[U+0080][U+0099]s see how our problem matches with the formula x2−32 = (x+3)(x−3)
The answer is x2−9 = (x+3)(x−3) .
We can check to see if this is correct by multiplying (x+3)(x−3) .
x + 3
x − 3
−3x − 9
x2 +3x
x2 +0x − 9
The answer checks out.
We could factor this polynomial without recognizing that it is a difference of squares. With the methods we learnedin the last section we know that a quadratic polynomial factors into the product of two binomials.
(x± )(x± )
We need to find two numbers that multiply to -9 and add to 0, since the middle term is missing.
We can write -9 as the following products
−9 =−1 ·9 and −1+9 = 8
−9 = 1 · (−9) and 1+(−9) =−8
−9 = 3 · (−3) and 3+(−3) = 0 ← This is the correct choice
We can factor x2−9 as (x+3)(x−3) , which is the same answer as before.
You can always factor using methods for factoring trinomials, but it is faster if you can recognize special productssuch as the difference of squares.
b) Rewrite x2−100 as x2−102 . This factors as (x+10)(x−10) .
c) Rewrite x2−1 as x2−12 . This factors as (x+1)(x−1) .
Example 2
Factor the difference of squares.
a) 16x2−25
b) 4x2−81
9.6. FACTORING SPECIAL PRODUCTS
www.ck12.org 617
c) 49x2−64
Solution
a) Rewrite 16x2−25 as (4x)2−52 . This factors as (4x+5)(4x−5) .
b) Rewrite 4x2−81 as (2x)2−92 . This factors as (2x+9)(2x−9) .
c) Rewrite 49x2−64 as (7x)2−82 . This factors as (7x+8)(7x−8) .
Example 3
Factor the difference of squares:
a) x2− y2
b) 9x2−4y2
c) x2y2−1
Solution
a) x2− y2 factors as (x+ y)(x− y) .
b) Rewrite 9x2−4y2 as (3x)2− (2y)2 . This factors as (3x+2y)(3x−2y) .
c) Rewrite as x2y2−1 as (xy)2−12 . This factors as (xy+1)(xy−1) .
Example 4
Factor the difference of squares.
a) x4−25
b) 16x4− y2
c) x2y8−64z2
Solution
a) Rewrite x4−25 as (x2)2−52 . This factors as (x2 +5)(x2−5) .
b) Rewrite 16x4− y2 as (4x2)2− y2 . This factors as (x2 +5)(x2−5) .
c) Rewrite x2y8−64z2 as (xy2)2− (8z) . This factors as (xy2 +8z)(xy2−8z) .
Factor Perfect Square Trinomials
We use the Square of a Binomial Formula to factor perfect square trinomials. A perfect square trinomial has thefollowing form.
a2 +2ab+b2 or a2−2ab+b2
In these special kinds of trinomials, the first and last terms are perfect squares and the middle term is twice theproduct of the square roots of the first and last terms. In a case like this, the polynomial factors into perfect squares.
a2 +2ab+b2 = (a+b)2
a2−2ab+b2 = (a−b)2
In these problems, the key is figuring out what the a and b terms are. Let’s do some examples of this type.
CHAPTER 9. FACTORING POLYNOMIALS; MORE ON PROBABILITY
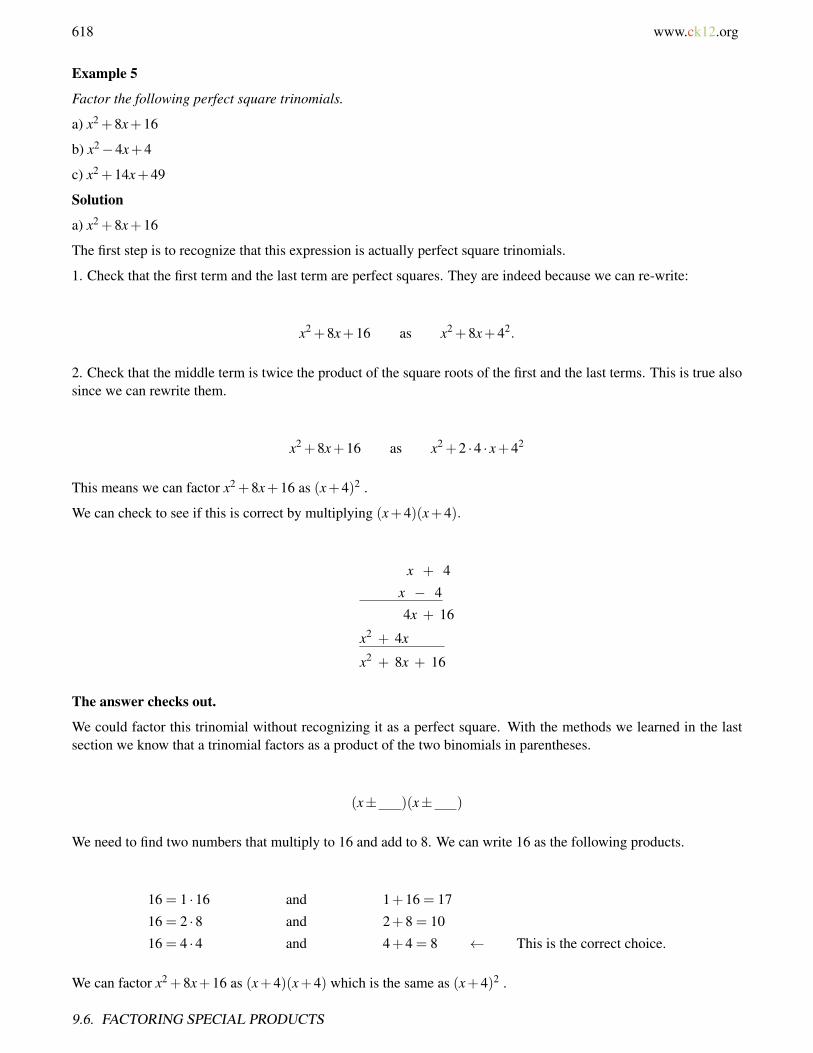
618 www.ck12.org
Example 5
Factor the following perfect square trinomials.
a) x2 +8x+16
b) x2−4x+4
c) x2 +14x+49
Solution
a) x2 +8x+16
The first step is to recognize that this expression is actually perfect square trinomials.
1. Check that the first term and the last term are perfect squares. They are indeed because we can re-write:
x2 +8x+16 as x2 +8x+42.
2. Check that the middle term is twice the product of the square roots of the first and the last terms. This is true alsosince we can rewrite them.
x2 +8x+16 as x2 +2 ·4 · x+42
This means we can factor x2 +8x+16 as (x+4)2 .
We can check to see if this is correct by multiplying (x+4)(x+4).
x + 4
x − 4
4x + 16
x2 + 4x
x2 + 8x + 16
The answer checks out.
We could factor this trinomial without recognizing it as a perfect square. With the methods we learned in the lastsection we know that a trinomial factors as a product of the two binomials in parentheses.
(x± )(x± )
We need to find two numbers that multiply to 16 and add to 8. We can write 16 as the following products.
16 = 1 ·16 and 1+16 = 17
16 = 2 ·8 and 2+8 = 10
16 = 4 ·4 and 4+4 = 8 ← This is the correct choice.
We can factor x2 +8x+16 as (x+4)(x+4) which is the same as (x+4)2 .
9.6. FACTORING SPECIAL PRODUCTS
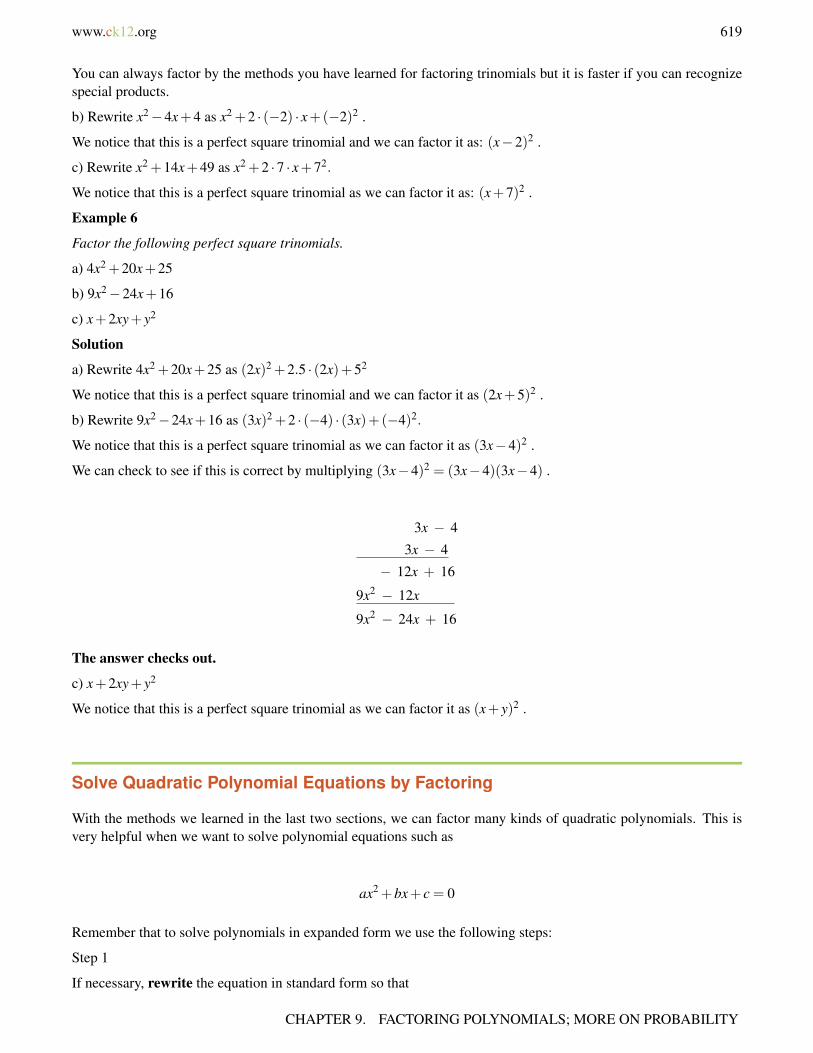
www.ck12.org 619
You can always factor by the methods you have learned for factoring trinomials but it is faster if you can recognizespecial products.
b) Rewrite x2−4x+4 as x2 +2 · (−2) · x+(−2)2 .
We notice that this is a perfect square trinomial and we can factor it as: (x−2)2 .
c) Rewrite x2 +14x+49 as x2 +2 ·7 · x+72.
We notice that this is a perfect square trinomial as we can factor it as: (x+7)2 .
Example 6
Factor the following perfect square trinomials.
a) 4x2 +20x+25
b) 9x2−24x+16
c) x+2xy+ y2
Solution
a) Rewrite 4x2 +20x+25 as (2x)2 +2.5 · (2x)+52
We notice that this is a perfect square trinomial and we can factor it as (2x+5)2 .
b) Rewrite 9x2−24x+16 as (3x)2 +2 · (−4) · (3x)+(−4)2.
We notice that this is a perfect square trinomial as we can factor it as (3x−4)2 .
We can check to see if this is correct by multiplying (3x−4)2 = (3x−4)(3x−4) .
3x − 4
3x − 4
− 12x + 16
9x2 − 12x
9x2 − 24x + 16
The answer checks out.
c) x+2xy+ y2
We notice that this is a perfect square trinomial as we can factor it as (x+ y)2 .
Solve Quadratic Polynomial Equations by Factoring
With the methods we learned in the last two sections, we can factor many kinds of quadratic polynomials. This isvery helpful when we want to solve polynomial equations such as
ax2 +bx+ c = 0
Remember that to solve polynomials in expanded form we use the following steps:
Step 1
If necessary, rewrite the equation in standard form so that
CHAPTER 9. FACTORING POLYNOMIALS; MORE ON PROBABILITY
620 www.ck12.org
Polynomial expression = 0.
Step 2
Factor the polynomial completely.
Step 3
Use the Zero-Product rule to set each factor equal to zero.
Step 4
Solve each equation from Step 3.
Step 5
Check your answers by substituting your solutions into the original equation.
We will do a few examples that show how to solve quadratic polynomials using the factoring methods we justlearned.
Example 7
Solve the following polynomial equations.
a) x2 +7x+6 = 0
b) x2−8x =−12
c) x2 = 2x+15
Solution
a) x2 +7x+6 = 0
Rewrite This is not necessary since the equation is in the correct form already.
Factor We can write 6 as a product of the following numbers.
6 = 1 ·6 and 1+6 = 7 ← This is the correct choice.
6 = 2 ·3 and 2+3 = 5
x2 +7x+6 = 0 factors as (x+1)(x+6) = 0
Set each factor equal to zero
x+1 = 0 or x+6 = 0
Solve
x =−1 or x =−6
Check Substitute each solution back into the original equation.
x =−1 (−1)2 +7(−1)+6 = 1−7+6 = 0 Checks out.
x =−6 (−6)2 +7(−6)+6 = 36−42+6 = 0 Checks out.
9.6. FACTORING SPECIAL PRODUCTS
www.ck12.org 621
b) x2−8x =−12
Rewrite x2−8x =−12 is rewritten as x2−8x+12 = 0.
Factor We can write 12 as a product of the following numbers.
12 = 1 ·12 and 1+12 = 13
12 =−1 · (−12) and −1+(−12) =−13
12 = 2 ·6 and 2+6 = 8
12 =−2 · (−6) and −2+(−6) =−8 ← This is the correct choice.
12 = 3 ·4 and 3+4 = 7
12 =−3 · (−4) and −3+(−4) =−7
x2−8x+12 = 0 factors as (x−2)(x−6) = 0
Set each factor equal to zero.
x−2 = 0 or x−6 = 0
Solve.
x = 2 or x = 6
Check Substitute each solution back into the original equation.
x = 2 (2)2−8(2) = 4−16 =−12 Checks out.
x = 2 (6)2−8(6) = 36−48 =−12 Checks out.
c) x2 = 2x+15
Rewrite x2 = 2x+15 is re-written as x2−2x−15 = 0 .
Factor We can write -15 as a product of the following numbers.
−15 = 1 · (−15) and 1+(−15) =−14
−15 =−1 · (15) and −1+(15) = 14
−15 =−3 ·5 and −3+5 = 2
−15 = 3 · (−5) and 3+(−5) =−2 ← This is the correct choice.
x2−2x−15 = 0 factors as (x+3)(x−5) = 0 .
Set each factor equal to zero
x+3 = 0 or x−5 = 0
CHAPTER 9. FACTORING POLYNOMIALS; MORE ON PROBABILITY
622 www.ck12.org
Solve
x =−3 or x = 5
Check Substitute each solution back into the original equation.
x =−3 (−3)2 = 2(−3)+15⇒ 9 = 0 Checks out.
x = 5 (5)2 = 2(5)+15⇒ 25 = 25 Checks out.
Example 8
Solve the following polynomial equations.
a) x2−12x+36 = 0
b) x2−81 = 0
c) x2 +20x+100 = 0
Solution
a) x2−12x+36 = 0
Rewrite This is not necessary since the equation is in the correct form already.
Factor: Re-write x2−12x+36 as x2−2 · (−6)x+(−6)2.
We recognize this as a difference of squares. This factors as (x−6)2 = 0 or (x−6)(x−6) = 0 .
Set each factor equal to zero
x−6 = 0 or x−6 = 0
Solve
x = 6 or x = 6
Notice that for a perfect square the two solutions are the same. This is called a double root.
Check Substitute each solution back into the original equation.
x = 6 62−12(6)+36 = 36−72+36+0 Checks out.
b) x2−81 = 0
Rewrite This is not necessary since the equation is in the correct form already
Factor Rewrite x2−81 = 0 as x2−92 = 0.
We recognize this as a difference of squares. This factors as (x−9)(x+9) = 0 .
Set each factor equal to zero.
9.6. FACTORING SPECIAL PRODUCTS

www.ck12.org 623
x−9 = 0 or x+9 = 0
Solve:
x = 9 or x =−9
Check: Substitute each solution back into the original equation.
x = 9 92−81 = 81−81 = 0 Checks out.
x =−9 (−9)2−81 = 81−81 = 0 Checks out.
c) x2 +20x+100 = 0
Rewrite This is not necessary since the equation is in the correct form already.
Factor Rewrite x2 +20x+100 = 0 as x2 +2 ·10 · x+102
We recognize this as a perfect square. This factors as: (x+10)2 = 0 or (x+10)(x+10) = 0.
Set each factor equal to zero.
x+10 = 0 or x+10 = 0
Solve.
x =−10 or x =−10 This is a double root.
Check Substitute each solution back into the original equation.
x = 10 (−10)2 +20(−10)+100 = 100−200+100 = 0 Checks out.
Review Questions
Factor the following perfect square trinomials.
1. x2 +8x+162. x2−18x+813. −x2 +24x−1444. x2 +14x+495. 4x2−4x+16. 25x2 +60x+367. 4x2−12xy+9y2
8. x4 +22x2 +121
CHAPTER 9. FACTORING POLYNOMIALS; MORE ON PROBABILITY

624 www.ck12.org
Factor the following difference of squares.
9. x2−410. x2−3611. −x2 +10012. x2−40013. 9x2−414. 25x2−4915. −36x2 +2516. 16x2−81y2
Solve the following quadratic equation using factoring.
17. x2−11x+30 = 018. x2 +4x = 2119. x2 +49 = 14x20. x2−64 = 021. x2−24x+144 = 022. 4x2−25 = 023. x2 +26x =−16924. −x2−16x−60 = 0
Review Answers
1. (x+4)2
2. (x−9)2
3. −(x−12)2
4. (x+7)2
5. (2x−1)2
6. (5x+6)2
7. (2x−3y)2
8. (x2 +11)2
9. (x+2)(x−2)10. (x+6)(x−6)11. −(x+10)(x−10)12. (x+20)(x−20)13. (3x+2)(3x−2)14. (5x+7)(5x−7)15. −(6x+5)(6x−5)16. (4x+9y)(4x−9y)17. x = 5,x = 618. x =−7,x = 319. x = 720. x =−8,x = 821. x = 1222. x = 5
2 ,x =−52
23. x =−1324. x =−10,x =−6
9.6. FACTORING SPECIAL PRODUCTS

www.ck12.org 625
9.7 Factoring Polynomials Completely
Learning Objectives
• Factor out a common binomial.• Factor by grouping.• Factor a quadratic trinomial where a 6= 1 .• Solve real world problems using polynomial equations.
Introduction
We say that a polynomial is factored completely when we factor as much as we can and we can’t factor any more.Here are some suggestions that you should follow to make sure that you factor completely.
• Factor all common monomials first.• Identify special products such as difference of squares or the square of a binomial. Factor according to their
formulas.• If there are no special products, factor using the methods we learned in the previous sections.• Look at each factor and see if any of these can be factored further.
Here are some examples
Example 1
Factor the following polynomials completely.
a) 6x2−30x+24
b) 2x2−8
c) x3 +6x2 +9x
Solution
a) 6x2−30x+24
Factor the common monomial. In this case 6 can be factored from each term.
6(x2−5x+6)
There are no special products. We factor x2−5x+6 as a product of two binomials (x± )(x± ) .
The two numbers that multiply to 6 and add to -5 are -2 and -3. Let’s substitute them into the two parenthesis. The6 is outside because it is factored out.
6(x2−5x+6) = 6(x−2)(x−3)
CHAPTER 9. FACTORING POLYNOMIALS; MORE ON PROBABILITY
626 www.ck12.org
If we look at each factor we see that we can’t factor anything else.
The answer is 6(x−2)(x−3)
b) 2x2−8
Factor common monomials 2x2−8 = 2(x2−4).
We recognize x2−4 as a difference of squares. We factor as 2(x2−4) = 2(x+2)(x−2).
If we look at each factor we see that we can’t factor anything else.
The answer is 2(x+2)(x−2).
c) x3 +6x2 +9x
Factor common monomials x3 +6x2 +9x = x(x2 +6x+9).
We recognize as a perfect square and factor as x(x+3)2.
If we look at each factor we see that we can’t factor anything else.
The answer is x(x+3)2 .
Example 2
Factor the following polynomials completely.
a) −2x4 +162
b) x5−8x3 +16x
Solution
a) −2x4 +162
Factor the common monomial. In this case, factor -2 rather than 2. It is always easier to factor the negative numberso that the leading term is positive.
−2x4 +162 =−2(x4−81)
We recognize expression in parenthesis as a difference of squares. We factor and get this result.
−2(x2−9)(x2 +9)
If we look at each factor, we see that the first parenthesis is a difference of squares. We factor and get this answers.
−2(x+3)(x−3)(x2 +9)
If we look at each factor, we see that we can factor no more.
The answer is −2(x+3)(x−3)(x2 +9)
b) x5−8x3 +16x
Factor out the common monomial x5−8x3 +14x = x(x4−8x2 +16) .
We recognize x4−8x2 +16 as a perfect square and we factor it as x(x2−4)2 .
We look at each term and recognize that the term in parenthesis is a difference of squares.
We factor and get: x[(x+2)2(x−2)]2 = x(x+2)2(x−2)2.
9.7. FACTORING POLYNOMIALS COMPLETELY
www.ck12.org 627
We use square brackets “[” and “]” in this expression because x is multiplied by the expression (x+ 2)2(x− 2) .When we have “nested” grouping symbols we use brackets “[” and “]” to show the levels of nesting.
If we look at each factor now we see that we can’t factor anything else.
The answer is: x(x+2)2(x−2)2.
Factor out a Common Binomial
The first step in the factoring process is often factoring the common monomials from a polynomial. Sometimespolynomials have common terms that are binomials. For example, consider the following expression.
x(3x+2)−5(3x+2)
You can see that the term (3x+ 2) appears in both term of the polynomial. This common term can be factored bywriting it in front of a parenthesis. Inside the parenthesis, we write all the terms that are left over when we dividethem by the common factor.
(3x+2)(x−5)
This expression is now completely factored.
Let’s look at some more examples.
Example 3
Factor the common binomials.
a) 3x(x−1)+4(x−1)
b) x(4x+5)+(4x+5)
Solution
a) 3x(x−1)+4(x−1) has a common binomial of (x−1) .
When we factor the common binomial, we get (x−1)(3x+4) .
b) x(4x+5)+(4x+5) has a common binomial of (4x+5) .
When we factor the common binomial, we get (4x+5)(x+1) .
Factor by Grouping
It may be possible to factor a polynomial containing four or more terms by factoring common monomials fromgroups of terms. This method is called factor by grouping.
The next example illustrates how this process works.
Example 4
Factor 2x+2y+ax+ay .
Solution
CHAPTER 9. FACTORING POLYNOMIALS; MORE ON PROBABILITY

628 www.ck12.org
There isn’t a common factor for all four terms in this example. However, there is a factor of 2 that is common to thefirst two terms and there is a factor of a that is common to the last two terms. Factor 2 from the first two terms andfactor a from the last two terms.
2x+2y+ax+ay = 2(x+ y)+a(x+ y)
Now we notice that the binomial (x+ y) is common to both terms. We factor the common binomial and get.
(x+ y)(2+a)
Our polynomial is now factored completely.
Example 5
Factor 3x2 +6x+4x+8.
Solution
We factor 3x from the first two terms and factor 4 from the last two terms.
3x(x+2)+4(x+2)
Now factor (x+2) from both terms.
(x+2)(3x+4).
Now the polynomial is factored completely.
Factor Quadratic Trinomials Where a 6= 1
Factoring by grouping is a very useful method for factoring quadratic trinomials where a 6= 1 . A quadratic polyno-mial such as this one.
ax2 +bx+ c
This does not factor as (x±m)(x±n) , so it is not as simple as looking for two numbers that multiply to give c andadd to give b . In this case, we must take into account the coefficient that appears in the first term.
To factor a quadratic polynomial where a 6= 1 , we follow the following steps.
a. We find the product ac .b. We look for two numbers that multiply to give ac and add to give b .c. We rewrite the middle term using the two numbers we just found.d. We factor the expression by grouping.
9.7. FACTORING POLYNOMIALS COMPLETELY

www.ck12.org 629
Let’s apply this method to the following examples.
Example 6
Factor the following quadratic trinomials by grouping.
a) 3x2 +8x+4
b) 6x2−11x+4
c) 5x2−6x+1
Solution
Let’s follow the steps outlined above.
a) 3x2 +8x+4
Step 1 ac = 3 ·4 = 12
Step 2 The number 12 can be written as a product of two numbers in any of these ways:
12 = 1 ·12 and 1+12 = 13
12 = 2 ·6 and 2+6 = 8 This is the correct choice.
12 = 3 ·4 and 3+4 = 7
Step 3 Re-write the middle term as: 8x = 2x+6x , so the problem becomes the following.
3x2 +8x+4 = 3x2 +2x+6x+4
Step 4: Factor an x from the first two terms and 2 from the last two terms.
x(3x+2)+2(3x+2)
Now factor the common binomial (3x+2) .
(3x+2)(x+2)
Our answer is (3x+2)(x+2) .
To check if this is correct we multiply (3x+2)(x+2) .
3x+ 2
x + 2
6x+ 4
3x2 + 2x
3x2 + 8x + 4
The answer checks out.
b) 6x2−11x+4
CHAPTER 9. FACTORING POLYNOMIALS; MORE ON PROBABILITY

630 www.ck12.org
Step 1 ac = 6 ·4 = 24
Step 2 The number 24 can be written as a product of two numbers in any of these ways.
24 = 1 ·24 and 1+24 = 25
24 =−1 · (−24) and −1+(−24) =−25
24 = 2 ·12 and 2+12 = 14
24 =−2 · (−12) and −2+(−12) =−14
24 = 3 ·8 and 3+8 = 11
24 =−3 · (−8) and −3+(−8) =−11 ← This is the correct choice.
24 = 4 ·6 and 4+6 = 10
24 =−4 · (−6) and −4+(−6) =−10
Step 3 Re-write the middle term as −11x =−3x−8x , so the problem becomes
6x2−11x+4 = 6x2−3x−8x+4
Step 4 Factor by grouping. Factor a 3x from the first two terms and factor -4 from the last two terms.
3x(2x−1)−4(2x−1)
Now factor the common binomial (2x−1) .
(2x−1)(3x−4)
Our answer is (2x−1)(3x−4).
c) 5x2−6x+1
Step 1 ac = 5 ·1 = 5
Step 2 The number 5 can be written as a product of two numbers in any of these ways.
5 = 1 ·5 and 1+5 = 6
5 =−1 · (−5) and −1+(−5) =−6 ← This is the correct choice
Step 3 Rewrite the middle term as −6x =−x−5x. The problem becomes
5x2−6x+1 = 5x2− x−5x+1
Step 4 Factor by grouping: factor an x from the first two terms and a factor of -1 from the last two terms
x(5x−1)−1(5x−1)
9.7. FACTORING POLYNOMIALS COMPLETELY
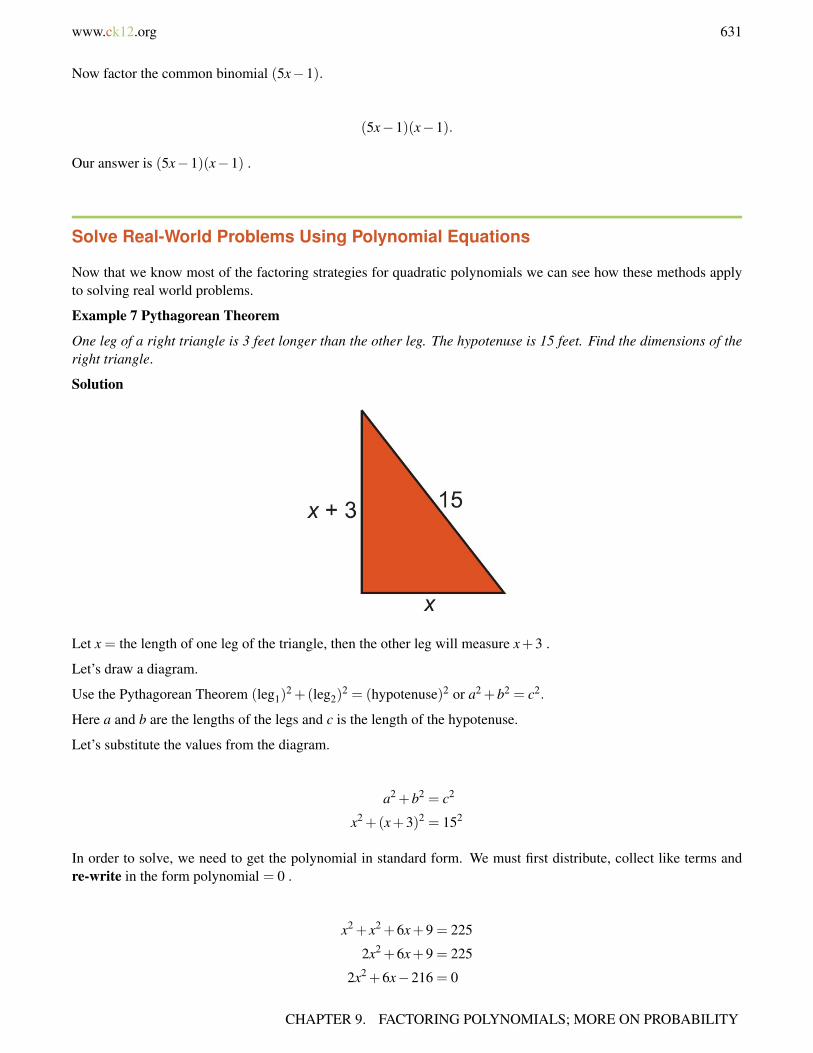
www.ck12.org 631
Now factor the common binomial (5x−1).
(5x−1)(x−1).
Our answer is (5x−1)(x−1) .
Solve Real-World Problems Using Polynomial Equations
Now that we know most of the factoring strategies for quadratic polynomials we can see how these methods applyto solving real world problems.
Example 7 Pythagorean Theorem
One leg of a right triangle is 3 feet longer than the other leg. The hypotenuse is 15 feet. Find the dimensions of theright triangle.
Solution
Let x = the length of one leg of the triangle, then the other leg will measure x+3 .
Let’s draw a diagram.
Use the Pythagorean Theorem (leg1)2 +(leg2)
2 = (hypotenuse)2 or a2 +b2 = c2.
Here a and b are the lengths of the legs and c is the length of the hypotenuse.
Let’s substitute the values from the diagram.
a2 +b2 = c2
x2 +(x+3)2 = 152
In order to solve, we need to get the polynomial in standard form. We must first distribute, collect like terms andre-write in the form polynomial = 0 .
x2 + x2 +6x+9 = 225
2x2 +6x+9 = 225
2x2 +6x−216 = 0
CHAPTER 9. FACTORING POLYNOMIALS; MORE ON PROBABILITY
632 www.ck12.org
Factor the common monomial 2(x+3x−108) = 0 .
To factor the trinomial inside the parenthesis we need to numbers that multiply to -108 and add to 3. It would take along time to go through all the options so let’s try some of the bigger factors.
−108 =−12· and −12+9 =−3
−108 = 12 · (−9) and 12+(−9) = 3 ← This is the correct choice.
We factor as: 2(x−9)(x+12) = 0 .
Set each term equal to zero and solve
x−9 = 0 x+12 = 0
or
x = 9 x =−12
It makes no sense to have a negative answer for the length of a side of the triangle, so the answer must be thefollowing.
Answer x = 9 for one leg, and x+3 = 12 for the other leg.
Check 92 +122 = 81+144 = 225 = 152 so the answer checks.
Example 8 Number Problems
The product of two positive numbers is 60. Find the two numbers if one of the numbers is 4 more than the other.
Solution
Let x = one of the numbers and x+4 equals the other number.
The product of these two numbers equals 60. We can write the equation.
x(x+4) = 60
In order to solve we must write the polynomial in standard form. Distribute, collect like terms and re-write in theform polynomial = 0 .
x2 +4x = 60
x2 +4x−60 = 0
Factor by finding two numbers that multiply to -60 and add to 4. List some numbers that multiply to -60:
−60 =−4 ·15 and −4+15 = 11
−60 = 4 · (−15) and 4+(−15) =−11
−60 =−5 ·12 and −5+12 = 7
−60 = 5 · (−12) and 5+(−12) =−7
−60 =−6 ·10 and −6+10 = 4 ← This is the correct choice
−60 = 6 · (−10) and 6+(−10) =−4
9.7. FACTORING POLYNOMIALS COMPLETELY
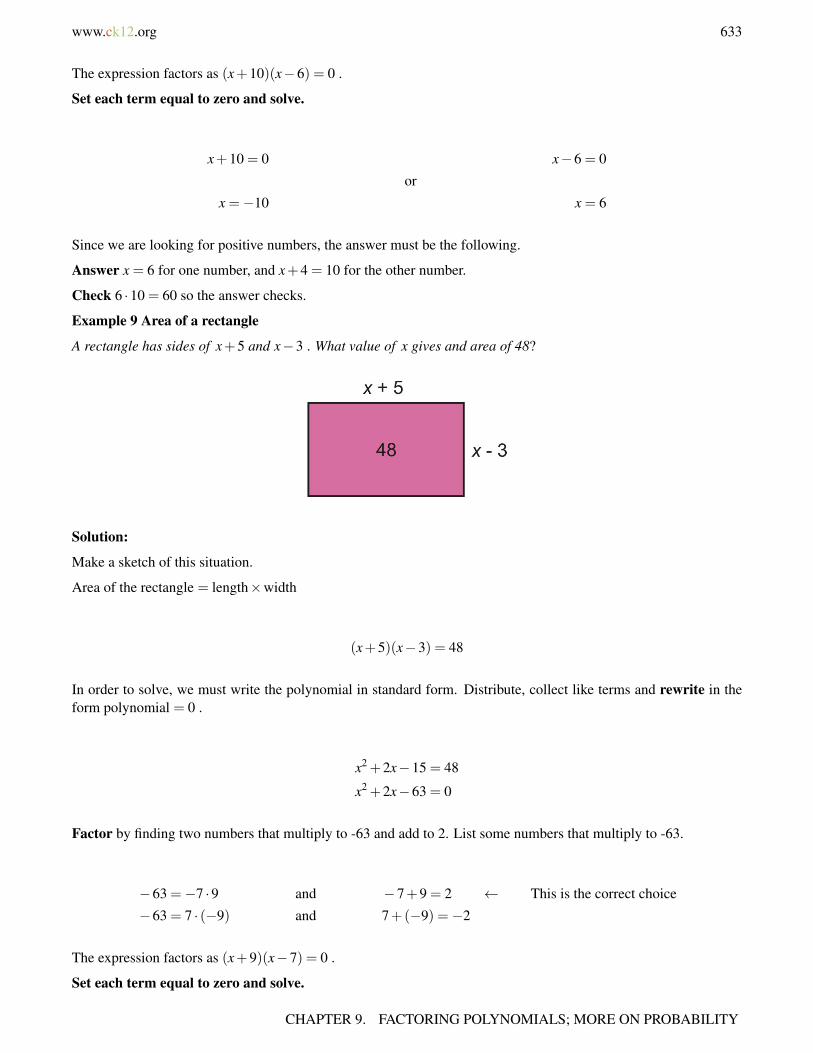
www.ck12.org 633
The expression factors as (x+10)(x−6) = 0 .
Set each term equal to zero and solve.
x+10 = 0 x−6 = 0
or
x =−10 x = 6
Since we are looking for positive numbers, the answer must be the following.
Answer x = 6 for one number, and x+4 = 10 for the other number.
Check 6 ·10 = 60 so the answer checks.
Example 9 Area of a rectangle
A rectangle has sides of x+5 and x−3 . What value of x gives and area of 48?
Solution:
Make a sketch of this situation.
Area of the rectangle = length×width
(x+5)(x−3) = 48
In order to solve, we must write the polynomial in standard form. Distribute, collect like terms and rewrite in theform polynomial = 0 .
x2 +2x−15 = 48
x2 +2x−63 = 0
Factor by finding two numbers that multiply to -63 and add to 2. List some numbers that multiply to -63.
−63 =−7 ·9 and −7+9 = 2 ← This is the correct choice
−63 = 7 · (−9) and 7+(−9) =−2
The expression factors as (x+9)(x−7) = 0 .
Set each term equal to zero and solve.
CHAPTER 9. FACTORING POLYNOMIALS; MORE ON PROBABILITY

634 www.ck12.org
x+9 = 0 x−7 = 0
or
x =−9 x = 7
Since we are looking for positive numbers the answer must be x = 7 .
Answer The width is x−3 = 4 and the length is x+5 = 12 .
Check 4 ·12 = 48 so the answer checks out.
Review Questions
Factor completely.
1. 2x2 +16x+302. −x3 +17x2−70x3. 2x2−5124. 12x3 +12x2 +3x
Factor by grouping.
5. 6x2−9x+10x−156. 5x2−35x+ x−77. 9x2−9x− x+18. 4x2 +32x−5x−40
Factor the following quadratic binomials by grouping.
9. 4x2 +25x−2110. 6x2 +7x+111. 4x2 +8x−512. 3x2 +16x+21
Solve the following application problems:
13. One leg of a right triangle is 7 feet longer than the other leg. The hypotenuse is 13 feet. Find the dimensionsof the right triangle.
14. A rectangle has sides of x+2 and x−1 . What value of x gives and area of 108?15. The product of two positive numbers is 120. Find the two numbers if one numbers is 7 more than the other.16. Framing Warehouse offers a picture framing service. The cost for framing a picture is made up of two parts.
The cost of glass is $1 per square foot. The cost of the frame is $2 per linear foot. If the frame is a square,what size picture can you get framed for $20?
Review Answers
1. 2(x+3)(x+5)
9.7. FACTORING POLYNOMIALS COMPLETELY
www.ck12.org 635
2. −x(x−7)(x−10)3. 2(x−4)(x+4)(x2 +16)4. 3x(2x+1)2
5. (2x−3)(3x+5)6. (x−7)(5x+1)7. (9x−1)(x−1)8. (x+8)(4x−5)9. (4x−3)(x+7)
10. (6x+1)(x+1)11. (2x−1)(2x+5)12. (x+3)(3x+7)13. Leg 1 = 5,Leg 2 = 1214. x = 1015. Numbers are 8 and 15.16. You can frame a 2 foot × 2 foot picture.
Texas Instruments Resources
In the CK-12 Texas Instruments Algebra I FlexBook, there are graphing calculator activities designed to supple-ment the objectives for some of the lessons in this chapter. See http://www.ck12.org/flexr/chapter/9619.
CHAPTER 9. FACTORING POLYNOMIALS; MORE ON PROBABILITY

636 www.ck12.org
CHAPTER 10 Quadratic Equations andQuadratic Functions
CHAPTER OUTLINE
10.1 GRAPHS OF QUADRATIC FUNCTIONS
10.2 QUADRATIC EQUATIONS BY GRAPHING
10.3 QUADRATIC EQUATIONS BY SQUARE ROOTS
10.4 SOLVING QUADRATIC EQUATIONS BY COMPLETING THE SQUARE
10.5 SOLVING QUADRATIC EQUATIONS BY THE QUADRATIC FORMULA
10.6 THE DISCRIMINANT
10.7 LINEAR, EXPONENTIAL AND QUADRATIC MODELS
10.8 PROBLEM SOLVING STRATEGIES: CHOOSE A FUNCTION MODEL
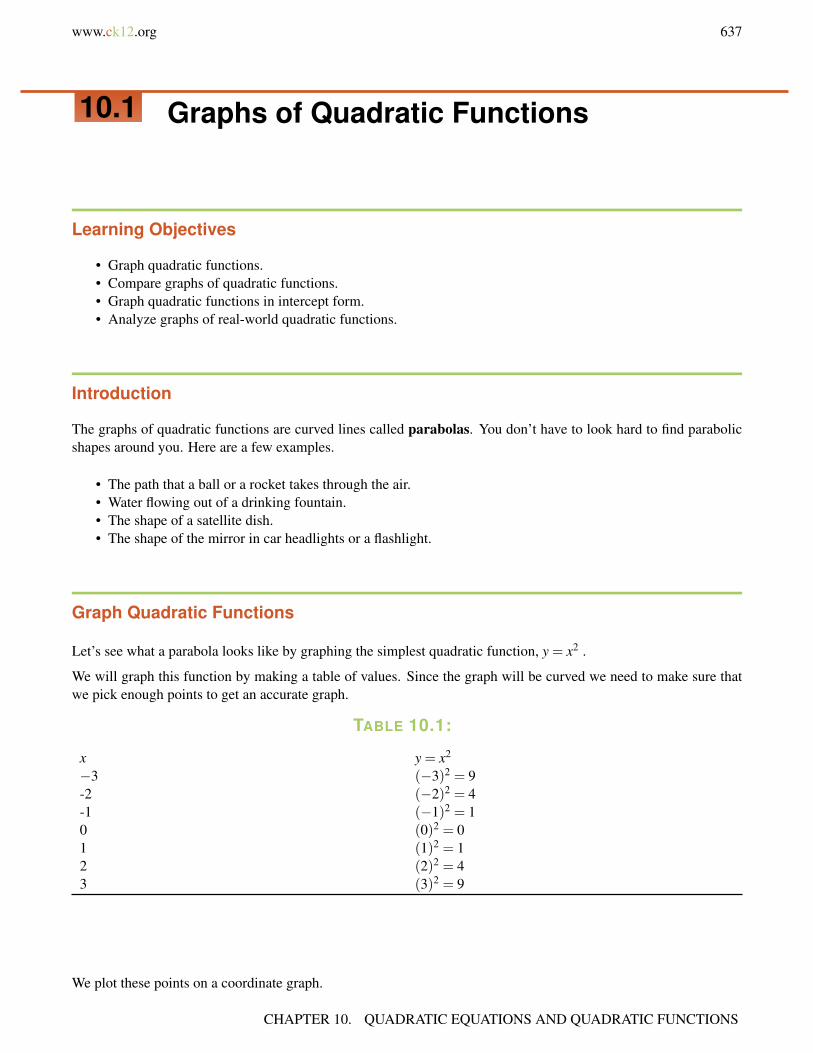
www.ck12.org 637
10.1 Graphs of Quadratic Functions
Learning Objectives
• Graph quadratic functions.• Compare graphs of quadratic functions.• Graph quadratic functions in intercept form.• Analyze graphs of real-world quadratic functions.
Introduction
The graphs of quadratic functions are curved lines called parabolas. You don’t have to look hard to find parabolicshapes around you. Here are a few examples.
• The path that a ball or a rocket takes through the air.• Water flowing out of a drinking fountain.• The shape of a satellite dish.• The shape of the mirror in car headlights or a flashlight.
Graph Quadratic Functions
Let’s see what a parabola looks like by graphing the simplest quadratic function, y = x2 .
We will graph this function by making a table of values. Since the graph will be curved we need to make sure thatwe pick enough points to get an accurate graph.
TABLE 10.1:
x y = x2
−3 (−3)2 = 9-2 (−2)2 = 4-1 (−1)2 = 10 (0)2 = 01 (1)2 = 12 (2)2 = 43 (3)2 = 9
We plot these points on a coordinate graph.
CHAPTER 10. QUADRATIC EQUATIONS AND QUADRATIC FUNCTIONS
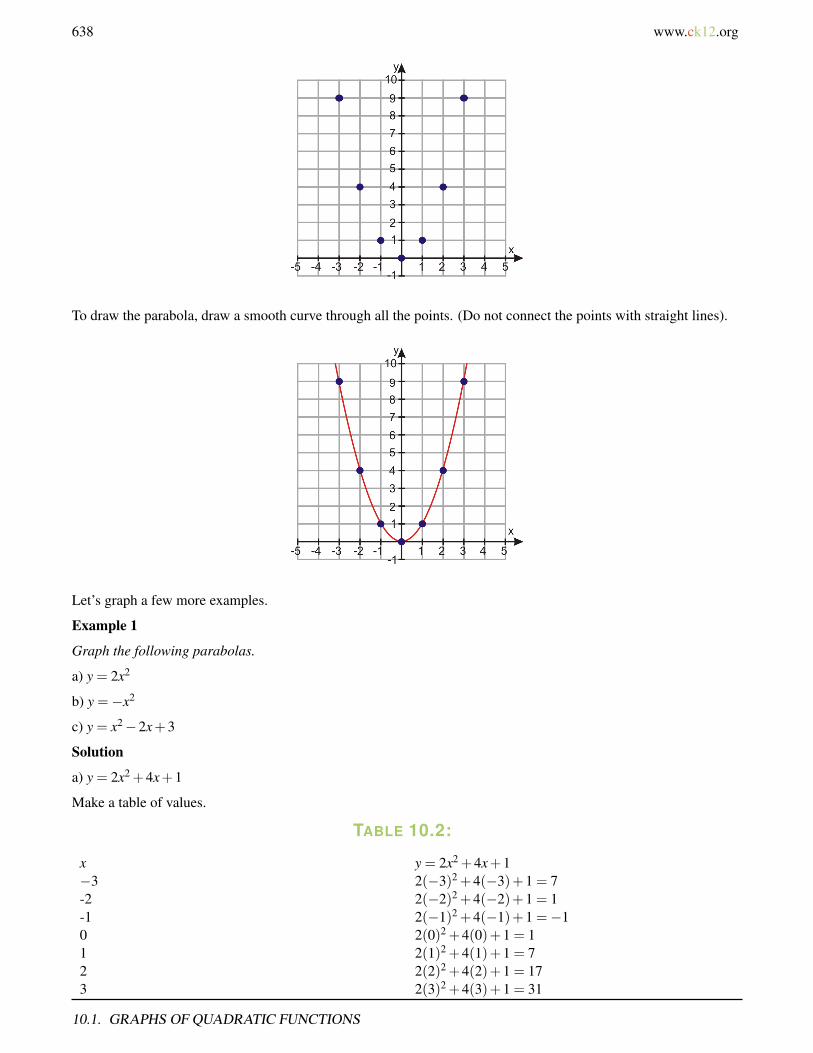
638 www.ck12.org
To draw the parabola, draw a smooth curve through all the points. (Do not connect the points with straight lines).
Let’s graph a few more examples.
Example 1
Graph the following parabolas.
a) y = 2x2
b) y =−x2
c) y = x2−2x+3
Solution
a) y = 2x2 +4x+1
Make a table of values.
TABLE 10.2:
x y = 2x2 +4x+1−3 2(−3)2 +4(−3)+1 = 7-2 2(−2)2 +4(−2)+1 = 1-1 2(−1)2 +4(−1)+1 =−10 2(0)2 +4(0)+1 = 11 2(1)2 +4(1)+1 = 72 2(2)2 +4(2)+1 = 173 2(3)2 +4(3)+1 = 31
10.1. GRAPHS OF QUADRATIC FUNCTIONS

www.ck12.org 639
Notice that the last two points have large y− values. We will not graph them since that will make our y− scale toobig. Now plot the remaining points and join them with a smooth curve.
b) y =−x2 +3
Make a table of values.
TABLE 10.3:
x y =−x2 +3−3 −(−3)2 +3 =−6-2 −(−2)2 +3 =−1-1 −(−1)2 +3 = 20 −(0)2 +3 = 31 −(1)2 +3 = 22 −(2)2 +3 =−13 −(3)2 +3 =−6
Plot the points and join them with a smooth curve.
Notice that it makes an “upside down” parabola. Our equation has a negative sign in front of the x2 term. The signof the coefficient of the x2 term determines whether the parabola turns up or down.
If the coefficient of x2 ; is positive, then the parabola turns up.
CHAPTER 10. QUADRATIC EQUATIONS AND QUADRATIC FUNCTIONS
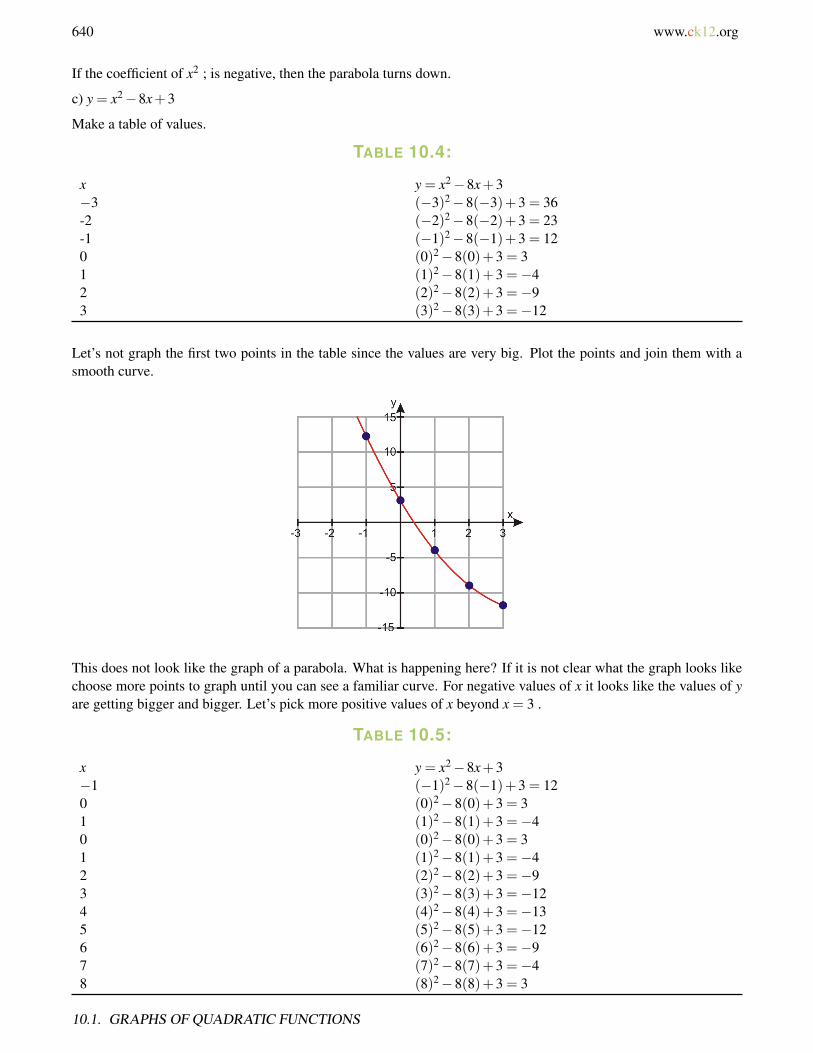
640 www.ck12.org
If the coefficient of x2 ; is negative, then the parabola turns down.
c) y = x2−8x+3
Make a table of values.
TABLE 10.4:
x y = x2−8x+3−3 (−3)2−8(−3)+3 = 36-2 (−2)2−8(−2)+3 = 23-1 (−1)2−8(−1)+3 = 120 (0)2−8(0)+3 = 31 (1)2−8(1)+3 =−42 (2)2−8(2)+3 =−93 (3)2−8(3)+3 =−12
Let’s not graph the first two points in the table since the values are very big. Plot the points and join them with asmooth curve.
This does not look like the graph of a parabola. What is happening here? If it is not clear what the graph looks likechoose more points to graph until you can see a familiar curve. For negative values of x it looks like the values of yare getting bigger and bigger. Let’s pick more positive values of x beyond x = 3 .
TABLE 10.5:
x y = x2−8x+3−1 (−1)2−8(−1)+3 = 120 (0)2−8(0)+3 = 31 (1)2−8(1)+3 =−40 (0)2−8(0)+3 = 31 (1)2−8(1)+3 =−42 (2)2−8(2)+3 =−93 (3)2−8(3)+3 =−124 (4)2−8(4)+3 =−135 (5)2−8(5)+3 =−126 (6)2−8(6)+3 =−97 (7)2−8(7)+3 =−48 (8)2−8(8)+3 = 3
10.1. GRAPHS OF QUADRATIC FUNCTIONS
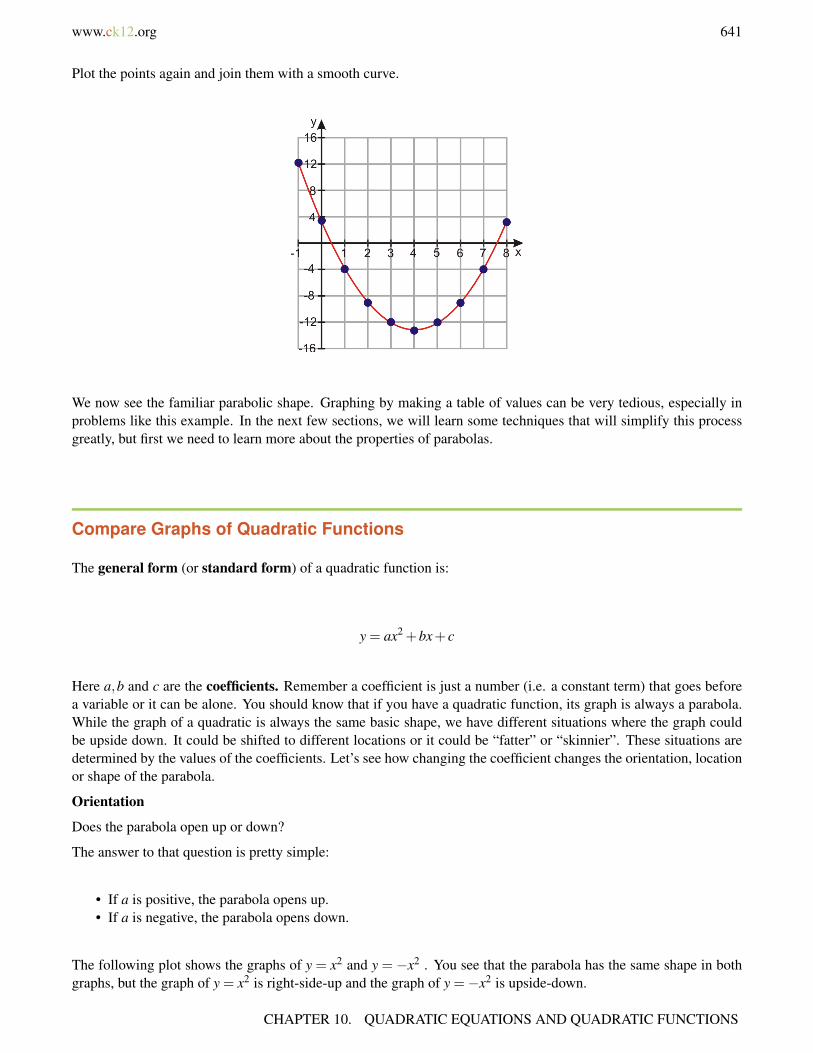
www.ck12.org 641
Plot the points again and join them with a smooth curve.
We now see the familiar parabolic shape. Graphing by making a table of values can be very tedious, especially inproblems like this example. In the next few sections, we will learn some techniques that will simplify this processgreatly, but first we need to learn more about the properties of parabolas.
Compare Graphs of Quadratic Functions
The general form (or standard form) of a quadratic function is:
y = ax2 +bx+ c
Here a,b and c are the coefficients. Remember a coefficient is just a number (i.e. a constant term) that goes beforea variable or it can be alone. You should know that if you have a quadratic function, its graph is always a parabola.While the graph of a quadratic is always the same basic shape, we have different situations where the graph couldbe upside down. It could be shifted to different locations or it could be “fatter” or “skinnier”. These situations aredetermined by the values of the coefficients. Let’s see how changing the coefficient changes the orientation, locationor shape of the parabola.
Orientation
Does the parabola open up or down?
The answer to that question is pretty simple:
• If a is positive, the parabola opens up.• If a is negative, the parabola opens down.
The following plot shows the graphs of y = x2 and y = −x2 . You see that the parabola has the same shape in bothgraphs, but the graph of y = x2 is right-side-up and the graph of y =−x2 is upside-down.
CHAPTER 10. QUADRATIC EQUATIONS AND QUADRATIC FUNCTIONS
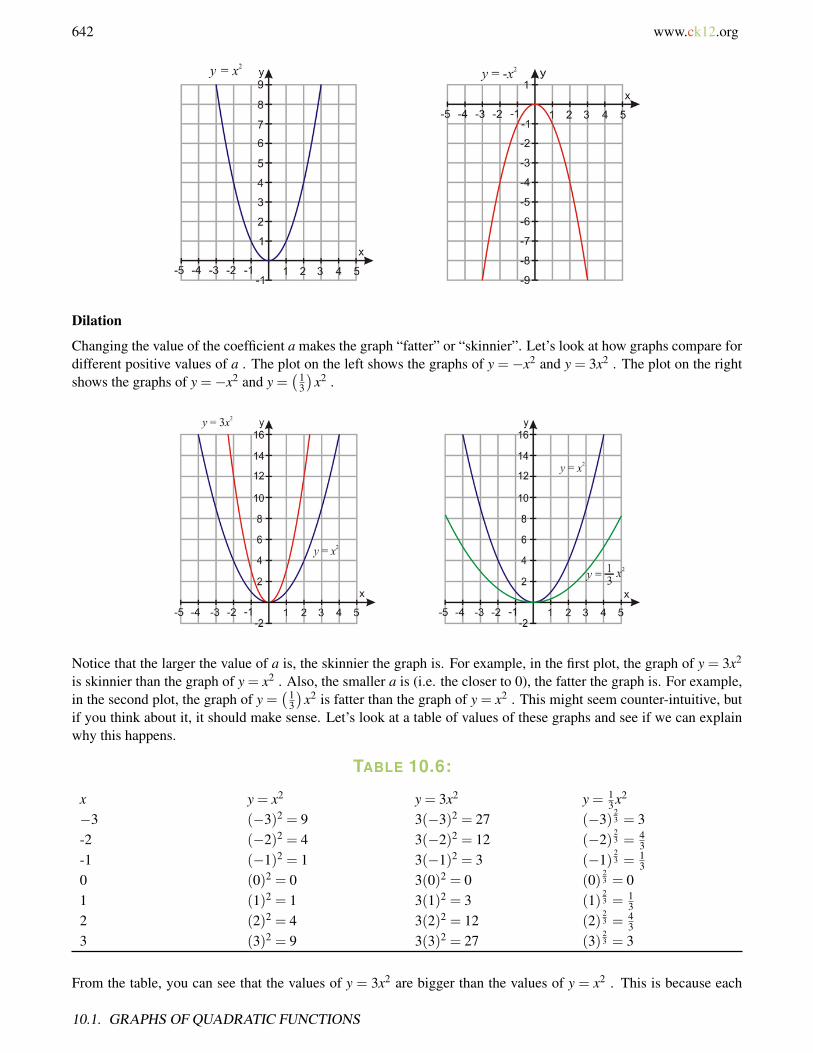
642 www.ck12.org
Dilation
Changing the value of the coefficient a makes the graph “fatter” or “skinnier”. Let’s look at how graphs compare fordifferent positive values of a . The plot on the left shows the graphs of y =−x2 and y = 3x2 . The plot on the rightshows the graphs of y =−x2 and y =
(13
)x2 .
Notice that the larger the value of a is, the skinnier the graph is. For example, in the first plot, the graph of y = 3x2
is skinnier than the graph of y = x2 . Also, the smaller a is (i.e. the closer to 0), the fatter the graph is. For example,in the second plot, the graph of y =
(13
)x2 is fatter than the graph of y = x2 . This might seem counter-intuitive, but
if you think about it, it should make sense. Let’s look at a table of values of these graphs and see if we can explainwhy this happens.
TABLE 10.6:
x y = x2 y = 3x2 y = 13 x2
−3 (−3)2 = 9 3(−3)2 = 27 (−3)23 = 3
-2 (−2)2 = 4 3(−2)2 = 12 (−2)23 = 4
3-1 (−1)2 = 1 3(−1)2 = 3 (−1)
23 = 1
30 (0)2 = 0 3(0)2 = 0 (0)
23 = 0
1 (1)2 = 1 3(1)2 = 3 (1)23 = 1
32 (2)2 = 4 3(2)2 = 12 (2)
23 = 4
33 (3)2 = 9 3(3)2 = 27 (3)
23 = 3
From the table, you can see that the values of y = 3x2 are bigger than the values of y = x2 . This is because each
10.1. GRAPHS OF QUADRATIC FUNCTIONS

www.ck12.org 643
value of y gets multiplied by 3. As a result, the parabola will be skinnier because it grows three times faster thany = x2 . On the other hand, you can see that the values of y =
(13
)x2 are smaller than the values of y = x2 . This is
because each value of y gets divided by 3. As a result, the parabola will be fatter because it grows at one third therate of y = x2 .
Vertical Shift
Changing the value of the coefficient c (called the constant term) has the effect of moving the parabola up and down.The following plot shows the graphs of y = x2,y = x2 +1,y = x2−1,y = x2 +2,y = x2−2 .
We see that if c is positive, the graph moves up by c units. If c is negative, the graph moves down by c units. In oneof the later sections we will also talk about horizontal shift (i.e. moving to the right or to the left). Before we cando that we need to learn how to rewrite the quadratic equations in different forms.
Graph Quadratic Functions in Intercept Form
As you saw, in order to get a good graph of a parabola, we sometimes need to pick a lot of points in our table ofvalues. Now, we will talk about different properties of a parabola that will make the graphing process less tedious.Let’s look at the graph of y = x2−6x+8 .
There are several things that we notice.
1. The parabola crosses the x axis at two points: x = 2 and x = 4 .
• These points are called the x− intercepts of the parabola.
2. The lowest point of the parabola occurs at point (3, -1).
• This point is called the vertex of the parabola.• The vertex is the lowest point in a parabola that turns upward, and it is the highest point in a parabola that
turns downward.• The vertex is exactly halfway between the two x− intercepts. This will always be the case and you can find
the vertex using that rule.
CHAPTER 10. QUADRATIC EQUATIONS AND QUADRATIC FUNCTIONS

644 www.ck12.org
3. A parabola is symmetric. If you draw a vertical line through the vertex, you can see that the two halves of theparabola are mirror images of each other. The vertical line is called the line of symmetry.
We said that the general form of a quadratic function is y = ax2 +bx+ c . If we can factor the quadratic expression,we can rewrite the function in intercept form
y = a(x−m)(x−n)
This form is very useful because it makes it easy for us to find the x− intercepts and the vertex of the parabola. Thex− intercepts are the values of x where the graph crosses the x− axis. In other words, they are the values of x wheny = 0 . To find the x− intercepts from the quadratic function, we set y = 0 and solve.
0 = a(x−m)(x−n)
Since the equation is already factored, we use the zero-product property to set each factor equal to zero and solvethe individual linear equations.
x−m = 0 x−n = 0
or
x = m x = n
So the x− intercepts are at points (m,0) and (n,0) .
Once we find the x− intercepts, it is simple to find the vertex. The x− coordinate of the vertex is halfway betweenthe two x intercepts, so we can find it by taking the average of the two values (m+n)
2 .
The y− value can be found by substituting the value of x back into the equation of the function.
Let’s do some examples that find the x− intercepts and the vertex:
Example 2
10.1. GRAPHS OF QUADRATIC FUNCTIONS
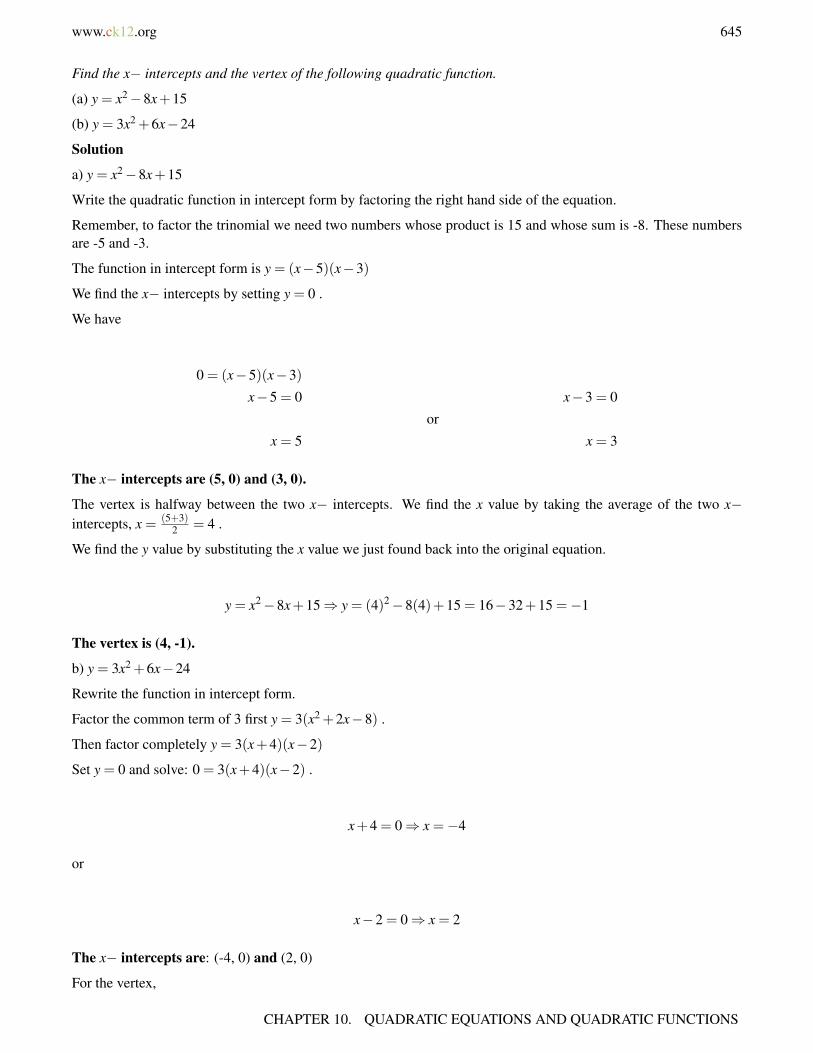
www.ck12.org 645
Find the x− intercepts and the vertex of the following quadratic function.
(a) y = x2−8x+15
(b) y = 3x2 +6x−24
Solution
a) y = x2−8x+15
Write the quadratic function in intercept form by factoring the right hand side of the equation.
Remember, to factor the trinomial we need two numbers whose product is 15 and whose sum is -8. These numbersare -5 and -3.
The function in intercept form is y = (x−5)(x−3)
We find the x− intercepts by setting y = 0 .
We have
0 = (x−5)(x−3)
x−5 = 0 x−3 = 0
or
x = 5 x = 3
The x− intercepts are (5, 0) and (3, 0).
The vertex is halfway between the two x− intercepts. We find the x value by taking the average of the two x−intercepts, x = (5+3)
2 = 4 .
We find the y value by substituting the x value we just found back into the original equation.
y = x2−8x+15⇒ y = (4)2−8(4)+15 = 16−32+15 =−1
The vertex is (4, -1).
b) y = 3x2 +6x−24
Rewrite the function in intercept form.
Factor the common term of 3 first y = 3(x2 +2x−8) .
Then factor completely y = 3(x+4)(x−2)
Set y = 0 and solve: 0 = 3(x+4)(x−2) .
x+4 = 0⇒ x =−4
or
x−2 = 0⇒ x = 2
The x− intercepts are: (-4, 0) and (2, 0)
For the vertex,
CHAPTER 10. QUADRATIC EQUATIONS AND QUADRATIC FUNCTIONS
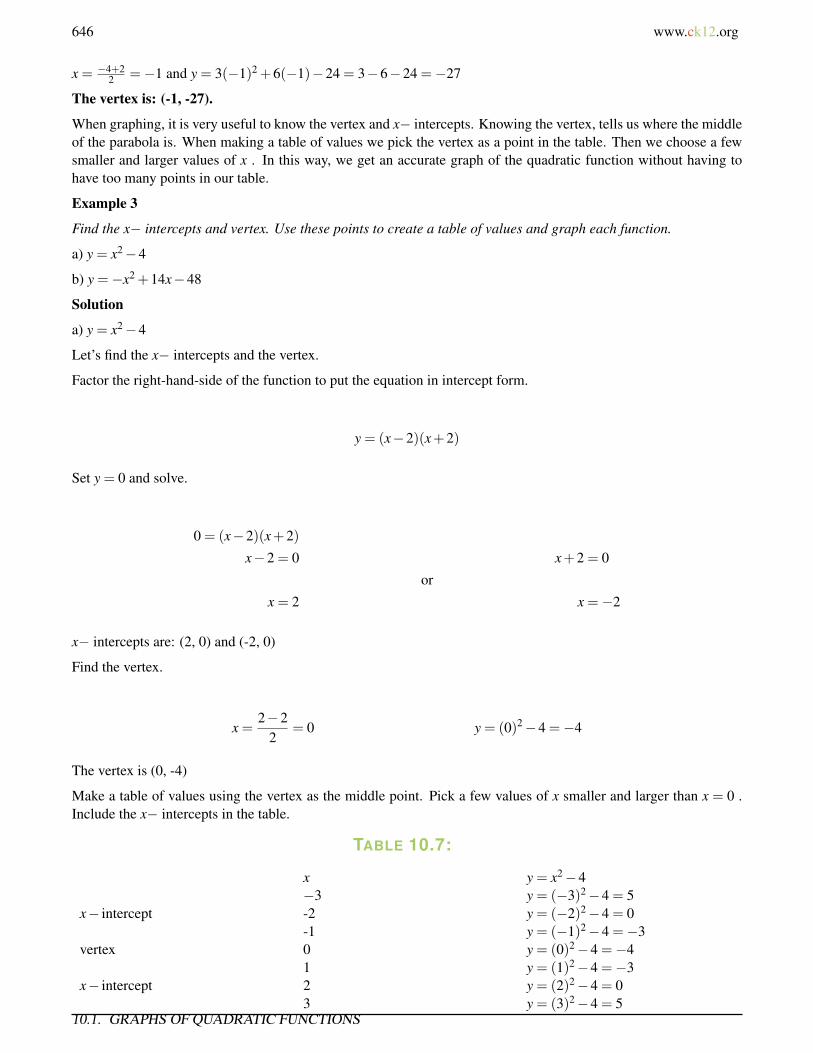
646 www.ck12.org
x = −4+22 =−1 and y = 3(−1)2 +6(−1)−24 = 3−6−24 =−27
The vertex is: (-1, -27).
When graphing, it is very useful to know the vertex and x− intercepts. Knowing the vertex, tells us where the middleof the parabola is. When making a table of values we pick the vertex as a point in the table. Then we choose a fewsmaller and larger values of x . In this way, we get an accurate graph of the quadratic function without having tohave too many points in our table.
Example 3
Find the x− intercepts and vertex. Use these points to create a table of values and graph each function.
a) y = x2−4
b) y =−x2 +14x−48
Solution
a) y = x2−4
Let’s find the x− intercepts and the vertex.
Factor the right-hand-side of the function to put the equation in intercept form.
y = (x−2)(x+2)
Set y = 0 and solve.
0 = (x−2)(x+2)
x−2 = 0 x+2 = 0
or
x = 2 x =−2
x− intercepts are: (2, 0) and (-2, 0)
Find the vertex.
x =2−2
2= 0 y = (0)2−4 =−4
The vertex is (0, -4)
Make a table of values using the vertex as the middle point. Pick a few values of x smaller and larger than x = 0 .Include the x− intercepts in the table.
TABLE 10.7:
x y = x2−4−3 y = (−3)2−4 = 5
x− intercept -2 y = (−2)2−4 = 0-1 y = (−1)2−4 =−3
vertex 0 y = (0)2−4 =−41 y = (1)2−4 =−3
x− intercept 2 y = (2)2−4 = 03 y = (3)2−4 = 5
10.1. GRAPHS OF QUADRATIC FUNCTIONS
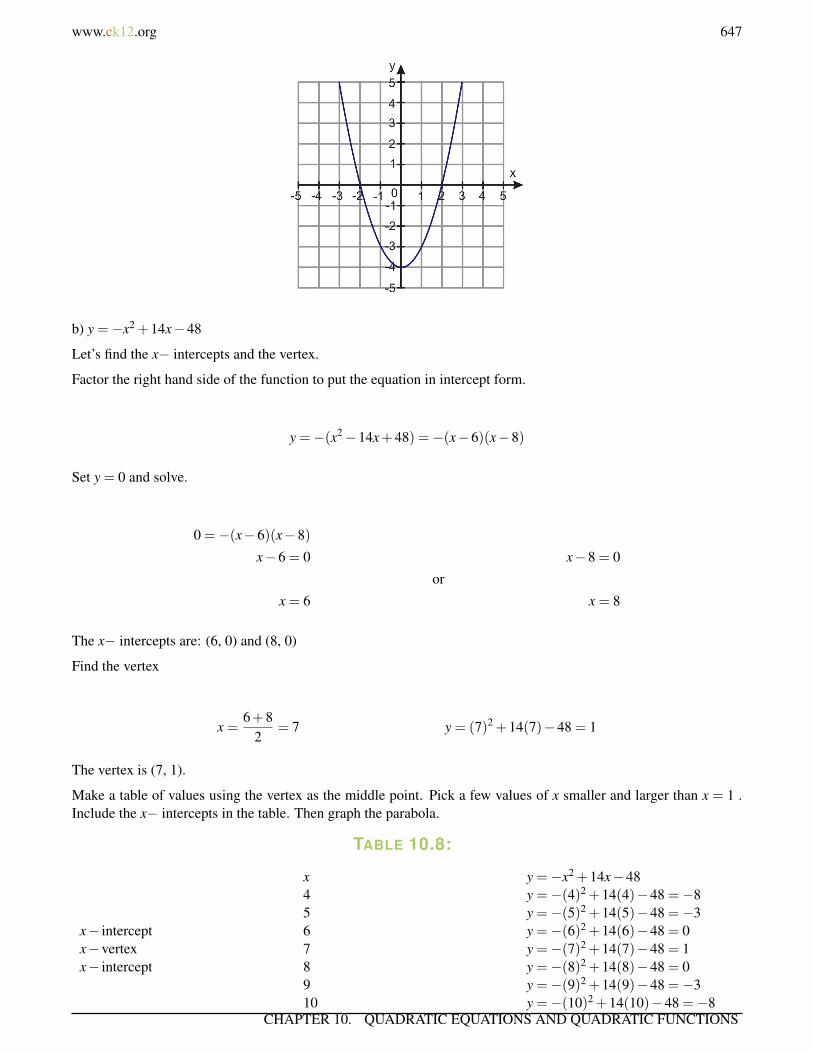
www.ck12.org 647
b) y =−x2 +14x−48
Let’s find the x− intercepts and the vertex.
Factor the right hand side of the function to put the equation in intercept form.
y =−(x2−14x+48) =−(x−6)(x−8)
Set y = 0 and solve.
0 =−(x−6)(x−8)
x−6 = 0 x−8 = 0
or
x = 6 x = 8
The x− intercepts are: (6, 0) and (8, 0)
Find the vertex
x =6+8
2= 7 y = (7)2 +14(7)−48 = 1
The vertex is (7, 1).
Make a table of values using the vertex as the middle point. Pick a few values of x smaller and larger than x = 1 .Include the x− intercepts in the table. Then graph the parabola.
TABLE 10.8:
x y =−x2 +14x−484 y =−(4)2 +14(4)−48 =−85 y =−(5)2 +14(5)−48 =−3
x− intercept 6 y =−(6)2 +14(6)−48 = 0x−vertex 7 y =−(7)2 +14(7)−48 = 1x− intercept 8 y =−(8)2 +14(8)−48 = 0
9 y =−(9)2 +14(9)−48 =−310 y =−(10)2 +14(10)−48 =−8
CHAPTER 10. QUADRATIC EQUATIONS AND QUADRATIC FUNCTIONS

648 www.ck12.org
Analyze Graphs of Real-World Quadratic Functions.
As we mentioned at the beginning of this section, parabolic curves are common in real-world applications. Here wewill look at a few graphs that represent some examples of real-life application of quadratic functions.
Example 4 Area
Andrew has 100 feet of fence to enclose a rectangular tomato patch. He wants to find the dimensions of the rectanglethat encloses most area.
Solution
We can find an equation for the area of the rectangle by looking at a sketch of the situation.
Let x be the length of the rectangle.
50− x is the width of the rectangle (Remember there are two widths so its not 100− x ).
Let y be the area of the rectangle.
Area = length×width⇒ y = x(50− x)
The following graph shows how the area of the rectangle depends on the length of the rectangle
10.1. GRAPHS OF QUADRATIC FUNCTIONS

www.ck12.org 649
We can see from the graph that the highest value of the area occurs when the length of the rectangle is 25. The areaof the rectangle for this side length equals 625. Notice that the width is also 25, which makes the shape a squarewith side length 25.
This is an example of an optimization problem.
Example 5 Projectile motion
Anne is playing golf. On the 4th tee, she hits a slow shot down the level fairway. The ball follows a parabolic pathdescribed by the equation, y = x−0.04x2 . This relates the height of the ball y to the horizontal distance as the balltravels down the fairway. The distances are measured in feet. How far from the tee does the ball hit the ground? Atwhat distance, x from the tee, does the ball attain its maximum height? What is the maximum height?
Solution
Let’s graph the equation of the path of the ball: y = x−0.04x2 .
y = x(1−0.04x) has solutions of x = 0 and x = 25
From the graph, we see that the ball hits the ground 25 feet from the tee.
We see that the maximum height is attained at 12.5 feet from the tee and the maximum height the ball reaches is6.25 feet.
CHAPTER 10. QUADRATIC EQUATIONS AND QUADRATIC FUNCTIONS

650 www.ck12.org
Review Questions
Rewrite the following functions in intercept form. Find the x− intercepts and the vertex.
1. y = x2−2x−82. y =−x2 +10x−213. y = 2x2 +6x+4
Does the graph of the parabola turn up or down?
4. y =−2x2−2x−35. y = 3x2
6. y = 16−4x2
The vertex of which parabola is higher?
7. y = x2 or y = 4x2
8. y =−2x2 or y =−2x2−29. y = 3x2−3 or y = 3x2−6
Which parabola is wider?
10. y = x2 or y = 4x2
11. y = 2x2 +4 or y = 12 x2 +4
12. y =−2x2−2 or y =−x2−2
Graph the following functions by making a table of values. Use the vertex and x− intercepts to help you pick valuesfor the table.
13. y = 4x2−414. y =−x2 + x+1215. y = 2x2 +10x+816. y = 1
2 x2−2x17. y = x−2x2
18. y = 4x2−8x+419. Nadia is throwing a ball to Peter. Peter does not catch the ball and it hits the ground. The graph shows the
path of the ball as it flies through the air. The equation that describes the path of the ball is y = 4+2x−0.16x2
. Here y is the height of the ball and x is the horizontal distance from Nadia. Both distances are measured infeet. How far from Nadia does the ball hit the ground? At what distance, x from Nadia, does the ball attain itsmaximum height? What is the maximum height?
10.1. GRAPHS OF QUADRATIC FUNCTIONS

www.ck12.org 651
20. Peter wants to enclose a vegetable patch with 120 feet of fencing. He wants to put the vegetable against anexisting wall, so he only needs fence for three of the sides. The equation for the area is given by a = 120x−x2
. From the graph find what dimensions of the rectangle would give him the greatest area.
Review Answers
1. x =−2,x = 4 Vertex (1, -9)2. x = 3,x = 7 Vertex (5, 4)3. x =−2,x =−1 Vertex (-3.5, 7.5)4. Down5. Up6. Down7. y = x2 +48. y =−2x2
9. y = 3x2−310. y = x2
11. y =(1
2
)x2 +4
12. y =−x2−2
CHAPTER 10. QUADRATIC EQUATIONS AND QUADRATIC FUNCTIONS
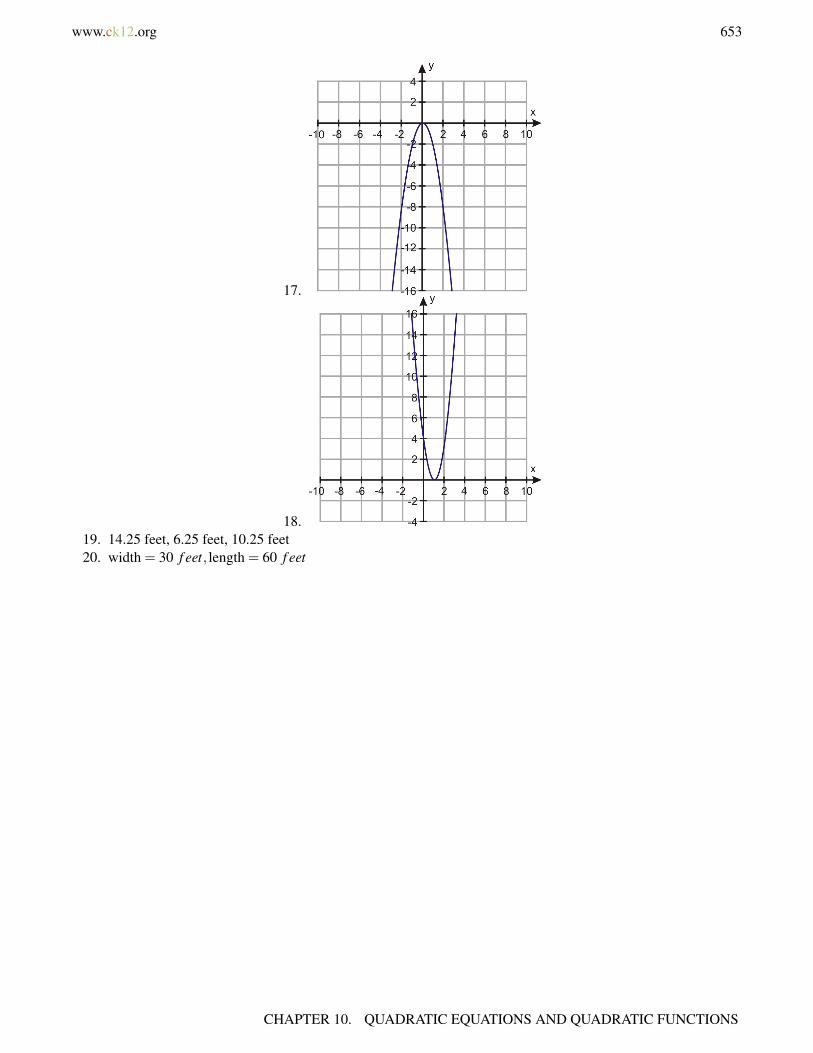
www.ck12.org 653
17.
18.19. 14.25 feet, 6.25 feet, 10.25 feet20. width = 30 f eet, length = 60 f eet
CHAPTER 10. QUADRATIC EQUATIONS AND QUADRATIC FUNCTIONS

654 www.ck12.org
10.2 Quadratic Equations by Graphing
Learning Objectives
• Identify the number of solutions of quadratic equations.• Solve quadratic equations by graphing.• Find or approximate zeros of quadratic functions.• Analyze quadratic functions using a graphing calculators.• Solve real-world problems by graphing quadratic functions.
Introduction
In the last, section you learned how to graph quadratic equations. You saw that finding the x− intercepts of a parabolais important because it tells us where the graph crosses the x− axis. and it also lets us find the vertex of the parabola.When we are asked to find the solutions of the quadratic equation in the form ax2 + bx+ c = 0 , we are basicallyasked to find the x− intercepts of the quadratic function.
Finding the x− intercepts of a parabola is also called finding the roots or zeros of the function.
Identify the Number of Solutions of Quadratic Equations
The graph of a quadratic equation is very useful in helping us identify how many solutions and what types ofsolutions a function has. There are three different situations that occur when graphing a quadratic function.
Case 1 The parabola crosses the x− axis at two points.
An example of this is y = x2 + x−6 .
10.2. QUADRATIC EQUATIONS BY GRAPHING
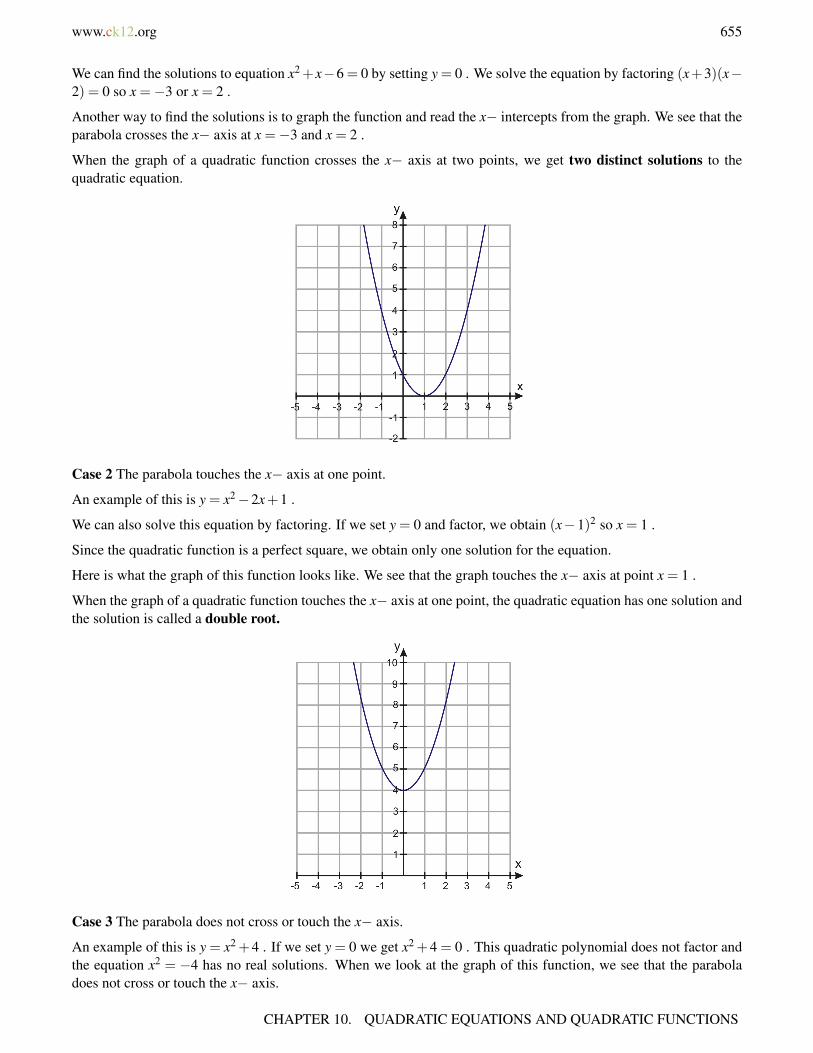
www.ck12.org 655
We can find the solutions to equation x2+x−6 = 0 by setting y = 0 . We solve the equation by factoring (x+3)(x−2) = 0 so x =−3 or x = 2 .
Another way to find the solutions is to graph the function and read the x− intercepts from the graph. We see that theparabola crosses the x− axis at x =−3 and x = 2 .
When the graph of a quadratic function crosses the x− axis at two points, we get two distinct solutions to thequadratic equation.
Case 2 The parabola touches the x− axis at one point.
An example of this is y = x2−2x+1 .
We can also solve this equation by factoring. If we set y = 0 and factor, we obtain (x−1)2 so x = 1 .
Since the quadratic function is a perfect square, we obtain only one solution for the equation.
Here is what the graph of this function looks like. We see that the graph touches the x− axis at point x = 1 .
When the graph of a quadratic function touches the x− axis at one point, the quadratic equation has one solution andthe solution is called a double root.
Case 3 The parabola does not cross or touch the x− axis.
An example of this is y = x2 +4 . If we set y = 0 we get x2 +4 = 0 . This quadratic polynomial does not factor andthe equation x2 = −4 has no real solutions. When we look at the graph of this function, we see that the paraboladoes not cross or touch the x− axis.
CHAPTER 10. QUADRATIC EQUATIONS AND QUADRATIC FUNCTIONS

656 www.ck12.org
When the graph of a quadratic function does not cross or touch the x− axis, the quadratic equation has no realsolutions.
Solve Quadratic Equations by Graphing.
So far we have found the solutions to graphing equations using factoring. However, there are very few functions inreal life that factor easily. As you just saw, graphing the function gives a lot of information about the solutions. Wecan find exact or approximate solutions to quadratic equations by graphing the function associated with it.
Example 1
Find the solutions to the following quadratic equations by graphing.
a) −x2 +3 = 0
b) 2x2 +5x−7 = 0
c) −x2 + x−3 = 0
Solution
Let’s graph each equation. Unfortunately none of these functions can be rewritten in intercept form because wecannot factor the right hand side. This means that you cannot find the x− intercept and vertex before graphing sinceyou have not learned methods other than factoring to do that.
a) To find the solution to −x2 +3 = 0 , we need to find the x− intercepts of y =−x2 +3 .
Let’s make a table of values so we can graph the function.
TABLE 10.9:
x y =−x2 +3−3 y =−(−3)2 +3 =−6-2 y =−(−2)2 +3 =−1-1 y =−(−1)2 +3 = 20 y =−(0)2 +3 = 31 y =−(−1)2 +3 = 22 y =−(2)2 +3 =−13 y =−(3)2 +3 =−6
We plot the points and get the following graph:
10.2. QUADRATIC EQUATIONS BY GRAPHING

www.ck12.org 657
From the graph we can read that the x− intercepts are approximately x = 1.7 and x =−1.7 .
These are the solutions to the equation −x2 +3 = 0 .
b) To solve the equation 2x2 +5x−7 = 0 we need to find the x− intercepts of y = 2x2 +5−7.
Let’s make a table of values so we can graph the function.
TABLE 10.10:
x y = 2x2 +5x−7−3 y = 2(−3)2 +5(−3)−7 =−4-2 y = 2(−2)2 +5(−2)−7 =−9-1 y = 2(−1)2 +5(−1)−7 =−100 y = 2(0)0 +5(0)−7 =−71 y = 2(1)2 +5(1)−7 = 02 y = 2(2)2 +5(2)−7 = 113 y = 2(3)2 +5(3)−7 = 26
We plot the points and get the following graph:
Since we can only see one x− intercept on this graph, we need to pick more points smaller than x =−3 and re-drawthe graph.
TABLE 10.11:
x y = 2x2 +5x−7−5 y = 2(−5)2 +5(−5)−7 = 18-4 y = 2(−4)2 +5(−4)−7 = 5
Here is the graph again with both x− intercepts showing:
CHAPTER 10. QUADRATIC EQUATIONS AND QUADRATIC FUNCTIONS
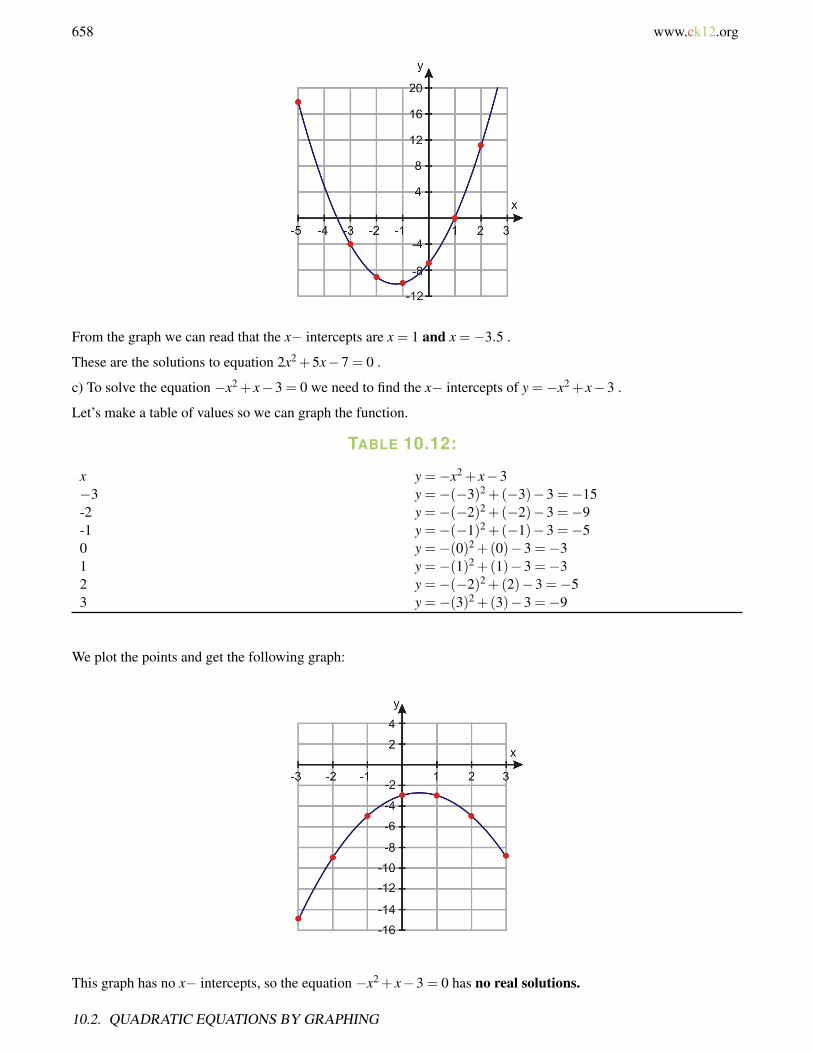
658 www.ck12.org
From the graph we can read that the x− intercepts are x = 1 and x =−3.5 .
These are the solutions to equation 2x2 +5x−7 = 0 .
c) To solve the equation −x2 + x−3 = 0 we need to find the x− intercepts of y =−x2 + x−3 .
Let’s make a table of values so we can graph the function.
TABLE 10.12:
x y =−x2 + x−3−3 y =−(−3)2 +(−3)−3 =−15-2 y =−(−2)2 +(−2)−3 =−9-1 y =−(−1)2 +(−1)−3 =−50 y =−(0)2 +(0)−3 =−31 y =−(1)2 +(1)−3 =−32 y =−(−2)2 +(2)−3 =−53 y =−(3)2 +(3)−3 =−9
We plot the points and get the following graph:
This graph has no x− intercepts, so the equation −x2 + x−3 = 0 has no real solutions.
10.2. QUADRATIC EQUATIONS BY GRAPHING
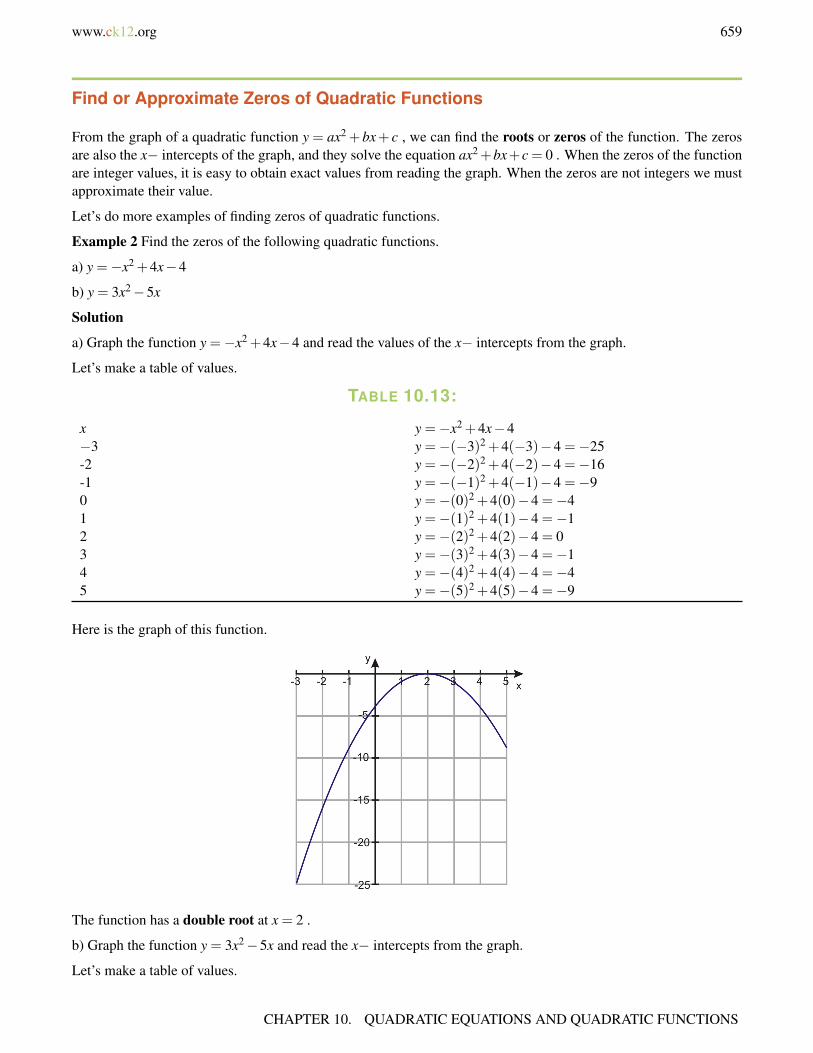
www.ck12.org 659
Find or Approximate Zeros of Quadratic Functions
From the graph of a quadratic function y = ax2 +bx+ c , we can find the roots or zeros of the function. The zerosare also the x− intercepts of the graph, and they solve the equation ax2+bx+c = 0 . When the zeros of the functionare integer values, it is easy to obtain exact values from reading the graph. When the zeros are not integers we mustapproximate their value.
Let’s do more examples of finding zeros of quadratic functions.
Example 2 Find the zeros of the following quadratic functions.
a) y =−x2 +4x−4
b) y = 3x2−5x
Solution
a) Graph the function y =−x2 +4x−4 and read the values of the x− intercepts from the graph.
Let’s make a table of values.
TABLE 10.13:
x y =−x2 +4x−4−3 y =−(−3)2 +4(−3)−4 =−25-2 y =−(−2)2 +4(−2)−4 =−16-1 y =−(−1)2 +4(−1)−4 =−90 y =−(0)2 +4(0)−4 =−41 y =−(1)2 +4(1)−4 =−12 y =−(2)2 +4(2)−4 = 03 y =−(3)2 +4(3)−4 =−14 y =−(4)2 +4(4)−4 =−45 y =−(5)2 +4(5)−4 =−9
Here is the graph of this function.
The function has a double root at x = 2 .
b) Graph the function y = 3x2−5x and read the x− intercepts from the graph.
Let’s make a table of values.
CHAPTER 10. QUADRATIC EQUATIONS AND QUADRATIC FUNCTIONS

660 www.ck12.org
TABLE 10.14:
x y = 3x2−5x−3 y = 3(−3)2−5(−3) = 42-2 y = 3(−2)2−5(−2) = 22-1 y = 3(−1)2−5(−1) = 80 y = 3(0)2−5(0) = 01 y = 3(1)2−5(1) =−22 y = 3(2)2−5(2) = 23 y = 3(3)2−5(3) = 12
Here is the graph of this function.
The function has two roots: x = 0 and x≈ 1.7.
Analyze Quadratic Functions Using a Graphing Calculator
A graphing calculator is very useful for graphing quadratic functions. Once the function is graphed, we can use thecalculator to find important information such as the roots of the function or the vertex of the function.
Example 3
Let’s use the graphing calculator to analyze the graph of y = x2−20x+35 .
1. Graph the function.
Press the [Y=] button and enter “ X2−20X +35 ” next to [ Y1 = ].(Note, X is one of the buttons on the calculator)
10.2. QUADRATIC EQUATIONS BY GRAPHING

www.ck12.org 661
Press the [GRAPH] button. This is the plot you should see. If this is not what you see change the window size. Forthe graph to the right, we used window size of XMIN = −10,XMAX = 30 and YMIN = −80,YMAX = 50 . Tochange window size, press the [WINDOW] button.
2. Find the roots.
There are at least three ways to find the roots
Use [TRACE] to scroll over the x− intercepts. The approximate value of the roots will be shown on the screen.Youcan improve your estimate by zooming in.
OR
Use [TABLE] and scroll through the values until you find values of Y equal to zero. You can change the accuracyof the solution by setting the step size with the [TBLSET] function.
OR
Use [2nd] [TRACE] (i.e. ‘calc’ button) and use option ‘zero’.
Move cursor to the left of one of the roots and press [ENTER].
Move cursor to the right of the same root and press [ENTER].
Move cursor close to the root and press [ENTER].
The screen will show the value of the root. For the left side root, we obtained x = 1.9 .
Repeat the procedure for the other root. For the right side root, we obtained x = 18 .
3. Find the vertex
There are three ways to find the vertex.
Use [TRACE] to scroll over the highest or lowest point on the graph. The approximate value of the roots will beshown on the screen.
OR
Use [TABLE] and scroll through the values until you find values the lowest or highest values of Y .
You can change the accuracy of the solution by setting the step size with the [TBLSET] function.
OR
Use [2nd] [TRACE] and use option ‘maximum’ if the vertex is a maximum or option ‘minimum’ if the vertex is aminimum.
CHAPTER 10. QUADRATIC EQUATIONS AND QUADRATIC FUNCTIONS
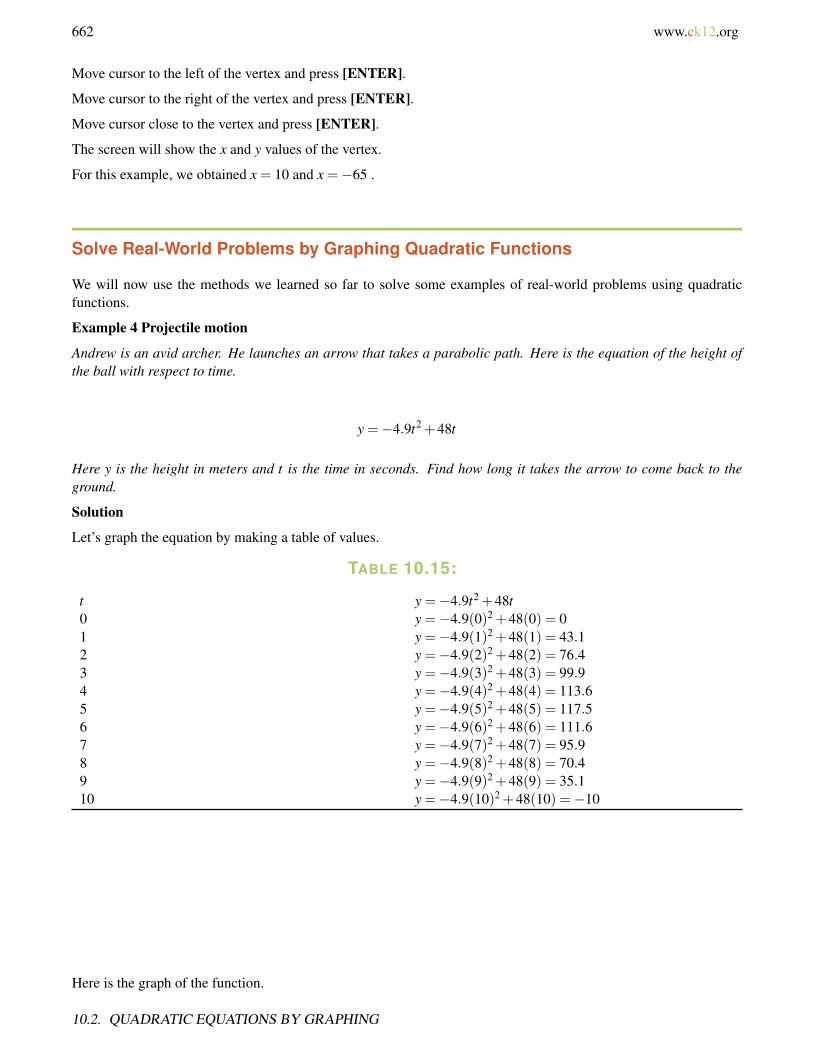
662 www.ck12.org
Move cursor to the left of the vertex and press [ENTER].
Move cursor to the right of the vertex and press [ENTER].
Move cursor close to the vertex and press [ENTER].
The screen will show the x and y values of the vertex.
For this example, we obtained x = 10 and x =−65 .
Solve Real-World Problems by Graphing Quadratic Functions
We will now use the methods we learned so far to solve some examples of real-world problems using quadraticfunctions.
Example 4 Projectile motion
Andrew is an avid archer. He launches an arrow that takes a parabolic path. Here is the equation of the height ofthe ball with respect to time.
y =−4.9t2 +48t
Here y is the height in meters and t is the time in seconds. Find how long it takes the arrow to come back to theground.
Solution
Let’s graph the equation by making a table of values.
TABLE 10.15:
t y =−4.9t2 +48t0 y =−4.9(0)2 +48(0) = 01 y =−4.9(1)2 +48(1) = 43.12 y =−4.9(2)2 +48(2) = 76.43 y =−4.9(3)2 +48(3) = 99.94 y =−4.9(4)2 +48(4) = 113.65 y =−4.9(5)2 +48(5) = 117.56 y =−4.9(6)2 +48(6) = 111.67 y =−4.9(7)2 +48(7) = 95.98 y =−4.9(8)2 +48(8) = 70.49 y =−4.9(9)2 +48(9) = 35.110 y =−4.9(10)2 +48(10) =−10
Here is the graph of the function.
10.2. QUADRATIC EQUATIONS BY GRAPHING
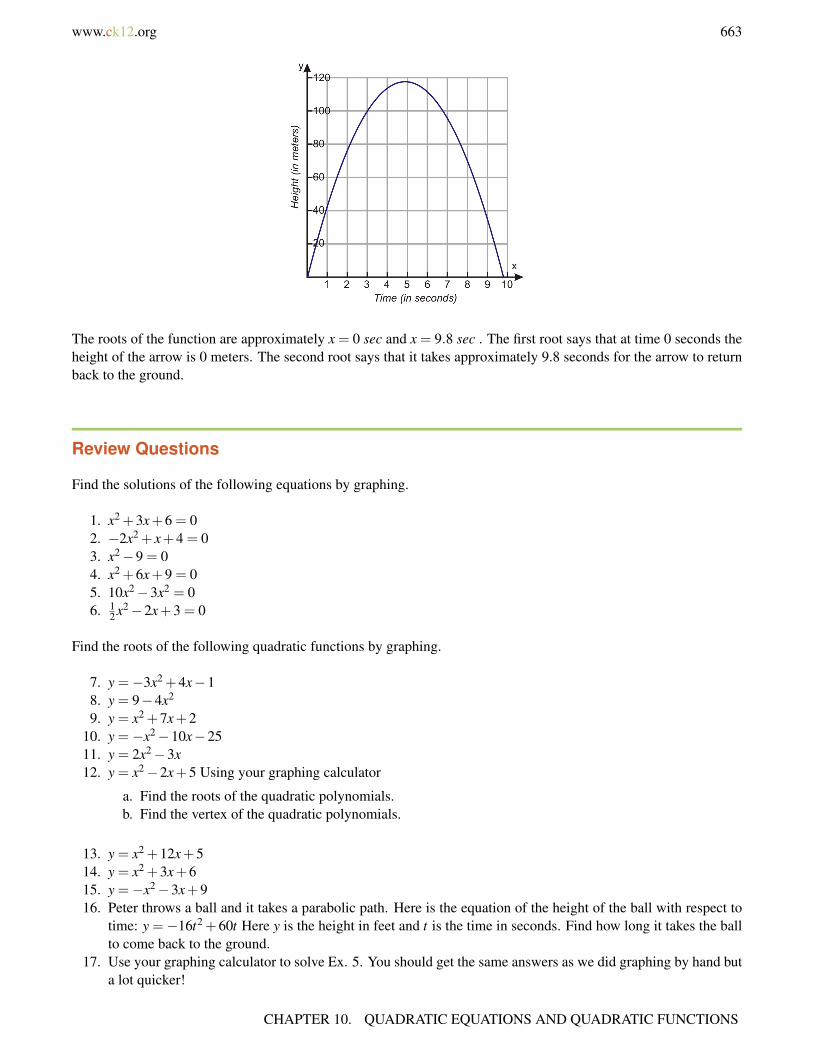
www.ck12.org 663
The roots of the function are approximately x = 0 sec and x = 9.8 sec . The first root says that at time 0 seconds theheight of the arrow is 0 meters. The second root says that it takes approximately 9.8 seconds for the arrow to returnback to the ground.
Review Questions
Find the solutions of the following equations by graphing.
1. x2 +3x+6 = 02. −2x2 + x+4 = 03. x2−9 = 04. x2 +6x+9 = 05. 10x2−3x2 = 06. 1
2 x2−2x+3 = 0
Find the roots of the following quadratic functions by graphing.
7. y =−3x2 +4x−18. y = 9−4x2
9. y = x2 +7x+210. y =−x2−10x−2511. y = 2x2−3x12. y = x2−2x+5 Using your graphing calculator
a. Find the roots of the quadratic polynomials.b. Find the vertex of the quadratic polynomials.
13. y = x2 +12x+514. y = x2 +3x+615. y =−x2−3x+916. Peter throws a ball and it takes a parabolic path. Here is the equation of the height of the ball with respect to
time: y =−16t2 +60t Here y is the height in feet and t is the time in seconds. Find how long it takes the ballto come back to the ground.
17. Use your graphing calculator to solve Ex. 5. You should get the same answers as we did graphing by hand buta lot quicker!
CHAPTER 10. QUADRATIC EQUATIONS AND QUADRATIC FUNCTIONS
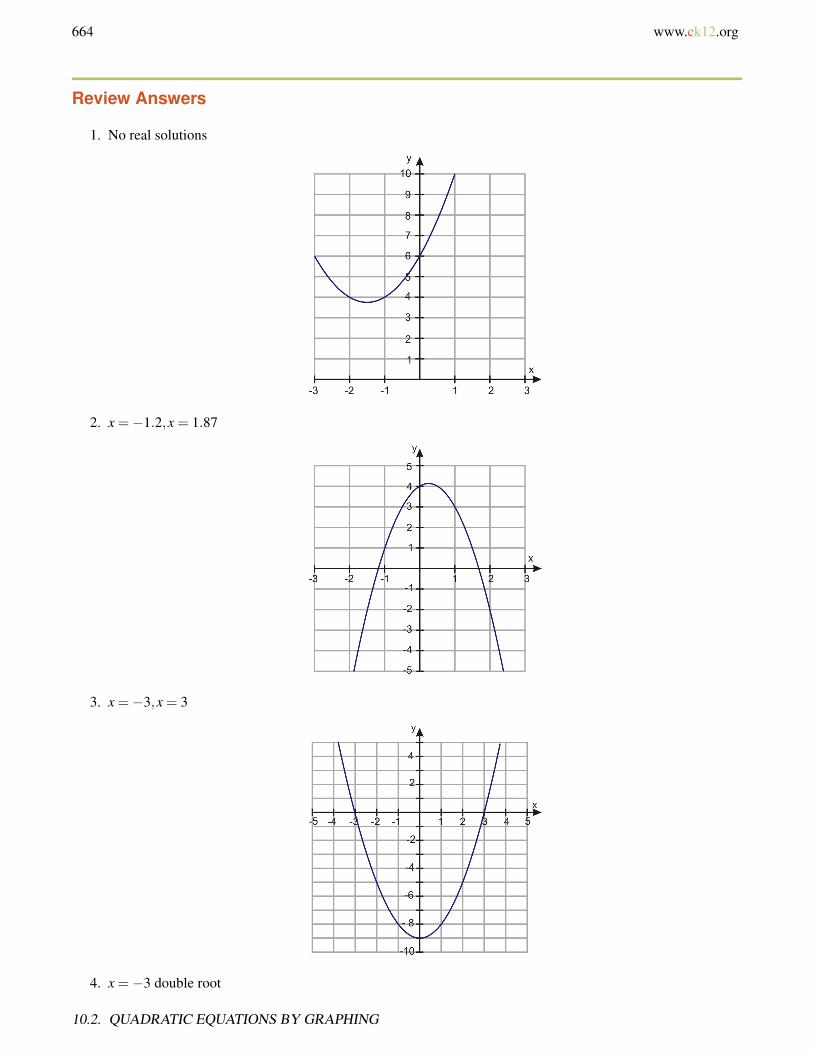
664 www.ck12.org
Review Answers
1. No real solutions
2. x =−1.2,x = 1.87
3. x =−3,x = 3
4. x =−3 double root
10.2. QUADRATIC EQUATIONS BY GRAPHING
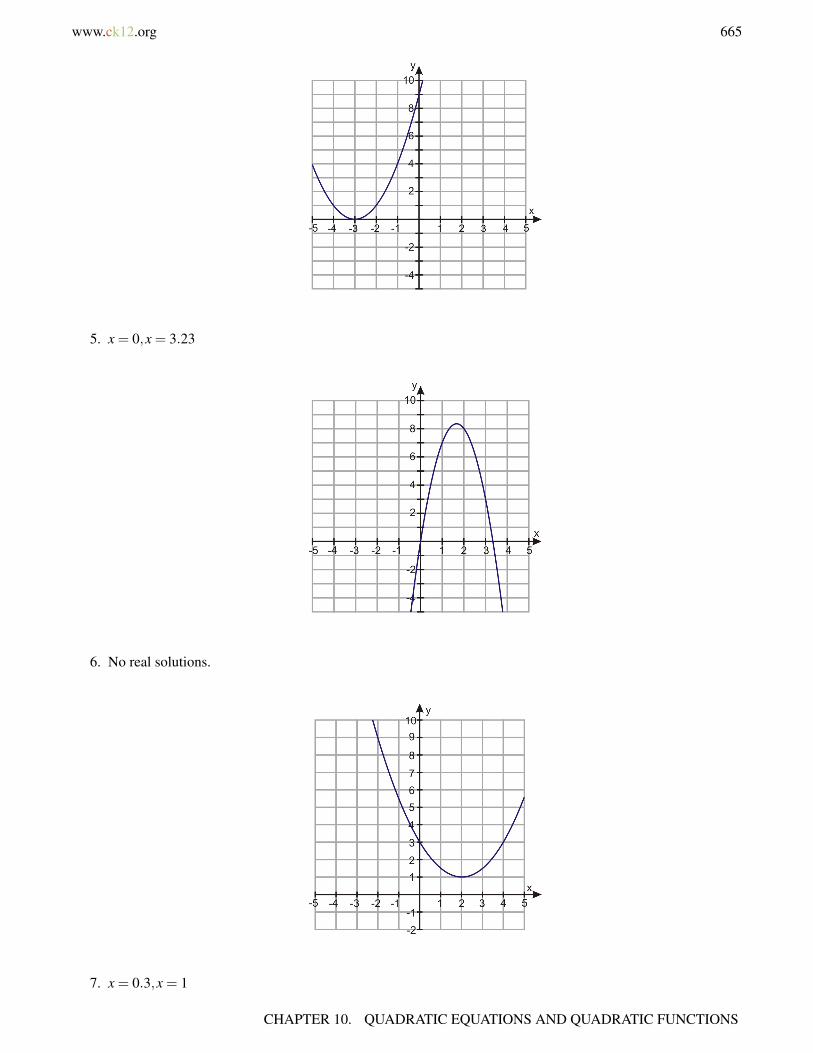
www.ck12.org 665
5. x = 0,x = 3.23
6. No real solutions.
7. x = 0.3,x = 1
CHAPTER 10. QUADRATIC EQUATIONS AND QUADRATIC FUNCTIONS
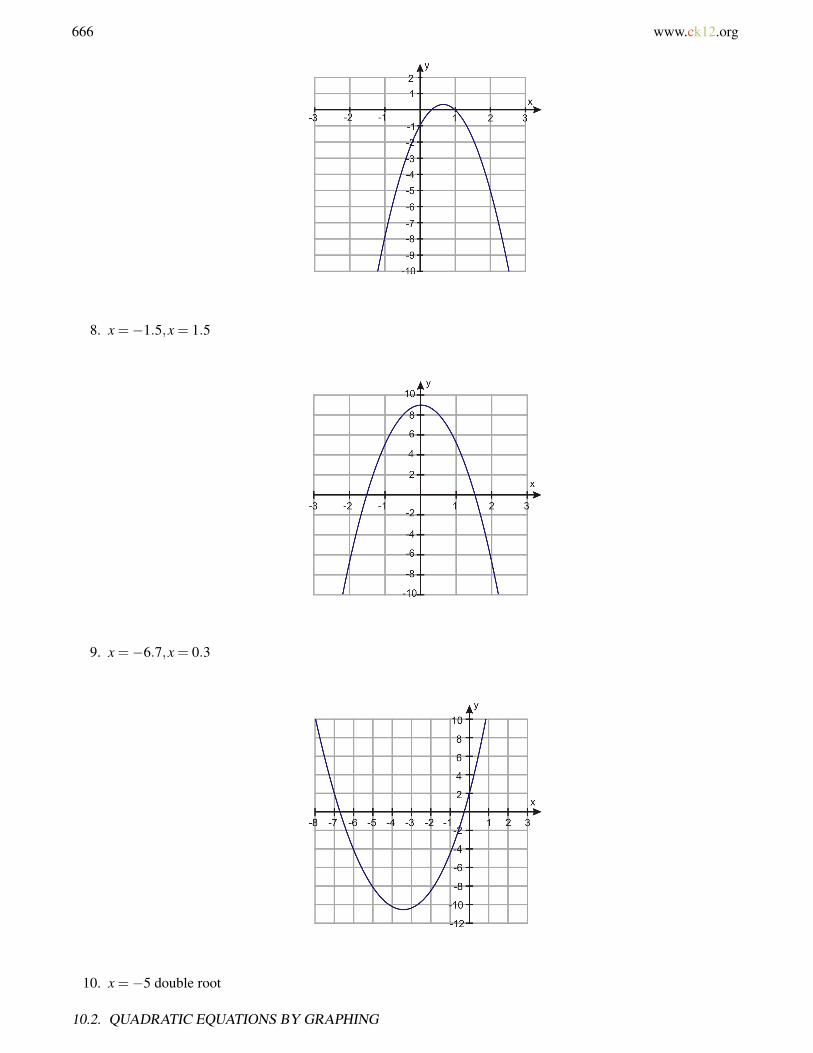
666 www.ck12.org
8. x =−1.5,x = 1.5
9. x =−6.7,x = 0.3
10. x =−5 double root
10.2. QUADRATIC EQUATIONS BY GRAPHING
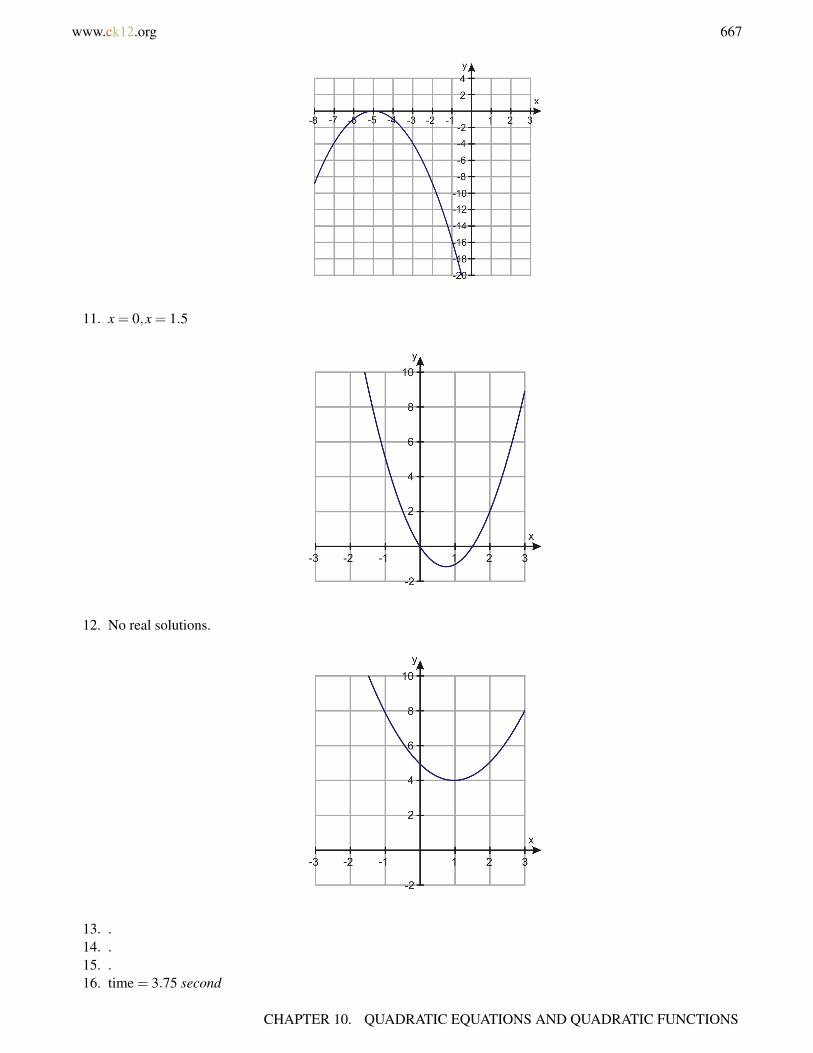
www.ck12.org 667
11. x = 0,x = 1.5
12. No real solutions.
13. .14. .15. .16. time = 3.75 second
CHAPTER 10. QUADRATIC EQUATIONS AND QUADRATIC FUNCTIONS
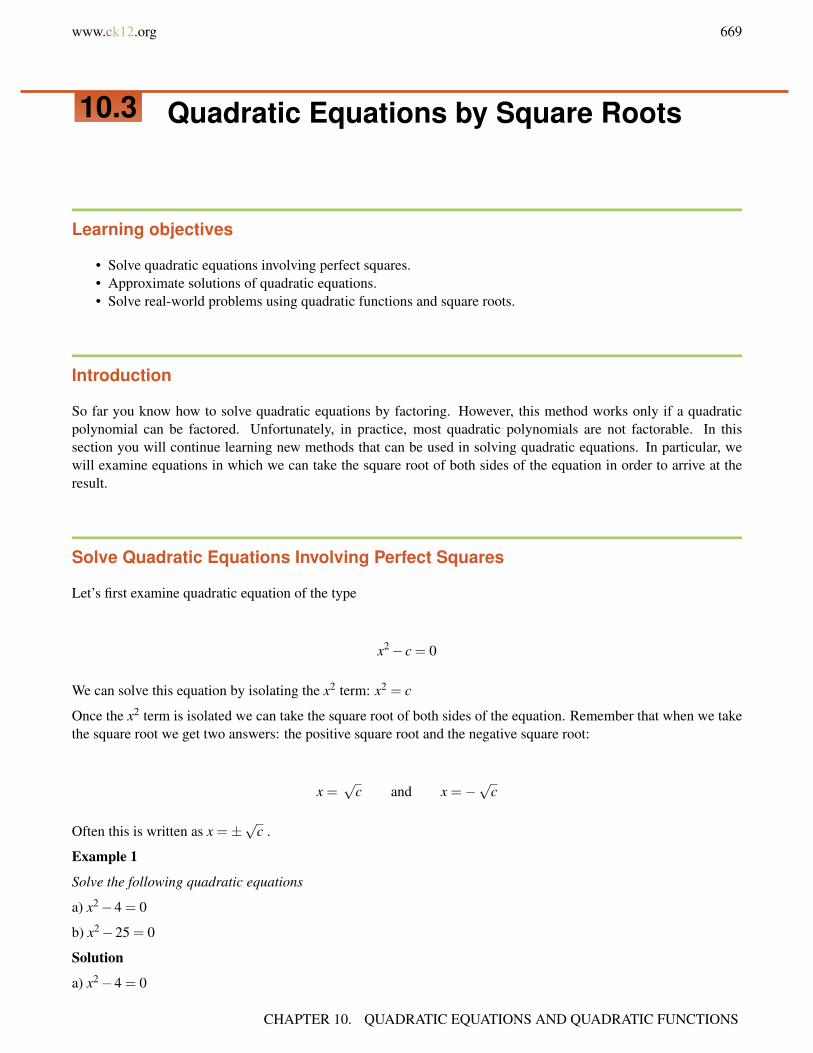
www.ck12.org 669
10.3 Quadratic Equations by Square Roots
Learning objectives
• Solve quadratic equations involving perfect squares.• Approximate solutions of quadratic equations.• Solve real-world problems using quadratic functions and square roots.
Introduction
So far you know how to solve quadratic equations by factoring. However, this method works only if a quadraticpolynomial can be factored. Unfortunately, in practice, most quadratic polynomials are not factorable. In thissection you will continue learning new methods that can be used in solving quadratic equations. In particular, wewill examine equations in which we can take the square root of both sides of the equation in order to arrive at theresult.
Solve Quadratic Equations Involving Perfect Squares
Let’s first examine quadratic equation of the type
x2− c = 0
We can solve this equation by isolating the x2 term: x2 = c
Once the x2 term is isolated we can take the square root of both sides of the equation. Remember that when we takethe square root we get two answers: the positive square root and the negative square root:
x =√
c and x =−√
c
Often this is written as x =±√
c .
Example 1
Solve the following quadratic equations
a) x2−4 = 0
b) x2−25 = 0
Solution
a) x2−4 = 0
CHAPTER 10. QUADRATIC EQUATIONS AND QUADRATIC FUNCTIONS

670 www.ck12.org
Isolate the x2 x2 = 4
Take the square root of both sides x =√
4 and x =−√
4
Answer x = 2 and x =−2
b) x2−25 = 0
Isolate the x2 x2 = 25
Take the square root of both sides x =√
25 and x =−√
25
Answer x = 5 and x =−5
Another type of equation where we can find the solution using the square root is
ax2− c = 0
We can solve this equation by isolating the x2 term
ax2 = c
x2 =ca
Now we can take the square root of both sides of the equation.
x =√
ca
and x =−√
ca
Often this is written as x =±√
ca
.
Example 2
Solve the following quadratic equations.
a) 9x2−16 = 0
b) 81x2−1 = 0
Solution
a) 9x2−16 = 0
Isolate the x2. 9x2 = 16
x2 =169
Take the square root of both sides. x =
√169
and x =−√
169
Answer: x = 43 and x =−4
3
10.3. QUADRATIC EQUATIONS BY SQUARE ROOTS
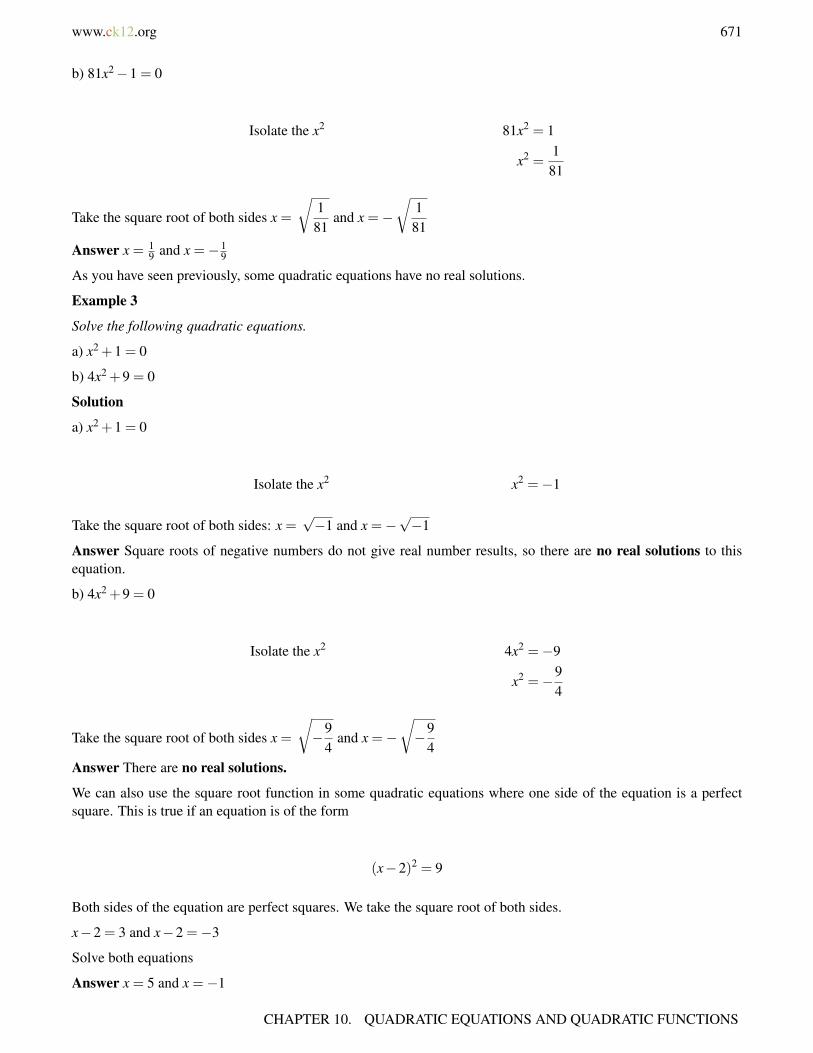
www.ck12.org 671
b) 81x2−1 = 0
Isolate the x2 81x2 = 1
x2 =1
81
Take the square root of both sides x =
√1
81and x =−
√181
Answer x = 19 and x =−1
9
As you have seen previously, some quadratic equations have no real solutions.
Example 3
Solve the following quadratic equations.
a) x2 +1 = 0
b) 4x2 +9 = 0
Solution
a) x2 +1 = 0
Isolate the x2 x2 =−1
Take the square root of both sides: x =√−1 and x =−
√−1
Answer Square roots of negative numbers do not give real number results, so there are no real solutions to thisequation.
b) 4x2 +9 = 0
Isolate the x2 4x2 =−9
x2 =−94
Take the square root of both sides x =
√−9
4and x =−
√−9
4Answer There are no real solutions.
We can also use the square root function in some quadratic equations where one side of the equation is a perfectsquare. This is true if an equation is of the form
(x−2)2 = 9
Both sides of the equation are perfect squares. We take the square root of both sides.
x−2 = 3 and x−2 =−3
Solve both equations
Answer x = 5 and x =−1
CHAPTER 10. QUADRATIC EQUATIONS AND QUADRATIC FUNCTIONS
672 www.ck12.org
Example 4
Solve the following quadratic equations.
a) (x−1)2 = 4
b) (x+3)2 = 1
Solution
a) (x−1)2 = 4
Take the square root of both sides. x−1 = 2 and x−1 =−2
Solve each equation. x = 3 and x =−1
Answer x = 3 and x =−1
b) (x+3)2 = 1
Take the square root of both sides. x+3 = 1 and x+3 =−1
Solve each equation. x =−2 and x =−4
It might be necessary to factor the right hand side of the equation as a perfect square before applying the methodoutlined above.
Example 5
Solve the following quadratic equations.
a) x2 +8x+16 = 25
b) 4x2−40x+25 = 9
Solution
a) x2 +8x+16 = 25
Factor the right hand side. x2 +8x+16 = (x+4)2 so (x+4)2 = 25
Take the square root of both sides. x+4 = 5 and x+4 =−5
Solve each equation. x = 1 and x =−9
Answer x = 1 and x =−9
b) 4x2−20x+25 = 9
Factor the right hand side. 4x2−20x+25 = (2x−5)2 so (2x−5)2 = 9
Take the square root of both sides. 2x−5 = 3 and 2x−5 =−3
Solve each equation. 2x = 8 and 2x = 2
Answer x = 4 and x = 1
10.3. QUADRATIC EQUATIONS BY SQUARE ROOTS

www.ck12.org 673
Approximate Solutions of Quadratic Equations
We use the methods we learned so far in this section to find approximate solutions to quadratic equations. We canget approximate solutions when taking the square root does not give an exact answer.
Example 6
Solve the following quadratic equations.
a) x2−3 = 0
b) 2x2−9 = 0
Solution
a)
Isolate the x2. x2 = 3
Take the square root of both sides. x =√
3 and x =−√
3
Answer x≈ 1.73 and x≈−1.73
b)
Isolate the x2. 2x2 = 9 so x2 =92
Take the square root of both sides. x =
√92
and x =−√
92
Answer x≈ 2.12 and x≈−2.12
Example 7
Solve the following quadratic equations.
a) (2x+5)2 = 10
b) x2−2x+1 = 5
Solution.
a)
Take the square root of both sides. 2x+5 =√
10 and 2x+5 =−√
10
Solve both equations. x =−5+
√10
2and x =
−5−√
102
Answer x≈−0.92 and x≈−4.08
b)
Factor the right hand side. (x−1)2 = 5
Take the square root of both sides. x−1 =√
5 and x−1 =−√
5
Solve each equation. x = 1+√
5 and x = 1−√
5
Answer x≈ 3.24 and x≈−1.24
CHAPTER 10. QUADRATIC EQUATIONS AND QUADRATIC FUNCTIONS
674 www.ck12.org
Solve Real-World Problems Using Quadratic Functions and Square Roots
There are many real-world problems that require the use of quadratic equations in order to arrive at the solution.In this section, we will examine problems about objects falling under the influence of gravity. When objects aredropped from a height, they have no initial velocity and the force that makes them move towards the ground is dueto gravity. The acceleration of gravity on earth is given by
g =−9.8 m/s2 or g =−32 f t/s2
The negative sign indicates a downward direction. We can assume that gravity is constant for the problems we willbe examining, because we will be staying close to the surface of the earth. The acceleration of gravity decreases asan object moves very far from the earth. It is also different on other celestial bodies such as the Moon.
The equation that shows the height of an object in free fall is given by
y =12
gt2 + y0
The term y0 represents the initial height of the object t is time, and g is the force of gravity. There are two choicesfor the equation you can use.
y =−4.9t2 + y0 If you wish to have the height in meters.
y =−16t2 + y0 If you wish to have the height in feet.
Example 8 Free fall
How long does it take a ball to fall from a roof to the ground 25 feet below?
Solution
Since we are given the height in feet, use equation y =−16t2 + y0
The initial height is y0 = 25 f eet, so y =−16t2 +25
The height when the ball hits the ground is y = 0, so 0 =−16t2 +25
Solve for t 16t2 = 25
t2 =2516
t =54
or t =−54
We can discard the solution t =−54 since only positive values for time makes sense in this case,
Answer It takes the ball 1.25 seconds to fall to the ground.
Example 9 Free fall
A rock is dropped from the top of a cliff and strikes the ground 7.2 seconds later. How high is the cliff in meters?
Solution
10.3. QUADRATIC EQUATIONS BY SQUARE ROOTS

www.ck12.org 675
Since we want the height in meters, use equation y =−4.9t2 + y0
The time of flight is t = 7.2 seconds y =−4.9(7.2)2 + y0
The height when the ball hits the ground is y = 0, so 0 =−4.9(7.2)2 + y0
Simplify 0 =−254+ y0 so y0 = 254
Answer The cliff is 254 meters high.
Example 10
Victor drops an apple out of a window on the 10th floor which is 120 feet above ground. One second later Juan dropsan orange out of a 6th floor window which is 72 feet above the ground. Which fruit reaches the ground first? Whatis the time difference between the fruits’ arrival to the ground?
Solution Let’s find the time of flight for each piece of fruit.
For the Apple we have the following.
Since we have the height in feet, use equation y =−16t2 + y0
The initial height y0 = 120 f eet. y =−16t2 +120
The height when the ball hits the ground is y = 0, so 0 =−16t2 +120
Solve for t 16t2 = 120
t2 =12016
= 7.5
t = 2.74 or t =−2.74 seconds.
For the orange we have the following.
The initial height y0 = 72 f eet. 0 =−16t2 +72
Solve for t. 16t2 = 72
t2 =7216
= 4.5
t = 2.12 or t =−2.12 seconds
But, don’t forget that the orange was thrown out one second later, so add one second to the time of the orange. It hitthe ground 3.12 seconds after Victor dropped the apple.
Answer The apple hits the ground first. It hits the ground 0.38 seconds before the orange. (Hopefully nobody wason the ground at the time of this experiment—don’t try this one at home, kids!).
Review Questions
Solve the following quadratic equations.
1. x2−1 = 02. x2−100 = 0
CHAPTER 10. QUADRATIC EQUATIONS AND QUADRATIC FUNCTIONS

676 www.ck12.org
3. x2 +16 = 04. 9x2−1 = 05. 4x2−49 = 06. 64x2−9 = 07. x2−81 = 08. 25x2−36 = 09. x2 +9 = 0
10. x2−16 = 011. x2−36 = 012. 16x2−49 = 013. (x−2)2 = 114. (x+5)2 = 1615. (2x−1)2−4 = 016. (3x+4)2 = 917. (x−3)2 +25 = 018. x2−6 = 019. x2−20 = 020. 3x2 +14 = 021. (x−6)2 = 522. (4x+1)2−8 = 023. x2−10x+25 = 924. x2 +18x+81 = 125. 4x2−12x+9 = 1626. (x+10)2 = 227. x2 +14x+49 = 328. 2(x+3)2 = 829. Susan drops her camera in the river from a bridge that is 400 feet high. How long is it before she hears the
splash?30. It takes a rock 5.3 seconds to splash in the water when it is dropped from the top of a cliff. How high is the
cliff in meters?31. Nisha drops a rock from the roof of a building 50 feet high. Ashaan drops a quarter from the top story window,
40 feet high, exactly half a second after Nisha drops the rock. Which hits the ground first?
Review Answers
1. x = 1,x =−12. x = 10,x =−103. No real solution.4. x = 1
3 ,x =−13
5. x = 72 ,x =−
72
6. x = 38 ,x =−
38
7. x = 9,x =−98. x = 6
5 ,x =−65
9. No real solution.10. x = 4,x =−411. x = 6,x =−612. x = 7
4 ,x =−74
13. x = 3,x = 114. x =−1,x =−9
10.3. QUADRATIC EQUATIONS BY SQUARE ROOTS

www.ck12.org 677
15. x = 32 ,x =−
12
16. x =−13 ,x =−
73
17. No real solution.18. x≈ 2.45,x≈−2.4519. x≈ 4.47,x≈−4.4720. No real solution.21. x≈ 8.24,x≈ 3.7622. x≈ 0.46,x≈−0.9623. x = 8,x = 224. x =−8,x =−1025. x = 7
2 ,x =−12
26. x≈−8.59,x≈−11.4127. x≈−5.27,x≈−8.7328. x =−1,x =−529. t = 5 seconds30. y0 = 137.6 meters31. .
CHAPTER 10. QUADRATIC EQUATIONS AND QUADRATIC FUNCTIONS

678 www.ck12.org
10.4 Solving Quadratic Equations byCompleting the Square
Learning objectives
• Complete the square of a quadratic expression.• Solve quadratic equations by completing the square.• Solve quadratic equations in standard form.• Graph quadratic equations in vertex form.• Solve real-world problems using functions by completing the square.
Introduction
You saw in the last section that if you have a quadratic equation of the form
(x−2)2 = 5
We can easily solve it by taking the square root of each side.
x−2 =√
5 and x−2 =−√
5
Then simplify and solve.
x = 2+√
5≈ 4.24 and x = 2−√
5≈−0.24
Unfortunately, quadratic equations are not usually written in this nice form. In this section, you will learn the methodof completing the squares in which you take any quadratic equation and rewrite it in a form so that you can takethe square root of both sides.
Complete the Square of a Quadratic Expression
The purpose of the method of completing the squares is to rewrite a quadratic expression so that it contains a perfectsquare trinomial that can be factored as the square of a binomial. Remember that the square of a binomial expands.Here is an example of this.
(x+a)2 = x2 +2ax+a2
(x−a)2 = x2−2ax+a2
In order to have a perfect square trinomial, we need two terms that are perfect squares and one term that is twice theproduct of the square roots of the other terms.
Example 1
10.4. SOLVING QUADRATIC EQUATIONS BY COMPLETING THE SQUARE
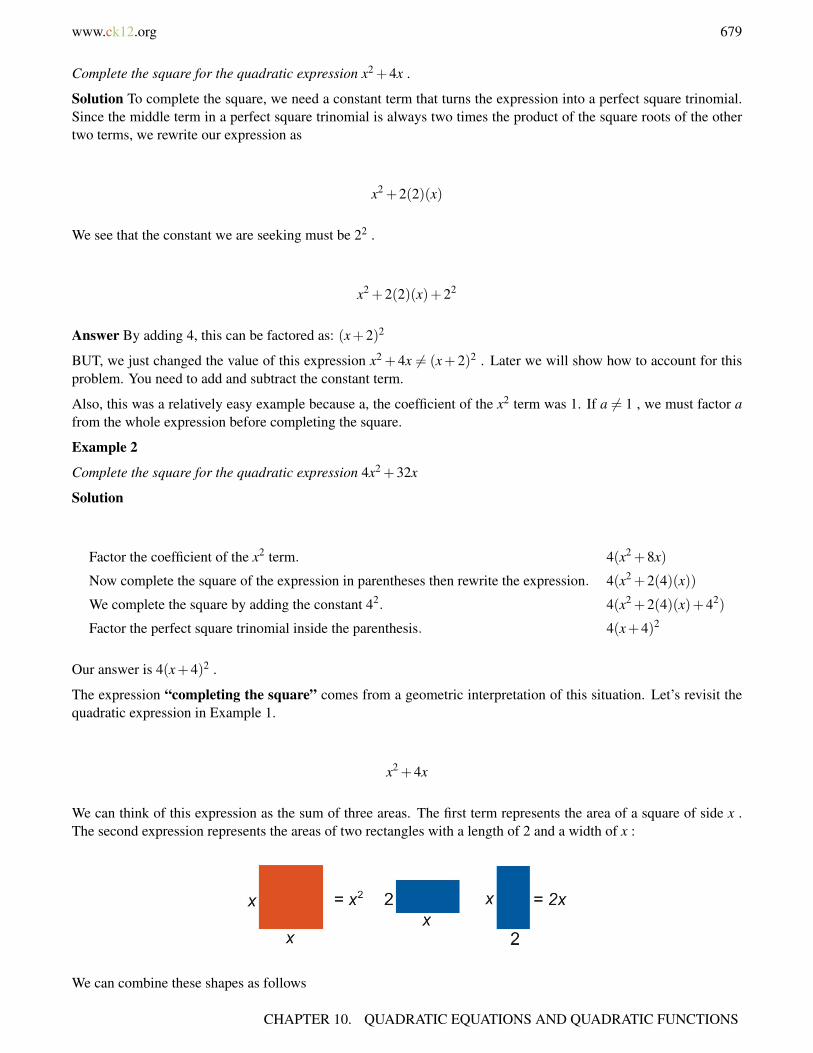
www.ck12.org 679
Complete the square for the quadratic expression x2 +4x .
Solution To complete the square, we need a constant term that turns the expression into a perfect square trinomial.Since the middle term in a perfect square trinomial is always two times the product of the square roots of the othertwo terms, we rewrite our expression as
x2 +2(2)(x)
We see that the constant we are seeking must be 22 .
x2 +2(2)(x)+22
Answer By adding 4, this can be factored as: (x+2)2
BUT, we just changed the value of this expression x2 +4x 6= (x+2)2 . Later we will show how to account for thisproblem. You need to add and subtract the constant term.
Also, this was a relatively easy example because a, the coefficient of the x2 term was 1. If a 6= 1 , we must factor afrom the whole expression before completing the square.
Example 2
Complete the square for the quadratic expression 4x2 +32x
Solution
Factor the coefficient of the x2 term. 4(x2 +8x)
Now complete the square of the expression in parentheses then rewrite the expression. 4(x2 +2(4)(x))
We complete the square by adding the constant 42. 4(x2 +2(4)(x)+42)
Factor the perfect square trinomial inside the parenthesis. 4(x+4)2
Our answer is 4(x+4)2 .
The expression “completing the square” comes from a geometric interpretation of this situation. Let’s revisit thequadratic expression in Example 1.
x2 +4x
We can think of this expression as the sum of three areas. The first term represents the area of a square of side x .The second expression represents the areas of two rectangles with a length of 2 and a width of x :
We can combine these shapes as follows
CHAPTER 10. QUADRATIC EQUATIONS AND QUADRATIC FUNCTIONS
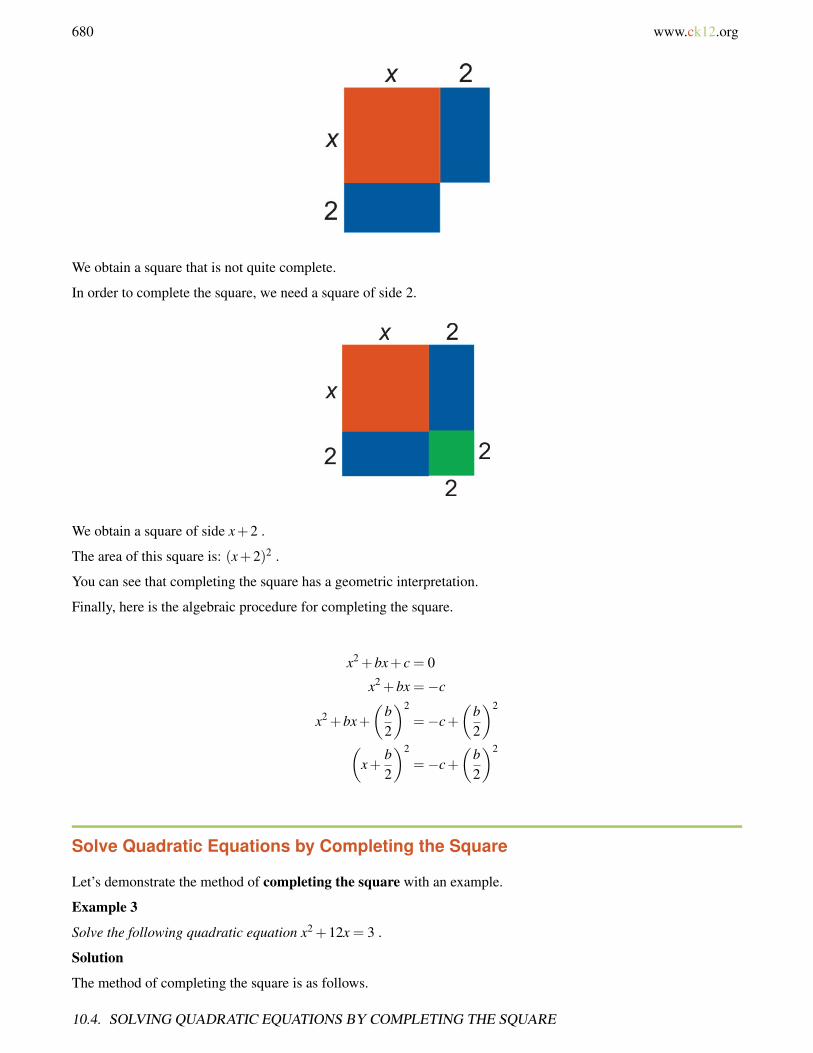
680 www.ck12.org
We obtain a square that is not quite complete.
In order to complete the square, we need a square of side 2.
We obtain a square of side x+2 .
The area of this square is: (x+2)2 .
You can see that completing the square has a geometric interpretation.
Finally, here is the algebraic procedure for completing the square.
x2 +bx+ c = 0
x2 +bx =−c
x2 +bx+(
b2
)2
=−c+(
b2
)2
(x+
b2
)2
=−c+(
b2
)2
Solve Quadratic Equations by Completing the Square
Let’s demonstrate the method of completing the square with an example.
Example 3
Solve the following quadratic equation x2 +12x = 3 .
Solution
The method of completing the square is as follows.
10.4. SOLVING QUADRATIC EQUATIONS BY COMPLETING THE SQUARE
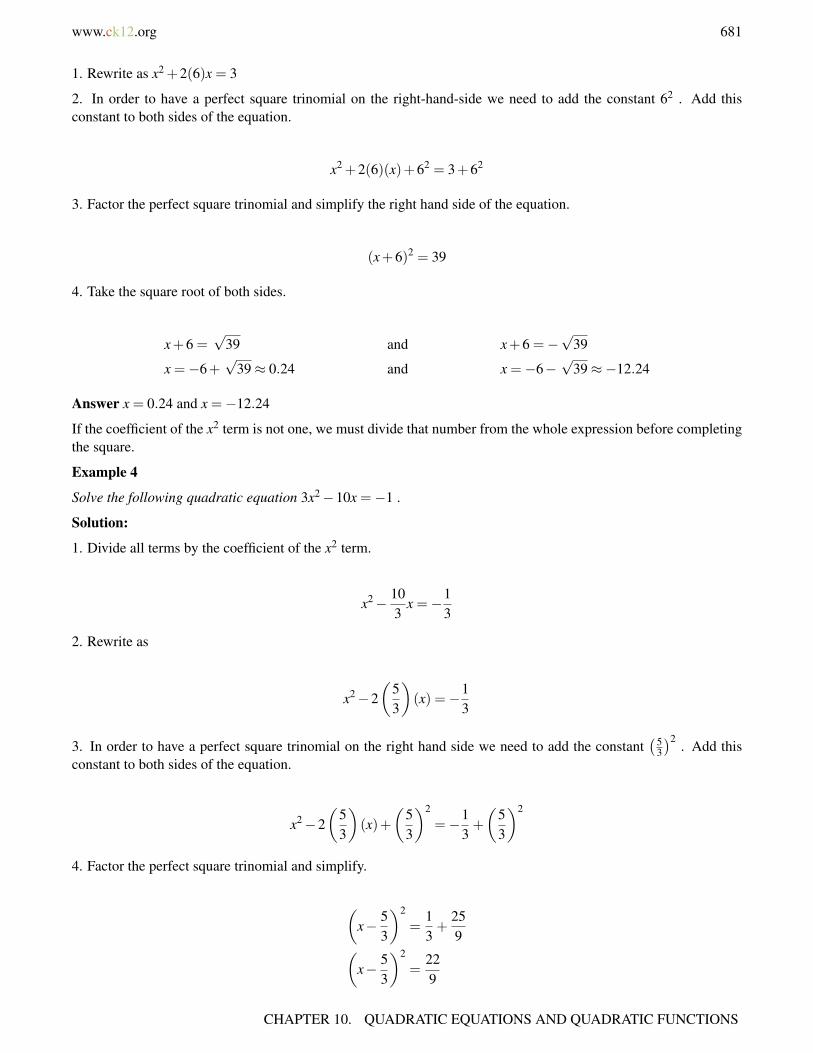
www.ck12.org 681
1. Rewrite as x2 +2(6)x = 3
2. In order to have a perfect square trinomial on the right-hand-side we need to add the constant 62 . Add thisconstant to both sides of the equation.
x2 +2(6)(x)+62 = 3+62
3. Factor the perfect square trinomial and simplify the right hand side of the equation.
(x+6)2 = 39
4. Take the square root of both sides.
x+6 =√
39 and x+6 =−√
39
x =−6+√
39≈ 0.24 and x =−6−√
39≈−12.24
Answer x = 0.24 and x =−12.24
If the coefficient of the x2 term is not one, we must divide that number from the whole expression before completingthe square.
Example 4
Solve the following quadratic equation 3x2−10x =−1 .
Solution:
1. Divide all terms by the coefficient of the x2 term.
x2− 103
x =−13
2. Rewrite as
x2−2(
53
)(x) =−1
3
3. In order to have a perfect square trinomial on the right hand side we need to add the constant(5
3
)2. Add this
constant to both sides of the equation.
x2−2(
53
)(x)+
(53
)2
=−13+
(53
)2
4. Factor the perfect square trinomial and simplify.
(x− 5
3
)2
=13+
259(
x− 53
)2
=229
CHAPTER 10. QUADRATIC EQUATIONS AND QUADRATIC FUNCTIONS
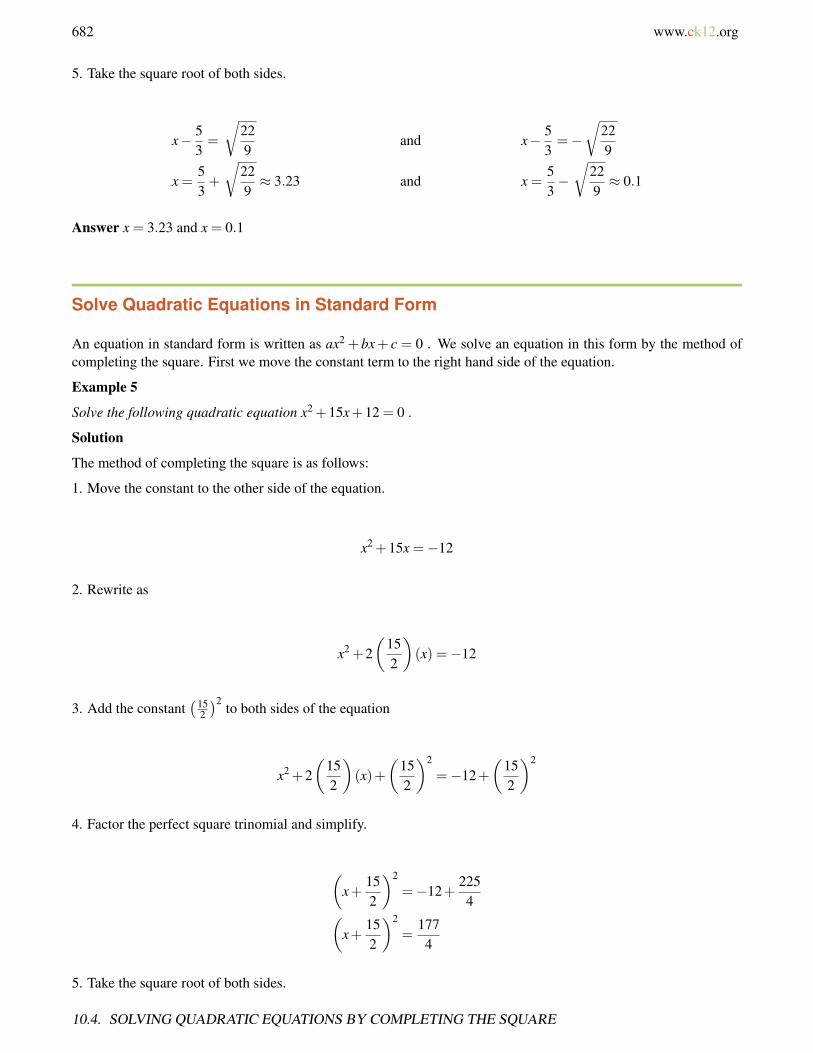
682 www.ck12.org
5. Take the square root of both sides.
x− 53=
√229
and x− 53=−
√229
x =53+
√229≈ 3.23 and x =
53−√
229≈ 0.1
Answer x = 3.23 and x = 0.1
Solve Quadratic Equations in Standard Form
An equation in standard form is written as ax2 + bx+ c = 0 . We solve an equation in this form by the method ofcompleting the square. First we move the constant term to the right hand side of the equation.
Example 5
Solve the following quadratic equation x2 +15x+12 = 0 .
Solution
The method of completing the square is as follows:
1. Move the constant to the other side of the equation.
x2 +15x =−12
2. Rewrite as
x2 +2(
152
)(x) =−12
3. Add the constant(15
2
)2to both sides of the equation
x2 +2(
152
)(x)+
(152
)2
=−12+(
152
)2
4. Factor the perfect square trinomial and simplify.
(x+
152
)2
=−12+225
4(x+
152
)2
=1774
5. Take the square root of both sides.
10.4. SOLVING QUADRATIC EQUATIONS BY COMPLETING THE SQUARE

www.ck12.org 683
x+152
=
√1774
and x+152
=−√
1774
x+−152+
√1774≈−0.85 and x+−15
2+
√1774≈−14.15
Answer x =−0.85 and x =−14.15
Graph Quadratic Functions in Vertex Form
Probably one of the best applications of the method of completing the square is using it to rewrite a quadratic functionin vertex form.
The vertex form of a quadratic function is y− k = a(x−h)2 .
This form is very useful for graphing because it gives the vertex of the parabola explicitly. The vertex is at point(h,k) .
It is also simple to find the x− intercepts from the vertex from by setting y = 0 and taking the square root of bothsides of the resulting equation.
The y− intercept can be found by setting x = 0 and simplifying.
Example 6
Find the vertex, the x− intercepts and the y− intercept of the following parabolas.
(a) y−2 = (x−1)2
(b) y+8 = 2(x−3)2
Solution
a) y−2 = (x−1)2
Vertex is (1, 2)
To find x− intercepts,
Set y = 0 −2 = (x−1)2
Take the square root of both sides√−2 = x−1 and −
√−2 = x−1
The solutions are not real (because you cannot take the square root of a negative number), so there are no x−intercepts.
To find y− intercept,
Set x = 0 y−2 = (−1)2
Simplify y−2 = 1⇒ y = 3
b) y+8 = 2(x−3)2
Rewrite y− (−8) = 2(x−3)2
Vertex is (3,−8)
CHAPTER 10. QUADRATIC EQUATIONS AND QUADRATIC FUNCTIONS

684 www.ck12.org
To find x− intercepts,
Set y = 0 : 8 = 2(x−3)2
Divide both sides by 2. 4 = (x−3)2
Take the square root of both sides : 2 = x−3 and −2 = x−3
Simplify : x = 5 and x = 1
To find the y− intercept,
Set x = 0. y+8 = 2(−3)2
Simplify : y+8 = 18⇒ y = 10
To graph a parabola, we only need to know the following information.
• The coordinates of the vertex.• The x− intercepts.• The y− intercept.• Whether the parabola turns up or down. Remember that if a > 0 , the parabola turns up and if a < 0 then the
parabola turns down.
Example 7
Graph the parabola given by the function y+1 = (x+3)2 .
Solution
Rewrite. y− (−1) = (x− (−3))2
Vertex is (−3,−1)
To find the x− intercepts
Set y = 0 1 = (x+3)2
Take the square root of both sides 1 = x+3 and −1 = x+3
Simplify x =−2 and x =−4
x− intercepts: (-2, 0) and (-4, 0)
To find the y− intercept
Set x = 0 y+1(3)2
Simplify y = 8 y− intercept : (0,8)
Since a > 0 , the parabola turns up.
Graph all the points and connect them with a smooth curve.
10.4. SOLVING QUADRATIC EQUATIONS BY COMPLETING THE SQUARE

www.ck12.org 685
Example 8
Graph the parabola given by the function y =−12(x−2)2
Solution:
Re-write y− (0) =−12(x−2)2
Vertex is (2,0)
To find the x− intercepts,
Set y = 0. 0 =−12(x−2)2
Multiply both sides by −2. 0 = (x−2)2
Take the square root of both sides. 0 = x−2
Simplify. x = 2
x− intercept (2, 0)
Note: there is only one x− intercept, indicating that the vertex is located at this point (2, 0).
To find the y− intercept
Set x = 0 y =−12(−2)2
Simplify y =−12(4)⇒ y =−2
CHAPTER 10. QUADRATIC EQUATIONS AND QUADRATIC FUNCTIONS
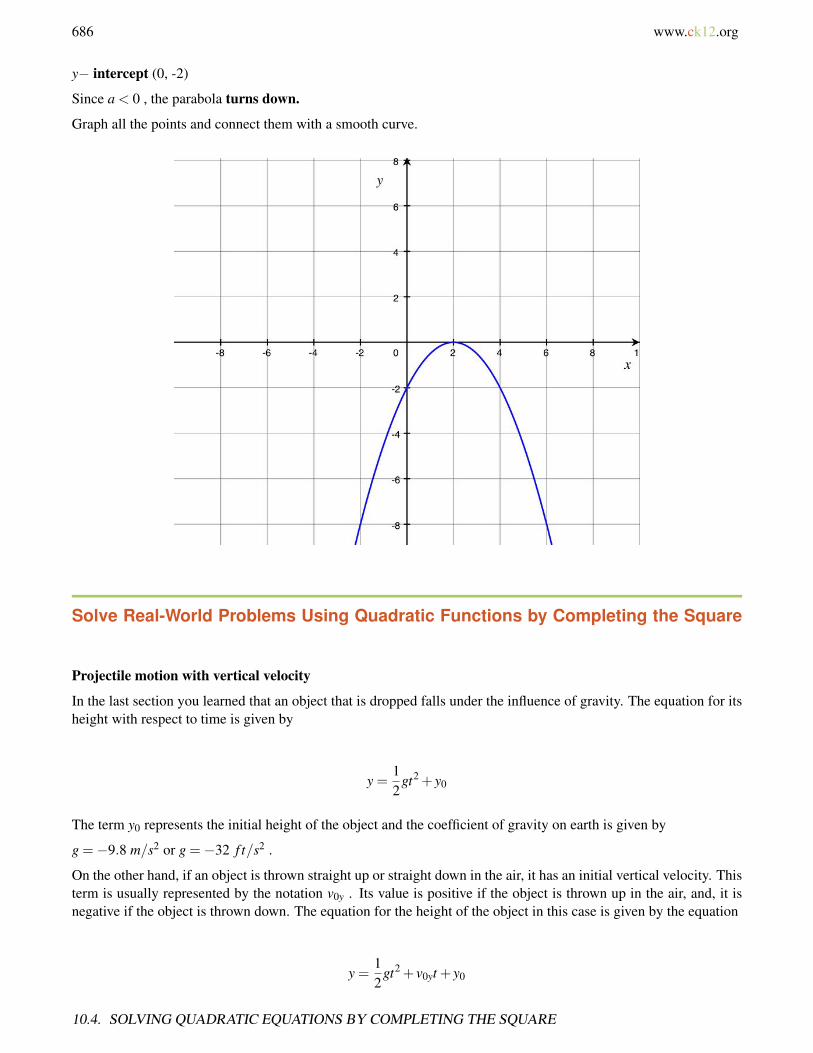
686 www.ck12.org
y− intercept (0, -2)
Since a < 0 , the parabola turns down.
Graph all the points and connect them with a smooth curve.
Solve Real-World Problems Using Quadratic Functions by Completing the Square
Projectile motion with vertical velocity
In the last section you learned that an object that is dropped falls under the influence of gravity. The equation for itsheight with respect to time is given by
y =12
gt2 + y0
The term y0 represents the initial height of the object and the coefficient of gravity on earth is given by
g =−9.8 m/s2 or g =−32 f t/s2 .
On the other hand, if an object is thrown straight up or straight down in the air, it has an initial vertical velocity. Thisterm is usually represented by the notation v0y . Its value is positive if the object is thrown up in the air, and, it isnegative if the object is thrown down. The equation for the height of the object in this case is given by the equation
y =12
gt2 + v0yt + y0
10.4. SOLVING QUADRATIC EQUATIONS BY COMPLETING THE SQUARE

www.ck12.org 687
There are two choices for the equation to use in these problems.
y =−4.9t2 + v0yt + y0 If you wish to have the height in meters.
y =−16t2 + v0yt + y0 If you wish to have the height in feet.
Example 9
An arrow is shot straight up from a height of 2 meters with a velocity of 50 m/s.
a) How high will an arrow be four seconds after being shot? After eight seconds?
b) At what time will the arrow hit the ground again?
c) What is the maximum height that the arrow will reach and at what time will that happen?
Solution
Since we are given the velocity in meters per second, use the equation y =−4.9t2 + v0yt + y0
We know v0y = 50 m/s and y0 = 2 meters so, y =−4.9t2 +50t +2
a) To find how high the arrow will be 4 seconds after being shot we substitute 4 for t
y =−4.9(4)2 +50(4)+2
=−4.9(16)+200+2 = 123.6 meters
we substitute t = 8
y =−4.9(8)2 +50(8)+2
=−4.9(64)+400+5 = 88.4 meters
b) The height of the arrow on the ground is y = 0 , so 0 =−4.9t2 +50t +2
Solve for t by completing the square −4.9t2 +50t =−2
Factor the −4.9−4.9(t2−10.2t) =−2
Divide both sides by −4.9t2−10.2t = 0.41
Add 5.12 to both sides t2−2(5.1)t +(5.1)2 = 0.41+(5.1)2
Factor (t−5.1)2 = 26.43
Solve t−5.1≈ 5.14 and t−5.1≈−5.14
t ≈ 10.2 sec and t ≈−0.04 sec
c) If we graph the height of the arrow with respect to time, we would get an upside down parabola (a < 0) .
The maximum height and the time when this occurs is really the vertex of this parabola (t,h) .
CHAPTER 10. QUADRATIC EQUATIONS AND QUADRATIC FUNCTIONS
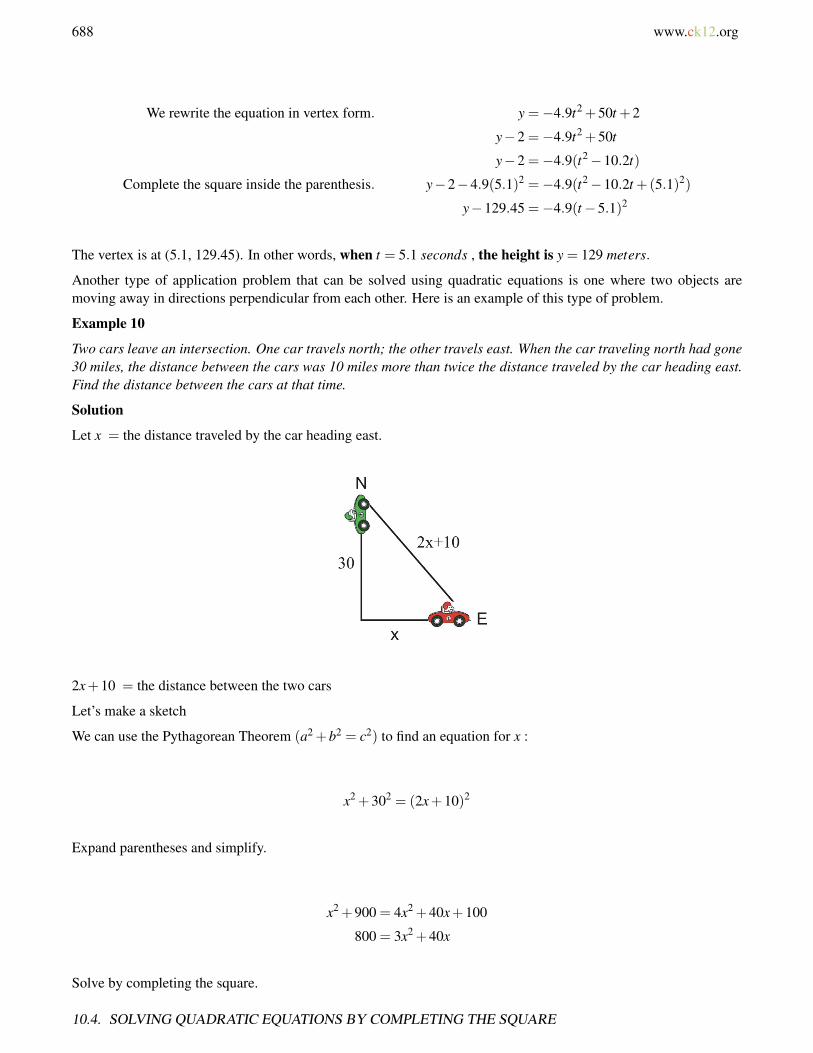
688 www.ck12.org
We rewrite the equation in vertex form. y =−4.9t2 +50t +2
y−2 =−4.9t2 +50t
y−2 =−4.9(t2−10.2t)
Complete the square inside the parenthesis. y−2−4.9(5.1)2 =−4.9(t2−10.2t +(5.1)2)
y−129.45 =−4.9(t−5.1)2
The vertex is at (5.1, 129.45). In other words, when t = 5.1 seconds , the height is y = 129 meters.
Another type of application problem that can be solved using quadratic equations is one where two objects aremoving away in directions perpendicular from each other. Here is an example of this type of problem.
Example 10
Two cars leave an intersection. One car travels north; the other travels east. When the car traveling north had gone30 miles, the distance between the cars was 10 miles more than twice the distance traveled by the car heading east.Find the distance between the cars at that time.
Solution
Let x = the distance traveled by the car heading east.
2x+10 = the distance between the two cars
Let’s make a sketch
We can use the Pythagorean Theorem (a2 +b2 = c2) to find an equation for x :
x2 +302 = (2x+10)2
Expand parentheses and simplify.
x2 +900 = 4x2 +40x+100
800 = 3x2 +40x
Solve by completing the square.
10.4. SOLVING QUADRATIC EQUATIONS BY COMPLETING THE SQUARE
www.ck12.org 689
8003
= x2 +403
x
8003
+
(203
)4
= x2 +2(
203
)x+(
203
)3
28009
=
(x+
203
)2
x+203≈ 17.6 and x+
203≈−17.6
x≈ 11 and x≈−24.3
Since only positive distances make sense here, the distance between the two cars is 2(11)+10 = 32 miles .
Answer The distance between the two cars is 32 miles.
Review Questions
Complete the square for each expression.
1. x2 +5x2. x2−2x3. x2 +3x4. x2−4x5. 3x2 +18x6. 2x2−22x7. 8x2−10x8. 5x2 +12x
Solve each quadratic equation by completing the square.
9. x2−4x = 510. x2−5x = 1011. x2 +10x+15 = 012. x2 +15x+20 = 013. 2x2−18x = 014. 4x2 +5x =−115. 10x2−30x−8 = 016. 5x2 +15x−40 = 0
Rewrite each quadratic function in vertex form.
17. y = x2−6x18. y+1 =−2x2− x19. y = 9x2 +3x−1020. y = 32x2 +60x+10 For each parabola, find
a. The vertexb. x− interceptsc. y− intercept
CHAPTER 10. QUADRATIC EQUATIONS AND QUADRATIC FUNCTIONS
690 www.ck12.org
d. If it turns up or down.e. The graph the parabola.
21. y−4 = x2 +8x22. y =−4x2 +20x−2423. y = 3x2 +15x24. y+6 =−x2 + x25. Sam throws an egg straight down from a height of 25 feet. The initial velocity of the egg is 16 ft/sec. How
long does it take the egg to reach the ground?26. Amanda and Dolvin leave their house at the same time. Amanda walks south and Dolvin bikes east. Half an
hour later they are 5.5 miles away from each other and Dolvin has covered three miles more than the distancethat Amanda covered. How far did Amanda walk and how far did Dolvin bike?
Review Answers
1. x2 +5x+ 254 =
(x+ 5
2
)2
2. x2−2x+1 = (x−1)2
3. x2 +3x+ 94 =
(x+ 3
2
)2
4. x2−4x+4 = (x−2)2
5. 3(x2 +6x+9) = 3(x+3)2
6. 2(x2−11x+ 121
4
)= 2
(x− 11
2
)2
7. 8(x2− 5
4 x+ 2564
)= 8
(x− 5
8
)2
8. 5(x2 + 12
5 x+ 3625
)= 5
(x+ 6
5
)2
9. 5,−110. 6.53,−1.5311. −8.16,−1.8412. −13.52,−1.4813. 9.16,−.1614. −1,−.2515. −3.25,−.2516. −4.7,1.717. y+9 = (x−3)2
18. y+ 78 =−2
(x+ 1
4
)2
19. y+10.25 = 9(x+ 1
6
)2
20. y− 3058 =−32
(x− 15
16
)2
21. y+12 = (x+4)2 ; vertex (-4, -12); x− intercepts (-7.46, 0), (-.54, 0); y− intercept (0, 4); turns up.22. y−1 =−4
(x− 5
2
)2; vertex (2.5, 1); x− intercepts (2, 0), (3, 0) y− intercept (0, -24); turns down.
23. y+18.75 = 3(x+2.5)2 ; vertex (-2.5, -18.75); x− intercepts (0, 0), (-5, 0); y− intercept (0, 0); turns up.24. y+ 23
4 =−(x− 1
2
)2 ; vertex (0.5, -5.75); x− intercepts none; y− intercept (0, -6); turns down.25. 0.85 seconds26. Amanda 2.1 miles , Dolvin 5.1 miles
10.4. SOLVING QUADRATIC EQUATIONS BY COMPLETING THE SQUARE

www.ck12.org 691
10.5 Solving Quadratic Equations by theQuadratic Formula
Learning objectives
• Solve quadratic equations using the quadratic formula.• Identify and choose methods for solving quadratic equations.• Solve real-world problems using functions by completing the square.
Introduction
In this section, you will solve quadratic equations using the Quadratic Formula. Most of you are already familiarwith this formula from previous mathematics courses. It is probably the most used method for solving quadraticequations. For a quadratic equation in standard form
ax2 +bx+ c = 0
The solutions are found using the following formula.
x =−b±
√b2−4ac
2a
We will start by explaining where this formula comes from and then show how it is applied. This formula is derivedby solving a general quadratic equation using the method of completing the square that you learned in the previoussection.
CHAPTER 10. QUADRATIC EQUATIONS AND QUADRATIC FUNCTIONS
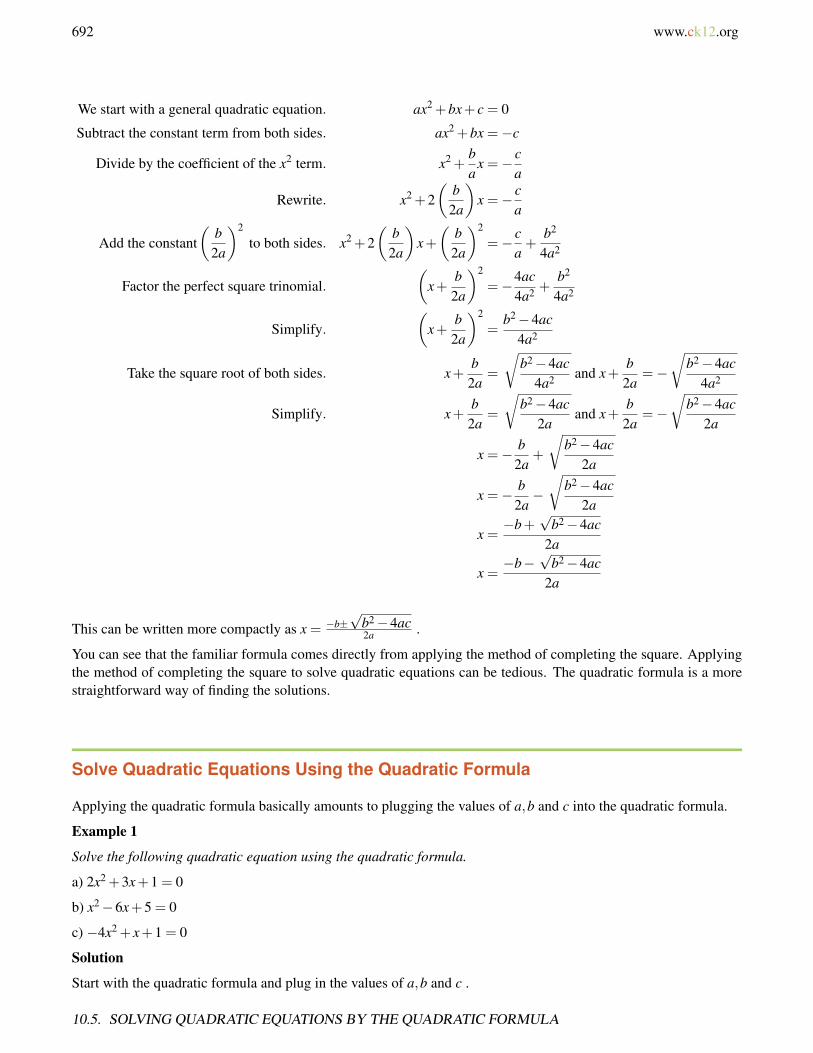
692 www.ck12.org
We start with a general quadratic equation. ax2 +bx+ c = 0
Subtract the constant term from both sides. ax2 +bx =−c
Divide by the coefficient of the x2 term. x2 +ba
x =− ca
Rewrite. x2 +2(
b2a
)x =− c
a
Add the constant(
b2a
)2
to both sides. x2 +2(
b2a
)x+(
b2a
)2
=− ca+
b2
4a2
Factor the perfect square trinomial.(
x+b2a
)2
=−4ac4a2 +
b2
4a2
Simplify.(
x+b2a
)2
=b2−4ac
4a2
Take the square root of both sides. x+b
2a=
√b2−4ac
4a2 and x+b2a
=−√
b2−4ac4a2
Simplify. x+b
2a=
√b2−4ac
2aand x+
b2a
=−√
b2−4ac2a
x =− b2a
+
√b2−4ac
2a
x =− b2a−√
b2−4ac2a
x =−b+
√b2−4ac
2a
x =−b−
√b2−4ac
2a
This can be written more compactly as x = −b±√
b2−4ac2a .
You can see that the familiar formula comes directly from applying the method of completing the square. Applyingthe method of completing the square to solve quadratic equations can be tedious. The quadratic formula is a morestraightforward way of finding the solutions.
Solve Quadratic Equations Using the Quadratic Formula
Applying the quadratic formula basically amounts to plugging the values of a,b and c into the quadratic formula.
Example 1
Solve the following quadratic equation using the quadratic formula.
a) 2x2 +3x+1 = 0
b) x2−6x+5 = 0
c) −4x2 + x+1 = 0
Solution
Start with the quadratic formula and plug in the values of a,b and c .
10.5. SOLVING QUADRATIC EQUATIONS BY THE QUADRATIC FORMULA
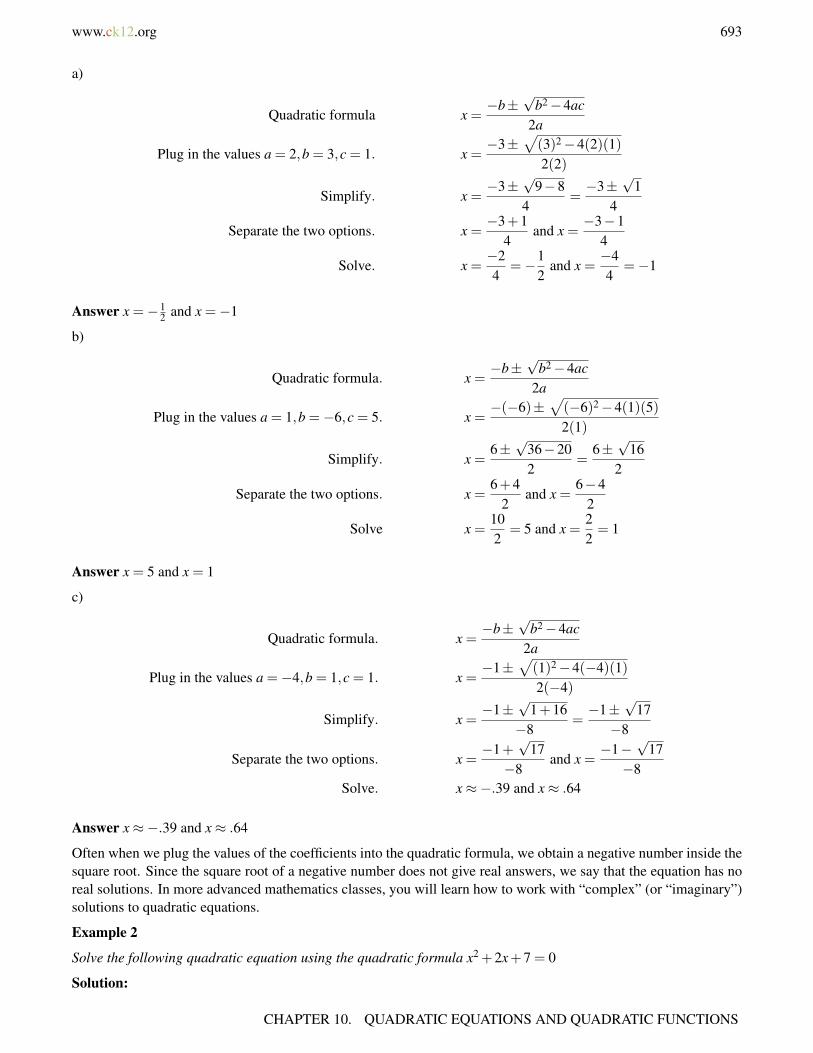
www.ck12.org 693
a)
Quadratic formula x =−b±
√b2−4ac
2a
Plug in the values a = 2,b = 3,c = 1. x =−3±
√(3)2−4(2)(1)2(2)
Simplify. x =−3±
√9−8
4=−3±
√1
4
Separate the two options. x =−3+1
4and x =
−3−14
Solve. x =−24
=−12
and x =−44
=−1
Answer x =−12 and x =−1
b)
Quadratic formula. x =−b±
√b2−4ac
2a
Plug in the values a = 1,b =−6,c = 5. x =−(−6)±
√(−6)2−4(1)(5)2(1)
Simplify. x =6±√
36−202
=6±√
162
Separate the two options. x =6+4
2and x =
6−42
Solve x =102
= 5 and x =22= 1
Answer x = 5 and x = 1
c)
Quadratic formula. x =−b±
√b2−4ac
2a
Plug in the values a =−4,b = 1,c = 1. x =−1±
√(1)2−4(−4)(1)2(−4)
Simplify. x =−1±
√1+16
−8=−1±
√17
−8
Separate the two options. x =−1+
√17
−8and x =
−1−√
17−8
Solve. x≈−.39 and x≈ .64
Answer x≈−.39 and x≈ .64
Often when we plug the values of the coefficients into the quadratic formula, we obtain a negative number inside thesquare root. Since the square root of a negative number does not give real answers, we say that the equation has noreal solutions. In more advanced mathematics classes, you will learn how to work with “complex” (or “imaginary”)solutions to quadratic equations.
Example 2
Solve the following quadratic equation using the quadratic formula x2 +2x+7 = 0
Solution:
CHAPTER 10. QUADRATIC EQUATIONS AND QUADRATIC FUNCTIONS
694 www.ck12.org
a)
Quadratic formula. x =b±√
b2−4ac2a
Plug in the values a = 1,b = 2,c = 7. x =−2±
√(2)2−4(1)(7)2(1)
Simplify. x =−2±
√4−28
2=−2±
√−24
2
Answer There are no real solutions.
To apply the quadratic formula, we must make sure that the equation is written in standard form. For some problems,we must rewrite the equation before we apply the quadratic formula.
Example 3
Solve the following quadratic equation using the quadratic formula.
a) x2−6x = 10
b) 8x2 = 5x+6
Solution:
a)
Rewrite the equation in standard form. x2−6x−10 = 0
Quadratic formula x =−b±
√b2−4ac
2a
Plug in the values a = 1,b =−6,c =−10. x =−(−6)±
√(−6)2−4(1)(−10)
2(1)
Simplify. x =6±√
36+402
=6±√
762
Separate the two options. x =6+√
762
and x =6−√
762
Solve. x≈ 7.36 and x≈−1.36
Answer x≈ 7.36 and x≈−1.36
b)
Rewrite the equation in standard form. 8x2 +5x+6 = 0
Quadratic formula x =−b±
√b2−4ac
2a
Plug in the values a = 8,b = 5,c = 6. x =−5±
√(5)2−4(8)(6)2(8)
Simplify. x =−5±
√25−192
16=−5±
√−167
16
Answer no real solutions
Multimedia Link For more examples of solving quadratic equations using the quadratic formula, see http://www.youtube.com/watch?v=y19jYxzY8Y8 (9:14)
10.5. SOLVING QUADRATIC EQUATIONS BY THE QUADRATIC FORMULA
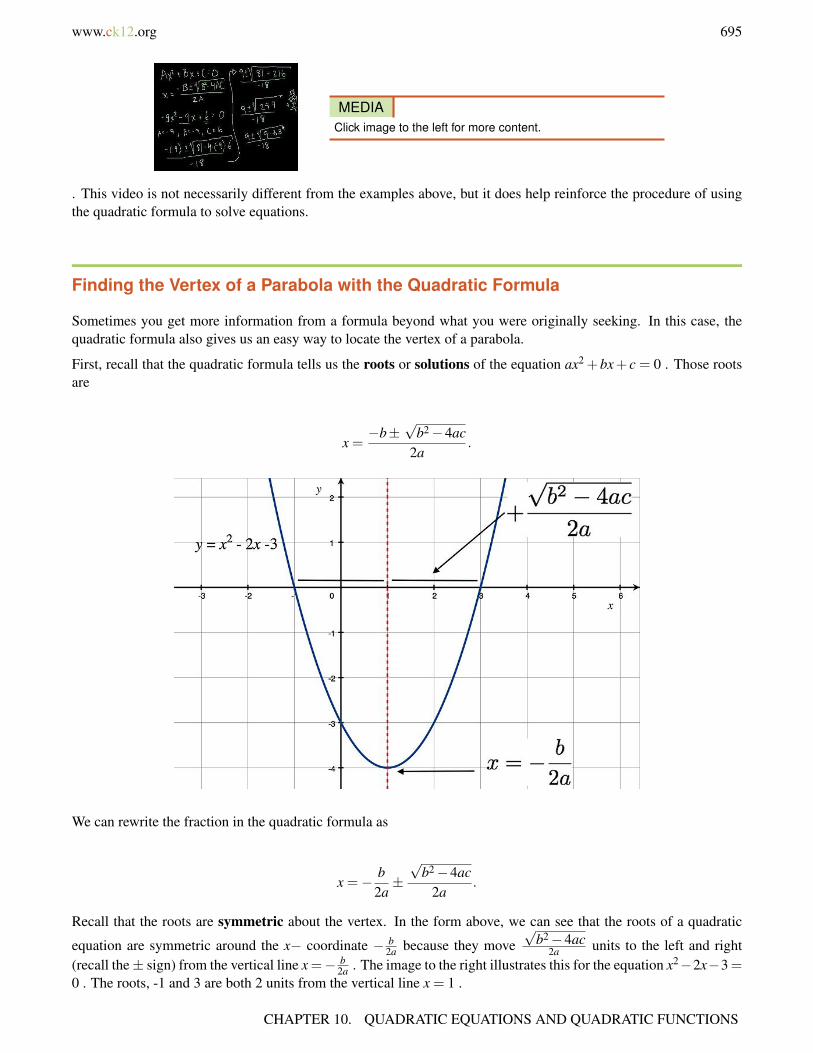
www.ck12.org 695
MEDIAClick image to the left for more content.
. This video is not necessarily different from the examples above, but it does help reinforce the procedure of usingthe quadratic formula to solve equations.
Finding the Vertex of a Parabola with the Quadratic Formula
Sometimes you get more information from a formula beyond what you were originally seeking. In this case, thequadratic formula also gives us an easy way to locate the vertex of a parabola.
First, recall that the quadratic formula tells us the roots or solutions of the equation ax2 +bx+ c = 0 . Those rootsare
x =−b±
√b2−4ac
2a.
We can rewrite the fraction in the quadratic formula as
x =− b2a±√
b2−4ac2a
.
Recall that the roots are symmetric about the vertex. In the form above, we can see that the roots of a quadratic
equation are symmetric around the x− coordinate − b2a because they move
√b2−4ac
2a units to the left and right(recall the± sign) from the vertical line x=− b
2a . The image to the right illustrates this for the equation x2−2x−3=0 . The roots, -1 and 3 are both 2 units from the vertical line x = 1 .
CHAPTER 10. QUADRATIC EQUATIONS AND QUADRATIC FUNCTIONS
696 www.ck12.org
Identify and Choose Methods for Solving Quadratic Equations.
In mathematics, you will need to solve quadratic equations that describe application problems or that are part ofmore complicated problems. You learned four ways of solving a quadratic equation.
• Factoring.• Taking the square root.• Completing the square.• Quadratic formula.
Usually you will not be told which method to use. You will have to make that decision yourself. However, here aresome guidelines to which methods are better in different situations.
Factoring is always best if the quadratic expression is easily factorable. It is always worthwhile to check if you canfactor because this is the fastest method. Many expressions are not factorable so this method is not used very oftenin practice.
Taking the square root is best used when there is no x term in the equation.
Completing the square can be used to solve any quadratic equation. This is usually not any better than usingthe quadratic formula (in terms of difficult computations), however it is a very important method for re-writing aquadratic function in vertex form. It is also be used to re-write the equations of circles, ellipses and hyperbolas instandard form (something you will do in algebra II, trigonometry, physics, calculus, and beyond...).
Quadratic formula is the method that is used most often for solving a quadratic equation. When solving directlyby taking square root and factoring does not work, this is the method that most people prefer to use.
If you are using factoring or the quadratic formula make sure that the equation is in standard form.
Example 4
Solve each quadratic equation
a) x2−4x−5 = 0
b) x2 = 8
c) −4x2 + x = 2
d) 25x2−9 = 0
e) 3x2 = 8x
Solution
a) This expression if easily factorable so we can factor and apply the zero-product property:
Factor. (x−5)(x+1) = 0
Apply zero-product property. x−5 = 0 and x+1 = 0
Solve. x = 5 and x =−1
Answer x = 5 and x =−1
b) Since the expression is missing the x term we can take the square root:
Take the square root of both sides. x =√
8 and x =−√
8
10.5. SOLVING QUADRATIC EQUATIONS BY THE QUADRATIC FORMULA

www.ck12.org 697
Answer x = 2.83 and x =−2.83
c) Rewrite the equation in standard form.
It is not apparent right away if the expression is factorable, so we will use the quadratic formula.
Quadratic formula x =−b±
√b2−4ac
2a
Plug in the values a =−4,b = 1,c =−2. x =−1±
√12−4(−4)(−2)2(−4)
Simplify. x =−1±
√1−32
−8=−1±
√−31
−8
Answer no real solution
d) This problem can be solved easily either with factoring or taking the square root. Let’s take the square root in thiscase.
Add 9 to both sides of the equation. 25x2 = 9
Divide both sides by 25. x2 =9
25
Take the square root of both sides. x =
√925
and x =−√
925
Simplify. x =35
and x =−35
Answer x = 35 and x =−3
5
e)
Rewrite the equation in standard form 3x2−8x = 0
Factor out common x term. x(3x−8) = 0
Set both terms to zero. x = 0 and 3x = 8
Solve. x = 0 and x =83= 2.67
Answer x = 0 and x = 2.67
Solve Real-World Problems Using Quadratic Functions by any Method
Here are some application problems that arise from number relationships and geometry applications.
Example 5
The product of two positive consecutive integers is 156. Find the integers.
Solution
For two consecutive integers, one integer is one more than the other one.
Define
CHAPTER 10. QUADRATIC EQUATIONS AND QUADRATIC FUNCTIONS
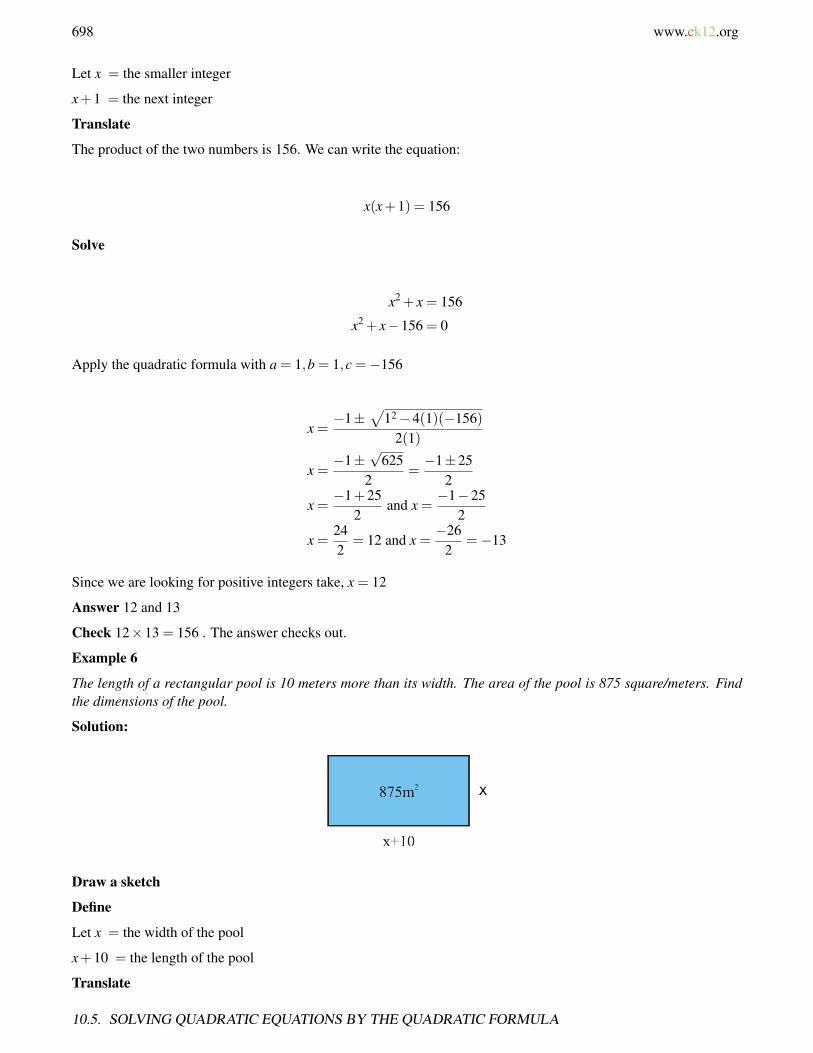
698 www.ck12.org
Let x = the smaller integer
x+1 = the next integer
Translate
The product of the two numbers is 156. We can write the equation:
x(x+1) = 156
Solve
x2 + x = 156
x2 + x−156 = 0
Apply the quadratic formula with a = 1,b = 1,c =−156
x =−1±
√12−4(1)(−156)
2(1)
x =−1±
√625
2=−1±25
2
x =−1+25
2and x =
−1−252
x =242
= 12 and x =−26
2=−13
Since we are looking for positive integers take, x = 12
Answer 12 and 13
Check 12×13 = 156 . The answer checks out.
Example 6
The length of a rectangular pool is 10 meters more than its width. The area of the pool is 875 square/meters. Findthe dimensions of the pool.
Solution:
Draw a sketch
Define
Let x = the width of the pool
x+10 = the length of the pool
Translate
10.5. SOLVING QUADRATIC EQUATIONS BY THE QUADRATIC FORMULA

www.ck12.org 699
The area of a rectangle is A = length × width, so
x(x+10) = 875
Solve
x2 +10x = 875
x2 +10x−875 = 0
Apply the quadratic formula with a = 1,b = 10 and c =−875
x =−10±
√(10)2−4(1)(−875)
2(1)
x =−10±
√100+35002
x =−10±
√3600
2=−10±60
2
x =−10+60
2and x =
−10−602
x =502
= 25 and x =−70
2=−35
Since the dimensions of the pools should be positive, then x = 25 meters .
Answer The pool is 25 meters×35 meters .
Check 25×35 = 875 m2 . The answer checks out.
Example 7
Suzie wants to build a garden that has three separate rectangular sections. She wants to fence around the wholegarden and between each section as shown. The plot is twice as long as it is wide and the total area is 200 f t2 .How much fencing does Suzie need?
Solution
Draw a Sketch
Define
Let x = the width of the plot
2x = the length of the plot
Translate
Area of a rectangle is A = length × width, so
CHAPTER 10. QUADRATIC EQUATIONS AND QUADRATIC FUNCTIONS
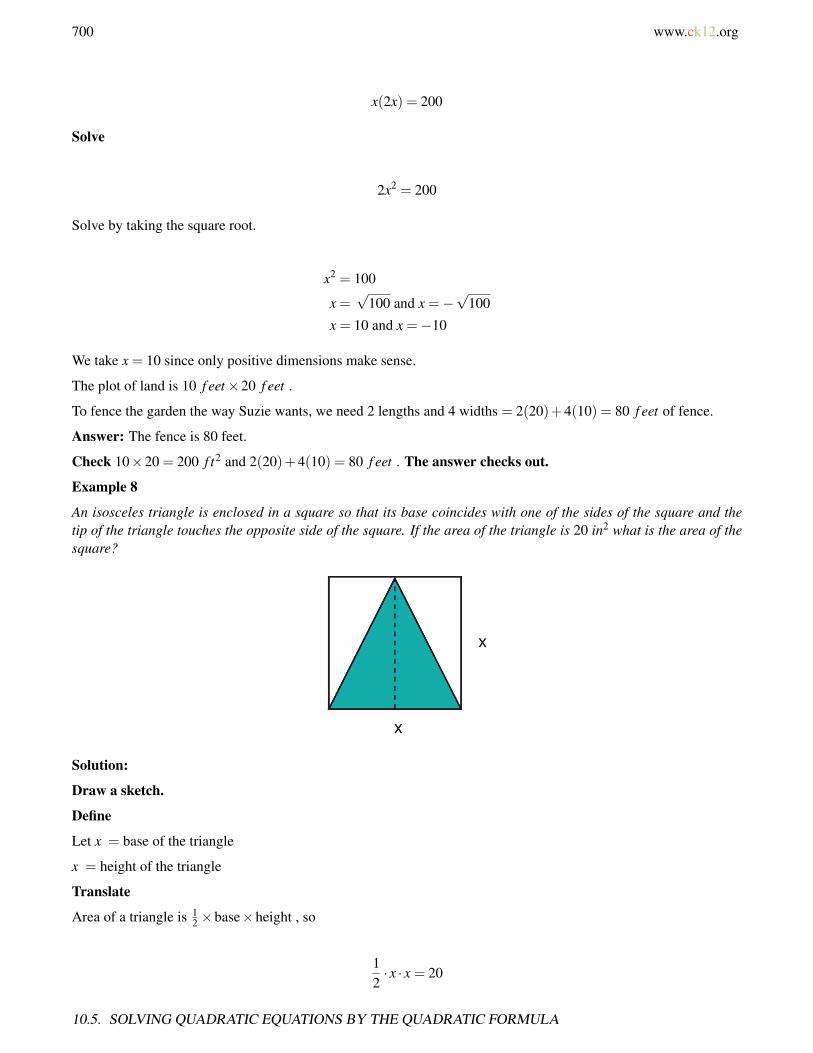
700 www.ck12.org
x(2x) = 200
Solve
2x2 = 200
Solve by taking the square root.
x2 = 100
x =√
100 and x =−√
100
x = 10 and x =−10
We take x = 10 since only positive dimensions make sense.
The plot of land is 10 f eet×20 f eet .
To fence the garden the way Suzie wants, we need 2 lengths and 4 widths = 2(20)+4(10) = 80 f eet of fence.
Answer: The fence is 80 feet.
Check 10×20 = 200 f t2 and 2(20)+4(10) = 80 f eet . The answer checks out.
Example 8
An isosceles triangle is enclosed in a square so that its base coincides with one of the sides of the square and thetip of the triangle touches the opposite side of the square. If the area of the triangle is 20 in2 what is the area of thesquare?
Solution:
Draw a sketch.
Define
Let x = base of the triangle
x = height of the triangle
Translate
Area of a triangle is 12 ×base×height , so
12· x · x = 20
10.5. SOLVING QUADRATIC EQUATIONS BY THE QUADRATIC FORMULA

www.ck12.org 701
Solve
12
x2 = 20
Solve by taking the square root.
x2 = 40
x =√
40 and x =−√
40
x≈ 6.32 and x≈−6.32
The side of the square is 6.32 inches.
The area of the square is (6.32)2 = 40 in2 , twice as big as the area of the triangle.
Answer: Area of the triangle is 40 in2
Check: It makes sense that the area of the square will be twice that of the triangle. If you look at the figure you cansee that you can fit two triangles inside the square.
The answer checks out.
Review Questions
Solve the following quadratic equations using the quadratic formula.
1. x2 +4x−21 = 02. x2−6x = 123. 3x2− 1
2 x = 38
4. 2x2 + x−3 = 05. −x2−7x+12 = 06. −3x2 +5x = 07. 4x2 = 08. x2 +2x+6 = 0
Solve the following quadratic equations using the method of your choice.
9. x2− x = 6
CHAPTER 10. QUADRATIC EQUATIONS AND QUADRATIC FUNCTIONS
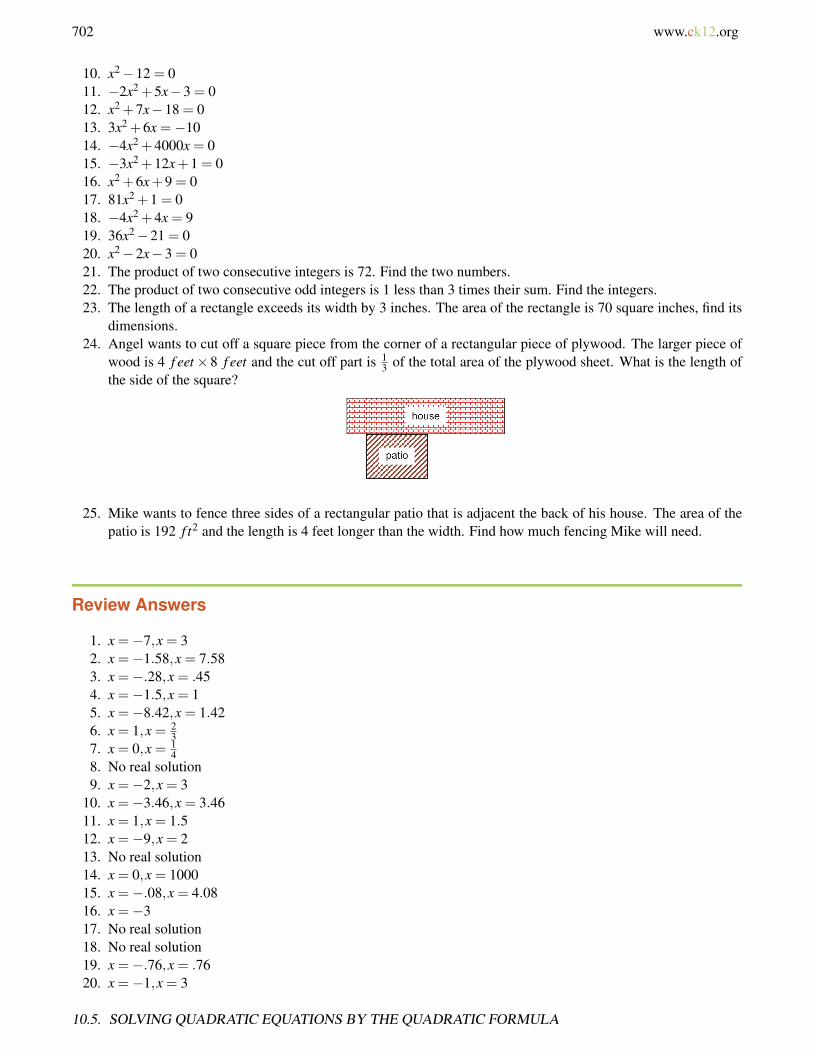
702 www.ck12.org
10. x2−12 = 011. −2x2 +5x−3 = 012. x2 +7x−18 = 013. 3x2 +6x =−1014. −4x2 +4000x = 015. −3x2 +12x+1 = 016. x2 +6x+9 = 017. 81x2 +1 = 018. −4x2 +4x = 919. 36x2−21 = 020. x2−2x−3 = 021. The product of two consecutive integers is 72. Find the two numbers.22. The product of two consecutive odd integers is 1 less than 3 times their sum. Find the integers.23. The length of a rectangle exceeds its width by 3 inches. The area of the rectangle is 70 square inches, find its
dimensions.24. Angel wants to cut off a square piece from the corner of a rectangular piece of plywood. The larger piece of
wood is 4 f eet×8 f eet and the cut off part is 13 of the total area of the plywood sheet. What is the length of
the side of the square?
25. Mike wants to fence three sides of a rectangular patio that is adjacent the back of his house. The area of thepatio is 192 f t2 and the length is 4 feet longer than the width. Find how much fencing Mike will need.
Review Answers
1. x =−7,x = 32. x =−1.58,x = 7.583. x =−.28,x = .454. x =−1.5,x = 15. x =−8.42,x = 1.426. x = 1,x = 2
37. x = 0,x = 1
48. No real solution9. x =−2,x = 3
10. x =−3.46,x = 3.4611. x = 1,x = 1.512. x =−9,x = 213. No real solution14. x = 0,x = 100015. x =−.08,x = 4.0816. x =−317. No real solution18. No real solution19. x =−.76,x = .7620. x =−1,x = 3
10.5. SOLVING QUADRATIC EQUATIONS BY THE QUADRATIC FORMULA

www.ck12.org 703
21. 8 and 922. 5 and 723. 7 in and 10 in24. side = 3.27 f t25. 40 feet of fencing.
CHAPTER 10. QUADRATIC EQUATIONS AND QUADRATIC FUNCTIONS

704 www.ck12.org
10.6 The Discriminant
Learning Objectives
• Find the discriminant of a quadratic equation.• Interpret the discriminant of a quadratic equation.• Solve real-world problems using quadratic functions and interpreting the discriminant.
Introduction
The quadratic equation is ax2 +bx+ c = 0 .
It can be solved using the quadratic formula x = −b±√
b2−4ac2a .
The expression inside the square root is called the discriminant, D = b2− 4ac . The discriminant can be used toanalyze the types of solutions of quadratic equations without actually solving the equation. Here are some guidelines.
• If b2−4ac > 0 , we obtain two separate real solutions.• If b2−4ac < 0 , we obtain non-real solutions.• If b2−4ac = 0 , we obtain one real solution, a double root.
Find the Discriminant of a Quadratic Equation
To find the discriminant of a quadratic equation, we calculate D = b2−4ac .
Example 1
Find the discriminant of each quadratic equation. Then tell how many solutions there will be to the quadraticequation without solving.
a) x2−5x+3 = 0
b) 4x2−4x+1 = 0
c) −2x2 + x = 4
Solution:
a) Substitute a = 1,b =−5 and c = 3 into the discriminant formula D = (−5)2−4(1)(3) = 13 .
There are two real solutions because D > 0 .
b) Substitute a = 4,b =−4 and c = 1 into the discriminant formula D = (−4)2−4(4)(1) = 0 .
There is one real solution because D = 0 .
c) Rewrite the equation in standard form −2x2 + x−4 = 0 .
Substitute a =−2,b = 1 and c =−4 into the discriminant formula: D = (1)2−4(−2)(−4) =−31 .
10.6. THE DISCRIMINANT
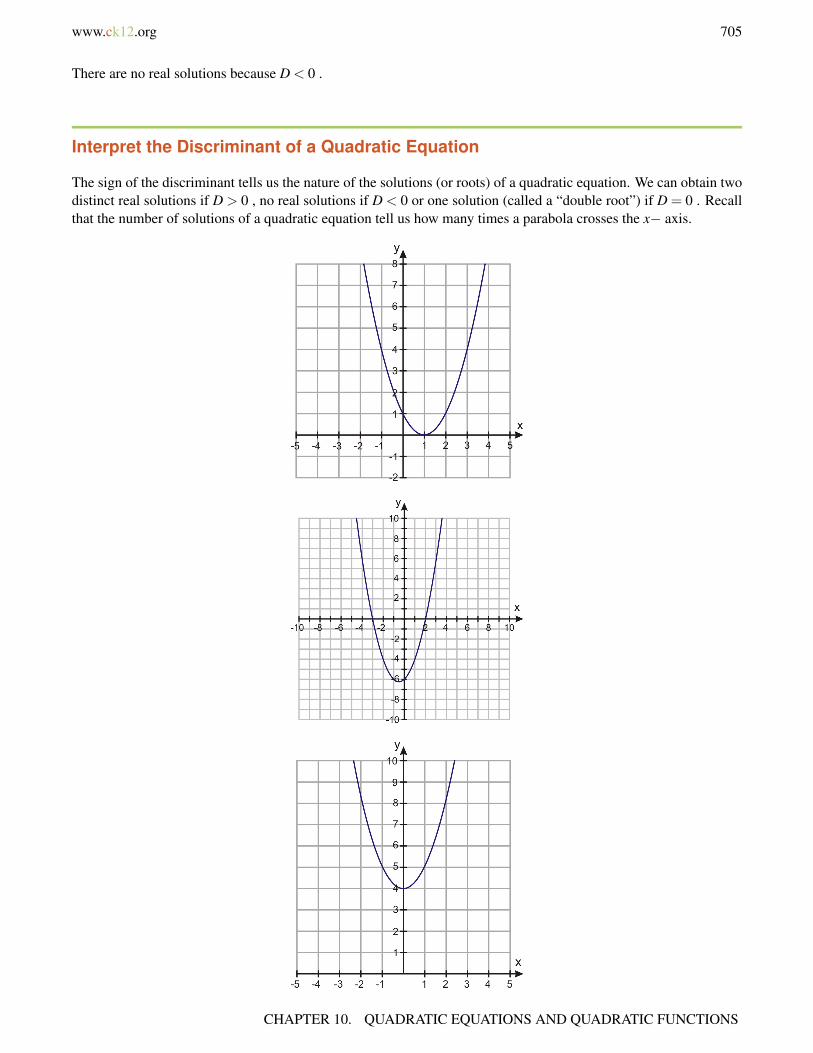
www.ck12.org 705
There are no real solutions because D < 0 .
Interpret the Discriminant of a Quadratic Equation
The sign of the discriminant tells us the nature of the solutions (or roots) of a quadratic equation. We can obtain twodistinct real solutions if D > 0 , no real solutions if D < 0 or one solution (called a “double root”) if D = 0 . Recallthat the number of solutions of a quadratic equation tell us how many times a parabola crosses the x− axis.
CHAPTER 10. QUADRATIC EQUATIONS AND QUADRATIC FUNCTIONS
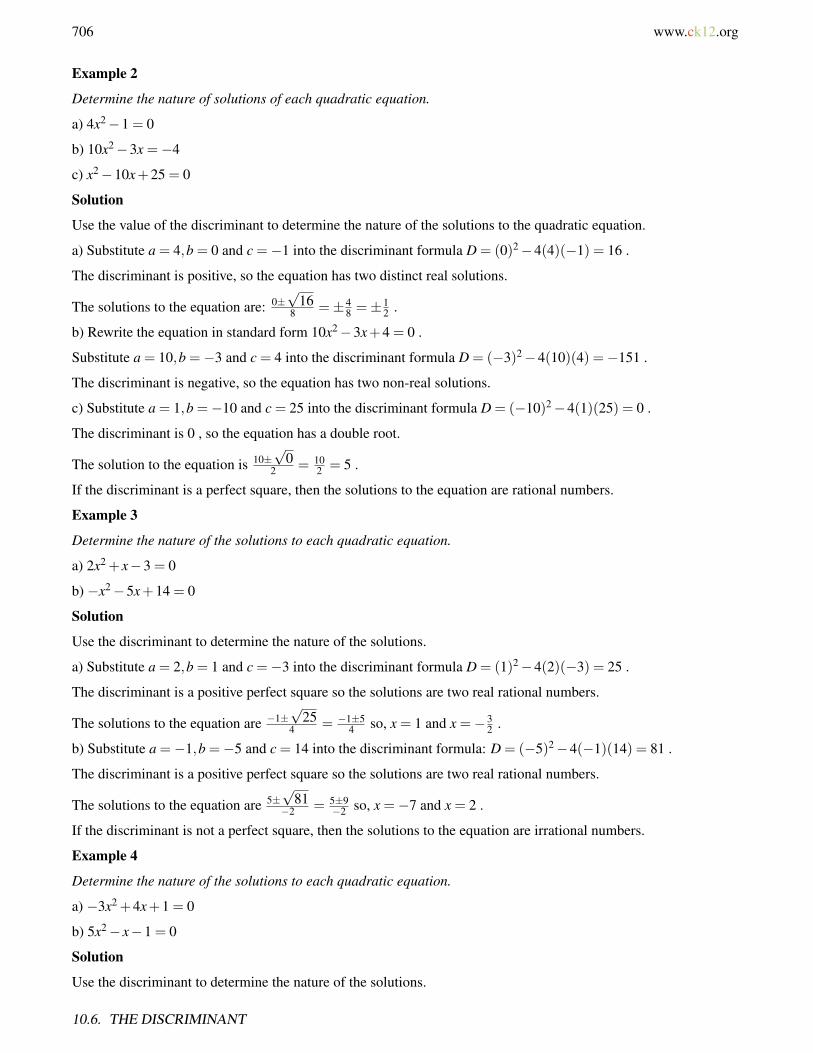
706 www.ck12.org
Example 2
Determine the nature of solutions of each quadratic equation.
a) 4x2−1 = 0
b) 10x2−3x =−4
c) x2−10x+25 = 0
Solution
Use the value of the discriminant to determine the nature of the solutions to the quadratic equation.
a) Substitute a = 4,b = 0 and c =−1 into the discriminant formula D = (0)2−4(4)(−1) = 16 .
The discriminant is positive, so the equation has two distinct real solutions.
The solutions to the equation are: 0±√
168 =±4
8 =±12 .
b) Rewrite the equation in standard form 10x2−3x+4 = 0 .
Substitute a = 10,b =−3 and c = 4 into the discriminant formula D = (−3)2−4(10)(4) =−151 .
The discriminant is negative, so the equation has two non-real solutions.
c) Substitute a = 1,b =−10 and c = 25 into the discriminant formula D = (−10)2−4(1)(25) = 0 .
The discriminant is 0 , so the equation has a double root.
The solution to the equation is 10±√
02 = 10
2 = 5 .
If the discriminant is a perfect square, then the solutions to the equation are rational numbers.
Example 3
Determine the nature of the solutions to each quadratic equation.
a) 2x2 + x−3 = 0
b) −x2−5x+14 = 0
Solution
Use the discriminant to determine the nature of the solutions.
a) Substitute a = 2,b = 1 and c =−3 into the discriminant formula D = (1)2−4(2)(−3) = 25 .
The discriminant is a positive perfect square so the solutions are two real rational numbers.
The solutions to the equation are −1±√
254 = −1±5
4 so, x = 1 and x =−32 .
b) Substitute a =−1,b =−5 and c = 14 into the discriminant formula: D = (−5)2−4(−1)(14) = 81 .
The discriminant is a positive perfect square so the solutions are two real rational numbers.
The solutions to the equation are 5±√
81−2 = 5±9
−2 so, x =−7 and x = 2 .
If the discriminant is not a perfect square, then the solutions to the equation are irrational numbers.
Example 4
Determine the nature of the solutions to each quadratic equation.
a) −3x2 +4x+1 = 0
b) 5x2− x−1 = 0
Solution
Use the discriminant to determine the nature of the solutions.
10.6. THE DISCRIMINANT

www.ck12.org 707
a) Substitute a =−3,b = 2 and c = 1 into the discriminant formula D = (4)2−4(−3)(1) = 28 .
The discriminant is a positive perfect square, so the solutions are two real irrational numbers.
The solutions to the equation are −2±√
28−6 so, x≈−0.55 and x≈ 1.22 .
b) Substitute a = 5,b =−1 and c =−1 into the discriminant formula D = (−1)2−4(5)(−1) = 21 .
The discriminant is a positive perfect square so the solutions are two real irrational numbers.
The solutions to the equation are 1±√
2010 so, x≈ 0.56 and x≈−0.36 .
Solve Real-World Problems Using Quadratic Functions and Interpreting the Dis-criminant
You saw that calculating the discriminant shows what types of solutions a quadratic equation possesses. Knowingthe types of solutions is very useful in applied problems. Consider the following situation.
Example 5
Marcus kicks a football in order to score a field goal. The height of the ball is given by the equation y =− 326400 x2+x
where y is the height and x is the horizontal distance the ball travels. We want to know if he kicked the ball hardenough to go over the goal post which is 10 feet high.
Solution
Define
Let y = height of the ball in feet
x = distance from the ball to the goalpost.
Translate We want to know if it is possible for the height of the ball to equal 10 feet at some real distance from thegoalpost.
10 =− 326400
x2 + x
Solve
Write the equation in standard form. − 326400
x2 + x−10 = 0
Simplify. −0.005x2 + x−10 = 0
Find the discriminant. D = (1)2−4(−0.005)(−10) = 0.8
Since the discriminant is positive, we know that it is possible for the ball to go over the goal post, if Marcus kicksit from an acceptable distance x from the goal post. From what distance can he score a field goal? See the nextexample.
Example 6 (continuation)
What is the farthest distance that he can kick the ball from and still make it over the goal post?
Solution
We need to solve for the value of x by using the quadratic formula.
CHAPTER 10. QUADRATIC EQUATIONS AND QUADRATIC FUNCTIONS

708 www.ck12.org
x =−1±
√0.8
−0.01≈ 10.6 or 189.4
This means that Marcus has to be closer that 189.4 feet or further than 10.6 feet to make the goal. (Why are theretwo solutions to this equation? Think about the path of a ball after it is kicked).
Example 7
Emma and Bradon own a factory that produces bike helmets. Their accountant says that their profit per year is givenby the function
P = 0.003x2 +12x+27760
In this equation x is the number of helmets produced. Their goal is to make a profit of $40,000 this year. Is thispossible?
Solution
We want to know if it is possible for the profit to equal $40,000.
40000 =−0.003x2 +12x+27760
Solve
Write the equation in standard form −0.003x2 +12x−12240 = 0
Find the discriminant. D = (12)2−4(−0.003)(−12240) =−2.88
Since the discriminant is negative, we know that there are no real solutions to this equation. Thus, it is not possiblefor Emma and Bradon to make a profit of $40,000 this year no matter how many helmets they make.
Review Questions
Find the discriminant of each quadratic equation.
1. 2x2−4x+5 = 02. x2−5x = 83. 4x2−12x+9 = 04. x2 +3x+2 = 05. x2−16x = 326. −5x2 +5x−6 = 0
Determine the nature of the solutions of each quadratic equation.
7. −x2 +3x−6 = 08. 5x2 = 6x9. 41x2−31x−52 = 0
10.6. THE DISCRIMINANT

www.ck12.org 709
10. x2−8x+16 = 011. −x2 +3x−10 = 012. x2−64 = 0
Without solving the equation, determine whether the solutions will be rational or irrational.
13. x2 =−4x+2014. x2 +2x−3 = 015. 3x2−11x = 1016. 1
2 x2 +2x+ 23 = 0
17. x2−10x+25 = 018. x2 = 5x19. Marty is outside his apartment building. He needs to give Yolanda her cell phone but he does not have time to
run upstairs to the third floor to give it to her. He throws it straight up with a vertical velocity of 55 feet/second.Will the phone reach her if she is 36 feet up? (Hint: The equation for the height is given by y=−32t2+55t+4.)
20. Bryson owns a business that manufactures and sells tires. The revenue from selling the tires in the month ofJuly is given by the function R = x(200− 0.4x) where x is the number of tires sold. Can Bryson’s businessgenerate revenue of $20,000 in the month of July?
Review Answers
1. D =−242. D = 573. D = 04. D = 15. D = 3846. D =−957. D =−15 no real solutions8. D = 36 two real solutions9. D = 9489 two real solutions
10. D = 0 one real solutions11. D =−31 no real solutions12. D = 256 two real solutions13. D = 96 two real irrational solutions14. D = 16 two real rational solutions15. D = 241 two real irrational solutions16. D = 8
3 two real irrational solutions17. D = 0 one real rational solution18. D = 25 two real rational solutions19. no20. yes
CHAPTER 10. QUADRATIC EQUATIONS AND QUADRATIC FUNCTIONS

710 www.ck12.org
10.7 Linear, Exponential and Quadratic Models
Learning Objectives
• Identify functions using differences and ratios.• Write equations for functions.• Perform exponential and quadratic regressions with a graphing calculator.• Solve real-world problems by comparing function models.
Introduction
In this course you have learned about three types of functions, linear, quadratic and exponential.
Linear functions take the form y = mx = b .
Quadratic functions take the form y = ax2 +bx+ c .
Exponential functions take the form y = a ·bx .
In real-world applications, the function that describes some physical situation is not given. Finding the function isan important part of solving problems. For example, scientific data such as observations of planetary motion areoften collected as a set of measurements given in a table. One job for the scientist is to figure out which functionbest fits the data. In this section, you will learn some methods that are used to identify which function describes therelationship between the dependent and independent variables in a problem.
Identify Functions Using Differences or Ratios.
One method for identifying functions is to look at the difference or the ratio of different values of the dependentvariable.
We use differences to identify linear functions.
If the difference between values of the dependent variable is the same each time we change the independentvariable by the same amount, then the function is linear.
Example 1
Determine if the function represented by the following table of values is linear.
10.7. LINEAR, EXPONENTIAL AND QUADRATIC MODELS

www.ck12.org 711
If we take the difference between consecutive y− values, we see that each time the x− value increases by one, they− value always increases by 3.
Since the difference is always the same, the function is linear.
When we look at the difference of the y− values, we must make sure that we examine entries for which the x−values increase by the same amount.
For example, examine the values in the following table.
At first glance, this function might not look linear because the difference in the y− values is not always the same.
However, we see that the difference in y− values is 5 when we increase the x− values by 1, and it i 10 when weincrease the x− values by 2. This means that the difference in y− values is always 5 when we increase the x− valuesby 1. Therefore, the function is linear. The key to this observation is that the ratio of the differences is constant.
In mathematical notation, we can write the linear property as follows.
If y2−y1x2−x1
is always the same for values of the dependent and independent variables, then the points are on a line.Notice that the expression we wrote is the definition of the slope of a line.
Differences can also be used to identify quadratic functions. For a quadratic function, when we increase the x−values by the same amount,
the difference between y− values will not be the same. However, the difference of the differences of the y− valueswill be the same.
Here are some examples of quadratic relationships represented by tables of values.
a)
CHAPTER 10. QUADRATIC EQUATIONS AND QUADRATIC FUNCTIONS
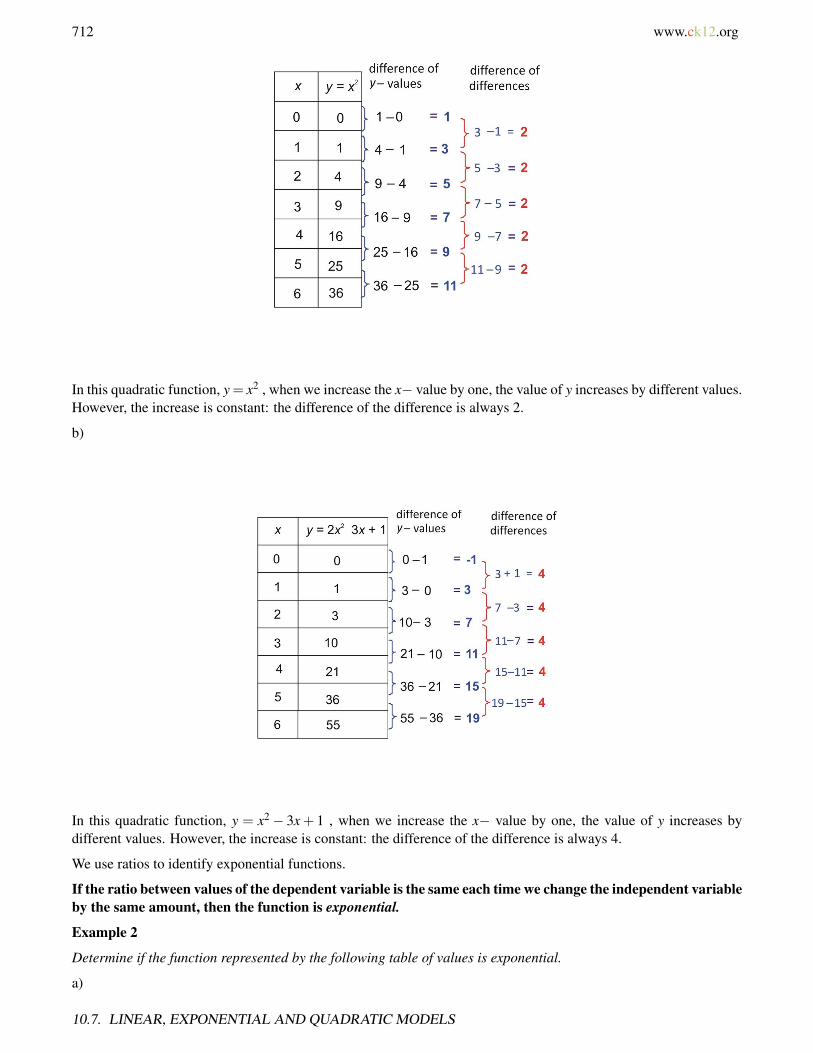
712 www.ck12.org
In this quadratic function, y = x2 , when we increase the x− value by one, the value of y increases by different values.However, the increase is constant: the difference of the difference is always 2.
b)
In this quadratic function, y = x2− 3x+ 1 , when we increase the x− value by one, the value of y increases bydifferent values. However, the increase is constant: the difference of the difference is always 4.
We use ratios to identify exponential functions.
If the ratio between values of the dependent variable is the same each time we change the independent variableby the same amount, then the function is exponential.
Example 2
Determine if the function represented by the following table of values is exponential.
a)
10.7. LINEAR, EXPONENTIAL AND QUADRATIC MODELS

www.ck12.org 713
If we take the ratio of consecutive y− values, we see that each time the x− value increases by one, the y− value ismultiplied by 3.
Since the ratio is always the same, the function is exponential.
b)
If we take the ratio of consecutive y− values, we see that each time the x− value increases by one, the y− value ismultiplied by 1
2 .
Since the ratio is always the same, the function is exponential.
Write Equations for Functions.
Once we identify which type of function fits the given values, we can write an equation for the function by startingwith the general form for that type of function.
Example 3
Determine what type of function represents the values in the following table.
CHAPTER 10. QUADRATIC EQUATIONS AND QUADRATIC FUNCTIONS

714 www.ck12.org
TABLE 10.16:
x y0 31 12 -33 -74 -11
Solution
Let’s first check the difference of consecutive values of y .
If we take the difference between consecutive y− values, we see that each time the x− value increases by one, they− value always decreases by 4. Since the difference is always the same, the function is linear.
To find the equation for the function that represents these values, we start with the general form of a linear function.
y = mx+b
Here [U+0080][U+009C]m[U+0080][U+009D] is the slope of the line and is defined as the quantity by which yincreases every time the value of x increases by one. The constant b is the value of the function when x = 0 .Therefore, the function is
y =−4x+5
Example 4
Determine what type of function represents the values in the following table.
TABLE 10.17:
x y0 01 52 203 45
10.7. LINEAR, EXPONENTIAL AND QUADRATIC MODELS

www.ck12.org 715
TABLE 10.17: (continued)
x y4 805 1256 180
Solution
Let’s first check the difference of consecutive values of y .
If we take the difference between consecutive y− values, we see that each time the x− value increases by one, they− value does not remain constant. Since the difference is not the same, the function is not linear.
Now, let’s check the difference of the differences in the values of y .
When we increase the x− value by one, the value of y increases by different values. However, the increase isconstant. The difference of the differences is always 10 when we increase the x− value by one.
The function describing these set of values is quadratic. To find the equation for the function that represents thesevalues, we start with the general form of a quadratic function.
y = ax2 +bx+ c
CHAPTER 10. QUADRATIC EQUATIONS AND QUADRATIC FUNCTIONS
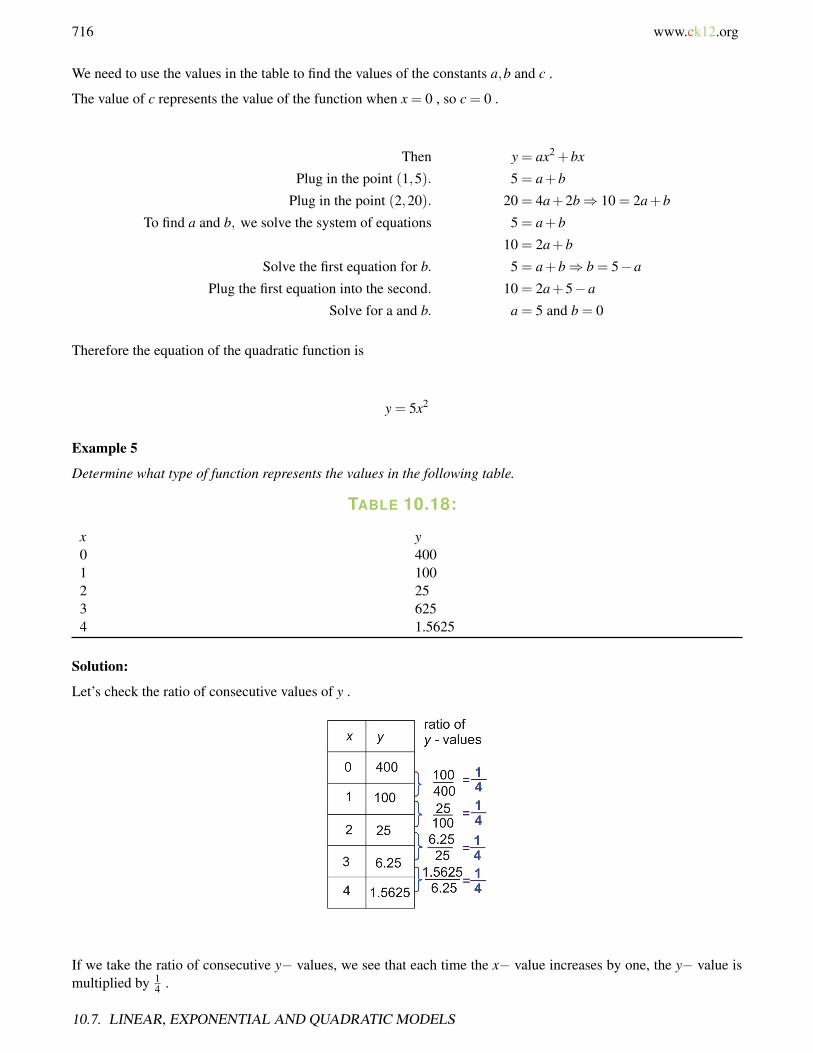
716 www.ck12.org
We need to use the values in the table to find the values of the constants a,b and c .
The value of c represents the value of the function when x = 0 , so c = 0 .
Then y = ax2 +bx
Plug in the point (1,5). 5 = a+b
Plug in the point (2,20). 20 = 4a+2b⇒ 10 = 2a+b
To find a and b, we solve the system of equations 5 = a+b
10 = 2a+b
Solve the first equation for b. 5 = a+b⇒ b = 5−a
Plug the first equation into the second. 10 = 2a+5−a
Solve for a and b. a = 5 and b = 0
Therefore the equation of the quadratic function is
y = 5x2
Example 5
Determine what type of function represents the values in the following table.
TABLE 10.18:
x y0 4001 1002 253 6254 1.5625
Solution:
Let’s check the ratio of consecutive values of y .
If we take the ratio of consecutive y− values, we see that each time the x− value increases by one, the y− value ismultiplied by 1
4 .
10.7. LINEAR, EXPONENTIAL AND QUADRATIC MODELS
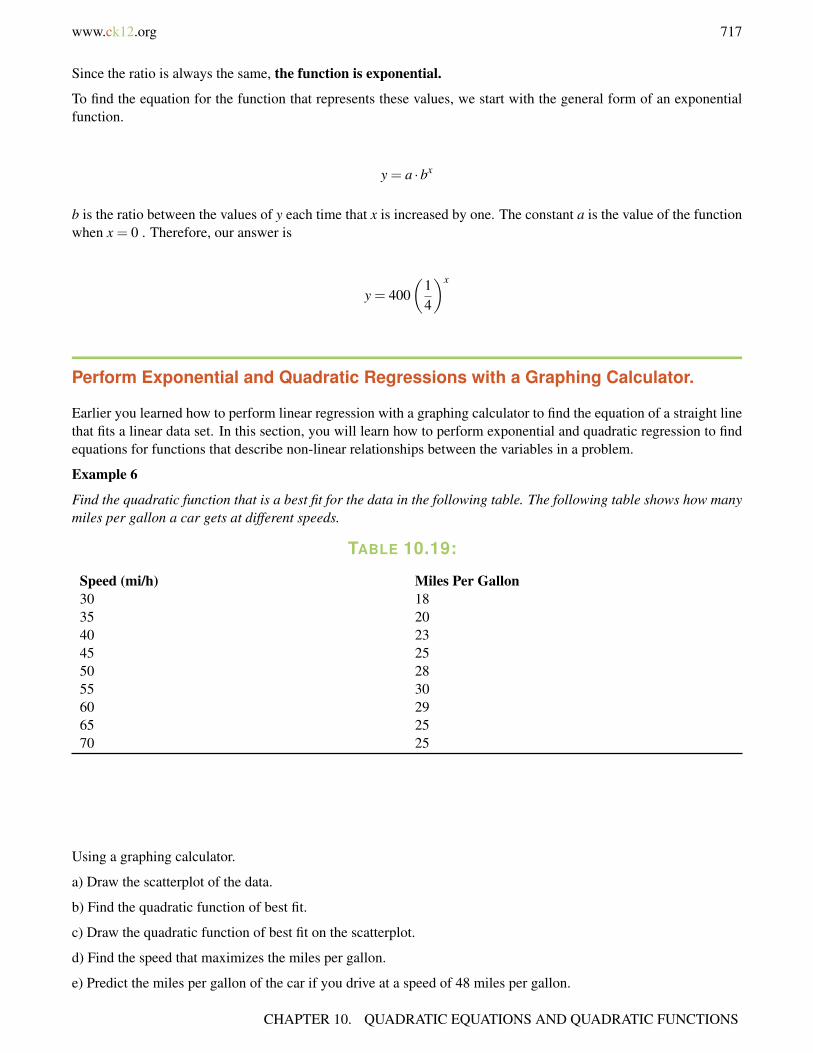
www.ck12.org 717
Since the ratio is always the same, the function is exponential.
To find the equation for the function that represents these values, we start with the general form of an exponentialfunction.
y = a ·bx
b is the ratio between the values of y each time that x is increased by one. The constant a is the value of the functionwhen x = 0 . Therefore, our answer is
y = 400(
14
)x
Perform Exponential and Quadratic Regressions with a Graphing Calculator.
Earlier you learned how to perform linear regression with a graphing calculator to find the equation of a straight linethat fits a linear data set. In this section, you will learn how to perform exponential and quadratic regression to findequations for functions that describe non-linear relationships between the variables in a problem.
Example 6
Find the quadratic function that is a best fit for the data in the following table. The following table shows how manymiles per gallon a car gets at different speeds.
TABLE 10.19:
Speed (mi/h) Miles Per Gallon30 1835 2040 2345 2550 2855 3060 2965 2570 25
Using a graphing calculator.
a) Draw the scatterplot of the data.
b) Find the quadratic function of best fit.
c) Draw the quadratic function of best fit on the scatterplot.
d) Find the speed that maximizes the miles per gallon.
e) Predict the miles per gallon of the car if you drive at a speed of 48 miles per gallon.
CHAPTER 10. QUADRATIC EQUATIONS AND QUADRATIC FUNCTIONS
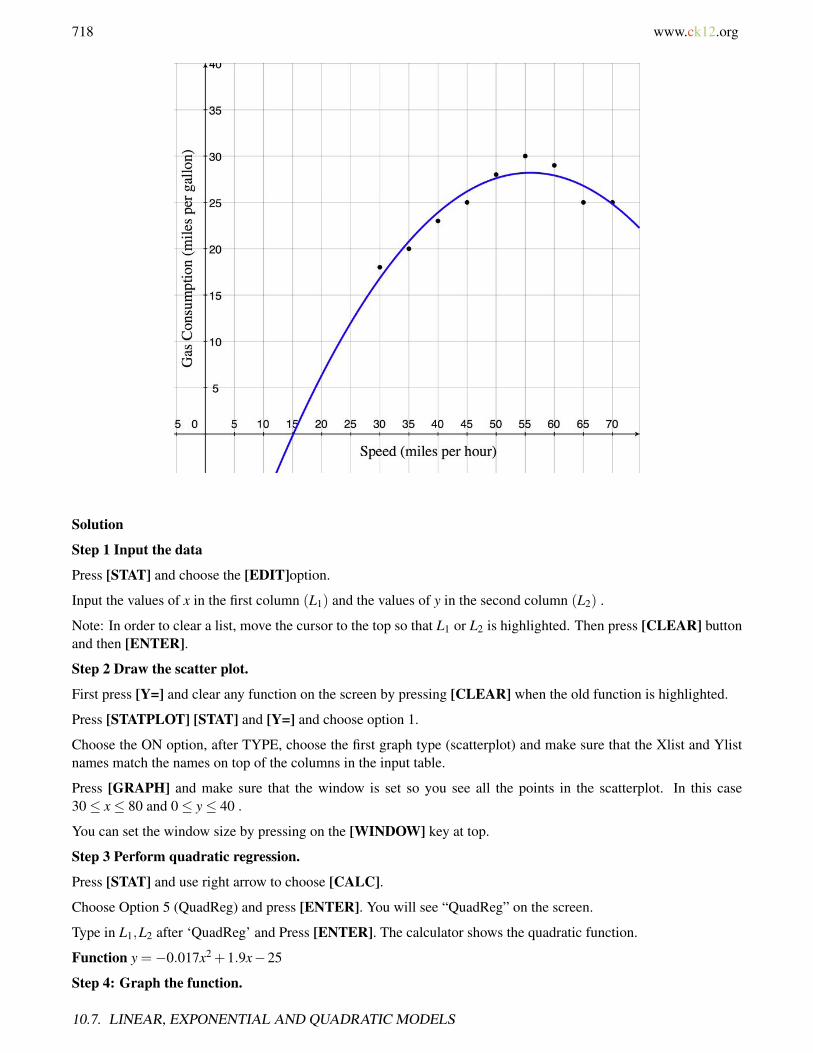
718 www.ck12.org
Solution
Step 1 Input the data
Press [STAT] and choose the [EDIT]option.
Input the values of x in the first column (L1) and the values of y in the second column (L2) .
Note: In order to clear a list, move the cursor to the top so that L1 or L2 is highlighted. Then press [CLEAR] buttonand then [ENTER].
Step 2 Draw the scatter plot.
First press [Y=] and clear any function on the screen by pressing [CLEAR] when the old function is highlighted.
Press [STATPLOT] [STAT] and [Y=] and choose option 1.
Choose the ON option, after TYPE, choose the first graph type (scatterplot) and make sure that the Xlist and Ylistnames match the names on top of the columns in the input table.
Press [GRAPH] and make sure that the window is set so you see all the points in the scatterplot. In this case30≤ x≤ 80 and 0≤ y≤ 40 .
You can set the window size by pressing on the [WINDOW] key at top.
Step 3 Perform quadratic regression.
Press [STAT] and use right arrow to choose [CALC].
Choose Option 5 (QuadReg) and press [ENTER]. You will see “QuadReg” on the screen.
Type in L1,L2 after ‘QuadReg’ and Press [ENTER]. The calculator shows the quadratic function.
Function y =−0.017x2 +1.9x−25
Step 4: Graph the function.
10.7. LINEAR, EXPONENTIAL AND QUADRATIC MODELS
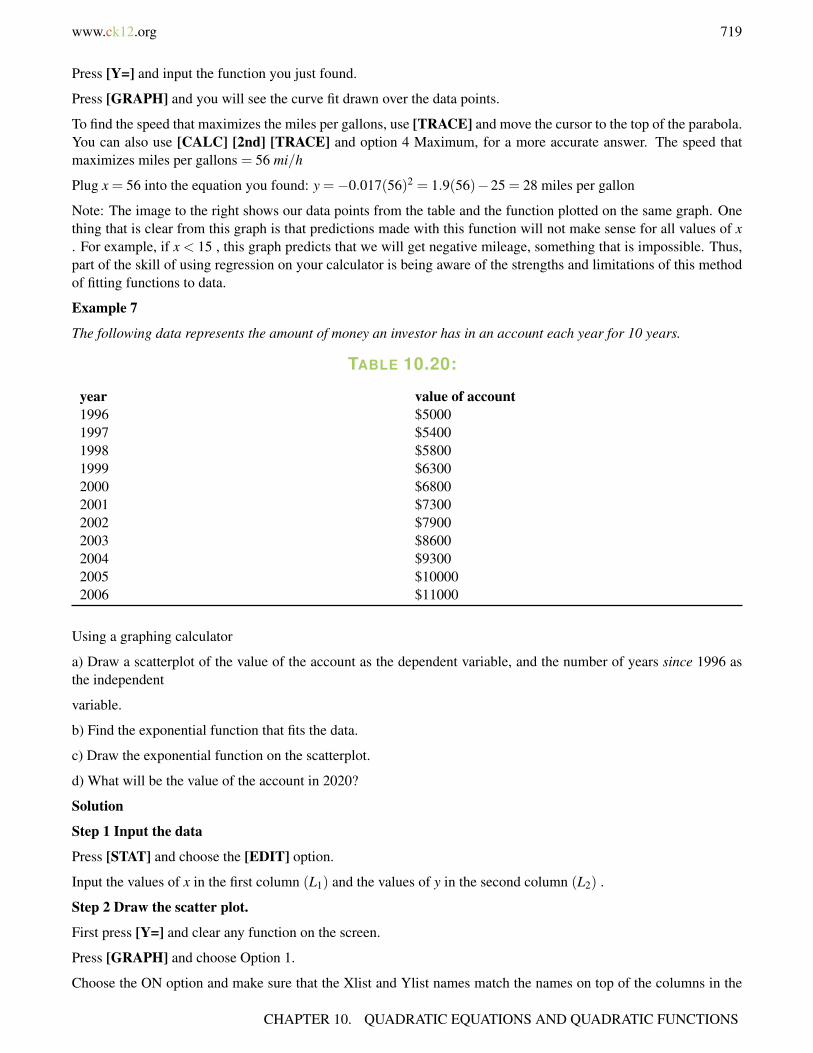
www.ck12.org 719
Press [Y=] and input the function you just found.
Press [GRAPH] and you will see the curve fit drawn over the data points.
To find the speed that maximizes the miles per gallons, use [TRACE] and move the cursor to the top of the parabola.You can also use [CALC] [2nd] [TRACE] and option 4 Maximum, for a more accurate answer. The speed thatmaximizes miles per gallons = 56 mi/h
Plug x = 56 into the equation you found: y =−0.017(56)2 = 1.9(56)−25 = 28 miles per gallon
Note: The image to the right shows our data points from the table and the function plotted on the same graph. Onething that is clear from this graph is that predictions made with this function will not make sense for all values of x. For example, if x < 15 , this graph predicts that we will get negative mileage, something that is impossible. Thus,part of the skill of using regression on your calculator is being aware of the strengths and limitations of this methodof fitting functions to data.
Example 7
The following data represents the amount of money an investor has in an account each year for 10 years.
TABLE 10.20:
year value of account1996 $50001997 $54001998 $58001999 $63002000 $68002001 $73002002 $79002003 $86002004 $93002005 $100002006 $11000
Using a graphing calculator
a) Draw a scatterplot of the value of the account as the dependent variable, and the number of years since 1996 asthe independent
variable.
b) Find the exponential function that fits the data.
c) Draw the exponential function on the scatterplot.
d) What will be the value of the account in 2020?
Solution
Step 1 Input the data
Press [STAT] and choose the [EDIT] option.
Input the values of x in the first column (L1) and the values of y in the second column (L2) .
Step 2 Draw the scatter plot.
First press [Y=] and clear any function on the screen.
Press [GRAPH] and choose Option 1.
Choose the ON option and make sure that the Xlist and Ylist names match the names on top of the columns in the
CHAPTER 10. QUADRATIC EQUATIONS AND QUADRATIC FUNCTIONS

720 www.ck12.org
input table.
Press [GRAPH] make sure that the window is set so you see all the points in the scatterplot. In this case: 0≤ x≤ 10and 0≤ y≤ 11000 .
Step 3 Perform exponential regression.
Press [STAT] and use right arrow to choose [CALC] .
Choose Option 0 and press [ENTER]. You will see “ExpReg” on the screen.
Press [ENTER]. The calculator shows the exponential function.
Function y = 4975.7(1.08)x
Step 4: Graph the function.
Press [Y=] and input the function you just found. Press [GRAPH].
Substitute x = 2020−1996 = 24 into the function y = 4975.7(1.08)24 = $31551.81 .
Note: This is a curve fit. So the function above is the curve that comes closest to all the data points. It will not returny values that are exactly the same as in the data table, but they will be close. It is actually more accurate to use thecurve fit values than the data points.
Solve Real-World Problems by Comparing Function Models
Example 8
The following table shows the number of students enrolled in public elementary schools in the US (source: USCensus Bureau). Make a scatterplot with the number of students as the dependent variable, and the number of yearssince 1990 as the independent variable. Find which curve fits this data the best and predict the school enrollment inthe year 2007.
TABLE 10.21:
Year Number of Students (millions)1990 26.61991 26.61992 27.11993 27.71994 28.11995 28.41996 28.11997 29.11998 29.32003 32.5
Solution
We will perform linear, quadratic and exponential regression on this data set and see which function represents thevalues in the table the best.
Step 1 Input the data.
Input the values of x in the first column (L1) and the values of y in the second column (L2) .
Step 2 Draw the scatter plot.
10.7. LINEAR, EXPONENTIAL AND QUADRATIC MODELS
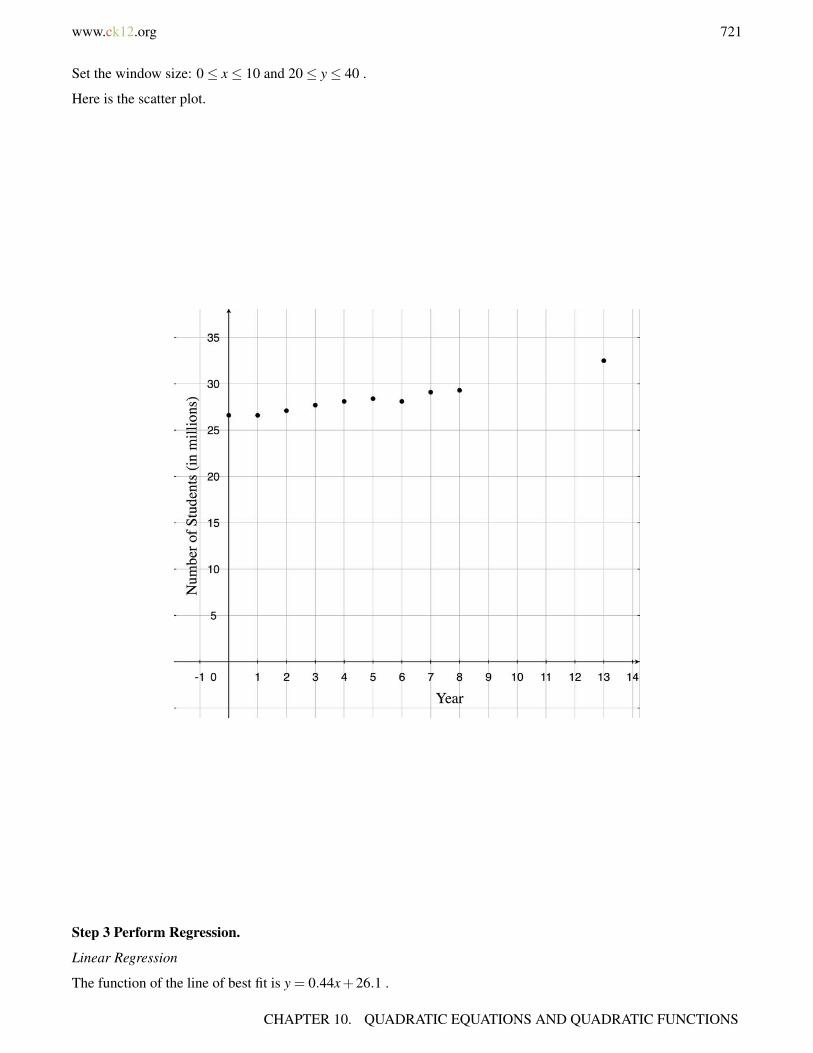
www.ck12.org 721
Set the window size: 0≤ x≤ 10 and 20≤ y≤ 40 .
Here is the scatter plot.
Step 3 Perform Regression.
Linear Regression
The function of the line of best fit is y = 0.44x+26.1 .
CHAPTER 10. QUADRATIC EQUATIONS AND QUADRATIC FUNCTIONS
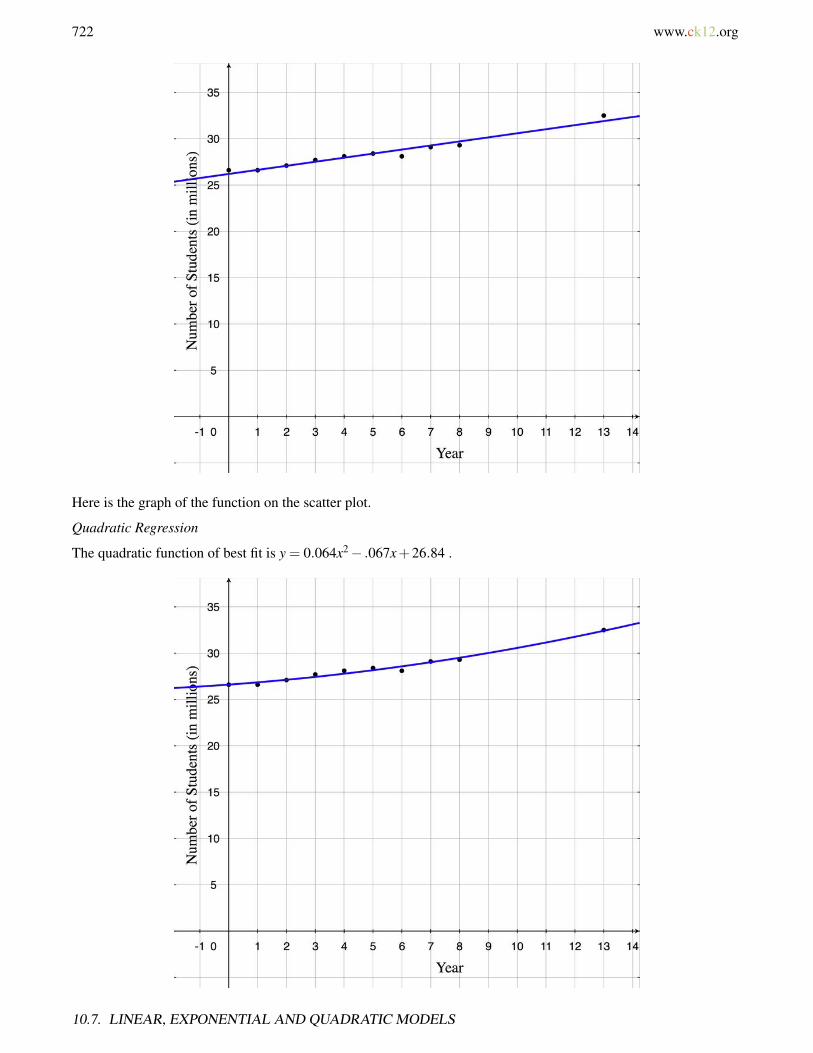
722 www.ck12.org
Here is the graph of the function on the scatter plot.
Quadratic Regression
The quadratic function of best fit is y = 0.064x2− .067x+26.84 .
10.7. LINEAR, EXPONENTIAL AND QUADRATIC MODELS

www.ck12.org 723
Here is the graph of the function on the scatter plot.
Exponential Regression
The exponential function of best fit is y = 26.2(1.018)x .
Here is the graph of the function on the scatter plot.
From the graphs, it looks like the quadratic function is the best fit for this data set. We use this function to predictschool enrollment in 2007.
Substitute x = 2007−1990 = 17
y = 0.064(17)2− .067(17)+26.84 = 44.2 million students
Review Questions
Determine whether the data in the following tables can be represented by a linear function.
TABLE 10.22:
x y−4 10-3 7-2 4-1 10 -2
CHAPTER 10. QUADRATIC EQUATIONS AND QUADRATIC FUNCTIONS
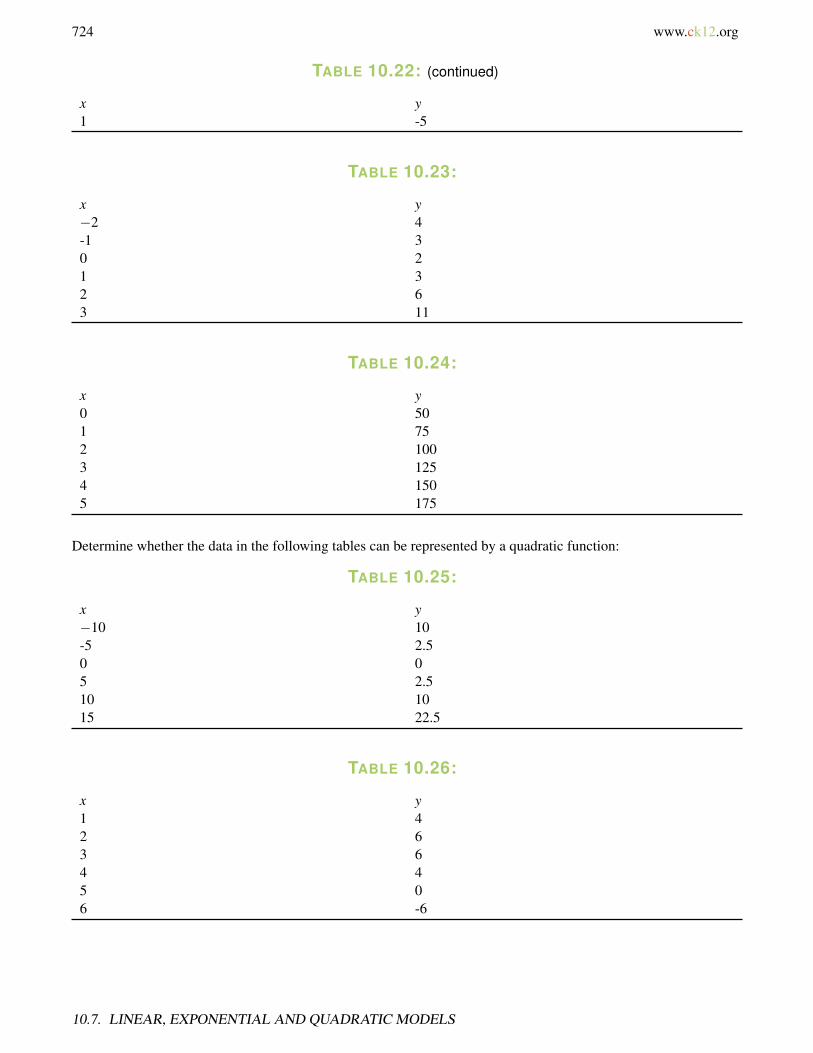
724 www.ck12.org
TABLE 10.22: (continued)
x y1 -5
TABLE 10.23:
x y−2 4-1 30 21 32 63 11
TABLE 10.24:
x y0 501 752 1003 1254 1505 175
Determine whether the data in the following tables can be represented by a quadratic function:
TABLE 10.25:
x y−10 10-5 2.50 05 2.510 1015 22.5
TABLE 10.26:
x y1 42 63 64 45 06 -6
10.7. LINEAR, EXPONENTIAL AND QUADRATIC MODELS
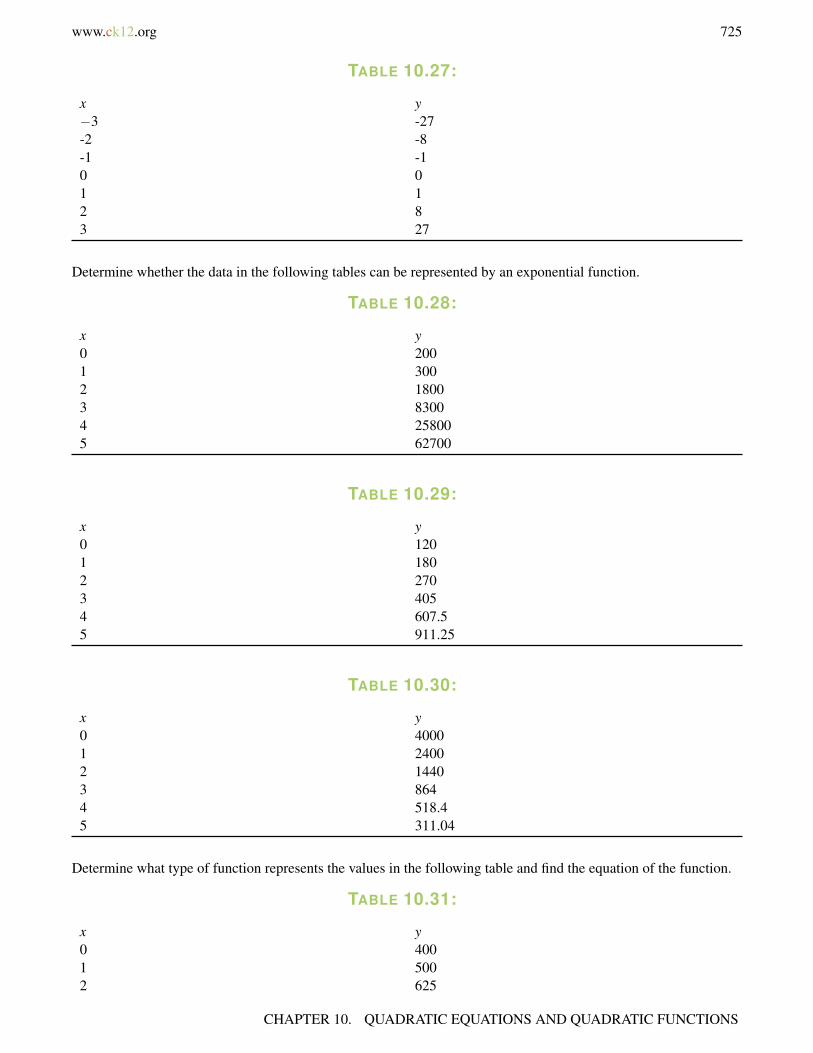
www.ck12.org 725
TABLE 10.27:
x y−3 -27-2 -8-1 -10 01 12 83 27
Determine whether the data in the following tables can be represented by an exponential function.
TABLE 10.28:
x y0 2001 3002 18003 83004 258005 62700
TABLE 10.29:
x y0 1201 1802 2703 4054 607.55 911.25
TABLE 10.30:
x y0 40001 24002 14403 8644 518.45 311.04
Determine what type of function represents the values in the following table and find the equation of the function.
TABLE 10.31:
x y0 4001 5002 625
CHAPTER 10. QUADRATIC EQUATIONS AND QUADRATIC FUNCTIONS

726 www.ck12.org
TABLE 10.31: (continued)
x y3 781.254 976.5625
TABLE 10.32:
x y−9 -3-7 -2-5 -1-3 0-1 11 2
TABLE 10.33:
x y−3 14-2 4-1 -20 -41 -22 43 14
13. As a ball bounces up and down, the maximum height that the ball reaches continually decreases from onebounce to the next. For a given bounce, the table shows the height of the ball with respect to time.
TABLE 10.34:
Time (seconds) Height (inches)2 22.2 162.4 242.6 332.8 383.0 423.2 363.4 303.6 283.8 144.0 6
Using a graphing calculator
a. Draw the scatter plot of the data.b. Find the quadratic function of best fit.
10.7. LINEAR, EXPONENTIAL AND QUADRATIC MODELS

www.ck12.org 727
c. Draw the quadratic function of best fit on the scatter plot.d. Find the maximum height the ball reaches on the bounce.e. Predict how high the ball is at time t = 2.5 seconds .
14. A chemist has a 250 gram sample of a radioactive material. She records the amount of radioactive materialremaining in the sample every day for a week and obtains the data in the following table.
TABLE 10.35:
Day Weight(grams)0 2501 2082 1583 1304 1025 806 657 50
Using a graphing calculator,
a. Draw a scatterplot of the data.b. Find the exponential function of best fit.c. Draw the exponential function of best fit on the scatter plot.d. Predict the amount of material after 10 days.
15. The following table shows the rate of pregnancies (per 1000) for US women aged 15 to 19. (source: USCensus Bureau). Make a scatterplot with the rate of pregnancies as the dependent variable and the number ofyears since 1990 as the independent variable. Find which curve fits this data the best and predict the rate ofteen pregnancies in the year 2010.
TABLE 10.36:
Year Rate of Pregnancy (per 1000)1990 116.91991 115.31992 111.01993 108.01994 104.61995 99.61996 95.61997 91.41998 88.71999 85.72000 83.62001 79.52002 75.4
CHAPTER 10. QUADRATIC EQUATIONS AND QUADRATIC FUNCTIONS

728 www.ck12.org
Review Answers
1. Linear common difference =−32. Not Linear3. Linear common difference = 254. Quadratic difference of difference = 55. Quadratic difference of difference =−26. Not Quadratic7. Not Exponential8. Exponential common ratio = 1.59. Exponential common ratio = 0.6
10. Exponential y = 400(1.25)x
11. Linear y =(1
2
)x+(3
2
)12. Quadratic y = 2x2−4
a.b. y =−35.4x2 +213.3x−282.4 ;c. Maximum height = 38.9 inches .d. t = 2.5 sec,height = 29.6 inches .
10.7. LINEAR, EXPONENTIAL AND QUADRATIC MODELS
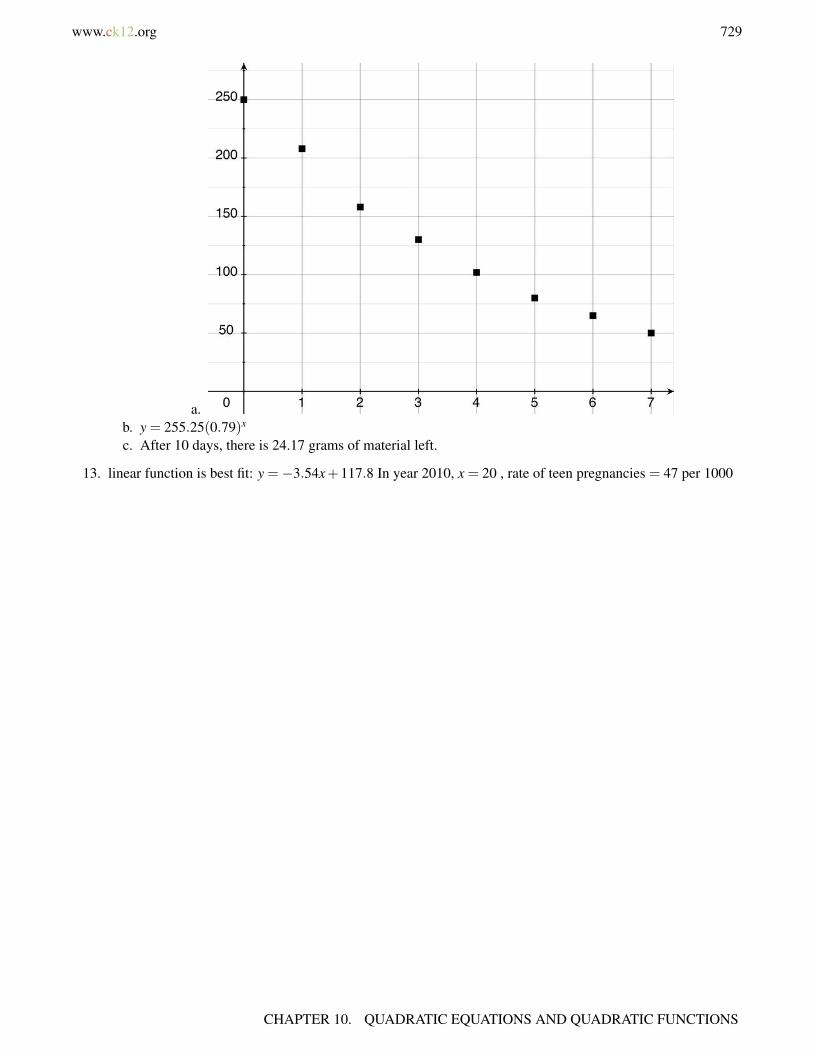
www.ck12.org 729
a.b. y = 255.25(0.79)x
c. After 10 days, there is 24.17 grams of material left.
13. linear function is best fit: y =−3.54x+117.8 In year 2010, x = 20 , rate of teen pregnancies = 47 per 1000
CHAPTER 10. QUADRATIC EQUATIONS AND QUADRATIC FUNCTIONS

730 www.ck12.org
10.8 Problem Solving Strategies: Choose aFunction Model
Learning Objectives
• Read and understand given problem situations• Develop and use the strategy: Choose a Function• Develop and use the strategy: Make a Model• Plan and compare alternative approaches to solving problems• Solve real-world problems using selected strategies as part of a plan
Introduction
As you learn more and more mathematical methods and skills, it is important to think about the purpose of mathe-matics and how it works as part of a bigger picture. Mathematics is used to solve problems which often arise fromreal-life situations. Mathematical modeling is a process by which we start with a real-life situation and arrive at aquantitative solution. Modeling involves creating a set of mathematical equations that describes a situation, solvingthose equations and using them to understand the real-life problem. Often the model needs to be adjusted because itdoes not describe the situation as well as we wish.
A mathematical model can be used to gain understanding of a real-life situation by learning how the system works,which variables are important in the system and how they are related to each other. Models can also be used topredict and forecast what a system will do in the future or for different values of a parameter. Lastly, a model can beused to estimate quantities that are difficult to evaluate exactly.
Mathematical models are like other types of models. The goal is not to produce an exact copy of the “real” objectbut rather to give a representation of some aspect of the real thing. The modeling process can be summarized asfollows.
Notice that the modeling process is very similar to the problem solving format we have been using throughout this
10.8. PROBLEM SOLVING STRATEGIES: CHOOSE A FUNCTION MODEL
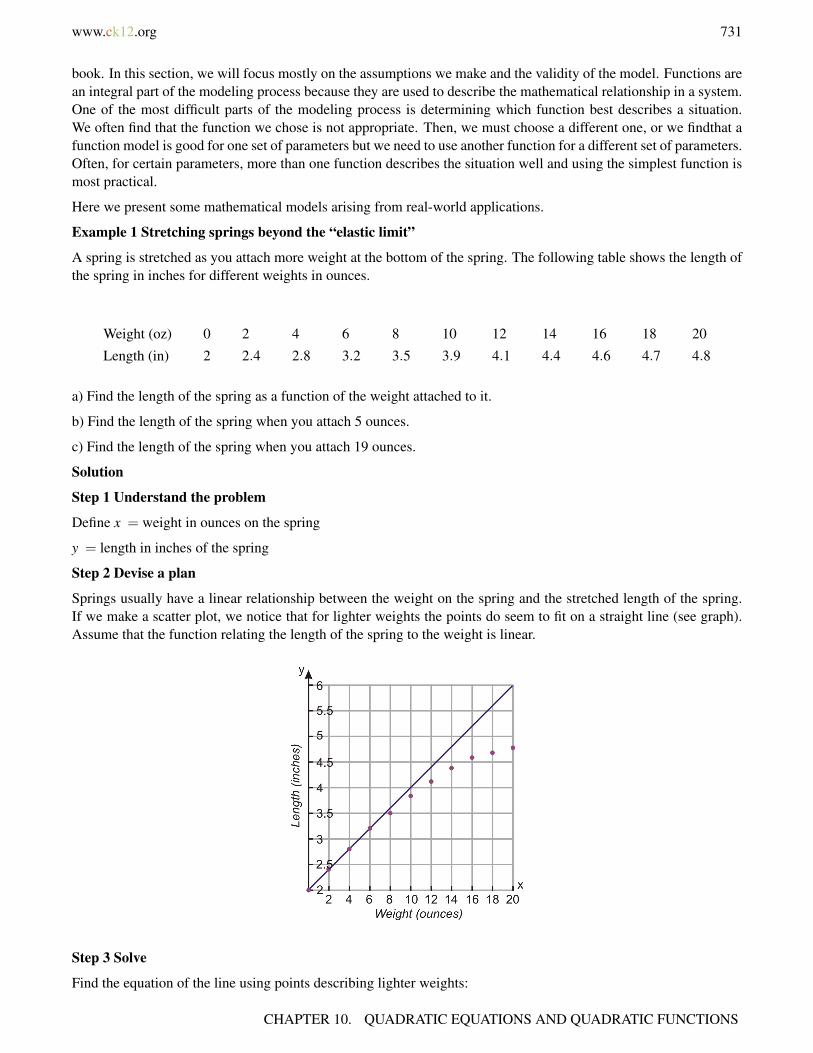
www.ck12.org 731
book. In this section, we will focus mostly on the assumptions we make and the validity of the model. Functions arean integral part of the modeling process because they are used to describe the mathematical relationship in a system.One of the most difficult parts of the modeling process is determining which function best describes a situation.We often find that the function we chose is not appropriate. Then, we must choose a different one, or we findthat afunction model is good for one set of parameters but we need to use another function for a different set of parameters.Often, for certain parameters, more than one function describes the situation well and using the simplest function ismost practical.
Here we present some mathematical models arising from real-world applications.
Example 1 Stretching springs beyond the “elastic limit”
A spring is stretched as you attach more weight at the bottom of the spring. The following table shows the length ofthe spring in inches for different weights in ounces.
Weight (oz) 0 2 4 6 8 10 12 14 16 18 20
Length (in) 2 2.4 2.8 3.2 3.5 3.9 4.1 4.4 4.6 4.7 4.8
a) Find the length of the spring as a function of the weight attached to it.
b) Find the length of the spring when you attach 5 ounces.
c) Find the length of the spring when you attach 19 ounces.
Solution
Step 1 Understand the problem
Define x = weight in ounces on the spring
y = length in inches of the spring
Step 2 Devise a plan
Springs usually have a linear relationship between the weight on the spring and the stretched length of the spring.If we make a scatter plot, we notice that for lighter weights the points do seem to fit on a straight line (see graph).Assume that the function relating the length of the spring to the weight is linear.
Step 3 Solve
Find the equation of the line using points describing lighter weights:
CHAPTER 10. QUADRATIC EQUATIONS AND QUADRATIC FUNCTIONS
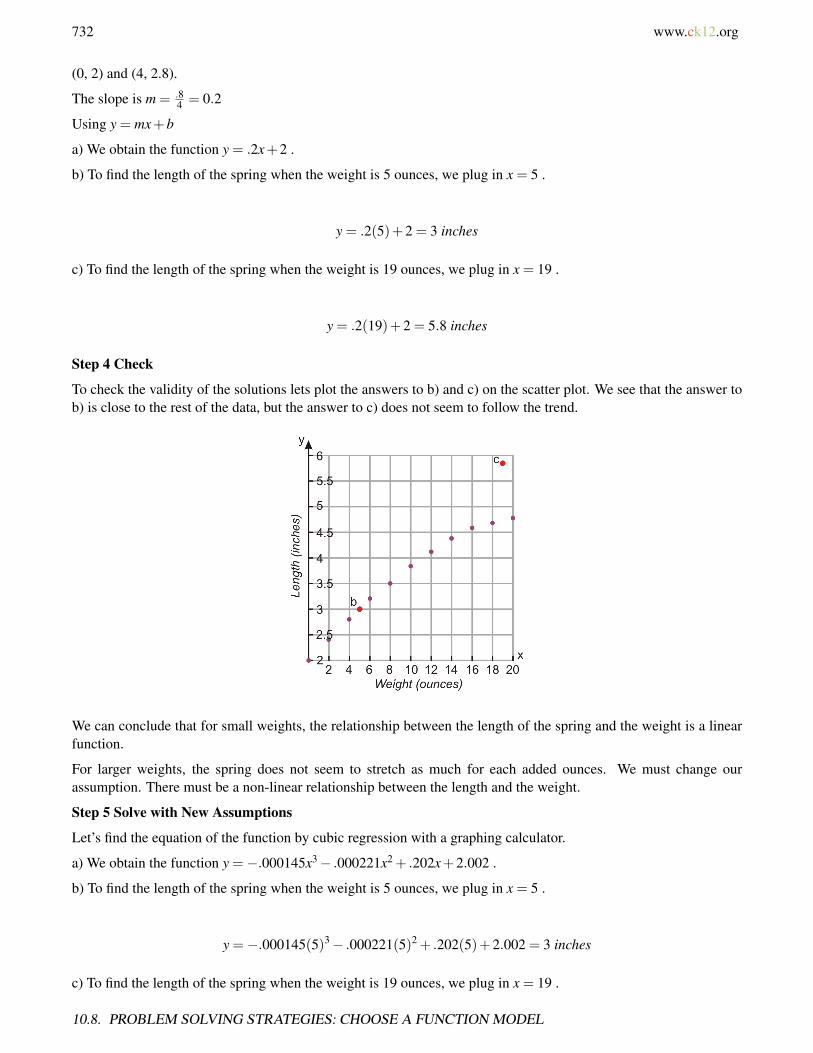
732 www.ck12.org
(0, 2) and (4, 2.8).
The slope is m = .84 = 0.2
Using y = mx+b
a) We obtain the function y = .2x+2 .
b) To find the length of the spring when the weight is 5 ounces, we plug in x = 5 .
y = .2(5)+2 = 3 inches
c) To find the length of the spring when the weight is 19 ounces, we plug in x = 19 .
y = .2(19)+2 = 5.8 inches
Step 4 Check
To check the validity of the solutions lets plot the answers to b) and c) on the scatter plot. We see that the answer tob) is close to the rest of the data, but the answer to c) does not seem to follow the trend.
We can conclude that for small weights, the relationship between the length of the spring and the weight is a linearfunction.
For larger weights, the spring does not seem to stretch as much for each added ounces. We must change ourassumption. There must be a non-linear relationship between the length and the weight.
Step 5 Solve with New Assumptions
Let’s find the equation of the function by cubic regression with a graphing calculator.
a) We obtain the function y =−.000145x3− .000221x2 + .202x+2.002 .
b) To find the length of the spring when the weight is 5 ounces, we plug in x = 5 .
y =−.000145(5)3− .000221(5)2 + .202(5)+2.002 = 3 inches
c) To find the length of the spring when the weight is 19 ounces, we plug in x = 19 .
10.8. PROBLEM SOLVING STRATEGIES: CHOOSE A FUNCTION MODEL
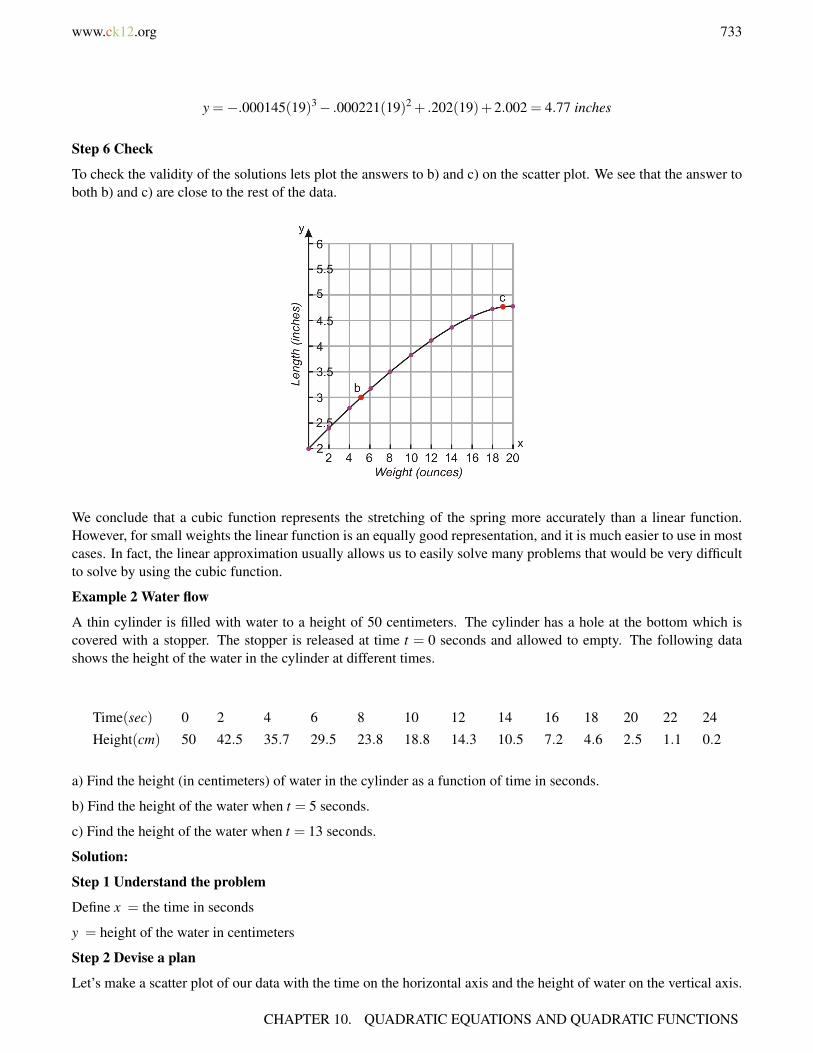
www.ck12.org 733
y =−.000145(19)3− .000221(19)2 + .202(19)+2.002 = 4.77 inches
Step 6 Check
To check the validity of the solutions lets plot the answers to b) and c) on the scatter plot. We see that the answer toboth b) and c) are close to the rest of the data.
We conclude that a cubic function represents the stretching of the spring more accurately than a linear function.However, for small weights the linear function is an equally good representation, and it is much easier to use in mostcases. In fact, the linear approximation usually allows us to easily solve many problems that would be very difficultto solve by using the cubic function.
Example 2 Water flow
A thin cylinder is filled with water to a height of 50 centimeters. The cylinder has a hole at the bottom which iscovered with a stopper. The stopper is released at time t = 0 seconds and allowed to empty. The following datashows the height of the water in the cylinder at different times.
Time(sec) 0 2 4 6 8 10 12 14 16 18 20 22 24
Height(cm) 50 42.5 35.7 29.5 23.8 18.8 14.3 10.5 7.2 4.6 2.5 1.1 0.2
a) Find the height (in centimeters) of water in the cylinder as a function of time in seconds.
b) Find the height of the water when t = 5 seconds.
c) Find the height of the water when t = 13 seconds.
Solution:
Step 1 Understand the problem
Define x = the time in seconds
y = height of the water in centimeters
Step 2 Devise a plan
Let’s make a scatter plot of our data with the time on the horizontal axis and the height of water on the vertical axis.
CHAPTER 10. QUADRATIC EQUATIONS AND QUADRATIC FUNCTIONS
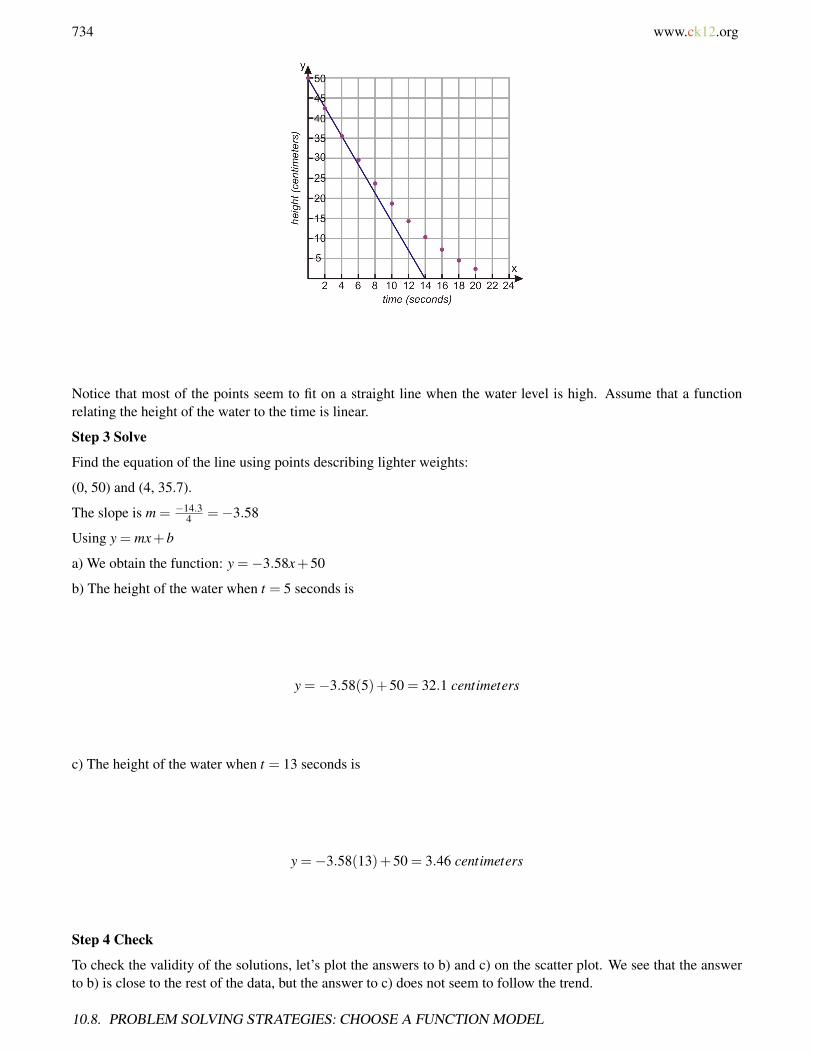
734 www.ck12.org
Notice that most of the points seem to fit on a straight line when the water level is high. Assume that a functionrelating the height of the water to the time is linear.
Step 3 Solve
Find the equation of the line using points describing lighter weights:
(0, 50) and (4, 35.7).
The slope is m = −14.34 =−3.58
Using y = mx+b
a) We obtain the function: y =−3.58x+50
b) The height of the water when t = 5 seconds is
y =−3.58(5)+50 = 32.1 centimeters
c) The height of the water when t = 13 seconds is
y =−3.58(13)+50 = 3.46 centimeters
Step 4 Check
To check the validity of the solutions, let’s plot the answers to b) and c) on the scatter plot. We see that the answerto b) is close to the rest of the data, but the answer to c) does not seem to follow the trend.
10.8. PROBLEM SOLVING STRATEGIES: CHOOSE A FUNCTION MODEL

www.ck12.org 735
We can conclude that when the water level is high, the relationship between the height of the water and the timeis a linear function. When the water level is low, we must change our assumption. There must be a non-linearrelationship between the height and the time.
Step 5 Solve with new assumptions
Let’s assume the relationship is quadratic and let’s find the equation of the function by quadratic regression with agraphing calculator.
a) We obtain the function y = .075x2−3.87x+50
b) The height of the water when t = 5 seconds is
y = .075(5)2−3.87(5)+50 = 32.53 centimeters
c) The height of the water when t = 13 seconds is
y = .075(13)2−3.87(13)+50 = 12.37 centimeters
Step 6: Check
To check the validity of the solutions lets plot the answers to b) and c) on the scatterplot. We see that the answer toboth b) and c) are close to the rest of the data.
CHAPTER 10. QUADRATIC EQUATIONS AND QUADRATIC FUNCTIONS

736 www.ck12.org
We conclude that a quadratic function represents the situation more accurately than a linear function. However, forhigh water levels the linear function is an equally good representation.
Example 3 Projectile motion
A golf ball is hit down a straight fairway. The following table shows the height of the ball with respect to time. Theball is hit at an angle of 70 degrees with the horizontal with a speed of 40 meters/sec.
Time (sec) 0 0.5 1.0 1.5 2.0 2.5 3.0 3.5 4.0 4.5 5.0 5.5 6.0 6.5 7.0
Height (meters) 0 17.2 31.5 42.9 51.6 57.7 61.2 62.3 61.0 57.2 51.0 42.6 31.9 19.0 4.1
a) Find the height of the ball as a function of time.
b) Find the height of the ball when t = 2.4 seconds.
c) Find the height of the ball when t = 6.2 seconds.
Solution
Step 1 Understand the problem
Define x = the time in seconds
y = height of the ball in meters
Step 2 Devise a plan
Let’s make a scatter plot of our data with the time on the horizontal axis and the height of the ball on the verticalaxis. We know that a projectile follows a parabolic path, so we assume that the function relating height to time isquadratic.
Step 3 Solve
Let’s find the equation of the function by quadratic regression with a graphing calculator.
a) We obtain the function y =−4.92x2 +34.7x+1.2
b) The height of the ball when t = 2.4 seconds is:
y =−4.92(2.4)2 +34.7(2.4)+1.2 = 56.1 meters
c) The height of the ball when t = 6.2 seconds is:
10.8. PROBLEM SOLVING STRATEGIES: CHOOSE A FUNCTION MODEL
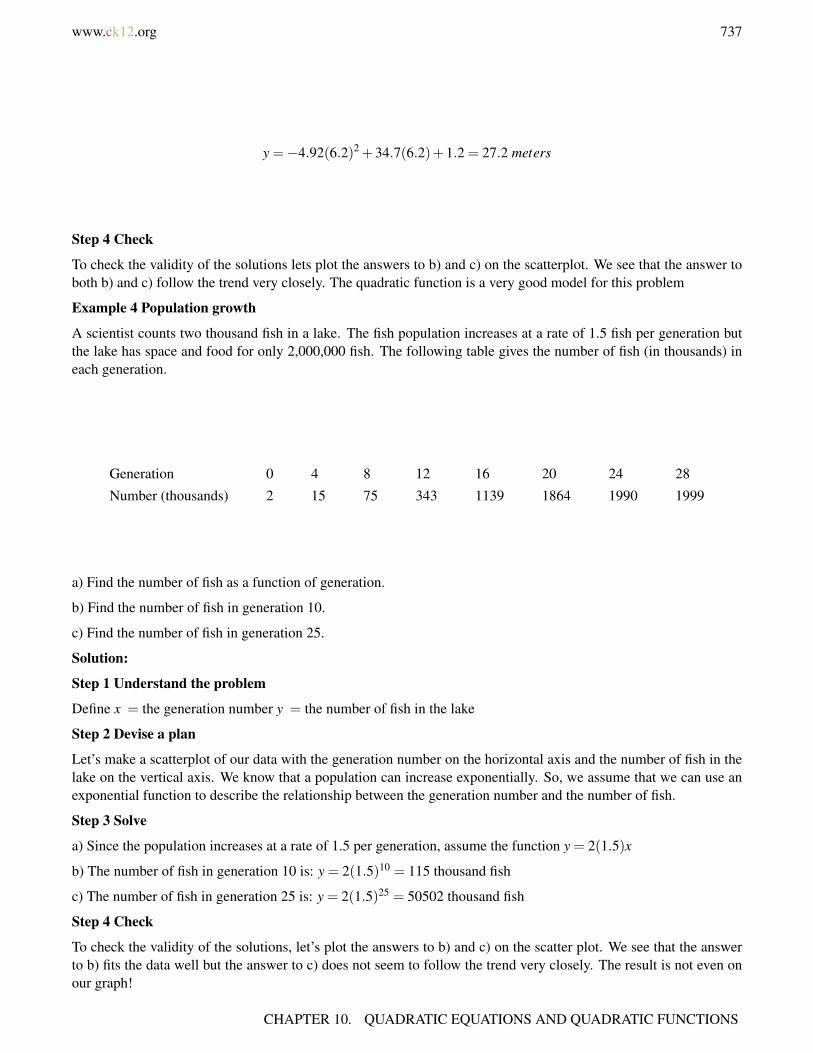
www.ck12.org 737
y =−4.92(6.2)2 +34.7(6.2)+1.2 = 27.2 meters
Step 4 Check
To check the validity of the solutions lets plot the answers to b) and c) on the scatterplot. We see that the answer toboth b) and c) follow the trend very closely. The quadratic function is a very good model for this problem
Example 4 Population growth
A scientist counts two thousand fish in a lake. The fish population increases at a rate of 1.5 fish per generation butthe lake has space and food for only 2,000,000 fish. The following table gives the number of fish (in thousands) ineach generation.
Generation 0 4 8 12 16 20 24 28
Number (thousands) 2 15 75 343 1139 1864 1990 1999
a) Find the number of fish as a function of generation.
b) Find the number of fish in generation 10.
c) Find the number of fish in generation 25.
Solution:
Step 1 Understand the problem
Define x = the generation number y = the number of fish in the lake
Step 2 Devise a plan
Let’s make a scatterplot of our data with the generation number on the horizontal axis and the number of fish in thelake on the vertical axis. We know that a population can increase exponentially. So, we assume that we can use anexponential function to describe the relationship between the generation number and the number of fish.
Step 3 Solve
a) Since the population increases at a rate of 1.5 per generation, assume the function y = 2(1.5)x
b) The number of fish in generation 10 is: y = 2(1.5)10 = 115 thousand fish
c) The number of fish in generation 25 is: y = 2(1.5)25 = 50502 thousand fish
Step 4 Check
To check the validity of the solutions, let’s plot the answers to b) and c) on the scatter plot. We see that the answerto b) fits the data well but the answer to c) does not seem to follow the trend very closely. The result is not even onour graph!
CHAPTER 10. QUADRATIC EQUATIONS AND QUADRATIC FUNCTIONS
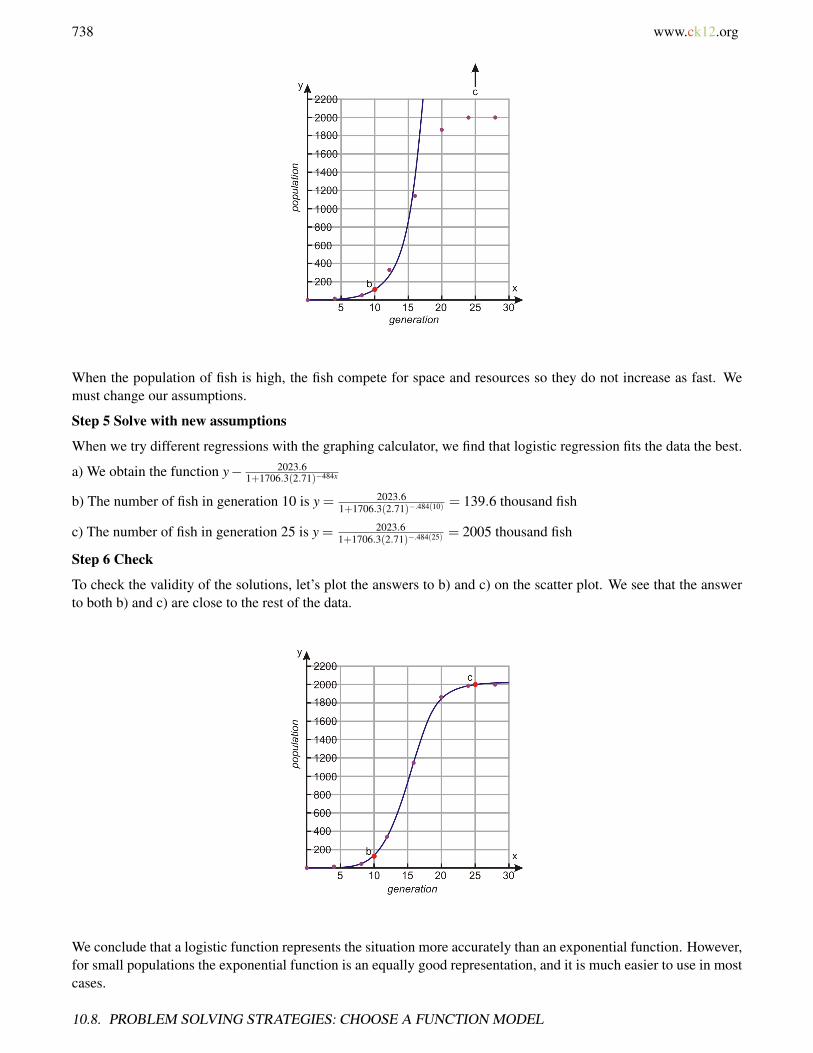
738 www.ck12.org
When the population of fish is high, the fish compete for space and resources so they do not increase as fast. Wemust change our assumptions.
Step 5 Solve with new assumptions
When we try different regressions with the graphing calculator, we find that logistic regression fits the data the best.
a) We obtain the function y− 2023.61+1706.3(2.71)−484x
b) The number of fish in generation 10 is y = 2023.61+1706.3(2.71)−.484(10) = 139.6 thousand fish
c) The number of fish in generation 25 is y = 2023.61+1706.3(2.71)−.484(25) = 2005 thousand fish
Step 6 Check
To check the validity of the solutions, let’s plot the answers to b) and c) on the scatter plot. We see that the answerto both b) and c) are close to the rest of the data.
We conclude that a logistic function represents the situation more accurately than an exponential function. However,for small populations the exponential function is an equally good representation, and it is much easier to use in mostcases.
10.8. PROBLEM SOLVING STRATEGIES: CHOOSE A FUNCTION MODEL
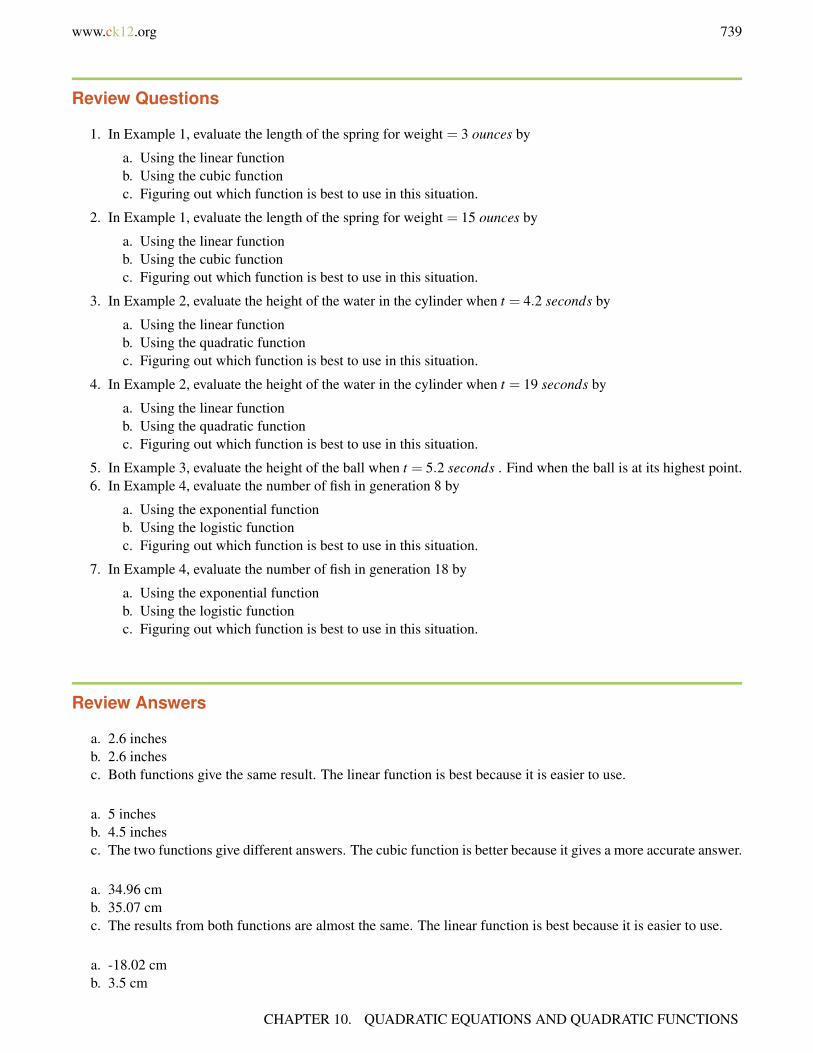
www.ck12.org 739
Review Questions
1. In Example 1, evaluate the length of the spring for weight = 3 ounces by
a. Using the linear functionb. Using the cubic functionc. Figuring out which function is best to use in this situation.
2. In Example 1, evaluate the length of the spring for weight = 15 ounces by
a. Using the linear functionb. Using the cubic functionc. Figuring out which function is best to use in this situation.
3. In Example 2, evaluate the height of the water in the cylinder when t = 4.2 seconds by
a. Using the linear functionb. Using the quadratic functionc. Figuring out which function is best to use in this situation.
4. In Example 2, evaluate the height of the water in the cylinder when t = 19 seconds by
a. Using the linear functionb. Using the quadratic functionc. Figuring out which function is best to use in this situation.
5. In Example 3, evaluate the height of the ball when t = 5.2 seconds . Find when the ball is at its highest point.6. In Example 4, evaluate the number of fish in generation 8 by
a. Using the exponential functionb. Using the logistic functionc. Figuring out which function is best to use in this situation.
7. In Example 4, evaluate the number of fish in generation 18 by
a. Using the exponential functionb. Using the logistic functionc. Figuring out which function is best to use in this situation.
Review Answers
a. 2.6 inchesb. 2.6 inchesc. Both functions give the same result. The linear function is best because it is easier to use.
a. 5 inchesb. 4.5 inchesc. The two functions give different answers. The cubic function is better because it gives a more accurate answer.
a. 34.96 cmb. 35.07 cmc. The results from both functions are almost the same. The linear function is best because it is easier to use.
a. -18.02 cmb. 3.5 cm
CHAPTER 10. QUADRATIC EQUATIONS AND QUADRATIC FUNCTIONS

740 www.ck12.org
c. The two function give different results. The quadratic function is better because it gives a more accurateanswer.
a. 48.6 metersb. 3.7 seconds
a. 51,000b. 55,000c. The results from both functions are almost the same. The linear function is best because it is easier to use.
a. 2,956,000b. 1,571,000c. the two functions give different results; the logistic function is better because it gives a more accurate answer.
Texas Instruments Resources
In the CK-12 Texas Instruments Algebra I FlexBook, there are graphing calculator activities designed to supple-ment the objectives for some of the lessons in this chapter. See http://www.ck12.org/flexr/chapter/9620.
10.8. PROBLEM SOLVING STRATEGIES: CHOOSE A FUNCTION MODEL
www.ck12.org 741
CHAPTER 11 Algebra and GeometryConnections; Working with Data
CHAPTER OUTLINE
11.1 GRAPHS OF SQUARE ROOT FUNCTIONS
11.2 RADICAL EXPRESSIONS
11.3 RADICAL EQUATIONS
11.4 THE PYTHAGOREAN THEOREM AND ITS CONVERSE
11.5 DISTANCE AND MIDPOINT FORMULAS
11.6 MEASURES OF CENTRAL TENDENCY AND DISPERSION
11.7 STEM-AND-LEAF PLOTS AND HISTOGRAMS
11.8 BOX-AND-WHISKER PLOTS
CHAPTER 11. ALGEBRA AND GEOMETRY CONNECTIONS; WORKING WITH DATA
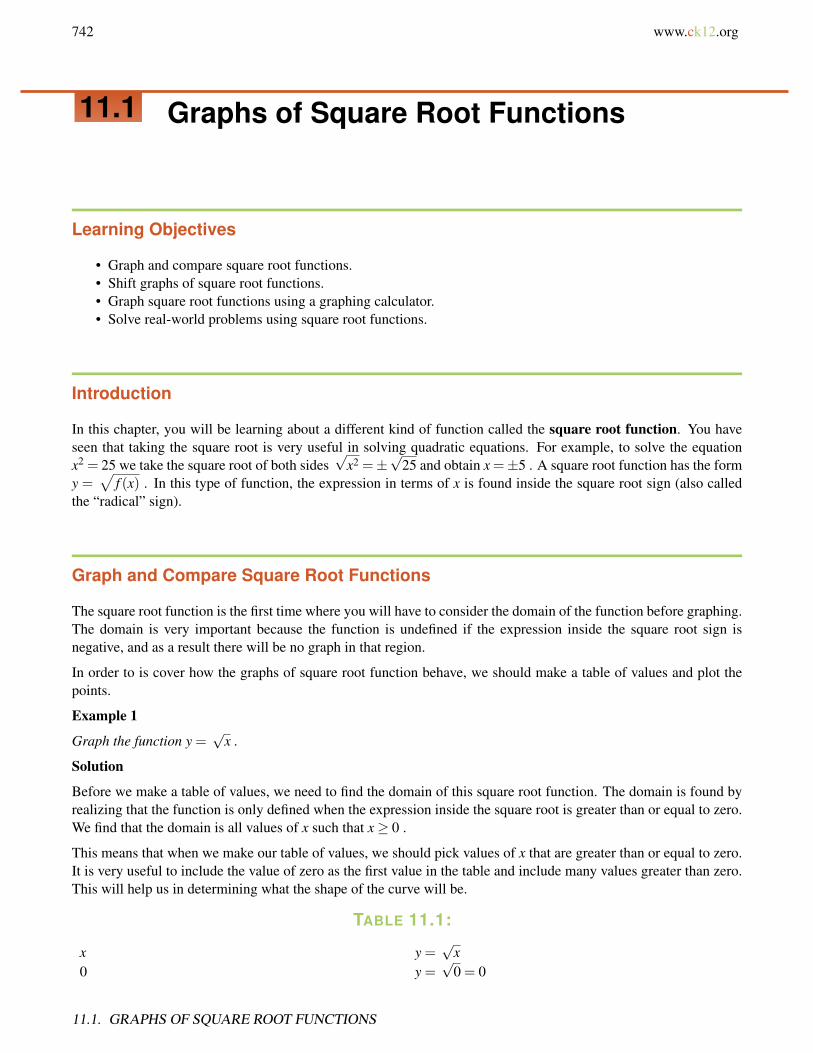
742 www.ck12.org
11.1 Graphs of Square Root Functions
Learning Objectives
• Graph and compare square root functions.• Shift graphs of square root functions.• Graph square root functions using a graphing calculator.• Solve real-world problems using square root functions.
Introduction
In this chapter, you will be learning about a different kind of function called the square root function. You haveseen that taking the square root is very useful in solving quadratic equations. For example, to solve the equationx2 = 25 we take the square root of both sides
√x2 =±
√25 and obtain x =±5 . A square root function has the form
y =√
f (x) . In this type of function, the expression in terms of x is found inside the square root sign (also calledthe “radical” sign).
Graph and Compare Square Root Functions
The square root function is the first time where you will have to consider the domain of the function before graphing.The domain is very important because the function is undefined if the expression inside the square root sign isnegative, and as a result there will be no graph in that region.
In order to is cover how the graphs of square root function behave, we should make a table of values and plot thepoints.
Example 1
Graph the function y =√
x .
Solution
Before we make a table of values, we need to find the domain of this square root function. The domain is found byrealizing that the function is only defined when the expression inside the square root is greater than or equal to zero.We find that the domain is all values of x such that x≥ 0 .
This means that when we make our table of values, we should pick values of x that are greater than or equal to zero.It is very useful to include the value of zero as the first value in the table and include many values greater than zero.This will help us in determining what the shape of the curve will be.
TABLE 11.1:
x y =√
x0 y =
√0 = 0
11.1. GRAPHS OF SQUARE ROOT FUNCTIONS
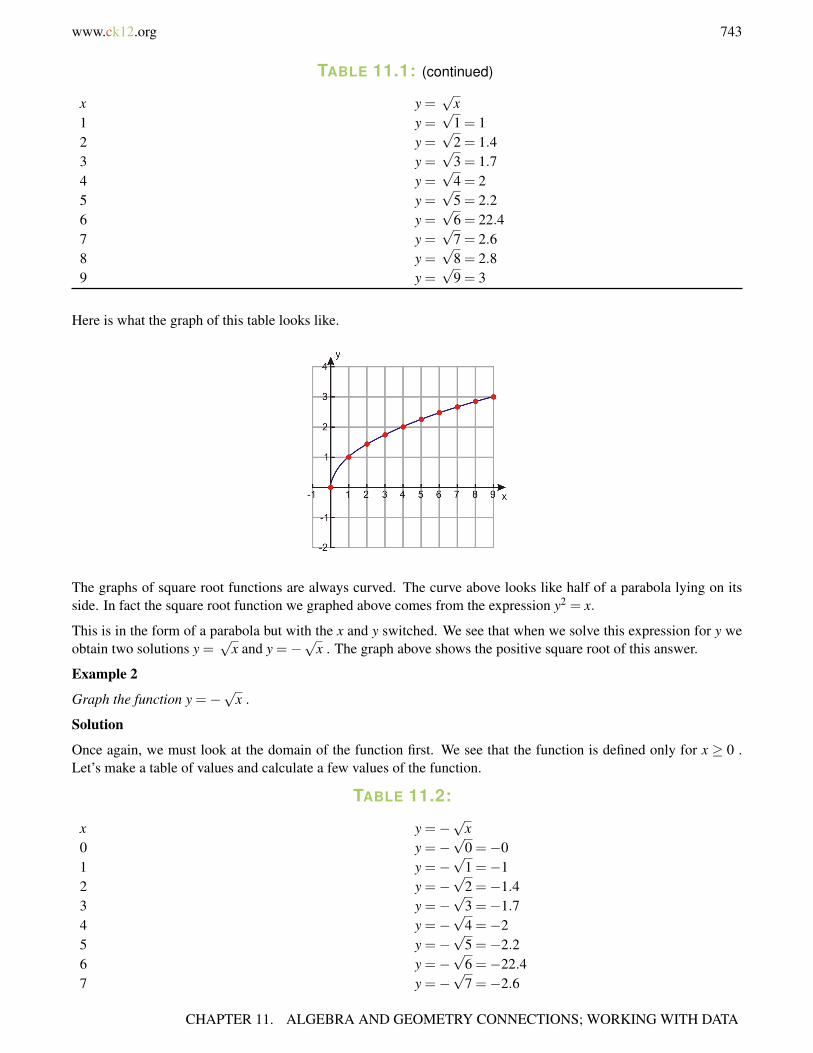
www.ck12.org 743
TABLE 11.1: (continued)
x y =√
x1 y =
√1 = 1
2 y =√
2 = 1.43 y =
√3 = 1.7
4 y =√
4 = 25 y =
√5 = 2.2
6 y =√
6 = 22.47 y =
√7 = 2.6
8 y =√
8 = 2.89 y =
√9 = 3
Here is what the graph of this table looks like.
The graphs of square root functions are always curved. The curve above looks like half of a parabola lying on itsside. In fact the square root function we graphed above comes from the expression y2 = x.
This is in the form of a parabola but with the x and y switched. We see that when we solve this expression for y weobtain two solutions y =
√x and y =−
√x . The graph above shows the positive square root of this answer.
Example 2
Graph the function y =−√
x .
Solution
Once again, we must look at the domain of the function first. We see that the function is defined only for x ≥ 0 .Let’s make a table of values and calculate a few values of the function.
TABLE 11.2:
x y =−√
x0 y =−
√0 =−0
1 y =−√
1 =−12 y =−
√2 =−1.4
3 y =−√
3 =−1.74 y =−
√4 =−2
5 y =−√
5 =−2.26 y =−
√6 =−22.4
7 y =−√
7 =−2.6
CHAPTER 11. ALGEBRA AND GEOMETRY CONNECTIONS; WORKING WITH DATA

744 www.ck12.org
TABLE 11.2: (continued)
x y =−√
x8 y =−
√8 = 2.8
9 y =−√
9 =−3
Here is the graph from this table.
Notice that if we graph the two separate functions on the same coordinate axes, the combined graph is a parabolalying on its side.
Now let’s compare square root functions that are multiples of each other.
Example 3
Graph functions y =√
x,y = 2√
x,y = 3√
x,y = 4√
x on the same graph.
Solution
Here we will show just the graph without the table of values.
11.1. GRAPHS OF SQUARE ROOT FUNCTIONS

www.ck12.org 745
If we multiply the function by a constant bigger than one, the function increases faster the greater the constant is.
Example 4
Graph functions y =√
x,y =√
2x,y =√
3x,y =√
4x on the same graph.
Solution
Notice that multiplying the expression inside the square root by a constant has the same effect as in the previousexample but the function increases at a slower rate because the entire function is effectively multiplied by the squareroot of the constant. Also note that the graph of
√4x is the same as the graph of 2
√2x . This makes sense
algebraically since√
4 = 2 .
Example 5
Graph functions y =√
x,y = 12
√x,y = 1
3
√x,y = 1
4
√x on the same graph.
Solution
If we multiply the function by a constant between 0 and 1, the function increases at a slower rate for smallerconstants.
CHAPTER 11. ALGEBRA AND GEOMETRY CONNECTIONS; WORKING WITH DATA
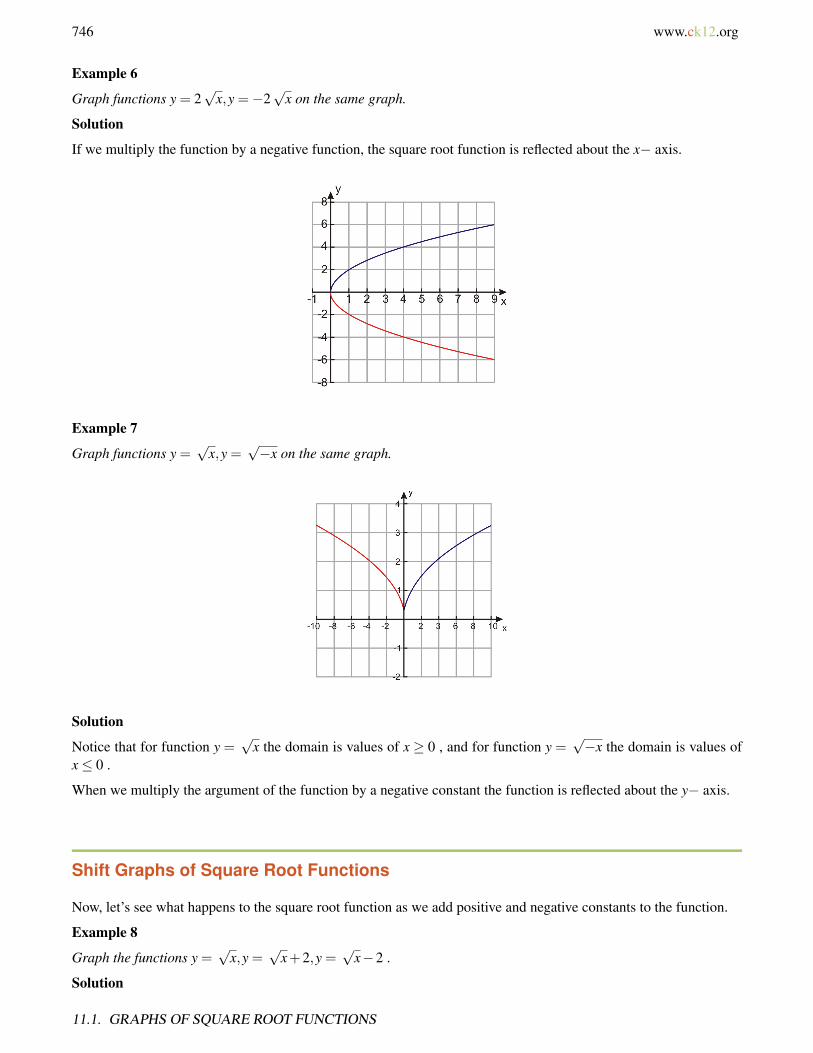
746 www.ck12.org
Example 6
Graph functions y = 2√
x,y =−2√
x on the same graph.
Solution
If we multiply the function by a negative function, the square root function is reflected about the x− axis.
Example 7
Graph functions y =√
x,y =√−x on the same graph.
Solution
Notice that for function y =√
x the domain is values of x ≥ 0 , and for function y =√−x the domain is values of
x≤ 0 .
When we multiply the argument of the function by a negative constant the function is reflected about the y− axis.
Shift Graphs of Square Root Functions
Now, let’s see what happens to the square root function as we add positive and negative constants to the function.
Example 8
Graph the functions y =√
x,y =√
x+2,y =√
x−2 .
Solution
11.1. GRAPHS OF SQUARE ROOT FUNCTIONS

www.ck12.org 747
We see that the graph keeps the same shape, but moves up for positive constants and moves down for negativeconstants.
Example 9
Graph the functions y =√
x,y =√
x−2,y =√
x+2 .
Solution
When we add constants to the argument of the function, the function shifts to the left for a positive constant and tothe right for a negative constant because the domain shifts. There can’t be a negative number inside the square root.
Now let’s graph a few more examples of square root functions.
Example 10
Graph the function y = 2√
3x−1+2 .
Solution
We first determine the domain of the function. The function is only defined if the expression inside the square rootis positive 3x−1≥ 0 or x≥ 1
3 .
Make a table for values of x greater than or equal to 13 .
TABLE 11.3:
x y = 2√
3x−1+2
13 y = 2
√3 · 1
3−1+2 = 2
1 y = 2√
3(1)−1+2 = 4.82 y = 2
√3(2)−1+2 = 6.5
3 y = 2√
3(3)−1+2 = 7.7
CHAPTER 11. ALGEBRA AND GEOMETRY CONNECTIONS; WORKING WITH DATA

748 www.ck12.org
TABLE 11.3: (continued)
x y = 2√
3x−1+24 y = 2
√3(4)−1+2 = 8.6
5 y = 2√
3(5)−1+2 = 9.5
Here is the graph.
You can also think of this function as a combination of shifts and stretches of the basic square root function y =√
x. We know that the graph of this function looks like the one below.
If we multiply the argument by 3 to obtain y =√
3x , this stretches the curve vertically because the value of yincreases faster by a factor of y =
√3 .
Next, when we subtract the value of 1 from the argument to obtain y =√
3x−1 this shifts the entire graph to theleft by one unit.
11.1. GRAPHS OF SQUARE ROOT FUNCTIONS

www.ck12.org 749
Multiplying the function by a factor of 2 to obtain y = 2√
3x−1 stretches the curve vertically again, and y increasesfaster by a factor of 2.
Finally, we add the value of 2 to the function to obtain y =√
3x−1+2 . This shifts the entire function vertically by2 units.
This last method of graphing showed a way to graph functions without making a table of values. If we know whatthe basic function looks like, we can use shifts and stretches to transform the function and get to the desired result.
Graph Square Root Functions Using a Graphing Calculator
Next, we will demonstrate how to use the graphing calculator to plot square root functions.
Example 11
Graph the following functions using a graphing calculator.
a) y =√
x+5
b) y =√
9− x2
Solution:
In all the cases we start by pressing the [Y=button] and entering the function on the function screen of the calculator:
We then press [GRAPH] to display the results. Make sure your window is set appropriately in order to view thefunction well. This is done by pressing the [WINDOW] button and choosing appropriate values for the Xmin,Xmax, Ymin and Ymax.
a)
The window of this graph is −6≤ x≤ 5; −5≤ y≤ 5.
The domain of the function is x≥−5
b)
CHAPTER 11. ALGEBRA AND GEOMETRY CONNECTIONS; WORKING WITH DATA

750 www.ck12.org
The window of this graph is −5≤ x≤ 5;−5≤ y≤ 5.
The domain of the function is −3≤ x≤ 3
Solve Real-World Problems Using Square Root Functions
Pendulum
Mathematicians and physicists have studied the motion of a pendulum in great detail because this motion explainsmany other behaviors that occur in nature. This type of motion is called simple harmonic motion and it is veryimportant because it describes anything that repeats periodically. Galileo was the first person to study the motion ofa pendulum around the year 1600. He found that the time it takes a pendulum to complete a swing from a startingpoint back to the beginning does not depend on its mass or on its angle of swing (as long as the angle of the swingis small). Rather, it depends only on the length of the pendulum.
The time it takes a pendulum to swing from a starting point and back to the beginning is called the period of thependulum.
11.1. GRAPHS OF SQUARE ROOT FUNCTIONS
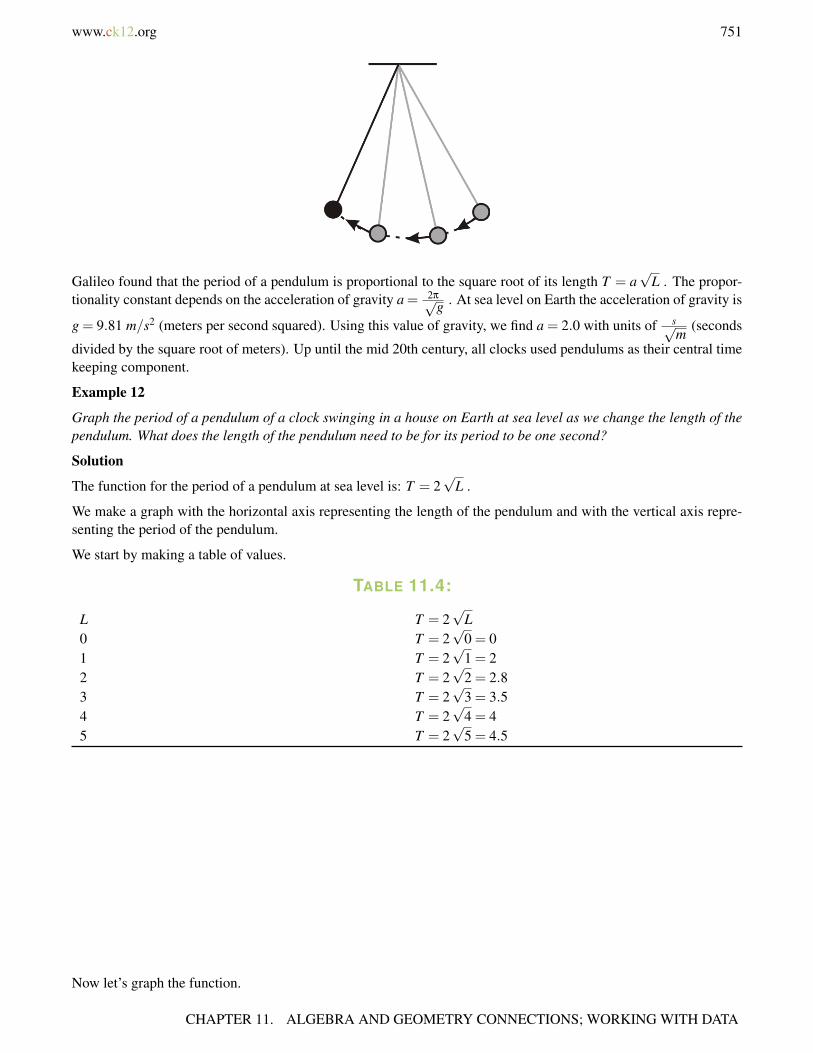
www.ck12.org 751
Galileo found that the period of a pendulum is proportional to the square root of its length T = a√
L . The propor-tionality constant depends on the acceleration of gravity a = 2π√
g . At sea level on Earth the acceleration of gravity is
g = 9.81 m/s2 (meters per second squared). Using this value of gravity, we find a = 2.0 with units of s√m
(seconds
divided by the square root of meters). Up until the mid 20th century, all clocks used pendulums as their central timekeeping component.
Example 12
Graph the period of a pendulum of a clock swinging in a house on Earth at sea level as we change the length of thependulum. What does the length of the pendulum need to be for its period to be one second?
Solution
The function for the period of a pendulum at sea level is: T = 2√
L .
We make a graph with the horizontal axis representing the length of the pendulum and with the vertical axis repre-senting the period of the pendulum.
We start by making a table of values.
TABLE 11.4:
L T = 2√
L0 T = 2
√0 = 0
1 T = 2√
1 = 22 T = 2
√2 = 2.8
3 T = 2√
3 = 3.54 T = 2
√4 = 4
5 T = 2√
5 = 4.5
Now let’s graph the function.
CHAPTER 11. ALGEBRA AND GEOMETRY CONNECTIONS; WORKING WITH DATA
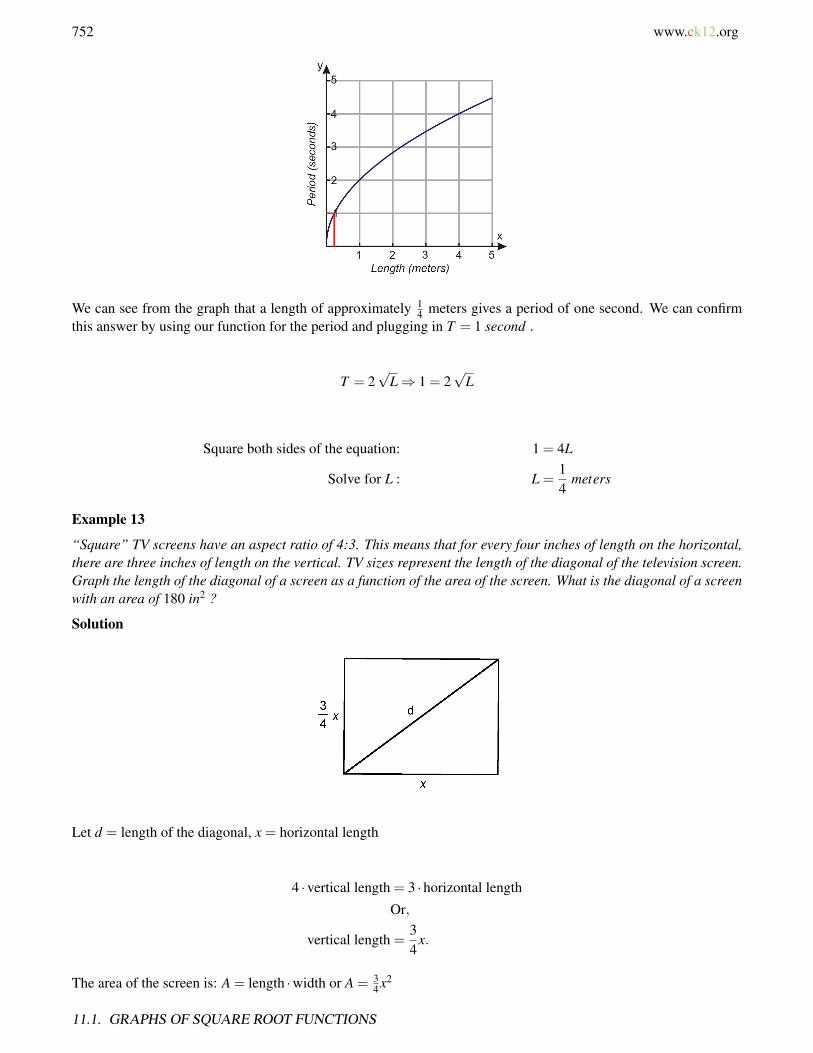
752 www.ck12.org
We can see from the graph that a length of approximately 14 meters gives a period of one second. We can confirm
this answer by using our function for the period and plugging in T = 1 second .
T = 2√
L⇒ 1 = 2√
L
Square both sides of the equation: 1 = 4L
Solve for L : L =14
meters
Example 13
“Square” TV screens have an aspect ratio of 4:3. This means that for every four inches of length on the horizontal,there are three inches of length on the vertical. TV sizes represent the length of the diagonal of the television screen.Graph the length of the diagonal of a screen as a function of the area of the screen. What is the diagonal of a screenwith an area of 180 in2 ?
Solution
Let d = length of the diagonal, x = horizontal length
4 ·vertical length = 3 ·horizontal length
Or,
vertical length =34
x.
The area of the screen is: A = length ·width or A = 34 x2
11.1. GRAPHS OF SQUARE ROOT FUNCTIONS
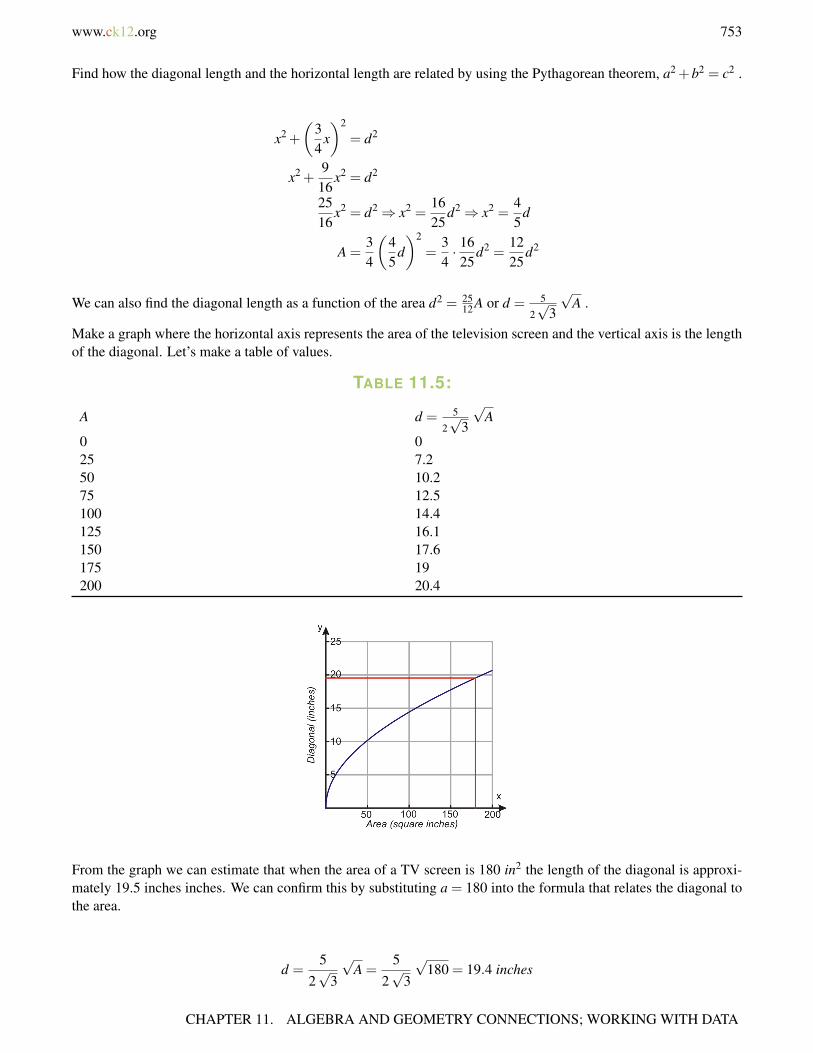
www.ck12.org 753
Find how the diagonal length and the horizontal length are related by using the Pythagorean theorem, a2 +b2 = c2 .
x2 +
(34
x)2
= d2
x2 +916
x2 = d2
2516
x2 = d2⇒ x2 =1625
d2⇒ x2 =45
d
A =34
(45
d)2
=34· 16
25d2 =
1225
d2
We can also find the diagonal length as a function of the area d2 = 2512 A or d = 5
2√
3
√A .
Make a graph where the horizontal axis represents the area of the television screen and the vertical axis is the lengthof the diagonal. Let’s make a table of values.
TABLE 11.5:
A d = 5
2√
3
√A
0 025 7.250 10.275 12.5100 14.4125 16.1150 17.6175 19200 20.4
From the graph we can estimate that when the area of a TV screen is 180 in2 the length of the diagonal is approxi-mately 19.5 inches inches. We can confirm this by substituting a = 180 into the formula that relates the diagonal tothe area.
d =5
2√
3
√A =
52√
3
√180 = 19.4 inches
CHAPTER 11. ALGEBRA AND GEOMETRY CONNECTIONS; WORKING WITH DATA
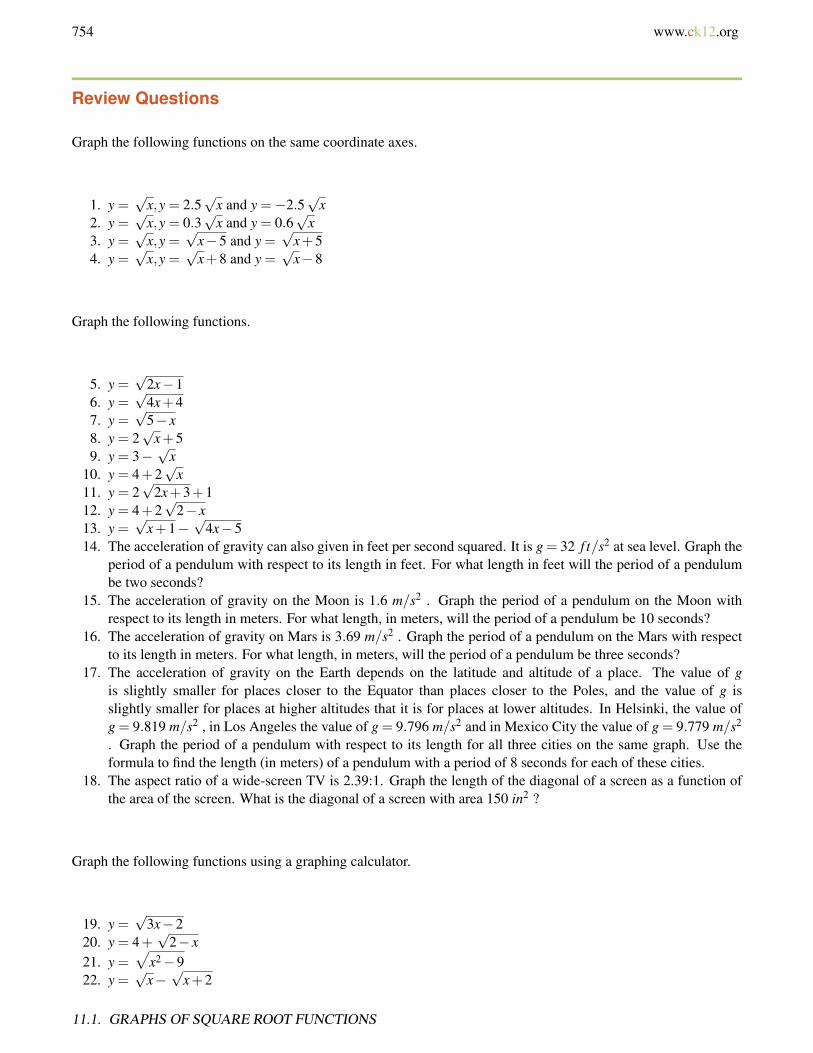
754 www.ck12.org
Review Questions
Graph the following functions on the same coordinate axes.
1. y =√
x,y = 2.5√
x and y =−2.5√
x2. y =
√x,y = 0.3
√x and y = 0.6
√x
3. y =√
x,y =√
x−5 and y =√
x+54. y =
√x,y =
√x+8 and y =
√x−8
Graph the following functions.
5. y =√
2x−16. y =
√4x+4
7. y =√
5− x8. y = 2
√x+5
9. y = 3−√
x10. y = 4+2
√x
11. y = 2√
2x+3+112. y = 4+2
√2− x
13. y =√
x+1−√
4x−514. The acceleration of gravity can also given in feet per second squared. It is g = 32 f t/s2 at sea level. Graph the
period of a pendulum with respect to its length in feet. For what length in feet will the period of a pendulumbe two seconds?
15. The acceleration of gravity on the Moon is 1.6 m/s2 . Graph the period of a pendulum on the Moon withrespect to its length in meters. For what length, in meters, will the period of a pendulum be 10 seconds?
16. The acceleration of gravity on Mars is 3.69 m/s2 . Graph the period of a pendulum on the Mars with respectto its length in meters. For what length, in meters, will the period of a pendulum be three seconds?
17. The acceleration of gravity on the Earth depends on the latitude and altitude of a place. The value of gis slightly smaller for places closer to the Equator than places closer to the Poles, and the value of g isslightly smaller for places at higher altitudes that it is for places at lower altitudes. In Helsinki, the value ofg = 9.819 m/s2 , in Los Angeles the value of g = 9.796 m/s2 and in Mexico City the value of g = 9.779 m/s2
. Graph the period of a pendulum with respect to its length for all three cities on the same graph. Use theformula to find the length (in meters) of a pendulum with a period of 8 seconds for each of these cities.
18. The aspect ratio of a wide-screen TV is 2.39:1. Graph the length of the diagonal of a screen as a function ofthe area of the screen. What is the diagonal of a screen with area 150 in2 ?
Graph the following functions using a graphing calculator.
19. y =√
3x−220. y = 4+
√2− x
21. y =√
x2−922. y =
√x−√
x+2
11.1. GRAPHS OF SQUARE ROOT FUNCTIONS
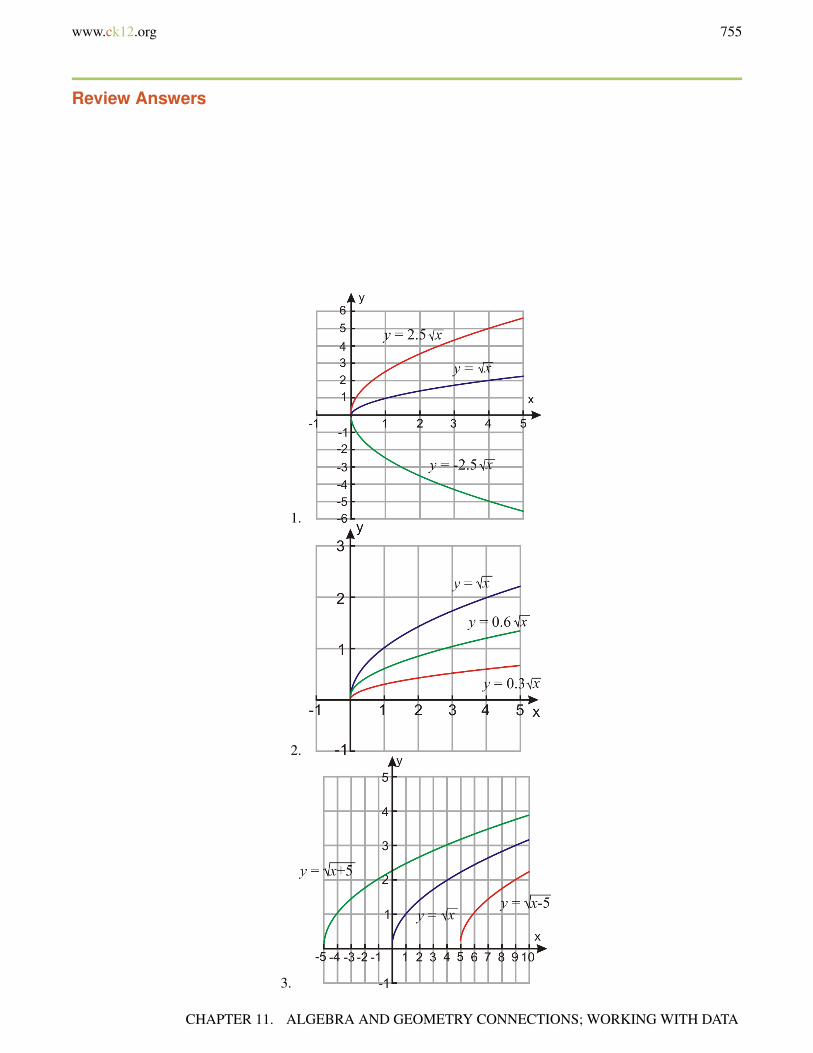
www.ck12.org 755
Review Answers
1.
2.
3.
CHAPTER 11. ALGEBRA AND GEOMETRY CONNECTIONS; WORKING WITH DATA

www.ck12.org 757
8.
9.
10.
11.
CHAPTER 11. ALGEBRA AND GEOMETRY CONNECTIONS; WORKING WITH DATA

758 www.ck12.org
12.
13.
14.L = 3.25 f eet
11.1. GRAPHS OF SQUARE ROOT FUNCTIONS
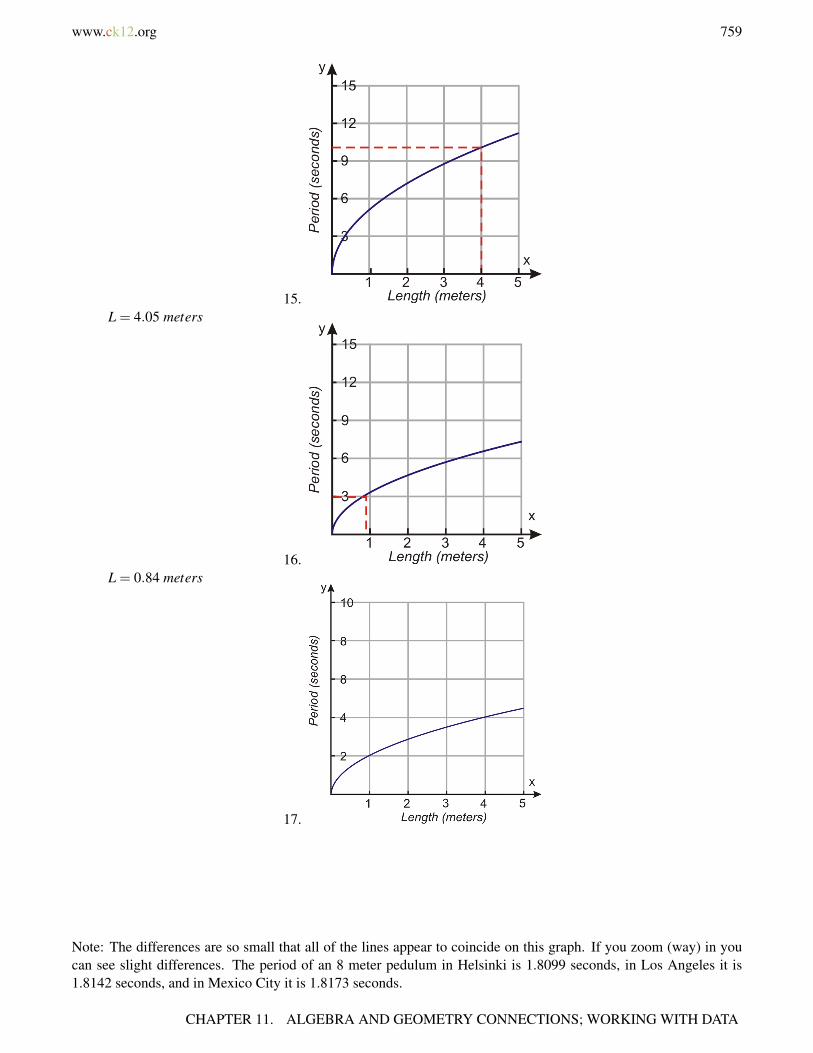
www.ck12.org 759
15.L = 4.05 meters
16.L = 0.84 meters
17.
Note: The differences are so small that all of the lines appear to coincide on this graph. If you zoom (way) in youcan see slight differences. The period of an 8 meter pedulum in Helsinki is 1.8099 seconds, in Los Angeles it is1.8142 seconds, and in Mexico City it is 1.8173 seconds.
CHAPTER 11. ALGEBRA AND GEOMETRY CONNECTIONS; WORKING WITH DATA

760 www.ck12.org
18.
D = 20.5 inches
15.92 m Helsinki
15.88 m Los Angeles
15.85 m Mexico City
19.−1≤ x≤ 5;−5≤ y≤ 5
20.−5≤ x≤ 5;0≤ y≤ 10
21.−6≤ x≤ 6;−1≤ y≤ 10
11.1. GRAPHS OF SQUARE ROOT FUNCTIONS

www.ck12.org 761
22.0≤ x≤ 5;−3≤ y≤ 1
CHAPTER 11. ALGEBRA AND GEOMETRY CONNECTIONS; WORKING WITH DATA
762 www.ck12.org
11.2 Radical Expressions
Learning objectives
• Use the product and quotient properties of radicals.• Rationalize the denominator.• Add and subtract radical expressions.• Multiply radical expressions.• Solve real-world problems using square root functions.
Introduction
A radical reverses the operation of raising a number to a power. For example, to find the square of 4 we write42 = 4 · 4 = 16 . The reverse process is called finding the square root. The symbol for a square root is √ . Thissymbol is also called the radical sign. When we take the square root of a number, the result is a number which whensquared gives the number under the square root sign. For example,
√9 = 3 since 32 = 3 ·3 = 9
Radicals often have an index in the top left corner. The index indicates which root of the number we are seeking.Square roots have an index of 2 but many times this index is not written.
2√36 = 6 since 62 = 36
The cube root of a number gives a number which when raised to the third power gives the number under the radicalsign.
3√64 = 4 since 43 = 4 ·4 ·4 = 64
The fourth root of number gives a number which when raised to the power four gives the number under the radicalsign.
4√81 = 3 since 34 = 3 ·3 ·3 ·3 = 81
Even and odd roots
Radical expressions that have even indices are called even roots and radical expressions that have odd indices arecalled odd roots. There is a very important difference between even and odd roots in that they give drasticallydifferent results when the number inside the radical sign is negative.
11.2. RADICAL EXPRESSIONS

www.ck12.org 763
Any real number raised to an even power results in a positive answer. Therefore, when the index of a radical is even,the number inside the radical sign must be non-negative in order to get a real answer.
On the other hand, a positive number raised to an odd power is positive and a negative number raised to an odd poweris negative. Thus, a negative number inside the radical sign is not a problem. It just results in a negative answer.
Example 1
Evaluate each radical expression.
a)√
121
b)3√
125
c) 4√−625
d) 5√−32
Solution
a)√
121 = 11
b)3√
125 = 5
c) 4√−625 is not a real number
d) 5√−32 =−2
Use the Product and Quotient Properties of Radicals
Radicals can be rewritten as exponent with rational powers. The radical y = m√an is defined as anm .
Example 2
Write each expression as an exponent with a rational value for the exponent.
a)√
5
b) 4√a
c) 3√
4xy
d)6√
x5
Solution
a)√
5 = 512
b) 4√a = a14
c) 3√
4xy = (4xy)13
d)6√
x5 = x56
As a result of this property, for any non-negative number n√an = ann = a.
Since roots of numbers can be treated as powers, we can use exponent rules to simplify and evaluate radical expres-sions. Let’s review the product and quotient rule of exponents.
Raising a product to a power (x · y)n = xn · yn
Raising a quotient to a power(
xy
)n
=xn
yn
CHAPTER 11. ALGEBRA AND GEOMETRY CONNECTIONS; WORKING WITH DATA
764 www.ck12.org
In radical notation, these properties are written as
Raising a product to a power m√
x · y = m√x · m√
y
Raising a quotient to a power m
√xy=
m√
xm√
y
A very important application of these rules is reducing a radical expression to its simplest form. This means that weapply the root on all the factors of the number that are perfect roots and leave all factors that are not perfect rootsinside the radical sign.
For example, in the expression√
16 , the number is a perfect square because 16 = 42 . This means that we cansimplify.
√16 =
√42 = 4
Thus, the square root disappears completely.
On the other hand, in the expression, the number√
32 is not a perfect square so we cannot remove the square root.However, we notice that 32 = 16 ·2 , so we can write 32 as the product of a perfect square and another number.
√32 =
√16 ·2 =
√16 ·2
If we apply the “raising a product to a power” rule we obtain
√32 =
√16 ·2 =
√16 ·√
2
Since√
16 = 4 , we get√
32 = 4 ·√
2 = 4√
2 .
Example 3
Write the following expression in the simplest radical form.
a)√
8
b)√
50
c)
√12572
Solution
The strategy is to write the number under the square root as the product of a perfect square and another number. Thegoal is to find the highest perfect square possible, however, if we don’t we can repeat the procedure until we cannotsimplify any longer.
a) We can write 8 = 4 ·2 so√
8 =√
4 ·2
Use the rule for raising a product to a power√
4 ·2 =√
4 ·√
2
Finally we have,√
8 = 2√
2 .
b) We can write 50 = 25 ·2 so√
50 =√
25 ·2
Use the rule for raising a product to a power =√
25 ·√
2 = 5√
2
11.2. RADICAL EXPRESSIONS

www.ck12.org 765
c) Use the rule for raising a product to a power to separate the fraction.
√12572
=
√125√72
Rewrite each radical as a product of a perfect square and another number.
=
√25 ·59 ·6
=5√
53√
6
The same method can be applied to reduce radicals of different indices to their simplest form.
Example 4
Write the following expression in the simplest radical form.
a)√
40
b) 4
√16280
c)3√
135
Solution
In these cases we look for the highest possible perfect cube, fourth power, etc. as indicated by the index of theradical.
a) Here we are looking for the product of the highest perfect cube and another number. We write
3√40 =3√
8 ·5 = 23√
5
b) Here we are looking for the product of the highest perfect fourth power and another number.
Rewrite as the quotient of two radicals 4
√16280
=4√1624√80
Simplify each radical separately =4√81 ·24√16 ·5
=4√81 · 4√24√16 · 4√5
=3 4√22 4√5
Recombine the fraction under one radical sign =32
4
√25
c) Here we are looking for the product of the highest perfect cube root and another number.
Often it is not very easy to identify the perfect root in the expression under the radical sign.
In this case, we can factor the number under the radical sign completely by using a factor tree.
CHAPTER 11. ALGEBRA AND GEOMETRY CONNECTIONS; WORKING WITH DATA
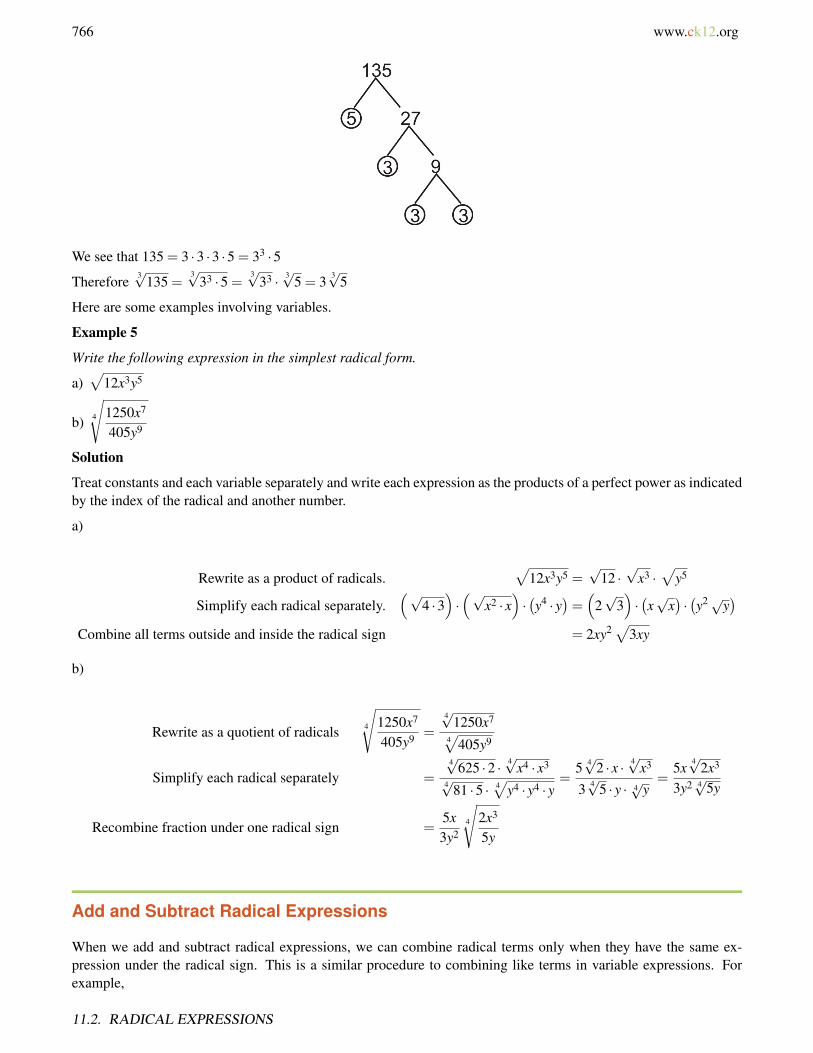
766 www.ck12.org
We see that 135 = 3 ·3 ·3 ·5 = 33 ·5
Therefore3√
135 =3√
33 ·5 =3√
33 · 3√5 = 3
3√5
Here are some examples involving variables.
Example 5
Write the following expression in the simplest radical form.
a)√
12x3y5
b) 4
√1250x7
405y9
Solution
Treat constants and each variable separately and write each expression as the products of a perfect power as indicatedby the index of the radical and another number.
a)
Rewrite as a product of radicals.√
12x3y5 =√
12 ·√
x3 ·√
y5
Simplify each radical separately.(√
4 ·3)·(√
x2 · x)·(y4 · y
)=(
2√
3)·(x√
x)·(y2√y
)Combine all terms outside and inside the radical sign = 2xy2
√3xy
b)
Rewrite as a quotient of radicals 4
√1250x7
405y9 =
4√1250x7
4√
405y9
Simplify each radical separately =4√625 ·2 · 4√
x4 · x3
4√81 ·5 · 4√
y4 · y4 · y=
5 4√2 · x · 4√x3
3 4√5 · y · 4√
y=
5x4√
2x3
3y2 4√
5y
Recombine fraction under one radical sign =5x3y2
4
√2x3
5y
Add and Subtract Radical Expressions
When we add and subtract radical expressions, we can combine radical terms only when they have the same ex-pression under the radical sign. This is a similar procedure to combining like terms in variable expressions. Forexample,
11.2. RADICAL EXPRESSIONS
www.ck12.org 767
4√
2+5√
2 = 9√
2 or 2√
3−√
2+5√
3+10√
2 = 7√
3+9√
2
It is important to simplify all radicals to their simplest form in order to make sure that we are combining all possiblelike terms in the expression. For example, the expression
√8− 2
√50 looks like it cannot be simplified any more
because it has no like terms. However, when we write each radical in its simplest form we have
2√
2−10√
2
This can be combined to obtain
−8√
2
Example 6
Simplify the following expressions as much as possible.
a) 4√
3+2√
12
b) 10√
24−√
28
Solution
a)
Simplify√
12 to its simplest form. = 4√
3+2√
4 ·3 = 4√
3+2 ·2√
3 = 4√
3+4√
3
Combine like terms. = 8√
3
b)
Simplify√
24 and√
28 to their simplest form. = 10√
6 ·4−√
7 ·4 = 20√
6−2√
7
There are no like terms.
Example 7
Simplify the following expressions as much as possible.
a) 4 3√128−33√
250
b) 3√
x3−4x√
9x
Solution
a)
Rewrite radicals in simplest terms. = 43√
2.64− 3√2.125 = 16
3√2−5
3√2
Combine like terms. = 113√
2
b)
Rewrite radicals in simplest terms. = 3√
x2 · x−4x√
9x = 3x√
x−12x√
x
Combine like terms. =−9x√
x
Multiply Radical Expressions.
When we multiply radical expressions, we use the “raising a product to a power” rule m√
x · y = m√x · n√
y .
CHAPTER 11. ALGEBRA AND GEOMETRY CONNECTIONS; WORKING WITH DATA
768 www.ck12.org
In this case we apply this rule in reverse. For example
√6 ·√
8 =√
6 ·8 =√
48
Make sure that the answer is written in simplest radical form
√48 =
√16 ·3 = 4
√3
We will also make use of the fact that
√a ·√
a =√
a2 = a.
When we multiply expressions that have numbers on both the outside and inside the radical sign, we treat thenumbers outside the radical sign and the numbers inside the radical sign separately.
For example
a√
b · c√
d = ac√
bd.
Example 8
Multiply the following expressions.
a)√
2(√
3+√
5)
b)√
5(
5√
3+2√
5)
c) 2√
x(3√
y+√
x)
Solution
In each case we use distribution to eliminate the parenthesis.
a)
Distribute√
2 inside the parenthesis.√
2(√
3+√
5)=√
2 ·√
3+√
2 ·√
5
Use the â[U+0080][U+009C]raising a product to a powerâ[U+0080][U+009D] rule. =√
2 ·√
3+√
2 ·√
5
Simplify. =√
6+√
10
b)
Distribute√
5 inside the parenthesis. = 5√
5 ·√
3−2√
5 ·√
5
Use the â[U+0080][U+009C]raising a product to a powerâ[U+0080][U+009D] rule. 5√
5 ·3−2√
5 ·5 = 5√
15−2√
25
Simplify. 5√
15−2 ·5 = 5√
15−10
c)
11.2. RADICAL EXPRESSIONS

www.ck12.org 769
Distribute 2√
x inside the parenthesis. = (2 ·3)(√
x · √y)−2 ·
(√x ·√
x)
Multiply. = 6√
xy−2√
x2
Simplify. = 6√
xy−2x
Example 9
Multiply the following expressions.
a)(
2+√
5)(
2−√
6)
b)(2√
x−1)(
5−√
x)
Solution
In each case we use distribution to eliminate the parenthesis.
a)
Distribute the parenthesis.(
2+√
5)(
2−√
6)= (2.2)−
(2.√
6)+(
2.√
5)−(√
5.√
6−√
30)
Simplify. 4−2√
6+2√
5−30
b)
Distribute.(2√
x−1)(
5−√
x)= 10
√x−2x−5+
√x
Simplify. 11√
x−2x−5
Rationalize the Denominator
Often when we work with radicals, we end up with a radical expression in the denominator of a fraction. We cansimplify such expressions even further by eliminating the radical expression from the denominator of the expression.This process is called rationalizing the denominator.
There are two cases we will examine.
Case 1 There is a single radical expression in the denominator 2√3
.
In this case, we multiply the numerator and denominator by a radical expression that makes the expression insidethe radical into a perfect power. In the example above, we multiply by the
√3 .
2√3·√
3√3=
2√
33
Next, let’s examine 73√5
.
In this case, we need to make the number inside the cube root a perfect cube. We need to multiply the numeratorand the denominator by
3√52 .
73√5·
3√52
3√52
=73√
253√
53=
73√
255
CHAPTER 11. ALGEBRA AND GEOMETRY CONNECTIONS; WORKING WITH DATA
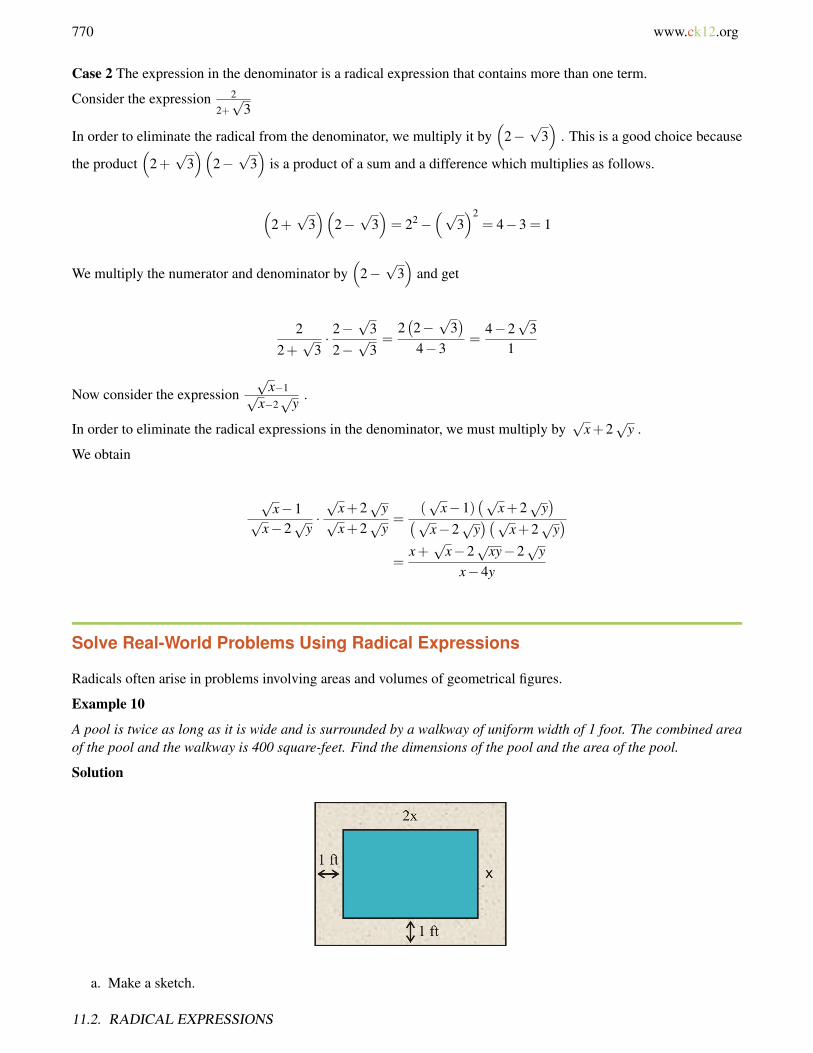
770 www.ck12.org
Case 2 The expression in the denominator is a radical expression that contains more than one term.
Consider the expression 2
2+√
3
In order to eliminate the radical from the denominator, we multiply it by(
2−√
3)
. This is a good choice because
the product(
2+√
3)(
2−√
3)
is a product of a sum and a difference which multiplies as follows.
(2+√
3)(
2−√
3)= 22−
(√3)2
= 4−3 = 1
We multiply the numerator and denominator by(
2−√
3)
and get
22+√
3· 2−
√3
2−√
3=
2(2−√
3)
4−3=
4−2√
31
Now consider the expression√
x−1√x−2√
y.
In order to eliminate the radical expressions in the denominator, we must multiply by√
x+2√
y .
We obtain
√x−1√
x−2√
y·√
x+2√
y√
x+2√
y=
(√
x−1)(√
x+2√
y)(√
x−2√
y)(√
x+2√
y)
=x+√
x−2√
xy−2√
yx−4y
Solve Real-World Problems Using Radical Expressions
Radicals often arise in problems involving areas and volumes of geometrical figures.
Example 10
A pool is twice as long as it is wide and is surrounded by a walkway of uniform width of 1 foot. The combined areaof the pool and the walkway is 400 square-feet. Find the dimensions of the pool and the area of the pool.
Solution
a. Make a sketch.
11.2. RADICAL EXPRESSIONS
www.ck12.org 771
b. Let x = the width of the pool.c. Write an equation.
Area = length ·width
Combined length of pool and walkway = 2x+2
Combined width of pool and walkway = x+2
Area = (2x+2)(x+2)
Since the combined area of pool and walkway is 400 f t2 we can write the equation.
(2x+2)(x+2) = 400
4. Solve the equation: (2x+2)(x+2) = 400
Multiply in order to eliminate the parentheses.
2x2 +4x+2x+4 = 400
Collect like terms.
2x2 +6x+4 = 400
Move all terms to one side of the equation.
2x2 +6x−396 = 0
Divide all terms by 2.
x2 +3x−198 = 0
Use the quadratic formula.
x =−b±
√b2−4ac
2a
=−3±
√32−4(1)(−198)
2(1)
=−3±
√801
2≈ −3±28.3
2x≈ 12.65 or−15.65 f eet
CHAPTER 11. ALGEBRA AND GEOMETRY CONNECTIONS; WORKING WITH DATA

772 www.ck12.org
5. We can disregard the negative solution since it does not make sense for this context. Thus, we can check ouranswer of 12.65 by substituting the result in the area formula.
Area = (2(12 ·65)+2)+(12.65+2) = 27.3 ·14.65≈ 400 f t2.
The answer checks out.
Example 11
The volume of a soda can is 355 cm3 . The height of the can is four times the radius of the base. Find the radius ofthe base of the cylinder.
Solution
a. Make a sketch.b. Let x = the radius of the cylinder basec. Write an equation.
The volume of a cylinder is given by
V = πr2 ·h
4. Solve the equation.
355 = πx2(4x)
355 = 4πx3
x3 =3554π
x =3
√3554π
= 3.046 cm
5. Check by substituting the result back into the formula.
V = πr2 ·h = π(3.046)2 · (4 ·3 ·046) = 355 cm3
So the volume is 355 cm3 .
The answer checks out.
11.2. RADICAL EXPRESSIONS
www.ck12.org 773
Review Questions
Evaluate each radical expression.
1.√
1692. 4√813. 3√−1254. 5√1024
Write each expression as a rational exponent.
5.3√
146. 4√
zw7.√
a8. 9√
y3
Write the following expressions in simplest radical form.
9.√
2410.√
30011.
5√96
12.
√240567
13.3√
50014.
6√64x8
15.3√
48a3b7
16. 3
√16x5
135y4
Simplify the following expressions as much as possible.
17. 3√
8−6√
3218.√
180+6√
40519.√
6−√
27+2√
54+3√
4820.√
8x3−4x√
98x21.√
48a+√
27a22.
3√4x3 + x
3√256
Multiply the following expressions.
23.√
6(√
10+√
8)
24.(√
a−√
b)(√
a+√
b)
25.(2√
x+5)(
2√
x+5)
Rationalize the denominator.
26. 7√15
27. 9√10
CHAPTER 11. ALGEBRA AND GEOMETRY CONNECTIONS; WORKING WITH DATA

774 www.ck12.org
28. 2x√5x
29.√
5√3y
30. 12
2−√
5
31. 6−√
34−√
332. x√
2+√
x33. 5y
2√
y−5
34. The volume of a spherical balloon is 950 cm-cubed. Find the radius of the balloon. (Volume of a sphere= 4
3 πR3 ).35. A rectangular picture is 9-inches wide and 12-inches long. The picture has a frame of uniform width. If the
combined area of picture and frame is 180 in-squared, what is the width of the frame?
Review Answers
1. 132. not a real solution3. -54. 45. 14
13
6. z14 w
14
7. a12
8. y13
9. 2√
610. 10
√3
11. 2 5√3
12. 49
√157
13. 53√
414. 2x.
6√x2
15. 2ab2 3√√
6b
16. 2x3y
√x2
5y
17. −18√
218. 15
√5
19. 7√
6+9√
320. −26x
√2x
21. 7√
3a22. 5x
3√4
23. 2√
15+4√
324. a−b25. 4x+20
√x+25
26. 7√
55
27. 9√
1010
28. 2√
5x5
11.2. RADICAL EXPRESSIONS

www.ck12.org 775
29.√
15y3y
30. −24−12√
5
31. 27+10√
313
32.√
2x− x2−x
33.10y√
y+25y4y−25
34. R = 6.1 cm35. 1.5 inches
CHAPTER 11. ALGEBRA AND GEOMETRY CONNECTIONS; WORKING WITH DATA
776 www.ck12.org
11.3 Radical Equations
Learning Objectives
• Solve a radical equation.• Solve radical equations with radicals on both sides.• Identify extraneous solutions.• Solve real-world problems using square root functions.
Introduction
When the variable in an equation appears inside a radical sign, the equation is called a radical equation. The firststeps in solving a radical equation are to perform operations that will eliminate the radical and change the equationinto a polynomial equation. A common method for solving radical equations is to isolate the most complicatedradical on one side of the equation and raise both sides of the equation to the power that will eliminate the radicalsign. If there are any radicals left in the equation after simplifying, we can repeat this procedure until all radical signsare gone. Once the equation is changed into a polynomial equation, we can solve it with the methods we alreadyknow.
We must be careful when we use this method, because whenever we raise an equation to a power, we could introducefalse solutions that are not in fact solutions to the original problem. These are called extraneous solutions. In orderto make sure we get the correct solutions, we must always check all solutions in the original radical equation.
Solve a Radical Equation
Let’s consider a few simple examples of radical equations where only one radical appears in the equation.
Example 1
Find the real solutions of the equation√
2x−1 = 5 .
Solution
Since the radical expression is already isolated, we square both sides of the equation in order to eliminate the radicalsign
(√2x−1
)2= 52
Remember that(√
a)2
= a so the equation simplifies to 2x−1 = 25
Add one to both sides. 2x = 26
Divide both sides by 2. x = 13
11.3. RADICAL EQUATIONS
www.ck12.org 777
Finally, we need to plug the solution in the original equation to see if it is a valid solution.
√2x−1 =
√2(13)−1 =
√26−1 =
√25 = 5
The answer checks out.
Example 2
Find the real solutions of 3√3−7x−3 = 0 .
Solution
We isolate the radical on one side of the equation.
3√3−7x = 3
Raise each side of the equation to the third power.
(3√3−7x
)3= 33
Simplify.
3−7x = 27
Subtract 3 from each side.
−7x = 24
Divide both sides by -7.
x =−247
Check
3√3−7x−3 = 3
√3−7
(−24
7
)−3 =
3√3+24−3 =3√
27−3 = 3−3 = 0.
The answer checks out.
Example 3
Find the real solutions of√
10− x2− x = 2 .
Solution
CHAPTER 11. ALGEBRA AND GEOMETRY CONNECTIONS; WORKING WITH DATA

778 www.ck12.org
We isolate the radical on one side of the equation.√
10− x2 = 2+ x
Square each side of the equation.(√
10− x2)= (2+ x)2
Simplify. 10− x2 = 4+4x+ x2
Move all terms to one side of the equation. 0 = 2x2 +4x−6
Solve using the quadratic formula. x =−4±
√42−4(2)(−6)
6
Simplify.−4±
√64
4
Rewrite√
64 in simplest form. x =−4±8
4Reduce all terms by a factor of 2. x = 1 or x =−3
Check
√10−12−1 =
√9−1 = 3−1 = 2
The answer checks out.
√10− (−3)2− (−3) =
√1+3 = 1+3 = 4 6= 2
This solution does not check out.
The equation has only one solution, x = 1 . The solution x =−3 is called an extraneous solution.
Solve Radical Equations with Radicals on Both Sides
Often equations have more than one radical expression. The strategy in this case is to isolate the most complicatedradical expression and raise the equation to the appropriate power. We then repeat the process until all radical signsare eliminated.
Example 4
Find the real roots of the equation√
2x+1−√
x−3 = 2 .
Solution
Isolate one of the radical expressions
√2x+1 = 2+
√x−3
Square both sides
(√2x+1
)2=(
2+√
x−3)2
11.3. RADICAL EQUATIONS
www.ck12.org 779
Eliminate parentheses
2x+1 = 4+4√
x−3+ x−3
Simplify.
x = 4√
x−3
Square both sides of the equation.
x2 =(
4√
x−3)2
Eliminate parentheses.
x2 = 16(x−3)
Simplify.
x2 = 16x−48
Move all terms to one side of the equation.
x2−16x+48 = 0
Factor.
(x−12)(x−4) = 0
Solve.
x = 12 or x = 4
Check
√2(12)+1−
√12−3 =
√25−
√9 = 5−3 = 2
The solution checks out.
√2(4)+1−
√4−3 =
√9−√
1 = 3−1 = 2
The solution checks out.
The equation has two solutions: x = 12 and x = 4 .
CHAPTER 11. ALGEBRA AND GEOMETRY CONNECTIONS; WORKING WITH DATA
780 www.ck12.org
Identify Extraneous Solutions to Radical Equations
We saw in Example 3 that some of the solutions that we find by solving radical equations do not check out whenwe substitute (or “plug in”) those solutions back into the original radical equation. These are called extraneoussolutions. It is very important to check the answers we obtain by plugging them back into the original equation. Inthis way, we can distinguish between the real and the extraneous solutions of an equation.
Example 5
Find the real roots of the equation√
x−3−√
x = 1 .
Solution
Isolate one of the radical expressions.
√x−3 =
√x+1
Square both sides.
(√x−3
)2=(√
x+1)2
Remove parenthesis.
x−3 =(√
x)2
+2√
x+1
Simplify.
x−3 = x+2√
x+1
Now isolate the remaining radical.
−4 = 2√
x
Divide all terms by 2.
−2 =√
x
Square both sides.
x = 4
Check
√4−3−
√4 =√
1−2 = 1−2 =−1
The solution does not check out.
The equation has no real solutions. Therefore, x = 4 is an extraneous solution.
11.3. RADICAL EQUATIONS
www.ck12.org 781
Solve Real-World Problems using Radical Equations
Radical equations often appear in problems involving areas and volumes of objects.
Example 6
The area of Anita’s square vegetable garden is 21 square-feet larger that Fred’s square vegetable garden. Anita andFred decide to pool their money together and buy the same kind of fencing for their gardens. If they need 84 feet offencing, what is the size of their gardens?
Solution
a. Make a sketchb. Define variables
Let Fred’s area be x
Anita’s area x+21
Therefore,
Side length of Fred’s garden is√
x
Side length of Anita’s garden is√
x+21
3. Find an equation
The amount of fencing is equal to the combined perimeters of the two squares.
4√
x+4√
x+21 = 84
4. Solve the equation
Divide all terms by 4.
√x+√
x+21 = 21
Isolate one of the radical expressions.
√x+21 = 21−
√x
Square both sides.
(√x+21
)2=(21−
√x)2
CHAPTER 11. ALGEBRA AND GEOMETRY CONNECTIONS; WORKING WITH DATA

782 www.ck12.org
Eliminate parentheses.
x+21 = 441−42√
x+ x
Isolate the radical expression.
42√
x = 420
Divide both sides by 42.
√x = 10
Square both sides.
x = 100 f t2
5. Check
4√
100+4√
100+21 = 40+44 = 84
The solution checks out.
Fred’s garden is 10 f t×10 f t = 100 f t2 and Anita’s garden is 11 f t×11 f t = 121 f t2 .
Example 7
A sphere has a volume of 456 cm3 . If the radius of the sphere is increased by 2 cm, what is the new volume of thesphere?
Solution
a. Make a sketch. Let’s draw a sphere.b. Define variables. Let R = the radius of the sphere.c. Find an equation.
The volume of a sphere is given by the formula:
11.3. RADICAL EQUATIONS
www.ck12.org 783
V =43
πr3
4. Solve the equation.
Plug in the value of the volume.
456 =43
πr3
Multiply by 3.
1368 = 4πr3
Divide by 4π .
108.92 = r3
Take the cube root of each side.
r = 3√108.92⇒ r = 4.776 cm
The new radius is 2 centimeters more.
r = 6.776 cm
The new volume is:
V =43
π(6.776)3 = 1302.5 cm3
5. Check
Let’s substitute in the values of the radius into the volume formula.
V =43
πr3 =43
π(4.776)3 = 456 cm3.
The solution checks out.
Example 8
The kinetic energy of an object of mass m and velocity v is given by the formula KE = 12 mv2 . A baseball has a mass
of 145 kg and its kinetic energy is measured to be 654 Joules (1 Joule = 1 kg ·m2/s2) when it hits the catcher’sglove. What is the velocity of the ball when it hits the catcher’s glove?
Solution
CHAPTER 11. ALGEBRA AND GEOMETRY CONNECTIONS; WORKING WITH DATA
784 www.ck12.org
a. Start with the formula. KE = 12 mv2
b. Plug in the values for the mass and the kinetic energy. 654 kg·m2
s2 = 12(145 kg)v2
c. Multiply both sides by 2. 1308 kg·m2
s2 = (145 kg)v2
d. Divide both sides by 145 kg. 9.02 m2
s2 = v2
e. Take the square root of both sides. v =√
9.02
√m2
s2 = 3.003 m/s
f. Check Plug the values for the mass and the velocity into the energy formula.
KE =12
mv2 =12(145 kg)(3.003 m/s)2 = 654 kg ·m2/s2
Review Questions
Find the solution to each of the following radical equations. Identify extraneous solutions.
1.√
x+2−2 = 02.√
3x−1 = 53. 2√
4−3x+3 = 04. 3√x−3 = 15.
4√
x2−9 = 26. 3√−2−5x+3 = 07.√
x = x−68.√
x2−5x−6 = 09.√
(x+1)(x−3) = x10.√
x+6 = x+411.√
x =√
x−9+112.√
3x+4 =−613.√
10−5x+√
1− x = 714.√
2x−2−2√
x+2 = 015.√
2x+5−3√
2x−3 =√
2− x16. 3
√x−9 =
√2x−14
17. The area of a triangle is 24 in2 and the height of the triangle is twice as long and the base. What are the baseand the height of the triangle?
18. The area of a circular disk is 124 in2 . What is the circumference of the disk? (Area = πr2,Circumference =2πr) .
19. The volume of a cylinder is 245 cm3 and the height of the cylinder is one third of the diameter of the base ofthe cylinder. The diameter of the cylinder is kept the same, but the height of the cylinder is increased by twocentimeters. What is the volume of the new cylinder? (Volume = πr2 ·h)
20. The height of a golf ball as it travels through the air is given by the equation h =−16t2 +256 . Find the timewhen the ball is at a height of 120 feet.
Review Answers
1. x = 22. x = 26
3
11.3. RADICAL EQUATIONS

www.ck12.org 785
3. No real solution, extraneous solution x = 712
4. x = 45. x = 5 or x =−56. x = 57. x = 9 , extraneous solution x = 48. x = 9 or x =−49. No real solution, extraneous solution x =−3
210. x =−2 , extraneous solution x =−511. x = 2512. No real solution, extraneous solution x = 32
313. x =−3 , extraneous solution x =−117
414. x = 9,x = 115. x = 2,x = 62
3316. x = 25 , extraneous solution x = 361
4917. Base = 4.9 in,Height = 9.8 in18. Circumference = 39.46 in19. Volume = 394.94 cm3
20. Time = 2.9 seconds
CHAPTER 11. ALGEBRA AND GEOMETRY CONNECTIONS; WORKING WITH DATA

786 www.ck12.org
11.4 The Pythagorean Theorem and ItsConverse
Learning Objectives
• Use the Pythagorean Theorem.• Use the converse of the Pythagorean Theorem.• Solve real-world problems using the Pythagorean Theorem and its converse.
Introduction
The Pythagorean Theorem is a statement of how the lengths of the sides of a right triangle are related to each other.A right triangle is one that contains a 90 degree angle. The side of the triangle opposite the 90 degree angle is calledthe hypotenuse and the sides of the triangle adjacent to the 90 degree angle are called the legs.
If we let a and b represent the legs of the right triangle and c represent the hypotenuse, then the Pythagorean Theoremcan be stated as:
In a right triangle, the square of the length of the hypotenuse is equal to the sum of the squares of the lengthsof the legs.
That is,
(leg1)2 +(leg2)
2 = (hypotenuse)2
Or using the labels given in the triangle to the right
a2 +b2 = c2
11.4. THE PYTHAGOREAN THEOREM AND ITS CONVERSE
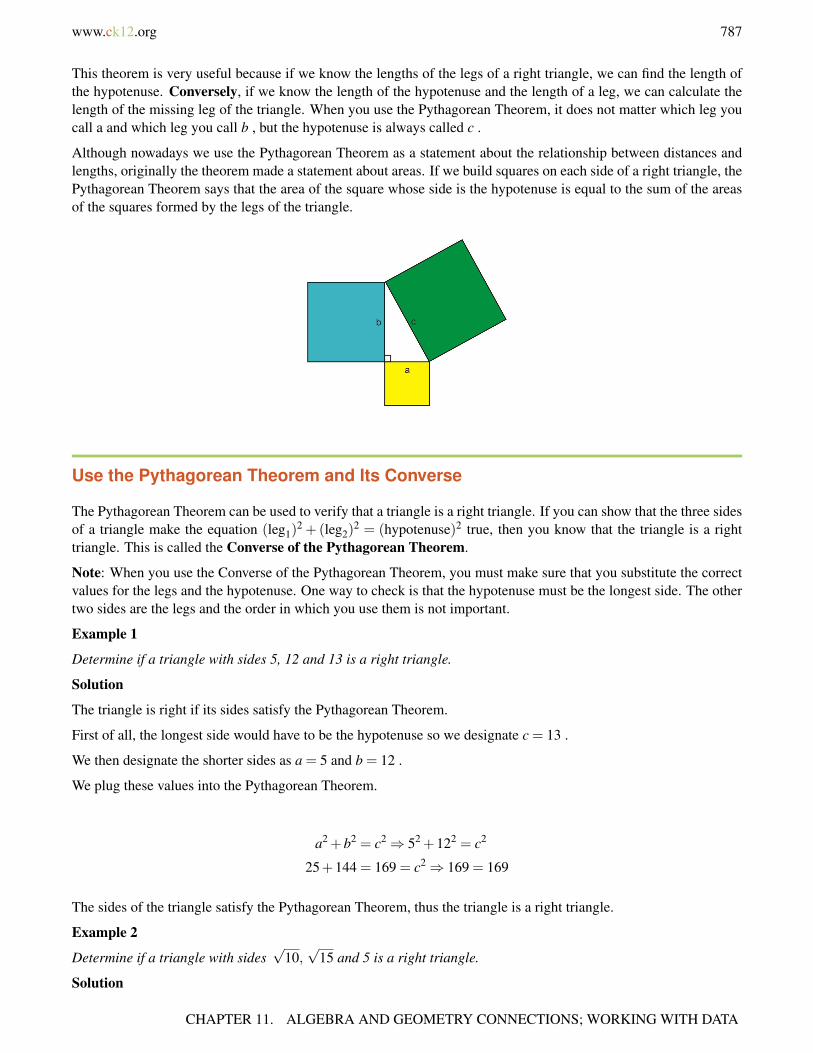
www.ck12.org 787
This theorem is very useful because if we know the lengths of the legs of a right triangle, we can find the length ofthe hypotenuse. Conversely, if we know the length of the hypotenuse and the length of a leg, we can calculate thelength of the missing leg of the triangle. When you use the Pythagorean Theorem, it does not matter which leg youcall a and which leg you call b , but the hypotenuse is always called c .
Although nowadays we use the Pythagorean Theorem as a statement about the relationship between distances andlengths, originally the theorem made a statement about areas. If we build squares on each side of a right triangle, thePythagorean Theorem says that the area of the square whose side is the hypotenuse is equal to the sum of the areasof the squares formed by the legs of the triangle.
Use the Pythagorean Theorem and Its Converse
The Pythagorean Theorem can be used to verify that a triangle is a right triangle. If you can show that the three sidesof a triangle make the equation (leg1)
2 +(leg2)2 = (hypotenuse)2 true, then you know that the triangle is a right
triangle. This is called the Converse of the Pythagorean Theorem.
Note: When you use the Converse of the Pythagorean Theorem, you must make sure that you substitute the correctvalues for the legs and the hypotenuse. One way to check is that the hypotenuse must be the longest side. The othertwo sides are the legs and the order in which you use them is not important.
Example 1
Determine if a triangle with sides 5, 12 and 13 is a right triangle.
Solution
The triangle is right if its sides satisfy the Pythagorean Theorem.
First of all, the longest side would have to be the hypotenuse so we designate c = 13 .
We then designate the shorter sides as a = 5 and b = 12 .
We plug these values into the Pythagorean Theorem.
a2 +b2 = c2⇒ 52 +122 = c2
25+144 = 169 = c2⇒ 169 = 169
The sides of the triangle satisfy the Pythagorean Theorem, thus the triangle is a right triangle.
Example 2
Determine if a triangle with sides√
10,√
15 and 5 is a right triangle.
Solution
CHAPTER 11. ALGEBRA AND GEOMETRY CONNECTIONS; WORKING WITH DATA
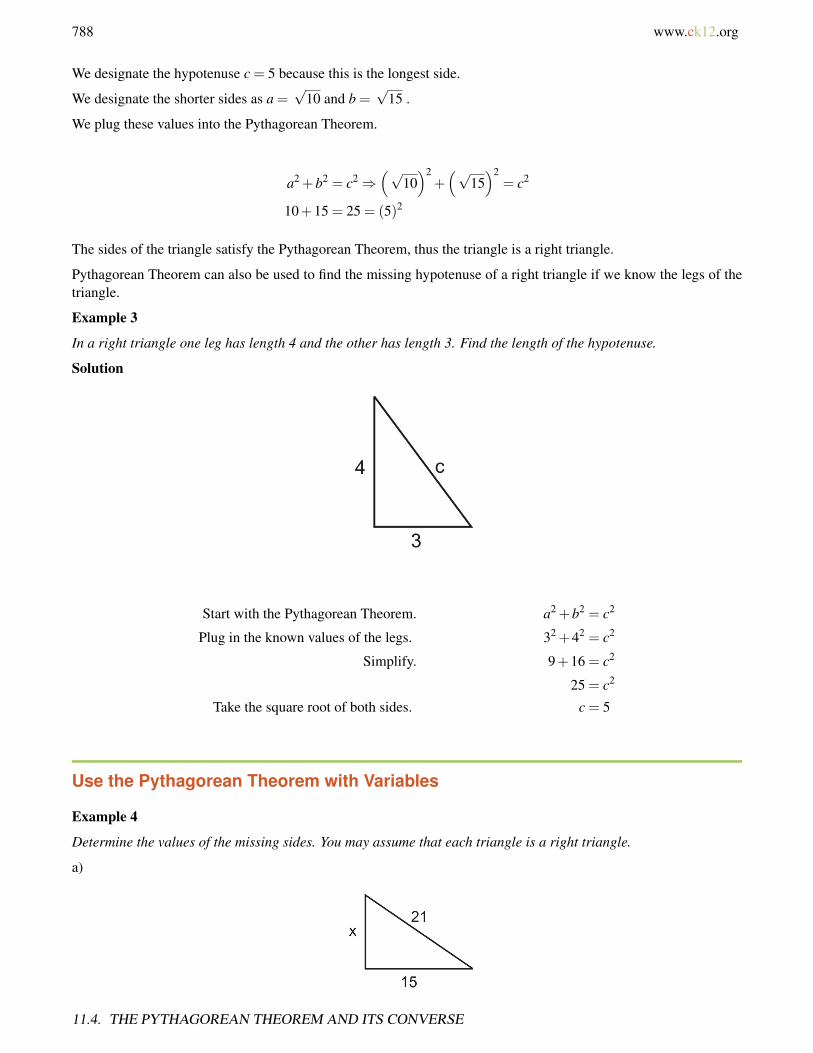
788 www.ck12.org
We designate the hypotenuse c = 5 because this is the longest side.
We designate the shorter sides as a =√
10 and b =√
15 .
We plug these values into the Pythagorean Theorem.
a2 +b2 = c2⇒(√
10)2
+(√
15)2
= c2
10+15 = 25 = (5)2
The sides of the triangle satisfy the Pythagorean Theorem, thus the triangle is a right triangle.
Pythagorean Theorem can also be used to find the missing hypotenuse of a right triangle if we know the legs of thetriangle.
Example 3
In a right triangle one leg has length 4 and the other has length 3. Find the length of the hypotenuse.
Solution
Start with the Pythagorean Theorem. a2 +b2 = c2
Plug in the known values of the legs. 32 +42 = c2
Simplify. 9+16 = c2
25 = c2
Take the square root of both sides. c = 5
Use the Pythagorean Theorem with Variables
Example 4
Determine the values of the missing sides. You may assume that each triangle is a right triangle.
a)
11.4. THE PYTHAGOREAN THEOREM AND ITS CONVERSE

www.ck12.org 789
b)
c)
Solution
Apply the Pythagorean Theorem.
a)
a2 +b2 = c2
x2 +152 = 212
x2 +225 = 441
x2 = 216⇒x =√
216 = 6√
6
b)
a2 +b2 = c2
y2 +32 = 72
y2 +9 = 49
y2 = 40⇒y =√
40 = 2√
10
c)
a2 +b2 = c2
182 +152 = z2
324+225 = z2
z2 = 216⇒x =√
549 = 3√
61
CHAPTER 11. ALGEBRA AND GEOMETRY CONNECTIONS; WORKING WITH DATA

790 www.ck12.org
Example 5
One leg of a right triangle is 5 more than the other leg. The hypotenuse is one more than twice the size of the shortleg. Find the dimensions of the triangle.
Solution
Let x = length of the short leg.
Then, x+5 = length of the long leg
And, 2x+1 = length of the hypotenuse.
The sides of the triangle must satisfy the Pythagorean Theorem,
Therefore x2 +(x+5)2 = (2x+1)
Eliminate the parenthesis. x2 + x2 +10x+25 = 4x2 +4x+1
Move all terms to the right hand side of the equation. 0 = 2x2−6x−24
Divide all terms by 2. 0 = x2−3x−12
Solve using the quadratic formula. x =3±√
9+482
=3±√
572
x≈ 5.27 or x≈−2.27
Answer
We can discard the negative solution since it does not make sense in the geometric context of this problem. Hence,we use x = 5.27 and we get short - leg = 5.27, long - leg = 10.27 and hypotenuse = 11.54.
Solve Real-World Problems Using the Pythagorean Theorem and Its Converse
The Pythagorean Theorem and its converse have many applications for finding lengths and distances.
Example 6
Maria has a rectangular cookie sheet that measures 10 inches× 14 inches . Find the length of the diagonal of thecookie sheet.
Solution
11.4. THE PYTHAGOREAN THEOREM AND ITS CONVERSE
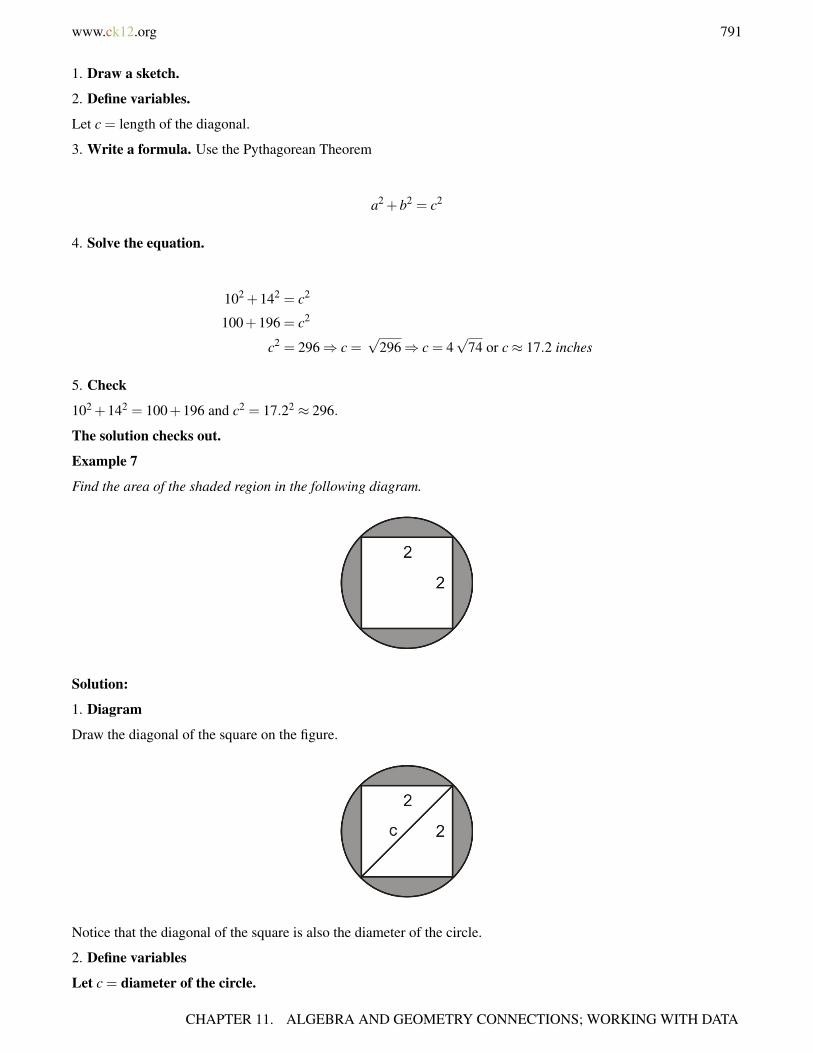
www.ck12.org 791
1. Draw a sketch.
2. Define variables.
Let c = length of the diagonal.
3. Write a formula. Use the Pythagorean Theorem
a2 +b2 = c2
4. Solve the equation.
102 +142 = c2
100+196 = c2
c2 = 296⇒ c =√
296⇒ c = 4√
74 or c≈ 17.2 inches
5. Check
102 +142 = 100+196 and c2 = 17.22 ≈ 296.
The solution checks out.
Example 7
Find the area of the shaded region in the following diagram.
Solution:
1. Diagram
Draw the diagonal of the square on the figure.
Notice that the diagonal of the square is also the diameter of the circle.
2. Define variables
Let c = diameter of the circle.
CHAPTER 11. ALGEBRA AND GEOMETRY CONNECTIONS; WORKING WITH DATA
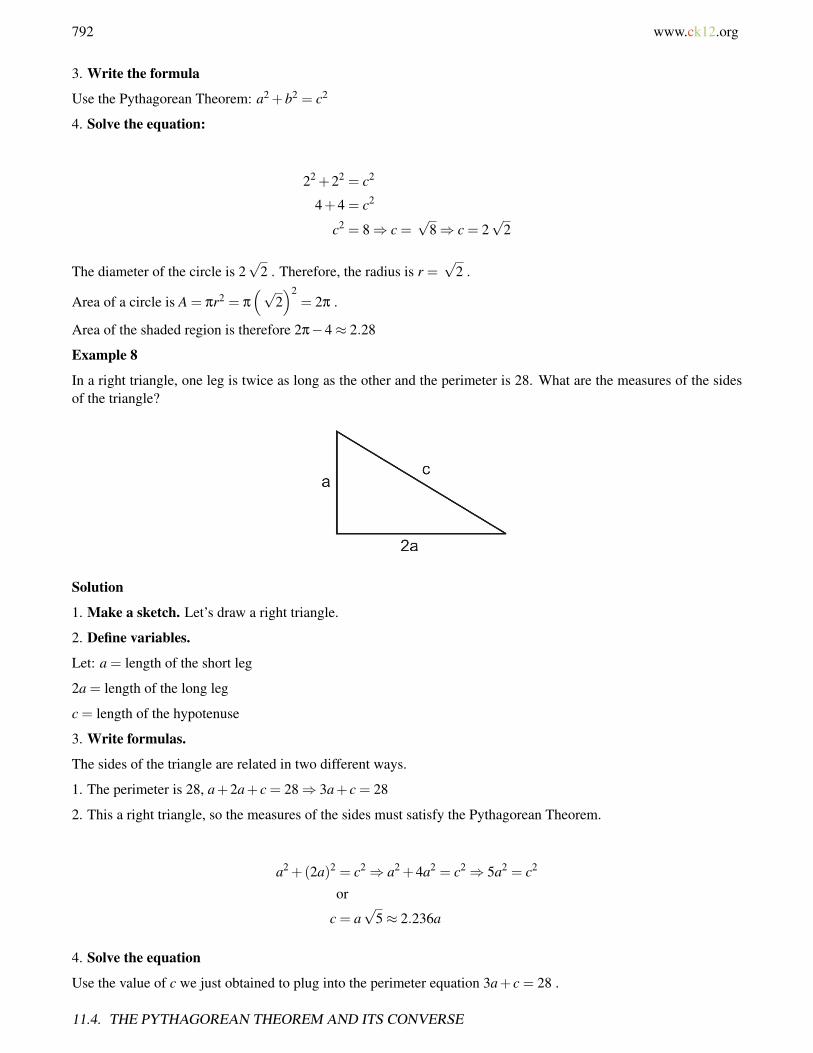
792 www.ck12.org
3. Write the formula
Use the Pythagorean Theorem: a2 +b2 = c2
4. Solve the equation:
22 +22 = c2
4+4 = c2
c2 = 8⇒ c =√
8⇒ c = 2√
2
The diameter of the circle is 2√
2 . Therefore, the radius is r =√
2 .
Area of a circle is A = πr2 = π
(√2)2
= 2π .
Area of the shaded region is therefore 2π−4≈ 2.28
Example 8
In a right triangle, one leg is twice as long as the other and the perimeter is 28. What are the measures of the sidesof the triangle?
Solution
1. Make a sketch. Let’s draw a right triangle.
2. Define variables.
Let: a = length of the short leg
2a = length of the long leg
c = length of the hypotenuse
3. Write formulas.
The sides of the triangle are related in two different ways.
1. The perimeter is 28, a+2a+ c = 28⇒ 3a+ c = 28
2. This a right triangle, so the measures of the sides must satisfy the Pythagorean Theorem.
a2 +(2a)2 = c2⇒ a2 +4a2 = c2⇒ 5a2 = c2
or
c = a√
5≈ 2.236a
4. Solve the equation
Use the value of c we just obtained to plug into the perimeter equation 3a+ c = 28 .
11.4. THE PYTHAGOREAN THEOREM AND ITS CONVERSE

www.ck12.org 793
3a+2.236a = 28⇒ 5.236a = 28⇒ a = 5.35
The short leg is:s a≈ 5.35.
The long leg is: 2a≈ 10.70.
The hypotenuse is: c≈ 11.95.
5. Check The legs of the triangle should satisfy the Pythagorean Theorem
a2 +b2 = 5.352 +10.702 = 143.1,c2 = 11.952 = 142.80
The results are approximately the same.
The perimeter of the triangle should be 28.
a+b+ c = 5.35+10.70+11.95 = 28
The answer checks out.
Example 9
Mike is loading a moving van by walking up a ramp. The ramp is 10 feet long and the bed of the van is 2.5 feetabove the ground. How far does the ramp extend past the back of the van?
Solution
1. Make a sketch.
2. Define Variables.
Let x = how far the ramp extends past the back of the van.
3. Write a formula. Use the Pythagorean Theorem:
x2 +2.52 = 102
4. Solve the equation.
x2 +6.25 = 100
x2 = 93.5
x =√
93.5≈ 9.7 f t
CHAPTER 11. ALGEBRA AND GEOMETRY CONNECTIONS; WORKING WITH DATA
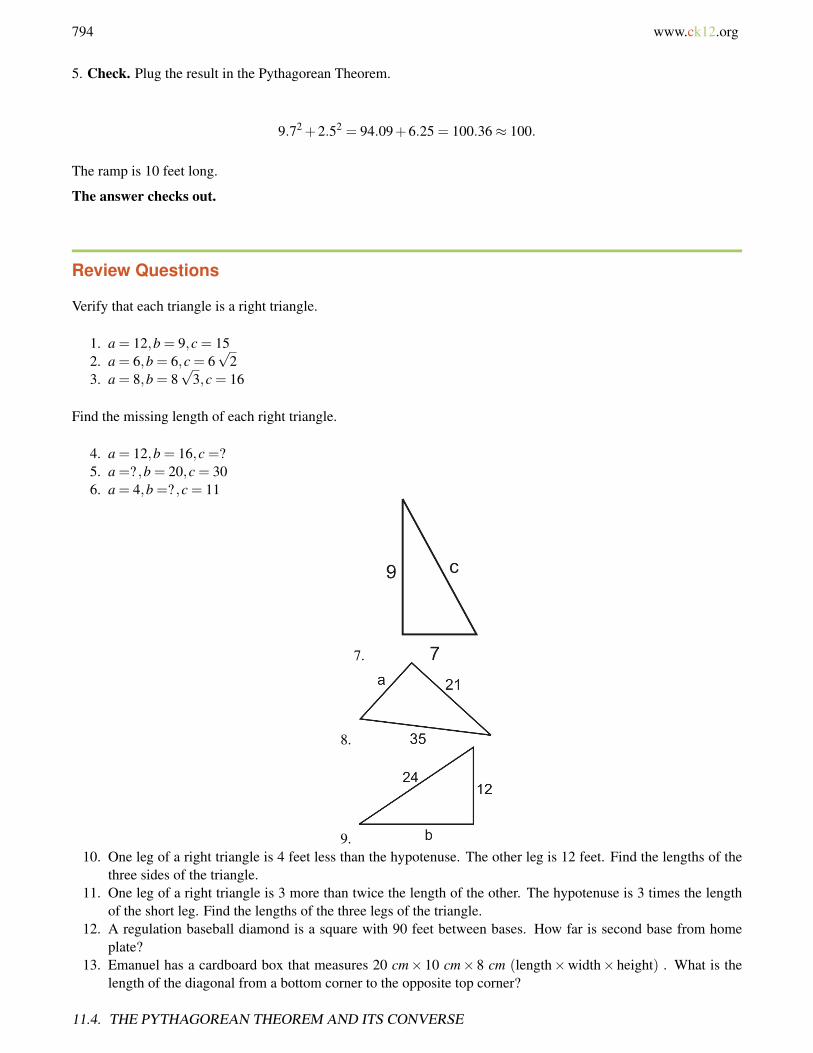
794 www.ck12.org
5. Check. Plug the result in the Pythagorean Theorem.
9.72 +2.52 = 94.09+6.25 = 100.36≈ 100.
The ramp is 10 feet long.
The answer checks out.
Review Questions
Verify that each triangle is a right triangle.
1. a = 12,b = 9,c = 152. a = 6,b = 6,c = 6
√2
3. a = 8,b = 8√
3,c = 16
Find the missing length of each right triangle.
4. a = 12,b = 16,c =?5. a =? ,b = 20,c = 306. a = 4,b =? ,c = 11
7.
8.
9.10. One leg of a right triangle is 4 feet less than the hypotenuse. The other leg is 12 feet. Find the lengths of the
three sides of the triangle.11. One leg of a right triangle is 3 more than twice the length of the other. The hypotenuse is 3 times the length
of the short leg. Find the lengths of the three legs of the triangle.12. A regulation baseball diamond is a square with 90 feet between bases. How far is second base from home
plate?13. Emanuel has a cardboard box that measures 20 cm× 10 cm× 8 cm (length×width× height) . What is the
length of the diagonal from a bottom corner to the opposite top corner?
11.4. THE PYTHAGOREAN THEOREM AND ITS CONVERSE

www.ck12.org 795
14. Samuel places a ladder against his house. The base of the ladder is 6 feet from the house and the ladder is 10feet long. How high above the ground does the ladder touch the wall of the house?
15. Find the area of the triangle if area of a triangle is defined as A = 12 base×height .
16. Instead of walking along the two sides of a rectangular field, Mario decided to cut across the diagonal. Hesaves a distance that is half of the long side of the field. Find the length of the long side of the field given thatthe short side is 123 feet.
17. Marcus sails due north and Sandra sails due east from the same starting point. In two hours, Marcus’ boat is35 miles from the starting point and Sandra’s boat is 28 miles from the starting point. How far are the boatsfrom each other?
18. Determine the area of the circle.
Review Answers
1. 122 +92 = 225152 = 225
2. 62 +62 = 72(6√
2)2
= 72
3. 82 +(
8√
3)2
= 256
162 = 2564. c = 205. a = 10
√5
6. b =√
1057. c =
√130
8. a = 289. b = 12
√3
10. 12, 16, 2011. 3.62, 10.24, 10.8612. 127.3 ft13. 23.75 cm14. 8 feet15. 32.2416. 164 feet
CHAPTER 11. ALGEBRA AND GEOMETRY CONNECTIONS; WORKING WITH DATA

796 www.ck12.org
17. 44.82 miles18. 83.25
11.4. THE PYTHAGOREAN THEOREM AND ITS CONVERSE

www.ck12.org 797
11.5 Distance and Midpoint Formulas
Learning Objectives
• Find the distance between two points in the coordinate plane.• Find the missing coordinate of a point given the distance from another known point.• Find the midpoint of a line segment.• Solve real-world problems using distance and midpoint formulas.
Introduction
In the last section, we saw how to use the Pythagorean Theorem in order to find lengths. In this section, you willlearn how to use the Pythagorean Theorem to find the distance between two coordinate points.
Example 1
Find distance between points A = (1,4) and B = (5,2) .
Solution
Plot the two points on the coordinate plane. In order to get from point A = (1,4) to point B = (5,2) , we need tomove 4 units to the right and 2 units down.
To find the distance between A and B we find the value of d using the Pythagorean Theorem.
d2 = 22 +42 = 20
d =√
20 = 2√
5 = 4.47
Example 2: Find the distance between points C = (2,1) and D = (−3,−4) .
CHAPTER 11. ALGEBRA AND GEOMETRY CONNECTIONS; WORKING WITH DATA

798 www.ck12.org
Solution: We plot the two points on the graph above.
In order to get from point C to point D , we need to move 3 units down and 5 units to the left.
We find the distance from C to D by finding the length of d with the Pythagorean Theorem.
d2 = 32 +52 = 34
d =√
34 = 5.83
The Distance Formula
This procedure can be generalized by using the Pythagorean Theorem to derive a formula for the distance betweentwo points on the coordinate plane.
Let’s find the distance between two general points A = (x1,y1) and B = (x2,y2) .
Start by plotting the points on the coordinate plane.
In order to move from point A to point B in the coordinate plane, we move x2−x1 units to the right and y2−y1 unitsup. We can find the length d by using the Pythagorean Theorem.
d2 = (x2− x1)2 +(y2− y1)
2.
This equation leads us to the Distance Formula.
Given two points (x1,y1) and (x2,y2) the distance between them is:
d =√
(x2− x1)2 +(y2− y1)2.
We can use this formula to find the distance between two points on the coordinate plane. Notice that the distanceis the same if you are going from point A to point B as if you are going from point B to point A . Thus, it does notmatter which order you plug the points into the distance formula.
Find the Distance Between Two Points in the Coordinate Plane
Let’s now apply the distance formula to the following examples.
11.5. DISTANCE AND MIDPOINT FORMULAS

www.ck12.org 799
Example 2
Find the distance between the following points.
a) (-3, 5) and (4, -2)
b) (12, 16) and (19, 21)
c) (11.5, 2.3) and (-4.2, -3.9)
Solution
Plug the values of the two points into the distance formula. Be sure to simplify if possible.
a) d =√(−3−4)2 +(5− (−2))2 =
√(−7)2 +(7)2 =
√49+49 =
√98 = 7
√2
b) d =√(12−19)2 +(16−21)2 =
√(−7)2 +(−5)2 =
√49+25 =
√74
c) d =√(11.5+4.2)2 +(2.3+3.9)2 =
√(15.7)2 +(6.2)2 =
√284.93 = 16.88
Example 3
Show that point P = (2,6) is equidistant for A = (−4,3) and B = (5,0).
Solution
To show that the point P is equidistant from points A and B , we need to show that the distance from P to A is equalto the distance from P to B .
Before we apply the distance formula, let’s graph the three points on the coordinate plane to get a visual representa-tion of the problem.
From the graph we see that to get from point P to point A , we move 6 units to the left and 3 units down. To movefrom point P to point B , we move 6 units down and 3 units to the left. From this information, we should expect P tobe equidistant from A and B .
Now, let’s apply the distance formula for find the lengths PA and PB .
PA =√
(2+4)2 +(6−3)2 =√(6)2 +(3)2 =
√39+9 =
√45
PA =√
(2−5)2 +(6−0)2 =√(−3)2 +(6)2 =
√9+36 =
√45
PA = PB, so P is equidistant from points A and B .
CHAPTER 11. ALGEBRA AND GEOMETRY CONNECTIONS; WORKING WITH DATA
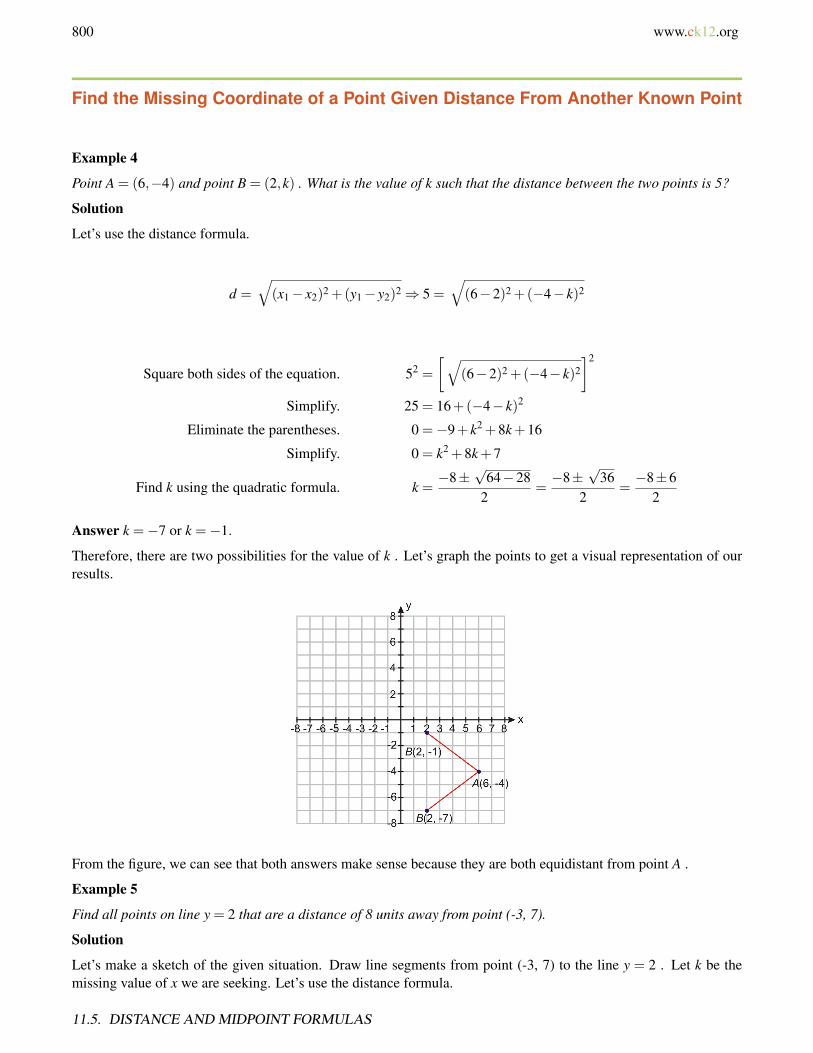
800 www.ck12.org
Find the Missing Coordinate of a Point Given Distance From Another Known Point
Example 4
Point A = (6,−4) and point B = (2,k) . What is the value of k such that the distance between the two points is 5?
Solution
Let’s use the distance formula.
d =√(x1− x2)2 +(y1− y2)2⇒ 5 =
√(6−2)2 +(−4− k)2
Square both sides of the equation. 52 =
[√(6−2)2 +(−4− k)2
]2
Simplify. 25 = 16+(−4− k)2
Eliminate the parentheses. 0 =−9+ k2 +8k+16
Simplify. 0 = k2 +8k+7
Find k using the quadratic formula. k =−8±
√64−28
2=−8±
√36
2=−8±6
2
Answer k =−7 or k =−1.
Therefore, there are two possibilities for the value of k . Let’s graph the points to get a visual representation of ourresults.
From the figure, we can see that both answers make sense because they are both equidistant from point A .
Example 5
Find all points on line y = 2 that are a distance of 8 units away from point (-3, 7).
Solution
Let’s make a sketch of the given situation. Draw line segments from point (-3, 7) to the line y = 2 . Let k be themissing value of x we are seeking. Let’s use the distance formula.
11.5. DISTANCE AND MIDPOINT FORMULAS
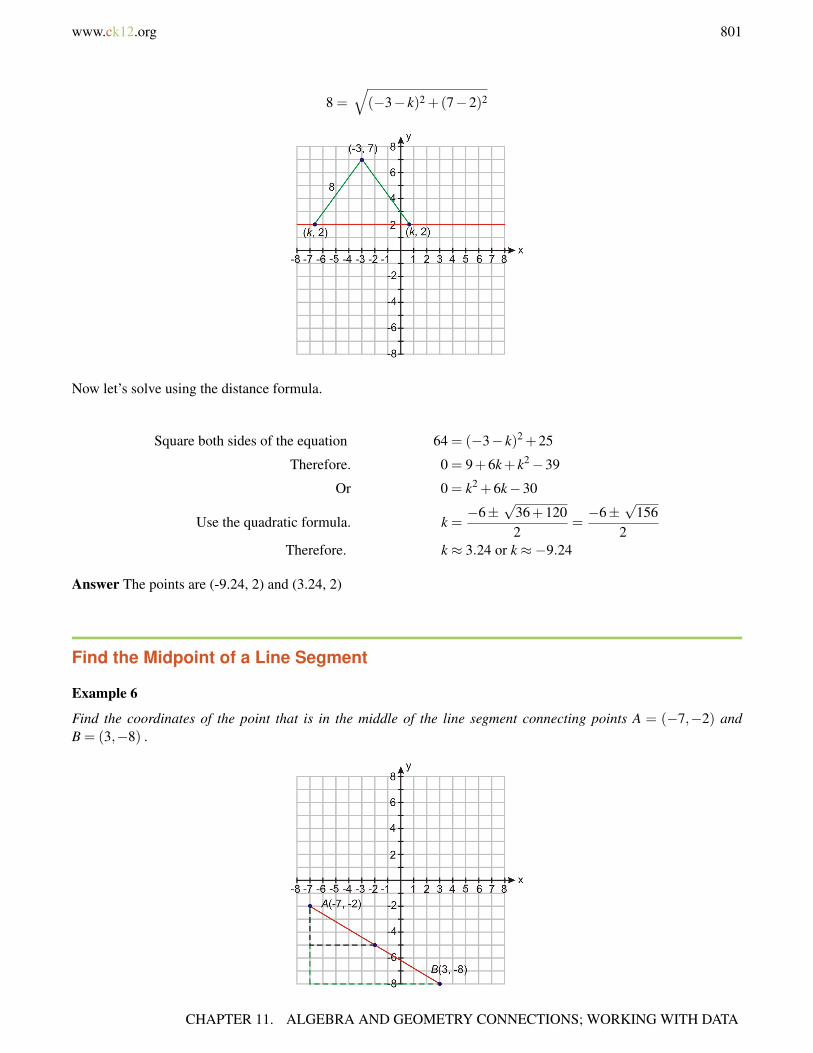
www.ck12.org 801
8 =√
(−3− k)2 +(7−2)2
Now let’s solve using the distance formula.
Square both sides of the equation 64 = (−3− k)2 +25
Therefore. 0 = 9+6k+ k2−39
Or 0 = k2 +6k−30
Use the quadratic formula. k =−6±
√36+1202
=−6±
√156
2Therefore. k ≈ 3.24 or k ≈−9.24
Answer The points are (-9.24, 2) and (3.24, 2)
Find the Midpoint of a Line Segment
Example 6
Find the coordinates of the point that is in the middle of the line segment connecting points A = (−7,−2) andB = (3,−8) .
CHAPTER 11. ALGEBRA AND GEOMETRY CONNECTIONS; WORKING WITH DATA
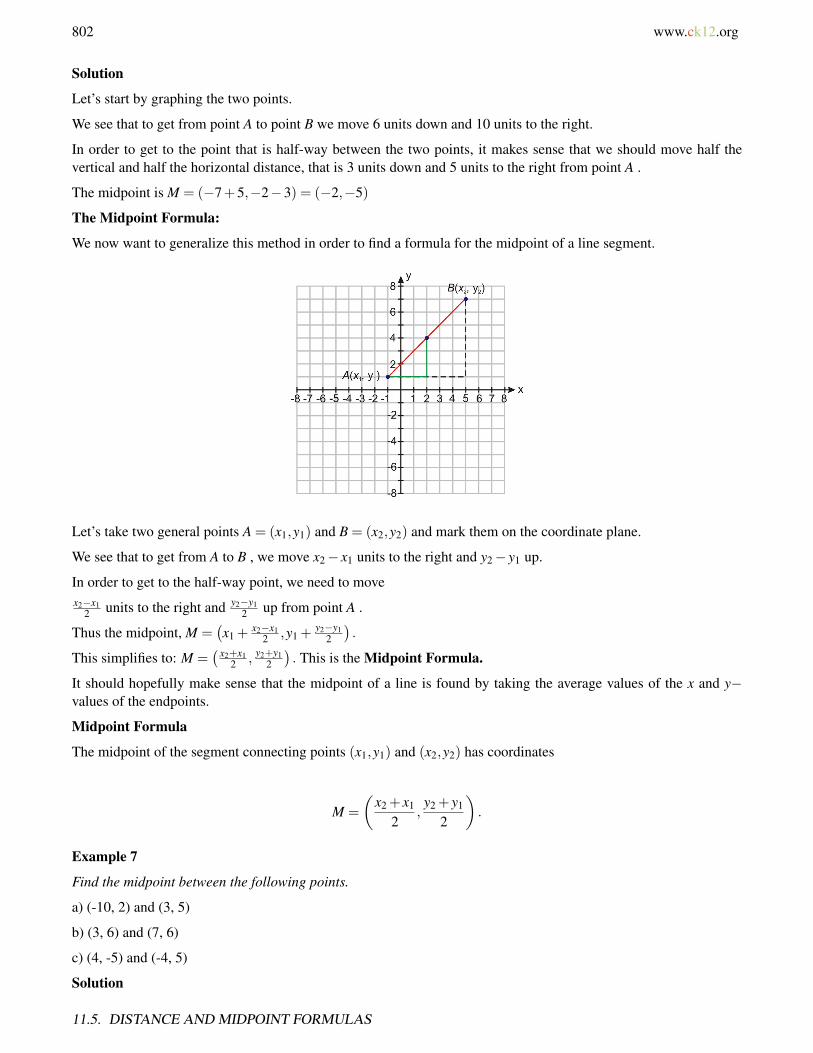
802 www.ck12.org
Solution
Let’s start by graphing the two points.
We see that to get from point A to point B we move 6 units down and 10 units to the right.
In order to get to the point that is half-way between the two points, it makes sense that we should move half thevertical and half the horizontal distance, that is 3 units down and 5 units to the right from point A .
The midpoint is M = (−7+5,−2−3) = (−2,−5)
The Midpoint Formula:
We now want to generalize this method in order to find a formula for the midpoint of a line segment.
Let’s take two general points A = (x1,y1) and B = (x2,y2) and mark them on the coordinate plane.
We see that to get from A to B , we move x2− x1 units to the right and y2− y1 up.
In order to get to the half-way point, we need to movex2−x1
2 units to the right and y2−y12 up from point A .
Thus the midpoint, M =(x1 +
x2−x12 ,y1 +
y2−y12
).
This simplifies to: M =( x2+x1
2 , y2+y12
). This is the Midpoint Formula.
It should hopefully make sense that the midpoint of a line is found by taking the average values of the x and y−values of the endpoints.
Midpoint Formula
The midpoint of the segment connecting points (x1,y1) and (x2,y2) has coordinates
M =
(x2 + x1
2,y2 + y1
2
).
Example 7
Find the midpoint between the following points.
a) (-10, 2) and (3, 5)
b) (3, 6) and (7, 6)
c) (4, -5) and (-4, 5)
Solution
11.5. DISTANCE AND MIDPOINT FORMULAS
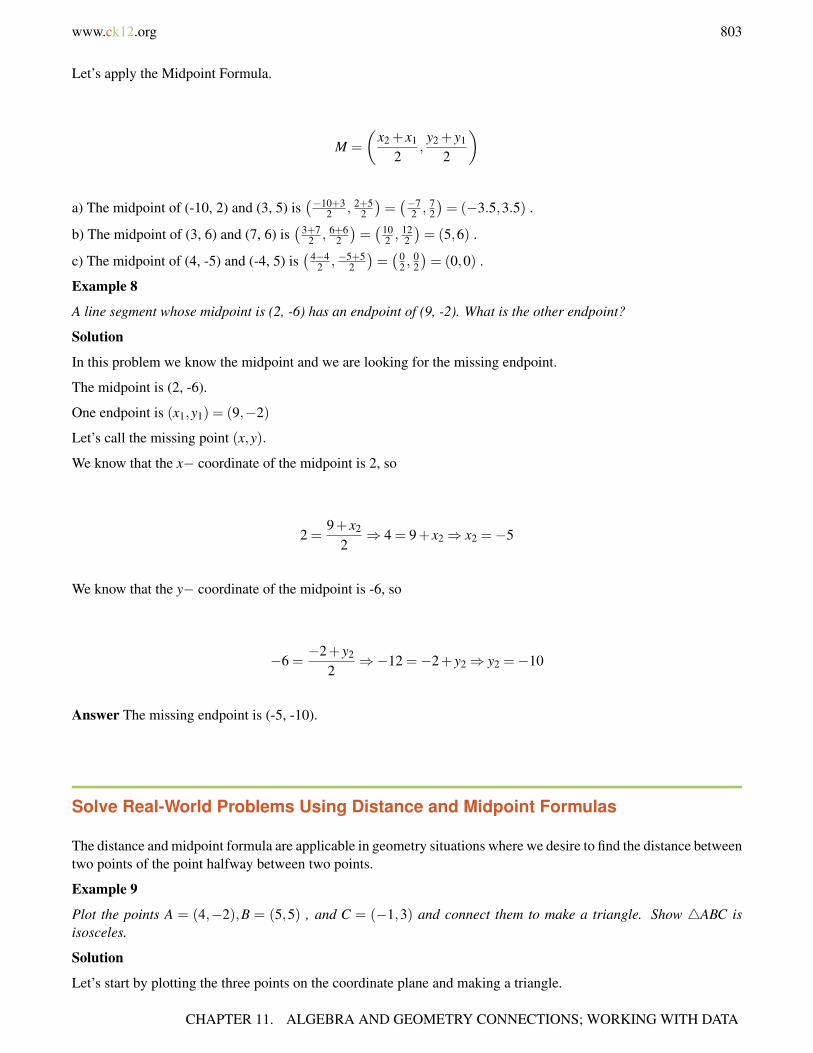
www.ck12.org 803
Let’s apply the Midpoint Formula.
M =
(x2 + x1
2,y2 + y1
2
)
a) The midpoint of (-10, 2) and (3, 5) is(−10+3
2 , 2+52
)=(−7
2 , 72
)= (−3.5,3.5) .
b) The midpoint of (3, 6) and (7, 6) is(3+7
2 , 6+62
)=(10
2 ,122
)= (5,6) .
c) The midpoint of (4, -5) and (-4, 5) is(4−4
2 , −5+52
)=(0
2 ,02
)= (0,0) .
Example 8
A line segment whose midpoint is (2, -6) has an endpoint of (9, -2). What is the other endpoint?
Solution
In this problem we know the midpoint and we are looking for the missing endpoint.
The midpoint is (2, -6).
One endpoint is (x1,y1) = (9,−2)
Let’s call the missing point (x,y).
We know that the x− coordinate of the midpoint is 2, so
2 =9+ x2
2⇒ 4 = 9+ x2⇒ x2 =−5
We know that the y− coordinate of the midpoint is -6, so
−6 =−2+ y2
2⇒−12 =−2+ y2⇒ y2 =−10
Answer The missing endpoint is (-5, -10).
Solve Real-World Problems Using Distance and Midpoint Formulas
The distance and midpoint formula are applicable in geometry situations where we desire to find the distance betweentwo points of the point halfway between two points.
Example 9
Plot the points A = (4,−2),B = (5,5) , and C = (−1,3) and connect them to make a triangle. Show 4ABC isisosceles.
Solution
Let’s start by plotting the three points on the coordinate plane and making a triangle.
CHAPTER 11. ALGEBRA AND GEOMETRY CONNECTIONS; WORKING WITH DATA

804 www.ck12.org
We use the distance formula three times to find the lengths of the three sides of the triangle.
AB =√(4−5)2 +(−2−5)2 =
√(−1)2 +(−7)2 =
√1+49 =
√50 = 5
√2
BC =√(5+1)2 +(5−3)2 =
√(6)2 +(2)2 =
√36+4 =
√40 = 2
√10
AC =√
(4+1)2 +(−2−3)2 =√(5)2 +(−5)2 =
√25+25 =
√50 = 5
√2
Notice that AB = AC , therefore4ABC is isosceles.
Example 10
At 8 AM one day, Amir decides to walk in a straight line on the beach. After two hours of making no turns andtraveling at a steady rate, Amir was two mile east and four miles north of his starting point. How far did Amir walkand what was his walking speed?
Solution
Let’s start by plotting Amir’s route on a coordinate graph. We can place his starting point at the origin A = (0,0) .Then, his ending point will be at point B = (2,4) . The distance can be found with the distance formula.
d =√(2−0)2 +(4−0)2 =
√(2)2 +(4)2 =
√4+16 =
√20
d = 4.47 miles.
11.5. DISTANCE AND MIDPOINT FORMULAS

www.ck12.org 805
Since Amir walked 4.47 miles in 2 hours, his speed is
Speed =4.47 miles
2 hours= 2.24 mi/h
Review Questions
Find the distance between the two points.
1. (3, -4) and (6, 0)2. (-1, 0) and (4, 2)3. (-3, 2) and (6, 2)4. (0.5, -2.5) and (4, -4)5. (12, -10) and (0, -6)6. (2.3, 4.5) and (-3.4, -5.2)7. Find all points having an x coordinate of -4 and whose distance from point (4, 2) is 10.8. Find all points having a y coordinate of 3 and whose distance from point (-2, 5) is 8.
Find the midpoint of the line segment joining the two points.
9. (3, -4) and (6, 1)10. (2, -3) and (2, 4)11. (4, -5) and (8, 2)12. (1.8, -3.4) and (-0.4, 1.4)13. (5, -1) and (-4, 0)14. (10, 2) and (2, -4)15. An endpoint of a line segment is (4, 5) and the midpoint of the line segment is (3, -2). Find the other endpoint.16. An endpoint of a line segment is (-10, -2) and the midpoint of the line segment is (0, 4). Find the other
endpoint.17. Plot the points A = (1,0),B = (6,4),C = (9,−2) and D = (−6,−4),E = (−1,0),F = (2,−6) . Prove that
triangles ABC and DEF are congruent.18. Plot the points A = (4,−3),B = (3,4),C = (−2,−1),D = (−1,−8) . Show that ABCD is a rhombus (all sides
are equal).19. Plot points A = (−5,3),B = (6,0),C = (5,5) . Find the length of each side. Show that it is a right triangle.
Find the area.20. Find the area of the circle with center (-5, 4) and the point on the circle (3, 2).21. Michelle decides to ride her bike one day. First she rides her bike due south for 12 miles, then the direction
of the bike trail changes and she rides in the new direction for a while longer. When she stops, Michelle is 2miles south and 10 miles west from her starting point. Find the total distance that Michelle covered from herstarting point.
Review Answers
1. 52.√
293. 9
CHAPTER 11. ALGEBRA AND GEOMETRY CONNECTIONS; WORKING WITH DATA
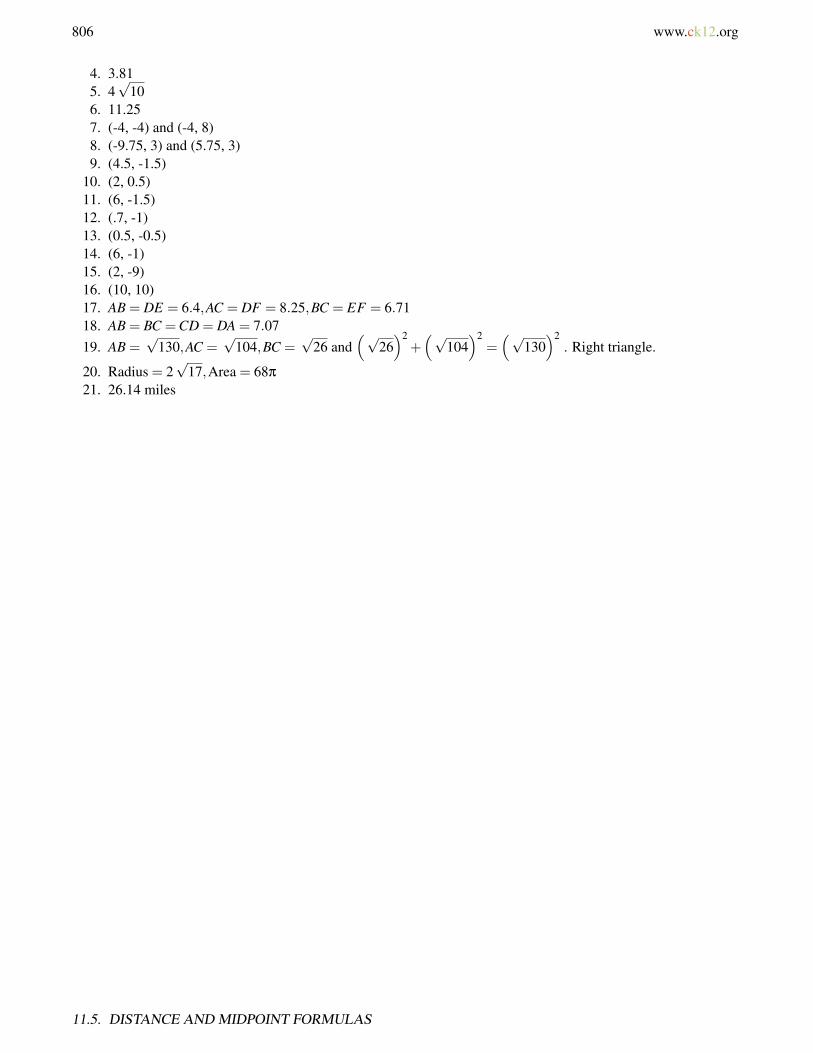
806 www.ck12.org
4. 3.815. 4√
106. 11.257. (-4, -4) and (-4, 8)8. (-9.75, 3) and (5.75, 3)9. (4.5, -1.5)
10. (2, 0.5)11. (6, -1.5)12. (.7, -1)13. (0.5, -0.5)14. (6, -1)15. (2, -9)16. (10, 10)17. AB = DE = 6.4,AC = DF = 8.25,BC = EF = 6.7118. AB = BC =CD = DA = 7.0719. AB =
√130,AC =
√104,BC =
√26 and
(√26)2
+(√
104)2
=(√
130)2
. Right triangle.
20. Radius = 2√
17,Area = 68π
21. 26.14 miles
11.5. DISTANCE AND MIDPOINT FORMULAS
www.ck12.org 807
11.6 Measures of Central Tendency andDispersion
Learning Objectives
• Compare measures of central tendency.• Measure the dispersion of a collection of data.• Calculate and interpret measures of central tendency and dispersion for real-world situations.
Comparing Measures of Central Tendency
The word “average” is often used to describe something that is used to represent the general characteristics of alarger group of unequal objects. Mathematically, an average is a single number which can be used to summarize acollection of numerical values. In mathematics, there are several types of “averages” with the most common beingthe mean, the median and the mode.
Mean
The arithmetic mean of a group of numbers is found by dividing the sum of the numbers by the number of valuesin the group. In other words, we add all the numbers together and divide by the number of numbers.
Example 1
Find the mean of the numbers 11, 16, 9, 15, 5, 18
Solution
There are six separate numbers, so we find the mean with the following.
mean =11+16+9+15+5+18
6=
746
= 1213.
The arithmetic mean is what most people automatically think of when the word average is used with numbers. It isgenerally a good way to take an average, but suffers when a small number of the values lie significantly far awayfrom the majority of the rest. A classic example would be when calculating average income. If one person (suchas Former Microsoft Corporation chairman Bill Gates) earns a great deal more than everyone else who is surveyed,then one value can sway the mean significantly away from what the majority of people earn.
Example 2
The annual incomes for 8 professions are shown below. Form the data, calculate the mean annual income of the 8professions.
TABLE 11.6:
Professional Realm Annual incomeFarming, Fishing, and Forestry $19, 630
CHAPTER 11. ALGEBRA AND GEOMETRY CONNECTIONS; WORKING WITH DATA
808 www.ck12.org
TABLE 11.6: (continued)
Professional Realm Annual incomeSales and Related $28, 920Architecture and Engineering $56, 330Healthcare Practitioners $49, 930Legal $69, 030Teaching & Education $39, 130Construction $35, 460Professional Baseball Player* $2, 476, 590
(Source: Bureau of Labor Statistics, except (*) - The Baseball Players’ Association (playbpa.com)).
Solution
There are 8 values listed so we find the mean as follows.
mean =$(19630+28920+56330+49930+69030+39130+35460+2476590)
8= $346,877.50
As you can see, the mean annual income is substantially larger than 7 out of the 8 professions. The effect of the singleoutlier (the baseball player) has a dramatic effect on the mean, so the mean is not a good method for representingthe ‘average’ salary in this case.
Algebraic Formula for the Mean.
If we have a number of values such as 11, 16, 9, 15, 5, 18 we may label them as follows.
TABLE 11.7:
Position in Sequence Label Value1st x1 112nd x2 163rd x3 94th x4 155th x5 56th x6 18
We can see from the table that x1 = 11,x2 = 16,x3 = 9, etc... If we also say that the number of terms = n , then justas x1 is the first term, xn is the last term. We can now define the mean (given the symbol x ) as
Arithmetic mean
x =x1 + x2 + x3 + . . .+ xn
n
Median
The median is another type of average. It is defined as the value in the middle of a group of numbers. To find themedian, we must first list all numbers in order from least to greatest.
Example 3
Find the median of the numbers 11, 21, 6, 17, 9.
11.6. MEASURES OF CENTRAL TENDENCY AND DISPERSION
www.ck12.org 809
Solution:
We first list the numbers in ascending order.
6, 9, 11, 17, 21
The median is the value in the middle of the set (in bold).
The median is 11. There are two values higher than 11 and two values lower than 11.
If there is an even number of values then the median is taken as the arithmetic mean of the two numbers in themiddle.
Example 4
Find the median of the numbers 2, 17, 1, -3, 12, 8, 12, 16
Solution:
We first list the numbers in ascending order.
-3, 1, 2, 8, 12, 12, 16, 17
The median is the value in the middle of the set, and lies between 8 and 12:
median =8+12
2=
202
= 10.
The median is 10. Four values are lower than 10, four values are higher than 10.
If you look again at the two previous examples, you will see that when we had 5 values, the median was the 3rd
term. With 8 values, the median was half way between the 4th and 5th values. In general, with a total of n values,the median is the
(n+12
)th value. When the quantity(n+1
2
)is fractional, it indicates that the median is the mean of
two data points. For example with 15 ordered data points, the median would be the(15+1
2
)= 8th value. For 50 data
points the quantity(n+1
2
)= 25.5 indicating that the median is given by taking the arithmetic mean of the 25th and
26th values.
The median is a useful measure of average when the data set is highly skewed by a small number of points that areextremely large or extremely small. Such outliers will have a large effect on the mean, but will leave the medianrelatively unchanged.
Mode
The mode can be a useful measure of data when that data falls into a small number of categories. It is simply ameasure of the most common number, or sometimes the most popular choice. The mode is an especially usefulconcept for data sets that contains non-numerical information such as surveys of eye color, or favorite ice-creamflavor.
Example 5
CHAPTER 11. ALGEBRA AND GEOMETRY CONNECTIONS; WORKING WITH DATA
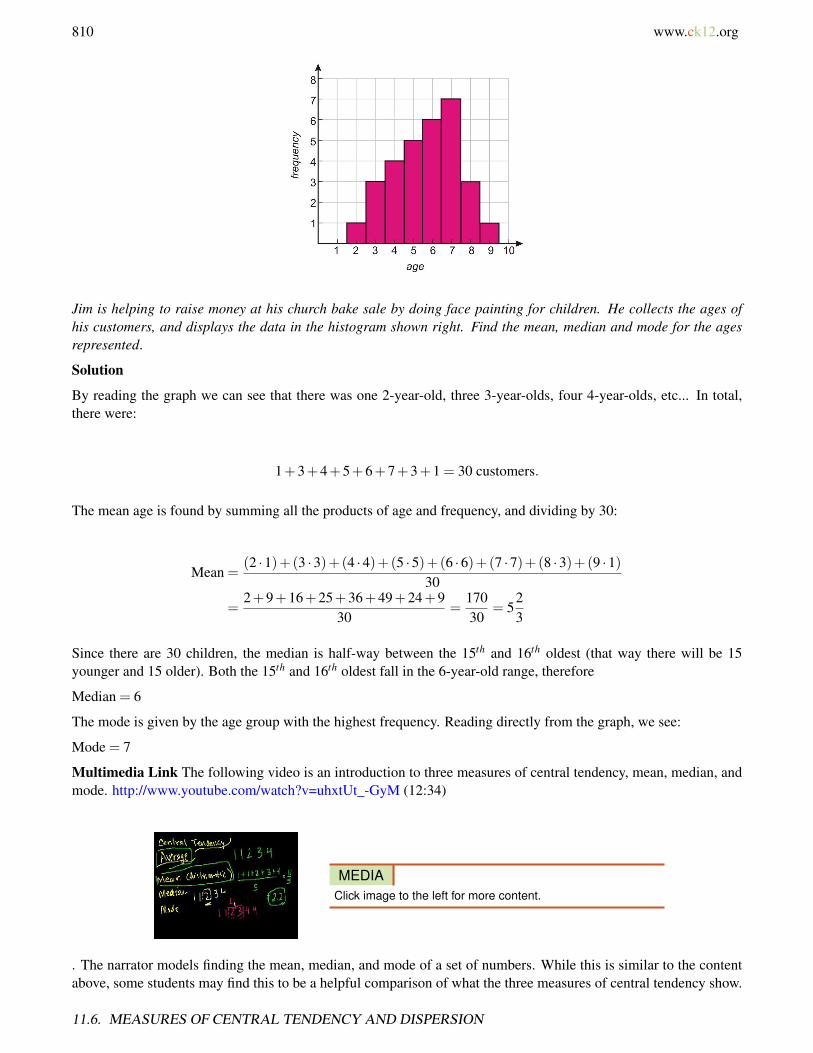
810 www.ck12.org
Jim is helping to raise money at his church bake sale by doing face painting for children. He collects the ages ofhis customers, and displays the data in the histogram shown right. Find the mean, median and mode for the agesrepresented.
Solution
By reading the graph we can see that there was one 2-year-old, three 3-year-olds, four 4-year-olds, etc... In total,there were:
1+3+4+5+6+7+3+1 = 30 customers.
The mean age is found by summing all the products of age and frequency, and dividing by 30:
Mean =(2 ·1)+(3 ·3)+(4 ·4)+(5 ·5)+(6 ·6)+(7 ·7)+(8 ·3)+(9 ·1)
30
=2+9+16+25+36+49+24+9
30=
17030
= 523
Since there are 30 children, the median is half-way between the 15th and 16th oldest (that way there will be 15younger and 15 older). Both the 15th and 16th oldest fall in the 6-year-old range, therefore
Median = 6
The mode is given by the age group with the highest frequency. Reading directly from the graph, we see:
Mode = 7
Multimedia Link The following video is an introduction to three measures of central tendency, mean, median, andmode. http://www.youtube.com/watch?v=uhxtUt_-GyM (12:34)
MEDIAClick image to the left for more content.
. The narrator models finding the mean, median, and mode of a set of numbers. While this is similar to the contentabove, some students may find this to be a helpful comparison of what the three measures of central tendency show.
11.6. MEASURES OF CENTRAL TENDENCY AND DISPERSION

www.ck12.org 811
Measures of Dispersion
Look at the graphs below. Each represents a collection of many data points and shows how the individual values(solid line) compare to the mean of the data set (dashed line). You can see that even though all three graphs havea common mean, the spread of the data differs from graph to graph. In statistics we use the word dispersion as ameasure of how spread out the data is.
Range
Range is the simplest measure of dispersion. It is simply the total spread in the data, calculated by subtracting thesmallest number in the group from the largest number.
Example 6
Find the range and the median of the following data.
223,121,227,433,122,193,397,276,303,199,197,265,366,401,222
Solution
The first thing to do in this case is to order the data, listing all values in ascending order.
121,122,193,197,199,222,223,227,265,276,303,366,397,401,433
Note: It is extremely important that all values are transferred to the second list. Two ways to ensure that you do thisare (i) cross out the numbers in the original list as you order them in the second list, and (ii) count the number ofvalues in both lists. In this example, both lists contain 15 values
The range is found by subtracting the lowest value from the highest.
Range = 433−122 = 311
Once that the list is ordered, we can find the median from the 8th value.
Median = 227
Variance
The range is not a particularly good measure of dispersion as it does not eliminate points that have unusually highor low values when compared to the rest of the data (the outliers). A better method involves measuring the distanceeach data point lies from a central average.
CHAPTER 11. ALGEBRA AND GEOMETRY CONNECTIONS; WORKING WITH DATA
812 www.ck12.org
Look at the following data values.
11,13,14,15,19,22,24,26
We can see that the mean of these values is
11+13+14+15+19+22+24+268
=1448
= 18
The values all differ from the mean, but the amount they differ by varies. The difference between each number inthe list and the mean (18) is in the following list.
−7,−5,−4,−3,1,4,6,8
This list shows the deviations from the mean. If find the mean of these deviations, we find that it is zero.
−7+(−5)+(−4)+(−3)+1+4+6+88
=08= 0
This comes as no surprise. You can see that some of the values are positive and some are negative, as the meanlies somewhere near the middle of the range. You can use algebra to prove (try it!) that the sum of the deviationswill always be zero, no matter what numbers are in the list. So, the sum of the deviations is not a useful tool formeasuring variance.
We can, however, square the differences - thereby turning the negative differences into positive values. In that casewe get the following list.
49,25,16,9,1,16,36,64
We can now proceed to find a mean of the squares of the deviations.
49+25+16+9+1+16+36+648
=2168
= 27
We call this averaging of the square of the differences from the mean (the mean squared deviation) the variance.The variance is a measure of the dispersion and its value is lower for tightly grouped data than for widely spreaddata. In the example above, the variance is 27.
The population variance (symbol, σ2 ) can be calculated from the formula.
Variance
σ2 =
(x1− x)2 +(x2− x)2 + ...+(xn− x)2
n
What does it mean to say that tightly grouped data will have a low variance? You can probably already imagine thatthe size of the variance also depends on the size of the data itself. Below we see ways that mathematicians have triedto standardize the variance.
11.6. MEASURES OF CENTRAL TENDENCY AND DISPERSION
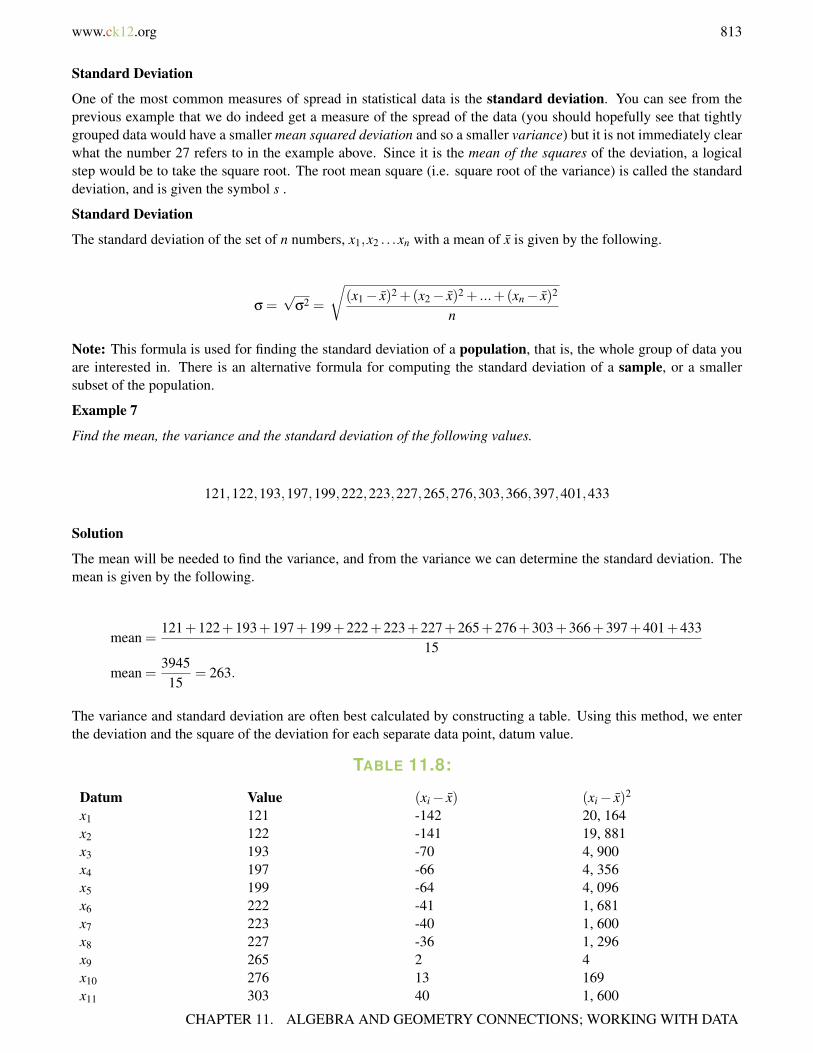
www.ck12.org 813
Standard Deviation
One of the most common measures of spread in statistical data is the standard deviation. You can see from theprevious example that we do indeed get a measure of the spread of the data (you should hopefully see that tightlygrouped data would have a smaller mean squared deviation and so a smaller variance) but it is not immediately clearwhat the number 27 refers to in the example above. Since it is the mean of the squares of the deviation, a logicalstep would be to take the square root. The root mean square (i.e. square root of the variance) is called the standarddeviation, and is given the symbol s .
Standard Deviation
The standard deviation of the set of n numbers, x1,x2 . . .xn with a mean of x is given by the following.
σ =√
σ2 =
√(x1− x)2 +(x2− x)2 + ...+(xn− x)2
n
Note: This formula is used for finding the standard deviation of a population, that is, the whole group of data youare interested in. There is an alternative formula for computing the standard deviation of a sample, or a smallersubset of the population.
Example 7
Find the mean, the variance and the standard deviation of the following values.
121,122,193,197,199,222,223,227,265,276,303,366,397,401,433
Solution
The mean will be needed to find the variance, and from the variance we can determine the standard deviation. Themean is given by the following.
mean =121+122+193+197+199+222+223+227+265+276+303+366+397+401+433
15
mean =394515
= 263.
The variance and standard deviation are often best calculated by constructing a table. Using this method, we enterthe deviation and the square of the deviation for each separate data point, datum value.
TABLE 11.8:
Datum Value (xi− x) (xi− x)2
x1 121 -142 20, 164x2 122 -141 19, 881x3 193 -70 4, 900x4 197 -66 4, 356x5 199 -64 4, 096x6 222 -41 1, 681x7 223 -40 1, 600x8 227 -36 1, 296x9 265 2 4x10 276 13 169x11 303 40 1, 600
CHAPTER 11. ALGEBRA AND GEOMETRY CONNECTIONS; WORKING WITH DATA

814 www.ck12.org
TABLE 11.8: (continued)
Datum Value (xi− x) (xi− x)2
x12 366 103 10, 609x13 397 134 17, 956x14 401 138 19, 044x15 433 170 28, 900
Sum 0 136,256
The variance is thus given by
σ2 =
136,25615
= 9083.733.
The standard deviation is given by
s =√
σ2 = 95.31.
If you look at the table, you will see that the standard deviation is a good measure of the spread. It looks to be areasonable estimate of the average distance that each point lies from the mean.
Calculate and Interpret Measures of Central Tendency and Dispersion for Real-World Situations
Example 8
A number of house sales in a town in Arizona are listed below. Calculate the mean and median house price. Alsocalculate the standard deviation in sale price
Mesa, Arizona
TABLE 11.9:
Address Sale Price Date Of Sale518 CLEVELAND AVE $117, 424 12/28/20061808 MARKESE AVE $128, 000 1/10/20071770 WHITE AVE $132, 485 12/28/20061459 LINCOLN AVE $77, 900 1/4/20071462 ANNE AVE $60, 000 1/24/20072414 DIX HWY $250, 000 1/12/20071523 ANNE AVE $110, 205 1/8/20071763 MARKESE AVE $70, 000 12/19/20061460 CLEVELAND AVE $111, 710 12/11/20061478 MILL ST $102, 646 12/6/2006
(Source: www.google.com)
Solution
11.6. MEASURES OF CENTRAL TENDENCY AND DISPERSION

www.ck12.org 815
We will first make a table, rewriting all sale prices in order. At the bottom, we will leave space to sum up not justthe differences, but also the values. This will help to determine the mean.
TABLE 11.10:
Datum Value ($) (xi− x) (xi− x)2
x1 60, 000x2 70, 000x3 77, 900x4 102, 646x5 110, 205x6 111, 710x7 117, 424x8 128, 000x9 132, 485x10 250, 000
SUM: 10 1, 160, 370
The mean can now be quickly calculated by dividing the sum of all sales values ($1, 160, 370) by the number ofvalues (10).
mean =$1,160,370
10= $116,037
Remember that the median is the(n+1
2
)th value. Since
(n+12
)= 5.5 , the median is the mean of x5 and x6 .
median =$110,205+$111,710
2= $110,957.50
Since we found the mean, we can now proceed to fill in the remainder of the table.
TABLE 11.11:
Datum Value ($) (xi− x) (xi− x)2
x1 60, 000 56037 3140145369x2 70, 000 -46037 2119405369x3 77, 900 -38137 1454430769x4 102, 646 -13391 179318881x5 110, 205 -5832 34012224x6 111, 710 -4327 18722929x7 117, 424 1387 1923769x8 128, 000 11963 14311369x9 132, 485 16448 270536704x10 250, 000 133963 17946085369
SUM 10 1, 160, 370 0 25178892752
So the standard variation is given by
CHAPTER 11. ALGEBRA AND GEOMETRY CONNECTIONS; WORKING WITH DATA

816 www.ck12.org
σ =
√25178892752
10≈ $50,179
In this case, the mean and the median are close to each other, indicating that the house prices in this area of Mesa arespread fairly symmetrically about the mean. Although there is one house that is significantly more expensive thanthe others there are also a number that are cheaper to balance out the spread.
Example 9
James and John both own fields in which they plant cabbages. James plants cabbages by hand, while John usesa machine to carefully control the distance between the cabbages. The diameters of each grower’s cabbages aremeasured, and the results are shown in the table.
TABLE 11.12:
James JohnMean Diameter (inches) 7.10 6.85Standard Deviation (inches) 2.75 0.60
John claims his method of machine planting is better. James insists it is better to plant by hand. Use the data toprovide a reason to justify both sides of the argument.
Solution
• Jame’s cabbages have a larger mean diameter, and therefore on average they are larger than John’s. The largerstandard deviation means that there will be a number of cabbages which are significantly bigger than themajority of John’s.
• John’s cabbages are, on average, smaller but only by a relatively small amount (one quarter inch). The smallerstandard deviation means that the sizes of his cabbages are much more predictable. The spread of sizes ismuch less, so they all end up being closer to the mean. While he may not have many extra large cabbages,he will not have any that are excessively small either, which may be better for any stores to which he sells hiscabbage.
Review Questions
1. Find the median of the salaries given in Example 2.2. Find the mean, median and standard deviation of the following numbers. Which, of the mean and median,
will give the best average?
15,19,15,16,11,11,18,21,165,9,11,20,16,8,17,10,12,11,16,14
3. Ten house sales in Encinitas, California are shown in the table below. Find the mean, median and standarddeviation for the sale prices. Explain, using the data, why the median house price is most often used as ameasure of the house prices in an area.
TABLE 11.13:
Address Sale Price Date Of Sale643 3RD ST $1, 137, 000 6/5/2007911 CORNISH DR $879, 000 6/5/2007
11.6. MEASURES OF CENTRAL TENDENCY AND DISPERSION
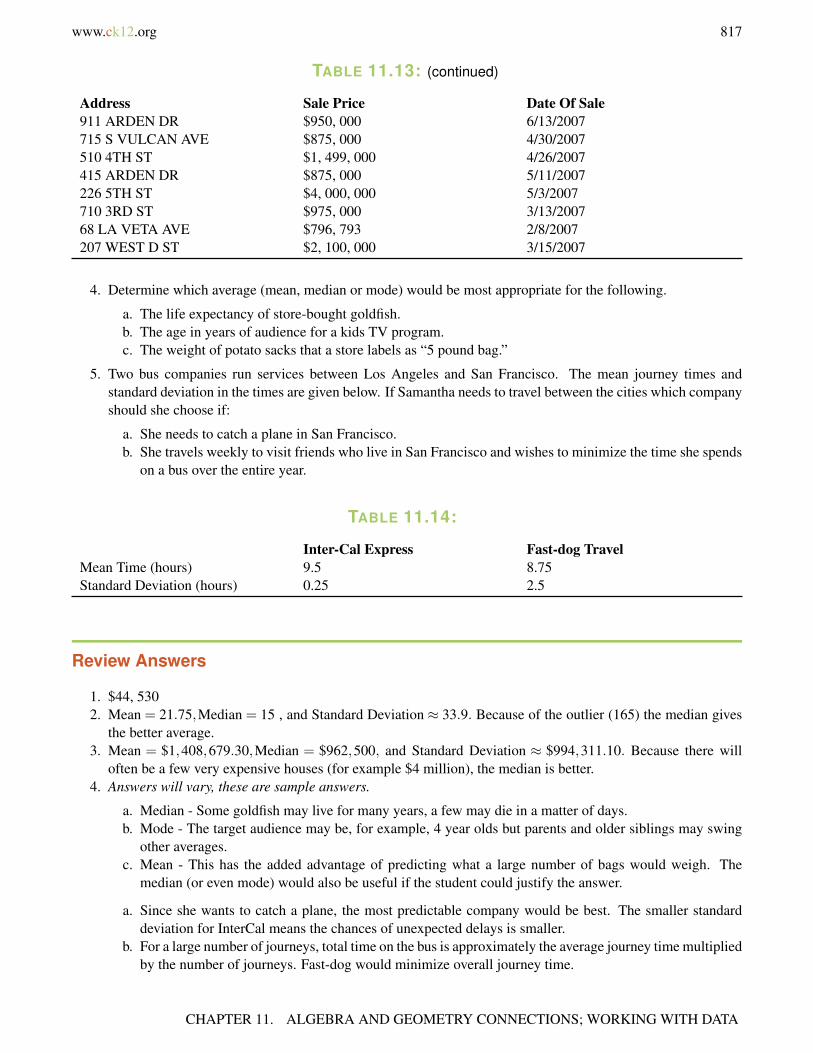
www.ck12.org 817
TABLE 11.13: (continued)
Address Sale Price Date Of Sale911 ARDEN DR $950, 000 6/13/2007715 S VULCAN AVE $875, 000 4/30/2007510 4TH ST $1, 499, 000 4/26/2007415 ARDEN DR $875, 000 5/11/2007226 5TH ST $4, 000, 000 5/3/2007710 3RD ST $975, 000 3/13/200768 LA VETA AVE $796, 793 2/8/2007207 WEST D ST $2, 100, 000 3/15/2007
4. Determine which average (mean, median or mode) would be most appropriate for the following.
a. The life expectancy of store-bought goldfish.b. The age in years of audience for a kids TV program.c. The weight of potato sacks that a store labels as “5 pound bag.”
5. Two bus companies run services between Los Angeles and San Francisco. The mean journey times andstandard deviation in the times are given below. If Samantha needs to travel between the cities which companyshould she choose if:
a. She needs to catch a plane in San Francisco.b. She travels weekly to visit friends who live in San Francisco and wishes to minimize the time she spends
on a bus over the entire year.
TABLE 11.14:
Inter-Cal Express Fast-dog TravelMean Time (hours) 9.5 8.75Standard Deviation (hours) 0.25 2.5
Review Answers
1. $44, 5302. Mean = 21.75,Median = 15 , and Standard Deviation ≈ 33.9. Because of the outlier (165) the median gives
the better average.3. Mean = $1,408,679.30,Median = $962,500, and Standard Deviation ≈ $994,311.10. Because there will
often be a few very expensive houses (for example $4 million), the median is better.4. Answers will vary, these are sample answers.
a. Median - Some goldfish may live for many years, a few may die in a matter of days.b. Mode - The target audience may be, for example, 4 year olds but parents and older siblings may swing
other averages.c. Mean - This has the added advantage of predicting what a large number of bags would weigh. The
median (or even mode) would also be useful if the student could justify the answer.
a. Since she wants to catch a plane, the most predictable company would be best. The smaller standarddeviation for InterCal means the chances of unexpected delays is smaller.
b. For a large number of journeys, total time on the bus is approximately the average journey time multipliedby the number of journeys. Fast-dog would minimize overall journey time.
CHAPTER 11. ALGEBRA AND GEOMETRY CONNECTIONS; WORKING WITH DATA
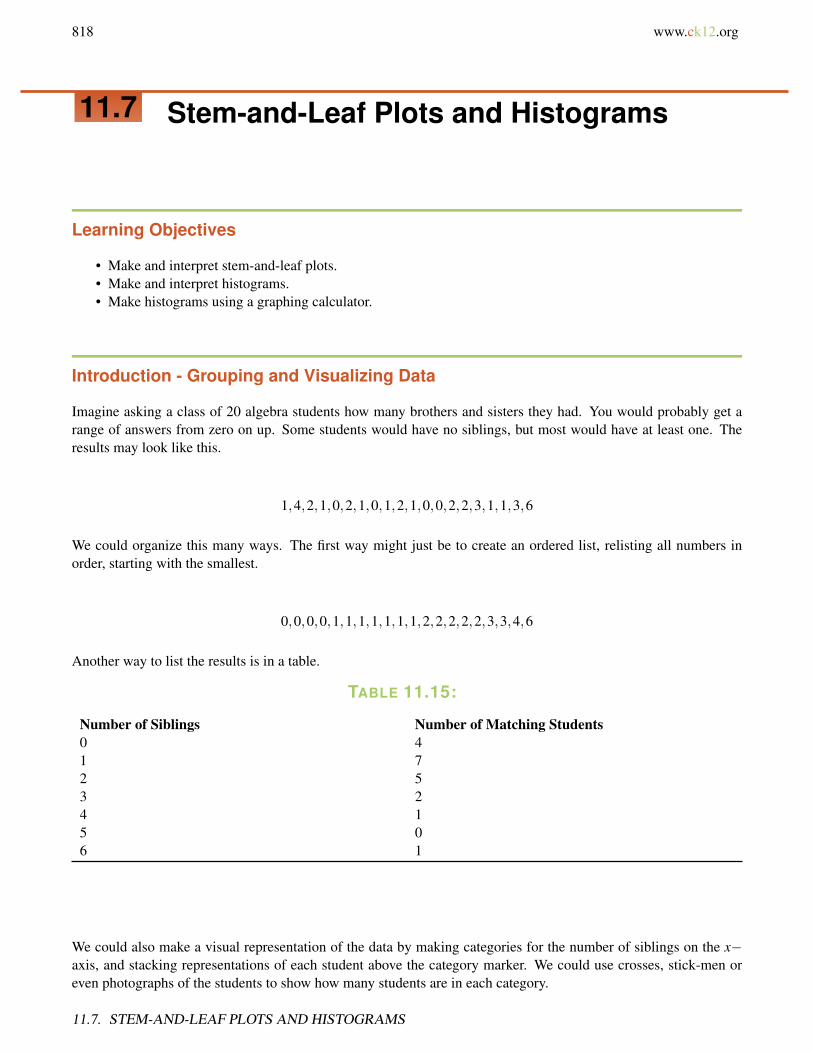
818 www.ck12.org
11.7 Stem-and-Leaf Plots and Histograms
Learning Objectives
• Make and interpret stem-and-leaf plots.• Make and interpret histograms.• Make histograms using a graphing calculator.
Introduction - Grouping and Visualizing Data
Imagine asking a class of 20 algebra students how many brothers and sisters they had. You would probably get arange of answers from zero on up. Some students would have no siblings, but most would have at least one. Theresults may look like this.
1,4,2,1,0,2,1,0,1,2,1,0,0,2,2,3,1,1,3,6
We could organize this many ways. The first way might just be to create an ordered list, relisting all numbers inorder, starting with the smallest.
0,0,0,0,1,1,1,1,1,1,1,2,2,2,2,2,3,3,4,6
Another way to list the results is in a table.
TABLE 11.15:
Number of Siblings Number of Matching Students0 41 72 53 24 15 06 1
We could also make a visual representation of the data by making categories for the number of siblings on the x−axis, and stacking representations of each student above the category marker. We could use crosses, stick-men oreven photographs of the students to show how many students are in each category.
11.7. STEM-AND-LEAF PLOTS AND HISTOGRAMS
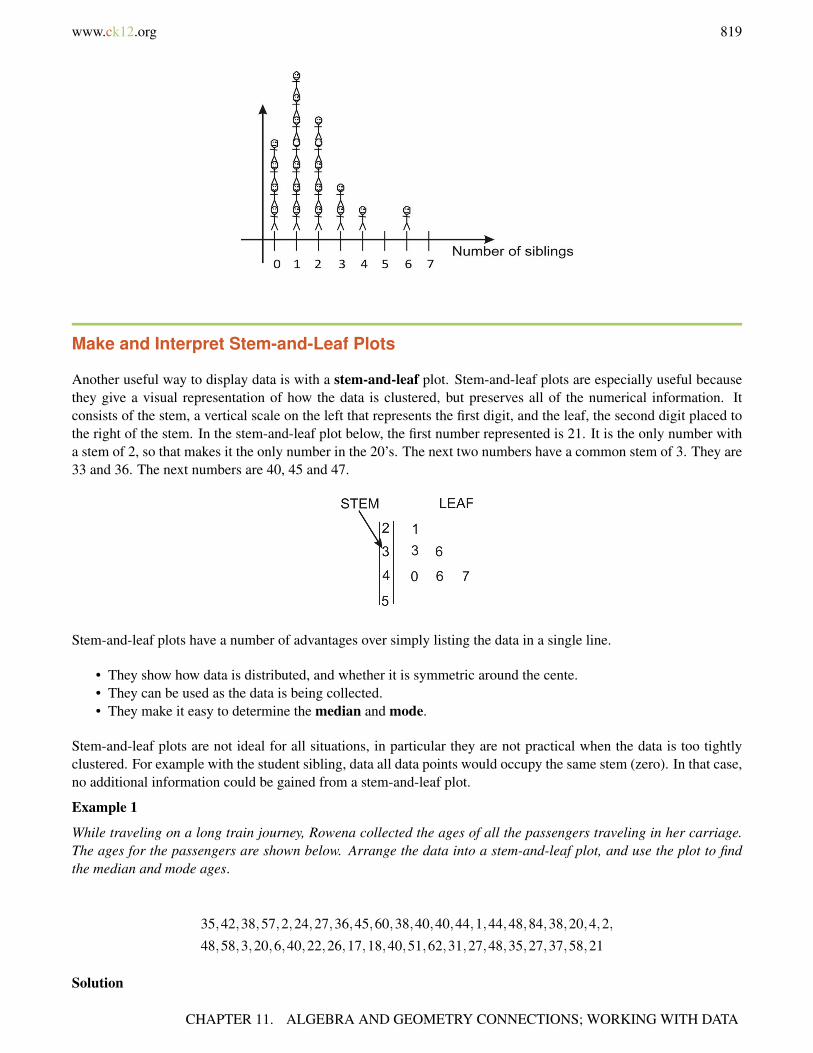
www.ck12.org 819
Make and Interpret Stem-and-Leaf Plots
Another useful way to display data is with a stem-and-leaf plot. Stem-and-leaf plots are especially useful becausethey give a visual representation of how the data is clustered, but preserves all of the numerical information. Itconsists of the stem, a vertical scale on the left that represents the first digit, and the leaf, the second digit placed tothe right of the stem. In the stem-and-leaf plot below, the first number represented is 21. It is the only number witha stem of 2, so that makes it the only number in the 20’s. The next two numbers have a common stem of 3. They are33 and 36. The next numbers are 40, 45 and 47.
Stem-and-leaf plots have a number of advantages over simply listing the data in a single line.
• They show how data is distributed, and whether it is symmetric around the cente.• They can be used as the data is being collected.• They make it easy to determine the median and mode.
Stem-and-leaf plots are not ideal for all situations, in particular they are not practical when the data is too tightlyclustered. For example with the student sibling, data all data points would occupy the same stem (zero). In that case,no additional information could be gained from a stem-and-leaf plot.
Example 1
While traveling on a long train journey, Rowena collected the ages of all the passengers traveling in her carriage.The ages for the passengers are shown below. Arrange the data into a stem-and-leaf plot, and use the plot to findthe median and mode ages.
35,42,38,57,2,24,27,36,45,60,38,40,40,44,1,44,48,84,38,20,4,2,
48,58,3,20,6,40,22,26,17,18,40,51,62,31,27,48,35,27,37,58,21
Solution
CHAPTER 11. ALGEBRA AND GEOMETRY CONNECTIONS; WORKING WITH DATA
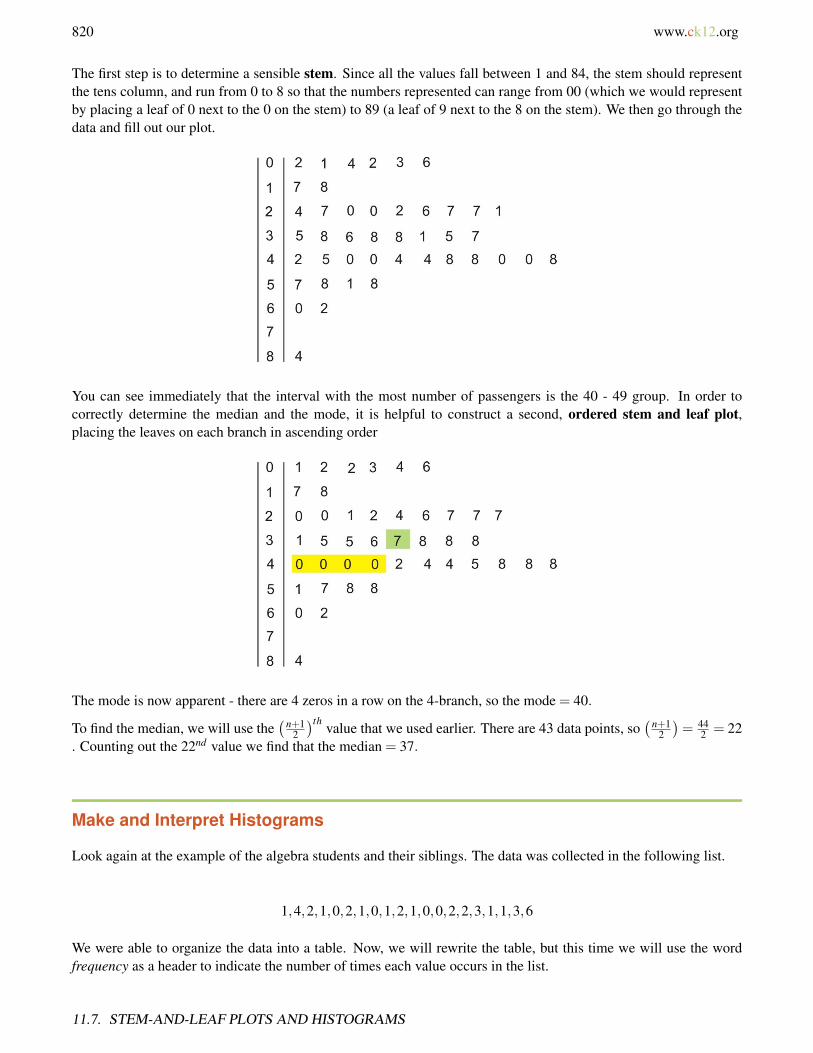
820 www.ck12.org
The first step is to determine a sensible stem. Since all the values fall between 1 and 84, the stem should representthe tens column, and run from 0 to 8 so that the numbers represented can range from 00 (which we would representby placing a leaf of 0 next to the 0 on the stem) to 89 (a leaf of 9 next to the 8 on the stem). We then go through thedata and fill out our plot.
You can see immediately that the interval with the most number of passengers is the 40 - 49 group. In order tocorrectly determine the median and the mode, it is helpful to construct a second, ordered stem and leaf plot,placing the leaves on each branch in ascending order
The mode is now apparent - there are 4 zeros in a row on the 4-branch, so the mode = 40.
To find the median, we will use the(n+1
2
)th value that we used earlier. There are 43 data points, so(n+1
2
)= 44
2 = 22. Counting out the 22nd value we find that the median = 37.
Make and Interpret Histograms
Look again at the example of the algebra students and their siblings. The data was collected in the following list.
1,4,2,1,0,2,1,0,1,2,1,0,0,2,2,3,1,1,3,6
We were able to organize the data into a table. Now, we will rewrite the table, but this time we will use the wordfrequency as a header to indicate the number of times each value occurs in the list.
11.7. STEM-AND-LEAF PLOTS AND HISTOGRAMS
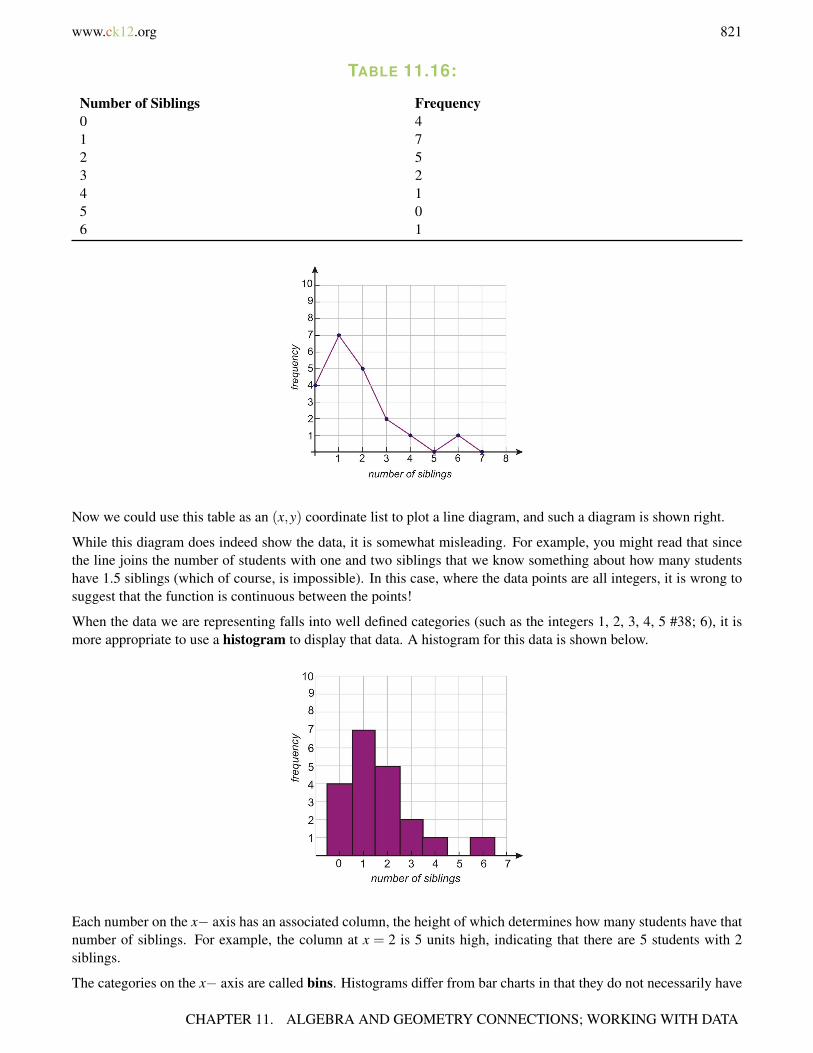
www.ck12.org 821
TABLE 11.16:
Number of Siblings Frequency0 41 72 53 24 15 06 1
Now we could use this table as an (x,y) coordinate list to plot a line diagram, and such a diagram is shown right.
While this diagram does indeed show the data, it is somewhat misleading. For example, you might read that sincethe line joins the number of students with one and two siblings that we know something about how many studentshave 1.5 siblings (which of course, is impossible). In this case, where the data points are all integers, it is wrong tosuggest that the function is continuous between the points!
When the data we are representing falls into well defined categories (such as the integers 1, 2, 3, 4, 5 #38; 6), it ismore appropriate to use a histogram to display that data. A histogram for this data is shown below.
Each number on the x− axis has an associated column, the height of which determines how many students have thatnumber of siblings. For example, the column at x = 2 is 5 units high, indicating that there are 5 students with 2siblings.
The categories on the x− axis are called bins. Histograms differ from bar charts in that they do not necessarily have
CHAPTER 11. ALGEBRA AND GEOMETRY CONNECTIONS; WORKING WITH DATA

822 www.ck12.org
fixed widths for the bins. They are also useful for displaying continuous data (data that varies continuously ratherthan in integer amounts). To illustrate this, look at the next examples.
Example 2
Rowena made a survey of the ages of passengers in a train carriage, and collected the results in a table. Display theresults as a histogram.
TABLE 11.17:
Age range Frequency0 - 9 610 - 19 220 - 29 930 - 39 840 - 49 1150 - 59 460 - 69 270 - 79 080 - 89 1
Solution
Since the data is already collected into intervals, we will use these as our bins for the histogram. Even though the topend of the first interval is 9, the bin on our histogram will extend to 10. This is because, as we move to continuousdata, we have a range of numbers that goes up to (but does not include) the lower end of the following bin. Therange of values for the first bin would therefore be.
Age is greater than or equal to 0, but less than 10.
Algebraically, we would write:
0≤ Age ≤ 10
We will use this notation to label our bins in the next example.
Example 3
Monthly rainfall (in millimeters) for Beaver Creek Oregon was collected over a five year period, and the data isshown below. Display the data in a histogram.
11.7. STEM-AND-LEAF PLOTS AND HISTOGRAMS
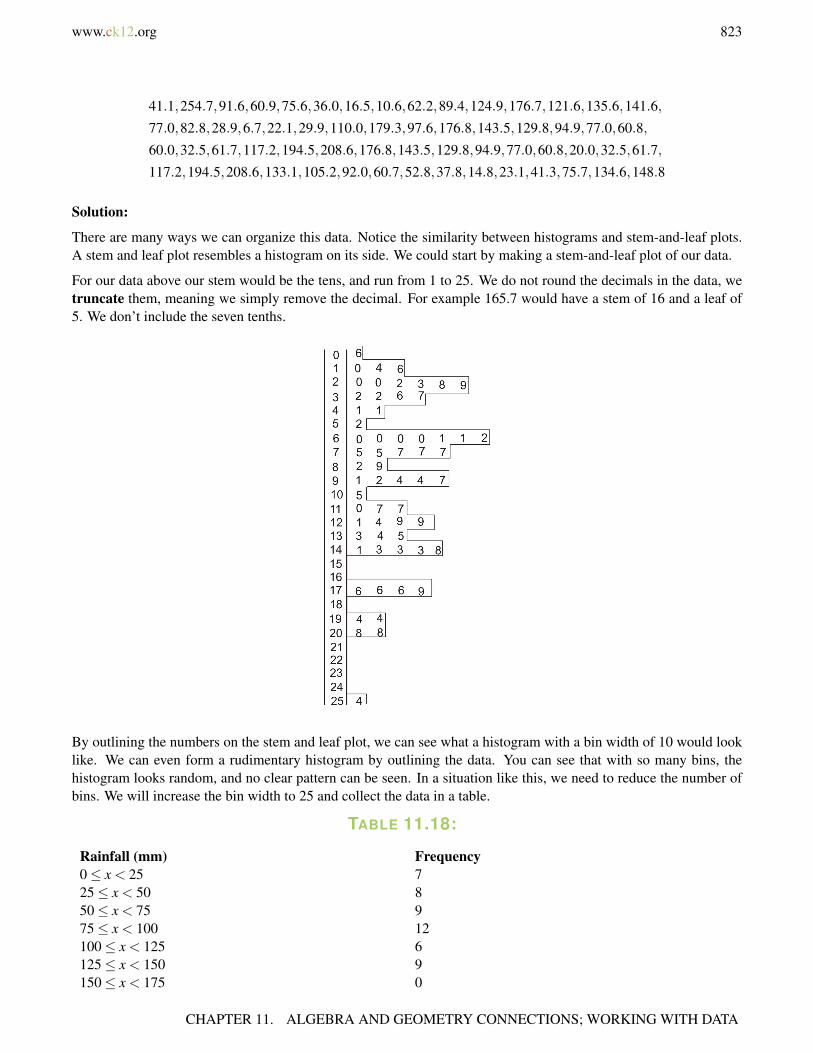
www.ck12.org 823
41.1,254.7,91.6,60.9,75.6,36.0,16.5,10.6,62.2,89.4,124.9,176.7,121.6,135.6,141.6,
77.0,82.8,28.9,6.7,22.1,29.9,110.0,179.3,97.6,176.8,143.5,129.8,94.9,77.0,60.8,
60.0,32.5,61.7,117.2,194.5,208.6,176.8,143.5,129.8,94.9,77.0,60.8,20.0,32.5,61.7,
117.2,194.5,208.6,133.1,105.2,92.0,60.7,52.8,37.8,14.8,23.1,41.3,75.7,134.6,148.8
Solution:
There are many ways we can organize this data. Notice the similarity between histograms and stem-and-leaf plots.A stem and leaf plot resembles a histogram on its side. We could start by making a stem-and-leaf plot of our data.
For our data above our stem would be the tens, and run from 1 to 25. We do not round the decimals in the data, wetruncate them, meaning we simply remove the decimal. For example 165.7 would have a stem of 16 and a leaf of5. We don’t include the seven tenths.
By outlining the numbers on the stem and leaf plot, we can see what a histogram with a bin width of 10 would looklike. We can even form a rudimentary histogram by outlining the data. You can see that with so many bins, thehistogram looks random, and no clear pattern can be seen. In a situation like this, we need to reduce the number ofbins. We will increase the bin width to 25 and collect the data in a table.
TABLE 11.18:
Rainfall (mm) Frequency0≤ x < 25 725≤ x < 50 850≤ x < 75 975≤ x < 100 12100≤ x < 125 6125≤ x < 150 9150≤ x < 175 0
CHAPTER 11. ALGEBRA AND GEOMETRY CONNECTIONS; WORKING WITH DATA
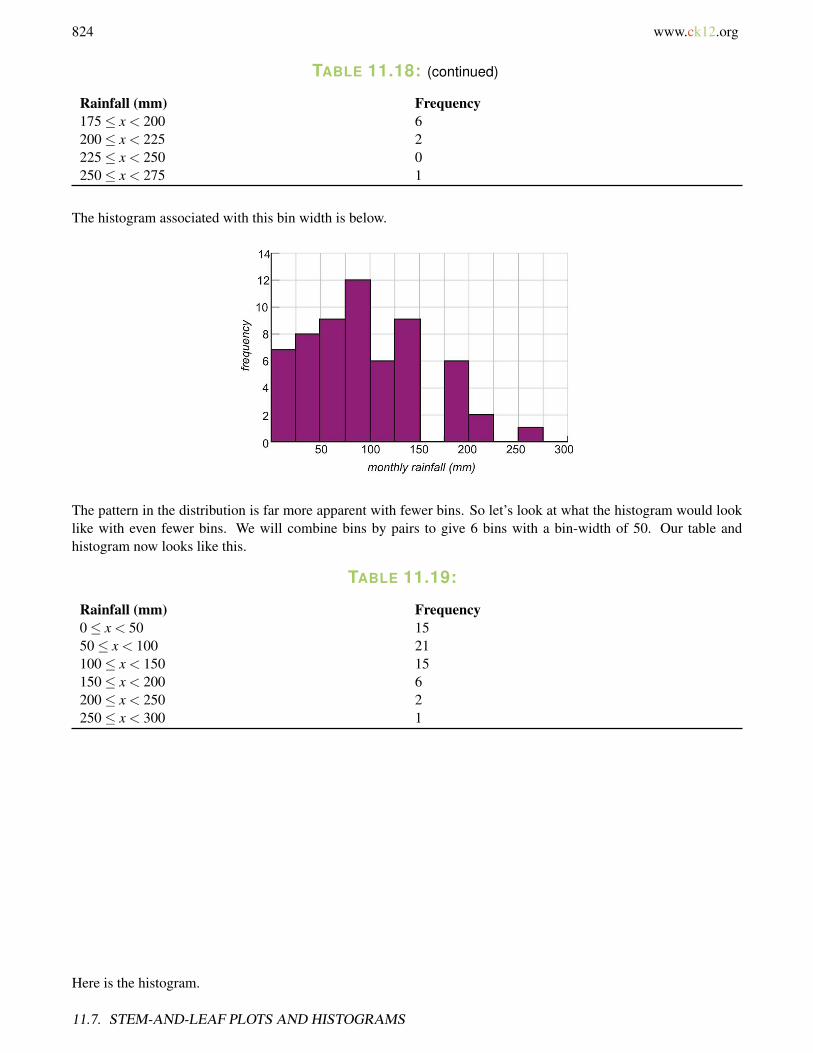
824 www.ck12.org
TABLE 11.18: (continued)
Rainfall (mm) Frequency175≤ x < 200 6200≤ x < 225 2225≤ x < 250 0250≤ x < 275 1
The histogram associated with this bin width is below.
The pattern in the distribution is far more apparent with fewer bins. So let’s look at what the histogram would looklike with even fewer bins. We will combine bins by pairs to give 6 bins with a bin-width of 50. Our table andhistogram now looks like this.
TABLE 11.19:
Rainfall (mm) Frequency0≤ x < 50 1550≤ x < 100 21100≤ x < 150 15150≤ x < 200 6200≤ x < 250 2250≤ x < 300 1
Here is the histogram.
11.7. STEM-AND-LEAF PLOTS AND HISTOGRAMS
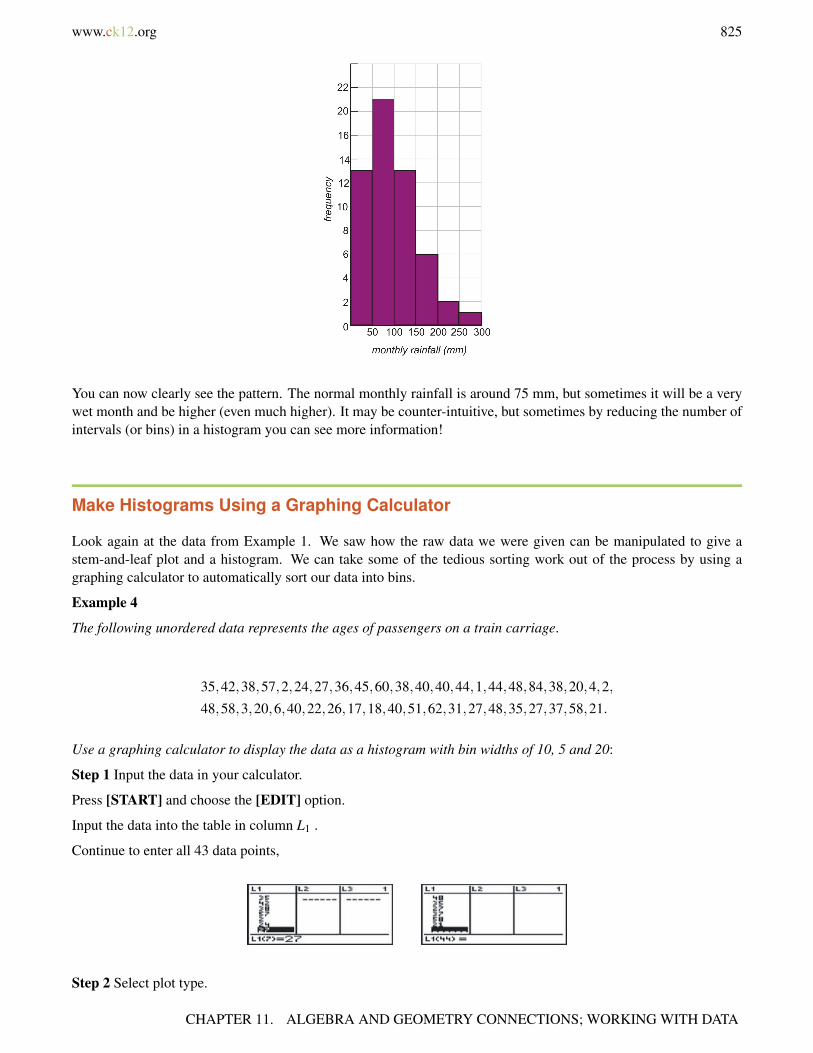
www.ck12.org 825
You can now clearly see the pattern. The normal monthly rainfall is around 75 mm, but sometimes it will be a verywet month and be higher (even much higher). It may be counter-intuitive, but sometimes by reducing the number ofintervals (or bins) in a histogram you can see more information!
Make Histograms Using a Graphing Calculator
Look again at the data from Example 1. We saw how the raw data we were given can be manipulated to give astem-and-leaf plot and a histogram. We can take some of the tedious sorting work out of the process by using agraphing calculator to automatically sort our data into bins.
Example 4
The following unordered data represents the ages of passengers on a train carriage.
35,42,38,57,2,24,27,36,45,60,38,40,40,44,1,44,48,84,38,20,4,2,
48,58,3,20,6,40,22,26,17,18,40,51,62,31,27,48,35,27,37,58,21.
Use a graphing calculator to display the data as a histogram with bin widths of 10, 5 and 20:
Step 1 Input the data in your calculator.
Press [START] and choose the [EDIT] option.
Input the data into the table in column L1 .
Continue to enter all 43 data points,
Step 2 Select plot type.
CHAPTER 11. ALGEBRA AND GEOMETRY CONNECTIONS; WORKING WITH DATA
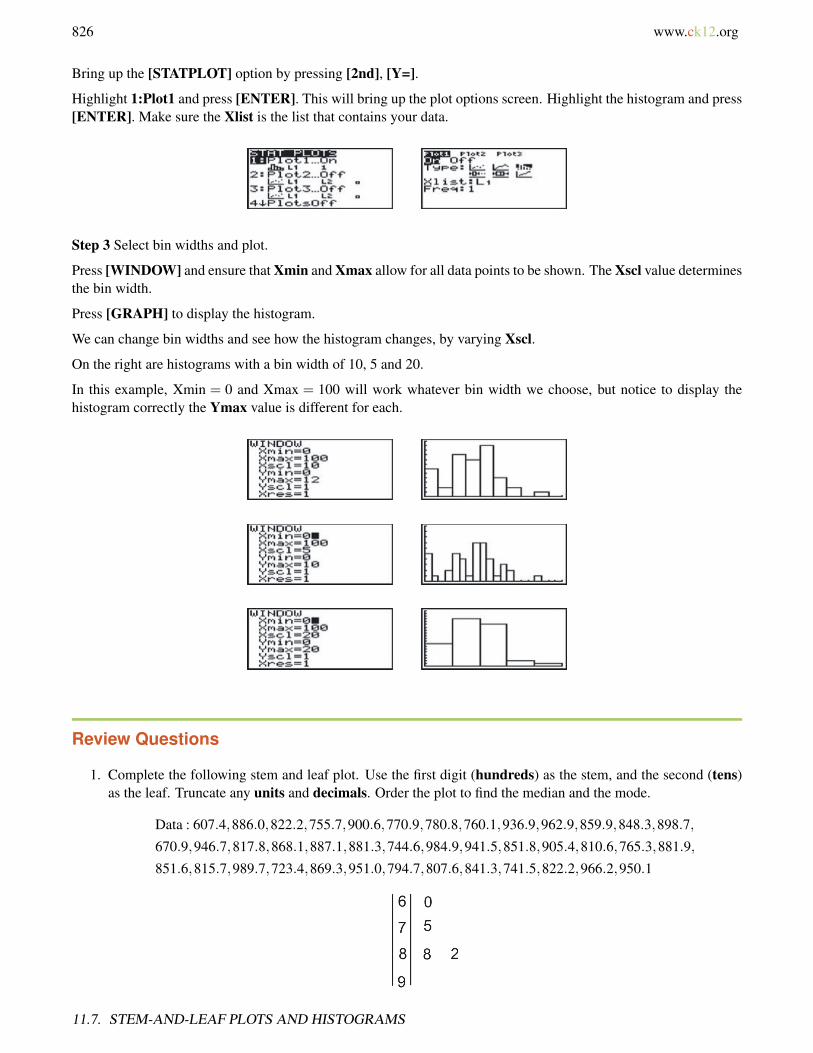
826 www.ck12.org
Bring up the [STATPLOT] option by pressing [2nd], [Y=].
Highlight 1:Plot1 and press [ENTER]. This will bring up the plot options screen. Highlight the histogram and press[ENTER]. Make sure the Xlist is the list that contains your data.
Step 3 Select bin widths and plot.
Press [WINDOW] and ensure that Xmin and Xmax allow for all data points to be shown. The Xscl value determinesthe bin width.
Press [GRAPH] to display the histogram.
We can change bin widths and see how the histogram changes, by varying Xscl.
On the right are histograms with a bin width of 10, 5 and 20.
In this example, Xmin = 0 and Xmax = 100 will work whatever bin width we choose, but notice to display thehistogram correctly the Ymax value is different for each.
Review Questions
1. Complete the following stem and leaf plot. Use the first digit (hundreds) as the stem, and the second (tens)as the leaf. Truncate any units and decimals. Order the plot to find the median and the mode.
Data : 607.4,886.0,822.2,755.7,900.6,770.9,780.8,760.1,936.9,962.9,859.9,848.3,898.7,
670.9,946.7,817.8,868.1,887.1,881.3,744.6,984.9,941.5,851.8,905.4,810.6,765.3,881.9,
851.6,815.7,989.7,723.4,869.3,951.0,794.7,807.6,841.3,741.5,822.2,966.2,950.1
11.7. STEM-AND-LEAF PLOTS AND HISTOGRAMS

www.ck12.org 827
2. Make a frequency table for the data in Question 1. Use a bin width of 50.3. Plot the data from Question 1 as a histogram with a bin width of
a. 50b. 100
4. The following stem-and-leaf plot shows data collected for the speed of 40 cars in a 35 mph limit zone inCulver City, California.
a. Find the mean, median and mode speed.b. Complete the frequency table, starting at 25 mph with a bin width of 5 mph.c. Use the table to construct a histogram with the intervals from your frequency table.
5. The histogram shown on the right displays the results of a larger scale survey of the number of siblings. Useit to find:
a. The median of the datab. The mean of the datac. The mode of the datad. The number of people who have an odd number of siblings.e. The percentage of the people surveyed who have 4 or more siblings.
Review Answers
1. The median from the plot would be 850; the mode is 880 (since all values are truncated at tens).
CHAPTER 11. ALGEBRA AND GEOMETRY CONNECTIONS; WORKING WITH DATA
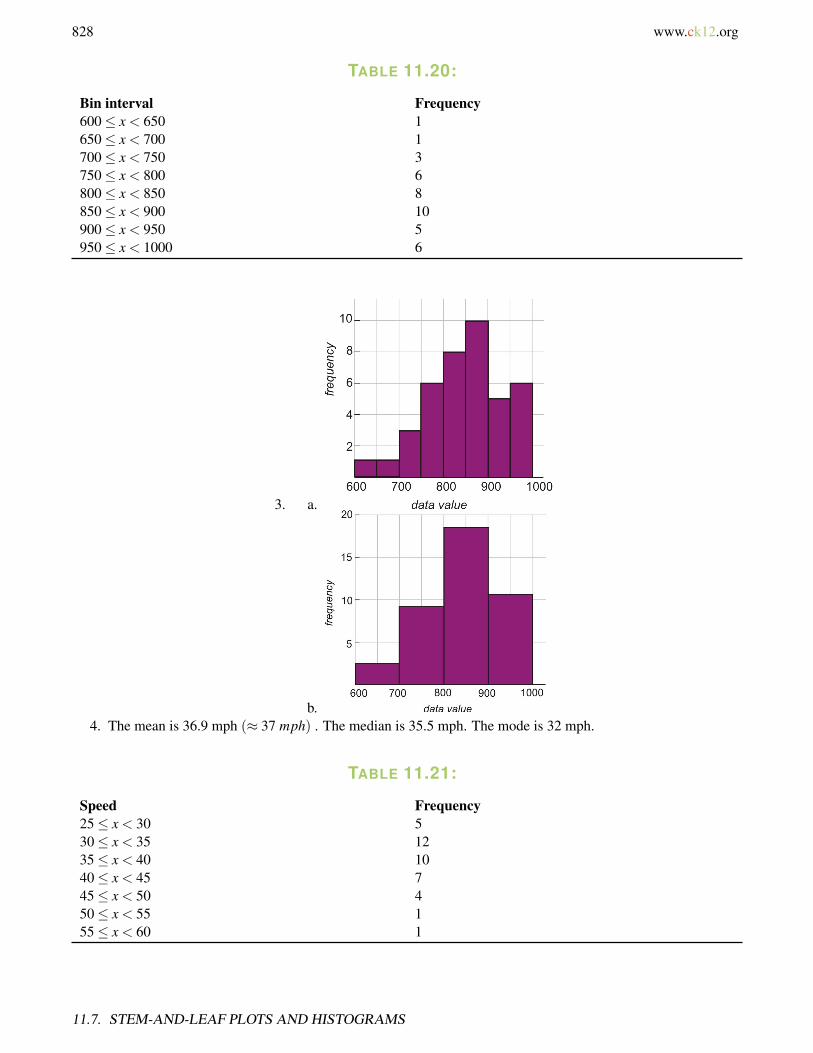
828 www.ck12.org
TABLE 11.20:
Bin interval Frequency600≤ x < 650 1650≤ x < 700 1700≤ x < 750 3750≤ x < 800 6800≤ x < 850 8850≤ x < 900 10900≤ x < 950 5950≤ x < 1000 6
3. a.
b.4. The mean is 36.9 mph (≈ 37 mph) . The median is 35.5 mph. The mode is 32 mph.
TABLE 11.21:
Speed Frequency25≤ x < 30 530≤ x < 35 1235≤ x < 40 1040≤ x < 45 745≤ x < 50 450≤ x < 55 155≤ x < 60 1
11.7. STEM-AND-LEAF PLOTS AND HISTOGRAMS

www.ck12.org 829
5. In order to determine the answers, it is useful to construct the frequency table. Read directly from the his-togram.
TABLE 11.22:
Number of Siblings Frequency0 101 152 213 174 95 56 37 18 19 010 1Total: 83
The sum tells us there were 83 people in the survey.
(a) The median is the 42nd value and the median = 2 .
(b) Mean = 0(10)+1(15)+2(21)+3(17)+4(9)+5(5)+6(3)+7+8+1083 = 212
83 = 2.55
(c) Mode = 2
(d) n(odd) = 15+17+5+1 = 38
(e) (%4 or more) = 9+5+3+1+1+183 ×100% = 24.1%
CHAPTER 11. ALGEBRA AND GEOMETRY CONNECTIONS; WORKING WITH DATA
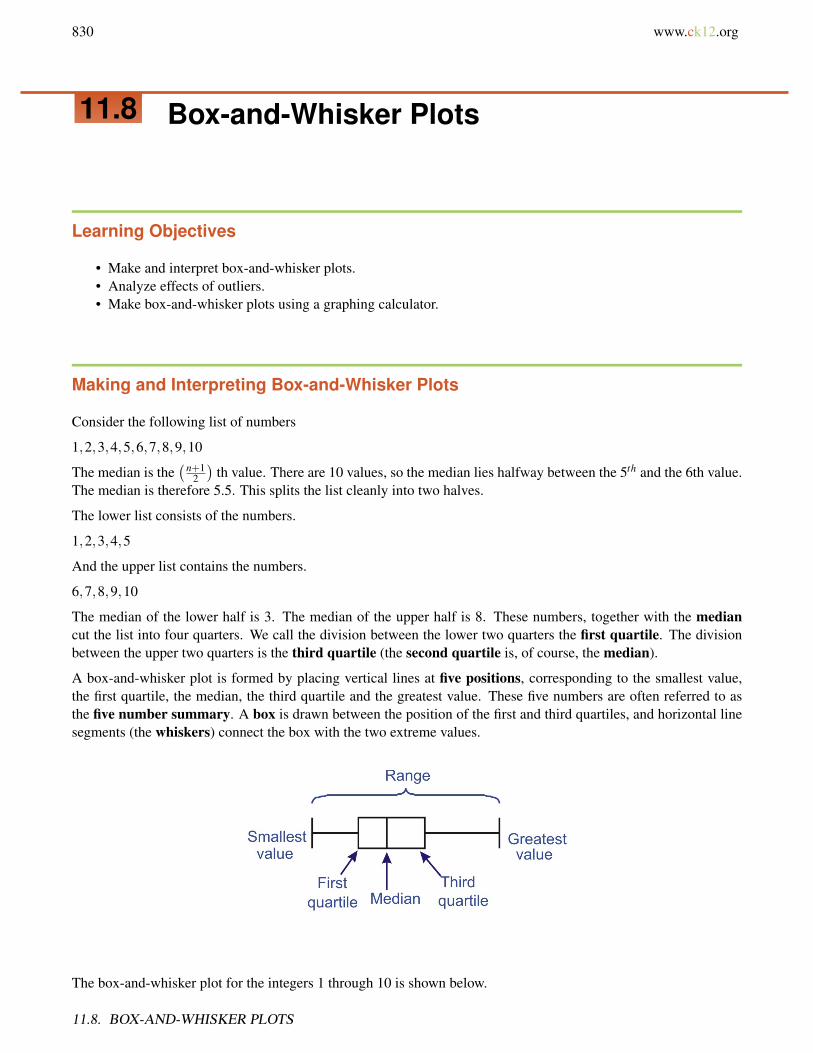
830 www.ck12.org
11.8 Box-and-Whisker Plots
Learning Objectives
• Make and interpret box-and-whisker plots.• Analyze effects of outliers.• Make box-and-whisker plots using a graphing calculator.
Making and Interpreting Box-and-Whisker Plots
Consider the following list of numbers
1,2,3,4,5,6,7,8,9,10
The median is the(n+1
2
)th value. There are 10 values, so the median lies halfway between the 5th and the 6th value.
The median is therefore 5.5. This splits the list cleanly into two halves.
The lower list consists of the numbers.
1,2,3,4,5
And the upper list contains the numbers.
6,7,8,9,10
The median of the lower half is 3. The median of the upper half is 8. These numbers, together with the mediancut the list into four quarters. We call the division between the lower two quarters the first quartile. The divisionbetween the upper two quarters is the third quartile (the second quartile is, of course, the median).
A box-and-whisker plot is formed by placing vertical lines at five positions, corresponding to the smallest value,the first quartile, the median, the third quartile and the greatest value. These five numbers are often referred to asthe five number summary. A box is drawn between the position of the first and third quartiles, and horizontal linesegments (the whiskers) connect the box with the two extreme values.
The box-and-whisker plot for the integers 1 through 10 is shown below.
11.8. BOX-AND-WHISKER PLOTS

www.ck12.org 831
With a box-and-whisker plot, a simple measure of dispersion can be gained from the distance from the first quartileto the third quartile. This inter-quartile range is a measure of the spread of the middle half of the data.
Example 1
Forty students took a college algebra entrance test and the results are summarized in the box-and-whisker plot below.How many students would be allowed to enroll in the class if the pass mark was set at
(i) 65%
(ii) 60%
From the plot, we can see the following information.
Lowest score = 52%
First quartile = 60%
Median score = 65%
Third quartile = 77%
Highest score = 97
Since the pass marks correspond with the median and the first quartile, the question is really asking how manystudents are there in: (i) the upper half and (ii) the upper 3 quartiles?
Solution
(i) If the pass mark was 65%, then 20 students would pass.
(ii) If the pass mark was 60%, then 30 students would pass.
Look again at the information we gained from the box-and-whisker plot. A box-and-whisker plot will alwaysrepresent five quantities in the five number summary: the lowest value, the first quartile, the median, the thirdquartile and the greatest value.
Example 2
Harika is rolling 3 dice and adding the scores together. She records the total score for 50 rolls, and the scores shegets are shown below. Display the data in a box-and-whisker plot, and find both the range and the inter-quartilerange .
9,10,12,13,10,14,8,10,12,6,8,11,12,12,9,11,10,15,10,8,8,12,10,14,10,
9,7,5,11,15,8,9,17,12,12,13,7,14,6,17,11,15,10,13,9,7,12,13,10,12
CHAPTER 11. ALGEBRA AND GEOMETRY CONNECTIONS; WORKING WITH DATA
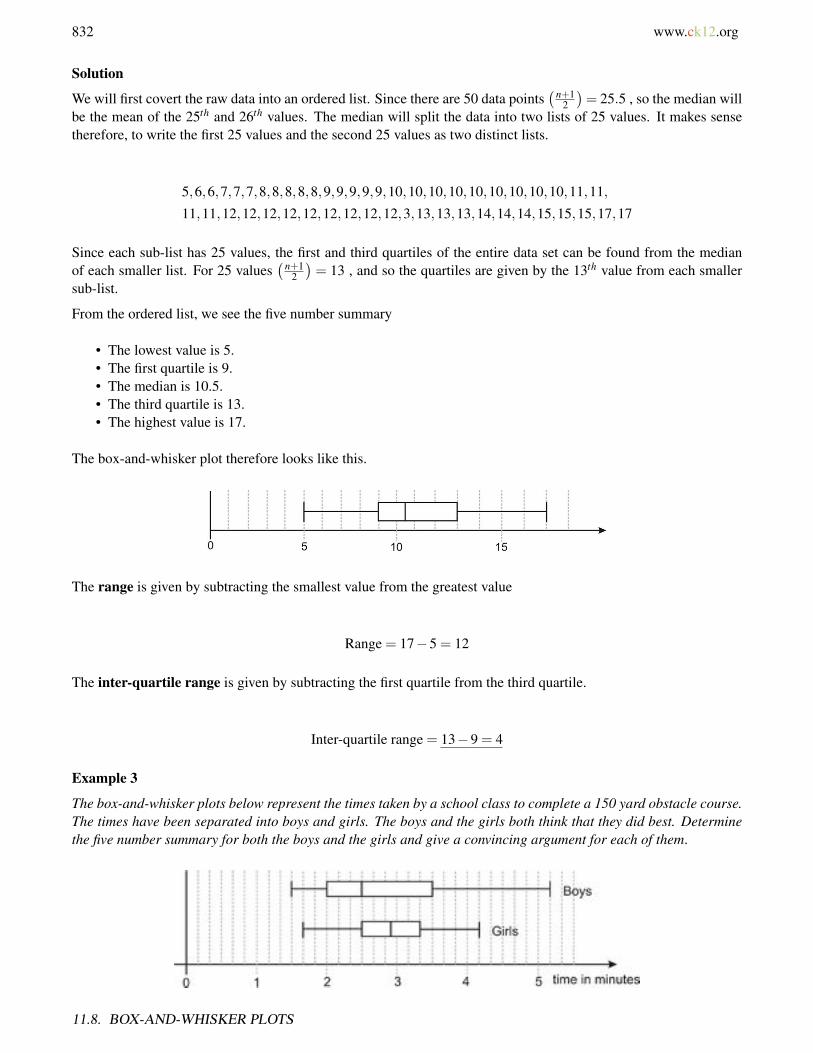
832 www.ck12.org
Solution
We will first covert the raw data into an ordered list. Since there are 50 data points(n+1
2
)= 25.5 , so the median will
be the mean of the 25th and 26th values. The median will split the data into two lists of 25 values. It makes sensetherefore, to write the first 25 values and the second 25 values as two distinct lists.
5,6,6,7,7,7,8,8,8,8,8,9,9,9,9,9,10,10,10,10,10,10,10,10,10,11,11,
11,11,12,12,12,12,12,12,12,12,12,3,13,13,13,14,14,14,15,15,15,17,17
Since each sub-list has 25 values, the first and third quartiles of the entire data set can be found from the medianof each smaller list. For 25 values
(n+12
)= 13 , and so the quartiles are given by the 13th value from each smaller
sub-list.
From the ordered list, we see the five number summary
• The lowest value is 5.• The first quartile is 9.• The median is 10.5.• The third quartile is 13.• The highest value is 17.
The box-and-whisker plot therefore looks like this.
The range is given by subtracting the smallest value from the greatest value
Range = 17−5 = 12
The inter-quartile range is given by subtracting the first quartile from the third quartile.
Inter-quartile range = 13−9 = 4
Example 3
The box-and-whisker plots below represent the times taken by a school class to complete a 150 yard obstacle course.The times have been separated into boys and girls. The boys and the girls both think that they did best. Determinethe five number summary for both the boys and the girls and give a convincing argument for each of them.
11.8. BOX-AND-WHISKER PLOTS
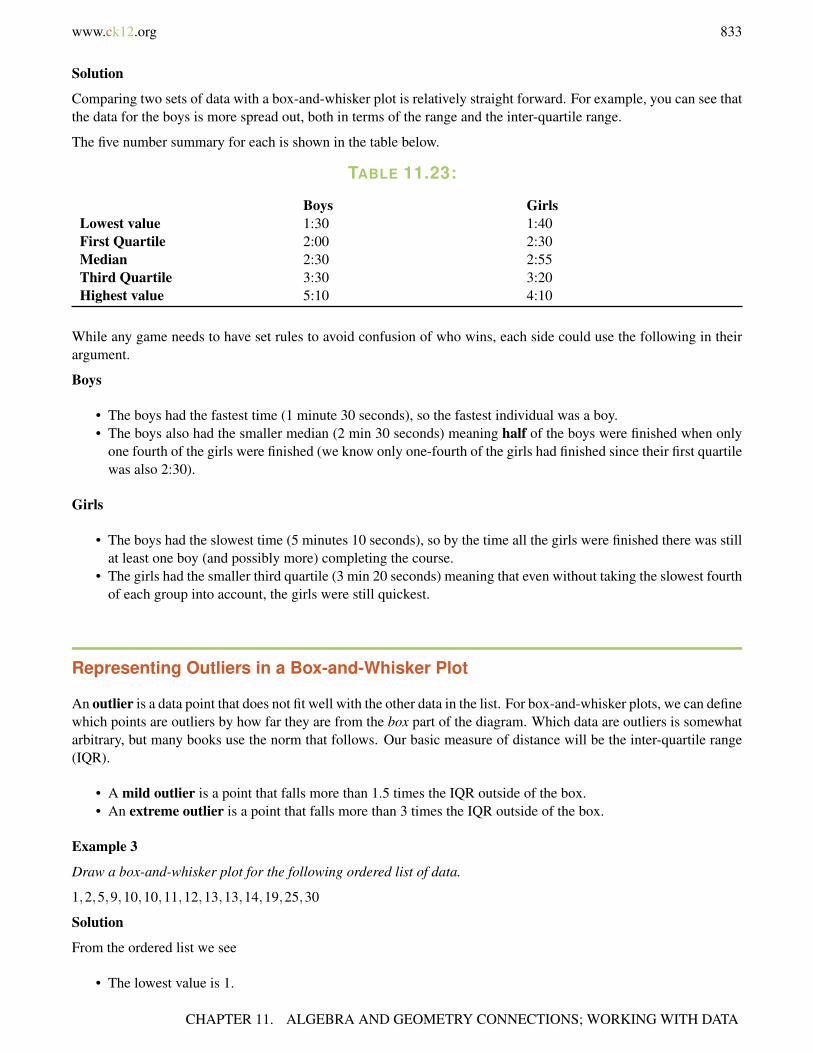
www.ck12.org 833
Solution
Comparing two sets of data with a box-and-whisker plot is relatively straight forward. For example, you can see thatthe data for the boys is more spread out, both in terms of the range and the inter-quartile range.
The five number summary for each is shown in the table below.
TABLE 11.23:
Boys GirlsLowest value 1:30 1:40First Quartile 2:00 2:30Median 2:30 2:55Third Quartile 3:30 3:20Highest value 5:10 4:10
While any game needs to have set rules to avoid confusion of who wins, each side could use the following in theirargument.
Boys
• The boys had the fastest time (1 minute 30 seconds), so the fastest individual was a boy.• The boys also had the smaller median (2 min 30 seconds) meaning half of the boys were finished when only
one fourth of the girls were finished (we know only one-fourth of the girls had finished since their first quartilewas also 2:30).
Girls
• The boys had the slowest time (5 minutes 10 seconds), so by the time all the girls were finished there was stillat least one boy (and possibly more) completing the course.
• The girls had the smaller third quartile (3 min 20 seconds) meaning that even without taking the slowest fourthof each group into account, the girls were still quickest.
Representing Outliers in a Box-and-Whisker Plot
An outlier is a data point that does not fit well with the other data in the list. For box-and-whisker plots, we can definewhich points are outliers by how far they are from the box part of the diagram. Which data are outliers is somewhatarbitrary, but many books use the norm that follows. Our basic measure of distance will be the inter-quartile range(IQR).
• A mild outlier is a point that falls more than 1.5 times the IQR outside of the box.• An extreme outlier is a point that falls more than 3 times the IQR outside of the box.
Example 3
Draw a box-and-whisker plot for the following ordered list of data.
1,2,5,9,10,10,11,12,13,13,14,19,25,30
Solution
From the ordered list we see
• The lowest value is 1.
CHAPTER 11. ALGEBRA AND GEOMETRY CONNECTIONS; WORKING WITH DATA

834 www.ck12.org
• The first quartile (Q1) is 9.• The median is 11.5.• The third quartile (Q3) is 14.• The highest value is 30.
Before we proceed to draw our box-and-whisker plot, we can determine the IQR:
IQR = Q3−Q1 = 14−9 = 5
Outliers are points that fall more than 1.5 times the IQR outside of the box. We can determine this range algebraically.
Lower limit for included points = Q1− (1.5× IQR) = 9−7.5 = 1.5
Upper limit for included points = Q3 +(1.5× IQR) = 14+7.5 = 21.5
Looking back at the data we see.
• The value of 1 falls more than 1.5 times the IQR below the first quartile. It is a mild outlier.• The value 2 is the lowest value that falls within the included range.• The value 30 falls more than 3 times the IQR above the third quartile. It is an extreme outlier.• The value 25 falls more than 1.5 times the IQR above the third quartile. It is a mild outlier.• The value 19 is the highest value that falls within the included range.
The box-and-whisker plot is shown below. Outliers are represented, but not included in the whiskers.
Making Box-and-Whisker Plots Using a Graphing Calculator
Graphing calculators make analyzing large lists of data easy. They have built-in algorithms for finding the median,and the quartiles and can be used to display box-and-whisker plots.
Example 5
The ages of all the passengers traveling in a train carriage are shown below.
35,42,38,57,2,24,27,36,45,60,38,40,40,44,1,44,48,84,38,20,4,2,
48,58,3,20,6,40,22,26,17,18,40,51,62,31,27,48,35,27,37,58,21
Use a graphing calculator to
(i) Obtain the 5 number summary for the data.
11.8. BOX-AND-WHISKER PLOTS
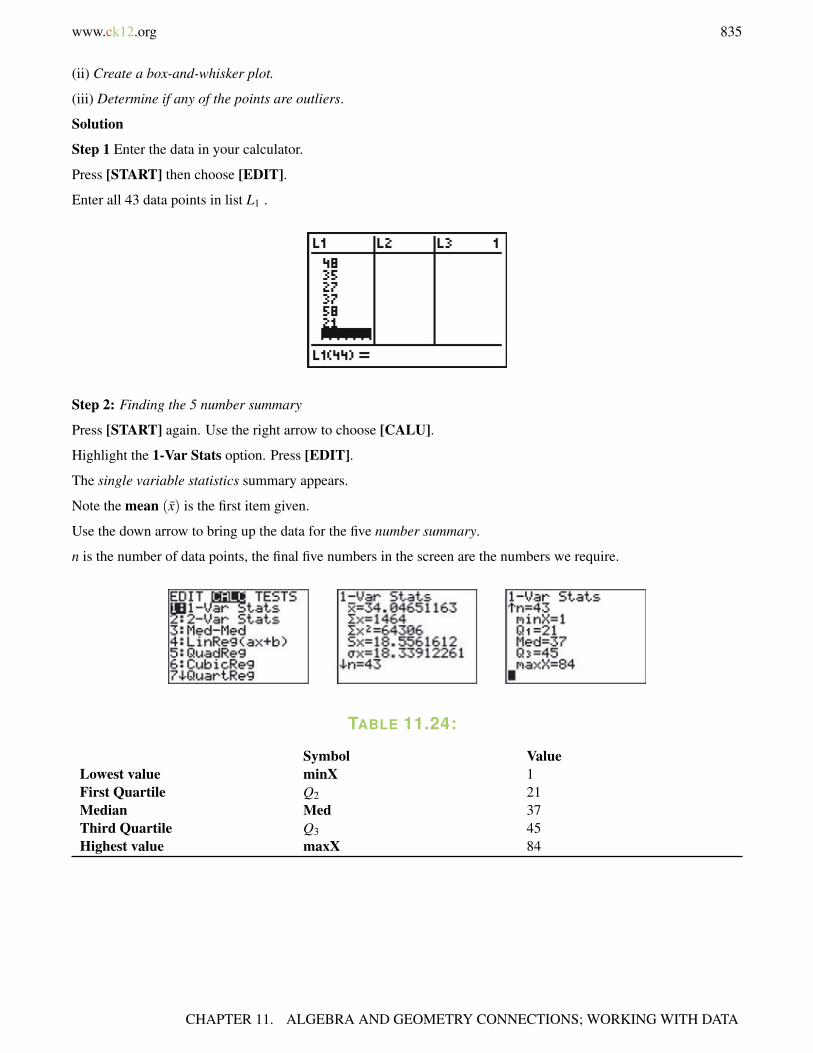
www.ck12.org 835
(ii) Create a box-and-whisker plot.
(iii) Determine if any of the points are outliers.
Solution
Step 1 Enter the data in your calculator.
Press [START] then choose [EDIT].
Enter all 43 data points in list L1 .
Step 2: Finding the 5 number summary
Press [START] again. Use the right arrow to choose [CALU].
Highlight the 1-Var Stats option. Press [EDIT].
The single variable statistics summary appears.
Note the mean (x) is the first item given.
Use the down arrow to bring up the data for the five number summary.
n is the number of data points, the final five numbers in the screen are the numbers we require.
TABLE 11.24:
Symbol ValueLowest value minX 1First Quartile Q2 21Median Med 37Third Quartile Q3 45Highest value maxX 84
CHAPTER 11. ALGEBRA AND GEOMETRY CONNECTIONS; WORKING WITH DATA

836 www.ck12.org
Step 3 Displaying the box-and-whisker plot.
Bring up the [STARTPLOT] option by pressing [2nd]. [Y=].
Highlight 1:Plot1 and press [ENTER].
There are two types of box-and-whisker plots available. The first automatically identifies outliers. Highlight it andpress [ENTER].
Press [WINDOW] and ensure that Xmin and Xmax allow for all data points to be shown. In this example, Xmin= 0and Xmax = 100 .
Press [GRAPH] and the box-and-whisker plot should appear.
The calculator will automatically identify outliers and plot them as such. You can use the [TRACE] function alongwith the arrows to identify outlier values. In this case there is one outlier (84).
Review Questions
1. Draw a box-and-whisker plot for the following unordered data.
49,57,53,54,49,67,51,57,56,59,57,50,49,52,53,50,58
2. A simulation of a large number of runs of rolling three dice and adding the numbers results in the following5-number summary: 3, 8, 10.5, 13, 18. Make a box-and-whisker plot for the data and comment on thedifferences between it and the plot in Example 2.
3. The box-and-whisker plots below represent the percentage of people living below the poverty line by countyin both Texas and California. Determine the 5 number summary for each state, and comment on the spread ofeach distribution.
4. The 5 number summary for the average daily temperature in Atlantic City, NJ (given in F ) is 31, 39, 52,68, 76. Draw the box-and-whisker plot for this data and use it to determine which of the following would beconsidered an outlier if it were included in the data.
a. January’s record high temperature of 78
b. January’s record low temperature of −8
c. April’s record high temperature of 94
d. The all time record high of 106
11.8. BOX-AND-WHISKER PLOTS

www.ck12.org 837
5. In 1887 Albert Michelson and Edward Morley conducted an experiment to determine the speed of light. Thedata for the first 10 runs (5 results in each run) is given below. Each value represents how many kilometersper second over 299, 000 km/s was measured. Create a box-and-whisker plot of the data. Be sure to identifyoutliers and plot them as such.
850,740,900,1070,930,850,950,980,980,880,960,940,960,940,880,800,850,
880,900,840,880,880,800,860,720,720,620,860,970,950,890,810,810,820,
800,770,760,740,750,760,890,840,780,810,760,810,790,810,820,850
Review Answers
1. (Upper value is just inside included range - there are no outliers)
2. The box-and-whisker plot for many runs is shown. It includes values that are less likely to occur (3 and 18)so the range is greater than for a small number of runs. The median is the same and the IQR is similar,indicating that a small trial makes a good estimate of these quantities.
3. California 6, 9.5, 12, 15.5, 22; Texas 5, 13, 16, 19.5, 35 Answers will vary but students should see that althoughthe county that has the lowest poverty rate is in Texas, in general counties in Texas have a greater percentageof people living below the poverty line. Q1 , the median and Q3 all higher for Texas than California. Thecounty with the highest poverty rate is in Texas, and it is worth noting that this value could be considered anoutlier as it falls more than 1.5 times the IQR above Q3 .
4. The box-and-whisker plot is shown. The IQR indicates that the only outlier would be point b .
5. See the box-and-whisker plot below. The modern accepted value (299, 792 km/s) falls just below Q2 .
Texas Instruments Resources
In the CK-12 Texas Instruments Algebra I FlexBook, there are graphing calculator activities designed to supple-ment the objectives for some of the lessons in this chapter. See http://www.ck12.org/flexr/chapter/9621.
CHAPTER 11. ALGEBRA AND GEOMETRY CONNECTIONS; WORKING WITH DATA
838 www.ck12.org
CHAPTER 12 Rational Equations andFunctions; Topics in Statistics
CHAPTER OUTLINE
12.1 INVERSE VARIATION MODELS
12.2 GRAPHS OF RATIONAL FUNCTIONS
12.3 DIVISION OF POLYNOMIALS
12.4 RATIONAL EXPRESSIONS
12.5 MULTIPLICATION AND DIVISION OF RATIONAL EXPRESSIONS
12.6 ADDITION AND SUBTRACTION OF RATIONAL EXPRESSIONS
12.7 SOLUTIONS OF RATIONAL EQUATIONS
12.8 SURVEYS AND SAMPLES

www.ck12.org 839
12.1 Inverse Variation Models
Learning Objectives
• Distinguish direct and inverse variation.• Graph inverse variation equations.• Write inverse variation equations.• Solve real-world problems using inverse variation equations.
Introduction
Many variables in real-world problems are related to each other by variations. A variation is an equation that relatesa variable to one or more variables by the operations of multiplication and division. There are three different kindsof variation problems: direct variation, inverse variation and joint variation.
Distinguish Direct and Inverse Variation
In direct variation relationships, the related variables will either increase together or decrease together at a steadyrate. For instance, consider a person walking at three miles per hour. As time increases, the distance covered by theperson walking also increases at the rate of three miles each hour. The distance and time are related to each other bya direct variation.
distance = rate× time
Since the speed is a constant 3 miles per hour, we can write: d = 3t .
Direct Variation
The general equation for a direct variation is
y = kx.
k is called the constant of proportionality
You can see from the equation that a direct variation is a linear equation with a y− intercept of zero. The graph of adirect variation relationship is a straight line passing through the origin whose slope is k the constant of proportion-ality.
CHAPTER 12. RATIONAL EQUATIONS AND FUNCTIONS; TOPICS IN STATISTICS

840 www.ck12.org
A second type of variation is inverse variation. When two quantities are related to each other inversely, as onequantitiy increases, the other one decreases and vice-versa.
For instance, if we look at the formula distance = speed× time again and solve for time, we obtain:
time =distance
rate
If we keep the distance constant, we see that as the speed of an object increases, then the time it takes to cover thatdistance decreases. Consider a car traveling a distance of 90 miles, then the formula relating time and speed is t = 90
s.
Inverse Variation
The general equation for inverse variation is
y =kx
where k is called the constant of proportionality.
In this chapter, we will investigate how the graph of these relationships behave.
Another type variation is a joint variation. In this type of relationship, one variable may vary as a product of two ormore variables.
For example, the volume of a cylinder is given by:
V = πr2 ·h
In this formula, the volume varies directly as the product of the square of the radius of the base and the height of thecylinder. The constant of proportionality here is the number π .
In many application problems, the relationship between the variables is a combination of variations. For instanceNewton’s Law of Gravitation states that the force of attraction between two spherical bodies varies jointly as themasses of the objects and inversely as the square of the distance between them
F = Gm1m2
d2
12.1. INVERSE VARIATION MODELS

www.ck12.org 841
In this example the constant of proportionality, G , is called the gravitational constant and its value is given byG = 6.673×10⁻¹¹N ·m2/kg2 .
Graph Inverse Variation Equations
We saw that the general equation for inverse variation is given by the formula y =( k
x
), where k is a constant of
proportionality. We will now show how the graphs of such relationships behave. We start by making a table ofvalues. In most applications, x and y are positive. So in our table, we will choose only positive values of x .
Example 1
Graph an inverse variation relationship with the proportionality constant k = 1 .
Solution
TABLE 12.1:
x y = 1x
0 y = 10 = undefined
14 y = 1
14= 4
12 y = 1
12= 2
34 y = 1
34= 1.33
1 y = 11 = 1
32 y = 1
32= 0.67
2 y = 12 = 0.5
3 y = 13 = 0.33
4 y = 14 = 0.25
5 y = 15 = 0.2
10 y = 110 = 0.1
Here is a graph showing these points connected with a smooth curve.
Both the table and the graph demonstrate the relationship between variables in an inverse variation. As one variableincreases, the other variable decreases and vice-versa. Notice that when x = 0 , the value of y is undefined. The
CHAPTER 12. RATIONAL EQUATIONS AND FUNCTIONS; TOPICS IN STATISTICS
842 www.ck12.org
graph shows that when the value of x is very small, the value of y is very big and it approaches infinity as x getscloser and closer to zero.
Similarly, as the value of x gets very large, the value of y gets smaller and smaller, but never reaches the value ofzero. We will investigate this behavior in detail throughout this chapter
Write Inverse Variation Equations
As we saw an inverse variation fulfills the equation: y =( k
x
). In general, we need to know the value of y at a
particular value of x in order to find the proportionality constant. After the proportionality constant is known, wecan find the value of y for any given value of x .
Example 2
If y is inversely proportional to x and y = 10 when x = 5 . Find y when x = 2 .
Solution
Since y is inversely proportional to x,
then the general relationship tells us y =kx
Plug in the values y = 10 and x = 5. 10 =k5
Solve for k by multiplying both sides of the equation by 5. k = 50
Now we put k back into the general equation.
The inverse relationship is given by y =50x
When x = 2 y =502
or y = 25
Answer y = 25
Example 3
If p is inversely proportional to the square of q , and p = 64 when q = 3 . Find p when q = 5 .
Solution:
Since p is inversely proportional to q2,
then the general equation is p =kq2
Plug in the values p = 64 and q = 3. 64 =k32 or 64 =
k9
Solve for k by multiplying both sides of the equation by 9. k = 576
The inverse relationship is given by p =576q2
When q = 5 p =57625
or p = 23.04
Answer p = 23.04 .
12.1. INVERSE VARIATION MODELS

www.ck12.org 843
Solve Real-World Problems Using Inverse Variation Equations
Many formulas in physics are described by variations. In this section we will investigate some problems that aredescribed by inverse variations.
Example 4
The frequency, f , of sound varies inversely with wavelength, λ . A sound signal that has a wavelength of 34 metershas a frequency of 10 hertz. What frequency does a sound signal of 120 meters have?
Solution
The inverse variation relationship is f =kλ
Plug in the values λ = 34 and f = 10. 10 =k
34Multiply both sides by 34. k = 340
Thus, the relationship is given by f =340λ
Plug in λ = 120 meters. f =340120⇒ f = 2.83
Answer f = 2.83 Hertz
Example 5
Electrostatic force is the force of attraction or repulsion between two charges. The electrostatic force is given bythe formula: F =
(Kq1q2
d2
)where q1 and q2 are the charges of the charged particles, d[U+0080][U+0099] is the
distance between the charges and k is proportionality constant. The charges do not change and are, thus, constantsand can then be combined with the other constant k to form a new constant K . The equation is rewritten as F =
( Kd2
). If the electrostatic force is F = 740 Newtons when the distance between charges is 5.3×10⁻¹¹ meters , what is Fwhen d = 2.0×10⁻¹⁰ meters ?
Solution
The inverse variation relationship is f =k
d2
Plug in the values F = 740 and d = 5.3×10⁻¹¹. 740 =k
(5.3×10⁻¹¹)2
Multiply both sides by (5.3×10⁻¹¹)2. K = 740(5.3×10⁻¹¹)2
The electrostatic force is given by F =2.08×10⁻¹⁸
d2
When d = 2.0×10⁻¹⁰ F =2.08×10⁻¹⁸
(2.0×10⁻¹⁰)2
Enter2.08∗10(−18)(2.0∗10(−10)
)2 into a calculator. F = 52
Answer F = 52 Newtons
Note: In the last example, you can also compute F = 2.08×10⁻¹⁸
(2.0×10⁻¹⁰)2 by hand.
CHAPTER 12. RATIONAL EQUATIONS AND FUNCTIONS; TOPICS IN STATISTICS
844 www.ck12.org
F =2.08×10⁻¹⁸
(2.0×10⁻¹⁰)2
=2.08×10⁻¹⁸
4.0×10−20
=2.08×10²⁰
4.0×1018
=2.084.0
(102)
= 0.52(100)
= 52
This illustrates the usefulness of scientific notation.
Review Questions
Graph the following inverse variation relationships.
1. y = 3x
2. y = 10x
3. y = 14x
4. y = 56x
5. If z is inversely proportional to w and z = 81 when w = 9 , find w when z = 24 .6. If y is inversely proportional to x and y = 2 when x = 8 , find y when x = 12 .7. If a is inversely proportional to the square root of b , and a = 32 when b = 9 , find b when a = 6 .8. If w is inversely proportional to the square of u and w = 4 when u = 2 , find w when u = 8 .9. If x is proportional to y and inversely proportional to z , and x = 2 , when y = 10 and z = 25 . Find x when
y = 8 and z = 35 .10. If a varies directly with b and inversely with the square of c and a = 10 when b = 5 and c = 2 . Find the value
of a when b = 3 and c = 6 .11. The intensity of light is inversely proportional to the square of the distance between the light source and the
object being illuminated. A light meter that is 10 meters from a light source registers 35 lux. What intensitywould it register 25 meters from the light source?
12. Ohm’s Law states that current flowing in a wire is inversely proportional to the resistance of the wire. If thecurrent is 2.5 Amperes when the resistance is 20 ohms, find the resistance when the current is 5 Amperes.
13. The volume of a gas varies directly to its temperature and inversely to its pressure. At 273 degrees Kelvin andpressure of 2 atmospheres, the volume of the gas is 24 Liters. Find the volume of the gas when the temperatureis 220 kelvin and the pressure is 1.2 atmospheres.
14. The volume of a square pyramid varies jointly as the height and the square of the length of the base. A conewhose height is 4 inches and whose base has a side length of 3 inches has a volume of 12 in3 . Find the volumeof a square pyramid that has a height of 9 inches and whose base has a side length of 5 inches.
12.1. INVERSE VARIATION MODELS
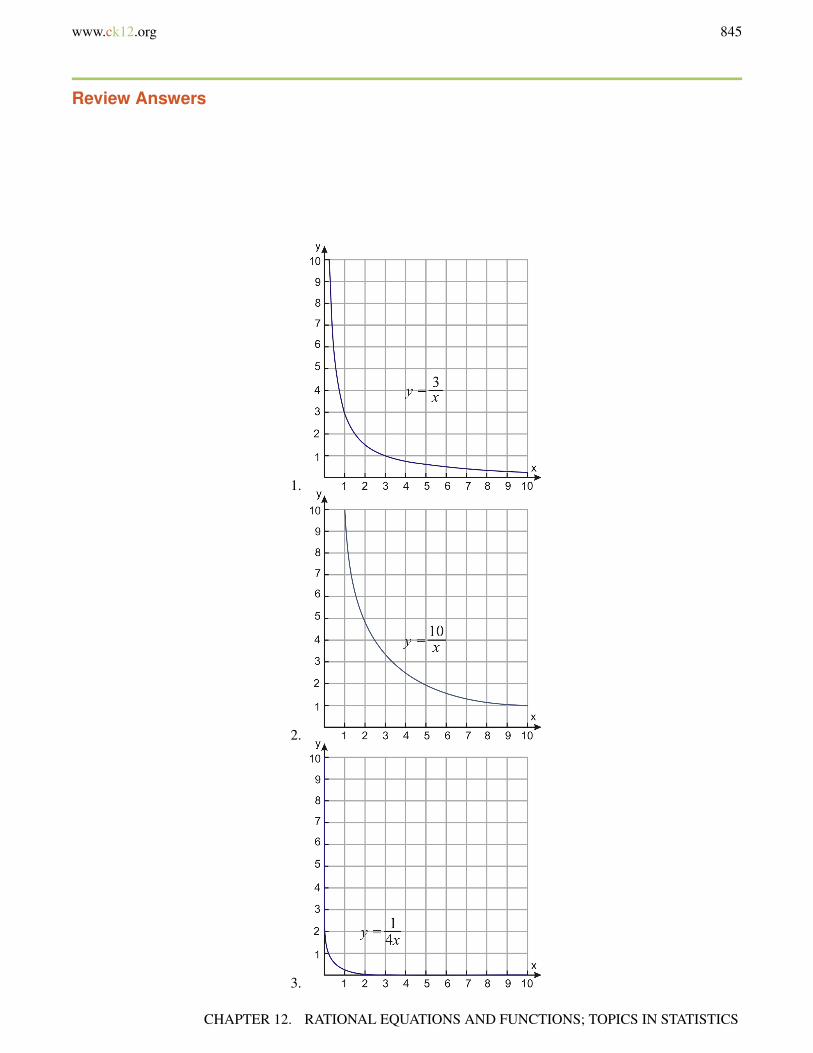
www.ck12.org 845
Review Answers
1.
2.
3.
CHAPTER 12. RATIONAL EQUATIONS AND FUNCTIONS; TOPICS IN STATISTICS
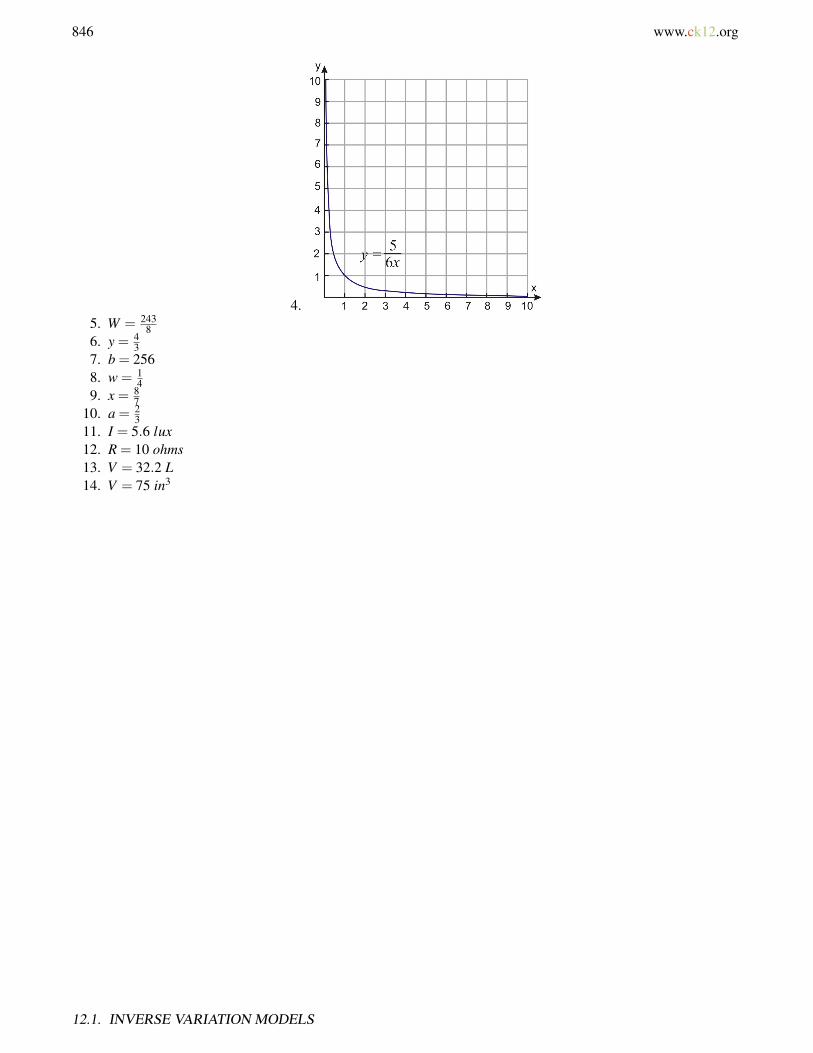
846 www.ck12.org
4.5. W = 243
86. y = 4
37. b = 2568. w = 1
49. x = 8
710. a = 2
311. I = 5.6 lux12. R = 10 ohms13. V = 32.2 L14. V = 75 in3
12.1. INVERSE VARIATION MODELS
www.ck12.org 847
12.2 Graphs of Rational Functions
Learning Objectives
• Compare graphs of inverse variation equations.• Graph rational functions.• Solve real-world problems using rational functions.
Introduction
In this section, you will learn how to graph rational functions. Graphs of rational functions are very distinctive.These functions are characterized by the fact that the function gets closer and closer to certain values but neverreaches those values. In addition, because rational functions may contain values of x where the function does notexit, the function can take values very close to the excluded values but never “cross” through these values. Thisbehavior is called asymptotic behavior and we will see that rational functions can have horizontal asymptotes,vertical asymptotes or oblique (or slant) asymptotes.
Compare Graphs of Inverse Variation Equations
Inverse variation problems are the simplest example of rational functions. We saw that an inverse variation has thegeneral equation: y = k
x . In most real-world problems, the x and y values take only positive values. Below, we willshow graphs of three inverse variation functions.
Example 1
On the same coordinate grid, graph an inverse variation relationships with the proportionality constants k = 1,k = 2,and k =
(12
).
Solution
We will not show the table of values for this problem, but rather we can show the graphs of the three functions onthe same coordinate axes. We notice that for larger constants of proportionality, the curve decreases at a slower ratethan for smaller constants of proportionality. This makes sense because, basically the value of y is related directly tothe proportionality constants so we should expect larger values of y for larger values of k .
CHAPTER 12. RATIONAL EQUATIONS AND FUNCTIONS; TOPICS IN STATISTICS

848 www.ck12.org
Graph Rational Functions
We will now extend the domain and range of rational equations to include negative values of x and y . We will firstplot a few rational functions by using a table of values, and then we will talk about distinguishing characteristics ofrational functions that will help us make better graphs.
Recall that one of the basic rules of arithmetic is that you cannot divide by 0.
05= 0
while
50= Undefined.
As we graph rational functions, we need to always pay attention to values of x that will cause us to divide by 0.
Example 2
Graph the function y = 1x .
Solution
Before we make a table of values, we should notice that the function is not defined for x = 0 . This means that thegraph of the function will not have a value at that point. Since the value of x = 0 is special, we should make sure topick enough values close to x = 0 in order to get a good idea how the graph behaves. Let’s make two tables: one forx− values smaller than zero and one for x− values larger than zero.
TABLE 12.2:
x y = 1x
−5 y = 1−5 =−0.2
-4 y = 1−4 =−0.25
-3 y = 1−3 =−0.33
-2 y = 1−2 =−0.5
-1 y = 1−1 =−1
12.2. GRAPHS OF RATIONAL FUNCTIONS

www.ck12.org 849
TABLE 12.2: (continued)
x y = 1x
-0.5 y = 1−0.5 =−2
-0.4 y = 1−0.4 =−2.5
-0.3 y = 1−0.3 =−3.3
-0.2 y = 1−0.2 =−5
-0.1 y = 1−0.1 =−10
TABLE 12.3:
x y = 1x
0.1 y = 10.1 = 10
0.2 y = 10.2 = 5
0.3 y = 10.3 = 3.3
0.4 y = 10.4 = 2.5
0.5 y = 10.5 = 2
1 y = 11 = 1
2 y = 12 = 0.5
3 y = 13 = 0.33
4 y = 14 = 0.25
5 y = 15 = 0.2
We can see in the table that as we pick positive values of x closer and closer to zero, y becomes increasing large. Aswe pick negative values of x closer and close to zero, y becomes increasingly small (or more and more negative).
Notice on the graph that for values of x near 0, the points on the graph get closer and closer to the vertical line x = 0. The line x = 0 is called a vertical asymptote of the function y =
(1x
).
We also notice that as x gets larger in the positive direction or in the negative direction, the value of y gets closerand closer to, but it will never actually equal zero. Why? Since y =
(1x
), there are no values of x that will make
the fraction zero. For a fraction to equal zero, the numerator must equal zero. The horizontal line y = 0 is called ahorizontal asymptote of the function y =
(1x
).
CHAPTER 12. RATIONAL EQUATIONS AND FUNCTIONS; TOPICS IN STATISTICS
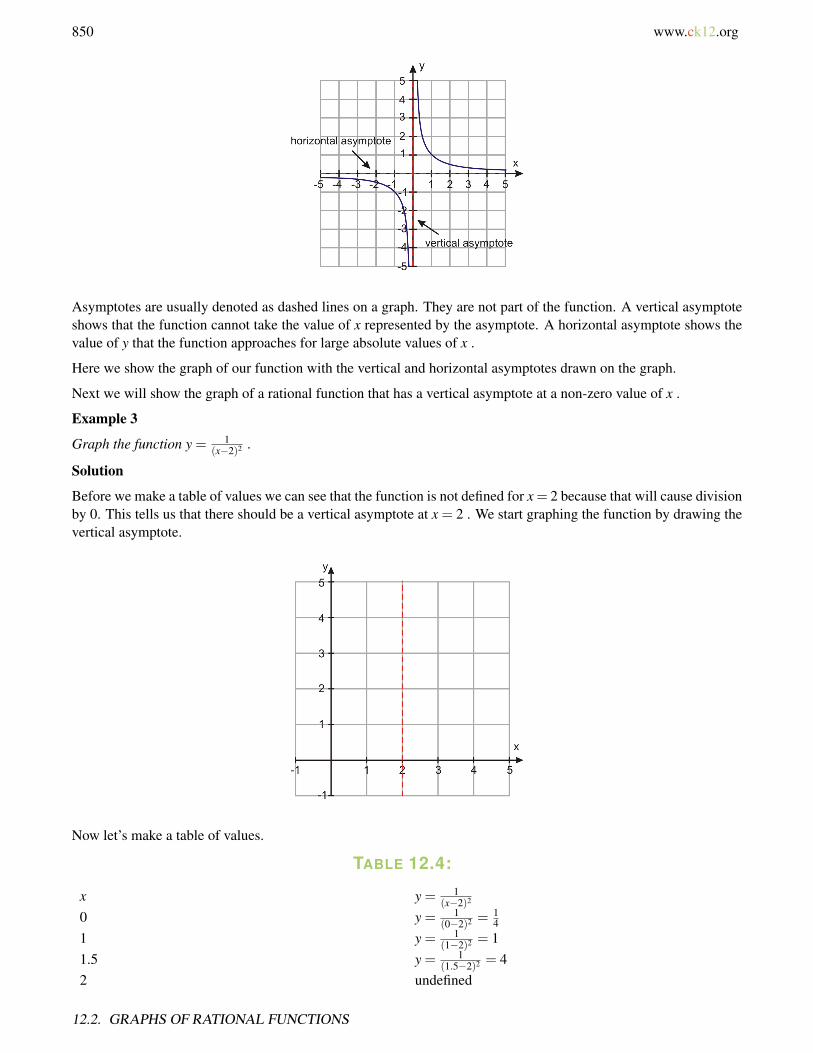
850 www.ck12.org
Asymptotes are usually denoted as dashed lines on a graph. They are not part of the function. A vertical asymptoteshows that the function cannot take the value of x represented by the asymptote. A horizontal asymptote shows thevalue of y that the function approaches for large absolute values of x .
Here we show the graph of our function with the vertical and horizontal asymptotes drawn on the graph.
Next we will show the graph of a rational function that has a vertical asymptote at a non-zero value of x .
Example 3
Graph the function y = 1(x−2)2 .
Solution
Before we make a table of values we can see that the function is not defined for x = 2 because that will cause divisionby 0. This tells us that there should be a vertical asymptote at x = 2 . We start graphing the function by drawing thevertical asymptote.
Now let’s make a table of values.
TABLE 12.4:
x y = 1(x−2)2
0 y = 1(0−2)2 =
14
1 y = 1(1−2)2 = 1
1.5 y = 1(1.5−2)2 = 4
2 undefined
12.2. GRAPHS OF RATIONAL FUNCTIONS

www.ck12.org 851
TABLE 12.4: (continued)
x y = 1(x−2)2
2.5 y = 1(2.5−2)2 = 4
3 y = 1(3−2)2 = 1
4 y = 1(4−2)2 =
14
Here is the resulting graph
Notice that we did not pick as many values for our table this time. This is because we should have a good idea whathappens near the vertical asymptote. We also know that for large values of x , both positive and negative, the valueof y could approach a constant value.
In this case, that constant value is y = 0 . This is the horizontal asymptote.
A rational function does not need to have a vertical or horizontal asymptote. The next example shows a rationalfunction with no vertical asymptotes.
Example 4
Graph the function y = x2
x2+1 .
Solution
We can see that this function will have no vertical asymptotes because the denominator of the function will never bezero. Let’s make a table of values to see if the value of y approaches a particular value for large values of x , bothpositive and negative.
TABLE 12.5:
x y = x2
x2+1
−3 y = (−3)2
(−3)2+1 = 910 = 0.9
-2 y = (−2)2
(−2)2+1 = 45 = 0.8
-1 y = (−1)2
(−1)2+1 = 12 = 0.5
0 y = (0)2
(0)2+1 = 01 = 0
1 y = (1)2
(1)2+1 = 12 = 0.5
2 y = (2)2
(2)2+1 = 45 = 0.8
2 y = (3)2
(3)2+1 = 910 = 0.9
CHAPTER 12. RATIONAL EQUATIONS AND FUNCTIONS; TOPICS IN STATISTICS
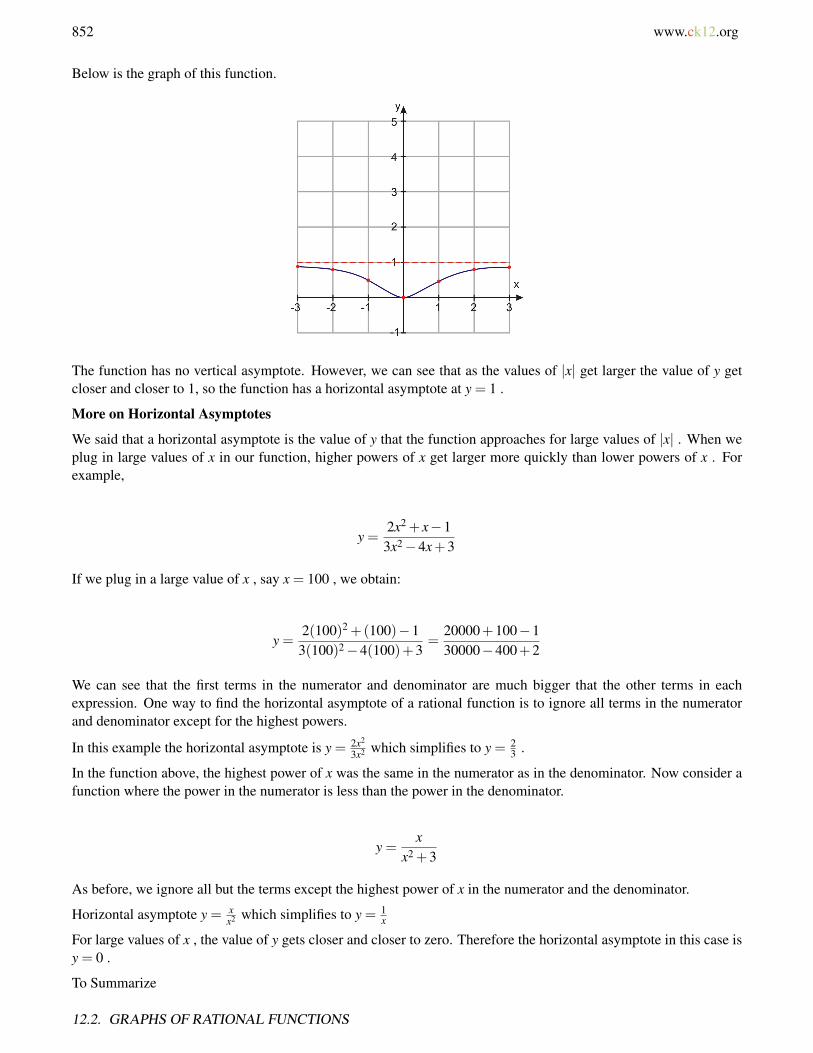
852 www.ck12.org
Below is the graph of this function.
The function has no vertical asymptote. However, we can see that as the values of |x| get larger the value of y getcloser and closer to 1, so the function has a horizontal asymptote at y = 1 .
More on Horizontal Asymptotes
We said that a horizontal asymptote is the value of y that the function approaches for large values of |x| . When weplug in large values of x in our function, higher powers of x get larger more quickly than lower powers of x . Forexample,
y =2x2 + x−13x2−4x+3
If we plug in a large value of x , say x = 100 , we obtain:
y =2(100)2 +(100)−13(100)2−4(100)+3
=20000+100−130000−400+2
We can see that the first terms in the numerator and denominator are much bigger that the other terms in eachexpression. One way to find the horizontal asymptote of a rational function is to ignore all terms in the numeratorand denominator except for the highest powers.
In this example the horizontal asymptote is y = 2x2
3x2 which simplifies to y = 23 .
In the function above, the highest power of x was the same in the numerator as in the denominator. Now consider afunction where the power in the numerator is less than the power in the denominator.
y =x
x2 +3
As before, we ignore all but the terms except the highest power of x in the numerator and the denominator.
Horizontal asymptote y = xx2 which simplifies to y = 1
x
For large values of x , the value of y gets closer and closer to zero. Therefore the horizontal asymptote in this case isy = 0 .
To Summarize
12.2. GRAPHS OF RATIONAL FUNCTIONS
www.ck12.org 853
• Find vertical asymptotes by setting the denominator equal to zero and solving for x .• For horizontal asymptotes, we must consider several cases for finding horizontal asymptotes.
– If the highest power of x in the numerator is less than the highest power of x in the denominator, then thehorizontal asymptote is at y = 0 .
– If the highest power of x in the numerator is the same as the highest power of x in the denominator, then
the horizontal asymptote is at y = coefficient of highest power of xcoefficient of highest power of x
– If the highest power of x in the numerator is greater than the highest power of x in the denominator, thenwe don’t have a horizontal asymptote, we could have what is called an oblique (slant) asymptote or noasymptote at all.
Example 5
Find the vertical and horizontal asymptotes for the following functions.
a) y = 1x−1
b) y = 3x4x+2
c) y = x2−22x2+3
d) y = x3
x2−3x+2
Solution
a) Vertical asymptotes
Set the denominator equal to zero. x−1 = 0⇒ x = 1 is the vertical asymptote.
Horizontal asymptote
Keep only highest powers of x . y = 1x ⇒ y = 0 is the horizontal asymptote.
b) vertical asymptotes
Set the denominator equal to zero. 4x+2 = 0⇒ x =−12 is the vertical asymptote.
Horizontal asymptote
Keep only highest powers of x . y = 3x4x ⇒ y = 3
4 is the horizontal asymptote.
c) Vertical asymptotes
Set the denominator equal to zero. 2x2+3 = 0⇒ 2x2 =−3⇒ x2 =−32 Since there are no solutions to this equation
therre is no vertical asymptote.
Horizontal asymptote
Keep only highest powers of x . y = x2
2x2 ⇒ y = 12 is the horizontal asymptote.
d) Vertical asymptotes
Set the denominator equal to zero. x2−3x+2 = 0
Factor. (x−2)(x−1) = 0
Solve. x = 2 and x = 1 vertical asymptotes
Horizontal asymptote. There is no horizontal asymptote because power of numerator is larger than the power ofthe denominator
Notice the function in part d of Example 5 had more than one vertical asymptote. Here is an example of anotherfunction with two vertical asymptotes.
Example 6
Graph the function y = −x2
x2−4 .
CHAPTER 12. RATIONAL EQUATIONS AND FUNCTIONS; TOPICS IN STATISTICS
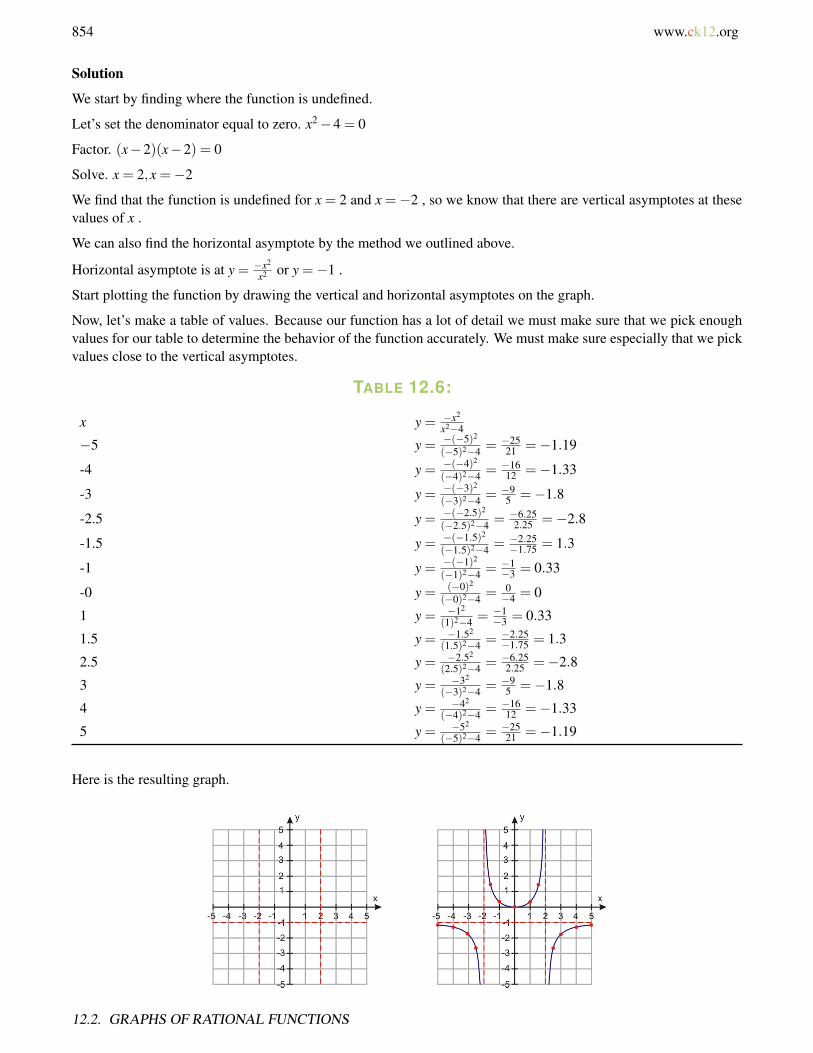
854 www.ck12.org
Solution
We start by finding where the function is undefined.
Let’s set the denominator equal to zero. x2−4 = 0
Factor. (x−2)(x−2) = 0
Solve. x = 2,x =−2
We find that the function is undefined for x = 2 and x =−2 , so we know that there are vertical asymptotes at thesevalues of x .
We can also find the horizontal asymptote by the method we outlined above.
Horizontal asymptote is at y = −x2
x2 or y =−1 .
Start plotting the function by drawing the vertical and horizontal asymptotes on the graph.
Now, let’s make a table of values. Because our function has a lot of detail we must make sure that we pick enoughvalues for our table to determine the behavior of the function accurately. We must make sure especially that we pickvalues close to the vertical asymptotes.
TABLE 12.6:
x y = −x2
x2−4
−5 y = −(−5)2
(−5)2−4 = −2521 =−1.19
-4 y = −(−4)2
(−4)2−4 = −1612 =−1.33
-3 y = −(−3)2
(−3)2−4 = −95 =−1.8
-2.5 y = −(−2.5)2
(−2.5)2−4 = −6.252.25 =−2.8
-1.5 y = −(−1.5)2
(−1.5)2−4 = −2.25−1.75 = 1.3
-1 y = −(−1)2
(−1)2−4 = −1−3 = 0.33
-0 y = (−0)2
(−0)2−4 = 0−4 = 0
1 y = −12
(1)2−4 = −1−3 = 0.33
1.5 y = −1.52
(1.5)2−4 = −2.25−1.75 = 1.3
2.5 y = −2.52
(2.5)2−4 = −6.252.25 =−2.8
3 y = −32
(−3)2−4 = −95 =−1.8
4 y = −42
(−4)2−4 = −1612 =−1.33
5 y = −52
(−5)2−4 = −2521 =−1.19
Here is the resulting graph.
12.2. GRAPHS OF RATIONAL FUNCTIONS

www.ck12.org 855
Solve Real-World Problems Using Rational Functions
Electrical Circuits
Electrical circuits are commonplace is everyday life. For instance, they are present in all electrical appliances inyour home. The figure below shows an example of a simple electrical circuit. It consists of a battery which providesa voltage ( V , measured in Volts, V ), a resistor ( R , measured in ohms, Ω ) which resists the flow of electricity, andan ammeter that measures the current ( I , measured in amperes, A ) in the circuit.
Ohm’s Law gives a relationship between current, voltage and resistance. It states that
I =VR
Your light bulb, toaster and hairdryer are all basically simple resistors. In addition, resistors are used in an electricalcircuit to control the amount of current flowing through a circuit and to regulate voltage levels. One important reasonto do this is to prevent sensitive electrical components from burning out due to too much current or too high a voltagelevel. Resistors can be arranges in series or in parallel.
For resistors placed in a series, the total resistance is just the sum of the resistances of the individual resistors.
Rtot = R1 +R2
For resistors placed in parallel, the reciprocal of the total resistance is the sum of the reciprocals of the resistance ofthe individual resistors.1
Rc= 1
R1+ 1
R2
CHAPTER 12. RATIONAL EQUATIONS AND FUNCTIONS; TOPICS IN STATISTICS
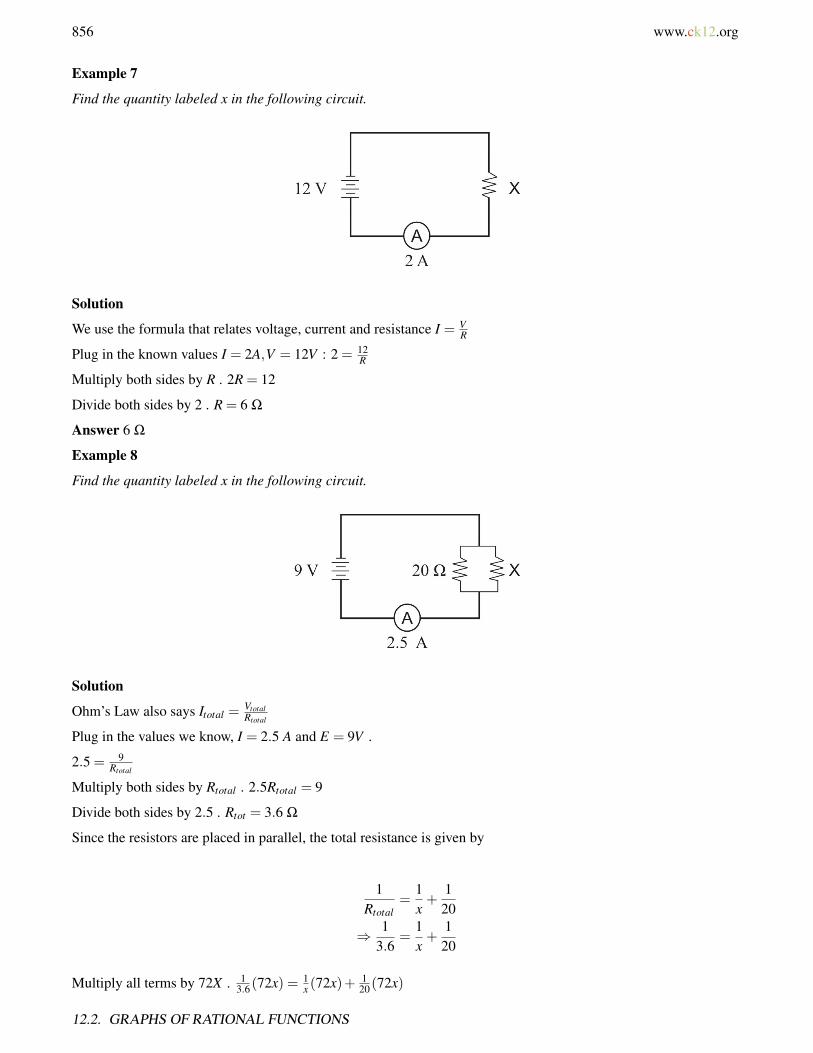
856 www.ck12.org
Example 7
Find the quantity labeled x in the following circuit.
Solution
We use the formula that relates voltage, current and resistance I = VR
Plug in the known values I = 2A,V = 12V : 2 = 12R
Multiply both sides by R . 2R = 12
Divide both sides by 2 . R = 6 Ω
Answer 6 Ω
Example 8
Find the quantity labeled x in the following circuit.
Solution
Ohm’s Law also says Itotal =VtotalRtotal
Plug in the values we know, I = 2.5 A and E = 9V .
2.5 = 9Rtotal
Multiply both sides by Rtotal . 2.5Rtotal = 9
Divide both sides by 2.5 . Rtot = 3.6 Ω
Since the resistors are placed in parallel, the total resistance is given by
1Rtotal
=1x+
120
⇒ 13.6
=1x+
120
Multiply all terms by 72X . 13.6(72x) = 1
x (72x)+ 120(72x)
12.2. GRAPHS OF RATIONAL FUNCTIONS
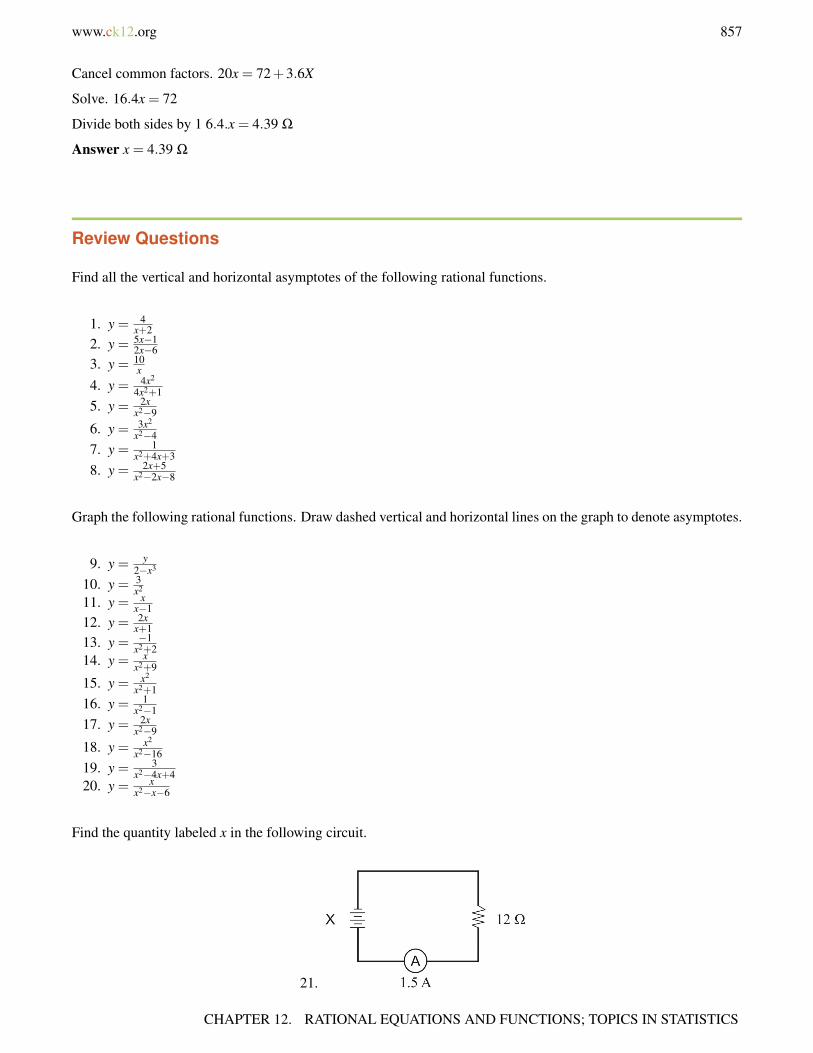
www.ck12.org 857
Cancel common factors. 20x = 72+3.6X
Solve. 16.4x = 72
Divide both sides by 1 6.4.x = 4.39 Ω
Answer x = 4.39 Ω
Review Questions
Find all the vertical and horizontal asymptotes of the following rational functions.
1. y = 4x+2
2. y = 5x−12x−6
3. y = 10x
4. y = 4x2
4x2+15. y = 2x
x2−9
6. y = 3x2
x2−47. y = 1
x2+4x+38. y = 2x+5
x2−2x−8
Graph the following rational functions. Draw dashed vertical and horizontal lines on the graph to denote asymptotes.
9. y = y2−x3
10. y = 3x2
11. y = xx−1
12. y = 2xx+1
13. y = −1x2+2
14. y = xx2+9
15. y = x2
x2+116. y = 1
x2−117. y = 2x
x2−9
18. y = x2
x2−1619. y = 3
x2−4x+420. y = x
x2−x−6
Find the quantity labeled x in the following circuit.
21.
CHAPTER 12. RATIONAL EQUATIONS AND FUNCTIONS; TOPICS IN STATISTICS
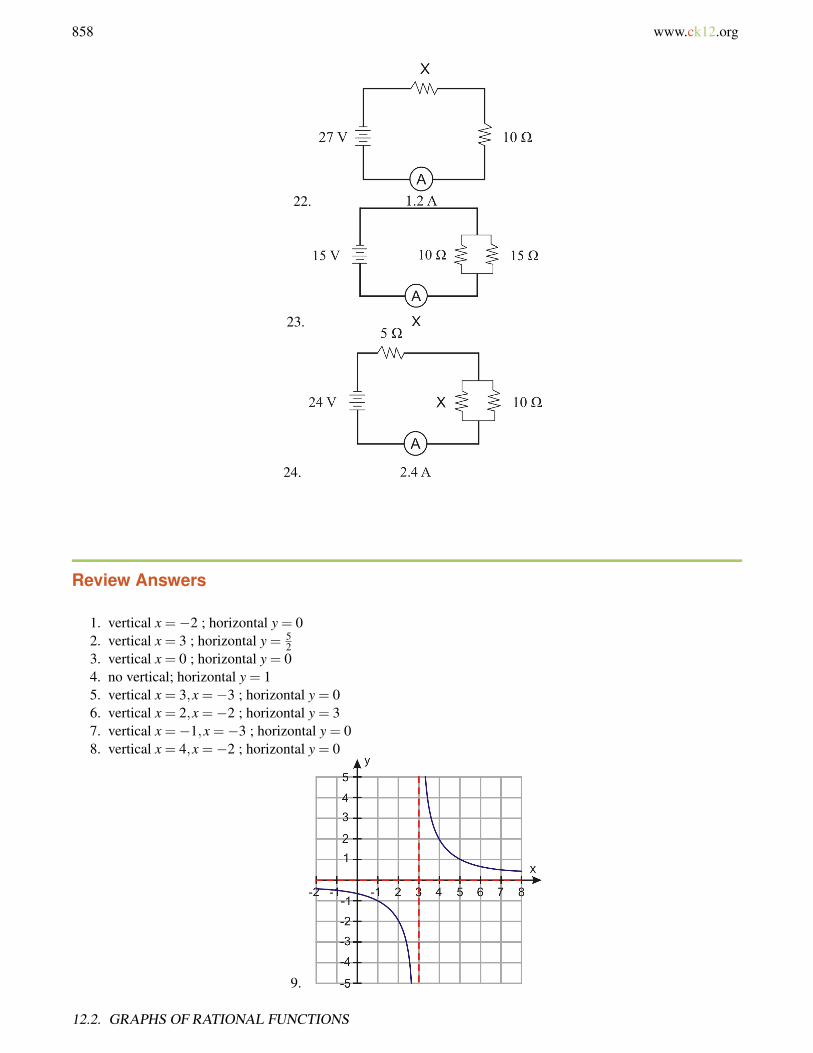
858 www.ck12.org
22.
23.
24.
Review Answers
1. vertical x =−2 ; horizontal y = 02. vertical x = 3 ; horizontal y = 5
23. vertical x = 0 ; horizontal y = 04. no vertical; horizontal y = 15. vertical x = 3,x =−3 ; horizontal y = 06. vertical x = 2,x =−2 ; horizontal y = 37. vertical x =−1,x =−3 ; horizontal y = 08. vertical x = 4,x =−2 ; horizontal y = 0
9.
12.2. GRAPHS OF RATIONAL FUNCTIONS

www.ck12.org 859
10.
11.
12.
CHAPTER 12. RATIONAL EQUATIONS AND FUNCTIONS; TOPICS IN STATISTICS

www.ck12.org 861
17.
18.
19.
CHAPTER 12. RATIONAL EQUATIONS AND FUNCTIONS; TOPICS IN STATISTICS
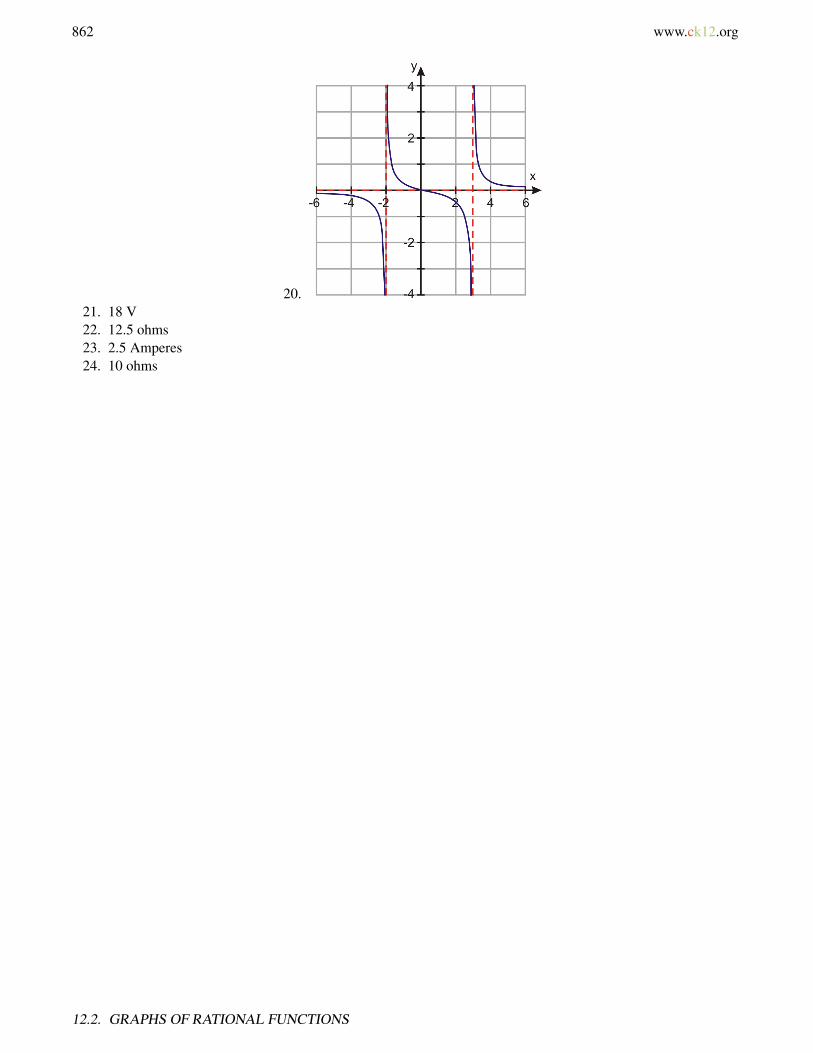
862 www.ck12.org
20.21. 18 V22. 12.5 ohms23. 2.5 Amperes24. 10 ohms
12.2. GRAPHS OF RATIONAL FUNCTIONS
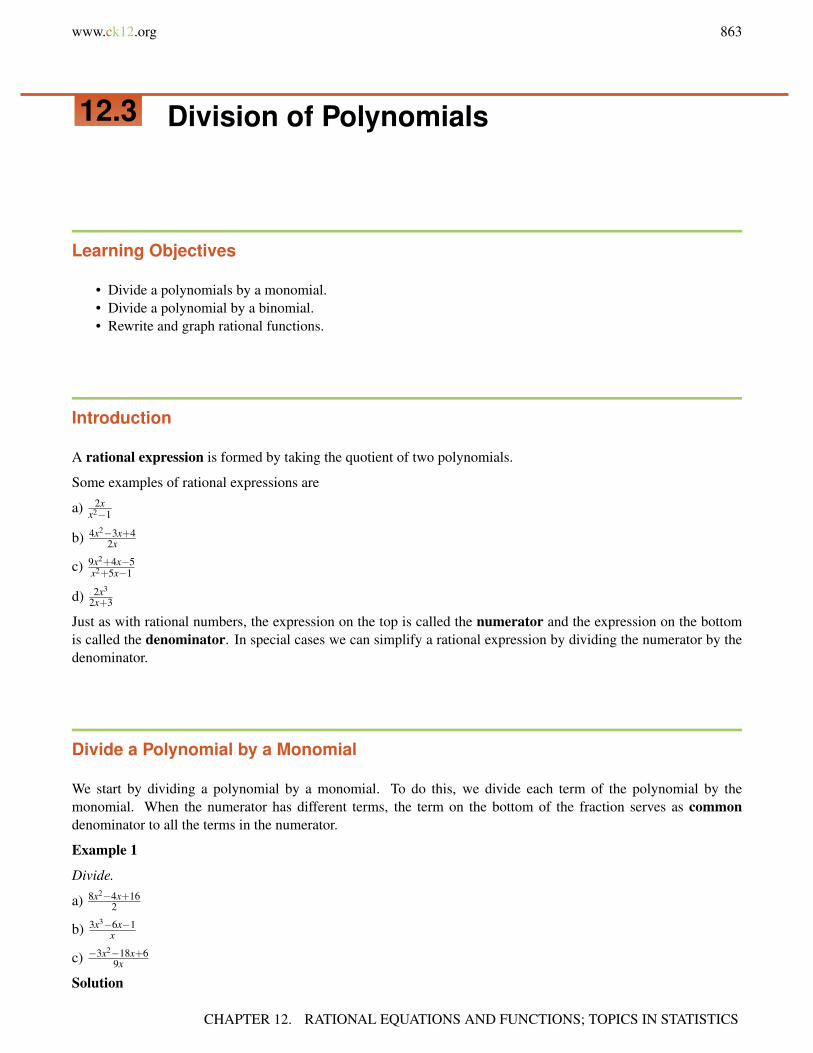
www.ck12.org 863
12.3 Division of Polynomials
Learning Objectives
• Divide a polynomials by a monomial.• Divide a polynomial by a binomial.• Rewrite and graph rational functions.
Introduction
A rational expression is formed by taking the quotient of two polynomials.
Some examples of rational expressions are
a) 2xx2−1
b) 4x2−3x+42x
c) 9x2+4x−5x2+5x−1
d) 2x3
2x+3
Just as with rational numbers, the expression on the top is called the numerator and the expression on the bottomis called the denominator. In special cases we can simplify a rational expression by dividing the numerator by thedenominator.
Divide a Polynomial by a Monomial
We start by dividing a polynomial by a monomial. To do this, we divide each term of the polynomial by themonomial. When the numerator has different terms, the term on the bottom of the fraction serves as commondenominator to all the terms in the numerator.
Example 1
Divide.
a) 8x2−4x+162
b) 3x3−6x−1x
c) −3x2−18x+69x
Solution
CHAPTER 12. RATIONAL EQUATIONS AND FUNCTIONS; TOPICS IN STATISTICS

864 www.ck12.org
8x2−4x+162
=8x2
2− 4x
2+
162
= 4x2−2x+8
3x3−6x−1x
=3x3
x+
6xx− 1
x= 3x2 +6− 1
x−3x2−18x+6
9x=
3x2
9x− 18x
9x+
69x
=− x3−2+
23x
A common error is to cancel the denominator with just one term in the numerator.
Consider the quotient 3x+44
Remember that the denominator of 4 is common to both the terms in the numerator. In other words we are dividingboth of the terms in the numerator by the number 4.
The correct way to simplify is
3x+44
=3x4+
44=
3x4+1
A common mistake is to cross out the number 4 from the numerator and the denominator
Z
ZZZ
3x+44
= 3x
This is incorrect because the term 3x does not get divided by 4 as it should be.
Example 2
Divide 5x3−10x2+x−25−5x2 .
Solution
5x3−10x2 + x−25−5x2 =
5x3
−5x2 −10x2
−5x2 +x−5x2 −
25−5x2
The negative sign in the denominator changes all the signs of the fractions:
−5x3
5x2 +10x2
5x2 −x
5x2 +255x2 =−x+2− 1
5x+
5x2
Divide a Polynomial by a Binomial
We divide polynomials in a similar way that we perform long division with numbers. We will explain the method bydoing an example.
Example 3
Divide x2+4x+5x+3 .
Solution: When we perform division, the expression in the numerator is called the dividend and the expression inthe denominator is called the divisor.
To start the division we rewrite the problem in the following form.
12.3. DIVISION OF POLYNOMIALS
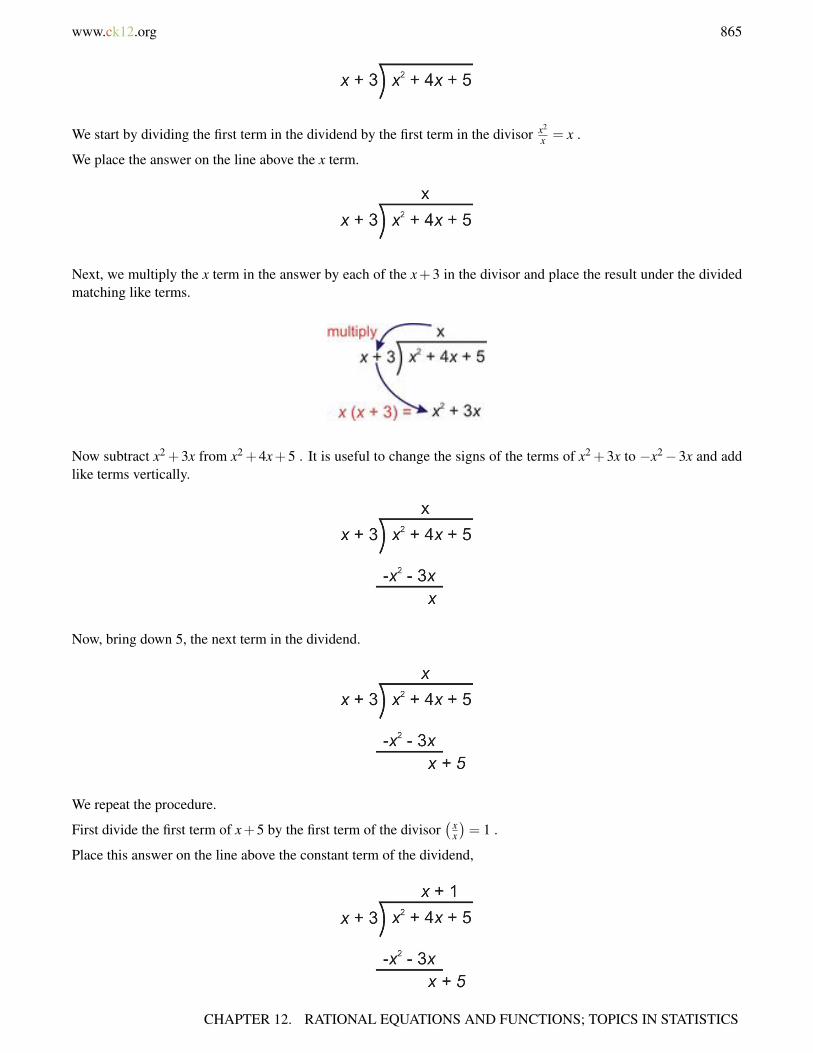
www.ck12.org 865
We start by dividing the first term in the dividend by the first term in the divisor x2
x = x .
We place the answer on the line above the x term.
Next, we multiply the x term in the answer by each of the x+3 in the divisor and place the result under the dividedmatching like terms.
Now subtract x2 +3x from x2 +4x+5 . It is useful to change the signs of the terms of x2 +3x to −x2−3x and addlike terms vertically.
Now, bring down 5, the next term in the dividend.
We repeat the procedure.
First divide the first term of x+5 by the first term of the divisor( x
x
)= 1 .
Place this answer on the line above the constant term of the dividend,
CHAPTER 12. RATIONAL EQUATIONS AND FUNCTIONS; TOPICS IN STATISTICS

866 www.ck12.org
Multiply 1 by the divisor x+3 and write the answer below x+5 matching like terms.
Subtract x+3 from x+5 by changing the signs of x+3 to −x−3 and adding like terms.
Since there are no more terms from the dividend to bring down, we are done.
The answer is x+1 with a remainder of 2.
Remember that for a division with a remainder the answer is quotient+ remainderdivisor
We write our answer as.
x2 +4x+5x+3
= x+1+2
x+3
Check
To check the answer to a long division problem we use the fact that:
divisor ·qiotient+ remainder = divisor
For the problem above here is the check of our solution.
(x+3)(x+1)+2 = x2 +4x+3+2
= x2 +4x+5
The answer checks out.
Example 4
Divide 4x2−25x−21x−7 .
Solution
12.3. DIVISION OF POLYNOMIALS

www.ck12.org 867
Answer 4x2−25x−21x−7 = 4x+3
Check (4x+3)(x−7)+0 = 4x2−25x−21 . The answer checks out.
Rewrite and Graph Rational Functions
In the last section we saw how to find vertical and horizontal asymptotes. Remember that the horizontal asymptoteshows the value of y that the function approaches for large values of x . Let’s review the method for finding horizontalasymptotes and see how it is related to polynomial division.
We can look at different types of rational functions.
Case 1 The polynomial in the numerator has a lower degree than the polynomial in the denominator. Take forexample, y = 2
x−1
We see that we cannot divide 2 by x−1 and y approaches zero because the number in the denominator is bigger thanthe number in the numerator for large values of x .
The horizontal asymptote is y = 0 .
Case 2 The polynomial in the numerator has the same degree as the polynomial in the denominator. Take forexample, y = 3x+2
x−1
In this case, we can divide the two polynomials and obtain.
The quotient is y = 3+ 5x−1 .
Because the number in the denominator of the remainder is bigger than the number in the numerator of the remainder,the reminder will approach zero for large values of x leaving only the 3, thus y will approach the value of 3 for largevalues of x .
The horizontal asymptote is y = 3 .
Case 3 The polynomial in the numerator has a degree that is one more than the polynomial in the denominator. Takefor example, y = 4x2+3x+2
x−1 .
CHAPTER 12. RATIONAL EQUATIONS AND FUNCTIONS; TOPICS IN STATISTICS

868 www.ck12.org
The quotient is: y = 4x+7+ 9x−1 .
The remainder approaches the value of zero for large values of x and the function y approaches the straight liney = 4x+ 7 .When the rational function approaches a straight line for large values of x , we say that the rationalfunction has an oblique asymptote. (Sometimes oblique asymptotes are also called slant asymptotes). The obliqueasymptote is y = 4x+7 .
Case 4 The polynomial in the numerator has a degree that in two or more than the degree in the denominator. Forexample, y = x3
x−1 .
In this case the polynomial has no horizontal or oblique asymptotes.
Example 5
Find the horizontal or oblique asymptotes of the following rational functions.
a) y = 3x2
x2+4
b) y = x−13x2−6
c) y = x4+1x−5
d) y = x3−3x2+4x−1x2−2
Solution
a) We can perform the division
The answer to the division is y = 3− 12x2+4
There is a horizontal asymptote at y = 3 .
b) We cannot divide the two polynomials.
There is a horizontal asymptote at y = 0 .
c) The power of the numerator is 3 more than the power of the denominator. There are no horizontal or obliqueasymptotes.
d) We can perform the division
12.3. DIVISION OF POLYNOMIALS
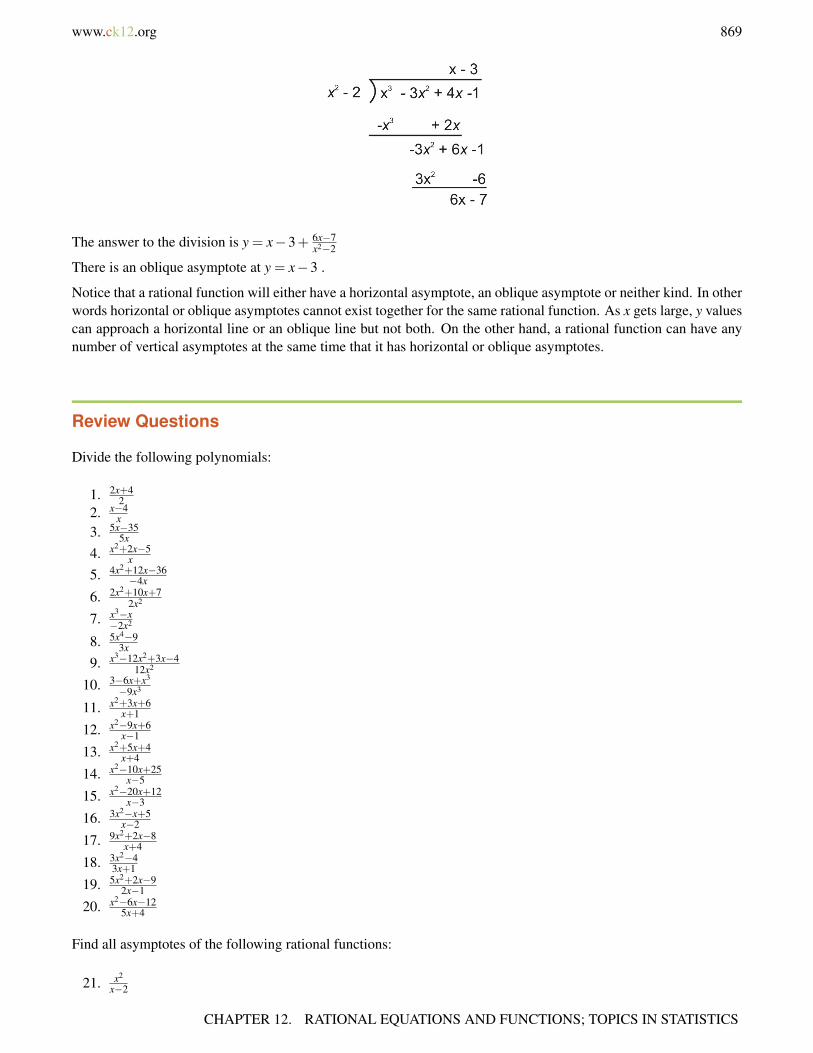
www.ck12.org 869
The answer to the division is y = x−3+ 6x−7x2−2
There is an oblique asymptote at y = x−3 .
Notice that a rational function will either have a horizontal asymptote, an oblique asymptote or neither kind. In otherwords horizontal or oblique asymptotes cannot exist together for the same rational function. As x gets large, y valuescan approach a horizontal line or an oblique line but not both. On the other hand, a rational function can have anynumber of vertical asymptotes at the same time that it has horizontal or oblique asymptotes.
Review Questions
Divide the following polynomials:
1. 2x+42
2. x−4x
3. 5x−355x
4. x2+2x−5x
5. 4x2+12x−36−4x
6. 2x2+10x+72x2
7. x3−x−2x2
8. 5x4−93x
9. x3−12x2+3x−412x2
10. 3−6x+x3
−9x3
11. x2+3x+6x+1
12. x2−9x+6x−1
13. x2+5x+4x+4
14. x2−10x+25x−5
15. x2−20x+12x−3
16. 3x2−x+5x−2
17. 9x2+2x−8x+4
18. 3x2−43x+1
19. 5x2+2x−92x−1
20. x2−6x−125x+4
Find all asymptotes of the following rational functions:
21. x2
x−2
CHAPTER 12. RATIONAL EQUATIONS AND FUNCTIONS; TOPICS IN STATISTICS

870 www.ck12.org
22. 1x+4
23. x2−1x2+1
24. x−4x2−9
25. x2+2x+13x+4
26. x3+14x−1
27. x−x3
x2−6x−7
28. x4−2x8x+24
Graph the following rational functions. Indicate all asymptotes on the graph:
29. x2
x+2
30. x3−1x2−4
31. x2+12x−4
32. x−x2
3x+2
Review Answers
1. x+22. 1− 4
x3. 1− 7
x4. x+2− 5
x5. −x−3+ 9
x6. 1+ 5
x +7
2x2
7. − x2 +
12x
8. 5x3
3 −3x
9. x12 −1+ 1
4x −1
3x2
10. − 13x3 +
23x2 − 1
911. x+2+ 4
x+112. x−8− 2
x−113. x+114. x−515. x−17− 39
x−316. 3x+5+ 15
x−217. 9x−34+ 128
x+418. x− 1
3 −11
3(3x+1)
19. 52 x+ 9
4 −27
4(2x−1)
20. 15 x− 34
25 −164
25(5x+4)21. vertical: x = 2 , oblique: y = x22. vertical: x =−4 , horizontal: y = 023. horizontal: y = 124. vertical: x = 3,x =−3, horizontal: y = 025. vertical: x = −4
3 , oblique: y = x3 +
29
26. vertical: x = 14
27. vertical: x = 7,x =−1, oblique: y =−x−628. vertical: x =−3
12.3. DIVISION OF POLYNOMIALS
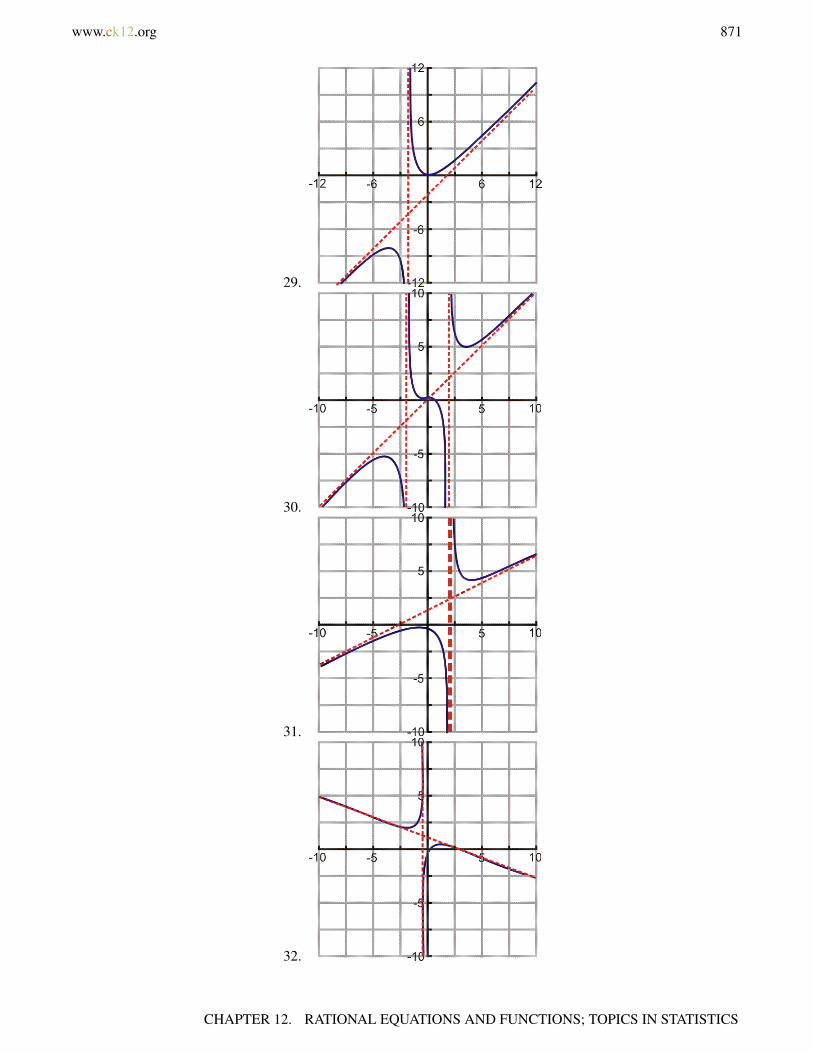
www.ck12.org 871
29.
30.
31.
32.
CHAPTER 12. RATIONAL EQUATIONS AND FUNCTIONS; TOPICS IN STATISTICS
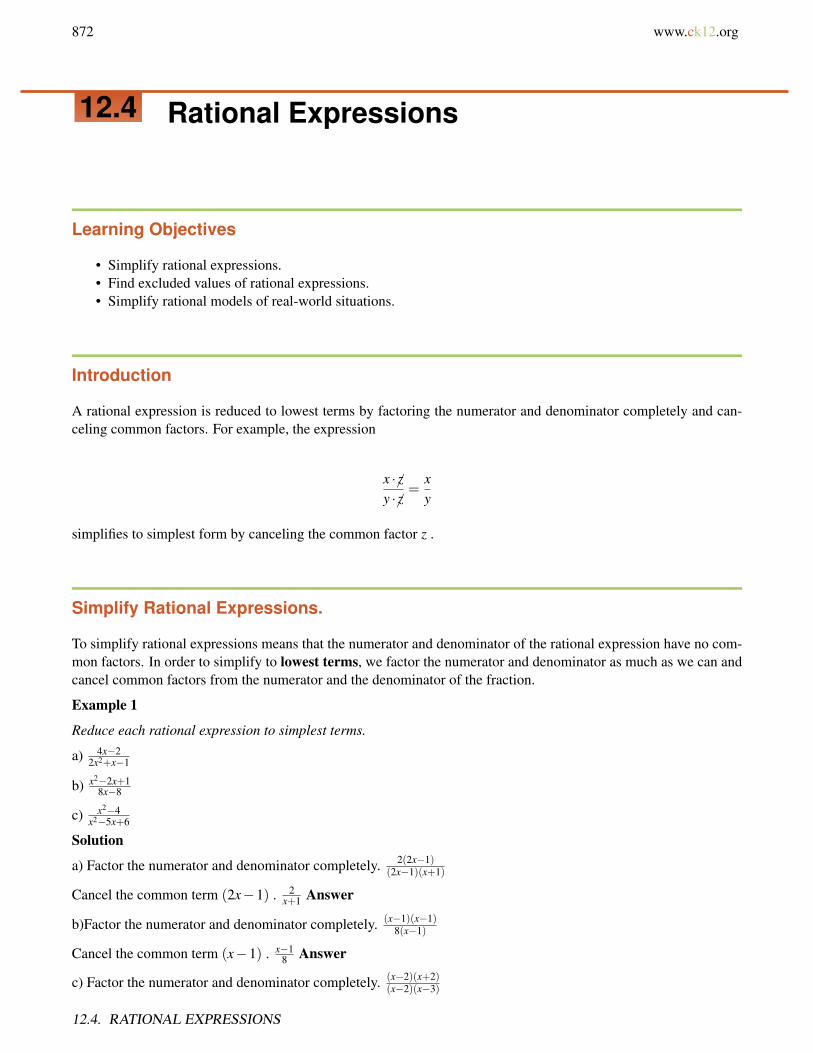
872 www.ck12.org
12.4 Rational Expressions
Learning Objectives
• Simplify rational expressions.• Find excluded values of rational expressions.• Simplify rational models of real-world situations.
Introduction
A rational expression is reduced to lowest terms by factoring the numerator and denominator completely and can-celing common factors. For example, the expression
x ·zy ·z
=xy
simplifies to simplest form by canceling the common factor z .
Simplify Rational Expressions.
To simplify rational expressions means that the numerator and denominator of the rational expression have no com-mon factors. In order to simplify to lowest terms, we factor the numerator and denominator as much as we can andcancel common factors from the numerator and the denominator of the fraction.
Example 1
Reduce each rational expression to simplest terms.
a) 4x−22x2+x−1
b) x2−2x+18x−8
c) x2−4x2−5x+6
Solution
a) Factor the numerator and denominator completely. 2(2x−1)(2x−1)(x+1)
Cancel the common term (2x−1) . 2x+1 Answer
b)Factor the numerator and denominator completely. (x−1)(x−1)8(x−1)
Cancel the common term (x−1) . x−18 Answer
c) Factor the numerator and denominator completely. (x−2)(x+2)(x−2)(x−3)
12.4. RATIONAL EXPRESSIONS
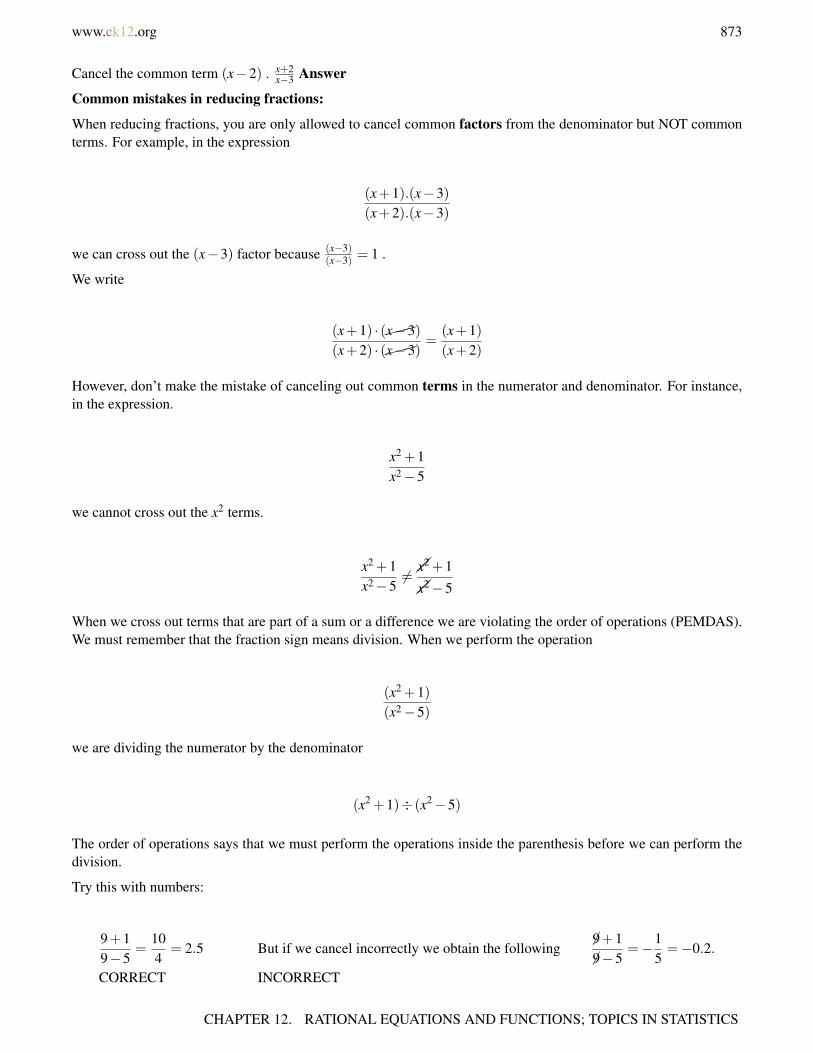
www.ck12.org 873
Cancel the common term (x−2) . x+2x−3 Answer
Common mistakes in reducing fractions:
When reducing fractions, you are only allowed to cancel common factors from the denominator but NOT commonterms. For example, in the expression
(x+1).(x−3)(x+2).(x−3)
we can cross out the (x−3) factor because (x−3)(x−3) = 1 .
We write
(x+1) · (x−3)(x+2) · (x−3)
=(x+1)(x+2)
However, don’t make the mistake of canceling out common terms in the numerator and denominator. For instance,in the expression.
x2 +1x2−5
we cannot cross out the x2 terms.
x2 +1x2−5
6=x2 +1
x2−5
When we cross out terms that are part of a sum or a difference we are violating the order of operations (PEMDAS).We must remember that the fraction sign means division. When we perform the operation
(x2 +1)(x2−5)
we are dividing the numerator by the denominator
(x2 +1)÷ (x2−5)
The order of operations says that we must perform the operations inside the parenthesis before we can perform thedivision.
Try this with numbers:
9+19−5
=104
= 2.5 But if we cancel incorrectly we obtain the following 9+19−5
=−15=−0.2.
CORRECT INCORRECT
CHAPTER 12. RATIONAL EQUATIONS AND FUNCTIONS; TOPICS IN STATISTICS

874 www.ck12.org
Find Excluded Values of Rational Expressions
Whenever a variable expression is present in the denominator of a fraction, we must be aware of the possibility thatthe denominator could be zero. Since division by zero is undefined, certain values of the variable must be excluded.These values are the vertical asymptotes (i.e. values that cannot exist for x ). For example, in the expression
( 2x−3
),
the value of x = 3 must be excluded.
To find the excluded values we simply set the denominator equal to zero and solve the resulting equation.
Example 2
Find the excluded values of the following expressions.
a) xx+4
b) 2x+1x2−x−6
c) 4x2−5x
Solution
a) When we set the denominator equal to zero we obtain. x+4 = 0⇒ x =−4 is the excluded value
b) When we set the denominator equal to zero we obtain. x2− x−6 = 0
Solve by factoring. (x−3)(x+2) = 0
⇒ x = 3 and x =−2 are the excluded values.
c) When we set the denominator equal to zero we obtain. x2−5x = 0
Solve by factoring. x(x−5) = 0
⇒ x = 0 and x = 5 are the excluded values.
Removable Zeros
Notice that in the expressions in Example 1, we removed a division by zero when we simplified the problem. Forinstance,
4x−22x2 + x−1
was rewritten as
2(2x−1)(2x−1)(x+1)
.
This expression experiences division by zero when x = 12 and x =−1 .
However, when we cancel common factors, we simplify the expression to 2x+1 . The reduced form allows the value
x = 12 . We thus removed a division by zero and the reduced expression has only x = −1 as the excluded value.
Technically the original expression and the simplified expression are not the same. When we simplify to simplestform we should specify the removed excluded value. Thus,
4x−22x2 + x−1
=2
x+1,x 6= 1
2
12.4. RATIONAL EXPRESSIONS
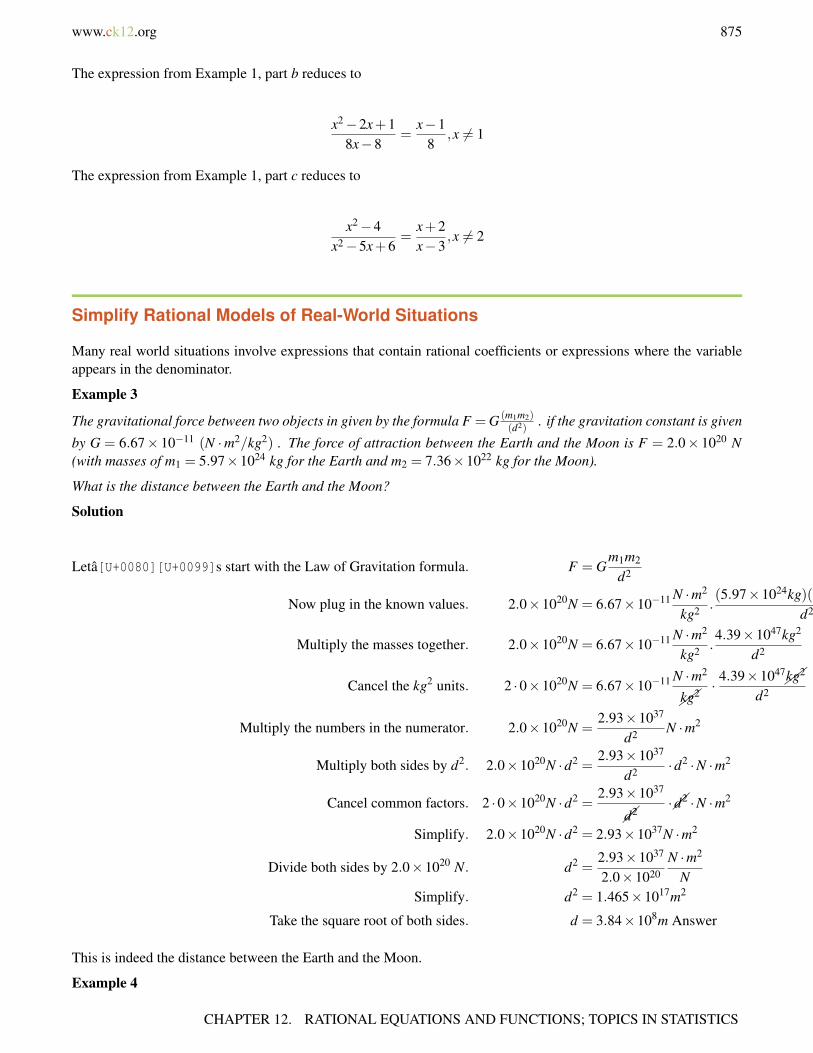
www.ck12.org 875
The expression from Example 1, part b reduces to
x2−2x+18x−8
=x−1
8,x 6= 1
The expression from Example 1, part c reduces to
x2−4x2−5x+6
=x+2x−3
,x 6= 2
Simplify Rational Models of Real-World Situations
Many real world situations involve expressions that contain rational coefficients or expressions where the variableappears in the denominator.
Example 3
The gravitational force between two objects in given by the formula F =G (m1m2)(d2)
. if the gravitation constant is given
by G = 6.67× 10⁻¹¹ (N ·m2/kg2) . The force of attraction between the Earth and the Moon is F = 2.0× 10²⁰ N(with masses of m1 = 5.97×1024 kg for the Earth and m2 = 7.36×10²² kg for the Moon).
What is the distance between the Earth and the Moon?
Solution
Letâ[U+0080][U+0099]s start with the Law of Gravitation formula. F = Gm1m2
d2
Now plug in the known values. 2.0×10²⁰N = 6.67×10⁻¹¹ N ·m2
kg2 .(5.97×1024kg)(7.36×10²²kg)
d2
Multiply the masses together. 2.0×10²⁰N = 6.67×10⁻¹¹ N ·m2
kg2 .4.39×1047kg2
d2
Cancel the kg2 units. 2 ·0×1020N = 6.67×10⁻¹¹ N ·m2
kg2 ·
4.39×1047kg2
d2
Multiply the numbers in the numerator. 2.0×10²⁰N =2.93×1037
d2 N ·m2
Multiply both sides by d2. 2.0×10²⁰N ·d2 =2.93×1037
d2 ·d2 ·N ·m2
Cancel common factors. 2 ·0×1020N ·d2 =2.93×1037
d2·d2 ·N ·m2
Simplify. 2.0×10²⁰N ·d2 = 2.93×1037N ·m2
Divide both sides by 2.0×10²⁰ N. d2 =2.93×1037
2.0×10²⁰N ·m2
NSimplify. d2 = 1.465×10¹⁷m2
Take the square root of both sides. d = 3.84×10⁸m Answer
This is indeed the distance between the Earth and the Moon.
Example 4
CHAPTER 12. RATIONAL EQUATIONS AND FUNCTIONS; TOPICS IN STATISTICS

876 www.ck12.org
The area of a circle is given by A = πr2 and the circumference of a circle is given by C = 2πr . Find the ratio of thecircumference and area of the circle.
Solution
The ratio of the circumference and area of the circle is: 2πrπr2
We cancel common factors from the numerator and denominator. 2πRπR2
R
Simplify. 2r Answer
Example 5
The height of a cylinder is 2 units more than its radius. Find the ratio of the surface area of the cylinder to its volume.
Solution
Define variables.
Let R = the radius of the base of the cylinder.
Then, R+2 = the height of the cylinder
To find the surface area of a cylinder, we need to add the areas of the top and bottom circle and the area of the curvedsurface.
12.4. RATIONAL EXPRESSIONS
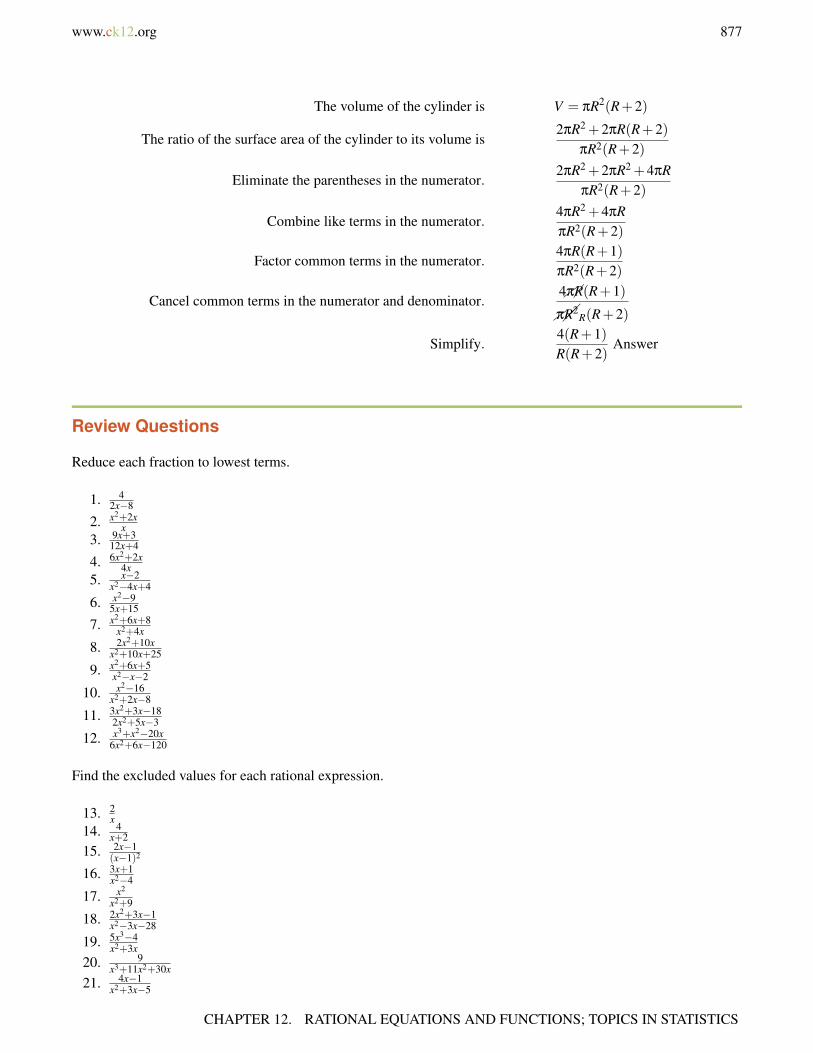
www.ck12.org 877
The volume of the cylinder is V = πR2(R+2)
The ratio of the surface area of the cylinder to its volume is2πR2 +2πR(R+2)
πR2(R+2)
Eliminate the parentheses in the numerator.2πR2 +2πR2 +4πR
πR2(R+2)
Combine like terms in the numerator.4πR2 +4πRπR2(R+2)
Factor common terms in the numerator.4πR(R+1)πR2(R+2)
Cancel common terms in the numerator and denominator.4πR(R+1)
πR2R(R+2)
Simplify.4(R+1)R(R+2)
Answer
Review Questions
Reduce each fraction to lowest terms.
1. 42x−8
2. x2+2xx
3. 9x+312x+4
4. 6x2+2x4x
5. x−2x2−4x+4
6. x2−95x+15
7. x2+6x+8x2+4x
8. 2x2+10xx2+10x+25
9. x2+6x+5x2−x−2
10. x2−16x2+2x−8
11. 3x2+3x−182x2+5x−3
12. x3+x2−20x6x2+6x−120
Find the excluded values for each rational expression.
13. 2x
14. 4x+2
15. 2x−1(x−1)2
16. 3x+1x2−4
17. x2
x2+9
18. 2x2+3x−1x2−3x−28
19. 5x3−4x2+3x
20. 9x3+11x2+30x
21. 4x−1x2+3x−5
CHAPTER 12. RATIONAL EQUATIONS AND FUNCTIONS; TOPICS IN STATISTICS
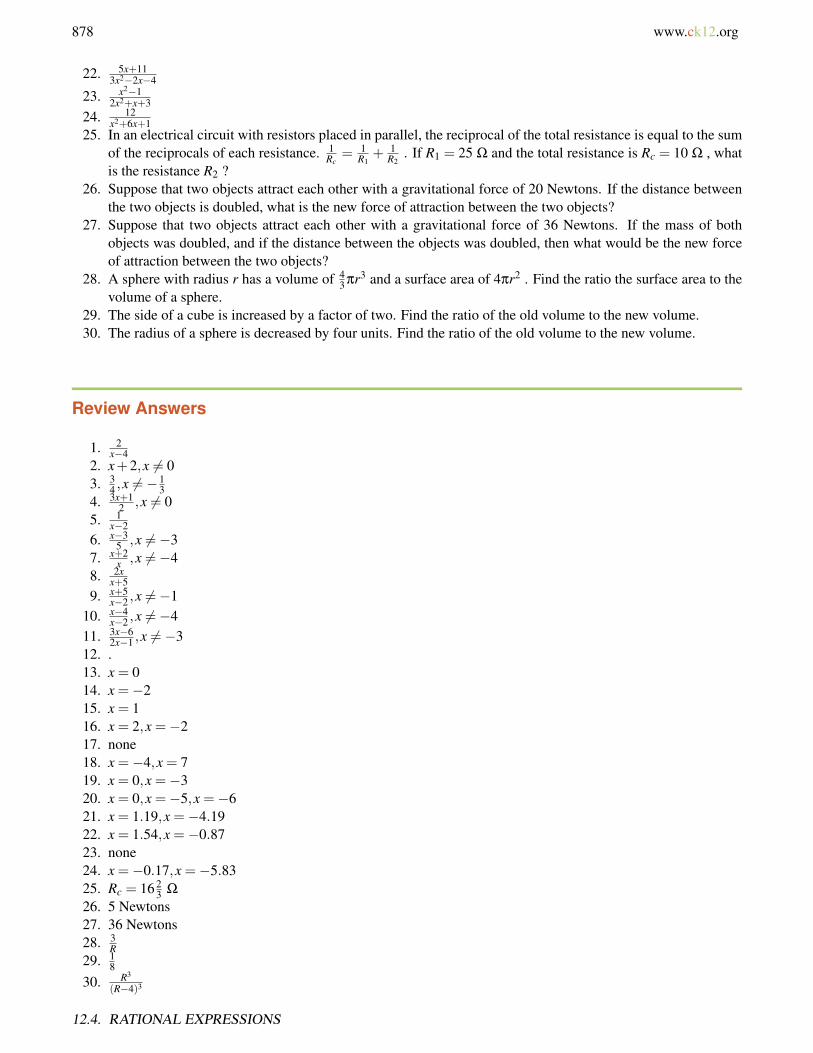
878 www.ck12.org
22. 5x+113x2−2x−4
23. x2−12x2+x+3
24. 12x2+6x+1
25. In an electrical circuit with resistors placed in parallel, the reciprocal of the total resistance is equal to the sumof the reciprocals of each resistance. 1
Rc= 1
R1+ 1
R2. If R1 = 25 Ω and the total resistance is Rc = 10 Ω , what
is the resistance R2 ?26. Suppose that two objects attract each other with a gravitational force of 20 Newtons. If the distance between
the two objects is doubled, what is the new force of attraction between the two objects?27. Suppose that two objects attract each other with a gravitational force of 36 Newtons. If the mass of both
objects was doubled, and if the distance between the objects was doubled, then what would be the new forceof attraction between the two objects?
28. A sphere with radius r has a volume of 43 πr3 and a surface area of 4πr2 . Find the ratio the surface area to the
volume of a sphere.29. The side of a cube is increased by a factor of two. Find the ratio of the old volume to the new volume.30. The radius of a sphere is decreased by four units. Find the ratio of the old volume to the new volume.
Review Answers
1. 2x−4
2. x+2,x 6= 03. 3
4 ,x 6=−13
4. 3x+12 ,x 6= 0
5. 1x−2
6. x−35 ,x 6=−3
7. x+2x ,x 6=−4
8. 2xx+5
9. x+5x−2 ,x 6=−1
10. x−4x−2 ,x 6=−4
11. 3x−62x−1 ,x 6=−3
12. .13. x = 014. x =−215. x = 116. x = 2,x =−217. none18. x =−4,x = 719. x = 0,x =−320. x = 0,x =−5,x =−621. x = 1.19,x =−4.1922. x = 1.54,x =−0.8723. none24. x =−0.17,x =−5.8325. Rc = 16 2
3 Ω
26. 5 Newtons27. 36 Newtons28. 3
R29. 1
8
30. R3
(R−4)3
12.4. RATIONAL EXPRESSIONS
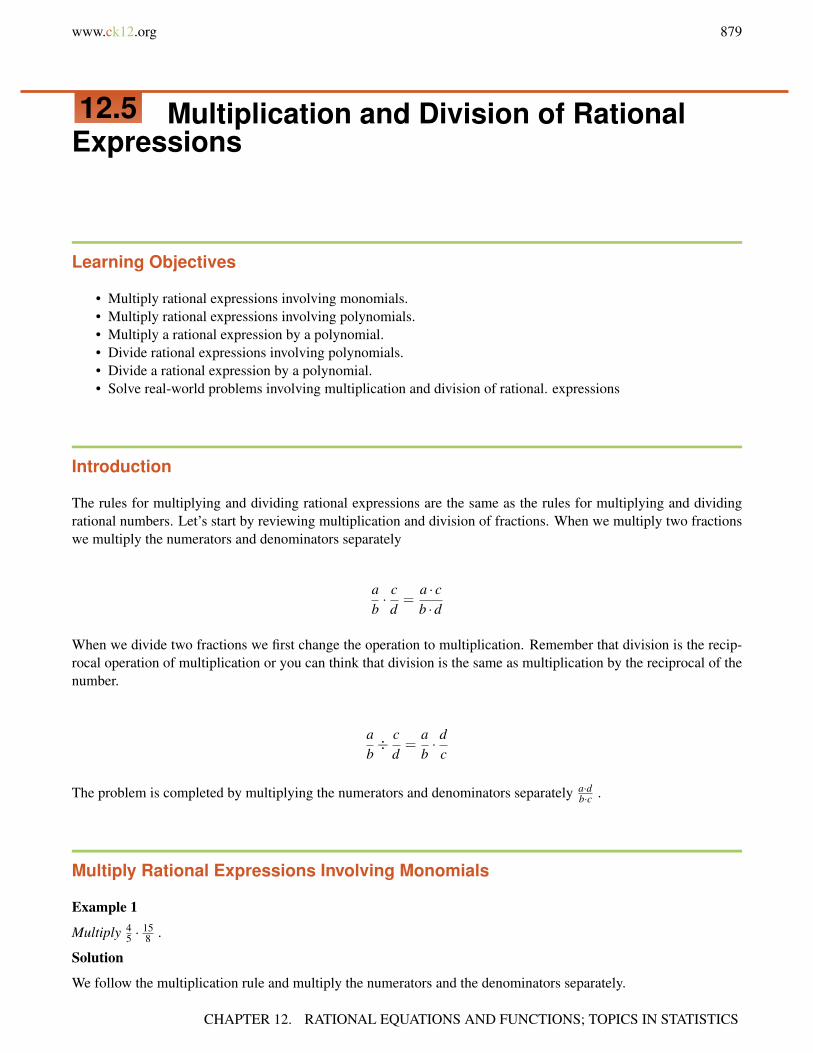
www.ck12.org 879
12.5 Multiplication and Division of RationalExpressions
Learning Objectives
• Multiply rational expressions involving monomials.• Multiply rational expressions involving polynomials.• Multiply a rational expression by a polynomial.• Divide rational expressions involving polynomials.• Divide a rational expression by a polynomial.• Solve real-world problems involving multiplication and division of rational. expressions
Introduction
The rules for multiplying and dividing rational expressions are the same as the rules for multiplying and dividingrational numbers. Let’s start by reviewing multiplication and division of fractions. When we multiply two fractionswe multiply the numerators and denominators separately
ab· c
d=
a · cb ·d
When we divide two fractions we first change the operation to multiplication. Remember that division is the recip-rocal operation of multiplication or you can think that division is the same as multiplication by the reciprocal of thenumber.
ab÷ c
d=
ab· d
c
The problem is completed by multiplying the numerators and denominators separately a·db·c .
Multiply Rational Expressions Involving Monomials
Example 1
Multiply 45 ·
158 .
Solution
We follow the multiplication rule and multiply the numerators and the denominators separately.
CHAPTER 12. RATIONAL EQUATIONS AND FUNCTIONS; TOPICS IN STATISTICS
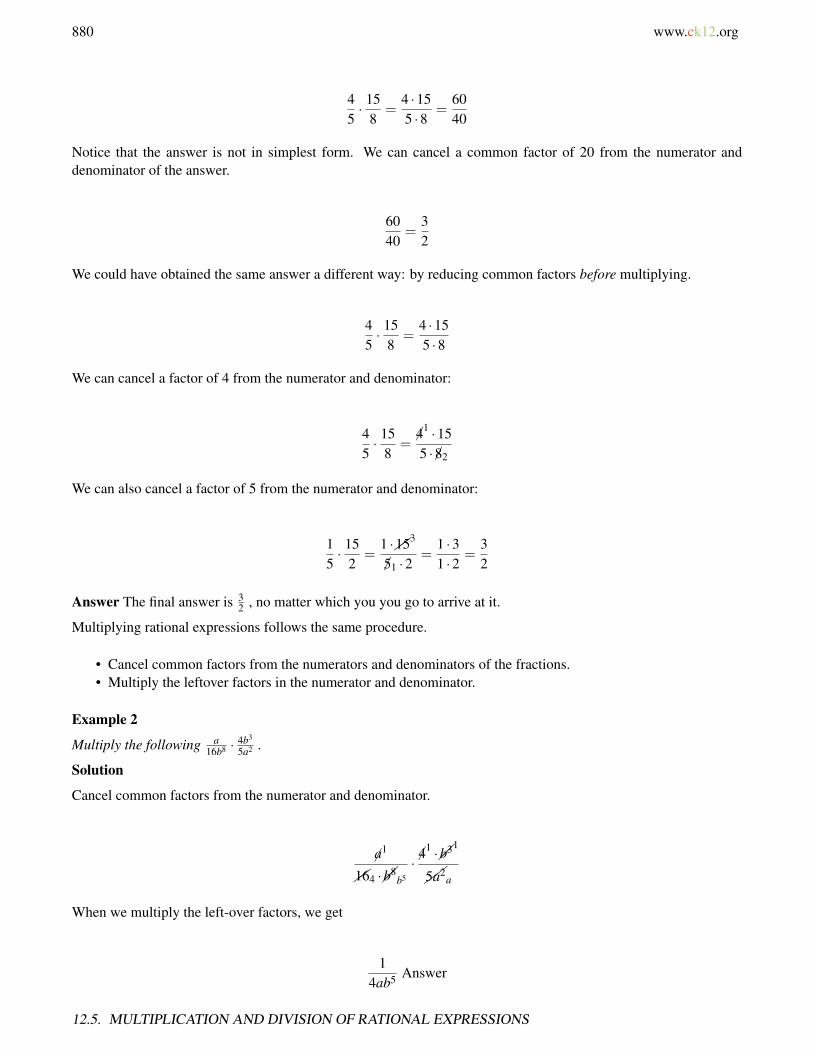
880 www.ck12.org
45· 15
8=
4 ·155 ·8
=6040
Notice that the answer is not in simplest form. We can cancel a common factor of 20 from the numerator anddenominator of the answer.
6040
=32
We could have obtained the same answer a different way: by reducing common factors before multiplying.
45· 15
8=
4 ·155 ·8
We can cancel a factor of 4 from the numerator and denominator:
45· 15
8=4
1 ·155 · 82
We can also cancel a factor of 5 from the numerator and denominator:
15· 15
2=
1 ·153
51 ·2=
1 ·31 ·2
=32
Answer The final answer is 32 , no matter which you you go to arrive at it.
Multiplying rational expressions follows the same procedure.
• Cancel common factors from the numerators and denominators of the fractions.• Multiply the leftover factors in the numerator and denominator.
Example 2
Multiply the following a16b8 · 4b3
5a2 .
Solution
Cancel common factors from the numerator and denominator.
a1
164 ·b8b5
· 41 ·b31
5a2
a
When we multiply the left-over factors, we get
14ab5 Answer
12.5. MULTIPLICATION AND DIVISION OF RATIONAL EXPRESSIONS
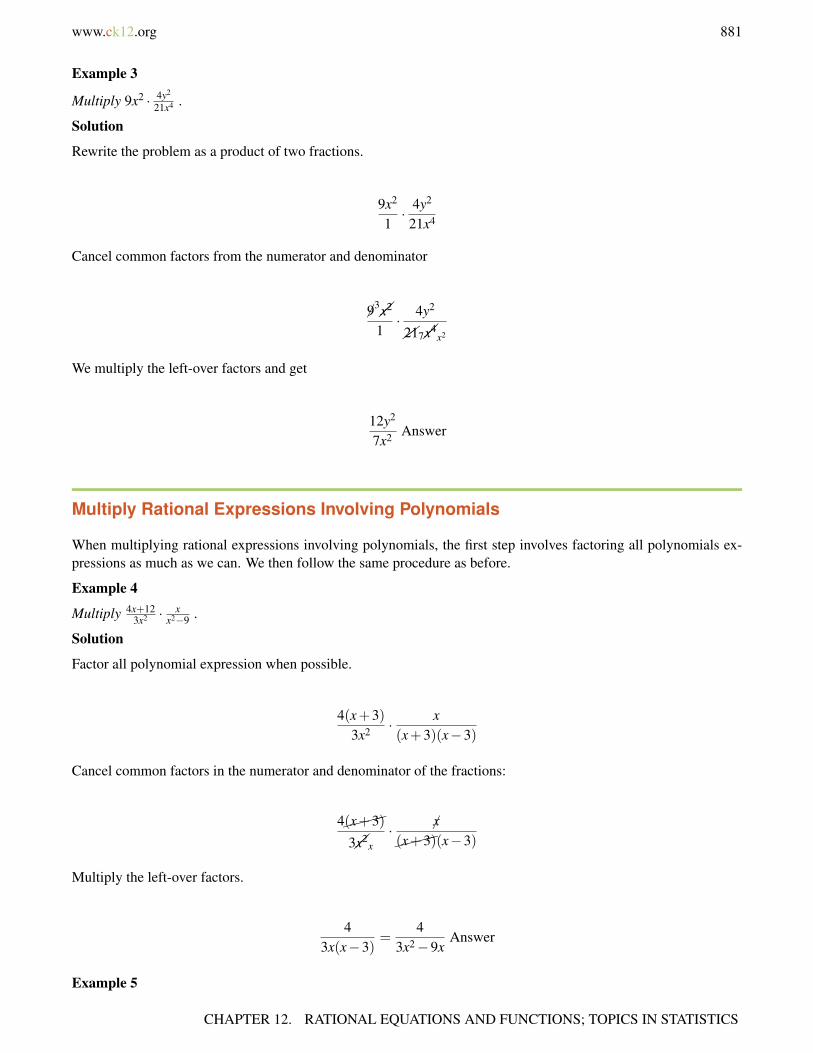
www.ck12.org 881
Example 3
Multiply 9x2 · 4y2
21x4 .
Solution
Rewrite the problem as a product of two fractions.
9x2
1· 4y2
21x4
Cancel common factors from the numerator and denominator
93x2
1· 4y2
217x4x2
We multiply the left-over factors and get
12y2
7x2 Answer
Multiply Rational Expressions Involving Polynomials
When multiplying rational expressions involving polynomials, the first step involves factoring all polynomials ex-pressions as much as we can. We then follow the same procedure as before.
Example 4
Multiply 4x+123x2 · x
x2−9 .
Solution
Factor all polynomial expression when possible.
4(x+3)3x2 · x
(x+3)(x−3)
Cancel common factors in the numerator and denominator of the fractions:
4(x+3)
3x2x· x
(x+3)(x−3)
Multiply the left-over factors.
43x(x−3)
=4
3x2−9xAnswer
Example 5
CHAPTER 12. RATIONAL EQUATIONS AND FUNCTIONS; TOPICS IN STATISTICS
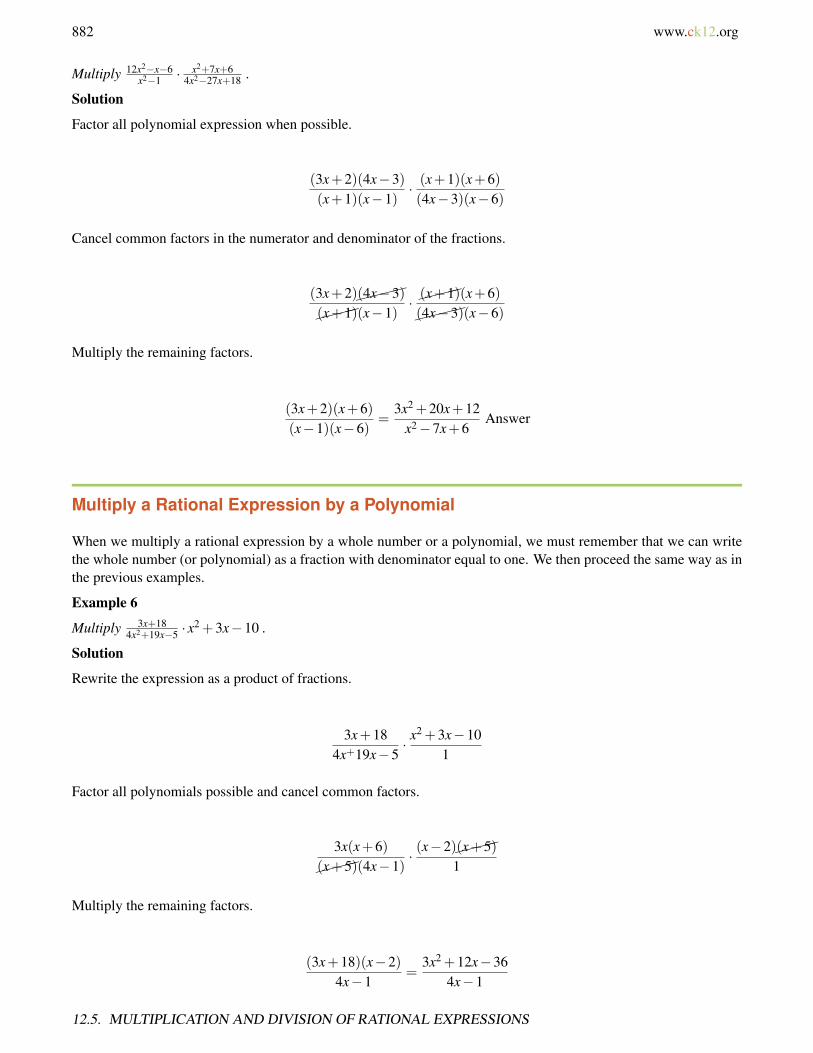
882 www.ck12.org
Multiply 12x2−x−6x2−1 · x2+7x+6
4x2−27x+18 .
Solution
Factor all polynomial expression when possible.
(3x+2)(4x−3)(x+1)(x−1)
· (x+1)(x+6)(4x−3)(x−6)
Cancel common factors in the numerator and denominator of the fractions.
(3x+2)(4x−3)
(x+1)(x−1)
· (x+1)(x+6)
(4x−3)(x−6)
Multiply the remaining factors.
(3x+2)(x+6)(x−1)(x−6)
=3x2 +20x+12
x2−7x+6Answer
Multiply a Rational Expression by a Polynomial
When we multiply a rational expression by a whole number or a polynomial, we must remember that we can writethe whole number (or polynomial) as a fraction with denominator equal to one. We then proceed the same way as inthe previous examples.
Example 6
Multiply 3x+184x2+19x−5 · x
2 +3x−10 .
Solution
Rewrite the expression as a product of fractions.
3x+184x+19x−5
· x2 +3x−10
1
Factor all polynomials possible and cancel common factors.
3x(x+6)
(x+5)(4x−1)· (x−2)(x+5)
1
Multiply the remaining factors.
(3x+18)(x−2)4x−1
=3x2 +12x−36
4x−1
12.5. MULTIPLICATION AND DIVISION OF RATIONAL EXPRESSIONS

www.ck12.org 883
Divide Rational Expressions Involving Polynomials
Since division is the reciprocal of the multiplication operation, we first rewrite the division problem as a multiplica-tion problem and then proceed with the multiplication as outlined in the previous example.
Note: Remember that ab ÷
cd = a
b ·dc . The first fraction remains the same and you take the reciprical of the second
fraction. Do not fall in the common trap of flipping the first fraction.
Example 7
Divide 4x2
15 ÷6x5 .
Solution
First convert into a multiplication problem by flipping what we are dividing by and then simplify as usual.
42x2x
15· 5
2
6x1=
2 · x ·13 ·3 ·1
=2x9
Example 8
Divide 3x2−15x2x2+3x−14 ÷
x2−252x2+13x+21 .
Solution
First convert into a multiplication problem by flipping what we are dividing by and then simplify as usual.
3x2−15x2x2 +3x−14
· 2x2 +13x+21x2−25
Factor all polynomials and cancel common factors.
3x(x−5)
(2x+7)(x−2)
·(2x+7)(x−2)
(x−5)(x+5)
Multiply the remaining factors.
3x(x+3)(x−2)(x+5)
=3x2 +9x
x2 +3x−10Answer.
Divide a Rational Expression by a Polynomial
When we divide a rational expression by a whole number or a polynomial, we must remember that we can write thewhole number (or polynomial) as a fraction with denominator equal to one. We then proceed the same way as in theprevious examples.
Example 9
Divide 9x2−42x−2 ÷21x2−2x−8 .
Solution
CHAPTER 12. RATIONAL EQUATIONS AND FUNCTIONS; TOPICS IN STATISTICS
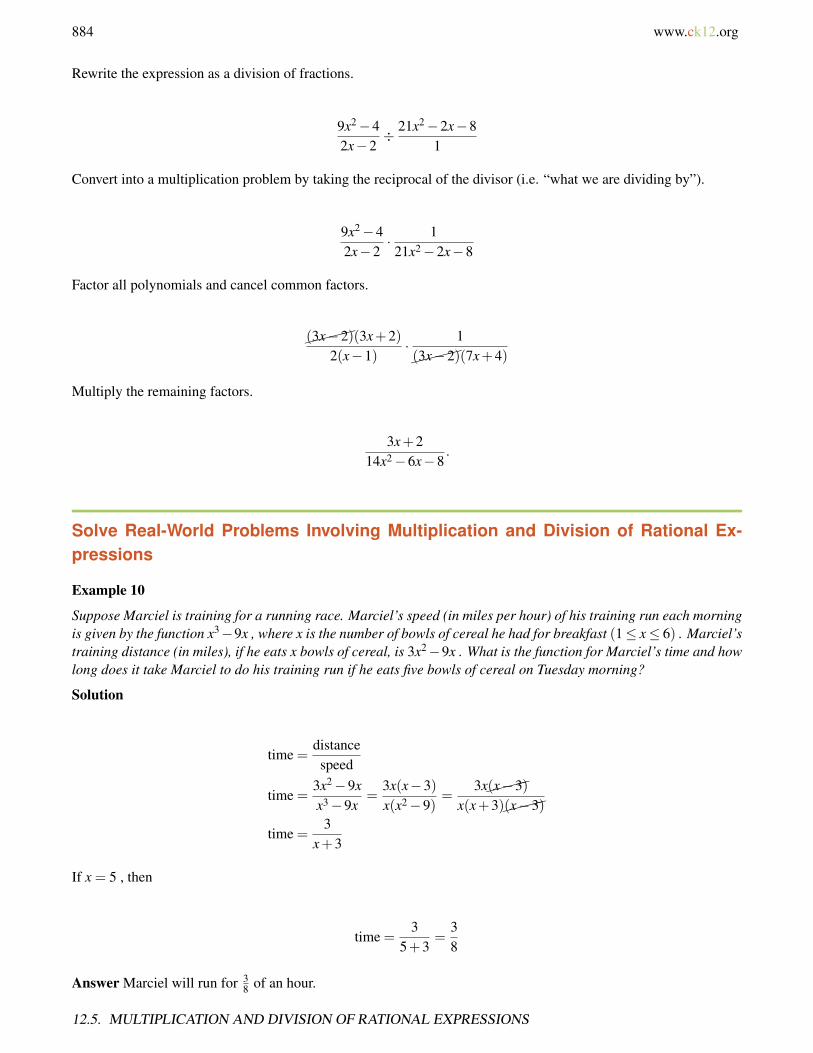
884 www.ck12.org
Rewrite the expression as a division of fractions.
9x2−42x−2
÷ 21x2−2x−81
Convert into a multiplication problem by taking the reciprocal of the divisor (i.e. “what we are dividing by”).
9x2−42x−2
· 121x2−2x−8
Factor all polynomials and cancel common factors.
(3x−2)(3x+2)2(x−1)
· 1
(3x−2)(7x+4)
Multiply the remaining factors.
3x+214x2−6x−8
.
Solve Real-World Problems Involving Multiplication and Division of Rational Ex-pressions
Example 10
Suppose Marciel is training for a running race. Marciel’s speed (in miles per hour) of his training run each morningis given by the function x3−9x , where x is the number of bowls of cereal he had for breakfast (1≤ x≤ 6) . Marciel’straining distance (in miles), if he eats x bowls of cereal, is 3x2−9x . What is the function for Marciel’s time and howlong does it take Marciel to do his training run if he eats five bowls of cereal on Tuesday morning?
Solution
time =distancespeed
time =3x2−9xx3−9x
=3x(x−3)x(x2−9)
=3x(x−3)
x(x+3)(x−3)
time =3
x+3
If x = 5 , then
time =3
5+3=
38
Answer Marciel will run for 38 of an hour.
12.5. MULTIPLICATION AND DIVISION OF RATIONAL EXPRESSIONS

www.ck12.org 885
Review Questions
Perform the indicated operation and reduce the answer to lowest terms
1. x3
2y3 · 2y2
x
2. 2xy÷ 2x2
y
3. 2xy2 · 4y
5x
4. 2xy · 2y2
x3
5. 4y2−1y2−9 ·
y−32y−1
6. 6aba2 · a3b
3b2
7. x2
x−1 ÷x
x2+x−2
8. 33a2
−5 ·20
11a3
9. a2+2ab+b2
ab2−a2b ÷ (a+b)
10. 2x2+2x−24x2+3x · x2+x−6
x+4
11. 3−x3x−5 ÷
x2−92x2−8x−10
12. x2−25x+3 ÷ (x−5)
13. 2x+12x−1 ÷
4x2−11−2x
14. xx−5 ·
x2−8x+15x2−3x
15. 3x2+5x−12x2−9 ÷ 3x−4
3x+4
16. 5x2+16x+336x2−25 · (6x2 +5x)
17. x2+7x+10x2−9 · x2−3x
3x2+4x−4
18. x2+x−12x2+4x+4 ÷
x−3x+2
19. x4−16x2−9 ÷
x2+4x2+6x+9
20. x2+8x+167x2+9x+2 ÷
7x+2x2+4x
21. Maria’s recipe asks for 2 12 times more flour than sugar. How many cups of flour should she mix in if she uses
3 13 cups of sugar?
22. George drives from San Diego to Los Angeles. On the return trip, he increases his driving speed by 15 milesper hour. In terms of his initial speed, by what factor is the driving time decreased on the return trip?
23. Ohm’s Law states that in an electrical circuit I = VRc
. The total resistance for resistors placed in parallel isgiven by 1
Rtot= 1
R1+ 1
R2. Write the formula for the electric current in term of the component resistances: R1
and R2 .
Review Answers
1. x2
y
2. y2
x3. 8
5y
4. 473
x2
5. 2y+1y+3
6. 2a2
7. x2 +2x
CHAPTER 12. RATIONAL EQUATIONS AND FUNCTIONS; TOPICS IN STATISTICS

886 www.ck12.org
8. −12a
9. a+bab2−a2b
10. 2x2−10x+12x
11. −2x2+8x+103x2+4x−15
12. x+5x+3
13. 11−2x
14. 115. 3x+4
x−3
16. 5x3+16x2+3x(6x−5)
17. x2+5x3x2−11x+6
18. x+4x+2
19. x2−4x2−9
20. x+4x2+x
21. 8 13 cups
22. ss+15
23. I = ER1
+ ER2
12.5. MULTIPLICATION AND DIVISION OF RATIONAL EXPRESSIONS
www.ck12.org 887
12.6 Addition and Subtraction of RationalExpressions
Learning Objectives
• Add and subtract rational expressions with the same denominator.• Find the least common denominator of rational expressions.• Add and subtract rational expressions with different denominators.• Solve real-world problems involving addition and subtraction of rational expressions.
Introduction
Like fractions, rational expressions represent a portion of a quantity. Remember that when we add or subtract frac-tions we must first make sure that they have the same denominator. Once the fractions have the same denominator,we combine the different portions by adding or subtracting the numerators and writing that answer over the commondenominator.
Add and Subtract Rational Expressions with the Same Denominator
Fractions with common denominators combine in the following manner.
ac+
bc=
a+bc
andac− b
c=
a−bc
Example 1
Simplify.
a) 87 −
27 +
47
b) 4x2−3x+5 + 2x2−1
x+5
c) x2−2x+12x+3 −
3x2−3x+52x+3
Solution
a) Since the denominators are the same we combine the numerators.
87− 2
7+
47=
8−2+47
=107
Answer
b) Since the denominators are the same we combine the numerators.
CHAPTER 12. RATIONAL EQUATIONS AND FUNCTIONS; TOPICS IN STATISTICS
888 www.ck12.org
4x2−3+2x2−1x+5
Simplify by collecting like terms.
6x2−4x+5
Answer
c) Since the denominators are the same we combine the numerators. Make sure the subtraction sign is distributed toall terms in the second expression.
x2−2x+1− (3x2−3x+5)2x+3
=x2−2x+1−3x2 +3x−5
2x+3
=−2x2 + x−4
2x+3Answer
Find the Least common Denominator of Rational Expressions
To add and subtract fractions with different denominators, we must first rewrite all fractions so that they havethe same denominator. In general, we want to find the least common denominator. To find the least commondenominator, we find the least common multiple (LCM) of the expressions in the denominators of the differentfractions. Remember that the least common multiple of two or more integers is the least positive integer having eachas a factor.
Consider the integers 234, 126 and 273.
To find the least common multiple of these numbers we write each integer as a product of its prime factors.
Here we present a systematic way to find the prime factorization of a number.
• Try the prime numbers, in order, as factors.• Use repeatedly until it is no longer a factor.• Then try the next prime:
234 = 2 ·117
= 2 ·3 ·39
= 2 ·3 ·3 ·13
234 = 2 ·32 ·13
126 = 2 ·63
= 2 ·3 ·21
= 2 ·3 ·3 ·7126 = 2 ·32 ·7
12.6. ADDITION AND SUBTRACTION OF RATIONAL EXPRESSIONS

www.ck12.org 889
273 = 3 ·91
= 3 ·7 ·13
Once we have the prime factorization of each number, the least common multiple of the numbers is the product ofall the different factors taken to the highest power that they appear in any of the prime factorizations. In this case,the factor of two appears at most once, the factor of three appears at most twice, the factor of seven appears at mostonce, the factor of 13 appears at most once. Therefore,
LCM = 2 ·32 ·7 ·13 = 1638 Answer
If we have integers that have no common factors, the least common multiple is just the product of the integers.Consider the integers 12 and 25.
12 = 22 ·3 and 25 = 52
The LCM = 22 ·3 ·52 = 300 , which is just the product of 12 and 25.
The procedure for finding the lowest common multiple of polynomials is similar. We rewrite each polynomial infactored form and we form the LCM by taken each factor to the highest power it appears in any of the separateexpressions.
Example 2
Find the LCM of 48x2y and 60xy3z .
Solution
First rewrite the integers in their prime factorization.
48 = 24 ·360 = 22 ·3 ·5
Therefore, the two expressions can be written as
48x2y = 24 ·3 · x2 · y60xy3z = 22 ·3 ·5 · x · y3 · z
The LCM is found by taking each factor to the highest power that it appears in either expression.
LCM = 24 ·3 ·5 · x2 · y3 · z = 240x2y3z.
Example 3
Find the LCM of 2x2 +8x+8 and x3−4x2−12x .
Solution
CHAPTER 12. RATIONAL EQUATIONS AND FUNCTIONS; TOPICS IN STATISTICS

890 www.ck12.org
Factor the polynomials completely.
2x2 +8x+8 = 2(x2 +4x+4) = 2(x+2)2
x3−4x2−12x = x(x2−4x−12) = x(x−6)(x+2)
The LCM is found by taking each factor to the highest power that it appears in either expression.
LCM = 2x(x+2)2(x−6) Answer
It is customary to leave the LCM in factored form because this form is useful in simplifying rational expressions andfinding any excluded values.
Example 4
Find the LCM of x2−25 and x2 +3x+2 .
Solution
Factor the polynomials completely:
x2−25 = (x+5)(x−5)
x2 +3x+2 = (x+2)(x+1)
Since the two expressions have no common factors, the LCM is just the product of the two expressions.
LCM = (x+5)(x−5)(x+2)(x+1) Answer
Add and Subtract Rational Expressions with Different Denominators
Now we are ready to add and subtract rational expressions. We use the following procedure.
a. Find the least common denominator (LCD) of the fractions.b. Express each fraction as an equivalent fraction with the LCD as the denominator.c. Add or subtract and simplify the result.
Example 5
Add 412 +
518 .
Solution
We can write the denominators in their prime factorization 12= 22 ·3 and 18= 2 ·32 . The least common denominatorof the fractions is the LCM of the two numbers: 22 ·32 = 36 . Now we need to rewrite each fraction as an equivalentfraction with the LCD as the denominator.
For the first fraction. 12 needs to be multiplied by a factor of 3 in order to change it into the LCD, so we multiplythe numerator and the denominator by 3.
12.6. ADDITION AND SUBTRACTION OF RATIONAL EXPRESSIONS
www.ck12.org 891
412· 3
3=
1236
For the section fraction. 18 needs to be multiplied by a factor of 2 in order to change it into the LCD, so wemultiply the numerator and the denominator by 2.
518· 2
2=
1036
Once the denominators of the two fractions are the same we can add the numerators.
1236
+1036
=2236
The answer can be reduced by canceling a common factor of 2.
1236
+1036
=2236
=1118
Answer
Example 6
Perform the following operation and simplify.
2x+2
− 32x−5
Solution
The denominators cannot be factored any further, so the LCD is just the product of the separate denominators.
LCD = (x+2)(2x−5)
The first fraction needs to be multiplied by the factor (2x−5) and the second fraction needs to be multiplied by thefactor (x+2) .
2x+2
· (2x−5)(2x−5)
− 32x−5
· (x+2)(x+2)
We combine the numerators and simplify.
2(2x−5)−3(x+2)(x+2)(2x−5)
=4x−10−3x−6(x+2)(2x−5)
Combine like terms in the numerator.
CHAPTER 12. RATIONAL EQUATIONS AND FUNCTIONS; TOPICS IN STATISTICS
892 www.ck12.org
x−16(x+2)(2x−5)
Answer
Example 8
Perform the following operation and simplify.
4xx−5
− 3x5− x
Solution
Notice that the denominators are almost the same. They differ by a factor of -1.
Factor (a−1) from the second denominator.
4xx−5
− 3x−(x−5)
The two negative signs in the second fraction cancel.
4xx−5
+3x
(x−5)
Since the denominators are the same we combine the numerators.
7xx−5
Answer
Example 9
Perform the following operation and simplify.
2x−1x2−6x+9
− 3x+4x2−9
Solution
We factor the denominators.
2x−1(x−3)2 −
3x+4(x+3)(x−3)
The LCD is the product of all the different factors taken to the highest power they have in either denominator.LCD = (x−3)2(x+3) .
The first fraction needs to be multiplied by a factor of (x+ 3) and the second fraction needs to be multiplied by afactor of (x−3) .
12.6. ADDITION AND SUBTRACTION OF RATIONAL EXPRESSIONS
www.ck12.org 893
2x−1(x−3)2 ·
(x+3)(x+3)
− 3x+4(x+3)(x−3)
· (x−3)(x−3)
Combine the numerators.
(2x−1)(x+3)− (3x+4)(x−3)(x−3)2(x+3)
Eliminate all parentheses in the numerator.
2x2 +5x−3− (3x2−5x−12)(x−3)2(x+3)
Distribute the negative sign in the second parenthesis.
2x2 +5x−3−3x2 +5x+12(x−3)2(x+3)
Combine like terms in the numerator.
−x2 +10x+9(x−3)2(x+3)
Answer
Solve Real-World Problems Involving Addition and Subtraction of Rational Expres-sions
Example 9
In an electrical circuit with two resistors placed in parallel, the reciprocal of the total resistance is equal to the sumof the reciprocals of each resistance 1
Rtot= 1
R1+ 1
R2. Find an expression for the total resistance in a circuit with two
resistors wired in parallel.
Solution
The expression for the relationship between total resistance and resistances placed in parallel says that the reciprocalof the total resistance is the sum of the reciprocals of the individual resistances.
Let’s simplify the expression 1R1
+ 1R2
.
The lowest common denominator is
= R1R2
Multiply the first fraction by R2R2
and the second fraction by R1R1
.
CHAPTER 12. RATIONAL EQUATIONS AND FUNCTIONS; TOPICS IN STATISTICS

894 www.ck12.org
R2
R2· 1
R1+
R1
R1· 1
R2
Simplify.
R2 +R1
R1R2
Therefore, the total resistance is the reciprocal of this expression.
Rc =R1R2
R1 +R2Answer
Number Problems
These problems express the relationship between two numbers.
Example 11
The sum of a number and its reciprocal is 5314 . Find the numbers.
Solution
1. Define variables.
Let x = a number
Then, 1x is the reciprocal of the number
2. Set up an equation.
The equation that describes the relationship between the numbers is: x+ 1x = 53
14
3. Solve the equation.
Find the lowest common denominator.
LCM = 14x
Multiply all terms by 14x
14x · x+14x · 1x= 14x · 53
14
Cancel common factors in each term.
14x · x+14x ·1
x=14x · 53
14
Simplify.
14x2 +14 = 53x
12.6. ADDITION AND SUBTRACTION OF RATIONAL EXPRESSIONS
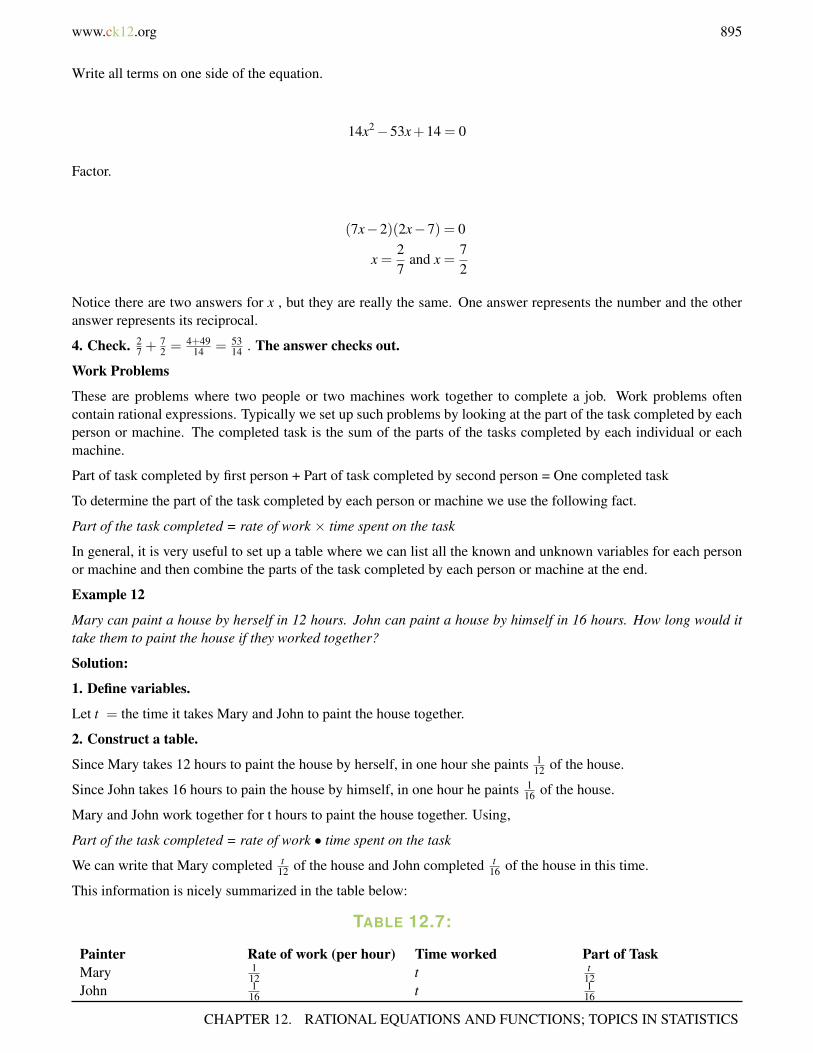
www.ck12.org 895
Write all terms on one side of the equation.
14x2−53x+14 = 0
Factor.
(7x−2)(2x−7) = 0
x =27
and x =72
Notice there are two answers for x , but they are really the same. One answer represents the number and the otheranswer represents its reciprocal.
4. Check. 27 +
72 = 4+49
14 = 5314 . The answer checks out.
Work Problems
These are problems where two people or two machines work together to complete a job. Work problems oftencontain rational expressions. Typically we set up such problems by looking at the part of the task completed by eachperson or machine. The completed task is the sum of the parts of the tasks completed by each individual or eachmachine.
Part of task completed by first person + Part of task completed by second person = One completed task
To determine the part of the task completed by each person or machine we use the following fact.
Part of the task completed = rate of work × time spent on the task
In general, it is very useful to set up a table where we can list all the known and unknown variables for each personor machine and then combine the parts of the task completed by each person or machine at the end.
Example 12
Mary can paint a house by herself in 12 hours. John can paint a house by himself in 16 hours. How long would ittake them to paint the house if they worked together?
Solution:
1. Define variables.
Let t = the time it takes Mary and John to paint the house together.
2. Construct a table.
Since Mary takes 12 hours to paint the house by herself, in one hour she paints 112 of the house.
Since John takes 16 hours to pain the house by himself, in one hour he paints 116 of the house.
Mary and John work together for t hours to paint the house together. Using,
Part of the task completed = rate of work • time spent on the task
We can write that Mary completed t12 of the house and John completed t
16 of the house in this time.
This information is nicely summarized in the table below:
TABLE 12.7:
Painter Rate of work (per hour) Time worked Part of TaskMary 1
12 t t12
John 116 t 1
16
CHAPTER 12. RATIONAL EQUATIONS AND FUNCTIONS; TOPICS IN STATISTICS
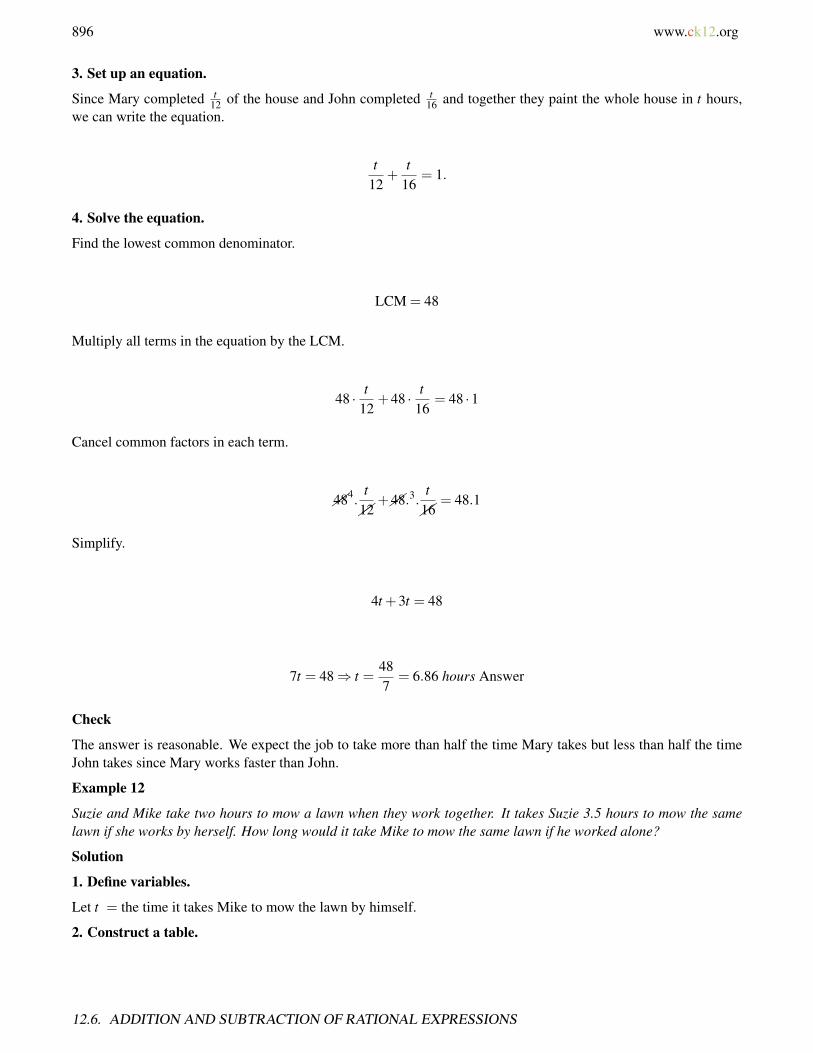
896 www.ck12.org
3. Set up an equation.
Since Mary completed t12 of the house and John completed t
16 and together they paint the whole house in t hours,we can write the equation.
t12
+t
16= 1.
4. Solve the equation.
Find the lowest common denominator.
LCM = 48
Multiply all terms in the equation by the LCM.
48 · t12
+48 · t16
= 48 ·1
Cancel common factors in each term.
484.t12
+48.3.t16
= 48.1
Simplify.
4t +3t = 48
7t = 48⇒ t =487
= 6.86 hours Answer
Check
The answer is reasonable. We expect the job to take more than half the time Mary takes but less than half the timeJohn takes since Mary works faster than John.
Example 12
Suzie and Mike take two hours to mow a lawn when they work together. It takes Suzie 3.5 hours to mow the samelawn if she works by herself. How long would it take Mike to mow the same lawn if he worked alone?
Solution
1. Define variables.
Let t = the time it takes Mike to mow the lawn by himself.
2. Construct a table.
12.6. ADDITION AND SUBTRACTION OF RATIONAL EXPRESSIONS
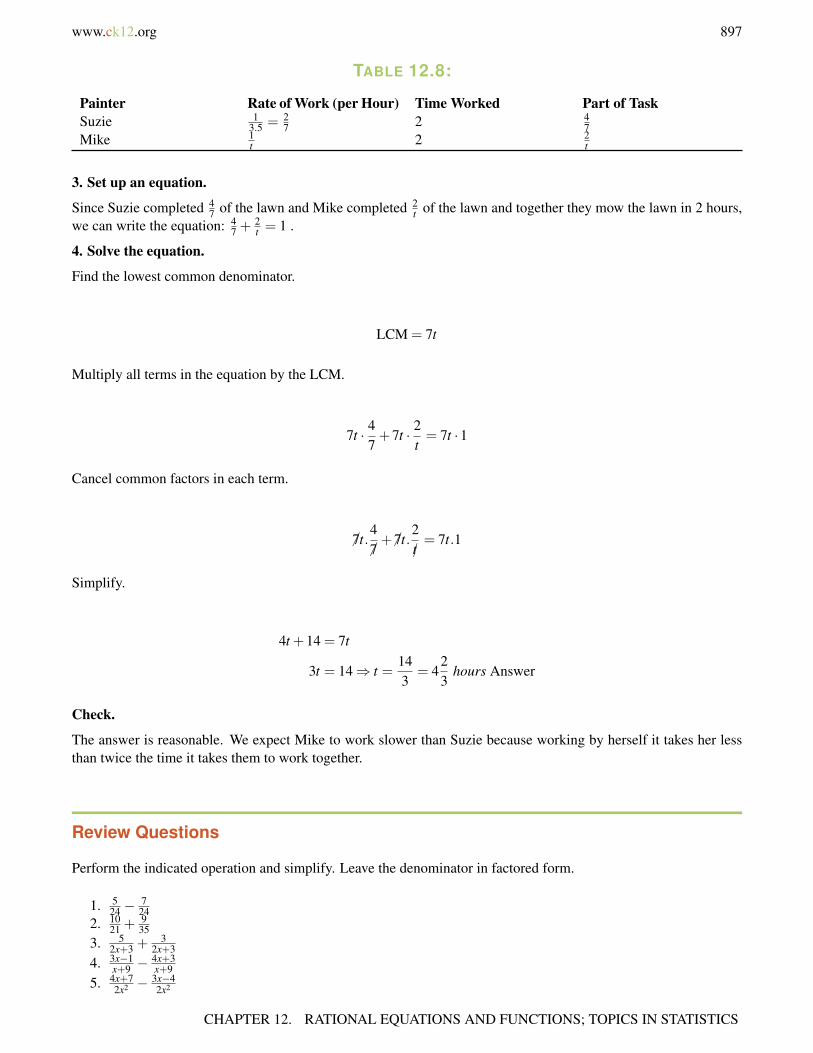
www.ck12.org 897
TABLE 12.8:
Painter Rate of Work (per Hour) Time Worked Part of TaskSuzie 1
3.5 = 27 2 4
7Mike 1
t 2 2t
3. Set up an equation.
Since Suzie completed 47 of the lawn and Mike completed 2
t of the lawn and together they mow the lawn in 2 hours,we can write the equation: 4
7 +2t = 1 .
4. Solve the equation.
Find the lowest common denominator.
LCM = 7t
Multiply all terms in the equation by the LCM.
7t · 47+7t · 2
t= 7t ·1
Cancel common factors in each term.
7t.47+ 7t.
2
t= 7t.1
Simplify.
4t +14 = 7t
3t = 14⇒ t =143
= 423
hours Answer
Check.
The answer is reasonable. We expect Mike to work slower than Suzie because working by herself it takes her lessthan twice the time it takes them to work together.
Review Questions
Perform the indicated operation and simplify. Leave the denominator in factored form.
1. 524 −
724
2. 1021 +
935
3. 52x+3 +
32x+3
4. 3x−1x+9 −
4x+3x+9
5. 4x+72x2 − 3x−4
2x2
CHAPTER 12. RATIONAL EQUATIONS AND FUNCTIONS; TOPICS IN STATISTICS
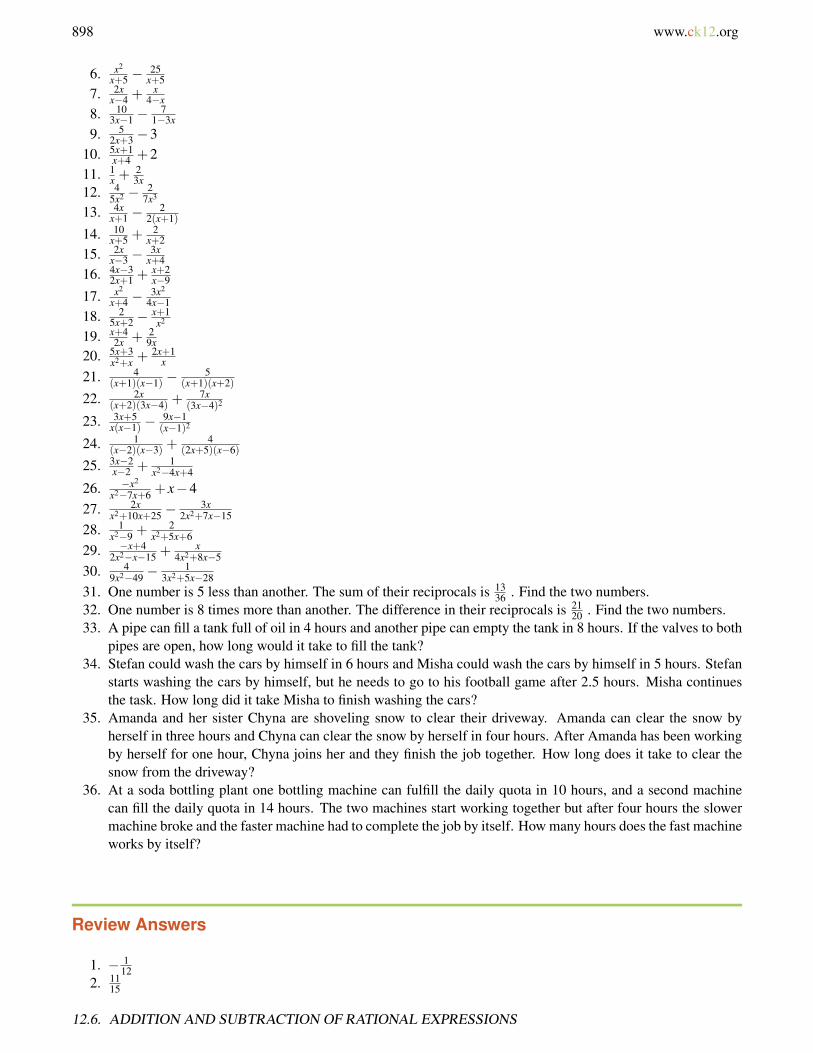
898 www.ck12.org
6. x2
x+5 −25
x+57. 2x
x−4 +x
4−x8. 10
3x−1 −7
1−3x9. 5
2x+3 −310. 5x+1
x+4 +211. 1
x +23x
12. 45x2 − 2
7x3
13. 4xx+1 −
22(x+1)
14. 10x+5 +
2x+2
15. 2xx−3 −
3xx+4
16. 4x−32x+1 +
x+2x−9
17. x2
x+4 −3x2
4x−118. 2
5x+2 −x+1x2
19. x+42x + 2
9x20. 5x+3
x2+x +2x+1
x21. 4
(x+1)(x−1) −5
(x+1)(x+2)
22. 2x(x+2)(3x−4) +
7x(3x−4)2
23. 3x+5x(x−1) −
9x−1(x−1)2
24. 1(x−2)(x−3) +
4(2x+5)(x−6)
25. 3x−2x−2 + 1
x2−4x+4
26. −x2
x2−7x+6 + x−427. 2x
x2+10x+25 −3x
2x2+7x−1528. 1
x2−9 +2
x2+5x+629. −x+4
2x2−x−15 +x
4x2+8x−530. 4
9x2−49 −1
3x2+5x−2831. One number is 5 less than another. The sum of their reciprocals is 13
36 . Find the two numbers.32. One number is 8 times more than another. The difference in their reciprocals is 21
20 . Find the two numbers.33. A pipe can fill a tank full of oil in 4 hours and another pipe can empty the tank in 8 hours. If the valves to both
pipes are open, how long would it take to fill the tank?34. Stefan could wash the cars by himself in 6 hours and Misha could wash the cars by himself in 5 hours. Stefan
starts washing the cars by himself, but he needs to go to his football game after 2.5 hours. Misha continuesthe task. How long did it take Misha to finish washing the cars?
35. Amanda and her sister Chyna are shoveling snow to clear their driveway. Amanda can clear the snow byherself in three hours and Chyna can clear the snow by herself in four hours. After Amanda has been workingby herself for one hour, Chyna joins her and they finish the job together. How long does it take to clear thesnow from the driveway?
36. At a soda bottling plant one bottling machine can fulfill the daily quota in 10 hours, and a second machinecan fill the daily quota in 14 hours. The two machines start working together but after four hours the slowermachine broke and the faster machine had to complete the job by itself. How many hours does the fast machineworks by itself?
Review Answers
1. − 112
2. 1115
12.6. ADDITION AND SUBTRACTION OF RATIONAL EXPRESSIONS
www.ck12.org 899
3. 82x+3
4. −x−4x+9
5. x=112x2
6. x−57. x
x−48. 17
3x−19. −6x−4
2x+310. 7x+9
x+411. 5
3x12. 28x−10
35x3
13. 4x−1x+1
14. 12x+30(x+5)(x+2)
15. −x2+17x(x−3)(x+4)
16. 6x2−34x+19(2x+1)(x−9)
17. x3−13x2
(x+4)(4x−1)
18. −3x2+7x+2x2(5x+2)
19. 9x+4018x
20. 2x2+8x+4x(x+1)
21. −x+13(x+1)(x−1)(x+2)
22. 13x2+6x(x+2)(3x−4)2
23. −6x2+3x−5x(x−1)2
24. 6x2−17x−6(x−2)(x−3)(2x+5)(x−6)
25. 3x2−8x+5(x−2)2
26. −11x2=34x−24(x−6)(x−1)
27. x2−21x(2x−3)(x+5)2
28. 3x−4(x−3)(x+3)(x+2)
29. −x2+4x=4(2x+5)(x−3)(2x−1)
30. x+9(3x+7)(3x−7)(x+4)
31. x = 4,x+5 = 4 or x =−4513 ,x+5 = 20
1332. x = 5
6 ,8x = 203
33. 8 hours34. 2 hours and 55 minutes35. 1 1
7 hours , or 1 hour 9 minutes36. 3 1
7 hours
CHAPTER 12. RATIONAL EQUATIONS AND FUNCTIONS; TOPICS IN STATISTICS

900 www.ck12.org
12.7 Solutions of Rational Equations
Learning Objectives
• Solve rational equations using cross products.• Solve rational equations using lowest common denominators.• Solve real-world problems with rational equations.
Introduction
A rational equation is one that contains rational expressions. It can be an equation that contains rational coefficientsor an equation that contains rational terms where the variable appears in the denominator.
An example of the first kind of equation is 35 x+ 1
2 = 4 .
An example of the second kind of equation is xx−1 +1 = 4
2x+3 .
The first aim in solving a rational equation is to eliminate all denominators. In this way, we can change a rationalequation to a polynomial equation which we can solve with the methods we have learned this far.
Solve Rational Equations Using Cross Products
A rational equation that contains two terms is easily solved by the method of cross products or cross multiplication.Consider the following equation.
x5=
x+12
Our first goal is to eliminate the denominators of both rational expressions. In order to remove the five from thedenominator of the first fraction, we multiply both sides of the equation by five:
5 ·x5=
x+12·5
Now, we remove the 2 from the denominator of the second fraction by multiplying both sides of the equation by two.
2 · x = 5(x+1)2
2
The equation simplifies to 2x = 5(x+1) .
12.7. SOLUTIONS OF RATIONAL EQUATIONS

www.ck12.org 901
2x = 5x+⇒ x =−53
Answer
Notice that when we remove the denominators from the rational expressions we end up multiplying the numeratoron one side of the equal sign with the denominator of the opposite fraction.
Once again, we obtain the simplified equation: 2x = 5(x+1) , whose solution is x =−53
We check the answer by plugging the answer back into the original equation.
Check
On the left-hand side, if x =−53 , then we have
x5=−535
=−13
On the right hand side, we have
x+12
=−53+1
2=−232
=−13
Since the two expressions are equal, the answer checks out.
Example 1
Solve the equation 2x−2 = 3
x+3 .
Solution
Use cross-multiplication to eliminate the denominators of both fractions.
The equation simplifies to
2(x+3) = 3(x−2)
Simplify.
2x+6 = 3x−6
x = 12
Check.
CHAPTER 12. RATIONAL EQUATIONS AND FUNCTIONS; TOPICS IN STATISTICS
902 www.ck12.org
2x−2
=2
12−2=
210
=15
3x+3
=3
12+3=
315
=15
The answer checks out.
Example 2
Solve the equation 23x+4 = 5
x .
Solution
Cross-multiply.
The equation simplifies to
2x2 = 5(x+4)
Simplify.
2x2 = 5x+20
Move all terms to one side of the equation.
2x2−5x−20 = 0
Notice that this equation has a degree of two, that is, it is a quadratic equation. We can solve it using the quadraticformula.
x = 5±√
1854 ⇒ x≈−2.15 or x≈ 4.65
Answer
It is important to check the answer in the original equation when the variable appears in any denominator of theequation because the answer might be an excluded value of any of the rational expression. If the answer obtainedmakes any denominator equal to zero, that value is not a solution to the equation.
Check:
First we check x =−2.15 by substituting it in the original equations. On the left hand side we get the following.
2xx+4
=2(−2.15)−2.15+4
−4.301.85
=−2.3
Now, check on the right hand side.
12.7. SOLUTIONS OF RATIONAL EQUATIONS

www.ck12.org 903
5x=
5−2.15
=−2.3
Thus, 2.15 checks out.
For x = 4.65 we repeat the procedure.
2xx+4
=2(4.65)4.65+4
= 1.08.
5x=
54.65
= 1.08.
4.65 also checks out.
Solve Rational Equations Using the Lowest Common Denominators
An alternate way of eliminating the denominators in a rational equation is to multiply all terms in the equation bythe lowest common denominator. This method is suitable even when there are more than two terms in the equation.
Example 3
Solve 3x35 = x2
5 −1
21 .
Solution
Find the lowest common denominator:
LCM = 105
Multiply each term by the LCD.
105 · 3x35
= 105 · x2
5−105 · 1
21
Cancel common factors.
1053.3x35
=10521.x2 5
5−105.
121
The equation simplifies to
9x = 21x2−5
Move all terms to one side of the equation.
21x2−9x−5 = 0
CHAPTER 12. RATIONAL EQUATIONS AND FUNCTIONS; TOPICS IN STATISTICS

904 www.ck12.org
Solve using the quadratic formula.
x =9±√
50142
x≈−0.32 or x≈ 0.75 Answer
Check
We use the substitution x =−0.32 .
3x35
=3(−0.32)
35=−0.27
x2
5− 1
24=
(−0.32)2
5− 1
21=−.027. The answer checks out.
Now we check the solution x = 0.75 .
3x35
=3(0.75)
35= 0.64
x2
5− 1
21(0.75)2
5− 1
21= .064. The answer checks out.
Example 4
Solve 3x+2 −
4x=5 = 2
x2−3x−10 .
Solution
Factor all denominators.
3x+2
− 4x−5
− 2(x+2)(x−5)
Find the lowest common denominator.
LCM = (x+2)(x−5)
Multiply all terms in the equation by the LCM.
(x+2)(x−5) · 3x+2
− (x+2)(x−5) · 4x−5
= (x+2)(x−5) · 2(x+2)(x−5)
Cancel the common terms.
(x+2)(x−5) · 3
x+2− (x+2)(x−5) · 4
x−5=
(x+2)(x−5) · 2
(x+2)(x−5)
12.7. SOLUTIONS OF RATIONAL EQUATIONS

www.ck12.org 905
The equation simplifies to
3(x−5)−4(x+2) = 2
Simplify.
3x−15−4x−8 = 2
x =−25 Answer
Check.
3x+2
− 4x−5
=3
−25+2− 4−25−5
= 0.003
2x2−3x−10
=2
(−25)2−3(−25)−10= 0.003
The answer checks out.
Example 5
Solve 2x2x+1 +
xx+4 = 1 .
Solution
Find the lowest common denominator.
LCM = (2x+1)(x+4)
Multiply all terms in the equation by the LCM.
(2x+1)(x+4) · 2x2x+1
+(2x+1)(x+4) · xx+4
= (2x+1)(x+4)
Cancel all common terms.
(2x+1)(x+4) · 2x
2x+1+(2x+1)(x+4) · x
x+4= (2x+1)(x+4)
The simplified equation is
2x(x+4)+ x(2x+1) = (2x+1)(x+4)
Eliminate parentheses.
2x2 +8x+2x2 + x = 2x2 +9x+4
CHAPTER 12. RATIONAL EQUATIONS AND FUNCTIONS; TOPICS IN STATISTICS
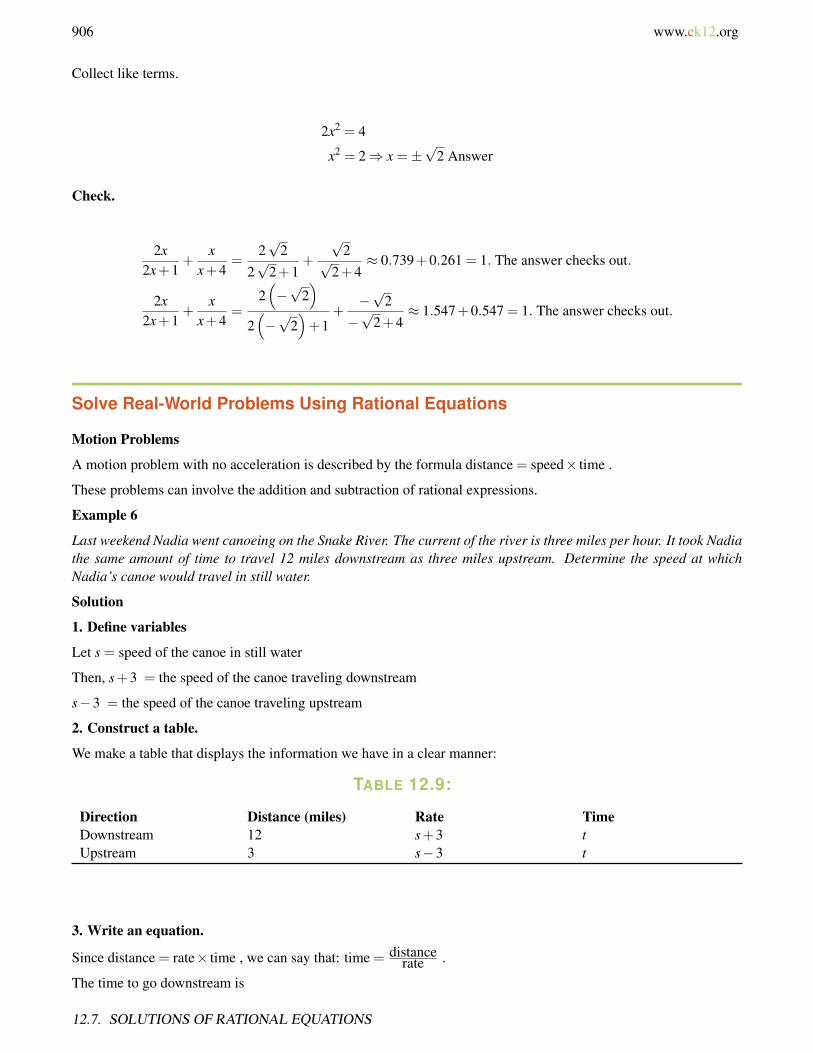
906 www.ck12.org
Collect like terms.
2x2 = 4
x2 = 2⇒ x =±√
2 Answer
Check.
2x2x+1
+x
x+4=
2√
22√
2+1+
√2√
2+4≈ 0.739+0.261 = 1. The answer checks out.
2x2x+1
+x
x+4=
2(−√
2)
2(−√
2)+1
+−√
2−√
2+4≈ 1.547+0.547 = 1. The answer checks out.
Solve Real-World Problems Using Rational Equations
Motion Problems
A motion problem with no acceleration is described by the formula distance = speed× time .
These problems can involve the addition and subtraction of rational expressions.
Example 6
Last weekend Nadia went canoeing on the Snake River. The current of the river is three miles per hour. It took Nadiathe same amount of time to travel 12 miles downstream as three miles upstream. Determine the speed at whichNadia’s canoe would travel in still water.
Solution
1. Define variables
Let s = speed of the canoe in still water
Then, s+3 = the speed of the canoe traveling downstream
s−3 = the speed of the canoe traveling upstream
2. Construct a table.
We make a table that displays the information we have in a clear manner:
TABLE 12.9:
Direction Distance (miles) Rate TimeDownstream 12 s+3 tUpstream 3 s−3 t
3. Write an equation.
Since distance = rate× time , we can say that: time = distancerate .
The time to go downstream is
12.7. SOLUTIONS OF RATIONAL EQUATIONS
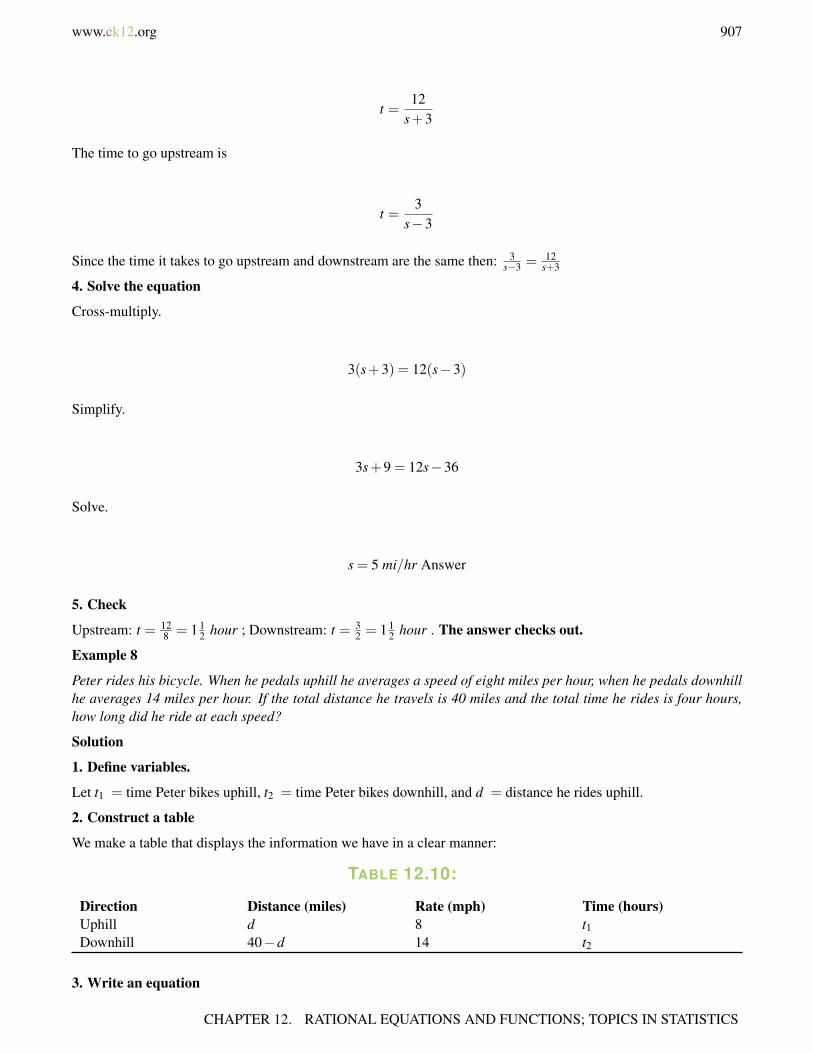
www.ck12.org 907
t =12
s+3
The time to go upstream is
t =3
s−3
Since the time it takes to go upstream and downstream are the same then: 3s−3 = 12
s+3
4. Solve the equation
Cross-multiply.
3(s+3) = 12(s−3)
Simplify.
3s+9 = 12s−36
Solve.
s = 5 mi/hr Answer
5. Check
Upstream: t = 128 = 1 1
2 hour ; Downstream: t = 32 = 1 1
2 hour . The answer checks out.
Example 8
Peter rides his bicycle. When he pedals uphill he averages a speed of eight miles per hour, when he pedals downhillhe averages 14 miles per hour. If the total distance he travels is 40 miles and the total time he rides is four hours,how long did he ride at each speed?
Solution
1. Define variables.
Let t1 = time Peter bikes uphill, t2 = time Peter bikes downhill, and d = distance he rides uphill.
2. Construct a table
We make a table that displays the information we have in a clear manner:
TABLE 12.10:
Direction Distance (miles) Rate (mph) Time (hours)Uphill d 8 t1Downhill 40−d 14 t2
3. Write an equation
CHAPTER 12. RATIONAL EQUATIONS AND FUNCTIONS; TOPICS IN STATISTICS
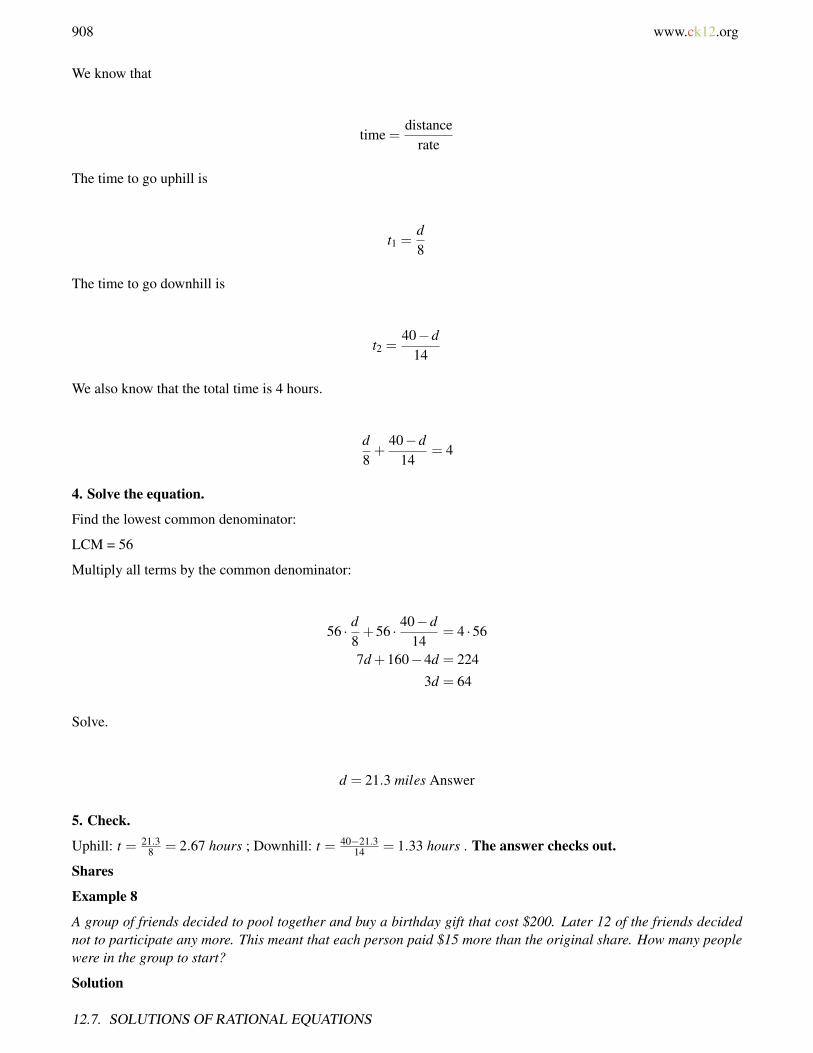
908 www.ck12.org
We know that
time =distance
rate
The time to go uphill is
t1 =d8
The time to go downhill is
t2 =40−d
14
We also know that the total time is 4 hours.
d8+
40−d14
= 4
4. Solve the equation.
Find the lowest common denominator:
LCM = 56
Multiply all terms by the common denominator:
56 · d8+56 · 40−d
14= 4 ·56
7d +160−4d = 224
3d = 64
Solve.
d = 21.3 miles Answer
5. Check.
Uphill: t = 21.38 = 2.67 hours ; Downhill: t = 40−21.3
14 = 1.33 hours . The answer checks out.
Shares
Example 8
A group of friends decided to pool together and buy a birthday gift that cost $200. Later 12 of the friends decidednot to participate any more. This meant that each person paid $15 more than the original share. How many peoplewere in the group to start?
Solution
12.7. SOLUTIONS OF RATIONAL EQUATIONS

www.ck12.org 909
1. Define variables.
Let x = the number of friends in the original group
2. Make a table.
We make a table that displays the information we have in a clear manner:
CHAPTER 12. RATIONAL EQUATIONS AND FUNCTIONS; TOPICS IN STATISTICS
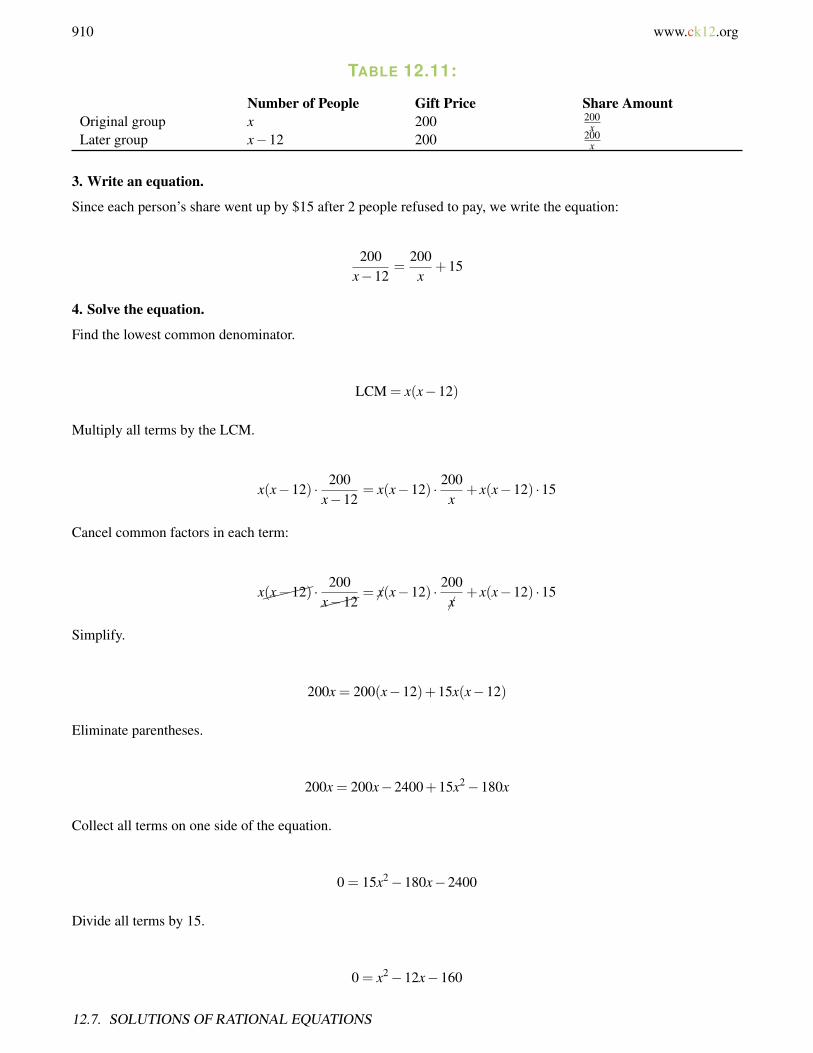
910 www.ck12.org
TABLE 12.11:
Number of People Gift Price Share AmountOriginal group x 200 200
xLater group x−12 200 200
x
3. Write an equation.
Since each person’s share went up by $15 after 2 people refused to pay, we write the equation:
200x−12
=200
x+15
4. Solve the equation.
Find the lowest common denominator.
LCM = x(x−12)
Multiply all terms by the LCM.
x(x−12) · 200x−12
= x(x−12) · 200x
+ x(x−12) ·15
Cancel common factors in each term:
x(x−12) · 200x−12
= x(x−12) · 200
x+ x(x−12) ·15
Simplify.
200x = 200(x−12)+15x(x−12)
Eliminate parentheses.
200x = 200x−2400+15x2−180x
Collect all terms on one side of the equation.
0 = 15x2−180x−2400
Divide all terms by 15.
0 = x2−12x−160
12.7. SOLUTIONS OF RATIONAL EQUATIONS
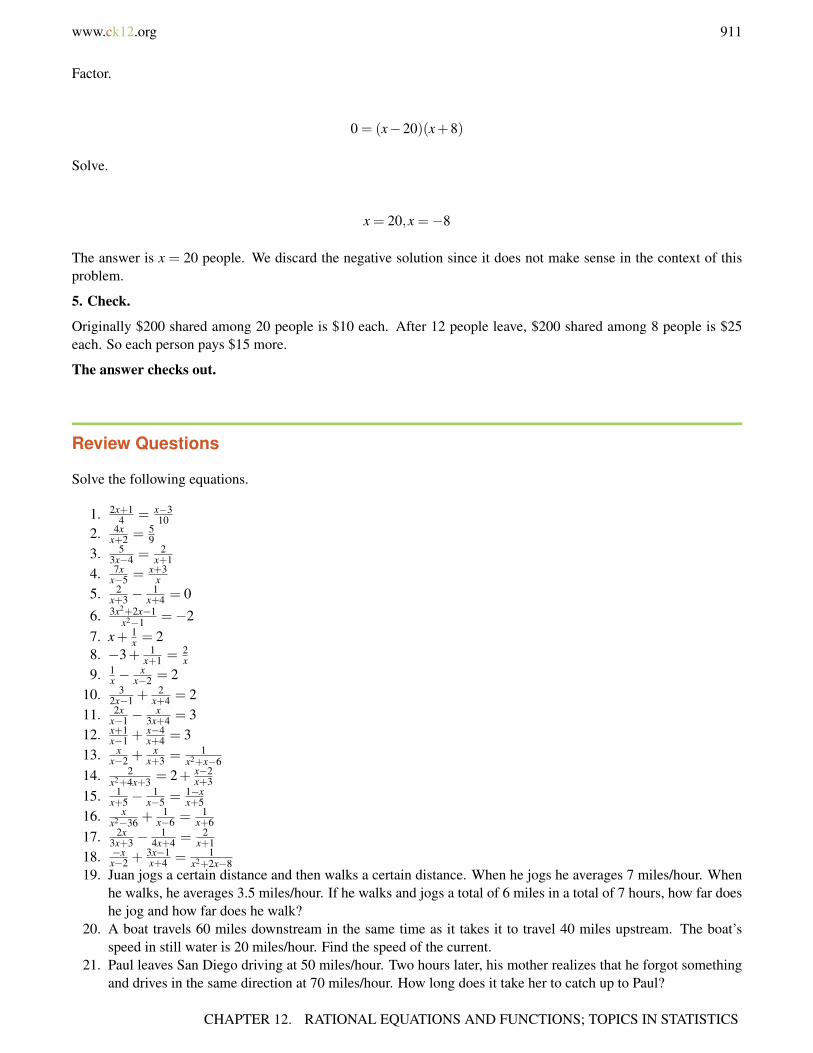
www.ck12.org 911
Factor.
0 = (x−20)(x+8)
Solve.
x = 20,x =−8
The answer is x = 20 people. We discard the negative solution since it does not make sense in the context of thisproblem.
5. Check.
Originally $200 shared among 20 people is $10 each. After 12 people leave, $200 shared among 8 people is $25each. So each person pays $15 more.
The answer checks out.
Review Questions
Solve the following equations.
1. 2x+14 = x−3
102. 4x
x+2 = 59
3. 53x−4 = 2
x+14. 7x
x−5 = x+3x
5. 2x+3 −
1x+4 = 0
6. 3x2+2x−1x2−1 =−2
7. x+ 1x = 2
8. −3+ 1x+1 = 2
x9. 1
x −x
x−2 = 210. 3
2x−1 +2
x+4 = 211. 2x
x−1 −x
3x+4 = 312. x+1
x−1 +x−4x+4 = 3
13. xx−2 +
xx+3 = 1
x2+x−614. 2
x2+4x+3 = 2+ x−2x+3
15. 1x+5 −
1x−5 = 1−x
x+516. x
x2−36 +1
x−6 = 1x+6
17. 2x3x+3 −
14x+4 = 2
x+118. −x
x−2 +3x−1x+4 = 1
x2+2x−819. Juan jogs a certain distance and then walks a certain distance. When he jogs he averages 7 miles/hour. When
he walks, he averages 3.5 miles/hour. If he walks and jogs a total of 6 miles in a total of 7 hours, how far doeshe jog and how far does he walk?
20. A boat travels 60 miles downstream in the same time as it takes it to travel 40 miles upstream. The boat’sspeed in still water is 20 miles/hour. Find the speed of the current.
21. Paul leaves San Diego driving at 50 miles/hour. Two hours later, his mother realizes that he forgot somethingand drives in the same direction at 70 miles/hour. How long does it take her to catch up to Paul?
CHAPTER 12. RATIONAL EQUATIONS AND FUNCTIONS; TOPICS IN STATISTICS
912 www.ck12.org
22. On a trip, an airplane flies at a steady speed against the wind. On the return trip the airplane flies with thewind. The airplane takes the same amount of time to fly 300 miles against the wind as it takes to fly 420 mileswith the wind. The wind is blowing at 30 miles/hour. What is the speed of the airplane when there is no wind?
23. A debt of $420 is shared equally by a group of friends. When five of the friends decide not to pay, the shareof the other friends goes up by $25. How many friends were in the group originally?
24. A non-profit organization collected $2250 in equal donations from their members to share the cost of im-proving a park. If there were thirty more members, then each member could contribute $20 less. How manymembers does this organization have?
Review Answers
1. x =−118
2. x = 1031
3. x = 134. no real solution5. x =−56. x = 3
57. x = 18. x = 1
39. x = 1,x = 2
310. x =−3.17,x = 1.4211. x =−1.14,x = 2.6412. x =−10.84,x = 1.8413. x =−1,x = 1
214. x =−2,x =−1
315. x =−.74,x = 6.7416. x =−1217. x = 27
818. x = .092,x = 5.4119. jogs 3.6 miles and walks 2.4 miles20. 4 miles/hour21. 5 hours22. 180 miles/hour23. 12 friends24. 45 members
12.7. SOLUTIONS OF RATIONAL EQUATIONS
www.ck12.org 913
12.8 Surveys and Samples
Learning Objectives
• Classify sampling methods.• Identify biased samples.• Identify biased questions.• Design and conduct a survey.• Display, analyze, and interpret statistical survey data.
Introduction
One of the most important applications of statistics is collecting information. Statistical studies are done for manypurposes: A government agency may want to collect data on weather patterns. An advertisement company mightseek information about what people buy. A consumer group could conduct a statistical study on gas consumptionof cars, and a biologist may study primates to find out more about animal behaviors. All of these applications andmany more rely on the collection and analysis of information.
One method to collect information is to conduct a census. In a census, information is collected on all the membersof the population of interest. For example, when voting for a class president at school every person in the classvotes, so this represents a census. With this method, the whole population is polled.
When the population is small (as in the case of voting for a class president) it is sensible to include everyone’sopinion. Conducting a census on a very large population can be very time-consuming and expensive. In many cases,a census is impractical. An alternate method for collecting information is by using a sampling method. This meansthat information is collected from a small sample that represents the population with which the study is concerned.The information from the sample is then extrapolated to the population.
Classify Sampling Methods
When a statistical study is conducted through a sampling method, we must first decide how to choose the samplepopulation. It is essential that the sample is a representative sample of the population we are studying. For example,if we are trying to determine the effect of a drug on teenage girls, it would make no sense to include males in oursample population, nor would it make sense to include women that are not teenagers. The word population instatistics means the group of people who we wish to study.
There are several methods for choosing a population sample from a larger group. The two main types of samplingare random sampling and stratified sampling.
Random sampling
This method simply involves picking people at random from the population we wish to poll. However, this does notmean we can simply ask the first 50 people to walk by in the street. For instance, if you are conducting a survey
CHAPTER 12. RATIONAL EQUATIONS AND FUNCTIONS; TOPICS IN STATISTICS
914 www.ck12.org
on people’s eating habits you will get different results if you were standing in front of a fast-food restaurant than ifwere standing in front of a health food store. In a true random sample, everyone in the population must have thesame chance of being chosen. It is important that each person in the population has a chance of being picked.
Stratified Sampling
This method of sampling actively seeks to poll people from many different backgrounds. The population is firstdivided into different categories (or strata) and the number of members in each category is determined. Gender andage groups are commonly used strata, but others could include salary, education level or even hair color. Each personin a given stratum must share that same characteristic. The sample is made up of members from each category in thesame proportion as they are in the population. Imagine you are conducting a survey that calls for a sample size of100 people. If it is determined that 10% of the population are males between the ages of 10 and 25, then you wouldseek 10 males in that age group to respond. Once those 10 have responded no more males between 10 and 25 maytake part in the survey.
Sample Size
In order for sampling to work well, the sample size must be large enough so as to lessen the effect of a biased sample.For example, if you randomly sample 6 children, there is a chance that many or all of them will be boys. If yourandomly sample 6,000 children it is far more likely that they will be approximately equally spread between boysand girls. Even in stratified sampling (when we would poll equal numbers of boys and girls) it is important to havea large enough sample to include the entire spectrum of people and viewpoints. The sample size is determined bythe precision desired for the population. The larger the sample size is, the more precise the estimate is. However,the larger the sample size, the more expensive and time consuming the statistical study becomes. In more advancedstatistics classes you will learn how to use statistical methods to determine the best sample size for a desired precisionon the population.
Example 1
For a class assignment you have been asked to find if students in your school are planning to attend university aftergraduating high-school. Students can respond with “yes”, “no” or “undecided”. How will you choose those youwish to interview if you want your results to be reliable?
Solution
The best method for obtaining a representative sample would be to apply stratified sampling. An appropriate categoryfor stratifying the population would be grade level since students in the upper grades might be more sure of theirpost-graduation plans than students in the lower grades.
You will need to find out what proportion of the total student population is included in each grade, then interviewthe same proportion of students from each grade when conducting the survey.
Identify Biased Samples
Once we have identified our population, it is important that the sample we choose accurately reflect the spread ofpeople present in the population. If the sample we choose ends up with one or more sub-groups that are either over-represented or under-represented, then we say the sample is biased. We would not expect the results of a biasedsample to represent the entire population, so it is important to avoid selecting a biased sample. Stratified samplinghelps, but does not always eliminate bias in a sample. Even with a large sample size, we may be consistently pickingone group over another.
Some samples may deliberately seek a biased sample in order to bolster a particular viewpoint. For example, if agroup of students were trying to petition the school to allow eating candy in the classroom, they may only surveystudents immediately before lunchtime when students are hungry. The practice of polling only those who you believewill support your cause is sometimes referred to as cherry picking.
12.8. SURVEYS AND SAMPLES
www.ck12.org 915
Many surveys may have a non-response bias. In this case, a survey that is simply handed out en-masse elicits fewresponses when compared to the number of surveys given out. People who are either too busy or simply not interestedwill be excluded from the results. Non-response bias may be reduced by conducting face-to-face interviews.
Self-selected respondents who tend to have stronger opinions on subjects than others and are more motivated torespond. For this reason phone-in and online polls also tend to be poor representations of the overall population.Even though it appears that both sides are responding, the poll may disproportionately represent extreme viewpointsfrom both sides, while ignoring more moderate opinions which may, in fact, be the majority view. Self selected pollsare generally regarded as unscientific.
Examples of biased samples.
The following text is adapted from Wikipedia http://www.wikipedia.org/wiki/Biased_sample
A classic example of a biased sample occurred in the 1948 Presidential Election. On Election night, the ChicagoTribune printed the headline DEWEY DEFEATS TRUMAN, which turned out to be mistaken. In the morning,the grinning President-Elect, Harry S. Truman, was photographed holding a newspaper bearing this headline. Thereason the Tribune was mistaken is that their editor trusted the results of a phone survey. Survey research was thenin its infancy, and few academics realized that a sample of telephone users was not representative of the generalpopulation. Telephones were not yet widespread, and those who had them tended to be prosperous and have stableaddresses.
Example 2
Identify each sample as biased or unbiased. If the sample is biased explain how you would improve your samplingmethod.
a. Asking people shopping at a farmer’s market if they think locally grown fruit and vegetables are healthier thansupermarket fruits and vegetables.
b. You want to find out public opinion on whether teachers get paid a sufficient salary by interviewing the teachersin your school.
c. You want to find out if your school needs to improve its communications with parents by sending home a surveywritten in English.
Solution
a. This would be a biased sample because people shopping a farmer’s market are generally interested in buyingfresher fruits and vegetables than a regular supermarket provides. The study can be improved by interviewing anequal number of people coming out of a supermarket, or by interviewing people in a more neutral environment suchas the post office.
b. This is a biased sample because teachers generally feel like they should get a higher salary. A better sample couldbe obtained by constructing a stratified sample with people in different income categories.
c. This is a biased sample because only English-speaking parents would understand the survey. This group ofparents would be generally more satisfied with the school’s communications. The study could be improved bysending different versions of the survey written in languages spoken at the students’ homes.
Identify Biased Questions
When you are creating a survey, you must think very carefully about the questions you should ask, how manyquestions are appropriate and even the order in which the questions should be asked. A biased question is aquestion that is worded in such a way (whether intentional or not) that it causes a swing in the way people answer it.Biased questions can lead a representative, non-biased population sample answering in a way that does not accuratelyreflect the larger population. While biased questions are a bad way to judge the overall mood of a population, they
CHAPTER 12. RATIONAL EQUATIONS AND FUNCTIONS; TOPICS IN STATISTICS

916 www.ck12.org
are sometimes linked to advertising companies conducting surveys to suggest that one product performs better thanothers. They could also be used by political campaigners to give the impression that some policies are more popularthan is actually the case.
There are several ways to spot biased questions.
They may use polarizing language, words and phrases that people associate with emotions.
• Is it right that farmers murder animals to feed people?• How much of your time do you waste on TV every week?• Should we be able to remove a person’s freedom of choice over cigarette smoking?
They may refer to a majority or to a supposed authority.
• Would you agree with the American Heart and Lung Association that smoking is bad for your health?• The president believes that criminals should serve longer prison sentences. Do you agree?• Do you agree with 90% of the public that the car on the right looks better?
The question may be phrased so as to suggest the person asking the question already knows the answer to be true, orto be false.
• It’s OK to smoke so long as you do it on your own, right?• You shouldn’t be forced to give your money to the government, should you?• You wouldn’t want criminals free to roam the streets, would you?
The question may be phrased in ambiguous way (often with double negatives) which may confuse people.
• Do you reject the possibility that the moon landings never took place?• Do you disagree with people who oppose the ban on smoking in public places?
In addition to biased questions, a survey may exhibit bias from other aspects of how it is designed. In particularquestion order can play a role. For example a survey may contain several questions on people’s attitudes to cigarettesmoking. If the question “What, in your opinion, are the three biggest threats to public health today?” is asked at theend of the survey it is likely that the answer “smoking” is given more often than if the same question is asked at thestart of the survey.
Design and Conduct a Survey
One way of collecting information from a population is to conduct a survey. A survey is a way to ask a lot ofpeople a few well-constructed questions. The survey is a series of unbiased questions that the subject must answer.Some advantages of surveys are that they are efficient ways of collecting information from a large number of people,they are relatively easy to administer, a wide variety of information can be collected and they can be focused (onlyquestions of interest to the researcher are asked, recorded, codified and analyzed). Some disadvantages of surveysarise from the fact that they depend on the subjects’ motivation, honesty, memory and ability to respond. In addition,although the chosen sample to be surveyed is unbiased, there might be errors due to the fact that the people whochoose to respond on the survey might not form an unbiased sample. Moreover, answer choices to survey questionscould lead to vague data. For example, the choice “moderately agree” may mean different things to different peopleor to anyone interpreting the data.
Conducting a Survey
12.8. SURVEYS AND SAMPLES
www.ck12.org 917
There are various methods for administering a survey. It can be done as a face-to face interview or a phone interviewwhere the researcher is questioning the subject. A different option is to have a self-administered survey where thesubject can complete a survey on paper and mail it back, or complete the survey online. There are advantages anddisadvantages to each of these methods.
Face-to-face interviews
The advantages of face-to-face interviews are that there are fewer misunderstood questions, fewer incomplete re-sponses, higher response rates, greater control over the environment in which the survey is administered and the factthat additional information can be collected from the respondent. The disadvantages of face-to-face interviews arethat they can be expensive and time-consuming and may require a large staff of trained interviewers. In addition, theresponse can be biased by the appearance or attitude of the interviewer.
Self-administered surveys
The advantages of self-administered surveys are that they are less expensive than interviews, do not require a largestaff of experienced interviewers and they can be administered in large numbers. In addition, anonymity and privacyencourage more candid and honest responses and there is less pressure on respondents. The disadvantages of self-administered surveys are that responders are more likely to stop participating mid-way through the survey andrespondents cannot ask for clarification. In addition, there are lower response rates that in personal interviews andoften respondents returning survey represent extremes of the population – those people who care about the issuestrongly at both extremes.
Design a Survey
Surveys can take different forms. They can be used to ask only one question or they can ask a series of questions.We use surveys to test out people’s opinions or to test a hypothesis.
When designing a survey, we must keep the following guidelines in mind.
a. Determine the goal of your survey, What question do you want to answer?b. Identify the sample population. Who will you interview?c. Choose an interviewing method, face-to-face interview, phone interview or self-administered paper survey or
internet survey.d. Conduct the interview and collect the information.e. Analyze the results by making graphs and drawing conclusions.
Example 3
Martha wants to construct a survey that shows which sports students at her school like to play the most.
a. List the goal of the survey.b. What population sample should she interview?c. How should she administer the survey?d. Create a data collection sheet that she can use the record your results.
Solution
a. The goal of the survey is to find the answer to the question: “Which sports do students at Martha’s school liketo play the most?”
b. A sample of the population would include a random sample of the student population in Martha’s school. Agood stategy would be to randomly select students (using dice or a random number generator) as they walkinto an all school assembly.
c. Face-to-face interviews are a good choice in this case since the survey consists of only one question which canbe quickly answered and recorded.
d. In order to collect the data to this simple survey Martha can design a data collection sheet such as the onebelow:
CHAPTER 12. RATIONAL EQUATIONS AND FUNCTIONS; TOPICS IN STATISTICS
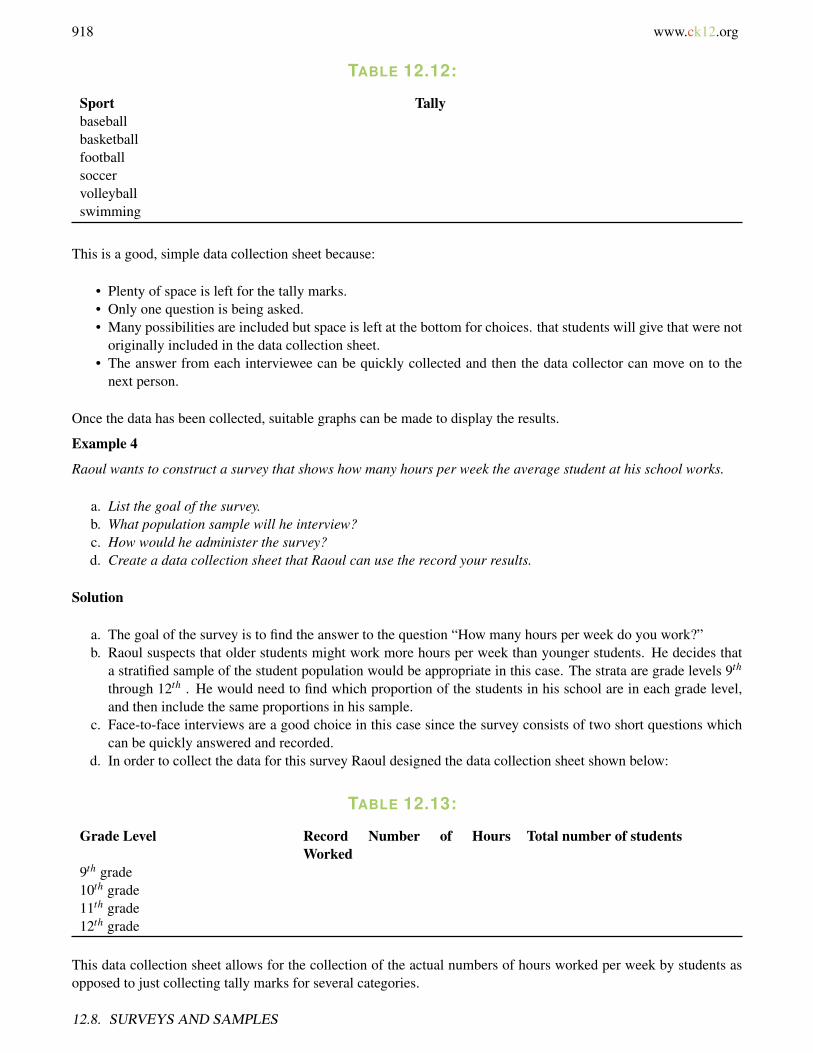
918 www.ck12.org
TABLE 12.12:
Sport Tallybaseballbasketballfootballsoccervolleyballswimming
This is a good, simple data collection sheet because:
• Plenty of space is left for the tally marks.• Only one question is being asked.• Many possibilities are included but space is left at the bottom for choices. that students will give that were not
originally included in the data collection sheet.• The answer from each interviewee can be quickly collected and then the data collector can move on to the
next person.
Once the data has been collected, suitable graphs can be made to display the results.
Example 4
Raoul wants to construct a survey that shows how many hours per week the average student at his school works.
a. List the goal of the survey.b. What population sample will he interview?c. How would he administer the survey?d. Create a data collection sheet that Raoul can use the record your results.
Solution
a. The goal of the survey is to find the answer to the question “How many hours per week do you work?”b. Raoul suspects that older students might work more hours per week than younger students. He decides that
a stratified sample of the student population would be appropriate in this case. The strata are grade levels 9th
through 12th . He would need to find which proportion of the students in his school are in each grade level,and then include the same proportions in his sample.
c. Face-to-face interviews are a good choice in this case since the survey consists of two short questions whichcan be quickly answered and recorded.
d. In order to collect the data for this survey Raoul designed the data collection sheet shown below:
TABLE 12.13:
Grade Level Record Number of HoursWorked
Total number of students
9th grade10th grade11th grade12th grade
This data collection sheet allows for the collection of the actual numbers of hours worked per week by students asopposed to just collecting tally marks for several categories.
12.8. SURVEYS AND SAMPLES
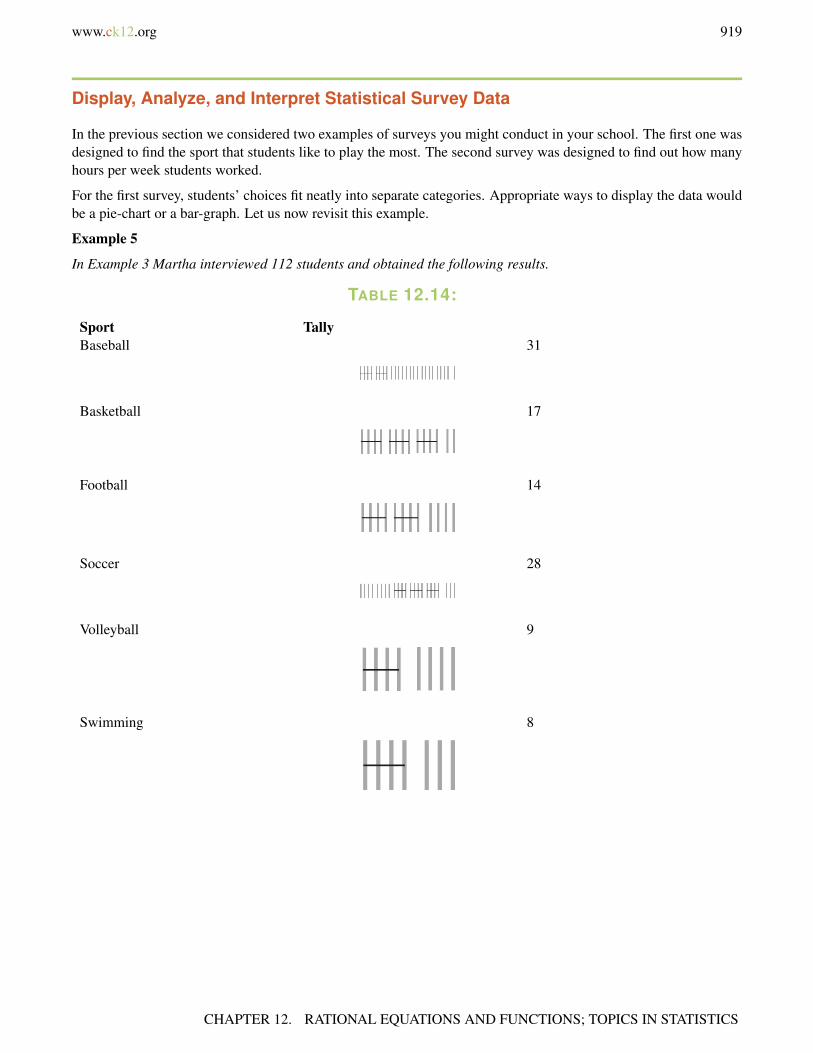
www.ck12.org 919
Display, Analyze, and Interpret Statistical Survey Data
In the previous section we considered two examples of surveys you might conduct in your school. The first one wasdesigned to find the sport that students like to play the most. The second survey was designed to find out how manyhours per week students worked.
For the first survey, students’ choices fit neatly into separate categories. Appropriate ways to display the data wouldbe a pie-chart or a bar-graph. Let us now revisit this example.
Example 5
In Example 3 Martha interviewed 112 students and obtained the following results.
TABLE 12.14:
Sport TallyBaseball 31
Basketball 17
Football 14
Soccer 28
Volleyball 9
Swimming 8
CHAPTER 12. RATIONAL EQUATIONS AND FUNCTIONS; TOPICS IN STATISTICS

920 www.ck12.org
TABLE 12.14: (continued)
Sport TallyGymnastics 3
Fencing 2
Total 112
a. Make a bar graph of the results showing the percentage of students in each category.
b. Make a pie chart of the collected information, showing the percentage of students in each category.
Solution
a. To make a bar graph, we list the sport categories on the x− axis and let the percentage of students be representedby the y− axis.
To find the percentage of students in each category, we divide the number of students in each category by the totalnumber of students surveyed.
12.8. SURVEYS AND SAMPLES
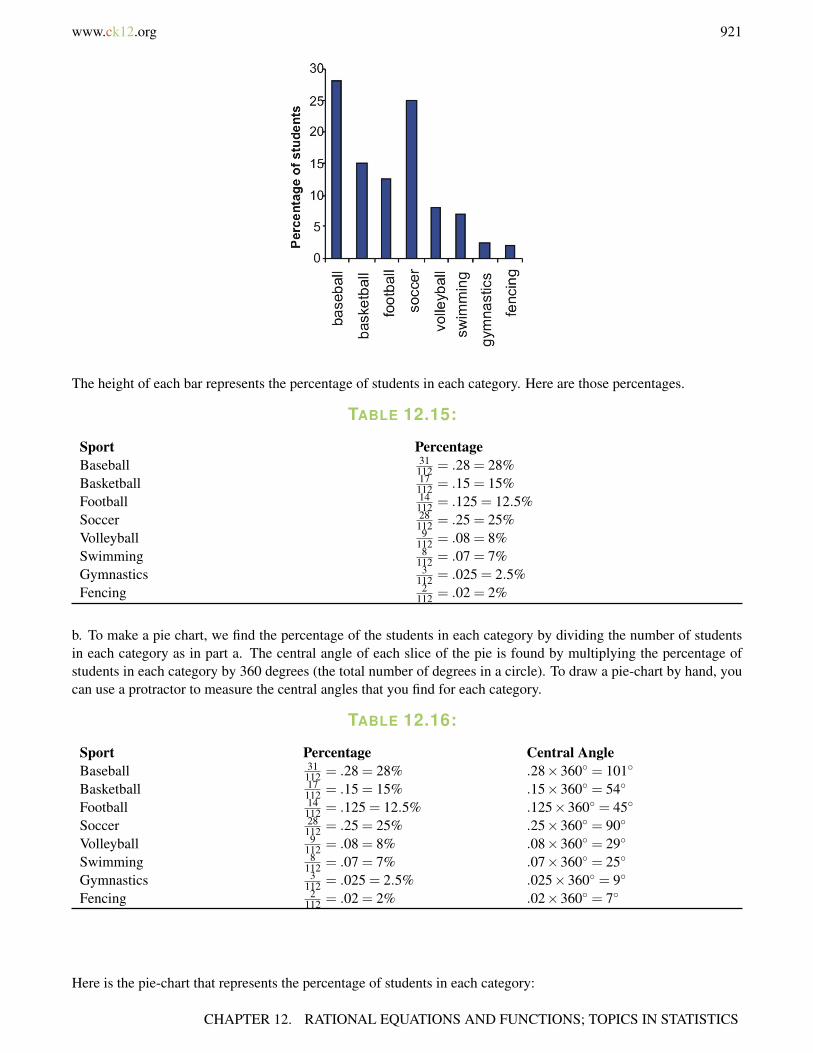
www.ck12.org 921
The height of each bar represents the percentage of students in each category. Here are those percentages.
TABLE 12.15:
Sport PercentageBaseball 31
112 = .28 = 28%Basketball 17
112 = .15 = 15%Football 14
112 = .125 = 12.5%Soccer 28
112 = .25 = 25%Volleyball 9
112 = .08 = 8%Swimming 8
112 = .07 = 7%Gymnastics 3
112 = .025 = 2.5%Fencing 2
112 = .02 = 2%
b. To make a pie chart, we find the percentage of the students in each category by dividing the number of studentsin each category as in part a. The central angle of each slice of the pie is found by multiplying the percentage ofstudents in each category by 360 degrees (the total number of degrees in a circle). To draw a pie-chart by hand, youcan use a protractor to measure the central angles that you find for each category.
TABLE 12.16:
Sport Percentage Central AngleBaseball 31
112 = .28 = 28% .28×360 = 101
Basketball 17112 = .15 = 15% .15×360 = 54
Football 14112 = .125 = 12.5% .125×360 = 45
Soccer 28112 = .25 = 25% .25×360 = 90
Volleyball 9112 = .08 = 8% .08×360 = 29
Swimming 8112 = .07 = 7% .07×360 = 25
Gymnastics 3112 = .025 = 2.5% .025×360 = 9
Fencing 2112 = .02 = 2% .02×360 = 7
Here is the pie-chart that represents the percentage of students in each category:
CHAPTER 12. RATIONAL EQUATIONS AND FUNCTIONS; TOPICS IN STATISTICS

922 www.ck12.org
For the second survey, actual numerical data can be collected from each student. In this case we can display the datausing a stem-and-leaf plot, a frequency table, a histogram, and a box-and-whisker plot.
Example 6
In Example 4, Raoul found that that 30% of the students at his school are in 9th grade, 26% of the students are inthe 10th grade, 24% of the students are in 11th grade and 20% of the students are in the 12th grade. He surveyed atotal of 60 students using these proportions as a guide for the number of students he interviewed from each grade.Raoul recorded the following data.
TABLE 12.17:
Grade Level Record Number of HoursWorked
Total Number of Students
9th grade 0, 5, 4, 0, 0, 10, 5, 6, 0, 0, 2, 4, 0, 8,0, 5, 7, 0
18
10th grade 6, 10, 12, 0, 10, 15, 0, 0, 8, 5, 0, 7,10, 12, 0, 0
16
11th grade 0, 12, 15, 18, 10, 0, 0, 20, 8, 15, 10,15, 0, 5
14
12th grade 22, 15, 12, 15, 10, 0, 18, 20, 10, 0,12, 16
12
a. Construct a stem-and-leaf plot of the collected data.b. Construct a frequency table with bin size of 5.c. Draw a histogram of the data.d. Find the five number summary of the data and draw a box-and-whisker plot.
Solution
1. The ordered stem-and-leaf plot looks as follows:
12.8. SURVEYS AND SAMPLES
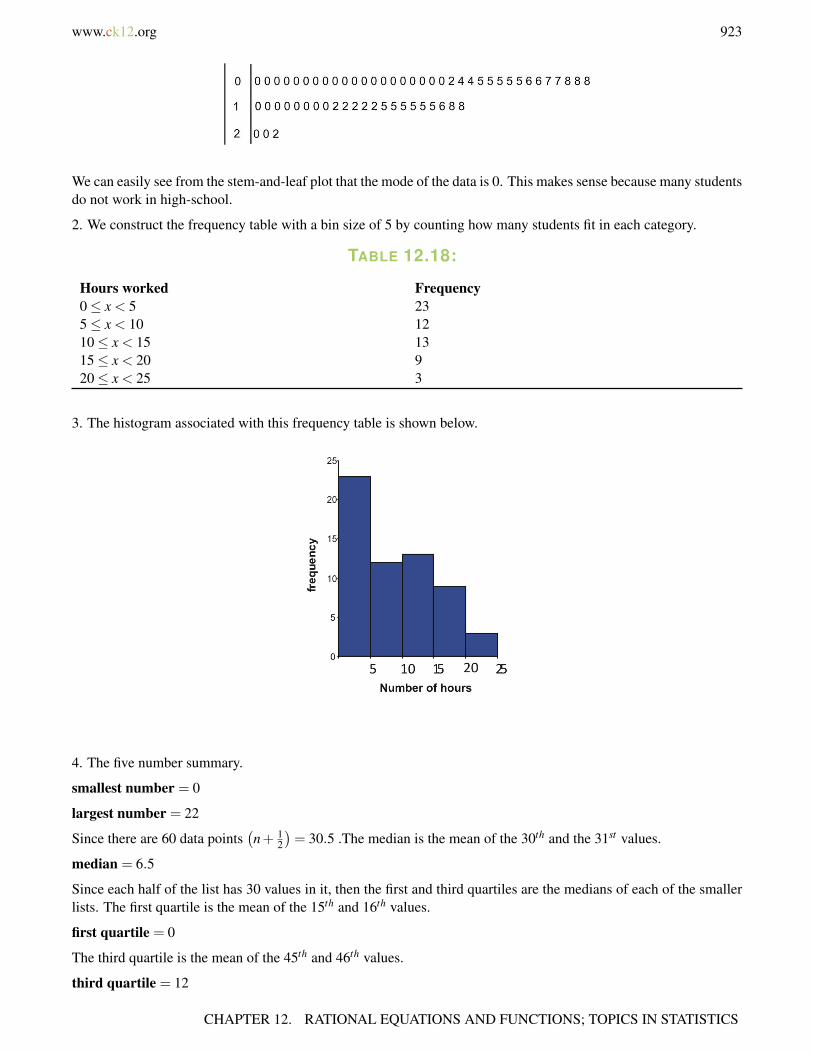
www.ck12.org 923
We can easily see from the stem-and-leaf plot that the mode of the data is 0. This makes sense because many studentsdo not work in high-school.
2. We construct the frequency table with a bin size of 5 by counting how many students fit in each category.
TABLE 12.18:
Hours worked Frequency0≤ x < 5 235≤ x < 10 1210≤ x < 15 1315≤ x < 20 920≤ x < 25 3
3. The histogram associated with this frequency table is shown below.
4. The five number summary.
smallest number = 0
largest number = 22
Since there are 60 data points(n+ 1
2
)= 30.5 .The median is the mean of the 30th and the 31st values.
median = 6.5
Since each half of the list has 30 values in it, then the first and third quartiles are the medians of each of the smallerlists. The first quartile is the mean of the 15th and 16th values.
first quartile = 0
The third quartile is the mean of the 45th and 46th values.
third quartile = 12
CHAPTER 12. RATIONAL EQUATIONS AND FUNCTIONS; TOPICS IN STATISTICS
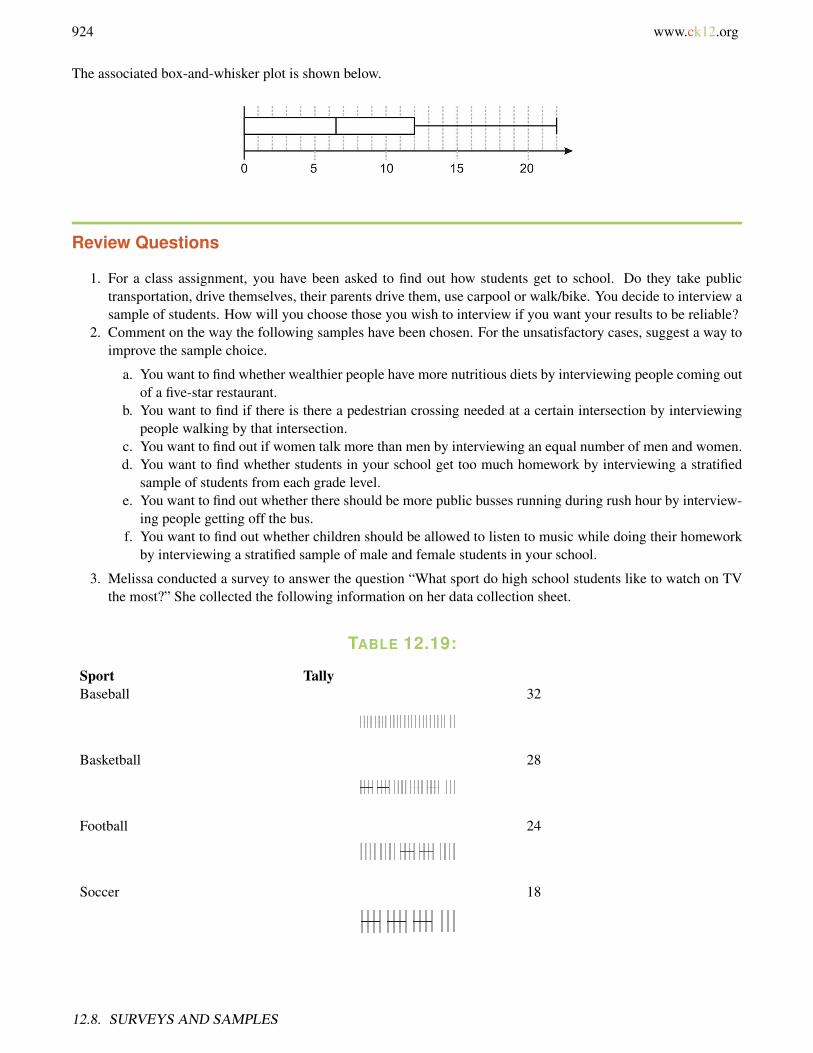
924 www.ck12.org
The associated box-and-whisker plot is shown below.
Review Questions
1. For a class assignment, you have been asked to find out how students get to school. Do they take publictransportation, drive themselves, their parents drive them, use carpool or walk/bike. You decide to interview asample of students. How will you choose those you wish to interview if you want your results to be reliable?
2. Comment on the way the following samples have been chosen. For the unsatisfactory cases, suggest a way toimprove the sample choice.
a. You want to find whether wealthier people have more nutritious diets by interviewing people coming outof a five-star restaurant.
b. You want to find if there is there a pedestrian crossing needed at a certain intersection by interviewingpeople walking by that intersection.
c. You want to find out if women talk more than men by interviewing an equal number of men and women.d. You want to find whether students in your school get too much homework by interviewing a stratified
sample of students from each grade level.e. You want to find out whether there should be more public busses running during rush hour by interview-
ing people getting off the bus.f. You want to find out whether children should be allowed to listen to music while doing their homework
by interviewing a stratified sample of male and female students in your school.
3. Melissa conducted a survey to answer the question “What sport do high school students like to watch on TVthe most?” She collected the following information on her data collection sheet.
TABLE 12.19:
Sport TallyBaseball 32
Basketball 28
Football 24
Soccer 18
12.8. SURVEYS AND SAMPLES
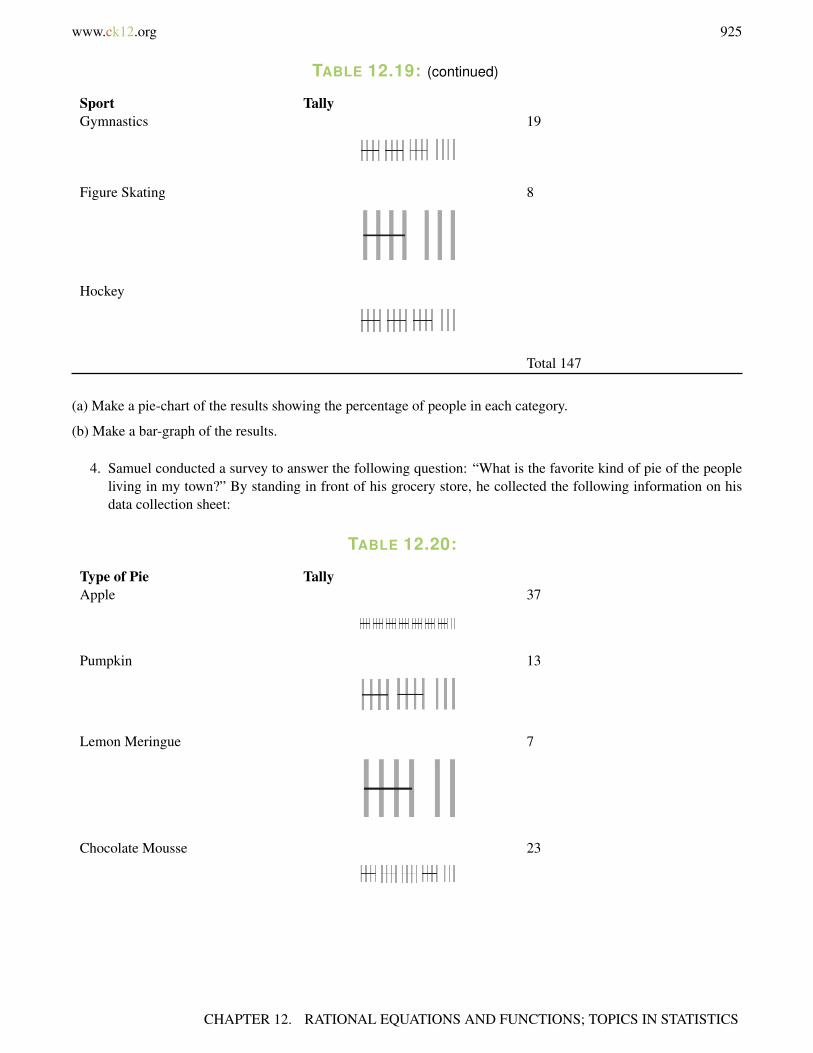
www.ck12.org 925
TABLE 12.19: (continued)
Sport TallyGymnastics 19
Figure Skating 8
Hockey
Total 147
(a) Make a pie-chart of the results showing the percentage of people in each category.
(b) Make a bar-graph of the results.
4. Samuel conducted a survey to answer the following question: “What is the favorite kind of pie of the peopleliving in my town?” By standing in front of his grocery store, he collected the following information on hisdata collection sheet:
TABLE 12.20:
Type of Pie TallyApple 37
Pumpkin 13
Lemon Meringue 7
Chocolate Mousse 23
CHAPTER 12. RATIONAL EQUATIONS AND FUNCTIONS; TOPICS IN STATISTICS
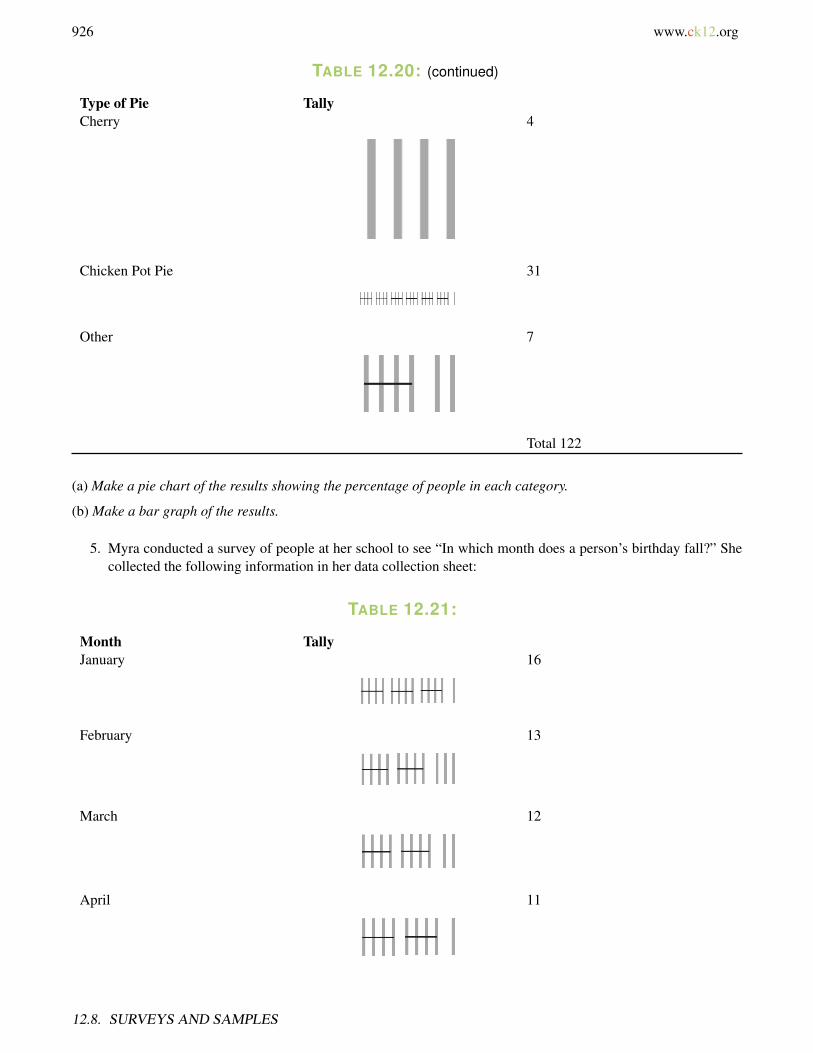
926 www.ck12.org
TABLE 12.20: (continued)
Type of Pie TallyCherry 4
Chicken Pot Pie 31
Other 7
Total 122
(a) Make a pie chart of the results showing the percentage of people in each category.
(b) Make a bar graph of the results.
5. Myra conducted a survey of people at her school to see “In which month does a person’s birthday fall?” Shecollected the following information in her data collection sheet:
TABLE 12.21:
Month TallyJanuary 16
February 13
March 12
April 11
12.8. SURVEYS AND SAMPLES
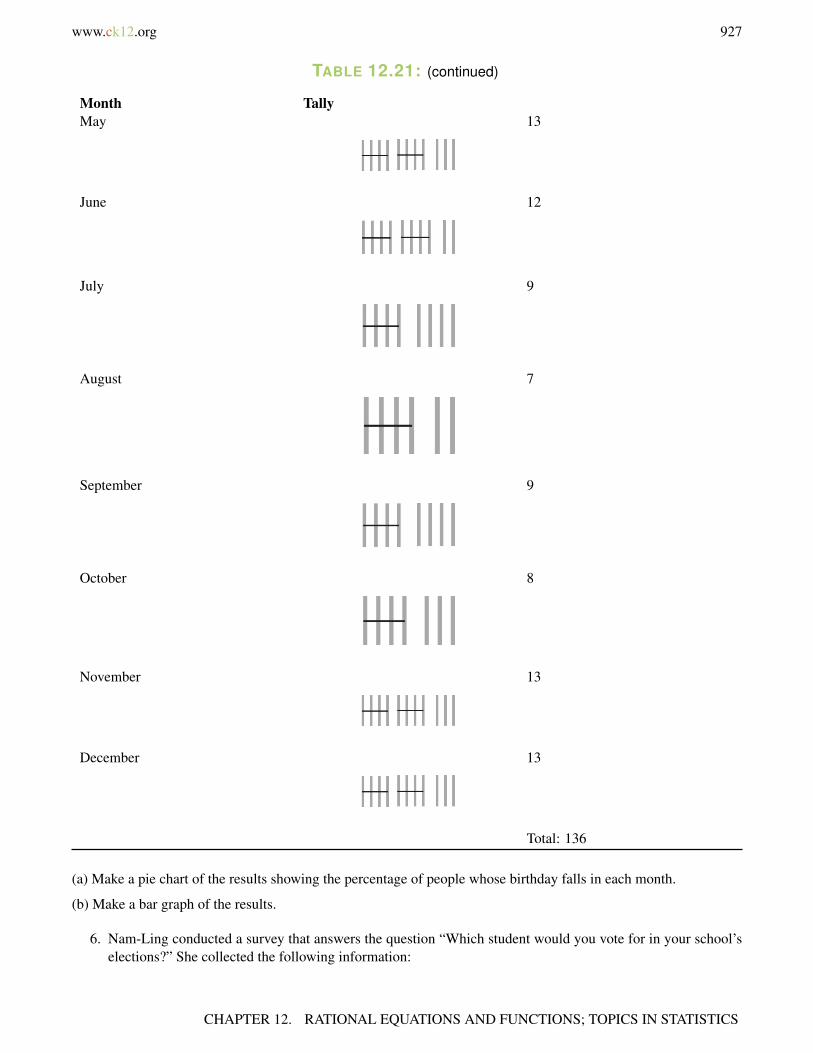
www.ck12.org 927
TABLE 12.21: (continued)
Month TallyMay 13
June 12
July 9
August 7
September 9
October 8
November 13
December 13
Total: 136
(a) Make a pie chart of the results showing the percentage of people whose birthday falls in each month.
(b) Make a bar graph of the results.
6. Nam-Ling conducted a survey that answers the question “Which student would you vote for in your school’selections?” She collected the following information:
CHAPTER 12. RATIONAL EQUATIONS AND FUNCTIONS; TOPICS IN STATISTICS
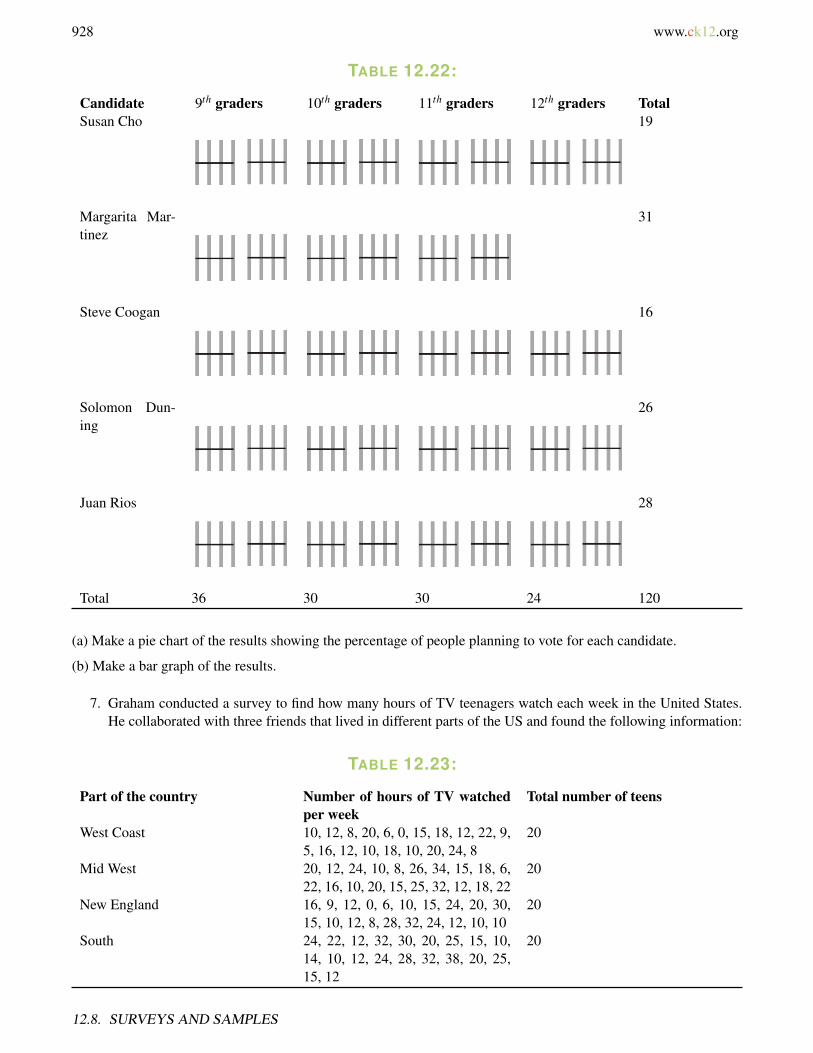
928 www.ck12.org
TABLE 12.22:
Candidate 9th graders 10th graders 11th graders 12th graders TotalSusan Cho 19
Margarita Mar-tinez
31
Steve Coogan 16
Solomon Dun-ing
26
Juan Rios 28
Total 36 30 30 24 120
(a) Make a pie chart of the results showing the percentage of people planning to vote for each candidate.
(b) Make a bar graph of the results.
7. Graham conducted a survey to find how many hours of TV teenagers watch each week in the United States.He collaborated with three friends that lived in different parts of the US and found the following information:
TABLE 12.23:
Part of the country Number of hours of TV watchedper week
Total number of teens
West Coast 10, 12, 8, 20, 6, 0, 15, 18, 12, 22, 9,5, 16, 12, 10, 18, 10, 20, 24, 8
20
Mid West 20, 12, 24, 10, 8, 26, 34, 15, 18, 6,22, 16, 10, 20, 15, 25, 32, 12, 18, 22
20
New England 16, 9, 12, 0, 6, 10, 15, 24, 20, 30,15, 10, 12, 8, 28, 32, 24, 12, 10, 10
20
South 24, 22, 12, 32, 30, 20, 25, 15, 10,14, 10, 12, 24, 28, 32, 38, 20, 25,15, 12
20
12.8. SURVEYS AND SAMPLES

www.ck12.org 929
(a) Make a stem-and-leaf plot of the data.
(b) Decide on an appropriate bin size and construct a frequency table.
(c) Make a histogram of the results.
(d) Find the five-number summary of the data and construct a box-and-whisker plot.
In exercises 8−11 , consider the following survey questions.
8. “What do students in your high-school like to spend their money on?”
a. Which categories would you include on your data collection sheet?b. Design the data collection sheet that can be used to collect this information.c. Conduct the survey. This activity is best done as a group with each person contributing at least 20 results.d. Make a pie chart of the results showing the percentage of people in each category.e. Make a bar graph of the results.
9. “What is the height of students in your class?”
a. Design the data collection sheet that can be used to collect this information.b. Conduct the survey. This activity is best done as a group with each person contributing at least 20 results.c. Make a stem-and-leaf plot of the data.d. Decide on an appropriate bin size and construct a frequency table.e. Make a histogram of the results.f. Find the five-number summary of the data and construct a box-and-whisker plot.
10. “How much allowance money do students in your school get per week?”
a. Design the data collection sheet that can be used to collect this information,b. Conduct the survey. This activity is best done as a group with each person contributing at least 20 results.c. Make a stem-and-leaf plot of the data.d. Decide on an appropriate bin size and construct a frequency table.e. Make a histogram of the results.f. Find the five-number summary of the data and construct a box-and-whisker plot.
11. “What time do students in your school get up in the morning during the school week?”
a. Design the data collection sheet that can be used to collect this information.b. Conduct the survey. This activity is best done as a group with each person contributing at least 20 results.c. Make a stem-and-leaf plot of the data.d. Decide on an appropriate bin size and construct a frequency table.e. Make a histogram of the results.f. Find the five-number summary of the data and construct a box-and-whisker plot.
Review Answers
1. Construct a stratified sample with categories based on how far students live from school, less than 2 miles,between 2 and 5 miles, over 5 miles. Find what proportion of the total student population falls in eachcategory and interview similar proportions for your survey. Other strata appropriate for this survey would beage, income, and distance from home to public transportation.
a. The sample is biased because only people who can afford a five star restaurant are interviewed. Thesampling could be improved by constructing a stratified sample with categories based on income leveland the interviews taking place in various locations.
b. This will give a one-sided view of the issue. The study can be improved by also interviewing driverspassing through the intersection.
CHAPTER 12. RATIONAL EQUATIONS AND FUNCTIONS; TOPICS IN STATISTICS

930 www.ck12.org
c. This should be an unbiased sample and give valid results. It could be improved by creating a stratifiedsamples with categories based on race or cultural background.
d. Although the sample is stratified, the sample is biased because the survey would only find the opinion ofthe students. A better survey would also include the opinion of teachers and parents.
e. This would be a biased sample because it would only show the opinion of the people using publictransportation. The study could be improved by creating a sample that includes people that drive on thebus routes.
f. Although the sample is stratified it is still biased. A better sample would include the opinion of parentsand teachers also.
a.
b.
a.
12.8. SURVEYS AND SAMPLES

www.ck12.org 931
b.
a.
b.
a.
CHAPTER 12. RATIONAL EQUATIONS AND FUNCTIONS; TOPICS IN STATISTICS
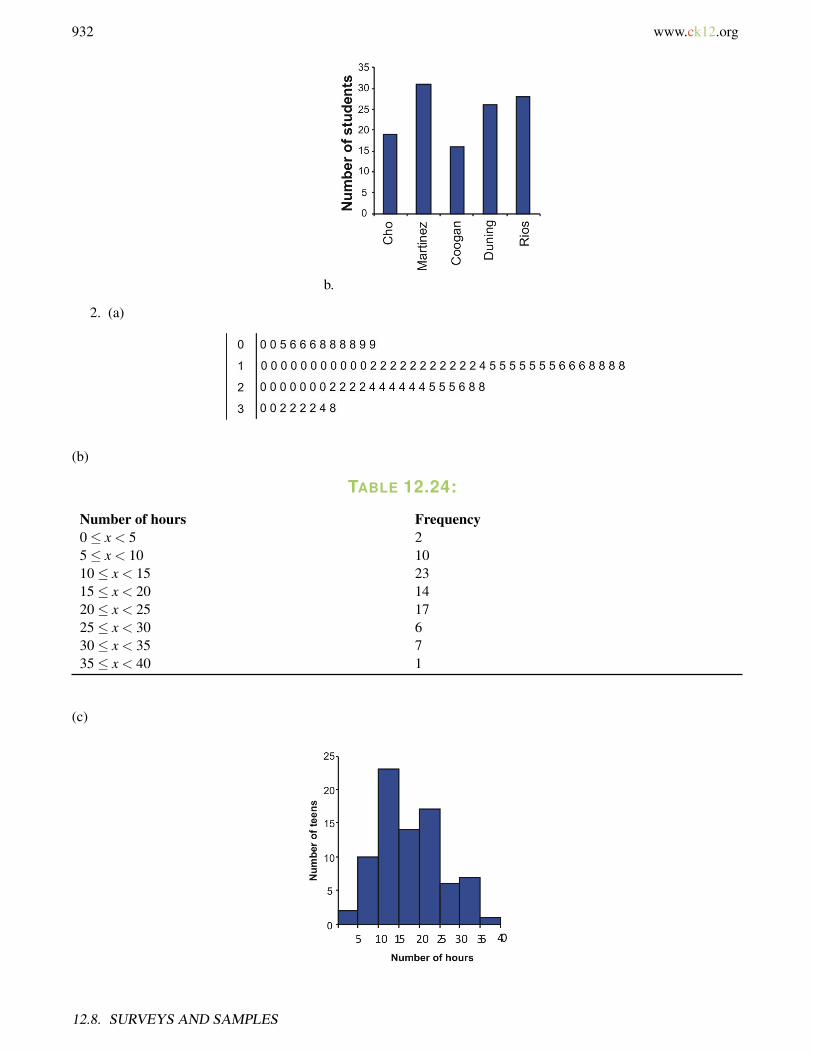
932 www.ck12.org
b.
2. (a)
(b)
TABLE 12.24:
Number of hours Frequency0≤ x < 5 25≤ x < 10 1010≤ x < 15 2315≤ x < 20 1420≤ x < 25 1725≤ x < 30 630≤ x < 35 735≤ x < 40 1
(c)
12.8. SURVEYS AND SAMPLES

www.ck12.org 933
(d) five-number summary: 0, 10, 20, 23, 38
8. Answers may vary.9. Answers may vary.
10. Answers may vary.11. Answers may vary.
Texas Instruments Resources
In the CK-12 Texas Instruments Algebra I FlexBook, there are graphing calculator activities designed to supple-ment the objectives for some of the lessons in this chapter. See http://www.ck12.org/flexr/chapter/9622.
CHAPTER 12. RATIONAL EQUATIONS AND FUNCTIONS; TOPICS IN STATISTICS