Algebra 1 Workbook 2019 2020 - Hamden Public Schools
62
Hamden High School Mathematics Department Algebra 1 Workbook Unit 7 - Exponents 2019 2020
-
Upload
khangminh22 -
Category
Documents
-
view
1 -
download
0
Transcript of Algebra 1 Workbook 2019 2020 - Hamden Public Schools

Hamden High School Mathematics Department
Algebra 1 Workbook Unit 7 - Exponents
2019 2020


Algebra I
Unit 7: Exponents
7.1.2 Is it a Good Deal?
7.2.1Exploring Growth Patterns: A Comparison
Supplemental Properties of Exponents
Supplemental Properties of Exponents (more)
Supplemental Properties of Exponents (even more)
7.2.2 The Meaning of Integer Exponents
7.2.1 Exit Slip
7.2.3 Exploring the Meaning of Rational Exponents
Quiz – Properties of Exponents
7.3.1 Building Walls
7.3.3 Effects of Parameters
7.3 Exit Slip
7.3.5 Growth and Decay Situations
7.3.6 Identifying Exponential Functions
7.5.2 Percent Change and Exponential Functions
7.5.3 Percent Change Situations
7.5.4 Modeling Exponential Functions
7.5.5 Compound Interest
Unit 7 Test

Name: Date: Page 2 of 37
Activity 7.1.2 Hamden Public Schools 2016-2017 adapted from
Algebra I Model Curriculum Version 3.0
Is It a Good Deal?
In a previous activity you saw that the world population vs. year data did not fit a linear model.
Is there another kind of function that models the kind of growth we saw in the world population
vs. year data? Yes! The exponential family of functions! To get familiar with this family of
functions, let’s explore another situation.
Situation: You are offered a job where you will earn $0.02 on the first day of a job and
then double your earnings each day.
Question: Should you take this job? Is it a good deal? Explain why or why not.
1. The table shows the daily wages for this
job for the first nine days. Explain how
you know that the data in the table are
not linear.
2. Make a scatter plot of the nine data values from the table by hand or with your calculator.
Label and scale the axes.
Day
(x)
Amount Earned
(y)
1 0.02
2 0.04
3 0.08
4 0.16
5 0.32
6 0.64
7 1.28
8 2.56
9 5.12

Name: Date: Page 3 of 37
Activity 7.1.2 Hamden Public Schools 2016-2017 adapted from
Algebra I Model Curriculum Version 3.0
3. Describe all the patterns you see in the table and in your graph. Do the data look linear?
Explain.
4. Do you think this job is a good deal? Explain why or why not.
5. Use the home screen of your graphing calculator to model the pattern and extend the table.
First, clear the home screen.
Next, enter 0.02, your earnings for the first day. Press enter.
Your screen should look like this:
Now, multiply this number by 2 to find the daily wage for the second day.
To do this, press the multiplication key followed by 2. Press enter.
You will see “ANS*2” to tell you that you have just multiplied the previous
answer of .02 by 2. Your screen should now look like this:
To repeat the previous command (multiply the previous answer by 2) just press enter again.
Now you see the daily wage for day 3, which is $0.08.
Your screen should now look like this:
Now you can continue the pattern by pressing enter again and again.
The next time you press enter, you will have the amount you earn on day 4.
Continue to press the enter key and keep track of the function values to fill in the missing
values in the table. Begin filling in the amount earned on day 10.
Day
(x)
Amount
Earned (y)
Day
(x)
Amount
Earned (y)
Day
(x)
Amount
Earned (y)
1 0.02 11 21
2 0.04 12 22
3 0.08 13 23
4 0.16 14 24
5 0.32 15 25
6 0.64 16 26
7 1.28 17 27
8 2.56 18 28
9 5.12 19 29
10 20 30

Name: Date: Page 4 of 37
Activity 7.1.2 Hamden Public Schools 2016-2017 adapted from
Algebra I Model Curriculum Version 3.0
6. How much money would your earn on day 30? Is this what you expected?
7. Do you think this job is a good deal? Explain why or why not.
8. Did your opinion of this job change? Explain.
9. Here is another way to represent the amount of money you will earn over time.
a. Enter the function Y1 = 0.01*2^X in the Y= menu on your calculator.
b. Then go to Table Set up and enter TblStart = 0 and ∆Tbl = 1
c. Press 2nd
Table to view the table.
d. How does the table on the calculator compare with the one you made in question 5?

Name: Date: Page 5 of 37
Activity 7.2.1 Hamden Public Schools 2016-2017 adapted from
Algebra I Model Curriculum Version 3.0
Exploring Growth Patterns: A Comparison
The following pictures show walls being built section by section. They are called ‘growth
patterns’ because the heights of the walls grow with each section.
Pattern A. Complete the table below based on
pattern A shown to the right.
Section # (x)
# of Bricks NA(x)
Write a recursive rule for pattern A.
Pattern B. Complete the table below based on
pattern B shown to the right.
Section # (x)
# of Bricks NA(x)
Write a recursive rule for pattern B.
Pattern A
Pattern B

Name: Date: Page 6 of 37
Activity 7.2.1 Hamden Public Schools 2016-2017 adapted from
Algebra I Model Curriculum Version 3.0
Pattern C. Complete the table below based on
pattern C shown to the right.
Section # (x)
# of Bricks NA(x)
Write a recursive rule for pattern C.
Pattern D. Complete the table below based on
pattern D shown to the right.
Section # (x)
# of Bricks NA(x)
Write a recursive rule for pattern D.
Pattern C
Pattern D

Name: Date: Page 7 of 37
Activity 7.2.1 Hamden Public Schools 2016-2017 adapted from
Algebra I Model Curriculum Version 3.0
1. Describe how the patterns are similar.
2. Describe how the patterns are different from each other.
3. Decide whether each pattern shows linear growth or exponential growth and explain why.
Pattern A:
Pattern B:
Pattern C:
Pattern D:
4. Find the initial value for each pattern.
Pattern A:
Pattern B:
Pattern C:
Pattern D:
5. For each linear growth pattern find the rate of change.
Pattern _______ Rate of change ___________
Pattern _______ Rate of change ___________
Name: Date: Page 8 of 37
Activity 7.2.1 Hamden Public Schools 2016-2017 adapted from
Algebra I Model Curriculum Version 3.0
6. For each exponential growth pattern find the growth factor.
Pattern _______ Growth factor ___________
Pattern _______ Growth factor ___________
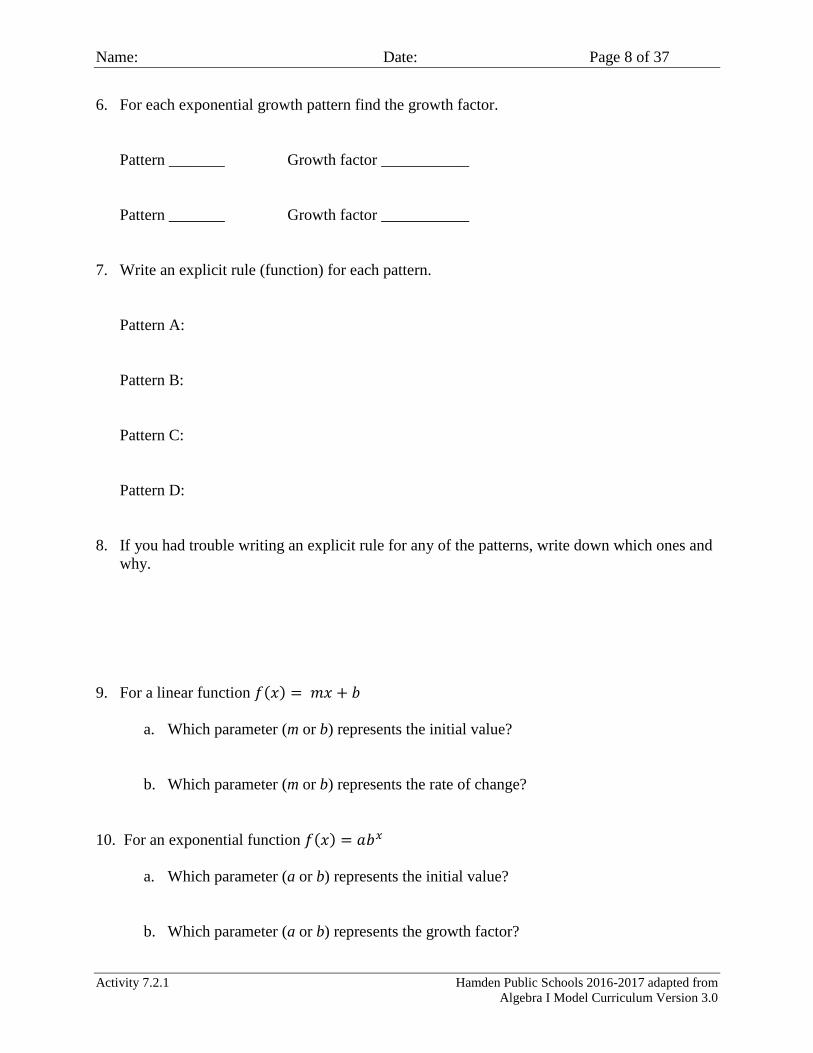
7. Write an explicit rule (function) for each pattern.
Pattern A:
Pattern B:
Pattern C:
Pattern D:
8. If you had trouble writing an explicit rule for any of the patterns, write down which ones and
why.
9. For a linear function 𝑓(𝑥) = 𝑚𝑥 + 𝑏
a. Which parameter (m or b) represents the initial value?
b. Which parameter (m or b) represents the rate of change?
10. For an exponential function 𝑓(𝑥) = 𝑎𝑏𝑥
a. Which parameter (a or b) represents the initial value?
b. Which parameter (a or b) represents the growth factor?

Name: Date: Page 9 of 60

Name: Date: Page 10 of 60

Name: Date: Page 11 of 60
Name: Date: Page 12 of 60

Name: Date: Page 13 of 60

Name: Date: Page 14 of 60

Name: Date: Page 15 of 60

Name: Date: Page 16 of 60

Name: Date: Page 17 of 60
Activity 7.2.2 Hamden Public Schools 2016-2017 adapted from
Algebra I Model Curriculum Version 3.0
The Meaning of Integer Exponents
To better understand exponential functions let’s review the meaning of exponents and how to
simplify exponential expressions.
Meaning of whole number exponents:
The exponent tells you how many times to repeat multiplication of the base by itself.
EX: 32
= 3∙3 = 9 EX: 74 = 7∙7∙7∙7 = 2401
EX: (–5)3
= (–5)∙(–5)∙(–5) = – 125 EX: –23 = – (2∙2∙2) = – 8
EX: (5
7)
2=
5
7∙
5
7 =
25
49
1. Simplify each expression by first writing out what it means. You can leave your answer in
exponential form (show the base(s) and exponent(s) – you do not need to evaluate.)
EX: (5)2 ∙ (5)4 = (5 ∙ 5) ∙ (5 ∙ 5 ∙ 5 ∙ 5) = 5 ∙ 5 ∙ 5 ∙ 5 ∙ 5 ∙ 5 = 56
EX: (43)2 = (4 ∙ 4 ∙ 4)2 = (4 ∙ 4 ∙ 4) ∙ (4 ∙ 4 ∙ 4) = 4 ∙ 4 ∙ 4 ∙ 4 ∙ 4 ∙ 4 = 46
EX: 23∙55
26∙52 = (2∙2∙2)∙(5∙5∙5∙5∙5)
(2∙2∙2∙2∙2∙2)∙(5∙5) =
5∙5∙5
2∙2∙2 =
53
23
a) 83 ∙ 85
b) (23)5
c) (1
7)
3
d) 34∙46
37∙45
Be careful! The negative sign is not part of the base!
Why? Because of order of operations.

Name: Date: Page 18 of 60
Activity 7.2.2 Hamden Public Schools 2016-2017 adapted from
Algebra I Model Curriculum Version 3.0
2. Simplify each expression by first writing out what it means. You can leave your answer in
exponential form (show the base(s) and exponent(s) – you do not need to evaluate for now).
a) 54 ∙ 56
b) (75)2
c) (23)3
d) 64∙86
67∙85
e) (2
9)
4
f) (3
8)
5
g) 23∙37
33∙22
h) 53∙32
34∙56
i) 32 ∙ 36
j) 64 ∙ 6
k) 54 ∙ 56
l) (94)3
m) (44)2

Name: Date: Page 19 of 60
Activity 7.2.2 Hamden Public Schools 2016-2017 adapted from
Algebra I Model Curriculum Version 3.0
You wrote out the exponential expressions on the last page to show their meaning and to
simplify them. What patterns do you notice?
3. Write down any patterns that you observe.
4. Now make up some examples of your own to show each pattern you found.
5. Discuss the patterns and examples with your class.

Name: Date: Page 20 of 60
Activity 7.2.2 Hamden Public Schools 2016-2017 adapted from
Algebra I Model Curriculum Version 3.0
Now let’s look at an exponential pattern in a table. We have examined exponential patterns like
this before. We can get from one output to the next output by using the constant multiplier 10.
The arrows and the box with the constant multiplier show this.
6. What is the pattern when we go backwards? Fill in the blank box below to describe how we
move from an output to the previous output. Then use the pattern to figure out the meaning of
zero and negative exponents. Write the values in decimal and in fraction form.
7. Explain in your own words what you think a zero exponent means. Then test your theory by
trying a zero exponent with a variety of bases on your calculator.
8. Explain in your own words what you think a negative exponent means. Then test your theory
by trying some negative exponents with a variety of bases on your calculator. (Try integer
and fractional bases. Convert all results to fractions to ‘see’ what happens.)
9. Discuss these ideas with the class.
x 10x Meaning Value
–3 10–3
–2 10–2
–1 10–1
0 100
1 101 10 10
2 102 10∙10 100
3 103 10∙10∙10 1,000
4 104 10∙10∙10∙10 10,000
5 105 10∙10∙10∙10∙10 100,000
6 106 10∙10∙10∙10∙10∙10 1,000,000
7 107 10∙10∙10∙10∙10∙10∙10 10,000,000
8 108 10∙10∙10∙10∙10∙10∙10∙10 100,000,000
× 10

Name: Date: Page 21 of 60
Activity 7.2.2 Hamden Public Schools 2016-2017 adapted from
Algebra I Model Curriculum Version 3.0
10. Use the meaning of exponents to write out each exponential expression to show what it
means and then simplify it.
EX: 2−3 = (1
2)
3= (
1
2) (
1
2) (
1
2) =
1∙1∙1
2∙2∙2=
13
23 =
1
8
EX: (3
5)
−2= (
5
3)
2= (
5
3) (
5
3) =
5∙5
3∙3=
52
32 = 25
9
a) 10−4
b) 5−6
c) (2
7)
−3
d) (1
4)
−2
e) 9−2
f) 8−5
g) (8
3)
−4

Name: Date: Page 22 of 60
Activity 7.2.3 Hamden Public Schools 2016-2017 adapted from
Algebra I Model Curriculum Version 3.0
Exploring the Meaning of Rational Exponents
1. What is a rational number? Why are they called rational numbers?
Now let’s figure out what a rational exponent means. We start with a specific example.
Look at the exponential pattern in the table below.
2. What do you think 91
2 means? What do you think is its value?
3. Does your estimate for 91
2 in question 2 fit the pattern in the table?
4. Does your estimate for 91
2 in question 2 fit with the rules for working with exponents?
Review some of the exponent rules on the next page and then return to this question.
x 9x Meaning Value
–3 9–3
1
9∙
1
9∙
1
9
1
729
–2 9–2
1
9∙
1
9
1
81
–1 9–1
1
9
1
9
0 90 1 1
1/2 9 1/2
1 91 9 9
2 92 9∙9 81
3 93 9∙9∙9 729

Name: Date: Page 23 of 60
Activity 7.2.3 Hamden Public Schools 2016-2017 adapted from
Algebra I Model Curriculum Version 3.0
Recall:
EX: 52 ∙ 54 = (5 ∙ 5) ∙ (5 ∙ 5 ∙ 5 ∙ 5) = 5 ∙ 5 ∙ 5 ∙ 5 ∙ 5 ∙ 5 = 56
EX: (43)2 = (4 ∙ 4 ∙ 4)2 = (4 ∙ 4 ∙ 4) ∙ (4 ∙ 4 ∙ 4) = 4 ∙ 4 ∙ 4 ∙ 4 ∙ 4 ∙ 4 = 46
5. Simplify each expression by writing out what it means first. Leave your answer in
exponential form.
a. 64 ∙ 63
d. 34 ∙ 37
b. (93)2
e. (85)3
c. 23 ∙ 25 f. (122)4
6. Describe the two ‘rules’ for working with exponents that you see in the patterns above.
7. Based on the rules, what should (91
2)2
mean? What should be its value?
8. Return to question 4. Does your estimate for 91
2 in question 2 fit with the rules for working
with exponents? Does that fit with the pattern in the table?
9. Discuss these ideas with your class and come up with your final estimate for the meaning of
91
2.

Name: Date: Page 24 of 60
Activity 7.2.3 Hamden Public Schools 2016-2017 adapted from
Algebra I Model Curriculum Version 3.0
10. What is the meaning of 251
2? What is the meaning of 491
2? Check your answers on a
calculator. (Hint: Because the calculator uses the order of operations you will need to enter
25^(1/2) for 251
2.)
11. You have seen that exponential growth may be modeled with the function 𝑓(𝑥) = 𝑎𝑏𝑥,
where a is the initial value and b is the growth factor. Suppose the number of bacteria in a
laboratory beaker after x days is modeled by 𝑓(𝑥) = 100 ∙ 4𝑥. Find how many bacteria are
in the beaker:
a. after 3 days. b. after 3
2 days. c. after
1
2 day.

Name: Date: Page 25 of 60
Activity 7.3.1 Hamden Public Schools 2016-2017 adapted from
Algebra I Model Curriculum Version 3.0
Building Walls
Hadrian and Paczkow are going to build two block walls with play wooden blocks. They decide
to build different kinds of walls. Paczkow's wall will use 20 + 3𝑥 blocks to build each section,
where x is the section number of the wall. Hadrian's wall will use 2 ∙ 3𝑥 blocks to build each
section, where x is the section number of the wall.
Equations that model the blocks needed for the sections of the walls:
Paczkow’s wall: 𝑦 = 20 + 3𝑥 Hadrian’s wall: 𝑦 = 2 ∙ 3𝑥
1. Each student has 400 blocks to build each wall. Predict who will run out of blocks first.
Explain your reasoning.
2. Fill out the following tables showing how many blocks are needed for each section.
Blocks needed for each section of the two different walls
1 2 3 4 5 6 7 8 9 10
𝑦 = 20 + 3𝑥
𝑦 = 2 ∙ 3𝑥
3. Will Paczkow have enough blocks to build 10 sections of his wall? Explain.
4. How many sections of wall will Hadrian be able to build? Show your reasoning.

Name: Date: Page 26 of 60
Activity 7.3.1 Hamden Public Schools 2016-2017 adapted from
Algebra I Model Curriculum Version 3.0
Comparing Exponential Functions
The class decides that even though he uses more blocks, Hadrian's wall is much better than
Paczkow's wall. However, two more students think they can build even better walls. Jericho's
wall will use (4 ∙ 3𝑥) blocks for each section and Qin's wall will use (2 ∙ 4𝑥) blocks for each
section.
Equation for number
of blocks in each
section
Hadrian Jericho Qin
𝑦 = 2 ∙ 3𝑥 𝑦 = 4 ∙ 3𝑥 𝑦 = 2 ∙ 4𝑥
5. Who do you think will use the most blocks in their wall if they each build a wall with 5
sections? Explain why.
6. Fill out each table below to see how many blocks are used in each wall.
Section # (x) 1 2 3 4 5
𝑦 = 2 ∙ 3𝑥
Section # (x) 1 2 3 4 5
𝑦 = 4 ∙ 3𝑥
Section # (x) 1 2 3 4 5
𝑦 = 2 ∙ 4𝑥
7. Write the general form of an exponential equation.
8. For Hadrian's equation (𝑦 = 2 ∙ 3𝑥), what are the "a" and "b" parameters?
a = __________ b = __________
9. 10. For Jericho's equation (𝑦 = 4 ∙ 3𝑥), what are the "a" and "b" parameters?
a = __________ b = __________
10. For Qin's equation (𝑦 = 2 ∙ 4𝑥), what are the "a" and "b" parameters?
a = __________ b = __________

Name: Date: Page 27 of 60
Activity 7.3.1 Hamden Public Schools 2016-2017 adapted from
Algebra I Model Curriculum Version 3.0
11. Who uses the most blocks in their 5-section wall (from the tables above)?
12. Which parameter do you think has a bigger influence in the equation? In other words,
increasing which parameter will make the function values get larger faster? Explain why.
Comparing Exponential Equations
For each pair of equations below, predict which equation will have larger results when x gets
large. Then, fill out the tables to test your prediction.
13. Equations: 𝑦 = 2 ∙ 5𝑥 or 𝑦 = 50 ∙ 2𝑥
Prediction:
x 1 2 3 4 5
𝑦 = 2 ∙ 5𝑥
𝑦 = 50 ∙ 2𝑥
14. Equations: 𝑦 = 20 ∙ 1𝑥 or 𝑦 = 1 ∙ 2𝑥
Prediction:
x 1 2 3 4 5
𝑦 = 20 ∙ 1𝑥
𝑦 = 1 ∙ 2𝑥

Name: Date: Page 28 of 60
Activity 7.3.1 Hamden Public Schools 2016-2017 adapted from
Algebra I Model Curriculum Version 3.0
Interdisciplinary Extensions: Math in the Real World
15. Why were "Hadrian", "Paczkow", and "Qin" used in this activity? (HINT: Google them!)
16. How many bricks were used to build the Great Wall of China?
17. How long did it take to build the Great Wall of China?
18. How many bricks were used to build Hadrian's Wall?
19. How long did it take to build Hadrian's wall?
20. Is it more likely that you would model a real wall using a linear equation, an exponential
equation, or some other equation? Explain why.

Name: Date: Page 29 of 60
Activity 7.3.3 Hamden Public Schools 2016-2017 adapted from
Algebra I Model Curriculum Version 3.0
Effects of Parameters
An exponential function is a function of the form 𝑓(𝑥) = 𝑎 ∙ 𝑏𝑥. In the previous activity we
explored the roles of parameters a and b. In this activity we will examine the b parameter more
closely. This parameter determines whether the function is increasing or decreasing and impacts the
steepness of the curve.
1. Based on what we have already seen, what does the parameter a indicate about the function and
the graph?
Now let’s look at functions for which a = 2, that is, functions of the form 𝑓(𝑥) = 2 ∙ 𝑏𝑥. Let’s see
what happens when we change the value of b.
Use your calculator to fill in the tables for questions 2–6. Then plot points by hand and sketch the
graph. Answer the questions about each graph.
2. 𝑦 = 2 ∙ 2𝑥
x y
–2
–1
0
1
2
3
a. Where is the y-intercept?
b. Is the function increasing or decreasing?

Name: Date: Page 30 of 60
Activity 7.3.3 Hamden Public Schools 2016-2017 adapted from
Algebra I Model Curriculum Version 3.0
3. 𝑦 = 2 ∙ 3𝑥
x y
–2
–1
0
1
2
3
4
a. Where is the y-intercept?
b. Is the function increasing or decreasing?
c. How does the steepness of the graph compare with 𝑦 = 2 ∙ 2𝑥?
4. 𝑦 = 2 ∙ 4𝑥
x y
–2
–1
0
1
2
3
a. Where is the y-intercept?
b. Is the function increasing or decreasing?
c. How does the steepness of the graph compare with 𝑦 = 2 ∙ 2𝑥?
d. How does the steepness of the graph compare with 𝑦 = 2 ∙ 3𝑥?

Name: Date: Page 31 of 60
Activity 7.3.3 Hamden Public Schools 2016-2017 adapted from
Algebra I Model Curriculum Version 3.0
5. 𝑦 = 2 ∙ (1
2)
𝑥
x y
–4
–3
–2
–1
0
1
2
3
a. Where is the y-intercept?
b. Is the function increasing or decreasing?
c. How is this graph related to the graph in question 2, 𝑦 = 2 ∙ 2𝑥?
6. 𝑦 = 2 ∙ (1
4)
𝑥
x y
–2
–1
0
1
2
3
a. Where is the y-intercept?
b. Is the function increasing or decreasing?
c. How does the steepness of this graph compare with 𝑦 = 2 ∙ (1
2)
𝑥?

Name: Date: Page 32 of 60
Activity 7.3.3 Hamden Public Schools 2016-2017 adapted from
Algebra I Model Curriculum Version 3.0
For questions 7–12, first answer the question. Then check your answer on the calculator. You may
have to adjust your window to get a good view of the graphs.
7. Which function, 𝑓(𝑥) = 3(1.1)𝑥 or 𝑓(𝑥) = 3(1.2)𝑥 is steeper? Explain how you know.
8. Which function, 𝑓(𝑥) = 3(1.2)𝑥 or 𝑓(𝑥) = 3(1.25)𝑥 is steeper? Explain how you know.
9. Which function, 𝑓(𝑥) = 3(1.1)𝑥 or 𝑓(𝑥) = 3(0.11)𝑥 is an increasing function? Explain how
you know.
10. Which function, 𝑓(𝑥) = 3 (6
7)
𝑥 or 𝑓(𝑥) = 3 (
7
6)
𝑥 is a decreasing function? Explain how you
know.
11. Which function, 𝑓(𝑥) = 3(1 + .02)𝑥 or 𝑓(𝑥) = 3(1 – .02)𝑥
, is an increasing function?
Explain how you know.
12. Which function, 𝑓(𝑥) = 300(. 7 + .4)𝑥 or 𝑓(𝑥) = 300(1.7 + .2 )𝑥, is a decreasing
function? Explain how you know.

Name: Date: Page 33 of 60
Activity 7.3.3 Hamden Public Schools 2016-2017 adapted from
Algebra I Model Curriculum Version 3.0
Domain and Range of Exponential Functions
13. Look at the table and graph for 𝑦 = 2 ∙ 2𝑥 in question 2, and answer these questions.
a. Are there any restrictions on x? Can x be any positive number? Can x be zero? Can x be any
negative number?
b. Based on your answer to (a) what is the domain of this function?
c. Are there any restrictions on y? Can y be any positive number? Can y be zero? Can y be any
negative number?
d. Based on your answer to (c) what is the range of this function?
14. Look at the table and graph for 𝑦 = 2 ∙ (1
2)
𝑥 in question 5, and answer these questions.
a. Are there any restrictions on x? Can x be any positive number? Can x be zero? Can x be any
negative number?
b. Based on your answer to (a) what is the domain of this function?
c. Are there any restrictions on y? Can y be any positive number? Can y be zero? Can y be any
negative number?
d. Based on your answer to (c) what is the range of this function?

Name: Date: Page 34 of 60
Activity 7.3.3 Hamden Public Schools 2016-2017 adapted from
Algebra I Model Curriculum Version 3.0
Special Cases: You have looked at functions for which b > 1 and for which 0 < b < 1. Now consider
these special cases.
15. Let b = 1. Make a table and sketch a graph of the function 𝑦 = 2 ∙ 1𝑥
x y
–2
–1
0
1
2
3
a. What is unusual about this function?
b. What are the domain and range for this function?
16. Let b = 0. Make a table and sketch a graph of the function 𝑦 = 2 ∙ 0𝑥, for values of x greater than
zero.
x y
1
2
3
4
a. What is unusual about this function?
b. Why is –1 not in the domain of this function?
c. Enter 0^0 in your calculator. What is the result?
x
y
x
y

Name: Date: Page 35 of 60
Activity 7.3.3 Hamden Public Schools 2016-2017 adapted from
Algebra I Model Curriculum Version 3.0
17. Let b < 0. Make a table for the function 𝑦 = 2 ∙ (−2)𝑥.
x y
–2
–1
0
1
2
3
4
a. Describe any patterns you see in the table.
b. Enter Y1 = 2*(–2)^X in your calculator. Use the Zoom4 Decimal Window. Describe what the
graph looks like.
18. When exponential functions are studied, usually we only consider cases where b > 1 or
0 < b < 1. Why do you think this is?
Name: Date: Page 36 of 60
Activity 7.3.5 Hamden Public Schools 2016-2017 adapted from
Algebra I Model Curriculum Version 3.0
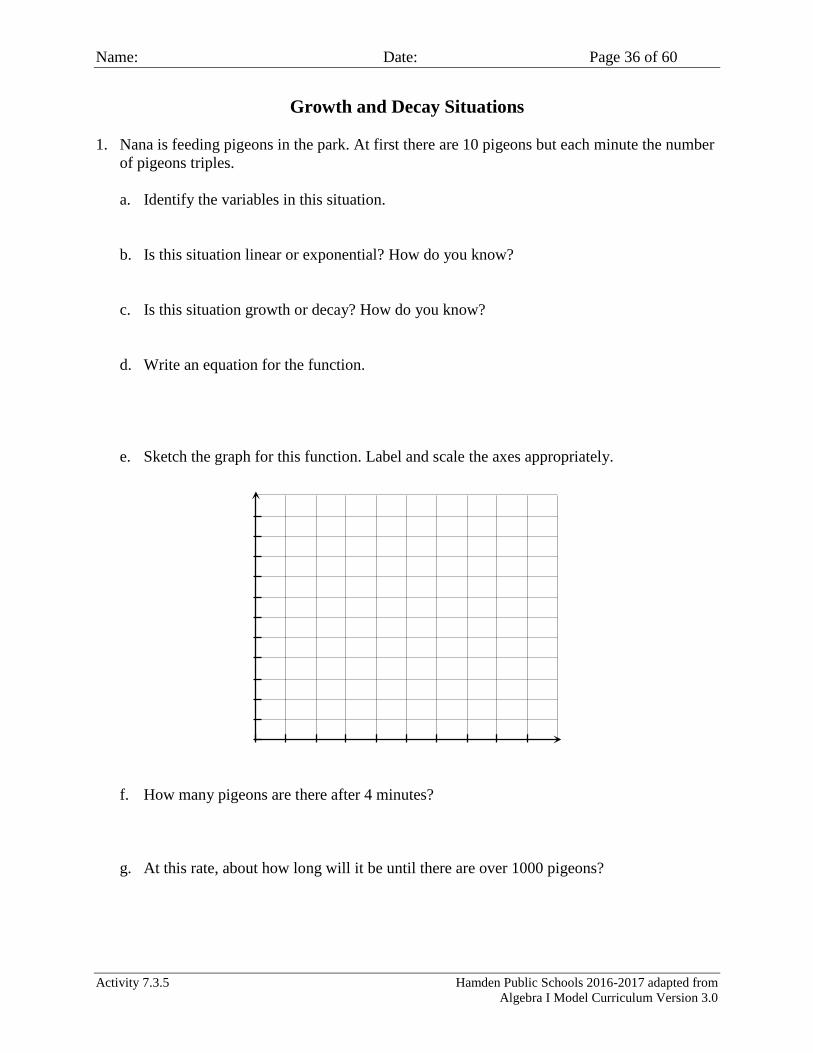
Growth and Decay Situations
1. Nana is feeding pigeons in the park. At first there are 10 pigeons but each minute the number
of pigeons triples.
a. Identify the variables in this situation.
b. Is this situation linear or exponential? How do you know?
c. Is this situation growth or decay? How do you know?
d. Write an equation for the function.
e. Sketch the graph for this function. Label and scale the axes appropriately.
f. How many pigeons are there after 4 minutes?
g. At this rate, about how long will it be until there are over 1000 pigeons?

Name: Date: Page 37 of 60
Activity 7.3.5 Hamden Public Schools 2016-2017 adapted from
Algebra I Model Curriculum Version 3.0
2. Sasha has a poison ivy rash that covers 82 square inches of area on her body. A doctor gave
her a medicated cream to apply on the rash. Since she began applying the cream, each day
the rash is only 1/3 of the size it was the day before.
a. Identify the variables in this situation.
b. Is this situation linear or exponential? How do you know?
c. Is this situation growth or decay? How do you know?
d. Write an equation for the function.
h. Sketch the graph for this function below. Label and scale the axes appropriately.
e. How much of the rash is left after a week?
f. How many days is it until Sasha has less than 1 square inch of the rash left?

Name: Date: Page 38 of 60
Activity 7.3.5 Hamden Public Schools 2016-2017 adapted from
Algebra I Model Curriculum Version 3.0
3. Keisha’s scarf was 10 inches long. Each day she knitted another 15 inches.
a. Identify the variables in this situation.
b. Is this situation linear or exponential? How do you know?
c. Is this situation growth or decay? How do you know?
d. Write an equation for the function.
e. Sketch the graph for this function. Label and scale the axes appropriately.
f. How long was the scarf after 6 days?
g. About how many days will it take until the scarf is over 300 feet long?

Name: Date: Page 39 of 60
Activity 7.3.5 Hamden Public Schools 2016-2017 adapted from
Algebra I Model Curriculum Version 3.0
4. Charles borrows $100 from his friend and each month he pays him half of the remaining
balance.
a. Identify the variables in this situation.
b. Is this situation linear or exponential? How do you know?
c. Is this situation growth or decay? How do you know?
d. Write an equation for the function.
e. Sketch the graph for this function. Label and scale the axes appropriately.
f. How much money will Charles pay back in month five?

Name: Date: Page 40 of 60
Activity 7.3.5 Hamden Public Schools 2016-2017 adapted from
Algebra I Model Curriculum Version 3.0
5. Johhny Appleseed left Massachusetts with 6000 seeds. Each week he planted 100 of them.
a. Identify the variables in this situation.
b. Is this situation linear or exponential? How do you know?
c. Is this situation growth or decay? How do you know?
d. Write an equation for the function.
e. Sketch the graph for this function. Label and scale the axes appropriately.
f. How long did his seeds last?

Name: Date: Page 41 of 60
Activity 7.3.5 Hamden Public Schools 2016-2017 adapted from
Algebra I Model Curriculum Version 3.0
6. Josie runs 200 meters in 24.47 seconds. She wants to decrease her running time by 0.1
seconds in each race.
a. Identify the variables in this situation.
b. Is this situation linear or exponential? How do you know?
c. Is this situation growth or decay? How do you know?
d. Write an equation for the function.
e. Sketch the graph for this function. Label and scale the axes appropriately.
f. What would she like her running time be in her third race?

Name: Date: Page 42 of 60
Activity 7.3.6 Hamden Public Schools 2016-2017 adapted from
Algebra I Model Curriculum Version 3.0
Identifying Exponential Functions
1. Each of the tables below represents a function. For each table, determine if the data show an
exponential function or not. Then, explain your reasoning.
A. x 0 1 2 3 4 5
y 3 6 12 24 48 96
Exponential? (Yes or No) Explain:
B. x 0 1 2 3 4 5
y 4 8 12 16 20 24
Exponential? (Yes or No) Explain:
C. x 0 1 2 3 4 5
y 5 6 9 14 21 30
Exponential? (Yes or No) Explain:
D. x 0 1 2 3 4 5
f(x) 10 12 14.4 17.28 20.736 24.8832
Exponential? (Yes or No) Explain:
E. x 0 1 2 3 4 5
f(x) 25 5 1 0.2 0.04 0.008
Exponential? (Yes or No) Explain:
F. x 1 2 3 4 5 2
f(x) 1 2 4 7 11 16
Exponential? (Yes or No) Explain:

Name: Date: Page 43 of 60
Activity 7.3.6 Hamden Public Schools 2016-2017 adapted from
Algebra I Model Curriculum Version 3.0
Determining the Parameters of an Exponential Equation
2. Write the general form of the equation for an exponential function.
3. Substitute "0" for "x" in the general form of the equation. What happens to the equation?
4. Write the new equation after evaluating for x = 0.
5. What does the parameter "a" represent in the general form of the equation?
6. In a table of values for an exponential pattern, how can you "find" the value of "a"?
7. What does the parameter "b" represent in the general form of the equation?
8. In a table of values for an exponential pattern, how can you "find" the value of "b"?
Table A
9. Table A shows an exponential pattern. How do we know it is exponential?
10. What is the growth factor for the data?
11. What is the initial value?
12. What is the equation for this function?

Name: Date: Page 44 of 60
Activity 7.3.6 Hamden Public Schools 2016-2017 adapted from
Algebra I Model Curriculum Version 3.0
Table D
13. Table D shows an exponential pattern. How do we know it is exponential?
14. What is the growth factor for the data?
15. What is the initial value?
16. What is the equation for this function?
Table E
17. Table E shows an exponential pattern. How do we know it is exponential?
18. What is the growth factor for the data?
19. Are the data in this table really growing?
20. What is the initial value?
21. What is the equation for this function?
Let’s Summarize
22. How do you find the "a" and "b" parameters for an exponential equation from a table?
Table B 23. The function in Table B is not an exponential function. Explain why it is not an exponential
function.
24. Can you identify the type of function show in Table B?

Name: Date: Page 45 of 60
Activity 7.3.6 Hamden Public Schools 2016-2017 adapted from
Algebra I Model Curriculum Version 3.0
Table C
25. The function in Table C is not an exponential function. Explain why it is not an exponential
function.
26. Is the function in Table C a linear function? Explain why or why not.
Table F
27. Table F does not show an exponential pattern. Explain why some people might think it is
exponential. Explain why it is not exponential.

Name: Date: Page 46 of 60
Activity 7.5.2 Hamden Public Schools 2016-2017 adapted from
Algebra I Model Curriculum Version 3.0
Percent Change and Exponential Functions
Growth of Cell Phones
1. Cell phones were introduced in the United States in the mid-1980s. In 1985 (time 0), there
were 300,000 cell phones in use. The number of cell phones then increased by about 50%
each year for the next several years.
a. Fill in the table to show approximately how many cell phones were in use in the U.S. in
the years following 1985.
Years after 1985 Number of cell
phones in the U.S.
0
1
2
3
4
5
b. What is the growth factor you can use to calculate
the number of cell phones in the U.S. the
next year?
c. Make a graph of your data on the grid.
Scale and label the axes appropriately.
d. What is the y-intercept of your graph? What does it mean in this situation?
e. Describe the function pattern you see in the table and the graph.
Name: Date: Page 47 of 60
Activity 7.5.2 Hamden Public Schools 2016-2017 adapted from
Algebra I Model Curriculum Version 3.0
f. Use what you know about this kind of function to write an equation that models this
situation. Be sure to identify the variables you use.
g. Use your equation to predict how many cell phones there would have been in the year
1995.
h. Do you think that your estimate in (g) is accurate? Why or why not? (Think: How many
people lived in the United States in 1995?)
i. Use your equation to predict how many cell phones there will be in the year 2015.
j. Do you think that your estimate in (i) is accurate? Why or why not?

Name: Date: Page 48 of 60
Activity 7.5.2 Hamden Public Schools 2016-2017 adapted from
Algebra I Model Curriculum Version 3.0
Efficacy of Organic Pesticide
2. An agricultural student is testing a new organic pesticide. The manufacturer of the pesticide
claims the pesticide reduces the number of crop eating insects by 90% at each application
without causing harm to the environment. The student estimates the number of insects in a
test plot and then sprays the test plot once a day. She does this for three days. The results are
found in the table below.
Number of Days Number of Insects Remaining
0 200
1 20
2 2
3 0
a. Do these results confirm the claim? Explain how you know.
b. What is the equation that models this relationship between number of insects and time?
c. Suppose the student tries this pesticide on a plot with 1,000,000 insects. Assume the
claim is true and the pesticide reduces the number of insects by 90% each day. How
many insects will be left after 3 days?
d. If the pesticide reduces the number of insects by 90% each day, how many days will it
take for there to be no insects left on this plot? Justify your answer.

Name: Date: Page 49 of 60
Activity 7.5.2 Hamden Public Schools 2016-2017 adapted from
Algebra I Model Curriculum Version 3.0
Summary. When amounts change by the same percent after a given unit of time, we can use the
percentage rate, r, to find a single growth factor or decay factor to get the new amount. If we
want to know the new amount after x units of time, we just use the growth factor (or decay
factor) on the original amount x times. Instead or writing out the multiplication over and over
again, we use the fact that an exponent indicates repeated multiplication. Let’s look more closely
at our two examples.
Cell Phones: Cell phones were introduced in the United States in the mid-1980s. In 1985
(time 0), there were 300,000 cell phones in use. The number of cell phones then increased by
about 50% each year for the next several years. (Growth factor = 1 + 0.50 = 1.50)
After 1 year 300,000(1.5) = 300,000(1.5)1 = 450,000
After 2 years (300,000(1.5))∙(1.5) = 300,000(1.5)2
= 675,000
After 3 years (300,000(1.5)(1.5))∙(1.5) = 300,000(1.5)3
= 1,012,500
After 4 years (300,000(1.5)(1.5)(1.5))∙(1.5) = 300,000(1.5)4
= 1,518,750
After x years 300,000 ∙ (1.5)(1.5)(1.5)∙ ∙ ∙ (1.5) = 300,000(1 + 0.5)x
= 300,000(1.5)x
x times
Organic Pesticide: An agricultural student is testing a new organic pesticide. It is claimed that
the new organic pesticide reduces the number of crop eating insects by 90% each day when
applied daily without causing harm to the environment. Suppose there are 1,000,000 insects on a
certain plot to start. (Decay factor = 1 – 0.90 = 0.10)
After 1 day 1,000,000(0.1) = 1,000,000(0.1)1 = 100,000
After 2 days (1,000,000(0.1))∙(0.1) = 1,000,000(0.1)2
= 10,000
After 3 days (1,000,000(0.1)(0.1))∙(0.1) = 1,000,000(0.1)3
= 1,000
After 4 days (1,000,000(0.1)(0.1)(0.1))∙(0.1) = 1,000,000(0.1)4
= 100
After x days 1,000,000 ∙ (0.1)(0.1)(0.1)∙ ∙ ∙ (0.1) = 1,000,000(1 – 0.9)x
= 1,000,000(0.1)x
x times
3. Suppose cell phone usage increased by 40% each year instead of 50%. Write an expression
for the number of cell phones after x years.
4. Suppose the organic pesticide reduced the number of crop-eating insects by 85% each day
instead of 90%. Write an expression for the number of insects left after x days.

Name: Date: Page 50 of 60
Activity 7.5.3 Hamden Public Schools 2016-2017 adapted from
Algebra I Model Curriculum Version 3.0
Percent Change Situations
For each problem:
A. Decide whether each situation is growth or decay and explain how you know.
B. Decide whether each situation is linear or exponential and explain how you know.
C. Identify your variables and write an equation for the function.
D. Answer the related question(s).
1. My pet iguana was 20 cm long when I got him. Then each month his length was 8% longer
than the month before.
A.
B.
C.
D. How long was he after a year?
2. Tom’s ATV (all-terrain vehicle) was worth $800 when he purchased it. Each year it lost 16%
of its value.
A.
B.
C.
D. How much was it worth after 4 years?

Name: Date: Page 51 of 60
Activity 7.5.3 Hamden Public Schools 2016-2017 adapted from
Algebra I Model Curriculum Version 3.0
3. Sue’s scarf was only 8 inches long. Her grandmother took it and each day she knitted 75% of
its original length.
A.
B.
C.
D. How long was the scarf after 5 days?
4. Aunt Amy starts feeding four seagulls at the beach. Each minute the number of seagulls
wanting to feed from her is about 50% more than the number there the minute before.
A.
B.
C.
D. How many seagulls is she feeding eight minutes later?

Name: Date: Page 52 of 60
Activity 7.5.3 Hamden Public Schools 2016-2017 adapted from
Algebra I Model Curriculum Version 3.0
5. You lend $75 to your brother, and each month for a year he will pay you only simple interest
of 5%. Then at the end of the year he will have to pay you the $75 back.
First find out what simple interest means. Explain it here.
A.
B.
C.
D. How much total interest will your brother have paid you at the end of the year?
6. A local pond started with about 2400 fish. Due to contamination, the number of fish in the
pond decreased. Each week the lake lost about 12% of the fish from the week before.
A.
B.
C.
D. How long until there is less than half of the original fish population left?

Name: Date: Page 53 of 60
Activity 7.5.4 Hamden Public Schools 2016-2017 adapted from
Algebra I Model Curriculum Version 3.0
Modeling Exponential Functions: What is the Percent Change?
In this activity we will identify whether situations are exponential growth or exponential decay,
determine the percent rate of change (percent change), write equations that model situations and
use the equations to solve problems.
1. Kerosene, a fuel oil used for heaters and jet engines, is running through a pipe. A filter is
placed inside the pipe to remove harmful pollutants. The percentage of pollutants that will be
left depends on the length of the filter. The table below shows this relationship.
a. What is the constant multiplier?
b. Is it a growth factor or a decay factor?
c. What is the percent rate of change?
d. Write an equation that models this situation.
e. How much pollutant will be left if the filter is 6 feet long?
f. How long must the filter be to have less than 10% pollutant, which is a safe level for use
in jets?
2. Goombas are a fictional species of animated mushrooms in Super Mario Galaxy 2. There
population growth over time is shown in the table below.
a. What is the constant multiplier?
b. Is it a growth factor or a decay factor?
c. What is the percent rate of change?
d. Write an equation that models this situation.
e. When would the number of Goombas reach 260?
Filter Length
(feet)
Percentage of
Pollutant Left
0 50
1 40
2 32
3 25.6
4 20.48
Month Goomba
Population
0 120
1 130.8
2 142.57
3 155.4
4 169.39

Name: Date: Page 54 of 60
Activity 7.5.4 Hamden Public Schools 2016-2017 adapted from
Algebra I Model Curriculum Version 3.0
3. The rabbit population at Multiplication Farms is shown in the table below.
a. What is the constant multiplier?
b. Is it a growth factor or a decay factor?
c. What is the percent rate of change?
d. Write an equation that models this situation.
e. How many rabbits will there be after 9 months?
f. When would the population of rabbits exceed 10 million?
4. The amount of aspirin in the bloodstream x hours after taking a 325mg pill is shown in the
table.
a. What is the constant multiplier?
b. Is it a growth factor or a decay factor?
c. What is the percent rate of change?
d. Write an equation that models this situation.
e. If you need 120 mg in the bloodstream to be effective, when should you take another
aspirin?
Month Rabbit
Population
0 6
1 12
2 24
3 48
4 96
Hour Milligrams of
Aspirin
0 325
1 276.25
2 234.81
3 199.59
4

Name: Date: Page 55 of 60
Activity 7.5.4 Hamden Public Schools 2016-2017 adapted from
Algebra I Model Curriculum Version 3.0
5. The fish population (in hundreds) in a pond is shown in the table below.
a. What is the constant multiplier?
b. Is it a growth factor or a decay factor?
c. What is the percent rate of change?
d. Write an equation that models this situation.
e. How many fish will there be in the pond after 8 months?
f. When would the population be over 5000 fish? (5,000 = ______ hundred)
6. The amount of chlorine in a swimming pool is shown in the table below.
a. What is the constant multiplier?
b. Is it a growth factor or a decay factor?
c. What is the percent rate of change?
d. Write an equation that models this situation.
e. How much chlorine will there be after 5 days?
f. If 100 grams of chlorine is needed to be effective, when should they put in another tablet
of chlorine?
Month
Fish
Population
(in hundreds)
0 30
1 31.5
2 33.08
3 34.73
4 36.47
Day Grams of
Chlorine
0 400
1 320
2 256
3 204.8
4
Name: Date: Page 56 of 60
Activity 7.5.4 Hamden Public Schools 2016-2017 adapted from
Algebra I Model Curriculum Version 3.0
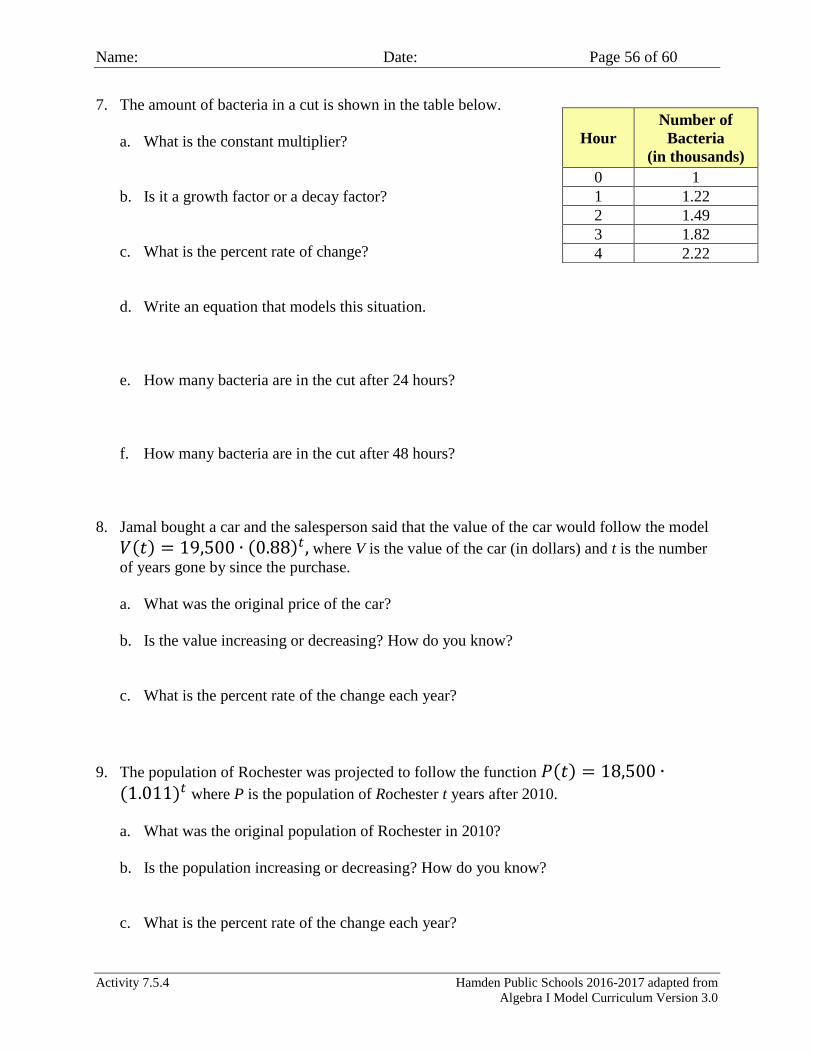
7. The amount of bacteria in a cut is shown in the table below.
a. What is the constant multiplier?
b. Is it a growth factor or a decay factor?
c. What is the percent rate of change?
d. Write an equation that models this situation.
e. How many bacteria are in the cut after 24 hours?
f. How many bacteria are in the cut after 48 hours?
8. Jamal bought a car and the salesperson said that the value of the car would follow the model
𝑉(𝑡) = 19,500 ∙ (0.88)𝑡, where V is the value of the car (in dollars) and t is the number
of years gone by since the purchase.
a. What was the original price of the car?
b. Is the value increasing or decreasing? How do you know?
c. What is the percent rate of the change each year?
9. The population of Rochester was projected to follow the function 𝑃(𝑡) = 18,500 ∙(1.011)𝑡 where P is the population of Rochester t years after 2010.
a. What was the original population of Rochester in 2010?
b. Is the population increasing or decreasing? How do you know?
c. What is the percent rate of the change each year?
Hour
Number of
Bacteria
(in thousands)
0 1
1 1.22
2 1.49
3 1.82
4 2.22

Name: Date: Page 57 of 60
Activity 7.5.5 Hamden Public Schools 2016-2017 adapted from
Algebra I Model Curriculum Version 3.0
Compound Interest
1. $10,000 is invested in a certificate of deposit (CD) that pays interest at the rate of 3% per
year compounded annually. This means that every year the interest is computed and then
added to the principal. This is shown in the table below. The first three years have been filled
in.
Column 1 Column 2 Column 3 Column 4
Year
Principal at the
beginning of the year
(same as principal at
the end of the
previous year)
Interest for the year
(= amount in Column
2 times 0.03)
Principal at the end
of the year
(= amount in column
2 + amount in column
3)
1 $10,000.00 $300.00 $10,300.00
2 $10,300.00 $309.00 $10,609.00
3 $10,609.00 $318.27 $10,927.27
4
5
6
7
8
9
10
a. Complete the table above. (Round answers to the nearest cent.)
b. Describe any patterns you see in the table.
c. Do the amounts in Column 4 appear to be growing linearly or exponentially? How can
you tell?
d. The amount each year can be considered a percent increase of 3%. You have learned
earlier that this corresponds to multiplying by a growth factor. What is the growth factor
in this situation?
e. You can generate the numbers in column 4 using the constant multiplication feature of
your calculator. Follow these steps:
i. Type in 10,000 and press ENTER.
ii. Press * 1.03 and press ENTER.
iii. Press ENTER 9 more times.
What do you notice?

Name: Date: Page 58 of 60
Activity 7.5.5 Hamden Public Schools 2016-2017 adapted from
Algebra I Model Curriculum Version 3.0
f. Write an explicit equation for the function that gives the value of the CD after x years.
g. Substitute x = 10 in your function. Do you get the same result as in the table and in step
(e)?
2. Suppose you take out a loan for $10,000 and agree to pay it back ten years later. The interest
rate is 3%, but it is not compounded. (This is what is called “simple interest”).
a. Each year you pay the same amount for the interest. What is that amount?
b. What is the total amount you will pay by the end of the tenth year, including the principal
plus the interest?
3. The situations in questions 1 and 2 illustrate the difference between compound interest and
simple interest. One may be considered linear growth and the other exponential growth.
Which is which? Explain your reasoning.
4. Write an explicit equation for each of these situations.
a. $500 is invested in a bond paying 8% interest compounded annually. What is the value of
the bond after x years?
b. $1000 is invested in a bond paying 5% interest compounded annually. What is the value
of the bond after x years
c. Which of the two bonds in questions (a) and (b) will be worth more after 30 years? How
much more?

Name: Date: Page 59 of 60
Activity 7.5.5 Hamden Public Schools 2016-2017 adapted from
Algebra I Model Curriculum Version 3.0
5. Sometimes interest is compounded more frequently than every year. For example, suppose
the CD in question 1 pays the same rate of interest (3% per year) but the compounding takes
place at the end of each month.
a. 3% per year is equivalent to ______% per month.
b. If the CD is held for 10 years, how many times will the interest be compounded?
c. Write an exponential function that shows how much this CD is worth after x months.
d. How much will the CD be worth after 120 months?
e. How does the value of this CD after 10 years compare with the value of the CD in
question 1 after 10 years?
f. Explain why the two values in (e) are different.

Name: Date: Page 60 of 60
Activity 7.5.5 Hamden Public Schools 2016-2017 adapted from
Algebra I Model Curriculum Version 3.0
6. If you visit a bank or a credit union you will see that certificates of deposit are often
described by APY. This stands for annual percentage yield. Here’s how that works. Suppose
the rate of interest is 6% and the interest is compounded monthly.
a. At the end of each month, what percent of the investment will be added on? This is the
monthly rate of interest.
b. The growth factor for one month will be of the form 1 + r, where r is the monthly rate of
interest. What is the growth factor for one month?
c. At the end of the year the principle will have been multiplied how many times by 1+r?
d. If P is the principal, at the end of the year the investment will be worth 𝑃(1 + 𝑟)____.
e. If the interest rate is 6% and the money is compounded every month, what will be the
growth factor for the year?
f. What annual rate of interest corresponds with the growth factor in (e)? This is the APY.
g. Suppose instead of compounding every month, the bank compounds only twice a year.
Suppose the interest rate is 6% per year. Find the APY for this investment.