ALFRED MARSHALL LECTURE SHAREHOLDER PROTECTION, STOCK MARKET DEVELOPMENT, AND POLITICS
40
WORKING PAPER NO. 149 Shareholder Protection, Stock Market Development, and Politics Marco Pagano and Paolo Volpin November 2005 Forthcoming on the Journal of the European Economic Association University of Naples Federico II University of Salerno Bocconi University, Milan CSEF - Centre for Studies in Economics and Finance – UNIVERSITY OF SALERNO 84084 FISCIANO (SA) - ITALY Tel. +39 089 96 3167/3168 - Fax +39 089 96 3167 – e-mail: [email protected]
Transcript of ALFRED MARSHALL LECTURE SHAREHOLDER PROTECTION, STOCK MARKET DEVELOPMENT, AND POLITICS

WWOORRKKIINNGG PPAAPPEERR NNOO.. 114499
Shareholder Protection,
Stock Market Development, and Politics
Marco Pagano and Paolo Volpin
November 2005
Forthcoming on the Journal of the European Economic Association
University of Naples Federico II
University of Salerno
Bocconi University, Milan
CSEF - Centre for Studies in Economics and Finance – UNIVERSITY OF SALERNO 84084 FISCIANO (SA) - ITALY
Tel. +39 089 96 3167/3168 - Fax +39 089 96 3167 – e-mail: [email protected]


WWOORRKKIINNGG PPAAPPEERR NNOO.. 114499
Shareholder Protection,
Stock Market Development, and Politics
Marco Pagano♥ and Paolo Volpin♦
Abstract This paper presents a political economy model where there is mutual feedback between investor protection and stock market development. Better investor protection induces companies to issue more equity and thereby leads to a broader stock market. In turn, equity issuance expands the shareholder base and increases support for shareholder protection. This feedback loop can generate multiple equilibria, with investor protection and stock market size being positively correlated across equilibria. The model’s predictions are tested on panel data for 47 countries over 1993-2002, controlling for country and year effects and endogeneity issues. We also document international convergence in shareholder protection to best-practice standards, and show that it is correlated with cross-border M&A activity, consistent with the model. JEL classification: G34, K22, K42. Keywords: political economy, shareholder protection, corporate governance, stock market development. Authors’ addresses: Marco Pagano, Facoltà di Economia, Università di Napoli Federico II, Via Cintia, 80126 Napoli, Italy, phone +39-081-5752508, fax +39-081-5752243; e-mail [email protected]. Paolo Volpin, Institute of Finance and Accounting, London Business School, Regent’s Park, London NW1 4SA, U.K., phone +44-20-72625050, fax +44-20-77243317; e-mail: [email protected]. Acknowledgements: This is the text of the Marshall Lecture delivered at the 20th Annual Congress of the European Economic Association, Amsterdam, 27 August 2005. We thank Abhijit Banerjee, Alberto Bennardo, Tullio Jappelli, Riccardo Martina, Ashok Mody, Marco Pagnozzi, Luigi Spaventa, Jean Tirole, Elu von Thadden, and other participants to the 2005 CSEF-IGIER Symposium on Economics and Institutions for insightful comments and suggestions. Marco Pagano acknowledges financial support by the Fondazione IRI.
♥ Università di Napoli Federico II, CSEF, CEPR and ECGI. ♦ London Business School, CEPR and ECGI.


Contents
1. Introduction
2. The Model
2.1. Assumptions
2.2. Equilibrium
3. Discussion and Extensions
3.1. Dynamic inconsistency of managers and timing of elections
3.2. International convergence
4 Empirical Evidence
4.1 Data description
4.2 Empirical relation between stock market development and shareholder protection
4.3 Convergence and its determinants
5 Conclusions
References


7
1. Introduction
A central idea of corporate finance is that the separation between ownership and control creates a
conflict of interest within companies: absent appropriate incentives, managers (or controlling
shareholders) will use their control over the company’s resources to their own advantage and to the
detriment of non-controlling shareholders. Even though private contracting can go a long way
towards tempering this agency problem (via incentive-based compensation and various corporate
governance mechanisms), regulation may help restrain managerial opportunism. For instance,
company law can allow dispersed shareholders to detect managerial abuse by mandating
information disclosure, and can help them to coordinate their actions and voice their discontent
against directors’ abuses through voting and judicial venues.
The set of laws protecting the rights of non-controlling shareholders is often referred to as
“shareholder protection”. A quantitative indicator of shareholder protection was proposed by La
Porta, Lopez-de-Silanes, Shleifer, and Vishny (1998) (hereafter, LLSV). Their study reveals large
differences in shareholder protection across 49 countries as of the early 1990s.1 Shareholder
protection varies considerably also over time, as documented by Pagano and Volpin (2005b), who
extended the LLSV indicator up to 2002.
LLSV (1997) show that their index of shareholder protection is positively correlated with the
breadth of the equity market and with measures of companies’ access to external capital. In turn, a
vast literature documents a robust correlation between measures of stock market development and
economic growth. To the extent that these correlations capture causal relationships from regulation
to financial development and economic growth, one may ask why any legislator would want to
grant less than a maximum degree of protection to non-controlling shareholders: the observed
variation across countries and over time would reflect an inefficient social choice by some
countries2 – or, in Acemoglu’s (2003) words, a failure of the “political Coase theorem”.3
One reason for these differences in financial regulation may be historical accident, which shaped
institutions and laws in an irreversible fashion. For example, LLSV (1998) argue that the degree of
shareholder protection differs systematically across legal systems, whose characteristics and
1 This indicator, that LLSV label “Anti-director Rights”, is described in detail in Section 3 of this paper. 2 However choosing a maximal degree of shareholder protection need not be always efficient. Allen and Gale (2003) and Allen (2005) point out that if markets are not complete and competitive a corporate governance arrangement designed to protect all stakeholders may be preferable to one that maximizes shareholders’ wealth. 3 Extending the Coase theorem to the political sphere, Acemoglu (2003) defines as “political Coase theorem” the view that “political and economic transactions will bring policies and institutions that achieve the best outcomes given the varying needs and requirements of societies, irrespective of who, or which social group, has political power” (p. 620).

8
workings were laid out centuries ago. They claim that English common law was more conducive to
rules and institutions protecting non-controlling shareholders, compared to civil-law systems.4 Also
Acemoglu and Johnson (2003) and Beck, Demirguc-Kunt and Levine (2003) emphasize the role of
historical accidents: they suggest that the environment faced by European colonizers shaped
different property right institutions, with persistent effects on financial development and growth.
A second reason why financial regulation may differ across countries is variation in ideology or
culture in a broad sense. For instance, Roe (2003) highlights the importance of ideology in his
account of differences in the protection of shareholders relative to other stakeholders, especially
between the United States and European social democracies. Similarly, Allen (2005) documents
that Japanese society is imbued with the idea of corporate social responsibility: in Japan, even high
school textbooks stress that companies should not be managed only in the interest of shareholders,
and most Japanese managers subscribe to this idea, in contrast with U.S. and U.K. managers.
A third explanation of differences in financial regulation emphasizes the political conflict
between different economic constituencies. This “political economy” view holds that regulation is
chosen by groups with political power, who shape it in their own interest and defend it against
change.5 As a result, regulation may lead to socially inefficient and yet persistent outcomes, i.e. to
lasting violations of the “political Coase theorem”. Yet this persistence does not bar the possibility
of financial reform, if economic shocks and political shifts modify the politically dominant groups
or their priorities. Indeed, in their study of financial liberalizations Abiad and Mody (2005)
documents both high persistence of the status quo and sharp regulatory regime changes in response
to sufficiently large shocks.
So this approach may explain not only international variation in shareholder protection, but also
its evolution over time, in contrast with the view that regulation is shaped by remote historical
“incidents” such as the origin of legal system or the difficulties faced by settlers during
colonization. Moreover, it can predict how the degree of shareholder protection should correlate
with other pieces of regulation, insofar as they jointly determine the rents accruing to political
incumbents. For instance, Pagano and Volpin (2005b) and Perotti and von Thadden (2005) predict
that poor shareholder protection should correlate with strong employment protection, while Perotti
4 However, there is evidence that common law has not always been more suited to business needs than civil law. Lamoreaux and Rosenthal (2004) show that in the 19th century the French Code de Commerce and legal practice offered more sophisticated and flexible solutions to organize business than Anglo-American law. Rajan and Zingales (2003) document that in the early 20th century French capital markets were more developed than those of the United States.

9
and Volpin (2005) and Rajan and Zingales (2003) argue that it should be associated with trade
protectionism, since they both serve the interest of incumbent firms as entry-deterring devices.6
The hallmark of political economy models is that they determine the degree of investor
protection endogenously and jointly with economic variables, as part of a political and economic
equilibrium. In the present paper, we propose a simple model to illustrate some insights that this
approach provides both about the cross-country variation in shareholder protection and its change
over time. The model, presented in Sections 2 and 3, brings together results already present in the
literature and some novel ones. In Section 4 we explore if the model’s prediction are consistent with
the data, relying on a panel of 47 countries over the 1993-2002 interval. Therefore, also our
evidence brings into the picture the time dimension (and thus the issue of legal reform), which is
absent in the early “law-and-finance” empirical studies.
The key assumption of our model is that profits are not entirely verifiable by non-controlling
shareholders and can therefore be appropriated by managers and workers. This extends the
customary notion of private benefits of control, which in the corporate finance jargon are resources
appropriated by managers at the expense of non-controlling shareholders (managerial perks,
generous bonuses, empire building, an “easy life”, etc.). Here, these benefits do not accrue only to
managers or controlling shareholders, but to all company insiders, including workers. Indeed, some
opportunistic activities of managers, such as empire building or shirking, happen to benefit also
their subordinates, and thereby turn the latter into allies of incumbent management against the threat
of corporate raiders (see Pagano and Volpin 2005a).
This congruence of interests between owner-managers and workers at the corporate level may
induce them to converge on a common platform at the political level, as argued by Hellwig (2000).
Our first result is that this political alliance between owner-managers and workers emerges when
the latter own a sufficiently small equity stake, so they have little interest to support shareholder
protection. Conversely, if workers have a large enough equity stake, they will side with other
external shareholders (“rentiers”) in favor of an investor-friendly regulatory stance. In this case,
high shareholder protection will emerge as the equilibrium outcome. This parallels the finding by
Perotti and von Thadden (2005) that workers owning small financial stakes prefer dominance by
5 The idea that public policies and regulation are determined by the political interplay of economic constituencies is not novel, having been recognized for some time in macroeconomics and other fields of economics. Recently, this “political economy” approach has made an inroad also in financial economics (see Pagano and Volpin, 2002, for an early survey). 6 Poor investor protection deters capital market development and thereby starves potential domestic entrants of financial resources, while trade barriers deter entry by foreign ones. By the same token, investor protection should be positively correlated with trade openness. Indeed, Braun and Raddatz (2004) show that the change in the strength of promoters
10
banks to that by shareholders because the former choose safer investment strategies. Also Pagano
and Volpin (2005b) predict that owner-managers and workers converge on a political platform
featuring low investor protection if the voting system is proportional (but not if it is majoritarian).
Our second result is the mutual interaction between the degree of shareholder protection and
stock market development. The anticipation of better shareholder protection leads investors to offer
more generous finance to firms, thereby allowing the latter to issue more equities. But increased
issuance may in turn encourage wider stock market participation, and hence increase political
support for shareholder protection. Under some circumstances, this feedback loop may translate into
multiple equilibria, with shareholder protection, market participation, equity issuance and
investment all being positively correlated across equilibria. So expectations about future regulation
are self-fulfilling. If expectations are shaped by past regulation, equilibrium selection is determined
by history: a given equilibrium persists over time, absent a sufficiently large shock, in line with the
evidence by Abiad and Mody (2005).
However, even absent exogenous shocks, the economy may shift from a low-level to a high-level
equilibrium if companies can opt out of national legislation by re-incorporating in jurisdictions with
better shareholder protection or merging with companies in such jurisdictions. Before they raise
external capital, entrepreneurs desire institutions that afford the highest protection to their
financiers’ claims (even though they prefer the opposite once they have raised external finance). So,
if they can, they will opt into jurisdictions that allow them to precommit to high shareholder
protection. But this shrinks the domestic constituency against shareholder protection, and thereby
promotes legal reform in countries that start with low shareholder protection. So our third prediction
is that, when companies can easily opt out of domestic regulation, one should observe international
convergence to high standards of shareholder protection – or, as some legal scholars put it, that
“convergence by contract” leads to convergence in corporate law (Hansmann and Kraakman, 2000).
The last two predictions described above are broadly consistent with our panel data evidence.
First, investor protection is correlated with measures of stock market development, although this
correlation is not as strong and precisely estimated as that identified by LLSV (1997) in cross-
country data of the early 1990s. In panel data estimates with country and calendar year fixed effects,
this correlation is much weaker but is still positive and statistically significant, particularly when
one controls for the endogeneity of shareholder protection. Second, the LLSV indicator of
shareholder protection displays a considerable degree of international convergence towards best-
vis-à-vis opponents of trade liberalization is a very good predictor of subsequent financial development. Also Abiad and Mody (2005) document that trade openness has increased the pace of reform in financially repressed countries.

11
practice standards. And, in accordance with the model, the speed of convergence is correlated with
cross-border M&A activity into the relevant country, which we take as a measure of the tendency of
domestic companies to opt out of national company law.
2. The Model
The model features three groups of risk-neutral individuals: owner-managers, workers, and
“rentiers”, with initial per-capita wealth Ma , Wa and Ra , respectively. Each owner-manager can set
up and manage a single company. Workers have a unit labor endowment. Rentiers have neither the
ability to run a firm nor a labor endowment. We standardize the number of managers to 1, and
denote the number of workers and rentiers by Wn and Rn , respectively. So these are also the
numbers of workers and rentiers per firm. For realism, workers are assumed to be the largest social
group: max{1, }W Rn n> .
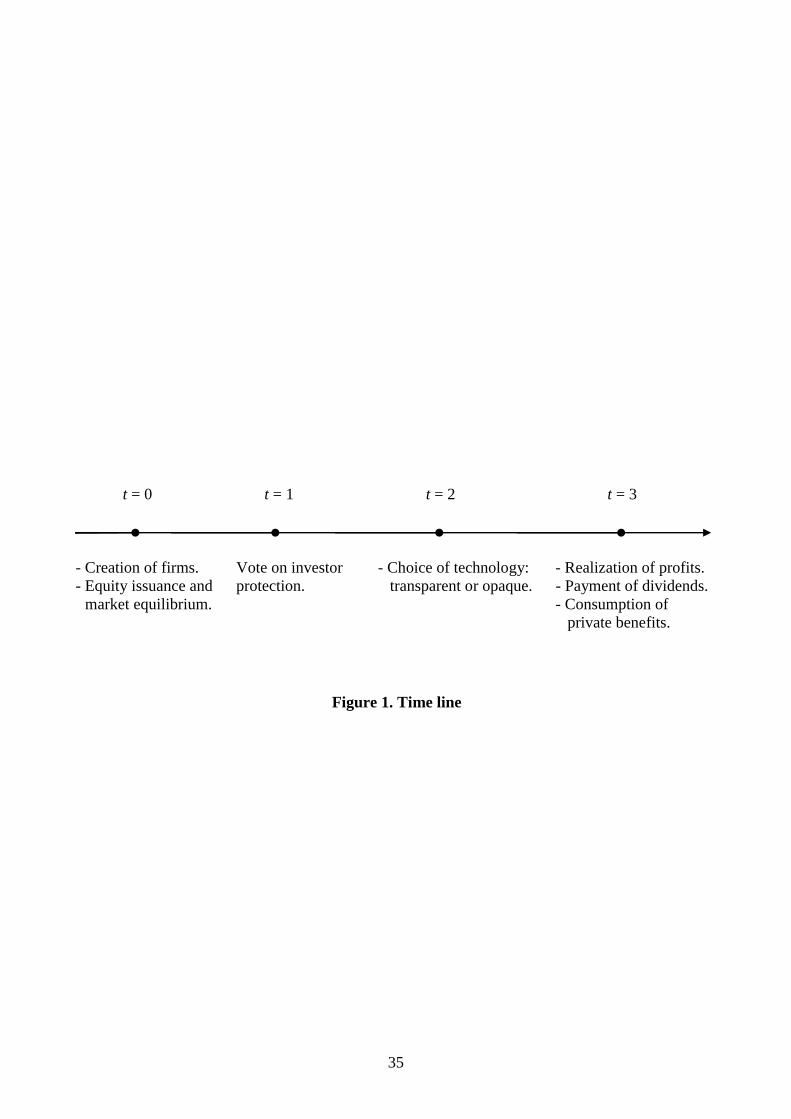
These three groups interact in the economy and contend in the political arena, as illustrated by
the time line in Figure 1, which comprises four stages:
• t = 0: each owner-manager creates a company, raising part of the necessary external capital
from outside shareholders (rentiers and possibly workers);
• t = 1: voters choose the degree of shareholder protection λ by a majority vote, where each
voter casts his vote non-cooperatively, based on his individual economic interest;
• t = 2: in each firm, the owner-manager decides whether to extract private benefits;
• t = 3: dividends are paid to shareholders, and private benefits are consumed – to some extent
also by workers.
INSERT FIGURE 1 HERE
Now we describe in detail the model’s assumptions concerning the creation of the firm at stage 0
and its production technology at stage 2.
2.1. Assumptions
When he creates a firm at stage 0, each owner-manager hires a fixed number of workers Wn at a
wage that for simplicity is standardized to zero, and chooses the scale of the firm’s capital stock k
on an interval between zero and a maximal feasible scale maxk . Each unit of capital (“machine”)
12
costs a fixed price kp and generates a profit y. If the manager’s wealth is not sufficient to cover the
cost of the firm’s initial investment, the firm is partly financed by outside shareholders, who are
compensated via the payment of dividends. After the financing stage, managers, rentiers and
workers have fractional stakes Mβ , Rβ and Wβ , respectively. To retain control over the company,
an owner-manager must keep a stake Mβ β≥ .
There is perfect competition in the provision of external finance. Since rentiers face no
transaction costs and have no time discount, their required rate of return on capital is zero. Workers
instead require a positive rate of return on equity 0r > , to compensate them either for their
transaction costs or for their greater impatience. As a result, workers are “residual buyers” of
external equity: in equilibrium they buy external equity only when its supply stretches the demand
by rentiers. As a result, the interest rate r is equal to 0 if in equilibrium only rentiers supply external
finance to firms, and becomes r if also workers do. We assume that in either case the net present
value of investment is positive, that is, /(1 ) ky r p+ > .
At stage 2, unbeknown to the company’s external shareholders, the owner-manager can choose
to operate the firm’s machines with one of two technologies: (i) a “transparent technology” whereby
the profit y generated by each machine coincides with a verifiable random variable vy , or (ii) an
“opaque technology” such that the profit y is a weighted sum of the verifiable component vy and a
non-verifiable one nvy : (1 )v nvy y yλ λ= + − . Both vy and nvy are independently and identically
distributed random variables, with support max[0, ]y and mean y . Therefore, if the opaque
technology is adopted, external shareholder can detect only the verifiable component vyλ of profits,
while the non-verifiable component is transformed into private benefits (1 ) nvb yλ= − .7
The relative sizes of the verifiable and non-verifiable components of profits under the opaque
technology depend on the degree of shareholder protection, [ , ]λ λ λ∈ , where 0λ > and 1λ ≤ .
Therefore, poor shareholder protection (low λ ) increases the “opaqueness” of technology and
decreases the profit per machine that can be pledged to outside shareholders. The positive lower
bound of λ implies that the firm’s assets generate a minimum verifiable cash flow, even if
shareholders are given the worst possible protection.
Private benefits generate utility not only for the manager but also, to a certain extent, for the
7 Note that the actual values of vy and nvy become known only at stage 3, so that at stage 2 the owner-manager chooses between the two technologies based on their expected payoffs: expected dividends y and no private benefits from the transparent technology, versus expected dividends yλ and private benefits (1 )yλ− from the opaque one.

13
company’s workers: while the manager’s utility increases one-for-one with private benefits b, the
workers’ utility increases by a fraction [0,1]α ∈ of the private benefits b.8
The assumption that both managers and workers can draw some private benefits from the
company is a departure from the standard corporate finance view that the private benefits of control
are simply appropriated and consumed by managers. However, this assumption does capture several
real-world situations. First, whenever managers’ private benefits arise from “empire building”, the
implied over-investment will tend to expand employment and career advancement opportunities,
and thereby benefit their workforce as well. Second, managers may extract private benefits by
motivating their subordinates via efficiency wages rather than via monitoring, which requires a
supervisory effort. Thus they gain an “easy life”, and workers earn a rent at the expense of
shareholders’ dividends. This mechanism, analyzed by Pagano and Volpin (2005a), also protects
the manager’s “easy life” from the threat of potential raiders, for instance by prompting employees
to oppose hostile takeovers. Wage concessions are not the only way in which managers can let
workers pitch in private benefits: others are generous job security or pension arrangements, and
even social services or environmental policies in favor of the firm’s local community.9
2.2. Equilibrium
The model’s equilibrium is found by backward induction. At stage 3, the representative firm
pays dividends vy kλ if the opaque technology was chosen at stage 2, and vy k otherwise. With the
opaque technology, the firm’s manager and workers enjoy private benefits (1 ) nvy kλ− and
(1 ) nvy kα λ− , respectively. With the transparent technology, neither one gets any private benefits.
At stage 2, the owner-manager chooses between the transparent and opaque technology based on
their expected stage-3 payoffs. His expected utility is M ykβ with the transparent technology and
(1 )M yk ykβ λ λ+ − with the opaque one. Since 1Mβ ≤ , the owner-manager always chooses the
opaque technology.
8 This assumption implies that the choice of the opaque technology is ex-post socially efficient (on average), since it causes shareholders to lose (1 )yλ− per machine, but increases the utility of other stakeholders by (1 )(1 )yα λ+ − . This can be seen as capturing the point by Allen (2005) that a governance regime that is not in the exclusive interest of shareholders may be socially efficient. But, as we shall see, our model captures also the ex-ante costs of stakeholder governance, in terms of equity rationing and decreased investment. Therefore, on an ex-ante basis higher shareholder protection λ has an ambiguous effect on social welfare, whose sign turns on the relative magnitude of the benefits of additional investment and the net benefits that must be forgone by stakeholders. 9 On this point, see Cespa and Cestone (2004).

14
2.2.1. Voting stage
At stage 1, a majority vote determines the degree of shareholder protection λ, and thereby the
amount of private benefits that can be extracted through the opaque technology. Their preferences
are shaped by their equity stakes, as determined at stage 0, and by their expected private benefits.
Rentiers prefer the highest feasible level of investor protection:
/R R Ru yk nβ λ= , (1)
since each rentier owns a fraction /R Rnβ of the representative firm.
The owner-managers’ utility depends on their private benefits, which are decreasing in λ, and the
value of their equity stake, which is increasing in λ:
[ (1 )]M Mu ykβ λ λ= + − . (2)
On balance, an increase in investor protection λ decreases their expected utility, since 1Mβ ≤ .
Finally, the preferences of the typical employee reflect his expected utility from private benefits
and from financial wealth:
[ (1 )] /W W Wu yk nβ λ α λ= + − . (3)
Increased investor protection λ decreases a worker’s expected utility if he owns a small equity
stake, Wα β> , and raises it otherwise.
Figure 2 helps illustrate these preferences. The manager’s equity stake Mβ is measured on the
vertical axis, and the workers’ total stake Wβ on the horizontal axis. The diagonal with slope –1
that cuts across the diagram represents the constraint that the aggregate stake of managers and
workers does not exceed 1 (because 1M W Rβ β β+ = − ). The shaded region represents combination
of equity stakes that are not feasible because they violate this constraint. In the feasible region
below the diagonal, we can distinguish two areas. If the workers have a low equity stake (area A),
they share the same preferences of managers for low investor protection to maximize private
benefits. Instead, if workers have a high equity stake (area B), they share rentiers’ preference for
high investor protection.
INSERT FIGURE 2 HERE

15
Since preferences are single peaked, the median voter theorem applies. The political equilibrium
depends on the preference of workers. This is obvious if workers are the absolute majority of the
population, but it is true also if they are not. In the latter case, the equilibrium must result from an
alliance between (at least) two economic constituencies. From Figure 2, we can see that workers
will vote together with managers for low investor protection in area A, and together with rentiers
for high investor protection in area B: in both cases their political preferences are decisive.
The following proposition summarizes the results.
Proposition 1 (Share ownership diffusion and shareholder protection). The degree of investor
protection is *λ λ= if Wβ α< (area A), and *λ λ= if Wβ α> (area B).
2.2.2. Initial investment decision
At stage 0, the owner-manager chooses the firm’s investment scale k and the stake Mβ that he
wishes to retain in the company’s equity capital. In this choice, he must take into account that the
scale of the investment is bounded by his own wealth and the external equity that can be raised from
investors, and that he must retain a stake β to keep control of the company. Moreover, we need to
check if it is worthwhile for the owner-manager to invest his own wealth into the firm.
Formally, the amount of external finance available to the owner-manager is given by the
participation constraint of external shareholders combined with the firm’s budget constraint.
External investors buy their equity stake at a price (1 )M Pβ− , such that
1
e yP kr
λ≤
+, (4)
where P is the market price of the entire company, eλ is the shareholder protection expected to be
chosen at stage 1, and r is the rate of return determined by capital market equilibrium, as shown
below. Competition between external shareholders ensures that (4) holds with equality.
The resources that the owner-manager invests in the firm (in excess of his wealth), k Mp k a− ,
cannot exceed the proceeds from external equity issuance, (1 )M Pβ− . Using (4), the manager must
satisfy the budget constraint:
16
(1 ) (1 )1
e
k M M Myp k a P kr
λβ β− ≤ − = −+
, (5)
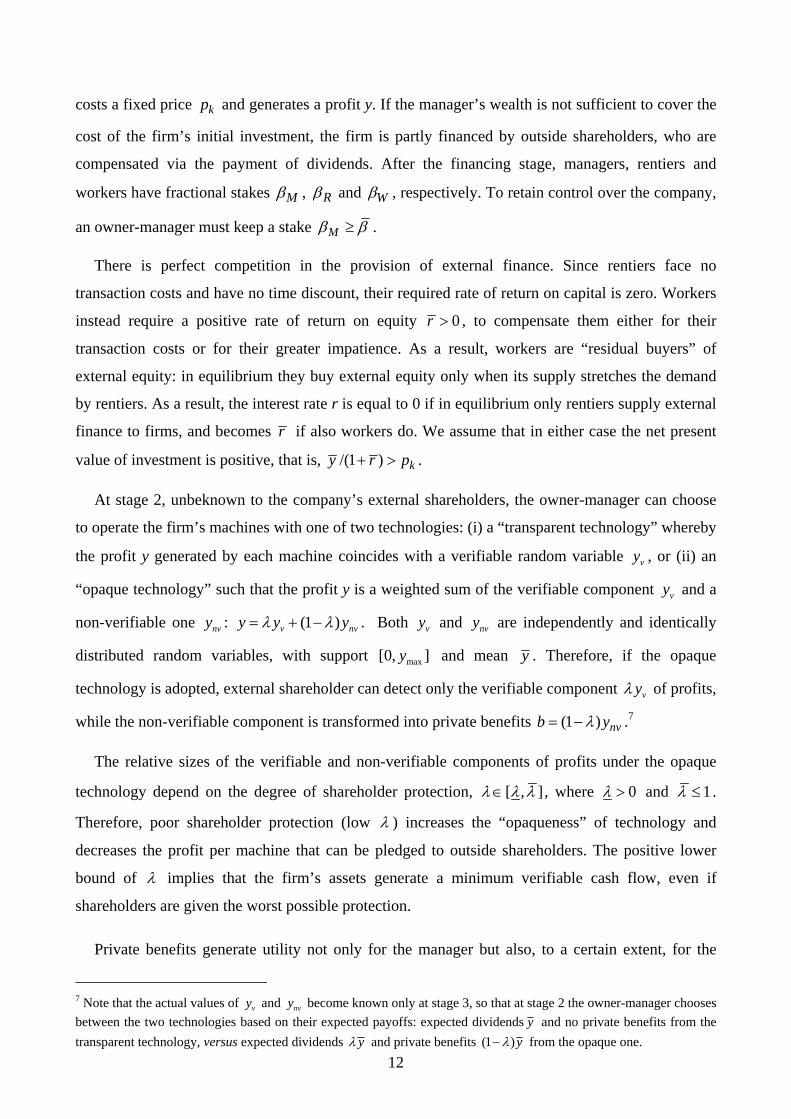
Note that the constraint (5) is binding only if the money that can be raised via external equity
issuance ( (1 ) /(1 )eM yk rβ λ− + ) is not sufficient to fund the investment kp k . If the constraint is
binding, the firm is subject to equity rationing, that is:
(1 ) /(1 )
Me
k M
akp y rβ λ
=− − +
. (6)
This expression is increasing in eλ : a higher expected investor protection relaxes equity rationing.
We assume that the maximum feasible investment scale maxk is such that the owner-manager cannot
finance it even with the highest degree of shareholder protection: max max(1 )k Mp k a ykβ λ> + − ,
implying that the firm is always financially constrained and shareholder protection reduces the
severity of this constraint. This assumption does not affect the main qualitative results of the model.
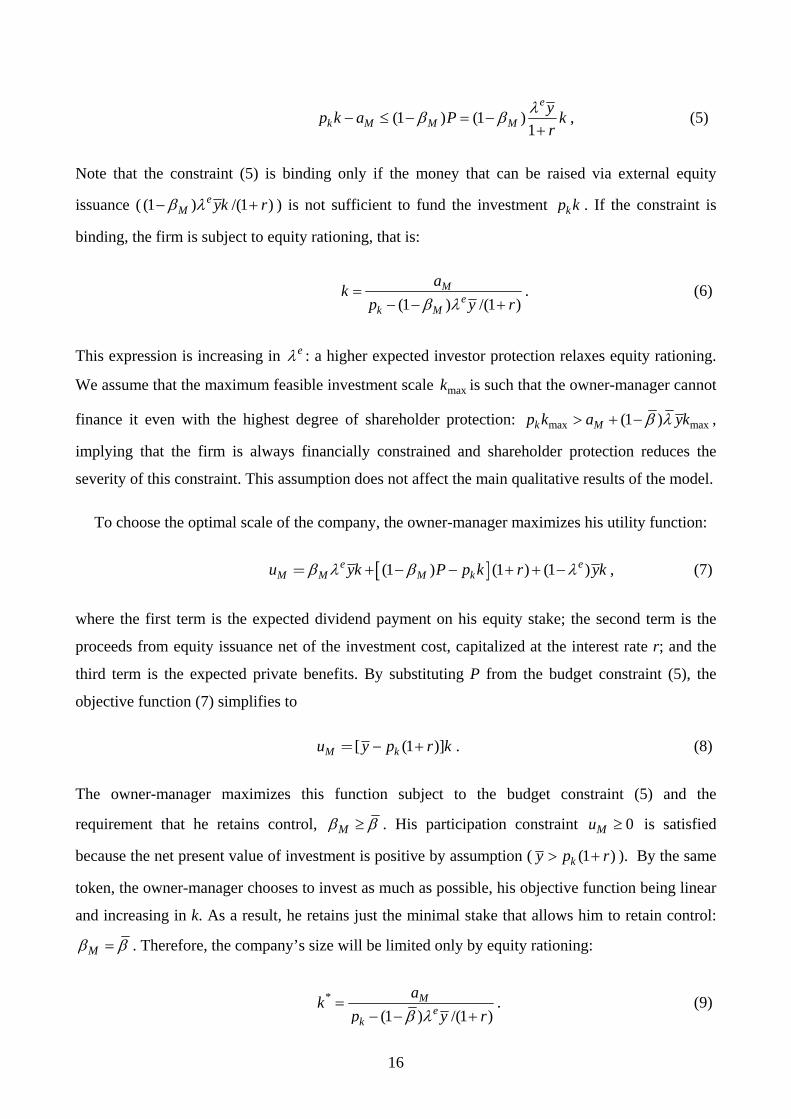
To choose the optimal scale of the company, the owner-manager maximizes his utility function:
[ ](1 ) (1 ) (1 )e eM M M ku yk P p k r ykβ λ β λ+ − − + + −= , (7)
where the first term is the expected dividend payment on his equity stake; the second term is the
proceeds from equity issuance net of the investment cost, capitalized at the interest rate r; and the
third term is the expected private benefits. By substituting P from the budget constraint (5), the
objective function (7) simplifies to
[ (1 )]M ku y p r k− += . (8)
The owner-manager maximizes this function subject to the budget constraint (5) and the
requirement that he retains control, Mβ β≥ . His participation constraint 0Mu ≥ is satisfied
because the net present value of investment is positive by assumption ( (1 )ky p r> + ). By the same
token, the owner-manager chooses to invest as much as possible, his objective function being linear
and increasing in k. As a result, he retains just the minimal stake that allows him to retain control:
Mβ β= . Therefore, the company’s size will be limited only by equity rationing:
*
(1 ) /(1 )M
ek
akp y rβ λ
=− − +
. (9)

17
To summarize:
Proposition 2 (Expected shareholder protection and firms’ investment). The scale of the firm’s
investment *k is strictly increasing in the expected investor protection eλ .
Now we can join these findings about the stage-0 investment decision together with the results
about stage-1 voting, and characterize the overall equilibrium.
2.2.3. Political and economic equilibrium
In Section 2.2.1 we found that majority voting may bring about one of two regulatory regimes:
low protection ( λ λ= ) or high protection ( λ λ= ), depending on the equity stake owned by
workers (Proposition 1). From Section 2.2.2, we know that, of these two regulatory regimes, the
regime with λ is associated with greater issuance and investment by firms: anticipating the stage-2
voting outcome leads firms and investors to contract differently at stage 0 (Proposition 2).
Therefore, the share-ownership structure determined at stage 0 affects issuance and investment
decisions, via the political vote. Depending on whether workers aggregate equity stake Wβ is
below or above the threshold level α , the expected degree of shareholder protection is low
( eλ λ= ) or high ( eλ λ= ), and the implied level of investment is respectively low or high as
indicated by equation (9). In short, larger equity ownership by workers translates into greater equity
issuance, due to the increased support for investor-friendly legislation.
However, this creates also a feedback effect from equity issuance to investor protection. In
equilibrium, stage-0 share issuance decisions must be accommodated by household portfolios.
Insofar as this affects stock market participation by the various constituencies, the issuance
decisions of firms will feed back on the distribution of share ownership, and thereby on the political
support for shareholder protection. This creates a feedback loop that can result in two equilibria:
one with high shareholder protection, large issuance and investment, and widespread stock-market
participation; and another equilibrium with the opposite characteristics.
To show this formally, we need to determine the equity stake held by workers in equilibrium. So
far, we have determined how equity is allocated in equilibrium to managers ( Mβ ) and to all other
shareholders (1 M R Wβ β β− = + ), but not the breakdown between non-controlling shareholders and

18
workers. This breakdown is pinned down by the assumption that workers are “residual buyers” of
shares: since their required rate of return exceeds that of rentiers ( 0r > instead of 0), in equilibrium
they buy external equity only when its supply k Mp k a− stretches the demand by rentiers R Ra n .
Their stake W Pβ is determined by the equilibrium condition:
*W k M R RP p k a a nβ = − − . (10)
Replacing the market value of the company P from condition (4) taken with equality into equation
(10), we can express the workers’ equilibrium stake in the representative firm as:
*
*
( )(1 )max ,0k M R RW e
p k a a n ryk
βλ
⎧ ⎫− − += ⎨ ⎬
⎩ ⎭, (11)
where we take into account that the interest rate r equals r if workers invest in the equity market.
Therefore the equilibrium equity stake of workers depends on how much equity is issued at stage 0, *
k Mp k a− . Replacing *k from equation (9) into equation (11), we find that
*
(1 )0 if ,( )(1 )
(12)(1 ) (1 )1 otherwise.
e R R k
M R RW e
kR Re
M
a n p ra a n y
p r ya na y
λβ
ββ λβ
λ
+⎧ <⎪ + −⎪= ⎨+ − −⎪ − −⎪⎩
Therefore, the workers’ equity stake is (weakly) increasing in eλ . This positive feedback of eλ on *Wβ creates the potential for multiple equilibria, as we shall see below.
We know from Proposition 1 that the chosen degree of shareholder protection is high (low)
depending on whether *Wβ is greater (smaller) than α . Using equation (12), one can easily find the
cut-off value for eλ at which *Wβ α= , that is, such that workers would be indifferent between the
two possible voting outcomes. Let us denote this cut-off value of eλ by λ̂ :
(1 )ˆ[( )(1 ) ]
R R k
M R R M
a n p ra a n a y
λβ α+
=+ − −
(13)
If the expected level of shareholder protection is ˆeλ λ> , then *Wβ α> and society will vote for
λ λ= . If instead the expected level of shareholder protection is ˆeλ λ< , then *Wβ α< and society

19
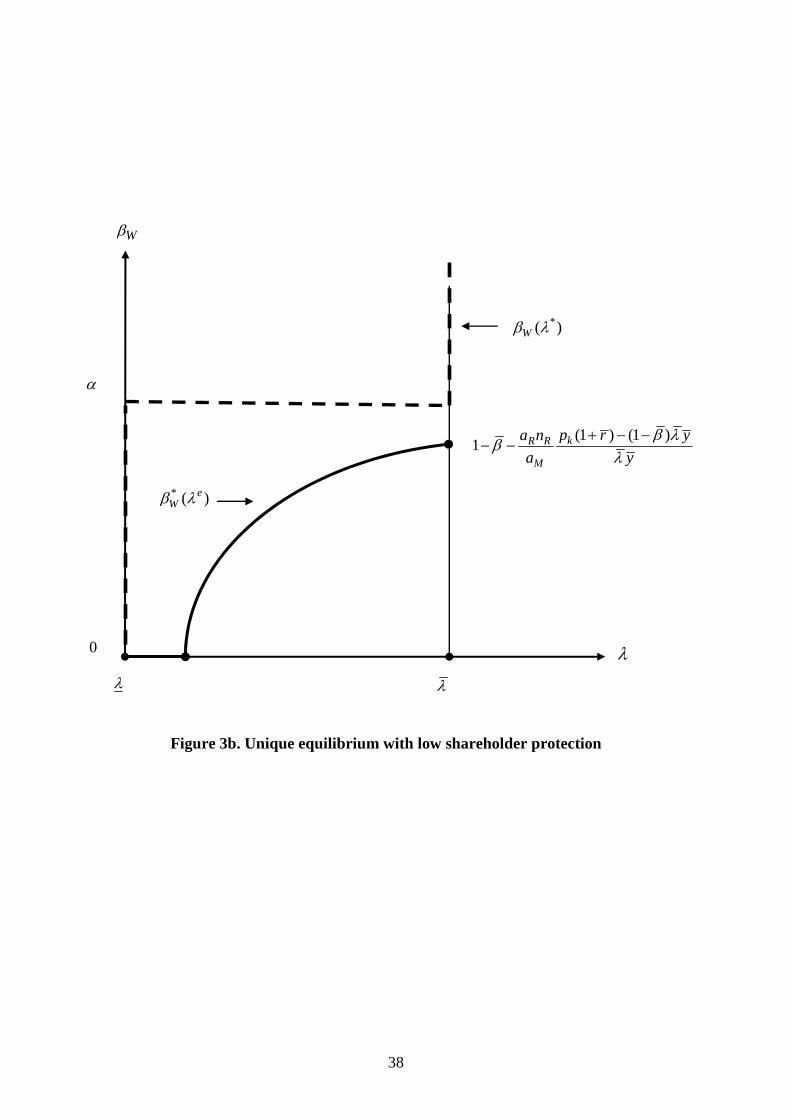
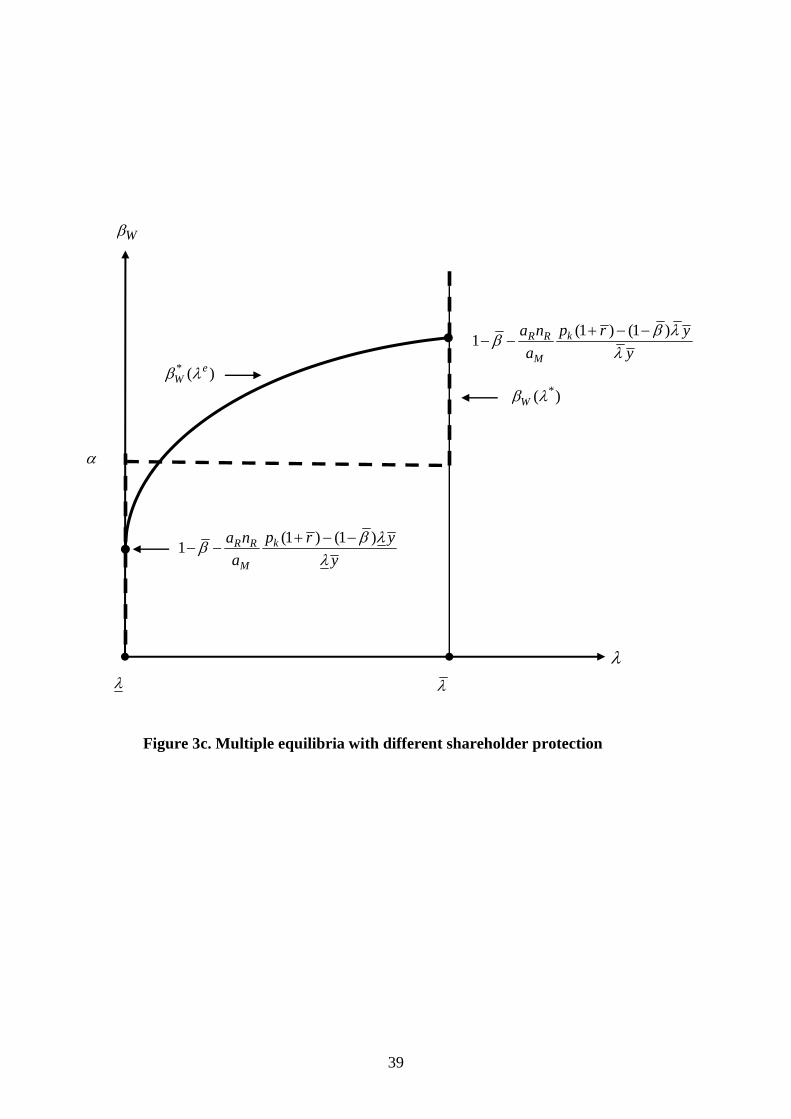
will vote for λ λ= . Therefore, the potential for multiple equilibria depends on the comparison
between λ̂ , λ , and λ . To see this, we refer to Figures 3a to 3c. In each figure, the dashed line
represents the stepwise function *( )Wβ λ that plots the employees’ equity ownership associated
with each voting outcome, according to Proposition 1. The continuous increasing function * ( )eWβ λ
maps the expected voting outcome into the equilibrium equity stake of the employees, according to
equation (12). An equilibrium corresponds to an intersection of the two curves.
INSERT FIGURES 3A, 3B AND 3C HERE
In Figure 3a, we consider the case in which λ̂ λ< . In this case, there is a unique equilibrium
with high investor protection: even if shareholder protection were expected to be low ( eλ λ= ), the
equity stake held by workers would be so large as to induce them to vote for *λ λ= . Alternatively,
as shown in Figure 3b, a unique equilibrium with low investor protection exists if ˆλ λ< : in this
case, even if shareholder protection were expected to be high ( eλ λ= ), the workers’ equity stake
would be so low that they would vote for *λ λ= . Finally, two equilibria occur in the intermediate
situation illustrated in Figure 3c ( ˆλ λ λ< < ). Here, if low investor protection is expected ( eλ λ= )
and therefore equity issuance is low, the workers’ stake is so low that they will actually vote for low
λ ; and vice versa in the opposite scenario. Figure 3c shows that there is also a third, knife-hedge
equilibrium corresponding to the middle intersection of the two loci, in which workers are just
indifferent about the level of shareholder protection and at stage 0 all players anticipate that workers
will vote exactly for the value of λ corresponding to that intersection.
We can summarize the previous discussion as follows:
Proposition 3 (Correlation between investor protection and stock issuance). Between any two
economies, the economy with the higher degree of investor protection *λ has a larger stock
issuance *k Mk p a− and greater stock market participation by workers *
Wβ .
This proposition holds irrespective of the uniqueness of equilibrium, since it applies both to the
comparison between the unique equilibria in Figures 3a and 3b, and across equilibria in Figure 3c.
With reference to the case with multiple equilibria, it is worth highlighting that equilibrium
selection depends on expectations about future regulation. In other words, expectations about the
20
degree of investor protection are self-fulfilling. If expectations are shaped by past regulation,
equilibrium selection is determined by history: a low- or high-level equilibrium becomes self-
sustaining, absent a sufficiently large shock, in line with the evidence by Abiad and Mody (2005).
Moreover, it is easy to show that a high-level equilibrium is more efficient than a low-level one,
using an ex-ante Pareto criterion (that is, comparing the expected utility of agents as of stage 0).
Finally, one may ask how shocks to the parameters of the economy may shift it from, say, a low-
level to a high-level equilibrium. Suppose that we start from the situation shown in Figure 3b, in
which only the equilibrium with low shareholder protection exists. Then, a decrease in the utility
that workers assign to private benefits, α , can shift downwards the stepwise function *( )Wβ λ
enough as to bring about the multiple equilibria of Figure 3c or even a unique equilibrium with high
shareholder protection of Figure 3a. So a lower valuation of private benefits by workers to the
private benefits can trigger a switch to better shareholder protection.
Other parameters can affect the position of the other locus, that is, the function * ( )eWβ λ . A rise
in the profitability of firms arising from an increase of y or a decrease in the investment costs kp
tend to shift this locus upwards. As a result, these parameter shifts can modify the locus from the
situation depicted in Figure 3b to a situation where also a high-level equilibrium exists as in Figure
3c – or only such an equilibrium exists as in Figure 3a. The intuition is clear: higher profitability of
investment relaxes the equity rationing constraint and channels more external funding to the firm,
and thereby tend to draw also workers into the shareholders’ base, increasing the support for
shareholder protection. A reduction of rentiers’ wealth R Ra n relative to that of owner-managers Ma
has a similar effect: it shifts the * ( )eWβ λ locus downwards, and thereby can bring about a transition
to a high-level equilibrium. Intuitively, the reduced financing capacity of rentiers triggers greater
workers’ participation in equilibrium, thus increasing political support for shareholder protection.
This suggests that policies that redistribute wealth away from rentiers tend to trigger stock market
development and improved shareholder protection.
3. Discussion and extensions
In this section, we discuss two extensions. In our model, legal rules are chosen after firms are
created. In Section 3.1 we explore how changing this timing would affect the results. In Section 3.2
we discuss an extension of the model where companies can opt out of domestic law, and investigate
the effects of this mechanism on the convergence between legal systems. Still other lines of
21
research would be worth exploring, by considering that expected shareholder protection may affect
other corporate choice beside share issuance, such as the debt-equity ratio, the extent of control
rights, or the extent of collateral pledging. However, dealing with these issues would require a
considerably richer contracting and preference structure, and are left for future research.
3.1. Dynamic inconsistency of managers and timing of elections
Since the owner-manager’s stage-0 objective function (expression 8) is increasing in company
size k, it is also increasing in the degree of investor protection λ . Indeed, as of stage 0 managers
would like to commit to the maximum shareholder protection, λ . Such a “regulatory lock-in” would
allow them to increase their security issuance and set up a larger company, an effect only partially
offset by the implied reduction in their private benefits per euro invested.
Of course, once stage 1 is reached, the investment is sunk and owner-managers would want to
renege on such commitment, and extract the highest possible private benefits. So, if they can affect
legislation at that point, they would vote for the lowest possible degree of shareholder protection,
λ λ= . So the owner-managers’ preferences are dynamically inconsistent: Tirole (2005, chapter 16)
labels this as the “topsy-turvy principle”, by which ex ante entrepreneurs desire institutions that
afford the highest protection to their financiers’ claims, while ex post they prefer the opposite.
In our model, we rule out the possibility of “regulatory lock-in”, by assuming that the stage-1
vote can change the initial contracting rules. If one were to change the time line and assume that
voting precedes the creation of firms, voting behaviour would be different. The alliance between
owner-managers and workers would vanish: owner-managers would vote for a high λ , as just
explained; workers would vote for a low λ ; and non-controlling shareholders would be indifferent.
Notice that the voting behaviour of workers and non-controlling shareholders would not be affected
by their financial portfolio, since they will buy shares after the vote and therefore at a price that
fairly discounts the chosen value of λ .
3.2. International convergence
Even when regulation does not allow society to precommit to high standards of shareholder
protection, private contracting can be used as a substitute “lock-in” mechanism. There are at least
three ways in which companies can opt out of their domestic legal system: they can (i) list their
22
shares in an exchange with stricter governance standards; (ii) be acquired by companies from
countries with better shareholder protection; or (iii) themselves incorporate in a jurisdiction with
better shareholder protection. The tendency of companies to cross-list in jurisdictions with better
shareholder protection is documented by Pagano, Röell, Randl and Zechner (2001) and Reese and
Weisbach (2002), among others. Miller (2001) and Doidge, Karolyi, and Stulz (2004) find that
cross-listing into developed stock markets is associated with a share price increase. Similarly, cross-
border mergers and acquisitions (M&A) serve a governance purpose: Rossi and Volpin (2004)
show that companies from countries with better investor protection tend to acquire companies in
countries with lower shareholder protection, and Bris and Cabolis (2005) document that such deals
create value because they transfer superior governance standards to acquired companies.
Legal scholars have remarked that these mechanisms lead to an effective international
convergence to best-practice corporate governance, irrespective of differences in company law (see
Coffee, 1999, and Gilson, 2001). The controversial issue is whether this “convergence by contract”
prompts also convergence of national legal systems. Hansmann and Kraakman (2000) argue that it
does, due to shareholder pressure. Gilson (2001) predicts an interplay of “convergence by contract”
and “convergence by law”. In contrast, Bebchuk and Roe (1999) question the idea of smooth and
rapid convergence towards a single system of corporate governance, since political and economic
forces tend to promote path dependence in corporate law and business practice.
Our model is capable of shedding some light on this issue. Suppose that a fraction γ of company
managers opt out of national law into a jurisdiction that provides high shareholder protection. The
workers and owner-managers of these companies will realize that the value of λ chosen at the
national level will not affect their own private benefits. As a result, they will vote for high
shareholder protection, to the extent that they own any shares in domestic companies. For
γ sufficiently large, this will tilt the balance of the political decision in favor of high shareholder
protection, and therefore “convergence by contract” may indeed promote “convergence by law”.10
10 However, one should ask whether the expectation of complete convergence between domestic and foreign values of λ should not deter companies from opting out of national regulation to start with: ex post, they would be indifferent! This would create a problem of non-existence of equilibrium if, when indifferent, all companies preferred not to opt out. The problem can be overcome by assuming that, when indifferent, companies play a mixed strategy, by which they opt out with a certain probability. If this probability is sufficiently high, there can be formal convergence in equilibrium.
23
4. Empirical Evidence
The model in this paper contains several predictions. The main one is a positive correlation
between measures of shareholder protection and measures of stock market development, such as
equity issuance, number of initial public offerings (IPOs), and stock market capitalization.
Specifically, better shareholder protection λ is associated with larger investment k, as illustrated in
Figure 3, and therefore with greater equity issuance k Mp k a− and higher stock market
capitalization /(1 )P yk rλ= + .
The second prediction of the model is that this correlation does not simply reflect a one-way
causality from shareholder protection to stock market development but a mutual feedback between
these two variables. Stock market development itself (in the form of greater equity issuance) elicits
greater stock market participation (by employees) and thereby increased political support for
shareholder protection. Empirically, this implies that both variables are endogenous. Hence, to
isolate the effect of shareholder protection on stock market development it is important to
instrument appropriately for the endogeneity of shareholder protection.
A third prediction of the model arises from its implication for convergence in shareholder
protection. As explained in Section 3.2, the model predicts that convergence by contract fosters
convergence by law: if a sufficiently large number of companies opt out of the national legal
system, for instance via cross-border M&A, then the political majority swings towards greater
shareholder protection. This prediction can be tested by investigating if (i) there is convergence by
countries with low shareholder protection towards higher governance standards and (ii) the speed of
convergence is affected by the number of domestic companies acquired via cross-border deals.
4.1. Data description
To test the predictions just described, we measure stock market development with two
indicators: stock market capitalization scaled by GDP, and number of domestic IPOs scaled by the
number of domestic listed companies. To measure shareholder protection, we rely on the “Anti-
Director Rights” index of shareholder protection compiled by LLSV (1998), which is the sum of six
dummy variables, capturing whether: (i) proxy by mail is allowed; (ii) shares are not blocked before
a shareholder meeting, (iii) cumulative voting for directors is allowed, (iv) oppressed minorities are
protected, (v) the share capital required to call an extraordinary shareholder meeting is less than 10
percent, and (vi) shareholders have pre-emptive rights at new equity offerings. We extend the

24
indicator constructed by LLSV (1998) to the entire interval between 1993 and 2001, relying on the
answers to questionnaires sent to legal experts and business practitioners around the world. Our
panel includes 47 of the original 49 countries studied by LLSV (1998), since for Jordan and Sri
Lanka there were no responses to our questionnaire.
Beside these, we use data for two variables that may affect shareholder protection: (i) the
cumulated number of M&A cross-border deals completed over the 1993-2002 interval, which
according to the model should generate convergence of shareholder protection to international best-
practice standards; and (ii) a measure of proportionality of the electoral system, which according to
Pagano and Volpin (2005b) is negatively correlated with the degree of shareholder protection.
The statistics in Table 1 reveal that measures of stock market development and the LLSV
shareholder protection indicator feature both cross-country variation (“between standard deviation”)
and time-series variation (“within standard deviation”), though the former exceeds the latter.
INSERT TABLE 1 HERE
4.2. Empirical relation between stock market development and shareholder protection
In this section we use the data just described to investigate the correlation between stock market
development and shareholder protection. LLSV (1997) is the natural reference point for this
empirical analysis. In their paper, they find a positive and significant correlation between several
measures of stock market development and shareholder protection using OLS regression for 1994.
Our dataset allows us to investigate whether this correlation holds for the whole 1993-2002 interval,
as well as for the individual years in our sample.
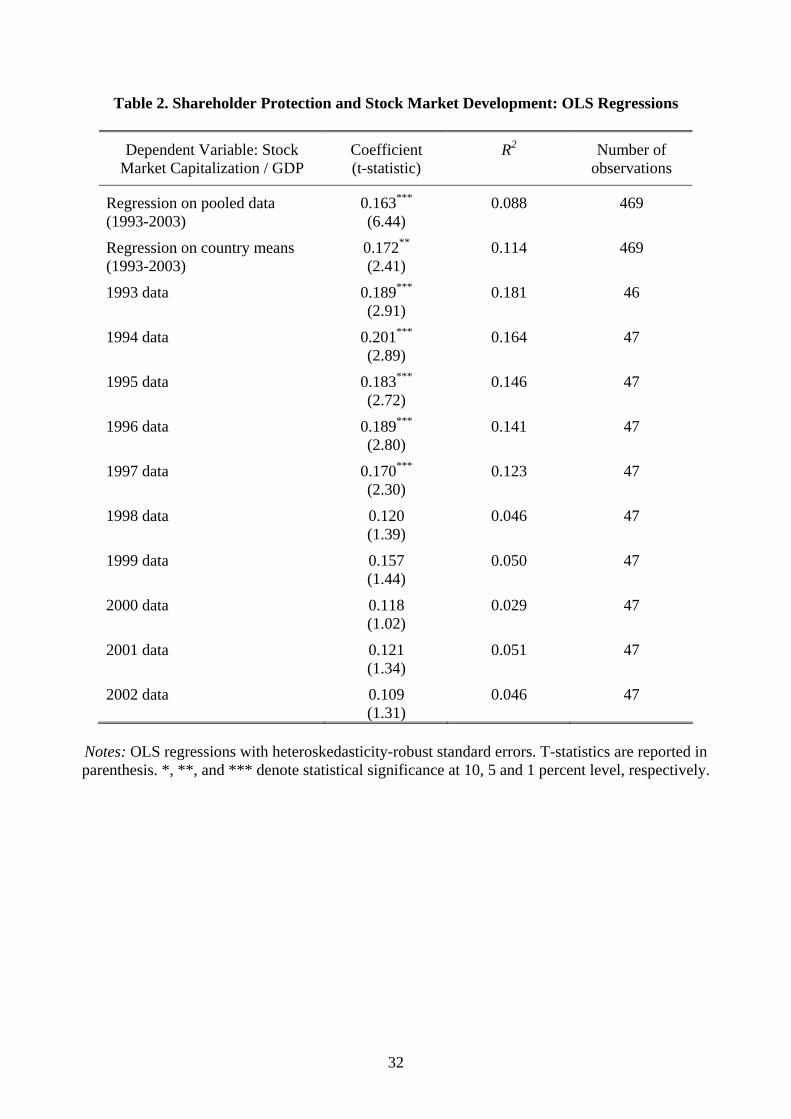
The first row of Table 2 reports an OLS regression estimated on the pooled data for the entire
panel, where Stock Market Capitalization divided by GDP is the dependent variable. The regression
coefficient is positive and statistically significant, in accordance with the finding of LLSV (1997).
Since however observations for the same country are not independent over time, the t-statistic
obtained on pooled data is likely to overestimate the precision of the estimate. One way to
overcome this problem is to use a between estimator, that is, estimate the regression on country
means. The second row of Table 2 reports the resulting estimate, which is of similar magnitude and
still significantly different from zero, though with a lower t-statistic.
INSERT TABLE 2 HERE
25
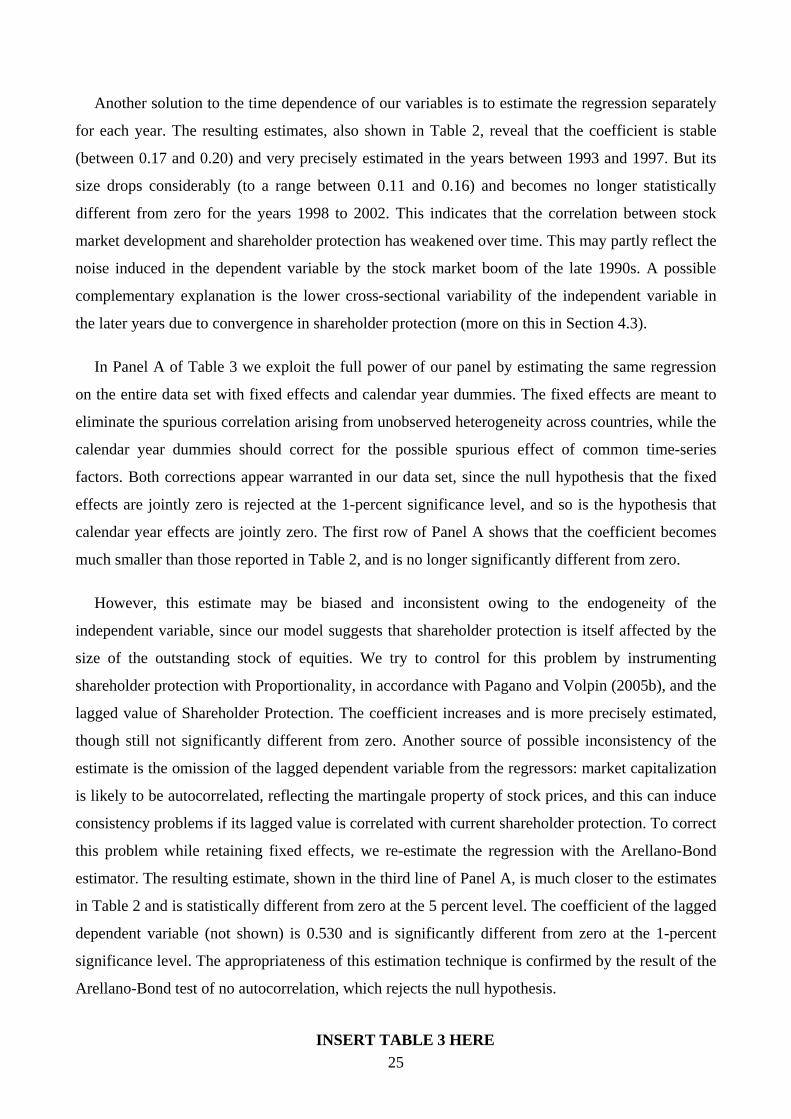
Another solution to the time dependence of our variables is to estimate the regression separately
for each year. The resulting estimates, also shown in Table 2, reveal that the coefficient is stable
(between 0.17 and 0.20) and very precisely estimated in the years between 1993 and 1997. But its
size drops considerably (to a range between 0.11 and 0.16) and becomes no longer statistically
different from zero for the years 1998 to 2002. This indicates that the correlation between stock
market development and shareholder protection has weakened over time. This may partly reflect the
noise induced in the dependent variable by the stock market boom of the late 1990s. A possible
complementary explanation is the lower cross-sectional variability of the independent variable in
the later years due to convergence in shareholder protection (more on this in Section 4.3).
In Panel A of Table 3 we exploit the full power of our panel by estimating the same regression
on the entire data set with fixed effects and calendar year dummies. The fixed effects are meant to
eliminate the spurious correlation arising from unobserved heterogeneity across countries, while the
calendar year dummies should correct for the possible spurious effect of common time-series
factors. Both corrections appear warranted in our data set, since the null hypothesis that the fixed
effects are jointly zero is rejected at the 1-percent significance level, and so is the hypothesis that
calendar year effects are jointly zero. The first row of Panel A shows that the coefficient becomes
much smaller than those reported in Table 2, and is no longer significantly different from zero.
However, this estimate may be biased and inconsistent owing to the endogeneity of the
independent variable, since our model suggests that shareholder protection is itself affected by the
size of the outstanding stock of equities. We try to control for this problem by instrumenting
shareholder protection with Proportionality, in accordance with Pagano and Volpin (2005b), and the
lagged value of Shareholder Protection. The coefficient increases and is more precisely estimated,
though still not significantly different from zero. Another source of possible inconsistency of the
estimate is the omission of the lagged dependent variable from the regressors: market capitalization
is likely to be autocorrelated, reflecting the martingale property of stock prices, and this can induce
consistency problems if its lagged value is correlated with current shareholder protection. To correct
this problem while retaining fixed effects, we re-estimate the regression with the Arellano-Bond
estimator. The resulting estimate, shown in the third line of Panel A, is much closer to the estimates
in Table 2 and is statistically different from zero at the 5 percent level. The coefficient of the lagged
dependent variable (not shown) is 0.530 and is significantly different from zero at the 1-percent
significance level. The appropriateness of this estimation technique is confirmed by the result of the
Arellano-Bond test of no autocorrelation, which rejects the null hypothesis.
INSERT TABLE 3 HERE
26
In Panel B we repeat the estimation relying on a measure of relative stock market development:
stock market capitalization scaled by the average capitalization of all the countries in the sample.
This measure controls for common world factors in stock returns.11 The coefficient of Shareholder
Protection in the fixed-effect regression is positive but not precisely estimated. With IV, it becomes
statistically different from zero at the 5 percent level. It is not significant when the estimation is
effected with the Arellano-Bond method, but in this case this procedure is less warranted than in
Panel A, since the null hypothesis of no autocorrelation is not rejected at the 5 percent level.
Finally, Panel C shows that the ratio of IPOs to listed companies is positively and significantly
correlated with shareholder protection, both in fixed-effect and IV estimation. As in Panel B, the
coefficient is no longer significantly different from zero when the estimation is effected with the
Arellano-Bond method.
On balance, the model’s prediction of a positive correlation between stock market development
and shareholder protection is broadly consistent with our panel data evidence. The relationship is
not as strong and precisely estimated as that identified in the 1994 cross-country data by LLSV
(1997), because it weakens considerably after 1997. But the correlation is stronger and more
precisely estimated when one controls for the endogeneity of shareholder protection via
instrumental variables.
4.3. Convergence and its determinants
Our panel data can also shed light on the issue of convergence between legal standards of
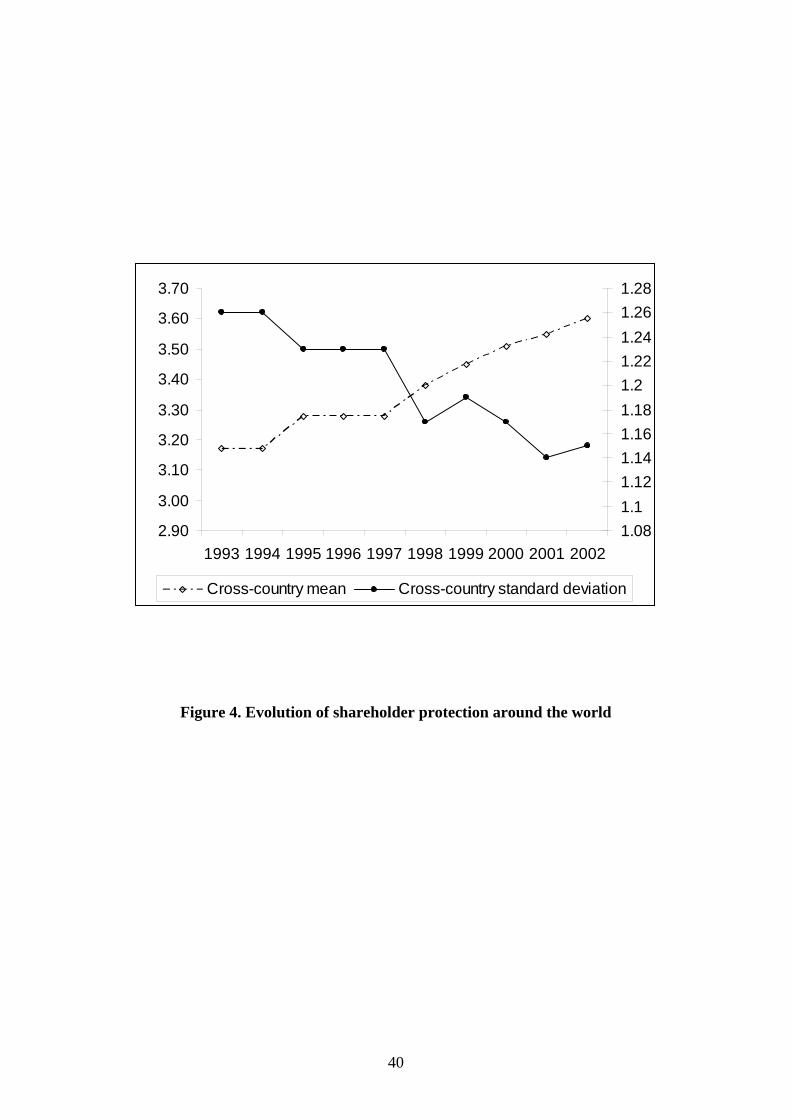
shareholder protection. Figure 4 shows that the time-series pattern of the LLSV measure of
shareholder protection features a remarkable “convergence towards the top” in the 1993-2002
interval: the cross-country standard deviation decreases by 9.1 percent over the sample period,
while the mean increases by 13.6 percent. Convergence proceeds with virtually no interruption over
the whole interval.
INSERT FIGURE 4 HERE
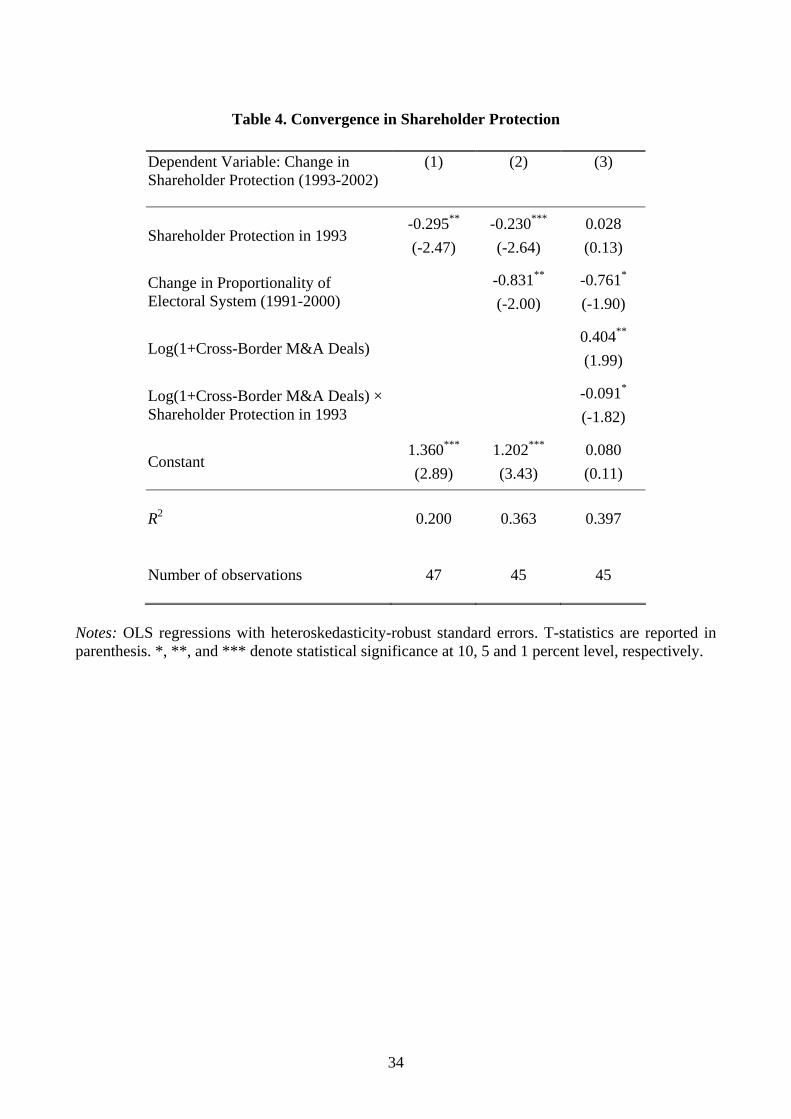
This is confirmed also by the regression in column (1) of Table 4, where the change in
shareholder protection between 1993 and 2002 is seen to be negatively and significantly correlated
11 This is confirmed by the fact that calendar year dummies, which were are statistically significant in Panel A, are not jointly significant when the dependent variable is relative stock market capitalization. As a result, calendar year

27
with the initial level of the same variable, which implies that countries that started from a lower
initial level improved their legal standards by more. This is confirmed by the regression results
shown in column (2), where we control for changes in the degree of proportionality in the electoral
rules, which Pagano and Volpin (2005b) find to be an important determinant of the degree of
shareholder protection.
INSERT TABLE 4 HERE
The question arises if this convergence is generated – or at least reinforced – by cross-border
M&A activity, as implied by our model. This prediction is tested in column (3) of Table 4, where
the logarithm of the cumulated number of cross-border deals into the corresponding country is
entered as an additional explanatory variable, both linearly and interacted with shareholder
protection.12 Cross-border M&A activity has a positive impact on the change of shareholder
protection: the coefficient of the linear term is significantly different from zero at the 10-percent
level. But the most striking result is that in this specification the initial level of shareholder
protection is significant only through its interaction with cross-border M&A deals. This is
consistent with the prediction that “convergence by law” is driven by “convergence by contract”.
5. Conclusions
This paper presents a political economy model where there is a two-way causal relation between
investor protection and stock market development. When better investor protection is expected,
companies can issue more equity, leading to a broader stock market. In turn, more equity issuance
expands the shareholder base and increases the political support for shareholder protection. This
feedback loop can generate multiple equilibria, with investor protection, stock market size and
investor participation being positively correlated across equilibria. If expectations about future
regulation are shaped by the past, equilibrium displays path-dependence. However, legal reform can
occur for a sufficiently large shock to some economic variables: a decrease in the workers’
valuation of private benefits, an increase in firm profitability or a reduction in the wealth of rentiers
can trigger a switch from a low-level to a high-level equilibrium.
Using panel data for 47 countries spanning the 1993-2002 interval, we take some of the model’s
dummies are not included in the specification of Panel B. 12 More precisely, the variable is the natural logarithm of 1 + Number of Cross-Border M&A Deals because for one country the number of cross-border deals is zero.

28
prediction to the data. The positive correlation between investor protection and stock market
development predicted by the model is broadly consistent with the evidence, but not as strong and
precisely estimated as that identified by LLSV (1997) in cross-country data of the early 1990s,
because it weakens considerably after 1997. Moreover, it weakens in panel data estimates with
country and calendar year fixed effects. But the correlation is stronger and more precisely estimated
when one controls for the endogeneity of shareholder protection via instrumental variables.
Finally, we uncover evidence of international convergence of shareholder protection to best-
practice standards. The speed of convergence appears to be correlated with cross-border M&A
activity into the relevant country. This conforms to our model’s prediction that the tendency of
companies to opt out of national company law via M&A increases the political support for greater
domestic shareholder protection.

29
References
Abiad, A., and A. Mody, 2005, “Financial Reform: What Shakes It? What Shapes It?,” American Economic Review 95, 66-88.
Acemoglu, D., 2003, “Why Not a Political Coase Theorem? Social Conflict, Commitment and Politics,” Journal of Comparative Economics 31, 620-652.
Acemoglu, D., and S. Johnson, 2003, “Unbundling Institutions,” Working Paper, MIT.
Allen, F. (2005), “Corporate Governance in Emerging Economies,” Oxford Review of Economic Policy 21, 164-177.
Allen, F. and D. Gale (2003), “A Comparative Theory of Corporate Governance,” Wharton Financial Institutions Center, Working Paper 03-27.
Bebchuk, L., and M. Roe, 1999, “A Theory of Path Dependence in Corporate Governance and Ownership,” Stanford Law Review 52, 127-170.
Beck, T., A. Demirguc-Kunt, and R. Levine, 2003, “Law, Endowment, and Finance,” Journal of Financial Economics 70, 137-181.
Beck, T., G. Clarke, A. Groff, P. Keefer, and P. Walsh, 2002, “New Tools and Tests in Comparative Political Economy: The Database of Political Institutions”, Working Paper, The World Bank Development Research Group.
Biais, B., and E. Perotti, 2002, “Machiavellian Privatization,” American Economic Review 92, 240-258.
Braun, M., and C. Raddatz, 2004, “Trade Liberalization and the Politics of Financial Development,” Working Paper, UCLA.
Bris, A, and C. Cabolis, 2004, “The Value of Investor Protection: Firm Evidence from Cross-Border Mergers,” Working Paper, Yale School of Management.
Cespa, Giovanni, and Giacinta Cestone, 2004, “Corporate Social Responsibility and Managerial Entrenchment,” CEPR Discussion Paper No. 4648.
Coffee, J., 1999, “The Future as History: The Prospects for Global Convergence in Corporate Governance and Its Implications,” Northwestern University Law Review 93, 641-708.
Doidge, C. G., A. Karolyi, and R. M. Stulz, 2004, “Why are foreign firms listed in the U.S. worth more?,” Journal of Financial Economics 71, 205–238.
Gilson R. J., 2001, “Globalizing Corporate Governance: Convergence of Form or Function,” American Journal of Comparative Law 49, 329-357.
Hansmann, H., and R. Kraakman, 2001, “The End of History for Corporate Law,” Georgetown Law Journal 89, 439-468.
30
Hellwig, Martin, 2000, “On the economics and politics of corporate finance and corporate control,” in Xavier Vives, ed.: Corporate Governance: Theoretical and Empirical Perspectives, Cambridge University: U.K.
La Porta, R., F. Lopez-de-Silanes, A. Shleifer, and R. Vishny, 1997, “Legal Determinants of External Finance,” Journal of Finance 52, 1131-1150.
La Porta, R., F. Lopez-de-Silanes, A. Shleifer, and R. Vishny, 1998, “Law and Finance,” Journal of Political Economy 107, 1113-1155.
Lamoreaux, N. R., and J. L. Rosenthal, 2004, “Legal Regime and Business’s Organizational Choice: A Comparison of France and the United States during the Mid-Nineteenth Century.” National Bureau of Economic Research (Cambridge, MA) Working Paper No. 10288.
Miller, D. P., 1999. “The Market Reaction to International Cross-listings: Evidence from Depositary Receipts”, Journal of Financial Economics 51, 103-123.
Pagano, M., and P. Volpin, 2001, ““The Political Economy of Finance” Oxford Review of Economic Policy 17, 502-519.
Pagano, M., and P. Volpin, 2005a, “Workers, Managers, and Corporate Control,” Journal of Finance 60, 841-868.
Pagano, M., and P. Volpin, 2005b, “The Political Economy of Corporate Governance,” American Economic Review 95(4).
Perotti, E., and P. Volpin, 2005, “Lobbying on Entry,” Working Paper, London Business School.
Perotti, E., and E.-L. von Thadden, 2005, “The Political Economy of Dominant Investors,” Journal of Political Economy, forthcoming.
Rajan, R., and L. Zingales, 2003, “The Great Reversals: The Politics of Financial Development in the 20th Century,” Journal of Financial Economics 69, 5-50.
Roe, M. J., 2003, Political Determinants of Corporate Governance, Oxford University Press: Oxford, U.K.
Rossi, S., and P. Volpin, 2004, “Cross-country determinants of mergers and acquisitions,” Journal of Financial Economics 74, 277-304.
Stulz, R. M., and Rohan Williamson, 2003, “Culture, Openness, and Finance,” Journal of Financial Economics 70, 313-349.
Tirole, J., 2005, The Theory of Corporate Finance, Princeton University Press, forthcoming.

31
Table 1. Descriptive Statistics
Variable Mean Standard Deviation (Overall)
Standard Deviation (Between)
Standard Deviation (Within)
Number of Observations
Number of Countries
Shareholder Protection 3.37 1.20 1.14 0.40 470 47
Stock market Capitalization / GDP 0.67 0.66 0.58 0.32 469 47
IPOs / Listed Companies 0.62 0.07 0.05 0.04 419 46
Completed Cross-Border M&A Deals 5.41 11.23 9.57 5.35 423 47
Proportionality of Electoral System 1.72 1.24 1.25 0.18 440 45
Notes: Except for Proportionality, the panel spans the 1993-2002 interval and includes 47 countries, which coincide with that of LLSV (1998) with the exception of Jordan and Sri Lanka. Proportionality is defined over the 1991-2000 interval for 45 countries (the LLSV sample with the exception of Hong-Kong, Jordan, Nigeria and Sri Lanka). Shareholder Protection is the LLSV anti-director rights index as updated by the responses to our questionnaires. Stock Market Capitalization is the total market value of domestic listed companies, Listed Companies is the number of domestic companies listed on the stock exchange, IPOs is the number of domestic initial public offerings. All these variables, GDP and Population are drawn from the World Development Report, various issues. Completed Cross-Border M&A Deals is the sum of the number of companies acquired in a given country via cross-border deals over the period 1993-2002, from SDC Platinum, by Thompson Financials. Proportionality equals 3 if 100 percent of seats are assigned via a proportional rule, 2 if the majority of seats are assigned by this rule, 1 if a minority of seats is assigned proportionally, and 0 if no seats are assigned in this way. It is defined as PR – PLURALTY – HOUSESYS + 2, which are variables drawn from World Bank Database of Political Indicators, and defined in Beck et al. (2002).
32
Table 2. Shareholder Protection and Stock Market Development: OLS Regressions
Dependent Variable: Stock Market Capitalization / GDP
Coefficient (t-statistic)
R2 Number of observations
Regression on pooled data (1993-2003)
0.163***
(6.44) 0.088 469
Regression on country means (1993-2003)
0.172**
(2.41) 0.114 469
1993 data 0.189***
(2.91) 0.181 46
1994 data 0.201***
(2.89) 0.164 47
1995 data 0.183***
(2.72) 0.146 47
1996 data 0.189***
(2.80) 0.141 47
1997 data 0.170***
(2.30) 0.123 47
1998 data 0.120
(1.39) 0.046 47
1999 data 0.157
(1.44) 0.050 47
2000 data 0.118
(1.02) 0.029 47
2001 data 0.121
(1.34) 0.051 47
2002 data 0.109
(1.31) 0.046 47
Notes: OLS regressions with heteroskedasticity-robust standard errors. T-statistics are reported in parenthesis. *, **, and *** denote statistical significance at 10, 5 and 1 percent level, respectively.

33
Table 3. Shareholder Protection and Stock Market Development: Regression Analysis
Estimation Method
Coefficient (t-statistic)
Calendar Year Dummies
R2 No. Obs.
Panel A. Dependent Variable: Stock Market Capitalization / GDP
Fixed effects 0.013 (0.34)
Included [Significant]
Within: 0.142, between: 0.100, overall: 0.046
469
Fixed effects, IV
0.040 (0.75)
Included [Significant]
Within: 0.115, between: 0.027, overall: 0.052
397
Arellano Bond
0.100**
(2.19) Included
[Significant] Wald χ2 = 62.9 351
Panel B. Dependent Variable: Relative Stock Market Capitalization
Fixed effects 0.075 (1.36)
Not included [Not significant]
Within: 0.004, between: 0.071, overall: 0.063
469
Fixed effects, IV
0.147***
(2.07) Not included
[Not significant] Within: 0.002, between: 0.072,
overall: 0.066 397
Arellano Bond
0.072
(1.08) Not included
[Not significant] Wald χ2 = 3536 351
Panel C. Dependent Variable: Number of IPOs / Number of Listed Companies
Fixed effects 0.028***
(4.21) Included
[Significant] Within:0.166, between: 0.000,
overall: 0.031 419
Fixed effects, IV
0.031***
(3.47) Included
[Significant] Within: 0.169, between: 0.001,
overall: 0.019 362
Arellano Bond
0.010
(0.85) Included
[Significant] Wald χ2 = 218 305
Notes: The estimates refer to the coefficient of shareholder protection, and the statistic in parenthesis is the t-statistic in the fixed effect regressions, and the z-statistic in the IV and Arellano-Bond regressions. *, **, and *** denote statistical significance at 10, 5 and 1 percent level, respectively. The lagged value of Shareholder Protection and Proportionality are used as instruments in the IV regressions. In the Arellano-Bond regression, the explanatory variables include one lag of the dependent variable; the change in Proportionality is used as an instrument; and the Wald χ2 statistic tests for the joint significance of the regressors (the R2 cannot be computed).
34
Table 4. Convergence in Shareholder Protection
Dependent Variable: Change in Shareholder Protection (1993-2002)
(1) (2) (3)
Shareholder Protection in 1993 -0.295**
(-2.47) -0.230***
(-2.64) 0.028
(0.13)
Change in Proportionality of Electoral System (1991-2000)
-0.831**
(-2.00) -0.761*
(-1.90)
Log(1+Cross-Border M&A Deals) 0.404**
(1.99)
Log(1+Cross-Border M&A Deals) × Shareholder Protection in 1993
-0.091*
(-1.82)
Constant 1.360***
(2.89) 1.202***
(3.43) 0.080
(0.11)
R2 0.200 0.363 0.397
Number of observations 47 45 45
Notes: OLS regressions with heteroskedasticity-robust standard errors. T-statistics are reported in parenthesis. *, **, and *** denote statistical significance at 10, 5 and 1 percent level, respectively.
35
t = 0 t = 1 t = 2 t = 3 - Creation of firms. Vote on investor - Choice of technology: - Realization of profits. - Equity issuance and protection. transparent or opaque. - Payment of dividends. market equilibrium. - Consumption of private benefits.
Figure 1. Time line

36
Wβ
α 0
Mβ
Figure 2. Political preferences of workers and managers
Area A: owner-managers and
workers vote for low λ
Area B: rentiers and
workers vote for high λ
1M W Rβ β β= − −

37
λλ
(1 ) (1 )1 kR R
M
p r ya na y
β λβ
λ+ − −
− −
* ( )eWβ λ
α
*( )Wβ λ
(1 ) (1 )1 kR R
M
p r ya na y
β λβλ
+ − −− −
λ
Figure 3a. Unique equilibrium with high shareholder protection
Wβ
38
λ
λ
* ( )eWβ λ
α
*( )Wβ λ
(1 ) (1 )1 kR R
M
p r ya na y
β λβλ
+ − −− −
λ
0
Figure 3b. Unique equilibrium with low shareholder protection
Wβ
39
λλ
(1 ) (1 )1 kR R
M
p r ya na y
β λβλ
+ − −− −
* ( )eWβ λ
α
*( )Wβ λ
(1 ) (1 )1 kR R
M
p r ya na y
β λβλ
+ − −− −
λ
Figure 3c. Multiple equilibria with different shareholder protection
Wβ
40
2.90
3.00
3.10
3.20
3.30
3.40
3.50
3.60
3.70
1993 1994 1995 1996 1997 1998 1999 2000 2001 20021.081.11.121.141.161.181.21.221.241.261.28
Cross-country mean Cross-country standard deviation
Figure 4. Evolution of shareholder protection around the world