Alcohol as a Risk Factor for Type 2 Diabetes: A systematic review and meta-analysis
10
Alcohol as a Risk Factor for Type 2 Diabetes A systematic review and meta-analysis DOLLY O. BALIUNAS, MSC 1,2 BENJAMIN J. TAYLOR, MSC 1,2 HYACINTH IRVING, MA 1 MICHAEL ROERECKE, MSC 1,2 JAYADEEP PATRA, PHD 1 SATYA MOHAPATRA, PHD 1 J¨ URGEN REHM, PHD 1,2,3 OBJECTIVE — To clarify the dose-response relationship between alcohol consumption and type 2 diabetes. RESEARCH DESIGN AND METHODS — A systematic computer-assisted and hand search was conducted to identify relevant articles with longitudinal design and quantitative measurement of alcohol consumption. Adjustment was made for the sick-quitter effect. We used fractional polynomials in a meta-regression to determine the dose-response relationships by sex and end point using lifetime abstainers as the reference group. RESULTS — The search revealed 20 cohort studies that met our inclusion criteria. A U- shaped relationship was found for both sexes. Compared with lifetime abstainers, the relative risk (RR) for type 2 diabetes among men was most protective when consuming 22 g/day alcohol (RR 0.87 [95% CI 0.76 –1.00]) and became deleterious at just over 60 g/day alcohol (1.01 [0.71–1.44]). Among women, consumption of 24 g/day alcohol was most protective (0.60 [0.52– 0.69]) and became deleterious at about 50 g/day alcohol (1.02 [0.83–1.26]). CONCLUSIONS — Our analysis confirms previous research findings that moderate alcohol consumption is protective for type 2 diabetes in men and women. Diabetes Care 32:2123–2132, 2009 D iabetes is a major public health problem with long-term conse- quences including loss of vision; kidney failure; amputations; gastrointes- tinal, genitourinary, and cardiovascular symptoms; and sexual dysfunction (1). Several factors increase the risk of diabe- tes, including being overweight, lack of physical activity, and family history of di- abetes (2). There is growing consensus that alcohol consumption is an influenc- ing factor. The biological mechanism is uncertain, but there are several factors that may explain the relationship, includ- ing increases in insulin sensitivity after moderate alcohol consumption (3), changes in levels of alcohol metabolites (4), increases in HDL cholesterol concen- trations (5), or via the anti-inflammatory effect of alcohol (6). The exact nature of the dose-response relationship remains unclear (7). Several reviews have suggested a U-shaped rela- tionship or a protective effect of moderate consumption with some question about the effect of higher levels of alcohol con- sumption (7–10). However, these reviews are narrative. Two quantitative reviews have been conducted. Carlsson et al. (11) categorized consumption into predeter- mined moderate- and high-consumption groups and used current abstainers or low consumers as the reference group. In their analysis, moderate consumption was as- sociated with a 30% reduced risk of dia- betes among men (relative risk [RR] 0.72 [95% CI 0.67– 0.77]) and women (0.68 [0.61– 0.75]). The risk associated with high consumption was described as being unclear. In the other meta-analysis, in which alcohol consumption was treated continuously, a U-shaped relationship was found for both men and women, with a more protective effect of moderate con- sumption observed for women (12). However, in both of these reviews, the reference group was composed of former drinkers and lifetime abstainers. Because former drinkers may be inspired to ab- stain due to health concerns, they may actually be at increased risk of developing diabetes, known as the sick-quitter effect (13). Our goal, therefore, was to examine the relationship between alcohol con- sumption and the risk of type 2 diabetes by conducting a meta-analysis that uses a flexible modeling approach and that, for the first time, uses lifetime abstention as the reference category. RESEARCH DESIGN AND METHODS — Non–insulin-depen- dent diabetes (type 2) was the outcome. Although this outcome can be measured in various ways, the current World Health Organization (WHO) clinical diagnostic criteria were considered the gold standard for this meta-analysis. These criteria de- fine diabetes by a fasting plasma glucose (FPG) level 7.0 mmol/l or a venous plasma concentration 11.1 mmol/l 2 h after a 75-g oral glucose challenge (14). The American Diabetes Association (ADA) also includes as sufficient criteria symptoms of hyperglycemia and a ran- dom plasma glucose concentration 11.1 mmol/l (1). The criteria, however, changed in 1996 (ADA) and 1999 (WHO) from an FPG 7.8 mmol/l. Articles were found via a search of the following sources: Medline (via OVID and PubMed), the Cumulative Index to Nursing and Allied Health Literature (CINAHL), the Excerpta Medica Database (EMBASE), CAB Abstracts, World Health Organization Library Information System (WHOLIS), the System for Information on Grey Literature in Europe (SIGLE), the Alcohol and Alcohol Problems Science ●●●●●●●●●●●●●●●●●●●●●●●●●●●●●●●●●●●●●●●●●●●●●●●●● From the 1 Centre for Addiction and Mental Health, Toronto, Ontario, Canada; the 2 Dalla Lana School of Public Health, University of Toronto, Toronto, Ontario, Canada; and the 3 Technische Universita ¨t Dresden, Dresden, Germany. Corresponding author: Dolly Baliunas, [email protected]. Received 6 February 2009 and accepted 22 July 2009. DOI: 10.2337/dc09-0227 © 2009 by the American Diabetes Association. Readers may use this article as long as the work is properly cited, the use is educational and not for profit, and the work is not altered. See http://creativecommons. org/licenses/by-nc-nd/3.0/ for details. The costs of publication of this article were defrayed in part by the payment of page charges. This article must therefore be hereby marked “advertisement” in accordance with 18 U.S.C. Section 1734 solely to indicate this fact. Reviews/Commentaries/ADA Statements M E T A - A N A L Y S I S care.diabetesjournals.org DIABETES CARE, VOLUME 32, NUMBER 11, NOVEMBER 2009 2123
-
Upload
independent -
Category
Documents
-
view
2 -
download
0
Transcript of Alcohol as a Risk Factor for Type 2 Diabetes: A systematic review and meta-analysis
Alcohol as a Risk Factor for Type 2DiabetesA systematic review and meta-analysis
DOLLY O. BALIUNAS, MSC1,2
BENJAMIN J. TAYLOR, MSC1,2
HYACINTH IRVING, MA1
MICHAEL ROERECKE, MSC1,2
JAYADEEP PATRA, PHD1
SATYA MOHAPATRA, PHD1
JURGEN REHM, PHD1,2,3
OBJECTIVE — To clarify the dose-response relationship between alcohol consumption andtype 2 diabetes.
RESEARCH DESIGN AND METHODS — A systematic computer-assisted and handsearch was conducted to identify relevant articles with longitudinal design and quantitativemeasurement of alcohol consumption. Adjustment was made for the sick-quitter effect. We usedfractional polynomials in a meta-regression to determine the dose-response relationships by sexand end point using lifetime abstainers as the reference group.
RESULTS — The search revealed 20 cohort studies that met our inclusion criteria. A U-shaped relationship was found for both sexes. Compared with lifetime abstainers, the relativerisk (RR) for type 2 diabetes among men was most protective when consuming 22 g/day alcohol(RR 0.87 [95% CI 0.76–1.00]) and became deleterious at just over 60 g/day alcohol (1.01[0.71–1.44]). Among women, consumption of 24 g/day alcohol was most protective (0.60[0.52–0.69]) and became deleterious at about 50 g/day alcohol (1.02 [0.83–1.26]).
CONCLUSIONS — Our analysis confirms previous research findings that moderate alcoholconsumption is protective for type 2 diabetes in men and women.
Diabetes Care 32:2123–2132, 2009
D iabetes is a major public healthproblem with long-term conse-quences including loss of vision;
kidney failure; amputations; gastrointes-tinal, genitourinary, and cardiovascularsymptoms; and sexual dysfunction (1).Several factors increase the risk of diabe-tes, including being overweight, lack ofphysical activity, and family history of di-abetes (2). There is growing consensusthat alcohol consumption is an influenc-ing factor. The biological mechanism isuncertain, but there are several factorsthat may explain the relationship, includ-ing increases in insulin sensitivity aftermoderate alcohol consumption (3),changes in levels of alcohol metabolites(4), increases in HDL cholesterol concen-
trations (5), or via the anti-inflammatoryeffect of alcohol (6).
The exact nature of the dose-responserelationship remains unclear (7). Severalreviews have suggested a U-shaped rela-tionship or a protective effect of moderateconsumption with some question aboutthe effect of higher levels of alcohol con-sumption (7–10). However, these reviewsare narrative. Two quantitative reviewshave been conducted. Carlsson et al. (11)categorized consumption into predeter-mined moderate- and high-consumptiongroups and used current abstainers or lowconsumers as the reference group. In theiranalysis, moderate consumption was as-sociated with a 30% reduced risk of dia-betes among men (relative risk [RR] 0.72
[95% CI 0.67–0.77]) and women (0.68[0.61–0.75]). The risk associated withhigh consumption was described as beingunclear. In the other meta-analysis, inwhich alcohol consumption was treatedcontinuously, a U-shaped relationshipwas found for both men and women, witha more protective effect of moderate con-sumption observed for women (12).However, in both of these reviews, thereference group was composed of formerdrinkers and lifetime abstainers. Becauseformer drinkers may be inspired to ab-stain due to health concerns, they mayactually be at increased risk of developingdiabetes, known as the sick-quitter effect(13). Our goal, therefore, was to examinethe relationship between alcohol con-sumption and the risk of type 2 diabetesby conducting a meta-analysis that uses aflexible modeling approach and that, forthe first time, uses lifetime abstention asthe reference category.
RESEARCH DESIGN ANDMETHODS — Non–insulin-depen-dent diabetes (type 2) was the outcome.Although this outcome can be measuredin various ways, the current World HealthOrganization (WHO) clinical diagnosticcriteria were considered the gold standardfor this meta-analysis. These criteria de-fine diabetes by a fasting plasma glucose(FPG) level �7.0 mmol/l or a venousplasma concentration �11.1 mmol/l 2 hafter a 75-g oral glucose challenge (14).The American Diabetes Association(ADA) also includes as sufficient criteriasymptoms of hyperglycemia and a ran-dom plasma glucose concentration�11.1 mmol/l (1). The criteria, however,changed in 1996 (ADA) and 1999(WHO) from an FPG �7.8 mmol/l.
Articles were found via a search of thefollowing sources: Medline (via OVIDand PubMed), the Cumulative Index toNursing and Allied Health Literature(CINAHL), the Excerpta Medica Database(EMBASE), CAB Abstracts, World HealthOrganization Library Information System(WHOLIS), the System for Informationon Grey Literature in Europe (SIGLE), theAlcohol and Alcohol Problems Science
● ● ● ● ● ● ● ● ● ● ● ● ● ● ● ● ● ● ● ● ● ● ● ● ● ● ● ● ● ● ● ● ● ● ● ● ● ● ● ● ● ● ● ● ● ● ● ● ●
From the 1Centre for Addiction and Mental Health, Toronto, Ontario, Canada; the 2Dalla Lana School ofPublic Health, University of Toronto, Toronto, Ontario, Canada; and the 3Technische UniversitatDresden, Dresden, Germany.
Corresponding author: Dolly Baliunas, [email protected] 6 February 2009 and accepted 22 July 2009.DOI: 10.2337/dc09-0227© 2009 by the American Diabetes Association. Readers may use this article as long as the work is properly
cited, the use is educational and not for profit, and the work is not altered. See http://creativecommons.org/licenses/by-nc-nd/3.0/ for details.
The costs of publication of this article were defrayed in part by the payment of page charges. This article must therefore be herebymarked “advertisement” in accordance with 18 U.S.C. Section 1734 solely to indicate this fact.
R e v i e w s / C o m m e n t a r i e s / A D A S t a t e m e n t sM E T A - A N A L Y S I S
care.diabetesjournals.org DIABETES CARE, VOLUME 32, NUMBER 11, NOVEMBER 2009 2123

(ETOH), Web of Science, and the AlcoholIn Moderation (AIM; an alcohol industrydatabase) databases. The databases weresearched for reports published from 1January 1980 to 31 January 2008, withthe following keywords: alcohol or etha-nol, diabetes, case-control or cohort orprospective, and risk. Animal studies,commentaries, editorials, letters, and re-view articles were excluded. No languagerestriction was applied. A simplifiedsearch using the terms alcohol or ethanolas well as diabetes was used for WHOLISand SIGLE, which could not support thecomplex strategy. AIM is not a searchableindex, but a selective list of articles wasreviewed.
The results of the search are shown inFig. 1. The strategy resulted in 1,615 hitsafter the removal of duplicates. The ab-stracts or complete publications were re-viewed and excluded if they contained noindication of a measure of association be-tween alcohol and either morbidity ormortality due to diabetes (n � 1,561), ifthe measure was cross-sectional (n � 8),
or if fewer than three levels of alcohol con-sumption (i.e., no dose-response data)were reported (n � 5). For all non-English articles, the authors were able toascertain eligibility. Of the 41 publica-tions remaining, 3 (student theses) couldnot be obtained and 6 did not containenough information to quantify, for eachalcohol group, consumption in grams perday and/or the measure of association.Two publications reporting consumptionusing continuous measures could not berevised to provide a measure of associa-tion. In cases where more than one pub-lication was generated from a given study,the most comprehensive analysis wasused. After exclusion of 6 such duplicates,24 articles remained. The references ofthese and relevant review articles werechecked for additional publications, and25 articles were identified. One remainedafter applying the same criteria describedabove. Combining the database and handsearches, 25 articles were identified fordata abstraction. However, four were ex-cluded because the number of cases of
diabetes per alcohol exposure group,which was required for the analysis, wasnot reported. One was excluded becausethe measure was for a recent drinking oc-casion and not a typical day. Thus, 20articles were included in the analysis(15–34).
Data abstracted included descriptorsof study design in addition to measures ofassociation. Alcohol consumption wasconverted to grams per day (if not origi-nally reported as such). For studies thatreported ranges of alcohol consumptionfor the categories, the midpoint was used.When the highest category was openended, three-quarters the width of theprevious interval was added to the lowerlimit. Where consumption was reportedin drinks and not grams, the grams ofpure alcohol equivalent described in thearticle, if stated, was used as a conversionfactor; if not stated, conversion was basedon typical drink sizes of the country (35).In one case, due to ambiguity over a sus-pected misprint, the authors were con-tacted via e-mail for clarification (16). 1.
Figure 1—Flow diagram of literature search for the relationship between alcohol consumption and risk of type 2 diabetes.
Alcohol and type 2 diabetes
2124 DIABETES CARE, VOLUME 32, NUMBER 11, NOVEMBER 2009 care.diabetesjournals.org
The measures of effect abstractedwere hazard ratios, odds ratios, and RRsbut are referred to hereafter using thegeneral term RR. Where RRs were notspecifically presented but sufficient infor-mation was available, they were calcu-lated. Where some consumption groupwas used as the reference, the RRs werereformulated to make abstainers the ref-erence group. For studies for which vari-ous estimates including more or lesscovariates were reported, and a choice ex-isted as to which to include, those thatcontrolled for the most potential con-founders not on the causal pathway werechosen. In five cases, crude measureswere used when no other measure wasavailable. In one study, where males andfemales were analyzed together, the RRswere applied to both men and women.
The studies contained two types ofreference groups: lifetime and current al-cohol abstainers. In order to use lifetimeabstention as the reference, RRs for thosestudies that had current abstention as thereference were adjusted; for each sex,studies that had both current and lifetimeabstainers were used to determine theoverall prevalence of former drinkersamong current abstainers and the RR offormer drinkers relative to lifetime ab-stainers (weighted by precision). The RRfor current abstention was then re-
weighted by the overall prevalence andthe RR calculated above and then multi-plied by the dose-specific RRs.
The literature search, review, and ab-straction were carried out by D.B. To en-sure accuracy in abstraction, a limiteddouble entry was performed by B.T. andthe results compared. Both authorsagreed on 5/5 articles reviewed for inclu-sion/exclusion and 605/664 data pointsabstracted over 10 articles. Where dis-agreements existed, both authors re-viewed the materials together until aconsensus was reached.
To assess potential publication bias,separate funnel plots were drawn for con-sumption �20 g/day and �20 g/day. Inthe absence of a known cutoff for decreas-ing and increasing diabetes risk, thesecategories were chosen because they corre-spond to the WHO’s low-risk drinkinglevel guidelines (36). The estimates wereprepooled using the inverse variance–weighted method because funnel plotmethodology assumes one overall RR perarticle. We assessed publication bias us-ing the tests of Egger and Begg (37,38).The Q test was used to assess the presenceof heterogeneity (39). Additionally, the I2
statistic was used to measure inconsis-tency across studies and represents theproportion of variability in the estimates
that is due to between-study variation(40).
We conducted the meta-regressionusing linear, first-order, and second-order fractional polynomial regression ofthe inverse variance–weighted data to es-timate a best-fitting curve (41). Best-fitcurves were assessed using decreased de-viance compared with the referencemodel. Comparisons of curves to deter-mine the best fit were made using a �2
distribution (41).Two sensitivity analyses were con-
ducted.Because themeta-analysisbyKop-pes et al. (12) suggested that studies thatused self-report of diabetes status re-ported a more protective effect than thosethat tested for diabetes, we assessedwhether the model varied by self-reported outcome. Also, we abstracted es-timates that did not adjust for potentialintermediates on the causal pathway toavoid over adjustment. However, thismay have resulted in using estimates thatwere not sufficiently adjusted. Therefore,we repeated the analysis using the most-adjusted estimates available, selectingmodels for men and women based on fitand comparability with the main analysis.All analyses were conducted using Statasoftware (version 10.1; StatCorp, CollegeStation, TX).
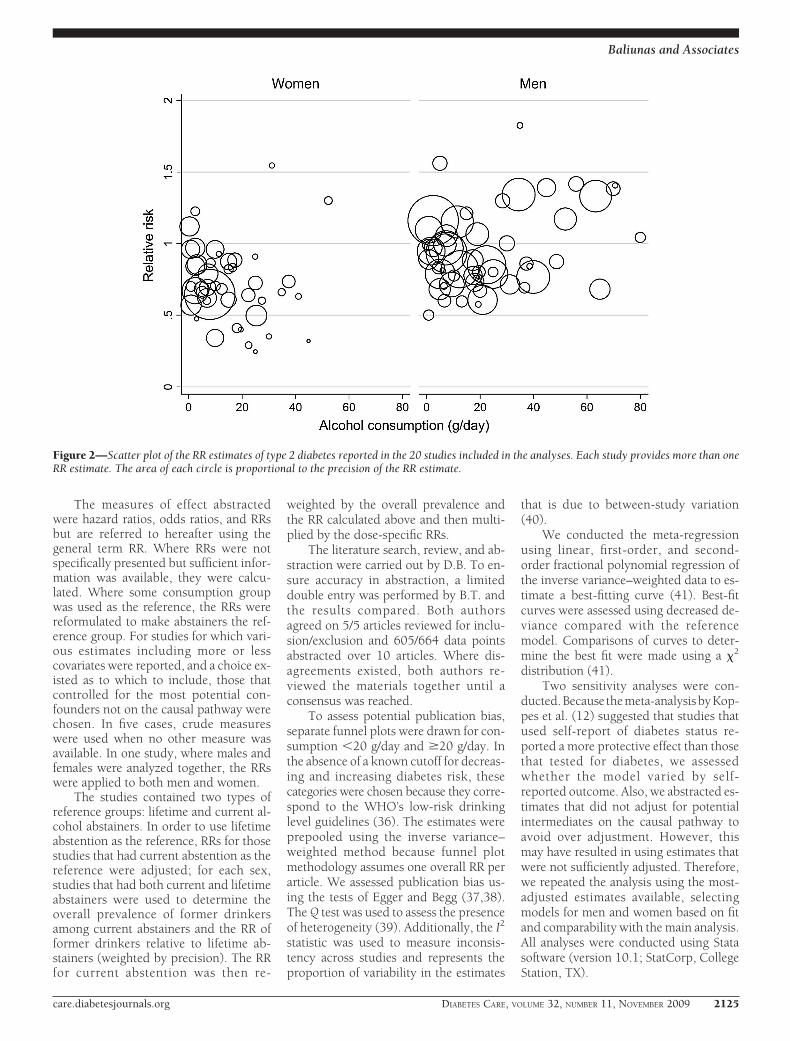
Figure 2—Scatter plot of the RR estimates of type 2 diabetes reported in the 20 studies included in the analyses. Each study provides more than oneRR estimate. The area of each circle is proportional to the precision of the RR estimate.
Baliunas and Associates
care.diabetesjournals.org DIABETES CARE, VOLUME 32, NUMBER 11, NOVEMBER 2009 2125
Tab
le1—
Cha
ract
eris
tics
of20
coho
rtst
udie
sin
clud
edin
the
anal
yses
Firs
tau
thor
(yea
rof
publ
icat
ion)
Loca
tion
Sex
Age
atba
selin
e(y
ears
)n
Follo
w-u
pA
lcoh
olco
nsum
ptio
n
Dia
bete
sde
finit
ion
Adj
ustm
ents
Dur
atio
n(y
ears
)E
vent
s(n
o.)
No.
cate
gori
esD
escr
ipti
on
Aja
ni(2
000)
U.S
.M
en40
–85
20,9
5112
.776
66
No.
ofdr
inks
:rar
ely/
neve
r,1–
3/m
onth
,1/w
eek,
2–4/
wee
k,5–
6/w
eek,
or�
1/da
y
Self-
repo
rt(p
hysi
cian
part
icip
ants
)A
ge,B
MI,
trea
tmen
tas
sign
men
t,sm
okin
gst
atus
,and
phys
ical
acti
vity
Beul
ens
(200
5)T
heN
ethe
rlan
dsW
omen
49–7
016
,330
6.2
760
7g/
wee
k:te
etot
aler
,0–4
.9,
5–29
.9,3
0–69
.9,7
0–13
9.9,
140–
209.
9,or
�21
0
Self-
repo
rtan
d/or
urin
ary
gluc
ose
stri
pan
d/or
Dut
chre
gist
erof
hosp
ital
disc
harg
edi
agno
sis
Age
and
BMI
Car
lsso
n(2
003)
Finl
and
Men
Not
repo
rted
10,9
7019
.427
74
g/da
y:ab
stai
ners
,�5.
0,5.
0–29
.9,o
r�
30.0
Link
age
toFi
nnis
hna
tion
alho
spit
alA
gean
dBM
I
Wom
enN
otre
port
ed11
,808
19.8
297
4g/
day:
abst
aine
rs,�
5.0,
5.0–
19.9
,or
�20
.0di
scha
rge
regi
ster
and
nati
onal
drug
regi
ster
;pa
tien
tsw
hore
ceiv
edon
lyor
alm
edic
atio
n,di
etar
yth
erap
y,or
insu
linas
anad
juva
nttr
eatm
ent
tohy
pogl
ycem
icdr
ugs
wer
eca
tego
rize
das
type
2di
abet
icC
onig
rave
(200
1)U
.S.
Men
40–7
546
,892
10.9
1,57
17
g/da
y:0,
0.1–
4.9,
5.0–
9.9,
10.0
–14.
9,15
.0–2
9.9,
30.0
–49.
9,or
�50
.0
Self-
repo
rt;c
rite
ria:
any
of1)
one
orm
ore
clas
sic
sym
ptom
sw
ith
FPG
�7.
8m
mol
/l,no
nfas
ting
gluc
ose
�11
.1m
mol
/l,or
OG
TT
�11
.1m
mol
/l,2)
elev
ated
plas
ma
gluc
ose
leve
lson
two
diff
eren
toc
casi
ons,
3)hy
pogl
ycem
iatr
eatm
ent
(but
not
type
1di
abet
ic)
Age
and
BMI
deV
egt
(200
2)T
heN
ethe
rlan
dsM
enan
dw
omen
com
bine
d50
–75
1,32
2N
otre
port
ed24
13
g/da
y:0,
�10
,or
�10
FPG
�7.
0m
mol
/lor
OG
TT
�11
.1m
mol
/l;or
subj
ects
alre
ady
bein
gtr
eate
dfo
rdi
abet
es
Age
and
sex
Djo
ussé
(200
7)U
.S.
Men
64–9
51,
909
6.3
109
4D
rink
s/w
eek:
neve
r,fo
rmer
,�1,
1–7,
or�
7U
seof
insu
linor
oral
hypo
glyc
emic
agen
ts;
Age
,BM
I,ed
ucat
ion,
and
smok
ing
stat
usW
omen
63–9
52,
746
6.3
125
4D
rink
s/w
eek:
neve
r,fo
rmer
,�1,
1–7,
or�
7or
FPG
�7.
0m
mol
Alcohol and type 2 diabetes
2126 DIABETES CARE, VOLUME 32, NUMBER 11, NOVEMBER 2009 care.diabetesjournals.org

Tab
le1—
Con
tinu
ed
Firs
tau
thor
(yea
rof
publ
icat
ion)
Loca
tion
Sex
Age
atba
selin
e(y
ears
)n
Follo
w-u
pA
lcoh
olco
nsum
ptio
n
Dia
bete
sde
finit
ion
Adj
ustm
ents
Dur
atio
n(y
ears
)E
vent
s(n
o.)
No.
cate
gori
esD
escr
ipti
on
Hod
ge(2
006)
Aus
tral
iaM
en40
–69
12,2
144
179
5g/
day:
neve
rdr
inke
r,fo
rmer
drin
ker,
�10
,10
–20,
20–3
0,or
�30
Part
icip
ants
mai
led
ques
tion
nair
eco
veri
ngdi
agno
sis
ofdi
abet
es,
Age
,BM
I,co
untr
yof
birt
h,di
etar
ygl
ucos
ein
take
,die
tary
ener
gyW
omen
40–6
919
,208
418
34
g/da
y:ne
ver
drin
ker,
form
erdr
inke
r,�
10,
10–2
0,or
�20
wit
hve
rific
atio
nfr
ompr
imar
yca
reph
ysic
ian
inta
ke,a
ndw
aist
-to-
hip
rati
o
Hol
broo
k(1
990)
U.S
.M
en40
–79
221
1431
4g/
wee
k:no
ndri
nker
,0.1
–84
.3,8
4.4–
176.
0,or
�17
6.1
FPG
�14
0m
g/dl
,OG
TT
�20
0m
g/dl
(11.
1m
mol
/l),o
rse
lf-re
port
Age
Wom
en40
–79
303
1444
4g/
wee
k:no
ndri
nker
,0.1
–41
.3,4
1.4–
117.
4,or
�11
7.5
ofdi
abet
esdi
agno
sis
bya
phys
icia
n
Hu
(200
6)Fi
nlan
dM
en35
–74
10,1
8813
.451
73
g/w
eek:
none
,1–1
00,o
r�
100
Link
age
ofin
foin
Finn
ish
nati
onal
hosp
ital
Age
;BM
I;st
udy
year
;ed
ucat
ion;
syst
olic
Wom
en35
–74
11,1
9713
.444
73
g/w
eek:
none
,1–1
00,o
r�
100
disc
harg
ere
gist
eran
dna
tion
aldr
ugre
gist
erbl
ood
pres
sure
;bre
ad,
vege
tabl
e,fr
uit,
saus
age,
coff
ee,a
ndte
aco
nsum
ptio
n;sm
okin
gst
atus
;and
phys
ical
acti
vity
Kao
(200
1)U
.S.
Men
45–6
45,
423
5.3
547
6D
rink
s/w
eek:
lifet
ime
abst
aine
r,fo
rmer
drin
ker,
�1,
1.1–
7,7.
1–14
,14.
1–21
,or
�21
Any
of1)
FPG
�7.
0m
mol
,2)
nonf
asti
nggl
ucos
e�
11.1
mm
ol,
3)cu
rren
tus
eof
diab
etic
med
icat
ions
,
Non
e
Wom
en45
–64
6,83
85.
456
96
Dri
nks/
wee
k:lif
etim
eab
stai
ner,
form
erdr
inke
r,�
1,1.
1–7,
7.1–
14,1
4.1–
21,o
r�
21
or4)
posi
tive
resp
onse
to“H
asa
doct
orev
erto
ldyo
uth
atyo
uha
ddi
abet
es?”
Lee
(200
3)K
orea
Men
25–5
54,
055
483
5g/
wee
k:ab
stai
ner,
1–90
,91
–180
,181
–360
g,or
�36
0g
Seru
mfa
stin
ggl
ucos
eco
ncen
trat
ion
�12
6m
g/dl
orta
king
diab
etes
med
icat
ion
Non
e
Lee
(200
4)U
.S.
Wom
en55
–69
35,6
9811
1,92
13
g/da
y:0,
1–14
,or
�15
Self-
repo
rtN
one
Mei
sing
er(2
002)
Ger
man
yM
en35
–74
3,05
27.
512
83
g/da
y:0,
0.1–
39.9
,or
�40
.0Se
lf-re
port
diag
nosi
sor
taki
ngan
tidi
abet
esA
ge,B
MI,
and
surv
ey
Wom
en35
–74
3,11
47.
685
3g/
day:
0,0.
1–19
.9,o
r�
20.0
med
icat
ions
Baliunas and Associates
care.diabetesjournals.org DIABETES CARE, VOLUME 32, NUMBER 11, NOVEMBER 2009 2127

Tab
le1—
Con
tinu
ed
Firs
tau
thor
(yea
rof
publ
icat
ion)
Loca
tion
Sex
Age
atba
selin
e(y
ears
)n
Follo
w-u
pA
lcoh
olco
nsum
ptio
n
Dia
bete
sde
finit
ion
Adj
ustm
ents
Dur
atio
n(y
ears
)E
vent
s(n
o.)
No.
cate
gori
esD
escr
ipti
on
Stam
pfer
(198
8)U
.S.
Wom
en34
–59
85,0
514
524
5g/
day:
0,�
1.5,
1.5–
4.9,
5.0–
14.9
,or
�15
.0Se
lf-re
port
byqu
esti
onna
ire,
then
supp
lem
enta
ryqu
esti
onna
ire
rega
rdin
gcl
assi
csy
mpt
oms
wit
hFP
G�
140
mg/
dlor
rand
ompl
asm
agl
ucos
e�
200
mg/
dl(o
rat
leas
ttw
oel
evat
edpl
asm
agl
ucos
ele
vels
ifno
sym
ptom
s)
Age
,BM
I,an
dca
lori
cin
take
Stro
dl(2
006)
Aus
tral
iaW
omen
70–7
48,
896
323
13
Dri
nks/
day:
none
orra
rely
,1–2
,or
�3
Ask
edw
heth
era
doct
orha
dto
ldth
emth
eyha
da
diag
nosi
sof
diab
etes
Non
e
Tsu
mur
a(1
999)
Japa
nM
en35
–61
6,36
29.
745
65
ml/d
ay:a
bsta
iner
,0.1
–19
.0,1
9.1–
29.0
,29.
1–50
.0,o
r�
50.1
FPG
�7.
8m
mol
/l,O
GT
T�
11.1
mm
ol/l,
orFP
G�
7.0
mm
ol/l
Age
,BM
I,sm
okin
gst
atus
,lei
sure
tim
eph
ysic
alac
tivi
ty,
pare
ntal
diab
etes
,and
FPG
leve
lW
aki(
2004
)Ja
pan
Men
40–5
912
,913
Not
repo
rted
703
4g/
day:
abst
aine
ran
din
freq
uent
drin
ker,
�23
.0,2
3.1–
46.0
,or
�46
.1
Self-
repo
rt�H
asa
doct
orev
erto
ldyo
uth
atyo
uha
vedi
abet
es?�
Age
,BM
I,sm
okin
gst
atus
,fam
ilyhi
stor
yof
diab
etes
,lei
sure
tim
eph
ysic
alac
tivi
ty,
Wom
en40
–59
15,9
80N
otre
port
ed48
04
g/da
y:ab
stai
ner
and
infr
eque
ntdr
inke
r,�
4.9,
5.0–
11.5
,or
�11
.6
and
hype
rten
sion
Wan
nam
ethe
e(2
002)
U.K
.M
en40
–59
5,22
116
.819
85
Uni
ts/w
eek:
none
,�1,
1–15
,15–
42,o
r�
42D
iagn
osis
ofdi
abet
esno
tac
cept
edon
basi
sof
self-
com
plet
edqu
esti
onna
ire
unle
ssco
nfirm
edin
prim
ary
care
reco
rds
Age
and
BMI
Alcohol and type 2 diabetes
2128 DIABETES CARE, VOLUME 32, NUMBER 11, NOVEMBER 2009 care.diabetesjournals.org
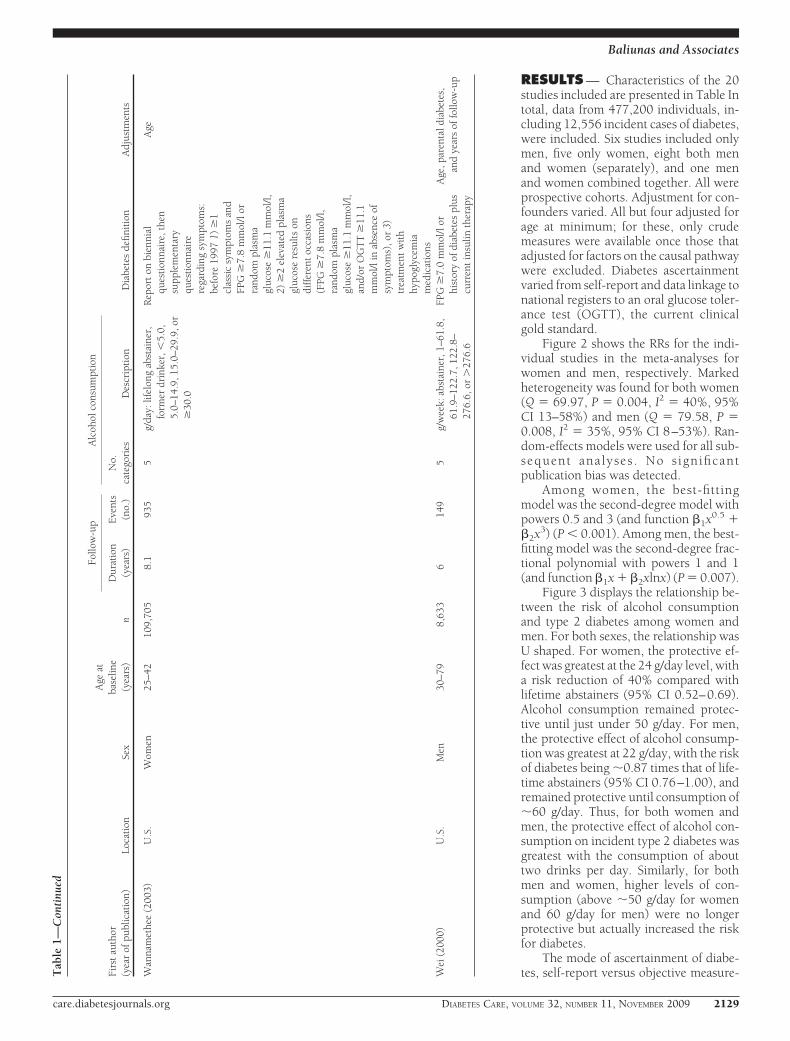
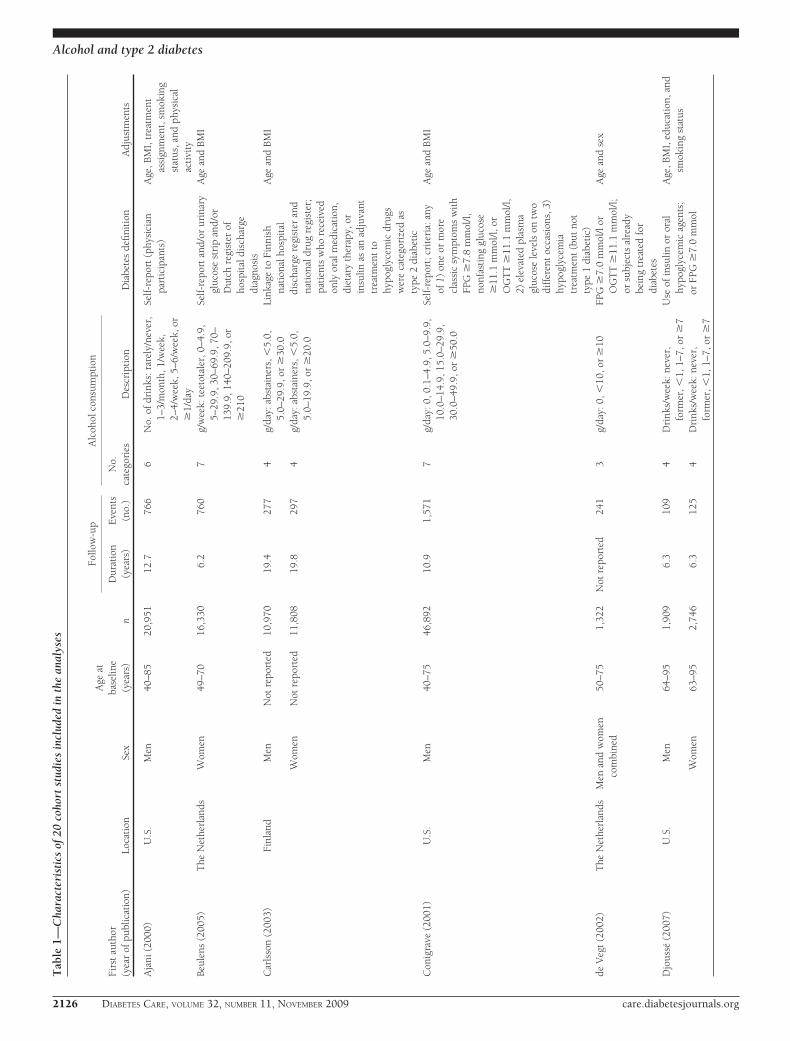
RESULTS — Characteristics of the 20studies included are presented in Table Intotal, data from 477,200 individuals, in-cluding 12,556 incident cases of diabetes,were included. Six studies included onlymen, five only women, eight both menand women (separately), and one menand women combined together. All wereprospective cohorts. Adjustment for con-founders varied. All but four adjusted forage at minimum; for these, only crudemeasures were available once those thatadjusted for factors on the causal pathwaywere excluded. Diabetes ascertainmentvaried from self-report and data linkage tonational registers to an oral glucose toler-ance test (OGTT), the current clinicalgold standard.
Figure 2 shows the RRs for the indi-vidual studies in the meta-analyses forwomen and men, respectively. Markedheterogeneity was found for both women(Q � 69.97, P � 0.004, I2 � 40%, 95%CI 13–58%) and men (Q � 79.58, P �0.008, I2 � 35%, 95% CI 8–53%). Ran-dom-effects models were used for all sub-sequent analyses . No significantpublication bias was detected.
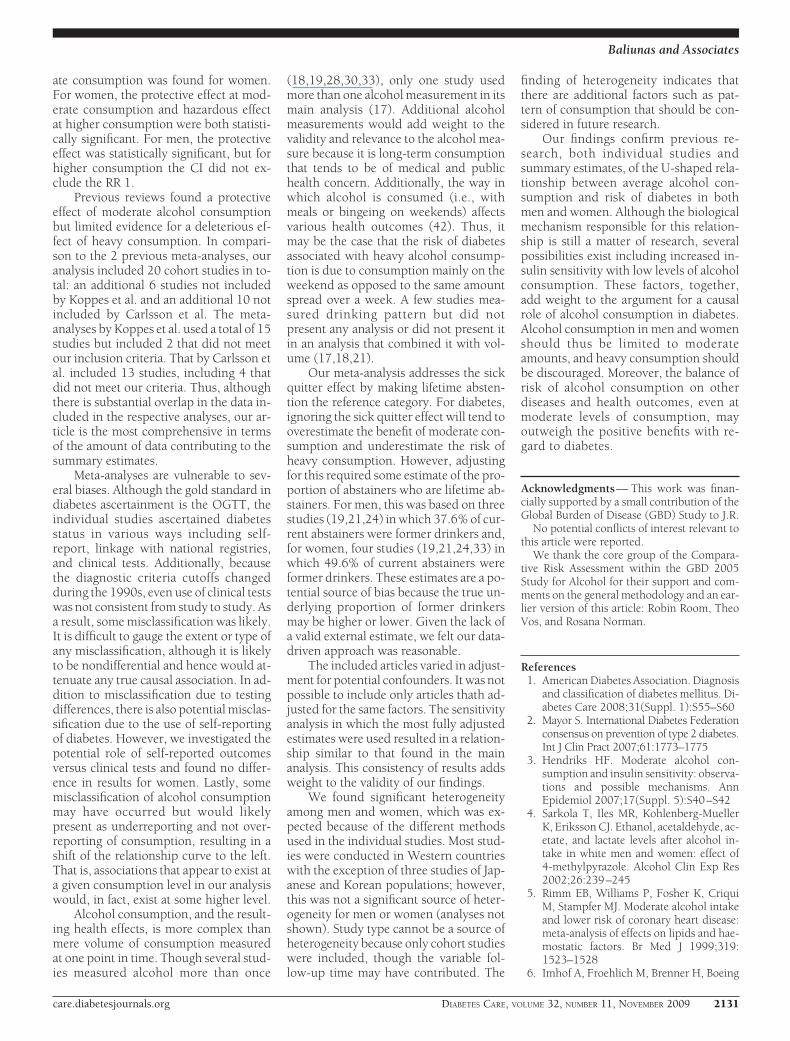
Among women, the best-fittingmodel was the second-degree model withpowers 0.5 and 3 (and function �1x0.5 ��2x3) (P � 0.001). Among men, the best-fitting model was the second-degree frac-tional polynomial with powers 1 and 1(and function �1x � �2xlnx) (P � 0.007).
Figure 3 displays the relationship be-tween the risk of alcohol consumptionand type 2 diabetes among women andmen. For both sexes, the relationship wasU shaped. For women, the protective ef-fect was greatest at the 24 g/day level, witha risk reduction of 40% compared withlifetime abstainers (95% CI 0.52–0.69).Alcohol consumption remained protec-tive until just under 50 g/day. For men,the protective effect of alcohol consump-tion was greatest at 22 g/day, with the riskof diabetes being �0.87 times that of life-time abstainers (95% CI 0.76–1.00), andremained protective until consumption of�60 g/day. Thus, for both women andmen, the protective effect of alcohol con-sumption on incident type 2 diabetes wasgreatest with the consumption of abouttwo drinks per day. Similarly, for bothmen and women, higher levels of con-sumption (above �50 g/day for womenand 60 g/day for men) were no longerprotective but actually increased the riskfor diabetes.
The mode of ascertainment of diabe-tes, self-report versus objective measure-T
able
1—C
onti
nued
Firs
tau
thor
(yea
rof
publ
icat
ion)
Loca
tion
Sex
Age
atba
selin
e(y
ears
)n
Follo
w-u
pA
lcoh
olco
nsum
ptio
n
Dia
bete
sde
finit
ion
Adj
ustm
ents
Dur
atio
n(y
ears
)E
vent
s(n
o.)
No.
cate
gori
esD
escr
ipti
on
Wan
nam
ethe
e(2
003)
U.S
.W
omen
25–4
210
9,70
58.
193
55
g/da
y:lif
elon
gab
stai
ner,
form
erdr
inke
r,�
5.0,
5.0–
14.9
,15.
0–29
.9,o
r�
30.0
Rep
ort
onbi
enni
alqu
esti
onna
ire,
then
supp
lem
enta
ryqu
esti
onna
ire
rega
rdin
gsy
mpt
oms:
befo
re19
971)
�1
clas
sic
sym
ptom
san
dFP
G�
7.8
mm
ol/l
orra
ndom
plas
ma
gluc
ose
�11
.1m
mol
/l,2)
�2
elev
ated
plas
ma
gluc
ose
resu
lts
ondi
ffer
ent
occa
sion
s(F
PG�
7.8
mm
ol/l,
rand
ompl
asm
agl
ucos
e�
11.1
mm
ol/l,
and/
orO
GT
T�
11.1
mm
ol/l
inab
senc
eof
sym
ptom
s),o
r3)
trea
tmen
tw
ith
hypo
glyc
emia
med
icat
ions
Age
Wei
(200
0)U
.S.
Men
30–7
98,
633
614
95
g/w
eek:
abst
aine
r,1–
61.8
,61
.9–1
22.7
,122
.8–
276.
6,or
�27
6.6
FPG
�7.
0m
mol
/lor
hist
ory
ofdi
abet
espl
uscu
rren
tin
sulin
ther
apy
Age
,par
enta
ldia
bete
s,an
dye
ars
offo
llow
-up
Baliunas and Associates
care.diabetesjournals.org DIABETES CARE, VOLUME 32, NUMBER 11, NOVEMBER 2009 2129

ment, did impact the risk relation withvolume of alcohol exposure but only formen; there was no effect for women. Ac-cordingly, we repeated the analyses sepa-rately for self-report versus no self-reportin men and found a linearly decreasingdose-response relationship in the stud-ies with self-report (15,18,27,31),aswell as a model similar to the main anal-ysis in the rest of the studies. The resultin the group based on self report was
mainly influenced by two studies(15,18) that accounted for 81% of theobservations.
The second sensitivity analysis, per-formed using the most adjusted estimatesavailable, resulted in models remarkablysimilar to those in the main analysis forboth sexes. For men, the U-shaped rela-tionship was most protective at a con-sumption of 22 g/day and crossed backover the RR 1 at 62 g/day. For women, the
U-shaped relationship, as with the mainanalysis, was most protective at a con-sumption of 25 g/day and crossed backover to deleterious effect at 51 g/day.
CONCLUSIONS — Our meta-analy-sis confirms the U-shaped relationshipsbetween average amount of alcohol con-sumed per day and risk of incident type 2diabetes among men and women, al-though a more protective effect of moder-
Figure 3—Pooled and fitted RR estimates and 95% CI band. A: The highest single alcohol consumption measure for women was 52.35 g/day, thusx-axis is scaled to 60 g/day. B: Among men, the single highest alcohol consumption measure was 80.04 g/day.
Alcohol and type 2 diabetes
2130 DIABETES CARE, VOLUME 32, NUMBER 11, NOVEMBER 2009 care.diabetesjournals.org
ate consumption was found for women.For women, the protective effect at mod-erate consumption and hazardous effectat higher consumption were both statisti-cally significant. For men, the protectiveeffect was statistically significant, but forhigher consumption the CI did not ex-clude the RR 1.
Previous reviews found a protectiveeffect of moderate alcohol consumptionbut limited evidence for a deleterious ef-fect of heavy consumption. In compari-son to the 2 previous meta-analyses, ouranalysis included 20 cohort studies in to-tal: an additional 6 studies not includedby Koppes et al. and an additional 10 notincluded by Carlsson et al. The meta-analyses by Koppes et al. used a total of 15studies but included 2 that did not meetour inclusion criteria. That by Carlsson etal. included 13 studies, including 4 thatdid not meet our criteria. Thus, althoughthere is substantial overlap in the data in-cluded in the respective analyses, our ar-ticle is the most comprehensive in termsof the amount of data contributing to thesummary estimates.
Meta-analyses are vulnerable to sev-eral biases. Although the gold standard indiabetes ascertainment is the OGTT, theindividual studies ascertained diabetesstatus in various ways including self-report, linkage with national registries,and clinical tests. Additionally, becausethe diagnostic criteria cutoffs changedduring the 1990s, even use of clinical testswas not consistent from study to study. Asa result, some misclassification was likely.It is difficult to gauge the extent or type ofany misclassification, although it is likelyto be nondifferential and hence would at-tenuate any true causal association. In ad-dition to misclassification due to testingdifferences, there is also potential misclas-sification due to the use of self-reportingof diabetes. However, we investigated thepotential role of self-reported outcomesversus clinical tests and found no differ-ence in results for women. Lastly, somemisclassification of alcohol consumptionmay have occurred but would likelypresent as underreporting and not over-reporting of consumption, resulting in ashift of the relationship curve to the left.That is, associations that appear to exist ata given consumption level in our analysiswould, in fact, exist at some higher level.
Alcohol consumption, and the result-ing health effects, is more complex thanmere volume of consumption measuredat one point in time. Though several stud-ies measured alcohol more than once
(18,19,28,30,33), only one study usedmore than one alcohol measurement in itsmain analysis (17). Additional alcoholmeasurements would add weight to thevalidity and relevance to the alcohol mea-sure because it is long-term consumptionthat tends to be of medical and publichealth concern. Additionally, the way inwhich alcohol is consumed (i.e., withmeals or bingeing on weekends) affectsvarious health outcomes (42). Thus, itmay be the case that the risk of diabetesassociated with heavy alcohol consump-tion is due to consumption mainly on theweekend as opposed to the same amountspread over a week. A few studies mea-sured drinking pattern but did notpresent any analysis or did not present itin an analysis that combined it with vol-ume (17,18,21).
Our meta-analysis addresses the sickquitter effect by making lifetime absten-tion the reference category. For diabetes,ignoring the sick quitter effect will tend tooverestimate the benefit of moderate con-sumption and underestimate the risk ofheavy consumption. However, adjustingfor this required some estimate of the pro-portion of abstainers who are lifetime ab-stainers. For men, this was based on threestudies (19,21,24) in which 37.6% of cur-rent abstainers were former drinkers and,for women, four studies (19,21,24,33) inwhich 49.6% of current abstainers wereformer drinkers. These estimates are a po-tential source of bias because the true un-derlying proportion of former drinkersmay be higher or lower. Given the lack ofa valid external estimate, we felt our data-driven approach was reasonable.
The included articles varied in adjust-ment for potential confounders. It was notpossible to include only articles thath ad-justed for the same factors. The sensitivityanalysis in which the most fully adjustedestimates were used resulted in a relation-ship similar to that found in the mainanalysis. This consistency of results addsweight to the validity of our findings.
We found significant heterogeneityamong men and women, which was ex-pected because of the different methodsused in the individual studies. Most stud-ies were conducted in Western countrieswith the exception of three studies of Jap-anese and Korean populations; however,this was not a significant source of heter-ogeneity for men or women (analyses notshown). Study type cannot be a source ofheterogeneity because only cohort studieswere included, though the variable fol-low-up time may have contributed. The
finding of heterogeneity indicates thatthere are additional factors such as pat-tern of consumption that should be con-sidered in future research.
Our findings confirm previous re-search, both individual studies andsummary estimates, of the U-shaped rela-tionship between average alcohol con-sumption and risk of diabetes in bothmen and women. Although the biologicalmechanism responsible for this relation-ship is still a matter of research, severalpossibilities exist including increased in-sulin sensitivity with low levels of alcoholconsumption. These factors, together,add weight to the argument for a causalrole of alcohol consumption in diabetes.Alcohol consumption in men and womenshould thus be limited to moderateamounts, and heavy consumption shouldbe discouraged. Moreover, the balance ofrisk of alcohol consumption on otherdiseases and health outcomes, even atmoderate levels of consumption, mayoutweigh the positive benefits with re-gard to diabetes.
Acknowledgments— This work was finan-cially supported by a small contribution of theGlobal Burden of Disease (GBD) Study to J.R.
No potential conflicts of interest relevant tothis article were reported.
We thank the core group of the Compara-tive Risk Assessment within the GBD 2005Study for Alcohol for their support and com-ments on the general methodology and an ear-lier version of this article: Robin Room, TheoVos, and Rosana Norman.
References1. American Diabetes Association. Diagnosis
and classification of diabetes mellitus. Di-abetes Care 2008;31(Suppl. 1):S55–S60
2. Mayor S. International Diabetes Federationconsensus on prevention of type 2 diabetes.Int J Clin Pract 2007;61:1773–1775
3. Hendriks HF. Moderate alcohol con-sumption and insulin sensitivity: observa-tions and possible mechanisms. AnnEpidemiol 2007;17(Suppl. 5):S40–S42
4. Sarkola T, Iles MR, Kohlenberg-MuellerK, Eriksson CJ. Ethanol, acetaldehyde, ac-etate, and lactate levels after alcohol in-take in white men and women: effect of4-methylpyrazole. Alcohol Clin Exp Res2002;26:239–245
5. Rimm EB, Williams P, Fosher K, CriquiM, Stampfer MJ. Moderate alcohol intakeand lower risk of coronary heart disease:meta-analysis of effects on lipids and hae-mostatic factors. Br Med J 1999;319:1523–1528
6. Imhof A, Froehlich M, Brenner H, Boeing
Baliunas and Associates
care.diabetesjournals.org DIABETES CARE, VOLUME 32, NUMBER 11, NOVEMBER 2009 2131
H, Pepys MB, Koenig W. Effect of alcoholconsumption on systemic markers of in-flammation. Lancet 2001;357:763–767
7. Klatsky AL. Alcohol, cardiovascular dis-eases and diabetes mellitus. PharmacolRes 2007;55:237–247
8. Howard AA, Arnsten JH, Gourevitch MN.Effect of alcohol consumption on diabetesmellitus: a systematic review. Ann InternMed 2004;140:211–219
9. Zilkens RR, Puddey IB. Alcohol and car-diovascular disease: more than one para-dox to consider. Alcohol and type 2diabetes: another paradox? J CardiovascRisk 2003;10:25–30
10. Conigrave KM, Rimm EB. Alchol for theprevention of type 2 diabetes mellitus?Treat Endocrinol 2003;2:145–152
11. Carlsson S, Hammar N, Grill V. Alcoholconsumption and type 2 diabetes: meta-analysis of epidemiological studies indicatesa U-shaped relationship. Diabetologia2005;48:1051–1054
12. Koppes LL, Dekker JM, Hendriks HF,Bouter LM, Heine RJ. Moderate alcoholconsumption lowers the risk of type 2 di-abetes: a meta-analysis of prospective ob-servational studies. Diabetes Care 2005;28:719–725
13. Shaper A, Wannamethee G, Walker M.Alcohol and mortality in British men: ex-plaining the U-shaped curve. Lancet1988;332:1267–1273
14. World health organization. Definition andDiagnosis of Diabetes Mellitus and Inter-mediate Hyperglycemia. Geneva, WorldHealth Org., 2006
15. Ajani UA, Hennekens CH, Spelsberg A,Manson JE. Alcohol consumption andrisk of type 2 diabetes mellitus among USmale physicians. Arch Intern Med 2000;160:1025–1030
16. Beulens JW, Stolk RP, van der SchouwYT, Grobbee DE, Hendriks HF, Bots ML.Alcohol consumption and risk of type 2diabetes among older women. DiabetesCare 2005;28:2933–2938
17. Carlsson S, Hammar N, Grill V, Kaprio J.Alcohol consumption and the incidenceof type 2 diabetes: a 20-year follow-up ofthe Finnish twin cohort study. DiabetesCare 2003;26:2785–2790
18. Conigrave KM, Hu BF, Camargo CA, Jr,Stampfer MJ, Willett WC, Rimm EB. Aprospective study of drinking patterns inrelation to risk of type 2 diabetes amongmen. Diabetes 2001;50:2390–2395
19. Djousse L, Biggs ML, Mukamal KJ, Sisco-
vick DS. Alcohol consumption and type 2diabetes among older adults: the Cardio-vascular Health Study. Obesity 2007;15:1758–1765
20. de Vegt F, Dekker JM, Groeneveld WJA,Nijpels G, Stehouwer CDA, Bouter LM,Heine RJ. Moderate alcohol consumptionis associated with lower risk for incidentdiabetes and mortality: the Hoorn Study.Diabetes Res and Clin Pract 2002;57:53–60
21. Hodge AM, English DR, O’Dea K, GilesGG. Alcohol intake, consumption pat-tern and beverage type, and the risk oftype 2 diabetes. Diabet Med 2006;23:690 – 697
22. Holbrook TL, Barrett-Connor E, WingardDL. A prospective population-based studyof alcohol use and non-insulin-dependentdiabetes mellitus. Am J Epidemiol 1990;132:902–909
23. Hu G, Jousilahti P, Peltonen M, Bidel S,Tuomilehto J. Joint association of coffeeconsumption and other factors to the riskof type 2 diabetes: a prospective study inFinland. Int J Obes 2006;30:1742–1749
24. Kao WH, Puddey IB, Boland LL, WatsonRL, Brancati FL. Alcohol consumptionand the risk of type 2 diabetes mellitus:atherosclerosis risk in communitiesstudy. Am J Epidemiol 2001;154:748–757
25. Lee DH, Ha MH, Kim JH, Christiani DC,Gross MD, Steffes M, Blomhoff R, JacobsDR Jr. Gamma-glutamyltransferase anddiabetes: a 4 year follow-up study. Diabe-tologia 2003;46:359–364
26. Lee DH, Folsom AR, Jacobs DR Jr. Dietaryiron intake and type 2 diabetes incidence inpostmenopausal women: the Iowa Wom-en’s Health Study. Diabetologia 2004;47:185–194
27. Meisinger C, Thorand B, Schneider A,Stieber J, Doring A, Lowel H. Sex differ-ences in risk factors for incident type 2diabetes mellitus: the MONICA Augsburgcohort study. Arch Intern Med 2002;162:82–89
28. Stampfer MJ, Colditz GA, Willett WC,Manson JE, Arky RA, Hennekens CH,Speizer FE. A prospective study of mod-erate alcohol drinking and risk of diabetesin women. Am J Epidemiol 1988;128:549–558
29. Strodl E, Kenardy J. Psychosocial andnon-psychosocial risk factors for the newdiagnosis of diabetes in elderly women.Diabetes Res Clin Pract 2006;74:57–65
30. Tsumura K, Hayashi T, Suematsu C, EndoG, Fujii S, Okada K. Daily alcohol con-sumption and the risk of type 2 diabetesin Japanese men: the Osaka Health Sur-vey. Diabetes Care 1999;22:1432–1437
31. Waki K, Noda M, Sasaki S, Matsumura Y,Takahashi Y, Isogawa A, Ohashi Y, Kad-owaki T, Tsugane S, JPHC Study Group.Alcohol consumption and other risk fac-tors for self-reported diabetes amongmiddle-aged Japanese: a population-based prospective study in the JPHCstudy cohort I. Diabet Med 2005;22:323–331
32. Wannamethee SG, Shaper AG, Perry IJ,Alberti KG. Alcohol consumption and theincidence of type II diabetes. J EpidemiolCommunity Health 2002;56:542–548
33. Wannamethee SG, Camargo CA, Jr, Man-son JE, Willett WC, Rimm EB. Alcoholdrinking patterns and risk of type 2 dia-betes mellitus among younger women.Arch Intern Med 2003;163:1329–1336
34. Wei M, Gibbons LW, Mitchell TL, Ka-mpert JB, Blair SN. Alcohol intake andincidence of type 2 diabetes in men. Dia-betes Care 2000;23:18–22
35. World Health Organization. InternationalGuide for Monitoring Alcohol Consumptionand Related Harm. Geneva, World HealthOrg., 2000
36. Babor TF, Higgin-Biddle JC, Saunders JB,Monteiro MG; World Health Organiza-tion. The Alcohol Use Disorders Identifica-tion Test: Guidelines for Use in PrimaryCare. Geneva, World Health Org., 2001
37. Egger M, Davey Smith G, Schneider M,Minder C. Bias in meta-analysis detectedby a simple, graphical test. Br Med J 1997;315:629–634
38. Begg CB, Mazumdar M. Operating char-acteristics of a rank correlation test forpublication bias. Biometrics 1994;50:1088–101
39. Cochran WG. The combination of esti-mates from different experiments. Bio-metrics 1954;10:101–129
40. Higgins JP, Thompson SG. Quantifyingheterogeneity in a meta-analysis. Stat Med2002;21:1539–1558
41. Royston P. A strategy for modelling theeffect of a continuous covariate in medi-cine and epidemiology. Stat Med 2000;19:1831–1847
42. Rehm J, Gmel G, Sempos CT, Trevisan M.Alcohol-related morbidity and mortality.Alcohol Res Health 2003;27:39–51
Alcohol and type 2 diabetes
2132 DIABETES CARE, VOLUME 32, NUMBER 11, NOVEMBER 2009 care.diabetesjournals.org