Alameda Brown Ware and San Francisco Mountain Gray Ware Technology and Economics
40
Citation: Heidke, James M., Susan C. Leary, Sarah A. Herr, and Mark D. Elson 2007 Alameda Brown Ware and San Francisco Mountain Gray Ware Technology and Econom- ics. In Sunset Crater Archaeology: The History of a Volcanic Landscape. Ceramic Tech- nology, Distribution, and Use, edited by S. Van Keuren, M. D. Elson, and S. A. Herr, pp. 145-183. Anthropological Papers No. 32. Center for Desert Archaeology, Tucson. Anthropological Papers No. 32: Sunset Crater Archaeology: The History of a Volcanic Landscape Anthropological Papers No. 32 Center for Desert Archaeology Edited by Scott Van Keuren Mark D. Elson Sarah A. Herr Contributions by Mark D. Elson James M. Heidke Sarah A. Herr Susan Leary Elizabeth J. Miksa Danielle Montague-Judd Scott Van Keuren Ceramic Technology, Distribution, and Use TRACS No. 089 CN 434 H2022 02D Contract No. 97-41 TABLE OF CONTENTS 1. Overview of the Ceramic Analyses, Scott Van Keuren and Sarah A. Herr 2. Overview of Ceramic Wares and Types, Sarah A. Herr and Elizabeth J. Miksa 3. The Function of U.S. 89 Project Ceramics, Scott Van Keuren 4. Petrographic Analysis of Tempering Materials, Elizabeth J. Miksa, Danielle Montague-Judd, and James M. Heidke 5. Alameda Brown Ware and San Francisco Moun- tain Gray Ware Technology and Economics, James M. Heidke, Susan C. Leary, Sarah A. Herr, and Mark D. Elson 6. Ceramic Economy and Cultural Identity in the Sunset Crater Landscape, Sarah A. Herr and Scott Van Keuren http://www.archaeologysouthwest.org/store/anthropological-papers/sunset-crater-archaeology-the- history-of-a-volcanic-landscape-ceramic-technology-distribution-and-use.html
Transcript of Alameda Brown Ware and San Francisco Mountain Gray Ware Technology and Economics

Citation:
Heidke, James M., Susan C. Leary, Sarah A. Herr, and Mark D. Elson 2007 Alameda Brown Ware and San Francisco Mountain Gray Ware Technology and Econom-
ics. In Sunset Crater Archaeology: The History of a Volcanic Landscape. Ceramic Tech-nology, Distribution, and Use, edited by S. Van Keuren, M. D. Elson, and S. A. Herr, pp.145-183. Anthropological Papers No. 32. Center for Desert Archaeology, Tucson.
Anthropological Papers No. 32:
Sunset Crater Archaeology:
The History of a Volcanic Landscape
Anthropological Papers No. 32
Center for Desert Archaeology
Edited by
Scott Van Keuren
Mark D. Elson
Sarah A. Herr
Contributions by
Mark D. ElsonJames M. HeidkeSarah A. HerrSusan LearyElizabeth J. MiksaDanielle Montague-JuddScott Van Keuren
Ceramic Technology, Distribution, and Use
TRACS No. 089 CN 434 H2022 02DContract No. 97-41
TABLE OF CONTENTS
1. Overview of the Ceramic Analyses, Scott VanKeuren and Sarah A. Herr
2. Overview of Ceramic Wares and Types, SarahA. Herr and Elizabeth J. Miksa
3. The Function of U.S. 89 Project Ceramics, ScottVan Keuren
4. Petrographic Analysis of Tempering Materials,Elizabeth J. Miksa, Danielle Montague-Judd, andJames M. Heidke
5. Alameda Brown Ware and San Francisco Moun-tain Gray Ware Technology and Economics,James M. Heidke, Susan C. Leary, Sarah A. Herr,and Mark D. Elson
6. Ceramic Economy and Cultural Identity in theSunset Crater Landscape, Sarah A. Herr andScott Van Keuren
http://www.archaeologysouthwest.org/store/anthropological-papers/sunset-crater-archaeology-the-history-of-a-volcanic-landscape-ceramic-technology-distribution-and-use.html

The U.S. 89 Archaeological Project area crossesthrough the traditionally defined frontier betweenthe Sinagua (to the south) and the Cohonina (to thewest and northwest) culture areas (Anderson 1990;Colton 1946; Downum 1988), while the KayentaAnasazi (or Ancestral Pueblo) culture area liesslightly east of the project area. Distinctions amongthese three groups have traditionally been basedlargely on the presence or absence of distinctivedecorated and plain ceramic wares, first noted byColton (1932b:13-16) more than 70 years ago. How-ever, those distinctions raise a number of importantquestions (Elson, ed. 1997:22). Do the ceramic dif-ferences express cultural or ethnic distinctions? Arethey the result of trade? Do they reflect local pro-duction and use of different resources by the same,or related, groups of people?
This chapter provides information that bears di-rectly on the latter two questions. Because these is-sues are relevant at a regional scale, published in-formation from previously excavated sites locatedthroughout the traditionally defined Sinagua andCohonina culture areas are also referenced, as arethe ceramic and petrographic data gathered duringthe U.S. 89 Archaeological Project.
The chapter is organized into 10 sections. Variousaspects of ceramic production, including materialspreparation, vessel forming, and firing are discussedin the first five sections. The next four sections presentaspects of pottery economics, and current findingsare discussed in the final section. More specifically,the first section summarizes ethnographic data re-garding the distance potters travel to collect clay. Theresults of a sherd and clay oxidation study are re-ported in the second section. The third section pre-sents the results of an inductively coupled plasma-mass spectrometry (ICP-MS) analysis of AlamedaBrown Ware and San Francisco Mountain Gray Ware,and the fourth section discusses the relationship be-tween clay composition and firing conditions. Theresults of an x-ray analysis of vessel forming and
CHAPTER 5
ALAMEDA BROWN WARE AND SAN FRANCISCO MOUNTAIN
GRAY WARE TECHNOLOGY AND ECONOMICS
James M. Heidke, Desert Archaeology, Inc.Susan C. Leary, Shapiro & Associates, Inc.
Sarah A. Herr, Desert Archaeology, Inc.Mark D. Elson, Desert Archaeology, Inc.
finishing techniques are summarized in the fifth sec-tion, while direct evidence for ceramic production re-covered from project area sites is presented in thesixth section. The seventh section summarizes indi-rect, provenance evidence of Alameda Brown Wareand San Francisco Mountain Gray Ware productionfrom temper and typological studies. The eighth sec-tion delves further into Alameda Brown Ware pro-duction and distribution issues, and the ninth sec-tion addresses aspects of San Francisco MountainGray Ware consumption. Finally, as mentionedabove, the project research questions are addressedin the final section in light of the chapter’s findings.1
MATERIALS PREPARATION, VESSELFORMING, AND FIRING
An Ethnographic Perspective RegardingDistance to Clay Resources
The manufacture of pottery begins with the col-lection of raw materials, primarily water, clay, tem-per (if added), and fuel (Rye 1981:29). The temperattribute was discussed extensively in Chapter 4 (thisvolume). Clay was also discussed briefly in Chapter4, although it is addressed more fully here and be-low. Seventy-three distance-to-clay resource mea-surements are reported in Table 5.1. Sixty-four arenew and were not mentioned in Arnold’s (1985:
1As part of her M.A. research, Susan Leary (then SusanRoberts) conducted the oxidation of some of the sherd andclay samples, inductively coupled plasma-mass spectrom-etry analysis, and x-ray analysis of vessel forming andfinishing techniques (see Roberts 2001); those sections hereare adapted from her work. Sarah Herr conducted the oxi-dation of the remaining sherd and clay samples and a pre-liminary analysis of the U.S. 89 project oxidation data.James Heidke wrote the remaining sections and revisedthe sections mentioned previously. Mark Elson assistedwith questions regarding Flagstaff archaeology.

146 Chapter 5
Ta
ble
5.1
. N
ew (n
= 6
4) a
nd
rev
ised
(n
= 9
) d
ista
nce
-to
-cla
y r
eso
urc
e m
easu
rem
ents
.
Co
un
try
C
om
mu
nit
y/
Gro
up
D
ista
nce
to
Cla
y
So
urc
e (k
m)
Tra
nsp
ort
Ty
pe
Tem
per
Ty
pe
Ref
eren
ce
Ty
pea
Bo
liv
ia
Co
lcap
irh
ua
2.0-
14.0
T
ruck
S
elf-
tem
per
ed
Sil
lar
2000
b:2
7, T
able
4.5
T
Bo
liv
ia
Hu
aycu
li
1.0-
2.5
Un
spec
ifie
d
Sel
f-te
mp
ered
S
illa
r 20
00b
:Tab
le 4
.5
T
Bo
liv
ia
Par
acay
1.
0-3.
0 U
nsp
ecif
ied
S
elf-
tem
per
ed
Sil
lar
2000
b:T
able
4.5
T
Bo
liv
ia
Pu
mp
uri
2.
0-3.
0 T
ruck
S
elf-
tem
per
ed
Sil
lar
2000
b:2
8, T
able
4.5
T
Bo
liv
ia
Su
rum
i R
anch
o
5.0
Un
spec
ifie
d
Un
spec
ifie
d
Sil
lar
2000
b:T
able
4.5
T
Bo
liv
ia
To
tora
ni
3.0
Un
spec
ifie
d
Un
spec
ifie
d
Sil
lar
2000
b:T
able
4.5
T
Cam
ero
on
B
afia
0.
2-1.
2 U
nsp
ecif
ied
S
elf-
tem
per
ed
Go
ssel
ain
199
2:56
4 T
Cam
ero
on
F
aro
3.
0 U
nsp
ecif
ied
M
ult
iple
ty
pes
S
mit
h 2
000:
23
T
Co
lom
bia
L
a C
ham
ba
<1.
0 M
ult
iple
ty
pes
S
elf-
tem
per
ed
Du
nca
n 2
000:
181-
183,
Ma
p 3
.1; K
ruck
man
an
d
Mil
lig
an 1
978:
55
MT
Eth
iop
ia
Gu
yla
<
1.0-
6.0
Mu
ltip
le t
yp
es
Vo
lcan
ic a
sh
Art
hu
r 20
06:3
1 T
Eth
iop
ia
Zu
za
1.0-
6.0
Mu
ltip
le t
yp
es
Sh
erd
A
rth
ur
2006
:31
T
Gh
ana
Ag
om
eda
1.0
Fo
ot
Gn
eiss
Q
uar
coo
an
d J
oh
nso
n 1
968:
50, 5
5 M
T
Gh
ana
Do
do
wa
<1.
0 F
oo
t G
nei
ss
Qu
arco
o a
nd
Jo
hn
son
196
8:50
, 55
MT
Gh
ana
Do
ryu
mu
2.
3 F
oo
t G
nei
ss
Qu
arco
o a
nd
Jo
hn
son
196
8:50
, 55
MT
Gh
ana
Ko
dia
be
<1.
0 F
oo
t G
nei
ss
Qu
arco
o a
nd
Jo
hn
son
196
8:50
, 55
MT
Gh
ana
Kro
bo
16
.0
Un
spec
ifie
d
Sel
f-te
mp
ered
G
yam
fi 1
980:
104
T
Gu
atem
ala
Gu
azac
apan
8.
0 U
nsp
ecif
ied
U
nsp
ecif
ied
F
eld
man
198
5:65
T
Ho
nd
ura
s E
l P
orv
enir
<
1.0
Un
spec
ifie
d
San
d
Mo
uat
an
d A
rno
ld 1
988:
248
T
Ind
ia
Bam
un
mar
a 3.
2 C
art
San
d
Fo
ster
195
6:39
5 T
Ind
ia
Dan
gw
ara
1.0
Do
nk
ey
Sel
f-te
mp
ered
M
ille
r 19
85:2
10
T
Ind
ia
Jod
hp
ur
24.0
-40.
0 U
nsp
ecif
ied
U
nsp
ecif
ied
K
ram
er 1
991:
230
T
Ind
ia
Kam
alap
ur
3.0
Do
nk
ey
Ash
an
d s
and
S
ino
po
li a
nd
Blu
rto
n 1
986:
443
T
Ind
ia
Ud
aip
ur
3.0-
10.0
U
nsp
ecif
ied
U
nsp
ecif
ied
K
ram
er 1
991:
230
T
Ind
on
esia
H
aru
ku
12
.0
Un
spec
ifie
d
Un
spec
ifie
d
Sp
rig
gs
and
Mil
ler
1979
:Tab
le 1
T
Ind
on
esia
O
ma
<1.
0 U
nsp
ecif
ied
U
nsp
ecif
ied
S
pri
gg
s an
d M
ille
r 19
79:T
able
1
T
Ivo
ry C
oas
t M
on
go
ro
1.6
Un
spec
ifie
d
Un
spec
ifie
d
Lig
htb
od
y 1
987:
18
T
Ken
ya
Lu
o
0.2-
2.0
Un
spec
ifie
d
Mu
ltip
le t
yp
es
Die
tler
an
d H
erb
ich
198
9:15
0, F
igu
re 1
M
T
Mal
i K
ang
aba
1.6-
3.2
Fo
ot
Sh
erd
F
ran
k 1
998:
81
T
Mex
ico
b
Aca
tlán
<
1.0-
5.0
Mu
ltip
le t
yp
es
Cla
y m
ixtu
re
Fo
ster
196
0:20
8; L
ack
ey 1
982:
50, M
ap 3
M
T

Alameda Brown Ware and San Francisco Mountain Gray Ware Technology and Economics 147
Ta
ble
5.1
. C
on
tin
ued
. C
ou
ntr
y
Co
mm
un
ity
/G
rou
p
Dis
tan
ce t
o C
lay
S
ou
rce
(km
) T
ran
spo
rt T
yp
e T
emp
er T
yp
e R
efer
ence
T
yp
ea
Mex
ico
A
gu
acat
enan
go
0.
2-2.
0 U
nsp
ecif
ied
S
and
D
eal
1998
:Tab
le 3
.7
T
Mex
ico
A
mat
enan
go
<
1.0
Un
spec
ifie
d
Mu
ltip
le t
yp
es
Dea
l 19
98:T
able
3.1
6 T
Mex
ico
Atz
om
pa
4.8-
11.3
Do
nk
eyC
lay
mix
ture
H
end
ry 1
957:
138-
139
T
Mex
ico
B
asca
scal
tep
ec
0.8
Fo
ot
Tu
ff
Arn
old
199
1:T
able
4
T
Mex
ico
Ch
anal
0.2-
5.0
Un
spec
ifie
dC
alci
te
Dea
l 19
98:T
able
s 3.
7, 3
.16
T
Mex
ico
C
hu
nia
pan
de
Ab
ajo
2.
0-4.
0 F
oo
t T
uff
A
rno
ld 1
991:
Tab
le 4
T
Mex
ico
Co
yo
tep
ec2.
0U
nsp
ecif
ied
Sel
f-te
mp
ered
V
an d
e V
eld
e an
d V
an d
e V
eld
e 19
39:2
2 T
Mex
ico
S
an I
sid
ro
0.5-
0.6
Fo
ot
San
d a
nd
sh
ell
Arn
old
199
1:T
able
4
T
Mex
ico
S
ehu
alac
a 1.
5-2.
5 F
oo
t T
uff
A
rno
ld 1
991:
Tab
le 4
T
Mex
ico
bT
icu
l 4.
0-7.
0 C
art
Un
spec
ifie
d
Hu
rd 1
976:
8; T
ho
mp
son
195
8:66
T
Mex
ico
Tla
cota
lpan
1.0
Un
spec
ifie
dS
and
Sta
rk 1
984:
8T
Mo
rocc
ob
Tao
uri
rt3.
0U
nsp
ecif
ied
S
and
Bec
ket
t 19
58:1
87T
Nig
eria
bA
beo
ku
ta11
.3“C
arri
ers”
Mu
ltip
leW
ahlm
an 1
972:
340
T
Nig
eria
bM
oro
4.8
Fo
ot
Sel
f-te
mp
ered
W
ahlm
an 1
972:
317-
318
T
Nig
eria
bO
yo
6.4
“Car
rier
s”
Sel
f-te
mp
ered
W
ahlm
an19
72:3
44T
Per
uA
co1.
0-3.
0U
nsp
ecif
ied
S
and
Hag
stru
m 1
989:
195
T
Per
uA
ray
pal
lpa
0.1-
0.3
Un
spec
ifie
d
Sel
f-te
mp
ered
S
illa
r 20
00b
:Tab
le 4
.5
T
Per
uC
har
amo
ray
/U
rub
amb
a1.
5U
nsp
ecif
ied
T
alc
Sil
lar
2000
b:7
6, T
able
4.5
T
Per
uM
ach
aca
2.0
Un
spec
ifie
d
Tal
c S
illa
r 20
00b
:76,
Tab
le 4
.5
T
Per
u
Mu
sho
<
1.0-
3.0
Fo
ot
Cla
y m
ixtu
re
Dru
c an
d G
wy
n 1
998:
714
T
Per
u
Qu
ich
a G
ran
de
2.0
Un
spec
ifie
d
Mic
a-cl
ay
Hag
stru
m 1
989:
158
T
Per
ub
Raq
chi
1.0-
3.0
Un
spec
ifie
d
San
dA
rno
ld 1
985:
Tab
le 2
.1; C
háv
ez 1
992:
57;
Sil
lar
2000
b:7
7, T
able
4.5
T
Per
uS
eq’u
erac
ay2.
0-3.
0U
nsp
ecif
ied
M
ud
sto
ne
Sil
lar
2000
b:1
69, T
able
4.5
T
Per
u
Tar
icá
<1.
0-9.
0 F
oo
t C
lay
mix
ture
D
ruc
and
Gw
yn
199
8:71
1 T
Ph
ilip
pin
esD
alu
pa
<1.
0F
oo
tS
elf-
tem
per
edS
tark
199
3:14
0T
Ph
ilip
pin
es
Dar
o
4.0
Car
t S
and
C
hio
ng
197
4:75
, 77
T
Ph
ilip
pin
esP
arad
ijo
n1.
5-3.
0F
oo
tS
elf-
tem
per
ed
Lo
nd
on
199
1:18
7; N
eup
ert
2000
:253
T
Ph
ilip
pin
es
San
Nic
ola
s 5.
0 C
art
San
d
Lo
ng
acre
et
al. 2
000:
274
T
Sar
din
ia
Ori
stan
o
1.5-
2.0
Car
t C
lay
mix
ture
A
nn
is 1
985:
Fig
ure
3
MT

148 Chapter 5
Ta
ble
5.1
. C
on
tin
ued
. C
ou
ntr
y
Co
mm
un
ity
/G
rou
p
Dis
tan
ce t
o C
lay
S
ou
rce
(km
) T
ran
spo
rt T
yp
e T
emp
er T
yp
e R
efer
ence
T
yp
ea
Sen
egal
D
iola
1.
5-2.
0 U
nsp
ecif
ied
S
her
d
Lin
ares
de
Sap
ir 1
969:
3 T
E
So
uth
Afr
ica
Bax
alak
a 4.
0 C
art
Sh
erd
K
rau
se 1
985:
67
T
So
uth
Afr
ica
Lo
bed
u
1.0-
3.0
Un
spec
ifie
d
Sel
f-te
mp
ered
D
avis
on
an
d H
osf
ord
197
8:29
5 T
So
uth
Afr
ica
Tsw
ana
1.6
Fo
ot
Un
spec
ifie
d
Kra
use
198
5:11
0 T
So
uth
Afr
ica
Ven
da
3.3
Fo
ot
Sel
f-te
mp
ered
K
rau
se 1
985:
91
T
Su
dan
Keb
keb
iya
1.0
Un
spec
ifie
dM
ult
iple
ty
pes
To
ber
t 19
84a:
143
T
Sy
ria
Tel
l A
hm
ar
<1.
0 U
nsp
ecif
ied
S
and
Ja
mis
on
199
9:2
T
Th
aila
nd
B
an N
on
g
<1.
0 F
oo
t S
her
d
So
lhei
m 1
964:
156
T
Tu
nis
iaG
uel
lala
2.0
Wag
on
Sel
f-te
mp
ered
Joh
nst
on
198
4:86
T
Un
ited
Sta
tes
(CA
) P
rad
o
0.5-
1.1
Un
spec
ifie
d
Sel
f-te
mp
ered
B
isch
off
an
d S
tern
er 2
004:
Fig
ure
6; O
’Mac
k
2004
:184
M
T
Un
ited
Sta
tes
(SW
) N
avaj
o
0.8
Un
spec
ifie
d
Sh
erd
T
sch
op
ik 1
968:
17
T
Un
ited
Sta
tes
(SW
)bS
an I
ldef
on
so
0.4-
2.4
Fo
ot
Tu
ff
Gu
the
1925
:19;
Har
rin
gto
n 1
916:
308,
M
ap 1
9; S
hep
ard
193
6:45
0 M
T
Un
ited
Sta
tes
(SW
)bS
anta
Cla
ra
1.6-
6.9
Mu
ltip
le t
yp
es
Tu
ff
Har
rin
gto
n 1
916:
127-
128;
LeF
ree
1975
:7; S
hep
ard
19
36:4
50
T
Un
ited
Sta
tes
(SW
) Y
um
an
<1.
0 F
oo
t S
and
S
pie
r 19
33:1
06
T
Un
ited
Sta
tes
(SW
) Z
ia
1.0
Un
spec
ifie
dB
asal
tS
hep
ard
193
6:45
0T
aT
his
co
lum
n r
efer
s to
th
e ty
pe
of
info
rmat
ion
so
urc
e u
sed
to
ob
tain
th
e d
ista
nce
-to
-cla
y r
eso
urc
e m
easu
rem
ent.
T =
A d
ista
nce
men
tio
ned
in t
he
tex
t; M
= A
dis
tan
ce t
o a
so
urc
e m
easu
red
fro
m a
map
wh
en p
lace
nam
es o
r sy
mb
ols
wer
e p
rov
ided
; E =
An
est
ima
te b
ased
on
in
form
atio
n p
rov
ided
in
th
e te
xt.
bR
evis
ed e
ntr
y p
rev
iou
sly
in
clu
ded
in
Arn
old
’s (
1985
:Tab
le 2
.1)
stu
dy
.

Alameda Brown Ware and San Francisco Mountain Gray Ware Technology and Economics 149
Table 2.1) pioneering study of this issue; ninepresent additional data for ethnographic cases in-cluded in his study. Unlike Arnold, the means usedto transport the clay and the type of temper are re-ported here whenever that information was avail-able, because those facts should allow more accu-rate analogies to be drawn from the data.
Summary statistics and specific subsets of thosemeasurements for the distance-to-clay resourcemeasurements are provided in Table 5.2. Both shortand long distance measurements are reported, be-cause some authors report a range of distances trav-eled to collect clay(s). It is for this reason that the105 distances reported in Arnold (1985:Table 2.1)are shown as 90 cases in Table 5.2.
Examination of Table 5.2 and Figure 5.1 revealsa number of interesting findings. First, the batchesof distance measurements compiled by Arnold andHeidke are nearly identical (see Figure 5.1a). Sec-ond, although the range of distances that Old andNew World potters travel to collect clay is similar,there is a slight tendency for Old World potters totravel farther. Third, availability of a draught ani-mal or wheeled conveyance has a marked effect onthe distance traveled to collect clay (see Figure5.1b). Potters with access to a truck, donkey, cart,or wagon often travel much farther to collect claythan potters who travel by foot to the resource.With few exceptions, potters who travel by foot tocollect clay exploit resources within 3.3 km of theirhome. Fourth, there is no clear relationship betweenthe distance potters travel to collect clay and theuse, or type, of temper. Potters who utilize clayscontaining a natural nonplastic component andthose who mix clay and sand generally travel nomore than 5.0 km to collect their clay (see Figure5.1c). Finally, among New World potters includedin the study, those living in the SouthwesternUnited States are known to travel up to 6.9 km tocollect clay (see Figure 5.1d), although the mediandistance traveled is 1.0 km.
The behavior of the prehistoric potters who livedin the U.S. 89 project area is probably best representedby modern potters who travel by foot to collect a self-tempered clay or a clay that will be mixed with sandtemper. Five of the cases in Table 5.2 match thoseconditions: Moro potters in Nigeria, Dalupa andParadijon potters in the Philippines, Venda pottersin South Africa, and Yuma potters in the Southwest-ern United States. These potters utilize clay resourceslocated up to 4.8 km from their homes, a distanceused here to define a local catchment area. Note,however, that within that area, preferences for claysources may be based on technical factors (for ex-ample, workability) as well as sociopolitical consid-erations (Neupert 2000; Stark et al. 2000:307).
Oxidation of Sherd and Clay Samples
Refiring, or ceramic oxidation, is an inexpensiveway to assess various relationships between rawmaterials and prehistoric pottery (Bubemyre andMills 1993:236; Windes 1977:290). Pottery samplesare fired in an oxidizing atmosphere for a longer timeand at a higher temperature than thought to havebeen attained prehistorically. After oxidation, com-parisons can be made between the resulting colorsof pottery and raw materials because the firing con-dition of all samples is standardized. Results of theU.S. 89 project oxidation study were used to addresstwo main questions. First, are ware differences re-flected in the oxidized color of their pastes? Second,are the colors of oxidized raw materials similar to,or different from, oxidized ceramic samples?
Methods and Samples
Herr oxidized the sherd, raw clay, and archi-tectural clay samples collected from and for the U.S.89 project. She used a Paragon DTC 600 electric fur-nace. Roberts (2001:58-97, 199-206, 210-212) oxi-dized the sherd samples recovered from the Mu-seum of Northern Arizona’s (MNA) field schoolsin the Sitgreaves Mountain area and other raw mate-rials. She used a Cress electric furnace, Model C-1006, Series 7604, located at Northern Arizona Uni-versity (NAU). All samples were fired to 950°C andheld at that temperature for 30 minutes. The Mun-sell color of all oxidized samples was recorded byRoberts under illumination from an Osram halo-gen photo-optic lamp.
Munsell colors were grouped into broader cat-egories to facilitate comparisons, following a classi-fication scheme begun by Windes (1977:Table 10.5),with additions by Mills (1987:Table 12.1), Bubemyreand Mills (1993:Table 64), and Mills et al. (1999:Table9.3). Color groups, presented in Table 5.3, includebuff (groups 1, 2, and 3), reddish-yellow (groups 4and 5), and red (groups 6 and 7). In previous analy-ses, color groups 4 and 5 have been classed as yel-lowish-red; however, the Munsell color name formost combinations of hue, color, and chroma in colorgroups 4 and 5 is reddish-yellow. Therefore, thatterm is used here.
In all, 453 sherds were oxidized and recorded:170 Alameda Brown Ware, 137 San Francisco Moun-tain Gray Ware, and 146 Tusayan White Ware (Table5.4; see also Appendix F). Whenever possible, sherdsfrom 10 different vessels of each ware were selectedfrom each excavated site. A total of 18 clay samplescollected by petrologist Elizabeth Miksa and 47 claysamples collected by Roberts were also oxidized andrecorded (Figure 5.2). Finally, nine architectural clay

150 Chapter 5
Ta
ble
5.2
. S
um
mar
y d
ista
nce
-to
-cla
y r
eso
urc
e m
easu
rem
ents
fro
m A
rno
ld (
1985
) an
d o
ther
eth
no
gra
ph
ic s
ou
rces
.
Dat
a S
et
Su
mm
ary
Sta
tist
ics
All
Cas
es
Cas
es
Co
mp
iled
by
A
rno
ld (
1985
)
Cas
es
Co
mp
iled
b
y H
eid
ke
Old
Wo
rld
C
ases
N
ew W
orl
d
Cas
es
Cas
es W
her
e C
lay
was
T
ran
spo
rted
b
y F
oo
t
Cas
es W
her
e
Cla
y w
as
San
d-t
emp
ered
Cas
es W
her
e C
lay
was
S
elf-
tem
per
ed
So
uth
wes
tern
U
.S. C
ases
Sh
ort
dis
tan
ce m
easu
rem
ents
m)
(k
Nu
mb
er o
f ca
ses
154
90
64
85
69
19
11
18
5
Min
imu
m
ts
m)
0.01
00.
010
0.10
00.
010
0.01
00.
400
0.20
00.
100
0.40
0
Max
imu
m30
.000
30.0
0024
.000
25.0
0030
.000
4.83
05.
000
16.0
001.
600
Med
ian
1.60
02.
000
1.25
02.
000
1.00
01.
000
1.00
01.
250
1.00
0
Mea
n3.
377
4.01
72.
477
3.98
22.
631
1.49
31.
947
2.60
40.
960
Sta
nd
ard
dev
iati
on
5.17
65.
919
3.76
25.
557
4.59
31.
055
1.57
23.
713
0.43
4
Lo
ng
dis
tan
ce m
easu
rem
en(k
Nu
mb
er o
f ca
ses
154
90
64
85
69
19
11
18
5
Min
imu
m0.
010
0.01
00.
300
0.01
00.
010
0.60
01.
000
0.30
00.
800
Max
imu
m50
.00
50.0
0040
.000
40.0
0050
.000
9.00
05.
000
16.0
006.
900
Med
ian
2.00
02.
000
2.15
02.
000
2.00
02.
300
3.00
02.
750
1.00
0
Mea
n4.
406
4.79
63.
858
4.55
54.
222
2.45
12.
475
3.81
92.
420
Sta
nd
ard
dev
iati
on
6.74
47.
432
5.64
76.
401
7.18
72.
006
1.37
94.
348
2.58
5

Alameda Brown Ware and San Francisco Mountain Gray Ware Technology and Economics 151
samples collected from U.S. 89 project area sites wereoxidized and recorded.
Ceramics
Examination of Table 5.5 indicates ware differ-ences are strongly reflected in the oxidized paste col-ors. Ninety-three percent of the Alameda BrownWare sherds oxidized to a red color; the remainderrefired reddish-yellow. Eighty-five percent of the SanFrancisco Mountain Gray Ware sherds oxidized toa reddish-yellow color; the remainder refired red.Finally, 95.9 percent of the Tusayan White Ware
sherds oxidized to a buff color; the remaining 4 per-cent refired to color groups 4, 5, and 6 (reddish-yel-low and red). A statistical test of the relationshipbetween ceramic ware and color group confirms thesignificance of this pattern. The null hypothesis (H0)for this test states that the distribution of oxidizedcolors among the three wares is the same; the alter-nate hypothesis (H1) states there is a difference incolor. Utilizing a significance level of 0.05, a chi-square test of the relationship between color groupand ware indicates there is a significant difference(�2 = 701.542; df = 4; p = 0.000). Therefore, it can besaid that the potters who produced Alameda Brown
Figure 5.1. Box-and-whiskers plots comparing: (a) distance measurements compiled by Arnold and Heidke; (b) methodof transportation and distance traveled to collect clay; (c) the relationship between tempering technology and distancetraveled to collect clay; and (d) the distance New World potters living in different countries travel to collect clay. (Thevertical, dashed line shown in each figure represents the median distance traveled by all potters, 2.0 km. All distances aredrawn from the long-distance measurements reported in Tables 5.1 and 5.2.)
Heidke
Arnold
0 40 50 602010 30
Distance (km)
Co
mp
iler
Cart/Wagon
Foot
Donkey
Truck
151050
Tra
nsp
ort
Typ
e
Distance (km)
U.S. (SW)
U.S. (CA)
U.S. (AK)
Peru
Mexico
Honduras
Guatemala
Ecuador
Columbia
Bolivia
Barbados
Distance (km)
40 50 60100 3020
Co
un
try
Te
mp
er
Typ
e
Self-tempered
Sand
0 15105 20
Distance (km)
a
dc
b

152 Chapter 5
Ware, San Francisco Mountain Gray Ware, andTusayan White Ware used primarily clay sourcesthat oxidize to distinctly different colors.
An examination of the entire ceramic sample af-ter refiring showed no systematic relationship be-tween the types in each ware and the final color
group. That is, most of the Alameda Brown Wareoxidized to a red color regardless of type, most ofthe San Francisco Mountain Gray Ware oxidized toa reddish-yellow color regardless of type, and soon. The Alameda Brown Ware and San FranciscoMountain Gray Ware sherds were also examinedfor potential patterning by site location. The Co-conino Divide (Colton 1932b:15, 1968:10) has beenidentified as the place in the U.S. 89 project areawhere the proportion of a site’s utilitarian potterychanges from Alameda Brown Ware dominant to SanFrancisco Mountain Gray Ware dominant (Chapter1, this volume).
The significance of the Coconino Divide as a ce-ramic or cultural boundary between the Sinagua(Alameda Brown Ware) and the Cohonina (San Fran-cisco Mountain Gray Ware) has long been recog-nized (Colton 1932b:15-16, 1946:306; Downum andGumerman 1998:11). When the oxidized color ofAlameda Brown Ware and San Francisco MountainGray Ware ceramics recovered from sites located oneither side of the Coconino Divide were compared,no relationship between site location and oxidizedcolor of a ware was detected. That is, AlamedaBrown Ware vessels were usually made from claysthat oxidize red and San Francisco Mountain GrayWare sherds were usually manufactured from claysthat oxidize reddish-yellow—regardless of wherethey were recovered. Even the less common red-fir-ing San Francisco Mountain Gray Ware sherds andthe reddish-yellow firing Alameda Brown Waresherds do not display any pattern by recovery sitelocation along the project corridor.
Clay Samples
Miksa collected 10 clay samples from locationsin and around the U.S. 89 project area, 3 clay samplesfar to the east of the project area, and 5 clay samplesfar to the west of the project (Table 5.6; see Figure5.2). Seven of the 10 clay samples collected in andaround the project area oxidized to a red color; theother three clay samples fired reddish-yellow. Thetwo clay samples collected from the Sugarloaf Petro-facies (K)—the source area identified for the produc-tion of Rio de Flag Brown, Angell Brown, WinonaBrown, and, presumably, Turkey Hill Red (see Fig-ures 4.5 and 4.6, this volume)—fired red, the samecolor as most Alameda Brown Ware sherds. Sevenof the eight clay samples collected far outside theproject area oxidized to a reddish-yellow color; theremaining clay fired red. The percentage of San Fran-cisco Mountain Gray Ware is usually higher at siteslocated far to the west of the U.S. 89 project area (atopic addressed further below), and all five of theclays Miksa collected far to the west oxidized to areddish-yellow color.
Table 5.3. Color groups used for assignment of oxidized sherd and clay samples.
Color Groupa
Munsell Hue, Color, and Chroma Munsell Color Name(s)
Buff
1 2.5Y (7/0-7/4) Light gray/Pale yellow
2.5Y (8/0-8/4) White/Pale yellow
5Y (7/2) Light gray
5Y (8/0-8/4) White/Pale yellow
10YR (6/6) Brownish-yellow
10YR (7/1-7/8) Light gray/Very pale brown/Yellow
10YR (8/1-8/4) White/Very pale brown
2 7.5YR (7/0-7/4) Light gray/Pinkish-gray/Pink
7.5YR (8/0-8/4) White/Pinkish-white/Pink
10YR (8/6-8/8) Yellow
3 5YR (7/1-7/4) Light gray/Pinkish-gray/ Pink
5YR (8/1-8/4) White/Pinkish-white/Pink
Reddish-yellow
4 7.5YR (5/2-5/8) Brown/Strong brown
7.5YR (6/6-6/8) Reddish-yellow
7.5YR (7/6-7/8) Reddish-yellow
7.5YR (8/6) Reddish-yellow
5 5YR (4/6) Yellowish-red
5YR (5/4-5/8) Reddish-brown/ Yellowish-red
5YR (6/6-6/8) Reddish-yellow
5YR (7/6-7/8) Reddish-yellow
Red
6 2.5YR (4/4-4/8) Reddish-brown/Red
2.5YR (5/4-5/8) Reddish-brown/Red
2.5YR (6/4-6/8) Light reddish-brown/Light red
7 10R (4/4) Weak red
10R (5/3-5/8) Weak red/Red
10R (6/3-6/8) Pale red/Light red
aAfter Windes (1977:Table 10.5), Mills (1987:Table 12.1), Bubemyre and Mills (1993:Table 64), and Mills et al. (1999:Table 9.3).

Alameda Brown Ware and San Francisco Mountain Gray Ware Technology and Economics 153
Roberts (2001) collected an additional 47 claysamples from locations that were far outside of theU.S. 89 project area (Table 5.7). Sixteen of the 23 claysamples she collected from the Williams District, lo-cated approximately 50 km west of the U.S. 89 proj-ect area, oxidized to a reddish-yellow color; the re-maining seven clays from that area fired red.Therefore, about 70 percent of the clays collectedfrom the Williams District oxidized to a reddish-yel-low color—the same color as most San FranciscoMountain Gray Ware. Nineteen of the 24 claysamples Roberts collected from the Tusayan Dis-trict oxidized red, while the remaining five sam-ples fired reddish-yellow. This result suggests thatthe type of clay used to produce San Francisco
Mountain Gray Ware is not common in the TusayanDistrict.
All the clays collected by Miksa and Roberts westof Flagstaff were derived from volcanic parent ma-terials, not the underlying Kaibab Limestone, andcontained volcanic inclusions (including volcanicquartz) (Roberts 2001:81). The presence of volcanicinclusions in the sampled clays suggests those claysare unlikely to have been used for San FranciscoMountain Gray Ware production, unless the vol-canic material was removed by levigation first.
Levigation is a cleaning procedure usually usedwith clays that are relatively coarse, stiff, and leanin their handling characteristics, while sticky, fine-textured clays usually have temper added (Rice
Table 5.4. Oxidized sherd sample reported by site and by ware (see Figure 4.5, this volume, for petrofacies locations).
Site Name/Number Alameda Brown San Francisco Mountain Gray Tusayan White Row Total
Sites in Red Hill Petrofacies (Q)
North End, NA 25,767 – 2 4 6
Plainview, NA 25,766 7 10 10 27
Deadman Flat, NA 25,764 – 11 10 21
Sites in Carr Petrofacies (N)
Deadman’s Edge, NA 420 11 11 10 32
Homestead, NA 181 11 14 9 34
Seven, NA 25,777 6 13 8 27
Roadhouse, NA 25,756 – 4 3 7
Bachelor House, NA 25,769 9 10 7 26
NA 25,770 – 3 – 3
Sites in Sugarloaf Petrofacies (K), located north of the Coconino Divide
Borrow, NA 25,776 2 2 1 5
NA 18,621 4 9 10 23
NA 25,771 1 2 1 4
Snag, NA 18,680 6 9 6 21
Sites in Sugarloaf Petrofacies (K), located south of the Coconino Divide
Divide, NA 21,087 11 – 10 21
Little Elk, NA 25,751 4 2 4 10
Elk, NA 21,104 17 8 12 37
Basalt Ridge, NA 21,089 2 – 3 5
Clay House, NA 21,103 14 12 7 33
Slope, NA 18,417 1 – – 1
NA 25,774 3 – – 3
Lenox Park, NA 20,700 14 – 10 24
Lenox Annex, NA 25,779 6 2 – 8
NA 25,780 6 – 2 8
Ant Hill, NA 19,007 18 10 9 37
Full House, NA 21,091 17 3 10 30
Column total 170 137 146 453

154 Chapter 5
Figure 5.2. Clay sample locations, the geologic units they were recovered from, and their oxidized color. (All claysamples collected from “P” are located within either the Kaibab Limestone or the Toroweap Formation units; no samplesare located within Coconino Sandstone or Hermit Shale units.)
1987:118). Given that San Francisco Mountain GrayWare was tempered, it seems unlikely that Coho-nina potters would have removed naturally occur-
ring, volcanic grains from the clay before addinganother nonplastic temper. Further, Miksa re-viewed the texture and composition of all thin-

Alameda Brown Ware and San Francisco Mountain Gray Ware Technology and Economics 155
sectioned San Francisco Mountain Gray Waresherds from the U.S. 89 and Sitgreaves Mountainproject areas—after being asked if any of their pastesdisplayed evidence of levigation. She found thatgrain sizes run continuously from silt to coarse sand,and that the fine fraction (silt to very fine sand) hasthe same composition as the coarser fraction (fine-to-coarse sand).
Nine architectural clay samples, collected fromU.S. 89 project area sites located in the SugarloafPetrofacies, were also oxidized (Table 5.8). Like theclay samples collected by Miksa from this area, theoxidized color of most (seven of the nine architec-tural clays) is red; the oxidized color of the othertwo is reddish-yellow. Therefore, although the clayresources collected by Miksa—as well as those used
Table 5.6. Oxidized color group of clay samples collected by Miksa (see Chapter 4, this volume).
Color Group
Reddish-yellow Red
Petrofacies Name (Map Symbol) Sample Type
U.S. 89 Sample Number
Roberts (2001) Sample Number 5 6
Samples collected in and around the U.S. 89 project area
Antelope (B) Clay FA-060 AZ-I-7-28 – 1
Antelope (B) Clay FA-062 AZ-I-7-29 – 1
Lenox (E) Clay FA-013 AZ-I-15-39 – 1
Walnut (H) Clay FA-016 AZ-I-14-32 1 –
Walnut (H) Clay FA-004 AZ-I-15-37 – 1
Walnut (H) Clay FA-009 AZ-I-15-38 1 –
Sugarloaf (K) Clay FA-071 AZ-I-10-33 – 1
Sugarloaf (K) Clay FA-104 AZ-I-10-34 – 1
Carr (N) Clay FA-035 AZ-I-10-40 1 –
Red Hill (Q) Clay FA-046 AZ-I-6-41 – 1
Samples collected far outside of the U.S. 89 project area, listed by general compass direction
East Clay FA-064 AZ-I-7-30 – 1
East Clay FA-065 AZ-I-7-31 1 –
East Clay FA-079 AZ-J-14-42 1 –
West Soil FA-082 AZ-I-10-35 1 –
West Soil FA-101 AZ-I-10-36 1 –
West Clay FA-085 AZ-H-12-43 1 –
West Clay FA-088 AZ-H-12-44 1 –
West Clay FA-103 AZ-H-12-45 1 –
Table 5.5. Summary results of oxidization of U.S. 89 project sherds.
Color Group
Buff Reddish-yellow Red
Ware 1 2 4 5 6 Row Total
Alameda Brown Ware – – – 11 159 170
San Francisco Mountain Gray Ware – – 1 115 21 137
Tusayan White Ware 90 50 3 3 – 146
Column total 90 50 4 129 180 453

156 Chapter 5
to plaster the walls and hearths of prehistoric struc-tures—may not be the same as those exploited bypotters2, most clay samples from the Sugarloaf Petro-facies oxidize to the same color (red) as most of theoxidized Alameda Brown Ware ceramics collectedfrom project sites. This further supports the conten-tion that Rio de Flag Brown, Angell Brown, WinonaBrown, and Turkey Hill Red production was con-centrated in this area.
Previous Refiring Studies
Four ceramic oxidization studies of AlamedaBrown Ware and/or San Francisco Mountain GrayWare have been previously conducted. As notedabove, Roberts (2001) oxidized a sample of San Fran-cisco Mountain Gray Ware collected from sites lo-cated in the Sitgreaves Mountain area. Samples (1989)also oxidized a number of San Francisco MountainGray Ware sherds collected from sites located in the
Sitgreaves Mountain area. Fairley et al. (1994) oxi-dized a sample of San Francisco Mountain Gray Warecollected from sites located during the Grand Can-yon River Corridor Survey. Finally, Bubemyre andMills (1993) oxidized a sample of Alameda BrownWare and San Francisco Mountain Gray Ware col-lected from sites located along the Transwestern Pipe-line Expansion project; they analyzed separatesamples of San Francisco Mountain Gray Waresherds from Sinagua and Patayan region sites.
The maximum temperature and soaking periodused to oxidize each of the sets of sherds mentionedabove are summarized in Table 5.9, as is the type of
2Hopi potters who examined the clay source exposed atthe Clay House site, NA 21,103, noted that it could be usedfor pottery making (if it was filtered or sieved before use)or architectural plaster (if sand was added to it). They alsonoted that the clay would be good for “mud fighting,” aritual associated with Hopi weddings (Ferguson andLoma’omvaya 2008).
Table 5.7. Clay and sand samples collected by Roberts (2001). (The oxidized color group of clay samples is reported [after Roberts 2001:75-90].)
Color Group
Reddish-yellow Red
Material Type and Sample Location 4 5 6 Row Total
Williams District clay samples
Duck Lake – 5 – 5
Raymond Lake – 3 – 3
Moritz Lake – 3 – 3
Smoot Lake – – 3 3
Fay Lake – 2 1 3
Allen Lake – – 3 3
Frenchie Hill – 1 – 1
Bald Mountain – 1 – 1
Spring Depression 1 – – 1
Tusayan District clay samples
Red Butte SW – 3 – 3
Red Butte – 1 3 4
Harrison Tank – – 3 3
Peterson Flat – – 1 1
Grandview Point – 1 6 7
Upper Basin – – 3 3
Coconino Rim – – 2 2
Tusayan East – – 1 1
Sand samples
Sitgreaves Mountain N/A N/A N/A 3
Ash Fork N/A N/A N/A 3
Grand Canyon N/A N/A N/A 3
Elden Mountain N/A N/A N/A 1

Alameda Brown Ware and San Francisco Mountain Gray Ware Technology and Economics 157
light source used when the Munsell hue, color, andchroma of each sample was recorded. Examinationof Table 5.9 shows that each researcher used eithera different temperature, soaking period, or lightsource. Generally then, the results of one studyshould not be compared with those of another be-cause it is difficult to discern variability reflectingdifferences in the clays from variability caused bythe different methods. However, the relationships,if any, between both maximum temperature andoxidized color group and length of soaking periodand oxidized color group can be explored when theresults of the different studies are compared.
Comparison of Current and Previous Research
The percentage of oxidized Alameda BrownWare sherds from the U.S. 89 and Transwestern Pipe-line Expansion projects, in each color group, is re-ported in Table 5.10. The modal color group of thesherds from each project differs; however, as notedabove, they were recorded under different condi-tions (for example, a different light source was usedin each study). The percentage of oxidized San Fran-cisco Mountain Gray Ware sherds from all six proj-ect areas, in each color group, is shown in Table 5.11.The modal color group of sherds from three of the
project areas (Patayan and Sinagua regions of theTranswestern Pipeline Expansion project and U.S.89) is reddish-yellow; the modal color group ofsherds from the other three project areas (GrandCanyon River Corridor Survey and both SitgreavesMountain samples) is red. Examination of the datareported in Table 5.11 allows the possibility thathigher maximum temperatures and/or longer soak-ing times lead to greater development of red colors,because the two studies that used higher tempera-tures and longer times (i.e., Fairley et al. 1994;Samples 1989) have much higher percentages of SanFrancisco Mountain Gray Ware that oxidized red,when compared with the other studies. This trendis also seen when only the two Sitgreaves Mountainsamples are compared. This finding may also indi-cate San Francisco Mountain Gray Ware are not fullyoxidized at temperatures of 950°C and soak timesof 30 minutes.
Two chi-square tests were conducted with thedata reported in Tables 5.10 and 5.11. The first testedthe significance of the relationship between ceramicware and color group using all the data collected byRoberts from U.S. 89 and Sitgreaves Mountain sherds.The second tested the significance of the relationshipbetween ceramic ware and color group using all thedata collected by Bubemyre and Mills (1993) from
Table 5.9. Conditions under which sherds and clays were oxidized and recorded.
Data Set Maximum Temperature
Soaking Period
Light Source Reference
Grand Canyon River Corridor Survey 1000 C 45 minutes Unspecified Fairley et al. 1994:265
Transwestern Pipeline Expansion Project 950 C 30 minutes Tungsten Bubemyre and Mills 1993:236
Sitgreaves Mountain 950-1000 C 60 minutes Unspecified Samples 1989:10
Sitgreaves Mountain 950 C 30 minutes Halogen Roberts 2001
U.S. 89 Archaeological Project 950 C 30 minutes Halogen –
Table 5.8. Oxidized color of architectural clay samples taken from U.S. 89 project sites. (All the sampled sites are located in the Sugarloaf Petrofacies [K] south of the Coconino Divide.)
Color Group
Reddish-yellow Red
Site Name/Number Sample Number Description 5 6
Divide, NA 21,087 H1 Hearth clay 1 –
Clay House, NA 21,103 H8 Hearth clay – 1
Lenox Park, NA 20,700 H3 Clay-lined basin – 1
Lenox Park, NA 20,700 H4 Hearth clay – 1
Lenox Annex, NA 25,779 H9 Hearth clay – 1
Ant Hill, NA 19,007 H2 Hearth clay 1 –
Full House, NA 21,091 H5 Hearth clay – 1
Full House, NA 21,091 H6 Wall adobe – 1
Full House, NA 21,091 H7 Hearth clay – 1

158 Chapter 5
Transwestern Pipeline Expansion project sherds. Thenull hypothesis (H0) for both tests states that the dis-tribution of oxidized colors among the two wares isthe same; the alternate hypothesis (H1) states thatthere is a difference. Utilizing a significance level of0.05, the first chi-square test of the relationship be-tween color group and ware indicates there is a sig-nificant difference (�2 = 136.781; df = 1; p = 0.000).The second chi-square test of the relationship be-tween color group and ware also indicates a signifi-cant difference (�2 = 9.034; df = 1; p = 0.003). Theseresults confirm the previously stated conclusion: thepotters who produced Alameda Brown Ware andSan Francisco Mountain Gray Ware primarily usedclay sources that oxidize to distinctly different col-ors. These results also suggest Alameda Brown Warewill usually oxidize to a redder color than San Fran-cisco Mountain Gray Ware.
Inductively Coupled Plasma-massSpectrometry Analysis of Alameda BrownWare and San Francisco Mountain Gray Ware
Results of the petrographic and clay oxidationstudies indicate temper composition and clay color
covary by ware. A third characterization technique,ICP-MS, was used to assess that variation at the el-emental level. Inductively coupled plasma-massspectrometry is a bulk chemical analysis technique,meaning that both clay and temper contribute to theelemental composition that is recorded in parts permillion (ppm) concentrations. Two methods can beused when preparing pottery samples for ICP-MSanalysis: complete dissolution or acid extraction.
In complete dissolution, a small portion of asherd is reduced to a powder and is completely dis-solved in acid. This study used the complete dissolu-tion technique, partly due to continued uncertaintyregarding the validity of results based on the acidextraction method (Neff et al. 1996). Parts per mil-lion figures for the following elements were calcu-lated: magnesium (Mg), manganese (Mn), iron (Fe),copper (Cu), zinc (Zn), strontium (Sr), zirconium(Zr), antimony (Sb), barium (Ba), lanthanum (La),cerium (Ce), praseodymium (Pr), neodymium (Nd),samarium (Sm), europium (Eu), gadolinium (Gd),terbium (Tb), dysprosium (Dy), holmium (Ho), er-bium (Er), thulium (Tm), ytterbium (Yb), lutetium(Lu), tantalum (Ta), thorium (Th), and uranium (U).Two elements, Sb and Ta, were dropped from theanalysis because a large number of the specimens
Table 5.10. Color groups of oxidized Alameda Brown Ware sherds. (Row percentages are reported.)
Reddish-yellow Red
Data Set 4 5 6 Total (n) Reference
Transwestern Pipeline Expansion Project, Sinagua region
9.18 71.43 19.39 196 Bubemyre and Mills 1993:Table 90
U.S. 89 Archaeological Project – 6.47 93.53 170 –
Column percent and total 4.91 41.25 53.82 366
Table 5.11. Color groups of oxidized San Francisco Mountain Gray Ware sherds. (Row percentages are reported.)
Buff Reddish-yellow Red
Data Set 2 3 4 5 6 7 Total (n) Reference Grand Canyon River Corridor Survey
– – – – 52.69 47.31 93 Fairley et al. 1994: Table III.3 and III.4
Transwestern Pipeline Expansion Project, Patayan region
– – 25.00 70.00 5.00 – 40 Bubemyre and Mills 1993:Table 92
Sitgreaves Mountain – 1.11 – 18.89 80.00 – 90 Samples 1989:Table 4
Sitgreaves Mountain – – – 46.18 53.81 – 249 Roberts 2001:Table 5.2
Transwestern Pipeline Expansion Project, Sinagua region
6.89 – 39.65 46.55 6.89 – 58 Bubemyre and Mills 1993:Table 90
U.S. 89 Archaeological Project
– – 1.37 83.94 15.33 – 137 –
Column percent and total 0.60 0.15 5.10 45.28 42.28 6.60 667

Alameda Brown Ware and San Francisco Mountain Gray Ware Technology and Economics 159
had concentrations below their detection limits. Cuand Zn were also dropped from the analysis becausecontamination may have occurred when a tungsten-carbide drill was used to remove the outer layers ofthe sherd specimens (Hart et al. 1987).
Thirteen Alameda Brown Ware sherds from theU.S. 89 project area, 138 San Francisco MountainGray Ware sherds from the U.S. 89 project area, and100 San Francisco Mountain Gray Ware sherds fromthe Sitgreaves Mountain area were included in thestudy. Roberts (2001:98-130) fully documents themethods used for preparing and analyzing samples,and this source should be consulted for a completetreatment of those topics; the results of her analysisare summarized below.
Following procedures described in Heidke andMiksa (2000), Roberts (2001) used two statisticalmethods to explore and analyze the elemental data:correspondence analysis and discriminant analysis.Correspondence analysis was used as a method ofdata reduction and exploration. Discriminant analy-sis was used to determine if sherd compositiongroups were statistically distinguishable. Correspon-dence analysis greatly reduced the dimensionalityof the data. The first axis accounts for 78.3 percentof the variation in the elemental data, while the sec-ond axis accounts for another 12.9 percent of thevariation (Table 5.12). Together, the first two axesaccount for over 91 percent of the variation in thedata set (cumulative total of inertia explained). Ala-meda Brown Ware was found to have relativelyhigher concentrations of Fe, Mg, Zr, Ba, Sm, U, andLu than either of the San Francisco Mountain GrayWare groups (Table 5.13). The San Francisco Moun-tain Gray Ware recovered from the U.S. 89 projectarea have relatively higher concentrations of Mg, Zr,Lu, and U than the Sitgreaves Mountain area SanFrancisco Mountain Gray Ware, while the SitgreavesMountain area San Francisco Mountain Gray Warehave relatively higher concentrations of Fe, Gd, andSm (see Table 5.13).
Prior to conducting the discriminant analysis,sherds were assigned to one of three groups: Ala-meda Brown Ware, U.S. 89 project San FranciscoMountain Gray Ware, or Sitgreaves area San Fran-cisco Mountain Gray Ware. Roberts (2001) used thejackknifing, or “leaving-one-out,” method whenshe calculated the discriminant functions, and sheused the elements that seemed to best distinguishamong the sherd groups in the correspondenceanalysis: Mg, Fe, Zr, Ba, Sm, U, Lu, and Gd.
The discriminant analysis classified 250 of 251sherds to the correct ware group (Table 5.14), indi-cating Alameda Brown Ware and San FranciscoMountain Gray Ware have very distinct chemicalcompositions (Roberts 2001). While the two SanFrancisco Mountain Gray Ware groups (separated
by geographical location of recovery) contain rela-tively similar compositions, a significance test of therelationship between assigned and predicted groupmembership indicates a significant difference be-tween the two groups (�2 = 67.039; df = 1; p = 0.000).That result suggests multiple San Francisco Moun-tain Gray Ware production locales, with one or moresupplying each area, may have been active prehis-torically. However, if multiple locales produced SanFrancisco Mountain Gray Ware, they need not havebeen located at great distances from one another.For example, two recent instrumental neutron acti-vation analyses of Philippine pottery and clays iden-tified distinct compositional signatures associatedwith raw materials located no more than 2 km apart(Neupert 2000; Stark et al. 2000:323). Finally, differ-ences among the groups may be exaggerated, be-cause discriminant analysis classification functionsare more accurate for particular samples than theyare for whole populations (Klecka 1980:51).
Table 5.12. Correspondence analysis ranked element scores and measures of inertia explained (after Roberts 2001:Table 6.1).
First Axis Second Axis
Magnesium -0.221 Uranium -0.031
Lutetium -0.150 Magnesium -0.018
Uranium -0.114 Iron -0.008
Zirconium -0.094 Thulium 0.022
Strontium -0.078 Zirconium 0.023
Ytterbium -0.064 Dysprosium 0.077
Thorium -0.060 Terbium 0.084
Barium -0.059 Erbium 0.089
Holmium -0.047 Neodymium 0.095
Erbium -0.032 Manganese 0.100
Cerium -0.027 Lanthanum 0.101
Praseodymium -0.021 Cerium 0.104
Lanthanum -0.013 Samarium 0.105
Dysprosium -0.012 Praseodymium 0.112
Manganese -0.010 Gadolinium 0.113
Europium -0.005 Thorium 0.120
Neodymium -0.004 Holmium 0.121
Terbium 0.001 Strontium 0.122
Thulium 0.014 Ytterbium 0.135
Samarium 0.045 Europium 0.147
Gadolinium 0.074 Lutetium 0.158
Iron 0.078 Barium 0.295
Eigenvalue 0.016 0.003
Proportion of inertia explained
78.306 12.930
Cumulative proportion
78.306 91.235

160 Chapter 5
X-ray Analysis of Vessel Forming andFinishing Technique
Vessel forming and finishing techniques are as-pects of the production sequence under direct con-trol of a potter. In fact, forming techniques are oftenconsidered a key indicator of cultural affiliation(Gosselain 2000; Scheans 1966; Stark et al. 1998). Toobjectively determine how Alameda Brown Wareand San Francisco Mountain Gray Ware wereformed (i.e., coil and scrape, paddle and anvil, or acombination of both techniques), Roberts (2001) con-ducted an x-ray analysis of those wares. X-rays pro-vide “a film image of those internal features or partsof an object that differ in their composition, averagespecific gravity, and/or thickness” (Carr 1990:14).Therefore, the clay and temper/void portions of aceramic vessel (or sherd) and thicker/thinner por-tions of a sherd appear as different shades of grayon a radiograph. These images provide clues aboutthe construction technique(s) used to make a givenvessel (Carr 1990).
A lack of locally thinned areas on an x-ray im-age serves as evidence that the potter finished the
vessel by scraping, as does the presence of mul-tiple, long narrow indentations on sherd surfaces(Cooper and Adams 1996:33). The hallmark ofpaddle and anvil thinning is the presence of locallythinned areas of a sherd, which are seen as isolateddark oval, circular, or elongated regions on a radio-graph (Cooper and Adams 1996:31). These dark ar-eas on the x-ray image often correlate with a depres-sion on the interior vessel surface. Both Carr (1990)and Rye (1977) also found that vessels finished by abeating technique, such as paddle and anvil, are lesslikely to exhibit voids between coils than those fin-ished by scraping because the beating process tendsto obliterate coil joints.
Roberts (2001) used a Litton brand instrumentwith a Eureka x-ray tube to take the images; she wasassisted by radiologist Ethan Braunstein, M.D., andx-ray technician Theresa Holmgren. The followingtechnical specifications were finalized after severaltrial runs: 58 Kv, 50 Ma, with an exposure time of0.066 seconds. Roberts (2001) included 2 TusayanWhite Ware, 2 Mesa Verde White Ware, and 2 TsegiOrange Ware sherds as coil and scrape controlsamples, and 5 Gila Plain sherds as paddle and anvil
Table 5.13. Mean parts per million concentrations for certain elements in sherd compositional groups (after Roberts2001:Table 6.2).
San Francisco Mountain Gray Ware
Element Alameda Brown Ware (U.S. 89 Project Area) U.S. 89 Project Area Sitgreaves Area
Magnesium 16,856.63 10,206.14 9,045.98
Iron 50,290.02 26,349.51 31,665.73
Zirconium 263.29 125.49 106.58
Barium 1,250.54 1,124.81 1,138.40
Samarium 7.18 5.55 6.36
Uranium 3.56 1.46 1.26
Lutetium 0.51 0.37 0.24
Gadolinium 9.93 7.75 10.22
Table 5.14. Classification matrix of discriminant analysis results (after Roberts 2001:Table 6.4).
Predicted Group Membership
Alameda Brown Ware San Francisco Mountain Gray Ware
Assigned Group Membership U.S. 89 Project Area U.S. 89 Project Area Sitgreaves Area Row Total
Alameda Brown Ware, U.S. 89 project area
12 1 – 13
San Francisco Mountain Gray Ware, U.S. 89 project area
– 123 15 138
San Francisco Mountain Gray Ware, Sitgreaves area
– 39 61 100
Column total 12 163 76 251

Alameda Brown Ware and San Francisco Mountain Gray Ware Technology and Economics 161
control samples. Roberts (2001:131-174) fully docu-ments the methods she used to prepare and ana-lyze samples, including numerous images of x-rayedvessels (Roberts 2001:Figures 7.2-7.8, 7.10, 7.12-7.13,7.15-7.27). The results of her analysis are summa-rized below.
Roberts’ (2001) pilot study indicates both SanFrancisco Mountain Gray Ware and Alameda BrownWare were produced using a paddle and anvil con-struction technique (possibly preceded by ring-build-ing). X-ray images of both wares appear similar toimages of Gila Plain sherds, a Hohokam type thatwas almost certainly constructed using paddle andanvil methods (Haury 1965:228, 1976:194). X-rayimages of all three wares show dark patches corre-lated with depressions on the interior surfaces ofsherds. The x-ray images of coil and scraped vesselshave a very different appearance. Those sherds havea relatively uniform thickness, do not show darkpatches, and some display linear voids and preferredtemper orientation. Many of the San Francisco Moun-tain Gray Ware and a few of the Alameda BrownWare vessels show evidence that they were scrapedor wiped; this wiping/scraping likely smoothed outimpressions left by the anvil during an earlier stageof forming (Cooper and Adams 1996).
The appearance of the interior surfaces of Ala-meda Brown Ware and San Francisco MountainGray Ware rim sherds recovered from U.S. 89 proj-ect sites are summarized in Table 5.15. Their appear-ance generally supports Roberts’ findings. Examplesof anvil-impressed interior surfaces were docu-mented in both wares, although most sherds dis-played evidence of hand-smoothing, wiping, scrap-ing, or polishing over the anvil-impressed surface.However, San Francisco Mountain Gray Ware pot-ters paid greater attention to finishing. Seventy-threepercent of the San Francisco Mountain Gray Warejars displayed a polished interior surface, as did 90percent of the San Francisco Mountain Gray Warebowls. Alameda Brown Ware potters were appar-ently less concerned with achieving a polished inte-rior surface, especially in jar forms where it would
not be visible. Only 6 percent of the Alameda BrownWare jars displayed a polished interior surface, while50 percent of the Alameda Brown Ware bowls did.Most of the U.S. 89 project Alameda Brown Warejars displayed a scraped, wiped, or anvil-impressedinterior surface.
Clay Composition and Firing Conditions
Temper composition (see Chapter 4) and bulkelemental analyses have shown strong differencesin the raw materials used to manufacture AlamedaBrown Ware and San Francisco Mountain GrayWare. Oxidized clay colors of the two wares—whichreflect clay chemistry—also show statistically signifi-cant differences. All three of these differences arerelated to the resources used to make the pottery.The final, fired appearance of a vessel also reflectsresource availability (amount and form of carbon-aceous material and iron compounds present in aclay), as well as the length, temperature, and atmo-sphere of the firing (Rice 1987:435; Shepard 1949:235,1953:180, 1995:214). Throughout his career, Coltonemphasized the importance of firing atmosphere anddownplayed the importance of clay composition andlength and temperature of firing:
. . . the basic technique can be determined bysimple inspection of the color of the vessel—(a) ifthe pottery is white, gray, or dark gray it was firedin a reducing atmosphere, but (b) if the pottery isbuff, yellow, red, or brown it was fired in an oxi-dizing atmosphere (Colton 1939c:231).
This approach led Colton (1946, 1958) to charac-terize Alameda Brown Ware as having been fired inan oxidizing atmosphere and San Francisco Moun-tain Gray Ware as having been fired in a reducingatmosphere. Matson (1940) recognized a problemwith that approach, because several of the typesColton and Hargrave (1937) list under reducing at-mosphere are said to display carbon streaks in their
Table 5.15. Three-way classification of interior surface appearance, vessel shape, and ceramic ware of rim sherds recovered from U.S. 89 project area sites. (Column percentages reported; indeterminate observations deleted.)
Jar Bowl
Interior Surface Appearance
Alameda Brown Ware (n = 506)
San Francisco Mountain Gray Ware (n = 582)
Alameda Brown Ware (n = 164)
San Francisco Mountain Gray Ware (n = 230)
Polished 6.33 72.85 50.00 89.57
Scraped 57.31 13.92 21.34 1.30
Wiped 21.34 11.17 14.02 7.39
Anvil-impressed 13.44 1.89 11.59 1.74
Hand-smoothed 1.58 0.17 3.05 –
162 Chapter 5
body. The presence of a carbon streak implies sur-faces are lighter than the core, thus indicating par-tial oxidation of the surfaces (Matson 1940:262; Shep-ard 1995:220).
To further confuse the issue, Colton (1958) re-ports that Alameda Brown Ware were frequentlyfired in a reducing atmosphere, while many re-searchers state that up to one-third of their SanFrancisco Mountain Gray Ware sherds are tan tobrownish-orange in color (Cartledge 1979:303;Downum and Gumerman 1998:55; Ferg 1977:120;Goetze and Mills 1993:65; Hays-Gilpin 1998a:22, 24-25; Landis 1993a:281; Marshall 1980:339; Samples1994:26; Wilcox et al. 1996:438, Table 1).
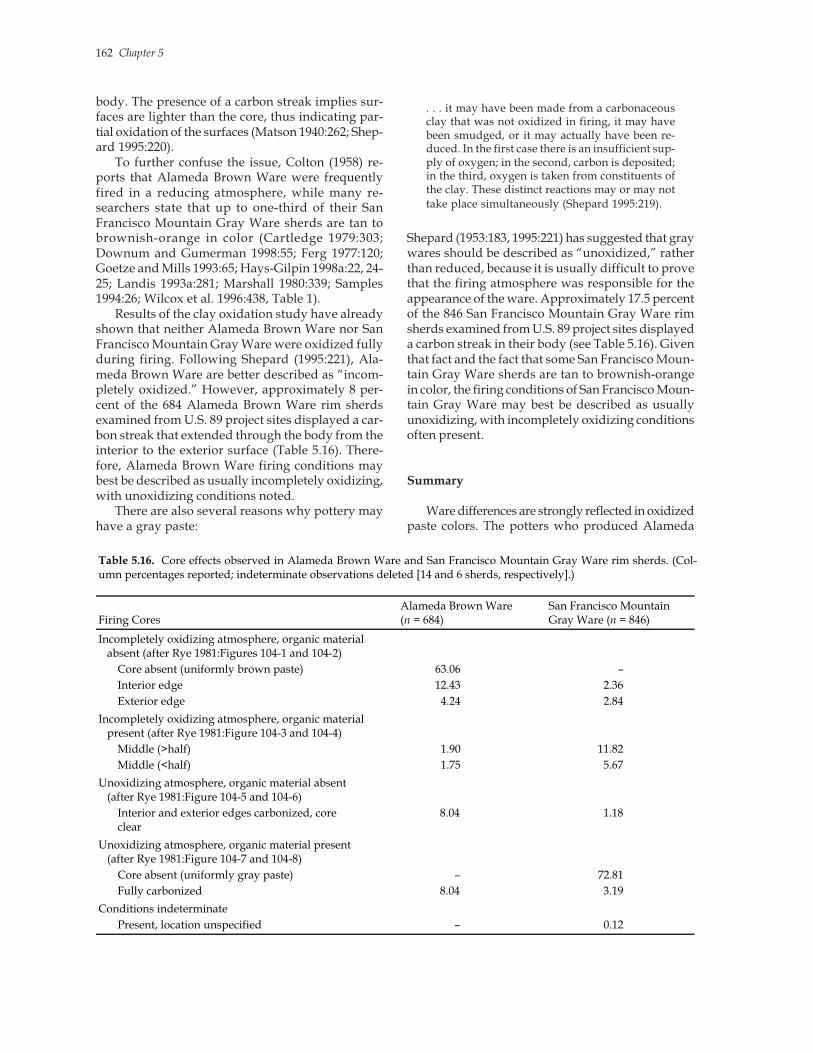
Results of the clay oxidation study have alreadyshown that neither Alameda Brown Ware nor SanFrancisco Mountain Gray Ware were oxidized fullyduring firing. Following Shepard (1995:221), Ala-meda Brown Ware are better described as “incom-pletely oxidized.” However, approximately 8 per-cent of the 684 Alameda Brown Ware rim sherdsexamined from U.S. 89 project sites displayed a car-bon streak that extended through the body from theinterior to the exterior surface (Table 5.16). There-fore, Alameda Brown Ware firing conditions maybest be described as usually incompletely oxidizing,with unoxidizing conditions noted.
There are also several reasons why pottery mayhave a gray paste:
. . . it may have been made from a carbonaceousclay that was not oxidized in firing, it may havebeen smudged, or it may actually have been re-duced. In the first case there is an insufficient sup-ply of oxygen; in the second, carbon is deposited;in the third, oxygen is taken from constituents ofthe clay. These distinct reactions may or may nottake place simultaneously (Shepard 1995:219).
Shepard (1953:183, 1995:221) has suggested that graywares should be described as “unoxidized,” ratherthan reduced, because it is usually difficult to provethat the firing atmosphere was responsible for theappearance of the ware. Approximately 17.5 percentof the 846 San Francisco Mountain Gray Ware rimsherds examined from U.S. 89 project sites displayeda carbon streak in their body (see Table 5.16). Giventhat fact and the fact that some San Francisco Moun-tain Gray Ware sherds are tan to brownish-orangein color, the firing conditions of San Francisco Moun-tain Gray Ware may best be described as usuallyunoxidizing, with incompletely oxidizing conditionsoften present.
Summary
Ware differences are strongly reflected in oxidizedpaste colors. The potters who produced Alameda
Table 5.16. Core effects observed in Alameda Brown Ware and San Francisco Mountain Gray Ware rim sherds. (Col-umn percentages reported; indeterminate observations deleted [14 and 6 sherds, respectively].)
Firing Cores Alameda Brown Ware (n = 684)
San Francisco Mountain Gray Ware (n = 846)
Incompletely oxidizing atmosphere, organic material absent (after Rye 1981:Figures 104-1 and 104-2)
Core absent (uniformly brown paste) 63.06 –
Interior edge 12.43 2.36
Exterior edge 4.24 2.84
Incompletely oxidizing atmosphere, organic material present (after Rye 1981:Figure 104-3 and 104-4)
Middle (>half) 1.90 11.82
Middle (<half) 1.75 5.67
Unoxidizing atmosphere, organic material absent (after Rye 1981:Figure 104-5 and 104-6)
Interior and exterior edges carbonized, core clear
8.04 1.18
Unoxidizing atmosphere, organic material present (after Rye 1981:Figure 104-7 and 104-8)
Core absent (uniformly gray paste) – 72.81
Fully carbonized 8.04 3.19
Conditions indeterminate
Present, location unspecified – 0.12

Alameda Brown Ware and San Francisco Mountain Gray Ware Technology and Economics 163
Brown Ware, San Francisco Mountain Gray Ware,and Tusayan White Ware used clay sources that, forthe most part, oxidize to distinctly different colors(red, reddish-yellow, and buff, respectively). Thisprobably reflects the fact that different groups ofpotters utilized clay resources located close to theirhomes, an assumption strongly supported by eth-nographic studies (see Tables 5.1-5.2). Seven of 10clay samples collected in and around the U.S. 89project area oxidized to a red color; importantly, thetwo clay samples collected from the Sugarloaf Petro-facies (K) fired red. Additionally, seven of nine ar-chitectural clay samples collected from sites locatedin the Sugarloaf Petrofacies oxidized red. Therefore,most clay samples from the Sugarloaf Petrofaciesoxidize to the same color—red—as most of the oxi-dized Alameda Brown Ware ceramics collected fromproject sites. Twenty-one of the 28 clay samples col-lected west of Flagstaff oxidized to a reddish-yel-low color—the same color as most San FranciscoMountain Gray Ware.
In addition to the temper (see Chapter 4) andoxidation studies, complete dissolution ICP-MS wasused to assess compositional variation at the elemen-tal level. Discriminant analysis of the elemental datacorrectly classified 250 of 251 sherds to the correctware group, indicating Alameda Brown Ware andSan Francisco Mountain Gray Ware have very dis-tinct chemical compositions. Given that both thetemper and clay components of the two wares havebeen shown to have distinct compositions and thatICP-MS is a bulk chemical analysis technique, thisfinding is to be expected; however, that result wasnot anticipated when Roberts initiated her research(see especially, Roberts 2001:4).
The results of a pilot study indicate San Fran-cisco Mountain Gray Ware and Alameda BrownWare were both produced using a paddle and anvilconstruction technique; x-ray images of those waresshow dark patches correlated with depressions onthe interior surfaces of sherds. The x-ray images ofcoil and scraped vessels have a very different ap-pearance; those sherds have a relatively uniformthickness, do not show dark patches, and some dis-play linear voids and preferred temper orientation.
Finally, a review of the literature regarding claycomposition and firing conditions, as well as numer-ous archaeological observations that do not fit theexpected pattern, suggests Colton’s straightforwarddichotomy of Alameda Brown Ware (oxidized) andSan Francisco Mountain Gray Ware (reduced) firingregimes is overly simplistic. A consideration of otherfactors indicates Alameda Brown Ware firing condi-tions may best be described as usually incompletelyoxidizing, with unoxidizing conditions noted, whileSan Francisco Mountain Gray Ware firing conditions
may best be described as usually unoxidizing, butincompletely oxidizing conditions often present.
All the characterization data discussed here andin Chapter 4 indicate Alameda Brown Ware and SanFrancisco Mountain Gray Ware were manufacturedfrom very different raw materials. The temper andclay oxidation data are compatible with the asser-tion that the felsic Alameda Brown Ware types wereproduced in the Sugarloaf Petrofacies. Temper dataalso indicate San Francisco Mountain Gray Warecould not have been produced in the project area(see Chapter 4). The potters who manufactured bothof these wares used the same forming and thinningtechnique: paddle and anvil. Incompletely oxidiz-ing and unoxidizing firing conditions are inferredfor both wares. However, a significant amount ofadditional experimental work is required to deter-mine if the final, fired appearance of these wares re-flects the quantity and form of carbonaceous mate-rial and iron compounds present in the clays usedto make them, the length of their firing, the tempera-ture of their firing, and/or their firing atmosphere.
POTTERY ECONOMICS
The study of pottery economics addresses issuesrelated to the production, distribution, consumption,and disposal of pottery (Alden 1982:84; Costin1991:1; Fontana et al. 1962:22; Welch 1991:2). Untilrelatively recently, many Southwestern archaeolo-gists assumed that each household produced its ownceramic containers (Crown 2001:457; Haury 1976:82;Roberts 1935:24). However, beginning in the 1930s,Shepard’s (1936, 1939, 1942, 1954) temper-basedprovenance studies indicated that exchange of pot-tery was common among prehistoric Southwesternpeople, and, as the number of provenance studiesconducted throughout the region has increased, ithas become obvious to many archaeologists thatspecialized production of some ceramic wares, types,or vessel forms occurred in nearly all parts of theSouthwest at one time or another (Glowacki and Neff2002:179; Hagstrum 1995; Heidke et al. 2002; McGre-gor 1941a:95-96; Mills and Crown 1995; Plog 1980,1994, 1995).
Specialization is a broadly defined analytical con-cept that encompasses several distinctive modes ofeconomic organization (Clark and Parry 1990; Cos-tin 1991; Peacock 1982; Pool 1992; Rice 1981, 1991;Spielmann 2002; Tosi 1984; van der Leeuw 1984).Specialized ceramic production is recognized in thearchaeological record when two conditions are met.First, when multiple lines of evidence suggest pro-ducer and consumer were neither the same personnor members of the same household (Clark and Parry

164 Chapter 5
1990:297; Pool 1992:283). Second, when multiple linesof evidence suggest a subset of the population madethe pottery used by a larger set of nonproducers (Cos-tin 2000:378). The annual output of specialist potterscovaries with organizational mode. The annual out-put of part-time individual or household-based spe-cialists usually numbers no more than hundreds ofpots, while full-time workshops can produce tens ofthousands of vessels annually (Table 5.17). The pre-historic specialist potters of the Greater Southwest al-most certainly produced no more pottery annuallythan the potters cited in Table 5.17 who build theirwares by hand (Heidke et al. 2002; Spielmann 2002).
Archaeologists typically use two general kinds ofevidence when reconstructing the organization of ce-ramic production: direct and indirect (Costin 1991).Direct evidence for pottery production includes rawmaterials (clay, temper, pigments), forming and fin-ishing tools (turntables, anvils, scrapers, polishers),facilities associated with production (clay-mixing ba-sins, kilns, wind screens), and manufacturing debris
(wasters) (Mills and Crown 1995; Stark 1985; Sulli-van 1988). Indirect evidence refers to provenance,morphological, and/or design data recorded frompottery (Costin 1991). Successful provenance studiesrequire detailed geological mapping and samplingof ceramic resources, as well as technological analy-ses of ceramic pastes (Arnold 2000; Costin 2000;Lombard 1987b; Miksa and Heidke 2001; Pool 1992;Shepard 1963).
The method used to determine temper prov-enance is presented in Chapter 4. Quantitative pet-rographic data presented there demonstrates that theAlameda Brown Ware types Rio de Flag Brown,Angell Brown, and Winona Brown are temperedwith sand or a self-tempered clay and sand avail-able in the Sugarloaf Petrofacies (K) (see Figure 4.5).It is argued that the temper in Rio de Flag Brownrepresents the Sugarloaf Petrofacies compositionbefore, or in areas unchanged by, the eruption ofSunset Crater, while the felsic sand temper found inAngell Brown and Winona Brown represents the
Table 5.17. Ethnographic examples of annual ceramic production rates.
Country Community or Group Average Range Reference
Hand-built (reciprocal exchange)
Ethiopia Felasha – 50-150 Messing 1985:85
New Guinea Amphlett Islands 72 – Lauer 1974:158
New Guinea Buka Island 150 – Specht 1972:135
New Guinea Western Motu – 87-117 Allen 1984:422
Philippines Dalupa 113 3-377 Stark 1993
Philippines Dangtalan 12 0-36 Graves 1991:142, Tables 6.5 and 6.9
United States (SW) Hopi 30 – Wyckoff 1990:117
United States (SW) Tohono O'odham 50 – Papago Indian Reservations 1930:4-5
Hand-built (indeterminate distribution)
Senegal Diola – 425-650 Linares de Sapir 1969:2, 4, 7
Hand-built (market distribution)
Cameroon Dii 100 – Wallaert-Pêtre 2001:476
Cameroon Doayo 100 – Wallaert-Pêtre 2001:476
Cameroon Duupa 100 – Wallaert-Pêtre 2001:476
Cameroon Fali 200 – Wallaert-Pêtre 2001:476
Ghana Shai 262 – Quarcoo and Johnson 1968:48, 53, 65-66
Mexico Tzeltal Maya (Chanal) 66 2-864 Deal 1998:Table 3.1
Peru Aco 328 91-507 Hagstrum 1989:Table 7.1
Peru Quicha Grande 569 244-825 Hagstrum 1989:Table 7.1
Sudan Berti and Zagh wa – 234-650 Tobert 1984a:143, 1984b:220-221, 223
Wheel-thrown (market distribution)
India Uttam Nagar 15,000 – Roux 2003:770
Morocco – – 1,500-10,000 Vossen 1984:370
Sardinia Pabillonis 16,523 15,882-17,500 Annis and Geertman 1987:Figure 4
Spain Agost 50,000 – Vossen 1984:354
Spain Bailén – 25,000-50,000 Vossen 1984:348-349
Spain Salvatierra 10,000 – Vossen 1984:343
Spain Vall de Uxo 14,000 – Roux 2003:770

Alameda Brown Ware and San Francisco Mountain Gray Ware Technology and Economics 165
Sugarloaf Petrofacies composition in areas affectedby the eruption of Sunset Crater. The temper in Tur-key Hill Red also likely represents the SugarloafPetrofacies composition in areas affected by theeruption of Sunset Crater, although no sherds of thattype were analyzed petrographically.
The Alameda Brown Ware types Sunset Red/Brown and Elden Corrugated are tempered withmafic sands such as those available in the Antelope(B), Merriam (C), Red Hill (Q), Lenox (E), and Wal-nut (H) petrofacies. They are probably also avail-able further afield in the ash fall zone of Sunset Cra-ter, which is beyond the area sampled for the U.S.89 project. Importantly, no Sunset Red/Brown or El-den Corrugated sherds were analyzed petrographi-cally due to their low frequency of occurrence atproject area sites. Colton (1958) described YoungsBrown as an intergrade between Winona Brown andSunset Brown, based on the presence of volcanic tuffand basaltic ash. However, petrographic analysis ofa sherd of that type indicates its composition fallswithin the range documented for Sugarloaf Petro-facies sands (see Chapter 4).
San Francisco Mountain Gray Ware types containa sand temper composition not available in the U.S.89 project area; no source area for that sand has cur-rently been identified. Provenance questions were notpursued for the other utilitarian wares recovered fromproject area sites (i.e., Mogollon Red/Brown Ware,Prescott Gray Ware, and Tusayan Gray Ware).
A total of 41 sites was investigated as a part of theU.S. 89 Archaeological Project. Two of those sites wereagricultural fields without ceramics; therefore, the fol-lowing discussion is based on the 39 sites that yieldedpottery. Twenty-two of those 39 sites lie north of theCoconino Divide and 17 lie south of it. The CoconinoDivide is a northwest-to-southeast trending chain ofcinder cone volcanoes, lava flows, and other volca-nic features that separate the high elevation parks andforests adjacent to the San Francisco Peaks from thelower elevation basalt flows and sedimentary rockstrata that step down toward the Wupatki Basin andthe Little Colorado River Valley (Downum andGumerman 1998:8). The Sugarloaf Petrofacies strad-dles the Coconino Divide; accordingly, SugarloafPetrofacies sands are present both north and south ofthe divide.
Colton (1932b, 1946), and, more recently Down-um and Gumerman (1998:11, 54) have asserted thatthe Coconino Divide represented a prehistoric cul-tural boundary, due primarily to the abundance ofAlameda Brown Ware (Sinagua) ceramics on siteslocated south of the divide and San Francisco Moun-tain Gray Ware (Cohonina) ceramics on sites locatednorth of the divide. Whether the Coconino Dividemarked a cultural boundary, or a barrier to trade, thedirect and indirect evidence for ceramic production
collected from U.S. 89 project sites indicates AlamedaBrown Ware production was common south of theCoconino Divide, while little ceramic production oc-curred north of it.
Direct Evidence for Ceramic Production
Twenty-two of the U.S. 89 Archaeological Proj-ect sites contain some direct evidence for ceramicproduction (Table 5.18). Eleven of those sites arelocated in the Sugarloaf Petrofacies south of the Co-conino Divide (see Figure 4.5). Those 11 sites con-tain 57 percent of the 103 ceramic production-re-lated artifacts and raw materials documented.Importantly, those sites also yielded all the unam-biguous evidence for ceramic production: the six pot-tery anvils and the raw clay sample. Further, all thosesites are located within 4.8 km of the Clay House site,NA 21,103—a location where a clay well-suited topottery production was exposed during archaeologi-cal fieldwork. The direct evidence recovered from theother 11 sites is less clear. Fully 61 percent of the in-ferred ceramic production evidence recovered fromthose sites consists of worked sherd scrapers andpossible scrapers—tools that might have been usedfor tasks other than ceramic manufacture.
A number of additional sites located in the Flag-staff area have yielded direct evidence of ceramicproduction (Table 5.19). One—the Jack Smith AlcoveHouses, NA 1295—is located in the Sugarloaf Petro-facies south of the Coconino Divide. Three of theremaining sites are located north of the Jack SmithAlcove Houses (two in the Sugarloaf Petrofacies andone in the Carr Petrofacies), while five sites are lo-cated south or southeast of the Sugarloaf Petrofacies(see Adams 2006). According to Colton (1946:288,312), many other sites in the region have producedanvils; unfortunately, he did not summarize the oc-currences of this important artifact type by site.
Indirect Evidence for Ceramic Production
All the U.S. 89 project sites where AlamedaBrown Ware is the dominant utilitarian ware arelocated in the Sugarloaf Petrofacies, and most (15 of16) lie south of the Coconino Divide (see Chapter 1and Figure P.6). Alameda Brown Ware is the domi-nant utilitarian ware at 15 of the 17 sites locatedsouth of the Coconino Divide, while it is the domi-nant ware at only one of the 22 sites located north ofthe divide. A statistical test of the relationship be-tween the dominance of this ware and site locationconfirms the significance of this pattern. The nullhypothesis (H0) for this test states that the distribu-tion of utilitarian wares among sites located on
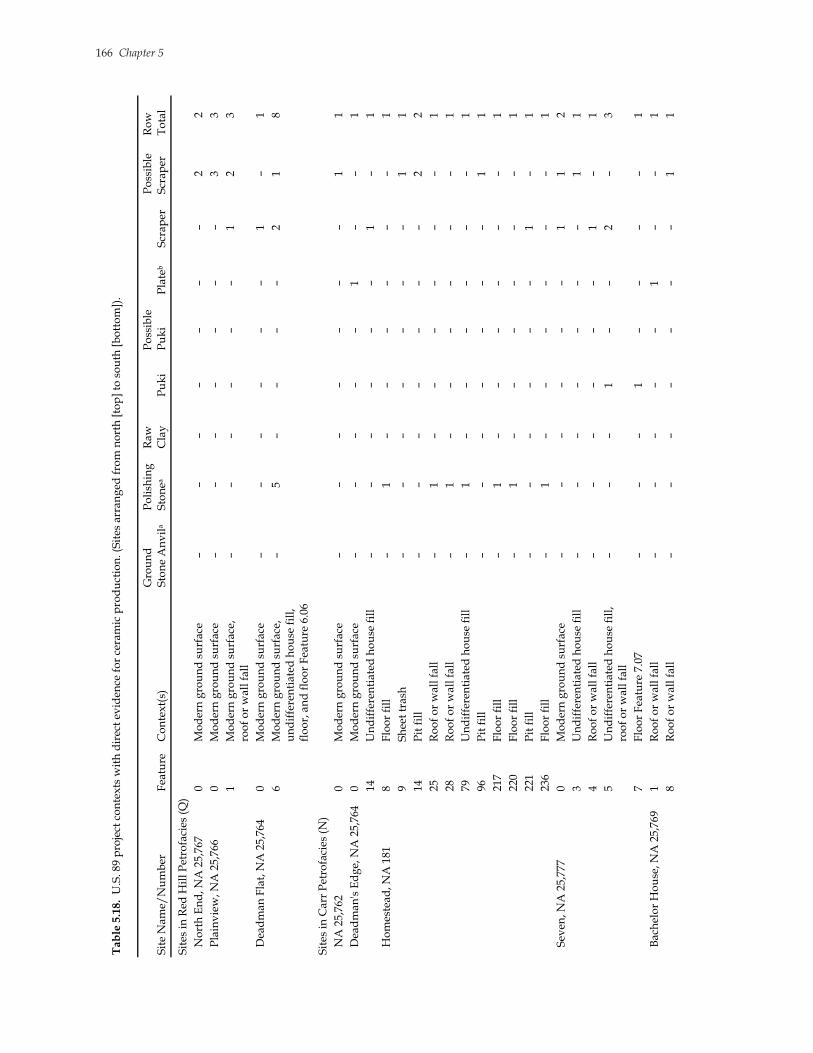
166 Chapter 5
Ta
ble
5.1
8.
U.S
. 89
pro
ject
co
nte
xts
wit
h d
irec
t ev
iden
ce f
or
cera
mic
pro
du
ctio
n. (
Sit
es a
rran
ged
fro
m n
ort
h [
top
] to
so
uth
[b
ott
om
]).
Sit
e N
ame/
Nu
mb
er
Fea
ture
C
on
tex
t(s)
G
rou
nd
S
ton
e A
nv
ila
Po
lish
ing
S
ton
eaR
aw
Cla
y
P
uk
iP
oss
ible
P
uk
i P
late
bS
crap
er
Po
ssib
le
Scr
aper
R
ow
T
ota
l
Sit
es i
n R
ed H
ill
Pet
rofa
cies
(Q
)
No
rth
En
d, N
A 2
5,76
7 0
Mo
der
n g
rou
nd
su
rfac
e –
– –
– –
– –
2 2
Pla
inv
iew
, NA
25,
766
0 M
od
ern
gro
un
d s
urf
ace
– –
– –
– –
– 3
3
1
Mo
der
n g
rou
nd
su
rfac
e,
roo
f o
r w
all
fall
–
––
––
–1
23
0 M
od
ern
gro
un
d s
urf
ace
– –
– –
– –
1 –
1 D
ead
man
Fla
t, N
A 2
5,76
4
6 M
od
ern
gro
un
d s
urf
ace,
u
nd
iffe
ren
tiat
ed h
ou
se f
ill,
fl
oo
r, a
nd
flo
or
Fea
ture
6.0
6
–5
––
––
21
8
Sit
es i
n C
arr
Pet
rofa
cies
(N
)
NA
25,
762
0 M
od
ern
gro
un
d s
urf
ace
– –
– –
– –
– 1
1
0 M
od
ern
gro
un
d s
urf
ace
– –
– –
– 1
– –
1 D
ead
man
's E
dg
e, N
A 2
5,76
4
14
Un
dif
fere
nti
ated
ho
use
fil
l –
– –
– –
– 1
– 1
Ho
mes
tead
, NA
181
8
Flo
or
fill
–
1 –
– –
– –
– 1
9
Sh
eet
tras
h
– –
– –
– –
– 1
1
14
P
it f
ill
– –
– –
– –
– 2
2
25
R
oo
f o
r w
all
fall
–
1 –
– –
– –
– 1
28
R
oo
f o
r w
all
fall
–
1 –
– –
– –
– 1
79
U
nd
iffe
ren
tiat
ed h
ou
se f
ill
– 1
– –
– –
– –
1
96
P
it f
ill
– –
– –
– –
– 1
1
21
7 F
loo
r fi
ll
– 1
– –
– –
– –
1
22
0 F
loo
r fi
ll
– 1
– –
– –
– –
1
22
1 P
it f
ill
– –
– –
– –
1 –
1
23
6 F
loo
r fi
ll
– 1
– –
– –
– –
1
Sev
en, N
A 2
5,77
7 0
Mo
der
n g
rou
nd
su
rfac
e –
– –
– –
– 1
1 2
3
Un
dif
fere
nti
ated
ho
use
fil
l –
– –
– –
– –
1 1
4
Ro
of
or
wal
l fa
ll
– –
– –
– –
1 –
1
5
Un
dif
fere
nti
ated
ho
use
fil
l,
roo
f o
r w
all
fall
–
––
1–
–2
–3
7
Flo
or
Fea
ture
7.0
7 –
– –
1 –
– –
– 1
1 R
oo
f o
r w
all
fall
–
– –
– –
1 –
– 1
Bac
hel
or
Ho
use
, NA
25,
769
8 R
oo
f o
r w
all
fall
–
– –
– –
– –
1 1

Alameda Brown Ware and San Francisco Mountain Gray Ware Technology and Economics 167
Ta
ble
5.1
8.
Co
nti
nu
ed.
Sit
e N
ame/
Nu
mb
er
Fea
ture
C
on
tex
t(s)
G
rou
nd
S
ton
e A
nv
ila
Po
lish
ing
S
ton
ea
Raw
C
lay
Pu
ki
Po
ssib
le
Pu
ki
Pla
teb
Scr
aper
Po
ssib
le
Scr
aper
R
ow
T
ota
l
Sit
es i
n S
ug
arlo
af P
etro
faci
es (
K),
lo
cate
d n
ort
h o
f th
e C
oco
nin
o D
ivid
e
NA
25,
772
0 M
od
ern
gro
un
d s
urf
ace
– –
– –
– –
– 1
1
Sn
ag, N
A 1
8,68
0 1
Un
dif
fere
nti
ated
ho
use
fil
l –
– –
– –
– –
1 1
Co
rn R
ock
, NA
860
0
Mo
der
n g
rou
nd
su
rfac
e –
– –
– –
2 –
– 2
Sit
es i
n S
ug
arlo
af P
etro
faci
es (
K),
lo
cate
d s
ou
th o
f th
e C
oco
nin
o D
ivid
e
Div
ide,
NA
21,
087
1 S
hee
t tr
ash
–
1 –
– –
– –
– 1
4
Sh
eet
tras
h
– 1
– –
– –
– –
1
Dea
n, N
A 2
5,75
3 10
M
od
ern
gro
un
d s
urf
ace
– –
– –
– –
1 –
1
Elk
, NA
21,
104
0 D
istu
rbed
co
nte
xt
1 –
– –
– –
– –
1
11
P
it f
ill
– –
– –
– –
– 2
2
14
R
oo
f o
r w
all
fall
1
– –
– –
– –
1 2
20
R
oo
f o
r w
all
fall
, flo
or
fill
–
– –
– 1
2 1
1 5
33
P
it f
ill
– –
– 1
– –
– –
1
41
U
nd
iffe
ren
tiat
ed h
ou
se f
ill
– –
– –
– –
1 –
1
Bas
alt
Rid
ge,
NA
21,
089
1 R
oo
f o
r w
all
fall
–
1 –
– –
– –
– 1
Cla
y H
ou
se, N
A 2
1,10
3 3
Flo
or
Fea
ture
3.0
3 –
1 –
– –
– –
– 1
Slo
pe,
NA
18,
417
0 D
istu
rbed
co
nte
xt
– 1
– –
– –
– –
1
0 M
od
ern
gro
un
d s
urf
ace
– –
– –
– –
1 –
1 L
eno
x P
ark
, NA
20,
700
1
Un
dif
fere
nti
ated
ho
use
fil
l,
roo
f o
r w
all
fall
, flo
or
fill
(u
pp
er a
nd
lo
wer
flo
ors
),
flo
or
Fea
ture
s 1.
16, 1
.17
–
––
––
23
–5
4
Un
dif
fere
nti
ated
ho
use
fil
l,
flo
or
fill
, flo
or
–2
––
––
12
5
15
S
hee
t tr
ash
, pit
fil
l –
– –
– –
1 1
– 2
23
P
it f
ill
– –
– 1
– –
– –
1
26
P
it f
ill
– 1
– –
– –
– –
1
31
U
nd
iffe
ren
tiat
ed h
ou
se f
ill,
ro
of
or
wal
l fa
ll
––
––
–1
––
1
32
S
hee
t tr
ash
–
– –
– –
– 1
– 1
35
U
nd
iffe
ren
tiat
ed h
ou
se f
ill
– –
– –
– 1
– –
1
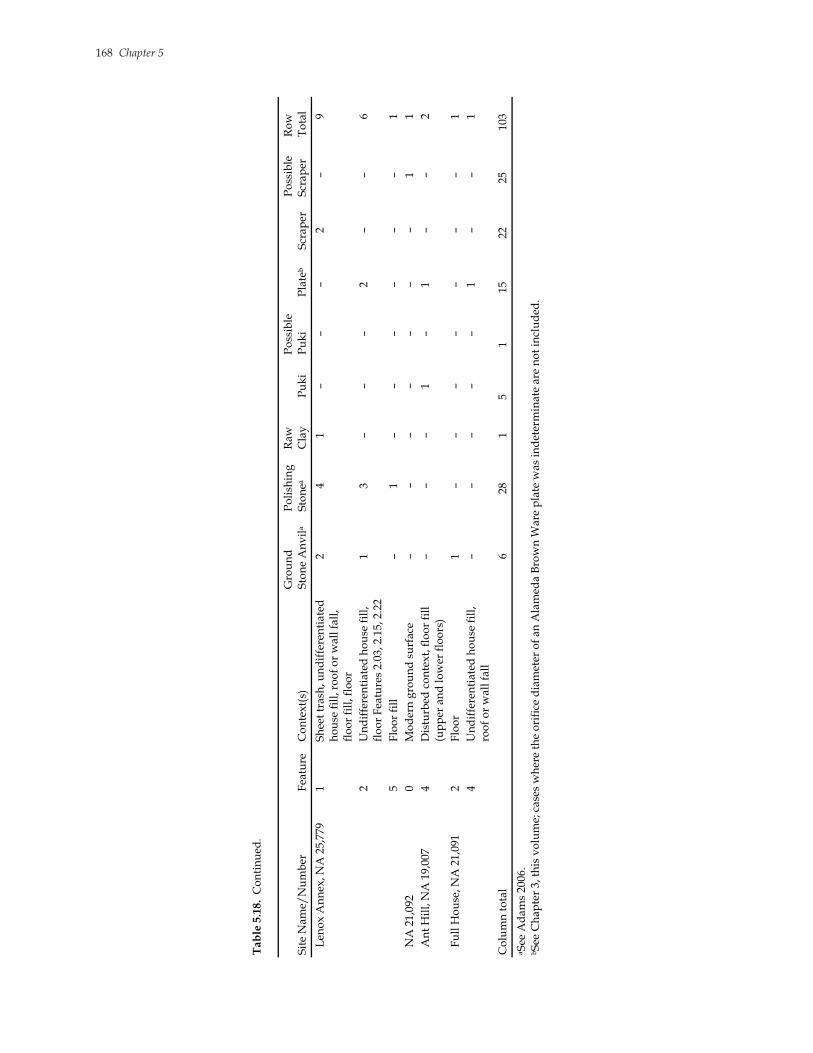
168 Chapter 5
Ta
ble
5.1
8.
Co
nti
nu
ed.
Sit
e N
ame/
Nu
mb
er
Fea
ture
C
on
tex
t(s)
G
rou
nd
S
ton
e A
nv
ila
Po
lish
ing
S
ton
ea
Raw
C
lay
Pu
ki
Po
ssib
le
Pu
ki
Pla
teb
Scr
aper
Po
ssib
le
Scr
aper
R
ow
T
ota
l
Len
ox
An
nex
, NA
25,
779
1 S
hee
t tr
ash
, un
dif
fere
nti
ated
h
ou
se f
ill,
ro
of
or
wal
l fa
ll,
flo
or
fill
, flo
or
2
4
1–
––
2–
9
2
Un
dif
fere
nti
ated
ho
use
fil
l,
flo
or
Fea
ture
s 2.
03, 2
.15,
2.2
2 1
3–
––
2–
–6
5
Flo
or
fill
–
1 –
– –
– –
– 1
NA
21,
092
0 M
od
ern
gro
un
d s
urf
ace
– –
– –
– –
– 1
1
An
t H
ill,
NA
19,
007
4 D
istu
rbed
co
nte
xt,
flo
or
fill
(u
pp
er a
nd
lo
wer
flo
ors
)
––
–1
–1
––
2
2F
loo
r1
––
––
––
–1
Fu
ll H
ou
se, N
A 2
1,09
1
4 U
nd
iffe
ren
tiat
ed h
ou
se f
ill,
ro
of
or
wal
l fa
ll
––
––
–1
––
1
Co
lum
n t
ota
l 6
28
1 5
1 15
22
25
10
3
aS
ee A
dam
s 20
06.
bS
ee C
hap
ter
3, t
his
vo
lum
e; c
ases
wh
ere
the
ori
fice
dia
met
er o
f an
Ala
med
a B
row
n W
are
pla
te w
as i
nd
eter
min
ate
are
no
t in
clu
ded
.

Alameda Brown Ware and San Francisco Mountain Gray Ware Technology and Economics 169
either side of the Coconino Divide is the same; thealternate hypothesis (H1) states that there is a differ-ence. Utilizing a significance level of 0.05, a chi-square test of the relationship between site locationand Alameda Brown Ware dominance indicatesthere is a significant difference (�2 = 27.761; df = 1; p= 0.000). Given that finding, as well as the directevidence for ceramic production reviewed above, alarger, regional perspective might help clarify trendsin Alameda Brown Ware and San Francisco Moun-tain Gray Ware production and distribution. Typedata covering more than 387,000 undecorated sherdsrecovered from nearly 130 sites was collected pri-marily through a literature review.
A synthesis of previously published Flagstaff areadata (Breternitz 1963; Colton 1932b, 1946; Dosh 1998;Goetze and Zedeño 1994; Kamp and Whittaker 1999;Landis 1993b, 1993c; Lee 1962; Marmaduke et al. 1998;Pilles 1969; Tagg and Layhe 1985; see also AppendixA) was possible because, as is now known (see Chap-ter 4), a great deal of temper provenance informationis built into the Alameda Brown Ware type defini-tions. Regional patterns in the typological/prov-enance data collected from those reports3 are sum-marized in Table 5.20. Information collected from 102
sites (representing 116 distinct spatial and temporalcomponents) and 344,639 sherds are summarized.
The raw data for all sites are reported in TableE.2, while Tables E.4-E.10 report the range, median,mean, and standard deviation for each of the subar-eas reported in Table 5.20. Northern and southernportions of the Sugarloaf Petrofacies are treated assubareas. Preeruptive and posteruptive provenance
3Based on Colton’s (1958) description of the temper inYoungs Brown (i.e., equal amounts volcanic tuff and ba-saltic ash), it is treated here as a mafic type. Petrographicanalysis of one sherd from a U.S. 89 project area site indi-cated a felsic, Sugarloaf Petrofacies composition; however,that sherd may not be representative of the type YoungsBrown (i.e., the sherd’s type may have been misidenti-fied). Overall, the type Youngs Brown is relatively rare inthe regional database; 7,112 sherds were recorded, repre-senting 2.1 percent of the total. Most of those sherds—6,908, or 97.1 percent—were recovered from sites locatedeast of Flagstaff, where mafic sand compositions are pres-ent. Sites in the felsic Sugarloaf Petrofacies yielded only116 Youngs Brown sherds (or 1.6 percent of that type’stotal). Together, these lines of evidence suggest the as-signment of Youngs Brown to the mafic group makessense archaeologically, if not geologically.
Table 5.19. Flagstaff area sites located outside the U.S. 89 project area with direct evidence for ceramic production.
Site Anvil Present
Unfired, Tempered Clay Present
Ceramic Groupa Reference
Sites in felsic Carr Petrofacies (N)
NA 192 Yes – 5/6 Bartlett 1934:32-33
Sites in felsic Sugarloaf Petrofacies (K), located north of the Coconino Divide
NA 2003A Yes – 5/6 Bartlett 1934:32-33
NA 1625A Yes – 5 Jennings 1968:51
Sites in felsic Sugarloaf Petrofacies (K), located south of the Coconino Divide
Jack Smith Alcove Houses, NA 1295A Yes – 6 Bartlett 1934:32-33
Sites in felsic Elden Petrofacies (V)
Coyote Range, NA 1959 Yes – 4 Bartlett 1934:32-33
Sites in mafic Lenox Petrofacies (E)
Piper, NA 4266 Yes – 6/7 Bliss and Ezell 1956:122-123, Figures 88 and 91
Sites in mafic Walnut Petrofacies (H)
Lizard Man Village, NA 17,957 Yes Yes 6/7 Kamp and Whittaker 1999:49, 119
Sites located in the ash fall zone, but outside the sampled U.S. 89 project area
Rincon Pueblo, NA 7432 Yes – 6/7 Kelly 1969:126-127, 129
Tse Tlani, NA 8762 Yes – 6, 7, and 8 Ward 1969:95-96
aCeramic groups modified from Colton (1946:20, 254, 329): 4 = Mixed Sunset and Rio de Flag Foci; 5 = Rio de Flag Focus; 5/6 = Mixed Rio de Flag and Angell/Winona/Padre Foci; 6 = Angell/Winona/Padre Focus; 6/7 = Mixed Angell/Winona/ Padre and Elden Foci; 7 = Elden Focus; 8 = Turkey Hill Focus.

170 Chapter 5
data for each subarea are reported. The overall com-position of the 116 collections is illustrated in Fig-ure 5.3a.
A synthesis of previously published Cohoninadata sets (Bluhm 1951; Colton 1946; Landis 1993c;McGregor 1951, 1967; Mills and Goetze 1994;Schwartz et al. 1980a; Wheat and Wheat 1954; Wilder1944) was also conducted. Regional patterns in thatprovenance data are summarized in Table 5.21; in-formation collected from 27 sites (representing 29distinct spatial and temporal components) and42,401 sherds are summarized. The raw data for eachsite are reported in Table E.3, while Tables E.11-E.19report the range, median, mean, and standard de-viation for each of the subareas reported in Table5.21. The overall composition of the 29 collections isillustrated in Figure 5.3b, and the locations of theCohonina subareas referred to in Table 5.21 areshown in Figure 5.4.
The main pattern expressed in the San FranciscoMountain Gray Ware data is its abundance at widelyscattered settlements; this is true both before andafter the eruption of Sunset Crater. San FranciscoMountain Gray Ware makes up at least 60 percentof the utilitarian ceramic assemblage of most Co-honina area data sets (see Table 5.21); however, two
sites—one located in the Great Thumb area and theother at the western end of Transwestern PipelineLoop H—contained less than 60 percent San Fran-cisco Mountain Gray Ware. Approximately 20 per-cent of the Flagstaff area data sets contain at least 60percent San Francisco Mountain Gray Ware. Mostof them, 22 of 24, occur north of the Coconino Di-vide (Table 5.22). The greatest concentration of Flag-staff area sites with high percentages of San Fran-cisco Mountain Gray Ware occurs in MedicineValley, where 11 of the 21 data sets (52 percent) con-tain at least 60 percent San Francisco Mountain GrayWare. Eight of those sites (73 percent) were occu-pied before the eruption of Sunset Crater. Eleven ofthe 27 data sets (41 percent) drawn from sites lo-cated on the Coconino Plateau north of MedicineValley also contain at least 60 percent San FranciscoMountain Gray Ware. Only four of those sites (36percent) were occupied before the eruption of Sun-set Crater. South of the Coconino Divide only twoof the 68 data sets (3 percent) contain at least 60 per-cent San Francisco Mountain Gray Ware; both ofthose sites were occupied before the eruption of Sun-set Crater. Sites located east of Flagstaff generallyconsumed relatively little San Francisco MountainGray Ware.
Table 5.20. Summary of typological/provenance data at Flagstaff area sites. (Median percentage values are reported; see Tables E.4-E.10 for additional information regarding each geographic area.)
Alameda Brown Ware
Sugarloaf Petrofacies
Location and Time Rio de Flag Felsic Typesa Mafic Typesb San Francisco Mountain Gray Ware
Other Utilitarian Ware
Sites located on the Coconino Plateau (north of Medicine Valley)
Preeruption (n = 9) 19.7 – – 55.8 0.6
Posteruption (n = 18) 0.2 12.4 0.4 51.3 26.6
Sites located outside the Sugarloaf Petrofacies in Medicine Valley
Posteruption (n = 2) 6.5 8.1 1.8 59.1 24.6
Sites located in the Sugarloaf Petrofacies north of the Coconino Divide in Medicine Valley
Preeruption (n = 14) 21.0 – – 63.4 13.1
Posteruption (n = 5) 18.8 2.2 – 59.8 8.7
Sites located in the Sugarloaf Petrofacies south of the Coconino Divide
Preeruption (n = 10) 42.3 10.8 – 35.0 7.7
Posteruption (n = 7) 6.3 42.3 2.1 28.1 14.6
Sites located in the Lenox Petrofacies (east of the Sugarloaf Petrofacies)
Preeruption (n = 11) 48.8 – – 35.6 12.4
Sites other than Winona Village located east of Flagstaff
Preeruption (n = 11) 80.5 – – 10.6 9.8
Posteruption (n = 24) 0.5 40.6 41.3 0.4 6.3
Winona Village
Posteruption (n = 5) 0.9 58.2 14.0 5.7 13.6
aFelsic types include Angell Brown, Winona Brown, and Turkey Hill Red. bMafic types include Sunset Red/Brown, Youngs Brown, and Elden Corrugated.

Alameda Brown Ware and San Francisco Mountain Gray Ware Technology and Economics 171
Compared with the widespread abundance ofSan Francisco Mountain Gray Ware, the distributionof Alameda Brown Ware appears localized in theFlagstaff area, especially before the eruption of Sun-set Crater. Rio de Flag Brown is abundant at siteslocated throughout the Flagstaff area prior to theeruption of Sunset Crater, especially south of the Co-conino Divide. After the eruption, its distribution isconfined to the area where it was thought to havebeen produced (i.e., in the Sugarloaf Petrofacies, es-pecially north of the Coconino Divide in MedicineValley). The felsic volcanic sand-tempered types—Angell Brown, Winona Brown, and Turkey HillRed—are relatively rare before the eruption of Sun-set Crater, but are widespread after the eruption. Allof those types are also thought to have been produced
in the Sugarloaf Petrofacies. The me-dian percentage of Alameda BrownWare recovered from sites locatednorth of the Coconino Divide is rela-tively consistent, regardless of wheth-er the collections are pre- or post-eruptive.
Sites located immediately southof the Coconino Divide, in the Sug-arloaf and Lenox petrofacies, gener-ally contain at least twice as muchAlameda Brown Ware as their north-ern neighbors. Types tempered withmafic volcanic sand are extremelyrare before the eruption of SunsetCrater. After the eruption, their high-est frequencies occur in data setsdrawn from settlements located inmafic petrofacies east of Flagstaff. Onaverage, those settlements containthe very highest percentages of Ala-meda Brown Ware, due to the localproduction of mafic sand-temperedtypes, moderate consumption offelsic sand-tempered types, and lowconsumption of San Francisco Moun-tain Gray Ware. There is not much tosay with regard to the “other” utili-tarian wares, which consist largely ofTusayan and Prescott Gray Wares,except to note they are most abun-dant at sites located north of theCoconino Divide that were occupiedafter the eruption of Sunset Crater(see Table 5.20).
Another way to examine the utili-tarian ware data is through a seriesof box-and-whiskers plots that em-phasize temporal, as opposed to spa-tial, variability. In these plots, thehorizontal axis represents the per-
centage of a ware and the vertical axis representstime (Colton’s ceramic groups, see Table E.1). Northof the Coconino Divide, the percentage of San Fran-cisco Mountain Gray Ware shows a nearly mono-tonic increase over time up to Colton’s CeramicGroup 6, after which time it decreases (Figure 5.5a).The consistently high percentage of San FranciscoMountain Gray Ware recovered from deposits as-signed to Colton’s Ceramic Group 3 is the exceptionto that trend; most of those deposits were excavatedat Baker Ranch, NA 2551 and 2797-2800.
South of the Coconino Divide, the pattern of in-creasing amounts of San Francisco Mountain GrayWare over time also occurs (see Figure 5.5c); how-ever, it stops earlier (i.e., Colton’s Ceramic Group5)—at about the time of Sunset Crater’s eruption.
a
Alameda
Brown Ware
Other
ware
San Francisco
Mountain
Gray Ware
bAlameda
Brown Ware
Other
ware
San Francisco
Mountain
Gray Ware
Figure 5.3. Ternary diagrams showing the overall composition of: (a) the116 Flagstaff area utilitarian ceramic collections; and (b) the 29 Cohoninautilitarian ceramic collections.

172 Chapter 5
South of the Coconino Divide, the production ofAlameda Brown Ware appears to have been rela-tively dynamic over time—abundant when SanFrancisco Mountain Gray Ware pottery was rare inthe area, declining as San Francisco Mountain GrayWare gained in importance, and abundant again af-ter the eruption of Sunset Crater (see Figure 5.5d).North of the Coconino Divide, where most AlamedaBrown Ware must have been imported, the medianpercentage remained relatively static over time (seeFigure 5.5b).
Alameda Brown Ware Production andDistribution
The direct and indirect evidence reviewed abovehints that Alameda Brown Ware production in theFlagstaff area was specialized, albeit at a low level.
In terms of the parameters Costin (1991) developedto characterize the organization of craft production,the evidence suggests the manufacture of AlamedaBrown Ware pottery occurred part-time amongsmall, dispersed kin-based households indepen-dent of elite sponsorship. Compared with farming,and food production in general, potting was almostcertainly of secondary importance to these farmer-artisans (Hagstrum 1995:284-285, 2001:48).
Some of the pottery produced at sites locatedin the Sugarloaf Petrofacies would likely have beenused at the settlement where it was made, and someof it would have been distributed across the land-scape by the household that made it during theirdaily and seasonal subsistence and resource pro-curement pursuits. Additionally, ethnoarchaeo-logical studies make it appear likely that pottersliving in the Sugarloaf Petrofacies would haveloaned, gifted, and bartered some of their pots with
Table 5.21. Summary of Cohonina area sites typological/provenance data. (Actual and/or median percentage values are reported; see Tables E.11-E.19 for additional information regarding each geographic area.)
Alameda Brown Ware
Sugarloaf Petrofacies
Location and Time Rio de Flag
Felsic Typesa
Mafic Typesb
San Francisco Mountain Gray Ware
Other Utilitarian Ware
Sites located in the vicinity of Red Lake
Preeruption (n = 2) – – – 92.5 7.5
Posteruption (n = 7) – – – 98.0 2.0
Sites located along the AT&T Transcontinental Cable north of Sitgreaves Mountain
Preeruption (n = 2) 0.9 0.1 – 90.7 8.2
Site located in the vicinity of Mount Floyd
Preeruption (n = 1) – – – 90.2 9.8
Sites located in the vicinity of Pittsberg
Preeruption (n = 2) – – – 88.5 11.5
Sites located along Transwestern Pipeline Loop H
Preeruption (n = 1, Loop H East) – – – 85.4 14.6
Site located at Unkar Delta
Preeruption (n = 1) – – – 83.3 16.7
Sites located in the Great Thumb area of the Grand Canyon
Preeruption (n = 2) – – – 79.6 20.4
Posteruption (n = 3) – – – 60.3 39.7
Site located east of the Grand Canyon Village
Preeruption (n = 1) – – – 77.9 22.1
Sites located in the vicinity of the Grand Canyon Airport
Preeruption (n = 1) 3.6 – – 75.6 20.9
Posteruption (n = 3) – – – 92.5 7.5
Sites located along Transwestern Pipeline Loop H
Preeruption (n = 2, Loop H West) – – – 34.3 65.7
Posteruption (n = 1, Loop H West) – – – 68.4 31.6
aFelsic types include Angell Brown, Winona Brown, and Turkey Hill Red. bMafic types include Sunset Red/Brown, Youngs Brown, and Elden Corrugated.

Alameda Brown Ware and San Francisco Mountain Gray Ware Technology and Economics 173
the residents of other, nearby settlements (Deal1998:79; Longacre and Stark 1992:126). However,the indirect evidence also suggests some (current-ly unknown) integrative mechanism must haveexisted that facilitated the intraregional exchangeof Rio de Flag Brown, given the widespread distri-bution of that type in the area, as well as the ab-sence of contemporary Alameda Brown Ware typestempered with sand from another source.
After the founding of Winona Village, NA 2131,pottery made in the Sugarloaf Petrofacies could havebeen exchanged at markets or fairs (Haury 1976; Plog1989; Wilcox 1979) that likely occurred in conjunc-tion with ceremonies held at the ballcourt. The per-centage of felsic sand-tempered Alameda BrownWare types is higher at Winona Village than it is atother posteruptive sites located east of Flagstaff (seeTable 5.20). That “secondary peak” (Hodder andOrton 1976:149-150) in pottery distribution may bea characteristic of ballcourt villages, as it has alsobeen documented for Middle Rincon Red-on-brownpottery at the Hodges Ruin, AZ AA:12:18 (ASM),located in the Tucson Basin (Heidke 2000). This typeof exchange would have supplemented exchangescontingent upon kinship connections (Hirth 1998;Wilcox 1991).
A wide variety of other goods may also have beenexchanged. Ethnographic examples of the types ofgoods and services typically exchanged for pottery
are summarized in Table 5.23. Foods of all sorts rep-resent the most commonly exchanged item, althougha wide variety of other goods and some services aredocumented. From that we hypothesize that food-stuffs, extrabasinal decorated pottery, ground andflaked stone tools and jewelry, baskets, and textilesmay also have been exchanged. Further, as notedby Renfrew (2001:23), ordinary items such as pot-tery may have been viewed as sanctified when ac-quired at a ritual gathering.
San Francisco Mountain Gray WareConsumption
The consistency in the San Francisco MountainGray Ware compositional data discussed above andin Chapter 4 suggest a relatively specific paste recipewas used to manufacture this ware. Two explana-tions are possible. First, production of San FranciscoMountain Gray Ware may have occurred over a lim-ited geographic area, with little compositional varia-tion in the clay and temper resources (Roberts 2001;Warren 1980b:130). That possibility suggests rela-tively few Cohonina specialized in the manufactureof San Francisco Mountain Gray Ware (Warren1980b:132). Alternatively, the production of SanFrancisco Mountain Gray Ware may have takenplace over a large geographic area that contained
Figure 5.4. Cohonina subareas referred to in Table 5.21. (Area names are displayed in capital letters.)

174 Chapter 5
homogenous clay and temper resources. That possi-bility suggests many Cohonina potters may havebeen involved in its manufacture.
Clay and temper resources sampled by Roberts(2001) and the U.S. 89 Archaeological Project (seeChapter 4) do not match the materials used to manu-facture San Francisco Mountain Gray Ware. Thisfinding suggests those materials were not widelyavailable throughout Cohonina territory, and thatthey may have been geographically limited. Colton
(1946:23, 28-29) was one of the first to recognize thatSan Francisco Mountain Gray Ware was intrusiveat sites located in the volcanic area around Flagstaff,and he suggested that the ware was produced fromclays derived from Kaibab limestone. Bluhm(1951:46) and McGregor (1967:133) suggested thatthe center of San Francisco Mountain Gray Wareproduction occurred somewhere west of Flagstaff.Based on the “Criterion of Abundance” (Bishop etal. 1982:301) and current knowledge of clay and sand
Table 5.22. Flagstaff area sites where San Francisco Mountain Gray Ware represents at least 60 percent of the utilitarian pottery. (Sites are ranked by gray ware percent; site numbers shown in bold were excavated as a part of the U.S. 89 project.)
Site Name/Number and Feature Number
Percent San Francisco Mountain Gray Ware
Total Quantity Utilitarian Sherds
Preeruption sites located on the Coconino Plateau (north of Medicine Valley)
Baker Ranch, NA 2551 79.6 157
Baker Ranch, NA 2799 81.9 537
Baker Ranch, NA 2797 91.0 992
Baker Ranch, NA 2798 97.4 6,021
Posteruption sites located on the Coconino Plateau (north of Medicine Valley)
Deadman’s Edge, NA 420a 60.4 4,158
NA 1768-A 65.1 206
Homestead, NA 181b 67.6 12,966
NA 192-A, -C 72.7 538
Seven, NA 25,777c 77.3 4,894
NA 194-B 82.8 615
Deadman Flat, NA 25,764c 87.3 2,379
Posteruption site located outside of the Sugarloaf Petrofacies in Medicine Valley
NA 1608-B 70.3 138
Preeruption sites located in the Sugarloaf Petrofacies north of the Coconino Divide in Medicine Valley
NA 1907-A, -B 60.7 112
NA 1244-B 66.0 515
NA 1123 66.7 465
NA 1625-A, -C 66.9 257
Medicine Fort, NA 862 71.4 3,529
AR-03-04-02-2567 (CNF) 75.4 3,861
NA 1238 77.0 191
NA 2002-B 89.2 232
Posteruption sites located in the Sugarloaf Petrofacies north of the Coconino Divide in Medicine Valley
NA 2002-A 76.0 100
NA 2001-A 96.2 816
Preeruption site located in the Sugarloaf Petrofacies south of the Coconino Divide
NA 1570-D 74.5 247
Preeruption site located in the Lenox Petrofacies (east of the Sugarloaf Petrofacies)
NA 1975 72.2 169
aTotal does not include surface and “other” deposits. bTotal does not include “other” deposits at either locus, nor surface deposits at Locus B. cTotal does not include “other” deposits.
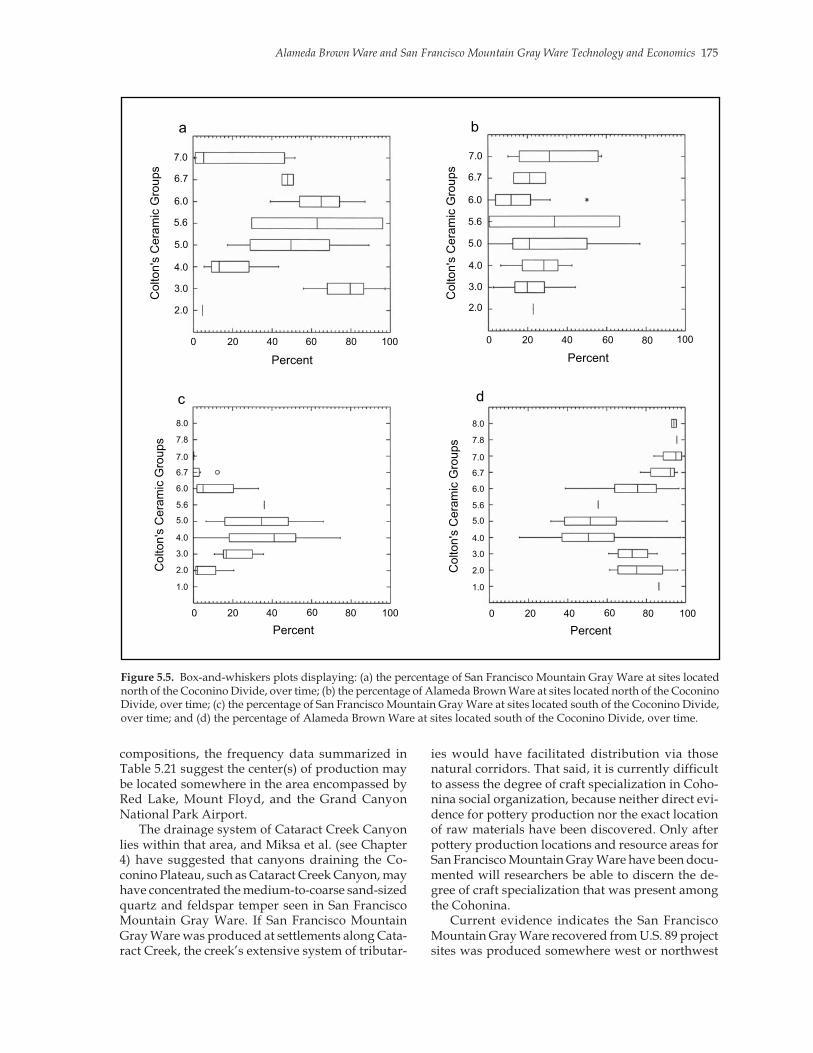
Alameda Brown Ware and San Francisco Mountain Gray Ware Technology and Economics 175
compositions, the frequency data summarized inTable 5.21 suggest the center(s) of production maybe located somewhere in the area encompassed byRed Lake, Mount Floyd, and the Grand CanyonNational Park Airport.
The drainage system of Cataract Creek Canyonlies within that area, and Miksa et al. (see Chapter4) have suggested that canyons draining the Co-conino Plateau, such as Cataract Creek Canyon, mayhave concentrated the medium-to-coarse sand-sizedquartz and feldspar temper seen in San FranciscoMountain Gray Ware. If San Francisco MountainGray Ware was produced at settlements along Cata-ract Creek, the creek’s extensive system of tributar-
ies would have facilitated distribution via thosenatural corridors. That said, it is currently difficultto assess the degree of craft specialization in Coho-nina social organization, because neither direct evi-dence for pottery production nor the exact locationof raw materials have been discovered. Only afterpottery production locations and resource areas forSan Francisco Mountain Gray Ware have been docu-mented will researchers be able to discern the de-gree of craft specialization that was present amongthe Cohonina.
Current evidence indicates the San FranciscoMountain Gray Ware recovered from U.S. 89 projectsites was produced somewhere west or northwest
806040200 100
Percent
Co
lto
n's
Ce
ram
ic G
rou
ps
6.0
6.7
7.0
3.0
4.0
5.0
5.6
2.0
7.0
0
Co
lto
n's
Ce
ram
ic G
rou
ps
Percent
10080604020
6.7
4.0
3.0
2.0
6.0
5.6
5.0
Percent
100806040200
Co
lto
n's
Ce
ram
ic G
rou
ps
4.0
3.0
2.0
1.0
8.0
5.6
5.0
7.0
6.7
6.0
7.8
Co
lto
n's
Ce
ram
ic G
rou
ps
4.0
3.0
2.0
1.0
8.0
5.6
5.0
7.0
6.7
6.0
7.8
100806040200
Percent
a b
dc
Figure 5.5. Box-and-whiskers plots displaying: (a) the percentage of San Francisco Mountain Gray Ware at sites locatednorth of the Coconino Divide, over time; (b) the percentage of Alameda Brown Ware at sites located north of the CoconinoDivide, over time; (c) the percentage of San Francisco Mountain Gray Ware at sites located south of the Coconino Divide,over time; and (d) the percentage of Alameda Brown Ware at sites located south of the Coconino Divide, over time.
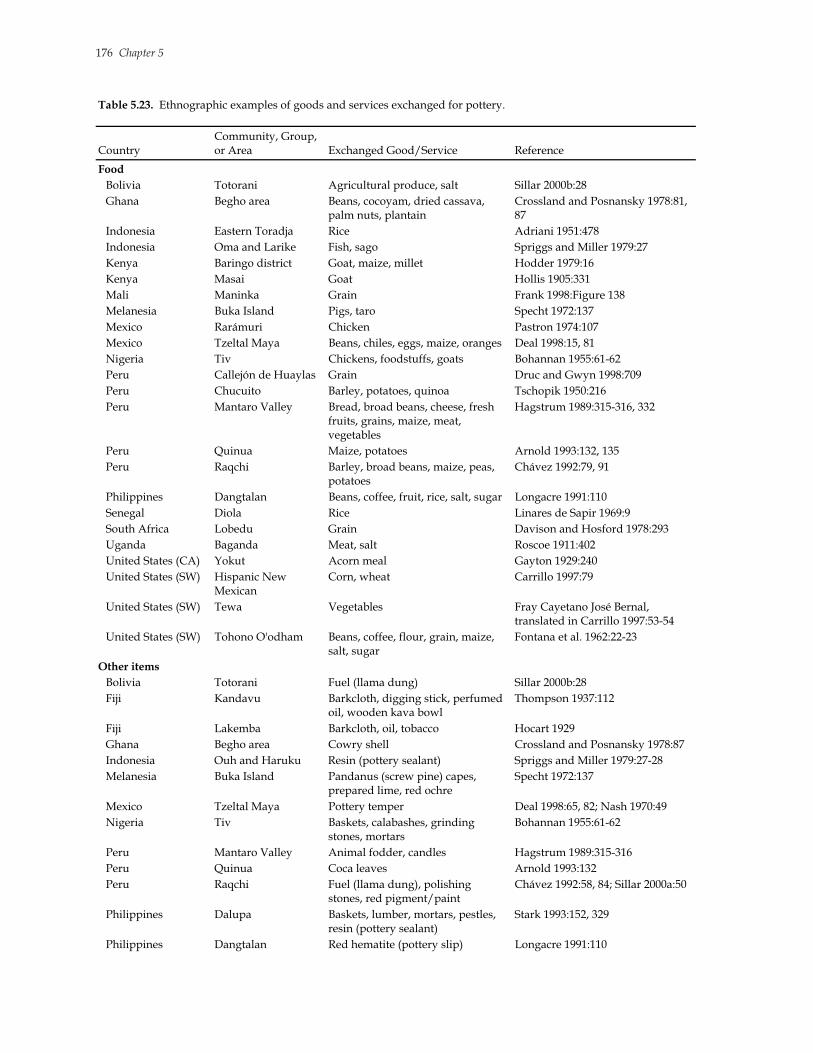
176 Chapter 5
Table 5.23. Ethnographic examples of goods and services exchanged for pottery.
Country Community, Group, or Area Exchanged Good/Service Reference
Food
Bolivia Totorani Agricultural produce, salt Sillar 2000b:28
Ghana Begho area Beans, cocoyam, dried cassava, palm nuts, plantain
Crossland and Posnansky 1978:81, 87
Indonesia Eastern Toradja Rice Adriani 1951:478
Indonesia Oma and Larike Fish, sago Spriggs and Miller 1979:27
Kenya Baringo district Goat, maize, millet Hodder 1979:16
Kenya Masai Goat Hollis 1905:331
Mali Maninka Grain Frank 1998:Figure 138
Melanesia Buka Island Pigs, taro Specht 1972:137
Mexico Rarámuri Chicken Pastron 1974:107
Mexico Tzeltal Maya Beans, chiles, eggs, maize, oranges Deal 1998:15, 81
Nigeria Tiv Chickens, foodstuffs, goats Bohannan 1955:61-62
Peru Callejón de Huaylas Grain Druc and Gwyn 1998:709
Peru Chucuito Barley, potatoes, quinoa Tschopik 1950:216
Peru Mantaro Valley Bread, broad beans, cheese, fresh fruits, grains, maize, meat, vegetables
Hagstrum 1989:315-316, 332
Peru Quinua Maize, potatoes Arnold 1993:132, 135
Peru Raqchi Barley, broad beans, maize, peas, potatoes
Chávez 1992:79, 91
Philippines Dangtalan Beans, coffee, fruit, rice, salt, sugar Longacre 1991:110
Senegal Diola Rice Linares de Sapir 1969:9
South Africa Lobedu Grain Davison and Hosford 1978:293
Uganda Baganda Meat, salt Roscoe 1911:402
United States (CA) Yokut Acorn meal Gayton 1929:240
United States (SW) Hispanic New Mexican
Corn, wheat Carrillo 1997:79
United States (SW) Tewa Vegetables Fray Cayetano José Bernal, translated in Carrillo 1997:53-54
United States (SW) Tohono O'odham Beans, coffee, flour, grain, maize, salt, sugar
Fontana et al. 1962:22-23
Other items
Bolivia Totorani Fuel (llama dung) Sillar 2000b:28
Fiji Kandavu Barkcloth, digging stick, perfumed oil, wooden kava bowl
Thompson 1937:112
Fiji Lakemba Barkcloth, oil, tobacco Hocart 1929
Ghana Begho area Cowry shell Crossland and Posnansky 1978:87
Indonesia Ouh and Haruku Resin (pottery sealant) Spriggs and Miller 1979:27-28
Melanesia Buka Island Pandanus (screw pine) capes, prepared lime, red ochre
Specht 1972:137
Mexico Tzeltal Maya Pottery temper Deal 1998:65, 82; Nash 1970:49
Nigeria Tiv Baskets, calabashes, grinding stones, mortars
Bohannan 1955:61-62
Peru Mantaro Valley Animal fodder, candles Hagstrum 1989:315-316
Peru Quinua Coca leaves Arnold 1993:132
Peru Raqchi Fuel (llama dung), polishing stones, red pigment/paint
Chávez 1992:58, 84; Sillar 2000a:50
Philippines Dalupa Baskets, lumber, mortars, pestles, resin (pottery sealant)
Stark 1993:152, 329
Philippines Dangtalan Red hematite (pottery slip) Longacre 1991:110

Alameda Brown Ware and San Francisco Mountain Gray Ware Technology and Economics 177
of the Flagstaff area; therefore, those pots musthave been transported at least 50-60 km. While thatdistance seems excessive for utilitarian ceramic ex-change, ethnographic examples have been docu-mented (Table 5.24; see also Malville 2001). Addi-tionally, Shepard’s (1939, 1963:21-22; see alsoStoltman 1999:23) classic study of sanidine basalt-tempered corrugated pottery recovered from settle-ments in Chaco Canyon demonstrated those potswere made some 80 km west of the sites where thepots were recovered, and, more recently, Lyneis(2005) has documented the recovery of olivine-tem-pered utilitarian pottery some 110 km from it pro-duction source. Numerous studies have concludedthat portage distances of 20 km to 36 km per day arereasonable (Drennan 1984:105; Feldman 1985:Table1; Hassig 1985:216; Tourtellot 1978). Those rates sug-gest it would have taken a porter two to three daysto reach the Flagstaff area from the inferred produc-tion area.
Colton (1968:10) argued that Cohonina forts weredefensive structures, although those forts would alsohave made excellent places to warehouse vesselsprior to their final disposition. Further, at least twoforts—Pittsberg Fort, NA 3577, and Medicine Fort,NA 862—displayed archaeological evidence thatmany vessels were stored at them at one time (Col-ton 1946:81-84, 218; Parry 1981:69). This functionalinterpretation may explain why the amount of SanFrancisco Mountain Gray Ware recovered from siteslocated in Medicine Valley is greater than at othersites located north of the Coconino Divide. The dis-tance to Medicine Fort would have been shortest forpeople living at other settlements located in Medi-cine Valley. This point is addressed further below.
The preceding discussion of San Francisco Moun-tain Gray Ware production and distribution mustbe viewed as a series of working hypotheses, becauseit is currently unknown exactly where those potswere made. However, the raw materials necessaryfor their manufacture were not available in the
greater Flagstaff area (including the U.S. 89 projectarea). Therefore, the sherds of San Francisco Moun-tain Gray Ware that were recovered from archaeo-logical contexts in the Flagstaff area document actsof consumption and discard, and not production.These facts question the validity of using indexwares as a key to cultural identification.
Colton (1946:18; also Colton and Hargrave 1937:28) assumed that large vessels: (1) were rarely trans-ported long distances; and (2) should be found closeto their point of manufacture. Therefore, a potteryware for cooking or storage could be used as an in-dicator of culture. Colton’s reasoning confuses thelogical distinction between the social context of pro-duction and the social context of consumption(Dietler and Herbich 1994:461), even though he rec-ognized that San Francisco Mountain Gray Warewas intrusive at sites located in the volcanic areaaround Flagstaff (Colton 1946:23). Further, ethno-graphic studies have shown that relative frequencyof occurrence does not always offer a reliable meansof distinguishing local from trade pottery (Deal1998:63; Shepard 1963:16).
The index ware concept is applicable south ofthe Coconino Divide, in the Sugarloaf Petrofacies,where all the direct and indirect evidence supportsthe idea that production of the Alameda Brown Waretypes Rio de Flag Brown, Angell Brown, WinonaBrown, and Turkey Hill Red occurred. It is also ap-plicable east of Flagstaff, in the Walnut Petrofacies,where the direct and indirect evidence supports theidea that the Alameda Brown Ware types SunsetRed/Brown, Youngs Brown, and Elden Corrugatedwere made at sites such as Lizard Man, NA 17,957(Kamp and Whittaker 1999:39, 49-50, 118-119).
However, north of the Coconino Divide, the tem-per provenance data show that the index ware con-cept leads to a false conclusion. The provenance datademonstrate social and economic relationshipsamong people living in different regions, ratherthan evidence of the area’s cultural affiliation. This
Table 5.23. Continued.
Country Community, Group, or Area Exchanged Good/Service Reference
Uganda Baganda Cowry shell Roscoe 1911:402
United States (CA) Yokut Basketry Gayton 1929:240
United States (SW) Hopi Clothing, jewelry, tanned deer and mountain sheep hides
Colton 1941b:308; Wyckoff 1990:Figure 23
United States (SW) Tohono O’odham Mat Underhill 1939:103
Service
South Africa Lobedu Weeding Davison and Hosford 1978:293
United States (SW) Hopi As payment for the services of a medicine man, as payment to daughter’s dance partner’s lineage
Wyckoff 1990:Figure 23

178 Chapter 5
conclusion is supported by Parry (1981:vi), whofound no evidence for a strong correlation betweenany one architectural form and any one ceramicware, or combination of wares, at sites located inMedicine Valley.
Colton (1946:306) found Medicine Valley justnorth of the Coconino Divide area to be a “hope-lessly” mixed area of Sinagua and Cohonina cul-tures. Information published by Parry (1981) aboutMedicine Valley settlement was not included in themetaanalytic data sets discussed above, because hereports ware-level data that combine decorated andutilitarian types. However, his information can berephrased to approximate the kind of data discussedhere by recalculating percentage values after delet-ing the Kayenta series pottery (most of which is deco-rated). Compared with the data sets discussedabove—which excluded decorated types (AppendixE, this volume)—that procedure probably inflatesthe percentage of San Francisco Mountain GrayWare because Deadmans Black-on-gray and FloydBlack-on-gray are included in the totals. The per-centages of San Francisco Mountain Gray Ware inthe best contexts reported by Parry (1981) (i.e., thosecontaining at least 100 sherds after the Kayenta se-ries material was deleted) are summarized in Table5.25. The precise, mapped location of sites representsan advantage of Parry's data over that reported here(Figure 5.6), because many of the current data setscould only be assigned to a section or a quarter sec-tion (see Appendix E).
Examination of Table 5.25 shows that Parry’sMedicine Valley data are very similar to that dis-cussed above. In the current data sets, 52 percent ofthe sites located in Medicine Valley contained at least60 percent San Francisco Mountain Gray Ware, while13 of the 22 data sets (59 percent) reported by Parry
contain those amounts. A statistical test of the rela-tionship between data set and gray ware amountshows there is no significant difference between thetwo data sets. The null hypothesis (H0) for this teststates that the frequency of sites with high and lowamounts of San Francisco Mountain Gray Ware isthe same in both data sets; the alternate hypothesis(H1) states that there is a significant difference. Uti-lizing a significance level of 0.05, a chi-square testof this relationship indicates the null hypothesisshould not be rejected (�2 = 0.196; df = 1; p = 0.658).
Similarly, 73 percent of the high gray ware siteswere found to have been occupied before the erup-tion of Sunset Crater, while 10 of the 13 sites (77percent) reported by Parry (1981) were occupiedbefore its eruption. A statistical test of the relation-ship between the data set and the number of highSan Francisco Mountain Gray Ware sites occupiedbefore and after the eruption of Sunset Crater showsthere is no significant difference between the twodata sets. The null hypothesis (H0) for this test statesthat the frequency of sites occupied before and afterSunset Crater’s eruption is the same in both data sets;the alternate hypothesis (H1) states that there is asignificant difference. Utilizing a significance levelof 0.05, a Fisher exact test (two-tail) of the relation-ship indicates the null hypothesis should not be re-jected ( p = 1.000).
It was suggested above that a simple distance-decay function, related to the distance of a site fromMedicine Fort, may explain the high percentage ofSan Francisco Mountain Gray Ware at sites locatedin Medicine Valley. Parry’s (1981) data support thatidea, because 78 percent of the nine sites locatedwithin 1.6 km of Medicine Fort contain at least 60percent San Francisco Mountain Gray Ware, whileonly 46 percent of the 13 sites located from 1.6 km
Table 5.24. Ethnographic cases of the distance traveled, by foot, to trade pottery.
Country Community/Group Distance (km) Reference
Distance potters travel to distribute
Ethiopia Gamo <1.0-18.0 Arthur 2006:Table 3.1
Ghana Begho 50.0-60.0 Crossland and Posnansky 1978:87
Ghana Shai 32.2 Quarcoo and Johnson 1968:66
India — 10.0-15.0 Kramer 1991:221-222
Kenya Luo 5.0 Dietler and Herbich 1994:466
Nigeria Yoruba 50.0-60.0 Beier 1980:48
Peru Aco 8.0 Hagstrum 1989:Table I.1
Peru Quicha Grande 12.0-13.0 Hagstrum 1989:Table I.1
Philippines Dalupa 4.0-5.0 Stark 1993:319
Distance consumers travel to acquire
Cameroon Faro area 15.0 Smith 2000:34
Cameroon Fulani 22.0 David and Hennig 1972:22
Kenya Luo 15.0 Dietler and Herbich 1994:466

Alameda Brown Ware and San Francisco Mountain Gray Ware Technology and Economics 179
to 3.2 km contains that amount. However, examina-tion of Parry’s data also suggests the presence of amore complex distance-decay function: sites locatedcloser to Medicine Wash, the small wash that flowsnortheast out of the valley (see Figure P.2, this vol-ume), contain higher percentages of San FranciscoMountain Gray Ware than sites located further fromthe wash (see Table 5.25). A Mann-Whitney U testwas conducted to verify that observation. The testcompared the distance to Medicine Wash of sites withhigh percentages of San Francisco Mountain GrayWare (>59.9 percent) and low percentages (<60.0 per-cent). The null hypothesis (H0) for this test states thatthe amount of San Francisco Mountain Gray Warerecovered from a site is unrelated to its distance fromMedicine Wash; the alternate hypothesis (H1) statesthat the amount is related. Utilizing a significancelevel of 0.05, the difference between the mean dis-tance of the two groups was found to be significant
(Table 5.26). That finding means that, in general, siteslocated closer to Medicine Wash do contain more SanFrancisco Mountain Gray Ware than sites locatedfurther from it.
Medicine Wash would have formed a naturaltransportation corridor for prehistoric inhabitants ofthe valley. Further, the trend of that wash—from itsorigin in Township 23 N, Range 7 E, Section 12 SW,to the point where it is no longer shown as a washon the O’Leary Peak USGS 7.5-minute quadranglein Township 24 N, Range 8 E, of Section 32 NE—isNorth 38.5 degrees East. Continuing northeast onthat bearing leads one to Township 24 N, Range 8E, Section 15, the section that contains DeadmansFort, NA 1765. Indeed, a straight line connectingthe two points described above leads one directly toDeadmans Fort. Therefore, Medicine Wash physi-cally, and perhaps symbolically (Liffman 2000), con-nected Medicine Valley (and, thus, Medicine Fort)
Table 5.25. Sites located in Medicine Valley where Parry (1981) collected at least 100 sherds. (Sites are ranked by percentage of San Francisco Mountain Gray Ware; percentages were recalculated from Parry [1981:Appendix A] after deleting Kayenta series types from the total; the percentage of San Francisco Mountain Gray Ware may include the decorated types Deadmans and Floyd Black-on-gray.)
AR-03-04-02 (CNF) Site Number
Distance to Medicine Wash (km)
Percent San Francisco Mountain Gray Ware Total Ceramics
Preeruption sites located in Medicine Valley
1588 1.14 38.5 122
1591 1.14 43.8 137
1629 0.94 43.9 196
1580a 0.22 49.6 115
1556b 0.47 50.5 309
1652 0.88 51.7 172
1558 0.20 55.1 1,033
1683 0.99 58.1 117
1634 0.28 62.3 5,263
1641c 0.31 66.3 344
1622 0.65 67.9 1,129
1582 0.31 74.6 114
1584 0.16 77.8 108
1632 0.05 82.3 361
1651 0.28 83.3 1,020
1577 0.83 84.1 258
1545 0.00 86.2 399
1565 0.46 97.7 391
Posteruption sites located in Medicine Valley
1656 0.60 50.5 465
1615 0.17 62.3 130
1646 0.15 69.8 504
1539d 0.20 76.7 2,051
aParry (1981:Figure 3) shows this site as 1579. bParry (1981:Figure 3) shows this site as 1656. cParry (1981:Figure 3) did not show this site’s location. dThis site (NA 18,625) was recollected during the U.S. 89 project.

180 Chapter 5
with Deadmans Fort, suggesting Deadmans Fortmay have acted as a tertiary node for San FranciscoMountain Gray Ware distribution.
The previous discussion leads to the conclusionthat, rather than being helplessly mixed, the Medicine
Valley data are highly structured. However, the In-dex Ware concept must be abandoned before thesepatterns are evident. Given the fact that San FranciscoMountain Gray Ware could not have been producedin Medicine Valley (see Chapter 4), its presence at
Table 5.26. Mann-Whitney U test comparing the distance of sites with high and low percentages of San Francisco Mountain Gray Ware to Medicine Wash.
San Francisco Mountain Gray Ware Sample Number
Mean distance to Medicine Wash (km)
Standard Deviation (km)
Mann-Whitney U test statistic Probability
Less than 60 percent San Francisco Mountain Gray Ware
9 0.731 0.370 – –
Greater than 60 percent San Francisco Mountain Gray Ware
13 0.296 0.233 98.5 0.007
Figure 5.6. Distribution of sites located in Medicine Valley discussed in the text (after Parry 1981:Figure 3).
U.S
.

Alameda Brown Ware and San Francisco Mountain Gray Ware Technology and Economics 181
any given site documents distribution, consumption,and discard behaviors—not acts of ceramic produc-tion. Therefore, San Francisco Mountain Gray Wareabundance alone cannot be used as a simple indexof a particular settlement’s cultural affiliation inMedicine Valley.
Summary
The direct and indirect evidence indicates Ala-meda Brown Ware production in the Flagstaff areawas specialized, and it also suggests manufactureoccurred part-time in dispersed households indepen-dent of elite control. All the U.S. 89 project sites whereAlameda Brown Ware is the dominant utilitarianware are located in the Sugarloaf Petrofacies, andmost lie south of the Coconino Divide. Eleven siteslocated in the Sugarloaf Petrofacies south of theCoconino Divide yielded all the unambiguous evi-dence for ceramic production recovered from theproject, including six pottery anvils and a raw claysample. All of those sites are located within 4.8 kmof the clay deposit located at the Clay House site.
From a regional perspective, the Alameda BrownWare type Rio de Flag Brown is abundant at siteslocated throughout the Flagstaff area prior to theeruption of Sunset Crater. The felsic volcanic sand-tempered types—Angell Brown, Winona Brown,and Turkey Hill Red—are relatively rare before theeruption of Sunset Crater, but are widespread afterthe eruption. Types tempered with mafic volcanicsand—Sunset Red/Brown, Elden Corrugated, andYoungs Brown—are also extremely rare before theeruption of Sunset Crater, and after the eruption,their highest frequencies occur at settlements locatedin mafic petrofacies.
The greatest concentration of Flagstaff area siteswith high percentages of San Francisco MountainGray Ware occurs in Medicine Valley and on theCoconino Plateau north of Medicine Valley. Mostof the high gray ware sites located in Medicine Val-ley were occupied before the Sunset Crater eruption,while most of the high gray ware sites located on theCoconino Plateau north of Medicine Valley were oc-cupied after the eruption. A Cohonina fort is locatedin Medicine Valley, and forts would have been excel-lent places to store vessels prior to distributing them.Most sites located within 1.6 km of Medicine Fortcontain a high percentage of San Francisco Moun-tain Gray Ware; however, sites located closer toMedicine Wash, a small drainage that flows north-east out of the valley, also contain high percentagesof San Francisco Mountain Gray Ware.
Finally, the index ware concept was addressed.Its assumption that abundance equals production,and therefore, cultural affiliation, confuses the act
of production with the act of consumption, and it isnot supported by many ethnological and archaeo-logical case studies. If the direct and indirect pro-duction evidence supports the hypothesis that apotter made a ware at a place, then, and only then,can that ware be used as an indicator of the potter’saffiliation without further qualification. Wheneverthe direct and indirect production evidence does notsupport the idea that a ware was produced at a place,the ware should be used cautiously, or not at all, asa cultural indicator. In those cases, the abundanceof a ware at a site may provide evidence regardinga potter’s seasonal round or migration, in which caseit could still be used as a legitimate indicator of thepotter’s culture. However, the abundance of a wareat a site also provides evidence regarding social andeconomic relationships among people belonging tothe same or different cultures; in the former case, itcould still be used as an indicator of cultural affilia-tion, while in the latter case, it could not be used.Deciding which of these hypotheses to accept as cor-rect would, almost certainly, require multiple, har-monious lines of evidence.
DISCUSSION
Flagstaff area archaeological sites can be charac-terized in many ways. Three dimensions of variabil-ity were focused on in this chapter: location, time,and dominant utilitarian ware (Table 5.27). The Co-conino Divide has been identified as the place in theU.S. 89 project area, and the greater Flagstaff areadatabase, where the proportion of a site’s utilitarianware changes from Alameda Brown Ware dominantto San Francisco Mountain Gray Ware dominant—regardless of whether the site was occupied beforeor after the eruption of Sunset Crater. Sites locatednorth of the Coconino Divide usually contain moreSan Francisco Mountain Gray Ware than AlamedaBrown Ware and have traditionally been called Co-honina, whereas sites south of the divide usuallycontain more Alameda Brown Ware than San Fran-cisco Mountain Gray Ware, and have traditionallybeen called Sinagua.
Petrographic analysis of wash sands and sandtempers indicates some of the Alameda Brown Waretypes—Rio de Flag Brown, Angell Brown, WinonaBrown, and, presumably, Turkey Hill Red—wereproduced in the area referred to in Figure 4.5 as theSugarloaf Petrofacies (K). That provenance assign-ment is supported by clay and ceramic paste oxida-tion data. The northern boundary of the SugarloafPetrofacies occurs north of the Coconino Divide (inMedicine Valley), while the southern boundary liesapproximately midway between the modern townof Fernwood and Elden Pueblo. All the best direct

182 Chapter 5
evidence for ceramic production recovered from U.S.89 project sites occurred at settlements located inthe Sugarloaf Petrofacies south of the Coconino Di-vide, and based on all lines of archaeological evi-dence currently available, it is inferred that the pot-ters who made the types listed above were part-time,household-level specialists living in dispersed settle-ments.
In contrast, the composition of wash sands col-lected from the petrofacies located north of the Co-conino Divide and north of the Sugarloaf Petrofaciesboundary do not correspond with the sand tempercomposition of any known ceramic type, particularlynot San Francisco Mountain Gray Ware. Therefore,the provenance evidence indicates the inhabitants ofsites located north of the Sugarloaf Petrofacies werenever intensive ceramic producers, although a fewpots were likely made in every settlement occasion-ally. Unfortunately, the source of San FranciscoMountain Gray Ware remains unknown. However,the abundance data suggest it may have been pro-duced somewhere in the area encompassed by RedLake, Mount Floyd, and the Grand Canyon Airport.
During occupation of the U.S. 89 project area, theeruption of Sunset Crater turned an area measuringsomewhere about 400 km2 into an unfertile, cinder-covered wasteland, at least until the ash erodeddown to the 10-15 cm level4. Although not all of thatarea was suitable for habitation, a large area likelyhad to be abandoned, at least temporarily, follow-ing the eruption.
Elson et al. (2002) have argued that the most par-simonious explanation for Colton’s (1946, 1949) landrush into the Deadman Wash area north of the Co-conino Divide, or Downum and Sullivan’s (1990)
population increase at Wupatki National Monument,is that those areas were largely settled by peopleforced to leave the >30-cm-deep ash zone after theSunset Crater eruption. Accordingly, contrary to pre-vious models, an extensive outside migration of Co-honina people into the Deadman Wash area is un-necessary to populate this zone (Elson et al. 2002).People from the ash fall zone also likely moved south,to the Winona and Ridge Ruin area, to the east andto the west, but the huge area that would have neededto be abandoned—which is roughly three times thearea encompassed by Wupatki National Monument—could have easily supplied the population for all ofthese areas. Additionally, some Cohonina people alsoprobably moved into the Deadman Wash area to takeadvantage of newly fertile lands, but they probablydid not comprise the majority of the population.
The question then remains, why do many settle-ments located north of the Coconino Divide containso much San Francisco Mountain Gray Ware pottery
Table 5.27. Summary of important dimensions of variability in Flagstaff area utilitarian ceramic collections. (Median percentage values are reported.)
Time
Preeruption Posteruption
Location Relative to the Coconino Divide
Flagstaff Subarea
Number of Data Sets
Alameda Brown Ware
San Francisco Mountain Gray Ware
Other Utilitarian Ware
Alameda Brown Ware
San Francisco Mountain Gray Ware
Other Utilitarian Ware
North North of Medicine Valley
9 19.7 55.8 0.6 – – –
18 – – – 14.5 51.3 26.6
Medicine Valley 14 28.5 63.4 13.1 – – –
7 – – – 22.2 59.8 10.7
South Sugarloaf Petrofacies
10 52.3 35.0 7.7 – – –
7 – – – 58.2 28.1 14.6
Other site 22 70.0 17.4 10.4 – – –
29 – – – 88.7 0.9 6.9
4The 400 km2 is the area covered by >30 cm of volcanicash and cinders (see Elson et al. 2006:Figure 2.14) thatalmost certainly became infertile and had to be aban-doned following the eruption. Using 30 cm to demar-cate the abandonment area is conservative, because ex-perimental data (Colton 1965; Maule 1963; Waring 2007)and data from modern eruptions (Rees 1979) indicatethat most crops, but particularly corn, are severely im-pacted when ash and cinders are deeper than 15-20 cm.The 400 km2 also represents a minimum area becausecinder depth measurements used in constructing the iso-pach map were taken after approximately 900 years oferosion (Hooten et al. 2001), and this area was likely sig-nificantly larger in the period immediately following theeruption.

Alameda Brown Ware and San Francisco Mountain Gray Ware Technology and Economics 183
if the people living there were not Cohonina? First,the direct and, especially, the provenance evidenceindicates people living north of the Coconino Dividewere always primarily pottery consumers, not pot-tery producers. Therefore, even before the SunsetCrater eruption, they were importing San FranciscoMountain Gray Ware, Alameda Brown Ware,Tusayan White and Gray Ware, Tsegi Orange Ware,and San Juan Red Ware. Second, the eruption dis-rupted, at least temporarily, the production of Ala-meda Brown Ware ceramics. Isopach mapping of ashthickness shows that about half the Sugarloaf Petro-facies, and presumably, ceramic production sites aswell as clay and temper resources, was buried un-der 10-40 cm of volcanic ash (Hooten et al. 2007:Fig-ure 2). The pass over the Coconino Divide (whichU.S. 89 follows) was also covered by 30-60 cm of cin-ders, which likely restricted movement over it, atleast temporarily. While these factors hindered thedistribution of San Francisco Mountain Gray Wareto consumers south of the Coconino Divide, it didnot affect the importation of San Francisco Moun-tain Gray Ware by those living at settlements to thenorth. Accordingly, the amount of San FranciscoMountain Gray Ware recovered from sites locatedin the Deadman Wash area increased (incrementally)immediately after the eruption of Sunset Crater,while the amount of San Francisco Mountain GrayWare coming into sites located south of the CoconinoDivide declined.
Finally, the greatest concentration of settlementsyielding relatively high amounts of San FranciscoMountain Gray Ware occurs in Medicine Valley, andfollowing Parry (1981), it has been argued here thatSan Francisco Mountain Gray Ware may have beenstored at, and distributed from, Medicine Fort. Acomplex distance-decay relationship involving bothdistance from the fort and distance from the smallwash (Medicine Wash) that drains Medicine Valleyto the northeast was documented, which showedthat settlements located close to the fort and/or washcontained more San Francisco Mountain Gray Warethan those located farther from them. Regardless ofcultural affiliation, people living close to MedicineFort would have found it to be a ready source ofgray ware pottery and could have exchanged foodor other ordinary goods for pottery. Some of thosepeople may have been Cohonina who established ahome for themselves near the fort, or married into asettlement located close to it.
Based on surface remains, five settlements lo-cated in Medicine Valley appear to be particularlystrong candidates for having contained Cohoninahouseholds. Sites NA 2001A and AR-03-04-02-1565(CNF) contain percentages of San Francisco Moun-tain Gray Ware similar to those documented in theCohonina heartland (96.2 percent and 97.7 percent,
respectively). Site AR-03-04-02-1651 (CNF) containsa relatively high percentage of San Francisco Moun-tain Gray Ware (83.3 percent) and displays a dis-tinctively Cohonina architectural style known as apatio house (McGregor 1951), although this archi-tectural style is not currently well-defined. Based onthose two measures, it appears to be another strongcandidate for having contained a Cohonina house-hold. Finally, the Medicine Jar site, AR-03-04-02-2567 (CNF), contains a relatively high percentageof San Francisco Mountain Gray Ware (75.4 percent)and displays a typically Cohonina room-block ar-chitectural style (Dosh 1998:50); based on those twomeasures, it appears to be a fifth strong candidatefor having contained a Cohonina household.
Four settlements located north of Medicine Val-ley also seem to be possible candidates, based onsimilar measures. Two of the Baker Ranch sites,NA 2797 and NA 2798, contain percentages of SanFrancisco Mountain Gray Ware similar to thosedocumented in the Cohonina heartland (91.0 per-cent and 97.4 percent, respectively). Two sites exca-vated during the U.S. 89 project may also representCohonina habitations. The Seven site, NA 25,777, isa small room-block and pithouse habitation, and ityielded 77.4 percent San Francisco Mountain GrayWare. Finally, the Homestead site, NA 181, is a largeroom-block and pithouse habitation site, and ityielded 67.6 percent San Francisco Mountain GrayWare. However, it must be noted that analysis ofthe flaked stone, ground stone, faunal, and botani-cal remains from the Seven and Homestead sitesfound little to distinguish them from other U.S. 89project area sites.
In conclusion, the technological and composi-tional data discussed in this chapter provide littleinformation bearing on the cultural or ethnic dis-tinctiveness of Alameda Brown Ware and San Fran-cisco Mountain Gray Ware producers. The resourcesused to make the two wares vary, although the tech-nology used to produce both wares is similar. Thepotters who made both wares used the same sec-ondary forming and thinning technique (paddle andanvil), and they fired their pots under conditions thatare best described as unoxidizing to incompletelyoxidizing. Here, and in Chapter 4, it has been shownthat the composition of Alameda Brown Ware andSan Francisco Mountain Gray Ware pottery ex-presses different clay and temper resources used bypeople who manufactured pottery within and out-side the U.S. 89 project area. All the evidence currentlyavailable indicates most San Francisco MountainGray Ware recovered from sites located in the Flag-staff area resulted from trade, although some siteslocated north of the Coconino Divide may have beenoccupied by Cohonina migrants, either permanentlyor as part of a seasonal round.