Ajinomoto - I3investor
18
12 February 2018 Affin Hwang Investment Bank Bhd (14389-U) www.affinhwang.com Page 1 of 18 A well-seasoned company We initiate on Ajinomoto Malaysia with a HOLD and TP of RM20.30 based on 20x FY19E PE. Ajinomoto is a manufacturer of monosodium Glutamate (MSG) and other flavored seasonings. We like it for its brand name and its dominant share in Malaysia. While Malaysia market’s growth is supported by urbanization, we think its focus on exports, especially to the Middle East provides exciting growth opportunities. Ajinomoto- a market leader with trusted brand name Established in 1961, Ajinomoto Malaysia is a leading Monosodium Glutamate (MSG) producer with 80% market share in Malaysia. Approximately 73% of sales are derived from the consumer segment, which include MSG products and flavoured seasonings. The remainder comes from the industrial segment whereby Ajinomoto sells functional savoury seasoning products to processed food producers. Commendable track record in Malaysia Ajinomoto Malaysia’s sales in Malaysia has grown at a CAGR of 5.3% over FY09-17, which is in tandem with the growth rate of F&B establishments and processed food sales volume. Despite dominant market share of over 80% in MSG, we believe there is growth opportunities for Ajinomoto, forecasting its sales to grow at 5% CAGR over FY17-22E. This is on the back of more product offerings as the flavoured seasonings’ market is still fragmented and enjoys higher growth rate. Growing demand for processed food and growing F&B food service should also support its growth. Promising outlook in export sales Overseas sales accounted for 40% of total sales in FY17 and its products are mainly exported to Middle East and the Asia region. We are positive on the export outlook as MSG consumption in Asia is expected to grow by 4.1% p.a. over the next 2-3 years. Ajinomoto’s “halal” certified product status will be an added advantage, shortening the export lead time to the Middle East. Initiate coverage with a HOLD rating and TP of RM20.30 We initiate coverage with a HOLD rating and TP of RM20.30 based on 20x FY19E PE. We think that with estimated earnings growth of 13% per annum for FY17-22E and dividend yield of 2.3-2.8%, the current share price is fairly valued and it is in line with valuations of Malaysia’s F&B consumer space. Downside risks include price competition, substitution risk, and cost risks. Earnings & Valuation Summary FYE 31 March 2016A 2017A 2018E 2019E 2020E Revenue 400.2 419.9 452.0 487.2 525.6 EBITDA 59.4 70.5 72.6 82.3 87.8 Pretax profit 53.9 211.5 73.4 82.1 88.1 Net profit 40.8 187.5 55.0 61.6 66.1 EPS(RM) 0.67 3.08 0.90 1.01 1.09 PER 29.2 6.4 21.7 19.3 18.0 Core net profit 43.8 42.1 55.0 61.6 66.1 Core EPS(RM) 0.72 0.69 0.90 1.01 1.09 Core EPS growth(%) 46.5 (3.9) 30.7 12.0 7.3 Core PER 27.2 28.3 21.7 19.3 18.0 Net DPS(RM) 0.34 1.55 0.45 0.51 0.54 Dividend Yield(%) 1.7 7.9 2.3 2.6 2.8 EV/EBITDA 17.3 15.1 15.2 13.0 11.9 ROE(%) 13.3 39.5 12.6 13.1 13.1 ROA(%) 11.1 35.2 11.0 11.5 11.4 Debt to equity(x) Net cash Net cash Net cash Net cash Net cash BPS(RM) 5.06 7.81 7.16 7.72 8.30 PBR(x) 3.9 2.5 2.7 2.5 2.4 Chg in EPS (%) - - - Affin/Consensus (x) n.a. n.a. n.a. Source: Company, Affin Hwang estimates Initiate coverage Ajinomoto AJI MK; AJI Sector: Consumer RM19.62 @ 9 Feb 2018 KLCI: 1841.02 HOLD Upside: 3% Price Target: RM20.30 Previous Target: - Price Performance 1M 3M 12M Absolute -4.7% 7.7% 47.3% Rel to KLCI -5.7% 2.6% 35.4% Stock Data Issued shares (m) 60.8 Mkt cap (RMm)/(US$m) 1212.3/310.5 Avg daily vol - 6mth (m) 0.0 52-wk range (RM) 13.42-25.21 Est free float 43.8% BV per share (RM) 6.67 P/BV (x) 2.99 Net cash/ (debt) (RMm) 263 ROE (2018E) 13% Beta -0.04 Derivatives Nil Shariah Compliant YES Key Shareholders AJINOMOTO CO INC 50.1% FMR LLC 5.1% CREDIT SUISSE 2.5% Source: Affin Hwang, Bloomberg Tan Jun Zhang, CFA (603) 2146 7487 [email protected] www.bursamids.com 1500 1550 1600 1650 1700 1750 1800 1850 1900 2.50 7.50 12.50 17.50 22.50 27.50 Oct-14 Mar-15 Aug-15 Jan-16 Jun-16 Nov-16 Apr-17 Sep-17 Feb-18 (RM) AJI MK EQUITY KLCI
-
Upload
khangminh22 -
Category
Documents
-
view
11 -
download
0
Transcript of Ajinomoto - I3investor

12 February 2018
Affin Hwang Investment Bank Bhd (14389-U) www.affinhwang.com Page 1 of 18
A well-seasoned company We initiate on Ajinomoto Malaysia with a HOLD and TP of RM20.30
based on 20x FY19E PE. Ajinomoto is a manufacturer of monosodium
Glutamate (MSG) and other flavored seasonings. We like it for its brand
name and its dominant share in Malaysia. While Malaysia market’s
growth is supported by urbanization, we think its focus on exports,
especially to the Middle East provides exciting growth opportunities.
Ajinomoto- a market leader with trusted brand name
Established in 1961, Ajinomoto Malaysia is a leading Monosodium
Glutamate (MSG) producer with 80% market share in Malaysia.
Approximately 73% of sales are derived from the consumer segment, which
include MSG products and flavoured seasonings. The remainder comes
from the industrial segment whereby Ajinomoto sells functional savoury
seasoning products to processed food producers.
Commendable track record in Malaysia
Ajinomoto Malaysia’s sales in Malaysia has grown at a CAGR of 5.3% over
FY09-17, which is in tandem with the growth rate of F&B establishments and
processed food sales volume. Despite dominant market share of over 80%
in MSG, we believe there is growth opportunities for Ajinomoto, forecasting
its sales to grow at 5% CAGR over FY17-22E. This is on the back of more
product offerings as the flavoured seasonings’ market is still fragmented and
enjoys higher growth rate. Growing demand for processed food and growing
F&B food service should also support its growth.
Promising outlook in export sales
Overseas sales accounted for 40% of total sales in FY17 and its products
are mainly exported to Middle East and the Asia region. We are positive on
the export outlook as MSG consumption in Asia is expected to grow by 4.1%
p.a. over the next 2-3 years. Ajinomoto’s “halal” certified product status will
be an added advantage, shortening the export lead time to the Middle East.
Initiate coverage with a HOLD rating and TP of RM20.30
We initiate coverage with a HOLD rating and TP of RM20.30 based on 20x
FY19E PE. We think that with estimated earnings growth of 13% per annum
for FY17-22E and dividend yield of 2.3-2.8%, the current share price is fairly
valued and it is in line with valuations of Malaysia’s F&B consumer space.
Downside risks include price competition, substitution risk, and cost risks.
Earnings & Valuation Summary
FYE 31 March 2016A 2017A 2018E 2019E 2020E Revenue 400.2 419.9 452.0 487.2 525.6 EBITDA 59.4 70.5 72.6 82.3 87.8 Pretax profit 53.9 211.5 73.4 82.1 88.1 Net profit 40.8 187.5 55.0 61.6 66.1 EPS(RM) 0.67 3.08 0.90 1.01 1.09 PER 29.2 6.4 21.7 19.3 18.0 Core net profit 43.8 42.1 55.0 61.6 66.1 Core EPS(RM) 0.72 0.69 0.90 1.01 1.09 Core EPS growth(%) 46.5 (3.9) 30.7 12.0 7.3 Core PER 27.2 28.3 21.7 19.3 18.0 Net DPS(RM) 0.34 1.55 0.45 0.51 0.54 Dividend Yield(%) 1.7 7.9 2.3 2.6 2.8 EV/EBITDA 17.3 15.1 15.2 13.0 11.9 ROE(%) 13.3 39.5 12.6 13.1 13.1 ROA(%) 11.1 35.2 11.0 11.5 11.4 Debt to equity(x) Net cash Net cash Net cash Net cash Net cash BPS(RM) 5.06 7.81 7.16 7.72 8.30 PBR(x) 3.9 2.5 2.7 2.5 2.4 Chg in EPS (%) - - - Affin/Consensus (x) n.a. n.a. n.a.
Source: Company, Affin Hwang estimates
Initiate coverage
Ajinomoto AJI MK; AJI Sector: Consumer
RM19.62 @ 9 Feb 2018 KLCI: 1841.02
HOLD Upside: 3%
Price Target: RM20.30 Previous Target: -
Price Performance
1M 3M 12M Absolute -4.7% 7.7% 47.3% Rel to KLCI -5.7% 2.6% 35.4%
Stock Data
Issued shares (m) 60.8 Mkt cap (RMm)/(US$m) 1212.3/310.5 Avg daily vol - 6mth (m) 0.0 52-wk range (RM) 13.42-25.21 Est free float 43.8% BV per share (RM) 6.67 P/BV (x) 2.99 Net cash/ (debt) (RMm)
(3Q17)
263 ROE (2018E) 13% Beta -0.04 Derivatives Nil Shariah Compliant YES
Key Shareholders
AJINOMOTO CO INC 50.1% FMR LLC 5.1% CREDIT SUISSE 2.5%
Source: Affin Hwang, Bloomberg
Tan Jun Zhang, CFA (603) 2146 7487
www.bursamids.com
1500
1550
1600
1650
1700
1750
1800
1850
1900
2.50
7.50
12.50
17.50
22.50
27.50
Oct-14 Mar-15 Aug-15 Jan-16 Jun-16 Nov-16 Apr-17 Sep-17 Feb-18
(RM)AJI MK EQUITY KLCI

12 February 2018
Affin Hwang Investment Bank Bhd (14389-U) www.affinhwang.com Page 2 of 18
Company Background
Ajinomoto Malaysia began its business operations as a Monosodium
Glutamate (MSG) producer since 1961, carrying the trusted household
brand name of AJI-NO-MOTO and growing into a market leader with
dominant market share of over 80%. With its own sales force to reach its
customers directly, Ajinomoto Malaysia currently has 8 branches in
Peninsular Malaysia, 2 branches in East Malaysia and 1 sales office in Saudi
Arabia to deliver its products to customers. It plans to open more branches
should the need arises. As at end of FY17, Malaysia is the main market
which accounts for 60% of sales, followed by 14% in Middle Eastern region
and the remaining 25% in other Asian countries.
Fig 1: Sales breakdown by geography (FY17)
Source: Company
Fig 2: Sales breakdown by segment
Source: Company
Ajinomoto Japan is the largest shareholder with a 50.1% stake in the
company currently. Ajinomoto Malaysia serves as one of production hubs in
ASEAN region of the Group. Over the past decades, Ajinomoto Malaysia
has increased its product portfolio gradually and its two core business
segments can be categorized under Consumer Business and Industrial
Business (Fig 2);
Consumer Business
The Consumer Business segment consists of the manufacture and
distribution of consumer products, such as “AJI-NO-MOTO” MSG, flavour
seasoning “Tumix”, menu seasoning “Seri Aji”, other seasonings “Aji-Shio”,
“Aji-Mix” and sweetener PalSweet. “AJI-NO-MOTO” MSG is the main
revenue contributor of this segment. Given that the MSG market is matured
in Malaysia and Ajinomoto commands a lion share, we estimate “AJI-NO-
MOTO” MSG to grow at low-to-mid-single digit over the next few years.
While flavoured seasoning contribution is relatively small compared to “AJI-
NO-MOTO” MSG, its growth rate is stronger due to the growing demand on
the product underpinned by urbanization in Malaysia.

12 February 2018
Affin Hwang Investment Bank Bhd (14389-U) www.affinhwang.com Page 3 of 18
Industrial Business
In this segment, Ajinomoto offers a wide range of functional savory
seasoning products known as “TENCHO” which are mainly used by
industrial producers in processed food, such as instant noodle, seasoning,
snack food, and sauce. The growth in this segment is mainly driven by the
growth of the processed food industry.
Fig 3: Products of consumer business segment
Source: Company
Fig 4: Products of industrial business segment
Source: Company
Fig 5: SWOT analysis Strength
Established brand with dominant market shares
Cost advantage due to its scale of economies,
leading to better bargaining power on both
suppliers and buyers
Comprehensive product portfolio in seasonings.
Weakness
High concentration of sales in seasoning
products.
Although Ajinomoto has dominant market
shares in MSG, the market for flavour
seasoning is relatively more fragmented with
more intense competition
Heavy reliance on advertising may result in
high marketing expenses.
Opportunity
Steady growth in MSG and flavoured seasoning
products due to urbanisation.
Export opportunities in Asian countries
Obtained Halal certification to export to Muslim
countries
Threats
Rising health awareness limits growth
Competition

12 February 2018
Affin Hwang Investment Bank Bhd (14389-U) www.affinhwang.com Page 4 of 18
What is MSG?
“AJI-NO-MOTO” MSG was the world’s first umami seasoning introduced by
Kikunae Ikeda in 1909 after he uncovered umami taste. It is currently sold
in more than 100 countries and used widely in homes, restaurants and
processed foods. Monosodium glutamate (MSG) is sodium salt of glutamic
acid. Glutamic acid is commonly found in the natural protein of vegetables,
meat, fish, poultry and human breast milk. Tomato, cheese and fermented
soy products also contain free glutamate. MSG is made through the process
of fermentation of raw materials such as cane molasses, sugar beets, corn
and tapioca starch using microbe known as Corynebacterium glutamicum.
Food processors generally use MSG to provide umami (savory taste) to
enhance food flavour. Umami is one of the 5 basic tastes, together with
sweetness, sourness, bitterness, and saltiness. MSG can be found in
canned soups, ready-to-eat food packets, instant noodles, ketchups, and
canned food. Hence, the growth of processed food is one of the key drivers
of MSG. Also, note that F&B establishments in food service sector use MSG
and the growing food service boost demand for MSG as well.
Fig 6: Production process of MSG
Source: Company

12 February 2018
Affin Hwang Investment Bank Bhd (14389-U) www.affinhwang.com Page 5 of 18
Ajinomoto- a market leader with trusted brand name
Based on Ajinomoto Japan’s annual report, the Group maintained leading
global market share of c. 22% in MSG as at end of FY16. It currently holds
the dominant market share in seasonings and dry savories market in many
countries. The Group intends to solidify its position by refining the quality
and strengthening the production of existing products along with an active
creation of new product lines.
Price maker rather than taker
In Malaysia, management guided that it currently holds more than 80%
share in the MSG market. Being a market leader, we believe this provides
cost advantages to Ajinomoto as it can have better bargaining power on both
suppliers and buyers. For instance, we understand that Ajinomoto Malaysia
increased selling prices by c.4% in September 2017 to pass on the rising
costs, but this was well received without much impact on sales.
Fig 7: Leading market shares in many countries
Source: Company

12 February 2018
Affin Hwang Investment Bank Bhd (14389-U) www.affinhwang.com Page 6 of 18
Malaysia: more room for growth
Ajinomoto Malaysia’s sales in Malaysia has grown at a CAGR of 5.3% over
FY09-17 with over 80% market share in MSG. Nevertheless, we believe that
the Malaysian market still presents growth opportunities for Ajinomoto. We
are forecasting Ajinomoto’s sales in Malaysia to grow at a 5% CAGR over
FY17-22E.
Fig 8: Sales in Malaysia has grown at a CAGR of 5.3%
Source: Company, Affin Hwang forecast
More product offering
Although Ajinomoto Malaysia dominates the MSG market, the flavored
seasonings’ market is relatively more fragmented with more brands
available in the market, such as Adabi, Nestle’s Maggi, Mak Nyonya,
Unilever’s Knorr and others. Notwithstanding this, management sees
stronger growth in its flavored seasonings than MSG as the latter is matured
in Malaysia. Also, note that these products also have higher ASP of RM3-
6/packet compared to a bottle of MSG that can last for months.
Ajinomoto Malaysia intends to capture the growing market through portfolio
reinforcement. Going forward, Ajinomoto will continue to refine its existing
products’ quality and introduce new flavored seasonings to the market.
Under the Consumer business segment, we forecast “AJI-NO-MOTO” MSG,
the major revenue contributor, to grow steadily in tandem with the market at
low-to-mid-single digit while flavored seasonings to grow at high-single digit.

12 February 2018
Affin Hwang Investment Bank Bhd (14389-U) www.affinhwang.com Page 7 of 18
Steady growth in F&B establishment
On the back of urbanization, Malaysian’s eating patterns have shifted to
favor convenience-oriented and time-saving options. This helps to boost the
demand for the overall F&B industry. Drive-through, takeaway and home-
delivery are on rising trend that benefits foodservice sector as well.
According to the Department of Statistic Malaysia, the census result showed
that there were 167,490 establishments operating in F&B services in 2015
compared to 130,570 establishments in 2010, representing CAGR of 5.1%.
Also, the value of gross output generated by F&B services grew at CAGR of
12% over the same period, reaching RM 66.4b in 2015. We believe that
these positive data are supportive Ajinomoto’s sales in Malaysia.
Fig 9: Steady growth in F&B to support the MSG consumption
Source: Department of Statistics Malaysia
Growth outlook for packaged food
Similarly, hectic lifestyles also shift consumers’ preference towards
processed food. Processed food industry growth should be well-supported
given the expansion of middle class and increase in disposable income
levels. According to Euromonitor, Malaysia’s packaged food volume is
projected to grow at 3.9% CAGR over 2016-2021. Given that MSG is usually
one of the main ingredients in processed food, we believe this should sustain
Ajinomoto’s growth in the coming years.

12 February 2018
Affin Hwang Investment Bank Bhd (14389-U) www.affinhwang.com Page 8 of 18
Overseas markets look promising
Over 2009-17, Ajinomoto Malaysia’s overseas sales have grown from
RM78m to RM168m, representing a CAGR of 10%. Its products are
exported mainly to Middle East and Asia region, accounting for 14% and
25% of total sales respectively as at end of FY17. Sales contribution outside
of Malaysia was c. 40% as at end of FY17 and we project its contribution to
rise to c. 50% within next 5 years.
Fig 10: Ajinomoto Malaysia's market presence
Source: Company
Fig 11: Forecasting increased contribution of export sales
Source: Company, Affin Hwang estimates
Fig 12: Forecasting 12% CAGR over FY17-22
Source: Company, Affin Hwang estimates

12 February 2018
Affin Hwang Investment Bank Bhd (14389-U) www.affinhwang.com Page 9 of 18
Potential of MSG market in Asia
Based on HIS Markit’s report dated Aug 2015, the world consumption of
MSG was estimated to be 3.2m metric tons and valued at USD4.5bn in 2014.
Asia was the biggest consumer that took up 88% of world MSG
consumption, with China alone accounted for 55% of world consumption.
MSG consumption in Asia was projected to grow at CAGR 4.1% to reach
3.9m metric tons by 2019, led by demand growth in China, Indonesia,
Vietnam, and Thailand. We believe that steady growth of demand in Asia
region is favorable to Ajinomoto Malaysia as all of its sales are
predominantly in Asia.
Fig 13: Demand for MSG mainly from Asia
Source: IHS
Where is the demand coming from?
While higher MSG consumption in Asia region is probably due to better
reception of Asians towards umami taste and its longer engrained influence
in Asian cuisine, we believe urbanization in Asia is a key factor driving the
MSG consumption growth. Busier lifestyles, convenience-seeking, and
changes in dietary patterns are some of by-products of urbanization that
leads to increasing income/capita and expansion of middle class. Hence, we
see increasing demand for processed and convenience foods that stimulate
the consumption of MSG.
Halal certification- an added advantage
According to Asia & Middle East Food Trade Journal (AMEFT), the market
for savory ingredients, such as MSG and flavored seasonings, are growing
at 2%-4% CAGR in Middle East. The demand is mainly underpinned by the
dominance of the meat consumption and preference of savory ingredients
to enhance the umami and meaty flavor profiles.

12 February 2018
Affin Hwang Investment Bank Bhd (14389-U) www.affinhwang.com Page 10 of 18
Halal certified food products are mandatory in the food sector in most Middle
East countries due to the dominance of the Muslim population. Being one of
the Halal production hubs for the Ajinomoto Group with its halal products
certified by Malaysian Islamic Development Department (JAKIM), we
believe that Ajinomoto Malaysia is well positioned to benefit from the
growing food sector in Middle East.
During end of 2017, Ajinomoto Malaysia has been added in to the “white list”
company by JAKIM. This should shorten its Halal certification process from
around 5 months to 1-2 months. Given the positive outlook of the Middle
East market, we are looking at 15-20% annual growth in the next 5 years for
Ajinomoto Malaysia’s sales to the region.
Future growth catalyst: Frozen food
On top of seasoning products which Ajinomoto Malaysia currently
dominates, the company intends to expand vertically into frozen food due to
its higher value add. We understand that Ajinomoto Japan currently has
existing products, such as Chinese dumplings, Gyoza. Kara-age, and Gyu
Beef in other countries. Therefore, we believe that Ajinomoto Malaysia can
tap into the Group’s resources and introduce frozen foods into the Malaysia
market.
Figure 14: Ajinomoto's frozen food sold outside of Malaysia
Source: Company
According to management, it targets frozen food to contribute 9% of total
sales by FY25 to diversify away from seasoning products. However, we
understand that Ajinomoto is still exploring the market potential and it is
unlikely to have material contribution in the next few years. Therefore, we
have not factored in the contribution of frozen food into our forecast, but it
can be additional earnings catalyst in future years.

12 February 2018
Affin Hwang Investment Bank Bhd (14389-U) www.affinhwang.com Page 11 of 18
Negative perception on MSG For decades, misconception that MSG consumption is harmful has been a
major setback for the MSG industry. MSG is commonly linked to cause
various health issues, such as headaches, numbness of body, breathing
difficulties and dizziness. As a result, we see an increased consumer
preference to abstain from artificial ingredients especially in developed
countries, such as the U.S. and Canada. The “NO MSG” label has been
increasingly noticeable in processed food and even some restaurants, which
promote it in their food menus. The rising health awareness and
misconception on MSG may put a dent on MSG’s long term growth rate.
Debunking the myth
In 1968, an American physician Robert Ho reported that he experienced
numbness, weakness and heart palpitations after eating in a Chinese
restaurant. He wrote an article in the New England Journal of Medicine
claiming that MSG was the cause, coining the term famously known as
“Chinese restaurant syndrome”.
Over the years, numerous rigorous scientific studies have disproved the
claim and clinical trials have failed to prove consistent relationship between
the consumption of MSG and the negative syndromes. The Food and Drug
Administration (FDA) and other scientific and regulatory bodies around the
world have confirmed MSG’s safety. FDA has even classified MSG as
“Generally Recognized As Safe” (GRAS), right along with sugar, baking
powder, salt, and pepper. Likewise, the World Health Organization (WHO)
has chosen not to set a limit on the Acceptable Daily Intake (ADI) of MSG,
classifying it as “not specified”
Fig 15: Conclusion of safety about MSG by public institution 1958 FDA designates MSG as “Generally Recognized as Safe”
1979 National Academy of Science in US confirms MSG is safe as a food ingredient
1987 Joint FAO/WHO Expert Committee on Food Additives places MSG in the
safest category for food additives
1991 European Community's Scientific Committee for food confirm safety of MSG
1992 American Medical Association concludes normal MSG levels in diet are safe
1995 FDA reaffirm MSG is safe upon a report from the Federation of American
Societies of Experimental Biology
2003 Food and Standards Australia New Zealand declared MSG is safe Source: Company
Impact on Ajinomoto Malaysia
Although rising health awareness could put pressure on the growth of MSG,
we do not expect it to impact Ajinomoto Malaysia’s sales in the coming
years. This is because MSG is still a cheap and effective source of flavor
enhancer. We do not foresee it to be completely replaced. Moreover, higher
consumption of MSG in Asia and urbanization should drive the projected
volume growth of 4.1% CAGR in the region, benefitting Ajinomoto
Malaysia’s export sales. Whereas in Malaysia, Ajinomoto Malaysia actively
organizes campaigns to raise public awareness and correct the
misunderstanding about MSG. We believe this should support the local
sales of its seasoning products.

12 February 2018
Affin Hwang Investment Bank Bhd (14389-U) www.affinhwang.com Page 12 of 18
Financial Analysis and Forecasts
Steady revenue and earnings growth
We estimate Ajinomoto Malaysia’s revenue CAGR of 8% over FY17-22E,
underpinned by stronger sales of flavored seasonings while its core product
MSG continues to grow at c. mid-single digit. Based on Ajinomoto Japan,
international food products in Asia region are projected to grow at low teens.
Ajinomoto Malaysia targets to hit total sales of RM1bn in FY25, implying a
CAGR of 11%. We are fairly comfortable with our forecast as it is consistent
with the management’s view.
Fig 16: Projecting 8% CAGR for revenue over FY17-22E
Source: Company, Affin Hwang estimates
Solid execution leads to margin improvement Ajinomoto Malaysia’s EBIT margin has improved from 8.6% in FY09 to 14%
in FY17. We believe that this is attributable to the economies of scale and
company’s effort to increase production efficiency. We believe that raw
materials and packaging cost are the key cost components with tapioca
starch and cane molasses being key raw ingredients. We understand that
these raw materials are generally abundant and inexpensive, which we think
explains the gross margin has been on uptrend.
Fig 17: Ajinomoto's EBIT margin
Source: Company, Affin Hwang estimates

12 February 2018
Affin Hwang Investment Bank Bhd (14389-U) www.affinhwang.com Page 13 of 18
Minimal impact on currency movement According to Ajinomoto Malaysia’s annual reports, the company generally
benefits from strengthening of RM against USD given that imported raw
materials are in USD. However, the impact is negligible as we estimate 4%
strength in RM against USD only leads to 1% increase in net profit.
According to management, the company is neutral to RM movement as its
exports act as a natural hedge for its imported raw materials.
One-off gain in FY17
On 28 May 2016, the company announced on the Kuala Lumpur
Administrator’s intention to hold a land inquiry pertaining to the said
compulsory acquisition for “Projek Mass Rapid Transit” (MRT Project). The
company had accepted and received the award of compensation of
RM166m in FY17 from the Government for the compulsory acquisition of its
factory land located in Jalan Kuchai Lama for the MRT 2 project. The
compensation generated a one-off gain on disposal of RM145m. The
disposal of land does not affect its business operation.
Fig 18: Projecting 14% core net profit CAGR over FY17-22E
Source: Company, Affin Hwang estimates

12 February 2018
Affin Hwang Investment Bank Bhd (14389-U) www.affinhwang.com Page 14 of 18
Strong net cash position, with manageable capex Ajinomoto Malaysia is currently in a net cash position and has practically no
borrowings (current net gearing is -65%). We expect the cash position will
likely strengthen further from the current level of RM263m (including
investment securities in current assets). The plant utilization is at 70%-80%
and there is no plan to construct any additional plants in the near term.
Capex is guided to be around RM15m per year for upgrades and
maintenance. Based on our forecast of RM60-70m cash flow generated from
operation and annual capex of RM15m, Ajinomoto Malaysia will likely
generate RM40-50m free cash flow per year.
Dividend policy
Ajinomoto’s dividend policy is to distribute 40%-50% of its earnings and it
has consistently paid around 50% over the past 2 years. In FY17, Ajinomoto
announced a final and a special dividend totaling RM1.55/share in May to
reward its shareholder. Of the RM166m compensation it receives from
Government, c. RM90m was paid out as special dividend. Ajinomoto
Malaysia currently has no plan on the deployment of remaining cash. But
with such strong balance sheet, we think it is likely for Ajinomoto to
announce a special dividend or invest resources into frozen food products
in the future. We assume that Ajinomoto will maintain its dividend payout
ratio at 50%, implying 2%-3% dividend yield for FY18E-20E.
Fig 19: Assuming a 50% payout ratio given its strong balance sheet position
Source: Company, Affin Hwang estimates
12 February 2018
Affin Hwang Investment Bank Bhd (14389-U) www.affinhwang.com Page 15 of 18
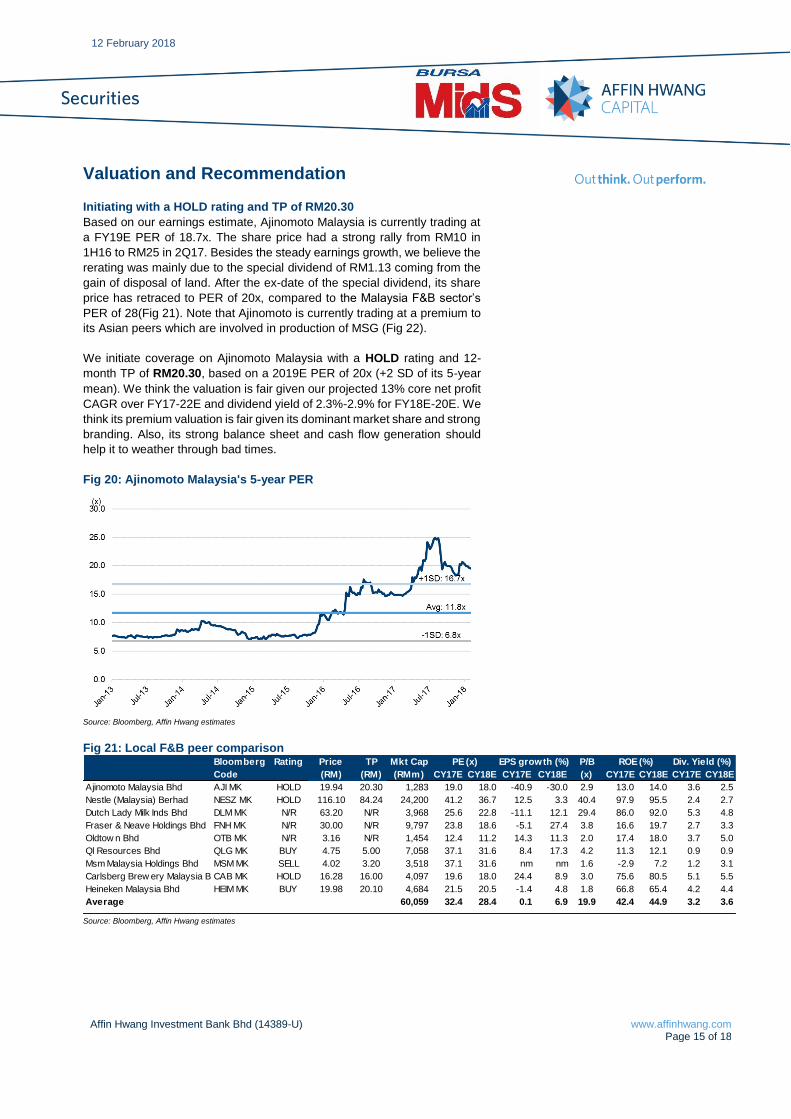
Valuation and Recommendation
Initiating with a HOLD rating and TP of RM20.30
Based on our earnings estimate, Ajinomoto Malaysia is currently trading at
a FY19E PER of 18.7x. The share price had a strong rally from RM10 in
1H16 to RM25 in 2Q17. Besides the steady earnings growth, we believe the
rerating was mainly due to the special dividend of RM1.13 coming from the
gain of disposal of land. After the ex-date of the special dividend, its share
price has retraced to PER of 20x, compared to the Malaysia F&B sector’s
PER of 28(Fig 21). Note that Ajinomoto is currently trading at a premium to
its Asian peers which are involved in production of MSG (Fig 22).
We initiate coverage on Ajinomoto Malaysia with a HOLD rating and 12-
month TP of RM20.30, based on a 2019E PER of 20x (+2 SD of its 5-year
mean). We think the valuation is fair given our projected 13% core net profit
CAGR over FY17-22E and dividend yield of 2.3%-2.9% for FY18E-20E. We
think its premium valuation is fair given its dominant market share and strong
branding. Also, its strong balance sheet and cash flow generation should
help it to weather through bad times.
Fig 20: Ajinomoto Malaysia's 5-year PER
Source: Bloomberg, Affin Hwang estimates
Fig 21: Local F&B peer comparison
Source: Bloomberg, Affin Hwang estimates
Bloomberg Rating Price TP Mkt Cap P/B
Code (RM) (RM) (RMm) CY17E CY18E CY17E CY18E (x) CY17E CY18E CY17E CY18E
Ajinomoto Malaysia Bhd AJI MK HOLD 19.94 20.30 1,283 19.0 18.0 -40.9 -30.0 2.9 13.0 14.0 3.6 2.5
Nestle (Malaysia) Berhad NESZ MK HOLD 116.10 84.24 24,200 41.2 36.7 12.5 3.3 40.4 97.9 95.5 2.4 2.7
Dutch Lady Milk Inds Bhd DLM MK N/R 63.20 N/R 3,968 25.6 22.8 -11.1 12.1 29.4 86.0 92.0 5.3 4.8
Fraser & Neave Holdings Bhd FNH MK N/R 30.00 N/R 9,797 23.8 18.6 -5.1 27.4 3.8 16.6 19.7 2.7 3.3
Oldtow n Bhd OTB MK N/R 3.16 N/R 1,454 12.4 11.2 14.3 11.3 2.0 17.4 18.0 3.7 5.0
Ql Resources Bhd QLG MK BUY 4.75 5.00 7,058 37.1 31.6 8.4 17.3 4.2 11.3 12.1 0.9 0.9
Msm Malaysia Holdings Bhd MSM MK SELL 4.02 3.20 3,518 37.1 31.6 nm nm 1.6 -2.9 7.2 1.2 3.1
Carlsberg Brew ery Malaysia B CAB MK HOLD 16.28 16.00 4,097 19.6 18.0 24.4 8.9 3.0 75.6 80.5 5.1 5.5
Heineken Malaysia Bhd HEIM MK BUY 19.98 20.10 4,684 21.5 20.5 -1.4 4.8 1.8 66.8 65.4 4.2 4.4
Average 60,059 32.4 28.4 0.1 6.9 19.9 42.4 44.9 3.2 3.6
PE (x) Div. Yield (%)ROE (%)EPS growth (%)

12 February 2018
Affin Hwang Investment Bank Bhd (14389-U) www.affinhwang.com Page 16 of 18
Fig 22: Peer comparison for regional MSG related companies
Source: Bloomberg, Affin Hwang estimates
Key Risks
1. Price competition. Ajinomoto holds no.1 position in the
seasonings and dry savouries market with c. 22% market share.
Nevertheless, the competition in the industry is intense especially
MSG. in 2014, China’s production and consumption accounted for
approximately 65% and 55% of world production and consumption
respectively. China is the world’s largest exporter of MSG which
accounted for 44% of the world’s MSG export. Some of Ajinomoto’s
competitors include Vedan, Fufeng, CJ Cheiljedang, Daesang
Corporations. Ajinomoto may incur more marketing expenses or
price discounts to compete in the market.
2. Substitution risk. Consumers may be health conscious and
reduce consumption of MSG and processed food.
3. Weather risk. Ajinomoto’s main raw ingredients for MSG are
tapioca starch and sugarcane molasses. Poor weather condition
may result in poor crop yield and elevate raw material prices.
Movement of packaging cost which include papers and plastics
may also affect its margin.
Bloomberg Rating Price TP Mkt Cap P/B
Code (RM) (RM) (RMm) CY17E CY18E CY17E CY18E (x) CY17E CY18E CY17E CY18E
Ajinomoto Malaysia Bhd AJI MK HOLD 19.94 20.30 1,283 19.0 18.0 -40.9 -30.0 2.9 13.0 14.0 3.6 2.5
Cj Cheiljedang Corp 097950 KP N/R 366,000.00 N/R 17,361 12.4 12.3 48.6 0.5 1.4 11.2 10.0 0.7 0.7
Daesang Corporation 001680 KP N/R 27,550.00 N/R 3,436 13.9 11.4 4.1 21.2 1.0 7.6 8.6 1.6 1.6
Fufeng Group Ltd 546 HK N/R 5.10 N/R 6,494 6.2 5.1 24.3 21.5 1.2 19.9 20.2 4.2 4.9
Average 28,574 11.4 10.8 9.0 3.3 1.3 12.9 13.2 2.5 2.4
PE (x) Div. Yield (%)ROE (%)EPS growth (%)

12 February 2018
Affin Hwang Investment Bank Bhd (14389-U) www.affinhwang.com Page 17 of 18
Ajinomoto - FINANCIAL SUMMARY
Souce: Company, Affin Hwang estimates
Profit & Loss Statement Key Financial Ratios and Margins
FYE 31 Mar (RM m) FY16 FY17 FY18E FY19E FY20E FYE 31 Mar (RM m) FY16 FY17 FY18E FY19E FY20E
Revenue 400.2 419.9 452.0 487.2 525.6 Growth
Operating expenses (340.8) (349.4) (379.4) (404.9) (437.8) Revenue (%) 17.6 4.9 7.6 7.8 7.9
EBITDA 59.4 70.5 72.6 82.3 87.8 EBITDA (%) 26.7 18.7 2.9 13.3 6.8
Depreciation (11.5) (11.8) (11.7) (12.3) (13.0) Core net profit (%) 46.5 (3.9) 30.7 12.0 7.3
EBIT 47.9 58.7 60.9 70.0 74.8
Net interest income/(expense) 6.0 7.6 12.4 12.2 13.3 Profitability
Associates' contribution - - - - - EBITDA margin (%) 14.9 16.8 16.1 16.9 16.7
EI (3.0) 145.4 - - - PBT margin (%) 13.5 50.4 16.2 16.9 16.8
Pretax profit 53.9 211.5 73.4 82.1 88.1 Net profit margin (%) 10.2 44.6 12.2 12.6 12.6
Tax (13.2) (24.0) (18.3) (20.5) (22.0) Effective tax rate (%) 24.4 11.4 25.0 25.0 25.0
Minority interest - - - - - ROA (%) 11.1 35.2 11.0 11.5 11.4
Net profit 40.8 187.5 55.0 61.6 66.1 Core ROE (%) 14.2 8.9 12.6 13.1 13.1
ROCE (%) 12.7 38.5 12.3 12.7 12.7
Balance Sheet Statement Dividend payout ratio (%) 50.3 50.3 50.0 50.0 50.0
FYE 31 Mar (RM m) FY16 FY17 FY18E FY19E FY20E
PPE 105.0 89.5 92.9 95.6 97.6 Liquidity
Other non-current assets 2.4 1.5 1.5 1.5 1.5 Current ratio (x) 5.6 9.7 7.8 8.1 8.1
Total non-current assets 107.5 91.1 94.4 97.1 99.1 Op. cash flow (RMm) 58.7 54.6 58.2 57.2 60.4
Cash and equivalents 162.3 129.9 91.3 118.2 146.0 Free cashflow (RMm) 46.0 36.9 43.2 42.2 45.4
Inventory 53.3 61.5 63.2 67.2 72.8 FCF/share (sen) 75.7 60.6 71.1 69.3 74.6
Trade receivables 43.1 49.9 51.2 55.1 59.5
Other current assets 1.0 200.1 200.1 200.1 200.1 Asset management
Total current assets 259.6 441.4 405.8 440.6 478.4 Inventory turnover (days) 92.2 101.4 96.8 96.8 96.8
Trade payables 43.3 38.9 45.4 48.2 52.2 Receivables turnover (days) 39.3 43.3 41.3 41.3 41.3
Short term borrowings - - - - - Payables turnover (days) 74.9 64.0 69.5 69.5 69.5
Other current liabilities 3.5 6.5 6.5 6.5 6.5
Total current liabilities 46.8 45.3 51.9 54.7 58.7 Capital structure
Long term borrowings - - - - - Net Gearing (%) net cash net cash net cash net cash net cash
Other long term liabilities 12.5 12.5 13.0 13.5 14.0 Interest Cover (x) n.m. n.m. n.m. n.m. n.m.
Total long term liabilities 12.5 12.5 13.0 13.5 14.0
Quarterly Profit & Loss
Shareholders' Funds 307.8 474.6 435.4 469.5 504.8 FYE 31 Mar (RM m) 2QFY17 3QFY17 4QFY17 1QFY18 2QFY18
Revenue 99.3 107.0 114.9 96.4 115.4
Cash Flow Statement Op costs (81.9) (90.3) (97.2) (85.5) (94.1)
FYE 31 Mar (RM m) FY16 FY17 FY18E FY19E FY20E EBITDA 17.4 16.6 17.7 11.0 21.3
PAT 40.8 187.5 55.0 61.6 66.1 Depn and amort (3.0) (3.0) (2.9) (3.1) (3.1)
Depreciation & amortisation 11.5 11.8 11.7 12.3 13.0 EBIT 14.4 13.6 14.8 7.9 18.2
Working capital changes 5.1 (20.7) 3.5 (5.1) (5.9) Net int income/(exp) 1.2 1.1 1.8 2.1 3.7
Others 1.4 (123.9) (11.9) (11.7) (12.8) EI 0.4 1.6 143.4 1.4 (0.5)
Cashflow from operations 58.7 54.6 58.2 57.2 60.4 Inc/(loss) from affiliates - - - - 1.0
Capex (12.7) (17.8) (15.0) (15.0) (15.0) Pretax profit 15.9 17.1 161.1 10.4 20.8
Others 2.8 (49.6) 12.4 12.2 13.3 Tax (3.9) (3.6) (12.1) (2.5) (4.3)
Cash flow from investing (9.9) (67.4) (2.6) (2.8) (1.7) MI - - - - -
Debt raised/(repaid) - - - - - Net profit 12.0 13.5 149.0 7.9 16.5
Equity raised/(repaid) - - - - - Core net profit 11.6 11.9 5.6 6.5 17.0
Dividends paid (12.2) (20.5) (94.2) (27.5) (30.8)
Others - - - - 0.0 Margins (%)
Cash flow from financing (12.2) (20.5) (94.2) (27.5) (30.8) EBITDA 17.5 15.6 15.4 11.4 18.4
PBT 16.1 16.0 140.2 10.8 18.0
Free Cash Flow 46.0 36.9 43.2 42.2 45.4 PAT 12.1 12.7 129.6 8.2 14.3

12 February 2018
Affin Hwang Investment Bank Bhd (14389-U) www.affinhwang.com Page 18 of 18
Equity Rating Structure and Definitions
BUY Total return is expected to exceed +10% over a 12-month period
HOLD Total return is expected to be between -5% and +10% over a 12-month period
SELL Total return is expected to be below -5% over a 12-month period
NOT RATED Affin Hwang Investment Bank Berhad does not provide research coverage or rating for this company. Report is intended as information only and not as a
recommendation
The total expected return is defined as the percentage upside/downside to our target price plus the net dividend yield over the next 12 months.
OVERWEIGHT Industry, as defined by the analyst’s coverage universe, is expected to outperform the KLCI benchmark over the next 12 months
NEUTRAL Industry, as defined by the analyst’s coverage universe, is expected to perform inline with the KLCI benchmark over the next 12 months
UNDERWEIGHT Industry, as defined by the analyst’s coverage universe is expected to under-perform the KLCI benchmark over the next 12 months
This report is intended for information purposes only and has been prepared by Affin Hwang Investment Bank Berhad (14389-U) (“the Company”) based on sources believed to be reliable. However, such sources have not been independently verified by the Company, and as such the Company does not give any guarantee, representation or warranty (express or implied) as to the adequacy, accuracy, reliability or completeness of the information and/or opinion provided or rendered in this report. Facts, information, views and/or opinion presented in this report have not been reviewed by, may not reflect information known to, and may present a differing view expressed by other business units within the Company, including investment banking personnel. Reports issued by the Company, are prepared in accordance with the Company’s policies for managing conflicts of interest arising as a result of publication and distribution of investment research reports. Under no circumstances shall the Company, its associates and/or any person related to it be liable in any manner whatsoever for any consequences (including but are not limited to any direct, indirect or consequential losses, loss of profi t and damages) arising from the use of or reliance on the information and/or opinion provided or rendered in this report. Any opinions or estimates in this report are that of the Company, as of this date and subject to change without prior notice. Under no circumstances shall this report be construed as an offer to sell or a solicitation of an offer to buy any securities. The Company and/or any of its directors and/or employees may have an interest in the securities mentioned therein. The Company may also make investment decisions or take proprietary positions that are inconsistent with the recommendations or views in this report. Comments and recommendations stated here rely on the individual opinions of the ones providing these comments and recommendat ions. These opinions may not fit to your financial status, risk and return preferences and hence an independent evaluation is essential. Investors are advised to independently evaluate particular investments and strategies and to seek independent financial, legal and other advice on the information and/or opinion contained in this report before investing or participating in any of the securities or investment strategies or transactions discussed in this report. Third-party data providers make no warranties or representations of any kind relating to the accuracy, completeness, or timeliness of the data they provide and shall not have liability for any damages of any kind relating to such data. The Company’s research, or any portion thereof may not be reprinted, sold or redistributed without the consent of the Company. The Company, is a participant of the Capital Market Development Fund-Bursa Research Scheme, and will receive compensation for the participation. This report is printed and published by: Affin Hwang Investment Bank Berhad (14389-U) A Participating Organisation of Bursa Malaysia Securities Berhad 22nd Floor, Menara Boustead, 69, Jalan Raja Chulan, 50200 Kuala Lumpur, Malaysia. T : + 603 2146 3700 F : + 603 2146 7630 [email protected] www.affinhwang.com