Air quality and public health in south asian cities
128
A REPORT ON THE STATUS OF AIR QUALITY AND PUBLIC HEALTH IN SOUTH ASIAN CITIES PREPARED BY: SUBMITTED TO: Siddhant Gupta Air Pollution Team 3 rd year, B. Tech. Environmental Engg. Centre for Science and Environment 1
-
Upload
ismdhanbad -
Category
Documents
-
view
1 -
download
0
Transcript of Air quality and public health in south asian cities

A REPORT ONTHE STATUS OF AIR QUALITY AND PUBLIC HEALTH
IN SOUTH ASIAN CITIES
PREPARED BY: SUBMITTED TO:
Siddhant Gupta Air Pollution Team
3rd year, B. Tech. Environmental Engg. Centre for Science and Environment
1

ISM Dhanbad New Delhi
INTRODUCTION:
Air pollution is a major environmental risk to health. By reducing airpollution levels, we can help countries reduce the global burden of disease from respiratory infections, heart disease and lung cancer.
The lower the levels of air pollution in a city, the better respiratory, and cardiovascular health of the population will be. Indoor air pollution is estimated to cause 2 million premature deaths mostly in developing countries. Almost half of these deaths are due to pneumonia in children under 5 years of age. [1]
Exposure to air pollutants is largely beyond the control of individuals and requires action by public authorities at the national,regional and even international levels. WHO estimates that globally about 3 million people die each year due to air pollution out of which800,000 premature deaths result from outdoor pollution.
WHO AIR QUALITY GUIDELINES:
The WHO air quality guidelines represent the most widely agreed and up-to-date assessment of health effects of air pollution, recommendingtargets for air quality at which the health risks are significantly reduced. The Guidelines recommend revised limits for the concentrationof selected air pollutants: particulate matter (PM), ozone (O3), nitrogen dioxide (NO2) and sulfur dioxide (SO2).
Poor indoor air quality may pose a risk to the health of over half of the world’s population. In homes where biomass fuels and coal are usedfor cooking and heating, PM levels may be 10-50 times higher than the guideline values. Significant reduction of exposure to air pollution can be achieved through lowering the concentrations of several of the most common air pollutants emitted during the combustion of fossil fuels. Such measures will also reduce GHGs and contribute to the mitigation of global warming. [1]
2

There are serious risks to health from exposure to PM and O3 in many cities. It is possible to derive a quantitative relationship between the pollution levels and specific health outcomes.
NATIONAL AMBIENT AIR QUALITY STANDARDS:
3

Figure 1. Comparison of India’s NAAQS with WHO and US EPA. [2]
MAJOR AIR POLLUTANTS AND THEIR SOURCES:
PM (Particulate Matter)
The major components of PM are sulfate, nitrates, ammonia, sodium chloride, carbon, mineral dust and water. It consists of a complex mixture of solid and liquid particles of organic and inorganic substances suspended in the air. The particles are identified according to their aerodynamic diameter as either PM2.5 (aerodynamic diameter smaller than 2.5 micro-m) or PM10 (particles with an aerodynamic diameter smaller than 10 micro-m). The former are more dangerous since, when inhaled, they may reach the peripheral regions of the bronchioles and interfere with gas exchange inside the lungs. [1]
Source of PM2.5 include paved and unpaved road dust, construction dust, fuel combustion in residences and industries, waste disposal and commercial cooking.
Sources of PM10 primary include dust emissions from paved and unpaved roads and construction dust, crops and livestock dust, industrial processes and fuel combustion.
As no threshold for PM has been identified below which no damage to health is observed, the recommended value should represent an acceptable and achievable objective to minimize health effects in the context of local constraints, capabilities and public health priorities.
CO (Carbon Monoxide)
It is a colorless, odorless gas emitted from combustion processes. Themajority of CO emissions to ambient air come from mobile sources. CO can cause harmful health effects by reducing oxygen delivery to the body’s organs and tissues. At extremely high levels, CO can cause death. CO is given off whenever fuel or other carbon-based materials are burned. It is usually emitted from sources combustion sources thatare not properly maintained or vented.
Sources of CO include on-road and off-road mobile sources, residentialfuel combustion, electricity generation and industrial boilers,
4

processes in industries of ferrous and non-ferrous metals, oil and gasproduction, etc. [12]
Carbon Monoxide mainly causes adverse effects in humans by combining with hemoglobin to form carboxyhemoglobin (HbCO) in the blood. People with several types of heart disease already have a reduced capacity for pumping oxygenated blood to the heart, which can cause them to experience myocardial ischemia (reduced oxygen to the heart) often accompanied by chest pain (angina) when exercising.
NO2 (Nitrogen Dioxide)
Nitrogen Dioxide is one of a group of highly reactive gases known as Nitrogen Oxides (NOx). Other nitrogen oxides include nitrous and nitricacid. NO2 forms quickly from emissions from cars, trucks and buses, power plants, and off-road equipment. In addition to contributing to the formation of ground-level ozone, and fine particle pollution, NO2 is linked with a number of adverse effects on the respiratory system.
Sources of NOx include mobile sources, fuel combustion, industrial processes, fires, solvent, dust, etc. [12]
Scientific evidence links short-term NO2 exposures, ranging from 30 minutes to 24 hours with acute respiratory effects including airway inflammation in healthy people and increased respiratory symptoms in people with asthma.
NOx react with ammonia, moisture, and other compounds to form small particles. These small particles penetrate deeply into sensitive partsof the lungs and can cause or worsen respiratory disease, such as emphysema and bronchitis, and can aggravate existing heart disease, leading to increased hospital admissions and premature death.
Ozone is formed when NOx and volatile organic compounds react in the presence of heat and sunlight. The effects of ozone on children, elderly and people with lung diseases such as asthma include reductionin lung function and increased respiratory symptoms as well as respiratory-related emergencies.
SO2 (Sulfur Dioxide)
Sulfur dioxide is one of a group of highly reactive gases known as “oxides of sulfur”. The largest sources of SO2 emissions are from fossil fuel combustion at power plants and other industrial
5
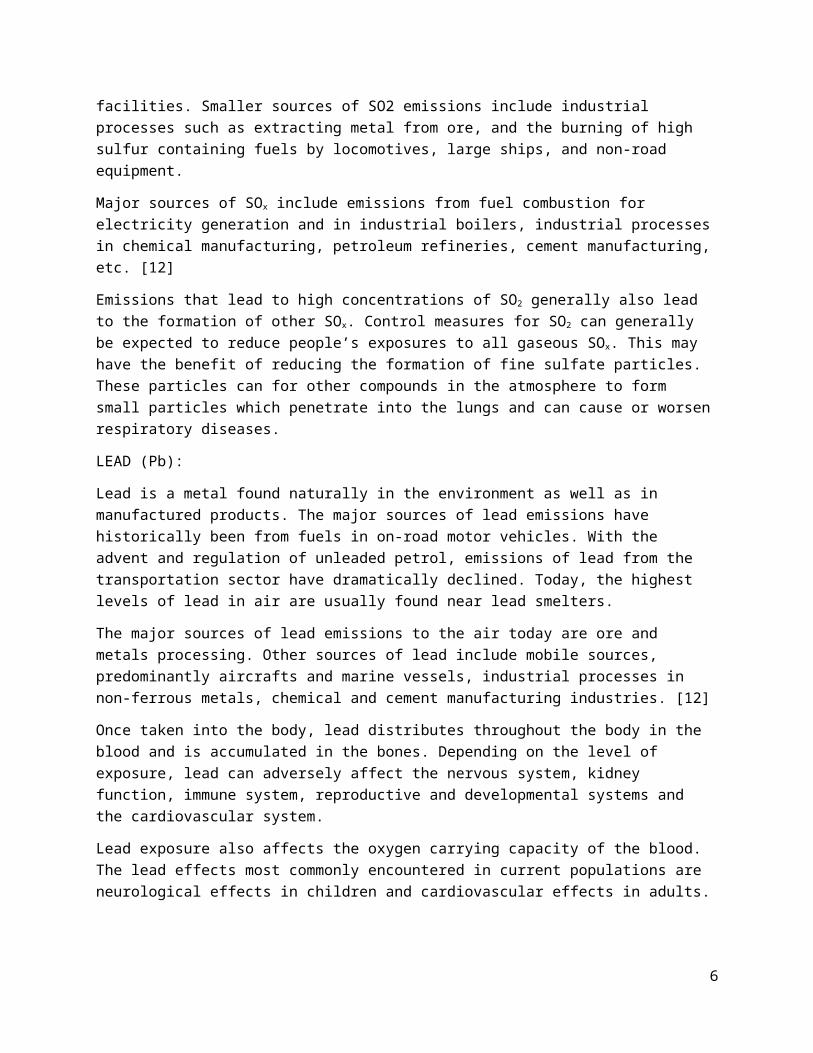
facilities. Smaller sources of SO2 emissions include industrial processes such as extracting metal from ore, and the burning of high sulfur containing fuels by locomotives, large ships, and non-road equipment.
Major sources of SOx include emissions from fuel combustion for electricity generation and in industrial boilers, industrial processesin chemical manufacturing, petroleum refineries, cement manufacturing,etc. [12]
Emissions that lead to high concentrations of SO2 generally also lead to the formation of other SOx. Control measures for SO2 can generally be expected to reduce people’s exposures to all gaseous SOx. This may have the benefit of reducing the formation of fine sulfate particles. These particles can for other compounds in the atmosphere to form small particles which penetrate into the lungs and can cause or worsenrespiratory diseases.
LEAD (Pb):
Lead is a metal found naturally in the environment as well as in manufactured products. The major sources of lead emissions have historically been from fuels in on-road motor vehicles. With the advent and regulation of unleaded petrol, emissions of lead from the transportation sector have dramatically declined. Today, the highest levels of lead in air are usually found near lead smelters.
The major sources of lead emissions to the air today are ore and metals processing. Other sources of lead include mobile sources, predominantly aircrafts and marine vessels, industrial processes in non-ferrous metals, chemical and cement manufacturing industries. [12]
Once taken into the body, lead distributes throughout the body in the blood and is accumulated in the bones. Depending on the level of exposure, lead can adversely affect the nervous system, kidney function, immune system, reproductive and developmental systems and the cardiovascular system.
Lead exposure also affects the oxygen carrying capacity of the blood. The lead effects most commonly encountered in current populations are neurological effects in children and cardiovascular effects in adults.
6

KATHMANDU:
Surrounded by high mountains, Kathmandu Valley is home to three districts, Kathmandu, Lalitpur and Bhaktapur, and the nation's capital,Kathmandu Metropolitan City, in Kathmandu District. The Valley houses a majority of Nepal's urban developments, all five of its municipalities, the majority of its total population and 30% of its urban population, and virtually all of the urban road infrastructure and transportation system.
7

Figure 2. Revised National Ambient Air Quality Standards for Nepal -2012
Studies have indicated that vehicles are the main source of air pollution in Kathmandu. The main reasons for the high level of vehicular emission are the large number of vehicles on congested streets, poor quality vehicles, poor quality fuels and lubricants, weaknesses in the emission inspection and maintenance system and ineffective transport management.
A study done by MOPE/ESPS indicates that PM10 emission from vehicles has increased by more than four times between 1993 and 2001 and now vehicle exhaust is responsible for 42 percent of the total PM10 emission in the Valley. [3]
Ensuring that the vehicles operate within the emissions standards, introducing electric vehicles and the bus trolley system can be operated to reduce the release of potentially carcinogenic particles into the air.
1. Introduction:
8

A recent Environmental Performance Index study of the Yale Centre for Environmental Law and Policy has ranked Nepal’s performance in air quality control as very poor. A 2006 Clean Air Initiative-Asia report put Kathmandu amongst the most polluted of 22 Asian cities it surveyed. This pollution comes from motor vehicles and construction, smoky vehicles, small-scale industries, brick kilns and road dust. Thehigh concentrations of particulate matters, PM10 and PM2.5, in particularare known to cause serious health problems and excess mortality. [9]
Kathmandu has initiated its first generation action that includes a wide gamut of measures. It has phased out leaded petrol, introduced unleaded gasoline, banned import of two-stroke three wheelers, introduced ambient air quality standards, Euro I emissions standards and in-use vehicle emission standards, and spearheaded the electric vehicles program.
2. Air quality:
The air quality in Nepal's major cities has worsened over the last decade. The levels of air pollution in Kathmandu, Biratnagar, and Birgunj are categorized as unacceptable in terms of human health considerations by WHO guidelines.
New data shows unacceptably high levels of particulate matter in thesecities, especially during winter months, of the tinier particles, PM2.5 that go very deep inside the lungs and cause very serious health damage. In Kathmandu, during the period January to February 2003, the MOPE/ESPS monitored PM2.5 levels in Patan and Bhaktapur areas. The average level in the Patan Hospital area was recorded at 166 µg/m3. The high concentration in this area was due to diesel exhausts as the monitoring station is located along a busy road near the Lagankhel busstation, which has many diesel vehicles. [9]
In Bhaktapur, brick kilns were the culprit. As the monitoring station in Bhaktapur is located in the Durbar Square which has no vehicular movement, the high PM2.5 must then be due to the particles that have been transported to the area by westerly winds from Kathmandu and the surrounding brick kilns.
9

Figure 3. Benzene Concentration in Kathmandu. [3]
The Kathmandu Valley might be facing a multi-pollutant crisis because although the largest health impacts are due to exposure to very high levels of particulate pollution, in Kathmandu, limited data shows thatair toxics including PAHs and benzene are of concern. The ESPS monitoring in 2003 has indicated that NO2 levels were the highest in Putali Sadak. The average concentration at other monitoring stations Chabahil, Thamel and Patan Hospital were also high. [9]
Local pollution: The Thamel monitoring station representing the urban residential site shows high number of days with non-compliance. Bhaktapur has a different story to tell: there is a reduction in the number of days of PM10 non-compliance due to the ban on brick kilns using traditional technology. The ban, introduced in 2004, seems to have had a very positive effect on the air quality, particularly in the Bhaktapur area. [9]
2.1. State of urban air quality in Kathmandu and other cities
Many studies made over the last decade have shown that the ambient airof Kathmandu Valley is heavily polluted and that the quality of the air is deteriorating. This development has mainly been due to a rapid rise in the number of petrol and diesel vehicles plying in the streetsof the valley. At the same time the continued emissions to the air from the many brick kilns, the cement factory, the dyeing industry andother industries in the valley are also important contributors. [4]
10

2.2. Air quality trends – pollutant and monitoring location wise
Prior to the creation of the Ministry of Population and Environment (MoPE) in 1995, no agency was assigned to monitor the quality of air in Nepal. Monitoring at that time was conducted on project basis. To date, routine AQ monitoring is only available for the Kathmandu valleyarea. With support from DANIDA, MoPE established an air quality monitoring system in Kathmandu consisting of six monitoring stations with the valley as a part of the ESPS program. However, the six stations that were supposed to monitor the level of air pollution in Kathmandu valley have been defunct since 2008. According to the officials, theequipment face technical and administrative problems.
Figure 5. PM10 concentrations for 2002-2007. Source: MOEST
TSP (Total Suspended Particulate)
It was monitored once a week for 24-hour average values in two roadside stations for the period 2003-05. There is no annual ambient standard for TSP in Nepal, only a daily limit of 230 µg/m3. [6]
11

Figure 7. Monthly and Annual Average TSP at Putalisadak and PatanStations, 2003-2005. Source: MOEST (2006) [6]
PM10
The data for PM10 in Kathmandu valley from 2003 to 2005 indicate that the average ambient concentration of PM10 has slightly improved. It continues, however, to exceed the WHO annual guidelines for PM10. Nepaldoes not have any annual standards for PM10 but even its 24-hour standard of 120 µg/m3 is exceeded by the annual average concentrations. PM10 concentrations in urban areas outside the valley are also very high, exceeding Nepal’s daily PM10 limit by as much as 11times. Compared with new annual guidelines for PM10 set by WHO (20 µg/m3), the PM10 in urban areas in Nepal exceed the guidelines by as much as 72 times. As with TSP, PM10 is also a major pollutant of concern in the urban areas of Nepal. [6]
Figure 6. Seasonal minimum, maximum, average ± standard deviationvalues (µg/m3) of ambient PM10. [5]
12

PM10 emissions from vehicles increased by more than four times between 1993 and 2001 and in 2003, vehicle exhaust was responsible for 42% of the total PM10 emission in the Valley. [3]
Figure 8. PM10 concentrations in Kathmandu Valley. Source: MOEST (2006)[6]
PM2.5
The Thamel station in the Kathmandu Valley monitors both PM10 and PM2.5. Figure 9 shows the monthly average of PM10 and PM2.5 monitored parallel at Thamel residential station; the ratio varies from 0.50 to 0.75 being higher during the dry season and falling gradually during the wet season. [6]
13

Figure 9. PM2.5 and PM10 in Kathmandu Valley. Source: MOEST. [6]
SO2
SO2 was monitored in September 2004 in Kathmandu valley using diffusivesamplers. SO2 levels in the Kathmandu Valley area are much lower than those in their other urban counterparts in Nepal. Since Nepal has an annual and 24-hour standard for SO2, these weekly and 8-hour averages are not directly comparable to Nepal’s standards.
14

Figure 10. Concentrations in Kathmandu and Other Urban Areas. Source:MOEST (2006) and IUCN (2004) [6]
NO2
NO2 was monitored, using passive samplers, at the six stations in the Kathmandu Valley. Because of difference in averaging periods, however,these weekly and 8-hour average readings of NO2 cannot be directly correlated with Nepal standards for annual and 24-hour NO2 standards.
Figure 11. NO2 concentrations in Kathmandu and Other Urban Areas. Sources: IUCN (2004) and MOEST (2006) [6]
CO and Pb:
Ambient concentrations of CO and Pb in urban areas, based on an 8-houraveraging time are shown below. CO values then have exceeded standardsin some sites. Pb concentrations cannot be compared with ambient standards.
15

Figure 12. CO and Pb Concentrations in Urban Areas in Nepal. Source:LEADERS Nepal (2000). [6]
2.3. State of air quality monitoring -- no. of air quality monitoring stations – manual and real time, pollutants beingmonitored
The Ministry of Environment set up the stations in 2002 at various places in the Valley. Set up in Thamel, Putali Sadak, Patan Hospital, Matsyagaon, Tribhuvan University and Bhaktapur, the stations were partof DANIDA’s Environment Sector Program Support (ESPS) until 2005 and collected 24-hour samples of air to be analyzed for PM10 levels. Since 2006, the Environment and Public Health Organization (ENPHO) was responsible for the maintenance of the stations besides monitoring airpollution on a daily basis.
The six stations that were supposed to monitor the level of air pollution in Kathmandu valley have been defunct since 2008. According to the officials, the equipment face technical and administrative problems.
2.4. Monitoring challenges
The new National Ambient Air Quality Standard (NAAQS) 2012 requires effective monitoring and collection of eight-hour and 24-hour samples of air pollutants like Total Suspended Particulates (TSP), ParticulateMatter (PM10 and PM2.5), carbon monoxide, lead and ozone levels for at least 347 days out of a 365-day year. The NAAQS further states that noparticular place should fail to monitor air samples for two consecutive days.
16

As stated above, many of the monitoring results from the stations are such that they cannot be compared to the air quality standards. Propercalibration of equipment is required so that the results can be compared to the Nepal NAAQS and proper control measures, if needed, can be devised.
In May 2013, the government’s attempt to resume air quality monitoringstations suffered a setback as four of the total seven existing stations broke down barely two months after being repaired.
2.5. Pollutants of concern exceeding Nepal NAAQS
Air pollution measurements show that particulate pollution is the mostsignificant pollutant inside the Kathmandu valley (Devkota, 1993; Karmacharya et. al., 1993; Otaki et. al., 1995; Shah and Nagpal, 1997).
TSP, the air pollution indicators, PM10 and PM2.5, and CO have exceeded the WHO or Nepal standards in the Kathmandu Valley and other urban areas monitored. SO2 and NO2 have also shown high concentrationsat the monitoring stations but there is a gap between the periods for which the average concentrations are obtained by the monitoring stations and the average period mentioned in the NAAQS.
Figure 7 shows the high levels of TSP in the Kathmandu Valley. There is no ambient standard for TSP in Nepal, the average annual concentration of TSP is around 600 µg/m3 which is well above the standard concentrations given by NAAQS for India, the neighboring country of Nepal.
The PM10 concentrations exceed the WHO annual guidelines for PM10. Nepal does not have any annual standards for PM10 but even its 24-hourstandard of 120 µg/m3 is exceeded by the annual average concentrationsfrom 2003-2005. Compared with the new annual guidelines for PM10 set by WHO, the PM10 in urban areas in Nepal exceed WHO guidelines by as much as 72 times. [6]
The 6 monitoring stations set up across the Valley have been defunct since 2008, hence before control measures and policies can be devised,proper air quality monitoring system and structure is required. Once adequate air quality data is available, various factors such as emission sources need to be considered. [11]
17

2.6. What is the air pollution source contributing to high levels of pollution?
Figure 13. Comparison of Emissions Inventories in 1993 and 2001(tons/year). Source: MOEST (2005) [6]
In Kathmandu, vehicle emissions contribute most of the PM10 levels. Vehicular emissions and emissions of re-suspended dust from poorly maintained and un-cleaned roads together are responsible for 63% of the PM10 emissions in the valley. The pollution levels drop significantly on weekends and during bandhs or strikes when there are fewer vehicles on the road, says the University Medical Journal.
A Kathmandu source apportionment study shows that PM10 and PM2.5 emissions from road transport are higher by one to two orders of magnitude than the emissions from combustion in manufacturing industry, residential emissions, and emissions due to waste burning and agricultural activities. Residential emissions of CO and NMVOC arehigher than those from road traffic, while NOx emissions are mainly dueto transport. Emissions of PM10 from road traffic are approximately 16 times higher than those of CO and 26 times than those of NOx. [9]
2.7. Why vehicles are a special challenge
In the last two decades, limited improvements have been made in traffic management, emission control and public transportation promotion, but they are offset by the declining role of high-occupancy
18

public transport, rapidly rising transportation activity, and the growth in the number of private cars and motorcycles.
Vehicles pose a special challenge to the valley as seen by the rising number in vehicles registration. The emissions from vehicle sources account for more than 38% of the total PM emissions. The exponential rise in the number of vehicles on the road will also lead to problems such as traffic congestion, parking problems, etc.
Figure 14. The various Sources of Pollutant Emissions in Vehicles.[20]
Vehicular emissions contribute to significant human exposure. Pollution concentration in our breathe is 3-4 times higher than the ambient air concentration. Public transport users, walkers and cyclists are the most exposed groups – most of them are also poor. [14]
The various ways to combat the problem include vehicle emissions standards, improving fuel quality and promoting public transport. These solutions can be challenging at both the regulation and implementation levels.
3. Air pollution and health impact studies
The impact of air pollution on health in the Kathmandu valley can be assessed by the increase in the number of patients suffering from
19

diseases related to air pollution. There has been no real epidemiological study in Nepal to assess the impact of air pollution on public health, primary reason being poor hospital and air quality information.
There are several studies conducted in the valley which suggest adverse health outcome of air pollution.
3.1. Air pollution and health impact studies conducted so far
According to Tribhuvan University Teaching Hospital, it has recorded 831 patients of pneumonia, 676 of chronic obstructive pulmonary disease, 114 of asthma and 144 of bronchitis since July. “Number of people suffering from various respiratory diseases has doubled since the road-widening drive began,” said Dr Dirgha Singh Bam, a former health secretary. “Though the government’s road expansion initiative is appreciable, it has not been well-organised.” [22]
According to WHO standards‚ the level of Particulate Matter10 should be 20 microgram per cubic metre (µg/m3). The Ministry of Environment informed that the PM-10 concentration in ambient air was recorded at up to 699 µg/m3 against 120 µg/m3, the national ambient air quality standards in Kathmandu in March. [22]
Air pollution in the valley has been taking a toll on the public health. A study conducted during February 2008 to January 2009 in Kathmandu and published recently in Atmospheric Pollution Research found highdensity traffic areas and road intersections of the valley severely polluted by PM10; it also said that all the studied sites can be considered as “hazardous” in comparison with the MoPE’s benchmark of 425 µg/m3. The study indicated that occupational PM10 plays a significantly dominant role in controlling ambient PM10 loads at the high density traffic areas and road intersections of the valley. [9]
The Ministry of Environment, Science and Technology (MoEST) estimated in 2005 that the valley’s air pollution results in approximately 1,600premature deaths per year. According to an estimate by the Clean Energy Nepal/Environment and Public Health Organization (CEN/ENPHO), the total benefit of reducing the valley’s PM10 levels to 50 μg/m3 would amount to US $1.86 billion per year. Using the WHO unit risks for benzene and PAH, the number of people expected to suffer from
20

leukemia due to benzene exposure amounts to 1-8 persons per 100,000; for PAH, the number is 16-32 persons per 100,000. Benefits of reducingbenzene and PAH concentrations to half their current values would amount to US $30-70 million per year. [9]
A study has found that Kathmandu’s residents experienced over 1.5 million respiratory symptom days per year. A survey done by CEN/ENPHO in 2003 of 331 patients with respiratory illnesses visiting the out-patient and emergency departments of major hospitals in Kathmandu indicates that most of them are from Kathmandu valley and belong to the age group of 51 to 75. [9]
Many institutional as well as independent studies have been conducted in regard to the health impact of air pollution in Nepal which suggestadverse health outcome from exposure to air pollution. Organizations such as Child Workers in Nepal, CEN and ENPHO have conducted studies that accumulate data on the patients admitted to hospitals, notice seasonal trends in hospital admissions and predict the effect of reducing the emission levels on the mortality rates and hospital admission rates. The summary of key findings of these studies is presented in the table below. [6]
21

22

OBSERVED RELATIONS BETWEEN PARTICULATES AND SO2 LEVELS AND HEALTH EFFECTS:
CONDITION EFFECTSParticulate level of 750 µg/m3 with SO2 at 715 µg/m3 (0.25 ppm), both 24-hour mean
Increased daily death rate; substantial increase in illness of persons with bronchitis
Low particulate level with SO2 levels ranging between 300 and 500 µg/m3 (0.11-0.19 ppm), both 24-hr mean
Increased hospital admissions of elderly people with respiratory disease cases; increased absenteeism among older workers
Particulate level of 300 µg/m3 with SO2 level of 600 µg/m3 (0.21 ppm), both 24-hr mean
Worsening of symptoms in persons suffering from chronic bronchitis
Particulate level of 185 µg/m3 with SO2 levels ranging between 105 and 265 µg/m3 (0.04 -0.09 ppm), both annual mean
Increased frequency of respiratory symptoms and lung disease
Particulate level of 100 µg/m3 with SO2 level of 120 µg/m3 (0.05 ppm), both annual mean
Increased respiratory disease among young children
Source: Air quality criteria for sulfur oxides and for particulates (U.S. Public Health Service Publication, AP-50), 1969.
EFFECTS OF ATMOSPHERIC NO2:
EFFECT NO2 CONCENTRATION (ppm)
EXPOSURE
Increase in acute respiratory disease
0.06-0.1 2-3 years
Increase in acute bronchitis inschool children
Up to 0.1 6 months
Human olfactory threshold 0.12 <24 hoursIncrease in airway resistance 5 10 minPulmonary Edema 90 30 minU.S. Environmental Protection Agency, “Air quality criteria for nitrogen oxides”, AP-84 (USEPA, Washington D.C.), 1971.
EFFECTS OF SULFUR DIOXIDE ON HUMANS:
CONCENTRATION (ppm)
EFFECTS
23

0.2 Lowest concentration causing a human response0.3 Threshold for taste recognition0.5 Threshold for odour recognition1.6 Threshold for inducing broncho-constrictions in
healthy individuals8-12 Immediate throat irritation10 Eye irritation20 Immediate coughingSource: S.H. Stoker and S.L. Seager, Environmental Chemistry: air and water pollution (Scott Foresman and Co., New York), 1976.
HEALTH EFFECTS OF COHb BLOOD LEVELS:
COHb blood level (%)
Effects on healthy individuals
Effects on heart patients
1-5 Blood flow to certain vital organs increases to compensate for reduction in oxygen carrying capacity of blood
Heart patients may lack sufficient cardiac reserve to compensate
5-9 Visual light threshold increased
Patients with angina pectoris require less exertion to induce chestpain
16-20 Labored respiration duringexertion, visual evoked response abnormal
May be lethal for patients with severe cardiovascular disease
20-30 Headache, nausea30-40 Severe headache, nausea
and vomits40-50 Slurring of speech;
collapsing50-60 Convulsions, coma60-70 Fatal coma if not treatedSource: R.D. Steward, “The effects of carbon monoxide on humans”. Annual Review of Pharmacology, Vol. 15 (1975), pp. 409-423.
MAJOR TOXIC METALS AND THEIR EFFECTS:
24

ELEMENT SOURCES HEALTH EFFECTSLead Auto exhaust, paints, storage
batteries, pipesNeurotoxin, affects blood system, behavioral disorders
Cadmium Coal, zinc mining, incineration Cardiovascular disease and hypertension, interference with zinc and copper metabolism
Nickel Combustion of coal, diesel and residual oils, tobacco smoke, chemicals and catalysts
Respiratory symptoms,lung cancer
Mercury Combustion of fossil fuels, evaporation from ore mining, exhausts from metal smelters
Nerve and brain damage, kidney damage
4. Mobility crisis
Road transportation is the only means of travel in the Valley at present and into the foreseeable future. The transportation system in the Valley is characterized by inadequate road length, narrow and congested roads, unmanaged traffic, an inadequate traffic management infrastructure, a combination of old and new vehicles, and a multi-modal public transportation system in which the role of high-occupancypublic transportation is growing increasingly marginalized.
The biggest challenge that confronts South Asian cities including Kathmandu is the rapidly increasing vehicle numbers that threatens to undo the small incremental gains. Growing congestion is crippling the cities. As of 2012, there were around 1.37 million registered vehiclesin Nepal and the number has been increasing by 20% every year. [7]
The mountainous terrain poses a significant barrier to the developmentof a road- and rain-based transportation system in Nepal. The per capita total road availability is a mere 0.64 meters, only one-third of which is black topped. [10]
CSE’s review of available information brings out the strength of Kathmandu. More than 63 per cent of the daily travel trips in Kathmandu are still carried by buses. Cars and two-wheelers are as much 42 per cent of the vehicle fleet but they carry a miniscule 10
25

and 5 per cent of the daily trips, respectively. Thus, cars occupy more road space, carry less number of people but use more fuel, and pollute more per person. It is also very significant that walkers and cyclists together meet close to a quarter of the daily travel demand in Kathmandu. This is the low polluting and low carbon mobility paradigm that the world is trying to achieve today to be more sustainable. [9]
Kathmandu must not repeat the same mistake that Delhi and many other cities have made – of focusing on road widening, building flyovers andfacilitating personal mobility through cars.
Public transport may not work optimally if accessibility and last mileconnectivity is not improved. Walking, cycling and para-transit like three-wheelers and small transport systems play a very important role.In almost all South Asian cities, three-wheelers and mini buses are popular high frequency and affordable public transport systems. Instead of discouraging them in city centers, integrate them with the public transport and neighborhoods to improve accessibility, connectivity and reduce dependence on personal vehicles.
4.1. Increasing number of vehicles
Figure 15. Increasing trend of registered Vehicles in KathmanduValley. [8]
26

The Bagmati zone had 0.19 million registered vehicles in 2001-02. Thisnumber is increasing at 16 per cent per year. Nearly 59 per cent of the total registered vehicles in Kathmandu comprise of two-wheelers and cars and taxis. The public transport and bicycle share is 19 per cent and 22 per cent, respectively. Since 2001, there has been a dramatic rise in new registrations of motorcycles. The reason is not known but could be due in part to various financial options offered bylocal financial institutions and motorcycle distributors. [9]
4.2. Motorization rate
Figure 16. Composition of Registered Vehicles. [8]
The number of registered vehicles in Kathmandu valley increased 3.75 times to reach 570,245 till 2010/2011. The composition of motorcycle is highest with 73.2% among registered vehicles in Kathmandu valley followed by car/jeep/van with a share of 18.5%. [8]
The number of vehicles in the country has grown 15 times in the last two decades. According to Department of Transport Management (DoTM), number of vehicles has reached 11,26,763 in the first eight months of the current fiscal year from 75,141 in 1989-90. As per the data, the country witnessed a slow growth in public and private transport before1990-91. Only 75,141 vehicles were registered in the country in 82 years since 1908, the year when the first vehicle plied on mud roads of the Kathmandu valley. The first vehicle entered Nepal (Kathmandu) in 1908 in the regime of Prithivi Bir Bikram Shah. People did not haveaccess to vehicles in Nepal until 1950. [29]
27

4.3. Modal share of different modes of transport
Figure 17. Modal Share of modes of Transport (Department of Transportand Management 2002)
A study revealed that the majority of demand was met by public transportation. Public transport vehicles (which comprise 19% of the total) met 56.5% of travel demand while motorcycles (which comprise 42.5% of the total) met just 6% of travel demand. The share of non-motorized modes (bicycle and pedestrian) in peak-hour travel demand was significant (22.4%). [13]
If one considers the growing population in the urban areas and the increasing number of vehicles (3.75 times from that of 2000) it can beassumed, that the modal share changed over the past decade. Current detailed scientific studies are needed. In the last decade, the numberof registered four-wheelers has doubled while the number of registeredtwo-wheelers has increased by more than four times.
4.4. Traffic congestion
Kathmandu must not repeat the mistakes that Delhi other mega cities are making. More roads are not the answer. Cities like Kathmandu need to make maximum investment in redesigning their existing road space and travel pattern to provide the majority of the people (more than 90per cent of people in Kathmandu use public transport and non-motorizedtransport) affordable and efficient mode of public transport that can be an alternative to personal vehicles.
Kathmandu is facing major parking crisis due to the tremendous increase in the number of personal vehicles. Haphazard parking is
28

common in core areas. Though the KMC has designated 30 places for parking two-wheelers and small four-wheelers, parking lots are mushrooming in the metropolis, and many of them are illegally run. Thecity authorities have to formulate a parking policy as a travel demandmanagement measure.
4.5. Vehicle emissions standard
Figure 18. Emission Standards for in-use vehicles (2000) (Downloadedfrom www.mope.gov.np)
In 2012, the government brought into effect the Nepal Vehicle Pollution Standard-2069. These standards have been enforced so as to enhance environmental cleanliness at the sites important from the cultural, religious and touristic perspectives, and to offer people anenvironment where they can inhale fresh air. A four-wheeler vehicular means equivalent to the Euro III will only be operated as per the standard. [7]
Figure 19. Number of Vehicles that failed to meet Emission Standards.[17]
29

Air quality gains through the first generation action have shown that the overall PM10 average concentration in Kathmandu has reduced by 12% from 2003 to 2007. [15] However, the monthly average PM10 levels in 2007 showed an increasing trend, especially during winters.
The reduction is observed in spite of an increase in number of vehicles registered in the valley: registered two- and four-wheeler numbers have been reported to be increasing by more than 10% per year.This general decrease in PM10 concentrations is attributed to the actions taken by the government during 2000-07, especially the implementation of the Euro I standard in 2003 and the ban on moving chimney bull’s trench kiln. [16]
Alternative fuel program
Diesel generators that are started up during power cuts are significantly polluting the Nepali capital and releasing global warming agents into atmosphere, researchers say. Preliminary results of a study conducted by the multi-stakeholder Clean Air Network–Nepal (CAAN) and presented at a workshop held in Kathmandu last month (30 August) say that diesel generators released 1,185 tonnes of carbon monoxide (CO) and 155 tonnes of black carbon (BC) into the city's air this year. [23]
In Kathmandu, the share of diesel in overall consumption of petroleum products is the highest at 67.1% followed by petrol at 17.7%. Distorted import policy also aids dieselization: Age limit for imported petrol cars is 3 years but that for diesel is 5 years. Effective tax paid for diesel vehicles is lower than that for petrol vehicles. The import and use of reconditioned vehicles and improper management of vehicle engines lead to bad air quality.
There is a general complaint that petrol and diesel supplied to consumer by dealers is adulterated (Himal 1999, Nepal Times 2001). Theauthority of Nepal Oil Corporation says that they maintain the quality, but due to great price difference in kerosene, diesel and petrol, dealers (1600 dealers in Nepal) adulterate diesel and petrol with kerosene (price of kerosene, diesel and petrol in Nepali Rupees: Rs. 17 (0.22 US$), Rs. 26.50 (0.39 US$) and Rs. 46 (0.60 US$) per litre.
In 2004, 5,085 three-wheelers were registered. By July, all gasoline models had been banned. After 1992, no registration of diesel three-
30

wheelers was allowed and this type of vehicles was completely phased out in 1995. Since then, the use of battery operated electric three-wheelers has risen due to the efforts of the government. In 2000, there were about 600 EVs and a Rs. 500 million industry comprised of vehicle manufactures, battery charging stations and vehicle operators had been established (IGES, 2004). In 2006, there were about one-thousand, half battery-operated and half LGP-powered vehicles. [10]
4.6. Electric vehicles
Despite some barriers, the electric vehicles program is a unique initiative of Kathmandu. The combined effort of government, private sector and civil society groups has promoted and expanded battery-operated electric three-wheelers to fulfill the vacuum created by expulsion of diesel three-wheelers. This successful introduction of zero-emission electric three-wheelers is an important step though challenges exist. According to SAFA tempo owners, there are issues pertaining to high operating costs and conflicting government policies. The number of SAFA tempos has not increased significantly in10 years as compared to other fossil fuel-run vehicles. [9]
4.7. State of public transport
Public transportation is provided by a mixture of low- and high-occupancy vehicles. About 2,339 buses and minibuses, one thousand LPG and electric battery-operated three-wheelers, one thousand LPG, gasoline and diesel microbuses, and six to seven thousand taxis make up the public transport system in the Valley. Public transport serves about 57% of the total passengers during peak hours [8]. Almost all public transportation is provided by the private sector. The state-owned Sajha Yatayat and electric trolley buses are almost on the brinkof collapse due to management problems.
Rapid population growth, urban sprawl, and increasing motorization in Kathmandu valley are creating complexity of traffic congestion, poor public transport system, pedestrian and vehicular conflict and poor air quality. The indicators for quality of public transport include comfort during the ride, seating space, hygiene and reliability, i.e. how dependable is the public transportation for daily usage such as going to work, school/college, etc. [8]
31

Public transport constitutes only 2.5% of total passenger vehicles in Kathmandu valley. About 31% of people find the public transportation neither frequently nor infrequently accessible; 28.7% find infrequently accessible while 10.8% find it not accessible at all during evening/night hours. 34.2% passengers feel uncomfortable with seating space, about 61.7% of female respondents were uncomfortable with the space in public transport. 67.3% of passengers find public transportation unhygienic and ill maintained and about 49% of passengers find public transportation fairly reliable. [8]
The survey shows current public transport service is unreliable and undependable on different aspects: in-vehicle time, frequency of service, availability of service during anti-social time, and level ofcomfort by overcrowding and recklessness in driving. A primary objective of government should be to ensure the reliability and comfort of public transport service.
Kathmandu is suffering from the increasing use of low capacity and lowquality public transportation vehicles. Large numbers of small capacity vehicles compete with each other for passengers in the streets. This has been the major cause of negative externalities like frequent traffic congestions, accidents, and emission. There are mainly two viable options to overcome the public transport problem in Nepal, namely development of metro and restructuring the existing bus transit. The development of metro requires high investment and longer construction time. So restructuring the existing bus transit is the best option as of now. [25]
SAJHA YATAYAT
Sajha Yatayat is the public transportation bus system in Nepal which serves Kathmandu Valley. It runs bus routes throughout Kathmandu and Lalitpur city.
Initially, it plans to operate 20 TATA-brand vehicles on two routes within the Kathmandu valley. Sajha has already applied to the Department of Transport Management for route permission. It is also scheduled to sign an agreement with India’s TATA Motors in a week for the supply of 20 Euro III vehicles. [28]
The Sajha Yatayat , the oldest transport service in the country, whichwas closed due to various reasons, is getting a lifeline after five decades of its establishment. The state-owned organization had faced
32

misfortunes due to political interference and negligence of the stakeholders. The organization is all said to start services under thenew management committee to carry out the administrative and managerial tasks. As per the plans, the organization will have green busses instead of blue ones of the past. [27]
The organization's general meeting held on May 20, 2011, had decided to run the services by transforming it into a non-government entity. Chairman of the Sajaha Yatayat, Kanak Mani Dixit said the management will try to make its services modern, well-managed, transparent, and responsible to the society. However, he urged support from the government, civil society, donor agencies and others to make the services up to mark. He claimed to remain far from political interference, saying that it was responsible whether or not to surviveany organization for a long. [27]
Routes:
- Route 1: Lagankhel - Jawalakhel - Tripureswar - NAC - Kantipath -Teaching Hospital - Maharajgunj - Basundhara - Gongabu New Bus Park and back same way.
- Route 2: Kalanki - Kalimati - Tripureswar - Maitighar - New Baneshwar - Tinkune - Sinamangal - TIA and back same way.
4.8. State of intermediate public transport
The Safa Tempo (three-wheeler) runs on electric fuel and only contributes to 4.7% of the public transport fleet while Buses that runon diesel make up more than 30%. Taxi, which is an inconvenient mode of public transport as it is too costly for the regular users, alone comprises 55.1%.
33

Figure 20. Public Transport Composition in Kathmandu Valley. [8]
Some consideration into last mile connectivity and intermediate publictransport modes is required for making public transport an easier and more reliable option for the regular users.
4.9. Walking and cycling
Figure 21. Average walking time from resident to origin and final stopto destination. [8]
Non-motorized transport varies according to the topography of the country. In southern part and other plain areas, there are bicycle, rickshaw, horse driven carts as well as bullock carts. In hilly areas,horses, mules and donkeys are used for transport of both goods and human beings. There is no alternative and cheap means of transport to walking in many parts of the country.
Figure 22. Modal Split for Modes of Transport according tocontribution in Daily Passenger Travel [21]
34

Road design needs further discussion among stakeholders. Road Safety Audit says ‘design roads for all road users’, the roads must have proper pedestrian footpaths and disabled accessibility. There is a lack of coordination and blame game.
5. Car restraint measures
There is need for car restraint measures as the no. of private cars has been on a constant rise in the past decade. The no. of two wheelers in the Kathmandu valley has seen an exponential growth. This is giving rise to problems such as traffic management and road congestion. Personal vehicles are competing with mass public transportation and parking zones and parking policy need to be built.
Mass transportation system needs to be encouraged with the population.This can be done by economizing the fares, ensuring proper management and scheduling of the public transport, integration of the different modes of transportation. Encouraging walking for short distances and innovative ideas such as rental cycles, etc.
The current parking facilities are not sufficient to cater the demand as the growing number of small vehicles especially the motorcycle and micro bus has created a traffic mess in the city. Undisciplined driving is another challenge for traffic management.
5.1. Parking policy and concern over parking crisis
The Kathmandu Metropolitan City (KMC) has received a green light to implement free parking facility to public. The Appellate Court on Thursday lifted a stay order on KMC’s proposal to designate free parking areas in the valley. KMC had planned to implement the proposalbeginning 16 December, but was halted by a stay order from the Appellate Court, which was acting on a writ filed by private parking contractors. The Court decision has paved way for KMC to designate 73 free parking spots throughout Kathmandu, including in Durbar Marg, Kichapokhari, Baneshwor and Kalimati. According to KMC, the spots willbe open from 6am to 9 am. [24]
The KMC has identified three long-term parking areas to ease traffic chaos in the capital. There is a proposal to construct new parking areas at Bhugol Park, Social Welfare Council and National Academy Hallwhich has been forwarded to the DoTM and Traffic Police. KMC has also circulated a notice to all malls and shopping complexes to use their
35

basement areas for parking in order to ease traffic pressure on roads.[14]
It is necessary to build parking space for multi storied commercial buildings. Currently, KMC exempts building free for private parking above 1500 sq. feet and grants permission to operate such parking. A few parking stations alongside Bishnumati river are coming soon.
Even though nine months have passed since the Kathmandu Metropolitan City (KMC) announced tender for 73 parking lots in the capital, it hasfailed to develop the parking lots. As a result the KMC is losing millions of rupees in revenue. From the 73 identified parking lots theKMC could have collected Rs 16.7 in revenue, but at this time, the KMChas been collecting only 1.3 million from the existing parking lots. All the identified places by the KMC are, nonetheless, are being used as parking lots, though many of them are illegal. [26]
The parking policy measures that can be taken include encouraging private land use for parking business, improving the road network and opening a river corridor for alternative routes and bringing non-stop parking policy particularly in core city areas.
KMC has fixed Rs. 5 and Rs. 10 for two-wheelers and four-wheelers respectively for one-hour parking. However, public complaints against the monopoly of contractors have been coming to the fore time and again. Kathmandu needs to formulate a parking policy as a travel demand management measure. [14]
5.2. Other congestion reduction strategies
There is a requirement of congestion reduction strategies. There are afew guidelines on parking policy which can help with reducing traffic congestion and improve traffic management.
- Provide parking for public transport vehicles- Innovative parking strategies for residential areas for demand
management- Stringent penalty on parking violations.- Parking pricing and using the parking revenue for other
congestion reduction strategies- Integrate parking design with multi-modal integration with
priority to public transport5.3. Fiscal measures – vehicle taxation etc.
36

There is an annual tax for all vehicles including personal vehicles, higher taxed on bigger cards and less taxes on buses.
Figure 23. Vehicle Tax levied in Kathmandu
5.4. Multi-modal integration
Figure 24. Peak hour modal split in Kathmandu Valley
There are two major modes of transport in Nepal: Road and Aircraft. There is a small sector of railways and no waterways.
Being a mountainous country, road construction is difficult and expensive in mountains. Lowland has 54% black topped roads while the mountain region above 3000m has only 147km of black topped, 158km of graveled and 145km of earthen roads. A 13 km Trolley bus service was developed in 1975 in Kathmandu Valley with the Chinese assistance. The
37

railway was the first made of modern transport installed in 1935, but it remains the most neglected sector. A 51 km narrow guage railway still runs between Janakpur-Jayanagar in Terai. [17]
5.5. Integration of different modes of transport
In areas having motor roads, maintenance of roads has become a challenge and in certain roads, authorities have started to raise funds from the vehicles for using particular roads. The government is planning to extend networks of motor-able roads to each and every district and also to improve the quality of roads and proper maintenance. Dry ports of Birgunj and Bhairahawa are connected directly to the Calcutta port with broad gauge railway. [19]
6. Best practices/initiatives from Nepal
Tourism is pedestrian. Kathmandu has a vehicle free zone which is a place to hangout for city dwellers and tourists. The metropolitan cityhas a vision to extend the vehicle free zone apart from which, few kilometers of cycle track is built in and several kilometers of cycle land is being planned. In Pokhara, a long stretch of lakefront is being pedestrianized. [18]
Kathmandu initiated a series of steps to clean up its air as the ‘first generation action’. The steps included the introduction of the Nepal Vehicle Mass emission standards, the ban on import of second-hand and reconditioned vehicles, phasing out of three-wheeler diesel tempos, three wheeler two-stroke engine vehicles, introduction of vehicle emission standards for in-use vehicles and ban on new registration of Bull Trench kiln brick manufacturing industries in the valley.
During the Tenth Plan period, the vehicle transport management guideline was implemented. The long term vision for the transport management plan was to make the transport system safe, affordable, organized, non-polluting and service-oriented, through qualitative services. [19]
- Initiatives are being taken to make the transport system environmentally sustainable.
- Provision for compulsory EIA for the construction of new roads and highways.
- Introduction of compulsory pollution testing to vehicles.
38
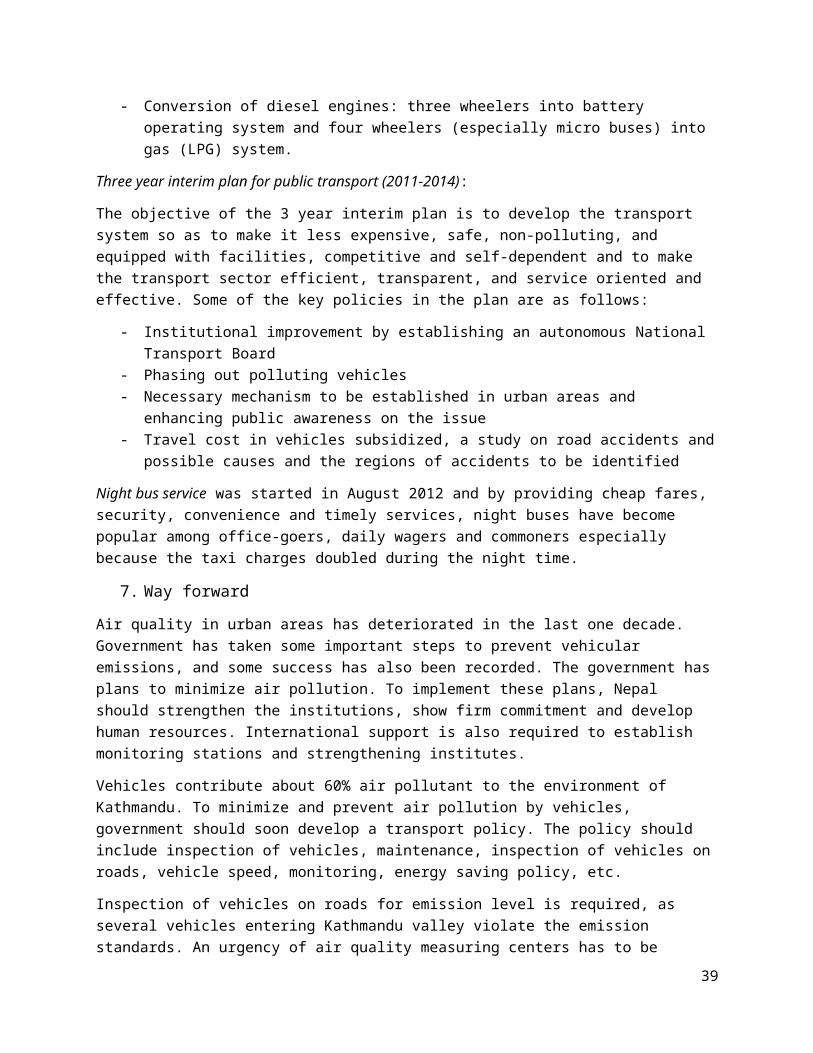
- Conversion of diesel engines: three wheelers into battery operating system and four wheelers (especially micro buses) into gas (LPG) system.
Three year interim plan for public transport (2011-2014):
The objective of the 3 year interim plan is to develop the transport system so as to make it less expensive, safe, non-polluting, and equipped with facilities, competitive and self-dependent and to make the transport sector efficient, transparent, and service oriented and effective. Some of the key policies in the plan are as follows:
- Institutional improvement by establishing an autonomous National Transport Board
- Phasing out polluting vehicles- Necessary mechanism to be established in urban areas and
enhancing public awareness on the issue- Travel cost in vehicles subsidized, a study on road accidents and
possible causes and the regions of accidents to be identified
Night bus service was started in August 2012 and by providing cheap fares, security, convenience and timely services, night buses have become popular among office-goers, daily wagers and commoners especially because the taxi charges doubled during the night time.
7. Way forward
Air quality in urban areas has deteriorated in the last one decade. Government has taken some important steps to prevent vehicular emissions, and some success has also been recorded. The government hasplans to minimize air pollution. To implement these plans, Nepal should strengthen the institutions, show firm commitment and develop human resources. International support is also required to establish monitoring stations and strengthening institutes.
Vehicles contribute about 60% air pollutant to the environment of Kathmandu. To minimize and prevent air pollution by vehicles, government should soon develop a transport policy. The policy should include inspection of vehicles, maintenance, inspection of vehicles onroads, vehicle speed, monitoring, energy saving policy, etc.
Inspection of vehicles on roads for emission level is required, as several vehicles entering Kathmandu valley violate the emission standards. An urgency of air quality measuring centers has to be
39

realized. Because of the bowl shape topography of the valley, the pollution scenario becomes alarming.
Nepal has set vehicle and air quality standards for three pollutants (CO, HC and smoke). There are other pollutants that also need to be measured and their standard should be set. In this concern, immediate initiative should be taken to set standard for PM10, Pb, SO2 and NO2.
The fuel used in vehicles is adulterated by the dealers, thus emittingmore pollutants and deteriorating the condition of vehicles. One of the measures that can discourage adulteration is fuel pricing. There is remarkable difference in price of kerosene, diesel and petrol. If price of kerosene is brought near that of diesel, adulteration rate would go down (kerosene is subsidized by the government). Link import policy with the technology and fuel quality leapfrog to cleaner fuel and vehicle technology: Introduce Euro IV fuels nation-wide.
A comprehensive environment action plan would help in overall management.
There is an urgent need for expanding and strengthening the monitoringnetwork for more comprehensive pollution coverage, reliable data and enforcing monitoring protocol for credible data. The following steps can be followed to develop proper monitoring methods and regulations:
- Design air quality monitoring to enable health assessments – actions plans can be drawn up only if they are conjoined with other assessment techniques. Precise estimates of pollution sources, along with their contribution to the total pollution load and the rate at which the sources are expected to increase are also required.
- Enforce quality audits of monitoring stations - introduce daily smog alert system: make monitoring more relevant to public health. Implement a daily smog alert system to enable the city authorities to enforce pollution emergency measures.
The following recommendations can be initiated for improving public transport:
Improve the frequency, reduce overcrowding, providing service during night time, uniformity in public transport fare, monitoring of reckless driving, and maintenance of public transport, route
40

management and establishment of Ministry of Transport and Investment on public transport.
There is a mobility crisis eminent in the valley due to inefficient traffic management and road infrastructure. The concentrations of various pollutants like particulate matter in the ambient air are causing more health problems by the day. The habitations on road-sidesand in the vicinity of heavy traffic zones are at a high risk of contracting respiratory problems and the effect is maximum on the poorer populations.
These are few of the many problems that are being faced by the population and their impacts will only extrapolate in the near future.Proper control and mitigation of air pollution is the need of the houror face masks will have to be the new fashion trend among men, women and children alike and air purifiers will become a must for every household.
41
REFERENCES:
1. World Health Organization Media Centre, Air Quality and Health Key Facts, www.who.int/mediacentre/factsheets/fs313/en
2. Clean Air Initiative, Country Synthesis Report on Urban Air Quality Management, India, Discussion Draft, (December 2006).
3. Clean Energy Nepal (CEN), Environmental and Public Health Organization (ENPHO), Health Impacts of Kathmandu’s Air Pollutionsubmitted to Kathmandu Electric Vehicle Alliance, (September 2003).
4. Mikael Malinovsky, Air Quality Management in Kathmandu Valley, A component under the HMGN/DANIDA Environment Sector Program Support (ESPS), A Journal of the Environment, Vol. 6, No. 7, (2001)
5. Majumder et al., Assessment of occupational and ambient air quality of traffic police personnel of the Kathmandu valley, Nepal; in view of atmospheric particulate matter concentrations (PM10), Atmospheric Pollution Research 3, 132-142, (2012)
6. Clean Air Initiative, Country Synthesis Report on Urban Air Quality Management, Nepal, Discussion Draft, (December 2006).
7. Clean Air Network Nepal, Clean Air News, Volume 6 Issue 8, August2012
8. Suman Udas, Clean Air Network Nepal and Clean Energy Nepal, Public Transport Quality Survey. (2012)
9. Briefing Note, Challenge of Urban Air Quality and Mobility Management in South Asian Cities, Centre for Science and Environment.
42

10. Shobhakar Dhakal, Urban Transportation and the Environment, Institute for Global Environmental Strategies (2006)
11. Monitoring stations long defunct, Kathmandu Post, http://www.ekantipur.com/the-kathmandu-post/2011/01/16/metro/monitoring-stations-long-defunct/217300/ (2011)
12. What are the Six Common Air Pollutants? USEPA website, www.epa.gov/airquality/urbanair
13. Public Transport System Performance and Possible Improvement, Mission Report, Kathmandu Valley Mapping Program, KMC/European Commission (2001)
14. Anumita Roychowdhury, Air Quality and Sustainable Transportation Challenge in South Asian Cities, Centre for Science and Environment (2012)
15. Chop Lal Bhusal, Situation Analysis of Environmental Health in Nepal, Nepal Health Research Council (2009)
16. Kathmandu can manage its urban transportation and become pollution-free if it builds on its strengths – its emission-free non-motorized transport: says CSE, http://cseindia.org/content/kathmandu-can-manage-its-urban-transportation-and-become-pollution-free-if-it-builds-its-str
17. P.K. Jha, Transport Sector Technical Inspection System in Nepal, Central Department of Botany
18. Prashanta Khanal, Walkability in Nepal, Clean Energy Nepal, Clean Air Initiative, Clean Air Network Nepal.
19. Yuba Raj Pandey, Transport Management System of Nepal, Ministry of Labour and Transport Management, (February 2009)
20. Dr. B.B. Ale, Fuel Quality and Vehicle Technology Roadmap for Clean Air – Alternative Initiative, Workshop on air quality and sustainable transportation challenge, 26 July 2012
21. Manjeet Dhakal, Walking and Cycling, CANN, CEN, Workshop on Air Quality and sustainable transportation challenges in South Asian Countries, July 2012.
22. Air Pollution giving Capital denizens a cough, The HimalayanTimes, 5 December 2013, http://www.thehimalayantimes.com/fullNews.php?headline=Air+pollution++giving+Capital+denizens+a+cough&NewsID=398698
23. Diesel Generators choking Kathmandu, Sci Dev, http://www.scidev.net/south-asia/environment/news/diesel-generators-choking-kathmandu.html
43

24. Free parking in Kathmandu today onwards, 27 December 2013, Nepal News, http://www.nepalnews.com/index.php/society-archive/28841-free-parking-in-kathmandu-today-onwards
25. Way to solve urban mobility problems, 13 March 2013, The Himalayan Times, http://www.thehimalayantimes.com/fullNews.php?headline=Public+transportation+&NewsID=369249
26. 73 new parking lots in Kathmandu in limbo, 18 November 2013,My Republica, http://www.myrepublica.com/portal/index.php?action=news_details&news_id=64726
27. Sajha Yatayat to resume service, 7 February 2013, Ekantipur.com, http://www.ekantipur.com/2012/02/07/capital/sajha-yatayat-to-resume-service/348555.html
28. Sajha Yatayat to resume service from February 2013, September 17 2012, Ekantipur, http://www.ekantipur.com/2012/09/17/business/sajha-yatayat-to-resume-service-from-february-2013/360358.html
29. Vehicles grew 15 times in 20 years, 22 April 2011, The Himalayan Times, http://www.thehimalayantimes.com/fullTodays.php?headline=Vehicles+grew+15+times+in+20+yrs&NewsID=285120
44

DHAKA:
Figure 1. Updated Bangladesh National Ambient Air Quality Standardsvs. WHO Guideline Values and US EPA Standards. [1]
1. Introduction
Dhaka is the capital city of Bangladesh. It covers an area of 360 km2 and is one of six municipalities in the middle of the Dhaka Metropolitan Area known as the Capital Development Authority. The cityis situated in the populous and flood-prone Ganges-Brahmaputra delta. Dhaka is in effect an island within the delta, especially during floods in the wet season (Asian Development Bank [ADB] 2001).
As of mid-2005, 137 million people resided in Bangladesh. The population at that time grew at an annual rate of 1.4%. The populationdensity of 928 persons per km2 was also among the highest in the world. Urban population share was 25.1% and grew at 3.0% annually (ADB2006).
Dhaka is the center of economic, political, and cultural activities inBangladesh. The city’s urban infrastructure is the most developed in the country and has seen in recent years, the modernization of its transport, communication, and public works sectors. As the city attracts more industries, the capital is facing severe challenges suchas pollution, congestion, and supply shortages. [1]
45

The common types of industries in and around the periphery of Dhaka are ready-made garment manufacturing, jute, tanneries, textile, tea processing, fertilizer, cement, paper and pulp, chemicals and pesticides, food and sugar, pharmaceuticals, petroleum refinery, distillery, rubber, plastics, and brick manufacturing, assembling buses, trucks, and motorcycles, assembling radios and televisions (Male Declaration 2000).
The World Health Organization estimates that up to 10,000 premature deaths a year in Bangladesh are attributed to air pollution.
The annual average tropospheric nitrogen dioxide levels of Dhaka increased by approximately 75 per cent between 2003 and 2010. A combination of numerous local emissions sources in winter in addition to special local and regional winter meteorological conditions gives the city exceedingly high air pollution concentrations. [2]
Although Dhaka’s vehicle fleet is not large, high traffic volumes, congestion, and poor vehicle maintenance has resulted in the transportsector being a major contributor to air pollution. In addition, inefficient land use and overall poor traffic management further adds to traffic congestion and air pollution. Motor vehicles are oft en old, overloaded, and poorly maintained. Old trucks and dilapidated mini-buses are also common. [1]
2. Air Quality
The air pollution level is high in the major cities in Bangladesh, particularly, Dhaka and Chittagong. Particulate matter is the most significant pollutant of concern, especially during the winter season when rain fall is minimal and wind speed is low. The known sources of pollution include: Older and smoke-emitting diesel buses and trucks, industrial emission sources including brick kilns, long range transport and diesel generators.
In the Dhaka city, the blackening of the ambient air and reduced visibility are observed in some areas, especially during dry seasons, even with unaided eyes. Episodes of choking smells and irritating eyesare quite common. [3]
The main influencing factors for the emissions of pollutants and deterioration of air quality in Dhaka [3] are:
46

1. Rapid urbanization resulting in increased construction activitiesleading to dust emissions and requiring large volumes of brick production in hundreds of brick kilns in the neighborhood of the city causing further pollution.
2. Increasing transportation demand, resulting in a growth in vehicle emissions and suspended road dust
3. Unplanned industrialization
4. Possible regional and trans-boundary movement of air pollution
2.1. State of urban air quality in Dhaka and other cities
Since the monitoring for the different areas were conducted for limited periods only, it is difficult to assess accurately the AQ problem in these cities. The information, however, indicates high levels of PM (in TSP) for other cities.
Figure 2. Results of Ambient Air Quality Analysis at various areas inChittagong (µg/m3). Source: ADB, 2005. [1]
47

Figure 3. TSP concentrations in some Major Cities in Bangladesh.Source: ADB, 2005. [1]
2.2. Air quality trends – pollutant and monitoring location wise
As of November 2013, PM10 and PM2.5 are the most critical pollutants and 24-hour average for both concentrations were found increasing tendencyof non-compliance with the BNAAQS. All gaseous pollutants except NOx measured at 11 CAMS did not exceed limit values except 5 stations. Although due to decreased average wind speed and precipitation during November-2013, dispersion and wash out of pollutants has decreasing tendency and thus the pollution concentration levels showed increasingtrend. [4]
Since AQ monitoring data has only been consistently gathered at constant locations only for five years in Dhaka, it is insufficient toindicate long-term trends in the AQ of the city, but can only provide indications of tendencies. It has provided enough data, however, to determine variations in AQ based on seasonal changes.
Although the total number of vehicles in Dhaka is small relative to the population, the city suffers from high levels of ambient air pollution due to vehicular emissions. About 1,000 MT of pollutants arepumped into the environment every day in Dhaka, of which 70% comes from vehicles. Other polluters are industrial units, garbage burning and other biomass burning by the slum dwellers and the burning of coaland wood by the large number of brick works in and around the city. There is indiscriminate throwing of plastic bags and other garbage in drains making them clogged. This, in turn results in flooding and traffic congestion. [5]
PM
PM concentrations (as PM10 and PM2.5) on an annual basis in the city of Dhaka indicate a slightly increasing tendency from April 2002 to July 2006 (2002 data is average of concentrations from April to December and 2006 data is average of concentrations from January to July 2006). Both PM10 and PM2.5 concentrations exhibit levels exceeding World Health Organization (WHO) guidelines as well as exceedmore than twice the national standards of annual PM10 (50μg/m3) and PM2.5 (15μg/m3). [1]
48

Figure 4. Annual average PM10 and PM2.5 in Dhaka. Source: Nasiruddin,2006. [1]
NO2
Long-term Nitrogen dioxide (NO2) data are not as available as PM data.To date, there is limited information to indicate long-term annual trend in NO2 concentrations, but annual average concentration of NO2 for 2003 of 27.6 parts per billion (ppb) will indicate that NO2 does not exceed annual ambient standards of 53ppb. [1]
Figure 5. Seasonal Variations in NO2 concentrations in Dhaka. Source:Nasiruddin, 2006. [1]
SO2
49

Sulfur Dioxide peaks are also observed during the months starting in November due to the winter season in the country in this period and its related meteorology. The available AQ monitoring results do not allow for long-term analysis of annual concentration trends. Annual average concentration for 2003 (6.67ppb) is within the national ambient AQ standard of 30ppb. [1]
Figure 6. Monthly concentrations of Sulfur Dioxide in Dhaka. Source:Nasiruddin, 2006. [1]
Figure 7. Spatial Distribution of PM10 and PM2.5 at the monitoring sitesin Dhaka. [6]
50

2.3. State of air quality monitoring -- no. of air quality monitoring stations – manual and real time, pollutants being monitored
In the past, most AQ monitoring efforts were undertaken in the capitalcity of Dhaka. With support from the World Bank and DOE, Bangladesh now has some capacity to monitor AQ using continuous AQ monitors. DOE has set up four monitoring stations in four divisional towns namely, Dhaka, Chittagong, Khulna, and Bogra. The parameters measured are PM, Sulfur oxides (SO), NOx, and CO.
The Objectives of Air Quality Monitoring in Bangladesh [6] are:
- To monitor the criteria pollutants
- Chemical Characterization of the pollutants (mainly PM)
- Source Identification and Apportionment
- Long Range Transport Studies
Name of Analyzer MethodPM10 and PM2.5 Beta GaugeSO2 Ultra Violet Fluoroscence
PhotometryO3 Ultra Vilolet Absorption
PhotometryNOx Chemiluminescence
PhotometryCO Infrared Radiation
PhotometryVOC Gas Chromatography (FID)
Figure 8. Working Principles of Different Analyzers. [6]
In 2002, a Continuous Air quality Monitoring Station (CAMS) was established at the premises of the national Parliament Building located at the heart of the capital city, Dhaka, under the World Bank-financed Air Quality Management Project (AQMP). Continuous monitors—measures NOx, CO, SOx, ozone [O3]), and methane and non-methane hydrocarbons (NMHCs) continuously for 24 hours. The data are recorded as hourly averages from which 8-hour, 24-hour, and other averaging periods can be generated (Akhter et al. 2003).
51

In 2006, another CAMS was set up at the premises of Bangladesh Television Center in the port city of Chittagong. The station also monitors criteria pollutants like SOx, NOx, CO, O3, NMHC, PM10, and PM2.5.
In 2011, a three-year institutional collaboration was established between the Norwegian Institute for Air Research (NILU) and the Department of Environment in Bangladesh. With support from Norway, thegoals were to improve local expertise in air quality monitoring and planning in one of the world’s most densely populated cities. To determine where to place the permanent monitoring system, and to get an idea of the current air quality. [7]
The CASE project by the Government of Bangladesh measures the air quality in major cities and monthly reports of the air quality at the monitoring sites can be obtained on the CASE website under Reports andPublications.
The ambient air quality monitoring network consists of eleven fixed CAMS.
52
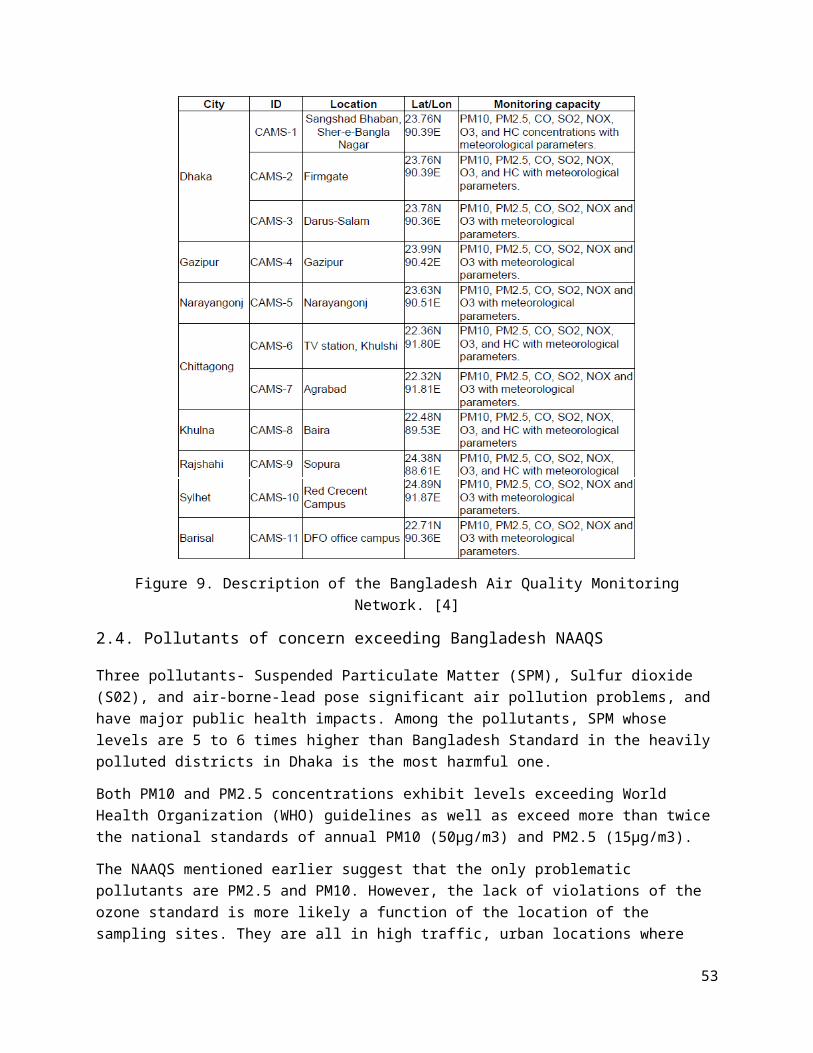
Figure 9. Description of the Bangladesh Air Quality MonitoringNetwork. [4]
2.4. Pollutants of concern exceeding Bangladesh NAAQS
Three pollutants- Suspended Particulate Matter (SPM), Sulfur dioxide (S02), and air-borne-lead pose significant air pollution problems, andhave major public health impacts. Among the pollutants, SPM whose levels are 5 to 6 times higher than Bangladesh Standard in the heavilypolluted districts in Dhaka is the most harmful one.
Both PM10 and PM2.5 concentrations exhibit levels exceeding World Health Organization (WHO) guidelines as well as exceed more than twicethe national standards of annual PM10 (50μg/m3) and PM2.5 (15μg/m3).
The NAAQS mentioned earlier suggest that the only problematic pollutants are PM2.5 and PM10. However, the lack of violations of the ozone standard is more likely a function of the location of the sampling sites. They are all in high traffic, urban locations where
53

the emitted NO titrates the ozone to low concentrations. In the US, the siting criteria would avoid such locations in order to provide a more accurate estimation of the likely ozone concentrations. [8]
A standard that should be modified in the NAAQS would be the lead standard level that should be revised to 0.15 μg/m3. [8] There is sufficient evidence of neurological harm at levels higher than this tojustify the lower value particularly to protect more susceptible children.
2.5. What is the air pollution source contributing to high levelsof pollution?
Although emission inventory data is not available but source apportionment studies of 2006 showed that the vehicles were the secondlargest contributors after the brick kilns, to carbonaceous content ofairborne particulate matter in Dhaka. However, increasing population of the vehicles will make them the main contributor of air pollution in the city as the brick kiln activities in the neighborhood are boundto decline. [9]
The vehicles in near future may be expected to become the primary contributors to air pollution due to: [9]
- Fast increasing population of motorized vehicles as the economy of the country grows
- Brick kilns are easier to control being point sources and these activities can also be moved away from the city
- Contribution of other sources like domestic burners which use natural gas is expected to be low as these use a lot of excess air and are steady combustion appliances & low emitters of CO.
Emissions inventory of mobile sources in Dhaka show that contributionsof different vehicles dominate certain types of pollutants. Petrol-fueled light-duty vehicles (cars/vans) and auto-rickshaws contribute 85% Carbon monoxide (CO), while diesel-fueled buses and trucks contribute 84%—most of total Nitrogen oxides (NOx). Two- and three-wheeled auto-rickshaws contribute about half of the total hydrocarbon (HC) emissions, while particulate matter (PM) emissions come mostly from diesel buses and trucks (45%), and autorickshaws (40%). [1]
54

Figure 10. Average Mass Contribution to Particulate Pollution inDhaka, 1993-1994 (%). (Source: Biswas et al., 2000)
The Bangladesh Atomic Energy Commission (BAEC) studied the trace element composition of samples particulate matter with a diameter of not more than 10 microns (PM10) and particulate matter with a diameterof not more than 2.5 microns (PM2.5) in Dhaka during 1993–1994, using the positive matrix factorization method (PMF) (Biswas et al. 2000).
2.6. Why vehicles are a special challenge
Vehicle population in Dhaka today stands at about 708 thousands which accounts for 41 % of total vehicle population of 1,752 thousands in the entire country. The vehicle population growth since the year 2003 has been close to 135% both in Dhaka as well in whole of Bangladesh. [9]
Nearly all the vehicles in Bangladesh are imported, the new ones from China, India and South Korea, and the reconditioned ones from Japan. Hence, the emission standards prevalent in these countries constitute an important factor to be considered besides the fuel quality and alternative fuel that is likely to be available in the country. [9]
3. Air pollution and health impact studies
Air pollution is estimated to be responsible for approximately 3,580 premature deaths, 10 million restricted activity days and 87 million respiratory symptom days per annum. The economic loss associated with
55

these health problems could range from a low estimate of $60 million to a high estimateof $270 million, equivalent to 1.7 to 7.5% of the city’s gross product. [1]
If added with traffic congestion, global warming, soiling of materials, and aesthetic degradation, the total cost of air pollution would be substantially larger (Xie et al. 1998).
3.1. Air pollution and health impact studies conducted so far
In 1997, a study conducted by the Health Economics Unit of the Ministry of Health and Family Welfare found that the concentration of lead in blood (PbB) among the residents of the metropolis has reached alarming levels. Blood samples of 39 people that were analyzed under the survey were all above the maximum tolerable limit of 10 microgramsper deciliter (μg/dL) recommended by WHO. The concentration levels ranged from a minimum of 13 μg/dl to a maximum of 132 μg/dL. The survey also found that Pb levels in the blood of 12 professionals who attend offices in the Motijheel Commercial Area averaged 55.8 μg/dL. [1]
In February 2000, another study determined the PbB levels of children at schools in Dhaka and evaluated the sources of environmental exposure, and potential risk factors for lead poisoning. Selected schools represented a range of geographic and socioeconomic strata. The mean PbB level was 15.0 μg/dL (range 4.2–63.1 μ/dL). Most students(87.4%) had PbB levels above the WHO guideline (10 μg/dL). Among othercorrelations, elevated PbB levels correlated with children living close to major roads (odds ratio = 2.30; 95% CI, 1.23–4.29. PbB levelsmeasured were similar to those in other countries that use leaded gasoline. [1]
Combustion of leaded gasoline is the main source of lead exposure in Dhaka, resulting in ubiquitous contamination of the environment (Kaiser et al. 2001).
In addition, it has been found that Dhaka city has volatile organic compounds (VOCs) exceeding tolerable limits. Emissions from 2-stroke auto-rickshaws were found to contain four to seven times the maximum permissible levels of VOC (DOE 2001).
3.2. Pollutants monitored and their health effects
56
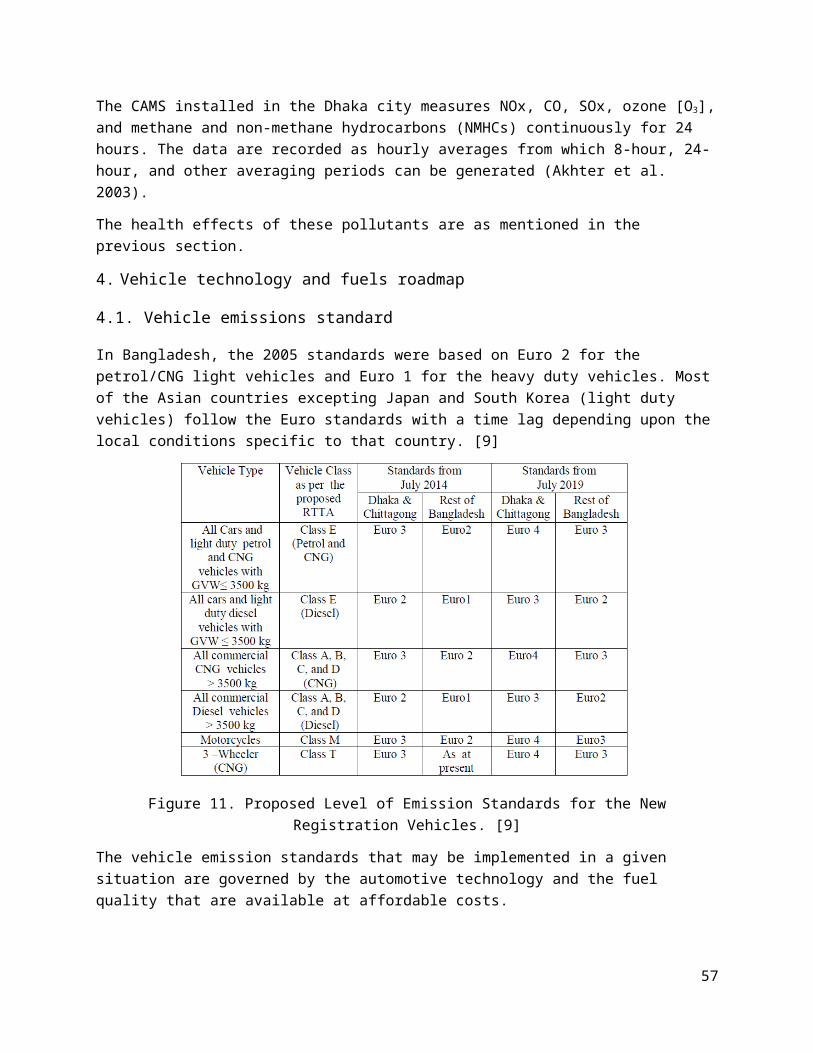
The CAMS installed in the Dhaka city measures NOx, CO, SOx, ozone [O3],and methane and non-methane hydrocarbons (NMHCs) continuously for 24 hours. The data are recorded as hourly averages from which 8-hour, 24-hour, and other averaging periods can be generated (Akhter et al. 2003).
The health effects of these pollutants are as mentioned in the previous section.
4. Vehicle technology and fuels roadmap
4.1. Vehicle emissions standard
In Bangladesh, the 2005 standards were based on Euro 2 for the petrol/CNG light vehicles and Euro 1 for the heavy duty vehicles. Mostof the Asian countries excepting Japan and South Korea (light duty vehicles) follow the Euro standards with a time lag depending upon thelocal conditions specific to that country. [9]
Figure 11. Proposed Level of Emission Standards for the NewRegistration Vehicles. [9]
The vehicle emission standards that may be implemented in a given situation are governed by the automotive technology and the fuel quality that are available at affordable costs.
57

Figure 12. Bangladesh Emission Standards for Diesel Vehicles duringRegistration. [9]
Emission standards are different for the different categories of vehicles. The standards depend on the size of engine/vehicle such as motorcycles, cars, buses, etc. and on application of vehicles namely light duty for individual passengers or heavy duty for mass and passenger transport; the trucks and buses. The standards also depend on the fuel used, e.g. for petrol and CNG fueled vehicles the standards are set only for CO, HC and NOx. For the diesel vehicles, smoke and particulate emission standards are also specified.
Figure 13. Bangladesh Emission Standards for Petrol and CNG DrivenVehicles during Registration (Light and Medium Duty Vehicles) [9]
58

4.2. Fuel quality
It is envisaged that fuel quality will undergo upgrading as most of the fuel is imported as the finished product and the refineries all over the world are producing fuels of superior quality to meet the demands of low emission vehicles in their own country and for exports.[9]
Fuel quality specifications are to match the needs of the vehicles manufactured to comply with the revised emission standards. An important factor is that in Dhaka most cars, other light duty vehiclesand three wheelers operate on CNG.
Motorcycles are the primary users of gasoline and these use mostly thepremium grade of gasoline as the regular grade of gasoline has a very poor octane number (80 RON). The regular grade gasoline should be suitably upgraded for use of motorcycles and its octane quality may beincreased to 91 RON minimum in line with the practice in Europe and most other Asian countries. This improved regular grade gasoline is expected to meet the requirements of motorcycles as well as of most ofnew petrol cars and station wagons etc. [9]
Figure 14. Key Diesel Fuel Characteristics to meet the Revised VehicleEmission Standards in Dhaka and Chittagong. [9]
Revisions to gasoline fuel quality particularly related to density, sulfur, content, gum content and hydrocarbon composition based on
59

European specifications EN 228: 1999 and 2004 are recommended. Similarly, based on European diesel fuel specifications EN 590:1993 and 1999, the revised specifications for key diesel fuel properties viz., density, cetane number, sulfur, viscosity etc. are also recommended. Additional parameters such as polyaromatic hydrocarbons and lubricity of ultra-low sulfur fuels are also included from the year 2019. [9]
For the diesel vehicles more advanced emission controls are directed towards reduction of PM and NOx emissions. The CO and HC emissions from the diesel vehicles are not of major concern. The diesel fuel characteristics that are important for low pollution engines/vehicles include;
- Sulfur content: it is important from the point of PM emissions. Sulfur < 500 ppm for Euro 2 and < 350 ppm for Euro 3 is required
- Cetane number preferably 48 and above for good combustion
- Lower final and 90 % or 95% boiling temperatures for good engine combustion, low deposits and hence low emissions over a longer period of engine operation
4.3. Dhaka’s CNG Program
The air quality in Dhaka is one of the worst in the world and to combat the problem of rising concentrations of the air pollutants, thegovernment launched an initiative that led to widespread conversion ofpetroleum motor vehicles to CNG vehicles. It is estimated that around 6,000 premature deaths were avoided in Dhaka in 2009 because of the switch from petroleum to CNG vehicles. This amounts to a saving of USD1.15 billion in 2009, which is around 1.3% of the GDP of the country. [11]
CNG as an automobile fuel was first introduced in Dhaka in 1995 (Rupantorito Prakritik Gas Company Limited, RPGCL 2009), although it did not gain a momentum initially. Use of CNG for petroleum vehicles has various advantages. The particulate emissions from CNG vehicles are much lower than corresponding petrol or diesel vehicle, helping improve the air quality (Kremer 1999). [11]
The transition from petrol/diesel to CNG was gradual and a list of steps taken by the government facilitated the smooth transition. [11]
60

1. The CNG industry got some momentum during early 2000 when CNG runtaxis were introduced in Dhaka city
2. Replacing the old two-stroke petrol run autorickshaws with 9,000 new CNG run autorickshaws also helped the industry gain a critical mass, especially to expand the CNG refueling network.
3. At the same time the government instructed mandatory retrofittingof all government vehicles with CNG conversion kits.
4. The government also encouraged the conversion of private vehiclesby making several policy initiatives
4.1. By exempting import duty on CNG conversion kits and CNG storage cylinders
4.2. By increasing the prices of petroleum fuel (which were subsidized before), etc.
All these initiatives led other vehicles (private cars, SUV’s, minibuses, buses) to gradually switch to CNG from petroleum. The primary local benefits of CNG conversion is the reduced emissions and reduced adverse health impacts.
In 2007, the only Continuous Air Monitoring Station in Dhaka registered a 24-hour average annual PM2.5 concentration of 109 μg/m3
(Department of Environment 2007). In the absence of the CNG conversionpolicy, the annual average PM2.5 would have been 120.6 μg/m3. Thus an improvement of 11.6 μg/m3 can be attributed to the policy. [11]
Of the total 134,000 vehicles converted, only around 2,000 15 (1.5%) were buses or minibuses, but these vehicles were responsible for around 40% of emissions reduction. The large reduction is a result of larger vehicle activity of buses and minibuses and of higher emissionsfrom the buses or minibuses, which run on diesel. In fact 79% of the PM10 reductions are due to the conversion of 9,852 diesel vehicles, theconversion of the 97,483 petrol vehicles result in only 21% emissions reduction. This clearly indicates that diesel to CNG conversions have larger health benefits. [11]
In Dhaka, nearly 95% of the passenger cars, taxis and 3-Wheelers and about 80% of station wagons are fuelled by CNG. About 50% of buses arealso CNG operated. CNG has very little sulfur and no lead. There are
61

no engine operation related issues concerning volatility or storage stability of CNG. The CNG vehicles also use spark ignition engines. [9]
Diesel trucks are not permitted to enter the city during day. If all the city- buses are mandated for CNG alone operation, then Euro 2 standards for heavy vehicles can be easily implemented for Dhaka.
4.4. Alternative fuel program
In Bangladesh, two grades of gasoline, regular and premium are marketed. The characteristics that need improvements specifically fromthe point of vehicles meeting the revised emission standards related to are Density, Lead Content, Gum Content, Sulfur and Hydrocarbon composition.
4.5. Electric vehicles
In May 2013, at the 7th Stakeholders-cum-Regional Coordination Meetingof Male Declaration on Control & Prevention of Air Pollution organizedby the Environment and Forest Ministry in Dhaka, the Environment and Forest Minister of Bangladesh, Hasan Mahmud said that hybrid electric vehicles can be the future alternative to the existing vehicles. Tax structure for the production and import of hybrid vehicles could be eased to popularize the use, Mahmud said.
5. Mobility crisis
An exponential growth in the number of vehicles on the Dhaka roads hasbeen observed in the recent past while there hasn’t been a similar increment in the volume of roads to accommodate this rise. The modal share of the vehicles shows that motorcycles and private cars make up most of the traffic volume on the roads and hence the passenger to vehicle ratio would be small.
Walking and cycling are trends that are on the rise throughout the world and even in Bangladesh but a social revolution and a change in the general layman’s attitude is still far-fetched. There are cyclist groups and they are active on social networking sites but the conditions for cycling and walking are not feasible. Most often, the footpaths are encroached by peddlers and are not pedestrian-friendly.
5.1. Increasing number of vehicles
62

Growth of vehicle population in Dhaka city is shown below. Since the year 2004 i.e., over a period of about the last 7 years, the vehicle numbers in Dhaka as well as in the whole country of Bangladesh have grown by nearly 135%.
Figure 15. Number of Year wise registered motor vehicles in Dhaka. (Obtained from www.brta.gov.bd)
Dhaka city has around a total of 708 thousand motorized vehicles out of which cars and other personal passenger vehicles number nearly 250 thousand and motorcycles 303 thousand. [9] The vehicle population change in number of different categories of vehicles in Dhaka since 2003 is shown in the figures below.
63

Figure 16. Comparison of Vehicle Population in Dhaka in the years 2003and 2012. [9]
5.2. Motorization rate
The number of vehicles in the city of Dhaka has seen a meteoric rise. Apart from Autorickshaws and Buses, every mode of transport has more than doubled its number in the period of 2003 to 2012. According to the Draft Report given by the Department of Environment of the Bangladesh Government, the % increase in the different modal population is given below. The vehicle population growth since the year 2003 has been close to 135% both in Dhaka as well in whole of Bangladesh.
Figure 17. Percent Increase in vehicle population for the Year 2012over 2003 in Dhaka. [9]
5.3. Modal share of different modes of transport
The most common mode of transport in Dhaka as of 2012 are two-wheelersconstituting 43% of the total composition followed by cars and taxis at 27%. There are also small amounts of Vans, Buses, Trucks and other modes of transport.
64

Figure 18. Composition of Vehicle Population in Dhaka. [9]
This is an indicator of the privatization in transportation and that the public transport vehicles constitute a very small percentage of the total vehicular population. This can be a major reason for trafficcongestion, parking problems and high amounts of vehicular emissions. There needs to be a shift from private transport to public transport in order to combat the mentioned issues.
Figure 19. Categorization of Vehicles in Dhaka by Fuel Used. [9]
The Bangladesh Road Transport Authority does not maintain vehicle registration records according to fuel used. They however, intend to do so in future. Through road emission inspection, the DoE collected data on the fuel used by the vehicles inspected by them.
5.4. Traffic congestion
The traffic of Dhaka comprises of pedestrian and vehicular movement; the vehicular traffic is divided again into motorized and non-motorized traffic, as well as private and public transport. Goods and passengers often need to change their mode of transport to reach their
65

destination. This requires vehicles to wait, stop or park at some points on the road network and causes traffic congestion.
The traffic system of Dhaka is severely affected by uncontrolled and indiscriminate parking of vehicles. The capacity of the link of a roadnetwork can be constrained by the capacity of its intersection. Indiscriminate parking, stopping or waiting of different types of vehicles reduce the capacities of intersections and huge losses are incurred due to delays at intersections.
Due to the poor institutional and regulatory framework and also reluctance to enforce existing laws the capacity of existing roads is reduced significantly.
5.5. State of public transport
In the table showing the number of registered vehicles in Dhaka, it isobserved that the amount of public transport vehicles is far less in comparison to two-wheelers and four-wheelers but they make up for a very small contribution of passengers.
Aside from walking and cycling, public transport is the only means of travel for the majority of the city dwellers. The relatively high costplaces these modes out of the reach of many lower paid workers. The poor service provided makes these modes unpleasant to use. The systemscompete with each other for the patronage of the traveling public mostly with inferior and out of date equipment and on roads which are badly surfaced causing additional wear and tear on the vehicles. [5]
Bus stops are badly located and routes are not advertised leading to confusion on the part of the users. The interfaces between different sub-modes are poorly designed with buses, rickshaws and baby taxis stopping in the same areas causing congestion and disorder.
There is a lack of control on the numbers and operations of the non-motorized transport modes (primarily the rickshaw) leading to inefficiencies and danger. There is a lack of encouragement from the authorities to this mode of travel and the fact that many smaller streets are in poor condition is detriment to their use within neighborhood areas.
5.6. State of intermediate public transport
66

Individual bus operators issue their own tickets, run their own schedules and stop when they feel like it. There are also the disturbing reports of the practice with some operators of refusing to pick up some passengers (women for example) due to prejudices of the individual operators or drivers. [5]
5.7. Walking and cycling
Under the Bangladesh Road Transport Regulations and Rules, 2012, the drivers of motor vehicles are to exercise due care for pedestrians. Provisions for pedestrians such as pedestrian crossing, a safety zone or a footpath are made and their implementation and construction needsto be observed.
Safety regulations are in place for pedestrians as well, the pedestrians are to walk on the footpaths and not on the adjacent roadways, every pedestrian shall, while passing across a highway, makeuse of the pedestrian crossing and in case of non-availability of footpaths, a person shall walk as near as practicable to an outside edge of the roadway and if on a two way roadway, shall walk only on the right side of the roadway.
The Government will enact a Pedestrian First Policy to ensure the construction of properly designed and continuous footpaths with well-defined and maintained pedestrian routes in the city, the provision of pedestrian crossing facilities giving the pedestrian priority over all other traffic and the prohibition of unauthorized encroachment on the footpath by street vendors and others. [5]
And, the Government will identify and promote some areas of the city as auto-free zones and provide the necessary facilities to make them pedestrian friendly so that walking becomes a favored mode of travel. [5]
5.8. Cycle rickshaws
Cycle rickshaws provide employment to unskilled labor. They are a clean mode of transportation and produce no air or noise pollution. They do not take up a lot of space and are cheap so can be used by low-income population as well.
The non-motorized transport (NMT) mode (primarily the rickshaw) has played a definite role in the overall public transport system in Dhakafor many years. However, there is a lack of control on their numbers and operations leading to inefficiencies and danger. There is a lack
67
of encouragement from the authorities to this mode of travel and the fact that many smaller streets are in poor condition is a detriment totheir use within neighborhood areas. It has been said that there are too many rickshaws in the city. Estimates of up to 600,000 have been posed against a figure of some 89,000 official licenses. In addition to these operational difficulties, the rickshaw vehicle itself needs to have a design overhaul in order to improve the operations and reduce the effort required to move it. [5]
Because of inadequate and disorganized public bus transport service, the Rickshaw has filled the vacuum created and has become a popular transport among the middle and lower middle class population. Previousstudies showed that the cost of trips by rickshaws is significantly cheaper than the auto-rickshaw (baby taxi), but considerably more expensive than buses and tempos. However, the cycle rickshaws’ range is limited with 90% of journeys within 4 km of the origin.
6. Car restraint measures
According to the Bangladesh Road Transport Regulations and Rules, 2012, no person including the Government shall own or possess, keep, drive and use a motor vehicle or continue or permit the vehicle to be used or driven unless there is in force a Motor Vehicle Authorization Certificate, granted in respect of the vehicle and the same is registered under this Act.
In order to ensure effective planning, coordination, implementation, regulation and systematic monitoring of road transport facilities and services as well as to provide advice, guidelines and technical support to the Authority there shall be an independent governmental capable body in the name of Institute of Road Transports. One of its many roles is to advise rules and procedures for conversion, retro fitment, certification and testing centers of gas (Natural Gas (NG), Compressed Natural Gas (CNG), Liquid Natural Gas (LNG), Liquefied Petroleum Gas (LPG) or hydrogen gas) operated vehicles and pollution checking centers for different types of vehicles.
6.1. Parking policy as a travel demand management measure
A more detailed study of parking supply and demand is needed with the objective of identifying permanent and temporary parking areas for vehicles. There is a draft parking policy available but it has never
68

been implemented. In part, this is due to the lack of a clear directive as to who is responsible for the implementation. [5]
One of the most important ways to control access to specific areas by some vehicles is to control the amount and type of parking spaces available. Clearly, if there are no parking spaces, then vehicle cannot stop. This is an extreme case and a balance has to be struck. The need for a parking policy is clear and some attempts have been made in the past.
In order to favor public transport and discourage automobiles, many countries have amended their planning rules. Originally it was mandatory for building complexes to provide parking to accommodate vehicles belonging to the residents and clients occupying those complexes. The amended rules limit the parking spaces in the buildings, meaning some clients will switch to public transport. As a result congestion on the road and consequent pollution level is reduced. [5]
The Government will review previous parking policies as drafted and will either amend or approve the required policy. The policy will ensure that the correct balance is struck between long-term and short-term space provision and will enforce the restrictions and parking areas clearly. [5]
Also, parking control will become the responsibility of the municipalities who will administer it through a central parking control office. The office will retain its own staff and will employ parking wardens to monitor space usage and issue tickets to violators. It is preferred that this aspect be undertaken by the private sector and the Government will enact such rules as will make this possible. [5]
6.2. Other congestion reduction strategies
Under the Bangladesh Road Transport Regulations and Rules, 2012, thereare regulations over leaving a vehicle in a dangerous position, obstruction of public street, road or highway, reckless driving, driving under influence and provides authorities with power to examinemotor vehicles, the regulations are in place but their implementation needs to be examined and improved.
The following objectives have been identified as the basis of the Parking Policy for Greater Dhaka [10]:
69

- Ensuring efficient use of road network: Allocation of road space between the needs of moving vehicles and stationary vehicles
- Ensuring traffic safety and protecting urban environment: Improper on-street parking can increase the risk of accidents andpollution related to vehicular traffic.
- Encouraging mass public transport system: Air pollution is one ofthe factors affecting the development of Dhaka, largely contributed by fumes emitted from vehicles.
- Encouraging use of bicycle: Being an environment friendly mode bicycles can fulfill the transport demand of lower and middle-income groups and of students of all income groups.
- Facilitating interchange between different modes of transport: Proper parking provisions are required for facilitating interchange of modes for passengers and goods.
6.3. Fiscal measures – vehicle taxation etc
According to the Bangladesh Road Transport Regulations and Rules, 2012, a tax at the rate, as may be prescribed from time to time, shallbe payable in respect of every Authorization certificate, every registration of a motor vehicle, and a motor vehicle used of kept for use on road.
If the tax payable is not paid within the period prescribed or fixed by the Taxing Officer, a fine equal to the sum prescribed for every day of the delay period subject to a maximum of forty percent of the tax payable for one year.
These rates may be different rates of taxes for different classes, categories or descriptions of vehicles or for vehicles used for different purposes.
7. Multi-modal integration
The greatest efficiencies in operating transportation systems are achieved when sub-modes and modes of transportation act together. In Dhaka, the existing modes and sub-modes act independently of each other and often are in competition. Whilst competition per se is not bad, the idea of allowing the sub-modes to benefit mutually from each
70
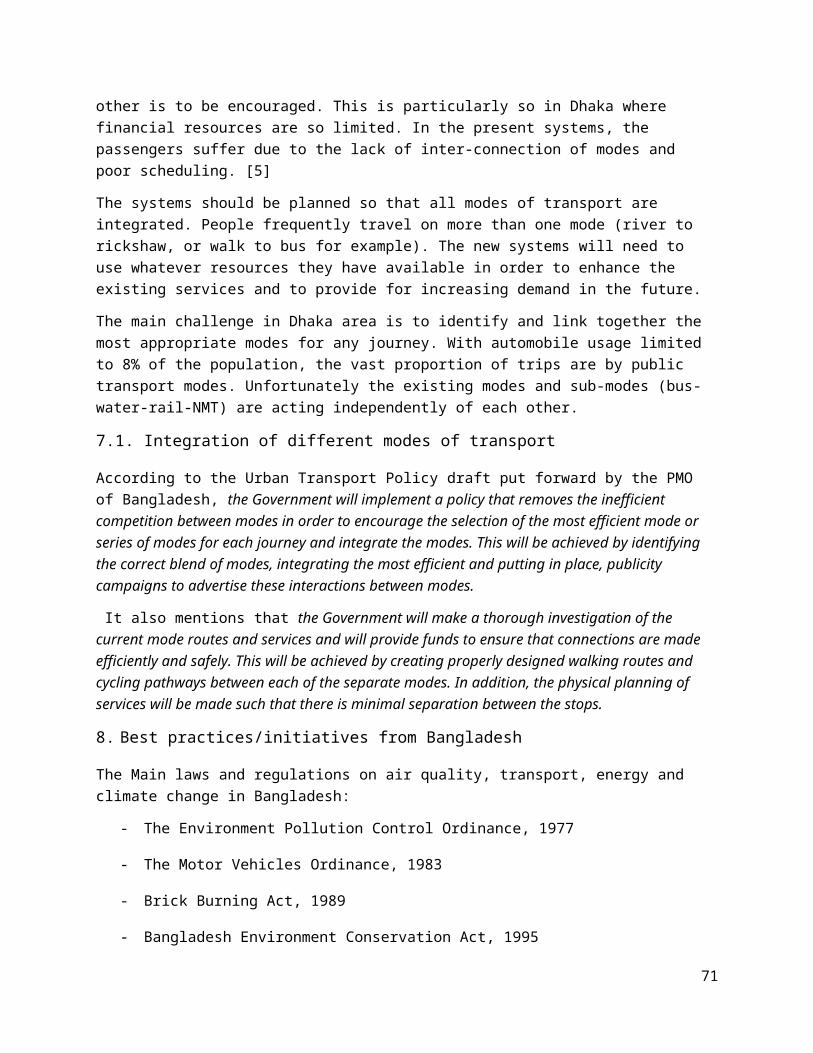
other is to be encouraged. This is particularly so in Dhaka where financial resources are so limited. In the present systems, the passengers suffer due to the lack of inter-connection of modes and poor scheduling. [5]
The systems should be planned so that all modes of transport are integrated. People frequently travel on more than one mode (river to rickshaw, or walk to bus for example). The new systems will need to use whatever resources they have available in order to enhance the existing services and to provide for increasing demand in the future.
The main challenge in Dhaka area is to identify and link together the most appropriate modes for any journey. With automobile usage limited to 8% of the population, the vast proportion of trips are by public transport modes. Unfortunately the existing modes and sub-modes (bus-water-rail-NMT) are acting independently of each other.
7.1. Integration of different modes of transport
According to the Urban Transport Policy draft put forward by the PMO of Bangladesh, the Government will implement a policy that removes the inefficient competition between modes in order to encourage the selection of the most efficient mode or series of modes for each journey and integrate the modes. This will be achieved by identifying the correct blend of modes, integrating the most efficient and putting in place, publicity campaigns to advertise these interactions between modes.
It also mentions that the Government will make a thorough investigation of the current mode routes and services and will provide funds to ensure that connections are made efficiently and safely. This will be achieved by creating properly designed walking routes and cycling pathways between each of the separate modes. In addition, the physical planning of services will be made such that there is minimal separation between the stops.
8. Best practices/initiatives from Bangladesh
The Main laws and regulations on air quality, transport, energy and climate change in Bangladesh:
- The Environment Pollution Control Ordinance, 1977
- The Motor Vehicles Ordinance, 1983
- Brick Burning Act, 1989
- Bangladesh Environment Conservation Act, 1995
71

- The Environment Conservation Rules, 1997 and,
- Bangladesh Environment Court Act, 2000
The Department of Environment is responsible for overall management ofenvironmental pollution national levels. DoE has offices at divisionallevels and with the growing concern of environmental pollution DoE plans to expand its activity at district levels.
The primary legislation instituted to mitigate air pollution is the 1995 Bangladesh Environmental Conservation Act (ECA) and the 1997 Environmental Conservation Rules (ECR) (DOE 1997, DOE 2002). DOE, under the Ministry of Environment and Forestry, is the key institutionprimarily responsible for AQ monitoring and management in Bangladesh. DOE’s air pollution responsibilities include the control and analysis of ambient AQ, the identification of polluting industries, and providing support for the implementation of pollution prevention and control.
Other core functions and activities of DOE include policy analysis, planning and evaluation of environmental requirements, monitoring and evaluation, compliance and enforcement, and environmental clearances and processing of environmental impact assessments (DOE 2005).
Bangladesh does not have a clean air act or law that specifically addresses air pollution and its management and control. There are no clear indications whether one will be legislated in the coming years. A number of sector-specific policies (e.g., transport and industry sectors) and regulations that impact on air pollution, however, have been adopted. City-specific action plans, such as the Action Plan to Improve Air Quality developed under the 2001 ADB-funded Urban Transport Environment Improvement Project, have also helped improve the AQM framework in the cities.
Enforcement of Emission Standards Inspection and Management Program
Two stages of revisions in the standards for the new registration vehicles have been proposed; the first in the year 2014 and the secondin 2019. The second revision may be reviewed in the light of air quality data and emission inventory data that would be available during that time.
72

The mechanism and methodology of enforcement of emission standards that need to be implemented have also been proposed and discussed in detail in the ‘Enforcement of Emission Standards and I/M Program: Draft Report – Part 2,’ December 2012.
Vehicle Emission Control Strategy
The different factors that should be typically essential components ofa vehicular air pollution control program are shown in the figure below. The other factors that are required to be addressed concurrently to make the emission control program more efficient and cost-effective include traffic planning and management, cleaner transport fuels and a vehicle inspection and maintenance mandate.
9. Way forward
Vehicular emission can be reduced by replacing old, worn-out vehicles.It can also be done by appropriate engine design, control strategies and maintenance services.
Appropriate transportation planning is to be adopted to introduce efficient mass transit. Rickshaws are to be gradually phased out from the main roads. They may be allowed to operate in lanes and by-lanes only. The reason behind this is that they slow down the traffic, thus causing higher pollution.
For reduction of brick field emission level, stack heights should be increased. New and improved technologies of brick-making should be introduced. Low sulfur coal should be used in brickfields instead of high sulfur coal.
In order to protect and enhance the quality of environment of Dhaka city, various interventions relating to the planning, vehicle quality control, and use of alternative fuels and avoidance of leaded fuels are needed. In terms of planning intervention spatial planning, road and inter-section planning and demand management all contribute to improvements in exhaust emissions.
The Department of Environment is implementing the Air Quality Management Project for Dhaka. It is expected that the findings and recommendations of this project will direct the setting up of the vehicle emission standards for the city. Meanwhile the Government has approved some national policies to introduce mandatory emission
73

testing as part of the vehicles fitness test, encourage the use of CNGby vehicles, import vehicles capable of CNG propulsion, encourage the conversion of existing petrol driven vehicles to CNG and fix price differentials between CNG and petrol driven vehicles.
In order to improve the status of public transport, there is a need toprovide transport of children, especially to and from schools. Managing the fare structures to allow the lower and middle-class to easily utilize the vehicular resources. Suitable provisions for the poor and for the women are a necessity along with provisions for the sick and the differently abled.
Before the management and mitigation of air pollution in Dhaka, air quality monitoring stations and institutes need to be set up. Institutions for road traffic management, air pollution assessment, etc. are needed for proper data collection for formulating better environmental policies based on long-term data.
Dhaka is one of the most polluted cities in the world especially in the winter months. Proper management of industrial sites, travel demand management and promoting public transport are some of the very basic measures that need to be adopted by the government and actions to facilitate these measures need to be devised by the agencies to be set up.
74
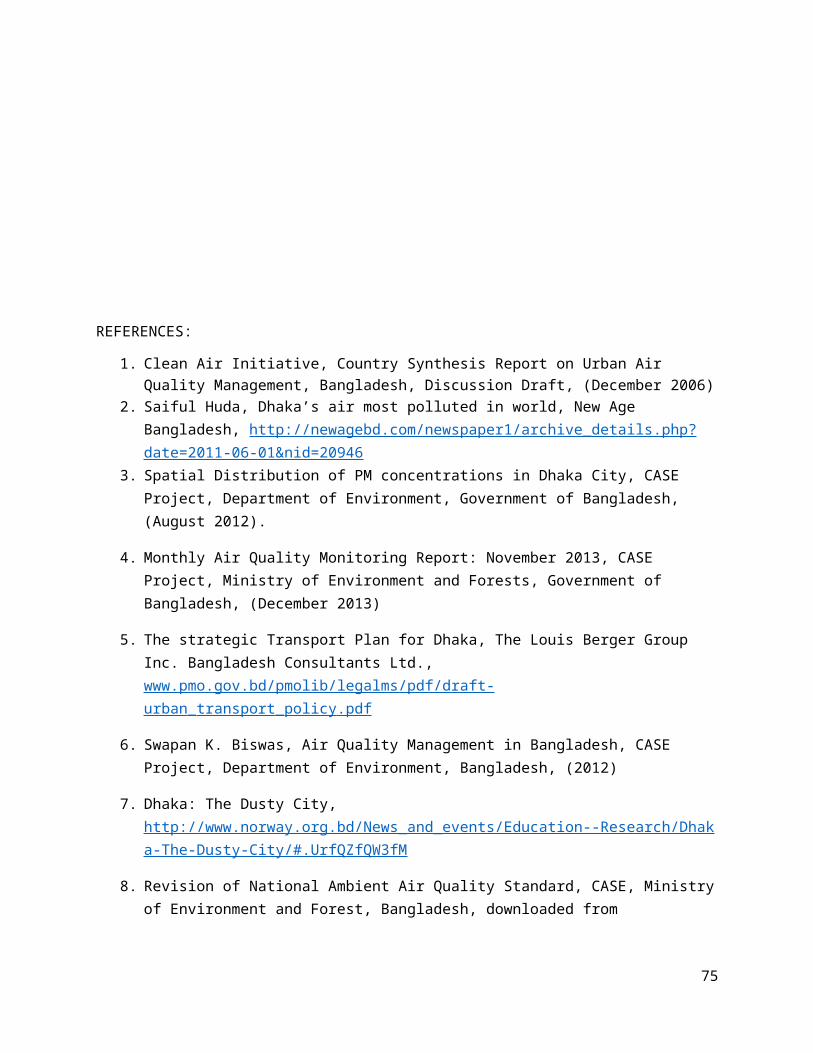
REFERENCES:
1. Clean Air Initiative, Country Synthesis Report on Urban Air Quality Management, Bangladesh, Discussion Draft, (December 2006)
2. Saiful Huda, Dhaka’s air most polluted in world, New Age Bangladesh, http://newagebd.com/newspaper1/archive_details.php?date=2011-06-01&nid=20946
3. Spatial Distribution of PM concentrations in Dhaka City, CASE Project, Department of Environment, Government of Bangladesh, (August 2012).
4. Monthly Air Quality Monitoring Report: November 2013, CASE Project, Ministry of Environment and Forests, Government of Bangladesh, (December 2013)
5. The strategic Transport Plan for Dhaka, The Louis Berger Group Inc. Bangladesh Consultants Ltd., www.pmo.gov.bd/pmolib/legalms/pdf/draft-urban _ transport _ policy .pdf
6. Swapan K. Biswas, Air Quality Management in Bangladesh, CASE Project, Department of Environment, Bangladesh, (2012)
7. Dhaka: The Dusty City, http://www.norway.org.bd/News_and_events/Education--Research/Dhaka-The-Dusty-City/#.UrfQZfQW3fM
8. Revision of National Ambient Air Quality Standard, CASE, Ministryof Environment and Forest, Bangladesh, downloaded from
75

http://www.case-moef.gov.bd/file_zone/feedback/Revision%20of%20National%20Ambient%20Air%20Quality%20Standard.pdf
9. CASE Project, Revisions of Vehicular Emission Standards for Bangladesh, Draft Final Report – Part 1, Department of Environment, Government of Bangladesh, (December 2012)
10. Khondaker Neaz Rahman, Vehicular Parking: Policy and Guidelines for Dhaka, Urbanization in Bangladesh, (July 2013)
11. Zia Wadud, Tanzila Khan, CNG Conversion of Motor Vehicles inDhaka: Valuation of co-benefits, Bangladesh University of Engineering and Technology, (2011)
COLOMBO:
76
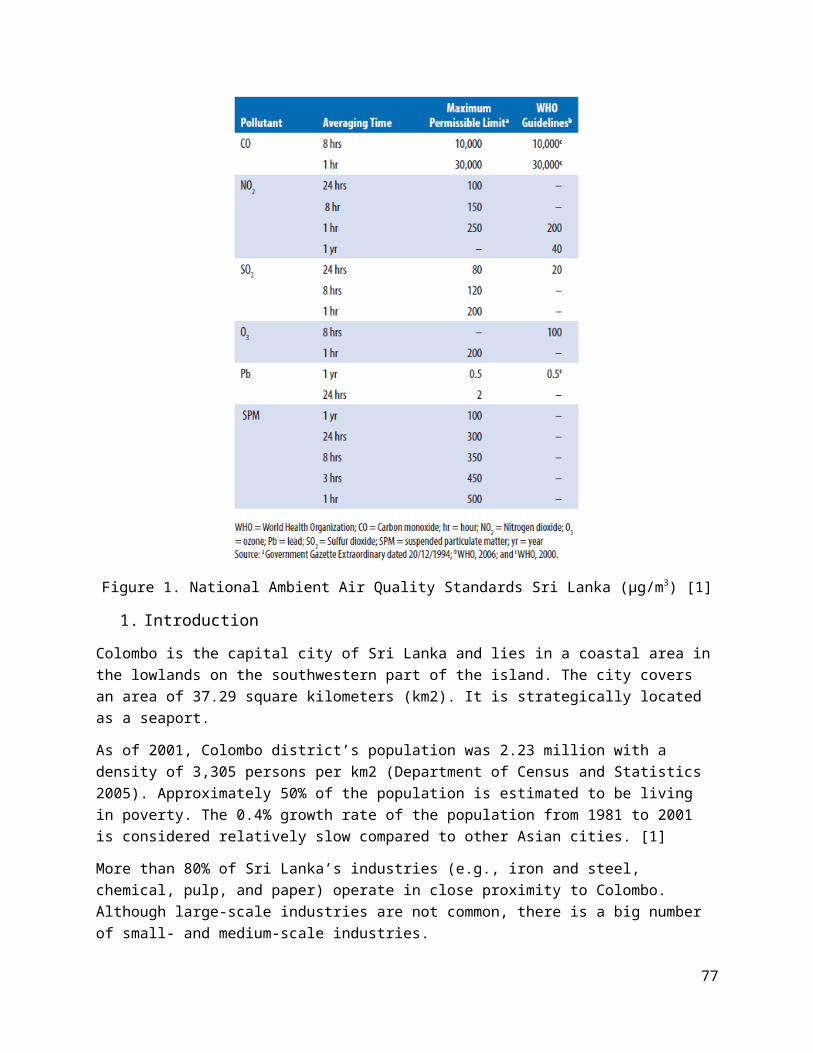
Figure 1. National Ambient Air Quality Standards Sri Lanka (µg/m3) [1]
1. Introduction
Colombo is the capital city of Sri Lanka and lies in a coastal area inthe lowlands on the southwestern part of the island. The city covers an area of 37.29 square kilometers (km2). It is strategically located as a seaport.
As of 2001, Colombo district’s population was 2.23 million with a density of 3,305 persons per km2 (Department of Census and Statistics 2005). Approximately 50% of the population is estimated to be living in poverty. The 0.4% growth rate of the population from 1981 to 2001 is considered relatively slow compared to other Asian cities. [1]
More than 80% of Sri Lanka’s industries (e.g., iron and steel, chemical, pulp, and paper) operate in close proximity to Colombo. Although large-scale industries are not common, there is a big number of small- and medium-scale industries.
77

Sri Lanka’s land transport system is predominantly road transport (93%), which is based mainly on a road network centered in Colombo. In2003, the transport sector has generated about 4% of direct employmentand contributed to about 10% of the country’s GDP (World Bank 2006). [1]
2. Air quality
Colombo is highly polluted due to:
- High traffic congestion during peak hours due to high vehicle population
- Low priority for vehicle maintenance and fuel efficiency- Improper releasing of harmful air pollutants from the factories
in the metropolitan area.
2.1. State of urban air quality in Colombo and other cities
The Air Quality in Colombo and other cities in Sri Lanka was measured and compared in 1999. The concentration of air pollutants in all the cities was well within the national standards except the SO2 concentrations in Colombo.
The concentrations were found to be maximum in Colombo and the NO2 concentrations in Colombo were found to be much higher than the rest of the cities, this can be attributed to the rise of the transport sector in the city.
Figure 2. Variation of One Hour average Concentrations of CarbonMonoxide (CO) in 1999. [4]
78
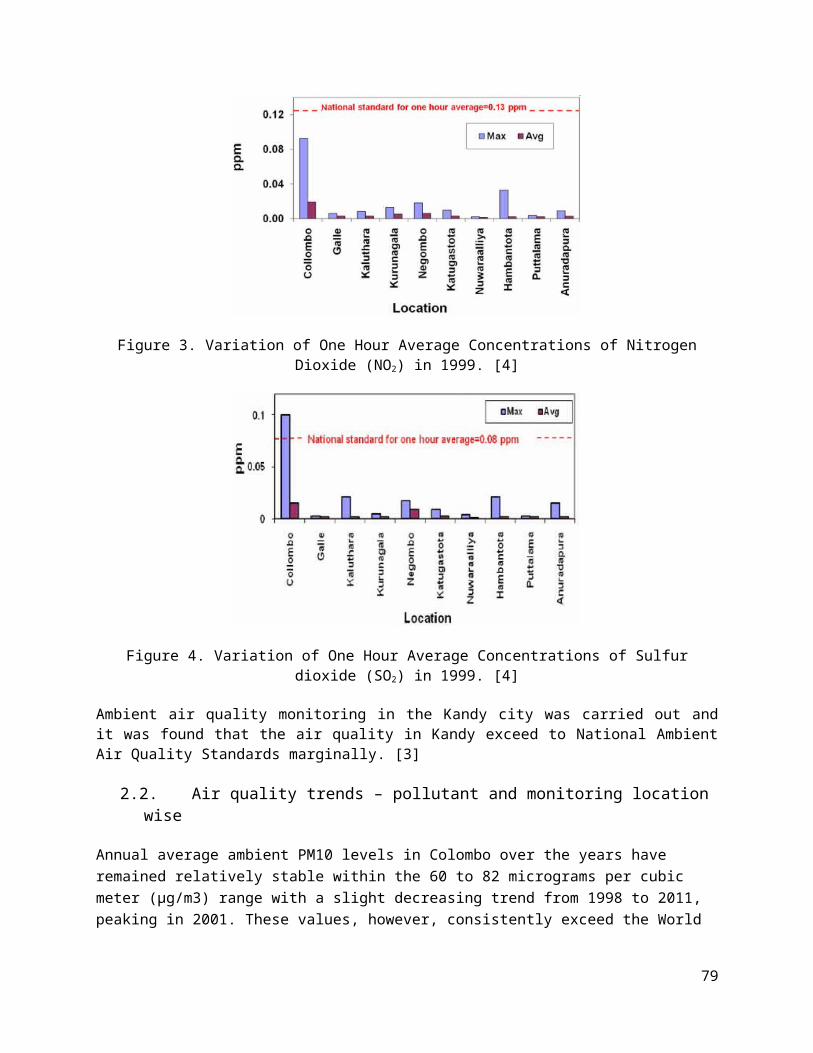
Figure 3. Variation of One Hour Average Concentrations of NitrogenDioxide (NO2) in 1999. [4]
Figure 4. Variation of One Hour Average Concentrations of Sulfurdioxide (SO2) in 1999. [4]
Ambient air quality monitoring in the Kandy city was carried out andit was found that the air quality in Kandy exceed to National AmbientAir Quality Standards marginally. [3]
2.2. Air quality trends – pollutant and monitoring location wise
Annual average ambient PM10 levels in Colombo over the years have remained relatively stable within the 60 to 82 micrograms per cubic meter (μg/m3) range with a slight decreasing trend from 1998 to 2011, peaking in 2001. These values, however, consistently exceed the World
79

Health Organization (WHO) annual guideline of 50μg/m3 for PM10. Sri Lanka has not set any ambient AQ standard for PM10. [2]
Figure 5. Annual Ambient Concentrations of PM10 at Colombo FortMonitoring Site, 1998-2012. Source: CEA, 2012. [2]
Figure 6. Annual Ambient Concentrations of SO2 and NO2 in Colombo,1998-2003. [1]
Despite high SO2 emissions from industrial activities, especially power plants close to Colombo City, the ambient SO2 level in the city for 2003 fell within the annual USEPA limit of 78 μg/m3 (Sri Lanka does not have an annual standard for SO2). Unlike PM10, which was fairly stable within a small range of values, SO2 levels in Colombo have shown an increasing trend from 1997 to 2000 and then a general decreasing trend to 2003. NO2 concentration levels in Colombo over theyears have experienced the same pattern trends as with SO2—increasing
80

from 1998 to sometime 2001 then decreasing to 2003. Unlike SO2, however, annual NO2 in Colombo has exceeded WHO (2006) guideline of 40μg/m3 (Sri Lanka does not have an annual standard for NO2). [1]
Figure 7. Carbon Monoxide Concentration – Monthly Mean and Maximum ofOne Hour Averages at Colombo Fort (June 2003 – December 2008). [4]
The NAAQS for 24-hour average concentration of CO is 26ppm and the graph clearly depicts that the concentrations are well within the limits. This has been a result of the measures taken by the governmentin the late 1990s and the early 2000s.
Figure 8. Trends in PM10 levels in Colombo between 1998 and 2007. [5]
81

Figure 9. Trends in SO2 levels in Colombo between 1997 and 2006. [5]
Figure 10. Trends in NO2 levels in Colombo between 1997 and 2006. [5]
The NAAQS for the NO2 concentration is 0.013 ppm and the mean concentrations in Colombo are below the limit but there is a gradual increase in the concentrations. This increase is a result of the increase in the no. of vehicles in the city area. Various programs such as the VET have been undertaken to reduce the rate of increase ofpollutants like NO2. The mean SO2 concentration has been rising above the NAAQS limit from time to time and the measures taken need to be implemented more efficiently or better techniques need to be devised by the government to prevent the concentration from rising too high above the limit. [4]
82

Figure 11. Concentration of Total Lead in Ambient Air. [10]
Leaded petrol was phased out Island-wide in 2001 and an immediate decline in the ambient air concentrations of lead was observed at the monitoring locations.
But the main concern for the city remains Particulate matter whose concentration has remained well above the WHO guidelines for a number of years.
2.3. State of air quality monitoring -- no. of air quality monitoring stations – manual and real time, pollutants beingmonitored
As early as 1983, monitoring of AQ, particularly lead (Pb), was already being carried out in Colombo by the Chemistry Department of the University of Colombo. From 1989 to 1992, three different organizations NBRO, CEA, and CISIR, now Industrial Technology Institute [ITI]) conducted separate studies to contribute to understanding the AQ situation in Colombo. [1]
Automatic ambient AQ monitoring in Colombo started in December 1996 with two fixed AQ monitoring stations. These two automatic stations were originally located at the Fort railway station in the central business district of Colombo and at the meteorological station in the center of the city. These stations could measure the following pollutants: Sulfur dioxide (SO2), Nitrogen oxide (NOx), Nitrogen dioxide (NO2), Nitrogen monoxide (NO), Carbon monoxide (CO), ozone (O3), and particulate matter with diameter not more than 10 micrograms(PM10).
83
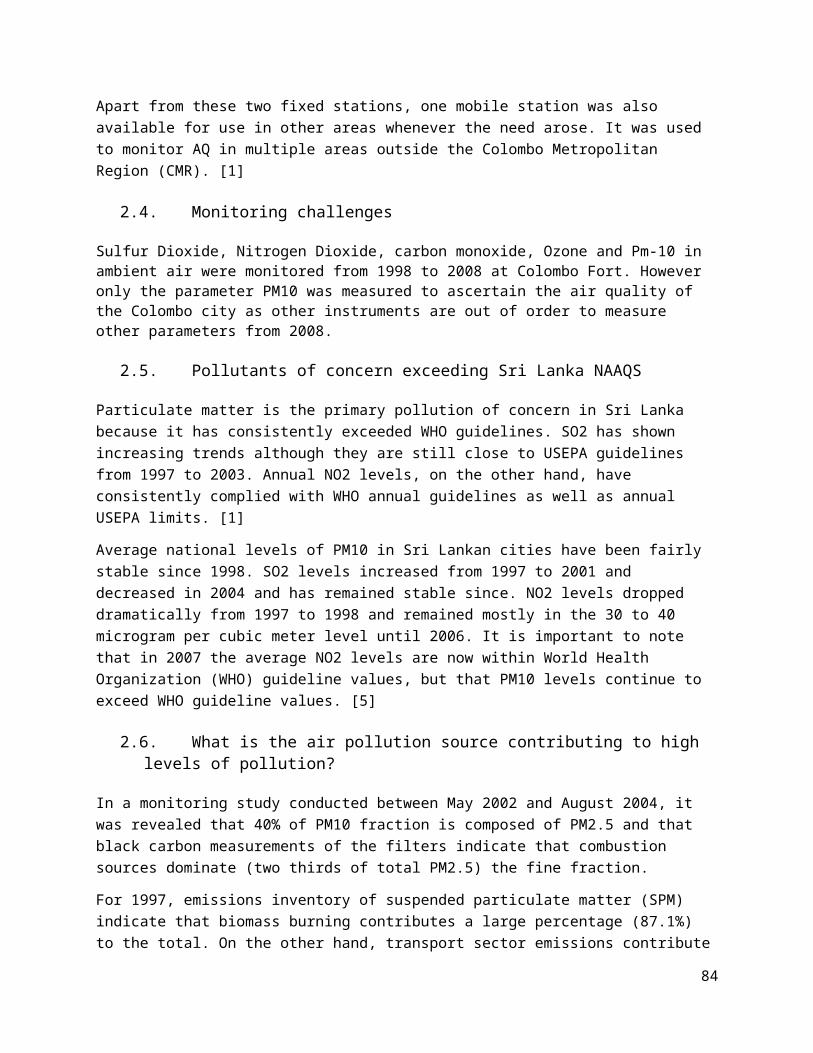
Apart from these two fixed stations, one mobile station was also available for use in other areas whenever the need arose. It was used to monitor AQ in multiple areas outside the Colombo Metropolitan Region (CMR). [1]
2.4. Monitoring challenges
Sulfur Dioxide, Nitrogen Dioxide, carbon monoxide, Ozone and Pm-10 in ambient air were monitored from 1998 to 2008 at Colombo Fort. However only the parameter PM10 was measured to ascertain the air quality of the Colombo city as other instruments are out of order to measure other parameters from 2008.
2.5. Pollutants of concern exceeding Sri Lanka NAAQS
Particulate matter is the primary pollution of concern in Sri Lanka because it has consistently exceeded WHO guidelines. SO2 has shown increasing trends although they are still close to USEPA guidelines from 1997 to 2003. Annual NO2 levels, on the other hand, have consistently complied with WHO annual guidelines as well as annual USEPA limits. [1]
Average national levels of PM10 in Sri Lankan cities have been fairly stable since 1998. SO2 levels increased from 1997 to 2001 and decreased in 2004 and has remained stable since. NO2 levels dropped dramatically from 1997 to 1998 and remained mostly in the 30 to 40 microgram per cubic meter level until 2006. It is important to note that in 2007 the average NO2 levels are now within World Health Organization (WHO) guideline values, but that PM10 levels continue to exceed WHO guideline values. [5]
2.6. What is the air pollution source contributing to high levels of pollution?
In a monitoring study conducted between May 2002 and August 2004, it was revealed that 40% of PM10 fraction is composed of PM2.5 and that black carbon measurements of the filters indicate that combustion sources dominate (two thirds of total PM2.5) the fine fraction.
For 1997, emissions inventory of suspended particulate matter (SPM) indicate that biomass burning contributes a large percentage (87.1%) to the total. On the other hand, transport sector emissions contribute
84
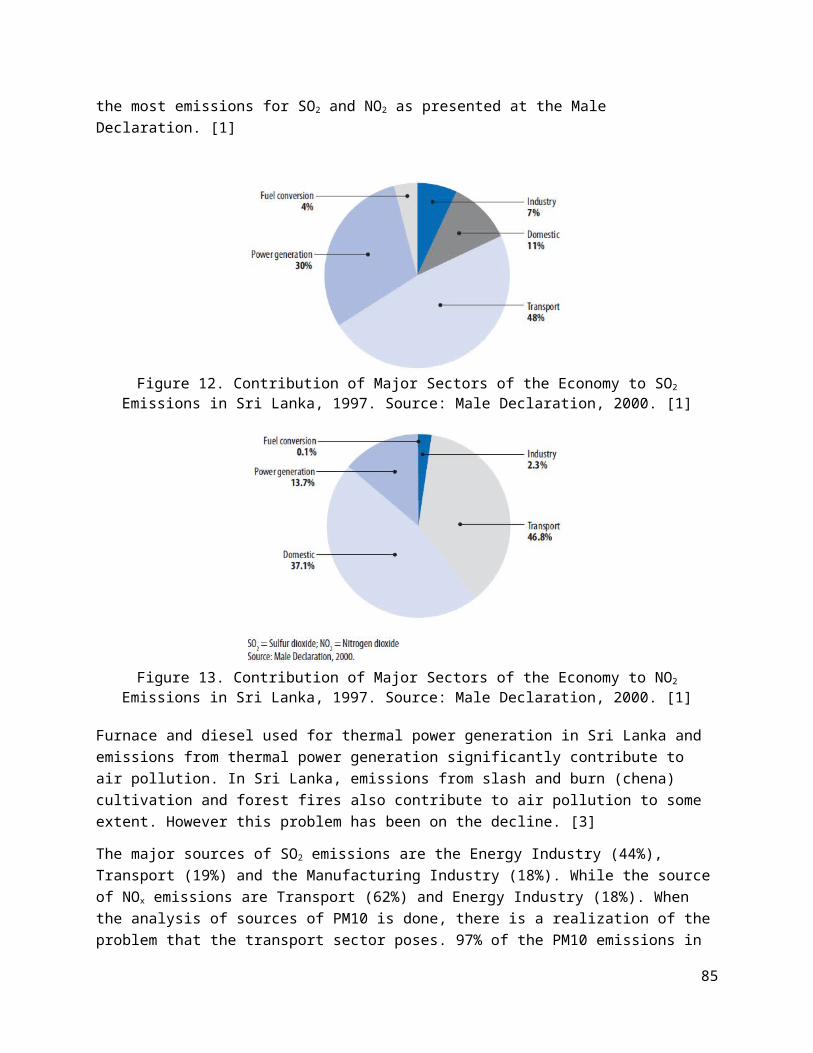
the most emissions for SO2 and NO2 as presented at the Male Declaration. [1]
Figure 12. Contribution of Major Sectors of the Economy to SO2
Emissions in Sri Lanka, 1997. Source: Male Declaration, 2000. [1]
Figure 13. Contribution of Major Sectors of the Economy to NO2
Emissions in Sri Lanka, 1997. Source: Male Declaration, 2000. [1]
Furnace and diesel used for thermal power generation in Sri Lanka and emissions from thermal power generation significantly contribute to air pollution. In Sri Lanka, emissions from slash and burn (chena) cultivation and forest fires also contribute to air pollution to some extent. However this problem has been on the decline. [3]
The major sources of SO2 emissions are the Energy Industry (44%), Transport (19%) and the Manufacturing Industry (18%). While the sourceof NOx emissions are Transport (62%) and Energy Industry (18%). When the analysis of sources of PM10 is done, there is a realization of theproblem that the transport sector poses. 97% of the PM10 emissions in
85

the city are due to the Transport sector in the form of vehicular emissions. [4]
2.7. Why vehicles are a special challenge
Vehicles pose a special challenge to the public health of a city. In Colombo, the air pollutant which is a major cause of concern in Particulate matter. The concentration of particulate matter in the ambient air of Colombo is above the national NAAQS levels. The primarysource of this particulate matter is the transport sector.
Figure 14. Sources of PM10 Emissions. [4]
With the rapid rise in the number of vehicles on the roads, traffic congestion leads to a decrease in the average travel speed. This results in an increase in the exposure time to pollutants during travel and hence the chances of contracting respiratory diseases.
In the one-hour period between 7-8 am and 6-7 pm, the average travel speed in most locations is below 20 km/hr. At some places, the averagespeed drop below 10 km/hr, which is a cause for concern for commuters as well as the roadside dwellers.
Unsustainable increase in private vehicle ownership in urban cities has created several problems in increased traffic congestion, road accidents and air pollution in the city centers. Dependence on road transport tends to raise total energy consumption, increase air pollution, and have other adverse effects on the environment. Toxic gas emission in high traffic conditions and noise pollution are at a peak level in urban city centers contributing to adverse health effects. On the other hand non-motorized transport modal share is verylow in urban areas and is also reducing in rural areas. [9]
86

3. Air pollution and health impact studies
The impact of the phase out of lead in gasoline has been studied by comparing the blood lead (Pb) levels of children respondents in 1998 (before phase out) and 2003 (one year after introduction of unleaded petrol). The comparative analysis of the blood levels showed a statistical decline in the presence of Pb was observed, whereby, the percentage with levels above 10mg/dl had dropped from 6% to 0%. [1]
A study conducted by NBRO and the University of Colombo, Faculty of Medicine found a significant association between ambient air pollution(with respect to SO2 and NOx) and acute childhood wheezing episodes inColombo . In this study, the correlation of the occurrence of maximum and minimum levels of SO2 and NOx were compared with the daily attendance of children experiencing wheezing (and requiring nebulization) were observed and found to be statistically significant (Senanayake et al. 1999). [1]
3.1. Air pollution and health impact studies conducted so far
PM10-related health damage in the City of Colombo is about Rs. 26.0 billion per annum; and in the case of PM2.5 it is about Rs. 774 million per annum. This is according to a study by Chandrasiri, S. et.al. (2004) which quantified the health effects of PM2.5 from auto-diesel emissions. [5]
Figure 15. Health Damage due to PM10 and PM2.5 (Rs. Millions/year)-2003
Based on the above estimates, the researchers calculated the cost per ton of auto diesel emissions in Colombo and the estimated figures are given below.
Figure 16. Health Damage due to PM10 and PM2.5 (Value/ton) – 2003
87

A study on the “Exposure to Aerosol Pollution and Reported RespiratorySymptoms among City Dwellers” by Perera, G.B.S., Emmanuel, R., Premasiri, H.D.S., (2006) showed that urban dwellers reported higher prevalence of respiratory illnesses since they spent more on the roadsides, had higher exposure and also had all the common respiratorysymptoms. Comparison of most common causes of mortality and morbidity data showed that although non-air pollution-related causes remain the primary cause for mortality, air pollution was a significant contributor to morbidity. [5]
The average property damage due to urban air pollution in Colombo is estimated at Rs. 12677 (US$ 126) per household per year. The average willingness to pay to avoid property damage from urban air pollution is at Rs. 520 (US$ 52) per household per year. If an Air Quality Improvement Fund were to be established, the public would be willing to pay Rs.1546 (US$ 154) per household per year. These were the findings of a study on the “Valuation of Property Damages from Urban Air Pollution: A Case Study of Colombo, Sri Lanka” by Batagoda B.M.S. & Parameshwaran, G., (2004). [5]
In Sri Lanka, automobile exhaust is one of the major causes of air pollution. Since 1995, diseases of the respiratory system ranked as the second leading cause of hospitalization. Respiratory diseases ranked within the first five leading causes of death in all age groupsexpect 15-24 and 25-49 years. The figures of hospitalization and hospital deaths from 1995-2001 show that ASTHMA has become a major respiratory disease. [14]
3.2. Type of studies – ambient air pollution or vehicular pollution
A comprehensive list of the various studies conducted by individuals and institutions was prepared by Dr. Sumal Nandasena, Department of Public Health, Faculty of Medicine, University of Kelaniya, Sri Lanka.The following figures illustrate the various studies categorized by Design, Study Location, Study Period, Study Sample, Exposure, Health Outcome and the Summary of the Published Findings.
88

89

Figures 17 and 18. Health Effects of Outdoor Air Pollutants in SriLanka: A Literature Review (1980-2007)
3.3. Pollutants monitored and their health effects
The most common air pollutants found and monitored are SO2, NO2, CO, Ozone, Particulate Matter and Lead. Since the introduction of unleadedpetrol, the levels of Pb in the blood streams of the population have reduced below 10ug/dL.
Air pollutants sources and health effects can be illustrated as mentioned below. [14]
90

Figure 19. Air Pollutants and Health Effects [14]
4. Vehicle technology and fuels roadmap
4.1. Vehicle emissions standard
Figure 19. Emissions Regulations under the National Environmental ActNo. 47 of 1980. [3]
These regulations set standards for maximum permissible levels of emission for different vehicle categories. Vehicle Emission Testing program is designed as a public-private partnership and is a centralized system with two large private sector companies contracted to issue the VET certificates. [3]
91

Figure 20. Basic Procedure of Emission Certification. [13]
Implementation of Vehicle Emission Standards was ensured through the "Vehicle Emission Testing (VET) Program" to make operate cleaner vehicles, reduced levels of vehicle emissions and thereby improve ambient air quality, reduce health risk and improve living conditions.It was mandated for all the vehicles of the country to have VET Certificate to obtain annual revenue license.
Some immediate actions within the VET program include: [13]- Full operation of the Project Office- Awareness and Training for VET center technicians- Initiation of certification of vehicle repair facilities/garages- Initiation of “Smoke Spotter” program- Enforcement of second phase of emission standards
4.2. Fuel quality
Various steps were taken by the government to improve the fuel qualityin Sri Lanka and reduce emissions from vehicles. Following are some ofthe measures taken by the government:
- Introduction of unleaded gasoline from 2003 to stop emission of particulate lead into the atmosphere from gasoline powered vehicles.
92

- During the period 2001-2005 actions were taken to provide low sulfur diesel to minimize the Sulfur Dioxide (SO2) emission to atmosphere from diesel vehicles, diesel power plants and industries using auto diesel. In this regard the Sulfur content in diesel was reduced from 15000 PPM to 3000 PPM. It was further envisaged to further reduce sulfur content in diesel to 500 PPM within next couple of years and was so reduced in 2007. [3]
- The government banned the import of two stroke three wheelers with effect from January 2008.
4.3. Alternative fuel program
Figure 21. Fuel Consumption of the vehicle fleet. [13]
The major fuel that is being consumed in Sri Lanka is Diesel though the usage of Gasoline has also increased, it remains much lower than the consumption of Diesel.
4.4. Electric vehicles
In the past, the Lanka Electric Vehicle Association (LEVA) has undertaken projects to promote environmentally sustainable transport systems. A project in 2009-11 was initiated by producing the first electric hybrid bus in Sri Lanka, the project focused on reducing greenhouse emissions from ground transport sources. The pilot project was supported by the Ministry of Environment and the Ministry of UrbanDevelopment and Sacred Area Development. [6]
93

Electric vehicles for private use are also being imported into the country by private distributors. The public transport like three-wheelers are being converted to electric vehicles for reducing the pollutant concentrations in the city and also to mitigate climate change and global warming.
- Momentum for Change
This activity spearheaded by the Lanka Electric Vehicle Association (LEVA), with support from the GEF Small Grants Programme (GEF SGP), implemented by the United Nations Development Programme, has helped todemonstrate the viability of and paved the way for the commercial introduction of electric and hybrid vehicles on the streets Sri Lanka's capital, Colombo. Initially planned as a demonstration and capacity building activity, LEVA switched to advocacy work, successfully lobbying the government to support electric and hybrid vehicles. The considerable success of lobbying led to government support in form of a favorable policy framework as well as lowered import duties for electric vehicle parts. [7]
As a result, several private firms started importing and assembling electric vehicles. Furthermore, the government in 2010, worked with LEVA to launch a pilot activity, to produce the first electric hybrid bus in Sri Lanka. The main goals of the activity were to introduce zero emission electric and hybrid vehicles and to train unemployed youth to operate and maintain these vehicles. The activity also conducts an awareness campaign on the benefits of electric vehicles for reducing emissions and pollution. [7]
The awareness campaign was initiated by the Ministry of Urban Development in collaboration with the Lanka Electric Vehicle Association and a nation-wide seminar was held in Colombo at the Ministry of Urban Development, with the two Ministers of Urban Development and Environment among the seminar participants.
5. Mobility crisis
In 2000, total active vehicle fleet in Sri Lanka was estimated to be 1.165 million, almost twice its size in 1991. In 2004, this further increased to 1.5 million. It is estimated that 60% of this fleet
94

operate in the Colombo Metropolitan Region. Sri Lanka’s vehicle fleet is characterized by a large share of motorcycles(49% in 2000) which has shown significant increase in the past few years (Jayaweera 2002). [1]
5.1. Increasing number of vehicles
Figure 22. Annual Vehicle Registration. [3]
Figure 23. Total Vehicle Registrations. [13]
The total number of two-wheelers decreased in the 1990s but in the last decade, the number has risen four-fold. There has been a rise in the number of three-wheelers but the difference in the number is not as big as the two-wheelers.
95

In Sri Lanka, air pollution by the transport sector is caused due to the following reasons along with sharp increase of vehicle population.[3]
- Poor maintenance of vehicles increases the air pollution by air-borne particles from diesel vehicles and carbon monoxide and volatile organic compounds from petrol vehicles.
- High traffic congestion because of not having a proper road network, traffic control system and poor maintenance of roads
- Absence of a proper and well-planned public transport system.
5.2. Modal share of different modes of transport
Figure 24. Migration from Public to Private transport at the ColomboMunicipal Council boundary [8]
As illustrated in Figure 24, public transport, mainly comprising of bus and railway networks, is losing its modal share as private modes of transport continue to increase significantly.
96

Figure 25. Current Modal share in Western Province, 2013. [8]
5.3. State of public transport
Public transport accounts for nearly 73% of the total motorized passenger transport, of this, bus transportation accounts for nearly 68%, with state owned bus service share of 23% and private operator share of 45% provided by small scale operators. Sri Lanka Railway accounts for only 5%, carrying 120mn passengers per year. Despite attempts made during the recent past, the quality and service of passenger transport have largely been neglected. Increase in public transport modal share will reduce traffic delays and congestions on roads and need for expensive road infrastructure developments. [9]
The railway network is vastly inadequate and not efficient enough to meet the passenger needs. All railway lines carry passengers more thanits seat capacity. The cost line and mainline carry passengers with over 250% load factor. (Load factor being the ratio of daily passengers carried to the seats supplied per day in both directions).
Figure 26. Current Issues for Urban transport modes [8]
There is a need for modernization of public transport for increase andhigh level of public transport services (quality, reliability, safety,connectivity, user-friendly). This is a lack of urban transport policies and strategies and there is no linkage between urban transport and urban land use planning. [8]
97

5.4. State of intermediate public transport
Figure 27. Transport Modal Shares (2007). [11]
Buses account for less than 7% of the number of vehicles and accommodate 61% of the passengers. There is no integration between thedifferent modes of transport and at present there is no coordinated effort made for inter-modal transportation. Three-wheelers and school and office vans are also providing substantial services to communitiesthat do not have direct access to bus or rail. There is a breakdown ofinter-modalism between trains and buses. Systems such as park and ridehave also not been developed to date. [9]
5.5. Walking and cycling
Walking is the mode of public transport which provides access to all regions, areas, built and unbuilt roads. It is not only useful for urban residence but also for tourism for more attractive urban area.
The Urban Transport System Development Project for Colombo includes a project to build sidewalks for pedestrian safety. In the current situation, there is no distinction between shoulder and side walk, there is no center median on 4 lane roads and there is no indication for sidewalk in the design standard. [8]
Figure 28. Proposed cross section for 4-lane Highways. [8]
98

Figure 28 represents the proposed 4-lane cross section in Urban Area. These standards may create a safe and attractive environment in the urban transport.
6. Car restraint measures
6.1. Congestion reduction strategies
Figure . Proposed City Bus routes [12]
The two new projects for sustainable transport include BRT and the Park & Ride system. The objectives of the BRT system is to introduce acost effective and expanded public transport system, extend the reach of rail transit providing feeder services and to reduce the traffic congestion in the city of Colombo. [12]
Successive governments have undertaken several initiatives to reduce traffic congestion. These included the installation of automatic traffic signals where traffic jams are frequently experienced, the relocation of the administrative capital to Sri Jayewardenapura Kotte and the staggered opening and closing times of government and private establishments, factories and schools (Jayaweera 2001). [1]
Colombo aims to manage traffic demand by policy options such as Fuel Tax, Electronic Road Pricing, Peak Hour Shift, Park and Ride, MobilityManagement, etc. The focus is on Transit Oriented Development,
99

planning to build Multi-modal centers and improving traffic managementand control. [8]
7. Multi-modal integration
7.1. Integration of different modes of transport
At present there is no coordinated effort made for inter-modal transportation. Three-wheelers and school and office vans are also providing substantial services to communities that do not have direct access to bus or rail. There is a breakdown of inter-modalism between trains and buses. Systems such as park and ride have also not been developed to date. A case in point is the lack of suitable public transport to the international airport at Katunayake. [9]
Figure . Mode Transfer for Public Transport User. [8]
19% of bus users transfer to another buses and 48% of railways users take bus access to railway stations, 18% of railway users transfer into a bus from the railway station toward their destination. [8]
8. Best practices/initiatives from Sri Lanka
The 1980 National Environmental Act (NEA) No. 47 was the first comprehensive legislation that encompassed environmental management and protection in Sri Lanka. CEA was established 1981 to implement the
100

provisions of this Act. Since then, CEA has been instrumental in developing the necessary standards relevant for managing AQ in Colomboand for the rest of the country. The Ministry of forestry and Environment (MoF&E) is the main institution for policy making and decision making. [1]
It covers recommendations for vehicle inspection and maintenance, fuelreformulation, monitoring of emissions, setting of standards, institutional strengthening, transport planning and traffic management, and the use of economic instruments. The expected result of which was to reduce all air pollutants of concern to CMA by 2000. [1]
The main achievements in improving air quality In Sri Lanka since 2006are:
- Banning of importation of two-stroke engine three- wheelers: The Government of Sri Lanka banned the importation of two-stroke petrol three-wheelers from 1 January 2008 and prohibited the import of full engine, engine blocks and cylinder heads after 2011 in order to avoid the local assembly of two-stroke engines.
- Implementation of vehicle emission testing program: Sri Lanka is in the process of implementing the Vehicle Emission Testing program. The Program was launched on 15 July 2008. Several agencies play an important part in its implementation. The Ministry of Environment and Natural Resources developed the emission standards; the Department of Motor Traffic is the designated implementing agency of the program. This program is designed as a public-private partnership and is a centralized system with two large private sector companies contracted to conduct the vehicle emission tests. Two private sector companies have been selected to establish testing centers in all of Sri Lanka. The testing centers in the major cities are already in place.
- Amendment of National Ambient Air Quality Standards: Considering the latest revised WHO guideline values, Sri Lanka reviewed the National Ambient Air Quality Standards and incorporated PM10 and PM2.5. Sri Lanka set the interim targets 2 as given in the Globalupdate of WHO Air Quality Guideline in 2005.
Under NEA, CEA is mandated to implement the two main regulatory provisions that relate to industrial pollution control. These are the
101

Environmental Protection License procedure for the control of industrial discharges; and the Environmental Impact Assessment procedure for major development projects, promulgated in February 1990and June 1993.
- The Air Resource Management center (AirMAC) was established in 2001 jointly by the Ministry of Forestry and Environment and CEA in partnership with all stakeholders of air resource management to develop, co-ordinate and integrate programs and mechanisms to mitigate air pollution. It also included strengthening institutions, capacity building, developing air resource researchprograms and establishing air resource information center for dissemination of air resource information. [3]
- Air pollution in Sri Lanka had been recognized as a growing problem since the early 1990s. As a response, a strategy and action plan named the “Clean Air 2000 Action Plan” (CA2AP) was approved by the cabinet in 1993. This plan was introduced to restore the gradually deteriorating air quality of Colombo Metropolitan Area through various control measures and Clean Air 2015 Action Plan in 2007 was also introduced. [3]
It is mandatory to control source emissions as well as non-source emissions in Sri Lanka. As a strategy for source emission control, CEAis in the process of formulating Source Emission Standards.
9. Way forward
The Ministry of Transport outlines the overall planning strategies forUrban Transport as follows: [8]
- Integrate urban development with urban transport system- Introduce new public transport system- Introduce user-friendly Transit Facilities for existing public
transport- Increase road capacity and optimize its use
There are no large-scale industries such as petrochemical industries and other chemical manufacturing plants of the scale found in neighboring countries. Given this situation, Sri Lanka is in a fortunate position where action could be initiated to ensure that whenlarge-scale heavy industries come into the country, necessary infrastructure would be in place to ensure that the operation of such industries do not cause unacceptable levels of pollution.
102

REFERENCES:
1. Clean Air Initiative, Country Synthesis Report on Urban Air Quality Management, Sri Lanka, Discussion Draft, (December 2006)
2. Air Quality Monitoring Status in Sri Lanka, Central EnvironmentalAuthority, http://www.cea.lk/index.php/en/air-quality
3. Progress Report 2011 and Action Plan 2012, Ministry of Environment, Sri Lanka
4. R.N.R. Jayaratne, Air Quality Issues in Sri Lanka, Central Environmental Authority.
5. Clean Air in Sri Lanka: Summary of progress on improving air quality, Country Network Sri Lanka, Clean Air Sri Lanka, (November 2008)
103

6. Electric hybrid bus by Lanka Electric Vehicle Association. https://sgp.undp.org/index.php?option=com_sgpprojects&view=projectdetail&id=15263&Itemid=205
7. Momentum for change, UNFCCC http://unfccc.int/secretariat/momentum_for_change/items/7102.php
8. Draft Urban Transport Master Plan for Colombo Metropolitan Regionand Suburbs, Ministry of Transport, November 18, 2013.
9. Country Report, Sri Lanka, Third Asia Pacific Ministerial Conference on Public-Private Partnership (PPP) for infrastructuredevelopment at Tehran, Islamic Republic of Iran, November 2012.
10. Environmentally Sustainable Transport in Sri Lanka, Ministryof Transport & Ministry of Environment, Sri Lanka
11. Amal S. Kumarage, Sustainable Transport Policies in Sri Lanka, Workshop on Air Quality and Environmentally Sustainable Transport, April 2011.
12. Dhammika Perera, Secretary – Ministry of Transport, Sustainable Transport Initiatives in Sri Lanka.
13. Thusitha Sugathapala, Future Emissions Standards and Fuel Quality Roadmap from Sri Lanka, Workshop on Air Quality and Environmentally Sustainable Transport, AirMAC, MoE, MoT, CSE India, April 2011.
14. Senarath, Mrs. Chandralatha “An Overview Of Air Pollution And Respiratory Illnesses In Sri Lanka” in Martin J. Bunch, V. Madha Suresh and T. Vasantha Kumaran, eds., Proceedings of the Third International Conference on Environment and Health, Chennai, India, 15-17 December, 2003. Chennai: Department of Geography, University of Madras and Faculty of Environmental Studies, York University. Pages 489 – 501.
PAKISTAN:
104
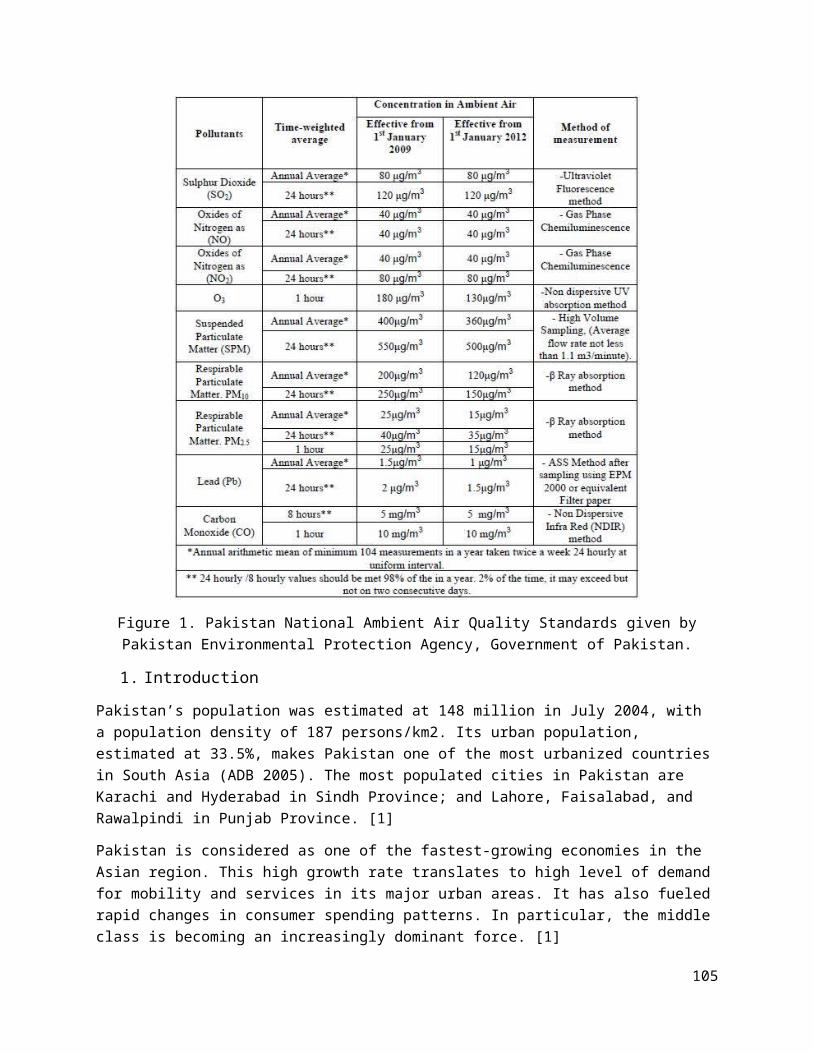
Figure 1. Pakistan National Ambient Air Quality Standards given byPakistan Environmental Protection Agency, Government of Pakistan.
1. Introduction
Pakistan’s population was estimated at 148 million in July 2004, with a population density of 187 persons/km2. Its urban population, estimated at 33.5%, makes Pakistan one of the most urbanized countriesin South Asia (ADB 2005). The most populated cities in Pakistan are Karachi and Hyderabad in Sindh Province; and Lahore, Faisalabad, and Rawalpindi in Punjab Province. [1]
Pakistan is considered as one of the fastest-growing economies in the Asian region. This high growth rate translates to high level of demandfor mobility and services in its major urban areas. It has also fueledrapid changes in consumer spending patterns. In particular, the middleclass is becoming an increasingly dominant force. [1]
105

The major industries in Pakistan are on textiles, cement, fertilizer, steel, sugar, electric goods, shipbuilding, and the automobile manufacturing industry. Karachi and Lahore have emerged as the cities with the most number of industrial activities. [1]
2. Air quality
2.1. State of urban air quality in citis
Figure 2. Hourly Average Ambient Concentrations of Air Pollutants inPakistani Cities in 2000.
A study investigating air quality was conducted by SUPARCO under the ENERCON/UNDP Fuel Efficiency in Road Transport Sector (FERTS) from 2003 to 2004 for the cities of Karachi, Lahore, Peshawar, Quetta, Rawalpindi, and Islamabad.
106

Figure 3. Maximum Concentration of PM10 in six big cities. Source:SUPARCO. [3]
Similar to those of the Pakistan EPA/JICA study conducted in 2000, theresults of this study showed high levels of PM10 exceeding WHO 2005 guideline values (20 μg/m3) for all the cities. The highest levels were recorded in Lahore and Quetta, reaching almost 260 μg/m3 and 290 μg/m3 average hourly concentrations. [1]
Figure 4. 48-hour Mean of SO2 in Major Pakistani Cities. Source:SUPARCO (2005). [1]
The above figure shows the ambient levels of SO2 observed from these six cities, which were found to also exceed WHO guideline values, withQuetta posting the highest average concentrations.
107

Figure 5. Ambient Levels of Nitrogen Dioxide in Different Cities inPakistan. Source: Lodhi (2006). [1]
The ambient concentrations of NO2 are shown in the figure above. Karachi had the highest or maximum recorded levels followed by Lahore,Quetta, Peshawar, and Islamabad. Average concentrations showed that Karachi and Lahore have similar concentrations at 76 μg/m3. The average concentrations of NO2 in Quetta, Peshawar, and Islamabad were 69.50 μg/m3, 47.28 μg/m3, and 30.41 μg/m3, respectively. The safe level of long-term exposure to NO2 is set by WHO at 40 μg/m3 for 1-year monitoring, while for short-term monitoring (1 hour), the threshold is set at 200 μg/m3. The lowest recorded level of NO2 (11.65μg/m3) was found in Islamabad in the residential area along embassy road, while the highest recorded level (399.65 μg/m3) was found at Karimabad Junction in Karachi (Lodhi 2006). [1]
Figure 6. O3 Levels in Major Pakistani Cities. Source: SUPARCO (2005).[1]
Ambient ozone concentrations in Pakistani Cities were found to be within the standards set by WHO. [1]
2.2. Air quality trends – pollutant and monitoring location wise
Pakistan EPA, in cooperation with JICA, carried out in 2000 an initialinvestigation of the air pollution in Pakistan and assessed the ambient air quality in Lahore, Rawalpindi, and Islamabad. Air quality sampling was conducted using a mobile station that measured hourly
108

concentrations of air pollutants from 0700 to 2400 taken on different days in April and May 2000. The concentrations of Suspended Particulate Matter (SPM), PM10, and lead (Pb) were found to have greatly exceeded the WHO guideline values. The average SPM for the three cities was 2,000 μg/m3, while PM10 averaged 700 μg/m3 (Pakistan EPA/JICA 2001). [1]
2.3. State of air quality monitoring -- no. of air quality monitoring stations – manual and real time, pollutants beingmonitored
The ‘Establishment of Environmental Monitoring System in Pakistan’ project established the foundation for building capacity of the monitoring laboratories of Pak-EPA and Provincial EPAs in order to enhance regulatory compliance, and environmental management and protection.
The Air Quality Monitoring System was established at Federal and Provincial EPAs. Detail of facilities established under EMS project isgiven below: [2]
Figure 7. Plan of Air Quality Monitoring System. [2]
109

Figure 8. Capability of Mobile Air Quality Monitoring Stations.Source: SUPARCO website. [4]
National Data Surveillance Centre (NDSC) for air quality was established at Central Laboratory for Environmental Analysis and Networking (CLEAN), Pak-EPA. The function of the Centre is to calculate the average data of each parameter received from all the stations. The received data is then compared with the Ambient Air Quality Standards. [2]
2.4. Pollutants of concern exceeding Pakistan NAAQS
Since the ban on leaded petrol in 2002, studies have shown a reductionin the lead levels in blood of children and lead no longer poses a threat to the public health. The major environmental concerns of thesecities are Particulate matter, NOx and SO2 as their concentrations continue to exceed the WHO guidelines.
Based on existing air quality monitoring data, PM10 and PM2.5 are the main pollutants of concern. PM concentrations were found to exceed 1979 WHO guidelines by a factor of 3–4. Oxides of nitrogen are also found to exceed WHO guidelines. [1]
110

The PM in cities like Rawalpindi and Islamabad are derived from: [5]
- Vehicular and industrial emissions
- Burning of solid waste
- Brick kilns and
- Natural, road and construction dusts
NO and NO2 occur mainly due to the combustion of fossil fuels. The sources of these gases in the atmosphere are the mobile emission and stationary sources, such as boilers and furnaces of industrial activities. [5]
2.5. What is the air pollution source contributing to high levels of pollution?
The major sources of air pollution in Pakistani cities are combustion of fossil fuels from vehicles, factories, and power plants. However, there are no emissions inventories that show the estimated air pollutant emissions from these sources. The Government does not conduct regular emissions inventories in the cities.
Emissions from large-scale facilities, such as cement, fertilizer, sugar, steel, and power plants, many of which use furnace oil; and a wide range of small- to medium-scale industries (including brick kilns, steel rerolling, steel recycling, and plastic molding) cause a disproportionate share of pollution through their use of dirty “waste”fuels, such as old tires, paper, wood, and textile waste. Industrial emissions are further compounded by the widespread use of small dieselelectric generators in commercial and residential areas in response tothe poor reliability of electricity supplies (Pakistan EPA/World Bank 2006). [1]
2.6. Why vehicles are a special challenge
The air pollution problem is aggravated by the aging fleet of vehiclesin poor mechanical condition and low levels of fuel efficiency. The increasing number of diesel trucks has further added to the problem. According to the Pakistan Environmental Protection Agency (EPA), a major share of the emissions load from motor vehicles, although not quantified, can be attributed to a relatively small number of smoky
111

diesel and 2-stroke vehicles found in many Pakistani cities (Pakistan EPA/World Bank 2006). The high levels of sulfur in automotive diesel (0.5%–1%) is seen as a major contributor to Sulfur dioxide (SO2) and particulate matter (PM) in ambient air. [1]
3. Air pollution and health impact studies
Air pollutants in large concentration cause adverse health effects on the population. Particulate matter penetrate deep into the lungs and cause respiratory problems. Adults are much more vulnerable to respiratory symptoms and lung cancer in the presence of large concentrations of air pollutants in the ambient air.
3.1. Air pollution and health impact studies conducted so far
A study on the impacts of PM on health in Pakistan conducted by the Pakistan EPA and the World Bank showed that it causes 22,000 prematuredeaths in adults and 700 in children annually. The total health cost was estimated between Rs62 billion to Rs65 billion (about US$1.09 billion1) or approximately 1% of the gross domestic product (Pakistan EPA/World Bank 2006). [1]
In 2002, a medical study investigated the impact of environmental pollution on the health of nearly 1,000 traffic policemen. Results showed that about 80% of the traffic policemen had chronic ear-nose-throat (ENT) problems and 40% showed signs of lung problems (some of which developed into asthma and tuberculosis). Due to the nearly 10-hour job on the road amidst smoke and blowing horns, almost 90% showedsymptoms of irritability and tension; 45% of the cases (ranging from 35 to 50 years of age) suffered from hypertension (Pakistan EPA 2005).[1]
The incidence of the so-called “winter fog” phenomenon in Pakistan, which is a cocktail of toxic gases and particulates, has contributed to economic losses, aggravating respiratory and cardiovascular diseases, as well as increased cardiac arrest rates. One study in 2002estimated that approximately 16.28 million people—about 40% of the total urban population in Pakistan—are exposed to this “fog” and have health implications amounting to Rs25.7 billion per year (Pakistan EPA2005). [1]
112

Pakistan had high levels of lead in gasoline prior to its nationwide ban in 2002. Various studies conducted in Pakistani cities, such as Peshawar, Karachi, Islamabad, and Chakshahzad, in the 1990s showed high levels of lead in blood of students. In Karachi, 98% of the children studied had blood lead levels (BPbLs) of more than 20 μg/dl compared to only 32.6% in Peshawar. [1]
3.2. Pollutants monitored and their health effects
The pollutants measured include the Particulate matter, NOx, SO2, CO, Pb and Ozone. The health effects of these pollutants have been mentioned earlier in the report.
4. Vehicle technology and fuels roadmap
4.1. Vehicle emissions standard
Emissions from new and in-use vehicles are controlled through standards. Pakistan Environmental Protection Agency under clause (e) of section 6(1) of the Pakistan Environmental Protection Act, 1997, and with the approval of the Pakistan Environmental Protection council, established National Environmental Quality Standards (NEQS), for motor vehicle exhaust and noise vide S.R.O. 742 (I)/93 dated August 29, 1993, as follows:
Figure 9. National Environmental Quality Standards for motor vehicleexhaust and noise. [6]
These set of standards were found to be no longer sufficient to tacklethe increasing problem of emissions from motor vehicles in Pakistan because these only include parameters for smoke and CO, which are comparable to pre-Euro standards for in-use vehicles (NECC 2002). [1]
113

In addition, the standards were set for all modes of vehicles and did not delineate between light-duty and heavy-duty vehicles, and/or motorcycles. The NEAP 2005 and the proposed PCAP mention a number of other actions to address emissions from motor vehicles, including proposed new vehicle emissions standards and corresponding fuel quality standards for metrocities. The proposed measures by PCAP, the national workshop on air quality management in Pakistan, which was held in Lahore in 2004, discussed the adoption of Euro 2 for all typesof vehicles in 2007, Euro 3 in 2010, and Euro 4 in 2013 for Pakistan’smetrocities (CAI–Asia 2004). [1]
The majority of countries in Asia have adopted the Euro emissions standards for new gasoline and diesel vehicles. The gasoline and diesel fuel standards required for adoption of Euro Standards are as follows [6]:
Figure 10. Time frame for Implementation of the proposed Euro EmissionStandards. [6]
The country does not have an established inspection and maintenance system in order to regulate emissions from in use vehicles. However, motor vehicle examiners, who operate within the transport departments in each state, conduct arbitrary inspections and issue a certificate of fitness for public and commercial vehicles. CDGs and the provincialtraffic police are implementing a provincial motor vehicle ordinance that allows them to apprehend private and public transport vehicles emitting visible smoke, vapor, grit, sparks, ashes, cinders, or oily substances and fines them Rs500 for such violation (Ghazali 2006). [1]
4.2. Fuel quality
Pakistan is the largest CNG-using country in Asia and the third largest in the world. In 2005, there were 700,000 CNG vehicles in the country, the majority of which are converted gasoline vehicles. The number of CNG refueling stations was 766 in 2005 (ANGV 2006). Several
114

initiatives at the local government level have been geared toward replacing 2-stroke gasoline rickshaws to CNG in order to reduce air pollution in the urban area. [1]
Pakistan has become the third country in the list of countries with the most natural gas vehicles, as over 26 percent of the vehicles on the roads consume natural gas, suggests the data of Natural Gas Vehicles (NGV) Europe.
The NGV Global suggests that Pakistan has observed the fastest growth in natural gas vehicles since the year 2000 as the number of gas vehicles has surged to around 3.5 million from less than 100,000 vehicles back in the year 2000. While Pakistan is the country with thehighest number of CNG refilling stations in the world. [10]
Unleaded gasoline was introduced in the country with effect from 1st July 2002, which brought tremendous benefits to public, as lead was highly injurious to health especially to children. More than 50% gasoline produced and marketed in the country w.e.f. March 2003, was 90 RON, unleaded. [8]
115

Figure 11. Pakistani Fuel Quality. [14]
In 2012, Pakistan shelved its plans to import petrol, diesel and all other petroleum products from India till 2014 due to difference in product specifications used in both countries. Pakistani refineries produced zero-euro quality oil whereas Indian refineries produced Euro-3 and Euro-4 quality oil, which was cleaner and more environmentally friendly fuel. Pakistan was preparing a road map to introduce Euro-2, Euro-3 and Euro-4 for clean energy in the country. “Pakistani refineries have been tasked to produce-Euro-2 quality diesel till July 2014 and therefore the government wants to shelve theplan of oil trade with India till then,” official said adding that theother reason is Pakistan has penned an oil supply contract with KuwaitPetroleum Corporation (KPC) till 2014. [7]
An official of the Engineering Development Board (EDB) said that the use of Euro-3 and Euro-4 would cause technology shift and therefore itwould be difficult to run existing vehicles on fuel produced in India.
4.3. Alternative fuel program
The use of petroleum products has shown a declining trend since 2000. This is mainly due to the Government’s efforts to promote local compressed natural gas (CNG) and liquefied petroleum gas (LPG) for usein the transport, agriculture, and power sectors because of the high costs of imported oil. Natural gas and LPG consumption have increased by an average of almost 16% in the period 2003 to 2005. Imported oil accounts for 82% of the total oil consumed while indigenous natural gas accounts for 50% of the total gas consumed (MoF 2006). [1]
Pakistan’s demand for natural gas is expected to rise substantially inthe next few years, according to the Ministry of Petroleum and NaturalResources, because of its plans to make natural gas the “fuel of choice” for future electric power generation projects (Pakistan EPA 2005). [1]
Owing to the vast reserves and availability of natural gas in Pakistan, the Government has adopted several measures in promoting itsuse in the transport sector. Apart from reducing the dependence on imported petroleum products, air pollution issues have also driven theGovernment to promote CNG for transportation. The Government has implemented a price differential between CNG and motor gasoline tariffs as an incentive for CNG usage. [1]
116

4.4. Electric vehicles
In 2011, on the PM’s instructions, the federal government activated Small and Medium Enterprises Development Authority (Smeda) to consult industrialists and prepare a plan to embark on research and assemble environment-friendly and energy efficient electric vehicles. In line with the directives, the provincial chief Smeda Punjab Alamgir Chaudhry held a meeting with the local industrialists at Multan Chamber of Commerce and Industry (MCCI) recently and got feedback fromthem on the matter.
C.Co launched an electric bike that runs by a set of batteries and a hybrid bike having petrol engine as well besides batteries as alternate source of power to run the motorcycle. C.Co, a company that pioneered assembling energy-efficient electric and hybrid motorcycles in Pakistan, lauded Prime Minister Syed Yusuf Raza Gilani on taking the environment-friendly initiative of assembling or manufacturing electric vehicles in South Punjab.
Syed Qalandar Ali Gardezi, the C.Co country manager said that it was agood decision taken by the Prime Minister Gilani at a time when consumers were worried due to high price of petrol and diesel and the initiative will enable people opt for extraordinarily cheaper means oftransportation without having to pay for petrol or diesel. And, no hazardous emission to environment would be a bonus, he added. [9]
5. Mobility crisis
Pakistan’s road traffic has been growing at an average annual rate of 14.1% during the 20-year period between 1985 and 2005. The road sectorcarries more than 95% of the inland freight (273 million t/year) and 90% of the passenger traffic. Pakistan has about 4.9 million vehicles on the road, whose number is growing by about 8% annually. The road transport industry is deregulated and predominantly in the private sector (World Bank 2006). [1]
5.1. Increasing number of vehicles
117

Figure 12. Number of Registered Vehicles in Pakistan. Source: PakistanEPA/World Bank (2006). [1]
Figure 13. Motor Vehicle growth in Pakistan, 1975-2005. [14]
The country’s vehicle fleet has doubled from about 2.7 million in 1990to about 5.4 million in 2005. The biggest share of motor vehicles (about 80%) is from cars and motorcycles, most of which are privately owned and operated. The fastest growth has been seen in two-wheelers, a large part of which are running on 2-stroke engines. The number of diesel trucks and buses has also increased up to three times in this period (Pakistan EPA/World Bank 2006). The increase in the use of 2-stroke motorcycles and three-wheelers poses a major concern for most Pakistani cities because of their high rates of emissions. [1]
5.2. Modal share of different modes of transport
Urban transportation systems in Pakistani cities are characterized by the dominating presence of colorful autorickshaws, known locally as
118

rickshahs; colorful buses and trucks; and cars. To a certain extent, bicycles are still being used for daily commuting but mostly only by the poorer sector of the society (Wikipedia 2006). [1]
5.3. Traffic congestion
The space on the roads of the federal capital is being squeezed with each passing day due to the ill planning of the transport authorities who are registering new vehicles without keeping their effects on the environment into account. Acting Excise and Taxation Officer Sharif Gull said the authority was registering almost 45,000 new vehicles each year. According to the Federal Excise and Taxation Office, 50 to 70 motorbikes, 90 to 100 private cars, four to five commercial vehicles and 10 to 15 government vehicles were being added to the city’s traffic each day. [11]
According to Pakistan Environmental Protection Agency’s (PEPA) Daily Air Quality Index for Islamabad recorded two days ago, the level of Particulate Matter (PM) in the air was 42.9 micro gm, against a safe limit of 35 micro gm. “The authorities are not paying attention to making the public transport system efficient and instead show satisfaction over the rising number of vehicles, claiming that the people are getting richer and the country is on the path towards development,” a PEPA official told Pakistan Today on condition of anonymity. [11]
5.4. State of public transport
Road transport is the backbone of Pakistan’s transport system. It has played a substantial role in the economic growth currently experiencedby the country, contributing 10% to its GDP. Passenger and freight traffic have grown much faster than the country’s economic growth in recent years.
Public transportation is generally poor in Pakistan. The number of intercity minibuses is insufficient to handle the passengers in Pakistani cities and its levels of service are found to be very low and oft en unattractive toward the public. Because of this, the general public has found stronger preference to travel within the cityusing rickshaws, motorcycles, and cars. [1]
Numerous factors have contributed to the upward trend of private vehicle use and the declining or static role of public transport in
119

most cities. The most important factor is continuous investment in roads, which left few or no funds for public transport provision in most cities of the developing world. [12]
Shares of private vehicles trips are higher in Pakistani cities compared to public transport trips. Pakistani cities are served by bus- or wagon (minibus)-based public transport, which provides a very low level of service and comfort. Although a large number of non-motorized trips still exist in Lahore and Karachi the expansion of Pakistani cities has increased the trip length for most urban residents, which makes walking and cycling less feasible than before, encouraging a continuous shift from non-motorized to motorized modes. In this situation, public transport can provide high-quality services for urban populations at a much lower cost than a system devoted to private motorized transport and road expansion. [12]
Almost no attention is paid to the ways and means by which the demand for motorized transport could be met by improving the quality of public transport. Therefore, in the presence of a low level of public transport services, middle- and higher-income people living in larger cities prefer private vehicles, either motorcycle or car, for travel. [12]
5.5. State of intermediate public transport
120

Figure 14. Important Air Quality Parameter Information. [15]
In the small towns and farms, many people decide to walk great distances to either get to work or to walk to their nearest grocery store to get their daily shopping. The donkey cart, locally known as the Reyri, is still visible everywhere in Pakistan, as people are poor they use this form of transport to shift cargo from one part of a cityto the next. The cargo they hold ranges from fruits and vegetables, textiles or machinery that factories require in industrial cities. TheHouse & Carriage, locally known as Taanga are mainly seen used for casual travelling around the city. There is one driver, with either one or two horses at the front. This method is now usually used by tourists in the spring and summer that love to see the cities in an open environment. Camel & Cart are also seen from time to time. Mostlyseen in the hotter parts of Pakistan including Sindh, Punjab and Balochistan where farmers transport largercargo that donkey carts cannot handle. Bicycles are used by either thepoorer society or for leisure. This method is still very widely used as it’s very economical and simple to run. (Wikipedia)
5.6. Walking and cycling
A good way of promoting cycling in Pakistan, especially among the youth is by bringing the culture of competitive cycling into the Pakistani culture.
121

However, cycling has not been able to make much progress because thereis only one velodrome, constructed near the Gaddafi Stadium, Lahore many years ago, which too is not in proper shape. This hampers in organizing the sprint and time trial events. However, much headway hasbeen made in the road race cycling. The most heartening feature is the'Tour de Pakistan" cycle race, which is held every year. The participants pedal their way from Quetta to Peshawar. [13]
5.7. Cycle rickshaws
Pulled and cycle rickshaws (qinqi) have been outlawed in Pakistan sincethe late 50s/early 60s. (Wikipedia)
6. Multi-modal integration
Figure 15. Modal Split in Lahore and Karachi. [12]
There have been many policies and schemes enacted by the government tointegrate the different modes of transport and make it environmentallysustainable and efficient.
Some of the Projects and Schemes devised are as follows [12]:
- Public Transport in the Prime Minister’s Public Transport Scheme,1991.
In 1991, the Prime Minister’s Incentives Scheme to Revamp the Public Transport Scheme was initiated by the Nawaz Sharif’s government (Govt.of Pakistan, Ministry of Communication 1991). This policy included incentive packages to import taxis, buses, and mini-buses for an efficient public transport system. The incentive packages included duty free imports of taxis, buses, and mini-buses; loan arrangements from banks at a 15 per cent annual interest rate; and special registration numbers for new public transport. This policy was implemented, and the public transport fleet was upgraded.
- The People’s Train and Awami (People’s) Bus Train Projects.
122

In 1996, under Prime Minister Benazir Bhutto’s Development Programme for big cities, a mass transit project was started in the cities of Rawalpindi and Islamabad. This system was based on a rail-road mixed mode that contained an urban rail link between Rawalpindi and Islamabad connected with feeder coasters (mini buses) in Islamabad. The main objective of this service was to reduce peak-hour traffic congestion, reduce air pollution, and make use of existing railway infrastructure (Govt. of Pakistan, NTRC 1996).
- Public Transport in the National Integrated Transport Policy, 1998.
In 1998, the Ministry of Communications gave the mandate to the Chartered Institute of Transport (now Chartered Institute of Logistic and Transport - CILT) for preparing a draft National Integrated Transport Policy’ (CILT 1998). This policy emphasized land use and transport integration to reduce the need to travel and to maximize theaccessibility of public transport Public Transport Policies in 2000s
In 2000s, the federal Planning Commission prepared a draft Transport Policy through an in-house process (Govt. of Pakistan, Planning Commission 2000). This document also presented a bus-based public transport system as the transport solution for metropolitan cities in Pakistan. The policy was the first to propose reserving special bus lanes at grade or grade-separated road infrastructure.
Why did all Public Transport Policies in Pakistan fail? [12]
- Overstating the Role of the Private Sector in Public Transport- Lack of Capacity among Public Transport Organizations- Negligence in the development of High-Capacity Public Transport- Failure to Utilize High-Density Mixed Land Use Patterns
7. Best practices/initiatives from Pakistan
Existing Mitigation measures: Pakistan has been working on policies incorporation on cut down its import bills for petroleum products and improve the environmental scenario. The following programs are in the process with limited or partial impacts due to variety of constraints [15]:
- FERTS tune up activities- VETS by GTZ
123

- Fuel substitution and clean up- Conversion to CNG
The Transport Development Program 2011-12 would be based on a broad strategy that will include establishment of a multi-modal transport system. An integrated and holistic approach would be adopted for making transport system more productive, efficient and reliable, whichmay lower the transport costs and enhance the productivity in the economy. Strategic emphasis will be made on:
- Improve transport planning, prioritization and rationalizing public sector expenditure
- mobilize resources from users and the private sector - Explore institutional governance reforms - revitalize the railways system by transforming it into a
commercially oriented entity, while retaining the railways network in public ownership
Owing to the vast reserves and availability of natural gas in Pakistan, the Government has adopted several measures in promoting itsuse in the transport sector. Apart from reducing the dependence on imported petroleum products, air pollution issues have also driven theGovernment to promote CNG for transportation. The Government has implemented a price differential between CNG and motor gasoline tariffs as an incentive for CNG usage. [1]
Pakistan is the largest CNG-using country in Asia and the third largest in the world. In 2005, there were 700,000 CNG vehicles in the country, the majority of which are converted gasoline vehicles. The number of CNG refueling stations was 766 in 2005 (ANGV 2006). Several initiatives at the local government level have been geared toward replacing 2-stroke gasoline rickshaws to CNG in order to reduce air pollution in the urban area. [1]
124
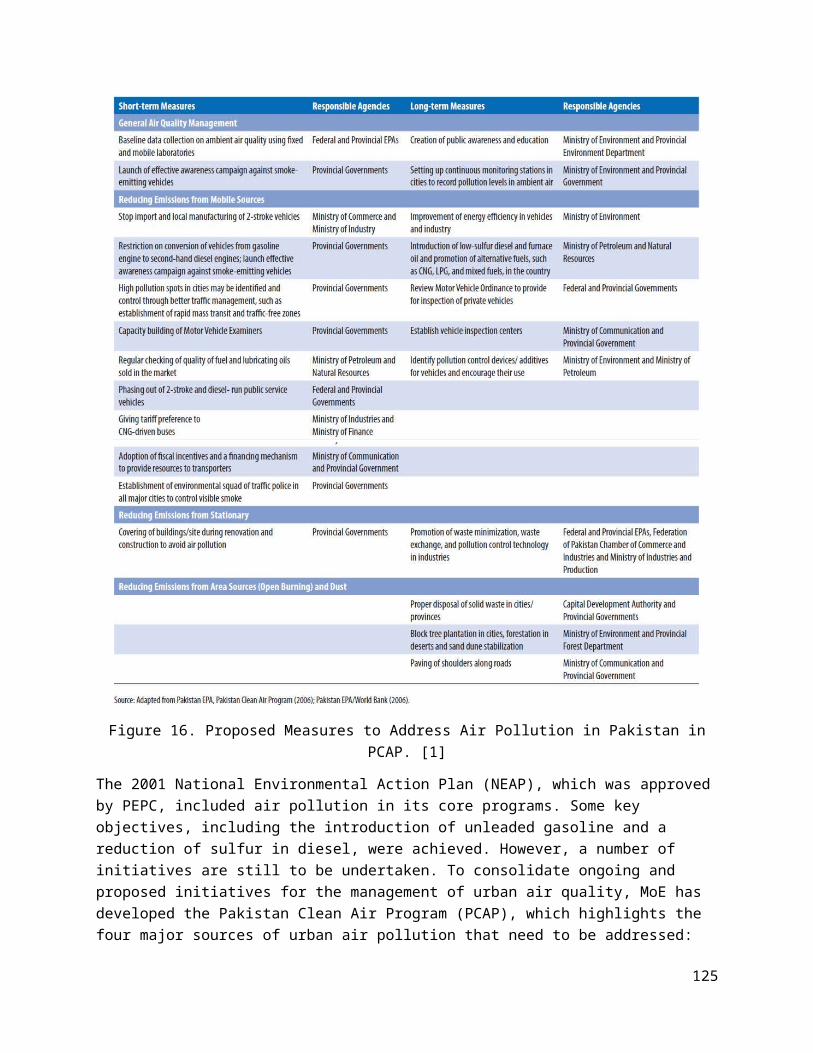
Figure 16. Proposed Measures to Address Air Pollution in Pakistan inPCAP. [1]
The 2001 National Environmental Action Plan (NEAP), which was approvedby PEPC, included air pollution in its core programs. Some key objectives, including the introduction of unleaded gasoline and a reduction of sulfur in diesel, were achieved. However, a number of initiatives are still to be undertaken. To consolidate ongoing and proposed initiatives for the management of urban air quality, MoE has developed the Pakistan Clean Air Program (PCAP), which highlights the four major sources of urban air pollution that need to be addressed:
125

(i) vehicular emissions, (ii) industrial emissions, (iii) burning of solid waste, and (iv) natural dust. It incorporates a range of short- and long-term actions to be adopted by all levels of government and bya variety of agencies (Pakistan EPA/World Bank 2006).
PAKSTRAN [16]
To address the transport and related problems in the country, the Pakistan Sustainable Transport Project (PAKSTRAN) is being implementedby Government of Pakistan.
Objective
The objective of the Project is ‘to reduce the growth of energy consumption and related greenhouse gas emissions from Pakistan’s transport sector, while simultaneously improving urban environmental conditions and improving Pakistan’s competitiveness’.
Expected Outcomes/Outputs
The expected outcomes of PAKSTRAN are:
- Outcome 1: Operational urban transport system in Punjab province- Outcome 2: Operational urban transport system in Sindh province- Outcome 3: Improved energy efficiency in truck freight transport- Outcome 4: Increased public awareness and institutional capacity
on sustainable transport concepts.
8. Way forward
The establishment of a continuous air quality monitoring is urgently needed to monitor the current air quality and provide the information required to formulate appropriate measures to protect public health. It is welcoming news that Pakistan is moving forward with the establishment of continuous air quality monitoring stations in its major cities. Although there have been few studies of the impacts of air pollution in human health and the environment, the very high concentrations of PM suggest a very heavy burden of air pollution-induced diseases in the population. [1]
Pakistan still lacks a legal framework that can address urban air pollution and provide an integrated and comprehensive air quality
126

management policy for the country. The need for such a legal basis is important in providing the fundamental basis for air pollution control. The involvement of concerned stakeholders should be ensured in the formulation and legislation of such policies. Linkages and roles of the national, provincial, and local levels should be clearly and firmly stipulated so as to avoid overlapping of roles and ensure coordination and cooperation. [1]
There is also a need to raise the awareness of the public in major cities in Pakistan and to ensure that relevant stakeholders are informed of the problem and are supportive of the development and implementation of action plans to mitigate air pollution.
REFERENCES:
1. Clean Air Initiative, ADB, Country Synthesis Report on Urban Air Quality Management, Pakistan, Discussion Draft, December 2006.
2. Brief on Establishment of Environmental Monitoring System in Pakistan, downloaded from www.environment.gov.pk/PRO_PDF/Brief%20on%20EMS.pdf
3. Malik et al., Ambient Air Quality Monitoring in Pakistan, Institute of Environmental Engineering and Research, University of Engineering and Technology, Lahore, Pakistan.
4. SUPARCO, Pollution Monitoring Test Laboratory, Capabilities, http://www.suparco.gov.pk/pages/mobile.asp
5. Dr. Irshad Ahmad, National Consultant, Air Quality in Rawalpindi/Islamabad.
6. Working Paper, National Environmental quality Standards for MotorVehicular Exhaust and Noise.
7. Pakistan not to import fuel from India before 2014, The Tribune, http://tribune.com.pk/story/430753/product-differences-pakistan-not-to-import-fuel-from-india-before-2014/
8. Muhammad Azam, Fuels Quality Scenario in Pakistan, Ministry of Petroleum and Natural Resources, September 13-14, 2006.
127

9. PM’s Initiative on electric vehicles manufacturing lauded, Pakistan Observer http://pakobserver.net/detailnews.asp?id=114878
10. Pakistan third-largest country with most CNG vehicles, The News, http://www.thenews.com.pk/Todays-News-3-119151-Pakistan-third-largest-country-with-most-CNG-vehicles
11. Rising number of vehicles choking the environment, Pakistan Today, http://www.pakistantoday.com.pk/2011/08/04/city/islamabad/rising-number-of-vehicles-choking-the-environment/
12. Muhammad Imran, Public Transport in Pakistan: A Critical Overview, Massey University, New Zealand, Journal of Public Transportation, Vol. 12, No. 2, 2009.
13. Cycling, Pakistan Sports Board, http://www.sports.gov.pk/Introduction/Intro_Cycling.htm
14. Syed Zafar Ilyas, A Review of Transport and Urban Air Pollution in Pakistan, J. Appl. Sci. Environ. Manage. June (2007)
15. Dr. Noman Fazal Qadir, Air Quality in Urban areas in Pakistan vs Transport Planning: Issues and Management Tools.
16. PAKSTRAN, Pakistan Sustainable Transport Project, www.pakstran.pk
128
http://www.thenews.com.pk/Todays-News-3-119151-Pakistan-third-largest-country-with-most-CNG-vehicles