Emotion and colour across languages: implicit associations in Spanish colour terms
Upload
independentCategory
view
1download
0
'
Reprinted in Canada from CANADIAN JOURNAL OF REMOTE SENSING
AIR-BORNE WATER COLOUR MEASUREMENTS OFF THENOVA SCOTIA COASTt
by J.R. Miller*, K.S. Gordon** and D. Kamykowski***
York University and Dalhousie University
SUMMARY
Water colour measurements have beenmade with a 4-channel spectral-scanning pho-tometer on a 160-mile flight line heading 50°South of East from Halifax out over the conti-nental shelf. Observations were made in thespectral regions .46-.44ft, .59-.55fj., . 70-.68n and. 75-. 72/u using the four-channel photometer andat .97\i using a silicon photodiode photometer.The spectral data obtained is compared withship-based chlorophyll measurements madealong the same transect.
INTRODUCTION
The attempt to use water colour to de-termine sub-surface water parameters such aschlorophyll concentration and turbidity hasreceived increased attention recently because ofthe need for more careful monitoring of ourresources and environment. The possibility ofmaking such measurements from an airplane orsatellite platform offers enormous advantagesover conventional ship-based techniques in termsof a shorter time scale required and, therefore,larger spatial scale possible. The extensive studyof Ramsey1 and a number of field measure-ments including those of Clark et. al.2, Arvensenet. al3 and Miller et. al.4 have established thatchanges in the spectrum of the water-backscattered radiation are related to changes insub-surface water parameters. Recent fieldmeasurements are aimed at establishing a unique
^Presented on the 5th February, 1975, at the AerospaceElectronics Symposium in Halifax.
* Assistant Professor of Physics, Centre for Research in Ex-perimental Space Science, York University
"Graduate Student, CRESS, York University
***Rescarch Associate, Institute of Oceanography, DalhousieUniversity
quantitative relationship between the spectraldata and the important water qualit parame-ters.
One of the authors (Kamykowski), wasresponsible for obtaining the surface-based dataand coordination with the Bedford ship cruise,which took place along the same transect fromMay 29 to June 3. The other authors (Gordonand Miller) carried out the spectrophotometricmeasurements and the required data reduction.
INSTRUMENTATION
The primary air-borne sensor for themission was a four-channel spectral-scanningphotometer that was developed under contractwith the Department of Energy, Mines andResources. Shepherd et. al.5 and Miller et. al.6have previously described the basic design of thisdevice. Interference filters with passband peaksof 4650 A, 5900 A, 7000 A and 7500 A wereselected to study the spectral regions of interest.The 15 photometer passbands for each of thesefilters are shown in Figure 1. As indicated inFigure 1, the photometer is able to measuresimultaneously through four spectral responsecurves one in each of the spectral regions .44 to.465/u, .55 to .59^, .677 to .70/u and .725 to.75/n. The photometer is stepped 15 times inabout 3 seconds to complete measurements inall 60 passbands. The photometer has a 15°field-of-view which results in a 500-ft. spatialresolution diameter at the flight altitude of2,000 ft.
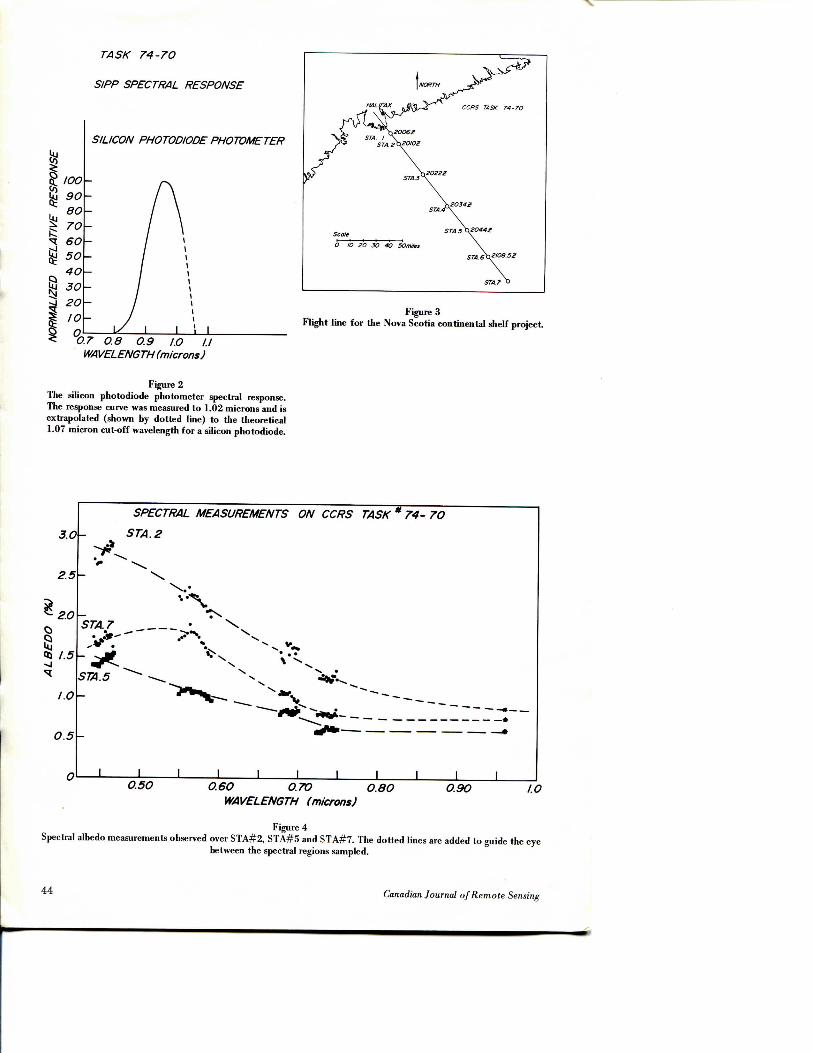
A simple photometer with a silicon pho-todiode detector, a 50 milliradian field-of-view(100-ft. ground resolution at 2,000 ft. altitude)and a spectral response shown in Figure 2 wasflown to obtain supplementary data near 1micron. In addition, CCRS provided a BarnesPRT-5 radiometer to measure the surfacetemperature through the 8-14 /n thermal infraredwavelength band. Track recovery colour pho-tography was used over the 7 sepcified stationsof interest along the transect.
42 Canadian Journal of Remote Sensing

PHOTOMETERSTEP * 16 14 12 10 8
16 14 12
44OO 445O
10
4500
8
4550
6
46OO 465O
4 2
I.O
0.5
0.0
1.0
O.5
55OO 555O 56OO
PHOTOMETERSTEP#
565O 57OO 575OWAVELENGTH (A)
58OO 585O 59OO
16 14 12 IO
I67OO 675O
PHOTOMETERSTEP #• 12
68OO 685O
IO
69OO 695O 7OOO
I.O
0.5
O.O
16 14
I
I.O
O.5
72OO 725O 7300 7350 7400 745O 75OOWAVELENGTH (A)
Figure 1The instrumental response curves for the four-channel spectral scanning photometer.
FLIGHT DATA
We arrived on a CCRS C-47 aircraft at mid-afternoon on June 2, 1974, in Shearwater, NovaScotia. Weather conditions had deterioratedsince morning of the same day with sky con-ditions described as "broken to overcast cirrusestimated at 12,000 to 15,000 feet". With aweather forecast of continually deterioratingconditions developing over the following days,coupled with the fact that the ship cruise wasscheduled to terminate the next day (June 3) itwas decided to proceed with the mission in spiteof the complicating sky conditions.
Solar pre-flight calibrations were carriedout at Shearwater, Nova Scotia, at 16:05 localtime (19:05 GMT). The solar radiation measure-ments were made using both photometers toview incident light scattered from a white dif-fuser that was placed on the tarmac about 30feet from the aircraft. Separate spectral measure-ments were made of the total incident radiance(due to direct solar input and diffuse skylight)and the diffuse sky component alone. The latterdata was obtained by casting a shadow over thediffuser. (The 2-ft. square diffuser consisted of a1 mm thick coat of Eastman Kodak standardwhite reflectance paint on an aluminum sheetbacking.) The measured ratio of diffuse skyradiation to total incident radiation was found
to vary between 0.78 at .465 \i to 0.70 at 1 ^indicating quantitatively the sky conditions be-fore the flight.
Our aircraft was air-borne at 19:35 GMTand out over the target line at 20:03 GMT. Theflight line (shown in Figure 3) was flown at2,000 feet and was followed accurately using aninertial navigational system. Indicated on Figure3 are the locations and the times of arrival overthe 7 selected ship-sampling stations (see alsoFigure 6). Sample spectra obtained over stationsSTA#2, STA#5 and STA#7 were analysed. Byratioing these data with the pre-flight solarcalibration data, the spectral albedo curves weredetermined and are shown in Figure 4. It shouldbe noted that, whereas the diffuse/total ratio ofincident solar radiation was about 0.75 prior tothe flight, the cloud cover became heavier andalso showed significant variations in thicknessduring the air-borne measurements along the160-nautical mile transect. The effect of thesolar input variations on the data is discussedlater.
The use of an albedo ratio at wavelengthson and off the chlorophyll a pigment absorptioncurve (Yentsch7), as discussed by Curran8, hasbeen employed previously as a convenientparameter to indicate chlorophyll content. In
Vol. 2, No. 1, April 1976 43
too
TASK 74-7O
SIPP SPECTRAL RESPONSE
SILICON PHOTODIODE PHOTOMETER
Figure 3Flight line for the Nova Scotia continental shelf project.
< 0.7 O.8 O.9 I.O I.IWAVELENGTH (microns)
Figure 2The silicon photodiode photometer spectral response.The response curve was measured to 1.02 microns and isextrapolated (shown by dotted line) to the theoretical1.07 micron cut-off wavelength for a silicon photodiode.
3.0
2.5
2.0
d> 1.5
1.0
0.5
^
SPECTRAL MEASUREMENTS ON OCRS TASK " 74- 7O
STA.2
;.X
STA.7
vr\
••
STA.5
J I 1 1 1 1 1 1 1O.5O O.6O O.7O O.8O
WAVELENGTH (microns)O.9O I.O
Figure 4Spectral albedo measurements observed over STA#2, STA#5 and STA#7. The dotted lines are added to guide the eye
between the spectral regions sampled.
44 Canadian Journal of Remote Sensing
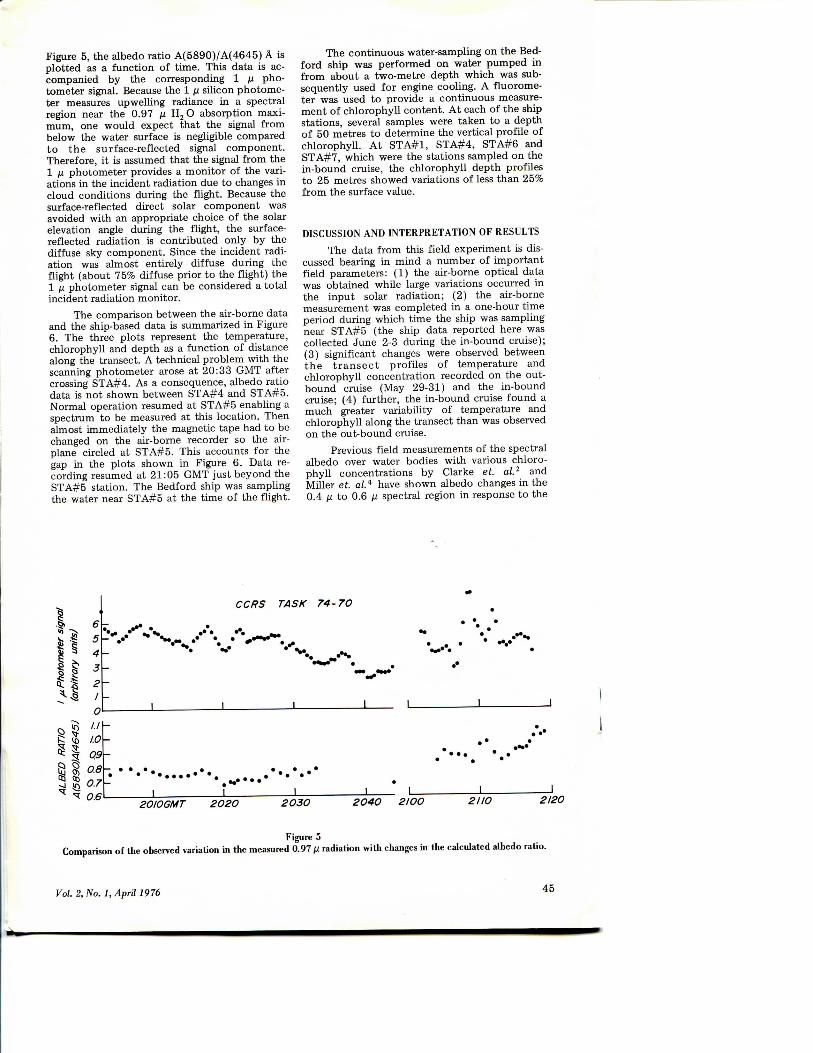
Figure 5, the albedo ratio A(5890)/A(4645) A isplotted as a function of time. This data is ac-companied by the corresponding 1 /u pho-tometer signal. Because the 1 n silicon photome-ter measures upwelling radiance in a spectralregion near the 0.97 // H2O absorption maxi-mum, one would expect that the signal frombelow the water surface is negligible comparedto the surface-reflected signal component.Therefore, it is assumed that the signal from the1 ju photometer provides a monitor of the vari-ations in the incident radiation due to changes incloud conditions during the flight. Because thesurface-reflected direct solar component wasavoided with an appropriate choice of the solarelevation angle during the flight, the surface-reflected radiation is contributed only by thediffuse sky component. Since the incident radi-ation was almost entirely diffuse during theflight (about 75% diffuse prior to the flight) the1 ju photometer signal can be considered a totalincident radiation monitor.
The comparison between the air-borne dataand the ship-based data is summarized in Figure6. The three plots represent the temperature,chlorophyll and depth as a function of distancealong the transect. A technical problem with thescanning photometer arose at 20:33 GMT aftercrossing STA#4. As a consequence, albedo ratiodata is not shown between STA#4 and STA#5.Normal operation resumed at STA#5 enabling aspectrum to be measured at this location. Thenalmost immediately the magnetic tape had to bechanged on the air-borne recorder so the air-plane circled at STA#5. This accounts for thegap in the plots shown in Figure 6. Data re-cording resumed at 21:05 GMT just beyond theSTA#5 station. The Bedford ship was samplingthe water near STA#5 at the time of the flight.
The continuous water-sampling on the Bed-ford ship was performed on water pumped infrom about a two-metre depth which was sub-sequently used for engine cooling. A fluorome-ter was used to provide a continuous measure-ment of chlorophyll content. At each of the shipstations, several samples were taken to a depthof 50 metres to determine the vertical profile ofchlorophyll. At STA#1, STA#4, STA#6 andSTA#7, which were the stations sampled on thein-bound cruise, the chlorophyll depth profilesto 25 metres showed variations of less than 25%from the surface value.
DISCUSSION AND INTERPRETATION OF RESULTS
The data from this field experiment is dis-cussed bearing in mind a number of importantfield parameters: (1) the air-borne optical datawas obtained while large variations occurred inthe input solar radiation; (2) the air-bornemeasurement was completed in a one-hour timeperiod during which time the ship was samplingnear STA#5 (the ship data reported here wascollected June 2-3 during the in-bound cruise);(3) significant changes were observed betweenthe transect profiles of temperature andchlorophyll concentration recorded on the out-bound cruise (May 29-31) and the in-boundcruise; (4) further, the in-bound cruise found amuch greater variability of temperature andchlorophyll along the transect than was observedon the out-bound cruise.
Previous field measurements of the spectralalbedo over water bodies with various chloro-phyll concentrations by Clarke et. al.2 andMiller et. a/.4 have shown albedo changes in the0.4 ju to 0.6 /x spectral region in response to the
.§, 6
l\
OCRS TASK 74-7O
•*«• /"*-v_ ••*• ••• «,- " "•-•.:* V "~ >
I f 5
0
0 ^ Ufc 5 1.0
^ ^ 0 9Q ^ naUj o^ ^-"
* °° 07^ \f) f-f-r
^ ^ 0.6
I I
1 1 J L 120IOGMT 2O2O 2030 2O4O 2IOO 2IIO 2120
Figure 5Comparison of the observed variation in the measured 0.97 jU radiation with changes in the calculated albedo ratio.
Vol. 2, No. 1, April 1976 45

0°
• BEDFORD SHIP DATA . ° l{_.n°- = AIRBORNE PRT-5
fbtjfv**** *- 0 °0° "o 0 ™W
• O IO 2O 3O1 1 1 1
DATA
-~ _-A
V%"9,X s->< ""%"°*,Ixf l51
A.-tf*Za^°^!fiaja^'*£/
40 SO 6O 7O SO SO /OOnmi i i i i i i
.•.•*tjtf>f*ajr•A'W"°n— "°
/OO //O /2O /3O WO /5O /6O/fI I
tf
II
IO9
e76
" Distance
20OOGMT 2OIO
S / / i - • BEDFORD SHIP DATA
^§ OS
g OS
§ 07
1 0.6~J
° AIRBORNE DATA
; ; ° ";° " ° • " - ° °% ff-ft*&j^>;5*v'V(? /O ^0 JC? 40 5O ^0 7O 5O
• ^
* ° D
o o a
BB0n0\*lX*W
'-•-% •>';V^%
9O /OOn/77 /OO //O /^O /5O MO ISO I6O~I I 1 I 1 1 I 1 1
4.0 *•&*
3.0 *^Si
2.O I
i.o io.o ^Distance
20OOGMT 20IO
26lO
Figure 6A composite figure summarizing the corresponding air-borne and ship data. The upper plot compares temperature, themiddle plot compares derived chlorophyll concentration with spectral albedo and the lower plot indicates the waterdepth. The three plots give the variation of these parameters with distance along the transect along with the cor-
responding time for the airplane data.
amount of absorption by chlorophyll pigmentnear .45 ju (Yentsch7). Thus, the shape of thespectral albedo curve is a measure of the chloro-phyll content. An examination of the spectralalbedo curves in Figure 4 reveals (1) the similari-ty in the shapes of the spectral curves forSTA#2 and STA#5 as well as (2) the signifi-cantly different spectral albedo shape forSTA#7. The change in the albedo shape betweenSTA#2 and STA#7 indicates a significant in-crease in chlorophyll content in agreement withthe ship measurements of 0.5 /jg/8 and 3.3 jug/8for STA#2 and STA#7, respectively. Thesechlorophyll concentrations and correspondingspectral albedo curves show qualitative agree-ment, with the previously published field databy Clarke et. a/.2 and Miller et. a/.4. Detailedcomparison of these data is not warranted be-cause of the effect of the varying solar input onthe albedo curves presented here. In the absenceof a continuous measurement of the solar inputspectrum, absolute % reflectance values cannotbe obtained from this experiment and thereforeonly qualitative comparisons are made. In thisregard it is interesting to note that the shape ofthe spectral albedo curves for both STA#2 andSTA#5 indicate a low chlorophyll concentration(measured at about 0.3 and 0.5 Mg/£> respec-tively), although the absolute magnitude of the %reflectance differs by about a factor of 2; this
factor corresponds closely to the decrease in theinput solar radiation between STA#2 andSTA#5 as indicated by the 1 jj. photometer inFigure 5.
The albedo ratio A(5890)/A(4645) isshown as a function of position along thetransect in Figures 5 and 6 as an indicator of thevariation of chlorophyll concentration. How-ever, the variability of the solar input makes thesimple use of the albedo ratio to directly inferchlorophyll content open to question. In thisregard, it is interesting that Figure 5 indicates noapparent correlation between the albedo ratioand the changing sky conditions, thought to beeffectively monitored by the 1 n photometer.The re-representation of this data in Figure 7 isquite convincing in establishing that the albedoratio is not sensitive to changing light levels fordiffuse illumination by an overcast sky. There-fore, it appears that it is appropriate to usealbedo ratios to infer chlorophyll concentrationsalong the transect. Accordingly, the spectralalbedo curves of Clarke et. a/.2 and Miller et.a/.4 were used to deduce that albedo ratios of0.6 and 1.0 correspond approximately to chloro-phyll concentrations of 0.5 and 3.0jUg/2 respec-tively. Using these values and assuming a linearrelationship between them, the albedo ratio datawas converted to chlorophyll data. (Note that
46 Canadian Journal of Remote Sensing

^60~•I 50-.
3..80 .90 1.0
ALBEDO RATIO A(5B9O)/A(4645)
Figure 7Plot of albedo ratios and the corresponding 1 pi pho-tometer signals obtained along the 160-mile flight line toshow the degree of correlation between these parameters.
no correction was made for the surface reflec-tion before calculating the albedo measure-ments.) These data are superimposed on theship-based chlorophyll data in Figure 6. Thegeneral agreement between the air-borne andship data is good, showing a gradual trend to-wards increased chlorophyll beyond the shelf.Exact agreement could not be expected becauseof the difference in the time scales in the twomeasurements, except for the coincidentmeasurement at STA#5. There are some signifi-cant differences, however. The most obvious dis-agreement is in the near shore STA#1 to STA#3area. Boat sampling in this region occurredabout eight hours following the flight and be-cause of the changes observed in the waterparameters between the out-bound and in-boundcruise, this disagreement is not surprising.
Comparison of the air-borne and ship basedtemperature measurements is shown by Figure 6to be in general agreement. However, a system-atic temperature difference of perhaps 1°C ap-pears in these data which could easily be causedby the absence of radiometric corrections to thePRT-5 calibrations to account for atmospherictemperature, humidity and perhaps local cloudconditions. Also, a small temperature increasewas possible between the ambient temperatureand the water sampling station in the ship. Anumber of more pronounced temperature datadifferences exist and furthermore, appear to cor-relate with the air-borne and ship chlorophylldata discrepancies. The most obvious suchcorrelation occurs at 20:17 GMT when both theair-borne measured temperature and chlorophyllexhibit a sharp change.
CONCLUSIONS
In view of the difficulties noted above,little progress can be claimed in establishing aquantitative relationship between the spectralalbedo and chlorophyll concentration. (To thisend some modelling calculations have beeninitiated.) However, in spite of the field prob-
lems, general agreement was found between thecholorophyll content inferred from the albedoratio obtained spectroscopically at 2,000 ft. alti-tude and the ship-based chlorophyll concentra-tion obtained using a fluorometer. Simultaneoussolar input measurements would have enhancedthe value of this data markedly. With solar inputmeasurements, remote chlorophyll measure-ments should be readily obtained even under ad-verse sky conditions. This result is important forair-borne programs for chlorophyll monitoringsince data collection could then be possible onmany more days than with the requirement forclear skies.
ACKNOWLEDGEMENTS
The authors gratefully acknowledge thesupport and co-operation of a large number ofpeople involved in this project. This experimentwas made possible through the excellent com-bined assistance of the Airborne OperationsSection of CCRS who organized the project, thecrew of the Airborne Sensing Unit who carriedout the air-borne mission and the captain andcrew of the C.S.S. Dawson (R.O. Fournier, ChiefScientist) who provided the ship measurements.The air-borne photometric measurements anddata analysis were funded by a grant from theNational Research Council.
REFERENCES
(1) Ramsey, R.C. —Study of Remote Measure-ment of Ocean Colour, Final Report TRW,NASA-1658,1968.
(2) Clarke, L., Ewing, G.C. and Lorenzen, C.J.— Spectra of Backscattered Light from theSea Obtained from Aircraft as a Measure ofChlorophyll Concentrations, Science, Vol.167, p. 1119,1970.
(3) Arvesen, J.C., Weaver, E.C. and Millard,J.P. — Rapid Assessment of Water Pollutionby Airborne Measurement of ChlorophyllContent, AIAA Joint Conference onSensing of Pollutants, Palo Alto, Calif.,November 1971.
(4) Miller, J.R., Shepherd, G.G. and Koehler,R.A. — Airborne Spectroscopic Measure-ments Over Water, CASJ, Vol. 19, No. 10,December 1973.
(5) Shepherd, G.G., Koehler, R.A., Gault, W.A.and Neo, Y.P. — Two SpectroscopicDevices For Earth Resource Surveys, CASJ,Vol. 17, No. 10, December 1971.
(6) Miller, R.G., Shepherd, G.G. and Koehler,R.A. —A Four-Channel Scanning Photome-ter For Remote Sensing, CASJ, Vol. 18,No. 10, December 1972.
(7) Yentsch, C.S. - The Influence of Phy-toplankton Pigments On the Color of theSea, Deep Sea Research, Vol. 17, p. 1,1960.
(8) Curran, R.J. — Ocean Color DeterminationThrough a Scattering Atmosphere, AppliedOptics, Vol. 11, p. 1857, 1972.
Vol. 2, No. 1, April 1976 47
Copyright © 2022 FDOKUMEN