Africa Bottom Billion Fastest Billion 190711
44
Africa Economics Update Economics and strategy research 19 July 2011 Africa The bottom billion becomes the fastest billion Important disclosures are found at the Disclosures Appendix. Communicated by Renaissance Securities (Cyprus) Limited, regulated by the Cyprus Securities & Exchange Commission, which together with non-US affiliates operates outside of the USA under the brand name of Renaissance Capital. Charles Robertson +44 (207) 367-8235 [email protected] Yvonne Mhango Nothando Ndebele
Transcript of Africa Bottom Billion Fastest Billion 190711

AfricaEconomics
UpdateEconomics and strategy research
19 July 2011
Africa The bottom billion becomes the fastest billion
Important disclosures are found at the Disclosures Appendix. Communicated by Renaissance Securities (Cyprus) Limited, regulated by the Cyprus Securities & Exchange Commission, which together with non-US affiliates operates outside of the USA under the brand name of Renaissance Capital.
Charles Robertson+44 (207) [email protected]
Yvonne MhangoNothando Ndebele
19 July 2011 Africa: The bottom billion becomes the fastest billion Renaissance Capital
2
Executive summary 3 A history of the world in 1,000 words 5 Modernisation theory 11 The Rostow take-off (or stages of growth) model 11
Africa 1960-1980: Stage one 11 Stage two in Africa: Education has improved, banking facilities are ready 12 Entering the third stage: Services over manufacturing 14 Africa’s demographic advantage over Asia 15 Urbanisation as a growth factor 17 The third stage – Investment requirements 18 Foreign financing 19 Domestic financing 20 Institutional developments 22
Growth drivers: Services and construction 24 The critics of catch-up theory 27 Your questions? 27
Infrastructure: the key to faster growth 29 in SSA 29
Finding 1: Infrastructure contributed to over half of Africa’s improved growth performance 29 Finding 2: Africa’s infrastructure lags its emerging markets peers 31 Finding 3: Socio-geo-economic issues add to the infrastructure challenges 31 Finding 4: Infrastructure services are twice as expensive as elsewhere 33 Finding 5: Power remains the continent’s largest infrastructure challenge 33 Finding 6: Africa’s infrastructure spending needs estimated at $93bn annually 36 Conclusion 37
What would result from sustained 38 higher growth? 38
What sectors and stocks do we prefer? 38
Appendix data 40 Disclosures appendix 41
Contents

3
Renaissance Capital Africa: The bottom billion becomes the fastest billion 19 July 2011
Age is not often associated with speed. But Africa, the world’s oldest continent, now has more of the world’s fastest-growing economies than any other. Over 2000-2009, 11 African countries grew at an annual rate of 7% or more – a rate sufficient to double the economy in 10 years. This is a big shift from the 1980s and 1990s, when just three African countries achieved this level of growth. Of these 11 booming economies, nine were in Sub-Saharan Africa (SSA); six benefited from higher energy prices, and five were not associated with either energy or metal exports: China’s demand for global commodities cannot be the only reason for this significant improvement. After a generation of relative stagnation in the late 20th century, many in Africa have now begun the long-awaited period of catch-up with the developed world. The bottom billion is becoming the fastest billion.
Figure 1: Africa accelerates past Asia, with the highest number of countries that grew at 7% pa on average over 2000-2009
Source: IMF World Economic Outlook, April 2011
Catch-up economic theory suggests all countries will eventually make the leap from subsistence farming to developed nation status, and that the later countries make this transition, the quicker the growth when it finally happens. The technologies to boost productivity get cheaper and easier to import; Africa’s booming telecoms sector is just one example. The global markets available to the poorest societies get ever larger: In the 19th century, the UK had no countries to export to that were richer on a per-capita GDP basis; today, Africa has richer export markets to pick from – not just in North America and Europe, but also across an increasing number of Asian countries. Delivering that export growth is easier too, as telecoms opens up services as a route for export growth. Meanwhile, the evidence that effective policymaking can lead to growth becomes progressively harder to ignore – in recent years, even North Korea and Cuba have made efforts to bring market forces into their economic systems, but we find far more to be inspired by in Rwanda and Mauritius.
Just how fast can growth be? The fact that 11 booming African nations have already achieved at least 7% annual growth is yesterday’s story. What’s more important is that three have grown at 10% pa, and we believe more can achieve or better this. In our view, it would not take much for Nigeria to shift its 9% growth rate into double digits by widening access to cheaper electricity. We see scope for improved governance in Côte d’Ivoire, in turn enabling it to emulate Sierra Leone’s 10% annual growth rate. The positive examples provided by countries like Rwanda highlight the success that others across Africa might copy.
02468
1012
Asia
Afric
a
CIS
Midd
le Ea
st
Latam
/Car
ibbea
n
CEE
1980-1989 1990-99 2000-09
Executive summary
Africa’s boom is not just a China story
It is easier than ever to catch up, as there is an increasing number of increasingly
rich countries to sell to
Three countries grew at 10% or more for a decade; more could easily follow

19 July 2011 Africa: The bottom billion becomes the fastest billion Renaissance Capital
4
Higher investment rates would go a long way towards broadening and accelerating growth across Africa. This investment might flow from external sources – as it did in South East Asia. Chinese lending to Africa is one example (see our China in Africa report, dated 21 April 2011), as is US retail giant Walmart’s investment in African retail. Foreign portfolio flows can reduce borrowing costs for companies, and provide equity financing for businesses to expand.
We think such inflows look increasingly likely, as demographics favour direct investment in Africa. Asia’s young population is now declining – with East Asia’s dropping 27% this decade – and only SSA is positioned to experience 15-20% growth in the crucial 15-24 age range over the coming decades, which will provide the plentiful labour force the world economy will rely on.
Better still, this workforce is far better educated than a generation or two ago, after SSA saw nearly a tenfold rise in the gross secondary school enrolment rate to 29% by 2005 from just 3% in 1960 (the latter was surely a contributory factor to the weakness of the 1980s). These are now around the levels of Mexico or Turkey in the 1970s which helped pave the way to their strong growth performance in subsequent decades. Africa’s workforce is now well educated enough to support the take-off.
Most positive would be a restoration of trust in the domestic economic environment from locals themselves, and a recognition that returns on investment in Africa can far outweigh those now available in the West. This can already be seen in the re-investment of profits by African businesses. We estimate higher investment could add 2 ppts to GDP growth rates (see pages 29 to 37), and note that this would have increased the number of African countries doubling their economies within a decade to 21 over 2000-2009. The challenge for investors will be in accessing the multiple growth stories that could result from this (see page 38 for our current stock recommendations).
Even a slight improvement in the growth rate over the next two decades will produce some remarkable results. If, instead of nominal dollar growth of 9% annually, we saw 10%, then Nigeria would become a $1trn economy by 2027. Sub-Saharan Africa – excluding South Africa – alone would rise from $700bn (similar to Indonesia) to $4.5trn by 2030, assuming 10% growth in nominal dollar terms. These may well prove to be conservative estimates.
The creation of a virtuous circle of higher growth leading to better governance – in turn attracting more investment and faster growth – is under way. Democracies are becoming safer across the continent. We would not be surprised to see Africa recording some of the highest growth rates ever achieved in the coming decades.
Foreign financing will provide some of the support
Asia’s population is now in decline, Africa’s young adult population is growing at 15-20%
SSA is better educated than ever; Botswana, Mauritius and SA have a higher percentage in secondary education than China or India
Higher investment (e.g. in infrastructure) could add 2 ppts to GDP growth and would have put 21 African countries into the high-growth category

5
Renaissance Capital Africa: The bottom billion becomes the fastest billion 19 July 2011
There is still no consensus on why the UK became the first country to experience an industrial revolution and a relative growth explosion. From 0-1000 AD, UK GDP was roughly stable at $400 per capita – roughly 15% below Chinese and Indian wealth levels. By 1500 AD, the UK had superseded both these great Asian powers, but with per-capita GDP of $714, it did not quite equal France and clearly lagged the financial giant that was Medici Italy with per-capita GDP of $1,100. Even 200 years later, after an impressive 0.3% annual growth rate, UK per-capita GDP was $1,250 and double that of China or India, but only just over half that of the new financial powerhouse that was The Netherlands, on $2,130. The great leap forward only kicked in from 1820 to 1850, when annual per-capita GDP began rising by 1.0%, after which UK per-capita income was the highest in the world.
Figure 2: Per-capita GDP from 0-1870 AD, constant 1990 PPP dollars
Source: Historical Statistics of the World Economy: 1-2008 AD, Angus Maddison
Naturally the Victorian British had many explanations for this, many of which assumed an innate English superiority over other peoples (and most satisfyingly over their age-old enemies, the French). But rather alarmingly, other Europeans began to catch up with the UK. Germans proved adept at copying, and then improving on UK iron and steel manufacturing techniques. They became more efficient than the English themselves – most distressing of all in the football arena. Through the 19th century, Germany, the US, France and Australia and New Zealand began to grow more quickly than the UK, by importing foreign capital (often British), modern industrial equipment and improving British manufacturing techniques – much as Kenya is doing with telephone banking today.
Figure 3: Growth spreads outside NW Europe – per-capita GDP, 1870-1910, constant 1990 PPP dollars
Source: Historical Statistics of the World Economy: 1-2008 AD, Angus Maddison
0500
1,0001,5002,0002,5003,0003,500
1 1000 1500 1600 1700 1820 1850 1870
United Kingdom France Italy India China Netherlands
500
1,500
2,500
3,500
4,500
5,500
1870 1880 1890 1900 1910
UK France Germany US CanadaNew Zealand Russia Argentina Japan
A history of the world in 1,000 words
Why was the UK the first to modernise?
It was not just Britain’s Victorian values –other European nations quickly followed
the UK lead

19 July 2011 Africa: The bottom billion becomes the fastest billion Renaissance Capital
Figure 4: Population size in 2010 (mn)
Source: IMF, Renaissance Capital estimates
Tunisia
Algeria Morocco Egypt
Libya
W.S Chad Mauritania Mali Niger
C.V Sudan Eritrea
Senegal Djib.Gambia
G-B Burkina Faso
Guinea
South Ethiopia Sudan Sierra L. Cen. A R Liberia Cote D'Ivoire Nigeria Som.
Ghana Benin Togo
1 box = 1m 1 box = total pop less than 1m
Kenya
Uganda
Cameroon 156mn Nigeria = Russia (140) = Bangladesh (165)85mn Ethiopia = Vietnam (88) = Germany (82) = Egypt (78) Eq G. Rwanda Tanzania70mn Dem Rep Congo = Iran (75) = Turkey (71) STP 50mn SA = Korea (49) = Spain (46) Gab. Dem Rep of Congo40mn Kenya= Algeria (36) = Poland (38) = Canada (34) = Uganda (34) Congo 24mn Ghana = Saudi Arabia (26) = Australia (23) 14mn Zimbabwe = Zambia (13) = Cambodia (14) = Greece (12) Burundi10mn Rwanda = Hungary (10) = Czech Republic (11)
Angola Romania
Zambia Malawi
MadagascarPoland Mozambique
Nmb. Bts. Zimbabwe Mrt.
Swz.
Lesotho South Africa

7
Renaissance Capital Africa: The bottom billion becomes the fastest billion 19 July 2011
Figure 5: GDP size in 2010 (bn), current dollars
Source: IMF, Renaissance Capital estimates
Morocco Algeria Tunisia
Libya
Egypt
Niger
W.S Mauritania Chad Mali
Gambia
C.V Senegal Burkina Faso
G-BGuinea
Nigeria Benin
S-L Ghana Togo Sudan Cote D'Ivoire
Lib.
Eritrea
Djib.
CAR SomaliaEthiopia
1 box = $1bn 1 box = total GDP less than $0.5bn Cameroon Blank box = No available GDP data
South Africa = Argentina = Iran = Austria ($357-377bn) UgandaNigeria = Egypt = Ireland = Israel = Singapore ($204-223bn)
Eq GuineaKenya
ST&PGabon Rwanda
Congo Dem Rep Bur. Tanzania Seychelles
Malawi
Zambia Moz.
ZimbabweMad.
BotswanaAngola Mauritius
Les. Swazil.
Namibia
South Africa

19 July 2011 Africa: The bottom billion becomes the fastest billion Renaissance Capital
8
By the late 19th century, while the British could no longer feel quite so superior, it still seemed that at least north-west Europeans and their colonists in the US and Oceania, had some natural advantage over others; whether this was rooted in political, religious or social norms. Yet seemingly out of nowhere imperial Orthodox Russia, Catholic Argentina and Japan began the same catch-up process others had experienced. In Russia and Argentina this was primarily financed from abroad (France and the UK, respectively), while the Japanese used domestic savings. Russia boomed on oil and grain, Argentina on meat and grain, while Japan shifted from silkworms to textiles and other light manufacturing.
Figure 6: The take-off engulfs Spain and Latin America – per-capita GDP, constant 1990 PPP dollars
Source: Historical Statistics of the World Economy: 1-2008 AD, Angus Maddison
By 1960, the gap between what was now termed the West (including Japan), and the rest of the world was wider than ever. It was not clear who, if anyone, could repeat what the West had achieved. Of all the continents, Asia would have been chosen by few as the likely success story of the second half of the 20th century. Communism was holding back, or even reversing, growth in countries like China, North Korea and North Vietnam. War and political instability threatened South Korea, South East Asia, India and Pakistan. Per-capita GDP in Singapore and South Korea was around $400. The English-speaking Philippines, protected by the US, would have probably seemed the most likely success story.
Figure 7: The growth story crosses the Pacific – per-capita GDP, constant 1990 PPP dollars
Source: Historical Statistics of the World Economy: 1-2008 AD, Angus Maddison
0
5,000
10,000
15,000
20,000
25,000
1
1825
1840
1855
1870
1885
1900
1915
1930
1945
1960
1975
1990
2005
Spain Argentina Brazil Chile Colombia Mexico Venezuela
0
5,000
10,000
15,000
20,000
25,000
30,000
35,000
1
1825
1840
1855
1870
1885
1900
1915
1930
1945
1960
1975
1990
2005
United States Japan South Korea Thailand Taiwan Singapore India China
Commodity exporters and non-Christian countries experienced the catch-up from 1870 onwards
When Asia followed it was resource-less countries that led the charge

9
Renaissance Capital Africa: The bottom billion becomes the fastest billion 19 July 2011
Instead it was the resource-less dragons of Taiwan, Hong Kong, Singapore as well as South Korea which boomed through the 1970s. By the 1980s and 1990s, they had been joined by the tigers of Thailand, Malaysia and Indonesia. China itself had finally joined the growth party in the 1980s and India stepped up in the 1990s and 2000s. Meanwhile, the Japanese model, which was so admired in the 1980s and appeared to put Japan on course to challenge the US, crashed, and consensus instead turned to the Chinese model.
While it is still generally ignored, Africa joined the boom a decade ago. The oil-rich economies of Angola and Equatorial Guinea were the fastest-growing African economies, but a number of East African countries, including Uganda, Rwanda and Tanzania, achieved record growth rates.
The pace of growth has also accelerated. The improvement in Nigerian per capita GDP in constant prices over the six years of 2002-2008 took India eight years to achieve in the late 20th century, it took Korea 11 years to achieve in the mid-20th century, and it took France 27 years to manage the same in the 19th century.
Figure 8: More African countries recorded average annual growth of 7%-plus over 2000-2009 than ever
Source: IMF, Renaissance Capital estimates
What is clear from the above is that the growth virus does not respect ethnic, religious or geographic boundaries. It is not Victorian English values, Chinese Confucian/communism or East African entrepreneurship that offer the only model to follow. Growth and high living standards have been created in resource-rich Canada and resource-less South Korea, in the formerly tropical swamps of Singapore and the cold winters of Sweden. There is no reason to assume it will not encompass us all.
02468
101214161820
Eq. G
uinea
Azer
baija
nTu
rkmen
istan
Qatar
Ango
laMy
anma
rCh
inaSi
erra
Leon
eAf
ghan
istan
Nige
riaAr
menia
Kaza
khsta
nEt
hiopia
Tajik
istan
Camb
odia
Bhuta
nRw
anda
Chad
Maldi
ves
Moza
mbiqu
eUg
anda
Suda
nVi
etnam
Belar
usMo
ngoli
aLa
osInd
iaTa
nzan
iaUA
ETr
inida
d & T
obag
o
The growth model has infected continental sized powers like China and
India, as well as city states like Singapore
Today it is Africa which dominates the high growth economies
Neither culture nor climate are barriers to the growth virus

19 July 2011 Africa: The bottom billion becomes the fastest billion Renaissance Capital
10
The only potential long-term barrier we see is the risk that the earth itself cannot cope with the consumption levels demanded by an ever-richer human race. This assumes that our ingenuity is unable to respond to these potential challenges. History is, however, encouraging. The agricultural revolution saved us from starvation. In the 1830s, Europe was running short of wood and panic buying was driving up lumber prices and cutting down the forests of the Austrian empire. Coal proved to be a solution. Oil saved the whales. It may yet be African solar power that saves us from global warming. But these are far from our areas of expertise, so below we focus on what catch-up theory suggests happens next, which countries are making the most progress, and what is both holding Africa back and providing the opportunity for faster progress.
Figure 9: Catching up is a global phenomenon – per-capita GDP since 1820, constant 1990 PPP dollars
Source: Historical Statistics of the World Economy: 1-2008 AD, Angus Maddison
0
5,000
10,000
15,000
20,000
25,000
30,000
35,000
1820
1826
1832
1838
1844
1850
1856
1862
1868
1874
1880
1886
1892
1898
1904
1910
1916
1922
1928
1934
1940
1946
1952
1958
1964
1970
1976
1982
1988
1994
2000
2006
United Kingdom FranceGermany Italy Spain United States CanadaCzechoslovakia Argentina Brazil Chile Japan South Korea Thailand TaiwanSingapore India

11
Renaissance Capital Africa: The bottom billion becomes the fastest billion 19 July 2011
The Rostow model is summarised as follows:
Stage one: Traditional society. Agriculture dominates; low per-capita GDP, due to a lack of technology. Hierarchical society.
Stage two: Preconditions for take-off. Secular education, formation of entrepreneurial class; some capital mobilisation, with currency and banking, and modest manufacturing. Take-off occurs within 10-50 years.
Stage three: Take-off. When the rate of productive investment rises from 5% to 10% or more of national income, and one or more substantial manufacturing sectors demonstrates a high rate of growth. Sector-led growth becomes common. Economic processes, rather than tradition, predominates. Maturity reached after 50-100 years. Equivalent to industrial revolution.
Stage four: Drive to maturity. Investment rates of 10-20% extend technology across the economy, and keep growth above population increase. New sectors take over from previous growth sectors. Poverty rates fall.
Stage five: Age of high mass-consumption. This enables countries to concentrate on their specific priorities, e.g. military/security issues, equality/welfare issues, luxuries for their elites.
Africa 1960-1980: Stage one
Much of Africa was evidently at the first stage at the time of the independence wave, around 1960. Agriculture dominated the continent’s economies, and education was very limited. When the Democratic Republic of Congo (DRC) won independence from Belgium in 1960, there were just 30 graduates in the country, no doctors, no secondary school teachers and no army officers. In the 1959-1960 school year, 136 children completed secondary school education in the DRC. Kenya did not have its first African lawyer until 1956 – which may be one too many, according to some American friends, but is indicative of the lack of professionals across the economy. In Northern Rhodesia (now Zambia), 35 Africans had gained higher education by 1959, and in Nyasaland (now Malawi) the figure was just 28. Given the starting point in 1960, it is not so surprising that Africa’s economies were in trouble as these countries entered the 1980s.
While human capital was lacking at the grassroots, leadership at the top did little to compensate. Many poor policy choices were made, from an excessive, if understandable focus on building university education, but at the expense of universal primary education, to the adoption of the latest Western or Maoist theories (it’s always China that has “the solution”), and neglect of the agricultural sector. The result was that growth had stuttered to a halt by the 1980s, in a continent burdened by debt.
Modernisation theory The Rostow take-off (or stages of growth) model
Africa was agricultural and held back by very low education levels in 1960
Political leaders followed foreign models with little relevance for Africa
19 July 2011 Africa: The bottom billion becomes the fastest billion Renaissance Capital
12
Stage two in Africa: Education has improved, banking facilities are ready
The situation has clearly improved. Debt forgiveness programmes mean Africa now has some of the lowest debt burdens in the world. Political leaders can see what has worked elsewhere, and are adopting reforms that make a difference. Micro-level reforms mean some countries in Africa are leaping up the World Bank’s ease of doing business indicators – Rwanda ranked first in 2010 (see our report Rwanda – An African inspiration, dated 12 April 2011). Education has been expanded dramatically.
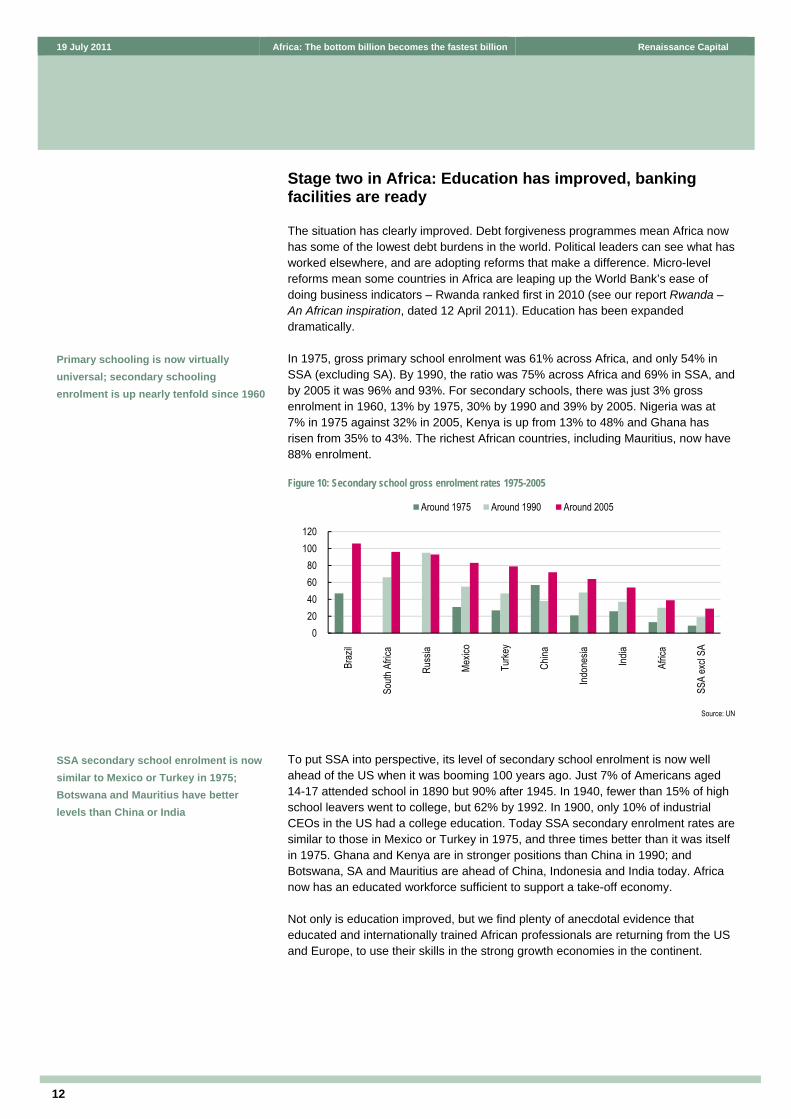
In 1975, gross primary school enrolment was 61% across Africa, and only 54% in SSA (excluding SA). By 1990, the ratio was 75% across Africa and 69% in SSA, and by 2005 it was 96% and 93%. For secondary schools, there was just 3% gross enrolment in 1960, 13% by 1975, 30% by 1990 and 39% by 2005. Nigeria was at 7% in 1975 against 32% in 2005, Kenya is up from 13% to 48% and Ghana has risen from 35% to 43%. The richest African countries, including Mauritius, now have 88% enrolment.
Figure 10: Secondary school gross enrolment rates 1975-2005
Source: UN
To put SSA into perspective, its level of secondary school enrolment is now well ahead of the US when it was booming 100 years ago. Just 7% of Americans aged 14-17 attended school in 1890 but 90% after 1945. In 1940, fewer than 15% of high school leavers went to college, but 62% by 1992. In 1900, only 10% of industrial CEOs in the US had a college education. Today SSA secondary enrolment rates are similar to those in Mexico or Turkey in 1975, and three times better than it was itself in 1975. Ghana and Kenya are in stronger positions than China in 1990; and Botswana, SA and Mauritius are ahead of China, Indonesia and India today. Africa now has an educated workforce sufficient to support a take-off economy.
Not only is education improved, but we find plenty of anecdotal evidence that educated and internationally trained African professionals are returning from the US and Europe, to use their skills in the strong growth economies in the continent.
020406080
100120
Braz
il
South
Afric
a
Russ
ia
Mexic
o
Turke
y
China
Indon
esia
India
Afric
a
SSA
excl
SA
Around 1975 Around 1990 Around 2005
Primary schooling is now virtually universal; secondary schooling enrolment is up nearly tenfold since 1960
SSA secondary school enrolment is now similar to Mexico or Turkey in 1975; Botswana and Mauritius have better levels than China or India

13
Renaissance Capital Africa: The bottom billion becomes the fastest billion 19 July 2011
To enter the second stage requires an effective banking system. Stock market investors in Ghana, Nigeria, Kenya and Rwanda will all be aware that this is now in place. Credit/GDP ratios have plenty of room to rise in the years ahead and help finance rising investment.
Figure 12: Credit to households and corporates as a proportion of GDP, 2009, %
Source: IMF
0102030405060708090
Maur
itius
South
Afric
aUk
raine
Lithu
ania
Hung
ary
Croa
tiaCz
ech R
epub
licKa
zakh
stan
Polan
dBr
azil
Slov
akia
India
Russ
iaRo
mania
Nige
riaTu
rkey
Philip
pines
Keny
aInd
ones
iaZim
babw
eMe
xico 4
2dBo
tswan
a (20
08)
Ghan
aAr
genti
naZa
mbia
Rwan
da
Private sector debt ratios are way below the 200% levels seen in the UK, Spain or
the US
Figure 11: Key education data and per-capita GDP in major EM and African countries Primary gross enrolment Secondary gross enrolment Per-capita GDP 1975 1990 2005 1975 1990 2005 1990 2005 2010 Africa 61 75 96 13 30 39 Angola 78* 86 102** 10 10 15*** Angola 879 1,699 4,478 Botswana 70 104 107 14 40 77 Botswana 3,187 5,985 7,627 DRC 89 54 82** 14 22 32** DRC 227 118 186 Ethiopia 18 33 78 5 14 24 Ethiopia 259 165 350 Ghana 64 71 87 35 37 43 Ghana 603 824 1,312 Guinea 34 34 86 13 9 31 Guinea 434 319 448 Kenya 103 101 108 13 48 48 Kenya 504 547 809 Mauritius 105 109 102 38 53 88 Mauritius 2,426 5,219 7,593 Mozambique 48 63 102 4 7 13 Mozambique 249 336 458 Nigeria 50 85 95 7 23 32 Nigeria 348 824 1,389 North Africa 76 88 105 27 60 na Rwanda 54 70 128 4 8 14 Rwanda 348 287 562 SA 99 107 103 na 66 96 SA 3,039 5,267 7,158 SSA ex. SA 54 69 93 9 19 29 Tanzania 53 69 107 3 5 11 Tanzania 176 366 548 Uganda 45 67 118 4 12 18 Uganda 259 321 501 Zambia 92 94 115 15 21 30 Zambia 475 612 1,221 Zimbabwe 71 101 104*** 9 47 41*** Zimbabwe na 461 594 * 1974 ** 2007 data *** 2006 data Around
1975 Around
1990 Around
2005 Around
1975 Around
1990 Around
2005 1990 2005 2010
Brazil 122 141 136 47 106 Brazil 3,465 4,832 10,816 Russia 107 94 95 93 Russia na 5,348 10,437 Mexico 108 114 112 31 55 83 Mexico 3,458 8,163 9,566 Turkey 100 99 96 27 47 79 Turkey 3,860 7,108 10,399 China 124 129 111 57 38 72 China 341 1,726 4,382 Indonesia 89 119 118 21 48 64 Indonesia 699 1,300 3,015 India 84 93 112 26 37 54 India 378 716 1,265
Source: UN

19 July 2011 Africa: The bottom billion becomes the fastest billion Renaissance Capital
14
Entering the third stage: Services over manufacturing
The third stage is where Africa might be different. Walt Rostow’s key book, Stages of Economic Growth, was written in 1990, before this analyst had heard of the internet. If development then required a country to export to the rest of the world, it could only be done physically. Today, services might be able to replace manufacturing as the engine of growth – in Ireland, exports of services are worth 48% of GDP, while Greek exports of goods account for just 7% of GDP. Rwanda already exports more services than goods. Productivity gains in Pakistan and Sri Lanka are rising faster than in manufacturing, and the productivity level is higher in both countries, and Nepal1. Whether it is call-centres in Kenya or conferences in Rwanda, there could be room for many countries in Africa to leapfrog manufacturing, reducing the need for costly investment in transport infrastructure.
Growth in ICT has been phenomenal. There are an estimated 0.5bn mobile phones in Africa. For every 10 additional phones per 100 people, GDP growth rises by 0.6-1.2% according to one study. In 2007, just one fibre cable connected SSA to the world – now there are seven, and next year the total will reach 12. Internet capacity has risen from 340 gigabits to 34,000 gigabits per second, and the cost of internet services has dropped by 95% since 2007 and may be down by 99% in 20122.
Figure 13: Telecoms catch-up – Mobile penetration as % of population
Source: MTN, NCC, Offcom, Arcep, Renaissance Capital estimates
This is not to say we won’t see manufacturing in Africa. Beneficial trade deals between Africa and the US have already encouraged a modest amount of manufacturing to relocate to Africa even from China into special economic zones. Rising wages in China make this an increasingly plausible scenario, but Africa’s challenge will be competing with Vietnam, and others in South East Asia and South Asia.
1 The Economist, 21 May 2011. 2 http://www.time.com/time/magazine/article/0,9171,2080702-1,00.html
0
0.2
0.4
0.6
0.8
1
1.2
1.4
Keny
a
Sene
gal
Nige
ria
South
Afric
a
Ghan
a
Ugan
da
Came
roon
Cong
o-B
Egyp
t
UK
Fran
ce
2001
2002
2003
2004
2005
2006
2007
2008
2009
2010
With the internet, services might replace manufacturing as the growth driver
As Chinese wages rise, Africa may win manufacturing market share too
15
Renaissance Capital Africa: The bottom billion becomes the fastest billion 19 July 2011
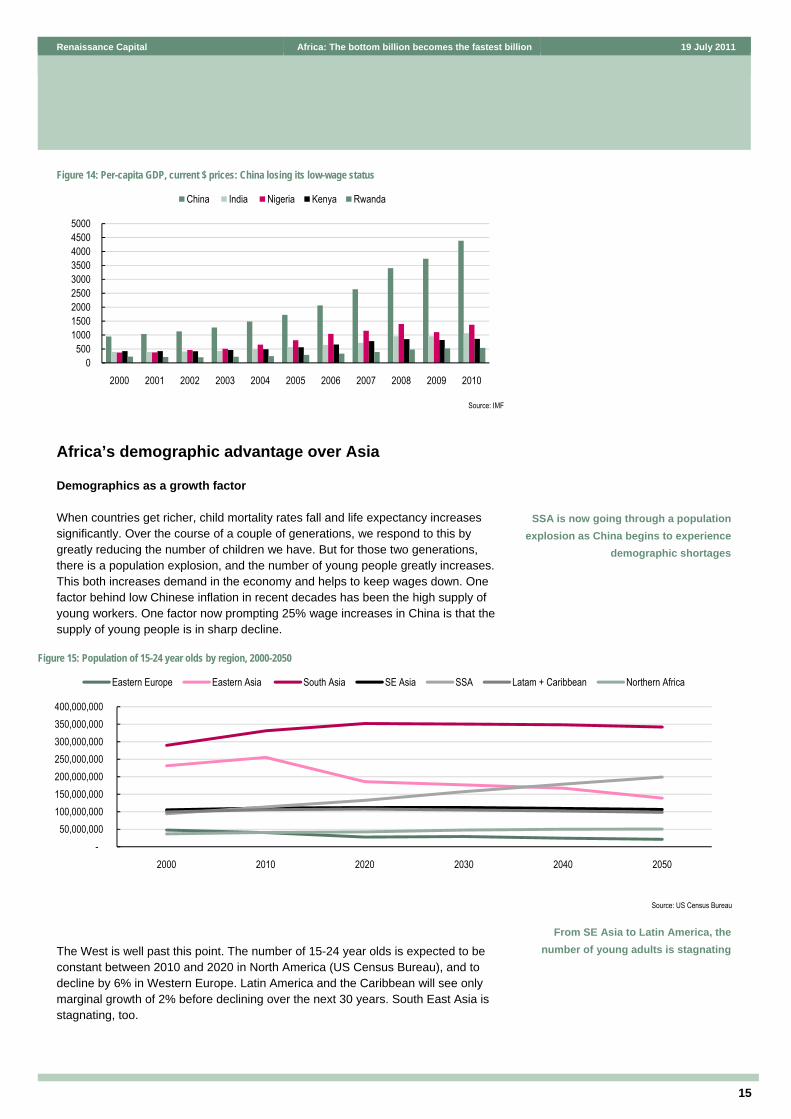
Figure 14: Per-capita GDP, current $ prices: China losing its low-wage status
Source: IMF
Africa’s demographic advantage over Asia
Demographics as a growth factor
When countries get richer, child mortality rates fall and life expectancy increases significantly. Over the course of a couple of generations, we respond to this by greatly reducing the number of children we have. But for those two generations, there is a population explosion, and the number of young people greatly increases. This both increases demand in the economy and helps to keep wages down. One factor behind low Chinese inflation in recent decades has been the high supply of young workers. One factor now prompting 25% wage increases in China is that the supply of young people is in sharp decline.
The West is well past this point. The number of 15-24 year olds is expected to be constant between 2010 and 2020 in North America (US Census Bureau), and to decline by 6% in Western Europe. Latin America and the Caribbean will see only marginal growth of 2% before declining over the next 30 years. South East Asia is stagnating, too.
0500
100015002000250030003500400045005000
2000 2001 2002 2003 2004 2005 2006 2007 2008 2009 2010
China India Nigeria Kenya Rwanda
SSA is now going through a population explosion as China begins to experience
demographic shortages
Figure 15: Population of 15-24 year olds by region, 2000-2050
Source: US Census Bureau
From SE Asia to Latin America, the number of young adults is stagnating
-50,000,000
100,000,000 150,000,000 200,000,000 250,000,000 300,000,000 350,000,000 400,000,000
2000 2010 2020 2030 2040 2050
Eastern Europe Eastern Asia South Asia SE Asia SSA Latam + Caribbean Northern Africa

19 July 2011 Africa: The bottom billion becomes the fastest billion Renaissance Capital
16
Figure 16: % change each decade in the number of 15-24 year olds in each region
Source: US Census Bureau
Eastern Europe is expected to see a dramatic 32% fall in the absolute number of 15-24 year olds, from 40mn to 28mn over 2010-2020 (according to the US Census Bureau), due to emigration by potential parents over 1995-2005 and low birth rates among those who remained in eastern Europe.
The US Census Bureau estimates that Eastern Asia (mainly China) will experience a 27% fall in this age group over this decade, and a total 45% decline from 2010 to 2050. This would more than offset a 6% rise in 15-24 year olds in South Asia. The supply of Asian labour is in decline.
Figure 17: % change in numbers of 15-24 year olds in each decade
Source: US Census Bureau
The only continent forecast to experience serious population growth is Africa – and as northern Africa is now relatively rich, the bulk of the growth will be in SSA. Its population of 15-24 year olds will rise by 15-20% each decade from now until 2040.
For labour-intensive industries such as textiles, evidently Africa will look ever more attractive, while the demand from employees in these growing sectors should in themselves boost consumption. It is young adults who need homes, and items to fill those homes. If China is the dream market for the automotive sector in 2010 – which might have looked an unrealistic forecast in 1970 – demographic data alone suggest Africa will be overtaking it within two generations.
-35-30-25-20-15-10-505
1015
North America Western Europe Eastern Europe Latam + Caribbean
2010 2020 2030 2040 2050
-40-30-20-10
01020304050
Eastern Asia
South Asia SE Asia Southern Africa
Western Africa
Northern Africa
SSA Middle Africa
2010 2020 2030 2040 2050
The number of East Asian 15-24 year olds will fall by more than a quarter this decade
SSA will see 15-20% growth per decade in the numbers of young adults
This could help attract labour intensive investment and boost economic demand
17
Renaissance Capital Africa: The bottom billion becomes the fastest billion 19 July 2011
Urbanisation as a growth factor
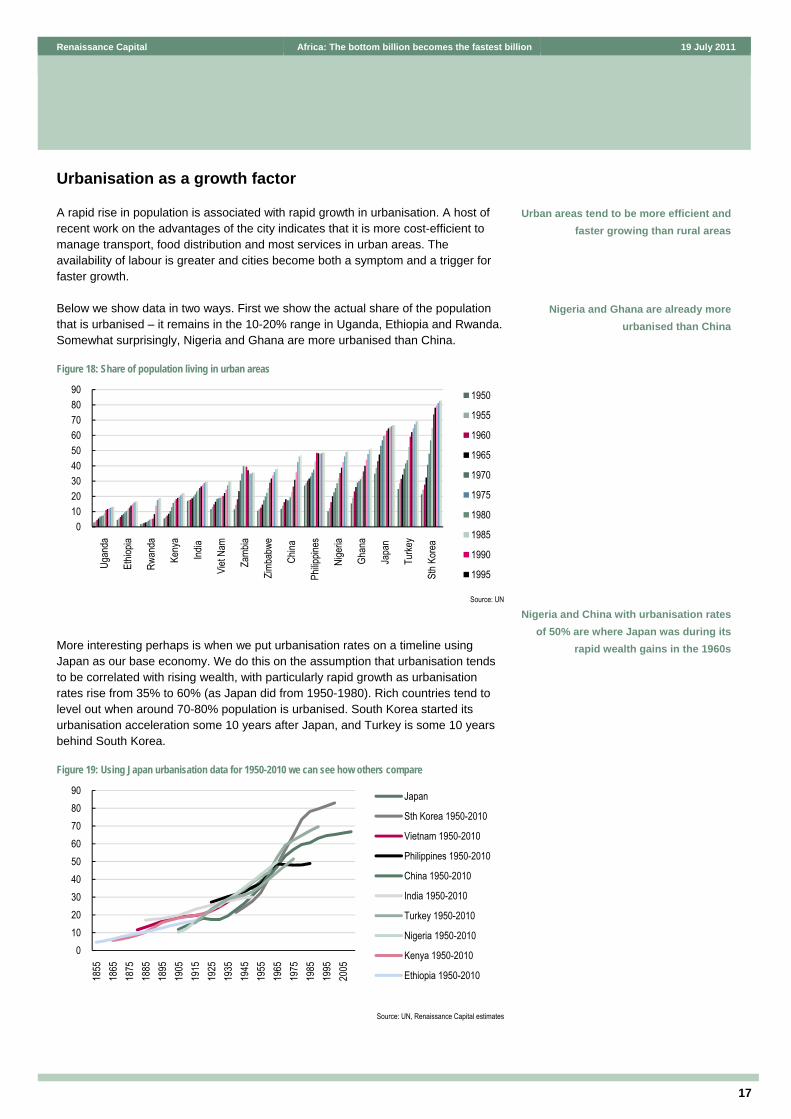
A rapid rise in population is associated with rapid growth in urbanisation. A host of recent work on the advantages of the city indicates that it is more cost-efficient to manage transport, food distribution and most services in urban areas. The availability of labour is greater and cities become both a symptom and a trigger for faster growth.
Below we show data in two ways. First we show the actual share of the population that is urbanised – it remains in the 10-20% range in Uganda, Ethiopia and Rwanda. Somewhat surprisingly, Nigeria and Ghana are more urbanised than China.
Figure 18: Share of population living in urban areas
Source: UN
More interesting perhaps is when we put urbanisation rates on a timeline using Japan as our base economy. We do this on the assumption that urbanisation tends to be correlated with rising wealth, with particularly rapid growth as urbanisation rates rise from 35% to 60% (as Japan did from 1950-1980). Rich countries tend to level out when around 70-80% population is urbanised. South Korea started its urbanisation acceleration some 10 years after Japan, and Turkey is some 10 years behind South Korea.
Figure 19: Using Japan urbanisation data for 1950-2010 we can see how others compare
Source: UN, Renaissance Capital estimates
0102030405060708090
Ugan
da
Ethio
pia
Rwan
da
Keny
a
India
Viet
Nam
Zamb
ia
Zimba
bwe
China
Philip
pines
Nige
ria
Ghan
a
Japa
n
Turke
y
Sth K
orea
1950
1955
1960
1965
1970
1975
1980
1985
1990
1995
0102030405060708090
1855
1865
1875
1885
1895
1905
1915
1925
1935
1945
1955
1965
1975
1985
1995
2005
Japan
Sth Korea 1950-2010
Vietnam 1950-2010
Philippines 1950-2010
China 1950-2010
India 1950-2010
Turkey 1950-2010
Nigeria 1950-2010
Kenya 1950-2010
Ethiopia 1950-2010
Urban areas tend to be more efficient and faster growing than rural areas
Nigeria and Ghana are already more urbanised than China
Nigeria and China with urbanisation rates of 50% are where Japan was during its
rapid wealth gains in the 1960s

19 July 2011 Africa: The bottom billion becomes the fastest billion Renaissance Capital
18
Nigeria is roughly where Turkey was in 1985, and where Japan was in 1965. We think it will likely see the urbanisation rate rise from 50% to 60-70% over the next 10-20 years. This may well coincide with a period of very rapid growth for Nigeria, as others have seen at this time. Countries like Ethiopia have not yet reached Japanese urbanisation rates for 1950.
While urbanisation can support growth, it also offers the clearest sign of an acute need to build infrastructure, as has remained clear from the slums of London in the 19th century to the favelas of Rio de Janeiro or Nairobi today. Investment is key.
The third stage – Investment requirements
According to Nobel prize winner Michael Spence, achieving multi-decade levels of growth of 7% pa has only been achieved by 13 countries – all of which had investment levels of 25% of GDP. The reverse does not apply: high savings do not guarantee growth.
Figure 20: 25 years of 7% annual growth were achieved by these countries Period of high
growth of 7% or more Per-capita income at the
beginning and in 2005 (constant 2000 dollars)
Botswana 1960-2005 210 3,800 Brazil 1950-1980 960 4,000 China 1961-2005 105 1,400
Hong Kong 1960-1997 3,100 29,900 Indonesia 1966-1997 200 900
Japan 1950-1983 3,500 39,600 Korea 1960-2001 1,100 13,200
Malaysia 1967-1997 790 4,400 Malta 1963-1994 11,100 9,600 Oman 1960-1999 950 9,000
Singapore 1960-1999 2,200 25,400 Taiwan 1965-2002 1,500 16,400
Thailand 1960-1997 330 2,400 Source: The Next Convergence, Michael Spence, World Bank, World Bank Development Indicators
Within this governments need to invest 5-7% of GDP, primarily in education (see above) and infrastructure (see below). The positive news for SSA is that government debt ratios are very low, suggesting such investment is plausible.
Figure 21: Public debt as % of GDP is very low in SSA economies
Source: Renaissance Capital estimates
0102030405060708090
100
Zimba
bwe
Hung
ary
India
Braz
il Po
land
Keny
a Ar
genti
naCh
ina
Turke
y Me
xico
Ukra
ine
Vene
zuela
Czec
h Rep
ublic
So
uth A
frica
Ghan
a So
uth K
orea
Ro
mania
Ind
ones
iaZa
mbia
Rwan
daKa
zakh
stan
Nige
ria
Russ
ia
One study suggests that achieving 25 years of 7% annual growth requires 25% investment/GDP ratios
There is room for SSA governments to boost investment
19
Renaissance Capital Africa: The bottom billion becomes the fastest billion 19 July 2011
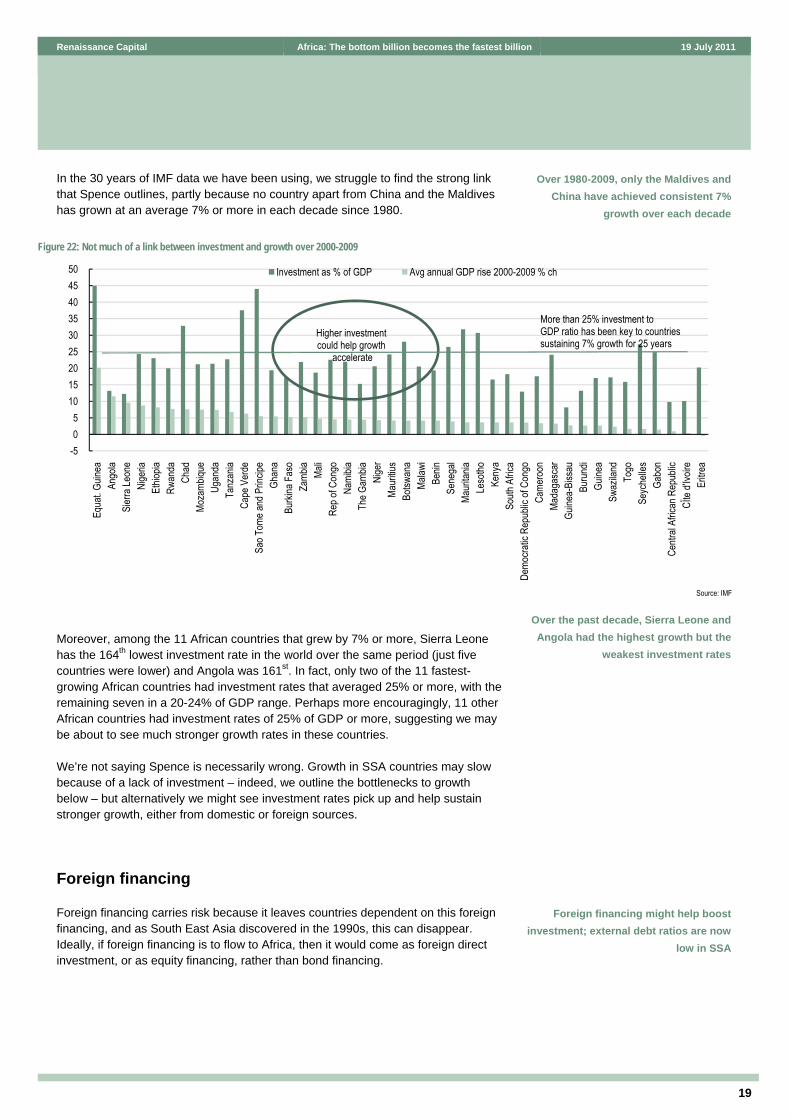
In the 30 years of IMF data we have been using, we struggle to find the strong link that Spence outlines, partly because no country apart from China and the Maldives has grown at an average 7% or more in each decade since 1980.
Moreover, among the 11 African countries that grew by 7% or more, Sierra Leone has the 164th lowest investment rate in the world over the same period (just five countries were lower) and Angola was 161st. In fact, only two of the 11 fastest-growing African countries had investment rates that averaged 25% or more, with the remaining seven in a 20-24% of GDP range. Perhaps more encouragingly, 11 other African countries had investment rates of 25% of GDP or more, suggesting we may be about to see much stronger growth rates in these countries.
We’re not saying Spence is necessarily wrong. Growth in SSA countries may slow because of a lack of investment – indeed, we outline the bottlenecks to growth below – but alternatively we might see investment rates pick up and help sustain stronger growth, either from domestic or foreign sources.
Foreign financing
Foreign financing carries risk because it leaves countries dependent on this foreign financing, and as South East Asia discovered in the 1990s, this can disappear. Ideally, if foreign financing is to flow to Africa, then it would come as foreign direct investment, or as equity financing, rather than bond financing.
Over 1980-2009, only the Maldives and China have achieved consistent 7%
growth over each decade
Figure 22: Not much of a link between investment and growth over 2000-2009
Source: IMF
Over the past decade, Sierra Leone and Angola had the highest growth but the
weakest investment rates
Foreign financing might help boost investment; external debt ratios are now
low in SSA
-505
101520253035404550
Equa
t. Guin
eaAn
gola
Sier
ra Le
one
Nige
riaEt
hiopia
Rwan
daCh
adMo
zamb
ique
Ugan
daTa
nzan
iaCa
pe V
erde
Sao T
ome a
nd P
rincip
eGh
ana
Burki
na F
aso
Zamb
iaMa
liRe
p of C
ongo
Nami
biaTh
e Gam
biaNi
ger
Maur
itius
Botsw
ana
Malaw
iBe
ninSe
nega
lMa
urita
niaLe
sotho
Keny
aSo
uth A
frica
Demo
cratic
Rep
ublic
of C
ongo
Came
roon
Mada
gasc
arGu
inea-
Biss
auBu
rund
iGu
inea
Swaz
iland
Togo
Seyc
helle
sGa
bon
Centr
al Af
rican
Rep
ublic
CЇte
d'Ivo
ireEr
itrea
Investment as % of GDP Avg annual GDP rise 2000-2009 % ch
Higher investment could help growth
accelerate
More than 25% investment to GDP ratio has been key to countries sustaining 7% growth for 25 years
19 July 2011 Africa: The bottom billion becomes the fastest billion Renaissance Capital
20
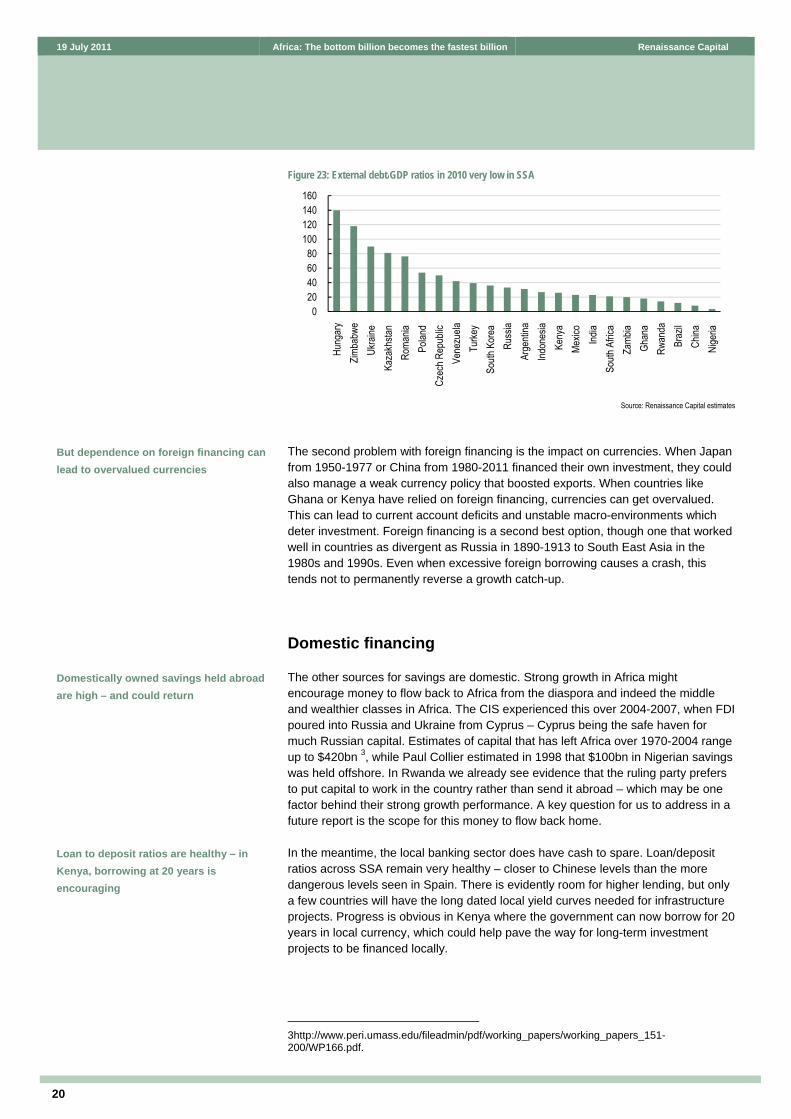
Figure 23: External debt/GDP ratios in 2010 very low in SSA
Source: Renaissance Capital estimates
The second problem with foreign financing is the impact on currencies. When Japan from 1950-1977 or China from 1980-2011 financed their own investment, they could also manage a weak currency policy that boosted exports. When countries like Ghana or Kenya have relied on foreign financing, currencies can get overvalued. This can lead to current account deficits and unstable macro-environments which deter investment. Foreign financing is a second best option, though one that worked well in countries as divergent as Russia in 1890-1913 to South East Asia in the 1980s and 1990s. Even when excessive foreign borrowing causes a crash, this tends not to permanently reverse a growth catch-up.
Domestic financing
The other sources for savings are domestic. Strong growth in Africa might encourage money to flow back to Africa from the diaspora and indeed the middle and wealthier classes in Africa. The CIS experienced this over 2004-2007, when FDI poured into Russia and Ukraine from Cyprus – Cyprus being the safe haven for much Russian capital. Estimates of capital that has left Africa over 1970-2004 range up to $420bn 3, while Paul Collier estimated in 1998 that $100bn in Nigerian savings was held offshore. In Rwanda we already see evidence that the ruling party prefers to put capital to work in the country rather than send it abroad – which may be one factor behind their strong growth performance. A key question for us to address in a future report is the scope for this money to flow back home.
In the meantime, the local banking sector does have cash to spare. Loan/deposit ratios across SSA remain very healthy – closer to Chinese levels than the more dangerous levels seen in Spain. There is evidently room for higher lending, but only a few countries will have the long dated local yield curves needed for infrastructure projects. Progress is obvious in Kenya where the government can now borrow for 20 years in local currency, which could help pave the way for long-term investment projects to be financed locally.
3http://www.peri.umass.edu/fileadmin/pdf/working_papers/working_papers_151-200/WP166.pdf.
020406080
100120140160
Hung
ary
Zimba
bwe
Ukra
ine
Kaza
khsta
n Ro
mania
Po
land
Czec
h Rep
ublic
Ve
nezu
elaTu
rkey
South
Kor
ea
Russ
iaAr
genti
naInd
ones
iaKe
nya
Mexic
o Ind
ia So
uth A
frica
Zamb
ia Gh
ana
Rwan
daBr
azil
China
Ni
geria
But dependence on foreign financing can lead to overvalued currencies
Domestically owned savings held abroad are high – and could return
Loan to deposit ratios are healthy – in Kenya, borrowing at 20 years is encouraging

21
Renaissance Capital Africa: The bottom billion becomes the fastest billion 19 July 2011
Figure 24: Loan/deposit ratios, 2010 data
Source: Renaissance Capital estimates
Pension reform might be a further avenue for domestic financing. While SA looks more akin to The Netherlands or the UK, the rest of SSA shows some surprisingly high pension fund assets, with Kenya above Kazakhstan and Nigeria above Russia. The obvious link between what pension funds need (long-dated assets) and infrastructure financing needs, suggests increased private pension levels could help fund the infrastructure that would boost growth.
Figure 25: Pension assets/GDP, Ghana vs SSA peers, 2009
Source: Local authorities
Figure 26: Pension assets, 2009
Pension
assets, $bn GDP, $bn
Population, mn
Pension assets, % of GDP
Pension assets, $/capita
Ghana 1.4 25.8 23.1 5.4 60.6 Nigeria 12.2 168 152 7.3 80.5 Kenya 5.1 29.4 35.9 17.3 142 SA 359 285 49.3 126 7,282 Russia 38 1,235 142 3.1 267 Kazakhstan 12 108 16 11.5 796 Zimbabwe 1.8 6.7 11.7 26.9 154 Zambia 1.2 12.7 12.0 9.7 100
Source: Local authorities, Renaissance Capital estimates
020406080
100120140160180200
Ukra
ine
Kaza
khsta
n
Russ
ia
South
Afric
a
Nige
ria
Rwan
da
China
Keny
a
Zamb
ia
Ghan
a
Zimba
bwe
Loan to deposit ratio (2010)
05
101520253035404550556065
South
Af
rica
Zimba
bwe
Keny
a
Kaza
khsta
n
Zamb
ia
Ghan
a
Nige
ria
Russ
ia

19 July 2011 Africa: The bottom billion becomes the fastest billion Renaissance Capital
22
Mobile phone banking may also pull savings into the formal economy and support domestically financed credit extension. The Mpesa system in Kenya has already extended banking services from roughly 20% of the population to at least 50% of the adult population between March 2007 and December 20104. Not only does it form an alternative way to bring cash into the banking system, it might also encourage remittances by cutting costs5. So far the interest earned on all Mpesa accounts is equivalent to $7.5m and the average saving is just $3 per account, but as the system develops, this may well change.
If nine countries can sustain 7% growth without high investment, then we see a good chance of more achieving 10% or more annual growth rates with high investment.
Institutional developments
The cutting of red tape supports the acceleration of economic activity in SSA. A significant part of SSA’s growth story is attributed to the region’s commodity wealth, which is satisfying Asia’s huge appetite for natural resources. However, the fact that SSA’s mineral-poor and oil-importing countries have also been a significant part of this growth story implies that there is more to it than commodities. Softer issues, including political stability, macroeconomic reforms and institutional developments, collectively explain the balanced growth performance across SSA.
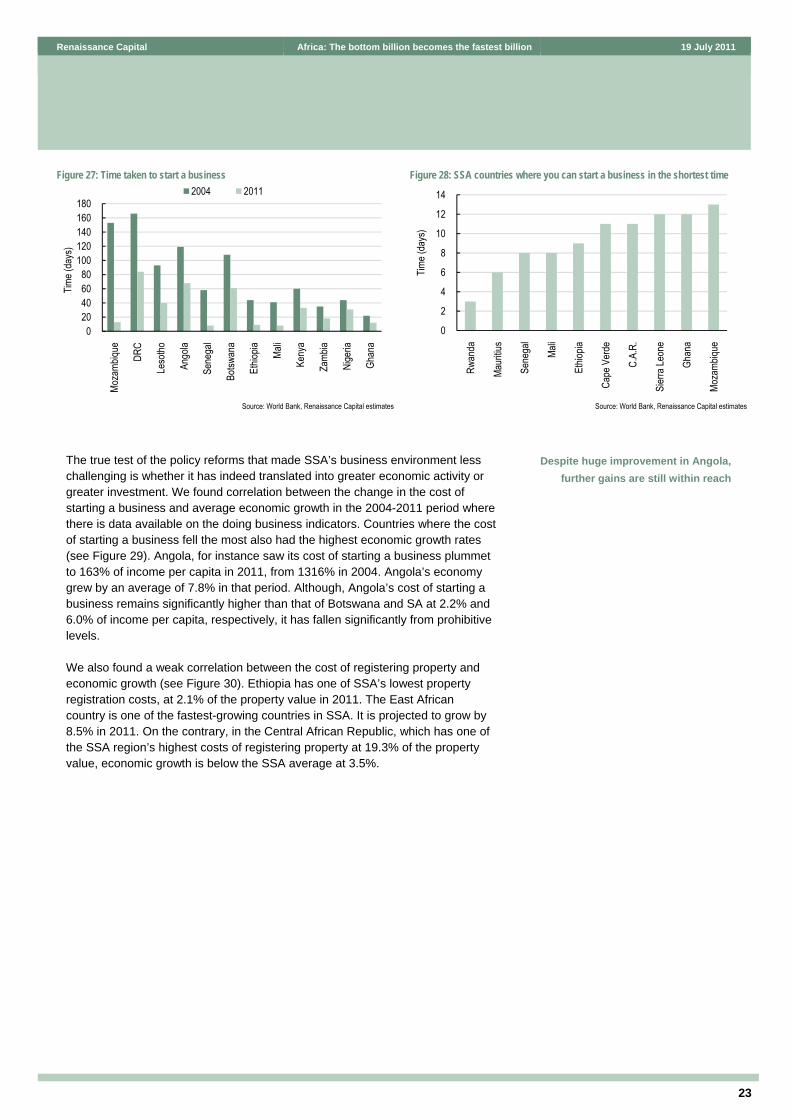
As SSA governments democratise, there is a growing awareness that their role must be limited to that of enablers. On the back of this some countries have made some concerted efforts to make it easier for the private sector and foreign investors to do business in their respective countries. The World Bank Doing Business survey on over 150 countries shows, using various indicators, including the ease of starting a business, how countries have performed relative to each other in improving their respective business environments. In the seven-year period between 2004 and 2011, the countries that reduced the time to start a business by the most number of days where Mozambique, the DRC, Lesotho, Angola and Senegal (see Figure 27). Today, the countries where one can start a business in the shortest amount of time are Rwanda (three days), Mauritius (six days), Senegal (eight days), Mali (eight days) and Ethiopia (nine days) (see Figure 28).
4http://wwwds.worldbank.org/external/default/WDSContentServer/IW3P/IB/2011/05/18/000158349_20110518143113/Rendered/PDF/WPS5664.pdf 5http://www.vodafone.com/content/dam/vodafone/about/public_policy/policy_papers/public_policy_series_6.pdf
Mobile banking may also help pull savings into the formal economy
High growth in Rwanda or Ethiopia may be linked to easier business regulation
23
Renaissance Capital Africa: The bottom billion becomes the fastest billion 19 July 2011
Figure 27: Time taken to start a business Figure 28: SSA countries where you can start a business in the shortest time
Source: World Bank, Renaissance Capital estimates Source: World Bank, Renaissance Capital estimates
The true test of the policy reforms that made SSA’s business environment less challenging is whether it has indeed translated into greater economic activity or greater investment. We found correlation between the change in the cost of starting a business and average economic growth in the 2004-2011 period where there is data available on the doing business indicators. Countries where the cost of starting a business fell the most also had the highest economic growth rates (see Figure 29). Angola, for instance saw its cost of starting a business plummet to 163% of income per capita in 2011, from 1316% in 2004. Angola’s economy grew by an average of 7.8% in that period. Although, Angola’s cost of starting a business remains significantly higher than that of Botswana and SA at 2.2% and 6.0% of income per capita, respectively, it has fallen significantly from prohibitive levels.
We also found a weak correlation between the cost of registering property and economic growth (see Figure 30). Ethiopia has one of SSA’s lowest property registration costs, at 2.1% of the property value in 2011. The East African country is one of the fastest-growing countries in SSA. It is projected to grow by 8.5% in 2011. On the contrary, in the Central African Republic, which has one of the SSA region’s highest costs of registering property at 19.3% of the property value, economic growth is below the SSA average at 3.5%.
020406080
100120140160180
Moza
mbiqu
e
DRC
Leso
tho
Ango
la
Sene
gal
Botsw
ana
Ethio
pia Mali
Keny
a
Zamb
ia
Nige
ria
Ghan
a
2004 2011
Time (
days
)
0
2
4
6
8
10
12
14
Rwan
da
Maur
itius
Sene
gal
Mali
Ethio
pia
Cape
Ver
de
C.A.
R.
Sier
ra Le
one
Ghan
a
Moza
mbiqu
e
Time(
days
)
Despite huge improvement in Angola, further gains are still within reach

19 July 2011 Africa: The bottom billion becomes the fastest billion Renaissance Capital
24
Figure 29: Correlation between economic growth and start up costs Figure 30: Correlation between the cost of registering property and GDP growth
Source: World Bank, Renaissance Capital estimates Source: World Bank, Renaissance Capital estimates
Our analysis also showed a weak correlation between the time taken to export goods and economic growth. We found that countries that reduced the number of days it took for them to get their exports across the border were the same as those with relatively higher economic growth rates (Figure 31). Eritrea cut the time it takes to get its exports across the border by 19 days between 2004 and 2011, which is one of the biggest improvements in SSA. Eritrea is also one of the fastest growing countries in SSA. Its economy is projected to grow by 7.9% in 2011. Research by Paul Collier among others highlights that exporting tends to boost productivity.
Figure 31: Correlation between the change in the time to export and economic growth
Sources: World Bank, Renaissance Capital estimates
Africa’s development path will leap from agriculture to services, and bypass industry. Contrary to the developed world, which after centuries of having agricultural-based feudal systems industrialised in the 18th and 19th centuries, and thereafter in the 20th century evolved to more services-oriented economies, SSA appears to have taken the leap from agriculture to services.
Telecoms has been one of the fastest-growing sectors in SSA over the past two decades, which partially explains the significant expansion of services in SSA, at the expense of industry. Poor infrastructure, particularly electricity, and a very
0
2
4
6
8
10
12
14
-1400 -1200 -1000 -800 -600 -400 -200 0 200
Decrease<---Cost of starting a business (% of income per capita)---> Increase
Aver
age r
eal G
DP gr
owth,
% (2
004-
11)
0
2
4
6
8
10
12
14
0 4 8 12 16 20 24
Cost of registering property (% of property value)
Real
GDP
grow
th,%
2
4
6
8
10
12
14
-30 -25 -20 -15 -10 -5 0 5Decrease<----change in number of days to export------>Increase
Real
GDP
grow
th,%
(201
1)
Easier access to export markets also supports faster growth
Growth drivers: Services and construction
25
Renaissance Capital Africa: The bottom billion becomes the fastest billion 19 July 2011
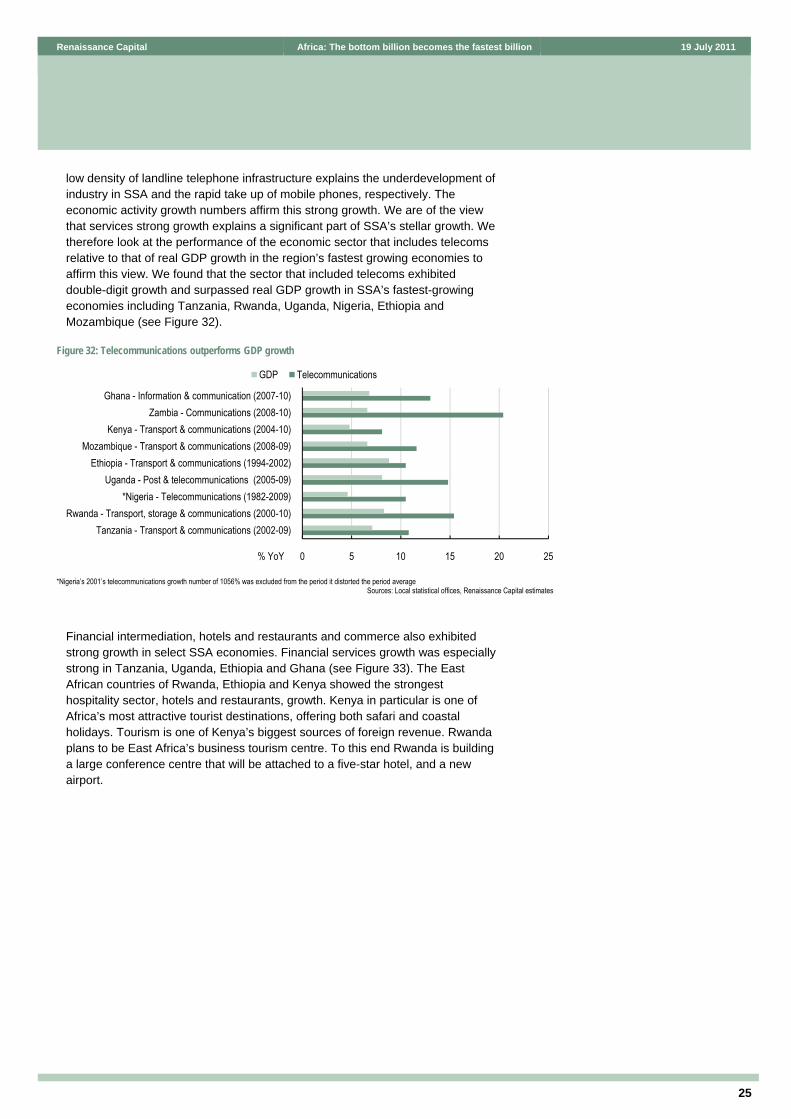
low density of landline telephone infrastructure explains the underdevelopment of industry in SSA and the rapid take up of mobile phones, respectively. The economic activity growth numbers affirm this strong growth. We are of the view that services strong growth explains a significant part of SSA’s stellar growth. We therefore look at the performance of the economic sector that includes telecoms relative to that of real GDP growth in the region’s fastest growing economies to affirm this view. We found that the sector that included telecoms exhibited double-digit growth and surpassed real GDP growth in SSA’s fastest-growing economies including Tanzania, Rwanda, Uganda, Nigeria, Ethiopia and Mozambique (see Figure 32).
Figure 32: Telecommunications outperforms GDP growth
*Nigeria’s 2001’s telecommunications growth number of 1056% was excluded from the period it distorted the period average
Sources: Local statistical offices, Renaissance Capital estimates
Financial intermediation, hotels and restaurants and commerce also exhibited strong growth in select SSA economies. Financial services growth was especially strong in Tanzania, Uganda, Ethiopia and Ghana (see Figure 33). The East African countries of Rwanda, Ethiopia and Kenya showed the strongest hospitality sector, hotels and restaurants, growth. Kenya in particular is one of Africa’s most attractive tourist destinations, offering both safari and coastal holidays. Tourism is one of Kenya’s biggest sources of foreign revenue. Rwanda plans to be East Africa’s business tourism centre. To this end Rwanda is building a large conference centre that will be attached to a five-star hotel, and a new airport.
0 5 10 15 20 25
Tanzania - Transport & communications (2002-09)Rwanda - Transport, storage & communications (2000-10)
*Nigeria - Telecommunications (1982-2009)Uganda - Post & telecommunications (2005-09)
Ethiopia - Transport & communications (1994-2002)Mozambique - Transport & communications (2008-09)
Kenya - Transport & communications (2004-10)Zambia - Communications (2008-10)
Ghana - Information & communication (2007-10)
GDP Telecommunications
% YoY

19 July 2011 Africa: The bottom billion becomes the fastest billion Renaissance Capital
26
Figure 33: Financial services outperforms real GDP growth Figure 34: Hospitality sector’s growth outperforms GDP growth in East Africa
Source: Local statistics office, Renaissance Capita estimates Source: Local statistics office, Renaissance Capital estimates
Outside the services sector, construction has been one of the fastest-growing sectors over the past decade in SSA’s best-performing economies. In our view, this growth has been driven by two factors, urbanisation and infrastructure development. In the 2009/2010 fiscal year, Uganda’s government made its biggest budget allocation to road transport infrastructure. That is indicative of the commitment the government has towards infrastructure development and the resultant boost to construction activity. Kenya has had a fiscal stimulus programme in place since FY09/FY10 that largely involves infrastructure development in the transportation and energy sectors. Ghana’s spurt in construction activity in recent years is partially due to the construction of infrastructure required to support oil production, which began in December 2010.
Figure 35: Construction outperforms GDP growth
Sources: Local statistical offices, Renaissance Capital estimates
All these highly growing sectors evidently imply relatively slow growth in sectors we have not focused on. Agriculture remains a key area in which big productivity improvements are possible, and we intend to focus on this in a future report.
0 4 8 12 16
Tanzania (2002-09)
Uganda (2005-09)
Ethiopia (1994-2002)
Ghana (2007-10)
GDP Financial intermediation
% YoY0 5 10 15 2
Rwanda (2000-10)
Ethiopia (1994-2002)
Kenya (2004-10)
GDP Hotels & restaurants
% YoY
0 4 8 12 16 20
Tanzania (2002-09)
Rwanda (2000-10)
Uganda (2005-09)
Ethiopia (1994-2002)
Mozambique (2008-09)
Kenya (2004-10)
Zambia (2008-10)
Ghana (2007-10)GDP Construction
% YoY

27
Renaissance Capital Africa: The bottom billion becomes the fastest billion 19 July 2011
The critics of catch-up theory
There are critics of catch-up theory economics, and among the best we’ve read is by Vladislav Inozemtsev. He highlights that a number of countries have made it to middle-income level, but have often stalled at this point. Latin America in the 1980s or the Philippines are examples. Whether this critique is accurate or not is not relevant to the debate in Africa today. Aside from Mauritius, SA and Botswana, they are only now entering the third stage, and making the transition to “maturity” and “high consumption” will be a challenge for the 2020s or 2030s.
Your questions?
Can growth continue when western economies are weak?
Yes. Asia succeeded in the 1970s despite the terrible market shocks of 1973-1975, the global debt crisis and the recession of 1980-1982. In fact, we’ve just experienced a terrible global shock and Africa sailed through it.
If China slumps, will Africa?
Half the countries that have sustained growth of 7% annually in the past decade do not sell to China. Clearly the commodity exporters would do worse in the face of a Chinese slump, but this need not bring down the whole continent. India has proved resilient and the same may apply to many African countries too.
Should we trust the data?
Few question Africa’s growth data when they show no growth. It is only high growth that surprises. The same questions have been asked about Chinese data too though no-one can now deny the commodity price boom that China has caused over the past ten years. While any economist is always sceptical of all data, we see no particular reason to doubt the validity of African data today.
Does high growth mean much when these countries are so poor?
In the 20th century, Africa was poor too, but this did not mean it experienced high growth in the 1980s. As with China, India and Europe, everyone starts at low levels.
Won’t Africa’s poor governance and political instability derail the story again?
As we demonstrated in our 22 June 2011 report, The revolutionary nature of growth, as an inevitable byproduct of rising wealth levels countries move away from autocracy towards democracy, which tends to reduce corruption. We are all aware of poor governance in Africa precisely because per-capita GDP did not rise in the 1980s, so poor governance was not challenged. Today, as wealth levels rise, democratisation will follow and corruption should decrease. Africa’s wealth levels have probably never been as high as they are today. This is not to say individual countries will not take backward steps – some will – but the prospects are improving.
Democratisation will follow growth

19 July 2011 Africa: The bottom billion becomes the fastest billion Renaissance Capital
28
How can you ignore the infrastructure challenges?
We discuss this issue more fully in the next section. We concur that infrastructure bottlenecks are a challenge, especially the undersupply of power. We conservatively estimate that addressing these bottlenecks could raise Africa’s GDP growth by an extra 2 ppts.

29
Renaissance Capital Africa: The bottom billion becomes the fastest billion 19 July 2011
Moving around SSA, visitors are often struck by:
Heavy traffic congestion
Frequent power outages
The rapid growth experienced in SSA over the past decade has resulted in worsening infrastructure bottlenecks. Ports, roads and freight are unable to keep up with the increasing movement of goods and people across the continent. Power generators are failing to meet growing demands for electricity, resulting in frequent power outages and blackouts. What are these constraints costing SSA in terms of growth?
A report published by the World Bank and Agence Française de Développement in 2010, Africa’s Infrastructure: A time for transformation, takes an in-depth look at Africa’s infrastructure. This report, at a mere 350 pages, may be too much for anyone to plough through in one session, so we have done our best to summarise the main findings, as well as add our thoughts on the matter. The report looks at the impact of infrastructure across 24 SSA countries which together represent 85% of SSA GDP and an. These included Benin, Burkina Faso, Cameroon, Cape Verde, Chad, Côte d’Ivoire, DRC, Ethiopia, Ghana, Kenya, Lesotho, Madagascar, Malawi, Mozambique, Namibia, Niger, Nigeria, Rwanda, Senegal, SA, Sudan, Tanzania, Uganda and Zambia. The main finding is that infrastructure bottlenecks are holding the continent back. They result in higher costs, lower intra-regional trade and lower productivity. This could be shaving as much as 2% off GDP growth across the region. We believe this figure could be higher.
Finding 1: Infrastructure contributed to over half of Africa’s improved growth performance
SSA has witnessed a marked uptick in growth over the past decade. The report states that between 1990 and 2005 improvements in infrastructure contributed about 1% to per-capita GDP growth. Power shortages, on the other hand, reduced growth in SSA by an estimated 0.1%t and as much as 0.2% in parts of southern Africa. The contribution of infrastructure cannot be overemphasised, not just in Africa but in both emerging and developed markets. This is depicted in the graph below, which shows the contribution by infrastructure to GDP per-capita growth across various regions. While stabilisation and structural policies play significant roles in increasing growth, in most regions infrastructure is the largest contributor to growth.
Infrastructure: the key to faster growth in SSA
A report last year suggested infrastructure bottlenecks could be holding GDP growth back by 2 ppts
Infrastructure improvements have already added 1% to GDP growth rates
over 1990-2005

19 July 2011 Africa: The bottom billion becomes the fastest billion Renaissance Capital
30
Figure 36: Changes in growth per capita caused by changes in growth fundamentals, 1990-2005
Source: World Bank report, Calderon 2008
Figure 37: Contribution of infrastructure to total factor productivity
Source: World Bank reports, Escribano, Guasch, and Pena 2008
As pointed out earlier in the report, within infrastructure the rollout of telecoms has been a major driver to GDP per-capita growth across Africa. Power has made the least contribution, in most instances detracting from growth:
Figure 38: Changes in growth per capita caused by changes in different infrastructure sectors, 1990 -2005
Source: World Bank report, Calderon 2008
-0.5
0.0
0.5
1.0
1.5
2.0
2.5
W. Europe SE Asia N. Africa W. Africa E. Africa S. Africa C. Africa
Stabilisation policies Structural policies Infrastructure
0% 10% 20% 30% 40% 50% 60% 70% 80% 90% 100%
NamibiaBotswanaMauritius
South AfricaKenya
TanzaniaCameroon
ZambiaEthiopiaMalawi
Infrastructure Others
-0.4-0.20.00.20.40.60.81.01.21.4
N. Africa W. Africa E. Africa S. Africa C. Africa Africa
Telecoms Power Roads

31
Renaissance Capital Africa: The bottom billion becomes the fastest billion 19 July 2011
Finding 2: Africa’s infrastructure lags its emerging markets peers
A report published in 2008, Making sense of Sub-Saharan Africa’s Infrastructure Endowment, identified that SSA countries lag their peers in the developing world on nearly all aspects of infrastructure development (Yepes, Pierce, and Foster 2008). However, this has not always been the case. The study shows that 40 years ago SSA was well ahead of its South Asian peers. Generation capacity per million people was almost three times higher. By 2000, South Asia had advanced to almost twice the generation capacity per million people. Somewhere along the line, the continent was caught sleeping and failed to invest in its assets.
Figure 39: Africa’s infrastructure deficit Normalised units SSA low income countries Other low-income countries Paved-road density 31 134 Total road density 137 211 Main-line density 10 78 Mobile density 55 76 Internet density 2 3 Generation capacity 37 326 Electricity coverage 16 41 Improved water 60 72 Improved sanitation 34 51 Note: Road density is measured in kilometres per 100 sq kilometres of arable land Note: Telephone density is measured in lines per 1,000 population Note: Generation capacity is measured in megawatts per 1,000,000 population Note: Electricity, water, and sanitation coverage in percentage of population.
Source: World Bank report, Yepes, Pierce, and Foster 2008
Figure 40: Road density, km/’000, km2
Source: WDI
Finding 3: Socio-geo-economic issues add to the infrastructure challenges
SSA comprises 49 nation states, following the formation of South Sudan. Many of the SSA states are small and a significant number are landlocked. Infrastructure development has largely been driven by the need to gain access to export markets, hence the development of rail, road and water corridors to seaports. Ports are congested and we have heard stories of consignments being held up at ports for up
01020304050607080
Cong
o
Suda
n
Gabo
n
Ethio
pia
Ango
la
Tanz
ania
Moza
mbiqu
e
Keny
a
Sene
gal
Afric
a-Av
erag
e
Zamb
ia
Nige
ria
Ghan
a
Zimba
bwe
South
Afric
a
Ugan
da

19 July 2011 Africa: The bottom billion becomes the fastest billion Renaissance Capital
32
to three months in some instances. Average delivery times from vessels to consignee are above those in other emerging markets.
Figure 41: Average delivery time for containers from vessel to consignee Gateway Destination Distance (km) Transit time (days) Mombasa, Kenya Kampala, Uganda 1,100 20 Mombasa, Kenya Kigali, Rwanda 1,700 27 Dar es Salaam, Tanzania Bujumbura, Burundi 1,800 21 Abidjan, Cote d'Ivoire Bamako, Mali 1,200 7 Dakar, Senegal Bamako, Mali 1,200 10 Cotonou, Benin Niamey, Niger 1,000 11 Douala, Cameroon Ndjamena, Chad 1,900 38 Lagos, Nigeria Kano, Nigeria 1,100 21 Almaty, Kazakhstan Germany 7,000 20 Bangkok, Thailand Vientiane, Lao 670 2 Kolkata, India Kathmandu, Nepal 1,250 9 Tianjin, China Ulaanbaatar, Mongolia 1,700 8
Source: World Bank report, UN Report, Arvis 2005, quoting an international logistics company
There has been less emphasis placed on developing intraregional trade. Despite the advent of economic and trade unions in various regions across Africa, these have been slow in encouraging intra-regional trade links. Global exports (i.e. exports from Africa to the rest of the world) account for 27% of SSA’s GDP growth while intra-Africa exports for only 4% (2009). If the infrastructure bottlenecks were removed, would intra-Africa trade double or increase tenfold? The answer probably lies somewhere in the middle. Higher exports might then boost manufacturing productivity and produce a virtuous circle, as seen in Mauritius.
Figure 42: Cost of transport in Africa – From major ports to cities
Source: World Bank, UNCTAD
The problem is not restricted to intra-regional trade. Intra-country, SSA countries are facing relatively rapid rates of urbanisation as the rural population throngs to cities in search of a better life. Meanwhile there has been underinvestment in infrastructure, due to both capital constraints and poor planning. As a result, existing infrastructure assets are under increasing strain and failing to meet demand. The result is higher operating costs for businesses and higher costs of living for consumers. We pay more for less. In SA, consumers are asked to reduce their power consumption, while
0
5
10
15
20
25
0
100
200
300
400
500
MOM
Nairo
bi MO
M Ka
mpala
MOM
Juba
MOM
Kiga
liMO
M Bu
jumbu
raDA
R to
Kigo
ma
DAR
Lusa
kaDA
R Ki
gali
DAR
Bujum
bura
DAR
Goma
DA
R Lu
bumb
ashi
Beira
to Lu
bumb
ashi
DAR
Hara
reDu
rban
Lusa
kaDo
uala
Bang
uiDo
uala
Njam
ena
Daka
r Bam
ako
Lome
Niam
eyLo
me O
uaga
doug
ouAb
idjan
Bam
ako
Lago
s Abu
jaLa
gos t
o Gom
be
USD/t USDc/t Km

33
Renaissance Capital Africa: The bottom billion becomes the fastest billion 19 July 2011
the per-unit cost of power to households has been approved to rise by over 25% pa for three years.
Finding 4: Infrastructure services are twice as expensive as elsewhere
According to a study published in 2008, across the board SSA’s infrastructure services cost at least twice as much as in other emerging markets. The report states that high costs are usually a function of high investment costs but in some sectors they are merely a function of low competition and hence high margins. The gap in some sectors, such as mobile telephony, has been reduced over the past two years with greater competition driving down costs. In some sectors the gap may very well have widened as prices to consumers have been increased to pay for investment in additional infrastructure assets.
Figure 43: Electricity tariffs USc/kW: 2009
Source: UPDEA Africa
Finding 5: Power remains the continent’s largest infrastructure challenge
Power consistently emerges as the primary limiting factor to growth in the region. We hear it from corporates in Lagos, Nairobi, Harare and even SA. We see it ourselves anecdotally in the power outages during business meetings – shortly followed by the humming of generators kicking in to fill the gap. Supply simply cannot meet demand, and this is widely acknowledged. What is often not known is the magnitude of the power deficit. It is estimated that SSA generates roughly the same power as Spain. Strip out SA and the picture becomes even less encouraging. Nigeria, for example, with a population three times that of SA, generates a tenth of SA’s power output, with total official generating capacity of 3,500 MW – similar to that consumed by Narita airport in Tokyo. This is evidenced in the low per-capita consumption of power across SSA, excluding SA.
05
10152025303540
Zimba
bwe
Libya
South
Afric
aAn
gola
Egyp
tEh
tiopia
Zamb
iaSu
dan
Alge
riaMa
uritiu
sKe
nya
Cong
oNi
geria
Moza
mbiqu
eNi
ger
Tunis
iaNa
mibia DR
CMa
lawi
Tanz
ania
CAR
Moro
cco
Guine
aUg
anda
Came
roon
Rwan
daGh
ana
Togo
Benin
Gabo
nCo
te d'I
voire
Buru
ndi
Chad Ma
liSe
nega
lMa
daga
scar
Rwan
daBu
rkina
Fas
oGa
mbia
Liber
ia

19 July 2011 Africa: The bottom billion becomes the fastest billion Renaissance Capital
34
Figure 44: Power consumption per capita, kW/’000 people
Source: EIA
Another study in 2008 looked into the causes of the power supply deficit in the region. As shown in the map below, it identified the leading drivers as:
Poor planning. Failure to anticipate rapid rates of urbanisation and economic growth. The long lead times in increasing capacity means supply simply cannot keep up with demand.
Droughts, which reduce hydropower generation in East Africa.
Systems disrupted by conflict/policies which hinder private investment in power generation.
0.0 0.1 0.2 0.3 0.4 0.5 0.6 0.7 0.8 0.9 1.0
Ethio
pia
Keny
a
Ugan
da
Tanz
ania
Suda
n
Cong
o
Nige
ria
Sene
gal
Ango
la
Ghan
a
Moza
mbiqu
e
Afric
a Avg
Zamb
ia
Zimba
bwe
Gabo
n
South
Afric
a

35
Renaissance Capital Africa: The bottom billion becomes the fastest billion 19 July 2011
Figure 45: Underlying causes of Africa’s power supply crisis
Source: World Bank report, Eberhard and others 2008
The overall economic costs of power outages are high. Another World Bank study in 2007 attempted to measure this cost by looking at the underlying cost of running back-up generators or stalling production during outages. Overall these costs ranged between 1-4% of GDP. Some countries, such as Malawi, were estimated to be losing up to 6% of GDP in power outages. It is estimated that the private sector is losing up to 5% of sales annually, due to power outages. This figure is projected to be as high as 20% for informal enterprises. The result is either lower margins or claw-back via higher prices to the end consumer. A clear example of this is the high retail price of cement across SSA. While cement prices range from $50-80/tonne in Asia, in SSA that range is $130-400/tonne. Cement prices are higher in SSA, partially as a result of higher production and distribution costs caused by infrastructure bottlenecks.
High growth/low investment
System disrupted by conflict
Droughts

19 July 2011 Africa: The bottom billion becomes the fastest billion Renaissance Capital
36
Figure 46: Cement price, $/tonne
Source: Company data, Renaissance Capital estimates
Finding 6: Africa’s infrastructure spending needs estimated at $93bn annually
Representing about 15% of the region’s GDP, this figure seems large and alarming. Earlier estimates by the Commission for Africa put the figure lower at $39bn pa. However, the World Bank argues this number was not based on a detailed study and cannot be used as a viable guide. A second study by the Commission places the figure at between $80-90bn pa.
What does SSA get for $96bn a year?
7,000 MW of new power generation capacity pa
22,000 MW of cross-border transmission lines pa
Interconnection of capitals, ports, border crossings and secondary cities via a road network
Road access to all high-value agricultural land
Double land under irrigation annually
Household electrification rates raised by 10% each year
Mobile telephony and public access broadband for 100% of the population
Clearly, this is the ultimate wish list: the continent is unlikely to invest $96bn pa. According to the World Bank report, this amount could be reduced significantly if inefficiencies plaguing the existing infrastructure were removed. For example, countries are currently spending about two-thirds of the allocated budget due to bureaucracy, red-tape and skills-shortage. Another inefficiency that could be addressed is the under pricing of infrastructure services. Despite the relatively high costs to users, pricing is often not high enough to cover the investment and maintenance costs of assets. This is exacerbated by undercollection of tariffs and revenues. It is estimated that revenue undercollection alone is as high as $4bn
050
100150200250300350400450
Keny
aTa
nzan
iaZim
babw
eSi
erra
Leon
eNi
geria
Came
roon
Togo
Ghan
aSe
nega
lZa
mbia
Moza
mbiqu
eBe
ninSu
dan
Ugan
daGa
bon
Katan
gaAn
gola
Nige
rBu
rkina
Liber
iaRw
anda
Ethio
piaCo
te d'I
voire
Mali
Buru
ndi
Rep o
f Con
goEa
st DR
CS
Suda
n

37
Renaissance Capital Africa: The bottom billion becomes the fastest billion 19 July 2011
annually in power and water. A third way to reduce the budget would be to spend more intelligently. It costs up to five times as much to rehabilitate road infrastructure vs the amount required for road maintenance. If more capital was allocated to road maintenance in the first place, there would be less of a need for expensive rehabilitation projects.
Figure 47: Economic burden associated with power utility inefficiencies in selected countries, % of GDP
Source: World Bank report, Briceno-Garmendia, Smits, and Foster 2008
Figure 48: Underpricing of power in selected countries, as % of GDP
Source: World Bank report, Briceno-Garmendia, Smits, and Foster 2008
Conclusion
Infrastructure has been a clear contributor to economic growth in the region. However, it is also clear that the full impact of infrastructure is throttled by bottlenecks; Africa is undersupplied in terms of rail, road and water freight assets. These bottlenecks impede the growth of global exports while also hindering the development of intraregional trade. Within each country, the rapid rates of urbanisation continue to stretch the existing asset base resulting in congestion, poor delivery and outages. Of all the infrastructure bottlenecks, power remains the gravest. It has a direct impact on economic productivity via the need to install backup generators, forego production during outages and delay expansionary projects in both the public and private sector. Removing these bottlenecks will take capital, cohesive action across regions and, most importantly, time. We conservatively estimate that SSA’s GDP growth could be raised by 2 ppts if infrastructure bottlenecks were reduced.
0 1 2 3 4 5
DRCGhana
UgandaMalawi
CameroonNigeria
SenegalTanzaniaRwandaEthiopia
MozambiqueKenya
ZambiaSouth Africa
Unaccounted losses Undercollection
0.0 1.0 2.0 3.0 4.0
MalawiZambia
TanzaniaCameroon
RwandaEthiopiaSenegalNigeriaKenya
MozambiqueGhana
South Africa
Underpricing
19 July 2011 Africa: The bottom billion becomes the fastest billion Renaissance Capital
38
As it stands, the IMF’s April World Economic Outlook assumes that Africa’s GDP will rise from $1,730bn in 2010 to $2,692bn by 2016, very similar to India’s assumed level of $2,777bn in 2016. The nominal dollar GDP growth rate averaged 10% over 2000-2009, and the IMF assumes 9% over 2010-2016. If we up this just marginally to 10%, that would already push nominal GDP to $3,220bn, putting Africa close to Brazil’s assumed level of $3,303bn.
Achieving nominal dollar growth of this amount depends largely on the dollar itself, but it is not hard to envisage Africa growing by 6% with US inflation of 2% and currency appreciation getting us to that 10% level.
Sustained growth at this rate would make Nigeria a $1trn economy by 2027 and $1.5trn by 2030. This does not look particularly ambitious to us. Nigeria aims to be the world’s 20th biggest economy by 2020, which would probably require at least 15% annual growth in nominal dollar terms putting the economy at $1trn already by 2019 – to put this into perspective, we expect 26% dollar growth in 2011 alone.
Assuming just 10% nominal dollar growth would make the other major oil producer Angola a $0.6trn economy by 2030. Among the energy importers Kenya would top $200bn by 2030 along with Ethiopia, with a cluster of $150bn economies ranging from Côte D’Ivoire to Cameroon.
Smaller economies such as Rwanda could boost GDP sixfold over 20 years from $6bn to $38bn.
Arguably, North Africa and SA are least likely to achieve such sustained rates of growth as they are already relatively wealthy. Taking just SSA alone, and excluding SA, such sustained growth rates would push nominal GDP up from $698bn in 2010 – roughly between Indonesia and Switzerland – to $4,488bn by 2030.
The real question is not whether Africa can grow at 7% annually and 10% in dollar terms, but whether 10-15% is possible annually and 15% or more in dollar terms. With the right push on infrastructure we believe this is plausible for a number of countries, with the main constraint being financing and potential overheating if growth is geared too much towards consumption rather than investment.
Within SSA, which markets do we believe have the best prospects? Unsurprisingly, we are confident about the long-term prospects where we have offices, including Nigeria, Kenya, Ghana, Rwanda, Zambia and believe Zimbabwe could be one of the positive surprises of the decade. Countries we should watch closely include Sierra Leone, Côte D’Ivoire, DRC, Ethiopia, Uganda, Tanzania, Malawi, Mozambique and Angola.
What sectors and stocks do we prefer?
Growing populations and accelerating urbanisation imply that agriculture, food producers and beverages will be positively impacted by higher growth.
We are particularly positive on the outlook for agriculture. The sector cannot keep up with the pace of urbanisation, which has resulted in a growing food deficit over the past decade. Not only is the continent charged with feeding itself, but increasingly
What would result from sustained higher growth?
Nominal dollar growth over 2000-2009 did average 10% for Africa
To continue, we can assume 6% real growth, 2% US inflation and real currency appreciation
Nigeria would be a trn-dollar economy by 2027, or by 2019 in a 15% nominal dollar growth environment – not impossible if they grow by 26% in dollar terms, as looks likely in 2011
Economies like Rwanda could increase six times by 2030
SSA excluding SA could rise from $700bn in 2010 – similar to Indonesia – to $4.5trn by 2030

39
Renaissance Capital Africa: The bottom billion becomes the fastest billion 19 July 2011
Africa will have to feed the world. Industrial-scale farming is likely to be a hallmark of African farming in the future. We have BUY ratings on Karuturi (BUY, TP INR13). Karuturi offers exposure to flower, rice, maize and palm oil production in Ethiopia and Kenya. We also have a BUY rating on Feronia (BUY, TP CAD0.60), a palm oil producer in DRC. Aside from its core asset of over 100,000 ha of palm oil plantations located along the Congo River, it also has a 10,000 ha arable farming venture near Kinshasa. Zambeef (Under Review) provides exposure to the growing demand for beef, chicken and pork, as well as crops. Others stocks to consider include the sugar producers, Mumias (Not Rated) in Kenya and Zambia Sugar (Not Rated) and Dangote Sugar (Not Rated) in Nigeria.
More people in urban areas with higher levels of disposal income will also be good for food and beverage producers. We particularly like companies with established brands in their markets – beer companies spring to mind. Per-capita consumption of beer in Africa lags other developing markets. We are currently reviewing our ratings and TPs for Nigerian Breweries, Guinness Nigeria, EABL (in Kenya and Tanzania) and Bralirwa (in Rwanda). We have a BUY rating on Delta (BUY, TP $0.99) which gives exposure to the recovering consumer disposable income sector in Zimbabwe. Other breweries in countries such as Zambia (Zambrew and Natbrew) and Ghana (Guiness Ghana) may also be considered.
In our view, branded food producers and retailers are also likely to be key beneficiaries of higher GDP growth. In this space we have a BUY rating on Innscor (BUY, TP $0.76). The company is well-poised to benefit from its Zimbabwean supermarket chain (Spar markets), fast-food outlets and food producing division (National Foods).We are currently reviewing our ratings and TPs for Nigerian food producers. With a population of over 150mn, this a key market for food producers. In our view, the stocks to consider include the subsidiaries of global giants such as Unilever Nigeria, Nestle Nigeria and Cadbury Nigeria. Other stocks to consider include PZ Cussons, UAC Nigeria, Flour Mills and Dangote Flour Mills.
Higher GDP growth will also be reflected in a growing banking sector. We highlight Nigerian banks within this sector. Not only is the macro picture for Nigeria favourable, but we think the prospects for growing a consumer lending business are attractive coming off a relatively low base. The banking sector in Nigeria is fairly large, with numerous stocks to choose from, but our top picks would include Zenith (BUY, TP NGN19.8), First Bank (BUY, NGN17.8) and Skye Bank (BUY, TP NGN10.9).
While we are of the view that Africa’s growth is not just a resource story, we remain positive on the outlook for production in resources, including oil and gas. Our top picks include Bellzone (BUY, TP GBP1.4), Beacon Hill Resources (BUY, TP GBP0.405) and Afren (BUY, TP GBP1.85)
Finally, given our view on the need for investment in infrastructure, we are positive on the outlook for cement producers. A large number of countries face a supply deficit which should support volumes as well as margins. We prefer Lafarge Wapco in West Africa (BUY, TP NGN55) and Athi River Mining (ARM) in East Africa, (BUY, TP KES236).

19 July 2011 Africa: The bottom billion becomes the fastest billion Renaissance Capital
40
Figure 49: Roads
Source: Renaissance Capital estimates
Figure 50: Power
Source: Renaissance Capital estimates
17
114
187
0 50 100 150 200 250
CongoSudanGabon
EthiopiaAngola
TanzaniaMozambique
KenyaSenegal
Africa-AverageZambiaNigeriaGhana
ZimbabweSouth Africa
UgandaBangladesh
EgyptIran
IndonesiaMexico
PakistanPhilippines
countries average Others emerging
IndiaBrazilChina
RussiaBRIC-Avg
Road (km)/ '000 sq km
0.13
0.26
0.62
0 0.2 0.4 0.6 0.8 1
AngolaCongoGabonGhana
EthiopiaKenya
MozambiqueNigeria
SenegalSudan
TanzaniaUgandaZambia
ZimbabweSouth Africa
Africa AvgBangladesh
Egypt, Arab Rep.Iran, Islamic Rep.
IndonesiaMexico
PakistanPhilippines
Other AverageBrazilChina
Russian FederationIndia
BRIC Avg
Kw/ '000 persons
Appendix data
Renaissance Capital Africa: The bottom billion becomes the fastest billion 19 July 2011
41
Analysts certification and disclaimer
This research report has been prepared by the research analyst(s), whose name(s) appear(s) on the front page of this document, to provide background information about the issuer or issuers (collectively, the “Issuer”) and the securities and markets that are the subject matter of this report. Each research analyst hereby certifies that with respect to the Issuer and such securities and markets, this document has been produced independently of the Issuer and all the views expressed in this document accurately reflect his or her personal views about the Issuer and any and all of such securities and markets. Each research analyst and/or persons connected with any research analyst may have interacted with sales and trading personnel, or similar, for the purpose of gathering, synthesizing and interpreting market information. If the date of this report is not current, the views and contents may not reflect the research analysts’ current thinking.
Each research analyst also certifies that no part of his or her compensation was, or will be, directly or indirectly related to the specific ratings, forecasts, estimates, opinions or views in this research report. Research analysts’ compensation is determined based upon activities and services intended to benefit the investor clients of Renaissance Securities (Cyprus) Limited and any of its affiliates (“Renaissance Capital”). Like all of Renaissance Capital’s employees, research analysts receive compensation that is impacted by overall Renaissance Capital profitability, which includes revenues from other business units within Renaissance Capital.
Important issuer disclosures
Important issuer disclosures outline currently known conflicts of interest that may unknowingly bias or affect the objectivity of the analyst(s) with respect to an issuer that is the subject matter of this report. Disclosure(s) apply to Renaissance Securities (Cyprus) Limited or any of its direct or indirect subsidiaries or affiliates (which are individually or collectively referred to as “Renaissance Capital”) with respect to any issuer or the issuer’s securities. A complete set of disclosure statements associated with the issuers discussed in the Report is available using the ‘Stock Finder’ or ‘Bond Finder’ for individual issuers on the Renaissance Capital Research Portal at: http://research.rencap.com/eng/default.asp Investment ratings
Investment ratings may be determined by the following standard ranges: Buy (expected total return of 15% or more); Hold (expected total return of 0-15%); and Sell (expected negative total return). Standard ranges do not always apply to emerging markets securities and ratings may be assigned on the basis of the research analyst’s knowledge of the securities.
Investment ratings are a function of the research analyst’s expectation of total return on equity (forecast price appreciation and dividend yield within the next 12 months, unless stated otherwise in the report). Investment ratings are determined at the time of initiation of coverage of an issuer of equity securities or a change in target price of any of the issuer’s equity securities. At other times, the expected total returns may fall outside of the range used at the time of setting a rating because of price movement and/or volatility. Such interim deviations will be permitted but will be subject to review by Renaissance Capital’s Research Management.
Where the relevant issuer has a significant material event with further information pending or to be announced, it may be necessary to temporarily place the investment rating Under Review. This does not revise the previously published rating, but indicates that the analyst is actively reviewing the investment rating or waiting for sufficient information to re-evaluate the analyst’s expectation of total return on equity.
If data upon which the rating is based is no longer valid, but updated data is not anticipated to be available in the near future, the investment rating may be Suspended until further notice. The analyst may also choose to temporarily suspend maintenance of the investment rating when unable to provide an independent expectation of total return due to circumstances beyond the analyst’s control such as an actual, apparent or potential conflict of interest or best business practice obligations. The analyst may not be at liberty to explain the reason for the suspension other than to Renaissance Capital’s Research Management and Compliance Officers. Previously published investment ratings should not be relied upon as they may no longer reflect the analysts’ current expectations of total return.
If issuing of research is restricted due to legal, regulatory or contractual obligations publishing investment ratings will be Restricted. Previously published investment ratings should not be relied upon as they may no longer reflect the analysts’ current expectations of total return. While restricted, the analyst may not always be able to keep you informed of events or provide background information relating to the issuer.
Where Renaissance Capital has not provided coverage of an issuer for a period of 12 months, coverage shall be deemed discontinued.
Where Renaissance Capital has not expressed a commitment to provide continuous coverage and/or an expectation of total return, to keep you informed, analysts may prepare reports covering significant events or background information without an investment rating (Unrated).
Your decision to buy or sell a security should be based upon your personal investment objectives and should be made only after evaluating the security’s expected performance and risk.
Renaissance Capital reserves the right to update or amend its investment ratings in any way and at any time it determines.
Disclosures appendix

19 July 2011 Africa: The bottom billion becomes the fastest billion Renaissance Capital
42
Renaissance Capital equity research distribution ratings
Investment Rating Distribution Investment Banking Relationships* Renaissance Capital Research Renaissance Capital Research Buy 129 37% Buy 5 71% Hold 49 14% Hold 2 29% Sell 13 4% Sell 0 0% Under Review 25 7% Under Review 0 0% Suspended 0 0% Suspended 0 0% Restricted 0 0% Restricted 0 0% Unrated 136 39% Unrated 1 14% 352 7 *Companies from which RenCap has received compensation within the past 12 months. NR – Not Rated UR – Under Review

Renaissance Capital research team
Head of Equity Research David Nangle +7 (495) 258-7748 [email protected] Deputy Head of Equity Research Milena Ivanova-Venturini +7 (727) 244-1584 [email protected] Research COO Ben Carey +44 (207) 367-8224 [email protected] Head of South African Research Gerhard Engelbrecht +27 (11) 750-1454 [email protected] Head of Turkish Equities Research Yavuz Uzay +44 (743) 263-8840 [email protected] Head of Sub-Saharan African Research Nothando Ndebele +27 (11) 750-1472 [email protected]
Name Telephone number Coverage Name Telephone number Coverage Equity Strategy Metals and mining Charles Robertson +44 (207) 367-8235 Global Rob Edwards +44 (207) 367-7781x8781 Global Ovanes Oganisian +7 (495) 258-7906 Russia Boris Krasnojenov +7 (495) 258-7770x4219 Russia/CIS Vitaliy Shushkovsky +38 (044) 492-7385x7145 Ukraine Andrew Jones +44 (207) 367-7734x8734 Russia/CIS Herman van Papendorp +27 (11) 750-1465 South Africa Ekaterina Gazadze +7 (727) 244-1581 Central Asia Leye Adekeye +234 (1) 448-5300x5386 Sub-Saharan Africa Jim Taylor +44 (207) 367-7736x8736 Africa Nothando Ndebele +27 (11) 750-1472 South Africa Vasiliy Kuligin +7 (495) 258-7770x4065 Russia/CIS Christina Claassens +27 (11) 750-1460 South Africa Macro and Fixed income research Emma Townshend +27 (11) 750-1463 South Africa Charles Robertson +44 (207) 367-8235 Global Cliff Fitzhenry +27 (073) 064-9249 South Africa Ivan Tchakarov +7 (495) 258-7770 x7400 Russia/CIS Leavitt Pope +852 3972-3832 Asia-Pacific Vladlen Andryushchenko +7 (495) 258-7770 x4908 Russia/CIS Matthew Whittall +852 3972-3835 Asia-Pacific Anton Nikitin +7 (495) 258-7770x7560 Russia/CIS Ilya Zhila +7 (495) 258-7770x4582 Russia/CIS Media/Technology/Real estate Anastasiya Golovach +38 (044) 492-7382 Ukraine David Ferguson +7 (495) 641-4189 Russia/CIS, Africa Kassymkhan Kapparov +7 (727) 244-1570 Central Asia Anastasia Demidova +7 (495) 258-7770x4040 Russia/CIS, Africa Lyubov Nikitina +7 (495) 725-5229 Russia/CIS Johan Snyman +27 (11) 750-1432 South Africa Mikhail Nikitin +7 (495) 258-7789 Russia/CIS Rita Tsovyan +7 (495) 258-7770x4516 Russia/CIS Telecoms/Transportation Natalia Suseeva +7 (495) 258-7770 x4082 Russia/CIS Alexander Kazbegi +7 (495) 258-7902 Global Elna Moolman +27 (11) 750-1462 South Africa Ivan Kim +7 (495) 258-7770x5620 Russia/CIS, Africa Busi Radebe +27 (11) 750-1473 South Africa Alexandra Serova +7 (495) 258-7770x4073 Russia/CIS Mamokete Lijane +27 (11) 750-1471 South Africa Johan Snyman +27 (11) 750-1432 South Africa Yvonne Mhango +27 (11) 750-1488 Sub-Saharan Africa Ernest van der Merwe South Africa Utilities Derek Weaving +44 (207) 367-7793x8793 Russia/CIS Banking Vladimir Sklyar +7 (495) 258-7770x4624 Russia/CIS David Nangle +7 (495) 258-7748 EMEA Milena Ivanova-Venturini +7 (727) 244-1584 Central Asia Luxury goods and tobacco Svetlana Kovalskaya +7 (495) 258-7752 Russia Rey Wium +27 (11) 750-1478 Africa Armen Gasparyan +7 (495) 258-7770x4964 Russia Ryno Truter +27 (11) 750-1497 Africa Kirill Rogachev +7 (495) 258-7770x4015 Russia Ilan Stermer +27 (11) 750-1482 South Africa Quantitative analysis Naeem Badat +27 (11) 750-1431 South Africa Renda Rundle +44 (207) 367-8240 South Africa Adesoji Solanke +234 (1) 448-5300x5384 Sub-Saharan Africa Small and medium cap Chemicals/Engineering/Building materials Jeanine Womersley +27 (11) 750-1458 South Africa Mikhail Safin +7 (495) 258-7770x7550 Russia/CIS Medium cap/Transport/Construction/Building materials Consumer/Retail/Agriculture John Arron +27 (11) 750-1466 Africa Natasha Zagvozdina +7 (495) 258-7753 Eastern Europe, Russia/CIS Umulinga Karangwa +27 (11) 750-1489 Sub-Saharan Africa Ulyana Lenvalskaya +7 (495) 258-7770x7265 Eastern Europe, Russia/CIS Konstantin Fastovets +38 (044) 492-7385x7125 Ukraine Paper Robyn Collins +27 (11) 750-1480 South Africa Adriana Benedetti +27 (11) 750-1452 South Africa Rohan Dyer +27 (11) 750-1481 South Africa Richard Ferguson +44 (207) 367-7991x8991 Global Diversified industrials/Support services/Packaging Umulinga Karangwa +27 (11) 750-1489 Sub-Saharan Africa Ceri Moodie +27 (11) 750-1459 South Africa Roman Ivashko +7 (495) 258-7770x4994 Russia/CIS Regional research Oil and gas Mbithe Muema +254 (20) 368-2316 East Africa Ildar Davletshin +7 (495) 258-7770x4971 Russia/CIS Anthea Alexander +263 (772) 421-845 Southern Africa Dragan Trajkov +44 (207) 367-7941x8941 Africa, MENA Ruvimbo Kuzviwanza +263 (7) 88-317x8795 Southern Africa Gerhard Engelbrecht +27 (11) 750-1454 South Africa Akinbamidele Akintola +234 (1) 448-5300x5385 West Africa Farid Abasov +44 (207) 367-7983 x8983 Central Asia Gbadebo Bammeke +234 (1) 448-5300x5367 West Africa Jenny Wong +852 3972-3800 x3836 Asia-Pacific Yavuz Uzay +44 (743) 263-8840 Turkey Nothando Ndebele +27 (11) 750-1472 South Africa
Renaissance Capital research is available via the following platforms: Renaissance research portal: research.rencap.com Bloomberg: RENA <GO> Capital IQ: www.capitaliq.com
Thomson Reuters: thomsonreuters.com/financial Factset: www.factset.com

Renaissance Capital Moscow T + 7 (495) 258 7777
Renaissance Capital Ltd. London T + 44 (20) 7367 7777
RenCap Securities, Inc. New York T + 1 (212) 824-1099
Renaissance Securities (Cyprus) Ltd.Nicosia T + 357 (22) 505 800
Renaissance Securities (Nigeria) Ltd. Lagos T +234 (1) 448 5300
Renaissance Capital Nairobi T +254 (20) 368 2000
Renaissance Capital Ukraine Kyiv T +38 (044) 492-7383
Renaissance Capital Almaty T + 7 (727) 244 1544
Renaissance Capital (Hong Kong) Ltd. Hong Kong T +852 3972 3800
Renaissance BJM Johannesburg T +27 (11) 750 1400
Renaissance Capital Harare T +263 (4) 788336
Pangaea Renaissance Securities Ltd.Lusaka T +260 (21) 123 8709
NewWorld Renaissance Securities LtdRenaissance Partners Accra T +234 (1) 4485300
© 2011 Renaissance Securities (Cyprus) Limited, an indirect subsidiary of Renaissance Capital Holdings Limited ("Renaissance Capital"), which together with other subsidiaries operates outside of the USA under the brand name of Renaissance Capital, for contact details see Bloomberg page RENA, or contact the relevant office. All rights reserved. This document and/or information has been prepared by and, except as otherwise specified herein, is communicated by Renaissance Securities (Cyprus) Limited, regulated by the Cyprus Securities and Exchange Commission (License No: KEPEY 053/04). The RenCap-NES Leading GDP Indicator is a model that seeks to forecast GDP growth and was developed by and is the exclusive property of Renaissance Capital and the New Economic School (e-mail: [email protected]).
This document is for information purposes only. The information presented herein does not comprise a prospectus of securities for the purposes of EU Directive 2003/71/EC or Federal Law No. 39-FZ of 22 April 1994 (as amended) of the Russian Federation "On the Securities Market". Any decision to purchase securities in any proposed offering should be made solely on the basis of the information to be contained in the final prospectus published in relation to such offering. This document does not form a fiduciary relationship or constitute advice and is not and should not be construed as an offer, or a solicitation of an offer, or an invitation or inducement to engage in investment activity, and cannot be relied upon as a representation that any particular transaction necessarily could have been or can be effected at the stated price. This document is not an advertisement of securities. Opinions expressed herein may differ or be contrary to opinions expressed by other business areas or groups of Renaissance Capital as a result of using different assumptions and criteria. All such information and opinions are subject to change without notice, and neither Renaissance Capital nor any of its subsidiaries or affiliates is under any obligation to update or keep current the information contained herein or in any other medium.
Descriptions of any company or companies or their securities or the markets or developments mentioned herein are not intended to be complete. This document and/or information should not be regarded by recipients as a substitute for the exercise of their own judgment as the information has no regard to the specific investment objectives, financial situation or particular needs of any specific recipient. The application of taxation laws depends on an investor’s individual circumstances and, accordingly, each investor should seek independent professional advice on taxation implications before making any investment decision. The information and opinions herein have been compiled or arrived at based on information obtained from sources believed to be reliable and in good faith. Such information has not been independently verified, is provided on an ‘as is’ basis and no representation or warranty, either expressed or implied, is provided in relation to the accuracy, completeness, reliability, merchantability or fitness for a particular purpose of such information and opinions, except with respect to information concerning Renaissance Capital, its subsidiaries and affiliates. All statements of opinion and all projections, forecasts, or statements relating to expectations regarding future events or the possible future performance of investments represent Renaissance Capital’s own assessment and interpretation of information available to them currently.
The securities described herein may not be eligible for sale in all jurisdictions or to certain categories of investors. Options, derivative products and futures are not suitable for all investors and trading in these instruments is considered risky. Past performance is not necessarily indicative of future results. The value of investments may fall as well as rise and the investor may not get back the amount initially invested. Some investments may not be readily realisable since the market in the securities is illiquid or there is no secondary market for the investor’s interest and therefore valuing the investment and identifying the risk to which the investor is exposed may be difficult to quantify. Investments in illiquid securities involve a high degree of risk and are suitable only for sophisticated investors who can tolerate such risk and do not require an investment easily and quickly converted into cash. Foreign-currency-denominated securities are subject to fluctuations in exchange rates that could have an adverse effect on the value or the price of, or income derived from, the investment. Other risk factors affecting the price, value or income of an investment include but are not necessarily limited to political risks, economic risks, credit risks, and market risks. Investing in emerging markets such as Russia, other CIS, African or Asian countries and emerging markets securities involves a high degree of risk and investors should perform their own due diligence before investing.
Excluding significant beneficial ownership of securities where Renaissance Capital has expressed a commitment to provide continuous coverage in relation to an issuer or an issuer’s securities, Renaissance Capital and its affiliates, their directors, representatives, employees (excluding the US broker-dealer unless specifically disclosed), or clients may have or have had interests in the securities of issuers described in the Investment Research or long or short positions in any of the securities mentioned in the Investment Research or other related financial instruments at any time and may make a purchase and/or sale, or offer to make a purchase and/or sale, of any such securities or other financial instruments from time to time in the open market or otherwise, in each case as principals or as agents. Where Renaissance Capital has not expressed a commitment to provide continuous coverage in relation to an issuer or an issuer’s securities, Renaissance Capital and its affiliates (excluding the US broker-dealer unless specifically disclosed) may act or have acted as market maker in the securities or other financial instruments described in the Investment Research, or in securities underlying or related to such securities. Employees of Renaissance Capital or its affiliates may serve or have served as officers or directors of the relevant companies. Renaissance Capital and its affiliates may have or have had a relationship with or provide or have provided investment banking, capital markets, advisory, investment management, and/or other financial services to the relevant companies, and have established and maintain information barriers, such as ‘Chinese Walls’, to control the flow of information contained in one or more areas within the Renaissance Group of companies to which Renaissance Capital belongs, into other areas, units, groups or affiliates of the Renaissance Group.
The information herein is not intended for distribution to the public and may not be reproduced, redistributed or published, in whole or in part, for any purpose without the written permission of Renaissance Capital, and neither Renaissance Capital nor any of its affiliates accepts any liability whatsoever for the actions of third parties in this respect. This information may not be used to create any financial instruments or products or any indices. Neither Renaissance Capital and its affiliates, nor their directors, representatives, or employees accept any liability for any direct or consequential loss or damage arising out of the use of all or any part of the information herein.
Bermuda: Neither the Bermuda Monetary Authority nor the Registrar of Companies of Bermuda has approved the contents of this document and any statement to the contrary, express or otherwise, would constitute a material misstatement and an offence.
EEA States: Distributed by Renaissance Securities (Cyprus) Limited, regulated by Cyprus Securities and Exchange Commission, or Renaissance Capital Limited, member of the London Stock Exchange and regulated in the UK by the Financial Services Authority (“FSA”) in relation to designated investment business (as detailed in the FSA rules). Cyprus: Except as otherwise specified herein the information herein is not intended for, and should not be relied upon by, retail clients of Renaissance Securities (Cyprus) Limited. The Cyprus Securities and Exchange Commission Investor Compensation Fund is available where Renaissance Securities (Cyprus) Limited is unable to meet its liabilities to its retail clients, as specified in the Customer Documents Pack. United Kingdom: Approved and distributed by Renaissance Capital Limited only to persons who are eligible counterparties or professional clients (as detailed in the FSA Rules). The information herein does not apply to, and should not be relied upon by, retail clients; neither the FSA’s protection rules nor compensation scheme may be applied.
Ghana: Distributed through NewWorld Renaissance Securities Ltd, a licenced broker dealer in Accra and an affiliate of Renaissance Capital.
Hong Kong: Distributed to professional investors (as defined in the Securities and Futures Ordinance and its subsidiary legislation) by Renaissance Capital (Hong Kong) Limited, regulated by the Hong Kong Securities and Futures Commission.
Kazakhstan: Distributed by Renaissance Capital Investments Kazakhstan JSC, regulated by the Agency for the Regulation and Supervision of the Financial Market and Financial Organizations.
Kenya: Distributed by Renaissance Capital (Kenya) Limited, regulated by the Capital Markets Authority.
Nigeria: Distributed by RenCap Securities (Nigeria) Limited, member of The Nigerian Stock Exchange, or Renaissance Securities (Nigeria) Limited, entities regulated by the Securities and Exchange Commission.
Russia: Distributed by CJSC Renaissance Capital, LLC Renaissance Broker, or Renaissance Online Limited, entities regulated by the Federal Financial Markets Service.
South Africa: Distributed by BJM Renaissance Securities Limited, regulated by the Johannesburg Stock Exchange. Ukraine: Distributed by Renaissance Capital LLC, authorized to perform professional activities on the Ukrainian stock market.
United States: Distributed in the United States by RenCap Securities, Inc., member of FINRA and SIPC, or by a non-US subsidiary or affiliate of Renaissance Capital Holdings Limited that is not registered as a US broker-dealer (a "non-US affiliate"), to major US institutional investors only. RenCap Securities, Inc. accepts responsibility for the content of a research report prepared by another non-US affiliate when distributed to US persons by RenCap Securities, Inc. Although it has accepted responsibility for the content of this research report when distributed to US investors, RenCap Securities, Inc. did not contribute to the preparation of this report and the analysts authoring this are not employed by, and are not associated persons of, RenCap Securities, Inc. Among other things, this means that the entity issuing this report and the analysts authoring this report are not subject to all the disclosures and other US regulatory requirements to which RenCap Securities, Inc. and its employees and associated persons are subject. Any US person receiving this report who wishes to effect transactions in any securities referred to herein should contact RenCap Securities, Inc., not its non-US affiliate. RenCap Securities, Inc. is a subsidiary of Renaissance Capital Holdings Limited and forms a part of a group of companies operating outside of the United States as "Renaissance Capital". Contact: RenCap Securities, Inc., 780 Third Avenue, 20th Floor, New York, New York 10017, Telephone: +1 (212) 824-1099.
Zambia: Distributed through Pangaea Renaissance Securities Ltd, a licenced broker dealer in Lusaka and an affiliate of Renaissance Capital.
Zimbabwe: Distributed by the representative office in Harare of Renaissance Africa (Mauritius) Limited, part of the Renaissance Group.
Other distribution: The distribution of this document in other jurisdictions may be restricted by law and persons into whose possession this document comes should inform themselves about, and observe, any such restriction.
Additional information (including information about the RenCap-NES Leading GDP Indicator) and supporting documentation is available upon request.