Optimal Hyper-Scalable Load Balancing with a Strict Queue ...
Upload
khangminh22Category
view
0download
0
Advocates of strict land use policies claim that traditional architecture and increased densities will enable
us to once again enjoy the kind of “meaningful community” that
supposedly cannot be achieved in conventional suburbs.
Suburbs and the Environment
Much of current urban planning theory revolves around concerns about the environment. Groups such as the Sierra Club argue that local, state, and federal governments should enact policies that make people live closer together, and, consequently, rely less on their cars. In order to do this, theorists advocate establishing urban growth boundaries which ban new development beyond the urban fringe.194 �eir vision has been reinforced by the smart growth movement’s promotion of "more scienti�c planning" for how land will be used, buttressed, of course, by "strict regulations.”195 �is makes it impossible to build the lower cost starter homes that are a�ordable because of cheap land on the urban fringe.
In the past, some environmentalists even celebrated the potential demographic impact of densi�cation, seeing in denser cities a natural contraceptive. Stewart Brand, who in 1968 founded the Whole Earth Catalog, embraces denser urbanization, particularly in developing countries, as a force for “stopping the population explosion cold.”196
More recently, climate change has been used to justify greater density.
“What is causing global warming is the lifestyle of the American middle class," insists New Urbanist architect Andres Duany, who is himself a major developer of dense housing.197 One retro-urbanist author, David Owen, in his book Green Metropolis suggests that the planet needs to live in densities associated with his former Manhattan home, although he himself moved to bucolic Connecticut.198
Sadly, much of the research advocating density as a solution to climate change is deeply �awed, since it usually excludes greenhouse (GHG) emissions from common areas, including elevators, and from lighting �xtures, space heaters and air conditioners, usually because data is not available. Research by Energy Australia, which took this and overall consumer energy spending into account, found that town houses and detached housing produced less GHG emissions per capita than high density housing when common-
area GHG emissions were included.199 In addition, one recent study from the National Academy of Sciences found that New York City, despite its transit system and high density, was the most environmentally wasteful of the world’s 27 megacities, well ahead of more dispersed, car-dominated Los Angeles.200
In one of the most comprehensive nationwide reviews of greenhouse gas emissions, Australian Conservation Foundation research showed per capita emissions to decline with distance from the urban core, through suburban rings outward.201 Another study, this one in Halifax, Nova Scotia, found the carbon
BEST CITIES FOR PEOPLE 43

footprints of core residents and suburbanites to be approximately the same.202
Higher densities, according to data in a recent National Academy of Sciences report, can do relatively little—perhaps as little as two percent—to reduce the nation greenhouse gas emissions:
"Urban planners hoping to help mitigate CO2 emissions by increasing housing density would do better to focus on fuel-e�ciency improvements to vehicles, investments in renewable energy, and cap and trade legislation."203 Economist Anthony Downs of the Brookings Institution, a proponent of smart growth policies, has said, "If your principle goal is to reduce fuel emissions, I don’t think future growth density is the way to do it."
As Downs suggests, there may be other, more e�ective and less damaging ways to reduce emissions. Improved mileage on cars, including electric and natural gas or hydrogen propelled vehicles, would thus be far more impactful, not to mention less
disruptive.204A report by McKinsey & Company and the Conference Board indicates that su�cient reduction in greenhouse gas emissions could be achieved without any "… of the draconian changes in living standards and lifestyles widely promoted by smart growth advocates."205
Suburbs could enjoy some environmental advantages over denser developments. A 2013 New Zealand paper suggests that, with proper design and use of their greater surface area for solar, single family homes potentially are actually better for the environment than multi-family houses. Researcher Hugh Byrd challenges “… conventional thinking that suburbia is energy-ine�cient," a belief that has become enshrined in architectural policy: “In fact, our results reverse the argument for a compact city based on transport energy use, and completely change the current perception of urban sprawl.”206
Byrd notes, there are numerous ways to make lower-density environments more environmental friendly, such as planting more trees.207
Other research shows that compact, dense cities are not necessarily better for the environment. Packing people into an environment of concrete, steel and glass creates what is known as “the urban heat island e�ect.”208 In Japan, researchers found that higher density areas create more heat than less dense areas.209 NASA has similarly has found that “… Densely developed, aggregated cities produce stronger urban heat islands than sprawling cities with less development density.” 210
�ere are other, unintended negative consequences to densi�cation.
Figure 50
Under 35
0.9
2.5
-1.8 0.1
10.7
45-54 45-54 55-64 65+
Millions of Households
-2
0
2
4
6
8
10
12
Urban Core Earlier Suburban Later Suburban Exurban
Senior Population: 2000 & 2010CITY SECTORS: MAJOR METROPOLITAN AREAS Figure 51
Pop
ulat
ion
(Mill
ions
)
By Functional City Sector
20102000
0%
200%
400%
600%
800%
1000%
2.82 2.70
8.96 2.96
2.95
4.59
2.73
3.61
Multi-Generation HouseholdsShare of U.S. Population Living in Multi-Generational Family Households, 1940-2008 Figure 52
Source: Pew Research Center, Census Data
Source: Joint Center for Housing Studies of Harvard, 2014
10
15
20
25
1940 1950 1960 1970 1980 1990 2000 2010
Australia: GHG Emissions by Urban SectorPER CAPITA: CAPITAL CITIES OVER 1 MILLION
Figure 53
Inner Inner Ring Second Ring Outer0
5
10
15
20
25
30
19101900
80% 70%60%50%40%30%20%10%0%
1920 1930 1940 1950 1960 1970 1980 1990 2000 2010 2014
Home OwnershipUNITED STATES: 2000-2014 Figure 55
From: Census Bureau
Projected Household Growth By Age:2015 - 2025
44 CHAPMAN UNIVERSITY • CENTER FOR DEMOGRAPHICS AND POLICY

Based on ages 18-29, unmarriedand without children, n=305
Do you want to get married? Do you want to have children?
Source: Pew Research Center
How Millennials View Marriage and Children(% SAYING THEY . . . ) Figure 60
25
5
70 74
7
19Want
Not sure
Don’t want
Figure 54
Emissions increases caused by Net Domestic Migration from California Versus CARB 2020 Reduction Targetfrom 2000–2004 Levels (tons of CO2e per annum)
-50,000,000
-40,000,000
-30,000,000
-20,000,000
-10,000,000
0
10,000,000
20,000,000
30,000,000
40,000,000
50,000,000
41,714,614
-42,000,000
Net CO2e Annual Emissions Increase from California DomesticMigration Losses since 1990
CARB ScopingPlan ReductionObjective from
2000–2004Average State
Emission Levels
Increased densities, for example, create congestion and 'stop and go' tra�c conditions that ultimately add to emissions. Transport Canada research indicates that fuel consumption per kilometer (and thus GHG emissions) rise nearly 50 percent as arterial street tra�c conditions deteriorate.211
In another example, California’s bid to restrict suburban growth in order to combat climate change has had mixed results. Attempts to promote transit oriented developments have proven notably ine�ective in reducing automobile travel. A Los Angeles Times report found that relatively few people in these buildings actually took transit.212 In addition, California’s strict policies may also have unintentionally driven people, jobs and factories to areas in the United States and abroad where heat and cold, as well as weaker regulation, lead to increased energy consumption. In practical terms this has all but wiped out any net reductions achieved by state policies.213
Keeping the Ownership Option: Back to the New Deal
�e drive against suburbs and lower density development threatens the essential nature of American democracy, as well as the prospects for the middle class. "A nation of homeowners,” Franklin Roosevelt believed, “of people who own a real share in their land, is unconquerable.” 214 Under the New Deal, housing policies enacted with bipartisan support li�ed up a working class that could now enjoy privacy, space and quiet that had previously been available only to the a�uent classes.215
By 1962, over 60 percent of Americans owned their own homes, an increase from the 41 percent before World War II. �e increase in homeownership between 1946 and 1956, notes Stephanie Coontz, was greater than that achieved in the preceding century and a half.216 Even though the rate has dropped since the Great Recession, it remains high by historical standards.
�is expansion of property owner-ship became a critical factor in America’s experiment with self-government at a time when the share of income held by the middle class expanded, while that of the wealthiest actually fell.217
BEST CITIES FOR PEOPLE 45

As sociologist Robert Lynd has noted: “�e characteristic thing about democracy is its di�usion of power among the people.”218 �e house remains, even in these more di�cult times, the last great
asset of the middle class. Homes represent only 9.4 percent of the wealth of the top 1 percent, but 30 percent for those in the upper twenty percent and, for the overall 60 percent of the population in the middle, roughly 60 percent.219
�is aspiration—held by most middle and working-class Americans—is now being directly threatened, o�en by government and sometimes by business. Some Wall Street analysts predict the evolution of a “rentership society,” where even new homes might be built primarily for lease rather than sale.220 Between 2006 and 2014 alone, the number of single family homes that were occupied by renters grew 31 percent.221
A 2012 study by the Joint Center for Housing Studies at Harvard found “… little evidence to suggest that individuals' preferences for owning versus renting a home have been fundamentally altered by their exposure to house price declines and loan delinquency rates, or by knowing others in their neighborhood who have defaulted on their mortgages."222 A 2013 survey by the University of Connecticut found that 76 percent believe being able to own your own home is necessary to be considered middle class.223
Nor do these aspirations seem to be fading among millennials. A survey by the online banking company TD Bank found that 84 percent of renters aged 18 to 34 intend to purchase a home in the future. Still another, this one from Better Homes and Gardens, found that three in four saw homeownership as “a key indicator of success.”224 A Merrill Lynch survey found millennials to have roughly the same interest in home buying as previous generations.
Figure 56
0%
10%
20%
30%
40%
50%
60%
70%
Home
9.4%Top 1%
30.1%
66.6%
5.5%
6.8%
5.9%
7.8%
20.6%
14.2%
25.4%
14.9%
3.1%
50.3%
25.6%
8.9%
1.6%
2%
1.3%
Bank Deposits& Other Liquid
Assets
PensionAccounts
Stocks & OtherSecurities
BusinessEquity & OtherReal Estate
Misc.
Next 19%
Middle 60%
What do Americans Own?MAKEUP OF ASSETS BY HOUSEHOLD WEALTH: 2010
Source: Jordan Weissman, “The Recession’s Toll: How Middle Class Wealth Collapsed to a 40-Year Low,” The Atlantic, December 4, 2012, http://www.theatlantic.com/business/archive/2012/12/the-recessions-toll-how-middle-class -wealth-collapsed-to-a-40-year-low/265743/.
Defining Attributes of the Middle Class
Being able to save moneyfor the future
Being able to own yourown home
Being able to afford college
Having enough money to sometimesbuy things you’d like to have, evenif you don’t absolutely need them
Having enough money forvacation travel
Being able to buy a new carfrom time to time
Source: Tom Breen, “UConn/Hartford Courant Poll: Middle Class Dream Persists, Though Harder to Attain,” UConn Today, February 11, 2013, http://today.uconn.edu/blog/2013/02/uconnhartford-courant-poll-middle-class-dream-persists-though-harder-to-attain/.
Figure 57
0 18 36 54 72 90
85
76
69
68
62
60
Percent who agree “homeownership is an important part of the American Dream”
Figure 58
74
76
78
80
82
84
86
88
90
84
8180
86
89
Total population
Base Age 21+ Gen x
Boomers
Silent GenMillennials
Less Money to Spend
Figure 59
Source: BLS
Source: Merrill Lynch – Age Wave, 2014
50%
60%
70%
80%
90%
100%
110%
120%
130%
140%
150%
1974
1975
1976
1977
1978
1979
1980
1981
1982
1983
1984
1985
1986
1987
1988
1989
1990
1991
1992
1993
1994
1995
1996
1997
1998
1999
2000
2001
2002
2003
2004
2005
2006
2007
2008
2009
2010
2011
2012
2013
One-way betMedian income for 25-34 year olds as a % of national median
House Purchase: Under Age 352014-2015 NATIONAL ASSOCIATIONOF REALTORS
DetachedHouse81%
Townhouse8%
Multi-Unit7%
Other4%
Figure 60
From National Association of Realtors, 2015
Figure 50
Under 35
0.9
2.5
-1.8 0.1
10.7
45-54 45-54 55-64 65+
Millions of Households
-2
0
2
4
6
8
10
12
Urban Core Earlier Suburban Later Suburban Exurban
Senior Population: 2000 & 2010CITY SECTORS: MAJOR METROPOLITAN AREAS Figure 51
Pop
ulat
ion
(Mill
ions
)
By Functional City Sector
20102000
0%
200%
400%
600%
800%
1000%
2.82 2.70
8.96 2.96
2.95
4.59
2.73
3.61
Multi-Generation HouseholdsShare of U.S. Population Living in Multi-Generational Family Households, 1940-2008 Figure 52
Source: Pew Research Center, Census Data
Source: Joint Center for Housing Studies of Harvard, 2014
10
15
20
25
1940 1950 1960 1970 1980 1990 2000 2010
Australia: GHG Emissions by Urban SectorPER CAPITA: CAPITAL CITIES OVER 1 MILLION
Figure 53
Inner Inner Ring Second Ring Outer0
5
10
15
20
25
30
19101900
80% 70%60%50%40%30%20%10%0%
1920 1930 1940 1950 1960 1970 1980 1990 2000 2010 2014
Home OwnershipUNITED STATES: 2000-2014 Figure 55
From: Census Bureau
Projected Household Growth By Age:2015 - 2025
46 CHAPMAN UNIVERSITY • CENTER FOR DEMOGRAPHICS AND POLICY
Figure 56
0%
10%
20%
30%
40%
50%
60%
70%
Home
9.4%Top 1%
30.1%
66.6%
5.5%
6.8%
5.9%
7.8%
20.6%
14.2%
25.4%
14.9%
3.1%
50.3%
25.6%
8.9%
1.6%
2%
1.3%
Bank Deposits& Other Liquid
Assets
PensionAccounts
Stocks & OtherSecurities
BusinessEquity & OtherReal Estate
Misc.
Next 19%
Middle 60%
What do Americans Own?MAKEUP OF ASSETS BY HOUSEHOLD WEALTH: 2010
Source: Jordan Weissman, “The Recession’s Toll: How Middle Class Wealth Collapsed to a 40-Year Low,” The Atlantic, December 4, 2012, http://www.theatlantic.com/business/archive/2012/12/the-recessions-toll-how-middle-class -wealth-collapsed-to-a-40-year-low/265743/.
Defining Attributes of the Middle Class
Being able to save moneyfor the future
Being able to own yourown home
Being able to afford college
Having enough money to sometimesbuy things you’d like to have, evenif you don’t absolutely need them
Having enough money forvacation travel
Being able to buy a new carfrom time to time
Source: Tom Breen, “UConn/Hartford Courant Poll: Middle Class Dream Persists, Though Harder to Attain,” UConn Today, February 11, 2013, http://today.uconn.edu/blog/2013/02/uconnhartford-courant-poll-middle-class-dream-persists-though-harder-to-attain/.
Figure 57
0 18 36 54 72 90
85
76
69
68
62
60
Percent who agree “homeownership is an important part of the American Dream”
Figure 58
74
76
78
80
82
84
86
88
90
84
8180
86
89
Total population
Base Age 21+ Gen x
Boomers
Silent GenMillennials
Less Money to Spend
Figure 59
Source: BLS
Source: Merrill Lynch – Age Wave, 2014
50%
60%
70%
80%
90%
100%
110%
120%
130%
140%
150%
1974
1975
1976
1977
1978
1979
1980
1981
1982
1983
1984
1985
1986
1987
1988
1989
1990
1991
1992
1993
1994
1995
1996
1997
1998
1999
2000
2001
2002
2003
2004
2005
2006
2007
2008
2009
2010
2011
2012
2013
One-way betMedian income for 25-34 year olds as a % of national median
House Purchase: Under Age 352014-2015 NATIONAL ASSOCIATIONOF REALTORS
DetachedHouse81%
Townhouse8%
Multi-Unit7%
Other4%
Figure 60
From National Association of Realtors, 2015
�e problem facing millennials is not that they don’t want to own, but that economic circumstances have, particularly in una�ordable markets, made purchasing a house very di�cult. Saddled with student debt as well as the weak economy, many millennials will be forced to �nd housing not in those areas that they prefer, per se, but in places they can a�ord.
Recent survey information also con�rms the preference of millennial generation households for low density housing. �e National Association of Realtors surveyed the housing types that had been purchased by homebuyers in 2013 and 2014. �ey found that 80 percent of millennial buyers had purchased detached houses, and 8 percent had chosen attached housing. Only 7 percent purchased units in multi-unit buildings, although many more, unable to buy, do end up renting in high density buildings longer than they expect.225
BEST CITIES FOR PEOPLE 47

Based on ages 18-29, unmarriedand without children, n=305
Do you want to get married? Do you want to have children?
Source: Pew Research Center
How Millennials View Marriage and Children(% SAYING THEY . . . ) Figure 60
25
5
70 74
7
19Want
Not sure
Don’t want
Figure 54
Emissions increases caused by Net Domestic Migration from California Versus CARB 2020 Reduction Targetfrom 2000–2004 Levels (tons of CO2e per annum)
-50,000,000
-40,000,000
-30,000,000
-20,000,000
-10,000,000
0
10,000,000
20,000,000
30,000,000
40,000,000
50,000,000
41,714,614
-42,000,000
Net CO2e Annual Emissions Increase from California DomesticMigration Losses since 1990
CARB ScopingPlan ReductionObjective from
2000–2004Average State
Emission Levels
Figure 56
0%
10%
20%
30%
40%
50%
60%
70%
Home
9.4%Top 1%
30.1%
66.6%
5.5%
6.8%
5.9%
7.8%
20.6%
14.2%
25.4%
14.9%
3.1%
50.3%
25.6%
8.9%
1.6%
2%
1.3%
Bank Deposits& Other Liquid
Assets
PensionAccounts
Stocks & OtherSecurities
BusinessEquity & OtherReal Estate
Misc.
Next 19%
Middle 60%
What do Americans Own?MAKEUP OF ASSETS BY HOUSEHOLD WEALTH: 2010
Source: Jordan Weissman, “The Recession’s Toll: How Middle Class Wealth Collapsed to a 40-Year Low,” The Atlantic, December 4, 2012, http://www.theatlantic.com/business/archive/2012/12/the-recessions-toll-how-middle-class -wealth-collapsed-to-a-40-year-low/265743/.
Defining Attributes of the Middle Class
Being able to save moneyfor the future
Being able to own yourown home
Being able to afford college
Having enough money to sometimesbuy things you’d like to have, evenif you don’t absolutely need them
Having enough money forvacation travel
Being able to buy a new carfrom time to time
Source: Tom Breen, “UConn/Hartford Courant Poll: Middle Class Dream Persists, Though Harder to Attain,” UConn Today, February 11, 2013, http://today.uconn.edu/blog/2013/02/uconnhartford-courant-poll-middle-class-dream-persists-though-harder-to-attain/.
Figure 57
0 18 36 54 72 90
85
76
69
68
62
60
Percent who agree “homeownership is an important part of the American Dream”
Figure 58
74
76
78
80
82
84
86
88
90
84
8180
86
89
Total population
Base Age 21+ Gen x
Boomers
Silent GenMillennials
Less Money to Spend
Figure 59
Source: BLS
Source: Merrill Lynch – Age Wave, 2014
50%
60%
70%
80%
90%
100%
110%
120%
130%
140%
150%
1974
1975
1976
1977
1978
1979
1980
1981
1982
1983
1984
1985
1986
1987
1988
1989
1990
1991
1992
1993
1994
1995
1996
1997
1998
1999
2000
2001
2002
2003
2004
2005
2006
2007
2008
2009
2010
2011
2012
2013
One-way betMedian income for 25-34 year olds as a % of national median
House Purchase: Under Age 352014-2015 NATIONAL ASSOCIATIONOF REALTORS
DetachedHouse81%
Townhouse8%
Multi-Unit7%
Other4%
Figure 60
From National Association of Realtors, 2015
�ese results track, almost precisely, the data from the survey for all buyers Ultimately, the issue of home-ownership relates to the quality of community life, particularly for middle class families. �is is critical, because the vast majority of millennials intend to get married and have children, although they will tend to do this later in life than earlier generations.
�is suggests that there will be a renewed demand for houses in areas that have many homeowners. Families generally do best in such areas. A�er all, homeowners naturally have a much greater �nancial stake in their neighborhoods than renters do.226 �ey also participate in elections much more frequently than renters. One study found that 77 percent of homeowners had at some point voted in local elections, compared with 52 percent of renters. About 38 percent of homeowners knew the name of their local school board representative, compared with only 20 percent of renters. �e study also showed a higher incidence of church attendance and volunteerism among homeowners.227
Research suggests that homeowners are more satis�ed than renters with their lives, are less exposed to crime and
48 CHAPMAN UNIVERSITY • CENTER FOR DEMOGRAPHICS AND POLICY

are more supportive of parks. Research published by Habitat for Humanity shows, perhaps most important of all, the many advantages for children associated with homeownership versus renting. �ese include better educational performance and better prospects for income, as well less of a tendency to become single parents or to be on welfare.228
Redefining Urban Policy
Ultimately, urban policy should be about choices driven by consumer preferences. People should be allowed, as much as is feasible and economically sustainable, to live where they please, whether in core cities, suburbs or elsewhere. As shown above, the notion that development be “steered” into ever denser pockets runs counter to the wishes of the vast majority. 229
Moreover, the attempt to force a particular lifestyle on all can have very expensive consequences, not only in respect to housing a�ordability, but in respect to economic equity. �omas Piketty, the French economist, recently described the extent to which inequality in 20 nations has deteriorated in recent decades, erasing the hard earned progress of previous years in the earlier part of the twentieth century.230 Matthew Rognlie of the Massachusetts Institute of Technology examined Piketty's ground-breaking research on rising inequality and concluded that much of the observed inequality is from redistribution of housing wealth away from the middle-class.231;232 Rognlie concluded that much of this was due to land regulation, and suggested the need to expand the housing supply and reexamine the land
use regulation that he associates with the loss of middle-class wealth.
Towards a 'Policy Pluralism'
Rather than impose one solitary ideal, we should embrace what Robert Fishman described nearly three decades ago as an “urban pluralism” that encompasses the city center, close-in suburbs, new fringe developments and exurbs.233
Some densi�cation will, of course, occur, due to changing demographics,
escalating land costs and, sadly, slower income growth. But it is absurd to suggest, as does urbanist author Roberta Brandes Gratz, that most Americans actually pine to live in the dense environments of places like Prague, and away from their more mobile automobile-oriented communities. And to be sure, Prague is a wonderful place to visit, but it’s doubtful that most American families would like to live in the 70 square meter (753 square feet) apartments that accommodate the average household in that city.234
In the long run, to be both socially and demographically sustainable, the city needs to embrace both its urban and suburban geographies, playing not only to the wealthy, the young, and the
People should be allowed, as much as is feasible and economically
sustainable, to live where they please, whether in core cities,
suburbs or elsewhere.
BEST CITIES FOR PEOPLE 49

very poor, but also to families. A society that wants to replace itself needs to pay attention to the needs of suburban families as well as to those of inner city dwellers. As Frederick Law Olmstead, the creator of Central Park, once remarked: “No great town can long exist without great suburbs.”235
For most middle and working class families, the goal is to achieve residence in a small home in a modest neighborhood, whether in a suburb or a city, where children can be raised and also where—of increasing importance—seniors can grow old amidst familiar places and faces. Rather than insist on one form of urbanism, we need to support the idea that a metropolis’ heart exists where its people choose to settle. “A�er all is said and done, he—the citizen—is really the city," Frank Lloyd Wright suggested.
“�e city is going wherever he goes."236 To succeed, planners and
politicians need to listen to people’s aspirations and help them accomplish that goal in a responsible manner. Such a consumer-based approach can be messy, and will need to be constrained by considerations of the common good and the environment. But a new approach to urbanism clearly is desperately needed: one that sees people and families not as assets or digits to be moved around and shaped by their betters, but as the fundamental element that de�nes a city's essence, and provides its ultimate purpose.
SIDEBAR: BEST CITIES FOR MIDDLE CLASS FAMILIES
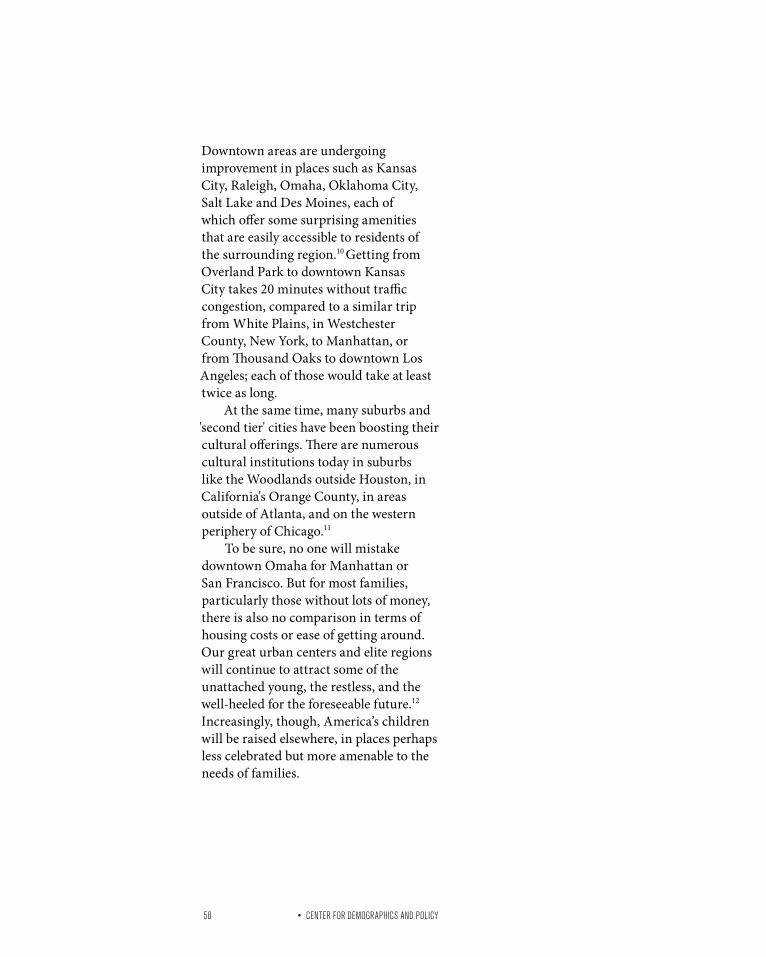
Our Best Cities for Middle-Class Families Index ranks all of the 106 US metropolitan areas with populations of more than 500,000 in 2014.
To create these rankings, we didn't just look at conditions across the board. We also focused on those factors that are illustrative of current and future trends: income, current housing prices, and migration data. �is approach, rather than leading us to the best places for families and careers in years past, revealed those places that may provide the best opportunities in the future.
As a result of our broader outlook, our �ndings are somewhat opposite of many “best places” rankings. Studies such as Monocle or the Economist Intelligence Unit are oriented to executives living abroad, and have little room for cost considerations. �ose rankings generally favor high-cost cities such as Melbourne or Vancouver, and cities, like Vienna and Helsinki in European nations with low birthrates.1
Nor does our list calculate which places are best for older populations. In many cases, people in West Coast and the Northeastern cities have measurably better health, and they live longer. But this is not where people, and particularly families, are moving. Low costs, the availability of more middle class jobs, and shorter commute times are driving young families to places that are becoming the new nurseries of the nation.2 �ese families would have to pay the exceedingly high costs to enter the Bay Area, New York or even Seattle or
50 CHAPMAN UNIVERSITY • CENTER FOR DEMOGRAPHICS AND POLICY

Portland real estate market. Our Best Cities for Middle Class
Families rankings are based on three equally-weighted categories of metrics:
• Median family income adjusted for cost of living
• Economic opportunity, with a focus on middle class jobs
• Family friendliness, determined by several quality of life metrics for school age children and parents
Final Rankings
Overall, our Best Cities index balances the economic costs and quality of life issues that matter to middle class families. When we integrate our three big categories a very interesting picture emerges. Notably, the best rated cities tend to be smaller. �e three most highly rated, Des Moines, Madison and Albany, all have populations of less than 1,000,000. Among our top 10 metropolitan areas for families there are �ve that are larger than this, but only two—Washington (including both its surrounding suburbs and the largely child-free District) and Minneapolis-St. Paul—are among the nation's 20 largest metropolitan areas.
Our bottom ten includes two of the media's favorite cities, New York and Los Angeles, which are also the largest metropolitan areas in the nation. �ere are three additional large metropolitan areas in the bottom 10: Miami, and Riverside-San Bernardino, among the top 10 and top 20 most populous cities in the nation respectively, and Las Vegas, which has a population of more than 1,000,000. It seems what we
usually see as “fun cities”—New York, Miami, Las Vegas, Los Angeles—are not so amenable to the new generation of young families.
�e other cities at the bottom tend to have large populations that live under the poverty line. Four are in California's San Joaquin Valley: Fresno, Bakers�eld, Stockton and Modesto. �is low group also includes El Paso and McAllen in Texas.
Income Relative to Cost Of Living
In our breakdown of factors that determined the overall rankings, we looked at median family incomes, adjusted for the cost of living.
When we use this adjusted family income metric, we see that many top performers—that is, cities that give a lot of proverbial bang for the bucks their residents earn—are in ultra-high income/ high cost regions. Cities that rank well on this income list in spite of their high costs include several in the Northeast: Washington DC, Bridgeport and Boston all make the top 10 for adjusted median family income. Other high income/ high cost cities that topped this adjusted income list were San Jose and San Francisco.
A di�erent phenomena could be seen in cities that landed in the top 15 due to average or below average costs paired with reasonable incomes: Albany, Madison, Des Moines, and Raleigh fall into that category.
On the other end of the adjusted income spectrum, California cities are also prominent, including �ve of the bottom ten. Many of these areas
BEST CITIES FOR PEOPLE 51

Salt Lake City, UT
Provo, UT
Austin, TX
Des Moines, IA
Ogden, UT
Baton Rouge, LA
Oklahoma City, OK
San Antonio, TX
Houston, TX
Fayetteville, AR-MO
Omaha, NE-IA
Madison, WI
Tulsa, OK
Pittsburgh, PA
Charleston, SC
Raleigh, NC
Seattle, WA
Minneapolis-St. Paul, MN-WI
Albany, NY
Colorado Springs, CO
Baltimore, MD
Washington, DC-VA-MD-WV
Denver, CO
Dallas-Fort Worth, TX
Portland, ME
Durham, NC
Richmond, VA
Little Rock, AR
Boise, ID
Harrisburg, PA
Nashville, TN
Boston, MA-NH
Birmingham, AL
El Paso, TX
Columbia, SC
Knoxville, TN
Kansas City, MO-KS
Honolulu, HI
Lancaster, PA
Virginia Beach-Norfolk, VA-NC
Albuquerque, NM
Greenville, SC
Louisville, KY-IN
Hartford, CT
Wichita, KS
Phoenix, AZ
Spokane, WA
Jacksonville, FL
Philadelphia, PA-NJ-DE-MD
Chattanooga, TN-GA
Allentown, PA-NJ
Portland, OR-WA
Charlotte, NC-SC
28
55
75
4
8
13
24
41
87
15
29
33
39
1
12
72
42
6
2
66
7
19
44
93
5
71
45
48
51
10
68
32
18
79
46
16
43
92
20
61
31
54
25
35
60
78
27
62
14
22
17
69
80
2
17
11
23
19
3
21
50
9
53
22
10
5
28
33
54
36
57
18
1
25
62
27
15
69
13
14
8
63
30
29
71
6
12
7
49
16
44
85
4
66
32
65
45
37
51
43
20
61
48
86
58
38
Metropolitan Area
Median Family Income: Increase 1999-2013
Middle IncomeJobs: % of Labor Market: 2014
Change in Middle Income Jobs: 2004-14
100
102
95
104
98
76
103
88
80
97
106
101
96
75
55
79
72
94
87
48
81
99
74
82
93
84
90
85
83
89
71
86
65
24
43
68
63
105
92
91
78
31
35
52
77
66
17
46
58
59
49
32
14
5
2
1
17
19
14
15
6
3
24
40
33
29
64
13
4
11
53
73
27
45
44
18
7
71
20
37
46
22
91
21
34
76
9
39
60
49
38
75
97
68
28
36
58
65
26
35
47
89
78
52
25
12
Change in Middle Income Jobs: 2005-14Rank
US Metropolitan Areas over 1,000,000 Population, Draft at 2015.09.25
Table E.1MIDDLE CLASS ASPIRATION INDEX: ECONOMIC OPPORTUNITY
1
2
3
4
5
6
7
8
9
10
11
12
13
14
15
16
17
18
19
20
21
22
23
24
25
26
27
28
29
30
31
32
33
34
35
36
37
38
39
40
41
42
43
44
45
46
47
48
49
50
51
52
53
Metropolitan Area
Median Family Income: Increase 1999-2013
Middle IncomeJobs: % of Labor Market: 2014
Change in Middle Income Jobs: 2004-14
Change in Middle Income Jobs: 2005-14Rank
US Metropolitan Areas over 1,000,000 Population, Draft at 2015.09.25
Table E.2MIDDLE CLASS ASPIRATION INDEX: ECONOMIC OPPORTUNITY
Worcester, MA-CT
Grand Rapids, MI
Indianapolis. IN
St. Louis,, MO-IL
Scranton, PA
Syracuse, NY
Rochester, NY
Bridgeport-Stamford, CT,
Tucson, AZ
Tampa-St. Petersburg, FL
Akron, OH
Augusta, GA-SC
McAllen, TX
Buffalo, NY
Columbus, OH
Lakeland, FL
San Francisco-Oakland, CA
Cleveland, OH
Springfield, MA
Cincinnati, OH-KY-IN
Jackson, MS
Cape Coral, FL
Milwaukee,WI
Orlando, FL
New Haven CT
San Diego, CA
New Orleans. LA
Melbourne, FL
Atlanta, GA
Winston-Salem, NC
Sarasota, FL
Daytona Beach, FL
San Jose, CA
Chicago, IL-IN-WI
Miami, FL
Sacramento, CA
Providence, RI-MA
Oxnard, CA
Memphis, TN-MS-AR
Greensboro, NC
Toledo, OH
New York, NY-NJ-PA
Youngstown, OH-PA
Riverside-San Bernardino, CA
Santa Rosa, CA
Dayton, OH
Detroit, MI
Bakersfield, CA
Los Angeles, CA
Las Vegas, NV
Stockton, CA
Modesto, CA
Fresno, CA
36
47
82
26
9
11
50
30
76
37
34
56
3
21
74
57
83
58
67
64
70
52
88
89
65
99
53
49
100
86
23
40
95
81
98
90
59
63
77
97
73
103
38
84
94
96
85
91
106
104
102
101
105
70
34
42
46
59
77
47
88
60
31
26
24
103
84
74
39
79
41
76
55
64
96
68
99
83
35
73
80
56
72
97
95
100
75
90
52
87
94
92
82
78
91
89
93
98
67
40
102
81
106
101
104
105
47
33
57
41
28
61
70
73
62
37
34
22
7
51
69
15
56
64
40
45
54
23
60
42
29
36
67
25
30
27
39
18
38
21
53
10
11
26
20
16
13
50
9
6
44
19
5
4
12
8
3
1
2
59
51
30
82
92
99
87
72
43
81
95
62
8
93
57
56
32
98
54
80
70
42
79
16
85
55
105
100
41
69
101
84
23
83
48
67
96
90
86
77
102
61
106
50
94
104
103
10
66
63
88
74
31
54
55
56
57
58
59
60
61
62
63
64
65
66
67
68
69
70
71
72
73
74
75
76
77
78
79
80
81
82
83
84
85
86
87
88
89
90
91
92
93
94
95
96
97
98
99
100
101
102
103
104
105
106
52 CHAPMAN UNIVERSITY • CENTER FOR DEMOGRAPHICS AND POLICY

Salt Lake City, UT
Provo, UT
Austin, TX
Des Moines, IA
Ogden, UT
Baton Rouge, LA
Oklahoma City, OK
San Antonio, TX
Houston, TX
Fayetteville, AR-MO
Omaha, NE-IA
Madison, WI
Tulsa, OK
Pittsburgh, PA
Charleston, SC
Raleigh, NC
Seattle, WA
Minneapolis-St. Paul, MN-WI
Albany, NY
Colorado Springs, CO
Baltimore, MD
Washington, DC-VA-MD-WV
Denver, CO
Dallas-Fort Worth, TX
Portland, ME
Durham, NC
Richmond, VA
Little Rock, AR
Boise, ID
Harrisburg, PA
Nashville, TN
Boston, MA-NH
Birmingham, AL
El Paso, TX
Columbia, SC
Knoxville, TN
Kansas City, MO-KS
Honolulu, HI
Lancaster, PA
Virginia Beach-Norfolk, VA-NC
Albuquerque, NM
Greenville, SC
Louisville, KY-IN
Hartford, CT
Wichita, KS
Phoenix, AZ
Spokane, WA
Jacksonville, FL
Philadelphia, PA-NJ-DE-MD
Chattanooga, TN-GA
Allentown, PA-NJ
Portland, OR-WA
Charlotte, NC-SC
28
55
75
4
8
13
24
41
87
15
29
33
39
1
12
72
42
6
2
66
7
19
44
93
5
71
45
48
51
10
68
32
18
79
46
16
43
92
20
61
31
54
25
35
60
78
27
62
14
22
17
69
80
2
17
11
23
19
3
21
50
9
53
22
10
5
28
33
54
36
57
18
1
25
62
27
15
69
13
14
8
63
30
29
71
6
12
7
49
16
44
85
4
66
32
65
45
37
51
43
20
61
48
86
58
38
Metropolitan Area
Median Family Income: Increase 1999-2013
Middle IncomeJobs: % of Labor Market: 2014
Change in Middle Income Jobs: 2004-14
100
102
95
104
98
76
103
88
80
97
106
101
96
75
55
79
72
94
87
48
81
99
74
82
93
84
90
85
83
89
71
86
65
24
43
68
63
105
92
91
78
31
35
52
77
66
17
46
58
59
49
32
14
5
2
1
17
19
14
15
6
3
24
40
33
29
64
13
4
11
53
73
27
45
44
18
7
71
20
37
46
22
91
21
34
76
9
39
60
49
38
75
97
68
28
36
58
65
26
35
47
89
78
52
25
12
Change in Middle Income Jobs: 2005-14Rank
US Metropolitan Areas over 1,000,000 Population, Draft at 2015.09.25
Table E.1MIDDLE CLASS ASPIRATION INDEX: ECONOMIC OPPORTUNITY
1
2
3
4
5
6
7
8
9
10
11
12
13
14
15
16
17
18
19
20
21
22
23
24
25
26
27
28
29
30
31
32
33
34
35
36
37
38
39
40
41
42
43
44
45
46
47
48
49
50
51
52
53
Metropolitan Area
Median Family Income: Increase 1999-2013
Middle IncomeJobs: % of Labor Market: 2014
Change in Middle Income Jobs: 2004-14
Change in Middle Income Jobs: 2005-14Rank
US Metropolitan Areas over 1,000,000 Population, Draft at 2015.09.25
Table E.2MIDDLE CLASS ASPIRATION INDEX: ECONOMIC OPPORTUNITY
Worcester, MA-CT
Grand Rapids, MI
Indianapolis. IN
St. Louis,, MO-IL
Scranton, PA
Syracuse, NY
Rochester, NY
Bridgeport-Stamford, CT,
Tucson, AZ
Tampa-St. Petersburg, FL
Akron, OH
Augusta, GA-SC
McAllen, TX
Buffalo, NY
Columbus, OH
Lakeland, FL
San Francisco-Oakland, CA
Cleveland, OH
Springfield, MA
Cincinnati, OH-KY-IN
Jackson, MS
Cape Coral, FL
Milwaukee,WI
Orlando, FL
New Haven CT
San Diego, CA
New Orleans. LA
Melbourne, FL
Atlanta, GA
Winston-Salem, NC
Sarasota, FL
Daytona Beach, FL
San Jose, CA
Chicago, IL-IN-WI
Miami, FL
Sacramento, CA
Providence, RI-MA
Oxnard, CA
Memphis, TN-MS-AR
Greensboro, NC
Toledo, OH
New York, NY-NJ-PA
Youngstown, OH-PA
Riverside-San Bernardino, CA
Santa Rosa, CA
Dayton, OH
Detroit, MI
Bakersfield, CA
Los Angeles, CA
Las Vegas, NV
Stockton, CA
Modesto, CA
Fresno, CA
36
47
82
26
9
11
50
30
76
37
34
56
3
21
74
57
83
58
67
64
70
52
88
89
65
99
53
49
100
86
23
40
95
81
98
90
59
63
77
97
73
103
38
84
94
96
85
91
106
104
102
101
105
70
34
42
46
59
77
47
88
60
31
26
24
103
84
74
39
79
41
76
55
64
96
68
99
83
35
73
80
56
72
97
95
100
75
90
52
87
94
92
82
78
91
89
93
98
67
40
102
81
106
101
104
105
47
33
57
41
28
61
70
73
62
37
34
22
7
51
69
15
56
64
40
45
54
23
60
42
29
36
67
25
30
27
39
18
38
21
53
10
11
26
20
16
13
50
9
6
44
19
5
4
12
8
3
1
2
59
51
30
82
92
99
87
72
43
81
95
62
8
93
57
56
32
98
54
80
70
42
79
16
85
55
105
100
41
69
101
84
23
83
48
67
96
90
86
77
102
61
106
50
94
104
103
10
66
63
88
74
31
54
55
56
57
58
59
60
61
62
63
64
65
66
67
68
69
70
71
72
73
74
75
76
77
78
79
80
81
82
83
84
85
86
87
88
89
90
91
92
93
94
95
96
97
98
99
100
101
102
103
104
105
106
BEST CITIES FOR PEOPLE 53

are inland— Bakers�eld, Modesto, Riverside-San Bernardino and Fresno—but Los Angeles also did poorly here, ranking #99. Other areas with poor scores included three in Florida—Miami, Daytona Beach and Lakeland—while El Paso and McAllen in south Texas scored at the absolute bottom. Many of the worst performing regions su�er from a combination of below average incomes and high costs. Even New York, when both earnings and costs are factored, shows up at a poor #70.
Interestingly, some cities may o�er a better economic deal to people before they get to their child raising years. A New York City controller's report shows that the New York “premium” tends to erode by the time workers enter their late 30s. �e advantages of a central location may jump start careers by providing key contacts and experiences, but this fades later on. “�e New York metro area is always sucking people in and spitting them out,” notes Bernard Weinstein, an economist at Southern Methodist University. “I’ve watched this cycle of all these kids moving to New York, and ten years later moving back to Dallas. You discover that you can �nd employment in Dallas or Atlanta at a roughly comparable salary, but in real terms it’s a boost because the cost of living is much lower.”3
Economic Opportunity
Being located in a place with an average high income can, of course, be a positive, but sometimes the resulting gains accrue to only a relatively small portion of the population. In order to focus on middle class economic
opportunity, we looked at three key categories: increases in median family income, percentage of middle class jobs in the labor market, and growth in such jobs.
Our de�nition of middle class jobs includes occupations paying 67-200 percent of the national median hourly wage. �is group of 574 job types account for 60 percent of the nation’s total employment. �e share of middle class jobs in each of the 106 metropolitan areas varies, ranging from 66 percent of all jobs in Colorado Springs, to a low of 49 percent in Las Vegas.
Our list of highest ranking cities for economic opportunity is dominated by areas that have also experienced considerable economic growth. �e best performer, Salt Lake, is one of three Utah areas in that list's top ten, which also includes Provo and Ogden. In Utah, economic growth has been expansive, including many technology operations that landed there a�er leaving California, a strong manufacturing base, and an expanding business and �nancial service sector. All these �elds tend to pay above average wages, although these Utahans are unlikely to make the mega-salaries of Silicon Valley entrepreneurs or Wall Street investment bankers.
Other strong performers in economic opportunity include three Texas cities: Houston, Austin and San Antonio. �e top ten list is rounded out by four diverse economies: Des Moines, Fayetteville (Arkansas-Missouri), Oklahoma City and Baton Rouge.
In contrast, the bottom of the economic opportunity list is dominated by some of those areas hardest hit in the last recession. Seven are in California, including Los Angeles, Santa Rosa
54 CHAPMAN UNIVERSITY • CENTER FOR DEMOGRAPHICS AND POLICY

Fayetteville, AR-MO
Scranton, PA
Toledo, OH
Syracuse, NY
Melbourne, FL
Youngstown, OH-PA
Colorado Springs, CO
Wichita, KS
Des Moines, IA
Columbia, SC
Greenville, SC
Dayton, OH
Greensboro, NC
Rochester, NY
Boise, ID
Buffalo, NY
Omaha, NE-IA
Akron, OH
Tulsa, OK
Columbus, OH
Madison, WI
Harrisburg, PA
Kansas City, MO-KS
Raleigh, NC
Chattanooga, TN-GA
Little Rock, AR
Knoxville, TN
Spokane, WA
Louisville, KY-IN
Lancaster, PA
Cape Coral, FL
Durham, NC
Daytona Beach, FL
Albany, NY
Oklahoma City, OK
Grand Rapids, MI
Sarasota, FL
Winston-Salem, NC
Cleveland, OH
Indianapolis. IN
Cincinnati, OH-KY-IN
Pittsburgh, PA
Ogden, UT
Richmond, VA
Lakeland, FL
Albuquerque, NM
Charlotte, NC-SC
Hartford, CT
Jacksonville, FL
Springfield, MA
Austin, TX
Birmingham, AL
St. Louis,, MO-IL
84
12
21
14
9
8
30
62
69
38
41
11
31
27
74
15
51
4
68
22
6
13
39
37
54
65
34
23
36
63
24
3
18
32
79
58
2
49
7
45
28
5
88
1
67
75
50
52
44
72
80
17
43
1
23
43
39
6
59
3
51
15
5
17
71
24
85
9
92
74
68
36
37
70
82
44
7
30
33
41
62
45
26
2
83
21
63
22
77
55
66
87
42
67
50
14
52
12
31
11
58
20
56
4
38
80
Metropolitan Area Rooms: 20135-17 Migration: 2005-2009
Journey to WorkTime : 2013
30
4
3
7
34
1
78
9
25
27
43
14
31
8
49
10
20
5
28
26
61
15
22
47
21
17
35
59
19
37
68
46
58
39
24
18
85
29
6
23
13
11
55
69
40
62
65
53
56
57
72
38
12
5
15
6
10
41
13
19
1
2
52
18
12
24
8
9
7
3
40
11
39
14
25
35
65
37
31
36
16
45
28
89
27
50
26
30
23
32
34
61
57
59
77
20
64
71
33
73
44
75
29
74
81
67
Detached House Price to Income Ratio: 2014Rank
*Based on four one-year samples from the 2006-2010 American Community Survey
Table E.3MIDDLE CLASS ASPIRATION INDEX: FAMILY FRIENDLINESS
1
2
3
4
5
6
7
8
9
10
11
12
13
14
15
16
17
18
19
20
21
22
23
24
25
26
27
28
29
30
31
32
33
34
35
36
37
38
39
40
41
42
43
44
45
46
47
48
49
50
51
52
53
Portland, ME
Nashville, TN
Minneapolis-St. Paul, MN-WI
Memphis, TN-MS-AR
Charleston, SC
Allentown, PA-NJ
Tampa-St. Petersburg, FL
Virginia Beach-Norfolk, VA-NC
Jackson, MS
Augusta, GA-SC
Las Vegas, NV
Atlanta, GA
Tucson, AZ
New Haven CT
Milwaukee,WI
San Antonio, TX
Phoenix, AZ
Salt Lake City, UT
Portland, OR-WA
Provo, UT
Baton Rouge, LA
Detroit, MI
Denver, CO
Dallas-Fort Worth, TX
Providence, RI-MA
Sacramento, CA
Orlando, FL
Philadelphia, PA-NJ-DE-MD
Baltimore, MD
Worcester, MA-CT
Houston, TX
Bakersfield, CA
Seattle, WA
Fresno, CA
El Paso, TX
Santa Rosa, CA
McAllen, TX
Modesto, CA
Bridgeport-Stamford, CT
Chicago, IL-IN-WI
Boston, MA-NH
Oxnard, CA
Washington, DC-VA-MD-WV
New Orleans. LA
Miami, FL
Riverside-San Bernardino, CA
San Diego, CA
Stockton, CA
San Jose, CA
New York, NY-NJ-PA
San Francisco-Oakland, CA
Los Angeles, CA
Honolulu, HI
19
48
26
42
25
20
46
16
76
40
83
47
70
57
53
94
73
90
61
98
81
60
29
86
71
85
64
35
10
78
95
103
59
100
104
77
106
96
55
82
66
89
33
56
91
101
87
99
97
92
93
102
105
78
19
69
88
76
28
54
94
49
103
16
10
47
64
95
8
29
46
34
35
25
99
48
27
79
32
81
89
61
75
18
53
73
96
91
84
40
60
93
97
86
72
57
106
102
13
90
65
98
100
101
104
105
Metropolitan Area Rooms: 20135-17 Migration: 2005-2009
Journey to WorkTime : 2013
76
50
45
32
79
48
36
63
44
16
81
33
66
86
64
54
74
83
88
84
42
2
90
52
80
89
71
70
77
75
67
82
94
91
60
101
41
87
97
73
95
99
92
51
98
96
102
93
106
100
104
103
105
42
79
62
58
49
86
76
54
56
47
53
98
60
51
46
63
68
21
66
4
88
83
78
85
70
72
84
94
102
91
96
43
92
22
38
48
17
87
97
101
99
69
105
80
90
103
55
104
82
106
100
95
93
Detached House Price to Income Ratio: 2014Rank
*Based on four one-year samples from the 2006-2010 American Community Survey
Table E.1MIDDLE CLASS ASPIRATION INDEX: FAMILY FRIENDLINESS
54
55
56
57
58
59
60
61
62
63
64
65
66
67
68
69
70
71
72
73
74
75
76
77
78
79
80
81
82
83
84
85
86
87
88
89
90
91
92
93
94
95
96
97
98
99
100
101
102
103
104
105
106
BEST CITIES FOR PEOPLE 55

and the inland metropolitan areas of Riverside-San Bernardino, Bakers�eld, Stockton, Modesto and Fresno. Also in the bottom 10 are two rustbelt metros, Dayton and Detroit. �e other city at the bottom is Las Vegas, an area prone to boom-bust cycles with an economy that has long been tied closely to California's.
Family Friendliness
�is might be considered the most subjective of our categories, but in some ways it may be the most persuasive. Our rankings on overall family friendliness include such things as commute times, a major concern of young parents, the cost of a single family house (the overwhelming choice of families) adjusted for income, crowding (number of rooms per person), and �nally, the net migration of people aged 5-17 over the 2005-2009 period.4
It is critical to understand that many of the areas that do best on this list are not always ranked by others as “best cities” for children, and other lists show admiration for places that didn't meet our standards. For example, upscale suburbs located around such as places as Boston (Newton) and San Francisco (Palo Alto) are no doubt excellent places to raise children if you bought years ago, come from a wealthy family or became rich in the tech business. Our study ended up giving the best ratings largely to some smaller cities, as well as to some suburban areas.5
One of the key components of this ranking is commute time. Commutes tend to be much shorter in small cities. Average one-way commute times are just under 20 minutes in Wichita (the
lowest, at 18.4 minutes), and in Provo, Omaha, Des Moines and Fayetteville. Commutes in most other metropolitan areas (including Los Angeles) range from 20 minutes to 28 minutes.6 �e longest commute times are in metropolitan areas with larger transit market shares, because commuting by transit takes about twice as long as by automobile. New York's average commute is 34 minutes each way, while Washington's is 32.3 minutes. Chicago, San Francisco and Boston also are among the worst ten for commute times, due to their high transit market shares.
Some places in the bottom ten in commuting time are part of larger metropolitan areas; Stockton (San Francisco Bay area), Riverside-San Bernardino (Los Angeles area) and Baltimore (Washington area). Bridgeport is also in the bottom ten, along with Atlanta and its less-than-optimum freeway and arterial street system.
Another key component is home buying. In this era of elevated housing prices and generally depressed incomes, the issue of cost has become paramount, and could become even more important if interest rates rise.7 Due to the vast preference of families for single family houses, we focused on the relative cost of such a dwelling. Our calculations are based on current prices, because that is what would be most relevant to younger families; for older households bought years ago, the higher prices may seem something of a boon (unless they want their children to buy or even rent close by).
Overall, the closest relationships between house price and income we saw were in the economically depressed cities of the Midwest and the Northeast. Youngstown was the most a�ordable,
56 CHAPMAN UNIVERSITY • CENTER FOR DEMOGRAPHICS AND POLICY

followed by Detroit, Toledo, Scranton and Akron. But other more economically vibrant heartland cities such as Omaha, Madison, Cincinnati and Pittsburgh placed high. �e bottom rungs were overwhelmingly seen in California, which accounts for six of the bottom ten of our 106 metropolitan areas, with San Jose at the bottom, followed by Honolulu, San Francisco, Los Angeles and San Diego. Los Angeles has become very una�ordable, despite generally low income growth.8
Finally, we looked at the migration of people aged 5 to 17, which tells us how people are “voting with their feet.” �e biggest percentage gain in migration of school-age children has been in Fayetteville, Arkansas-Missouri, which reported growth of 2.5 percent over the 2005-2009 period. Other big gainers were Cape Coral, Florida; Colorado Springs; and Columbia, South Carolina; the next �ve included Melbourne, Florida; Raleigh; San Antonio; Boise; and Atlanta.
In the future this process will be accelerated by the growing shi� of immigrants (who tend to have more children) to both suburbs and smaller cities, a trend well documented by the Pew Foundation. More immigrants moved to metropolitan areas like Minneapolis, Baltimore and Charlotte than to Los Angeles between 2000 and 2013. Atlanta and Seattle, largely in their lower cost suburbs, saw an increase in immigrants during this period far greater than Chicago, San Francisco, Boston, or Los Angeles did.�e immigrant population doubled or more in nine mostly southeastern metro areas: Cape Coral, Knoxville, Nashville, Charlotte, Louisville, Charleston, Raleigh,
Scranton, and Indianapolis.9
What areas are families increasingly avoiding? California sits at the bottom of the list of places where families choose to move, with three of the ten areas with the lowest migration of children: Los Angeles, San Francisco and San Jose. �ese high priced areas are joined by other pricey cities like Honolulu and New York. Any future demography of America will likely re�ect these movements, which will make the South and Intermountain West more family-centric, while the Northeast and the West Coast, for the most part will become less so.
The Question Of Amenities
So why do families pick di�erent places than those that are generally considered hotbeds of 'the creative class'? One answer has to do with which amenities are valuable to di�erent people at di�erent stages of life. San Francisco, New York, and Los Angeles o�er much to those who want to enjoy the arts, �ne dining and bracing street scenes. But many of the things that appeal to those focused on urban culture do not ful�ll the needs of families who seek family-oriented attractions like farmer’s markets, bike trails and Fourth of July parades.
Some of the more media-favored cities seem over-anxious to embrace a future of singles. �is is especially illustrated by the constraint of the housing choices that families overwhelmingly prefer.
But, for the most part, the better rated cities in our rankings have continued to maintain their attractiveness to families while expanding their more urban options.
BEST CITIES FOR PEOPLE 57
Downtown areas are undergoing improvement in places such as Kansas City, Raleigh, Omaha, Oklahoma City, Salt Lake and Des Moines, each of which o�er some surprising amenities that are easily accessible to residents of the surrounding region.10 Getting from Overland Park to downtown Kansas City takes 20 minutes without tra�c congestion, compared to a similar trip from White Plains, in Westchester County, New York, to Manhattan, or from �ousand Oaks to downtown Los Angeles; each of those would take at least twice as long.
At the same time, many suburbs and 'second tier' cities have been boosting their cultural o�erings. �ere are numerous cultural institutions today in suburbs like the Woodlands outside Houston, in California's Orange County, in areas outside of Atlanta, and on the western periphery of Chicago.11
To be sure, no one will mistake downtown Omaha for Manhattan or San Francisco. But for most families, particularly those without lots of money, there is also no comparison in terms of housing costs or ease of getting around. Our great urban centers and elite regions will continue to attract some of the unattached young, the restless, and the well-heeled for the foreseeable future.12 Increasingly, though, America’s children will be raised elsewhere, in places perhaps less celebrated but more amenable to the needs of families.
58 CHAPMAN UNIVERSITY • CENTER FOR DEMOGRAPHICS AND POLICY

US Metropolitan Areas over 1,000,000 Population, Draft at 2015.09.25US Metropolitan Areas over 1,000,000 Population, Draft at 2015.09.25
Table A.1MIDDLE CLASS ASPIRATION INDEX: SCORES IN RANK ORDER
Des Moines, IA
Madison, WI
Albany, NY
Austin, TX
Raleigh, NC
Minneapolis-St. Paul, MN-WI
Hartfort, CT
Washington, DC-VA-MD-WV
Omaha, NE-IA
Ogden, UT
Salt Lake City, UT
Kansas City, MO-KS
Pittsburg, PA
Durham, NC
Colorado Springs, CO
Harrisburg, PA
Fayetteville, AR-MO
Baltimore, MD
Boston, MA-NH
Richmond, VA
Bridgeport-Stamford, CT
Provo, UT
Seattle, WA
Denver, CO
Oklahoma City, OK
St. Louis, MO-IL
Akron, OH
Syracuse, NY
Portland, ME
Wichita, KS
Louisville, KY-IN
Charleston, SC
Tulsa, OK
Cincinnati, OH-KY-IN
Columbus, OH
Baton Rouge, LA
0.806
0.833
0.847
0.756
0.786
0.851
0.912
1.000
0.707
0.684
0.626
0.725
0.669
0.685
0.603
0.677
0.518
0.775
0.890
0.675
0.929
0.546
0.768
0.703
0.532
0.739
0.675
0.615
0.628
0.585
0.629
0.582
0.499
0.693
0.646
0.534
0.517
0.656
0.524
0.580
0.566
0.596
0.559
0.463
0.543
0.567
0.475
0.558
0.562
0.657
0.619
0.679
0.577
1
2
3
4
5
6
7
8
9
10
11
12
13
14
15
16
17
18
19
20
21
22
23
24
25
26
27
28
29
30
31
32
33
34
35
36
37
38
39
40
41
42
43
44
45
46
47
48
49
50
51
52
53
0.775
0.712
0.684
0.796
0.701
0.684
0.600
0.678
0.713
0.755
0.844
0.624
0.702
0.661
0.682
0.644
0.720
0.678
0.642
0.661
0.572
0.827
0.685
0.670
0.748
0.576
0.563
0.573
0.662
0.599
0.604
0.702
0.707
0.545
0.554
0.751
0.627
0.548
0.656
0.644
0.610
0.555
0.573
0.651
0.637
0.583
0.731
0.580
0.663
0.593
0.587
0.585
0.588
0.848
0.808
0.796
0.758
0.808
0.751
0.762
0.573
0.821
0.774
0.720
0.808
0.777
0.797
0.856
0.808
0.880
0.658
0.578
0.770
0.584
0.710
0.625
0.699
0.792
0.754
0.820
0.860
0.753
0.850
0.799
0.746
0.813
0.778
0.812
0.703
0.844
0.783
0.802
0.753
0.798
0.822
0.826
0.824
0.757
0.786
0.723
0.782
0.693
0.668
0.711
0.651
0.745
0.810
0.785
0.775
0.770
0.765
0.762
0.758
0.750
0.747
0.737
0.730
0.719
0.716
0.714
0.713
0.710
0.706
0.704
0.703
0.702
0.695
0.694
0.693
0.691
0.691
0.690
0.686
0.683
0.681
0.678
0.677
0.676
0.673
0.672
0.671
0.663
0.663
0.662
0.660
0.659
0.658
0.658
0.652
0.646
0.646
0.645
0.643
0.640
0.639
0.639
0.639
0.638
0.637
Columbia, SC
Cleveland, OH
Little Rock, AR
Nashville, TN
Lancaster, PA
Buffalo, NY
Rochester, NY
Boise, ID
Birmingham, AL
Grand Rapids, MI
San Antonio, TX
Indianapolis. IN
Dallas-Fort Worth, TX
Philadelphia, PA-NJ-DE-MD
Portland, OR-WA
Worcester, MA-CT
Allentown, PA-NJ
Metropolitan AreaCOLI Adjusted Median Family Income
Economic Opportunity
Family Friendliness
Overall ScoreRank
Table A.2MIDDLE CLASS ASPIRATION INDEX: SCORES IN RANK ORDER
Virginia Beach-Norfolk, VA-NC
Chattanooga, TN-GA
Scranton, PA
Charlotte, NC-SC
Greenville, SC
Milwaukee,WI
Springfield, MA
Knoxville, TN
Houston, TX
Jacksonville, FL
Spokane, WA
New Haven, CT
Toledo, OH
San Jose, CA
Atlanta, GA
Providence, RI-MA
Albuquerque, NM
Oxnard, CA
San Francisco-Oakland, CA
Augusta, GA-SC
Phoenix, AZ
Melbourne, FL
Dayton, OH
Winston-Salem, NC
Sacramento, CA
Youngstown, OH-PA
Sarasota, FL
Greensboro, NC
Tampa-St. Petersburg, FL
Memphis, TN-MS-AR
Detroit, MI
Chicago, IL-IN-WI
Jackson, MS
Cape Coral, FL
Tucson, AZ
Lakeland, FL
Orlando, FL
Daytona Beach, FL
Honolulu, HI
Santa Rosa, CA
New Orleans. LA
San Diego, CA
El Paso, TX
Las Vegas, NV
New York, NY-NJ-PA
Riverside-San Bernardino, CA
Bakersfield, CA
Miami, FL
McAllen, TX
Modesto, CA
Stockton, CA
Los Angeles, CA
Fresno, CA
0.562
0.504
0.460
0.527
0.440
0.642
0.568
0.439
0.504
0.501
0.434
0.593
0.507
0.935
0.571
0.639
0.408
0.720
0.832
0.444
0.417
0.361
0.453
0.402
0.515
0.380
0.391
0.384
0.320
0.425
0.544
0.572
0.349
0.316
0.291
0.225
0.308
0.198
0.596
0.440
0.385
0.387
0.099
0.337
0.480
0.284
0.207
0.190
0.000
0.267
0.290
0.265
0.118
0.609
0.593
0.575
0.586
0.605
0.508
0.546
0.626
0.725
0.596
0.596
0.504
0.432
0.477
0.497
0.469
0.607
0.465
0.548
0.561
0.596
0.498
0.402
0.487
0.475
0.426
0.481
0.433
0.567
0.454
0.383
0.476
0.543
0.509
0.569
0.552
0.507
0.479
0.613
0.413
0.499
0.501
0.636
0.222
0.480
0.284
0.207
0.190
0.000
0.267
0.290
0.265
0.118
0.738
0.806
0.867
0.765
0.832
0.725
0.759
0.801
0.636
0.760
0.800
0.727
0.865
0.388
0.731
0.688
0.767
0.577
0.366
0.733
0.723
0.858
0.832
0.783
0.679
0.856
0.784
0.831
0.744
0.751
0.702
0.580
0.734
0.798
0.730
0.767
0.678
0.797
0.258
0.601
0.562
0.522
0.613
0.733
0.427
0.414
0.360
0.476
0.555
0.191
0.201
0.356
0.188
54
55
56
57
58
59
60
61
62
63
64
65
66
67
68
69
70
71
72
73
74
75
76
77
78
79
80
81
82
83
84
85
86
87
88
89
90
91
92
93
94
95
96
97
98
99
100
101
102
103
104
105
106
0.810
0.785
0.775
0.770
0.765
0.762
0.758
0.750
0.747
0.737
0.730
0.719
0.716
0.714
0.713
0.710
0.706
0.704
0.703
0.702
0.695
0.694
0.693
0.691
0.691
0.690
0.686
0.683
0.681
0.678
0.677
0.676
0.673
0.672
0.671
0.663
0.663
0.662
0.660
0.659
0.658
0.658
0.652
0.646
0.646
0.645
0.643
0.640
0.639
0.639
0.639
0.638
0.637
Metropolitan AreaCOLI Adjusted Median Family Income
Economic Opportunity
Family Friendliness
Overall ScoreRank
BEST CITIES FOR PEOPLE 59

US Metropolitan Areas over 1,000,000 Population, Draft at 2015.09.25US Metropolitan Areas over 1,000,000 Population, Draft at 2015.09.25
Table A.1MIDDLE CLASS ASPIRATION INDEX: SCORES IN RANK ORDER
Des Moines, IA
Madison, WI
Albany, NY
Austin, TX
Raleigh, NC
Minneapolis-St. Paul, MN-WI
Hartfort, CT
Washington, DC-VA-MD-WV
Omaha, NE-IA
Ogden, UT
Salt Lake City, UT
Kansas City, MO-KS
Pittsburg, PA
Durham, NC
Colorado Springs, CO
Harrisburg, PA
Fayetteville, AR-MO
Baltimore, MD
Boston, MA-NH
Richmond, VA
Bridgeport-Stamford, CT
Provo, UT
Seattle, WA
Denver, CO
Oklahoma City, OK
St. Louis, MO-IL
Akron, OH
Syracuse, NY
Portland, ME
Wichita, KS
Louisville, KY-IN
Charleston, SC
Tulsa, OK
Cincinnati, OH-KY-IN
Columbus, OH
Baton Rouge, LA
0.806
0.833
0.847
0.756
0.786
0.851
0.912
1.000
0.707
0.684
0.626
0.725
0.669
0.685
0.603
0.677
0.518
0.775
0.890
0.675
0.929
0.546
0.768
0.703
0.532
0.739
0.675
0.615
0.628
0.585
0.629
0.582
0.499
0.693
0.646
0.534
0.517
0.656
0.524
0.580
0.566
0.596
0.559
0.463
0.543
0.567
0.475
0.558
0.562
0.657
0.619
0.679
0.577
1
2
3
4
5
6
7
8
9
10
11
12
13
14
15
16
17
18
19
20
21
22
23
24
25
26
27
28
29
30
31
32
33
34
35
36
37
38
39
40
41
42
43
44
45
46
47
48
49
50
51
52
53
0.775
0.712
0.684
0.796
0.701
0.684
0.600
0.678
0.713
0.755
0.844
0.624
0.702
0.661
0.682
0.644
0.720
0.678
0.642
0.661
0.572
0.827
0.685
0.670
0.748
0.576
0.563
0.573
0.662
0.599
0.604
0.702
0.707
0.545
0.554
0.751
0.627
0.548
0.656
0.644
0.610
0.555
0.573
0.651
0.637
0.583
0.731
0.580
0.663
0.593
0.587
0.585
0.588
0.848
0.808
0.796
0.758
0.808
0.751
0.762
0.573
0.821
0.774
0.720
0.808
0.777
0.797
0.856
0.808
0.880
0.658
0.578
0.770
0.584
0.710
0.625
0.699
0.792
0.754
0.820
0.860
0.753
0.850
0.799
0.746
0.813
0.778
0.812
0.703
0.844
0.783
0.802
0.753
0.798
0.822
0.826
0.824
0.757
0.786
0.723
0.782
0.693
0.668
0.711
0.651
0.745
0.810
0.785
0.775
0.770
0.765
0.762
0.758
0.750
0.747
0.737
0.730
0.719
0.716
0.714
0.713
0.710
0.706
0.704
0.703
0.702
0.695
0.694
0.693
0.691
0.691
0.690
0.686
0.683
0.681
0.678
0.677
0.676
0.673
0.672
0.671
0.663
0.663
0.662
0.660
0.659
0.658
0.658
0.652
0.646
0.646
0.645
0.643
0.640
0.639
0.639
0.639
0.638
0.637
Columbia, SC
Cleveland, OH
Little Rock, AR
Nashville, TN
Lancaster, PA
Buffalo, NY
Rochester, NY
Boise, ID
Birmingham, AL
Grand Rapids, MI
San Antonio, TX
Indianapolis. IN
Dallas-Fort Worth, TX
Philadelphia, PA-NJ-DE-MD
Portland, OR-WA
Worcester, MA-CT
Allentown, PA-NJ
Metropolitan AreaCOLI Adjusted Median Family Income
Economic Opportunity
Family Friendliness
Overall ScoreRank
Table A.2MIDDLE CLASS ASPIRATION INDEX: SCORES IN RANK ORDER
Virginia Beach-Norfolk, VA-NC
Chattanooga, TN-GA
Scranton, PA
Charlotte, NC-SC
Greenville, SC
Milwaukee,WI
Springfield, MA
Knoxville, TN
Houston, TX
Jacksonville, FL
Spokane, WA
New Haven, CT
Toledo, OH
San Jose, CA
Atlanta, GA
Providence, RI-MA
Albuquerque, NM
Oxnard, CA
San Francisco-Oakland, CA
Augusta, GA-SC
Phoenix, AZ
Melbourne, FL
Dayton, OH
Winston-Salem, NC
Sacramento, CA
Youngstown, OH-PA
Sarasota, FL
Greensboro, NC
Tampa-St. Petersburg, FL
Memphis, TN-MS-AR
Detroit, MI
Chicago, IL-IN-WI
Jackson, MS
Cape Coral, FL
Tucson, AZ
Lakeland, FL
Orlando, FL
Daytona Beach, FL
Honolulu, HI
Santa Rosa, CA
New Orleans. LA
San Diego, CA
El Paso, TX
Las Vegas, NV
New York, NY-NJ-PA
Riverside-San Bernardino, CA
Bakersfield, CA
Miami, FL
McAllen, TX
Modesto, CA
Stockton, CA
Los Angeles, CA
Fresno, CA
0.562
0.504
0.460
0.527
0.440
0.642
0.568
0.439
0.504
0.501
0.434
0.593
0.507
0.935
0.571
0.639
0.408
0.720
0.832
0.444
0.417
0.361
0.453
0.402
0.515
0.380
0.391
0.384
0.320
0.425
0.544
0.572
0.349
0.316
0.291
0.225
0.308
0.198
0.596
0.440
0.385
0.387
0.099
0.337
0.480
0.284
0.207
0.190
0.000
0.267
0.290
0.265
0.118
0.609
0.593
0.575
0.586
0.605
0.508
0.546
0.626
0.725
0.596
0.596
0.504
0.432
0.477
0.497
0.469
0.607
0.465
0.548
0.561
0.596
0.498
0.402
0.487
0.475
0.426
0.481
0.433
0.567
0.454
0.383
0.476
0.543
0.509
0.569
0.552
0.507
0.479
0.613
0.413
0.499
0.501
0.636
0.222
0.480
0.284
0.207
0.190
0.000
0.267
0.290
0.265
0.118
0.738
0.806
0.867
0.765
0.832
0.725
0.759
0.801
0.636
0.760
0.800
0.727
0.865
0.388
0.731
0.688
0.767
0.577
0.366
0.733
0.723
0.858
0.832
0.783
0.679
0.856
0.784
0.831
0.744
0.751
0.702
0.580
0.734
0.798
0.730
0.767
0.678
0.797
0.258
0.601
0.562
0.522
0.613
0.733
0.427
0.414
0.360
0.476
0.555
0.191
0.201
0.356
0.188
54
55
56
57
58
59
60
61
62
63
64
65
66
67
68
69
70
71
72
73
74
75
76
77
78
79
80
81
82
83
84
85
86
87
88
89
90
91
92
93
94
95
96
97
98
99
100
101
102
103
104
105
106
0.810
0.785
0.775
0.770
0.765
0.762
0.758
0.750
0.747
0.737
0.730
0.719
0.716
0.714
0.713
0.710
0.706
0.704
0.703
0.702
0.695
0.694
0.693
0.691
0.691
0.690
0.686
0.683
0.681
0.678
0.677
0.676
0.673
0.672
0.671
0.663
0.663
0.662
0.660
0.659
0.658
0.658
0.652
0.646
0.646
0.645
0.643
0.640
0.639
0.639
0.639
0.638
0.637
Metropolitan AreaCOLI Adjusted Median Family Income
Economic Opportunity
Family Friendliness
Overall ScoreRank
60 CHAPMAN UNIVERSITY • CENTER FOR DEMOGRAPHICS AND POLICY

US Metropolitan Areas over 1,000,000 Population, Draft at 2015.09.25 US Metropolitan Areas over 1,000,000 Population, Draft at 2015.09.25US Metropolitan Areas over 1,000,000 Population, Draft at 2015.09.25
Table B.1MIDDLE CLASS ASPIRATION INDEX: ALPHABETICAL SCORES
Akron, OH
Albany, NY
Albuquerque, NM
Allentown, PA-NJ
Atlanta, GA
Auqusta, GA-SC
Austin, TX
Bakersfield, CA
Baltimore, MD
Baton Rouge, LA
Birmingham, AL
Boise. ID
Boston, MA-NH
Bridgeport-Stamford, CT
Buffalo, NY
Cape Coral, FL
Charleston, SC
Charlotte, NC-SC
Chattanooga, TN-GA
Chicago, IL-IN-WI
Cincinnati, OH-KY-IN
Cleveland, OH
Colorado Springs, CO
Columbia, SC
Columbus, OH
Dallas-Fort Worth, TX
Dayton, OH
Daytona Beach, FL
Denver, CO
Des Moines, IA
Detroit, MI
Durham, NC
El Paso, TX
Fayetteville, AR-MO
Fresno, CA
Grand Rapids, MI
Greensboro, NC
Greenville, SC
Harrisburg, PA
Hartford, CT
Houston, TX
Indianapolis, IN
Jackson, MS
Jacksonville, FL
Kansas City, MO-KS
Knoxville, TN
Lakeland, FL
Lancaster, PA
Las Vegas, NV
Little Rock, AR
Los Angeles, CA
Louisville, KY-IN
Madison, WI
0.675
0.847
0.408
0.577
0.571
0.444
0.756
0.207
0.775
0.534
0.543
0.463
0.890
0.929
0.596
0.316
0.582
0.527
0.504
0.572
0.693
0.656
0.603
0.517
0.646
0.562
0.453
0.198
0.703
0.806
0.544
0.685
0.099
0.518
0.118
0.567
0.384
0.440
0.677
0.912
0.504
0.558
0.349
0.501
0.725
0.439
0.225
0.566
0.337
0.524
0.265
0.629
0.833
27
3
70
53
68
73
4
100
18
36
45
44
19
21
42
87
32
57
55
85
34
38
15
37
35
49
76
91
24
1
84
14
96
17
106
46
81
58
16
7
62
48
86
63
12
61
89
41
97
39
105
31
2
0.563
0.684
0.607
0.588
0.497
0.561
0.796
0.360
0.678
0.751
0.637
0.651
0.642
0.572
0.555
0.509
0.702
0.586
0.593
0.476
0.545
0.548
0.682
0.627
0.554
0.663
0.402
0.479
0.670
0.775
0.383
0.661
0.636
0.720
0.188
0.583
0.433
0.605
0.644
0.600
0.725
0.580
0.543
0.596
0.624
0.626
0.552
0.610
0.222
0.656
0.356
0.604
0.712
0.820
0.796
0.767
0.745
0.731
0.733
0.758
0.634
0.658
0.703
0.757
0.824
0.578
0.584
0.822
0.798
0.746
0.765
0.806
0.580
0.778
0.783
0.856
0.844
0.812
0.693
0.832
0.797
0.699
0.848
0.702
0.797
0.613
0.880
0.617
0.786
0.831
0.832
0.808
0.762
0.636
0.782
0.734
0.760
0.808
0.801
0.767
0.798
0.733
0.802
0.316
0.799
0.808
0.686
0.775
0.594
0.637
0.600
0.580
0.770
0.400
0.704
0.663
0.646
0.646
0.703
0.695
0.658
0.541
0.676
0.626
0.634
0.543
0.672
0.662
0.713
0.663
0.671
0.639
0.562
0.491
0.691
0.810
0.543
0.714
0.449
0.706
0.308
0.645
0.549
0.625
0.710
0.758
0.621
0.640
0.542
0.619
0.719
0.622
0.515
0.658
0.431
0.660
0.312
0.677
0.785
Metropolitan AreaCOLI Adjusted Median Family Income
Economic Opportunity
Family Friendliness
Overall ScoreRank
Table B.2MIDDLE CLASS ASPIRATION INDEX: ALPHABETICAL SCORES
McAllen, TX
Memphis, TN-MS-AR
Miami, FL
Milwaukee, WI
Minneapolis-St. Paul, MN-WI
Modesto, CA
Nashville, TN
New Haven, CT
New Orleans, LA
New York, NY-NJ-PA
Sarasota, Fl
Ogden, UT
Oklahoma City, OK
Omaha, NE-IA
Orlando, FL
Oxnard, CA
Melbourne, FL
Philadelphia, PA-NJ-DE-MD
Phoenix, AZ
Pittsburgh, PA
Portland, ME
Portland, OR-WA
Providence, RI-MA
Provo, UT
Raleigh, NC
Richmond, VA
Riverside-San Bernadino, CA
Rochester, NY
Sacramento, CA
St. Louis, MO-IL
Salt Lake City, UT
San Antonio, TX
San Diego, CA
San Fransisco-Oakland, CA
San Jose, CA
Santa Rosa, CA
Scranton, PA
Seattle, WA
Spokane, WA
Springfield, MA
Stockton, CA
Syracuse, NY
Tampa-St. Petersburg, FL
Toledo, OH
Tucson, AZ
Tulsa, OK
Honolulu, HI
Virginia Beach-Norfolk, VA-NC
Washington, DC-VA-MD-WV
Wichita, KS
Winston-Salem, NC
Worcester, MA-CT
Youngstown, OH-PA
0.000
0.425
0.190
0.642
0.851
0.267
0.580
0.593
0.385
0.480
0.391
0.684
0.532
0.707
0.308
0.720
0.361
0.657
0.417
0.669
0.628
0.619
0.639
0.546
0.786
0.675
0.284
0.559
0.515
0.739
0.626
0.475
0.387
0.832
0.935
0.440
0.460
0.768
0.434
0.568
0.290
0.615
0.320
0.507
0.291
0.499
0.596
0.562
1.000
0.585
0.402
0.679
0.380
0.555
0.454
0.476
0.508
0.684
0.191
0.644
0.504
0.499
0.427
0.481
0.755
0.748
0.713
0.507
0.465
0.498
0.593
0.596
0.702
0.662
0.587
0.469
0.827
0.701
0.661
0.414
0.573
0.475
0.576
0.844
0.731
0.501
0.548
0.477
0.413
0.575
0.685
0.596
0.546
0.201
0.573
0.567
0.432
0.569
0.707
0.613
0.609
0.678
0.599
0.487
0.585
0.426
0.596
0.751
0.529
0.725
0.751
0.584
0.753
0.727
0.562
0.383
0.784
0.774
0.792
0.821
0.678
0.577
0.858
0.668
0.723
0.777
0.753
0.711
0.688
0.710
0.808
0.770
0.526
0.826
0.679
0.754
0.720
0.723
0.522
0.366
0.388
0.601
0.867
0.625
0.800
0.759
0.496
0.860
0.744
0.865
0.730
0.813
0.258
0.738
0.573
0.850
0.783
0.651
0.856
102
83
101
59
6
103
40
65
94
98
80
10
25
9
90
71
75
50
74
13
29
51
69
22
5
20
99
43
078
26
11
47
95
72
67
93
56
23
64
60
104
28
82
66
88
33
92
54
8
30
77
52
79
0.384
0.543
0.398
0.625
0.762
0.348
0.659
0.608
0.482
0.430
0.552
0.737
0.691
0.747
0.498
0.587
0.573
0.639
0.579
0.716
0.681
0.639
0.598
0.694
0.765
0.702
0.408
0.652
0.556
0.690
0.730
0.643
0.470
0.582
0.600
0.485
0.634
0.693
0.610
0.624
0.329
0.683
0.544
0.601
0.530
0.673
0.489
0.636
0.750
0.678
0.558
0.638
0.554
Metropolitan AreaCOLI Adjusted Median Family Income
Economic Opportunity
Family Friendliness
Overall ScoreRank
BEST CITIES FOR PEOPLE 61

US Metropolitan Areas over 1,000,000 Population, Draft at 2015.09.25 US Metropolitan Areas over 1,000,000 Population, Draft at 2015.09.25US Metropolitan Areas over 1,000,000 Population, Draft at 2015.09.25
Table B.1MIDDLE CLASS ASPIRATION INDEX: ALPHABETICAL SCORES
Akron, OH
Albany, NY
Albuquerque, NM
Allentown, PA-NJ
Atlanta, GA
Auqusta, GA-SC
Austin, TX
Bakersfield, CA
Baltimore, MD
Baton Rouge, LA
Birmingham, AL
Boise. ID
Boston, MA-NH
Bridgeport-Stamford, CT
Buffalo, NY
Cape Coral, FL
Charleston, SC
Charlotte, NC-SC
Chattanooga, TN-GA
Chicago, IL-IN-WI
Cincinnati, OH-KY-IN
Cleveland, OH
Colorado Springs, CO
Columbia, SC
Columbus, OH
Dallas-Fort Worth, TX
Dayton, OH
Daytona Beach, FL
Denver, CO
Des Moines, IA
Detroit, MI
Durham, NC
El Paso, TX
Fayetteville, AR-MO
Fresno, CA
Grand Rapids, MI
Greensboro, NC
Greenville, SC
Harrisburg, PA
Hartford, CT
Houston, TX
Indianapolis, IN
Jackson, MS
Jacksonville, FL
Kansas City, MO-KS
Knoxville, TN
Lakeland, FL
Lancaster, PA
Las Vegas, NV
Little Rock, AR
Los Angeles, CA
Louisville, KY-IN
Madison, WI
0.675
0.847
0.408
0.577
0.571
0.444
0.756
0.207
0.775
0.534
0.543
0.463
0.890
0.929
0.596
0.316
0.582
0.527
0.504
0.572
0.693
0.656
0.603
0.517
0.646
0.562
0.453
0.198
0.703
0.806
0.544
0.685
0.099
0.518
0.118
0.567
0.384
0.440
0.677
0.912
0.504
0.558
0.349
0.501
0.725
0.439
0.225
0.566
0.337
0.524
0.265
0.629
0.833
27
3
70
53
68
73
4
100
18
36
45
44
19
21
42
87
32
57
55
85
34
38
15
37
35
49
76
91
24
1
84
14
96
17
106
46
81
58
16
7
62
48
86
63
12
61
89
41
97
39
105
31
2
0.563
0.684
0.607
0.588
0.497
0.561
0.796
0.360
0.678
0.751
0.637
0.651
0.642
0.572
0.555
0.509
0.702
0.586
0.593
0.476
0.545
0.548
0.682
0.627
0.554
0.663
0.402
0.479
0.670
0.775
0.383
0.661
0.636
0.720
0.188
0.583
0.433
0.605
0.644
0.600
0.725
0.580
0.543
0.596
0.624
0.626
0.552
0.610
0.222
0.656
0.356
0.604
0.712
0.820
0.796
0.767
0.745
0.731
0.733
0.758
0.634
0.658
0.703
0.757
0.824
0.578
0.584
0.822
0.798
0.746
0.765
0.806
0.580
0.778
0.783
0.856
0.844
0.812
0.693
0.832
0.797
0.699
0.848
0.702
0.797
0.613
0.880
0.617
0.786
0.831
0.832
0.808
0.762
0.636
0.782
0.734
0.760
0.808
0.801
0.767
0.798
0.733
0.802
0.316
0.799
0.808
0.686
0.775
0.594
0.637
0.600
0.580
0.770
0.400
0.704
0.663
0.646
0.646
0.703
0.695
0.658
0.541
0.676
0.626
0.634
0.543
0.672
0.662
0.713
0.663
0.671
0.639
0.562
0.491
0.691
0.810
0.543
0.714
0.449
0.706
0.308
0.645
0.549
0.625
0.710
0.758
0.621
0.640
0.542
0.619
0.719
0.622
0.515
0.658
0.431
0.660
0.312
0.677
0.785
Metropolitan AreaCOLI Adjusted Median Family Income
Economic Opportunity
Family Friendliness
Overall ScoreRank
Table B.2MIDDLE CLASS ASPIRATION INDEX: ALPHABETICAL SCORES
McAllen, TX
Memphis, TN-MS-AR
Miami, FL
Milwaukee, WI
Minneapolis-St. Paul, MN-WI
Modesto, CA
Nashville, TN
New Haven, CT
New Orleans, LA
New York, NY-NJ-PA
Sarasota, Fl
Ogden, UT
Oklahoma City, OK
Omaha, NE-IA
Orlando, FL
Oxnard, CA
Melbourne, FL
Philadelphia, PA-NJ-DE-MD
Phoenix, AZ
Pittsburgh, PA
Portland, ME
Portland, OR-WA
Providence, RI-MA
Provo, UT
Raleigh, NC
Richmond, VA
Riverside-San Bernadino, CA
Rochester, NY
Sacramento, CA
St. Louis, MO-IL
Salt Lake City, UT
San Antonio, TX
San Diego, CA
San Fransisco-Oakland, CA
San Jose, CA
Santa Rosa, CA
Scranton, PA
Seattle, WA
Spokane, WA
Springfield, MA
Stockton, CA
Syracuse, NY
Tampa-St. Petersburg, FL
Toledo, OH
Tucson, AZ
Tulsa, OK
Honolulu, HI
Virginia Beach-Norfolk, VA-NC
Washington, DC-VA-MD-WV
Wichita, KS
Winston-Salem, NC
Worcester, MA-CT
Youngstown, OH-PA
0.000
0.425
0.190
0.642
0.851
0.267
0.580
0.593
0.385
0.480
0.391
0.684
0.532
0.707
0.308
0.720
0.361
0.657
0.417
0.669
0.628
0.619
0.639
0.546
0.786
0.675
0.284
0.559
0.515
0.739
0.626
0.475
0.387
0.832
0.935
0.440
0.460
0.768
0.434
0.568
0.290
0.615
0.320
0.507
0.291
0.499
0.596
0.562
1.000
0.585
0.402
0.679
0.380
0.555
0.454
0.476
0.508
0.684
0.191
0.644
0.504
0.499
0.427
0.481
0.755
0.748
0.713
0.507
0.465
0.498
0.593
0.596
0.702
0.662
0.587
0.469
0.827
0.701
0.661
0.414
0.573
0.475
0.576
0.844
0.731
0.501
0.548
0.477
0.413
0.575
0.685
0.596
0.546
0.201
0.573
0.567
0.432
0.569
0.707
0.613
0.609
0.678
0.599
0.487
0.585
0.426
0.596
0.751
0.529
0.725
0.751
0.584
0.753
0.727
0.562
0.383
0.784
0.774
0.792
0.821
0.678
0.577
0.858
0.668
0.723
0.777
0.753
0.711
0.688
0.710
0.808
0.770
0.526
0.826
0.679
0.754
0.720
0.723
0.522
0.366
0.388
0.601
0.867
0.625
0.800
0.759
0.496
0.860
0.744
0.865
0.730
0.813
0.258
0.738
0.573
0.850
0.783
0.651
0.856
102
83
101
59
6
103
40
65
94
98
80
10
25
9
90
71
75
50
74
13
29
51
69
22
5
20
99
43
078
26
11
47
95
72
67
93
56
23
64
60
104
28
82
66
88
33
92
54
8
30
77
52
79
0.384
0.543
0.398
0.625
0.762
0.348
0.659
0.608
0.482
0.430
0.552
0.737
0.691
0.747
0.498
0.587
0.573
0.639
0.579
0.716
0.681
0.639
0.598
0.694
0.765
0.702
0.408
0.652
0.556
0.690
0.730
0.643
0.470
0.582
0.600
0.485
0.634
0.693
0.610
0.624
0.329
0.683
0.544
0.601
0.530
0.673
0.489
0.636
0.750
0.678
0.558
0.638
0.554
Metropolitan AreaCOLI Adjusted Median Family Income
Economic Opportunity
Family Friendliness
Overall ScoreRank
62 CHAPMAN UNIVERSITY • CENTER FOR DEMOGRAPHICS AND POLICY

US Metropolitan Areas over 1,000,000 Population, Draft at 2015.09.25
Akron, OH
Albany, NY
Albuquerque, NM
Allentown, PA-NJ
Atlanta, GA
Auqusta, GA-SC
Austin, TX
Bakersfield, CA
Baltimore, MD
Baton Rouge, LA
Birmingham, AL
Boise. ID
Boston, MA-NH
Bridgeport-Stamford, CT
Buffalo, NY
Cape Coral, FL
Charleston, SC
Charlotte, NC-SC
Chattanooga, TN-GA
Chicago, IL-IN-WI
Cincinnati, OH-KY-IN
Cleveland, OH
Colorado Springs, CO
Columbia, SC
Columbus, OH
Dallas-Fort Worth, TX
Dayton, OH
Daytona Beach, FL
Denver, CO
Des Moines, IA
Detroit, MI
Durham, NC
El Paso, TX
Fayetteville, AR-MO
Fresno, CA
Grand Rapids, MI
Greensboro, NC
Greenville, SC
Harrisburg, PA
Hartford, CT
Houston, TX
Indianapolis, IN
Jackson, MS
Jacksonville, FL
Kansas City, MO-KS
Knoxville, TN
Lakeland, FL
Lancaster, PA
Las Vegas, NV
Little Rock, AR
Los Angeles, CA
Louisville, KY-IN
Madison, WI
25
7
82
45
47
75
14
101
12
58
57
72
5
3
40
93
43
60
66
46
20
29
38
63
30
52
74
102
19
10
56
21
105
62
104
49
87
77
24
4
67
54
90
68
16
78
100
50
91
61
99
33
8
27
3
70
53
68
73
4
100
18
36
45
44
19
21
42
87
32
57
55
85
34
38
15
37
35
49
76
91
24
1
84
14
96
17
106
46
81
58
16
7
62
48
86
63
12
61
89
41
97
39
105
31
2
64
19
41
51
82
65
3
101
21
6
33
29
32
61
67
75
15
53
50
87
73
71
20
35
68
24
99
85
23
4
100
26
34
10
106
55
93
42
30
44
9
56
74
48
37
36
69
39
103
28
102
43
12
18
34
46
59
65
63
51
85
82
74
52
15
94
92
16
31
58
47
25
93
41
39
7
10
20
77
12
33
76
9
75
32
88
1
87
36
13
11
22
48
84
40
62
49
23
27
45
30
64
26
105
29
21
27
3
70
53
68
73
4
100
18
36
45
44
19
21
42
87
32
57
55
85
34
38
15
37
35
49
76
91
24
1
84
14
96
17
106
46
81
58
16
7
62
48
86
63
12
61
89
41
97
39
105
31
2
Metropolitan AreaCOLI Adjusted Median Family Income
Economic Opportunity
Family Friendliness
Overall ScoreRank
McAllen, TX
Memphis, TN-MS-AR
Miami, FL
Milwaukee, WI
Minneapolis-St. Paul, MN-WI
Modesto, CA
Nashville, TN
New Haven, CT
New Orleans, LA
New York, NY-NJ-PA
Sarasota, Fl
Ogden, UT
Oklahoma City, OK
Omaha, NE-IA
Orlando, FL
Oxnard, CA
Melbourne, FL
Philadelphia, PA-NJ-DE-MD
Phoenix, AZ
Pittsburgh, PA
Portland, ME
Portland, OR-WA
Providence, RI-MA
Provo, UT
Raleigh, NC
Richmond, VA
Riverside-San Bernadino, CA
Rochester, NY
Sacramento, CA
St. Louis, MO-IL
Salt Lake City, UT
San Antonio, TX
San Diego, CA
San Fransisco-Oakland, CA
San Jose, CA
Santa Rosa, CA
Scranton, PA
Seattle, WA
Spokane, WA
Springfield, MA
Stockton, CA
Syracuse, NY
Tampa-St. Petersburg, FL
Toledo, OH
Tucson, AZ
Tulsa, OK
Honolulu, HI
Virginia Beach-Norfolk, VA-NC
Washington, DC-VA-MD-WV
Wichita, KS
Winston-Salem, NC
Worcester, MA-CT
Youngstown, OH-PA
106
80
103
31
6
98
44
41
86
70
84
22
59
18
94
17
89
28
81
27
34
36
32
55
11
26
97
53
64
15
35
71
85
9
2
76
73
13
79
48
96
37
92
65
95
69
39
51
1
42
83
23
88
66
92
88
76
18
105
31
78
80
95
84
5
7
11
77
91
81
49
46
14
25
52
90
2
16
27
97
60
89
57
1
8
79
70
86
98
58
17
47
72
104
59
63
94
62
13
38
40
22
45
83
54
96
90
57
98
68
56
91
55
67
97
103
37
43
35
17
80
95
5
81
70
42
54
72
78
73
24
44
99
14
79
53
71
69
100
104
102
89
2
86
28
50
101
4
60
3
66
19
106
61
96
8
38
83
6
102
83
101
59
6
103
40
65
94
98
80
10
25
9
90
71
75
50
74
13
29
51
69
22
5
20
99
43
078
26
11
47
95
72
67
93
56
23
64
60
104
28
82
66
88
33
92
54
8
30
77
52
79
102
83
101
59
6
103
40
65
94
98
80
10
25
9
90
71
75
50
74
13
29
51
69
22
5
20
99
43
78
26
11
47
95
72
67
93
56
23
64
60
104
28
82
66
88
33
92
54
8
30
77
52
79
Metropolitan AreaCOLI Adjusted Median Family Income
Economic Opportunity
Family Friendliness
Overall ScoreRank
US Metropolitan Areas over 1,000,000 Population, Draft at 2015.09.25US Metropolitan Areas over 1,000,000 Population, Draft at 2015.09.25
Table C.1MIDDLE CLASS ASPIRATION INDEX: ALPHABETICAL RANK Table C.2MIDDLE CLASS ASPIRATION INDEX: ALPHABETICAL RANK
BEST CITIES FOR PEOPLE 63
US Metropolitan Areas over 1,000,000 Population, Draft at 2015.09.25
Akron, OH
Albany, NY
Albuquerque, NM
Allentown, PA-NJ
Atlanta, GA
Auqusta, GA-SC
Austin, TX
Bakersfield, CA
Baltimore, MD
Baton Rouge, LA
Birmingham, AL
Boise. ID
Boston, MA-NH
Bridgeport-Stamford, CT
Buffalo, NY
Cape Coral, FL
Charleston, SC
Charlotte, NC-SC
Chattanooga, TN-GA
Chicago, IL-IN-WI
Cincinnati, OH-KY-IN
Cleveland, OH
Colorado Springs, CO
Columbia, SC
Columbus, OH
Dallas-Fort Worth, TX
Dayton, OH
Daytona Beach, FL
Denver, CO
Des Moines, IA
Detroit, MI
Durham, NC
El Paso, TX
Fayetteville, AR-MO
Fresno, CA
Grand Rapids, MI
Greensboro, NC
Greenville, SC
Harrisburg, PA
Hartford, CT
Houston, TX
Indianapolis, IN
Jackson, MS
Jacksonville, FL
Kansas City, MO-KS
Knoxville, TN
Lakeland, FL
Lancaster, PA
Las Vegas, NV
Little Rock, AR
Los Angeles, CA
Louisville, KY-IN
Madison, WI
25
7
82
45
47
75
14
101
12
58
57
72
5
3
40
93
43
60
66
46
20
29
38
63
30
52
74
102
19
10
56
21
105
62
104
49
87
77
24
4
67
54
90
68
16
78
100
50
91
61
99
33
8
27
3
70
53
68
73
4
100
18
36
45
44
19
21
42
87
32
57
55
85
34
38
15
37
35
49
76
91
24
1
84
14
96
17
106
46
81
58
16
7
62
48
86
63
12
61
89
41
97
39
105
31
2
64
19
41
51
82
65
3
101
21
6
33
29
32
61
67
75
15
53
50
87
73
71
20
35
68
24
99
85
23
4
100
26
34
10
106
55
93
42
30
44
9
56
74
48
37
36
69
39
103
28
102
43
12
18
34
46
59
65
63
51
85
82
74
52
15
94
92
16
31
58
47
25
93
41
39
7
10
20
77
12
33
76
9
75
32
88
1
87
36
13
11
22
48
84
40
62
49
23
27
45
30
64
26
105
29
21
27
3
70
53
68
73
4
100
18
36
45
44
19
21
42
87
32
57
55
85
34
38
15
37
35
49
76
91
24
1
84
14
96
17
106
46
81
58
16
7
62
48
86
63
12
61
89
41
97
39
105
31
2
Metropolitan AreaCOLI Adjusted Median Family Income
Economic Opportunity
Family Friendliness
Overall ScoreRank
McAllen, TX
Memphis, TN-MS-AR
Miami, FL
Milwaukee, WI
Minneapolis-St. Paul, MN-WI
Modesto, CA
Nashville, TN
New Haven, CT
New Orleans, LA
New York, NY-NJ-PA
Sarasota, Fl
Ogden, UT
Oklahoma City, OK
Omaha, NE-IA
Orlando, FL
Oxnard, CA
Melbourne, FL
Philadelphia, PA-NJ-DE-MD
Phoenix, AZ
Pittsburgh, PA
Portland, ME
Portland, OR-WA
Providence, RI-MA
Provo, UT
Raleigh, NC
Richmond, VA
Riverside-San Bernadino, CA
Rochester, NY
Sacramento, CA
St. Louis, MO-IL
Salt Lake City, UT
San Antonio, TX
San Diego, CA
San Fransisco-Oakland, CA
San Jose, CA
Santa Rosa, CA
Scranton, PA
Seattle, WA
Spokane, WA
Springfield, MA
Stockton, CA
Syracuse, NY
Tampa-St. Petersburg, FL
Toledo, OH
Tucson, AZ
Tulsa, OK
Honolulu, HI
Virginia Beach-Norfolk, VA-NC
Washington, DC-VA-MD-WV
Wichita, KS
Winston-Salem, NC
Worcester, MA-CT
Youngstown, OH-PA
106
80
103
31
6
98
44
41
86
70
84
22
59
18
94
17
89
28
81
27
34
36
32
55
11
26
97
53
64
15
35
71
85
9
2
76
73
13
79
48
96
37
92
65
95
69
39
51
1
42
83
23
88
66
92
88
76
18
105
31
78
80
95
84
5
7
11
77
91
81
49
46
14
25
52
90
2
16
27
97
60
89
57
1
8
79
70
86
98
58
17
47
72
104
59
63
94
62
13
38
40
22
45
83
54
96
90
57
98
68
56
91
55
67
97
103
37
43
35
17
80
95
5
81
70
42
54
72
78
73
24
44
99
14
79
53
71
69
100
104
102
89
2
86
28
50
101
4
60
3
66
19
106
61
96
8
38
83
6
102
83
101
59
6
103
40
65
94
98
80
10
25
9
90
71
75
50
74
13
29
51
69
22
5
20
99
43
078
26
11
47
95
72
67
93
56
23
64
60
104
28
82
66
88
33
92
54
8
30
77
52
79
102
83
101
59
6
103
40
65
94
98
80
10
25
9
90
71
75
50
74
13
29
51
69
22
5
20
99
43
78
26
11
47
95
72
67
93
56
23
64
60
104
28
82
66
88
33
92
54
8
30
77
52
79
Metropolitan AreaCOLI Adjusted Median Family Income
Economic Opportunity
Family Friendliness
Overall ScoreRank
US Metropolitan Areas over 1,000,000 Population, Draft at 2015.09.25US Metropolitan Areas over 1,000,000 Population, Draft at 2015.09.25
Table C.1MIDDLE CLASS ASPIRATION INDEX: ALPHABETICAL RANK Table C.2MIDDLE CLASS ASPIRATION INDEX: ALPHABETICAL RANK
64 CHAPMAN UNIVERSITY • CENTER FOR DEMOGRAPHICS AND POLICY

US Metropolitan Areas over 1,000,000 Population, Draft at 2015.09.25
Washington, DC-VA-MD-WV
San Jose, CA
Bridgeport-Stamford, CT
Hartford, CT
Boston, MA-NH
Minneapolis-St. Paul, MN-WI
Albany, NY
Madison, WI
San Francisco-Oakland, CA
Des Moines, IA
Raleigh, NC
Baltimore, MD
Seattle, WA
Austin, TX
St. Louis,, MO-IL
Kansas City, MO-KS
Oxnard, CA
Omaha, NE-IA
Denver, CO
Cincinnati, OH-KY-IN
Durham, NC
Ogden, UT
Worcester, MA-CT
Harrisburg, PA
Akron, OH
Richmond, VA
Pittsburgh, PA
Philadelphia, PA-NJ-DE-MD
Cleveland, OH
Columbus, OH
Milwaukee,WI
Providence, RI-MA
Louisville, KY-IN
Portland, ME
Salt Lake City, UT
Portland, OR-WA
Syracuse, NY
Colorado Springs, CO
Honolulu, HI
Buffalo, NY
New Haven CT
Wichita, KS
Charleston, SC
Nashville, TN
Allentown, PA-NJ
Chicago, IL-IN-WI
Atlanta, GA
Springfield, MA
Grand Rapids, MI
Lancaster, PA
Virginia Beach-Norfolk, VA-NC
Dallas-Fort Worth, TX
Rochester, NY
1
2
3
4
5
6
7
8
9
10
11
12
13
14
15
16
17
18
19
20
21
22
23
24
25
26
27
28
29
30
31
32
33
34
35
36
37
38
39
40
41
42
43
44
45
46
47
48
49
50
51
52
53
Indianapolis. IN
Provo, UT
Detroit, MI
Birmingham, AL
Baton Rouge, LA
Oklahoma City, OK
Charlotte, NC-SC
Little Rock, AR
Fayetteville, AR-MO
Columbia, SC
Sacramento, CA
Toledo, OH
Chattanooga, TN-GA
Houston, TX
Jacksonville, FL
Tulsa, OK
New York, NY-NJ-PA
San Antonio, TX
Boise, ID
Scranton, PA
Dayton, OH
Augusta, GA-SC
Santa Rosa, CA
Greenville, SC
Knoxville, TN
Spokane, WA
Memphis, TN-MS-AR
Phoenix, AZ
Albuquerque, NM
Winston-Salem, NC
Sarasota, FL
San Diego, CA
New Orleans. LA
Greensboro, NC
Youngstown, OH-PA
Melbourne, FL
Jackson, MS
Las Vegas, NV
Tampa-St. Petersburg, FL
Cape Coral, FL
Orlando, FL
Tucson, AZ
Stockton, CA
Riverside-San Bernardino, CA
Modesto, CA
Los Angeles, CA
Lakeland, FL
Bakersfield, CA
Daytona Beach, FL
Miami, FL
Fresno, CA
El Paso, TX
McAllen, TX
54
55
56
57
58
59
60
61
62
63
64
65
66
67
68
69
70
71
72
73
74
75
76
77
78
79
80
81
82
83
84
85
86
87
88
89
90
91
92
93
94
95
96
97
98
99
100
101
102
103
104
105
106
Metropolitan AreaCOLI Adjusted Median Family Income Ranking Metropolitan Area
COLI Adjusted Median Family Income Ranking
US Metropolitan Areas over 1,000,000 Population, Draft at 2015.09.25
Table D.1MIDDLE CLASS ASPIRATION INDEX: INCOME RANKING
BEST CITIES FOR PEOPLE 65

1. Fernand Braudel, The Structures of Everyday Life (Berkeley: University of California, 1992), 29.
2. Ibid., 481.
3. Based on net domestic migration of children aged 5-17, 2006-2010, American Community Survey 5 year.
4. “The Evolving Expenditures of U.S. Households,” Townhall Finance, March 26, 2015, http://finance.townhall.com/columnists/politicalcalculations/2015/03/26/the-evolving-expenditures-of-us-households-n1976354/page/full; “Rising Housing Costs Swallow Up Savings Elsewhere,” August 20, 2015, iPR Newswire, http://www.ibloomberg.net/rising-housing-costs-swallow-up-savings-elsewhere/.
5. William Fischel, Regulatory Takings, Law, Economics and Politics (Cambridge, MA: Harvard University Press, 1995).
6. Les Shaver, “The Demise of the Starter Home”, Architect, April 14, 2015, http://www.architectmagazine.com/practice/market-intel/the-demise-of-the-starter-home_s; Megan McArdle, “New Starter Homes Hit a Dead Stop”, Bloomberg View, April 17, 2015, http://www.bloombergview.com/articles/2015-04-17/new-starter-homes-hit-a-dead-stop; Bob Sullivan, “The Death of the Starter Home,” August 11, 2015, http://www.dailyfinance.com/2015/08/11/death-of-start-er-homes/?icid=maing-grid7|main5|dl16|sec1_lnk3%26pLid%3D368585882.
7. “Affordable Housing Stock in U.S. Declines as Home Prices Gain,” Economy Watch, August 12, 2014, http://www.economy-watch.com/news/affordable-housing-stock-in-us-declines-as-home-prices-gain.12-08.html.
8. Janny Scott and Randal C. Archibold, “Across Nation, Housing Costs Rise as Burden,” The New York Times, October 3, 2006, http://www.nytimes.com/2006/10/03/nyregion/03census.html?pagewanted=all&_r=0; Christine Haughney, “New York City Renters Cope With Squeeze,” May 10, 2007, http://www.nytimes.com/2007/05/10/nyregion/10rent.html?n=Top%2FReference%2FTimes%20Topics%2FSubjects%2FH%2FHousing&_r=0.
9. “Building Permits Survey,” United States Census Bureau, http://www.census.gov/construction/bps/.
10. Mike Krieger, “The Oligarch Recovery – Renting in America is Most Expensive Ever,” Zero Hedge, August 14, 2015, http://www.zerohedge.com/news/2015-08-14/oligarch-recovery-renting-america-most-expensive-ever; http://online.wsj.com/documents/print/WSJ_-A002-20150401.pdf (don’t have access)
11. Chelsea Dulaney, “Apartment Rents Rise as Incomes Stagnate,” The Wall Street Journal, July 2, 2014, http://www.wsj.com/articles/apartment-rents-rise-as-incomes-stagnate-1404273662.
12. Krishna Rao, “The Rent is Too Damn High”, Zillow, April 15, 2014, http://www.zillow.com/research/rent-affordabili-ty-2013q4-6681/.
13. David Winzelberg, “NAR: NY rental costs unsustainable,” libn.com, March 16, 2015, http://libn.com/2015/03/16/nar-ny-rental-costs-unsustainable/.
15. Data from US Census Bureau.
16. Laura Kusisto and Kris Hudson, “Renters are Majority in Big U.S. Cities,” The Wall Street Journal, February 8, 2015, http://www.wsj.com/articles/renters-are-majority-in-big-u-s-cities-1423432009?ref=/home-page&c-b=logged0.8001066217238658&cb=logged0.856963346974228.
66 CHAPMAN UNIVERSITY • CENTER FOR DEMOGRAPHICS AND POLICY

17. Evelyn Wang, “Housing Solution: Increase Density in Western Neighborhoods and Fix Transit,” San Francisco Public Press, October 27, 2014, http://sfpublicpress.org/news/2014-10/housing-solution-increase-density-in-western-neighbor-hoods-and-fix-transit; Matthew Yglesias, “The Biggest Thing Blue States Are Screwing Up,” Real Clear Policy, August 29, 2014, http://www.realclearpolicy.com/2014/08/29/the_biggest_thing_blue_states_are_screwing_up_21791.html.
18. Gerard Mildner, “Density at Any Cost,” Portland State University, November 2014, http://www.pdx.edu/realestate/sites/www.pdx.edu.realestate/files/Mildner_UGR_article_3.pdf.
19. Jonathan Fearn, Denise Pinkston, Nicolas Arenson, "The Bay Area Housing Crisis: A Developers Perspective," Submittal to Plan Bay Area.
20. David L.A. Gordon and Mark Janzen, “Suburban Nation? Estimating the Size of Canada’s Suburban Population,” Journal of Architectural and Planning Research 30:3 (Autumn 2013): 197-220, http://japr.homestead.com/Gordon_FinalVer-sion131216.pdf.
21. Wendell Cox, “City Sector Model (2015) Criteria,” Demogaphia, 2015, http://www.demographia.com/db-citysectormodel pdf.
22. Calculated from American Community Survey, 2012.
23. Calculated at the zip code level, using the City Sector Model (see: http://www.demographia.com/db-citysectormodel.pdf)
24. Wendell Cox, “Urban Core Millennials? A Matter of Perspective”, New Geography, March 6, 2015, http://www.newgeog-raphy.com/content/004864-urban-core-millennials-a-matter-perspective;Wendell Cox, “Plan Bay Area: Telling People What to Do”, New Geography, August 28, 2013, www.newgeography.com/content/003899-plan-bay-area-telling-people-what-do; Mike Lanza, “Suburb-Hating is Anti-Child”, Playborhood, August 15, 2013, http://playborhood.com/2013/08/suburb-hating-is-anti-child/.
25. Matthew Yglesias, “The best cure for wage stagnation nobody in Washington is talking about,” Vox Media, November 12, 2014, http://www.vox.com/2014/11/12/7193609/zoning-wage-stagnation?wpisrc=nl-wonkbk&wpmm=1;Peter Nivola, Laws of the Landscape: How Policies Change Cities in Europe and America (Washington, D.C.: Brookings Institution, 1999), 1; Matthew J. Belvedere, “’End of suburbia’ may nearly be upon us: Sam Zell”, CNBC, October 8, 2013, http://www.cnbc.com/id/101095397#; Andres Duany, Elizabeth Plater-Zyberk, and Jeff Speak, Suburban Nation: The Rise of Sprawl and the Decline of the American Dream (New York: North Point Press, 2000), 44-46; City Life, “Micro Units – The Newet Trend in Real Estate”, Cities Journal, April 25, 2015, http://www.citiesjournal.com/micro-units-newest-trend-real-estate/; Karrie Jacobs , “It’s a Small World: The newest trend in urban development? Micro Units”, Metropolis, April 9, 2003, http://www.vancouversun.com/Huge+demand+tiny+rental+units+Vancouver/9628610/story.html.
26. Gan Yu Jia, “3 Bedroom condo unit at 635 sq. feet: A New Low”, The Straits Times, March 21, 2012.
27. Derived from American Community Survey, 2013.
28. Based upon an analysis of American Community Survey (2010) data for 422 counties comprising the largest metropolitan areas in the United States (over 1,000,000 population).
29. Calculated from Census Bureau data.
BEST CITIES FOR PEOPLE 67
30. This actually understates the suburban growth, since many core cities have annexed areas that were formerly suburban.
31. Wendell Cox, “Urban Cores, Core Cities, and Principal Cities”, New Geography, August 1, 2014, http://www.newgeography.com/content/004453-urban-cores-core-cities-and-principal-cities.
32. Becky Nicolaides, “How Hell Moved From the Cities to the Suburbs”, in The New Suburban History, ed. Kevin M. Kruse and Thomas J. Sugre (Chicago: University of Chicago Press, 2006), 87.
33. Pat Garofalo, “Obama: The Days of ‘Building Sprawl Forever’ Are Over,” Think Progress, February 10, 2009, http://thinkprogress.org/economy/2009/02/10/172595/obama-sprawl/; Bruce Frohnen, “Fixing the Suburbs for the Family”. Family Policy, May-June 2000, https://www.heartland.org/sites/all/modules/custom/heartland_migration/files/pdfs/7251.pdf; Charles Marohn, “The Conservative Case Against the Suburbs,” The American Conservative, http://www.theamericanconservative.com/urbs/the-conservative-case-against-the-suburbs/; Nick Schulz, “The Life and Death of Great American Cities,” American Enterprise Institute, May 11, 2012, http://www.aei.org/publication/the-life-and-death-of-great-american-cities/.
34. Duany, et al., 5-9, 137; William Schneider, “The Suburban Century Begins”, The Atlantic, July 1992, http://www.theatlantic.com/past/politics/ecbig/schnsub.htm;
35. James Howard Kunstler, The Long Emergency (New York City: Atlantic Monthly Press, 2005), 19; http://www.democrati-cunderground.com/discuss/duboard.php?az=view_all&address=103x119541 (website is shut down, could not access more info); James Quinn, “As Things Fell Apart, Nobody Paid Much Attention,” Financial Sense, November 19, 2010, http://www.financialsense.com/contributors/james-quinn/as-things-fell-apart-nobody-paid-much-attention.
36. Richard Florida, “Rise and Fall of the House?” Creative Class, April 20, 2007, http://www.creativeclass.com/_v3/cre-ative_class/2007/04/20/rise-and-fall-of-the-house/.
37. Jan K. Brueckner and Ann G. Largey, “Socia Interaction and Urban Sprawl”, Department of Economics, Irvine, October 2006, http://www.economics.uci.edu/files/economics/docs/workingpapers/2006-07/Brueckner-07.pdf.
38. Sommer Mathis, “Overall, Americans in the Suburbs Are Still the Happiest”, CityLab, August 25, 2014, http://www.citylab.com/politics/2014/08/overall-americans-in-the-suburbs-are-still-the-happiest/378964/; David Peterson, “In Twin Cit-ies metro, more young people are moving to the urban core, while suburbs age”, Star Tribune, January 5, 2014, http://www.startribune.com/local/minneapolis/238734151.html; Christopher B. Leinberger, “The Next Slum?”, The Atlantic, March 2008, http://www.theatlantic.com/magazine/archive/2008/03/the-next-slum/306653/,
39. http://www.realtor.org/file/819/download?token=vKf_myg9t612Ubqcdi6txJxk4Zaxof0MUu8fmA0Myv4 (unable to access without sign in)
40. An organization dedicated to higher density urban living.
41. Ed Braddy, “Smart Growth and the New Newspeak”, New Geography, April 4, 2012, http://www.newgeography.com/con-tent/002740-smart-growth-and-the-new-newspeak.
42. Metro, which administers Portland's smart growth land use system.
43. “Residential Preference Study,” DHM Research, May 2014, http://www.oregonmetro.gov/sites/default/files/Residential-PreferenceStudy-FullReport.pdf.
68 CHAPMAN UNIVERSITY • CENTER FOR DEMOGRAPHICS AND POLICY
44. Derived from 2013 FBI crime data. Based on average core municipalities and suburban areas of the 52 major metropolitan areas. Chicago data incomplete and not included. Principal cities that are not core cities are included in the suburban category.
45. Monica Davey and Mitch Smith, “Murder Rates Rising Sharply in Many U.S. Cities,” The New York Times, August 31, 2015, http://www.nytimes.com/2015/09/01/us/murder-rates-rising-sharply-in-many-us-cities.html?_r=0.
46. Jane S. Shaw and Ronald Utt, A Guide to Smart Growth: Shattering Myths, Providing Solutions (Washington, D.C.: Heritage Foundation, 2000), 89.
47. “The Status of Rural Education,” National Center for Education Statistics, May 2013, http://nces.ed.gov/programs/coe/indicator_tla.asp; Sam Dillon, “Large Urban-Suburban Gap Seen in Graduation Rates,” The New York Times, April 22, 2009, http://www.nytimes.com/2009/04/22/education/22dropout.html?_r=0 Suzanne E. Graham and Lauren E. Provost, "Mathematics Achievement Gaps Between Suburban Students and Their Rural and Urban Peers Increase Over Time," The Carey Institute, University of New Hampshire, June 1, 2012, http://scholars.unh.edu/cgi/viewcontent.cgi?ar-ticle=1171&context=carsey; Paul Emrath and Natalia Siniavskaia, "Household Type, Housing Choice, and Commuting Behavior," National Association of Home Builders, December 1, 2009, https://www.nahb.org/en/research/housing-eco-nomics/special-studies/household-type-housing-choice-and-commuting-behavior-2009.aspx; "Urban Schools: The Challenge of Location and Poverty," National Center for Education Statistics, June 1, 1996, http://nces.ed.gov/pubs/web/96184ex.asp.
48. Paul Krugman, “Home Not-So-Sweet-Home”, New York Times, January 23, 2008, http://www.nytimes.com/2008/06/23/opinion/23krugman.html.
49. Richard Florida, “How the Crash Will Reshape America”, The Atlantic, March 2009, http://www.theatlantic.com/magazine/archive/2009/03/how-the-crash-will-reshape-america/307293/?single_page=true.
50. Neil Shah, “Suburbs Regain Their Appeal,” The Wall Street Journal, May 22, 2014, http://www.wsj.com/news/articles/SB20001424052702303749904579576440578771478.
51. Conor Dougherty, “Cities Grow at Suburbs’ Expense During Recession”, The Wall Street Journal, July 1, 2009, http://www.wsj.com/articles/SB124641839713978195; Christopher B. Leinberger, “The Death of the Fringe Suburb”, The New York Times, November 25, 2011, http://www.nytimes.com/2011/11/26/opinion/the-death-of-the-fringe-suburb.html?_r=0; Jed Kolko, “No, Suburbs Aren’t All the Same. The Suburbiest Ones Are Growing Fastest”, The Atlantic, February 5, 2015, http://www.citylab.com/housing/2015/02/no-suburbs-arent-all-the-same-the-suburbiest-ones-are-growing-fast-est/385183/; Emily Badger, “New Census data: Americans are returning to the far-flung suburbs”, The Washington Post, March 26, 2015, http://www.washingtonpost.com/blogs/wonkblog/wp/2015/03/26/new-census-data-americans-are-returning-to-the-far-flung-suburbs/; “Seeding Sprawl”, Wall Street Journal, October 18, 2006.
52. Jed Kolko, “How Suburban Are Big American Cities?”, FiveThirtyEightEconomics, May 21, 2015, http://fivethirtyeight.com/features/how-suburban-are-big-american-cities/.
53. Calculated from US Bureau of the Census data.
54. Jed Kolko, “Even After the Housing Bust, Americans Still Love the Suburbs”, Center for Opportunity Urbanism, October 11, 2012, http://opportunityurbanism.org/2015/01/even-after-the-housing-bust-americans-still-love-the-suburbs/
55. Richard Florida, “The Power of Density,” The Atlantic, September 8, 2010, http://www.theatlantic.com/business/ar-
BEST CITIES FOR PEOPLE 69

chive/2010/09/the-power-of-density/62569/.
56. John G. Clark, Three Generations in Twentieth Century America (Homewood, Illinois: The Dorsey Press, 1982), 499.
57. Wendell Cox, “Dispersion and Concentration in Metropolitan Employment,” New Geography, May 13, 2015, http://www.newgeography.com/content/004921-dispersion-and-concentration-metropolitan-employment.
58. Elizabeth Kneebone, “Job Sprawl Revisited: The Changing Geography of Metropolitan Employment,” Brookings Institution, April 2009, http://www.brookings.edu/~/media/Research/Files/Reports/2009/4/06%20job%20sprawl%20knee-bone/20090406_jobsprawl_kneebone.PDF.
59. “Dispersion and Concentration”; Jean Gottman, The Coming of the Transactional City (College Park: University of Maryland Institute for Urban Studies, 1983), 23, 41.
65. Kim Hjelmgaard, “Where the world’s super-rich send residential prices soaring,” USA Today, June 1, 2015, http://www.usatoday.com/story/news/world/2015/05/31/global-house-prices-global-cities/25507897/; Elizabeth A. Harris, “Why Buy a Condo You Seldom Use? Because You Can,” The New York Times, February 11, 2013, http://www.nytimes.com/2013/02/12/nyregion/paying-top-dollar-for-condos-and-leaving-them-empty.html?_r=0; Louise Story and Stephanie Saul, “Stream of Foreign Wealth Flows to Elite New York Real Estate,” The New York Times, February 7, 2015, http://www.nytimes.com/2015/02/08/nyregion/stream-of-foreign-wealth-flows-to-time-warner-condos.html?_r=0.
66. Author’s analysis of EMSI 2015.2.
67. Joel Kotkin and and Michael Shires, “The Cities Stealing Jobs from Wall Street”, New Geography, June 27, 2014, http://www.newgeography.com/content/004390-the-cities-stealing-jobs-from-wall-street; Susan Fainstein, The City Builders: Property, Politics and Planning in London and New York (London: Blackwell Publishers, 1994), 25.
68. Aaron M. Renn, “The Rise of the Executive Headquarters,” New Geography, April 15, 2014, http://www.newgeography.com/content/004265-the-rise-executive-headquarters.
69. Martha De Lacey, “The REAL Story of Britain’s servant class,” Daily Mail, September 25, 2012, http://www.dailymail.co.uk/femail/article-2207935/Downton-Abbey-servants-New-BBC-series-Servants-The-True-Story-Life-Below-Stairs.html#ixzz3ll6WXcVO.
70. Christian Gonzalez-Rivera, “Low-Wage Jobs, 2012”, Center for an Urban Future, April 2013, http://nycfuture.org/data/info/low-wage-jobs-2012;Patrick McGeehan, “More Earners at Extremes in New York Than in U.S.”, The New York Times, May 20, 2012, http://www.nytimes.com/2012/05/21/nyregion/middle-class-smaller-in-new-york-city-than-nationally-study-finds.html?_r=0.
71. “More Earners at Extremes”; Sam Roberts, “Rich Got Richer and Poor Poorer in N.Y.C., 2011 Data Shows”, The New York Times, September 20, 2012, http://www.nytimes.com/2012/09/20/nyregion/rich-got-richer-and-poor-poorer-in-nyc-2011-data-shows.html?_r=0; C. Zawadi Morris, “New City Council Study Shows NYC’s Middle Class Shrinking Fast”, Bed-Stuy Patch, February 11, 2013, http://bed-stuy.patch.com/articles/new-city-council-study-shows-nyc-s-middle-class-shrinking-fast; Lizzy Ratner, “Boom Town and Bust City: A Tale of Two New Yorks,” The Nation, January 27, 2011, http://www.thenation.com/article/boom-town-and-bust-city-tale-two-new-yorks/.
72. “Kings County, New York”, United States Census Bureau, May 29, 2015, http://quickfacts.census.gov/qfd/states/36/36047.html; “Kings County”; Michael Howard Saul, “New York City Leads Jump in Homeless”, The Wall
70 CHAPMAN UNIVERSITY • CENTER FOR DEMOGRAPHICS AND POLICY
Street Journal, March 4, 2013, http://online.wsj.com/article/SB10001424127887324539404578340731809639210.html?mod=djemalertNEWS; This is clearly true in the United States, where the highest degrees of inequality can be found in its premier global city, New York, as well as that city’s prime competitors for international commerce including Chicago, Los Angeles, and the San Francisco Bay Area. These cities tend to develop an economy based in large part on serving the wealthy; what economist Ajay Kapur calls a “plutonomy” an economy and society driven largely by the very rich. This process has been amplified by the gloal recovery from the Great Recession which has particularly benefited those with inherited wealth, as the returns on capital have surpassed those of labor.
73. Joel Garreau, “Review: The Great Inversion and the Future of the American City”, New Geography, April 23, 2012, http://www.newgeography.com/content/002787-review-the-great-inversion-and-future-american-city; Pete Saunders, “Two Chicagos, Defined”, New Geography, December 12, 2014, http://www.newgeography.com/content/004795-two-chi-cagos-defined; Daniel Kay Hertz, “Watch Chicago’s Middle Class Vanish Before Your Very Eyes”, City Notes, March 31, 2014, http://danielkayhertz.com/2014/03/31/middle-class/.
74. Joe Cortright and Dillon Mahmoudi, “Lost in Place: Why the persistence and spread of concentrated poverty – not gentrification – is our biggest urban challenge.” CityReport, December 2014, http://cityobservatory.org/wp-content/uploads/2014/12/LostinPlace_12.4.pdf.
75. Richard Morrill, “Inequality of the Largest U.S. Metropolitan Areas,” New Geography, September 1, 2013, http://www.newgeography.com/content/003921-inequality-largest-us-metropolitan-areas.
76. Joel Kotkin, “Where Inequality is Worst in the United States,” New Geography, March 21, 2014, http://www.newgeography.com/content/004229-where-inequality-is-worst-in-the-united-states.
77. Aaron M. Renn, “The Rise of the Executive Headquarters”, New Geography, April 15, 2014, http://www.newgeography.com/content/004265-the-rise-executive-headquarters.
78. Wendell Cox, “Beyond Polycentricity: 2000s Job Growth (Continues to) Follow Population,” New Geography, August 22, 2014, http://www.newgeography.com/content/004486-beyond-polycentricity-2000s-job-growth-continues-follow-pop-ulation; William T. Bogart, Don’t Call It Sprawl: Metropolitan Structure in the Twenty-first Century, Cambridge University Press (Cambridge, UK: 2006), 43.
79. Scott Donaldson, “City and Country: Marriage Proposals”, in New Towns and the Suburban Dream, ed. Irving Lewis Allen (Port Washington, NY: Kennikat Press, 1977), 101.
80. Calculated from American Community Survey, 2013 one year.
81. Calculated from Census Bureau County Business Pattern data at the Zip code (ZCTA) level.
82. Derived the CoStar Office Report: National Office Market, Midyear 2012 and Midyear 2015, https://www.costar.com/.
83. Wendell Cox, “Dispersion and Concentration in Metropolitan Employement,” New Geography, May 13, 2015, http://www.newgeography.com/content/004921-dispersion-and-concentration-metropolitan-employment.
84. Dominic Basulto, “The future of innovation belongs to the mega-city”, DailyNews.com, October 28, 2014, http://www.dailynews724.com/local/the-future-of-innovation-belongs-to-the-mega-city-h287221.html.
85. Author’s analysis of EMSI 2015.2 employment data.
BEST CITIES FOR PEOPLE 71

86. Henry Grabar, “The Biggest Problem with San Francisco’s Rent Problems,” Slate, June 22, 2015, http://www.slate.com/articles/business/metropolis/2015/06/san_francisco_rent_crisis_the_solution_isn_t_in_the_city_it_s_in_the_suburbs.html.
87. Wendell Cox, “2010 Major Metropolitan Area & Principal Urban Area (Urbanized Area) Population & Density”, Demographia, http://demographia.com/db-msauza2010.pdf.
88. Joel Kotkin and Mark Schill, “The Valley and the Upstarts: The Cities Creating the Most Tech Jobs”, New Geography, April 15, 2015, http://www.newgeography.com/content/004899-the-valley-and-the-upstarts-the-cities-creating-the-most-tech-jobs.
89. Wendell Cox, “New York, Legacy Cities Dominate Transit Urban Core Gains”, New Geography, June 25, 2014, http://www.newgeography.com/content/004384-new-york-legacy-cities-dominate-transit-urban-core-gains.
90. Amy Morin, “Want To Be Happier? Change Your Commute or Change Your Attitude,” Forbes, December 7, 2014, http://www.forbes.com/sites/amymorin/2014/12/07/want-to-be-happier-change-your-commute-or-change-your-attitude/
91. Aarian Marshall, “NYC’s Long Commutes May Be Forcing Mothers Out of the Workforce,” CityLab, March 19, 2015, http://www.citylab.com/work/2015/03/how-nycs-long-commutes-force-mothers-out-of-the-workforce/388208/.)
92. Alexander von Hoffman, John Felknerm “The Historical Origins and Causes of Urban Decentralization in the United States”, Joint Center for Housing Studies, Harvard University, January 2002
93. By contrast, Manhattan residents, in the most dense environment of the United States have much shorter average com-mutes, at 31 minutes. This, however, is not due to Manhattan's high density as much as it is to Manhattan's distorted jobs-housing balance. There are nearly three times as many jobs as resident workers (a ratio of 3 to 1), a situation that could not be replicated throughout a metropolitan area (labor market), where the ratio must be nearly 1 to 1.
94. Wendell Cox, “Commuting in New York,” New Geography, April 26, 2015, http://www.newgeography.com/con-tent/004967-commuting-new-york.
95. Wendell Cox, “Evaluating Urban Rail,” December 5, 2014, http://www.newgeography.com/content/004789-evaluating-ur-ban-rail.
96. Largely owing to the availability of federal funding, a large number of new rail and exclusive bus way lines have been constructed since 1980 (in the previous recent decades, new lines were built in just a few metropolitan areas, such as Washington and San Francisco).
97. As opposed to the New York metropolitan area.
98. Wendell Cox, “Transit Ridership Increases: No Escape From New York,” New Geography, April 11, 2015, http://www.newgeography.com/content/004895-transit-ridership-increases-no-escape-new-york.
99. http://www.newgeography.com/content/004929-us-work-home-commute-centers 100. Yonah Freemark, “Why Telecommuting Really Matters, in 6 Charts,” CityLab, February 4, 2014, http://www.citylab.com/
commute/2014/02/why-telecommuting-really-matters-6-charts/8227/.
72 CHAPMAN UNIVERSITY • CENTER FOR DEMOGRAPHICS AND POLICY

101. Neema P. ROshania, “A Hot Trend: Home-Based Businesses,” Kiplinger, August 10, 2010, http://www.kiplinger.com/arti-cle/business/T049-C000-S005-a-hot-trend-home-based-businesses.html.
102. Nanette Fondas, “Millennials Say They’ll Relocate for Work-Life Flexibility,” Harvard Business Review, May 7, 2015, https://hbr.org/2015/05/millennials-say-theyll-relocate-for-work-life-flexibility.
103. Frederick L. Pilot, Last Rush Hour: The Decentralization of Knowledge Work in the Twenty-First Century (Portland: Bookbaby, 2015), 4-15.
104. “Pros and Cons”, Global Workplace Analytics, http://globalworkplaceanalytics.com/pros-cons.
105. Alvin Toffler, The Third Wave (New York: William Morrow, 1980), 42-45, 119-145, 195.
106. Sarah Susanka, “The future of homes and housing,” The Christian Science Monitor, January 5, 2005, http://www.csmonitor.com/2005/0105/p14s01-lihc.html.
107. “Bigger home and smaller lots?” Rain City Guide, September 12, 2005, http://raincityguide.com/2005/09/12/bigger-homes-and-smaller-lots/.
108. James Alan Kushner, “Urban Planning and the American Family,” Stetson Law Review, 36 (2006), http://papers.ssrn.com/sol3/papers.cfm?abstract_id=1010221.
109. Appleseed, “The Economy of Greenwich Village: A Profile”, New York University, May 2011, http://www.gvshp.org/_gvshp/preservation/nyu/doc/nyu-report-05-2011.pdf Calculated from American Community Survey, 2012.
110. Terry Nichols Clark, et al., “Amenities Drive Urban Growth: A New Paradigm and Policy Linkages”, in The City as Entertain-ment Machine, ed. Terry Nichols Clark (Amsterdam: Elsevier, 2004), 291-318; Terry Nichols Clark and Ronald Inglehart,
“The New Political Culture” in The New Political Culture, ed. Terry Nichols Clark and Vincent Hoffman-Martinett (Boulder, CO: Westview Press, 1998), 58-59.
111. Wendell Cox, “Exodus of the School Children”, New Geography, December 29, 2014, http://www.newgeography.com/content/004815-exodus-school-children; Joel Kotkin, “The Geography of Aging: Why Millennials are headed to the Suburbs”, December 9, 2013, http://www.newgeography.com/content/004084-the-geography-of-aging-why-millenni-als-are-headed-to-the-suburbs.
112. San Francisco is the core municipality of the San Francisco Bay Area and is home to slightly more than 10 percent of its population, with 800,000 residents.
113. Norimitsu Onishi, “In San Francisco, Coyotes in Parks Are a Concern”, The New York Times, May 14, 2012, http://www.nytimes.com/2012/05/15/us/in-san-francisco-coyotes-in-parks-are-a-concern.html.
114. “San Francisco, California”, City-Data.com, http://www.city-data.com/city/San-Francisco-California.html; Joshua Sabatini, “San Francisco becoming a child-free zone as youth population declines”, The Examiner, March 23, 2011, http://www.sfexaminer.com/sanfrancisco/san-francisco-becoming-a-child-free-zone-as-youth-population-declines/Content?oid=2171813; Rachel Gordon, “Many with children planning to leave city/Survey finds them upset with safety, housing, schools”, SFGATE, October 22, 2005, http://www.sfgate.com/bayarea/article/SAN-FRANCISCO-Many-with-children-planning-to-2600243.php; “Families Flee San Francisco: City Has Lowest Percentage Of Kids Of Any Major U.S. City”, The Huffington Post, March 11, 2012, http://www.huffingtonpost.com/2012/03/09/families-flee-san-fran-
BEST CITIES FOR PEOPLE 73
cisco_n_1335639.html; Joe Eskenazi, “Newsflash: San Francisco Expensive, Minorities and Families Leaving”, SF Weekly, March 9, 2012, http://www.sfweekly.com/thesnitch/2012/03/09/newsflash-san-francisco-expensive-minori-ties-and-families-leaving; Joel Kotkin, “Aging America: The cities that are graying the fastest”, New Geography, December 14, 2012, http://www.newgeography.com/content/003314-aging-america-the-cities-that-are-graying-the-fastest.
115. http://www.chron.com/business/real-estate/article/Homes-outside-Loop-610-draw-8-out-of-10-buyers-4432802.php
116. H.G. Wells, Anticipations of the Reaction of Mechanical and Scientific Progress Upon Human Life and Thought (Mineola, NY: Dover: 1999), 75-76.
117. Wells, Anticipations of the Reaction, 32.
118. Bogart, op. cit., p.108 (which book?) Bella DePaulo, Singled Out (St. Martin’s Press, 2007), 259.
120. Eric Klinenberg, “America: Single and Loving It”, New York Times, February 22, 2012, http://www.nytimes.com/2012/02/12/fashion/America-Single-and-Loving-It.html.
121. Dionne Searcey, “Marketers are Sizing Up the Millennials,” The New York Times, August 21, 2014, http://www.nytimes.com/2014/08/22/business/marketers-are-sizing-up-the-millennials-as-the-new-consumer-model.html?_r=0.
122. “Millennials and Their Homes: Still Seeking the American Dream,” Demand Institute, 2013. http://www.demandinstitute.org/sites/default/files/blog-uploads/millennials-and-their-homes-final.pdf
123. Matthew Hardy, “The Renaissance of the Traditional City”, Axess Magazine, September 2003, http://www.academia.edu/2129665/The_Renaissance_of_the_Traditional_City_Axess_September_2003.
124. Peter Katz, “The New Urbanism in the new Millenium: A Postcard to the Future” in Cities in the 21st century, ed. Robert Fishman (Washington, D.C.: Urban Land Institute, 2000); Jeff Speck, “Sprawl and the Future of the Old Neighborhood”, Asheville Citizen Times, September 3, 2000.
125. Jeremy Hobson and Leigh Gallagher, “Millennials Prefer City Life to Suburban Life”, Here & Now, July 27, 2014, http://
hereandnow.wbur.org/2014/06/27/millennials-america-suburbs; Leigh Gallagher, The End of Suburbs (New York: Penguin, 2013), 19.
126. ALDEN BAKER, “U.S. cities left on their own” The Globe and Mail (Canada), March 24, 1981; Jenny Thompson, “Bright Lights, Big City: Early 1980s New York”, The American past: NYC in focus, September 4, 2014, http://americanpast.blogspot.com/2014/09/bright-lights-big-city-early-1980s-new.html.
127. Zip codes (zip code tabulation areas) with population densities 7,500 per square mile & above and transit/walk/bicycle commute shares of 20% and above. See City Sector Model, at http://www.demographia.com/csmcriteria.png and http://www.newgeography.com/category/story-topics/city-sector-model.
128. Wendell Cox, "Urban Core Millennials? A Matter of Perspective", New Geography, March 6, 2015, http://www.newgeogra-phy.com/content/004864-urban-core-millennials-a-matter-perspective.
129. Morley Winograd and Michael D. Hais, “The Millennial Metropolis”, New Geography, April 19, 2010, http://www.newgeog-raphy.com/content/001511-the-millennial-metropolis.
130. Jeremy Burbank and Louise Keely, “New Millennials and their Homes”, Demand Institute, September 16, 2014, http://
74 CHAPMAN UNIVERSITY • CENTER FOR DEMOGRAPHICS AND POLICY

demandinstitute.org/blog/millennials-and-their-homes
131. M. Leanne Lachman and Deborah L. Brett, “Gen Y and Housing: What they want and where they want it”, Urban Land Institute, 2015, http://uli.org/wp-content/uploads/ULI-Documents/Gen-Y-and-Housing.pdf.
132. Patrick Clark, “The Exact Moment Cities Got Too Expensive for Millennials,” Bloomberg Business, July 15, 2015, http://www.bloomberg.com/news/articles/2015-07-15/the-exact-moment-big-cities-got-too-expensive-for-millennials?utm_source=Mic+Check&utm_campaign=2b200dd408-Thursday_July_167_15_2015&utm_medium=email&utm_ter-m=0_51f2320b33-2b200dd408-285306781.
133. Lauren Braun, “Renting Less Affordable Than Ever Before, While Mortgages Remain Affordable, by Historical Standard,” Zillow, August 13, 2015, http://zillow.mediaroom.com/index.php?s=28775&item=137182.
134. Ricky Piiparinen and Jim Russell, “Globalizing Cleveland: A Path Forward,” Maxine Goodman Levin College of Urban Affairs,
May 1, 2014, http://engagedscholarship.csuohio.edu/cgi/viewcontent.cgi?article=2166&context=urban_facpub; Joel Kotkin and Mark Schill, “America’s Smartest Cities,” New Geography, November 18, 2014, http://www.newgeography.com/content/004774-americas-smartest-cities; Joel Kotkin, “The U.S. Cities Getting Smarter The Fastest,” New Geography, August 9, 2012, http://www.newgeography.com/content/003007-the-us-cities-getting-smarter-the-fast-est; Joel Kotkin, “America’s New Brainpower Cities,” New Geography, April 3, 2014, http://www.newgeography.com/content/004246-americas-new-brainpower-cities; Aaron M. Renn, “Brain Gain in America’s Shrinking Cities,” Manhattan Institute for Policy Research, August 2015, http://www.manhattan-institute.org/html/cr_102.htm#.VeJjEZeny1s.
135. Yuqing Pan, “Bright Lights, Not-So-Big Cities: Where Americans Are Moving,” realtor.com, August 26, 2015, http://www.realtor.com/news/trends/nation-on-the-move-new-census-bureau-data-reveal-migration-pattern/?cid=syn_out-brain_0214_mob_news-01.
136. Laura Kusisto, “U.S. Existing-Home Sales Increase 5.1% in May,” The Wall Street Journal, June 22, 2015, http://www.wsj.com/articles/u-s-existing-home-sales-increase-5-1-in-may-1434981986.
137. Michael Barone, “Is America Entering a New Victorian Era?” Real Clear, July 28, 2015, http://www.realclearpolitics.com/articles/2015/07/28/is_america_entering_a_new_victorian_era_127563.html.
139. “Parenting a Priority,” Pew Research Center, March 24, 2010, http://www.pewresearch.org/daily-number/parenting-a-pri-ority/.
140. “Monitoring the Future,” University of Michigan, July 31, 2015, http://monitoringthefuture.org/.
141. Kris Hudson, “Generation Y Prefers Suburban Home Over City Condo”, The Wall Street Journal, January 21, 2015, http://www.wsj.com/articles/millennials-prefer-single-family-homes-in-the-suburbs-1421896797?c-b=logged0.7028438908287595; Rose Quint, “Most Millennial Buyers want Single-Family Home in the Suburbs”, National Association of Home Builders, January 28, 2015, /http://eyeonhousing.org/2015/01/most-millennial-buy-ers-want-single-family-home-in-the-suburbs/.
142. Elliot Schimel and Jennifer Marchetti, “Next Generation of Homebuyers are Knowledgeable, Responsible and Savvy According to New Better Homes and Gardens Real Estate Survey”, Market Wired, October 22, 2012, http://www.marketwired.com/press-release/next-generation-homebuyers-are-knowledgeable-responsible-savvy-according-new-bet-ter-nyse-rlgy-1716114.htm.
BEST CITIES FOR PEOPLE 75

143. Jed Kolko, “Urban Headwinds, Suburban Tailwinds”, Trulia, January 22, 2015, http://www.trulia.com/trends/2015/01/cities-vs-suburbs-jan-2015/.
144. “Millennials Will Play a Large Role in Shaping Housing Demand, Reports the Demand Institute,” The Conference Board,
September 16, 2014, https://www.conference-board.org/press/pressdetail.cfm?pressid=5278;
145. Nick Timiraos, “New Housing Headwind Looms as Fewer Renters Can Afford to Own,” The Wall Street Journal, June 7, 2015, http://www.wsj.com/articles/new-housing-crisis-looms-as-fewer-renters-can-afford-to-own-1433698639?c-b=logged0.8265339631128316.
146. Clark, Three Generations, 469.
147. Crystal Galyean, “Levittown”, U.S. History Scene, April 10, 2015, http://www.ushistoryscene.com/uncategorized/levit-town/.
148. Nicole Stelle Garnett, “Suburbs as Exit, Suburbs as Entrance,” Michigan Law Review 106 (2007): 7-22, http://papers.ssrn.com/sol3/papers.cfm?abstract_id=975217.
149. Calculated from Census data for the "African American only" population, based on "historical core municipalities,"( http://www.demographia.com/db-histcore2000-2010.pdf).
150. Mark Duell, “Census reveals African-American children are leaving large U.S. cities as their young parents head for better life in suburbs”, Daily Mail, June 30, 2011, http://www.dailymail.co.uk/news/article-2009903/African-American-chil-dren-leaving-biggest-U-S-cities-young-parents-head-suburbs.html
151. Calculated from Census data for the "African American only" population. See ###wc newgeography article in prepara-tion 20150912
152. Walter Russell Mead, “Black and Blue 2: Blacks Flee Blue States in Droves,” The American Interest, March 27, 2011, http://www.the-american-interest.com/2011/03/27/black-and-blue-2-blacks-flee-blue-states-in-droves/; Dan Bilefsky, “For New Life, Blacks in City Head to South,” The New York Times, June 23, 2011, http://www.nytimes.com/2011/06/22/nyregion/many-black-new-yorkers-are-moving-to-the-south.html?_r=0.
153. Jill H. Wilson and Nicole Prchal Svaljenka, “Immigrants Continue to Disperse, with Fastest Growth in the Suburbs”, Brookings, October 29, 2014, http://www.brookings.edu/research/papers/2014/10/29-immigrants-disperse-sub-urbs-wilson-svajlenka.
154. Sam Roberts, “In Shift, 40% of Immigrants Move Directly to Suburbs,” The New York Times, October 17, 2007, http://www.nytimes.com/2007/10/17/us/17census.html.
155. Sabrina Tavernise and Robert Gebeloff, “Immigrants Make Paths to Suburbia, Not Cities”, The New York Times, December 14, 2010, http://www.nytimes.com/2010/12/15/us/15census.html?_r=0.
156. Edward L. Glaeser and Matthew E. Khan, “Sprawl and Urban Growth”, Handbook of Urban Regional Economics, May 13, 2003, http://www.econ.brown.edu/faculty/henderson/sprawl.pdf.
157. William H. Frey, “Melting Pot Cities and Suburbs: Racial and Ethnic Change in Metro America in the 2000s,” Metropolitan Policy Program at Brookings, May 2011, http://www.brookings.edu/~/media/research/files/papers/2011/5/04%20
76 CHAPMAN UNIVERSITY • CENTER FOR DEMOGRAPHICS AND POLICY

census%20ethnicity%20frey/0504_census_ethnicity_frey.pdf.
158. Census Bureau Current Population Survey for 2013 to 2014. The number is actually higher, because this report uses the "principal cities" to identify non-suburban immigration. Principal cities include the core cities as well as municipalities that are suburban employment centers and which are overwhelmingly suburban in their built form. Wendell Cox, “Urban Cores, Core Cities and Principal Cities,” August 1, 2014, http://www.newgeography.com/content/004453-urban-cores-core-cities-and-principal-cities.
159. Joel Kotkin, “The Changing Geography of Asian America: To the South and the Suburbs,” New Geography, September 13, 2012, http://www.newgeography.com/content/003080-the-changing-geography-asian-america-to-the-south-and-the-suburbs.
160. Joel Kotkin and Wendell Cox, “The Evolving Geography of Asian America: Suburbs are High-Tech Chinatowns”, New Geography, March 19, 2015, http://www.newgeography.com/content/004875-the-evolving-geography-asian-america-suburbs-are-new-high-tech-chinatowns; Jon C. Teaford, The American Suburb: The Basics (New York: Routledge, 2008), 82-83.
161. Stephanie Czekalinski, "Suburbs Diversify but Many Areas Still Segregated, Report Says," National Journal, July 19, 2012, http://www.nationaljournal.com/thenextamerica/demographics/suburbs-diversify-but-many-areas-still-segregated-re-port-says-20120719.
162. Amy Stuart Wells, “The Diverse Suburbs Movement Has Never Been More Relevant”, The Atlantic, October 3, 2014, http://www.citylab.com/politics/2014/10/the-diverse-suburbs-movement-has-never-been-more-relevant/381061/.
163. Leah Binkovitz, “Study: Newer Houston suburbs offer best opportunities for minorities”, Houston Chronicle, April 18, 2015, http://www.houstonchronicle.com/neighborhood/katy/news/article/Study-Newer-Houston-suburbs-offer-best-6209145.php?t=2346c5d044fda33e64&cmpid=email-premiumapter;Dierdre Pfeiffer, “Racial equity in the post-civil rights suburbs? Evidence from US regions 2000-2012”, Urban Studies, December 19, 2014, http://usj.sagepub.com/content/early/2014/12/19/0042098014563652.abstract.
164. Steve Yoder, “Millions of Seniors Are Moving Back to Big Cities”, Business Insider, June 6, 2013, http://www.businessin-sider.com/millions-of-seniors-are-moving-to-cities-2013-6.
165. Al Heavens, “Active-Adult Boomers Still Favor Suburbs”, RealtyTimes, October 13, 2004, http://realtytimes.com/consum-eradvice/newhomeadvice1/item/11550-20041014_boomers; Gary V. Engelhart, “Housing Trends Among Baby Boomers”, ResearchGate, December 2006, http://www.researchgate.net/publication/228200303_Housing_Trends_Among_Baby_Boomers.
166. Nar Res, “2012 Profile of Home Buyers and Sellers: Press Highlights”, National Association of Realtors, November 10, 2012, http://www.slideshare.net/NarRes/2012-profile-of-home-buyers-and-sellers-press-highlights; “Home in Retire-ment: More Freedom, New Choices”, Merril Lynch, August 2014, https://mlaem.fs.ml.com/content/dam/ML/Articles/pdf/AR6SX48F.pdf.
167. Paula Span, “New Old Age”, The New York Times, March 25, 2011, http://newoldage.blogs.nytimes.com/2011/03/25/aging-without-children/?_r=0.
168. Linda A. Jacobsen, Mark Mather, and Genevieve Dupuis, “Household Change in the United States”, Population Reference Bureau, September 2012, http://www.prb.org/Publications/Reports/2012/us-household-change.aspx.
BEST CITIES FOR PEOPLE 77

169. Stephanie Coontz, The Way We Never Were (New York:Basic Books, 1992), 183.
170. Melissa Sullivan, “Survey also reveals Millennials are ‘boomeranging’”, Mayflower, April 20, 2015, http://www.mayflower.com/about-us/news/boomerang-press-release.
171. Aaron Glantz, “Multigenerational Housing Is a Real Estate Growth Niche,” The New York Times, April 21, 2011, http://www.nytimes.com/2011/04/22/us/22cncmultigenerational.html?_r=0.
172. Jane Gross, “Boomerang Parents”, The New York Times, November 18, 2008, http://newoldage.blogs.nytimes.com/2008/11/18/boomerang-parents/?_r=0.
173. “While Families Get Smaller, New Houses Grow Larger,” http://www.gwssi.com/villageverdeokc/images/news/family-house.pdf
174. Paul Taylor, et al., “The Return of the Multi-Generational Family Household”, Pew Research Center, March 18, 2010, http://www.pewsocialtrends.org/2010/03/18/the-return-of-the-multi-generational-family-household/.
175. “Home Buyer and Seller Generational Trends”, National Association of Realtors, 2015, http://www.realtor.org/reports/home-buyer-and-seller-generational-trends.
176. Les Christie, “The new American household: 3 generations, 1 roof,” CNN Money, April 3, 2012, http://money.cnn.com/2012/04/03/real_estate/multi-generation-households/index.htm.
177. Richard Fry and Jeffrey S. Passel, “In Post-Recession Era, Young Adults Drive Continuing Rise in Multi-Generational Living,” Pew Research Center, July 17, 2014, http://www.pewsocialtrends.org/2014/07/17/in-post-recession-era-young-adults-drive-continuing-rise-in-multi-generational-living/.
178. Christopher Palmeri and Frank Bass, “Grandma Bunks With Jobless Kids as Multigenerational Homes Surge,” Bloomberg Business, August 29, 2011, http://www.bloomberg.com/news/articles/2011-08-30/grandma-bunks-with-job-less-kids-as-multigenerational-homes-surge.
179. Krisanne Alcantra, “Multigenerational Homes: Real Estate’s Next Big Thing as More Families Share a Space”, AOL Real Estate, November 16, 2012, http://realestate.aol.com/blog/2012/11/16/multigenerational-homes-real-estates-next-big-thing-as-more-fa/.
180. Les Christie, “The New American household: 3 generations, 1 roof”, CNN Money, April 3, 2012, http://money.cnn.com/2012/04/03/real_estate/multi-generation-households/index.htm.
181. Bruegmann, Sprawl (Chicago: The University of Chicago Press, 2005), 61, 81; Peter Coy, “The Death of the McMansion Has Been Greatly Exaggerated”, Bloomberg Business, November 16, 2012, http://www.bloomberg.com/bw/arti-cles/2012-11-16/death-of-the-mcmansion-has-been-greatly-exaggerated.
182. Wendell Cox, “U.S. Sets New House Record in 2012”, New Geography, June 15, 2013, http://www.newgeography.com/content/003772-us-sets-new-house-size-record-2012.
183. Kriston Capps, “The Recovery Is Super-Sizing Houses,” City Lab, August 3, 2015, http://www.citylab.com/hous-ing/2015/08/the-recovery-is-super-sizing-houses/400094/)
78 CHAPMAN UNIVERSITY • CENTER FOR DEMOGRAPHICS AND POLICY
184. Frank Llyod Wright, The Living City (New York:New American Library, 1958) ( 83, 231.
185. Austin Williams, Enemies of Progress, 57; Peter Gordon and Harry W. Richardson, “Critiquing Sprawl’s Critics”, Policy Analysis, No. 365, January 24, 2000, 5, http://object.cato.org/sites/cato.org/files/pubs/pdf/pa365.pdf.
186. James A. Kushner, “Urban Planning and the American Family”, Emory Law School, March, 6, 2007, http://www.stetson.edu/law/lawreview/media/urban-planning-and-the-american-family.pdf.
187. Steven Conn, “Let’s make suburbs into cities: New urbanism, car culture and the future of community”, Salon, August 17, 2004, http://www.salon.com/2014/08/17/lets_make_suburbs_into_cities_new_urbanism_car_culture_and_the_future_of_community/.
188. The metropolitan planning organization (Metropolitan Council). 189. Katherine Kersten, “Turning the Twin Cities into Sim City,” The Wall Street Journal, May 19, 2014, http://www.wsj.com/
articles/SB10001424052702304536104579560042268686598; Katherine Kersten, “About the Met Council’s stamp on housing: Do we really want to live like this?” Star Tribune, September 25, 2015, http://www.startribune.com/about-the-met-council-s-stamp-on-housing-do-we-really-want-to-live-like-this/329599581/.
190. Peter Calthorpe, The Next American Metropolis: Ecology, Community and the American Dream (Princeton, NJ: Princeton University Press, 1993), 18-19.
191. Scott A. Hodge and Andrew Lundeen, “America Has Become a Nation of Dual-Income Working Couples,” Tax Foundation, November 21, 2013, http://taxfoundation.org/blog/america-has-become-nation-dual-income-working-couples.
192. “American suburbs turning into ghost towns: How homeowners are ditching out of town areas to live in city areas”, Daily Mail, April 5, 2012, http://www.dailymail.co.uk/news/article-2125507/American-suburbs-turning-ghost-towns-How-homeowners-ditching-town-areas-live-big-cities.html.
193. Allison Arieff, “What Will Save the Suburbs?” The New York Times, January 11, 2009, http://opinionator.blogs.nytimes.com/2009/01/11/what-will-save-the-suburbs/?_r=0.
194. Eric Parfrey, “What is Smart Growth?” Sierra Club, http://vault.sierraclub.org/sprawl/community/smartgrowth.asp.
195. Shaw and Utt, A Guide to Smart Growth, 18; Brenden O’Neill, “Too Many People? No, Too Many Malthusians,” spiked, November 19, 2009, http://www.spiked-online.com/newsite/article/7723#.VVTK-pMYG48.
196. Stewart Brand, “Cities & Time”, The Long Now Foundation, April 8, 2005, http://longnow.org/seminars/02005/apr/08/cities-and-time/.
197. Martin Dreiling, “New Urbanism Examined by Time Magazine, Andres Duany”, Planetizen, December 24, 2007, http://www.planetizen.com/node/29063; Brian Stone, “Land Use as Climate Change Mitigation”, Environmental Science and Technology43 (2009), 9052-9056; Ronald D. Utt, “The Oberstar Transportation Plan: A Costly Exercise in Lifestyle Modification”, Heritage Foundation Web Memo, November 10, 2009.
198. ATL Urbanist, “Streetcar Tour of Bad Land Use in Atlanta”, Streetsblog Southeast, August 7, 2015, http://www.washing-tonpost.com/wp-dyn/content/article/2009/09/18/AR2009091801306.html; Eric Klinenberg, (New York:Penguin:2013) .,p.207 (Going Solo: The Extraordinary Rise and Surprising Appeal of Living Alone)
BEST CITIES FOR PEOPLE 79

199. Wendell Cox, “Greenhouse Gas Emissions and Reality: Residential Emissions”, New Geography, April 8, 2009, http://www.newgeography.com/content/00728-greenhouse-gas-emissions-and-reality-residential-emissions.
200. Christopher A. Kennedy, “Energy and material flows of megacities,” Proceedings of the National Academy of Sciences of the United States of America 112 (2015): 5985-5990, http://www.pnas.org/content/112/19/5985.abstract.
201. Wendell Cox Greenhouse Gas Reduction Policy: From Rhetoric to Reason , New Geography http://www.newgeography.com/content/0039-greenhouse-gas-reduction-policy-from-rhetoric-reason
202. “Carbon footprint assumptions do not hold true for Halifax”, CBC News, April 29, 2013, http://www.cbc.ca/news/cana-da/nova-scotia/carbon-footprint-assumptions-do-not-hold-true-for-halifax-1.1371095.
203. Phil McKenna, “Forget Curbing Suburban Sprawl”, MIT Technology Review, September 3, 2009, http://www.technologyre-view.com/news/415135/forget-curbing-suburban-sprawl/;Rebecca Alvania and Luwam Yeibio, “Increasing Residential ad Employment Density Could Mean Reductions in Vehicle Travel, Fuel Use, and CO2 emissions,” The National Academies of Sciences, Engineering, and Medicine, September 1, 2009, http://www8.nationalacademies.org/onpinews/newsitem.aspx?RecordID=12747.
204. McKenna, “Forget Curbing Suburban Sprawl”; Witold Rybczyniski, Makeshift Metropolis (New York: Scribner, 2010), 186.
205. Wendell Cox, “California Declares War on Suburbia II: The Cost of Radical Densification”, New Geography, April 18, 2012, http://www.newgeography.com/content/002781-california-declares-war-suburbia-ii-the-cost-radical-densification; “Re-ducing US Greenhouse Gas Emissions: How Much at What Cost?” McKinsey & Company, November 21, 2007, file:///C:/Users/MIMKA/Downloads/Greenhouse_Gas_Emissions_Executive_Summary%20(1).pdf.
206. Hugh Byrd, et al., “Measuring the Solar Potential of a City and Its Implications for Energy Policy”, Energy Policy 61 (October 2013): 944-952, http://www.sciencedirect.com/science/article/pii/S0301421513005272.
207. Christopher G. Boone and Ali Modarres, City and Environment (Philadelphia: Temple University Press, 2006), 105.
208. Werner H. Terjunb and Stella S-F Laurie, “Solar Radiation and Urban Heat Islands”, Annals of the Association of American Geographers 63 (1973): 181-207, http://www.jstor.org/stable/2562269.
209. Hashem Akbari, “Energy Saving Potentials and Air Quality Benefits of Urban Heat Island Mitigation”, SCITech Connect, August 23, 2005, http://www.osti.gov/scitech/biblio/860475; Sachiho A. Adachi, et al., “Moderation of Summertime Heat Island Phenomena via Modification of the Urban Form in the Tokyo Metropolitan Area”, Journal of Applied Meteo-rology & Climatology 53 (August 2014): 1886-1900, https://eds-a-ebscohost-com.libproxy.chapman.edu/ehost/detail/detail?vid=5&sid=bc7d8f89-8605-4f26-a574-6a02d6ddcdae%40sessionmgr4001&hid=4113&bdata=JkF1dGhUeX-BlPWlwLHVpZCxjb29raWUsdXJsJnNpdGU9ZWhvc3QtbGl2ZQ%3d%3d#db=aph&AN=97411213.
210. Ping Zhang, et al., “Potential Drivers of Urban Heat Islands in the Northeast USA”, NASA, http://www.nasa.gov/pdf/505254main_zhang.pdf.
211. Transport Canada, The Cost of Urban Congestion in Canada, April 2006, http://citeseerx.ist.psu.edu/viewdoc/download;j-sessionid=9CD2D9FA6D7AE54580D380138C052FED.
212. Lloyd Alter, “To Go Green, Live Closer to Work”, treehugger, October 2, 2007, http://www.treehugger.com/sustain-able-product-design/to-go-green-live-closer-to-work.html; Sharon Bernstein and Francisco Vara-Orta, “Near the rails but
80 CHAPMAN UNIVERSITY • CENTER FOR DEMOGRAPHICS AND POLICY

on the road”, Los Angeles Times, June 30, 2007, http://articles.latimes.com/2007/jun/30/local/me-transit30.
213. David Friedman and Jennifer Hernandez, “California Environmental Quality Act, Greenhouse Gas Regulation and Climate Change”, Chapman University Press, 2015, http://www.chapman.edu/wilkinson/_files/GHGfn.pdf.
214. Eric John Abrahamson, Building Home: Howard F. Ahmanson and the Politics of the American Dream (Berkeley: University of California Press, 2013), 5-11.
215. Abrahamson, Building Home, 5; Stephanie Coontz, The Way We Never Were (New York: Basic Books, 1991), 77.
216. Coontz, The Way We Never Were, 29, 61.
217. Thomas Piketty and Emmanual Saez, “The Evolution of Top Incomes: A Historical and International Perspective”, American Economics Association, 2006, http://eml.berkeley.edu/~saez/piketty-saezAEAPP06.pdf.
218. Clarence Senior, Land Reform and Democracy (Gainesville: University of Florida Press, 1958), 11.
219. Jordan Weissmann, “The Recession’s Toll: How Middle Class Wealth Collapsed to a 40-Year Low,” The Atlantic, December 4, 2012, http://www.theatlantic.com/business/archive/2012/12/the-recessions-toll-how-middle-class-wealth-col-lapsed-to-a-40-year-low/265743/.
220. Robbie Whelan, “Housing Analyst-Turned-Investor’s ‘Jerry Maguire’ Moment,” The Wall Street Journal, December 4, 2012, http://blogs.wsj.com/developments/2012/12/04/housing-analyst-turned-investors-jerry-maguire-moment/; Conor Dougherty, “New Homes Get Built Renters in Mind,” The Wall Street Journal, November 3, 2013, http://www.wsj.com/articles/SB10001424052702303843104579171791879768178.
221. AnnaMaria Andriotis, “New Ways to Profit From Renting Out Single-Family Homes,” The Wall Street Journal, September 19, 2014, http://www.wsj.com/articles/new-ways-to-profit-from-renting-out-single-family-homes-1411150866.
222. Rachel Bogardus Drew and Christopher Herbert, “Post-Recession Drivers or Preferences for Homeownership”, Joint Center for Housing Studies, Harvard University, August 2012, http://www.jchs.harvard.edu/sites/jchs.harvard.edu/files/w12-4_drew_herbert.pdf.
223. Tom Breen, “UConn/Hartford Courant Poll: Middle Class Dream Persists, Though Harder to Attain,” UConn Today, February 11, 2013, http://today.uconn.edu/blog/2013/02/uconnhartford-courant-poll-middle-class-dream-persists-though-hard-er-to-attain/.
224. Wendell Cox, “84% of 18-to-34-Year-Olds Want to Own Homes,” New Geography, May 22, 2012, http://www.newgeog-raphy.com/content/002859-84-18-34-year-olds-want-to-own-homes; “Study Finds 84 Percent of Renters Intend to Buy a Home”, National Mortgage Professional , May 21, 2012, http://nationalmortgageprofessional.com/news/23453/study-finds-84-percent-renters-intend-buying-home; https://www.flatfee.com/realestateblog/the-millennial-genera-tion-and-home-ownership/ (could not find)
225. “Home Buyer and Seller Generational Trends,” National Association of Realtors, March 2015, http://www.realtor.org/sites/default/files/reports/2015/2015-home-buyer-and-seller-generational-trends-2015-03-11.pdf?utm_source=hs_email&utm_medium=email&utm_content=21927799&_hsenc=p2ANqtz-_12AfxVI9zZ4mSzz8SS75C7_yXu2vb-K_9e9KKi2jd3KYJUdPscTskdIYZplm6sOINV2lWx1JJ4RaFAEtFKfjN0rWEQKg&_hsmi=21927799.
BEST CITIES FOR PEOPLE 81

226. See for example, Denise DiPasquale and Edward L. Glaeser, “Incentives and Social Capital: Are Homeowners Better Citi-zens?” Journal of Urban Economics 45 (1998): 354-384, http://www.law.uchicago.edu/files/files/54.Glaeser.Home_.pdf; Kim Manturuk, K, Mark Lindblad, and Roberto Quercia, “Friends and Neighbors: Homeownership and Social Capital among Low-to-Moderate Income Families,” Journal of Urban Affairs 32 (2010): 471-488, http://onlinelibrary.wiley.com/doi/10.1111/j.1467-9906.2010.00494.x/abstract.
227. “Social Benefits of Homeownership and Stable Housing,” National Association of Realtors, April 2012, http://www.realtor.org/sites/default/files/social-benefits-of-stable-housing-2012-04.pdf: ; William H. Rohe, Shannon van Zandt and George McCarthy, “The Social Benefits and Costs of Home Ownership”, Joint Center for Housing Studies of Harvard, October 2001, http://www.jchs.harvard.edu/research/publications/social-benefits-and-costs-homeownership-critical-as-sessment-research.
228. Robert D. Dietz, “The social consequences of homeownership”, Ohio State University, Center for Urban and Regional Analysis, June 18, 2003; “Benefits of Homeownership,” Habitat for Humanity - New York City, http://www.habitatnyc.org/pdf/Toolkit/homewonership.pdf.
229. Peter Gordon and Harry W. Richardson, “Critiquing Sprawl’s Critics”, Cato Institute, January 24, 2000, http://object.cato.org/sites/cato.org/files/pubs/pdf/pa365.pdf.
230. Thomas Picketty, "Capital in the 21st Century," Cambridge: Harvard University (2014). Available online at http://www.marcellodibello.com/PHI169/resources/Piketty-response-about-rg.pdf.
231. Matthew Rognlie, "A note on Piketty and diminishing returns to capital,” Massachusetts Institute of Technology, June 15, 2014, http://www.mit.edu/~mrognlie/piketty_diminishing_returns.pdf.
232. Picketty, "Capital in the 21st Century.”
233. Robert Fishman, “ Cities After the End of Cities: towards an urban pluralism”, Harvard Design Magazine, Winter/Spring 1997, 14-15.
234. Roberta Brandes Gratz, “Americans Want What Czechs Have”, Association for Thrifty Transport, November 1995, http://doprava.ecn.cz/en/Amerika.php; “Selected Data on Housing 2013”, Ministry of Regional Development CZ and Institute for Spatial Development, July 2014 Prague, http://www.mmr.cz/getmedia/1e967746-c803-44e9-90e1-e2008c337f1e/Selected-data-housing-2013.pdf.
236. Frank Lloyd Wright, The Living City , op.cit., 87.
82 CHAPMAN UNIVERSITY • CENTER FOR DEMOGRAPHICS AND POLICY
Sidebar:
1. “The world’s most ‘liveable’ cities,” The Economist, August 18, 2015, http://www.economist.com/blogs/graphicde-tail/2015/08/daily-chart-5; http://monocle.com/magazine/ (
2. Richard Florida, “The Geography of Well-Being,” City Lab, April 23, 2015, http://www.citylab.com/work/2015/04/the-geog-raphy-of-well-being/391188/.
3. Patrick McGeehan, “New Yorkers Earn More, Early On, a Study Shows,” The New York Times, April 25, 2010, http://www.nytimes.com/2010/04/26/nyregion/26earn.html?_r=0.
4. Robin Madell, “What Working Moms Really Want,” U.S. News, September 12, 2013, http://money.usnews.com/money/blogs/outside-voices-careers/2013/09/12/what-working-moms-really-want.
5. “10 Best Cities for Families,” Livability, May 2015, http://www.livability.com/top-10/families/10-best-cities-families/2015; ; John S. Kiernan, ‘2015’s Best and Worst Cities for Families,” WalletHub, 2015, http://wallethub.com/edu/best-cit-ies-for-families/4435/.
6. Includes working at home, which is assumed to be zero minutes.
7. Laura Kusisto, “Rising Mortgage Rates to Test Housing Market’s Strength,” The Wall Street Journal, June 21, 2015, http://www.wsj.com/articles/rising-mortgage-rates-to-test-housing-markets-strength-1434913633.
8. “The Los Angeles and Orange County area becomes even more unaffordable when it comes to housing: In last two years home prices up 28 percent while wages are up 2 percent.” Dr. Housing Bubble, March 27, 2015, http://www.doctorhous-ingbubble.com/los-angeles-orange-county-wages-and-home-prices-unaffordable-la/.
9. “Things to Do in Omaha’s Old Market,” Visit Omaha, http://www.visitomaha.com/things-to-do/entertainment-districts/old-market/#.Ve3l1Zeny1s; Robert Ogilvie, “Transforming Oklahoma City: Using downtown revitalization to build a healthier community,” ReportingonHealth, July 8, 2014, http://www.reportingonhealth.org/2014/07/03/transform-ing-oklahoma-city-using-downtown-revitalization-build-healthier-community; http://www.downtownkc.org/; “Things to do in the Des Moines Area,” Catch Des Moines, http://www.catchdesmoines.com/things-to-do/.
10. “You are here,” The McKnight Foundation and FORECAST Public Artworks, 2005, https://www.mcknight.org/system/asset/document/546/YouAreHere_full.pdf.
11. See: Wendell Cox, “Urban Core Millennials? A Matter of Perspective,” New Geography, March 6, 2015, http://www.newge-ography.com/content/004864-urban-core-millennials-a-matter-perspective
BEST CITIES FOR PEOPLE 83

Design Notes
Best Cities for People and the graphics utilize the following:
To achieve visual harmony a modi�ed version of the grid Jan Tschichold conceived for his book Typographie was employed.
MINION PRO Chapman’s serif family, is a digital typeface designed by Robert Slimbach in 1990 for Adobe Systems. �e name comes from the traditional naming system for type sizes, in which minion is between nonpareil and brevier. It is inspired by late Renaissance-era type.
BERTHOLD AKIZEDENZ GROTESK is Chapman’s san serif family. It is a grotesque typeface originally released by the Berthold Type Foundry in 1896 under the name Accidenz-Grotesk. It was the �rst sans serif typeface to be widely used and in�uenced many later neo-grotesque typefaces a�er 1950.
Page 6: Chinese Family Giving Daughter Ride on Shoulders In Park Copyright: www.123rf.com/18709944
Page 14-15, Multi Generation African American Family on Cycle Ride Copyright: www.123rf.com/31003727
Front Cover: Group of Friends Eating Meal On Roo�op Terrace Copyright: www.123rf.com/31098777
Back Cover: Family Playing Soccer Together Copyright" www.123rf.com/31065822
Book exterior and interior design by Chapman University professor Eric Chimenti. His work has won a Gold Advertising Award, been selected for inclusion into LogoLounge: Master Library, Volume 2 and LogoLounge Book 9, and been featured on visual.ly, the world’s largest community of infographics and data visualization. He has 17 years of experience in the communication design industry. To view a client list and see additional samples please visit www.behance.net/ericchimenti.
Professor Chimenti is also the founder and head of Chapman’s Ideation Lab that supports undergraduate and faculty research by providing creative visualization and presentation support from appropriately quali�ed Chapman University undergraduate students. Services include creative writing, video, photography, data visualization, and all aspects of design. �e students specialize in the design and presentation of complex communication problems.
Special thanks to Ideation Lab workers Erin Hiromoto, Justin Pintda, Sarah Pratt, Jamey Siebenberg, and Annie Woodward.
84 CHAPMAN UNIVERSITY • CENTER FOR DEMOGRAPHICS AND POLICY


Copyright © 2022 FDOKUMEN