
Advertising business model strategy to increase consumers ...
171
Advertising business model strategy to increase consumers’ brand recognition An exploratory study testing the benefits of a quiz structure, applying incentives and targeting ads by Manuel Francisco Carrapatoso Garcia Ribeiro Católica Porto Business School September of 2016
-
Upload
khangminh22 -
Category
Documents
-
view
4 -
download
0
Transcript of Advertising business model strategy to increase consumers ...
Advertising business model strategy to increase
consumers’ brand recognition
An exploratory study testing the benefits of a quiz structure, applying
incentives and targeting ads
by
Manuel Francisco Carrapatoso Garcia Ribeiro
Católica Porto Business School
September of 2016


Advertising business model strategy to increase
consumers’ brand recognition
An exploratory study testing the benefits of a quiz structure, applying
incentives and targeting ads
Final Assignment in the form of Dissertation presented to the Universidade Católica
Portuguesa to obtain the Master Degree in Management
by
Manuel Francisco Carrapatoso Garcia Ribeiro
under supervision of
Prof. Doutor António Manuel Valente de Andrade
Católica Porto Business School
September of 2016


iii
Acknowledgements
I would like to thank my thesis advisor Professor Doutor António Andrade from
Católica Porto Business School. He was always available to answer all my emails and
steer me to the right direction. Also he allowed me to write this thesis according to my
own research and allowed me to create my own experimental phase.
I would also like to thank all people that wasted a little time of their lives to participate
in my experimental phase. They gave me the input to pursuit this project and valuable
feedback to understand how to construct this business model in the future.
Finally, I must express my very profound gratitude to my parents, for their support and
comprehension dealing with me and my problems. Also I would like to thank all my
dearest friends and family for their laughs, good humor and concerns.
Finally I would like to thank Leonor for her unconditional love, support and continuous
encouragement throughout this journey in the good and the bad days.
This accomplishment would not have been possible without all of you. Thank you.

iv

v
“The people who are crazy enough to think they can change the world are the ones who do.”
Steve Jobs


vii
Resumo
Atualmente, existe uma saturação do mercado publicitário devido aos novos meios de
baixo custo. A sociedade tem acesso a ferramentas para ignorar ou evitar publicidade,
nomeadamente, bloquear anúncios na internet, e passar à frente anúncios na TV.
O principal objetivo deste projeto é a criação de estratégias publicitárias com o intuito
de aumentar a atenção dos consumidores e, consequentemente, o reconhecimento da
marca. Este modelo foi construído de forma a testar, os benefícios de uma
estrutura quiz, incentivos e anúncios com targeting, de acordo com género, idade e
ocupação. O presente trabalho é, de natureza descritiva e, quanto à profundidade,
exploratório. Procura-se um primeiro conhecimento empírico da aceitação do modelo
imaginado, através dos dados recolhidos que identificam caraterísticas e dimensões da
problemática, oferecendo, no final, uma visão mais completa e clara. O desenho
metodológico incluiu um simulador de quiz, associado a um inquérito por questionário,
capaz de mostrar anúncios publicitários para testar a atenção de 160 participantes, e um
inquérito, fundamentado na Teoria de Comportamento Planeado, para recolher a sua
opinião. Após um mês, um novo questionário foi aplicado com o objetivo de avaliar o
reconhecimento da marca pelos consumidores. Através do desempenho dos
participantes, este estudo concluiu que a estrutura de quiz tem influência positiva na
atenção e no reconhecimento da marca. Os participantes demostraram uma atitude
positiva face à experiência, o que é promissor para a criação de um modelo de negócio
com base nesta estratégia de publicidade. Efetivamente destacaram que seria mais fácil
a sua aceitação, caso se implementasse em smartphones e se se usasse incentivos.
Palavras-chave: Publicidade, atenção, reconhecimento da marca, quiz, incentivos,
anúncios com targeting.

viii
ix
Abstract
Advertising has now cheap methods to promote products which are leading to market
saturation. Nowadays, society has tools to ignore or avoid advertising, giving
consumers the ability to block ads from the internet, and fast-forwarding commercials
in TV.
The main goal for this project was to create a business model strategy to increase
consumers’ attention and consequently, brand recognition. This model was constructed
to test the benefits of strategies such the implementation of a quiz structure, incentives
and targeting ads, according to gender, age and occupation
This research has a descriptive nature and follows and presents an exploratory study,
using quantitative instruments to collect data. These instruments consisted in a quiz
simulator, associated to a questionnaire, showing commercial videos, in order to test
users’ attention, along with a survey, grounded in the Theory of Planned Behavior, to
assess participants’ opinion. After one month, another questionnaire tested participants’
memory, with the goal of assessing consumers’ brand recognition. Results evaluated
participants’ performances, influenced by each strategy, individually and combined.
From participants’ performances, this research concluded that a quiz structure helps
users focus on the ad and improves their brand recognition. Furthermore, incentives
and targeted ads have different influence over each demographic variable, and behave
different when combined with each other. From feedback, participants demonstrated a
positive attitude towards the business model and highlighted that this model would be
more easily accepted, implementing it in smartphones and using a reward system along
with targeted ads.
Keywords: advertising, attention, brand recognition, quiz, incentives, targeting ads.

x
Contents
Resumo ........................................................................................................................................ vii
Abstract......................................................................................................................................... ix
Contents ....................................................................................................................................... vii
Table Index ................................................................................................................................. xiv
Figures Index ............................................................................................................................. xvi
Glossary ..................................................................................................................................... xvii
Introduction ................................................................................................................................ 25
1. Background Theme ......................................................................................................... 25
2. Objectives ......................................................................................................................... 26
3. Research Methodology ................................................................................................... 26
4. Work Structure ................................................................................................................ 27
1. Advertising Evolution .................................................................................................... 29
1.1. Digital and Social ......................................................................................................... 29
Digital .................................................................................................................... 29 1.1.1.
Social Media .......................................................................................................... 30 1.1.2.
1.2. Advertising ................................................................................................................... 34
Marketing .............................................................................................................. 34 1.2.1.
Advertising definition ......................................................................................... 34 1.2.2.

Advertising research models .............................................................................. 35 1.2.3.
Advertising evolution ......................................................................................... 36 1.2.4.
Advertising effectiveness .................................................................................... 36 1.2.5.
1.3. Internet Advertising .................................................................................................... 37
Perceived Goal Impediment ............................................................................... 39 1.3.1.
Perceived Ad Clutter on the Internet ................................................................ 40 1.3.2.
Prior Negative Experiences ................................................................................ 40 1.3.3.
1.4. Mobile Advertising ..................................................................................................... 41
Mobile industry .................................................................................................... 41 1.4.1.
Mobile Advertising .............................................................................................. 42 1.4.2.
2. Incentives, Targeting and Gamification....................................................................... 49
2.1. Incentives ...................................................................................................................... 49
Mobile Incentives ................................................................................................. 50 2.1.1.
Age ......................................................................................................................... 51 2.1.2.
2.2. Targeting and personalization .................................................................................. 51
Message Relevance .............................................................................................. 52 2.2.1.
Targeting ............................................................................................................... 53 2.2.2.
Personalization ..................................................................................................... 54 2.2.3.
2.3. Gamification ................................................................................................................. 55
Advergames .......................................................................................................... 55 2.3.1.
Limitations ............................................................................................................ 57 2.3.2.
3. Theoretical foundations ................................................................................................. 59

3.1. Mobile research theories ............................................................................................. 59
3.2. Brand Recognition and Memorability ...................................................................... 60
3.3. Questionnaire foundations ........................................................................................ 61
Brand ...................................................................................................................... 62 3.3.1.
Product Information ............................................................................................ 63 3.3.2.
Non product related questions .......................................................................... 64 3.3.3.
3.4. Feedback foundations ................................................................................................. 64
4. Research Methodology ................................................................................................... 67
4.1. Question and Purpose ................................................................................................ 67
4.2. Methodology ................................................................................................................ 68
Questionnaire foundations ................................................................................. 70 4.2.1.
Feedback foundations ......................................................................................... 71 4.2.2.
4.3. Tools and Procedures ................................................................................................. 74
Pretest and semantic test ..................................................................................... 74 4.3.1.
Online quiz simulator and survey data collection .......................................... 75 4.3.2.
Feedback question analysis ................................................................................ 79 4.3.3.
Online quiz simulator and survey data compilation ...................................... 82 4.3.4.
5. Findings and Discussion ................................................................................................ 83
5.1. Demographic parameters ........................................................................................... 83
Age ......................................................................................................................... 84 5.1.1.
Gender ................................................................................................................... 85 5.1.2.
Occupation ............................................................................................................ 86 5.1.3.

E-mail ..................................................................................................................... 87 5.1.4.
5.2. Quiz simulator ............................................................................................................. 87
................................................................................................................................................ 88
5.3. Quiz simulator – Altered version.............................................................................. 89
Gender ................................................................................................................... 90 5.3.1.
Age ......................................................................................................................... 90 5.3.2.
Occupation ............................................................................................................ 93 5.3.3.
Quiz simulator conclusion with altered results............................................... 94 5.3.4.
5.4. Brand recognition ........................................................................................................ 95
Gender ................................................................................................................... 95 5.4.1.
Age ......................................................................................................................... 98 5.4.2.
Occupation ............................................................................................................ 99 5.4.3.
5.5. Brand recognition individual brand performances .............................................. 100
Brand recognition male individual performances ........................................ 100 5.5.1.
Brand recognition female individual performances ..................................... 102 5.5.2.
5.6. Feedback ..................................................................................................................... 103
Idea ....................................................................................................................... 103 5.6.1.
Disposition .......................................................................................................... 104 5.6.2.
Time ..................................................................................................................... 106 5.6.3.
Time/Day ............................................................................................................. 106 5.6.4.
Devices ................................................................................................................. 108 5.6.5.
Conclusion ................................................................................................................................ 111

References ................................................................................................................................. 117
APPENDIX I – Quiz Simulator and brand recognition tools and procedures used ...... 139
1. Raw Data ........................................................................................................................ 139
2. Responses ....................................................................................................................... 140
2.1. Structure ..................................................................................................................... 140
2.2. Method ........................................................................................................................ 140
2.3. Results ......................................................................................................................... 141
Personal information ......................................................................................... 141 2.3.1.
Questions ............................................................................................................. 141 2.3.2.
Win/Lose.............................................................................................................. 142 2.3.3.
Total Row ............................................................................................................ 142 2.3.4.
2.4. Graphics ...................................................................................................................... 142
User profile ......................................................................................................... 142 2.4.1.
Feedback .............................................................................................................. 143 2.4.2.
First and Third graphics .................................................................................... 143 2.4.3.
Second and Forth graphics ............................................................................... 143 2.4.4.
Fifth graphic ........................................................................................................ 144 2.4.5.
Win/Lose graphic ............................................................................................... 144 2.4.6.
Categories graphic ............................................................................................. 144 2.4.7.
3. Stats ................................................................................................................................. 145
3.1. First Table ................................................................................................................... 145
Gender group ..................................................................................................... 145 3.1.1.

Age group ........................................................................................................... 146 3.1.2.
Occupation group .............................................................................................. 147 3.1.3.
Color ..................................................................................................................... 148 3.1.4.
3.2. Second table ............................................................................................................... 148
Total Values ........................................................................................................ 149 3.2.1.
Percentage values ............................................................................................... 149 3.2.2.
4. Brand recognition data collection ............................................................................... 150
4.1. Introductory section .................................................................................................. 150
4.2. Brand recognition sections ....................................................................................... 151
5. Brand recognition data compilation ........................................................................... 152
5.1. Raw Data .................................................................................................................... 152
5.2. Brand recognition results ......................................................................................... 152
Individual brand recognition results .............................................................. 153 5.2.1.
Demographic brand recognition results ......................................................... 154 5.2.2.
Color ..................................................................................................................... 156 5.2.3.
APPENDIX II – Results for unaltered version ..................................................................... 157
1. Stats Sheet – Category results...................................................................................... 157
1.1. Gender ......................................................................................................................... 157
Total ..................................................................................................................... 158 1.1.1.
Quiz questions with interest............................................................................. 158 1.1.2.
Quiz without interest ......................................................................................... 158 1.1.3.
Prize quiz with interest ..................................................................................... 159 1.1.4.
Prize quiz without interest ............................................................................... 159 1.1.5.
Overall conclusion ............................................................................................. 160 1.1.6.
1.2. Age ............................................................................................................................... 160
Less than 18 years old ........................................................................................ 160 1.2.1.
Between 18 and 30 years old ............................................................................ 161 1.2.2.
More than 30 years old ...................................................................................... 164 1.2.3.
Overall conclusion ............................................................................................. 165 1.2.4.
1.3. Occupation ................................................................................................................. 166
Total ..................................................................................................................... 166 1.3.1.
Quiz with interest .............................................................................................. 167 1.3.2.
Quiz without interest ......................................................................................... 167 1.3.3.
Prize with interest .............................................................................................. 167 1.3.4.
Prize without interest ........................................................................................ 168 1.3.5.
Overall conclusion ............................................................................................. 168 1.3.6.
2. Stats Sheet – Individual results ................................................................................... 169

Table Index
TABLE 1 - Feedback questions - Foundations and context ................................................. 79
TABLE 2 - Gender parameter ................................................................................................... 90
TABLE 3 - Ages younger than 18 years old concerning each category ............................. 90
TABLE 4 - Ages between 18 and 30 years old concerning each category .......................... 91
TABLE 5 - Ages older than 30 years old concerning each category ................................... 92
TABLE 6 - Occupation parameter concerning each category .............................................. 93
TABLE 7 - Gender concerning each category - brand recognition without accounting for
wrong answers ........................................................................................................................... 96
TABLE 8 - Gender concerning each category - brand recognition accounting for wrong
answers ........................................................................................................................................ 96
TABLE 9 - Ages between 18 and 30 years old concerning each category - brand
recognition .................................................................................................................................. 98
TABLE 10 – Ages older than 30 years old concerning each category - brand recognition
....................................................................................................................................................... 99
TABLE 11 - Occupation parameter concerning each category - brand recognition ......... 99
TABLE 12 - Survey question – Idea ....................................................................................... 103
TABLE 13 - Table representing ages between 18 and 30 years old concerning survey
question - disposition .............................................................................................................. 105
TABLE 14 - Gender concerning survey question - time/day ............................................ 107
TABLE 15 - Occupation concerning survey question - time/day ...................................... 107
TABLE 16 - Ages between 18 and 30 years old and ages older than 30 years old
concerning survey question - ideal devices ......................................................................... 109
TABLE 17 - Gender concerning each category - unaltered version .................................. 157

TABLE 18 - Ages younger than 18 years old concerning each category - unaltered
version ....................................................................................................................................... 160
TABLE 19 - Ages between 18 and 30 years old concerning each category - unaltered
version ....................................................................................................................................... 161
TABLE 20 – Ages older than 30 years old concerning each category - unaltered version
..................................................................................................................................................... 164
TABLE 21 - Occupation parameter concerning each category - unaltered version ....... 166
TABLE 22 - Performances of questions 7, 8 and 9 concerning each parameter - unaltered
version ....................................................................................................................................... 169
TABLE 23 - Performances of questions 37, 38 and 39 concerning each parameter -
unaltered version ..................................................................................................................... 170
Figures Index
FIGURE 1 - Theoretical Framework – Attention and brand recall. .................................... 70
FIGURE 2 - Feedback theoretical model grounded in Theory of Planned Behavior. ...... 71
FIGURE 3 - Hypothetical question for Subjective Norm ..................................................... 73
FIGURE 4 - Diagram representing quiz simulator operations sketch................................ 75
FIGURE 5 - Graphic representing age parameter ................................................................. 84
FIGURE 6 - Graphic representing gender parameter ........................................................... 85
FIGURE 7 - Graphic representing occupation parameter .................................................... 86
FIGURE 8 - Graphic representing categories performance - Attention ............................. 88
FIGURE 9 - Graphic representing categories performance - altered version .................... 89
FIGURE 10 - Graphic representing individual brand recognition performances for males
..................................................................................................................................................... 100
FIGURE 11 - Graphic representing individual brand recognition performances for
females ....................................................................................................................................... 102
FIGURE 12 - Graphic representing survey question - Disposition ................................... 104
FIGURE 13 - Graphic representing survey question - Time .............................................. 106
FIGURE 14 - Graphic representing survey question - Time/Day ..................................... 106
FIGURE 15 - Graphic representing survey question - Ideal Devices ............................... 108

Glossary
Ad – Advertisement
AIDA – Attention - Interest - Desire – Action
CS – College Students
CTRs – click-through rates
e-commerce – Electronic Commerce
e-coupons – Electronic coupons
GPS – Global Position System
HS – High School Students
IT – Information Technology
KCC - Korea Communications Commission
KFC – Kentucky Fry Chicken
M-Commerce – Mobile Commerce
NGI - no game with interest
NGWI - no game without interest
NS – Non-Students
P&G – Procter and Gamble
PC – Personal Computer
PCB – Perceived Behavior Control
PI - PRIZE QUIZ with interest
PWI - PRIZE QUIZ without interest
QI - QUIZ with interest
QWI - QUIZ without interest
SMS – Short Message System
U.S – United States
WWW – World Wide Web

24

25
Introduction
1. Background Theme
Advertising has always been a strong industry, throughout every century, and,
nowadays, is not different. Advertising is a type of marketing communication,
responsible for promoting a product or service. However, traditional advertising
methods already reached a mature state, leading to industry stagnation.
Advertising has become easy and cheap to produce and share, which led to a high
market saturation, and more difficulty for companies to highlight their ads from the
rest. In other words, consumers are now facing too many ads in their daily routine,
which is driving them to ignore most of them or even to block or run away. With this,
new emergent markets are rising, to fight this issue. Users nowadays have several tools
to avoid ads, as for instance Adblock, to block ads on the internet, or TiVo, a TV channel
box with abilities to choose what show users want to watch and with the ability to fast-
forward commercials. Advertising firms need to find solutions to fight this new
strategies in order to still be able to reach out their consumers This research, studies a
new strategy to reach consumers attention, offering presenting ads through a gaming
structure, offering them incentives to watch ads and only showing them ads which they
would be interesting in.

26
2. Objectives
The study has the goal to address the question ‚How does a quiz format, incentives and
targeted commercials affect users’ attention and brand recognition?‛ In other words the
main objective of this study was to study how variables such as a quiz structure,
incentives and targeted ads would influence users focus on commercials to enhance
their memorability and consequently their brand recognition.
3. Research Methodology
This research was conducted following a quantitative paradigm, of a descriptive nature,
using as collecting instruments, a quiz simulator based on a questionnaire, to test
participants’ attention, one questionnaire, grounded in the Theory of Planned Behavior,
to test participants’ brand recognition and one survey, to assess participants’ opinion.
The study was designed in a continuous logic structure of collecting, compiling,
analyzing and presenting results.
This was an exploratory research, which traced as its main goal, to understand which
research design was best to conduct, to better comprehend this problem not fully
researched yet. Due to the lack of depth of this particular type of research, it is
important to highlight, that this study was not meant to draw absolute conclusions, but
to find reasons to conduct future researches in this direction.
27
4. Work Structure
The present study was divided in six chapters, in order to present all information in a
structured and logical process.
The first chapter tells the story of the evolution of mobile advertising, explaining its
roots since it’s the traditional way until nowadays techniques and problems. The
second chapter explains the concepts of the three strategies, tested in the experiment,
incentives, targeted ads and gamification. Chapter three shows the groundings of this
works’ methods and procedures. In chapter four all methodologies are explained and
all tools and procedures are demonstrated. Chapter five has the purpose of presenting
all meaningful results found after compiling all data collected. In the end, the main
conclusions of the outcome of the data collected are exposed, limitations are explained
and suggestions for further research on the topic are pointed out.

28

29
1. Advertising Evolution
1.1. Digital and Social
Digital 1.1.1.
The world is always in constant evolution and, nowadays, there are two very different
ways businesses are conducted, analog and digital.
Throughout the analog approach, there is a sense of trust, and communication is more
interpersonal (Zimmermann, 2011). Connection between organizations and consumers
is what propels the economy and evolution. This connection gets stronger amongst all
business parties, when business activities are conducted ‚the analog way. An analog
approach is the key factor of business transactions. Human relations between
employees, owners, customers and stakeholders are vital to success, and take time to
build (Wheeler and Lanza, 2014). However, digital technologies changed the way firms
and consumers interacted with one and other (Susarla, Oh, and Tan, 2012).
Information Technology (IT) is a new approach, and, it is equally important and
necessary. In ancient times, IT strategy was just at a functional-level strategy, in order to
be aligned with the firms’ business strategy (Henderson and Venkatraman, 1993).
Nonetheless, digital devices came to life. Nowadays, companies can be completely
digital and firms, that are not embracing technology, are struggling to keep up. The
speed of new technology is making tech firms acquire specific qualities appreciated in
our society. Their growth has become alarming to ‚classic companies‛. The digital way
is a new approach, to sell communicate and distribute products. It is non-stop 27/7, cold
and productive and usually means more quantity and less quality. The traditional way
can be more affective and it develops relationships with the consumers. It uses its

30
human-touch to reach out and conquer their loyalty. However, these two forces can be
connected and work with each other (Wheeler and Lanza, 2014). More and more digital
and analog methods are present in everyones’ lives. They are both important, as each
one brings something valuable for consumers’ experience. For instance, a study on
shoppers from UK and US, with ages from 20 to 40, found that 65% of UK, and 55% of
US subjects, first go online to search for products, then go into a physical store to try out
the product they have seen on the website, and in the end, they buy it online. This new
shopping method is increasing its popularity and has already a term to describe it,
‚Show-rooming‛. The study also found, roughly one-third compare product in-store
prices, using their mobile device, before making a decision to purchase a product (Seth,
2014).
Social Media 1.1.2.
Consumers now have a much more important role in a firms’ marketing process. Firms
rely part of the design experience to their consumers, by including them in products’
features and design processes (Berthon, Pitt, McCarthy, and Kates, 2007). From Schmitt
(2012) point of view, as consumers are part of the marketing machine, they should not
be treated as passive information recipients, but as active participants. Consumers are
behaving as co-creators for most firms’ communication strategy. Marketers have a new
role. Their job is to drum attention through engagement and not only reaching out.
Online social marketing is executed in all social networks, where all consumers own
their virtual space. Facebook, Twitter, LinkedIn are the most well-known social
platforms and should be dealt together, as a combined tool of communication. Most
companies treat social networks as individual platforms and normally do not consider
them as part of the marketing machine.

31
More and more, social media is blending with traditional media (Hanna, Rohm, and
Crittenden, 2011). Social media advertising, delivers an ongoing direct line of
interaction, where firms and consumers can share thoughts, ideas, feelings and
emotions, throughout the day. This endless connection, is what builds a strong
relationship consumer-brand, and constructs a firms’ history, where the consumer is not
just a mere buyer, but a part of the ‚building‛ and an endless fount of crucial feedback
(Murdough, 2009). From these bullet points, consumers build their memories, happy or
sad, and develop opinions, perceptions, images and experiences (Keller, 2009).
According to Beck (2007), social media has an influential effect on how communications
are performed, not only in an individuals’ personal life but also in his professional life.
Social networks did not change completely the way how employees and the
organization communicate. However, new media applications, such as email, forums
and chat apps, transfigured the way communications are chained. Pathak (2015) defend
social networks can also have negative effects on a working environment, as they can
emerge risks for firms’ network security, network performance, bandwidth capacity,
information leaks and privacy. Although, they assert companies should enable access to
certain social websites, in order to increase workers’ productivity. This level of access
can establish a greater level of trust between workers from all hierarchies. Productivity
comes to how much an employee produces and how well can he produce a given
resource (Bernolak, 1997). Employees, who use social networks, have a 9% increase in
productivity, as this applications help individuals be more socially accepted and overall
better persons in the workplace. Employees, connected through social networks,
develop interacting skills and become better at solving problems within the firm
(Pathak, 2015).
Chui et al. (2012) study reveals, social marketing can increase enterprises workers’
productivity, up to 20%-25%, in activities such as reading and answering emails,
search/gather information and intra/intercommunications. The study affirms only 72%

32
of the companies operate these social capabilities and only a small percentage uses them
in depth. The institute also states, most of the powerful social tools are still to be
explored, and will have an important role in communications, sharing information, and
cooperation with other firms (Chui et al., 2012).
The world still suffers from lack of knowledge, when it comes on how to engage
consumers in a creative way, to power their attributes. The strategy is still learning from
consumers and let them decide firms’ brand engagement process (Keller, 2009). Even
though it is still not at its full potential, firms are increasingly betting on this type of
promotional communication. In 2013, firms spent $4.1 billion in ads through social
media. This number was expected to increase to $5 billion in the following year
(eMarketer 2013). eMarketer (2013), also stated, a majority of marketers already saw
social marketing with good eyes. These last few years, there has been an incredible
change, how firms communicate and how social marketing was embraced as a mean to
engage consumers. Social media advertising was increased throughout the globe, with
an increase of 56.2% (eMarketer, 2005). In a Social Media Industry Report, Stelzner
(2013) stated 86% of marketers believed in social media as an important channel to
communicate with users and potential consumers. Also they stated this type of media
was also beneficial, for branding, product research, customer relationship management,
customer service and sales promotions. Two years later, the same Social Media Industry
Report, Stelzner (2015) states 66% of marketers claimed they will enhance social media
in the future for better performance. The study also reveals the most important social
platforms for marketers are Facebook and LinkedIn (52% and 21%, respectively).
Opposed to the idea, social media platforms are just a virtual space to place photos and
post status updates, this networks have unique characteristics, for efficiently targeting
customers, flowing information, and for intra-organization communications, like for
instance employing best practices to Employees ( Pathak, 2015). This type of media
sources of engagement, are transforming society daily routine behavior. Consumers are
33
participating in an array of activities online, where they share content, news, opinions
and review events and products. This type of media sources, are transforming society
daily routines, and with this behavior changes, firms are also adopting these virtual
spaces to communicate with their consumers, or their potential buyers. Murdough
(2009) believes social media has an important role, when it comes to advertisement for
firms. Furthermore, he believes this role is increasing, which indicates sharing and
communication, through social platforms, is becoming one of the main channels of
advertising for companies. Marketers can take advantage of social platforms by, using
them for paid advertising displays, building a brand persona, engaging with customers
and publishing branded content. Even though consumers’ role in firms‘ social media
strategy had become more important over the years, Hutton and Fosdick (2011) studies,
defend another perspective. They mention, consumers’ top three activities in social
media platforms are naturally passive. These activities mainly involve content
consumption and represent most of time spent on social media. Another important
factor that may result in less engagement from consumers is the interpersonal aspect,
meaning, consumers’ only will engage with a brand that helps them build a positive
self-image online (Schau and Gilly, 2003). This type of engagement has its consequences
and they can be either good or bad (Mangold and Faulds, 2009). These types of issues
are important to marketers, as they must build their brand strategy according to these
behaviors, in order to augment purchase desire. Huang and Mitchell (2013) ascertained,
consumers may develop negative emotions, if they feel a brand is not following the
same values as them, or that it is creating a one-sided way relation where it is not
respecting their wishes and desires. Even though, some scholars might find social
networking to be less relevant than others, it is imperative to note that these virtual
worlds changed the way people interact with each other, thereby made firms adopt
them to advertise their products, as well.

34
1.2. Advertising
Marketing 1.2.1.
Marketing is a wide concept and it was mentioned by Keith’s article (1960), as a process
in constant evolution, which gives organizations stronger entities (Keith, 1960). Kotler
and Zaltman (1971) corroborated the same idea by defining marketing as methods and
functions accounted for understanding costumers, determining what their needs are
and how to satisfy them. One important activity inside the concept, is Advertising, most
commonly interpreted as a synonym. While Marketing consists in understanding
consumers’ needs, Advertising is one of the activities used to present the products to
fulfill consumers’ needs. This two concepts are abruptly different, being ‚one inside the
other‛ (Bennett and Cooper, 1981).
Advertising definition 1.2.2.
Armstrong and Kotler (2000) established the definition of Advertising as, ‚any paid
form of non-personal presentation and promotion of ideas, goods, or services by an
identified sponsor‛ (Armstrong and Kotler, 2000). Leo Burnett, a Marketing Guru,
compared it to ‚selling corn flakes to people who are eating Cheerios", while Marshall
McLuhan set as "the cave art of the twentieth century". Daniel Starch resumed it as
‚selling in print‛, and named it ‚the simplest definition of advertising‛, referring to an
ancient quote, from 1904, when John E. Kennedy defined advertising as "salesmanship
in print". Of course, this definition was related to the old media where ‚print‛ was the
primary channel of communication (Richards, 2002). Scholars brought a broad
definition for an equally broad concept, which led to distinct interpretations. .

35
According to (Schultz, 1995), when consumers think of the term advertising, they first
thoughts are commercials, promotional activities, from sponsorships to telemarketing.
However academics and industry professionals, are more meticulous and don’t
consider all promotional efforts as advertising (Rust and Oliver, 1994). Some consider
certain activities as other types of marketing, such as sales promotions, promotional
products, direct marketing or public relations. Even though professionals and scholars
agree on this matter, some activities like word of mouth or product placement in
movies are still a two activities that present doubt on whether they are or not a form of
advertising (Richards, 2002).
Advertising research models 1.2.3.
The first formal well known model for advertising was AIDA (Attention - Interest -
Desire – Action), designed by E. St. Elmo Lewis, in 1898 (Strong, 1925). Lavidge and
Steiner (1961) called this type of models "hierarchy of effects". This type of models has
been highlighted to explain the advertising phenomena. Furthermore, other studies
have been conducted in order to understand the parameters behind a successful
advertising campaign. For instance, the effects of frequency of exposure and scheduling
were studied by Fletcher (1980), market response was studied by Clarke (1976) and
Assmus et al. (1984). Throughout the years, advertising business has been suffering
major mutations, due to technology breakthroughs (Richards and Curran, 2002). Even
though the world of advertising, changed to a more interactive way, traditional
advertising did not disappear, it just mutated and adapted to the circumstances.

36
Advertising evolution 1.2.4.
The world evolved, and advertising, that once was only for powerful companies, is now
for everyone. This change is due to new technologies advancement, such as internet,
smartphones or social media. As previously said, social media altered the way people
connect to the world and facilitated communications. Digital media has transformed
advertising into an interactive experience. From digital media, new advertising
methods emerged, such as internet ads and interactive TV ads (Aymerich-Franch, 2014).
Questions as How and What to do to create better and more powerful advertisements,
were put on the table (Kolsaker and Drakatos, 2009). Thanks to this problem, many
scholars have been working on this subject, in order to find other advertising formats.
For example, van Reijmersdal et al. (2005) discovered that advertorials were positively
accepted, as the ad was perceived as a co-sender, which gave it more trust. Likewise, a
study from Sheehan and Guo (2005) found programmed content also received better
acceptance, due to clean blend between advertised products and the TV programs.
Advertising effectiveness 1.2.5.
The Ad itself doesn’t constitute all the responsibility for its effectiveness. Many
academics, state that an advertising message relies on other factors besides itself, like
for example, the environment where the consumer is exposed to it. Several elements can
be responsible for effecting advertising variables (cognitions, recognition, attitudes, and
intentions), such as context-induced arousal or involvement), context-induced mood or
affect and thematic congruence between editorial content and the ad (Dahlén and
Edenius, 2007). Ducoffe (1995) claimed, advertising effectiveness can be quantified by
its advertising value. Through his study he analyzed the role of advertising value and

37
classified its parameters. Other research highlighted advertising value as a way of
forecasting consumers’ intention and attitudes towards advertising (Liu et al., 2012).
Ducoffe (1995), also stated consumers’ perception of utility of an Advertising campaign,
is what defines its value. The effectiveness of that same campaign was measured by the
degree of consumer fulfillment when stomped upon the ad (Pavlou and Stewart, 2000).
1.3. Internet Advertising
Online ads transfigured Internet into an effective advertising channel, notorious by its
delivery, custom design and high interactivity. This type of media had a remarkable
growth since 1994, when the first banner ad was published online (Lohtia et al., 2003).
There are several advertising types of media firms can use in the ‚www‛ world. Some
examples are buttons, banner ads, and pop-up ads, paid text links, sponsorships, target
sites, superstitials and e-mail ads. Internet was a combination of different types of
traditional media, such as TV, radio, magazines, newspapers, direct mail and
billboards. Scholars found that if we compare traditional media with the internet, the
conclusion is that internet is a goal- and task-, directed, more interactive and better to
find information. In 2002, NTIA affirmed, online purchases were increasing in an
unpredictable way. The spread was explained by online market unique benefits
(Eroglu, et al., 2001). Online shopping began to be the preferred method, firms used to
reach their desired revenue.
Nevertheless, in 2001, Kearney concluded, that 82% of consumers shopping online drop
out their purchase intention before completing the transaction (Kearney, 2001).
Following studies, associate these failures with lack of interest by costumers’ needs
(Rosen and Purinton, 2004). They came to the conclusion; firms should have built

38
websites to highlight consumers’ online experience, instead of shaping their websites
according to their physical stores.
Positive or negative feelings can breed through advertising (Schlosser et al., 1999).
Several reasons are behind both marketers and advertisers disappointment with the
internet. The story is repeating itself. First, towards traditional media and now are
Internet ads. In other words, long ago studies revealed consumers were starting to
avoid ads in the ‚old media‛, due to wide spread and common use of this strategy for
most companies (Zanot, 1984). Well, this previous trend is now also attacking modern
media, as consumers are starting to develop a feeling of disgust and annoyance by ads
and only want to avoid this ‚plagues‛ invading their virtual space. Tsang, Ho, and
Liang (2004) discovered that generally, consumers don’t have a good attitude towards
advertising.
In order to confirm these negative signs, we can look at the evolution on click-through
rates (CTRs) on internet banner ads, starting from the very first banner published by
HotWired.com, in 1994 (Briggs and Hollis, 1997). By the end of 1995, CTRs were 2% and
in 1998 they declined to 0.5% (Duffy, 2001). Technological developments, are delivering
consumers’ new ways to avoid traditional advertising. Traditional advertising, like TV
commercials and print ads has reached a point of saturation. New hybrid techniques
and integrated advertising methods are coming to life (Balasubramanian, 1994). The
problem of this evolution results from the fact that, it facilitates the promotion of
products and events, and that nowadays society is filled with ads everywhere.
According to Godin (1999), everyday consumers can be exposed to 3500 ads during
their daily affairs, which is beginning to be too much and is starting to be annoying.
People learned to deal with this plague by mentally block ads from their minds,
creating a new phenomenon named ‚advertising schema‛ (Friestad and Wright, 1994,
1995) According to Hoch (2002), (Stafford and Stafford, 2002) an ad is interpreted as a
39
persuasive endeavor, which it makes consumers skeptic towards it and, consequently
diminishes its power (Dahlén, 2005). Several other scholars, have been working on this
matter (Dahlén, 2005; Friestad and Wright, 1994, 1995; Stafford and Stafford, 2002).
More is not always better. Ha and Litman (1997) work, is a good example to corroborate
this idea, as they found that when magazines use an excessive number of ads, each ad
reduces its individual effectiveness, magazine diminishes circulation and, consequently,
loses profitability (Dahlén and Edenius, 2007). Moreover, other scholars also studied
this event. With it, a new term was created, ‚banner blindness‛. Banner Blindness was
defined by Benway (1999) as a phenomenon describing users’ ability to deviate their
eyes from every piece of design that looks like an internet banner Ad. Even though, the
story of ad avoidance seems to be repeating itself with Internet, this type of medium has
a lot of differences from traditional media. Therefore, this new ad blindness is different
from traditional media and its effects are more powerful than traditional media. There
are several theories which help comprehend banner blindness, such as Perceived Goal
Impediment, Perceived Ad Clutter on the Internet and Prior Negative Experiences.
Perceived Goal Impediment 1.3.1.
As mentioned before, internet is more of a goal oriented tool, which, according to Li,
Edwards, and Lee (2002) Internet advertising gives users the perception of being more
intrusive than other types of media. Krugman (1983) found that when consumers are
Web browsing and an ad slows or interrupts their journey, which may result in
negative feelings towards the ad and consequently ad avoidance.

40
Perceived Ad Clutter on the Internet 1.3.2.
Perceived Ad Clutter is the consumers’ perception that the number of advertising
promotions in a virtual space is exceeding its capacity. Speck and Elliott (1997) defined
ad clutter as consumers’ perception of an excessive amount of advertising for a specific
timeline, and concluded, that can be responsible for the ad effectiveness. Perceived ad
clutter is driven by the number of advertising ads.
Prior Negative Experiences 1.3.3.
Prior knowledge is responsible for intervening in the process of consumers’
information, as brand perception, purchase desire, product evaluation and overall
organization of thoughts (Bettman and Park, 1980). Experiences help an individual gain
new information, which can transmit in new attitudes and perceptions (Fazio and
Zanna, 1981; Smith and Swinyard, 1982). Consumers value more their personal
experiences, and tend to formulate their conclusions based on them, which leads them
to choose more efficient methods of practice and decisions (Hoch and Deighton, 1989)
Therefore, consumers can develop bad thoughts, driven by bad advertisement
experiences, which can result in radical decisions, as ad blindness (Bettman and Park,
1980). Consumers can be annoyed by advertisers that communicate messages in an
intrusive and abusive way (Sandage and Leckenby, 1980). Advertisers are trying to
patch up this inevitable outcome, including promotional messages with program
contents. Marketers are using several types of brand integration, as for instance,
sponsorships or product placement (Newell, Salmon, and Chang, 2006). Brand attitude,
translates not only in the overall appreciation of the product marketed and its
associated brand, but also it is built on other parameters, as consumers’ beliefs, values
41
or consumers’ general enjoyment when stomped upon a promotional message (Bellman
et al., 2014; Mitchell and Olson, 1981). However, the world is evolving, and more and
more gadgets and services are making life easy for consumers to avoid the burden of
watching commercials. If we take a closer look at the TV advertising business we can
easily spot some feature choices consumers have to prevent from having to watch some
commercial ad. The remote control gives viewers, a way to change channel, every time
an advertising ad starts to annoy them. Also the fast forward button of some new TV
boxes (ex: TiVo) is another application that threatens traditional media to desist
altogether on TV business (Bronnenberg et al., 2010; Taylor, 2013). Another major
trouble issue is the new daily routine of millennials, multitasking. Multitasking during
tv commercials is increasing. A study from Monahan (2011), demonstrated 63% of TV
impressions are not viewed basically because users are not paying attention to TV. A
method used to fight this problem, is by mixing branded content and interactivity
together, meaning insert advertising techniques inside a tv show (Cauberghe and
Pelsmacker, 2006)). One practical example of this technique put it to action, was in a
famous sitcom, Friends, when they decided to allow viewers to purchase items seen
during the show, like Jennifer Aniston’s sweater (Leddy, 2001).
1.4. Mobile Advertising
Mobile industry 1.4.1.
Mobile phones have the advantage of being highly portable, being always connected
and being extremely personal devices. Many mobile services are highly used by
marketers and advertisers, including email, online purchases, shopping alerts and
location based services (Mort and Drennan, 2007). Mobile devices are now consider

42
normal or essential in our society (Balasubraman et al., 2002). Specialists place mobile
advertising as an important pillar, concerning mobile business developments (Bulander
et al., 2005).
Mobile Advertising 1.4.2.
Mobile Ads were defined as a text- and graphics- based message meant for commercial
purposes communicated through mobile devices (Peters et al., 2007; Soroa-Koury and
Yang, 2010). Haghirian et al. (2005) defines mobile advertising, as transmission of
messages with advertising purpose, transmitted through a handset. Okazaki et al.
(2012) established as visual or text messages that help gain new customers via mobile.
Mobile technology creates new markets, a new competitive landscape and new
opportunities to cultivate businesses (Stewart and Pavlou, 2002).
How it works 1.4.2.1.
Mobile advertising is employed in two different modes, push or pull. While mobile
push strategy occurs when marketers send advertising to mobile devices without
consumers’ request, a pull strategy takes place when consumers ask for more
information about the firm, or daily updates and news (Dickinge et al., 2004). Push
strategy has the challenge of needing prior acceptance from users. Godin (1999)
massified this approach of requesting consumers’ permission before engaging them
with advertising messages. Mobile ad spending is directly related with the number of
smartphone owners. As the number increases, consumers’ trust in mobile commerce
also increases. Consequently, more websites get adapted to a mobile structure and more
apps appear on the market (Rosenkrans and Myers, 2012). One of the most important
43
channels for advertising is through mobile. M-Commerce is already studied by
academics, used by professionals and spoken by the media (Hsu and Kulviwat, 2006;
Leppaniemi and Karjaluoto, 2005; Varshney and Vetter, 2002).
Mobile advertising evolution 1.4.2.2.
WorldNet TPS, predicted that mobile advertising, in the next 3 to 4 years, would
achieve the same as E-commerce achieved in the last 15 years (Duane et al.,2014).
Through mobile market growth, advertising had, more than ever, a superior reach
(Richard and Meuli, 2013). Shabelman (2007) projected a 42% increase in mobile
advertising spending, from 2006 to 2010, meaning from $871 million to $1.5 billion,
respectively. Expansion of mobile market has brought a new channel of communication
for firms to show and sell their products. In 2013, Mobithinking exposed global mobile
advertising revenue would raise up to $11.4 billion in 2013 and it predicted it would
increase to $24.6 billion in the end of 2016 (Kim and Han, 2014). In 2014, Social Media
Industry Report revealed 43% of marketers surveyed had a mobile-optimized blog. In
2015 this percentage raised to 50% (Stelzner, 2015). Mobile advertising, has been
adopted by organizations with global attention, as for instance, McDonalds, P&G,
Microsoft and Coca-Cola (Wei et al., 2010). Some researchers have inclined their work in
a matter of technology issues regarding mobile advertising (Li and Du, 2012).
Purchase 1.4.2.3.
Researchers, stated it is imperative to study more about consumers’ attitude towards
mobile ads in order to understand how to positively affect them into making a purchase
(Nittala, 2011). A JiWire’s survey, in 2010, determined, more than 50% of participants,
already engaged with at least one advertise from a mobile app. Also, in the same

44
survey, 20% of individuals who engaged on Ads had purchased a product from the ad
they clicked (Jay, 2013). Purchase intention is influenced by consumers’ attitude
towards a specific product/service (MacKenzie et al., 1986)). A practical example is Lady
Gaga’s application that gave users the possibility to purchase clothes, worn in concerts
and video clips, via digital devices, like pc, smartphones or tablets. This advertising
technique had its flaws, as this type of ad was highly distracting to consumers which
translated in divided attention, meaning it was not beneficial to either parties
(Brechman et al., 2015).
When we talk about intention to purchase, we need to talk about flow. This theory,
formulated by Csikszentmihalyi and LeFevre (1989) defined Flow as an immersed
experience a person gets when it is fully focused in a task. People are so involved in an
activity that their attention is just that activity and nothing else. Flow results in a state of
mind where consumers get immersed in an enjoyable activity that lets them,
momentarily, with lack of conscience. Csikszentmihalyi and LeFevre (1989) state Flow
is as a state of mind with a defined objective, feedback, skills, focus, loss of self-
consciousness, lack of time passing, and enhanced value of an ordinary task. Further
research, classified flow by one-dimensional parameters that ranked this theory in
different perspectives, framing a new model (Hoffman and Novak, 2009). Novak,
Hoffman, and Yung (2000) conducted a study where it discovered 47% of consumers
already experienced this phenomenon. Online flow was defined by Hoffman and
Novak (1996) as a cognitive status consumers lived through while they were navigating
online. According to him, it enhances consumers’ will to browse and it can end in a
product/service acquisition. Their model evaluates online flow by: a) level of
skill/control; b) level of pressure/persuasion; c) level of focus/ attention; d) level of
engagement/interactivity. Several researches, corroborate them by affirming flow incites
customers to browse, purchase and repeat (Agarwal and Karahanna, 2000; Koufaris,
2002; Luna et al., 2002; Smith and Sivakumar, 2004). Additionally is important to

45
reiterate, flow has been used to clarify usage of internet, software Agarwal and
Karahanna (2000), and online games (Hsu and Lu, 2004).
Interactivity 1.4.2.4.
Previous approaches do not transmit the complete definition of mobile definition, as
they miss out three main characteristics of this type of marketing, and classified it as a
mass media strategy. Balasubraman et al. (2002) set mobile marketing as custom made,
interactive and as an individualized experience. According to several researchers,
interactivity has an important role, helping mobile ads to be accepted by consumers
(Cho and Cheon, 2005; Drossos et al., 2007; Gao et al., 2009). With the advances in
technology, modern ways of marketing are appearing, and with that, advertisers are
betting on interactive ways to advertise their products/services (Pavlou and Stewart,
2000). The online world is much appreciated by marketers to try out interactive
advertising (Loughney et al., 2008)). Also, by Kannan et al. (2001) standards, ease of
appliance of interactivity is the secret to a good advertising strategy in mobile devices.
Interactive advertising can be beneficial in recognizing users’ interest in the
product/service showed in the ad (Bellman and Varan, 2012). Likewise, it introduces a
new method of persuasion, which can increase awareness and deliver new kinds of
content (Sicilia et al., 2005). Several scholars have beetled the importance of interactivity
when a company wants to promote a product through a mobile platform. They
highlight that if they print a certain degree of interactivity into a mobile ad, then there is
a higher possibility for the user to retain positive outcomes from that same ad (Lustria,
2007). Yu, Paek, and Bae (2008) referred, interactive ads in mobile devices, are not only
influencial for the respective ad but also to products and brands the ad is representing.

46
Mobile advertising benefits / limitations 1.4.2.5.
A study conducted by Rosenkrans and Myers (2012), had the goal of understanding the
difference in effectiveness between a non-mobile banner and a mobile banner. The
experience took place in a newspaper website, by evaluating the click-through rates of a
mobile banner vs two non-mobile banner of 728x90 and 300x250 pixel. The ad was on
for 3 months in the website venturacountystar.com. The results were significantly
different, the mobile ad had a 0.17% click‐through rate (CTR) and the non-mobile
banners had 0.06% and 0.05% respectively, which can be considered a huge difference
in effectiveness.
CTR measures ratio of clicks to impressions (Rosenkrans and Myers, 2012; Schonberg et
al., 2000). Haghirian et al. (2005) state the rapid mobile advertising spread, reflects the
power of reaching everyone, every time, everywhere. Peters et al. (2007) even adds that
using mobile phones a firm can deliver a promotional message in the most perfect time,
place and with a more funny and interactive approach. Another important benefit is the
ability for brands to communicate with individuals, that are less accessible the media
platforms or media in general (Ferris, 2007). MobiAD, in 2010, affirmed mobile ads are
in most cases cheaper than a more traditional advertising strategy (Jay, 2013). This type
of advertising should be used nevertheless. When applied, mobile capabilities can be
very effective, like for example location-based Ads, when merged with coupons benefits
(Bellman et al., 2014; Duane et al., 2014; Goldman, 2010; Jayasingh and Eze, 2009).
Geolocation technology provides advertisers to send users commercial messages
through their mobile phone, according to their actual physical location. From this
location-based techs, we can highlight features like Bluetooth, wireless application
protocol (WAP), global positioning systems (GPS) (Leppäniemi et al., 2006). A survey
by JiWire, in 2010, regarding consumers’ attitude, exposed to a mobile promotional
message, concluded that approximately 50% of the individuals who participated in the

47
experiment, would willing to share their physical location in order to receive location-
based mobile ads. This survey also came to the conclusion that consumers are keener on
advertising, when they are in motion, rather than when they are at home. Furthermore
the questionnaire, also found the public accepts better promotional ads via mobile.
Mobile advertising effectiveness depends on several factors. One major factor relates to
the audience, the ad is targeted for (Jay, 2013). Summarizing, mobile devices have new
features capable of engaging with consumers in a more personal way, as Salo and
Tähtinen (2003) claimed when affirming, advertising via mobile is much more personal
than traditional routes, where consumers often appear in an anonymous. Although,
concerns pointed out, indicate issues regarding sensitive information from consumers’
side, such as their current location or their interests and daily activities. Therefore
marketers have the task of analyzing mobile systems and services, as mobile
advertising, to determine which ones are well received by consumers, and apply them
with caution and responsibility (Ferris, 2007; Mort and Drennan, 2007; Okazaki and
Hirose, 2009).

48

49
2. Incentives, Targeting and Gamification
2.1. Incentives
One of the biggest challenges marketers face nowadays, comes from how to motivate
consumers to focus on advertisement. As previously mentioned, advertising can be a
great cause of intrusiveness and lead to higher levels of annoyance among consumers.
This issue is known to produce negative behaviors towards ads and, consequently,
negative behaviors towards the brand itself. Rettie et al. (2005)research, focused on this
particular problem, and reached to the conclusion, it can be mitigated when advertisers
add relevance and value, such as discounts or special offers. They affirm this type of
strategy has the possibility to increase consumers’ acceptance for advertising
campaigns. Others studies completed these findings by coming to the conclusion,
incentives increase click-through rates (Hupfer and Grey, 2005; Xie et al., 2004).
According to Bellman et al. (2009) consumers were positively open to the idea of having
to click on an impulse banner ad to get free samples. Varnali (2012) stated there are two
types of incentives, monetary and non-monetary. On one hand, incentives as discounts,
gifts and discounts are some examples of a monetary approach. On the other hand, non-
monetary benefits have intrinsic value like status upgrades, level-ups, or premium
feature rights (Kim and Han, 2014). However, Rettie and Brum (2001) discovered,
benefits by monetary incentives have substantial influence in users’ willingness to
receive advertising messages. They even found, financial incentives have a significantly
better level of acquisition than other type of incentives. Likewise Drossos and Giaglis
(2005) work was coroneted, in the idea that economic incentives help advertisers
implement multiple promotional strategies, such as coupons, rebates, price packs, and
contests. Offering samples as incentives also is another route, a marketer may use to
50
capture users’ attention. Studies such as Marks and Kamins (1988) considered sample
incentives as a great way of introducing new products/services in the market. Hupfer
and Grey (2005) additionally added, samples can also provide a possibility of attracting
consumers that have less patience and are goal directed search individuals.
Mobile Incentives 2.1.1.
Advertising, in mobile industry, is also highly influenced by the offering of incentives
to consumers. A survey from In-Stat (2005), found nearly half of the individuals
participating in the study, were on behalf of, having advertise in their mobiles in
exchange of incentives as premium features. Air2Web (2003) said, mobile advertising is
more effective when consumers receive some incentive for their attention and
disposition to visualize commercial ads. Air2Web, from 2003, even adds brands might
even be harmed if consumers don’t receive a suitable compensation (Hanley et al., 2006).
A study, for mobile ads in shape of commercials, from the Mobile Marketing
Association, in 2007, found 41% were willing to watch ads if they were offered free
mobile videos. Also, the study found, 20% would watch the commercials, if they were
offered free mobile TV or a reduced fee for the same purpose (Hanley and Becker,
2009). Tsang et al. (2004) found a connection between consumer attitude, intention and
behavior, concerning mobile marketing. They also concluded, consumers’ intention to
receive an SMS-based mobile ad, may increase, when some kind of incentive is
provided. Furthermore, their research was focused in the connection between consumer
attitude, intention and his behavior concerning mobile ads. From a study, grounded on
Taiwanese individuals, it was concluded, that mobile ads should require previous
permission before engagement, and by providing incentives and entertainment,
consumers’ attitude might improve favorably. However, several studies obtained
different results on consumers’ attitude towards incentivized ads. For instance, Mobile

51
Marketing Association conducted a survey, with more than 11,000 U.S mobile
subscribers, and discovered 11% of applicants between ages of 18-24 years old, were
keen on the idea of receiving mobile coupons (Hanley et al., 2006).
Age 2.1.2.
According to Salo and Tähtinen (2003), marketers usually use college students to
introduce mobile marketing strategies, and motivation towards accepting such
techniques, can revolve around several variables. One important variable is the age of
consumer. Barwise and Strong (2002) concluded the same by highlighting that
consumer age is a robust influencer when we evaluate the power of using incentives in
mobile ads, over its technological acceptance. For instance, their research discovered
that younger consumers were more inclined to accept to engage with an ad, comparing
with older consumers, when offered with incentives. Hanley, Becker and Martinsen
tested students in college concerning their level of willingness, when facing mobile
advertising in exchange for incentives. The experiment, came to 3 significant numbers,
29% of college students would accept mobile ads if they get some kind of incentive, 51%
will not accept ads even with incentives and 66% would accept ads if they would get
paid. The study also came to the conclusion, young adults are more inclined to consider
mobile ads than the general mobile phone population (Hanley et al., 2006).
2.2. Targeting and personalization
Mobile marketing industry is has grown significantly fast in the last years, and part of
the reason this happened, was the unique capabilities, mobile has to know who is the
consumer, where he is, and what is he. A study from eMarketer, in 2013, found that U.S

52
adults spend time in non-voice mobile applications, more than one hour a day, and that
overall mobile usage and receptivity have grown (Ashley and Tuten, 2015). An ad is
more appealing when it revolves around their preferences and their relevant content
(Robins, 2003). Furthermore, in order to gain publics’ attention, an Ad should focus on
consumers purchasing routines, using a personalized message (Xu and Gutierrez, 2006).
Message Relevance 2.2.1.
The message relevance, points to how much a promotional message, relates with
consumers’ cognitive and/or affective needs (Celsi and Olson, 1988). Relevance of the
message has been assigned as one of the imperative factors for messages’ perceived
value, and consequently, consumers’ behavior towards the ad (Ducoffe and Curlo,
2000).
Rettie et al. (2005) corroborated these findings for mobile industry as well, affirming
consumers, who consider mobile advertising messages more relevant, are more inclined
to visit a web site, visit a store, reply to the message, enable access to personal
information, engage in word of mouth, or buy the product. Several studies found
various elements that may have influence on a mobile advertising message relevance
(Okazaki et al., 2007; Varnali and Toker, 2010). These variables enable unique
personalization and targeting strategies, considered critical for mobile ad to successfully
capture consumers’ attention (Varnali and Yilmaz, 2010). Intrusiveness, as previously
mentioned, is one of the biggest problems when it comes to mobile advertising and,
according to Krishnamurthy (2001), relevance of a promotional message content, is not
only to make it more interesting but also to reduce intrusiveness. In a study conduct by
Varnali, two processes are considered effective to improve the relevance of a message:
targeting and personalization (Varnali, 2012).
53
Targeting 2.2.2.
In 2015, a research, carried out by Pradeep Korgaonkar, Maria Petrescu and Eric
Larsson, studied mobile advertising effectiveness, and targeted for Hispanic-Americans
vs non-Hispanics-Americans. The experiment consisted in a questionnaire about their
mobile preferences and habits, as well as their mobile attitude towards mobile
advertising. Athwart the results, they found Hispanic-Americans have different
attitudes concerning mobile advertising from non-Hispanics-Americans (Korgaonkar et
al., 2015). Varnali (2012), defines targeting as the ‚identification of users who are likely
to be interested in the subject/content of the mobile marketing campaign (establishing
content relevance) at the time of message delivery (establishing contextual relevance)‛.
In other words, targeting is the process where a brand identifies its potential clients,
studying their interests and establishing the perfect context to present a product. Mobile
advertising brings unique capabilities such as location sensors and perfect timing
responses, which increases significantly the context where the product is announced
(Varnali, 2012). Consumers’ behavior towards advertising messages depends on the
location. For instance, consumers are more inclined to click in an ad from a place near
their location (Ghose et al., 2013). This explains the response affection to promotional
offers, being related to the retailer proximity (Luo et al., 2014). Danaher et al. (2015)
claims, even inside a shopping mall, store distance may affect ad response. Targeting is
considering a persuasive and effective strategy and is widely accepted not only
amongst consumers, but also amongst industry professionals. BIA/Kelsey survey, in
2014, found a locational targeting, has been a strategy abruptly used in the industry,
with 40% of the 11.4 billion spent solely in the U.S, in 2014 (Fong et al. 2015). For
example, in 2013, an mBlox study found 47% of its applicants would provide their
location in order to receive interesting offers and discounts. In the same study 57%,

54
considered short message system (SMS) or push notifications as two persuasive
approaches to receive promotional offers (Fong et al. 2015).
Personalization 2.2.3.
Varnali (2014) defines personalization as the message ‚degree to which it is tailored to
meet the needs, wants, and characteristics of a target segment of consumers‛ (Varnali,
2012). Personalization inputs in a promotional message, inserts features as incentives,
familiar sources to increase credibility, custom visual and text designs, to fit the
cognitive style of a consumer, and the custom languages to be more suitable for
consumers (Varnali, 2012). Smartphone technology allows features with tracking
capabilities according to costumers’ routines and demographics. In addition to this fact,
smartphones bring a new level of targeting in line with different context or recently
events (Xu et al., 2008). Location-aware features can help advertisers to communicate
their message reaching individual consumers from their physical location, using a
mobile device. This functionality facilitates substantial information and promotes a
great level of personalization (Richard and Meuli 2013). With the inclusion of
personalization, effects from targeting message relevance are more powerful. Both
processes are linked, and one without the other can’t be fully effective. Furthermore, he
refers that to positively implement both processes, it might imply building large
consumers databases, which leads to complex data mining algorithms and high
maintenance costs (Varnali, 2012) .

55
2.3. Gamification
Printed materials, TV commercials, website banners, videos and mobile advertising are
some of the tools used by marketers nowadays. However, a new type of media
advertisement has recently come to life, advergaming, and is already becoming popular
and successful. For instance, in the US it was projected to reach $68 billion by 2012 (Goh
and Ping, 2014). Gamification uses game practices and regulations, applied into a non-
gaming environment, and was introduced in 2010 as a non-gaming term (Robson et al.,
2015).
Advergames 2.3.1.
Advergaming can be defined as the inclusion of promotional messages in a game, to
promote a brand or a specific product, during the time users are interacting with the
game (Mallinckrodt and Mizerski, 2007). Advergames have natural interactivity which
contrasts with the effects on other types of advertising such as product placement in
movies and television programs. Online video web sites, as Hulu and ABC.com created
frameworks, where advertisers can publish video ads, with an interactive improvement.
These platforms give marketers, the ability to engage users while showing them
products, which turns this method into a more enjoyable experience for consumer,
meaning, it turns them into advergames (Goh and Ping, 2014). Advergames aren’t
structured to be played for hours straight, instead they are designed to be played for
minutes and are for all kinds of players, since casual gamers to experienced gamers.
Usually it is easy to master game mechanics, and their main objective is to enhance the
message, provided from its brand (Winkler and Buckner, 2006).

56
Advergame Mechanics 2.3.1.1.
Previous studies nominate three imperative design components that provide the
answer for advergaming effectiveness; Expectancy, Fit and Interactivity (Heckler and
Childers, 1992; Palmer, 2002; Vessey and Galletta, 1991). As interactivity increases in an
advergame, players’ motivation also increases, and with it, their brand perception and
will to play the game increases as well. These advertising messages, shown during
gameplay are proved to be more powerful and convincing when a player is fully
immersed in the gaming experience (Raney et al., 2003). Furthermore, if users
demonstrate positive emotions towards a game while playing it, these emotions can be
translated into positive emotions towards the brand through transportation experience
(Glass, 2007; Green et al., 2004; Homer, 2006). In other words, players who actually are
enjoying playing the game, will have a friendlier attitude towards the brand promoted
in the game (Wise et al., 2008).
Advergame types 2.3.1.2.
There are several types of advergaming. For example, there are advergames, where
promotional ads appear in the background, inserted in billboards. One example of
advertising messages on background is billboards from a car racing game. This type of
advergaming can be also called, in-game advertising, and is a much smoother way to
include advertising messages inside a gaming environment. This type of games help
players to absorb the ad implicitly, and not be disturbed by it. In-game ads have more
probability on skipping unnoticed by users’ conscience and being only noticeable by
users’ subconscious mind, which helps advertisers, not dealing with consumers’
negative reactance towards the ads (Edwards et al., 2002). Other types of advergames
are the standalone games that can appear on web sites. A practical example of an

57
advergame specially made for marketing purposes is game designed from Pepsi, where
the aim of the game was basically for players to catch Pepsi cans falling from the sky.
This game was a branding example, with simple mechanics of moving right or left an
empty basket to catch Pepsi cans falling from the sky, where every player would
immediately learn how to play and master the game (van Reijmersdal et al., 2012).
Effects on children 2.3.1.3.
These games have an explicit approach to leading consumers’ thoughts into the brand,
while playing. Prior studies, found that advergames are indeed an effective way of
advertising, particularly when used on children (Lee and Faber, 2007; Van Reijmersdal
et al., 2012; Wise et al., 2008). Marketers target children, as they usually possess a great
weight in families’ budget and their consumerism addiction (Buijzen and Valkenburg,
2000, 2003; Garde, 2008).
Limitations 2.3.2.
Meanwhile most reviews see advergaming in good eyes, scholars, as Friestad and
Wright (1994) are more skeptic, when it comes to this subject. According to their
research, advergames use an aggressive approach to transmit their promotional
message, and this route can be, in the eyes of some users, excessive, and consequently
can drive them to resist communications. However, Kim, Lim, and Bhargava (1998)
state, this negative behaviors transmitted by explicit branding campaigns, can balance
by transferring positive effects. Nevertheless, is important that advertising is well
inserted in the gaming environment. The promotional parcel must be in perfect
symphony with game theme and context. This way is easy for gamers to understand the
connection between the two parts, and better understand games’ story and purpose.
58
Prior research found that when an advergames are coherent and understandable,
consumers have a positive perception towards advertised products / brands
(Hernandez et al., 2004). For instance, if a travel agency wants to create a custom made
advergame, it should create one in the same context as its brand, meaning, it should
develop a game using a travel-related context, in order to make sense in gamers’ minds
(Wise et al., 2008). Most times, the game used to promote a brand is specially made for
this task and its only goal is to present the brand with an engaging and interactive
approach (Wise et al., 2008). Opposing to traditional media, where consumers just
observe in a passive state, advergaming brings users closer to the experience, as
individuals have the possibility to engage with brand elements. Researchers add, that
consumers demonstrate better attitude, in response, memory and focus towards an
advergame, where its context is well mixed up with the brands purpose (Suh and Lee,
2005). To understand this media advertisement method, is important to highlight the
interactive approach that helps captivate users and transmit friendly behaviors towards
the brand. In the end, advergames, brings them closer to the message firms want to pass
on (Dahl et al., 2009).
59
3. Theoretical foundations
3.1. Mobile research theories
Being this business model, meant to be applied using mainly smartphones, the study
was grounded in theories used in mobile technology, concerning users’ acceptance. The
most generally applied theories in the mobile field of study, embody Theory of
Reasoned Action (Fishbein and Ajzen, 1977), Innovation Diffusion Theory (Rogers,
2004), Optimal Stimulation Theory (Hebb, 1955), Theory of Cognitive Dissonance
(Festinger, 1957), Technology Acceptance Models (Davis, 1989) and Uses and
Gratification Theory (Katz and Blumler, 1974). Throughout these engineered models,
researchers Leppaniemi and Karjaluoto (2005) elected several parameters responsible
for conditioning consumers accepting mobile technology. He catalogued them by three
different fields: industry, medium and consumer. Also some researchers included
Demographic parameters as another significant field, when analyzing consumer
acceptance (Barnes and Scornavacca, 2004; Carroll et al., 2005; Leppaniemi and
Karjaluoto, 2005; Rettie and Brum, 2001; Tsang et al., 2004). Example of industry
parameters, are technological devices (ex: devices, networks, standards), time
transmission, complexity, user adoption, easy-of-use, compatibility, government
policies and industry guidelines (Leppaniemi and Karjaluoto, 2005). Example of
medium parameters are interactions market-to-consumer, context, costs, incentives
adoption, and permissions (Barnes and Scornavacca, 2004; Martin and Marshall, 1999;
Stewart and Pavlou, 2002). As Consumer parameters we have, advertising attitude,
involvement level, innovation level, stimulation response, trust, control and risk. As
Demographic parameters we see, age, gender, income and education as some possible
examples (Barnes and Scornavacca, 2004; Carroll et al., 2005; Leppaniemi and
60
Karjaluoto, 2005; Rettie and Brum, 2001; Tsang et al., 2004). Other reasearchers who
studied consumer acceptance models for mobile advertising, used other parameters,
such as advertising value and content, Haghirian et al. (2005) entertainment value and
information value (Bauer et al., 2005), permission, content, wireless service provider
control and brand trust (Barnes and Scornavacca, 2004; Carroll et al., 2005).
Furthermore, Krishnamurthy (2001) highlights message relevance, customization,
privacy costs, message processing costs and monetary benefits, as other relevant mobile
advertising parameters for consumer acceptance.
3.2. Brand Recognition and Memorability
The present study was meant to evaluate participants’ memory and brand recognition.
Both these elements have been known to be linked and studied together.
Brand recognition can be considered when users have the competence and knowledge
to identify a certain brand after establishing first contact (Wixted and Squire, 2004).
Memorability is known to be evaluated through recall and recognition (Gillund and
Shiffrin, 1984).
Researchers appealing to eye-tracking technology concluded that users’ have better
chances to memorize information, when they pay more attention(Goodrich, 2011;
Intraub, 1979; Loftus and Kallman, 1979; Wedel and Pieters, 2008). High levels of
attention increases time to better process a determined advertising message (Yun et al.,
2005). During a promotional video, attention is not always at the same level throughout
the whole movie. Attention rate over video duration has a shape of a parable, reaching
its peak in the middle of the movie, meaning users are more focus in the middle of the
movie (Lloyd and Clancy, 1991). However with quiz basis users have a reason to be
fully focused over the entire movie. If a message captures users’ attention it goes from
61
sensory memory to short term memory, or working memory (Schweppe and Rummer,
2014). Recognition presents the best sensitive memory to evaluate whether a message
was encoded (Lang, 2000). Encoded messages have better odds to be transferred to long
term memory (Schweppe and Rummer, 2014). Therefore, short term brand recognition
can be determinant to enhance brand recognition in long term memory as well. This
experience tries to enhance users’ attention in order to improve their memory over the
advertising videos, asking them questions at the end of each video. This way, users
have more probability to have better brand recognition on the short term memory,
which can after lead to long term memory.
3.3. Questionnaire foundations
There was no study that could prove, asking questions related to advertising video,
increased brand recognition. However a quiz structure was already used as an
advergame in prior research, meaning this structure was already considered an
advergame possibility (Bellman et al., 2014).
All questions were posted in the questionnaire, in order to enhance brand recognition.
Videos were all used in TV broadcast and taken from the public video platform
Youtube.com. Moreover, prior research found that high involvement in advergames
lead to lower brand memory, due to cognitive capacity constraints (Grigorovici and
Constantin, 2004; Nelson, et al., 2006). Therefore a quiz game can be considered not a
game with high levels of involvement. Some work has been done relative to presenting
in an ad video, aspects like the brand name or the slogan. Chaney et al. (2004) found
that brand/product recognition depended on how products/brands were demonstrated,
as pictures or in words. According to scholars presenting the brand name or slogan may
62
increase brand recognition. The slogan has been proved to positively influence brand
recognition by Stewart and Furse (1986).
Brand 3.3.1.
As for the brand name, more thorough research has been made:
Brand name can appear in shape of both visual and verbal aspects of the respective
video.
Brand appearance in the video is an important factor which can result in enhanced
brand recognition.
Visual 3.3.1.1.
All texts, characters and images from the video can be considered as visual aspects of
the movie. According to Romaniuk and Lock (2008) there is a strong good relation
between brand recognition and visual frequency. Other scholars corroborate
Romaniuk’s findings (Scott and Craig-Lees, 2006; Stewart and Furse, 1986).
Verbal 3.3.1.2.
All sounds and speeches are considered Verbal aspects of the movie. Likewise, verbal
frequency has been already linked to brand recognition. Three research studies
established a positive relation between them (Pavlou and Stewart, 2000; Stewart and
Furse, 1986; Stewart and Koslow, 1989; Walker and von Gonten, 1989). However two
Romaniuk’s point out that this link is not effective when the experience is conducted in
a natural environment, such as the subjects’ home.

63
Dual mode 3.3.1.3.
The two previous brand execution tactics have been proved to be more effective when
matched together. This combined tactic, has been tested positive not only in
experimental environment and pretests, but also in natural environments (Brennan and
Babin, 2004; Gupta and Lord, 1998; Law and Braun, 2000; Romaniuk and Lock, 2008).
Duration 3.3.1.4.
There is little relation between brand recognition and movie duration. Several studies
were made in accordance to this important aspect none returned a positive connection
between duration and brand recognition (Romaniuk and Lock, 2008; Stewart and Furse,
1986; Stewart and Koslow, 1989). However Romaniuk and Lock (2008) found that when
brand is placed more than ten seconds it can have positive association with brand
recognition.
Product Information 3.3.2.
Asking questions about product attributes is not proven to enhance brand recognition,
however repeating product attributes more than once in a commercial may contribute
to brand recognition. By asking questions at the end of the video, the effects may be the
same as watching the commercial all over again as it may repeat the specific scenes in
consumers’ head, when they try to remember the answers. This way, at least the
products information will be in their heads one more time. Lautman and Dean (1983)
research faces this question and returns with evidences that confirm that repeating
product attributes twice has a marginal effect on consumers brand recognition.

64
Non product related questions 3.3.3.
This question includes all audio sounds, visuals and characters that are not related to
the brand and product, but are there to context the product into an appealing story that
can persuade and relate to consumers. Again, asking these questions is not proved to
help with brand recognition, but some of these elements are important for consumers to
fix and associate with the brand like for example celebrities hired to promote the
product in the commercial. For instance, Friedman and Friedman (1979) suggest that
using celebrities in ads, may increase ad recognition, Mapes and Ross (cited by Ogilvy
and Raphaelson, 1982), found that the use of celebs in ads resulted in a 22% increase in
ad recognition. Additionally, Petty et al. (1983) found that product recognition can also
be improved when using celebrities. Nevertheless, this type of questions should not be
the focus, as they can lead to less brand recognition. Researchers concluded that some
cues inserted in the ad may help distract users from the important aspects of the video,
branding and product information. For instance, according to Bello et al. (1983) the use
of sexual/decorative models may increase motivation and ad recognition (Lachance et
al., 1977) but at the same time, it can result in less brand recognition (Lachance et al.,
1977; Steadman, 1969) and less brand thoughts (Severn et al., 1990).
3.4. Feedback foundations
In society, individuals can be influenced by several elements to behavior in a specific
way, meaning individuals can be predictable according to their actions, behaviors and
attitudes. The Theory of Planned Behavior is one of the most acclaimed theories to
study behavior predictions. This theory was developed by Fishbein and Ajzen (1977)
and transmits how humans have particular behaviors. The theory of planned behavior

65
was constructed in order to surpass limitations from the theory of reasoned action
(Ajzen and Fishbein, 2004). According to this theory, when individuals have time to
decide how to behave, the best predictor of that behavior is individuals’ intention.
Behavior intention, has been established by Fishbein and Ajzen (1977) as the
individuals’ perception over a determined behavior performance. For example, most
actions that are not involuntary, usually come from users intention, like eating, going
out with friends, playing football. However intention does not completely illustrate the
‚actual intention‛.
Depending on the outcome of each element, the strength to predict ones intention
would be determined. This theory already been used in several field of studies, as for
instance, e-coupons (Kang et al., 2006), environmental issues (Sparks and Shepherd,
1992), smoking business (Godin et al., 1992), e-commerce services (Bhattacherjee, 2000),
sustainable products (Kumar, 2012) etc.
This theory is divided in three elements; attitude, subjective norm and perceived
behavioral control (Fishbein and Ajzen, 1977). According to (Ajzen, 1991), the more
positive an individuals’ behavior is, towards an attitude, subjective norm and perceived
behavioral control, the better his/her probability to perform that behavior.
Attitude 3.4.1.1.
Attitudes can be described as evaluations of people, objects, events or ideas. They are
generally individuals’ opinion over thoughts and things which can be positive or
negative. For example, Zeithaml (1988) states, that purchase intention reveals the users’
willingness to buy a certain product. Therefore, they will have intention of purchasing a
product if they have positive feelings toward a brand or product. Prior research already
affirmed, attitude has tremendous effect towards intention (Korzaan, 2003; Taylor and
Todd, 1995).

66
Perceived Behavioral Control 3.4.1.2.
Perceived behavioral control relates on how much control the individual has over the
environment, meaning how easy or difficult would be a determined task to be
accomplished (Ajzen, 1991). This element reflects control beliefs that influence a specific
behavior, fostering it or blocking it. Scholars already established that perceived
behavioral control influences directly intentional behavior (Taylor and Todd, 1995). The
higher the individuals’ trust in his/her capabilities, the higher is the probability of a
positive outcome for a determined behavioral intention.
Subjective Norm 3.4.1.3.
The last element refers to how normal and ordinary a particular task would be in order
to be accepted by others as well. In other words, what is the degree of approval this task
or action would have, among society (Ajzen, 1991; Ajzen and Fishbein, 1975).
Users are subjected to peer pressure, meaning they are normally influenced by their
groups in life, like family, friends, school mates, etc. Even though, scholars named
Subjective Norm a direct influencer on behavioral intention, not only in theory of
planned behavior (Ajzen, 1991; Venkatesh and Davis, 2000) but also in theory of
reasoned action (Ajzen and Fishbein, 1975) some research state the opposite,
considering that there is no direct link between subjective normal and behavioral
intention (Davis, 1989).

67
4. Research Methodology
4.1. Question and Purpose
This master thesis describes a problem in nowadays society and explores the idea
potential, through an experiment which simulated and tried to understand its
effectiveness. The problem revolved around advertising industry and its ineffectiveness
with consumers, especially, traditional advertising strategies in mobile phones, internet
and TV, such as banner ads and TV commercials. The problem, already described and
explained previously, in the background theme, allowed to test a combined advertising
method, with a purpose of improving users’ attention, and interest towards
promotional messages. This research was aimed to understand behaviors from five
hypotheses or five scenarios, testing out users’ attention and brand recognition,
regarding three demographic parameters, age, gender and occupation. These
parameters tested the effectiveness of commercials when presented in a quiz game
structure, when presented only commercials according to users interests, and when
offered incentives for users’ attention.
This research was meant to find out if consumers are more concentrated watching
commercials when:
H1, questioned whether confronting users with targeted ads would be beneficial for
their attention.
H2, questioned whether rewarding users with incentives would be beneficial for their
attention.
And ultimately analyze what is the difference in brand recognition for H3, H4, and H5:

68
H3, questioned whether presenting users, commercials in a quiz game structure would
be beneficial for their attention.
H4, questioned whether confronting users with targeted ads would be beneficial for
their brand recognition.
H5, questioned whether rewarding users with incentives would be beneficial for their
brand recognition.
4.2. Methodology
This research was conducted with a quantitative paradigm and aimed to describe
particular behaviors and attitudes regarding advertisement. Its methodological
approach followed a descriptive nature and a logic order.
First, a literature review was conducted, in order to gather information on prior studies
concerning mobile industry, advergaming, incentives and targeting ads, so that it was
understood the prior work done in this field of studies. Secondly, was important to
collect information by creating a platform which simulated this type of strategy, in
order to collect field data and real experiences from a tested subject sample as well as
participants opinion on the business model idea. For that, a questionnaire was put
together where users had to watch commercials in a shape of a quiz game with
questions related with their interests and with a rewarding system. Additionally, before
the game, users’ provided their demographic information, as gender, age and
occupation. After the simulator, a feedback survey was also constructed, to understand
users’ opinion on the business model idea and the best method to prototype it into a
real product. This particular survey was grounded in the Theory of Planned Behavior
(Fishbein & Ajzen, 1977), following instead a hypothetic-deductive logic. After this, one
month later, another test was sent to the same subjects, to test out their brand

69
memorability on the same brands which appeared on the quiz simulator. Thirdly, was
important to compile all data, collected from the two experiments and surveys, to better
comprehend the outcome of the combination of each method on the study and each
demographic variable influence over them. This part was meant to discuss the results in
order to formulate theoretical assumptions. Lastly, was important to conclude which
results had meaningful importance over the experiment, mentioned each assumption
constructed followed by a plausible topic of further research for future work on this
field. Additionally was important to mention each limitation of the current study
followed by suggestions of improvement for future research.
Regarding studies’ depth, it was an exploratory research, meaning that there were no
significant conclusions to be expected. Instead, the study was meant to address a
problem with high level of uncertainty, and little research, in order to help further
investigations to have better grounds and direction.

70
Questionnaire foundations 4.2.1.
This present study focus on evaluating elements, such as attention and brand
recognition, and relying on a quiz method to help users stay focus and memorize
promotional messages and giving them a visual possibility to read one more time each
brand and relevant product information. Therefore, if a user memorizes a brand asked
in a quiz video, it can lead to better brand recognition in the short term, as previously
explained in (subchapter 3.2). Furthermore, questions regarding product information
or even non-product aspects from the video can be result in better brand recognition, as
mentioned in subchapter 3.3.
The questionnaire followed the design and method from FIGURE 1, evaluating the
combination of three strategies. The quiz structure was considered and evaluated as an
advergame strategy, which was already mentioned in subchapter 2.3. Likewise both
H3
H4
H5
Interactivity Quiz structure
Customization/Interests
Incentives
Attention H1 Brand Recall
H2
FIGURE 1 - Operational Framework – Attention and brand recall.

71
customization and incentives were also mentioned and explained in subchapter X and
X, respectively.
Feedback foundations 4.2.2.
Five questions were asked to users in order to assess participants’ opinion on whether if
a game functioning with the business model tested, would be well used by them
(FIGURE 2). This survey was grounded in the Planned Behavior Theory, by Fishbein &
Ajzen (1977), helped predict participants’ behavior on whether they were going to
accept this business model. (Subchapter 3.4)
The five questions were divided by the three elements; attitude, subjective norm and
perceived behavioral control.
Disposition
Time
Time/Day
Devices
Idea
Subjective Norm
Attitude
Behavioral Intention to use
Perceived Control Behavior
FIGURE 2 - Feedback theoretical model grounded in Theory of Planned Behavior.
72
Attitude 4.2.2.1.
From this element two questions were assigned to evaluate users’ perception on
whether this game and, consequently this business model would be a positive or
negative idea:
Question 1 – What do you thing of the idea? – ‚Idea‛
Question 3 – how much time you would you spend playing this game? – ‚Time‛
Perceived Behavioral Control 4.2.2.2.
From this element three questions were assigned to evaluate users’ perception on
whether this game would be easy or difficult to include in their lives.
Question 2 – Would you be willing to play this game? – ‚Disposition‛
Question 4 – Where would you thing this should be implemented? – ‚Devices‛
Question 5 – How much time would you be willing to spend playing a day to reach a 10
euro prize until the end of the month? – ‚Time/Day‛
These questions were formulated to understand what would be the best gaming
features to facilitate users’ acceptance, over the intended game. If the game was
according to users choices over these three questions, their intentional behavior would
have more probability of being positive.

73
Subjective Norm 4.2.2.3.
Subjective Norm had no questions to evaluate its level of importance concerning
intention to adopt the tested business model. The reason why Subjective norm did not
have any question associated was because this business model was not thought to have
any controversial topics or matters that could result in some kind of hostile opinions
from society towards who would use such game. However some scenarios were
thought, just for reassuring purposes that would put this app in check for users. The
first scenario came from the fact that this business model rewards people prizes for
their time watching commercials. Due to the fact that nowadays the world, lives in
societies who are blocking or running away from ads, maybe this type of method may
offend people who hate advertising, because they are giving this firms more ways to
interfere with peoples’ lives. Additionally some people might think that it is a waste of
time watching commercials to earn prizes when you could be working for something
useful in society. This type of concerns may incite peer pressure for users that might
have liked to play this game but were somewhat embarrassed or persuaded not to play
by their friends, family or society in general. Also we could highlight cultural issues this
app might have in some countries or religions.
Nevertheless, if this tested had a question to understand the level of persuasion for a
subjective norm, it would be a multiple choice question with five options (FIGURE 3).
FIGURE 3 - Hypothetical question for Subjective Norm

74
Options’ order was from the best answer on top to the worst answer on the bottom,
being the middle one the most neutral. In other words, if participants chose the first
one, it meant that Subjective Norm would be the most positive answer possible. On the
other hand, if users chose the last one, Subjective Norm would be the most negative
answer possible.
4.3. Tools and Procedures
This subchapter, presented each choice made and explained the reason how it was
done.
The experimental phase took place online, meaning each user participated in a
questionnaire, via PC, tablets or smartphones. The questionnaire was constructed with
Google forms and the results were compiled and analyzed through a custom built
Microsoft Excel file. The Experiment had 160 participants, and was focused more on
people ranging ages between 18 and 30 years old. Subjects were contacted via Facebook,
through a common message and a link to Google forms survey. Likewise some
participants were encouraged to share the test with their friends and family.
Approximately 400 people were contacted to conduct this experiment, which gave it a
return rate of approximately 40% of positive responses. Subjects had a window of 10
days to participate in the first survey.
Pretest and semantic test 4.3.1.
First of all, a pretest would be recommended to conduct in order to ensure every
question was perceptible and understandable to participants, as well as every video
(Hult et al., 2004). However a pretest would involve a significant amount of rules and

75
statistic research, which would be translated in a complex analysis and significant
amount of time spent. This test means, usually five times the number of questions
asked.
Nevertheless, a semantic analysis was conducted in order to comprehend if the
experiment was perceptible to users, special questions asked, by selecting five
individuals from the used sample to test out the experiment and return some feedback
on the their opinion about the questions perception, choice of videos and evaluating
their practical method strategy playing the game.
Online quiz simulator and survey data collection 4.3.2.
The experiment, provided users the possibility to play a quiz game, where its questions
were about commercial advertising campaigns. The test began presenting a slide with a
general description on what was the experiment all about, and the three variables that
were being tested: questions’ format, interests and prize. Also, it seized the opportunity
to alert applicants to the limitations of Google forms software and requested them to
only watch the videos one time, in order to collect results with more precision.
Demographic
variables
Quiz
with
interest
Quiz
without
interest
Prize
with
interest
Prize
without
interest
Prize
without
interest
F
M
F
M
F
M
F
M
M/F M/F
FIGURE 4 - Diagram representing quiz simulator operations sketch
76
Additionally, this first slide announced, the experiment would be divided into three
phases, personal info, questions and feedback. Throughout the entire questionnaire,
users were obliged to fulfill all questions before advancing to the next phase (FIGURE
4).
Demographic parameters 4.3.2.1.
The first phase was responsible for asking individuals demographic questions, such as
age, gender, occupation and email address. This phase was inserted in this experiment,
due to the fact that it was necessary to conduct a survey to better adjust users’
experience to the commercials collected. Likewise, this phase was used to better
comprehend the results afterwards, giving the ability to segment users’ performances,
according to specific parameters, and also detect and nullify biased variables. The test
did not ask the exact age. It sectioned in ranges, ‚less than 18 years old‛ (<18), ‚between
18 and 30 years old‛ (18-30) and ‚-‛ (>30). As for Occupation, users had also three
choices, ‚High School Student‛ (HS), ‚College Student‛ (CS) and ‚Non-Student‛ (NS).
These two questions were constructed in a multiple choice system. The other two
questions were more generic, as the gender was also multiple choice and had two
choices, ‚Male‛ and ‚Female‛. Email was asked as a short answer text, perceived by
data validation for email addresses.
Commercials 4.3.2.2.
In the second phase, users were confronted with commercials, which could be followed
with, questions about those same commercials. This phase was divided into three
categories, ‚QUIZ Game‛, and ‚QUIZ Game with PRIZE‛ and ‚Commercials with no
game‛ (FIGURE 4).

77
First category, QUIZ Game, presented video ads in shape of a quiz game, where, firstly,
a video, with a duration ranging 20 seconds and 2 minutes, was shown and afterwards
three questions about this video were asked. The category included four videos,
separated in two groups, where the first group was composed with videos according
the participants’ interests, and the other two were just generic videos. Users had to
focus their attention in each advertising video, in order to answer questions correctly.
The attention had to be in terms of a wide number of parameters, such as sound, text,
colors, as the answers could come in text inside the video, or be spoken, or even be
pictured it. Videos were collected via YouTube, which gave users the ability to fast-
forward and rewind it, as many times as they wanted. Is also important to highlight the
fact that videos, according to users’ interests, were targeted, according to their gender.
After answering to all questions, participants proceeded to next category, the ‚QUIZ
Game with PRIZE‛. This category was design the same way as the previous one, having
also two groups, one with two videos, according to gender interests, and other with two
generic videos. However, this phase was rewarded users with a prize if they answered
correctly all questions of the category. The prize offered was common to both genders
and was small but symbolic at the same time. The prize chosen was a small chocolate.
To summarize, both categories had 8 YouTube videos, 12 multiple choice questions,
where two videos were directed to males, other two were direct to females and the
other four were just generic, having each video three questions with three options
assigned, with just one correct answer. Evidently, only for four videos were shown to
each subject, depending whether they were male/female. As for the last category,
‚Commercials with no game‛, participants were presented again with four videos,
provided by YouTube, showing TV commercials. Same as the last two categories, it one
showed four videos split into the same interest/generic groups. The difference of this
category relied, on the fact that it presented videos without questions whatsoever,
which did not give users any reason to watch the ads in the first place, especially the

78
last two ads which did not even assure the projection of interesting ads for participants.
Second phase reached the end, and participants continued to the next and last phase of
the experiment.
Feedback 4.3.2.3.
The third phase was the Feedback phase, and consisted in conducting an actual survey
to assess what users thought of the idea tested, and how did they think it should be
implemented. The survey was constructed following Theory of Planned Behavior
foundations, from subchapter 3.4, in order to predict consumers’ behavior on whether
they would accept such business model strategy. This phase presented users, for the
first time, the actual business model idea that was being tested in the experiment. The
slide showed a written elevator pitch where the idea concept was shortly described, in
order to get users to understand the business model and the reason why the experiment
was made in the first place. The concept was summarized as a platform where the
‚burden‛ of watching commercials is transformed into a QUIZ game, allowing users to
visualize commercials directed to their interests and rewarding them with prizes for
their attention, in case they answer the respective questions correctly. Feedback had five
survey questions, one where subjects
had to give their own opinion about the idea, one where they responded on what
conditions they would adhere the platform, one where they expressed their opinion on
how much time would they willing to use the platform, one that demonstrated where
would they think it would be best to implement the platform, and the last one assess
users’ opinion on how much time would they be willing to spend, using the platform,
in order to reach 10 euros, at the end of the month.

79
Feedback question analysis 4.3.3.
Analyzing more further the structure of each feedback question, all five questions were
intentionally inserted to be able to answer two of the three elements of the Theory of
Planned Behavior; Attitude and Perceived Control Behavior (PCB). All questions were
represented in (TABLE 1).
Attitude 4.3.3.1.
Questions Dimensions Foundation
Context (all questions
appeared in the third phase of
the experiment)
What do you
think of the idea?
Attitude
Planned Behavior Control
(Ajzen, 1991)
1-5 Likert scale (1 = bad idea, 5
= good idea)
How much time
would you spend
in this platform?
Planned Behavior Control
(Ajzen, 1991)
1-5 Likert scale (1 = never use,
5 = daily use)
Would you be
willing to play
this game?
Perceived
Behavior Control
(PCB)
Planned Behavior Control
(Ajzen, 1991)
Multiple choice with four
choices (‚Yes, if offers prize‛,
‚Yes if are related to interests‛,
‚Two answers above‛ and
‚No‛)
Where would you
think this
platform would
be implanted
more efficiently?
Planned Behavior Control
(Ajzen, 1991)
Checkbox with three choices
(‚Smartphones‛, ‚PC‛ and
‚Smart TV‛), and an ‚Other‛
for a custom option
How much time
would you spend
in the platform in
order to reach 10
euros, at the end
of the month?
Planned Behavior Control
(Ajzen, 1991)
Multiple choice with three
choices (‚< 5 minutes‛,
between 5 and 10 minutes‛
and more than 10 minutes‛)
TABLE 1 - Feedback questions - Foundations and context

80
Attitude was evaluated by two questions, the first question, ‚Idea‛, and the third,
‚Time‛. This two questions were the most important questions of the survey, because,
as already mentioned, (Ajzen, 1991) stated attitude reflects most times users’ intention.
So if users’ responded positive answers on these two questions, the probability for them
to play the game would be high. If some of these questions, or both were negative,
Attitude towards the intention of playing this game would be negative as well.
4.3.3.1.1. Idea question
The ‚Idea‛ question gave consumers’ opinion on whether they had a positive or
negative opinion regarding the respective business model. The survey started with a
question on users’ opinion about the concept. This question was constructed in a linear
Likert scale, from ‚1‛ to ‚5‛, where the ‚1‛ represented a ‚bad idea‛ and the ‚5‛
represented a ‚good idea‛.
4.3.3.1.2. Time question
As for the ‚Time‛ question, gave consumers’ opinion on whether they would play the
game, and how much time they would play it. The third question, focused on how
much time would users be willing to spend using the platform. Same as question one, it
was constructed in a linear Likert scale, from one to five, where ‚1‛ represented a
‚Never use it‛ and ‚5‛ a ‚Use it on a daily basis‛.
81
Perceived Control Behavior 4.3.3.2.
PCB was assessed by three questions, the second question, ‚Disposition‛, the forth,
‚Time/Day‛ and the fifth, ‚Devices‛. All questions referred to users’ opinions on
whether what would be the best features and methods that a possible prototype and
final version would have to have, in order to work. According to (Ajzen, 1991), PCB
reflected users’ opinion on whether the game would be difficult or easy to include on
their lives. In other words, if the game adopted users’ options, this would represent the
easiest route for them to adopt the game. On the other hand the other non-chose
options would represent difficulties for them to adopt the game.
4.3.3.2.1. Disposition question
Starting with the question ‚Disposition‛, it gave participants’ opinion on what would
be the best features to have in the game. The second question was structured as a
multiple choice question, where users only were allowed to choose one choice. There
were four choices to choose from. The first and second choice were ‚yes‛ choices, where
their conditions were if they win any prizes and if the ads were according to their
interests, respectively. As for the last two choices, one was with both previous
conditions, and the other was a simple ‚no‛ choice, meaning the users were not willing
to play the game.
A positive intention towards playing the game be easy if the game would have the
features users’ chose in this question.

82
4.3.3.2.2. Devices question
‚Devices‛ question, represented users’ opinion on where should the platform be
implemented. The forth question was constructed in an open check box structure,
where users could select more than one choice. The suggested options were,
‚Smartphones‛, ‚PC‛ and ‚SMART TV‛, having still an ‚Other…‛ possibility where
the applicants could write in a suggestion. A positive intention towards playing the
game be easy if the game would have be constructed in the platform chose by users.
4.3.3.2.3. Time / Day
‚Time/Day‛ question, represented users’ opinion on, how much time users were willing
to spend a day to reach a 10 euro prize, until the end of the month. This fifth question
was structured as the second question, a multiple choice question with only one choice
allowed. Options were ‚less than 5 minutes‛, ‚between 5 and 10 minutes‛ and ‚more
than 10 minutes‛. A positive intention towards playing the game be easy if the game
would corresponded to the time users’ chose to reach the 10 euro price.
Online quiz simulator and survey data compilation 4.3.4.
After collecting all responses, a Microsoft Excel file was created to compile all data. This
Excel page allowed organizing and better comprehending the results of this experiment.
All tools and procedures from the online quiz simulator were explained in more detail
in APPENDIX I.
83
5. Findings and Discussion
This chapter displayed each choice made and explained the reason why it was done.
Results were thoroughly explained, and presented through tables and graphics, when
necessary. At the end of each subchapter an overall conclusion was written, to
summarize each subchapter. The main goal of this exploratory research was to test a
new method of advertising and study its effectiveness in terms of brand recognition.
5.1. Demographic parameters
The test began asking participants to fulfill the first page of the survey with their
demographic information, age, gender, occupation and email address. These questions
were asked, in order to adjust the experiment to participants and to compile results in
greater detail and reach more thoughtful conclusions. It was important to highlight
email was not a demographic parameter however was in this section due to logistics.

84
Age 5.1.1.
As presented in FIGURE 5, age parameter had the highest discrepancy, throughout the
three options, having the majority of participants, ages ‚between 18 and 30 years old‛.
This option had a percentage of 84%, as for the participants with ‚less than 18 years
old‛ and ‚more than 30 years old‛, they were the lowest with only 6%, and 11%
respectively.
This significant difference can be explained by three facts. First, the way participants
were contacted, was through a Facebook network, linked to a person also with an age
18-30, meaning the majority of people who seen this survey link was in the same age
range.
Secondly, it was proved that college students, which usually are individuals with ages
18-30, were the best public to challenge and test this type of experiments, as it will be
explained further along the way in Subchapter 5.1.3.
FIGURE 5 - Graphic representing age parameter
6%
84%
11%
under 18 between 18 and 30 above 30
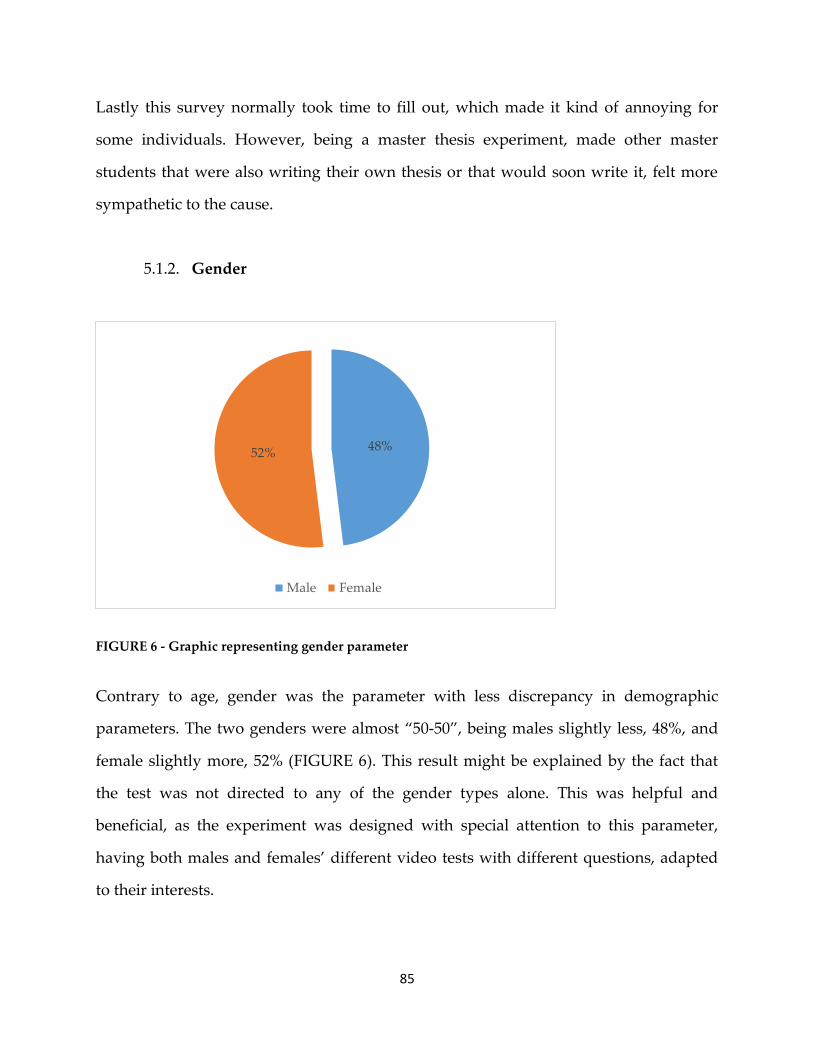
85
Lastly this survey normally took time to fill out, which made it kind of annoying for
some individuals. However, being a master thesis experiment, made other master
students that were also writing their own thesis or that would soon write it, felt more
sympathetic to the cause.
Gender 5.1.2.
Contrary to age, gender was the parameter with less discrepancy in demographic
parameters. The two genders were almost ‚50-50‛, being males slightly less, 48%, and
female slightly more, 52% (FIGURE 6). This result might be explained by the fact that
the test was not directed to any of the gender types alone. This was helpful and
beneficial, as the experiment was designed with special attention to this parameter,
having both males and females’ different video tests with different questions, adapted
to their interests.
48% 52%
Male Female
FIGURE 6 - Graphic representing gender parameter

86
Occupation 5.1.3.
Regarding occupation parameter, results were as expected, similar to age parameter. As
presented in FIGURE 7, CS were again a majority, having 58% of the total individuals.
Through these results, it was possible to better understood participants’ profile.
Analyzing HS, 11/20 students were individuals that had more than 18 years old already,
which could have meant these students were probably already going to college next
year. Almost a third of participants, 30%, were NS, which gave it a fair sample to
evaluate this class, who had high probability of their participants already being
employed and earning their own salaries. This fact might have influenced their
willingness to accept such advertising method, as it was focused on offering incentives
for consumers’ attention. However, this occupation parameter might have not implied
they were all working, which could’ve led to an even more important category,
unemployed individuals. Additionally, it was important to highlight the fact that even
13%
58%
30%
High School student College student Non- student
FIGURE 7 - Graphic representing occupation parameter
87
individuals from other categories might have been working as well, which resulted in
the assumption that another parameter should have been used to understand who was
currently employed.
E-mail 5.1.4.
Finally, email parameter which is important to highlight it was not a demographic
parameter, had its sole purpose to establish the connection between an individuals’
participation in survey one, the questionnaire, and feedback phases, with survey two,
brand recognition phase. Some individuals showed concerns, giving out their email for
the experiment. This fact might have resulted in people abandoning the quiz before
finishing it, or giving a fictitious email just to enter. Due to the email validation
limitations, using false emails was possible, which might have partially explained the
lack of responses on the second survey. Nevertheless, email gave uniqueness to every
participant, helped with data compilation and, at the same time, gave a sense of
anonymity to the test.
5.2. Quiz simulator
Quiz simulator was put together to evaluate participants’ performance, concerning
hypnosis H1,H2 and H3, meaning they were constructed to assess consumers attitude
towards video ads in a shape of a quiz game, according to their interests and according
to the incentives rewarded. Participants were put to the test, when answering questions
regarding TV commercials, and, in one of the three categories, were given an incentive
in case they answered correctly every question of that same category.

88
All tables presented participants from the quiz simulator presented users’ performance
over the questions they answered according to each category and demographic variable
In other words, the overall sum was not meant to demonstrate 100%.
Quiz simulator results were thoroughly analyzed and presented in APPENDIX II.
The graphics and tables constructed gave the possibility to evaluate participants’
performance and acceptance over H1 and H2. FIGURE 8 demonstrated the overall
results of each category. However the results were not what was expected, as the PI,
87%, was not the highest in the table, with 4% less than PWI, with 91%, disrupting H2.
Moreover, this prize category was not even higher than its non-prize rival category, QI
disrupting also H1. Although, results demonstrated there were two questions that were
more difficult than the average, which deviated the expected results. The reason why
these questions were casted aside was explained in APPENDIX II. These results were
the reason why it was necessary to construct another Excel file. The new Excel file was
constructed following the same statistics and tables but without the two biased
questions.
88%
80%
87%
91%
QUIZZ with
interests
QUIZZ without
interests
Prize with interests Prize without
interests
FIGURE 8 - Graphic representing categories performance

89
5.3. Quiz simulator – altered version
Through the exclusion of the two questions that were contaminating the results, the
goal was to compute the numbers one more time to see the differences in performances
on categories, QWI for females and PI, for males. This time numbers turned out to be
according to H1 and H2, after all. As visible in FIGURE 9, Prize QUIZ with interests
reached its peak and became the category with the highest performance. However, it
was less than 1% higher than the other prize category, which meant H1 was not
significant on the prize categories. This time the analysis was only to evaluate the two
variables that changed. The study was constructed according the demographic
parameters used in the first analysis. The discussion was only individualized for this
two variables and the overall outcome was commented, especially in terms of H1 and
H2 alterations.
87.8%
84.5%
91.1% 90.5%
QUIZZ with
interests
QUIZZ without
interests
Prize with interests Prize without
interests
FIGURE 9 - Graphic representing categories performance – altered
version

90
Gender 5.3.1.
The feminine cell, QWI, ramped up to 86%, increasing 8% from TABLE 2. This increase
was not enough to discredit H1 and H2 though, as this category kept still as the lowest
performance, being 1% less than QI, obeying H1, and less 6% than PWI, obeying H2. As
for the male number, it registered a 88%, increasing 7% from TABLE 17. This upgrade
was not enough to confirm H1 or H2, though. The 88% was still 1% lower than QI,
which went against H2. This value was also 1% lower than the prize quiz without
interests, which did not prove H1.
Age 5.3.2.
Less than 18 years old 5.3.2.1.
Gender Participants QI QWI PI PWI Total
Total % Total % Total % Total % Total %
Female 83 434 87% 356 86% 464 93% 458 92% 1712 90%
Male 77 409 89% 385 83% 340 88% 411 89% 1545 87%
TABLE 2 - Gender parameter
TABLE 3 - Ages younger than 18 years old concerning each category
Age Participants QI QWI PI PWI Total
Total % Total % Total % Total % Total %
<18 9 46 85% 45 92% 49 98% 53 98% 193 97%
Male 4 22 92% 22 92% 20 100% 24 100% 88 96%
Female 5 24 80% 23 92% 29 97% 29 97% 105 91%

91
As the previous study, TABLE 3 was analyzed with an overall approach, as the sample
for this age range, 9 participants, was too small to be reliable. In the feminine cell, QWI,
ramped up to 92%, increasing 7%, from TABLE 18, corroborated against H1 and
confirmed H2. As for the male number, it did not altered, as it was already 100%. As
previously mentioned, this table was not discussed further due to the small sample of
this age range.
Between 18 and 30 years old 5.3.2.2.
TABLE 4 - Ages between 18 and 30 years old concerning each category
TABLE 4 was the table with more meaningful results, and the one that enabled to
confirm of discredit H1 and H2 with more credibility. From QWI, results manifested a
high increase in the female cell, from 77% to 85% which translated into an 8% jump.
However, this number was not sufficiently high to oppose H1, as it was still 3% lower
than QI. Likewise, the number did not alter H2 confirmation, as it was still lower than
the 93% on PWI. Regarding the male altered number, PI was increased to 88%, which
was not sufficient to corroborate H2, as QI was still 1% higher. H1 was also not
statistically approved as the 88% was also 1% lower than PWI.
These results allowed making some assumptions. First, as female participants seemed
to have better performances in the prize categories, it was viable to assume that females
Age Participants QI QWI PI PWI Total
Total % Total % Total % Total % Total %
18-30 134 709 88% 616 84% 669 90% 730 91% 2724 92%
Male 64 341 89% 318 83% 281 88% 341 89% 1281 87%
Female 70 368 88% 298 85% 388 92% 389 93% 1443 90%
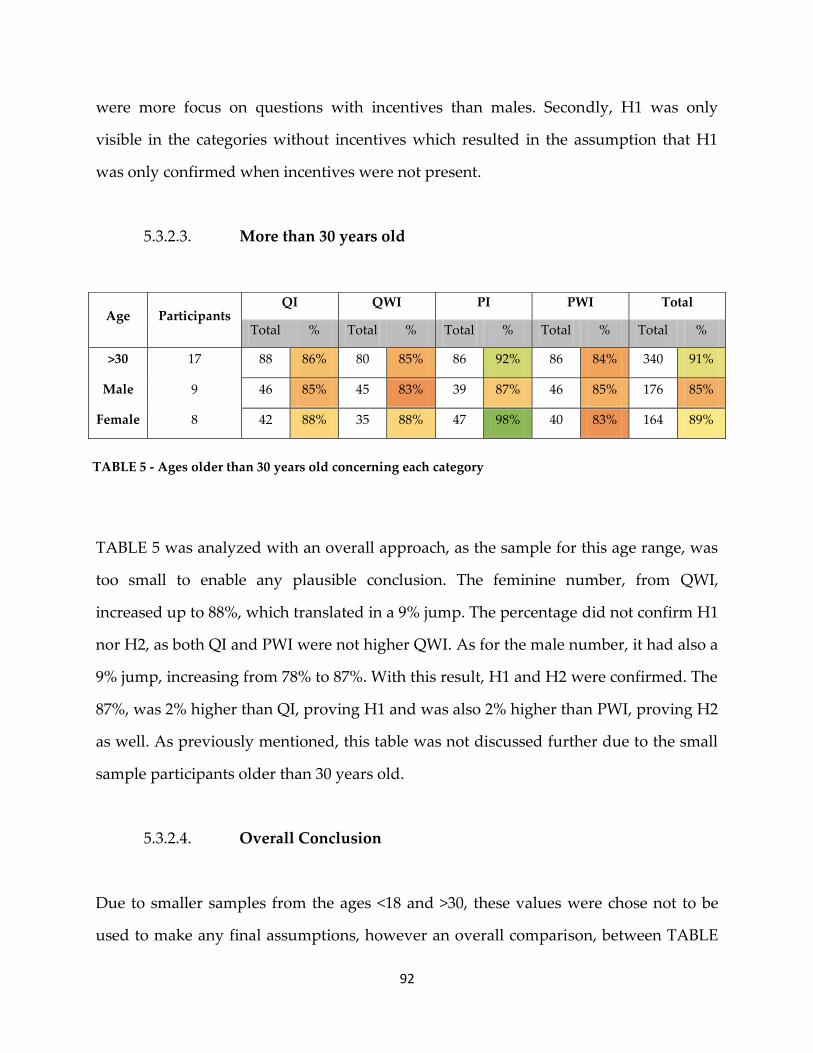
92
were more focus on questions with incentives than males. Secondly, H1 was only
visible in the categories without incentives which resulted in the assumption that H1
was only confirmed when incentives were not present.
More than 30 years old 5.3.2.3.
TABLE 5 was analyzed with an overall approach, as the sample for this age range, was
too small to enable any plausible conclusion. The feminine number, from QWI,
increased up to 88%, which translated in a 9% jump. The percentage did not confirm H1
nor H2, as both QI and PWI were not higher QWI. As for the male number, it had also a
9% jump, increasing from 78% to 87%. With this result, H1 and H2 were confirmed. The
87%, was 2% higher than QI, proving H1 and was also 2% higher than PWI, proving H2
as well. As previously mentioned, this table was not discussed further due to the small
sample participants older than 30 years old.
Overall Conclusion 5.3.2.4.
Due to smaller samples from the ages <18 and >30, these values were chose not to be
used to make any final assumptions, however an overall comparison, between TABLE
TABLE 5 - Ages older than 30 years old concerning each category
Age Participants QI QWI PI PWI Total
Total % Total % Total % Total % Total %
>30 17 88 86% 80 85% 86 92% 86 84% 340 91%
Male 9 46 85% 45 83% 39 87% 46 85% 176 85%
Female 8 42 88% 35 88% 47 98% 40 83% 164 89%

93
3, 4 and 5, was conducted. Looking at the total numbers in each table, it was
demonstrated the younger the participants were best performance. Furthermore the
range representing 18-30 had a sufficiently wider sample, which allowed formulating
two hypothetical thoughts. First, female participants had better performance in prize
categories which gave up the assumption that females’ attention is enhanced when they
are offered some kind of incentive for their attention. Additionally, H1 was only
confirmed in the questions without incentives, which gave up the assumption that H1 is
only manifested when consumers don’t have the option of receiving incentives for their
attention
Occupation 5.3.3.
TABLE 6 also returned meaningful results, concerning H1 and H2 on whether they
were or not discredited. This table allowed assessing H1 and H2, with the altered
results, according to participants’ occupation. Results, concerning HS, were not
accounted for any assumptions and were only discussed with an overall approach, as
the sample was too small to have reliable results. Looking at the numbers in QWI,
where the female cell was altered, CS increased 3%, reaching 84%, and the number
representing NS, increased 5%, from 78% to 83%. These results, corroborated H1 and
Occupation
Participants QI QWI PI PWI Total
Total % Total % Total % Total % Total %
HS 20 99 83% 99 89% 100 92% 110 92% 408 85%
CS 92 496 90% 429 84% 463 92% 505 91% 1893 86%
NS 48 248 86% 213 83% 241 89% 254 88% 956 83%
TABLE 6 - Occupation parameter concerning each category
94
H2 as they were significantly lower QI, confirming H1 and were also lower than PWI,
confirming H2. As for the altered male result, PI, it also confirmed H1 and H2. The
number, representing CS, went up to 92%, being this way higher than the 90%,
representing QI, and confirming H1. The percentage was also 1% higher than PWI,
confirming H2 as well. However, it was clear H1 manifested more significantly through
non-prize categories, enabling the assumption that advertising according to interests
was not as important as if incentives were offered to the user.
Quiz simulator conclusion with altered results 5.3.4.
The two questions that were taken out were in fact the reason why the results were not
what was expected in the first place. However these modifications revealed that H1 and
H2 were only proven partially. These tables and graphics constructed proved that H1,
was only true when there were no incentives to help participants focus on the
commercial. H1 was clearly manifested when users were up against the quiz game
without prize, QWI. Although for the prize questions users had only slightly better
performance for PI against PWI. On the other hand, H2 was proven on both categories,
as the numbers from the prize categories were significantly higher than the numbers
from the non-prize ones. Additionally, it was important to highlight the fact that
females had a significantly better performance on the quiz questions compared to the
male participants, which led to assume females get more focused when incentives are
an option, when watching commercials. In other words this meant that H2 was
confirmed and H1 was confirmed but only on the non-incentive categories.
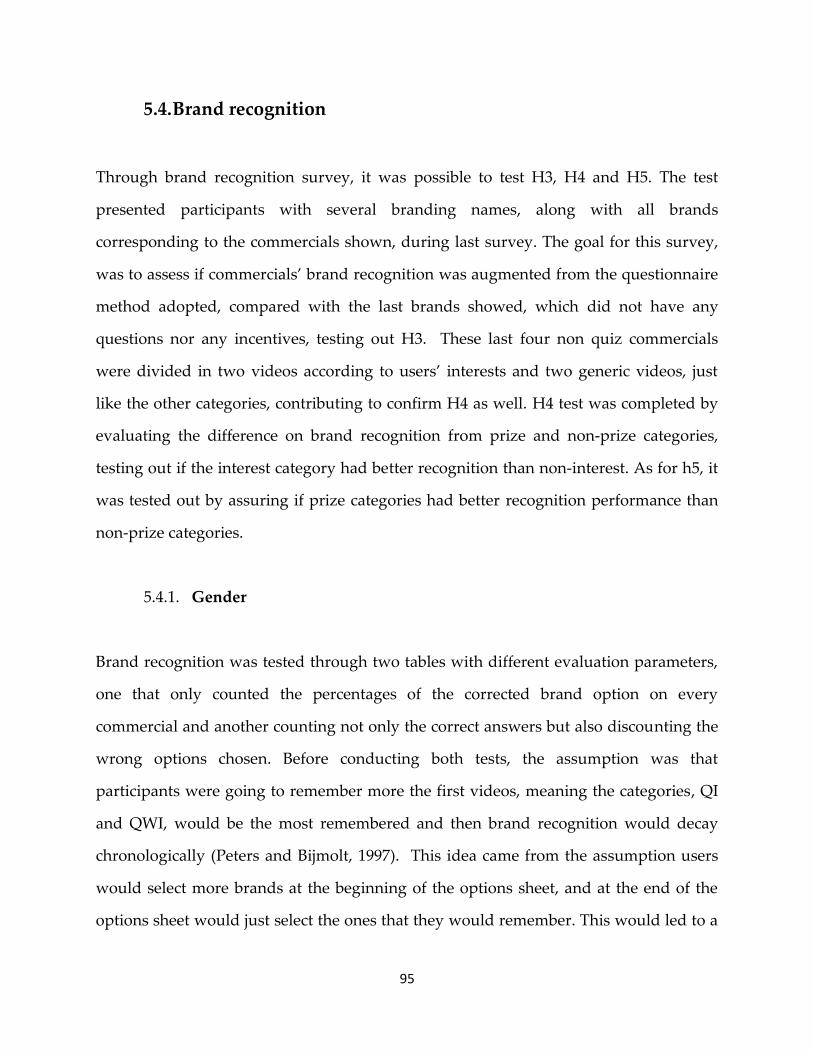
95
5.4. Brand recognition
Through brand recognition survey, it was possible to test H3, H4 and H5. The test
presented participants with several branding names, along with all brands
corresponding to the commercials shown, during last survey. The goal for this survey,
was to assess if commercials’ brand recognition was augmented from the questionnaire
method adopted, compared with the last brands showed, which did not have any
questions nor any incentives, testing out H3. These last four non quiz commercials
were divided in two videos according to users’ interests and two generic videos, just
like the other categories, contributing to confirm H4 as well. H4 test was completed by
evaluating the difference on brand recognition from prize and non-prize categories,
testing out if the interest category had better recognition than non-interest. As for h5, it
was tested out by assuring if prize categories had better recognition performance than
non-prize categories.
Gender 5.4.1.
Brand recognition was tested through two tables with different evaluation parameters,
one that only counted the percentages of the corrected brand option on every
commercial and another counting not only the correct answers but also discounting the
wrong options chosen. Before conducting both tests, the assumption was that
participants were going to remember more the first videos, meaning the categories, QI
and QWI, would be the most remembered and then brand recognition would decay
chronologically (Peters and Bijmolt, 1997). This idea came from the assumption users
would select more brands at the beginning of the options sheet, and at the end of the
options sheet would just select the ones that they would remember. This would led to a

96
higher selection of brands, either correct or wrong, for the brands of the first categories.
That said, a second table was created to fight this issue by prejudicing users that chose
wrong brands with negative points.
Gender accounted for right answers 5.4.1.1.
The assumption was proved to be true, after compiling branding results on a TABLE 7
with each category average performance. This table only accounted for the correct
brands of each category which resulted in exponential performance decay, starting in
the first category seen in the experiment, down to the last. Looking at the table, it was
visible also a higher performance from male subjects over females.
Gender accounted for right/wrong answers 5.4.1.2.
TABLE 7 - Gender concerning each category - brand recognition without accounting for wrong
answers
QI QWI PI PWI NGI NGWI
Male 84% 64% 67% 42% 30% 11%
Female 77% 68% 58% 33% 13% 8%
Total 81% 66% 62% 38% 21% 9%
TABLE 8 - Gender concerning each category - brand recognition accounting for wrong answers
QI QWI PI PWI NGI NGWI
Male 17% 18% 17% 10% 10% 1%
Female 26% 20% 28% 13% 3% 1%
Total 21% 19% 22% 12% 6% 1%

97
Results from TABLE 7, made this experiment, construct TABLE 8, but this time
accounting for both correct and wrong answers, giving the wrong answers a negative
mark. This way it was possible to really understand individuals’ performance over
brand recognition.
By constructing FIGURE 10 and 11, it was possible to find which brands had more
brand recognition, both in female and male brand experiences, taking into account the
wrong choices as well. Looking at the numbers, the exponential pattern was not visible
anymore. Instead, the graphic behaved according to H3, H4 and H5.
Analyzing it further, on one hand, male performances did not prove any hypothesis.
Male results, from FIGURE 10, showed similar performances for the first three
categories, 17%, 18%, 17%, and then decrease on the next two, to 10%, finishing the
category NGWI at 1%. This behavior led to believe male participants, got bored after PI
and lost total interest at NGWI. These results demonstrated males did not care about
prize and interests, however looks like they still demonstrated attitude towards quiz
advertising method.
On the other hand, looking at female performance numbers, in FIGURE 11, it was
possible to prove H3, H4 and H5 almost in totality. First of all, one important fact was
that female performances were better in almost all fronts when compared with males.
This event was exactly the opposite seen in the last table where males had better
performance. This phenomenon led to make the assumption males tried to guess more
than females, which made them guess wrong more often than females and ultimately
have worst results in the next table. Furthermore, female numbers showed PI with the
highest percentages, with 2% more than QI, 26%, which proved H5, and 15%, more than
PWI, 13%, which proved H4. H4 was also proved by quiz and non-quiz categories, as in
each one of them interest category was better than the generic one. H3 was also proven,
as all gaming categories were far better than non-gaming categories. However H5 was
not completely proven, as PWI had 7% less performance than QWI.

98
Tables concerning age range and occupation were then constructed following the same
method as the previous table.
Age 5.4.2.
Less than 18 years old 5.4.2.1.
Looking at branding according to age, the first step was to ignore ‚less than 18 years
old‛ category, due to the small sample previously mentioned.
Between 18 and 30 years old 5.4.2.2.
The second step was to analyze ‚between 18 and 30 years old‛ category. Due to the fact
that this class had the biggest sample, results in TABLE 9, were expected to be similar to
TABLE 8. The same pattern was captured both in male and female, confirming the same
results for each hypothesis. However, the percentages were much higher on both male
and female, getting females to reach 83% percentage on brand recognition for PI. This
results led to assume female users from 18-30, had better brand recognition over ads
according to their interests, with offering of incentives. This fact only partially
confirmed H4 and H5
QI QWI PI PWI NGI NGWI
18-30 49% 50% 60% 32% 10% 3%
Male 38% 36% 34% 28% 16% 3%
Female 60% 63% 83% 36% 6% 3%
TABLE 9 - Ages between 18 and 30 years old concerning each category - brand recognition

99
More than 30 years old 5.4.2.3.
Regarding >30, in TABLE 10, even though the sample was small, there was a distinctive
pattern from all other tables, which led to outline two assumptions. First, the care for
H3 was visible, as gaming categories were overall better than non-gaming. However,
this theory might have been discredited by the assumption that this age range subjects
showed an exponential decay over the questions, which led to assume users were losing
interest in a chronological order. Nevertheless, the most credible finding in this table
were the fact that numbers demonstrated a general focus and positive attitude towards
all ads according to users’ interests, which led to assume users with ages over thirty had
better brand recognition towards ads according to their interests, confirming H4.
Occupation 5.4.3.
QI QWI PI PWI NGI NGWI
>30 65% 18% 29% 0% 12% -12%
Male 56% 22% 22% 0% 11% -11%
Female 75% 13% 38% 0% 13% -13%
TABLE 10 – Ages older than 30 years old concerning each category - brand recognition
QI QWI PI PWI NGI NGWI
HS 50% 45% 40% 25% 15% -5%
CS 50% 54% 63% 29% 13% 2%
NS 54% 35% 50% 29% 6% 2%
TABLE 11 - Occupation parameter concerning each category - brand recognition

100
Regarding, occupation brand recognition, in TABLE 11, results did not have any more
meaningful discoveries, except that all gaming categories had much better
performances than the non-gaming ones, confirming this way H3.
5.5. Brand recognition individual brand performances
Brand recognition performances were tested individually, in order to discover general
patterns from brand recognition responses individually and to understand whether
some individual brand was disrupting results.
Brand recognition male individual performances 5.5.1.
FIGURE 10 - Graphic representing individual brand recognition performances for males
-25%
-9%
91%
-25%
78%
-9%
-28%
78%
0%
50%
-9%
75%
-13% -22%
59%
-16%
28%
-6%
0%
56%
-3% -13%
41%
-19%
0%
19% 6%
-3% -16%
16%
-50%
0%
50%
100%
1
Philips Braun Gillette
TAP Turkish Airlines British Airways
BMW Mercedes Benz Clínica Privada
Jess e os Rapazes Anatomia de Grey AXE
NIVEA REXONA Mission Impossible: Rogue Nation
007 Spectre Massa Fresca Coração D'Ouro
Santa Bárbara Uncharted Grand Theft Auto
Assassins Creed Nike ADIDAS
PUMA Audi ACER
MICROSOFT APPLE Dacia

101
Looking first at the numbers from the male survey, FIGURE 10, two facts were visible.
First was that the first videos had much more brand recognition than the last ones,
showing an exponential decay from the first categories down to the last. The
exponential behavior was also perceptible, when looked at the wrong brands. The
brands that were not in the commercials were more selected in the first categories.
Additionally, within these brands, it was visible as well that there was always a rival
brand that was stronger than the other rivals which helped assume that known brands
have better recognition than unknown ones. For instance, when the correct brand was
Gillette, other two brands rival appeared as options, Braun and Philips. Philips brand
had a better recognition, 25% than Braun, 9%, which led to assume participants were
more familiar to Philips over Braun. This phenomenon also was manifested in the prize
categories, like for example with AXE, NIVEA and REXONA, where AXE was the
correct answer and REXONA had 22% brand recognition over its rival NIVEA with
only 13%. This phenomenon, even escalated when Acer from the non-questions
category, being the correct answer, got less than its rival APPLE. This may be explained
by two facts, first it could be because it was at the non-quiz categories which might led
to assume consumers were not focus enough during those commercials, and secondly,
the fact that APPLE was considered more powerful and is better known than Acer. This
might have led consumers that did not remember the correct answers, to guess with a
better known brand, as APPLE.

102
Brand recognition female individual performances 5.5.2.
-13%
72%
-10%
82%
-3%
67%
-3% -3%
69%
-8% -3%
64%
0%
15%
51%
-5%
0%
21%
0%
-3% -10%
10% 5%
10%
-3%
0%
-10%
46%
0% 0%
-20%
0%
20%
40%
60%
80%
100%
1
Evax Tampax O.B
L'Oreal Sephora Now you see me 2
Batman Begins X-Men Days of Future Past Prós e Contras
Sociedade das Nações Trio de Ataque DOVE
NIVEA2 DIOR CHANEL
D&G NOS MEO
VODAFONE Pantene VICHY
SILVERCREST BOJACK HORSEMAN SAGRES
SUPERBOCK ARROW GAME OF THRONES
Casa dos Segredos Peso Pesado Ídolos
FIGURE 11 - Graphic representing individual brand recognition performances for females

103
Looking at the female chart, in FIGURE 11, representing brand recognition responses,
the same patterns were demonstrated in the male chart. The exponential decay from the
first category to the last, as well, and in either correct answers or wrong answers.
However in the wrong brands, the decay was not as significant as in the male side. This
fact might have occurred because females selected fewer brands, which led them to
error less. Furthermore, the female graphic gave the possibility to make one more
assumption. One of the brands, from, PWI, ‚Casa dos Segredos‛ was put at the end of the
survey table, along with its wrong brands ‚Peso Pesado‛ and ‚Ídolos‛, and still had
similar performances as its prize category brand, ‚MEO‛. ‚Casa dos Segredos‛ reached
46%, which was even more than twice the percentage of ‚MEO‛ brand, which only had
21%.
5.6. Feedback
For the feedback phase, overall graphics were sufficient to understand the behavior of
all participants. However, tables were constructed to assess the choices of every
question, according to demographic parameters, gender, age and occupation.
Idea 5.6.1.
TABLE 12 - Survey question – Idea
Idea Percentages
1 2%
2 4%
3 14%
4 44%
5 36%

104
The idea, represented in TABLE 12, received positive feedback as 44% gave it a mark 4
and 36% gave it a mark 5 out of 5, being 1 a bad idea and 5 a good idea, which
represented 80% of all voting. As for results, according to the demographic values, the
numbers did not show any meaningful behaviors worth mentioning.
Disposition 5.6.2.
FIGURE 12 demonstrated that the majority of participants, when up against commercial
videos in a quiz shape demanded the offering of some kind of incentive for their
undivided attention. However 36% preferred that commercials also were according to
their interests, as well.
41%
12%
36%
11%
Yes, if it offers prizes for my attention Yes, is has ads according to my interests
Two answers above No
FIGURE 12 - Graphic representing survey question - Disposition
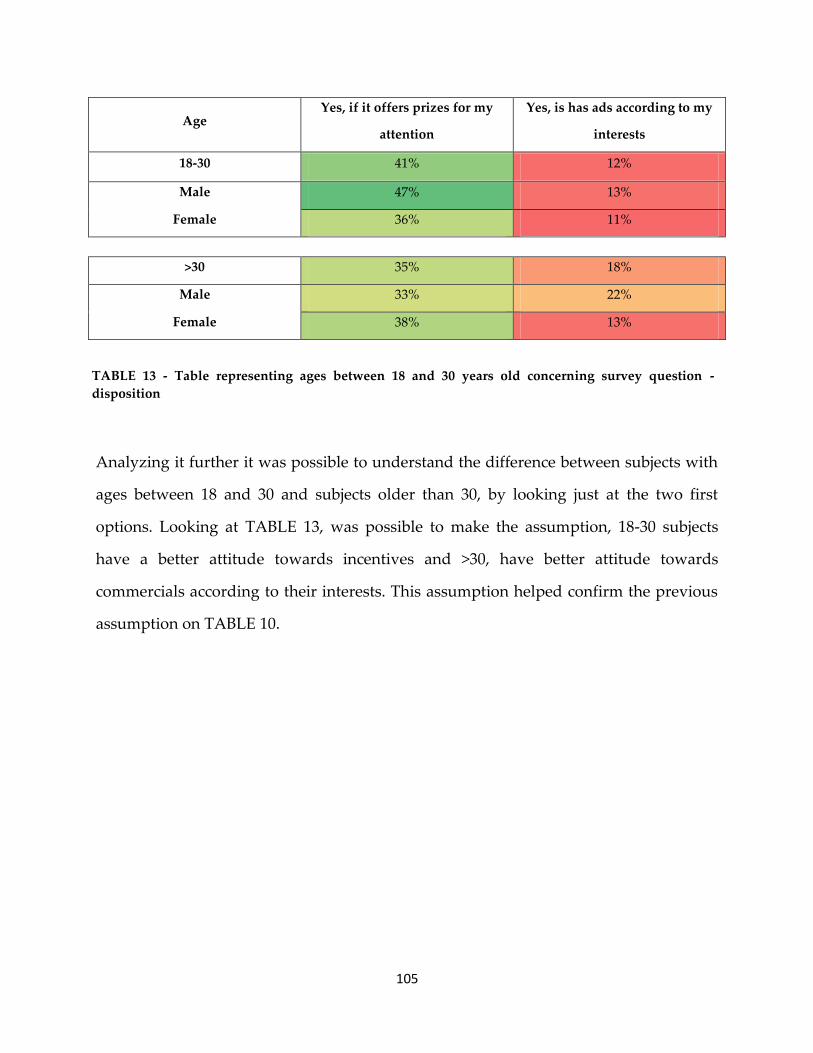
105
Analyzing it further it was possible to understand the difference between subjects with
ages between 18 and 30 and subjects older than 30, by looking just at the two first
options. Looking at TABLE 13, was possible to make the assumption, 18-30 subjects
have a better attitude towards incentives and >30, have better attitude towards
commercials according to their interests. This assumption helped confirm the previous
assumption on TABLE 10.
Age Yes, if it offers prizes for my
attention
Yes, is has ads according to my
interests
18-30 41% 12%
Male 47% 13%
Female 36% 11%
>30 35% 18%
Male 33% 22%
Female 38% 13%
TABLE 13 - Table representing ages between 18 and 30 years old concerning survey question -
disposition

106
1 2 3 4 5
Series1 6% 14% 46% 25% 9%
6%
14%
46%
25%
9%
Time 5.6.3.
FIGURE 13 gave a clear thought on how much people were willing to play this platform
if some day, came to market. 46% of participants gave 3 out of 5, being five to use the
platform daily and 1 to never use it.
Time/Day 5.6.4.
FIGURE 14 - Graphic representing survey question - Time/Day
46%
43%
11%
menor que 5 entre 5 e 10 minutos maior que 10
FIGURE 13 - Graphic representing survey question - Time
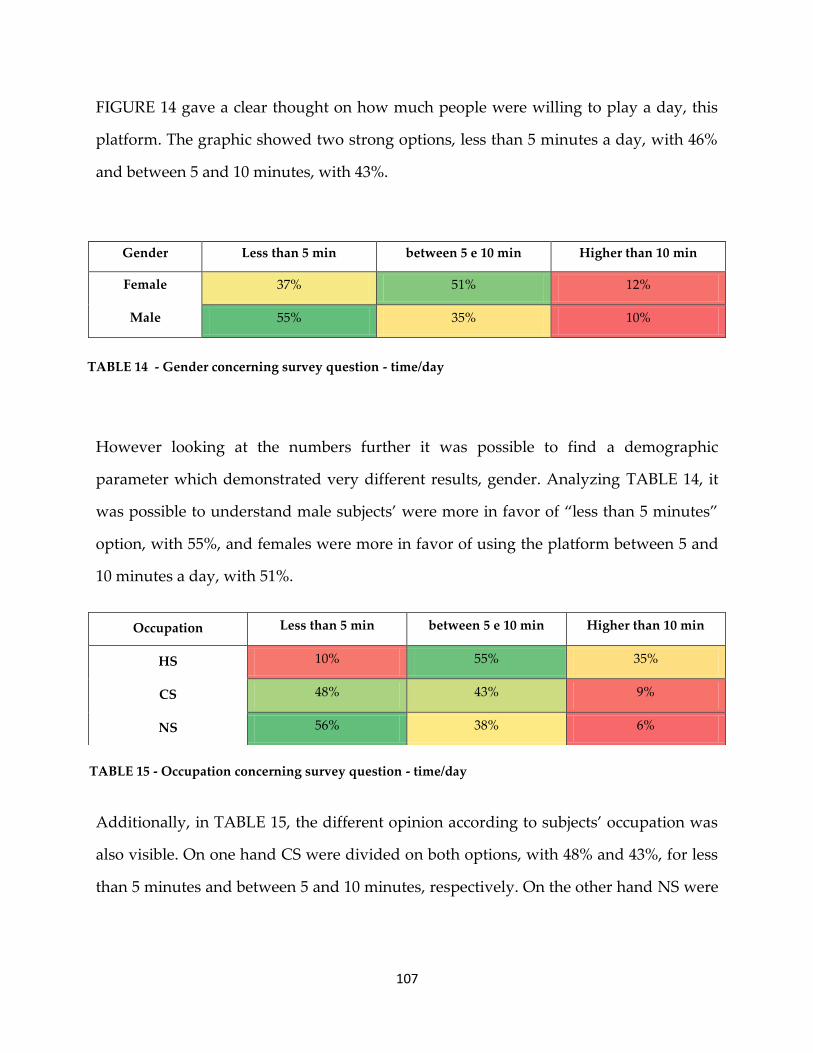
107
FIGURE 14 gave a clear thought on how much people were willing to play a day, this
platform. The graphic showed two strong options, less than 5 minutes a day, with 46%
and between 5 and 10 minutes, with 43%.
However looking at the numbers further it was possible to find a demographic
parameter which demonstrated very different results, gender. Analyzing TABLE 14, it
was possible to understand male subjects’ were more in favor of ‚less than 5 minutes‛
option, with 55%, and females were more in favor of using the platform between 5 and
10 minutes a day, with 51%.
Additionally, in TABLE 15, the different opinion according to subjects’ occupation was
also visible. On one hand CS were divided on both options, with 48% and 43%, for less
than 5 minutes and between 5 and 10 minutes, respectively. On the other hand NS were
Gender Less than 5 min between 5 e 10 min Higher than 10 min
Female 37% 51% 12%
Male 55% 35% 10%
TABLE 14 - Gender concerning survey question - time/day
Occupation Less than 5 min between 5 e 10 min Higher than 10 min
HS 10% 55% 35%
CS 48% 43% 9%
NS 56% 38% 6%
TABLE 15 - Occupation concerning survey question - time/day

108
more inclined to the less than 5 minutes option, with 56% over 38% for the ‚5/10
minutes‛ option.
Devices 5.6.5.
Concerning FIGURE 15, on what devices the platform should be installed, users opinion
was strongly directed towards smartphones, with 83%, over the second most voted
‚PC‛ with only 35%. However looking further into the results, it was possible to find a
big approximation of this two options inside one age category, >30. Looking first at 18-
30 participants options, in TABLE 16, it was highly perceptible the difference between
Smartphones and the other categories. The option ‚Smartphones‛ got an overall of 84%
over ‚PC‛ with only 33%.
83%
35%
17%
1%
1%
Smartphones
PC
SMART TV
Nenhum lado
Tablets
FIGURE 15 - Graphic representing survey question - Ideal Devices

109
However, when looked upon the >30, in TABLE 16 the options were more divided,
especially for the feminine audience which gave 50% to ‚PC‛ and only 63% to
smartphones.
Género Smartphones PC SMART TV
entre 18 e 30 anos 84% 33% 16%
Male 81% 33% 20%
Female 87% 33% 11%
>30 71% 47% 24%
Male 78% 44% 22%
Female 63% 50% 25%
TABLE 16 - Ages between 18 and 30 years old and ages older than 30 years old concerning survey
question - ideal devices

110

111
Conclusion
The experiment addressed the issue of lack of attention from consumers, when
confronted with advertising campaigns. Nowadays, users possess tools that can
improve their ability to ignore ads or even run away from them, such as Adblock, or
even the improved ‚old‛ remote control, that gave the possibility for a user to change
the channel or fast-forward when commercials were on. This work was developed to
answer the question ‚How does a quiz format, incentives and targeted commercials
affect users’ attention and brand recognition?‛ The assumption was that users would be
more focus on commercials which, not only would be according to their interests but
also gave them incentives for their attention. On top of that, the quiz structure was
thought to use the power of gamification and transform the burden of watching
commercials into an enjoyable interactive experience. In order to reach the answer, five
hypothesis were formulated to compile results according to three demographic
parameters, age, gender and occupation. Due to the lack of theoretical work developed
for this subject and lack of time, an exploratory study was conducted, to better
understand whether the use of a quiz structure along with incentivized and targeted
parameters, would be a beneficial approach to insert in the advertising industry.
Five hypotheses or five scenarios were configured: H1, H2, H3, H4 and H5. H1
questioned whether confronting users with targeted ads would be beneficial for their
attention. H2 questioned whether rewarding users with incentives would be beneficial
for their attention. H3 questioned whether presenting users with commercials in a quiz
game structure would be beneficial for their attention. H4 questioned whether
confronting users with targeted ads would be beneficial for their brand recognition. H5
questioned whether rewarding users with incentives would be beneficial for their brand
recognition.

112
The study conducted had its own limitations, which demonstrated several
improvements to take into consideration in future investigations. First of all, it would be
interesting to conduct a study where the questionnaire experiment would be tested
with a higher sample of participants and with similar ratios between each demographic
parameter. This way it would be possible to make a reliable comparison between each
age range and each occupation. Additionally, a pretest and pilot would have better
impact on the outcome of the experiment. Secondly, the experiment was based on a
promise of an incentive for every answer correct during the incentivized categories;
however the incentive was just a promise of a small chocolate. It would be interesting in
future studies, to understand the power of incentives by inserting different kind of
incentives, and compare the results, in attention and brand recognition. The experiment
would be interesting to recreate using a different technology to present the quizzes,
namely a smartphone app since it was the most voted platform in the feedback phase.
Using a smartphone would give the ability to block users from rewinding and fast-
forwarding the video ad before the questions, and would give a better data validation
system for the email. Data compilation lacked of an efficient system to test out questions
difficulty and choice of videos.
From the results compiled for the quiz simulator, two hypotheses were tested, H1 and
H2, according to the three chosen demographic parameters, and four assumptions were
generated. First, H1 was clearly manifested more significantly through non-prize
categories, which led to the assumption that users the power of targeted advertising is
less powerful when incentives are offered. Secondly, H2 was clearly better manifested
in the female results which led to assume, females were more focused when incentives
were on the table, than males. The third realization, came from the poorly female
performances in one of the videos showed that had twice the duration of the other
videos, and gave the assumption that users attention is affected according to the video

113
duration. Due to this fact, it would be interesting to conduct a future research regarding
duration over quiz advertisings.
Compiling brand recognition results, three hypotheses were tested, H3, H4 and H5, as
well according to demographic parameters, and three assumptions were generated.
First, through testing of branding results in two distinct methods it was possible to
conclude, future research should be conducted accounting both right and wrong
answers, otherwise users might have an exponential focus decay when selecting brands
(Peters and Bijmolt, 1997) even though other scholars beg to differ (Biswas et al., 2010;
Verhaeghen et al., 2004). Brand recognition phase gave clear thoughts on several facts
that led to X assumptions. The clearest one was the confirmation of H3. In other words
users had better brand recognition in all brands regarding videos showed during quiz
categories, compared with non-quiz. The brand ‚Casa dos Segredos‛, put at the end of
the branding options of the survey, was a test control used confirm whether users were
not being affected by the options order. This test contradicted prior research (Peters and
Bijmolt, 1997) which gave the impression that it would be interesting to recreate the
branding recognition experimental phase, shuffling all question category brands, to see
if the effect would still be an exponential decay. Concerning participants with ages
between 18 and 30 years old, female users confirmed H3, H4 and H5; however male
subjects, who had worst performances than females, did not confirm H4 and H5.
This fact, led to assume male subjects, got bored from the experiment itself which led to
believe it would be interesting to conduct future research concerning which drivers
influence brand recognition for males and females. Participants with more than 30 years
old, demonstrated a significant positive attitude towards H4, meaning they had better
brand recognition over brands inserted in categories, according to users interests. This
fact gave the assumption that users with more than 30 years old have a positive attitude
over ads according to their interests, and gave the impression that it would be
interesting to conduct this experiment with a more reliable sample to understand
114
whether this assumption is true or not. This work research was developed to assess
what was the best method to construct a business model and understand if it would be
well received and needed in nowadays society. Feedback phase was built into five
survey questions, grounded in the theory of planned behavior. The theory
demonstrated the best way to predict whether participants would be interested in
playing a game with this business model idea. Two questions rated the element attitude
from TPB, meaning they showed users’ opinion about the business model. First
question, ‚Idea‛, showed, in a scale from 1 to 5 if, in the eyes of the users, this business
model would be a good or bad idea. The results gave the impression; users were open
to the idea, being the majority of votes 4 and 5 out of five. ‚Time‛, demonstrated that
the majority of users would play this game in a moderate amount of time, rating 3 out
of 5. Both questions reflected a good indicator that users would look at this game with a
positive intention to play it. The other questions demonstrated the outcome of the
element Perceived Behavior Control (PCB), which referred users’ opinion on whether
using this game would be difficult or easy to implement in their lives. Question,
‚Disposition‛, demonstrated that users thought this type of business model would
better received if it would offer incentives for their attention or targeted ads but also
with offering of incentives. The next question concluded that, on one hand, male users
would prefer to use this app less than five minutes a day, to reach 10 euros at the end of
the month. On the other hand female users, revealed they would be willing to play
between 5 and 10 minutes per day, which led to assume female users would be more
patient to reach a prize than male subjects. In the same question another important
assumption was revealed. The study concluded NS participants would be less open to
the scenario of having to play the game more than 5 minutes a day, compared to CS. In
the last question users were almost unanimous choosing Smartphones as the best
platform to execute this business model. Summarizing, PCB answers showed that users
would be more keep on playing game if it have incentives and targeted ads to offer and
115
if it was implemented in smartphones. Additionally, in case the goal was to reach both
genders, PCB, concludes that, in order to reach a 10 euro prize, at the end of the month,
users should only need to play 5 minutes a day.
This experiment explored a new advertising method and developed a theoretical model
to better understand the inclusion of an advertising quiz structure and the inclusion of
strategies such as incentives and targeting ads. This made the impression, that it would
be interesting for the next step to be the developing of a mobile app prototype, to test
the idea in a real market, and actually prove the business model.

116

117
References
Dahlén, M., & Edenius, M. (2007). When is advertising advertising? Comparing
responses to non-traditional and traditional advertising media. Journal of Current
Issues & Research in Advertising, 29(1), 33-42.
Agarwal, R., & Karahanna, E. 2000. Time Flies When You’re Having Fun: Cognitive
Absorption and Beliefs about Information Technology Usage. MIS Quarterly, 24(4):
665.
Ajzen, I. 1991. The theory of planned behavior. Organizational Behavior and Human
Decision Processes, 50(2): 179–211.
Ajzen, I., & Fishbein, M. 1975. Belief, attitude, intention and behavior: An introduction
to theory and research. Reading, MA: Addison-Wesley.
Ajzen, I., & Fishbein, M. 2004. The Influence of Attitudes on Behavior.
ARMSTRONG, G., & KOTLER, P. 2000. Introdução ao marketing. 4o Edição, Rio de
Janeiro: LTC.
Ashley, C., & Tuten, T. 2015. Creative strategies in social media marketing: An
exploratory study of branded social content and consumer engagement.
Psychology & Marketing, 32(1): 15–27.
Assmus, G., Farley, J. U., & Lehmann, D. R. 1984. How Advertising Affects Sales: Meta-
Analysis of Econometric Results. Journal of Marketing Research, 21(1): 65.
Aymerich-Franch, L. 2014. The Effect of Incentive Type and Sex on Attitudes towards
Interactive Television Advertising. Procedia - Social and Behavioral Sciences,
155(October): 490–495.
Balasubraman, S., Peterson, R. A., & Jarvenpaa, S. L. 2002. Exploring the Implications of
M-Commerce for Markets and Marketing. Journal of the Academy of Marketing
118
Science, 30(4): 348–361.
Balasubramanian, S. K. 1994. Beyond Advertising and Publicity: Hybrid Messages and
Public Policy Issues. Journal of Advertising, 23(4): 29–46.
Barnes, S. J., & Scornavacca, E. 2004. Mobile marketing: the role of permission and
acceptance. International Journal of Mobile Communications, 2(2): 128.
Barwise, P., & Strong, C. 2002. Permission-based mobile advertising. Journal of
Interactive Marketing, 16(1): 14–24.
Bauer, H. H., Reichardt, T., Barnes, S. J., & Neumann, M. M. 2005. Driving consumer
acceptance of mobile marketing: A theoretical framework and empirical study.
Journal of Electronic Commerce Research, 6(3): 181.
Beck, A. 2007. Web 2.0: Konzepte, Technologie, Anwendungen. HMD, 44(3): 5–16.
Bellman, S., Kemp, A., Haddad, H., & Varan, D. 2014. The effectiveness of advergames
compared to television commercials and interactive commercials featuring
advergames. Computers in Human Behavior, 32: 276–283.
Bellman, S., Schweda, A., & Varan, D. 2009. A Comparison of Three Interactive
Television AD Formats. Journal of Interactive Advertising, 10(1): 14–34.
Bellman, S., & Varan, D. 2012. Modeling Self-Selection Bias in Interactive-
Communications Research. Communication Methods and Measures, 6(3): 163–189.
Bello, D. C., Pitts, R. E., & Etzel, M. J. 1983. The communication effects of controversial
sexual content in television programs and commercials. Journal of Advertising,
12(3): 32–42.
Bennett, R. C., & Cooper, R. G. 1981. The misuse of marketing: an American tragedy.
Business Horizons, 24(6): 51–61.
Benway, J. P. 1999. Banner blindness: What searching users notice and do not notice on
the World Wide Web. Rice University.
Bernolak, I. 1997. Effective measurement and successful elements of company
productivity: The basis of competitiveness and world prosperity. International
119
Journal of Production Economics, 52(1–2): 203–213.
Berthon, P. R., Pitt, L. F., McCarthy, I., & Kates, S. M. 2007. When customers get clever:
Managerial approaches to dealing with creative consumers. Business Horizons,
50(1): 39–47.
Bettman, J. R., & Park, C. W. 1980. Effects of Prior Knowledge and Experience and
Phase of the Choice Process on Consumer Decision Processes: A Protocol Analysis.
J CONSUM RES, 7(3): 234.
Bhattacherjee, A. 2000. Acceptance of e-commerce services: the case of electronic
brokerages. IEEE Transactions on Systems, Man, and Cybernetics-Part A: Systems
and Humans, 30(4): 411–420.
Biswas, D., Grewal, D., & Roggeveen, A. 2010. How the order of sampled experiential
products affects choice. Journal of Marketing Research, 47(3): 508–519.
Brechman, J., Bellman, S., Schweda, A., & Varan, D. 2015. Interactive Branded Overlays.
Journal of Broadcasting & Electronic Media, 59(1): 184–207.
Brennan, I., & Babin, L. A. 2004. Brand placement recognition: The influence of
presentation mode and brand familiarity. Journal of Promotion Management, 10(1–
2): 185–202.
Briggs, R., & Hollis, N. 1997. Advertising on the Web: Is there response before click-
through? Journal of Advertising Research, 37(2): 33–46.
Bronnenberg, B. J., Dubé, J.-P., & Mela, C. F. 2010. Do Digital Video Recorders Influence
Sales? Journal of Marketing Research, 47(6): 998–1010.
Buijzen, M., & Valkenburg, P. M. 2000. The Impact of Television Advertising on
Children’s Christmas Wishes. Journal of Broadcasting & Electronic Media, 44(3):
456–470.
Buijzen, M., & Valkenburg, P. M. 2003. The effects of television advertising on
materialism, parent–child conflict, and unhappiness: A review of research. Journal
of Applied Developmental Psychology, 24(4): 437–456.

120
Bulander, R., Decker, M., Schiefer, G., & Kolmel, B. n.d. Comparison of Different
Approaches for Mobile Advertising. Second IEEE International Workshop on
Mobile Commerce and Services. Institute of Electrical & Electronics Engineers
(IEEE). http://doi.org/10.1109/wmcs.2005.8.
Carroll, A., Barnes, S. J., & Scornavacca, E. n.d. Consumers Perceptions and Attitudes
towards SMS Mobile Marketing in New Zealand. International Conference on
Mobile Business (ICMB’05). Institute of Electrical & Electronics Engineers (IEEE).
http://doi.org/10.1109/icmb.2005.30.
Cauberghe, V., & Pelsmacker, P. De. 2006. Opportunities and Thresholds for
Advertising on Interactive Digital TV. Journal of Interactive Advertising, 7(1): 2–
23.
Celsi, R. L., & Olson, J. C. 1988. The Role of Involvement in Attention and
Comprehension Processes. J CONSUM RES, 15(2): 210.
Chaney, I. M., Lin, K.-H., & Chaney, J. 2004. The effect of billboards within the gaming
environment. Journal of Interactive Advertising, 5(1): 37–45.
Cho, C.-H., & Cheon, H. J. 2005. CROSS-CULTURAL COMPARISONS OF
INTERACTIVITY ON CORPORATE WEB SITES: The United States, the United
Kingdom, Japan, and South Korea. Journal of Advertising, 34(2): 99–115.
Chui, M., Manyika, J., Bughin, J., Dobbs, R., Roxburgh, C., et al. 2012. The social
economy: Unlocking value and productivity through social technologies. McKinsey
Global Institute, (July): 1–18.
Clarke, D. G. 1976. Econometric Measurement of the Duration of Advertising Effect on
Sales. Journal of Marketing Research, 13(4): 345.
Csikszentmihalyi, M., & LeFevre, J. 1989. Optimal experience in work and leisure.
Journal of Personality and Social Psychology, 56(5): 815–822.
Dahl, S., Eagle, L., & Báez, C. 2009. Analyzing advergames: active diversions or actually
deception. An exploratory study of online advergames content. Young Consumers,

121
10(1): 46–59.
Dahlén, M. 2005. THE MEDIUM AS A CONTEXTUAL CUE: Effects of Creative Media
Choice. Journal of Advertising, 34(3): 89–98.
Dahlén, M., & Edenius, M. 2007. When is advertising advertising? Comparing responses
to non-traditional and traditional advertising media. Journal of Current Issues &
Research in Advertising, 29(1): 33–42.
Danaher, P. J., Smith, M. S., Ranasinghe, K., & Danaher, T. S. 2015. Where, When, and
How Long: Factors That Influence the Redemption of Mobile Phone Coupons.
Journal of Marketing Research, 52(5): 710–725.
Davis, F. D. 1989. Perceived Usefulness, Perceived Ease of Use, and User Acceptance of
Information Technology. MIS Quarterly, 13(3): 319.
Dickinger, A., Haghirian, P., Murphy, J., & Scharl, A. 2004. An investigation and
conceptual model of SMS marketing. 37th Annual Hawaii International
Conference on System Sciences, 2004. Proceedings of the. Institute of Electrical &
Electronics Engineers (IEEE). http://doi.org/10.1109/hicss.2004.1265096.
Digital Set to Surpass TV in Time Spent with US Media - eMarketer. n.d. .
http://www.emarketer.com/Article/Digital-Set-Surpass-TV-Time-Spent-with-US-
Media/1010096.
Drossos, D., & Giaglis, G. M. 2005. Factors That Influence the Effectiveness of Mobile
Advertising: The Case of SMS. Advances in Informatics. Springer Science +
Business Media.
Drossos, D., Giaglis, G. M., Lekakos, G., Kokkinaki, F., & Stavraki, M. G. 2007.
Determinants of Effective SMS Advertising: An Experimental Study. Journal of
Interactive Advertising, 7(2): 16–27.
Duane, A., O’Reilly, P., & Andreev, P. 2014. Realising M-Payments: Modelling
consumers’ willingness to M-pay using Smart Phones. Behaviour and Information
Technology, 33(June 2015): 318–334.

122
Ducoffe, R. H., & Curlo, E. 2000. Advertising value and advertising processing. Journal
of Marketing Communications, 6(4): 247–262.
Duffy, C. M. 2001. Designing Web Usability: The Practice of Simplicity, by Jakob
Nielsen, New Riders Publishing, Indianapolis, Indiana, USA, 420 pp., 2000., Paper:
ISBN 1-56205-810-X, $45.00. Human Factors and Ergonomics in Manufacturing,
11(1): 73.
Edwards, S. M., Li, H., & Lee, J.-H. 2002. Forced Exposure and Psychological Reactance:
Antecedents and Consequences of the Perceived Intrusiveness of Pop-Up Ads.
Journal of Advertising, 31(3): 83–95.
Eroglu, S. A., Machleit, K. A., & Davis, L. M. 2001. Atmospheric qualities of online
retailing. Journal of Business Research, 54(2): 177–184.
Fazio, R. H., & Zanna, M. P. 1981. Direct Experience And Attitude-Behavior
Consistency. Advances in Experimental Social Psychology. Elsevier BV.
Ferris, M. 2007. Insights on Mobile Advertising, Promotion, and Research. Journal of
Advertising Research, 47(1): 28–37.
Festinger, L. 1957. A Theory of Cognitive Dissonance: Stanford University.
Fishbein, M., & Ajzen, I. 1977. Belief, attitude, intention, and behavior: An introduction
to theory and research.
Fletcher, A. D. 1980. Effective Frequency: The Relationship between Frequency and
Advertising Effectiveness. Naples, Michael J. New York: Association of National
Advertisers, Inc. 1979. Cloth, 140 pp. Journal of Advertising, 9(2): 48.
FONG, N. M., FANG, Z., & LUO, X. 2015. Geo-Conquesting: Competitive Locational
Targeting of Mobile Promotions. Journal of Marketing Research (JMR), 52(5): 726–
735.
Friedman, H. H., & Friedman, L. 1979. Endorser effectiveness by product type. Journal
of Advertising Research, 19(5): 63–71.
Friestad, M., & Wright, P. 1994. The Persuasion Knowledge Model: How People Cope
123
with Persuasion Attempts. J CONSUM RES, 21(1): 1.
Friestad, M., & Wright, P. 1995. Persuasion Knowledge: Lay People’s and Researchers’
Beliefs about the Psychology of Advertising. J CONSUM RES, 22(1): 62.
Gao, Q., Rau, P.-L. P., & Salvendy, G. 2009. Perception of Interactivity: Affects of Four
Key Variables in Mobile Advertising. International Journal of Human-Computer
Interaction, 25(6): 479–505.
Garde, A. 2008. Food Advertising and Obesity Prevention: What Role for the European
Union? J Consum Policy, 31(1): 25–44.
Ghose, A., Goldfarb, A., & Han, S. P. 2013. How Is the Mobile Internet Different? Search
Costs and Local Activities. Information Systems Research, 24(3): 613–631.
Gillund, G., & Shiffrin, R. M. 1984. A retrieval model for both recognition and recall.
Psychological Review, 91(1): 1.
Glass, Z. 2007. The Effectiveness of Product Placement in Video Games. Journal of
Interactive Advertising, 8(1): 23–32.
Godin, G., Valois, P., Lepage, L., & Desharnais, R. 1992. Predictors of smoking
behaviour: an application of Ajzen’s theory of planned behaviour. British Journal
of Addiction, 87(9): 1335–1343.
Godin, S. 1999. Permission marketing: Turning strangers into friends and friends into
customers. Simon and Schuster.
Goh, K.-Y., & Ping, J. W. 2014. Engaging Consumers with Advergames: An
Experimental Evaluation of Interactivity, Fit and Expectancy. Journal of the
Association for Information Systems, 15(7): 388–421.
Goldman, S. M. 2010. Transformers. Journal of Consumer Marketing, 27(5): 469–473.
Goodrich, K. 2011. Anarchy of effects? Exploring attention to online advertising and
multiple outcomes. Psychology & Marketing, 28(4): 417–440.
Green, M. C., Brock, T. C., & Kaufman, G. F. 2004. Understanding Media Enjoyment:
The Role of Transportation Into Narrative Worlds. Commun Theory, 14(4): 311–327.
124
Grigorovici, D. M., & Constantin, C. D. 2004. Experiencing interactive advertising
beyond rich media: Impacts of ad type and presence on brand effectiveness in 3D
gaming immersive virtual environments. Journal of Interactive Advertising, 5(1):
22–36.
Gupta, P. B., & Lord, K. R. 1998. Product placement in movies: The effect of prominence
and mode on audience recall. Journal of Current Issues & Research in Advertising,
20(1): 47–59.
Ha, L., & Litman, B. R. 1997. Does Advertising Clutter Have Diminishing and Negative
Returns? Journal of Advertising, 26(1): 31–42.
Haghirian, P., Madlberger, M., & Tanuskova, A. n.d. Increasing Advertising Value of
Mobile Marketing - An Empirical Study of Antecedents. Proceedings of the 38th
Annual Hawaii International Conference on System Sciences. Institute of Electrical
& Electronics Engineers (IEEE). http://doi.org/10.1109/hicss.2005.311.
Hanley, M., & Becker, M. 2009. a Multi-Year Analysis of College Student Cell Phone
Usage and Advertising Acceptance. American Academy of Advertising Conference
Proceedings, 20.
Hanna, R., Rohm, A., & Crittenden, V. L. 2011. We’re all connected: The power of the
social media ecosystem. Business Horizons, 54(3): 265–273.
Hebb, D. O. 1955. Drives and the CNS (conceptual nervous system). Psychological
Review, 62(4): 243.
Heckler, S. E., & Childers, T. L. 1992. The Role of Expectancy and Relevancy in Memory
for Verbal and Visual Information: What is Incongruency? J CONSUM RES, 18(4):
475.
Henderson, J. C., & Venkatraman, H. 1993. Strategic alignment: Leveraging information
technology for transforming organizations. IBM Syst. J., 32(1): 472–484.
Hernandez, M. D., Chapa, S., Minor, M. S., Maldonado, C., & Barranzuela, F. 2004.
Hispanic Attitudes Toward Advergames. Journal of Interactive Advertising, 5(1):

125
74–83.
Hoch, S. J. 2002. Product Experience Is Seductive. J Consum Res, 29(3): 448–454.
Hoch, S. J., & Deighton, J. 1989. Managing What Consumers Learn from Experience.
Journal of Marketing, 53(2): 1.
Hoffman, D. L., & Novak, T. P. 1996. Marketing in Hypermedia Computer-Mediated
Environments: Conceptual Foundations. Journal of Marketing, 60(3): 50.
Hoffman, D. L., & Novak, T. P. 2009. Flow Online: Lessons Learned and Future
Prospects. Journal of Interactive Marketing, 23(1): 23–34.
Homer, P. M. 2006. RELATIONSHIPS AMONG AD-INDUCED AFFECT, BELIEFS,
AND ATTITUDES: Another Look. Journal of Advertising, 35(1): 35–51.
Hsu, C.-L., & Lu, H.-P. 2004. Why do people play on-line games? An extended TAM
with social influences and flow experience. Information & Management, 41(7): 853–
868.
Hsu, H. Y. S., & Kulviwat, S. 2006. An integrative framework of technology acceptance
model and personalisation in mobile commerce. International Journal of
Technology Marketing, 1(4): 393.
Huang, H. H., & Mitchell, V.-W. 2013. The Role of Imagination and Brand
Personification in Brand Relationships. Psychology & Marketing, 31(1): 38–47.
Hult, G. T. M., Hurley, R. F., & Knight, G. A. 2004. Innovativeness: Its antecedents and
impact on business performance. Industrial Marketing Management, 33(5): 429–
438.
Hupfer, M. E., & Grey, A. 2005. Getting Something for Nothing. Journal of Interactive
Advertising, 6(1): 105–117.
Hutton, G., & Fosdick, M. 2011. The Globalization of Social Media. Journal of
Advertising Research, 51(4): 564–570.
Intraub, H. 1979. The role of implicit naming in pictorial encoding. Journal of
Experimental Psychology: Human Learning and Memory, 5(2): 78.
126
Jay (Hyunjae) Yu. 2013. You’ve Got Mobile Ads! Young Consumers’ Responses to
Mobile Ads with Different Types of Interactivity. International Journal of Mobile
Marketing, 8(1): 5–22.
Jayasingh, S., & Eze, U. C. 2009. Exploring the Factors Affecting the Acceptance of
Mobile Coupons in Malaysia. 2009 Eighth International Conference on Mobile
Business. Institute of Electrical & Electronics Engineers (IEEE).
http://doi.org/10.1109/icmb.2009.63.
Jensen Schau, H., & Gilly, M. C. 2003. We Are What We Post? Self-Presentation in
Personal Web Space. J Consum Res, 30(3): 385–404.
Kang, H., Hahn, M., Fortin, D. R., Hyun, Y. J., & Eom, Y. 2006. Effects of perceived
behavioral control on the consumer usage intention of e‐coupons. Psychology &
Marketing, 23(10): 841–864.
Kannan, P. K., Chang, A.-M., & Whinston, A. B. n.d. Wireless commerce: marketing
issues and possibilities. Proceedings of the 34th Annual Hawaii International
Conference on System Sciences. Institute of Electrical & Electronics Engineers
(IEEE). http://doi.org/10.1109/hicss.2001.927209.
Katz, E., & Blumler, J. G. 1974. The uses of mass communications: Current perspectives
on gratifications research. Sage Publications.
Kearney, A. T. 2001. Satisfying the experienced on-line customer. Global E-Shopping
Survey.
Keith, R. J. 1960. The Marketing Revolution. Journal of Marketing, 24(3): 35.
Keller, K. L. 2009. Building strong brands in a modern marketing communications
environment. Journal of Marketing Communications, 15(2–3): 139–155.
Kim, J., Lim, J.-S., & Bhargava, M. 1998. The Role of Affect in Attitude Formation: A
Classical Conditioning Approach. Journal of the Academy of Marketing Science,
26(2): 143–152.
Kim, Y. J., & Han, J. 2014. Why smartphone advertising attracts customers: A model of

127
Web advertising, flow, and personalization. Computers in Human Behavior, 33:
256–269.
Kolsaker, A., & Drakatos, N. 2009. Mobile advertising: The influence of emotional
attachment to mobile devices on consumer receptiveness. Journal of Marketing
Communications, 15(4): 267–280.
Korgaonkar, P., Petrescu, M., & Karson, E. 2015. Hispanic-Americans, Mobile
Advertising and Mobile Services. Journal of Promotion Management, 21(1): 107–
125.
Korzaan, M. L. 2003. Going with the flow: Predicting online purchase intentions.
Journal of Computer Information Systems, 43(4): 25–31.
Kotler, P., & Zaltman, G. 1971. Social Marketing: An Approach to Planned Social
Change. Journal of Marketing, 35(3): 3.
Koufaris, M. 2002. Applying the Technology Acceptance Model and Flow Theory to
Online Consumer Behavior. Information Systems Research, 13(2): 205–223.
Krishnamurthy, S. 2001. A comprehensive analysis of permission marketing. Journal of
Computer‐Mediated Communication, 6(2): 0.
Krugman, H. E. 1983. Television program interest and commercial interruption. Journal
of Advertising Research.
Kumar, S. 2012. Kac-Moody groups, their flag varieties and representation theory, vol.
204. Springer Science & Business Media.
Lachance, C. C., Lubitz, A., & Chestnut, R. W. 1977. The ‚decorative‛ female model:
Sexual stimuli and the recognition of advertisements. Journal of Advertising, 6(4):
11–14.
Lang, A. 2000. The limited capacity model of mediated message processing. Journal of
Communication, 50(1): 46–70.
Lautman, M. R., & Dean, K. J. 1983. Time compression of television advertising.
Advertising and Consumer Psychology, 219: 236.

128
Lavidge, R. J., & Steiner, G. A. 1961. A Model for Predictive Measurements of
Advertising Effectiveness. Journal of Marketing, 25(6): 59.
Law, S., & Braun, K. A. 2000. I’ll have what she’s having: Gauging the impact of
product placements on viewers.
Leddy, C. 2001. Peering Behind Jennifer Aniston’s Sweater. Multichannel News, 22: 52.
Lee, M., & Faber, R. J. 2007. Effects of Product Placement in On-Line Games on Brand
Memory: A Perspective of the Limited-Capacity Model of Attention. Journal of
Advertising, 36(4): 75–90.
Leppaniemi, M., & Karjaluoto, H. 2005. Factors influencing consumers’ willingness to
accept mobile advertising: a conceptual model. International Journal of Mobile
Communications, 3(3): 197.
Leppäniemi, M., Sinisalo, J., & Karjaluoto, H. 2006. A review of mobile marketing
research. International Journal of Mobile Marketing, 1(1): 30–40.
Li, H., Edwards, S. M., & Lee, J.-H. 2002. Measuring the Intrusiveness of
Advertisements: Scale Development and Validation. Journal of Advertising, 31(2):
37–47.
Li, K., & Du, T. C. 2012. Building a targeted mobile advertising system for location-
based services. Decision Support Systems, 54(1): 1–8.
Liu, C.-L. ‚Eunice,‛ Sinkovics, R. R., Pezderka, N., & Haghirian, P. 2012. Determinants
of Consumer Perceptions toward Mobile Advertising — A Comparison between
Japan and Austria. Journal of Interactive Marketing, 26(1): 21–32.
Lloyd, D. W., & Clancy, K. J. 1991. CPMs versus CPMIs: Implications for media
planning. Journal of Advertising Research, 31(4): 34–44.
Loftus, G. R., & Kallman, H. J. 1979. Encoding and use of detail information in picture
recognition. Journal of Experimental Psychology: Human Learning and Memory,
5(3): 197.
Lohtia, S., James, W. M., & Hwang, B. C. 2003, May 6. System and method for providing
129
subscriber-initiated information over the short message service (SMS) or a
microbrowser. Google Patents.
Loughney, M., Eichholz, M., & Hagger, M. 2008. Exploring the Effectiveness of
Advertising in the ABC.com Full Episode Player. Journal of Advertising Research,
48(3): 320–328.
Luna, D., Peracchio, L. A., & de Juan, M. D. 2002. Cross-Cultural and Cognitive Aspects
of Web Site Navigation. Journal of the Academy of Marketing Science, 30(4): 397–
410.
Luo, X., Andrews, M., Fang, Z., & Phang, C. W. 2014. Mobile Targeting. Management
Science, 60(7): 1738–1756.
Lustria, M. L. A. 2007. Can interactivity make a difference? Effects of interactivity on the
comprehension of and attitudes toward online health content. J. Am. Soc. Inf. Sci.,
58(6): 766–776.
MacKenzie, S. B., Lutz, R. J., & Belch, G. E. 1986. The Role of Attitude toward the Ad as
a Mediator of Advertising Effectiveness: A Test of Competing Explanations.
Journal of Marketing Research, 23(2): 130.
Mallinckrodt, V., & Mizerski, D. 2007. The Effects of Playing an Advergame on Young
Children’s Perceptions, Preferences, and Requests. Journal of Advertising, 36(2):
87–100.
Mangold, W. G., & Faulds, D. J. 2009. Social media: The new hybrid element of the
promotion mix. Business Horizons, 52(4): 357–365.
Marks, L. J., & Kamins, M. A. 1988. The Use of Product Sampling and Advertising:
Effects of Sequence of Exposure and Degree of Advertising Claim Exaggeration on
Consumers’ Belief Strength, Belief Confidence, and Attitudes. Journal of Marketing
Research, 25(3): 266.
Martin, B., & Marshall, R. 1999. The interaction of message framing and felt
involvement in the context of cell phone commercials. European Journal of
130
Marketing, 33(1/2): 206–218.
Martinsen, J. 2006. Factors influencing mobile advertising acceptance. International
Journal of Mobile Marketing, 1(1): 50–59.
Mitchell, A. A., & Olson, J. C. 1981. Are Product Attribute Beliefs the Only Mediator of
Advertising Effects on Brand Attitude? Journal of Marketing Research, 18(3): 318.
Monahan, B. 2011. When it comes to ad avoidance, the DVR is not the problem. 24th
May, Available at: Http://adage. Com/article/adagestat/smartphones-a-Bigger-
distractiondvrs/227725/(accessed 16th April, 2014).
Mort, G. S., & Drennan, J. 2007. Mobile Communications: A Study of Factors
Influencing Consumer Use of m-Services. Journal of Advertising Research, 47(3):
302–312.
Murdough, C. 2009. Social Media Measurement. Journal of Interactive Advertising,
10(1): 94–99.
Nelson, M. R., Yaros, R. A., & Keum, H. 2006. Examining the influence of telepresence
on spectator and player processing of real and fictitious brands in a computer
game. Journal of Advertising, 35(4): 87–99.
Newell, J., Salmon, C. T., & Chang, S. 2006. The Hidden History of Product Placement.
Journal of Broadcasting & Electronic Media, 50(4): 575–594.
Nittala, R. 2011. Registering for incentivized mobile advertising: Discriminant analysis
of mobile users. International Journal of Mobile Marketing, 6(1): 42–53.
Novak, T. P., Hoffman, D. L., & Yung, Y.-F. 2000. Measuring the Customer Experience
in Online Environments: A Structural Modeling Approach. Marketing Science,
19(1): 22–42.
Ogilvy, D., & Raphaelson, J. 1982. RESEARCH ON ADVERTISING TECHNIQUES
THAT WORK-AND DONT WORK. Harvard Business Review, 60(4): 14.
Okazaki, S., & Hirose, M. 2009. Effects of displacement-reinforcement between
traditional media, PC internet and mobile internet: a quasi-experiment in Japan.
131
Int. J. Adv., 28(1): 77.
Okazaki, S., Katsukura, A., & Nishiyama, M. 2007. How Mobile Advertising Works: The
Role of Trust in Improving Attitudes and Recall. Journal of Advertising Research,
47(2): 165–178.
Okazaki, S., Molina, F. J., & Hirose, M. 2012. Mobile advertising avoidance: exploring
the role of ubiquity. Electronic Markets, 22(3): 169–183.
Palmer, J. W. 2002. Web Site Usability, Design, and Performance Metrics. Information
Systems Research, 13(2): 151–167.
Pathak, P. 2015. Social Network Sites: Can they enhance Employee Productivity in an
organization? International Journal of Management Science & Technology
Information, (17).
Pavlou, P. A., & Stewart, D. W. 2000. Measuring the Effects and Effectiveness of
Interactive Advertising. Journal of Interactive Advertising, 1(1): 61–77.
Peters, C., Amato, C. H., & Hollenbeck, C. R. 2007. An Exploratory Investigation of
Consumers’ Perceptions of Wireless Advertising. Journal of Advertising, 36(4):
129–145.
Peters, R. G. M., & Bijmolt, T. H. A. 1997. Consumer memory for television advertising:
A field study of duration, serial position, and competition effects. Journal of
Consumer Research, 23(4): 362–372.
Petty, R. E., Cacioppo, J. T., & Schumann, D. 1983. Central and peripheral routes to
advertising effectiveness: The moderating role of involvement. Journal of
Consumer Research, 10(2): 135–146.
Raney, A. A., Arpan, L. M., Pashupati, K., & Brill, D. A. 2003. At the movies, on the
Web: An investigation of the effects of entertaining and interactive Web content on
site and brand evaluations. Journal of Interactive Marketing, 17(4): 38–53.
Rettie, R., & Brum, M. 2001. M-commerce: The role of SMS text messages. Cotim-2001
Proceedings from E-Commerce to M-Commerce, University of Rhode Island,

132
Kingston.
Rettie, R., Grandcolas, U., & Deakins, B. 2005. Text message advertising: Response rates
and branding effects. J Target Meas Anal Mark, 13(4): 304–312.
Richard, J. E. ;Meul., Meuli, P. G., & Richard, James E.;Meuli, Paul G. 2013. Exploring
and modelling digital natives’ intention to use permission-based location-aware
mobile advertising. Journal of Marketing Management, 29(January): 698–719.
Richards, J. I., & Curran, C. M. 2002. Oracles on ‚Advertising‛: Searching for a
Definition. Journal of Advertising, 31(2): 63–77.
Richards, J. y C. C. 2002. Oracles on ‚advertising‛: Searching for a definition. Journal of
Advertising, 31(2): 63–77.
Robins, F. 2003. The marketing of 3G. Marketing Intelligence & Planning, 21(6): 370–
378.
Robson, K., Plangger, K., Kietzmann, J. H., McCarthy, I., & Pitt, L. 2015. Is it all a game?
Understanding the principles of gamification. Business Horizons, 58(4): 411–420.
Rogers, E. M. 2004. A prospective and retrospective look at the diffusion model. Journal
of Health Communication, 9(S1): 13–19.
Romaniuk, J., & Lock, C. 2008. The Recall of Brand Placements with Television Shows.
Ehrenberg-Bass Institute Working Paper.
Rosen, D. E., & Purinton, E. 2004. Website design. Journal of Business Research, 57(7):
787–794.
Rosenkrans, G., & Myers, K. 2012. Mobile advertising effectiveness. International
Journal of Mobile Marketing, 7(3): 5–24.
Rust, R. T., & Oliver, R. W. 1994. The Death of Advertising. Journal of Advertising,
23(4): 71–77.
Salo, J., & Tähtinen, J. n.d. Special Features of Mobile Advertising and Their Utilization.
Mobile Computing. IGI Global.
Sandage, C. H., & Leckenby, J. D. 1980. Student Attitudes toward Advertising:

133
Institution vs. Instrument. Journal of Advertising, 9(2): 29–44.
Schlosser, A. E., Shavitt, S., & Kanfer, A. 1999. Survey of Internet users’ attitudes toward
Internet advertising. J. Interactive Mark., 13(3): 34–54.
Schmitt, B. 2012. The consumer psychology of brands. Journal of Consumer Psychology,
22(1): 7–17.
Schonberg, E., Cofino, T., Hoch, R., Podlaseck, M., & Spraragen, S. L. 2000. Measuring
success. Communications of the ACM, 43(8): 53–57.
Schultz, D. E. 1995. From the editor. What is direct marketing? Journal of Direct
Marketing, 9(2): 5–9.
Schweppe, J., & Rummer, R. 2014. Attention, Working Memory, and Long-Term
Memory in Multimedia Learning: An Integrated Perspective Based on Process
Models of Working Memory. Educational Psychology Review, 26(2): 285–306.
Scott, J., & Craig-Lees, M. 2006. Conceptualization, consumer and cognition: The 3 Cs
that will advance product placement research. Asia-Pacific Conference for the
Association for Consumer Research. Sydney, Australia.
Seth, E. 2014. Mobile Commerce: A Broader Perspective. IT Professional, 16(3): 61–65.
Severn, J., Belch, G. E., & Belch, M. A. 1990. The effects of sexual and non-sexual
advertising appeals and information level on cognitive processing and
communication effectiveness. Journal of Advertising, 19(1): 14–22.
Shabelman, D. 2007. Startups prep for mobile ad boom. Daily Deal/The Deal.
Sheehan, K. B., & Guo, A. 2005. ‚Leaving on a (Branded) Jet Plane‛: An Exploration of
Audience Attitudes towards Product Assimilation in Television Content. Journal of
Current Issues & Research in Advertising, 27(1): 79–91.
Sicilia, M., Ruiz, S., & Munuera, J. L. 2005. EFFECTS OF INTERACTIVITY IN A WEB
SITE: The Moderating Effect of Need for Cognition. Journal of Advertising, 34(3):
31–44.
Smith, D. N., & Sivakumar, K. 2004. Flow and Internet shopping behavior. Journal of
134
Business Research, 57(10): 1199–1208.
Smith, R. E., & Swinyard, W. R. 1982. Information Response Models: An Integrated
Approach. Journal of Marketing, 46(1): 81.
Soroa-Koury, S., & Yang, K. C. C. 2010. Factors affecting consumers’ responses to
mobile advertising from a social norm theoretical perspective. Telematics and
Informatics, 27(1): 103–113.
Sparks, P., & Shepherd, R. 1992. Self-identity and the theory of planned behavior:
Assesing the role of identification with‚ green consumerism.‛ Social Psychology
Quarterly, 388–399.
Speck, P. S., & Elliott, M. T. 1997. Predictors of Advertising Avoidance in Print and
Broadcast Media. Journal of Advertising, 26(3): 61–76.
Stafford, T. F., & Stafford, M. R. 2002. The Advantages of Atypical Advertisements for
Stereotyped Product Categories. Journal of Current Issues & Research in
Advertising, 24(1): 25–37.
Steadman, M. 1969. How sexy illustrations affect brand recall. Journal of Advertising
Research, 9(1): 15–19.
Stelzner, M. . 2013. How marketers are using Social Media to grow their businesses.
Social Media Examiner, (May): 1–53.
Stelzner, M. . 2015. How marketers are using Social Media to grow their businesses.
Social Media Examiner, (May): 1–53.
Stewart, D. W., & Furse, D. H. 1986. Effective television advertising: A study of 1000
commercials. Lexington Books.
Stewart, D. W., & Koslow, S. 1989. Executional factors and advertising effectiveness: A
replication. Journal of Advertising, 18(3): 21–32.
Stewart, D. W., & Pavlou, P. A. 2002. From Consumer Response to Active Consumer:
Measuring the Effectiveness of Interactive Media. Journal of the Academy of
Marketing Science, 30(4): 376–396.
135
Strong Jr., E. K. 1925. Theories of selling. Journal of Applied Psychology, 9(1): 75–86.
Suh, K.-S., & Lee, Y. E. 2005. The effects of virtual reality on consumer learning: an
empirical investigation. Mis Quarterly, 673–697.
Susarla, A., Oh, J.-H., & Tan, Y. 2012. Social Networks and the Diffusion of User-
Generated Content: Evidence from YouTube. Information Systems Research, 23(1):
23–41.
Taylor, C. R. 2013. Editorial: Hot topics in advertising research. Int. J. Adv., 32(1): 7.
Taylor, S., & Todd, P. A. 1995. Understanding information technology usage: A test of
competing models. Information Systems Research, 6(2): 144–176.
Tsang, M. M., Ho, S.-C., & Liang, T.-P. 2004. Consumer attitudes toward mobile
advertising: An empirical study. International Journal of Electronic Commerce,
8(3): 65–78.
Van Reijmersdal, E. A., Rozendaal, E., & Buijzen, M. 2012. Effects of Prominence,
Involvement, and Persuasion Knowledge on Children’s Cognitive and Affective
Responses to Advergames. Journal of Interactive Marketing, 26(1): 33–42.
van Reijmersdal, E., Neijens, P., & Smit, E. 2005. Readers’ Reactions to Mixtures of
Advertising and Editorial Content in Magazines. Journal of Current Issues &
Research in Advertising, 27(2): 39–53.
Varnali, K. 2012. SMS advertising: How message relevance is linked to the attitude
toward the brand? Journal of Marketing Communications, 20(5): 339–351.
Varnali, K., & Toker, A. 2010. Mobile marketing research: The-state-of-the-art.
International Journal of Information Management, 30(2): 144–151.
Varnali, K., & Yilmaz, C. n.d. Exploring the Mobile Consumer. IGI Global.
Varshney, U., & Vetter, R. 2002. No Title. Mobile Networks and Applications, 7(3): 185–
198.
Venkatesh, V., & Davis, F. D. 2000. A Theoretical Extension of the Technology
Acceptance Model: Four Longitudinal Field Studies. Management Science, 46(2):

136
186–204.
Verhaeghen, P., Cerella, J., & Basak, C. 2004. A working memory workout: how to
expand the focus of serial attention from one to four items in 10 hours or less.
Journal of Experimental Psychology: Learning, Memory, and Cognition, 30(6):
1322.
Vessey, I., & Galletta, D. 1991. Cognitive Fit: An Empirical Study of Information
Acquisition. Information Systems Research, 2(1): 63–84.
Walker, D., & von Gonten, M. F. 1989. Explaining related recall outcomes: New answers
from a better model. Journal of Advertising Research.
Wedel, M., & Pieters, R. 2008. A review of eye-tracking research in marketing. Review
of Marketing Research, 4(2008): 123–147.
Wei, R., Xiaoming, H., & Pan, J. 2010. Examining user behavioral response to SMS ads:
Implications for the evolution of the mobile phone as a bona-fide medium.
Telematics and Informatics, 27(1): 32–41.
Wheeler, J. V., & Lanza, J. M. 2014. 404. Relationship Not Found: Digital vs. Analog -
Moving Towards a Synthesis. Organization Development Journal, 32: 77–89.
Winkler, T., & Buckner, K. 2006. Receptiveness of Gamers to Embedded Brand
Messages in Advergames : Attitudes towards Product Placement. Journal of
Interactive Advertising, 7(1): 37–46.
Wise, K., Bolls, P. D., Kim, H., Venkataraman, A., & Meyer, R. 2008. Enjoyment of
Advergames and Brand Attitudes. Journal of Interactive Advertising, 9(1): 27–36.
Wixted, J. T., & Squire, L. R. 2004. Recall and recognition are equally impaired in
patients with selective hippocampal damage. Cognitive, Affective, & Behavioral
Neuroscience, 4(1): 58–66.
Xie, T., Donthu, N., Lohtia, R., & Osmonbekov, T. 2004. Emotional Appeal and Incentive
Offering in Banner Advertisements. Journal of Interactive Advertising, 4(2): 30–37.
Xu, D. J., Liao, S. S., & Li, Q. 2008. Combining empirical experimentation and modeling
137
techniques: A design research approach for personalized mobile advertising
applications. Decision Support Systems, 44(3): 710–724.
Xu, G., & Gutierrez, J. A. 2006. An Exploratory Study of Killer Applications and Critical
Success Factors in M-Commerce. Journal of Electronic Commerce in Organizations,
4(3): 63–79.
Yu, H. (Jay), Paek, H., & Bae, B. 2008. Cross‐cultural comparison of interactivity and
advertising appeals on antismoking web sites in the United States and South Korea.
Internet Research, 18(5): 454–476.
Yun Yoo, C., & Kim, K. 2005. Processing of animation in online banner advertising: The
roles of cognitive and emotional responses. Journal of Interactive Marketing, 19(4):
18–34.
Zanot, E. J. 1984. Public attitudes towards advertising: The American experience.
International Journal of Advertising, 3(1): 3–15.
Zeithaml, V. A. 1988. Consumer perceptions of price, quality, and value: a means-end
model and synthesis of evidence. The Journal of Marketing, 2–22.
Zimmermann, A. 2011. Interpersonal relationships in transnational, virtual teams:
Towards a configurational perspective. International Journal of Management
Reviews, 13(1): 59–78.

138

139
APPENDIX I – Quiz Simulator and brand recognition tools and
procedures used
Google forms helped transfer data to excel file, with the tool button, named ‚View
responses in Sheets‛. This tool processed information to a Google sheets file, which
facilitated the transfer to the custom built Excel file. The excel file was divided into five
sheets, ‚Raw Data‛, ‚Responses‛, ‚Results‛, ‛Graphics‛ and ‚Stats‛. This excel file then
suffered modifications, as it added two more sheets for the Brand Recognition results
‚Raw Data Brand Recognition‛ and ‚Brand Recognition Results‛, discussed further
bellow.
1. Raw Data
‚Raw Data‛, was chosen to paste all data from Google Sheets. To structure all data, a
table was created, with a header row selected, in order to better organize the
information.
Raw data table began, with the insertion of the time of response followed by age,
gender, occupation and email. As for the answers to the questions the title of the
columns was the respective questions. The last columns of the table were for feedback
questions. Data was not altered in any way from google sheets file.
140
2. Responses
The next sheet created was ‚Responses‛ sheet. This sheet was composed through a
single table and was created to compile all answers users gave, and figure it out which
ones were correct and which ones were incorrect.
2.1. Structure
The table started by replicating in the first columns, with its respective headers, the age,
gender, occupation, for control purposes. After that, the table focused its efforts,
representing every question of the second phase, using the columns’ header for that
purpose. The second and third rows were used to represent the question type and the
right answer for the respective question. For control purposes, feminine answers were
in the third row and masculine were in the second, meaning the question type were in
the other respective row. Additionally for control, masculine question type were in
color blue and feminine were in skin color.
2.2. Method
The method used to compile all the answers, was a binary code of ‚0‛’s and ‚1‛’s, being
‚0‛ wrong and ‚1‛ right, using answer cells, in the second or third row, to check. At the
end of the table, a total row was added to sum all answers. Was important to highlight
all question responses had a ‚0‛ or a ‚1‛, even if the applicant was not allowed to
answer. In other words, male subjects only responded to male questions and all their
female questions were automatically assumed as a ‚0‛. On the other hand, female
subjects had the opposite event, meaning all the male questions were ‚0‛.
141
2.3. Results
The next sheet, ‚Results‛, and was created to find out if applicants were able to win or
not the prize for the ‚QUIZ game with PRIZE‛ category in the game. Additionally, this
sheet was used to compile ‚Feedback‛ data, mostly into circular graphics in the next
sheet, ‚Graphics‛, showing percentages of choices available, which gave a better
visualization on results for the third phase of the experiment. Like the others, data was
put together in a single table, with a header row on the top and a Total row on the
bottom, where first columns were used to organize profile information, gathered in first
phase of the experiment.
Personal information 2.3.1.
The table began with the date when users participated in the test, and followed with
their email, age, gender and occupation, which was copied from ‚Raw Data‛ first
columns.
Questions 2.3.2.
As for questions, they were presented in four groups, ‚QUIZ with interest‛ (QI), ‚QUIZ
without interest‛ (QWI), ‚PRIZE QUIZ with interest‛ (PI) and PRIZE QUIZ without
interest‛ (PWI). These groups resulted from the sum of binary sums conducted in the
‚Responses‛ sheet. Each group was composed by male and female results summed
together. For example, the first group was composed by the two first female questions
of the first category, ‚QUIZ GAME‛, associated with questions directed to users’
interests, added with the two first male questions of the same category.

142
Win/Lose 2.3.3.
The last column of the table was reserved to see if users actually won. This column was
created with a simple IF formula, figuring out if the sum of the last two groups PI and
PWI was equal to 12. In the outcome of a TRUE sentence the result would print out a
‚WON‛ in a green cell. However if the sentence turned out to be FALSE, the result
would be ‚DID NOT WIN‛ in a red cell. This way the result would be more visual and
practical to understand.
Total Row 2.3.4.
The total row in the bottom was used to find the average of right answers in each
group, and was used to formulate the percentage of right answers, on the column
beneath, dividing the average result by 6, the total number of right answers possible.
2.4. Graphics
The next sheet, ‚Graphics‛, was used to compile data generated from last sheet,
‚Results‛. The sheet was composed of ten graphics, three concerning users profile, five
related to users’ feedback responses, one graphic showing the winning results and one
showing, question category performance comparisons.
User profile 2.4.1.
The first three graphics were created to have a better visual at statistical analysis over
users’ profile, concerning their age, gender and occupation. These graphics were all

143
structure the same way, starting with a table, generated for each profile parameter,
followed by a formula, showing percentages of every choice available. Graphics were
all circular with ‚Chart Title‛, ‚Data Labels‛ and ‚Legend‛. The formula used was a
simple COUNTIF statement, divided by another COUNTIF statement to count all cells
with text (‚*‛). The choice of a circular graphic fell into the fact that options were all
independent, making them easy to comprehend in a circular structure.
Feedback 2.4.2.
The next five graphics were intended to picture the users’ choices, during feedback
phase. All five used the same method, starting with a table, pointing out the
percentages of users’ choices, followed by the respective graphic. However the graphics
were not all in the exact same structure.
First and Third graphics 2.4.3.
The first and third graphics, concerning the ‚Idea‛ and ‚Time‛ choices, were designed
as a clustered column graph, with ‚Title‛, ‚Data Labels‛ and a ‚Data Table‛. This
structure gave a better way to comprehend the results, as these data ware established as
linear scale questions, therefore it was important to structure in a linear graphic with
clustered columns.
Second and Forth graphics 2.4.4.
Regarding second and forth graphics, choice was also on circular graphics, as the
choices were independent, therefore the structure was same as the graphics for users’
profile options, circular with ‚Title‛, ‚Label‛ and ‚Legend‛.

144
Fifth graphic 2.4.5.
The fifth graphic, ‚Implementation‛, used a different structure from the other ones. Due
to the fact, this data was generated through a checkbox question, none of the graphics
used would be a better suit to visualize the data and have the best judgment. With this
type of question, users could have multiple choices at the same time, including users’
own suggestions, which can result in tiny percentages of custom users’ choices.
Therefore, the best way to generate this results was through a clustered bar graphic,
with a ‚Data Table‛, for better visualization of all options, ‚Horizontal Axe‛ ‚Title‛,
‚Label‛ and ‚Legend‛.
Win/Lose graphic 2.4.6.
The graphic, concerning the Win/Lose evaluation, was constructed as a clustered
column with a ‚Label‛ and a ‚Horizontal Axis‛. The graphic also was built with a green
color for the ‚WIN‛ status and a red color for the ‚DID NOT WIN‛.
Categories graphic 2.4.7.
The last graphic, showed a comparison between question categories’ performances. The
graphic was structured as Win/Lose graphic, and was intended to demonstrate which
question category had the highest and lowest rate of correct answers. This ‚category‛
graphic displayed a color red on the column representing the worst performance and
green on the highest performance.
145
3. Stats
Last but not least, the ‚Stats‛ sheet was the last one to be constructed and its main
function was to interrelate variables used, try to find out a correlation between the
results, spot any anomalies and ultimately takeout, biased inputs. In order to achieve
that goal, two distinct tables were created to evaluate the numbers. The first table was
built to assess performance, according to gender, gender for each age and occupation,
within every question category group, from ‚Results‛ sheet, QI, QWI, PI and PWI. The
second table was constructed to assess performance according to age, occupation and
gender, within every single question of the second phase, computed in the experiment.
Analyzing it more further, the tables’ execution was divided into small portions, in
order to be meticulously explained.
3.1. First Table
Starting with the first table, it was wise to divide it in three groups, gender group, age
group and occupation group.
Gender group 3.1.1.
The first group, gender, was constructed to understand the numbers relative to males
and females in each category group from the ‚Results‛ sheet, and find out if there was
any significant discrepancy, comparing both genders’ performance in any category. The
table had two significant rows, one for each gender, and eleven significant columns, one
for the number of participants, two for each of the four categories and two for the total,
being the first a total and the second a percentage.

146
Participants column 3.1.1.1.
The first column represented the absolute number of participants in the study, for each
gender. The formula used was a COUNTIF, using the table gender from the ‚Results‛
sheet.
Category columns 3.1.1.2.
The second part columns, which encompassed all four categories, presented each
category in two columns, one representing total right answers and the other
representing percentage of right answers, in percentage format. The formula used to
reach the total number was a SUMIF, using the values of the gender data as range and
the values of the respective category data as the SUM range, located in the ‚Results‛
sheet. As for the percentage values, a simple multiplication/division calculation was
made, dividing the Total right answers for the number of participants, in the first
column, multiplied by 6, which represented the maximum correct answers possible.
These formulas were composed in the same way for all the categories.
Age group 3.1.2.
Moving on to the second group, its objective was to conjugate numbers, referred to
males and females, within their age range, inside each questions category. Likewise, the
main goal was to find out if there was any significant discrepancy, comparing both
performances, within the combination of age, gender and category variables. The group
was structured the same way as the first group, being the columns exactly the same. As
for the rows, the group had nine significant rows, organized in three groups, one for

147
each age range. Each group’s row started with a total of an age range, followed by the
age range for each gender.
Participants column 3.1.2.1.
Regarding formulas used to assemble the numbers, the first column, ‚participants‛, was
constructed with a COUNTIF in the first row, with the age range, and a COUNTIFS for
the second and third rows, with one of the ranges as the age and the other the gender,
all collected from the ‚Results‛ sheet.
Category Columns 3.1.2.2.
Concerning columns related to question categories, the first row numbers were
targeting how many correct answers (in absolute and percentage numbers), were
achieved for a determined age range. As for the second and third rows, the goal was to
target how many correct answers were achieved for a determined age range, but for
each gender. For the formulas, in the first row, a SUMIF was used with a range as the
ages’ column and a sum range as the column for questions of the intended category, all
collected from the ‚Results‛ sheet. The second and third rows values used a SUMIFS
formula, with sum range as the column for the category questions, and two criteria
ranges, age and gender, all collected from the ‚Results‛ sheet as well.
Occupation group 3.1.3.
The third group, occupation, had the same objective as the other two groups, find
significant discrepancies, but this time just by assessing the users’ performance in each

148
category, according to their occupation response. Just as the other two groups, this
group had the same columns structure, having just three rows, one for each occupation
option. The values in category columns were meant to represent the total number of
right answers, for a determined occupation (in absolute and percentage values).
Concerning how the formulas were generated, the group had the same formulas as the
first group, ‚gender‛, using for the first column a COUNTIF and for category columns a
SUMIF, differing just in the range option (occupation column from the ‚Results‛ sheet).
The third columns, for the totals, represented the sum of every correct answer for each
category, and the percentage was also referred to each category matched together, so
that it would show the performance difference between male and female as total.
Color 3.1.4.
Throughout the whole table, all percentage values were formatted with a color scale
option, meaning all percentage values would be compared in terms of value, and
assigned a color, in accordance. The scale ranged values from 0% to 100%. The closer
the values were to 0% the redder the color, on the other hand, the closer to 100% the
greener the color. By choosing this conditional color option, results were much more
simple and easy to view and understand, in the big picture.
3.2. Second table
The second table in ‚Stats‛ sheet, represented users’ performance in every single
question, according to its age, occupation or gender, separately. The table had eight
rows, three representing age variables, other three for occupation variables and the last
two represented male and female genders. As for the columns, each question had two
149
columns assigned to them, one for the total values and another for the percentage
values, and above, occupying both columns, the question written, with its respective
question number, beneath it.
Total Values 3.2.1.
This time all formulas for the total columns were in the same structure. The formula
used was a SUMIF function with the range, in a structured reference for the respective
row value, with an INDEX function inside the SUM range section. Furthermore, INDEX
function, had an array representing every question, with a ‚0‛ for the column and row
and the number of the area represented, as the question number in the table. Is
important to highlight that each array, for the questions, followed a structured
reference, in order to be a fixed value and be easy to extend to the rest of the columns.
Percentage values 3.2.2.
Regarding percentage column values, the same formula, used for the total value, was
divided by the total value possible to reach. For this denominator, a COUNTIFS
function was constructed, with the respective criteria column as first range, and the
gender column with the criteria, respective to questions’ gender. In other words, this
formula gave the possibility to isolate the correct answers for a specific question within
specific criteria, like age, occupation or gender. For example, in the first question, for
the non-student criteria, the formula would need to create a SUMIF, with the
‚Occupation‛ column from the ‚Responses‛ sheet, with a structured reference, and the
criteria would by the row cell in the actual table, ‚Non-Student‛. The SUM RANGE,
would start with an INDEX function, with an array with all questions from the

150
‚Responses‛ sheet, with column and row equal to ‛0‛, and the area code equal to the
number of the respective question, located in the actual table ( in this case would have
been ‚1‛). As for the percentage value, the formula would continue by dividing
everything by the function COUNTIFS, where first range would be the occupation
column, from the ‚Responses‛ sheet, the first criteria would be the respective row cell
in the actual table, ‚Non-Student‛, the second range would be the gender column also
located in the ‚Responses‛ sheet, and its criteria cell would be the gender of the
respective question, in this case ‚Female‛, found on top of the actual table along with
the question.
4. Brand recognition data collection
One month later, a new survey was sent to participants, in order to understand how
recognition was conducted for quiz and non-quiz questions and how was the difference
in brand recognition performances for each category, concerning each demographic
parameter in the study. The survey was constructed with Google forms platform, and
was composed by three sections, one to introduce the survey and the other two were
the respective brand recognition section for each gender.
4.1. Introductory section
The Introductory section, where the survey was explained, asked two questions, email
address and gender. Email address was asked, in order to associate demographic
parameters, questionnaires and feedback with brand recognition. Email address was
the main channel used to reach out subjects from the first experiment, however

151
Facebook was also a channel used for the same purpose in order to have more
responses. Gender was asked, in order to transport users to their own brand recognition
page, as each gender had its own brand recognition section.
4.2. Brand recognition sections
As for the brand recognition sections they were compiled in a checkbox format where
users were demanded to only check-in brands they remembered. Brands were put
together in the same order as they were in previous questionnaires, and they were not
advised of this detail. The idea for this order was to get users more familiar with brands
in order for them not to give up on the quiz right away. Each brand had one or two
rival brands along in the list, to understand if subjects really remembered brands or
they just checked every brand. The goal was to get rival brands that would prove users
really remembered brands from the first experiment but, at the same time, that
wouldn’t be too extensive for them to lose interest. Prior research stated that when
brands are showed in chronological order, the first brands to be presented have better
brand recognition than last ones (Peters and Bijmolt, 1997). Due to the concern of
participants choosing brands in an exponential decay, one brand was out of its
chronological order to serve as a control device. The brand chose for this purpose was
‚Casa dos Segredos‛ along with two rival brands ‚Peso Pesado‛ and ‚Ídolos‛. These brands
were put in the end of the checkbox list with the ‚Commercials with no game‛
category, even though they were part of the category PWI.

152
5. Brand recognition data compilation
As previously mentioned, the excel file used in the first experiment suffered
modifications some modifications. Results were compiled in the same excel sheet, used
for the first experiment. For brand results, two new sheets were created, one to compile
raw data from the Google forms platform, named ‚Raw Data Brand Recognition‛, and
another sheet to compile the results in tables regarding the users’ performances and
demographic parameters, named ‚Brand Recognition results‛.
5.1. Raw Data
Raw data was compiled into a table with five columns, timestamp, email, gender, male
responses and female responses. Each individual’s responses were put in a cell,
separating every chosen brand by a comma. Raw data had to be filtered, due to the fact
that not everyone who responded to the second survey responded to the first. This
event happened because of some individuals that were contacted via Facebook and
decided to participate in the second survey without participating in the first one.
Without cutting them out, these individuals would’ve biased the results, as they
would’ve responded completely random brands.
5.2. Brand recognition results
‚Brand Recognition results‛ sheet, was divided into three parts, results performance
table, brand recognition tables for the demographic parameter gender, and brand
recognition tables for the remaining demographic parameters, age and occupation.

153
Individual brand recognition results 5.2.1.
Starting with the first table, it was constructed to compile each individual answer and
was constituted by several column groups. The first column was responsible to cut out
subjects that did not participate in both experiments. In order to cut them out, a column
was constructed with a formula responsible to match raw data from ‚Raw Data‛ sheet
with raw data from ‚Raw Data Brand Recognition‛. This formula consisted in an IF
formula with a COUNTIF inside to count how many emails from the second test
corresponded to the emails from the first test. If the answer were more than zero a
‚YES‛ would appear in the cell, otherwise a ‚NO‛ would appear. This way it was
possible to rule out the ‚impostors‛ responsible for the biased results. The second e
third column ware responsible for showing the email used in the previous formula and
subjects’ gender. The next columns, showed every brand from the survey. The goal of
these columns was to register which brands were chose by each individual in way that
would facilitate later the comprehension of the results. In order to do so, each cell
would have an absolute number from ‚1‛ to ‚-1‛, being ‚-1‛, a wrong brand that users
chose, ‚0‛ a brand that was not selected by the user and 1 a correct brand that users
chose. In order to reach the correct number to be assigned to each cell, an IF formula
was constructed with, INDEX and MATCH formulas attached. The next two columns
registered the two other demographic parameters, age and occupation. The last group
of columns, presented results, grouped by category, QI, QWI, PI, PWI, ‚no game with
interest‛ (NGI) and ‚no game without interest‛ (NGWI). These columns were
constructed with a simple SUM formula, summing both right and wrong brands, and
their purpose was to facilitate the results compilation according to users’ demographics.
In order to reach the correct number to be assigned to each cell, a complex IF formula
was constructed. The goal of this formula was to capture a specific text within a cell,
meaning it needed to capture the name of the brand inside all choices that were

154
separated by a comma. For that the function ISNUMBER was used to find the name of
the corresponded brand. After that, an INDEX function was used to search for the
responses column, respective to their gender. The Match used the email column, from
the previous table, to match all values. In the end if the logic value were true, the
number ‚-1‛ or ‚1‛ would be assigned, depending if the brand was correct or incorrect.
Otherwise, if the IF function retrieved a false value, the number ‚0‛ would be assigned.
Demographic brand recognition results 5.2.2.
Brand recognition was assessed by gender, age and occupation and was created to try
to find out a correlation between each category and ultimately find a correlation with
results from the previous experiment.
Gender group 5.2.2.1.
Two tables were constructed to evaluate brand recognitions’ performance, according to
gender. The reason why two tables were created came from the uncertainty how results
should be summed. These tables addressed the fear of biased results from users that
would select every brand available even if they were not sure they the brand appeared.
These tables, were constructed to understand the numbers relative to males and females
in each category group from the previous table, and find out if there was any significant
discrepancy, comparing both genders performance in any category. The table had three
significant rows, one for each gender and one for the total and had six significant
columns, one for each category. All results were presented in percentage. Depending if
the results demonstrated an exponential decay or outrageous results, one of the
methods would be chosen to compile the other tables. Due to the chronological
155
disinterest showed in the table with only the correct brands, the table chosen was the
one with both correct and wrong answers. This choice was analyzed and discussed
further bellow.
All results were presented in percentage. The first table demonstrated results, summing
only correct brands and the second table summed both right and wrong results. Both
presented a straightforward SUM formula, where each brand was selected according to
its category. The SUM was divided by the number of brands assigned to each category.
Age group 5.2.2.2.
Moving on to the second group, the age group, its objective was to conjugate the
numbers, referred to males and females, within their age range, inside each questions
category. Likewise, the main goal was to find out if there was any significant
discrepancy, comparing both performances, within the combination of age, gender and
category variables. The group was structured the same way as the first group, being the
columns exactly the same. As for the rows, the group had nine significant rows,
organized in three groups, one for each age range. Each group’s row started with a total
of an age range, followed by the age range for each gender.
The formula used to reach the total number was a SUMIF, using values of age data as
range, and values of the respective category data as the SUM range, located in the
previous table. After that the value would be divided by a COUNTIF formula with the
same age range for the respective criteria. These formulas were composed in the same
way for all the categories.
The formula, presenting results for each gender, was similar, adding just other criteria,
‚gender‛, both to the SUMIF and COUNTIF, transforming this way the SUMIF in a
SUMIFS.
156
Occupation group 5.2.2.3.
The third group, occupation, had the same objective as the other two groups, find
significant discrepancies, but this time just by assessing users’ performance in each
category, according to their occupation response. Just as the other two groups, this
group had the same columns’ structure, having just three rows, one for each occupation
option. Values from category columns were meant to represent the total number of
right answers, for a determined occupation (in absolute and percentage values).
Concerning how formulas were generated, the group had the same formulas as the first
group, gender, using a SUMIF and dividing it by COUNTIF, differing just in the range
option (occupation column from the previous table).
Color 5.2.3.
Throughout the whole table, all percentage values were formatted with a color scale
option, meaning all percentage values would be compared in terms of value, and
assigned a color, in accordance. The scale ranged values from 0% to 100%. The closer
the values were to the 0%, the redder the color. On the other hand, the closer to 100%,
the greener the color. By choosing this conditional color option, results were much
simpler and easy to view and understand, in the big picture. The table, representing the
other brand recognition demographic parameters, age and occupation, was designed in
two shapes, one to compare each demographic parameter group, within each category,
and another to compare each demographic parameter, within one category. This
difference was captured by conditional formatting by color scales, being the first
assigned to the whole table and the second assigned for each category column.

157
APPENDIX II – Results for unaltered version
All results were compiled into graphics and tables in order to better visualize the
results. Tables showed number of participants for each parameter, in an absolute and
percentage format. Each result had a distinct purpose, which gave them relevance and
significance throughout the experiment.
1. Stats Sheet – Category results
Analyzing the first table, from ‚Stats‛, all the results were compiled divided by
categories, ‚QUIZ with interest‛, ‚QUIZ without interest‛, ‚PRIZE QUIZ with interest‛
and PRIZE QUIZ without interest‛, and analyzed according to their gender, age range
and occupation.
1.1. Gender
TABLE 17 - Gender concerning each category - unaltered version
Starting with gender in TABLE 17, the goal was to evaluate the performance of right
answers, according to the participants’ gender throughout every category and find if
there was a relevant disparity, comparing both male and female results. Likewise, this
Gender Participants QI QWI PI PWI Total
total % total % total % total % total %
Female 83 434 87% 386 78% 464 93% 463 93% 1747 88%
Male 77 409 89% 385 83% 375 81% 411 89% 1580 85%

158
table permitted a single evaluation for every gender in each category which was
beneficial to spot any unordinary discrepancy.
Total 1.1.1.
Looking at the results, there was a small difference in total results, which gave female
audience an 88% of right answers, opposing to only 85% for the males. These numbers
themselves were not significant, as the difference between them was not relevant.
Quiz questions with interest 1.1.2.
Results also were not significant, as the difference between male and female in the
category was 2%.
Quiz without interest 1.1.3.
Results in this category demonstrated a decrease against the previous category, with
females decaying their percentage to 78% of right answers and males having also a
slight decrease to 83%. These numbers might have meant individuals were not as
focused in generic commercials as they were on commercials, according to their
interests, which went according to H1. According to this number, H1 seemed more
plausible for female audience than male audience, as females had a decrease of 9% and
males had only 5%, giving the female number the lowest in the whole table. Another
reason might have been the difficulty on some commercial questions that could’ve
decreased the percentage of correct answers.
159
Prize quiz with interest 1.1.4.
This category, in theory, would have been the category that should’ve gotten the best
results for both genders, as it would accept H1, and H2. Although numbers did not
correspond with the expected results, as the number, concerning male percentage, was
the second lowest in the table, with 81% of percentage of right answers. Looking at the
female number, it was visible the upgrade against the other numbers, registering one of
the best percentages in the table. When compared with QI, it was possible to visualize
an increase in percentage of right answers for female gender, of 6% increase over the
non-incentive category. This higher difference, which confirmed H2, only happened in
female, which did not go according to expected. Several ideas might have helped
understand the numbers, starting with the fact that only male gender numbers ware not
according to what was expected, meaning it could have been because of a question that
was not completely understandable or was significantly more difficult. However
another idea to explain could have been the fact that this questionnaire was to extent for
participants to be fully 100%, focused, or that the offering of a chocolate as an incentive
was not a sufficiently good reason to focus. Nevertheless, this idea does not explain
female numbers.
Prize quiz without interest 1.1.5.
This category presented results that went according to H1 and were not according to
H2, meaning that, compared with PI, numbers were higher, which was not expected.
The table showed a 93% on the female audience, which resulted in an equal percentage
as PI. As for the male gender the number was much higher than PI, with an 89%
percentage in correct answers, which translated in an 8% increase. Nevertheless these
results were significantly better than QWI, which was in accordance with H1.
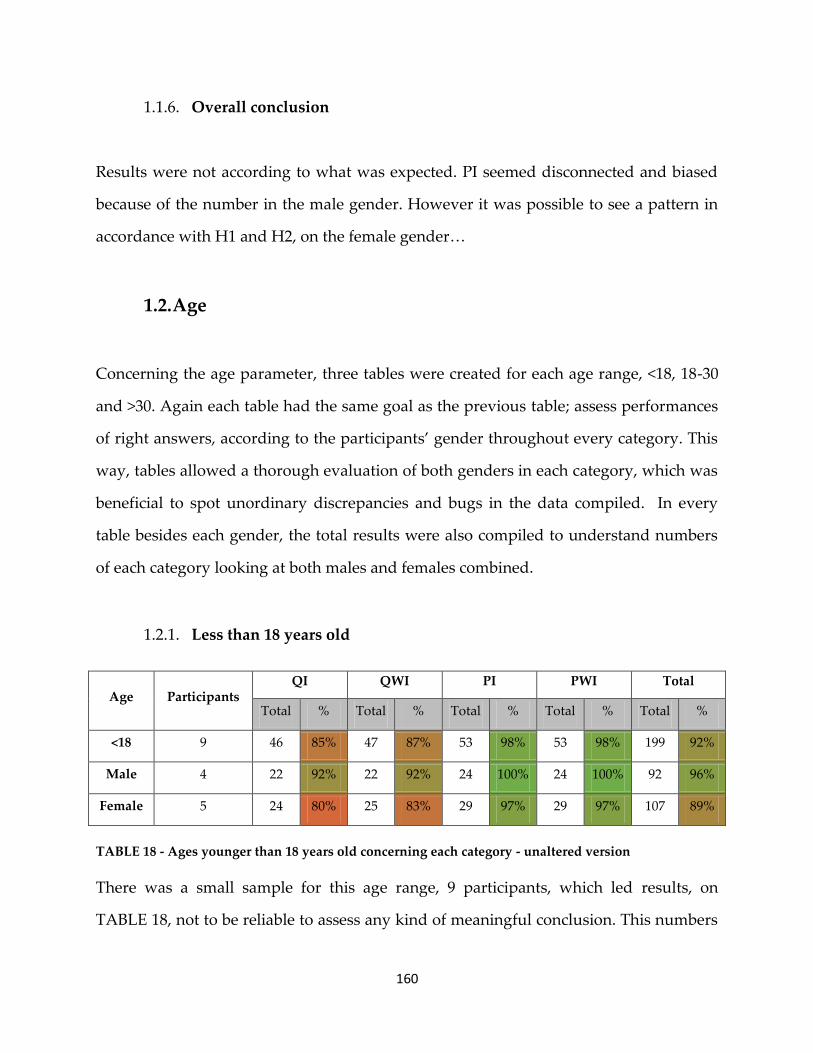
160
Overall conclusion 1.1.6.
Results were not according to what was expected. PI seemed disconnected and biased
because of the number in the male gender. However it was possible to see a pattern in
accordance with H1 and H2, on the female gender…
1.2. Age
Concerning the age parameter, three tables were created for each age range, <18, 18-30
and >30. Again each table had the same goal as the previous table; assess performances
of right answers, according to the participants’ gender throughout every category. This
way, tables allowed a thorough evaluation of both genders in each category, which was
beneficial to spot unordinary discrepancies and bugs in the data compiled. In every
table besides each gender, the total results were also compiled to understand numbers
of each category looking at both males and females combined.
Less than 18 years old 1.2.1.
TABLE 18 - Ages younger than 18 years old concerning each category - unaltered version
There was a small sample for this age range, 9 participants, which led results, on
TABLE 18, not to be reliable to assess any kind of meaningful conclusion. This numbers
Age Participants QI QWI PI PWI Total
Total % Total % Total % Total % Total %
<18 9 46 85% 47 87% 53 98% 53 98% 199 92%
Male 4 22 92% 22 92% 24 100% 24 100% 92 96%
Female 5 24 80% 25 83% 29 97% 29 97% 107 89%

161
only corresponded to 6% of the whole experience, (FIGURE 5). On top of that, there was
a small difference in total results, which gave male audience a 96% of right answers
opposing only 89% for females. These numbers themselves were not significant, as the
difference between them was not relevant. That being said, the numbers were according
to H2 but were not according to H1. Analyzing TABLE 18, it was possible to see a huge
difference between the two first categories and the last two, in terms of percentage of
correct answers, enhanced by the colors red and green. Looking at the total numbers in
the non-incentives categories, the average on both categories was 86% while the average
for the two incentive ones was 98%, which resulted in a 12% increase for the incentives.
However the H1 was not corroborated, as numbers directed to individuals’ interests
and non-interests were almost exactly the same, being the prize one exactly the same.
Nevertheless, it is important to highlight that these numbers had a very small sample
and so, were not viable for any conclusion.
Between 18 and 30 years old 1.2.2.
TABLE 19 - Ages between 18 and 30 years old concerning each category - unaltered version
This age range corresponded to the core audience of the experiment, therefore, these
results, in TABLE 19, allowed to best describe, data outcome, and led to meaningful
conclusions, on whether H1 and H2 were or not confirmed.
Age Participants QI QWI PI PWI Total
Total % Total % Total % Total % Total %
18-30 134 709 88% 641 80% 697 87% 728 91% 2775 86%
Male 64 341 89% 318 83% 309 80% 341 89% 1309 85%
Female 70 368 88% 323 77% 388 92% 387 92% 1466 87%
162
Total 1.2.2.1.
Looking solely at the total value there was a small difference in the total results that
gave the female audience an 87% of right answers opposing only 85% for the males.
These numbers themselves were not significant, as the difference between them was not
relevant.
Quiz with interest 1.2.2.2.
The results also were not significant, as the difference between male and female in the
category was only 1%.
Quiz without interest 1.2.2.3.
The results in this category demonstrated a decrease against QI, with females
presenting a decrease to 77% of right answers and males having also decay to 83%.
These numbers might have meant individuals were not as focused in generic
commercials as they were in commercials according to their interests, which went
according to H1. Regarding this number, H1 seemed more plausible for the female
audience than the male audience, as females had a higher decrease of 11% and males
had only 6%, giving the female number the lowest in the whole table, same as the
TABLE 17, presenting gender. Another reason might have been the difficulty of some
commercial questions that could’ve decrease percentage of correct answers.
Nevertheless, the results of these two first tables confirm H1, with an 8% decrease in
percentage of correct answers for the non interest category.

163
Prize quiz with interest 1.2.2.4.
This category in theory was the one that should’ve gotten the best results for both
genders, as it should have been accepting H1, and H2. Although, the numbers did not
correspond with the expected, as the number, concerning the male subjects, 80%, had a
decay of 9%, over QI, which led to a disagreement with H2. Looking at the female
number, 92%, it was possible to observe one of the highest values registered in the table.
When compared with QI, it was possible to visualize an increase in percentage of right
answers for the female gender, of 4% increase. This higher difference, which went
according to the H1 and H2, only happened in the female, which did not go according
to expected. A fact that might’ve helped comprehend this results, could’ve been the fact
that only the male gender numbers were not according to what was expected, meaning
it could’ve been because of a question that was not completely understandable or was
significantly more difficult. However another idea to explain could have been triggered
by the questionnaire that was too extent for participants to be focused 100% all the way,
or that the offering of a chocolate as an incentive was not enough to focus participants’
attention. Nevertheless this idea did not explain the female numbers.
Prize quiz without interest 1.2.2.5.
This category presented results according to H1 but not according to H2, which meant
that, compared with PI, the numbers were higher than expected. The table showed a
92% on the female audience, which resulted in an equal percentage as PI. As for the
male gender the number was much higher than PI, with an 89% percentage in correct
answers, which translated in a 9% increase. Nevertheless these results were
significantly better than the other QWI, which was in accordance with H1.
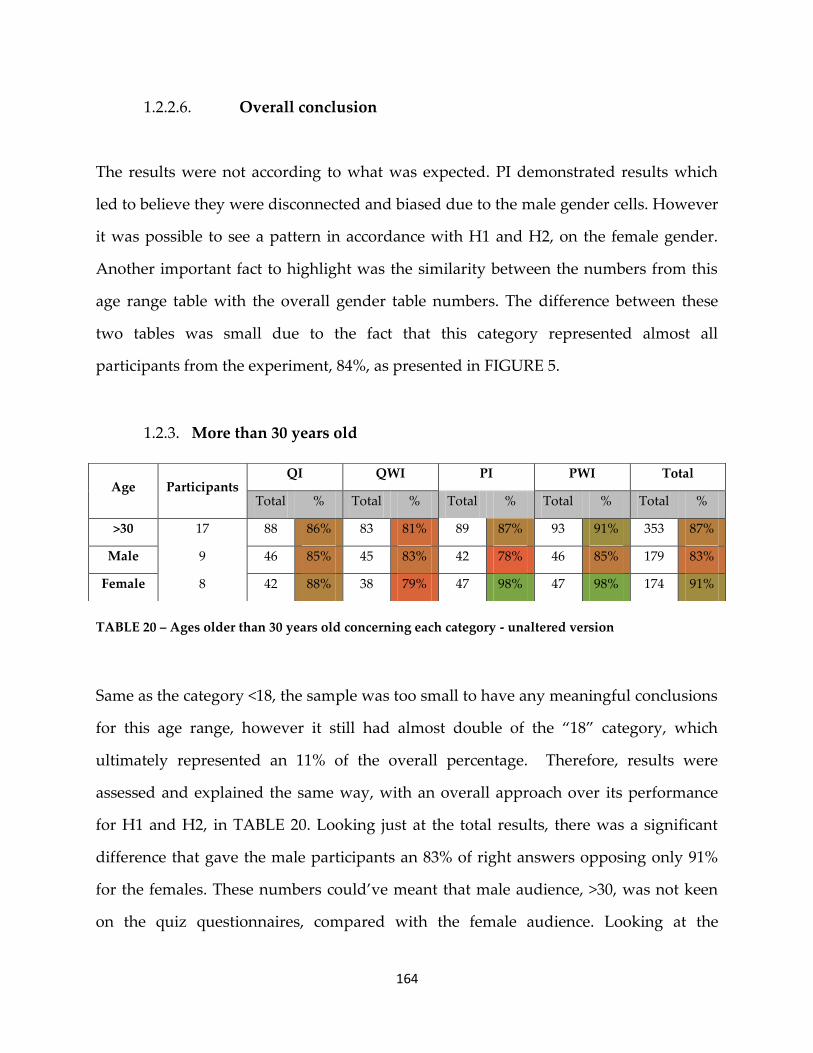
164
Overall conclusion 1.2.2.6.
The results were not according to what was expected. PI demonstrated results which
led to believe they were disconnected and biased due to the male gender cells. However
it was possible to see a pattern in accordance with H1 and H2, on the female gender.
Another important fact to highlight was the similarity between the numbers from this
age range table with the overall gender table numbers. The difference between these
two tables was small due to the fact that this category represented almost all
participants from the experiment, 84%, as presented in FIGURE 5.
More than 30 years old 1.2.3.
TABLE 20 – Ages older than 30 years old concerning each category - unaltered version
Same as the category <18, the sample was too small to have any meaningful conclusions
for this age range, however it still had almost double of the ‚18‛ category, which
ultimately represented an 11% of the overall percentage. Therefore, results were
assessed and explained the same way, with an overall approach over its performance
for H1 and H2, in TABLE 20. Looking just at the total results, there was a significant
difference that gave the male participants an 83% of right answers opposing only 91%
for the females. These numbers could’ve meant that male audience, >30, was not keen
on the quiz questionnaires, compared with the female audience. Looking at the
Age Participants QI QWI PI PWI Total
Total % Total % Total % Total % Total %
>30 17 88 86% 83 81% 89 87% 93 91% 353 87%
Male 9 46 85% 45 83% 42 78% 46 85% 179 83%
Female 8 42 88% 38 79% 47 98% 47 98% 174 91%

165
numbers on the male side, it was difficult to spot a pattern that either H1 or H2. The
first two categories went according to H1 with a 2% decrease from QI to QWI. As for
the other two prize categories, there was a huge increase of 7% from PI to PWI, which
went completely against H1. Also regarding H2, there was the decay of 7% from PI to
PWI, which result the opposite of H2. Concerning female results, also only one
hypothesis was confirmed, H2, and with fly color values having in both interest and
non-interest a huge increase in percentage of corrected answers. Both prize categories
had the same result, 98%, which led to believe females over 30 years old were more
focused when the possibility of incentives were offered for their attention. As for H1, it
only manifested positive in the non-incentive category. Nevertheless, it was important
to highlight that this age range had a very small sample which made them not viable for
any conclusion, as the <18 range.
Overall conclusion 1.2.4.
Comparing the three tables, it was possible to construct three conclusions along with
some assumptions. First, the younger audience was keener on the gaming method, and
seemed to try harder to answer correctly every question. Secondly, in the >30, female
participants seemed more inclined to focus on questions where their attention would
have the possibility to be rewarded with an incentive. However these two conclusions
lack of reliability, as both these categories represented only a small sample of the whole
test. Lastly, the main conclusion from these tables came from the cells responsible for
male results in PI. This table presented in all cells an awkward number, and against
both H1 and H2. The surprisingly low number might have resulted from a question that
was unevenly more difficult than the normal or even a question that was confusing that
might have misguided male participants to the wrong answer. Nonetheless, looking at
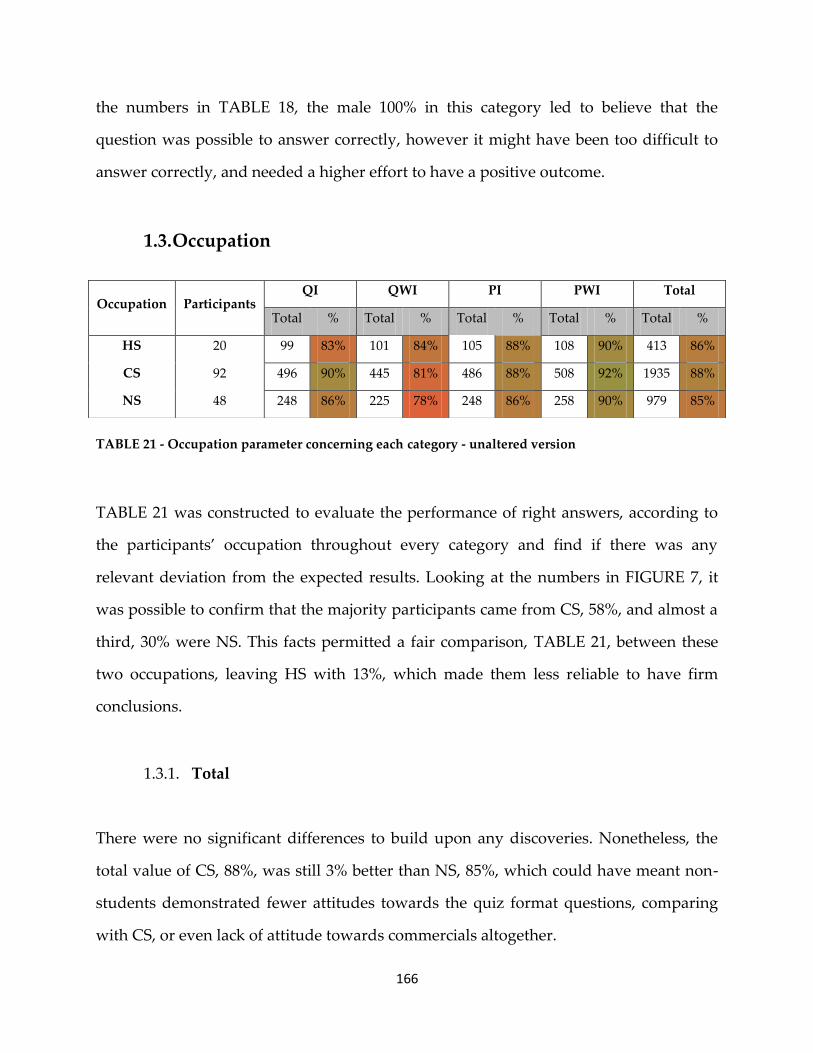
166
the numbers in TABLE 18, the male 100% in this category led to believe that the
question was possible to answer correctly, however it might have been too difficult to
answer correctly, and needed a higher effort to have a positive outcome.
1.3. Occupation
TABLE 21 - Occupation parameter concerning each category - unaltered version
TABLE 21 was constructed to evaluate the performance of right answers, according to
the participants’ occupation throughout every category and find if there was any
relevant deviation from the expected results. Looking at the numbers in FIGURE 7, it
was possible to confirm that the majority participants came from CS, 58%, and almost a
third, 30% were NS. This facts permitted a fair comparison, TABLE 21, between these
two occupations, leaving HS with 13%, which made them less reliable to have firm
conclusions.
Total 1.3.1.
There were no significant differences to build upon any discoveries. Nonetheless, the
total value of CS, 88%, was still 3% better than NS, 85%, which could have meant non-
students demonstrated fewer attitudes towards the quiz format questions, comparing
with CS, or even lack of attitude towards commercials altogether.
Occupation Participants QI QWI PI PWI Total
Total % Total % Total % Total % Total %
HS 20 99 83% 101 84% 105 88% 108 90% 413 86%
CS 92 496 90% 445 81% 486 88% 508 92% 1935 88%
NS 48 248 86% 225 78% 248 86% 258 90% 979 85%

167
Quiz with interest 1.3.2.
Looking at this category, the first number that popped up was the HS, 83%, which was
7% less than CS and 3% less than NS, however HS numbers were somewhat biased by
the lack of participants. Comparing CS with the NS, it was possible to see the same
pattern as seen on the totals, giving the impression that NS cared less.
Quiz without interest 1.3.3.
From this category it was possible to see the confirmation of H1, as the percentages of
correct answers for both CS and NS, decreased by 9% and 8% respectively, which gave
the impression that when the commercials were directed to the audience their focus
would improve. It is important to refer that the results from HS were not according to
expected, however, as previously mentioned, this results might have been biased from
the start due to the small sample of data.
Prize with interest 1.3.4.
From this category, results were not as expected, as they should have confirmed H2.
However, H2 was dethroned, due to the fact, CS value, 88%, was 2% lower than its PI,
and the NS value turned out to have the same value, 86%. These phenomena might
have been explained by the results from the previous tables, due to the ‚outsider‛ value
from the male sample. This time the HS value was according to what was expected, as
its value ramped up 5%. Nevertheless, this positive result couldn’t be trusted, due to the
reasons already mentioned previously.
168
Prize without interest 1.3.5.
This last category showed that results were according to H2 but were not according to
H1. On one hand, H2 was confirmed, as QWI party ware clearly less accurate than PWI,
with an increase of 6%, 11% and 12% for the HS, CS and NS, respectively. However, H1
was not confirmed, as PWI, 90%, 92%, 90%, suffered an increase over PI, 88%, 88%, 86%
for the each occupation in the same order.
Overall conclusion 1.3.6.
The results matched the same outcome of the previous categories, and gave the same
sensation that something was off the expected normality.
Comparing the three occupation results, it was possible to construct two plausible
conclusions, and some assumptions. First, it was visible the difference between CS
participants over NS, as the CS performance was better in all categories, which led to
believe that this type of advertising method would be better suited for CS over NS. This
fact could have meant, NS probably earned their salary, which could have influenced
their attitude towards such strategy, giving it a less enthusiastic posture when
compared to CS. Lastly, the main conclusion from these tables came from the cells
responsible for the male results in PI. This table presented in all cells an awkward
number, which was against both H1 and H2. The surprisingly low number may have
resulted from a question that was unevenly more difficult than the normal or even a
question that was confusing that might have misguided male participants to the wrong
answer.

169
2. Stats Sheet – Individual results
The second table was constructed to comprehend the performance for each question
individually and this way understand if there was an unevenly number of wrong
answers in any question that could’ve disrupted the expected results. The table
evaluated each question according to each age, each occupation and each gender.
Studying these numbers, resulted in two discoveries.
TABLE 22 - Performances of questions 7, 8 and 9 concerning each parameter - unaltered version
First, in the female sector, in TABLE 22, from PWI, a commercial video had
performances significantly lower than the average, 86%, with an average of 56%.
Several assumptions were deduced by this fact. On one hand, not being a question
directed to female interests, it was possible not to give a strong reason for female
Question What’s the original movie
title?
When is the movie
premiere? Which is the official site?
Number 7 8 9
Total % Total % Total %
<18 4 80% 4 80% 2 40%
18-30 45 64% 44 63% 25 36%
>30 5 63% 7 88% 3 38%
HS 8 89% 8 89% 2 22%
CS 26 59% 27 61% 16 36%
NS 20 67% 20 67% 12 40%
Male 0 0% 0 0% 0 0%
Female 54 65% 55 66% 30 36%

170
audience to be focus on the video, leading to an outcome of a lower percentage of right
answers. On the other hand, the table, representing the video in question, showed a
question that was outrageously low with only 36% of correct answers. The question,
‚What is the movies’ official website?‛, was a trick question, as the obvious option
(www.nowyouseemee.com) was wrong, and the right answer was
(www.nowyouseemee.movie), which appeared written in the movie for about 2
seconds in the end of the movie. Another important fact which might explain these low
results was the fact that this commercial had twice the duration of the others videos in
the female experiment. This video with almost one minute long could have been too
long for the audience in question to focus or even care, and gave the assumption users
were affected with videos duration.
Question What brand appeared? What is the slogan? Which was the last product?
Number 37 38 39
Total % Total % Total %
<18 4 100% 4 100% 4 100%
18-30 64 100% 57 89% 28 44%
>30 9 100% 8 89% 3 33%
HS 11 100% 9 82% 5 45%
CS 48 100% 46 96% 23 48%
NS 18 100% 14 78% 7 39%
Male 77 100% 69 90% 35 45%
Female 0 0% 0 0% 0 0%
TABLE 23 - Performances of questions 37, 38 and 39 concerning each parameter - unaltered version
171
The second discovery, this time was in the male sector, in TABLE 23. From PI, a single
question had also a percentage lower than the average performance, 45%, throughout
the experiment. However the commercial which included this question, did not have a
low performance in the other two questions, 100% and 90%, which meant this might
have been an isolated problem concerning a single question. Studying further this
questions, it was possible to conjugate the same assumptions. The question asked
which last gamma product was showed, and appeared in the last second of the video,
with a duration of about 1 minute long. The answers were not written anywhere and
were not spoken, they were just performed by the actor, which increased difficulty level
for male participants, and might have explained this lack of positive performances.