ADVERTIMENT. La consulta d'aquesta tesi queda condicionada a l ...
192
ADVERTIMENT. La consulta d’aquesta tesi queda condicionada a l’acceptació de les següents condicions d'ús: La difusió d’aquesta tesi per mitjà del servei TDX (www.tesisenxarxa.net ) ha estat autoritzada pels titulars dels drets de propietat intel·lectual únicament per a usos privats emmarcats en activitats d’investigació i docència. No s’autoritza la seva reproducció amb finalitats de lucre ni la seva difusió i posada a disposició des d’un lloc aliè al servei TDX. No s’autoritza la presentació del seu contingut en una finestra o marc aliè a TDX (framing). Aquesta reserva de drets afecta tant al resum de presentació de la tesi com als seus continguts. En la utilització o cita de parts de la tesi és obligat indicar el nom de la persona autora. ADVERTENCIA. La consulta de esta tesis queda condicionada a la aceptación de las siguientes condiciones de uso: La difusión de esta tesis por medio del servicio TDR (www.tesisenred.net ) ha sido autorizada por los titulares de los derechos de propiedad intelectual únicamente para usos privados enmarcados en actividades de investigación y docencia. No se autoriza su reproducción con finalidades de lucro ni su difusión y puesta a disposición desde un sitio ajeno al servicio TDR. No se autoriza la presentación de su contenido en una ventana o marco ajeno a TDR (framing). Esta reserva de derechos afecta tanto al resumen de presentación de la tesis como a sus contenidos. En la utilización o cita de partes de la tesis es obligado indicar el nombre de la persona autora. WARNING. On having consulted this thesis you’re accepting the following use conditions: Spreading this thesis by the TDX (www.tesisenxarxa.net ) service has been authorized by the titular of the intellectual property rights only for private uses placed in investigation and teaching activities. Reproduction with lucrative aims is not authorized neither its spreading and availability from a site foreign to the TDX service. Introducing its content in a window or frame foreign to the TDX service is not authorized (framing). This rights affect to the presentation summary of the thesis as well as to its contents. In the using or citation of parts of the thesis it’s obliged to indicate the name of the author
-
Upload
khangminh22 -
Category
Documents
-
view
3 -
download
0
Transcript of ADVERTIMENT. La consulta d'aquesta tesi queda condicionada a l ...
ADVERTIMENT. La consulta d’aquesta tesi queda condicionada a l’acceptació de les següents condicions d'ús: La difusió d’aquesta tesi per mitjà del servei TDX (www.tesisenxarxa.net) ha estat autoritzada pels titulars dels drets de propietat intel·lectual únicament per a usos privats emmarcats en activitats d’investigació i docència. No s’autoritza la seva reproducció amb finalitats de lucre ni la seva difusió i posada a disposició des d’un lloc aliè al servei TDX. No s’autoritza la presentació del seu contingut en una finestra o marc aliè a TDX (framing). Aquesta reserva de drets afecta tant al resum de presentació de la tesi com als seus continguts. En la utilització o cita de parts de la tesi és obligat indicar el nom de la persona autora. ADVERTENCIA. La consulta de esta tesis queda condicionada a la aceptación de las siguientes condiciones de uso: La difusión de esta tesis por medio del servicio TDR (www.tesisenred.net) ha sido autorizada por los titulares de los derechos de propiedad intelectual únicamente para usos privados enmarcados en actividades de investigación y docencia. No se autoriza su reproducción con finalidades de lucro ni su difusión y puesta a disposición desde un sitio ajeno al servicio TDR. No se autoriza la presentación de su contenido en una ventana o marco ajeno a TDR (framing). Esta reserva de derechos afecta tanto al resumen de presentación de la tesis como a sus contenidos. En la utilización o cita de partes de la tesis es obligado indicar el nombre de la persona autora. WARNING. On having consulted this thesis you’re accepting the following use conditions: Spreading this thesis by the TDX (www.tesisenxarxa.net) service has been authorized by the titular of the intellectual property rights only for private uses placed in investigation and teaching activities. Reproduction with lucrative aims is not authorized neither its spreading and availability from a site foreign to the TDX service. Introducing its content in a window or frame foreign to the TDX service is not authorized (framing). This rights affect to the presentation summary of the thesis as well as to its contents. In the using or citation of parts of the thesis it’s obliged to indicate the name of the author

Optical properties of the dissolved organic matter as tracers of microbiological and
geochemical processes in marine ecosystems
Cristina Romera Castillo
Cèlia Marrasé y Xosé Antón Álvarez Salgado
Abril 2011


INDEXABSTRACT 5
GLOSSARY OF RELEVANT TERMS 9
INTRODUCTION 11
CHAPTER I
Production of chromophoric dissolved organic matter by marine phytoplankton 35
CHAPTER II
Net production/consumption of fluorescent coloured dissolved organic matter by natural bacterial assemblages growing on marine phytoplankton exudates 57
CHAPTER III
Optical properties of ultrafiltered dissolved organic matter (udom) from contrasting aquatic environments and their alteration by sunlight 87
CHAPTER IV
Fluorescence: absorption coefficient ratio – tracing photochemical and microbial degradation processes affecting coloured dissolved organic matter in a coastal system 119
CHAPTER V
Seasonal variability of different dissolved organic matter fractions followed by absorption and fluorescence spectroscopy in an oligotrophic coastal system (Blanes Bay, NW Mediterranean) 153
SYNTHESIS AND DISCUSSION 175
CONCLUSIONS 183
ACKNOWLEDGEMENTS 187

5
Resumen - Resum - Resumo - Abstract
ResumenLos océanos albergan 685 Pg de carbono orgánico, de los que 662 Pg están en forma disuelta. La enorme diversidad de compuestos que constituyen la materia orgánica disuelta (DOM) y la baja concentración en que se encuentra cada uno de ellos, hace de la caracterización química y estructural de este material una ardua tarea. Es por eso que menos del < 11% de la DOM está identificado en la actualidad. Una fracción variable de la DOM –entre el 20% en océano abierto y el 70% en zonas costeras– absorbe luz UV y visible, por lo que se conoce como DOM coloreada (CDOM). Parte de la CDOM, emite la radiación absorbida en forma de fluorescencia, si bien con un rendimiento cuántico bajo (en torno al 1%) y es conocida como DOM fluorescente (FDOM). El estudio simultaneo de la CDOM y FDOM combinando espectroscopia de absorción y fluorescencia permite –de forma relativamente simple, rápida y barata– ahondar en el conocimiento de (i) la estructura molecular de la DOM, en aspectos tales como su aromaticidad y peso molecular medio; y (ii) su reactividad biológica y fotoquímica, a través del estudio de la producción, consumo y/o alteración química de diferentes grupos cromóforos y fluoróforos en respuesta a la actividad de los microorganismos y la radiación solar en los océanos.
En esta Tesis se han realizado tanto experimentos de laboratorio como estudios de campo. En una serie de experimentos se ha profundizado en las fuentes microbiológicas de la CDOM y FDOM en condiciones controladas, demostrando que el fitoplancton marino produce un fluoróforo a Ex/Em = 320 nm/410 nm que es consumido por las bacterias marinas, que a su vez producen otro fluoróforo a Ex/Em = 340 nm/440 nm. Estos fluoróforos de naturaleza húmica, conocidos en la literatura especializada como “pico-M” y “pico-C”, se consideraban característicos de ecosistemas marinos y continentales, respectivamente. Este trabajo sugiere que la diferenciación tiene más que ver con el tipo de células que las producen: eucariotas o procariotas.
Se ha caracterizado ópticamente DOM aislada por filtración tangencial (> 1 KDa) de diversas aguas naturales, observándose cambios significativos en la aromaticidad y peso molecular medio de las muestras en función de su origen continental o marino y de su exposición a la luz natural antes de ser colectadas. Igualmente, se realizaron experimentos controlados para estudiar la respuesta de estos materiales a la radiación natural, observándose degradación de los fluoróforos de naturaleza húmica “pico-M” y “pico-C” y generación de un fluoróforo de naturaleza protéica, conocido en la literatura como “pico-T”. Al cultivar bacterias marinas usando los materiales irradiados como substrato se observa una rápida recuperación de los fluoróforos de naturaleza húmica, proporcional a la fluorescencia inicial de los materiales antes de ser irradiados.
Finalmente, se ha estudiado la importancia relativa de los procesos de mezcla de masas de agua de origen continental y marino, producción microbiana y degradación fotoquímica sobre la distribución de CDOM y FDOM en dos ecosistemas costeros con distintas condiciones: la Ría de Vigo y la Bahía de Blanes. La Ría de Vigo, sistema eutrófico enclavado en el afloramiento ibérico, se ve afectada periódicamente por episodios de afloramiento y hundimiento, resultando la producción microbiana el proceso dominante en condiciones de afloramiento y la descomposición fotoquímica en condiciones de hundimiento. Por otro lado, la Bahía de Blanes, en el oligotrófico Mediterráneo Nororiental, describe un marcado ciclo estacional dictado por la radiación natural incidente caracterizado por la acumulación estival de cromóforos y fluoróforos que absorben a <300 nm y la descomposición fotoquímica de los que lo hacen a > 300 nm.
6
Resumen - Resum - Resumo - Abstract
ResumEls oceans alberguen 685 Pg de carboni orgànic, dels quals 662 Pg estan en forma dissolta. L’enorme diversitat de compostos que constitueixen la matèria orgànica dissolta (DOM) i la baixa concentració en què es troba cadascun d’ells, fa de la caracterització química i estructural d’aquest material una àrdua tasca. És per això que menys del < 11% de la DOM està identificat a dia d’avui. Una fracció variable de la DOM –entre el 20% a l’oceà obert i el 70% a zones costaneres– absorbeix llum UV i visible, per la qual cosa es coneix com DOM acolorida (CDOM). Part de la CDOM, emet la radiació absorbida en forma de fluorescència, si bé amb un rendiment quàntic baix (entorn del 1%) i és coneguda com DOM fluorescent (FDOM). L’estudi simultanei de la CDOM i la FDOM combinant espectroscòpia d’absorció i fluorescència permet –de forma relativament simple, ràpida i barata– aprofundir en el coneixement de (i) l’estructura molecular de la DOM, en aspectes tals com la seva aromaticitat i el pes molecular mitjà; i (ii) la seva reactivitat biològica i fotoquímica, a través de l’estudi de la producció, consum i/o alteració química de diferents grups cromòfors i fluoròfors en resposta a l’activitat dels microorganismes i la radiació solar en els oceans. En aquesta Tesi s’han realitzat tant experiments de laboratori com estudis de camp. En una sèrie d’experiments s’ha aprofundit en les fonts microbiològiques de la CDOM i FDOM en condicions controlades, demostrant que el fitoplàncton marí produeix un fluoròfors a Ex/Em = 320 nm/410 nm que és consumit pels bacteris marins, que al seu torn produeixen un altre fluoròfors a Ex/Em = 340 nm/440 nm. Aquests fluoròfors de naturalesa húmica, coneguts en la literatura especialitzada com “pic-M” i “pic-C”, es consideraven característics d’ecosistemes marins i continentals, respectivament. Aquest treball suggereix que la diferenciació té més a veure amb el tipus de cèl·lules que les produeixen: eucariotes o procariotes. S’ha caracteritzat òpticament DOM aïllada per filtració tangencial (> 1 KDa) de diverses aigües naturals, observant-se canvis significatius en la aromaticitat i pes molecular mitjà de les mostres en funció del seu origen continental o marí i de la seva exposició a la llum natural abans de ser mostrejadas. Igualment, es van realitzar experiments controlats per estudiar la resposta d’aquests materials a la radiació natural, observant-se degradació dels fluoròfors de naturalesa húmica “pic-M” i “pic-C” i generació d’un fluoròfors de naturalesa protéica, conegut en la literatura com “pic-T”. En cultivar bacteris marins utilizant els materials irradiats com a substrat s’observa una ràpida recuperació dels fluoròfors de naturalesa húmica, proporcional a la fluorescència inicial dels materials abans de ser irradiats. Finalment, s’ha estudiat la importància relativa dels processos de barreja de masses d’aigua d’origen continental i marí, producció microbiana i degradació fotoquímica sobre la distribució de CDOM i FDOM en dos ecosistemes costaners diferents: la Ria de Vigo i la Badia de Blanes. La Ria de Vigo, sistema eutròfic enclavat en l’aflorament ibèric, es veu afectada periòdicament per episodis d’aflorament i enfonsament, resultant la producció microbiana el procés dominant en condicions d’aflorament i la descomposició fotoquímica en condicions d’enfonsament. D’altra banda, la Badia de Blanes, en el oligotròfic Mediterrani Nord-oriental, descriu un marcat cicle estacional dictat per la radiació natural incident caracteritzat per l’acumulació estival de cromòfors i fluoròfors que absorbeixen a <300 nm i la descomposició fotoquímica dels quals que ho fan a > 300 nm.
7
Resumen - Resum - Resumo - Abstract
ResumoOs océanos albergan 685 Pg de carbono orgánico, dos que 662 Pg están en forma disolta. A enorme diversidade de compostos que constitúe a materia orgánica disolta (DOM) e a baixa concentración na que se atopa cada un deles, fai da caracterización química e estrutural deste material unha árdua tarefa. É por iso que menos do 11% da DOM está identificada na actualidade. Unha fracción variable da DOM -entre o 20% no océano aberto e o 70% en zonas costeiras- absorbe luz UV e visible, polo que se coñece como DOM coloreada (CDOM). Parte da CDOM, emite a radiación absorbida en forma de fluorescencia, se ben cun rendemento cuántico baixo (en torno ó 1%) e é coñecida como DOM fluorescente (FDOM). O estudo simultáneo da CDOM e FDOM combinando espectroscopía de absorción e fluorescencia permite -de forma relativamente simple, rápida e barata- afondar no coñecemento de (i) a estrutura molecular da DOM, en aspectos tales como a súa aromaticidade e peso molecular medio; e (ii) a súa reactividade biolóxica e fotoquímica, a través do estudo da produción, consumo e/ou alteración química de diferentes grupos cromóforos e fluoróforos en resposta á actividade dos microorganismos e a radiación solar nos océanos.
Nesta Tese realizáronse tanto experimentos de laboratorio coma estudos de campo. Nunha serie de experimentos afondouse nas fontes microbiolóxicas da CDOM e FDOM en condicións controladas, demostrando que o fitoplancto mariño produce un fluoróforo a Ex/Em =320 nm/410 nm que é consumido polas bacterias mariñas, que á súa vez producen outro fluoróforo a Ex/Em =340 nm/440 nm. Estes fluoróforos de natureza húmica, coñecidos na literatura especializada como “pico-M” e “pico-C”, considerábanse característicos de ecosistemas mariños e continentais, respectivamente. Este traballo suxire que a diferenciación ten máis que ver co tipo de células que as producen: eucarióticas ou procariotas. Caracterizouse ópticamente DOM illada por filtración tanxencial (>1 KDa) de diversas augas naturais, observándose cambios significativos na aromaticidade e peso molecular medio das mostras en función da súa orixe continental ou mariña e da súa exposición á luz natural antes de ser colectadas. Igualmente, realizáronse experimentos controlados para estudar a resposta destes materiais á radiación natural, observándose degradación dos fluoróforos de natureza húmica “pico-M” e “pico-C” e xeración dun fluoróforo de natureza proteica, coñecido na literatura como “pico-T”. Ó cultivar bacterias mariñas usando os materiais irradiados como substrato obsérvase unha rápida recuperación dos fluoróforos de natureza húmica, proporcional á fluorescencia inicial dos materiais antes de ser irradiados.
Finalmente, estudouse a importancia relativa dos procesos de mistura de masas de auga de orixe continental e mariña, produción microbiana e degradación fotoquímica sobre a distribución de CDOM e FDOM en dous ecosistemas costeiros con distintas condicións: a Ría de Vigo e a Baía de Blanes. A Ría de Vigo, sistema eutrófico encravado no afloramento ibérico, vese afectada periodicamente por episodios de afloramento e afundimento, resultando a produción microbiana o proceso dominante en condicións de afloramento e a descomposición fotoquímica en condicións de afundimento. Por outro lado, a Baía de Blanes, no oligotrófico Mediterráneo Nororiental, describe un marcado ciclo estacional ditado pola radiación natural incidente caracterizado pola acumulación estival de cromóforos e fluoróforos que absorben a <300 nm e a descomposición fotoquímica dos que o fan a >300 nm.
8
Resumen - Resum - Resumo - Abstract
AbstractOceans store 685 Pg of organic carbon of which 662 Pg are in a dissolved form. The diversity of compounds that make up the dissolved organic matter (DOM) pool and the low concentration of each compound make the chemical characterization of this material a difficult task. For that reason, less than 11% of the oceanic DOM has been identified. A variable fraction of the DOM –between 20% in the open ocean and 70% in coastal areas- absorbs UV and visible radiation and it is known as coloured DOM (CDOM). A sub-fraction of the CDOM emits the absorbed radiation as fluorescence, although with a low quantum yield (around 1%), and this is called fluorescent DOM (FDOM). The study of the CDOM and FDOM pools, combining the spectroscopy of absorption and fluorescence, allows us to obtain knowledge about (i) the molecular structure of the DOM (i.e., aromaticity and average molecular weigh) and (ii) its biological and photochemical reactivity in a relatively simple, fast and economic way. This can be done through the study of the production, utilization and/or chemical alteration of the different chromophores and fluorophores in response to the activity of the microorganisms and the solar radiation in the ocean.
The work that has resulted in this thesis has involved both laboratory experiments and field studies. Some experiments have deepened our knowledge of (or focused on??) the microbiological sources of the CDOM and FDOM. For example, our work has shown that marine phytoplankton produces a fluorophore at Ex/Em 320/410 nm which is consumed by marine bacteria which at the same time produce another absorbing fluorophore at Ex/Em 340/440. These “humic-like” fluorophores, known in the literature as “peak-M” and “peak-C”, are considered to be characteristic of marine and continental ecosystems, respectively. This work suggests that differentiation is mostly due to the type of cells that produce them: eukaryotic and prokaryotic cells.
Furthermore, DOM isolated by tangential ultrafiltration (> 1 KDa) from different aquatic environments has also been characterized. Significant changes were observed in the aromaticity and average molecular weigh of the samples depending on whether they were of continental or marine origin and also on the exposition to the sunlight before sampling. Moreover, controlled experiments were performed in order to study the response of these materials to natural radiation. These experiments showed degradation of the humic-like fluorophores “peak-M” and “peak-C” and the formation of another protein-like fluorophores, known in literature as “peak-T”. When the marine bacteria were cultivated using the irradiated materials as substrate a rapid recovery of the humic-like fluorophores was observed. This recovery was proportional to the initial fluorescence of the materials before irradiation.
Finally, we have also studied the relative importance of the processes that involve the mixing between water masses of continental and marine origin, microbial production and photochemical degradation on the CDOM and FDOM distribution of two distinct coastal ecosystem: the “Ría de Vigo” and the Blanes Bay. The Ría de Vigo, enclosed in the Iberian upwelling system, is periodically affected by downwelling and upwelling events. Microbial production was the dominant process during the donwelling period while the photochemical decomposition predominated during upwellings. On the other hand, Blanes Bay, in the oligotrophic Northwest Mediterranean Sea, possesses a seasonal cycle determined by natural radiation. This is characterized by the accumulation of chromophores and fluorophores absorbing at < 300 nm and the photochemical decomposition of those absorbing at > 300nm during the summer season.

9
Glossary of relevant terms
aCDOM(λ) Absorption coefficient at wavelength λa*CDOM(λ) Carbon specific CDOM absorption coefficient at λ nmAOU Apparent oxygen utilizationβ constant for the obtention of the fluorescent quantum yield.BB Bacterial biomassCDOM Coloured dissolved organic matterDOC/DOM Dissolved organic carbon/matterENACW Eastern North Atlantic Central WaterFDOM Fluorescent dissolved organic matterF(340/440) FDOM at Ex/Em 340 nm/440 nm or peak-CF(320/410) FDOM at Ex/Em 320 nm/410 nm or peak-MF(280/350) FDOM at Ex/Em 280 nm/350 nm or peak-TQSU Quinine sulphate unitsS Spectral slopes Salinity TIN Total inorganic nitrogenΔa*CDOM(340) Residual of a*CDOM(340) with salinityΔAOU Residual of AOU with salinityΔF*(340/440) Residual of C-specific fluorescence with salinityΔ2F*(340/440) Residual of ΔF*(340/440) versus Δa*CDOM(340)Φ(340) Fluorescent quantum yield at 340 nm


Introduction


13
Introduction
The marine carbon cycle is driven by a large number of physical, chemical and biological processes which occur in the atmosphere, land and ocean. These processes determine the total carbon reservoir and also the relative weight of inorganic and organic marine carbon pools. The dynamics of this net carbon compartment also regulates the ocean capacity to absorb atmospheric CO2 and consequently plays a part in the crucial role that the ocean has in Earth’s climate. However, and despite its interest, there is still a lack of knowledge regarding the chemical composition and transformations of the major carbon compartments. The present study inquires into some key physical, chemical and biological factors governing the dynamics of the marine dissolved organic carbon (DOC) pool.
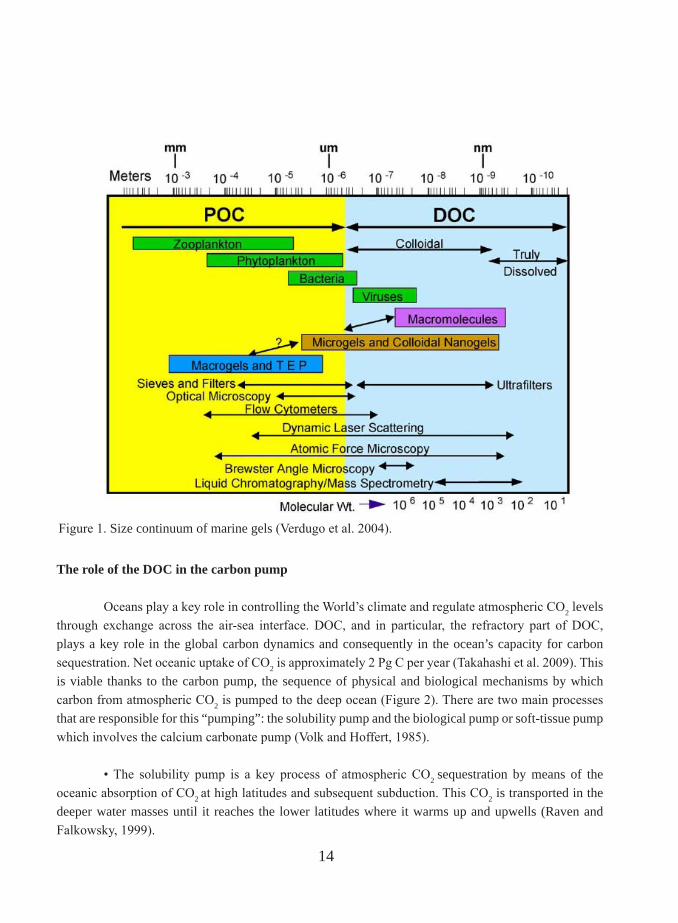
There are four major reservoirs of organic matter on the Earth’s surface: organic matter in soil and in recently deposited marine sediments, dissolved organic matter (DOM) in seawater and plant biomass on land. Among them, oceanic dissolved organic matter (DOM) is the most important intermediate in the global carbon cycle (Battin et al., 2008) and represents one of the largest and most dynamic reservoirs of reduced carbon on Earth. In the last few years there has been an increased level of interest in the study of oceanic DOM since it is related to greenhouse gases and therefore associated to climate change (Hedges, 2002). In the context of carbon cycle, the OM (organic matter) term refers, often, to its carbon content and, for this reason, the term OC (organic carbon) is, generally, used as synonym of OM (organic matter). Two pools of marine OM have been traditionally distinguished by its size: Dissolved Organic Carbon (DOC), the fraction that passes through 0.2-1.0 µm filters, and Particulate Organic carbon (POC), the fraction which is retained in these filters (Figure 1). However, any division based on size is purely operational (Verdugo et al. 2004) since organic matter is formed by a continuum of discrete units ranging in size from small colloids to compounds of a few Da. Nevertheless, this distinction is useful since particles smaller than 1µm are not prone to sinking (Hedges, 2002) and all living organisms other than viruses and small bacterial fall into the particulate fraction. The global DOC pool is estimated to be 662 Gt C (Hansell et al. 2009). This mass is comparable to the mass of carbon of all living vegetation on the Earth’s continents and the carbon stock of terrestrial biomass (600 Gt C) or the CO2 accumulated in the atmosphere (720 Gt C, Hedges 1992). Therefore, minor changes in the DOM pool could have a considerable impact on atmospheric CO2 concentrations and the radiative balance on Earth (Hedges, 2002). Indeed, it has been speculated that a large-scale oxidation of DOM may have prevented a dramatic global glaciation (‘snowball earth’) in the Neoproterozoic period (Peltier 2007).
14
The role of the DOC in the carbon pump
Oceans play a key role in controlling the World’s climate and regulate atmospheric CO2 levels through exchange across the air-sea interface. DOC, and in particular, the refractory part of DOC, plays a key role in the global carbon dynamics and consequently in the ocean’s capacity for carbon sequestration. Net oceanic uptake of CO2 is approximately 2 Pg C per year (Takahashi et al. 2009). This is viable thanks to the carbon pump, the sequence of physical and biological mechanisms by which carbon from atmospheric CO2 is pumped to the deep ocean (Figure 2). There are two main processes that are responsible for this “pumping”: the solubility pump and the biological pump or soft-tissue pump which involves the calcium carbonate pump (Volk and Hoffert, 1985).
• The solubility pump is a key process of atmospheric CO2 sequestration by means of the oceanic absorption of CO2 at high latitudes and subsequent subduction. This CO2 is transported in the deeper water masses until it reaches the lower latitudes where it warms up and upwells (Raven and Falkowsky, 1999).
Figure 1. Size continuum of marine gels (Verdugo et al. 2004).

15
• The biological pump, in which CO2, together with inorganic nutrients and light, is used by phytoplankton which converts it to organic carbon which is the base of the marine food web (Chisholm, 2000). About 50% of this organic carbon passes through consumers in marine systems and most of it will be converted back to CO2 and released into the atmosphere (Hansell et al. 2009). However, about 15% of it reaches the deepest ocean mainly by means of sinking particles but also as dissolved organic matter (DOM) transported by vertical mixing or convection currents. Once in the ocean interior the organic carbon is oxidized back to CO2 by marine microheterotrophs and it accumulates, out of contact with the atmosphere, travelling with the water masses for years (Volk and Hoffert, 1985). The structure of the food web and the relative abundance of species influence how much CO2 is pumped into the deep ocean. This structure is dictated largely by the availability of inorganic nutrients such as nitrogen, phosphorus, silicon and iron.
• The Ca2CO3 pump is part of the biological pump. At the ocean’s surface, the Ca2CO3
synthesizer organisms (cocolithophorals, foraminifers, and pteropods among others) remove CO2 to build calcium carbonate structures (i.e shells). When they die, their Ca2CO structures are transported into the depths through gravitational settling and active biotransport (Redfield et al., 1963). Once there, the high pressures and low temperatures of the deep ocean favour their dissolution and the consequent re-release of CO2.
Figure 2. Scheme of the solubility pump (right) together with the biological pump (middle) and the carbonate pump (left, modified from Chisholm, 2000).

16
Therefore, it is through these processes that CO2 is transported from the atmosphere to the ocean interior, where it can remain for time frames that range between decades to hundreds of years. This makes the ocean the most important CO2 sink on the Earth, with an essential role in the sequestering of atmospheric CO2 and in the mitigation of the greenhouse effect. The understanding of the role of organic and inorganic carbon pools in the carbon cycle is thus extremely important in order to help us comprehend and predict the carbon sequestration to the ocean interior.
Source and sinks of DOM
There are two main sources of organic matter in the ocean:
1) Input by terrestrial DOM, which represents only 2–3% of the total oceanic DOM pool, although it may be a dominant source in coastal zones (Opsahl and Benner, 1997).
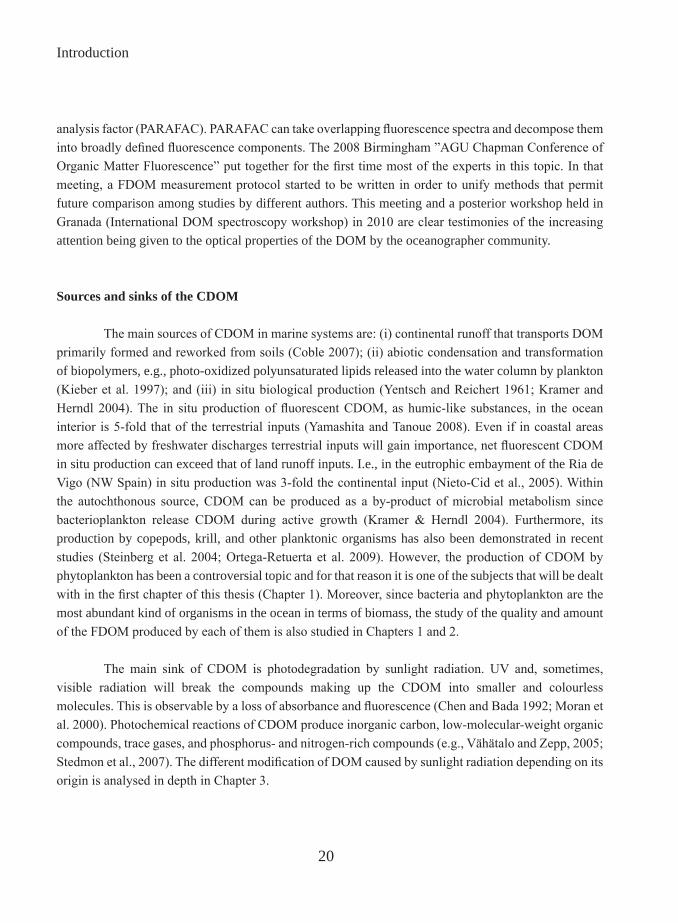
2) Autochthonous production which accounts for more than 95% of total organic matter and is therefore its dominant source. This in situ production is mainly due to phytoplankton primary production (~50 Gt-C per year), as a component of the biological pump. Through some biological processes (i.e., excretion, viral lysis, cell death, grazing, etc…) this DOM can be poured into the ocean where constitute the base of bacterioplankton growth and respiration (Azam and Cho 1987). Bacteria can be grazed by ciliates and flagellates, those can be grazed by zooplankton, and the trip of this carbon through different trophic microbial levels constitutes the so-called microbial loop (Azam et al., 1983).
Figure 3. Microbial Carbon Pump scheme (from Jiao et al., 2010).

Introduction
17
The recognition of the DOM as an important intermediate in rapid cycling of bioactive elements within the ocean (Pomeroy, 1974; Azam and Hodson, 1977) has also contributed to increasing the awareness of scientific community in relation to the DOM.
The fraction of organic carbon incorporated into the microbial biomass will be prone to pass to higher trophic levels. However, most of it will be oxidized by heterotrophs releasing CO2, inorganic nutrients (that will be accessible for phytoplankton) and recalcitrant forms of organic matter. The cyc1ing of reduced carbon is rather efficient. Only a small percentage of the global new production escapes rapid microbial degradation processes and is exported to the ocean’s interior (Hedges, 1992; Hansell and Carlson 1998). The preservation of reduced carbon is the exception while the mineralization is the rule. The amount of DOC routed through rapid bacterial production may be as much as 50% of the total primary production (William, 2000). However, this labile fraction only constitutes < 1% of the ocean DOC inventory owing to its very rapid turnover (Hansell et al. 2009). The major part of DOC in the ocean is considered refractory DOM (RDOM, Hansell et al., 2009). Part of the RDOM pool is initially resistant to microbial degradation while another portion of this pool is produced in situ by bacteria through degradation of more labile DOM. The mechanisms involved in the microbial production of this RDOM and its storage in the ocean have recently been called “microbial carbon pump” (Jiao et al. 2010). This “pump” consists of the production of refractory DOM by bacteria, Archaea and viruses from labile DOM, mainly originated by phytoplankton (Figure 3). It has been reported that 15-20% of the net community productivity (~ 2 Pg C yr-1) is not immediately mineralized accumulating in the surface ocean as biologically semi-labile DOC (Hansell, 2009). This amount is similar to the annual ocean uptake of anthropogenic CO2 (Takahashi et al., 2009).
Refractory DOC can be exported to ocean interior mainly by means of two different processes:
Convection currents: through this process the RDOC accumulates in high 1) concentrations in the mid-ocean gyres (Goldberg et al. 2009) and once there, it can be exported to all ocean basins by Ekman convergence of surface waters, by downwelling of the DOC-enriched waters to a few hundred of meters. Most of the DOC transported by this pathway is returned for exchange with the atmosphere within months to years (Hansell et al. 2009).
Thermohaline circulation: following this process the RDOC can be transported2) from low to high latitudes and reach greater depth via meridional overturning circulation and ventilation of the ocean interior. In this case the DOC remains sequestered for years to centuries (i.e., Hopkinson and Vallino, 2005).
Introduction
18
If the recalcitrant DOM manages to reach the surface ocean (i.e., as when transported by the thermohaline circulation or by convection currents) sunlight radiation, by means of photo-degradation processes, can transform a fraction of the RDOM into labile DOM which becomes available for microbes (Benner and Biddanda 1998; Obernosterer et al. 2001a), re-starting the cycle. However, not only labile DOM but also inorganic carbon (CO2 and CO) is produced by photo-degradation of the DOM. It has been estimated that between about 2 to 4% of the oceanic DOC is photochemically oxidized to CO2 and CO per year (Moran and Zepp 1997; Obernosterer et al. 2001b). However, a large gap of knowledge exists regarding the links between microbial activities and the refractory DOM formation.
Despite its large global inventory, DOC in the open ocean is found at extremely low concentrations. Typical concentrations of DOC are of about 80 µmol C kg-1 in the surface ocean and of approximately 40 µmol C kg-1 in the deep ocean (Hansell et al., 2009).
Optical properties of the DOM
A fraction of the DOM pool absorbs light at both ultraviolet (UV) and visible wavelengths and this is called coloured dissolved organic matter (CDOM; Coble 2007). CDOM absorption is highest in the UV wavelengths and decreases exponentially with increased wavelength (Jerlov, 1976; Kirk, 1994). CDOM is one the major absorption components of the ocean (Armstrong and Boalch, 1961). A sub-fraction of CDOM can emit blue fluorescence when irradiated with UV light and this is called fluorescent CDOM (FDOM; Coble 1996, 2007). It is important to note that all the fluorescent DOM is coloured but not all the coloured DOM fluoresces. FDOM can represent between 30% and 70% of DOC depending on the aquatic system, being found the higher percentages in coastal areas (Chen and Bada 1992; Chen, 2002). It is possible to distinguish between two main groups of FDOM substances, depending of their excitation and emission (Ex/Em) wavelengths. One group fluoresces at wavelengths characteristic of the aromatic amino acids (protein-like substances, Ex/Em 280 nm/350 nm) that corresponds to the peak-T reported by Coble (1996). Another group fluorescence at wavelength pairs characteristic of humic-like substances (Ex/Em 250/435 nm for peak-A, Ex/Em 320/410 nm for peak-M and Ex/Em 340/440 nm for peak-C). Some compounds likely to be responsible for the fluorescence of this group are tannins, lignin, polyphenols and melanins (Coble, 2007). Moreover, quinone moieties have also been suggested to contribute to fluorescent humic-like substances (Cory and McKnight, 2005).
CDOM measurements are a good tracer of water masses (Stedmon et al., 2010). The variability of the optical properties of DOM can also be used to trace biogeochemical processes as it is shown throughout this thesis. Other application of the CDOM is in the satellite remote sensing measurements. However, there are some problems with the estimation of DOC from absorbance remote sensing measurements. Although in most estuaries and coastal areas good positive correlations are found between

Introduction
19
CDOM and DOC (i.e., Vodacek and Blough, 1997; Ferrari, 2000), no –universal– relationship between these parameters has been found because the processes responsible for production and decomposition of both pools are decoupled in oceanic systems.
Despite of its importance in global climate change and in the ocean biogeochemical cycles, only a small fraction (<11%) of the components constituting the DOC pool are known (Benner, 2002). This gap of knowledge is owing to the difficulty of isolating the high number of separate compounds that constitute the DOM and the low concentrations at which these are found. Nevertheless, as the biochemical characteristics of DOM can be linked to its optical properties (Stedmon et al. 2003; Hernes et al. 2009), these can be used to trace compositional changes of DOM. Absorbance coefficients and spectral slopes have proven to be good proxies of some characteristics of the molecular structure of the DOM. For example ratio aCDOM(254/365) have been used in freshwater research as index of the average molecular weight of DOM (Dahlén et al. 1996; Engelhaupt et al. 2003) and a*CDOM(254) as aromaticity index (Weishaar et al., 2003). Fluorescence provides reliable information about the source, redox state, and biological and photochemical reactivity of DOM (Fellman 2010). Thus, this technique allows for a qualitative and semi-quantitative characterization of this pool.
The occurrence of coloured dissolved organic matter was reported for the first time by Kalle in 1937 and called “gelbstoff”, “gilvin” or “yellow substances”. In 1966, the same author used DOM fluorescence to follow the entry of terrestrial organic matter via rivers into coastal waters. Some years before, Weber (1961) devised a technique for elucidating the number of fluorescing compounds, i.e. fluorophores, in complex systems by variation of the excitation and emission wavelength and construction of a matrix of the resulting intensities. This technique allows to obtain the so-called fluorescence excitation-emission matrices (EEMs) and it was applied by Paula Coble to characterize DOM (Coble, 1990). Coble and colleagues showed that it is possible to differentiate between the two main groups of fluorescent components based on their excitation/emission (Ex/Em) wavelengths: protein-like substances and humic-like substances as described above. As a result, the optical properties of DOM, which had not previously been a major focus of research, began to be investigated. Thereafter, numerous studies employing fluorescence EEMs for the identification of terrestrial, marine and anthropogenic components of DOM have been reported (i.e., Coble 1996; Stedmon et al. 2003; Cory and McKnight 2005). However, the primary driver for optical studies of CDOM in the ocean for the last two decades has been the ocean colour remote sensing. The absorption of the CDOM overlaps with that of the chlorophyll in the blue region of the electromagnetic spectrum. Therefore, when satellite chlorophyll measurements are made, the absorption by CDOM has to be taken into account. Measurements of CDOM are also interesting in ocean colour remote sensing studies as a proxy to the dissolved organic carbon distribution. In this context, some studies have focused on the relationship between DOC and its optical properties to investigate to which extent CDOM and FDOM can be used as a proxy of DOM concentration. In 2003, Stedmon et al. went a step forward in the use of the EEMs by applying a parallel
Introduction
20
analysis factor (PARAFAC). PARAFAC can take overlapping fluorescence spectra and decompose them into broadly defined fluorescence components. The 2008 Birmingham ”AGU Chapman Conference of Organic Matter Fluorescence” put together for the first time most of the experts in this topic. In that meeting, a FDOM measurement protocol started to be written in order to unify methods that permit future comparison among studies by different authors. This meeting and a posterior workshop held in Granada (International DOM spectroscopy workshop) in 2010 are clear testimonies of the increasing attention being given to the optical properties of the DOM by the oceanographer community.
Sources and sinks of the CDOM
The main sources of CDOM in marine systems are: (i) continental runoff that transports DOM primarily formed and reworked from soils (Coble 2007); (ii) abiotic condensation and transformation of biopolymers, e.g., photo-oxidized polyunsaturated lipids released into the water column by plankton (Kieber et al. 1997); and (iii) in situ biological production (Yentsch and Reichert 1961; Kramer and Herndl 2004). The in situ production of fluorescent CDOM, as humic-like substances, in the ocean interior is 5-fold that of the terrestrial inputs (Yamashita and Tanoue 2008). Even if in coastal areas more affected by freshwater discharges terrestrial inputs will gain importance, net fluorescent CDOM in situ production can exceed that of land runoff inputs. I.e., in the eutrophic embayment of the Ria de Vigo (NW Spain) in situ production was 3-fold the continental input (Nieto-Cid et al., 2005). Within the autochthonous source, CDOM can be produced as a by-product of microbial metabolism since bacterioplankton release CDOM during active growth (Kramer & Herndl 2004). Furthermore, its production by copepods, krill, and other planktonic organisms has also been demonstrated in recent studies (Steinberg et al. 2004; Ortega-Retuerta et al. 2009). However, the production of CDOM by phytoplankton has been a controversial topic and for that reason it is one of the subjects that will be dealt with in the first chapter of this thesis (Chapter 1). Moreover, since bacteria and phytoplankton are the most abundant kind of organisms in the ocean in terms of biomass, the study of the quality and amount of the FDOM produced by each of them is also studied in Chapters 1 and 2.
The main sink of CDOM is photodegradation by sunlight radiation. UV and, sometimes, visible radiation will break the compounds making up the CDOM into smaller and colourless molecules. This is observable by a loss of absorbance and fluorescence (Chen and Bada 1992; Moran et al. 2000). Photochemical reactions of CDOM produce inorganic carbon, low-molecular-weight organic compounds, trace gases, and phosphorus- and nitrogen-rich compounds (e.g., Vähätalo and Zepp, 2005; Stedmon et al., 2007). The different modification of DOM caused by sunlight radiation depending on its origin is analysed in depth in Chapter 3.
Introduction
21
Role of the CDOM in the ecosystem
The role of CDOM is key for ocean biogeochemical cycles since it can control light penetration in the water column. It directly affects both the intensity and spectral quality of light in the water column (Jerlov, 1976; Blough and Del Vecchio, 2002). Through its effects on solar radiation in the water column, CDOM may either stimulate or hinder primary production and temperature stratification (e.g., Mopper and Kieber, 2002). A high concentration of CDOM can reduce photosynthetic available radiation reducing primary production in regions where light is limiting (Arrigo and Brown, 1996). On the other hand, it can also decrease harmful UV effects on phytoplankton cells as well as on bacterioplankton deoxyribonucleic acid (DNA) and physiology (Herndl et al., 1993). Another important role of CDOM is the contribution of its refractory fraction to the sequestration of anthropogenic carbon by the “microbial carbon pump”. The humic character of CDOM and FDOM increases with depth (Stedmon and Álvarez-Salgado, submitted). Due to the bio-refractory character of this CDOM, its constituting carbon is thought to remain unavailable for thousand of years when these substances are transported away from the sunlight. Another important role of CDOM is the capacity for metal scavenging by formation of complexes. This characteristic can be beneficial to the organisms when trace metals present in the medium reach toxic concentrations (Midorikawa and Tanoue 1998). These metals can be later released into the marine environment during DOM remineralization. The metal complex-forming capacity of CDOM also contributes to the solubilisation of the iron by photoreduction (Sánchez-Marín et al. 2010). The rate of CDOM photodegradation is catalytically influenced by the presence of iron (Gao and Zepp 1998). Furthermore, in rain-derived waters CDOM is likely to influence multiple atmospheric processes in addition to spectral attenuation of solar radiation such as the free radical and trace metal chemistry of the troposphere (Kieber et al. 2006).
Molecular size and optical properties
Another way to characterize the DOM pool is to separate it based on the molecular size of its components, using tangential-flow ultrafiltration techniques. The advantage of this procedure is that it supposedly does not modify the chemical structure DOM components. But its disadvantage is that it is time-consuming and that high volumes of water are needed to obtain a few milligrams of DOM. The most used pore size membranes are those that range between 1-3 kDa. Nevertheless, studies concerning the molecular weigh of DOM should to be read carefully since the limits between the high and low MW, depending on the pore size of the membrane used, are not fixed. Although it is not possible to generalize since there are few studies reporting the fluorescence in the different molecular fractions of DOM, its seems that protein-like substances are more important in the LMW fraction. This fraction corresponds to DOM with < 500 Da for Huget et al. (2010) or < 5 kDa for Yamashita and Tanoue (2004). This agrees with the evidence that the highest concentrations of total hydrolysable amino acids (THAA) were found
Introduction
22
in the LMW fractions for fresh and seawater (Wu et al., 2003; Yamashita and Tanoue, 2004). However, the predominance of the fluorescent humic-like peaks is found in different fractions depending on the origin of the water sample. The highest fluorescence intensity of peak-M has been found in the LMW fraction, i.e., < 500 Da (Huget et al., 2010) for estuarine samples and < 5 kDa for seawater samples (Yamashita and Tanoue, 2004). The fluorescence of peak-C was found to be predominant in the HMW fraction (> 1 kDa) in samples from freshwater (Bezile and Guo 2006) but in the LMW fraction (< 5 kDa) for fresh and sea water samples (Wu et al., 2003; Yamashita and Tanoue, 2004), likely in the intermediate fraction between 500 Da and1kDa (Huget et al. 2010). In this thesis, the optical properties and chemical characteristics of ultrafiltered DOM (> 1KDa) from contrasting aquatic environment is examined to help elucidate their origins and the biogeochemical transformations that they experienced in the environment before been collected (Chapter 3).
About the measurements of CDOM
The main advantages of the employment of optical techniques are the quickness, simple and relatively low cost of their measurements. Moreover, no handling of the sample is required so it is assumed that the CDOM does not suffer chemical changes. However, multiple instrumental and spectral corrections must be carefully made to correct for instrument-specific biases (Stedmon and Bro 2008).
The transmission of sample excitation from the source to the cuvette and the sample emission from the cuvette to the detector is not equally efficient at all wavelengths and it also depends on the fluorimeter. Therefore, excitation and emission corrections must to be employed. The emission correction use to be supplied with the instrument although the right way to correct the emission will be using an integrated sphere. However, the corrections for changes in the spectral properties of the light source can be made operating in “ratio” mode since modern fluorescence spectrophotometers have a built-in reference detector. The corrections for additional deviations can be made by periodically using a concentrated solution of Rhodamine B or 101 (Stedmon and Bro 2008). “Inner filter” effects constitute another problem in highly absorbing samples due to the absorption losses provoked by internal quenching. Greater effects are seen on the excitation signal since the absorption by DOM is considerably lower at emission than at excitation wavelengths. This problem can be easily resolved by diluting those samples presenting an absorption coefficient above ~ 10 m-1 (Stedmon and Bro 2008).
Calibration of spectrofluorimeters for FDOM measurements are usually made with dihydrate quinine sulphate in 0.1 N sulphuric acid. However, some authors use monohydrate quinine sulphate (Yamashita et al. 2010) introducing this difference in the calibration of the instruments. Currently, there is no consensus on how to calibrate the signal intensity of fluorescence. Some authors normalize their measurements to that of quinine sulphate measured at Ex/Em 350 nm/450 nm and present its fluorescent
Introduction
23
data in quinine sulphate units (QSU, Coble 1993). On the contrary, others do the normalization to the Raman signal from pure water presenting the FDOM in Raman Units (e.g., Determann et al. 1998; Stedmon et al. 2003). This is another important difference that makes it difficult for the comparison between results reported by different authors.
Nevertheless, none of these different ways of normalizing data makes sense if we want to calibrate measurements made at wavelengths that are different from those where quinine sulphate fluoresce or where Raman present its signal. For instance, the fluorescence at the region around Ex/Em 250/435 nm (peak-A) or around Ex/Em 280/350 nm (peak-T) is out of the region of the Raman peak and also of where quinine sulphate fluoresces. To address this issue, tryptophan has been used to calibrate the fluorescence of the protein-like substances. However, since its use has been not completely accepted by the DOM spectroscopic community and to facilitate comparisons with previous studies all the fluorescent data reported in this thesis are in quinine sulphate units.
Therefore, the use of the optical properties of DOM has some limitations: 1) the lack of standardization in the measurements, calibrations and units which complicate the comparison between authors; 2) fluorescence analysis of DOM does not provide information on the chemical structure of the compounds containing DOM nor on the carbon content of these organic compounds; 3) parameters like temperature, oxygen concentration and pH or metal quenching influence fluorescence peak shift and intensity.
CDOM in the environment
General vertical distribution of CDOM presents lower values at surface than at the deep ocean due to photobleaching in the euphotic layer, and the highest values in the thermocline (Nelson et al. 2010). In surface waters, higher values have been registered in the subarctic zones, intermediate values in the Equatorial upwelling region and Southern Oceans and lowers in the sub-tropical gyres (Nelson et al. 2010). The higher values of CDOM in winter and lower in summer owing to photo-degradation correspond to the typical seasonal distribution of CDOM in temperate systems (Nelson et al., 1998). The work described in this thesis looks at the distribution of CDOM in two coastal systems with different trophic status as well as at the main biogeochemical processes affecting their variability (Chapter 4 and 5).

Introduction
24
Iberian upwelling system: Ría de Vigo
Iberian Peninsula NW is the northern limit of the Norwest African upwelling system. This coast is affected by intermittent wind-driven upwelling (April-October) and downwelling (November-March) periods (Álvarez-Salgado et al. 1993). Located in this coast are the “Rías Baixas”, four V-shaped embayments (Ría de Muros y Noia, Ría de Arousa, Ría de Pontevedra and Ría de Vigo, Figure 4) where the upwelled nutrients are efficiently trapped (Prego, 1993; Álvarez-Salgado et al. 1996). The Rías Baixas act as “biogeochemical reactors” where the largest amounts of organic matter are produced (Prego, 1993; Álvarez-Salgado et al. 1996). Only one third
of the annual net community production in Ría de Vigo is exported to the shelf (Prego, 1993) and the labile DOM produced in the Rías is preferentially outwelled (Álvarez-Salgado et al. 1996). The optical properties of the DOM in the Ría de Vigo during the two different events of downwelling and upwelling, are compared in Chapter 4.
Upwelling phenomena are caused by northerly winds which make raise the cold, salty and rich-nutrient Eastern North Atlantic Central Water (ENACW) over the shelf making it enter the rías and enhancing the two dimensional circulation characteristic of the Rías Baixas (Rosón et al. 1997). During the upwelling season, upwelling pulses are separated by short intervals of calm, which nutrient recycling and enhances primary production (Álvarez-Salgado et al. 1999). On other hand, the downwelling event, caused by southerly winds, is characterized by the advection of warm and nutrient-poor shelf surface waters to the Ría de Vigo giving rise to low primary production rates (Castro et al. 1997). These characteristics make this system a perfect survey area to study the biogeochemical processes affecting CDOM.
Figure 4. Rías Baixas in the NW of Spain (from Álvarez-Salgado et al., 1999).

Introduction
25
NW Mediterranean Sea (Blanes Bay)
The Mediterranean Sea is an oligotrophic basin which generally presents a weak primary production by autotrophs and chlorophyll concentrations in the open sea rarely exceed 2–3 mg m-3 (Sournia, 1973). This system is deprived in P relative to N, with N/P ratios, varying from 20:1-28:1 (i.e., Mc Gill, 1965), higher than those established by Redfield et al. in 1963. The Blanes Bay Observatory is located in the Northwest of the Mediterranean Sea, ~1 Km offshore and in front of the city Blanes (Figure 5). The prolonged period of high atmospheric pressure and associated high irradiance and calm waters in late winter is the main seasonal trigger in the NW Mediterranean Sea, setting the development of phytoplankton blooms (Duarte et al., 1999). This station is one of the sites that has been providing older and exhaustive information about plankton ecology of the Mediterranean planktonic environment, with studies dating back to the 1950’s.
However, a gap in knowledge exists concerning the DOM characteristic of this system and its seasonal changes, a topic that is analysed in more detail in Chapter 5 of this thesis. Moreover, a time series of biological and chemical variables is available to use as a reference framework to understand the seasonal variability of the optical properties of DOM as well as its interaction with microbes.
21
Figure 5. Location of Blanes Bay Microbial Observatory.
Introduction
26
Aims of the thesis
This work is aims to extend the knowledge of the unknown pool of the DOM through its optical properties. Moreover, the cycle of the colour fraction of the DOM, its sources and sinks, sometimes differing from that of the DOM, is studied by means of controlled experiments and field works. This thesis is divided in five chapters, in which the first three resolve questions concerning the sources and sink of CDOM through laboratory experiments and the last two describe field studies.
An attempt to clarify the biological sources of the fluorescent DOM is made in Chapter 1 and 2. Two kinds of microorganisms are responsible for the two major carbon biomasses in the ocean: bacteria and phytoplankton. The search for characteristic fluorescent signals of the DOM produced by each of these kinds of microorganisms will be studied in more depth throughout this chapter. Moreover, the FDOM produced by each of these types of biomass is quantified and compared.
The origin and structural composition of the fraction of DOM concentrated by ultrafiltration from very different aquatic environments is analysed through their optical properties in Chapter 3. Additionally, the major sink of coloured and fluorescent DOM, the photodegradation, will be studied on a selection of those ultra-filtered substances.
The focus of chapters four and five is on discerning the relative importance of the biogeochemical processes affecting variability of the CDOM in two different trophic systems. The eutrophic system will be analysed in chapter four while in chapter five we looked at the oligotrophic system. Moreover in chapters 4 and 5 we tried to obtain “on the field” confirmation of the results and hypotheses presented in the experiments indicated in chapters 1, 2 and 3.
References
Álvarez-Salgado, X. A., Rosón, G., Pérez, F. F. & Pazos, Y. 1993 Hydrographic variability off the Rı´as Baixas (NW Spain) during the upwelling season. J. Geophys. Res. 98, 14 447– 14 455.
Álvarez-Salgado, X. A., Rosón, G., Pérez, F. F., Figueiras, F. G., Pazos, Y. 1996 Nitrogen cycling in an estuarine upwelling system, the Rı´a de Arousa (NW Spain). I: short-time-scale evolution of hydrodynamic and biogeochemical circulation of nitrogen species. Mar. Ecol. Prog. Ser. 135,
Introduction
27
259–273.
Álvarez-Salgado, X.A., Doval, M.D., Pérez, F.F., 1999. Dissolved organic matter in shelf waters off the Ría de Vigo (NW Iberian upwelling system). J. Mar. Syst. 18, 383–394.
Armstrong, F.A.J., Boalch, G.T., 1961. The ultra-violet absorption of sea water. J. Mar. Biol. Ass. U. K. 41(03), 591-597.
Arrigo, K.R., Brown, C.W., 1996. Impact of chromophoric dissolved organic matter on UV inhibition of primary productivity in the sea. Mar. Ecol. Prog. Ser., 140: 207-216.
Azam, F., Hodson, R.E., 1977. Size Distribution and Activity of Marine Microheterotrophs. Limnol. Oceanogr. 22(3), 492-501.
Azam, F. et al., 1983. The Ecological Role of Water-Column Microbes in the Sea. Marine Ecology Progress Series, 10, 257-263.
Azam, F., Cho, B.C. 1987. Bacterial utilization of organic matter in the sea. En Ecology of Microbial Communities. Fletcher, M., T.R.G. Gray, J.G. Jones (Eds). Cambridge University Press. Cambridge. 261-281.
Battin, T.J., Kaplan, L.A. Findlay, S., Hopkinson, C.S., Marti, E., Packman, A.I., Newbold, J.D., Sabater, F., 2008. Biophysical controls on organic carbon fluxes in fluvial networks. Nat. Geosci. 1(2), 95-100.
Belzile, C., Guo, L., 2006. Optical properties of low molecular weight and colloidal organic matter: Application of the ultrafiltration permeation model to DOM absorption and fluorescence. Mar. Chem. 98(2-4), 183-196.
Benner, R., Biddanda, B., 1998. Photochemical Transformations of Surface and Deep Marine Dissolved Organic Matter: Effects on Bacterial Growth. Limnol. Oceanogr. 43(6), 1373-1378.
Benner, R., 2002. Chemical composition and reactivity. In: Hansell, D., Carlson, C. (Eds), Biogeochemistry of 730 Marine Dissolved Organic Matter. Academic Press, San Diego, pp. 59-90.
Blough, N.V., Del Vecchio, R., 2002. Chromophoric DOM in the coastal environment.In: Hansell, D., Carlson, C. (Eds.), Biogeochemistry of Marine Dissolved Organic Matter.
Introduction
28
Academic Press, New York, pp. 509–546.
Castro, C.G., Álvarez-Salgado, X.A., Figueiras, F.G., Pérez, F.F., Fraga, F., 1997. Transient hydrographic and chemical conditions affecting microplankton populations in the coastal transition zone of the Iberian upwelling system (NW Spain) in September 1986. J. Mar. Res. 55, 321-352.
Coble, P.G., Green, S.A., Blough, N.V., Gagosian, R.B., 1990. Characterization of dissolved organic matter in the Black Sea by fluorescence spectroscopy. Nature, 348(6300), 432-435.
Coble, P.G., 1996. Characterization of marine and terrestrial DOM in seawater using excitation-emission matrix spectroscopy. Marine Chemistry, 51: 325-346.
Coble, P.G., 2007. Marine Optical Biogeochemistry: The Chemistry of Ocean Color. Chem. Rev. 107, 402-418.
Cory, R. M., D. M. McKnight. 2005. Fluorescence spectroscopy reveals ubiquitous presence of oxidized and reduced quinones in dissolved organic matter. Environ. Sci. Technol. 39:8142–49.
Chen, R.F., Bada, J.L., 1992. The fluorescence of dissolved organic matter in seawater. Mar. Chem. 37(3-4), 191-221.
Chen, R.F., Zhang, Y., Vlahos, P., Rudnick, S.M., 2002. The fluorescence of dissolved organic matter in the Mid-Atlantic Bight. Deep Sea Res. Part II 49(20), 4439-4459.
Chisholm, S.W., 2000. Oceanography: Stirring times in the Southern Ocean. Nature, 407(6805), 685-687.
Dahlén, J., Bertilsson, S., Pettersson, C., 1996. Effects of UV-A irradiation on dissolved organic matter in humic surface waters. Environ. Int. 22(5), 501-506.
Determann, S., Lobbes, J.M., Reuter, R., Rullkötter, J., 1998. Ultraviolet fluorescence excitation and emission spectroscopy of marine algae and bacteria. Mar. Chem. 62(1-2), 137-156.
Duarte, C.M., Agustí, S., Kennedy, H., Vaqué, D.,1999. The Mediterranean climate as a template for Mediterranean marine ecosystems: The example of the northeast Spanish littoral. Progr. Oceanogr. 44, 245-270.
Engelhaupt, E., Bianchi, T.S., Wetzel, R.G., Tarr, M.A., 2003. Photochemical transformations and
Introduction
29
bacterial utilization of high-molecular-weight dissolved organic carbon in a southern Louisiana tidal stream (Bayou Trepagnier). Biogeochemistry 62, 39-58.
Fellman, J.B., Hood, E., Spencer, R.G.M., 2010. Fluorescence spectroscopy opens new windows into dissolved organic matter dynamics in freshwater ecosystems: A review. Limnol. Oceanogr, 55(6), 2452-2462.
Ferrari, G.M., 2000. The relationship between chromophoric dissolved organic matter and dissolved organic carbon in the European Atlantic coastal area and in the West Mediterranean Sea (Gulf of Lions). Mar. Chem. 70(4), 339-357.
Gao, H., Zepp, R.G., 1998. Factors Influencing Photoreactions of Dissolved Organic Matter in a Coastal River of the Southeastern United States. Environmental Science & Technology, 32(19), 2940-2946.
Goldberg, S.J., Carlson, C.A., Hansell, D.A., Nelson, N.B., Siegel, D.A., 2009. Temporal dynamics of dissolved combined neutral sugars and the quality of dissolved organic matter in the Northwestern Sargasso Sea. Deep Sea Res. Part I 56(5), 672-685.
Hansell, D.A., Carlson, C.A., 1998. Net community production of dissolved organic carbon. Global Biogeochem. Cy. 12(3), 443-453
Hansell, D.A., Carlson, C.A., Repeta, D.J., Reiner, S., 2009. Dissolved organic matter in the ocean. Oceanography, 22(4), 202-211.
Hedges, J.I., Hatcher, P.G., Ertel, J.R., Meyers-Schulte, K.J., 1992. A comparison of dissolved humic substances from seawater with Amazon River counterparts by 13C-NMR spectrometry. Geochim. Cosmochim.Ac. 56, 1753-1757.
Hedges, J.I., 2002. Why dissolved organic matter. In: Hansell, D., Carlson, C. (Eds.), 2002. Biogeochemistry of Marine Dissolved Organic Matter. Academic Press, San Diego, pp. 1-33.
Herndl, G.J., Muller-Niklas, G., Frick, J., 1993. Major role of ultraviolet-B in controlling bacterioplankton growth in the surface layer of the ocean. Nature, 361, 717-719.
Hernes, P.J., Bergamaschi, B.A., Eckard, R.S., Spencer, R.G.M., 2009. Fluorescence-based proxies for lignin in freshwater dissolved organic matter. J. Geophys. Res. 114, G00F03, doi:10.1029/2009JG000938.

Introduction
30
Hopkinson, C.S., Vallino, J.J., 2005. Efficient export of carbon to the deep ocean through dissolved organic matter. Nature, 433(7022), 142-145.
Huguet, A. et al., 2010. New insights into the size distribution of fluorescent dissolved organic matter in estuarine waters. Org. Geochem. 41(6), 595-610.
Jerlov, N.G., 1976. Marine Optics. Elsevier, New York. 231.
Jiao, N. et al., 2010. Microbial production of recalcitrant dissolved organic matter: long-term carbon storage in the global ocean. Nat Rev Micro, 8(8), 593-599.
Kalle, K., 1937. Ann. Hydrogr., Berlin 65, 276.
Kalle, K., 1966. The problem of the gelbstoff in the sea. Oceanogr. Mar. Biol. Ann. Rev., 4: 91-104.
Kieber, R.J., Hydro, L.H., Seaton, P.J., 1997. Photooxidation of Triglycerides and Fatty Acids in Seawater: Implication Toward the Formation of Marine Humic Substances. Limnol. Oceanogr. 42(6), 1454-1462.
Kieber, R.J., Whitehead, R.F., Reid, S.N., Willey, J.D., Seaton, P.J., 2006. Chromophoric dissolved organic matter (CDOM) in rainwater, southeastern North Carolina, USA. J. Atmos. Chem. 54(1), 21-41.
Kirk, J.T.O., 1994. Light and Photosynthesis in Aquatic Ecosystems, 2nd ed. Cambridge University Press, New York. 509.
Kramer, G.D., Herndl, G.J., 2004. Photo- and bioreactivity of chromophoric dissolved organic matter produced by marine bacterioplankton. Aquat. Microb. Ecol. 36, 239-246.
Mc Gill, D.A., 1965. The relative supplies of phosphate, nitrate and silicate in theMediterranean Sea. Comm. Int. Expl. Sci. Mer Médit., Rapp. et P.V. Réunions. 18, 737–744.
Midorikawa, T., Tanoue, E., 1998. Molecular masses and chromophoric properties of dissolved organic ligands for copper(II) in oceanic water. Mar.e Chemi. 62(3-4), 219-239.
Mopper, K., Kieber, D.J., 2002. Photochemistry and the cycling of carbon, sulfur,nitrogen and phosphorus. In: Hansell, D.A., Carlson, C.A. (Eds.), Biogeochemistry of Marine

Introduction
31
Dissolved Organic Matter. Academic Press, New York, pp. 455–507.
Moran, M.A., Zepp, R.G., 1997. Role of photoreactions in the formation of biologically labile compounds from dissolved organic matter. Limnol. Oceanogr. 42(6), 1307-1316.
Moran, M.A., Sheldon, W.M., Zepp, R.G., 2000. Carbon Loss and Optical Property Changes during Long-Term Photochemical and Biological Degradation of Estuarine Dissolved Organic Matter. Limnol. Oceanogr. 45(6), 1254-1264.
Nelson, N.B., Siegel, D.A. and Michaels, A.F., 1998. Seasonal dynamics of colored dissolved material in the Sargasso Sea. Deep Sea Research Part I: Oceanographic Research Papers, 45(6): 931-957.
Nelson, N.B., Siegel, D.A., Carlson, C.A., Swan, C.M., 2010. Tracing global biogeochemical cycles and meridional overturning circulation using chromophoric dissolved organic matter. Geophys. Res. Let. 37, L03610.
Nieto-Cid, M., Álvarez-Salgado, X.A., Gago, J., Pérez, F.F., 2005. DOM fluorescence, a tracer for biogeochemical processes in a coastal upwelling system (NW Iberian Peninsula). Mar. Ecol. Prog. Ser. 297 33-50.
Obernosterer, I., Sempéré, R., Herndl, G.J., 2001a. Ultraviolet radiation induces reversal of the bioavailability of DOM to marine bacterioplankton Aquat. Microb. Ecol. 24, 61-68.
Obernosterer, I., Ruardij, P., Herndl, G.J., 2001b. Spatial and diurnal dynamics of dissolved organic matter (DOM) fluorescence and H2O2 and the photochemical oxygen demand of surface water DOM across the subtropical Atlantic Ocean. Limnol. Oceanogr. 46, 632–643
Opsahl, S., Benner, R., 1997. Distribution and cycling of terrigenous dissolved organic matter in the ocean. Nature, 386(6624), 480-482.
Ortega-Retuerta, E. et al., 2009. Biogeneration of chromophoric dissolved organic matter by bacteria and krill in the Southern Ocean. Limnol. Oceanogr. 54(6), 1941–1950.
Peltier, W.R., Liu, Y., Crowley, J.W., 2007. Snowball Earth prevention by dissolved organic carbon remineralization. Nature 450: 813-819.
Pomeroy, L.R., 1974. The Ocean’s Food Web, A Changing Paradigm. Bioscience 24, 499-504.
Introduction
32
Prego, R., 1993. General aspects of carbon biogeochemistry in the ria of Vigo (NW Spain). Geochim. Cosmochim. Ac. 57, 2041-2052.
Raven, J.A., Falkowski, P.G., 1999. Oceanic sinks for atmospheric CO2. Plant Cell Environ. 22(6), 741-755.
Redfield, A.C., Ketchum, B.H., Richards, F.A., 1963. The influence of organisms on the composition of seawater. In: Hill, M.N. (Ed.), The sea. Vol. 2, Interscience, New York, pp. 26–77.
Rosón, G., Álvarez-Salgado, X.A., Pérez, F.F., 1997. A non-stationary box model to determine residual fluxes in a partially mixed estuary, based on both thermohaline properties. Application to the Ría de Arousa (NW Spain). Estuar. Coast. Shelf. Sci. 44, 249–262.
Sánchez-Marín, P., Santos-Echeandía, J., Nieto-Cid, M., Álvarez-Salgado, X.A., Beirasa, R., 2010. Effect of dissolved organic matter (DOM) of contrasting origins on Cu and Pb speciation and toxicity to Paracentrotus lividus larvae. Aquat. Toxicol. 96, 90-102.
Sournia, A., 1973. La production primaire planctonique en Mediterranee: Essai de mise a jour. Bull. Et. Comm. Medit. Special Issue 5, 1–128.
Stedmon, C.A., Markager, S., Bro, R., 2003. Tracing dissolved organic matter in aquatic environments using a new approach to fluorescence spectroscopy. Mar. Chem. 82(3-4), 239-254.
Stedmon, C.A. et al., 2007. Photochemical production of ammonium and transformation of dissolved organic matter in the Baltic Sea. Mar. Chem. 104(3-4), 227-240.
Stedmon, C.A., Bro, R., 2008. Characterizing dissolved organic matter fluorescence with parallel factor analysis: a tutorial Limnol. Oceanogr.: Methods, 6, 572–579.
Stedmon, C.A., Osburn, C.L., Kragh, T., 2010. Tracing water mass mixing in the Baltic–North Sea transition zone using the optical properties of coloured dissolved organic matter. Estuar. Coast. Shelf. Sci. 87, 156-162.
Stedmon, C.A., Álvarez-Salgado, X.A., 2011. Shedding light on a black box: UV-visible spectroscopic characterization of marine dissolved organic matter. Submitted.
Steinberg, D.K., Nelson, N.B., Carlson, C.A., Prusak, A.C., 2004. Production of chromophoric dissolved organic matter (CDOM) in the open ocean by zooplankton and the colonial cyanobacterium
Introduction
33
Trichodesmium spp. Mar. Ecol. Prog. Ser. 267, 45-56.
Takahashi, T. et al., 2009. Climatological mean and decadal change in surface ocean pCO2, and net sea-air CO2 flux over the global oceans. Deep Sea Rese. Part II 56(8-10), 554-577.
Vähätalo, A.V., Zepp, R.G., 2005. Photochemical Mineralization of Dissolved Organic Nitrogen to Ammonium in the Baltic Sea. Environ. Sci. Technol. 39(18), 6985-6992.
Verdugo, P. et al., 2004. The oceanic gel phase: a bridge in the DOM-POM continuum. Mar. Chem. 92(1-4), 67-85.
Vodacek, A., Blough, N.V., 1997. Seasonal variation of CDOM in the Middle Atlantic Bight: Terrestrial inputs and photooxidation. Proceedings of SPIE-The International Society for Optical Engineering, 2963(Ocean Optics XIII): 132-137.
Volk, T., Hoffert, M.l., 1985. Ocean carbon pumps: analysis of relative strengths and efficiencies in ocean-driven atmospheric CO2 changes. In: Sunquist, E.T., Broeke, W.S. (Eds.), The Carbon Cycle and Atmospheric CO2: Natural variations archean to present. American Geophysical Union, Washington, D.C., pp. 99-110.
Weishaar, J.L. et al., 2003. Evaluation of Specific Ultraviolet Absorbance as an Indicator of the Chemical Composition and Reactivity of Dissolved Organic Carbon. Environ. Sci. Technol. 37 (20), 4702-4708.
Williams, P.J. leB. 2000. Heterotrophic bacteria and the dynamics of dissolved organic material. In: Kirchman, D.L. (Ed.), Microbial Ecology of the Oceans. Wiley-Liss, New York, NY, pp. 153–200.
Weber, G., 1961.Enumeration of components in complex systems by fluorescence spectrophotometry.
Nature 90(4770), 27-29.
Wu, F.C., Tanoue, E., Liu, C.Q., 2003. Fluorescence and amino acid characteristics of molecular size fractions of DOM in the waters of Lake Biwa Biogeochemistry, 65(2), 245-257.
Yamashita, Y., Tanoue, E., 2004. Chemical characteristics of amino acid-containing dissolved organic matter in seawater. Org. Geochem. 35(6), 679-692.
Yamashita, Y., Tanoue, E., 2008. Production of bio-refractory fluorescent dissolved organic matter in the ocean interior. Nat. Geosci. 1, 579-582.
Yamashita, Y. et al., 2010. Fluorescence characteristics of dissolved organic matter in the deep waters of the Okhotsk Sea and the northwestern North Pacific Ocean. Deep Sea Res. Part II 57(16),

1478-1485.
Yentsch, C.S., Reichert, C.A., 1961. The Interrelationship between Water-Soluble Yellow Substances and Chloroplastic Pigments in Marine Algae. Bot. Mar. 3, 65-74.

Chapter I
Production of chromophoric dissolved organic matter by marine phytoplankton

Chapter I
36
Co-authors:
Hugo Sarmento, Xosé Antón Álvarez-Salgado, Josep M. Gasol and Celia Marrasé.

Phytoplankton production of CDOM
37
Abstract
Incubation experiments with axenic cultures of four common phytoplankton species of the genera Chaetoceros, Skeletonema, Prorocentrum, and Micromonas were performed to test for the production of fluorescent dissolved organic matter (FDOM) by marine phytoplankton. Our results prove that the four species exuded both fluorescent protein- and marine humic-like materials in variable amounts, with more production by the diatoms Chaetoceros sp. and S. costatum and less by P. minimum. Whereas the exudation of protein-like substances by healthy phytoplankton cells has been recognised, the in situ production of marine-humic like substances is still a matter of debate. Using axenic cultures, we demonstrate unequivocally that phytoplankton can directly contribute to the autochthonous production of coloured humic-like substances in the ocean. Extrapolation of these findings to the field suggests that about 20% of the marine humic-like substances produced in the highly productive coastal upwelling system of the Ría de Vigo could originate from growing phytoplankton. Therefore, the exudation of FDOM by marine phytoplankton should be considered in future studies of the dynamics of coloured DOM in marine systems.

Chapter I
38

Phytoplankton production of CDOM
39
Introduction
Marine dissolved organic matter (DOM) represents the largest pool of reduced carbon in the Earth. Phytoplankton is one of the major sources of DOM, which is released to the water column by exudation, excretion, and cell lysis due to viral attack, grazing, and sloppy feeding (Myklestad 2000), and constitutes substrate that supports heterotrophic bacterial growth (Azam et al. 1983). The chemical composition, origin, and fate of the different components of the DOM pool in aquatic systems are still poorly known (Hansell 2002).
Recent methodological advances have enabled identification of different fractions of DOM based on their optical properties in a way that is methodologically fast and simple, and that might provide indications about the origin and degradability of the DOM pool (Coble 1996). A fraction of the DOM pool absorbs light at both ultraviolet (UV) and visible wavelengths and it is called coloured dissolved organic matter (CDOM; Coble 2007). A sub-fraction of CDOM can emit blue fluorescence when it is irradiated with UV light and it is called fluorescent CDOM (FDOM; Coble 1996, 2007). It is possible to distinguish between main groups of FDOM substances, depending on their excitation and emission (Ex/Em) wavelengths. One group fluoresces at wavelength pairs characteristic of the aromatic amino acids (Ex/Em 280 nm/350 nm) that corresponds to the peak-T reported by Coble (1996). This group, known as protein-like substances, has been considered as a proxy for labile DOM (Yamashita and Tanoue 2003; Nieto-Cid et al. 2006). The other group, which emits radiation in the wavelength range of 380-420 nm when excited at 320 nm (peak-M as reported by Coble 1996), is called marine humic-like substances and it is considered to be photo-labile and bio-refractory (Chen and Bada 1992; Nieto-Cid et al. 2006). Changes in FDOM are a good indication of biological (Chen and Bada 1992; Nieto-Cid et al. 2006) and photochemical processes (Moran et al. 2000; Nieto-Cid et al. 2006) acting upon the bulk DOM pool.
The role of CDOM is key for ocean biogeochemical cycles since it can control light penetration in the water column. A high concentration of CDOM can reduce harmful UV effects on phytoplankton, acting as a photo-protector but it can also attenuate photosynthetic usable radiation, reducing primary production in regions where light is limiting (Arrigo and Brown 1996). On the contrary, at low concentrations of CDOM, sunlight can damage not only phytoplankton cells but bacterioplankton physiology and deoxyribonucleic acid (DNA) as well (Herndl et al. 1993). Another important role of CDOM is the capacity for metal scavenging and the formation of complexes that can be beneficial to phytoplankton when metals present in the medium reach toxic concentrations (Midorikawa and Tanoue 1998).
Sources of CDOM include continental runoff that transports DOM primarily from soils (Coble
Chapter I
40
2007); abiotic condensation and transformation of biopolymers, e.g., photo-oxidized polyunsaturated lipids released into the water column by plankton (Kieber et al. 1997); and in situ biological production (Yentsch and Reichert 1961; Kramer and Herndl 2004). Within these autochthonous sources, CDOM can be produced as a by-product of DOM metabolism, mainly by bacteria. But its production by copepods, krill, and other planktonic organisms has also been demonstrated in recent studies (Steinberg et al. 2004; Ortega-Retuerta et al. 2009).
The release of DOM by phytoplankton has been recognised as a major process in global biogeochemical cycles (Myklestad 2000). The nature of the dissolved organic carbon (DOC) derived from phytoplankton is highly complex but major fractions include carbohydrates, followed by N-compounds namely protein, polypeptides, and amino acids (Goldman et al. 1992; Myklestad 2000). However, the direct contribution of FDOM to the DOC released by phytoplankton is in controversy. On the one hand, a few field studies (Carder et al. 1989; Twardowski and Donaghay 2001) and some culture experiments (Seritti et al. 1994) suggest that phytoplankton is a possible source of CDOM. But, other authors have reported the opposite, as they did not find a significant correlation between CDOM and phytoplankton biomass either in natural systems (Nelson et al. 1998) or in cultures (Rochelle-Newall and Fisher 2002).
To better understand the sources and sinks of different types of organic matter in the ocean we must determine unequivocally whether phytoplankton produces CDOM. In this study, we have quantified the build-up of FDOM and DOC in axenic cultures of four common marine phytoplankton species (two diatoms, Chaetoceros sp. and Skeletonema costatum; a dinoflagelate, Prorocentrum minimum; and a prasinophyte, Micromonas pusilla) in order to determine whether phytoplankton is a direct source of CDOM, particularly of fluorescent humic-like substances.
Material and methods
Phytoplankton cultures
Four axenic species obtained from the Provasoli-Guillard National Center for Culture of Marine Phytoplankton (CCMP) (https://ccmp.bigelow.org/) were cultured in axenic conditions. The strains used were the diatoms Chaetoceros sp. (CCMP199) and Skeletonema costatum (CCMP2092) (Greville) Cleve, the dinoflagellate Prorocentrum minimum (CCMP1329) (Pavillard) J. Schiller, and the prasinophyte Micromonas pusilla (CCMP1545) (R.W. Butcher) I. Manton and M. Parke.
An inoculum of each species was added to 2 L of F/2 culture medium made with filtered and

Phytoplankton production of CDOM
41
autoclaved coastal Mediterranean seawater. After gentle shaking, each mixture was distributed into three polystyrene bottles. Each bottle was filled with 600 mL and incubated at 20°C under artificial photosynthetic active radiation (PAR) radiation of 100 μmol photon m-2 s-1, in a 16:8 hour light: dark cycle, until cell density increased about one order of magnitude.
Aliquots for phytoplankton counts, DOC concentration and DOM fluorescence were taken at the beginning and end of the incubation period: 3 days for all microalgae except for P. minimum, which was incubated for 7 days. Controls of the F/2 medium were also taken before adding the inoculum. Since the F/2 medium was the same for the four cultures, the differences between the initial values of the variables studied reflected the variable composition of the aliquots of the four cultures added to the F/2 medium.
Algal cultures were initially axenic, as guaranteed by the Provasoli-Guillard National Center for Culture of Marine Phytoplankton. To determine phytoplankton cell abundance and to check that the algal cultures were kept in axenic conditions, aliquots of 1 mL of each culture were fixed with 1% paraformaldehyde + 0.05% glutaraldehyde (final concentration), stained with DAPI (4,6 diamidino-2-phenylindole; 10 µg mL-1, final concentration) and counted with an Olympus BX61 epifluorescence microscope under blue and UV wavelength excitation at the beginning and at the end of the experiment.
At the beginning and at the end of the incubation, DOC and FDOM samples were filtered onto 0.2 μm Sterivex filters. Milli-Q water was filtered through this filtration system and no significant changes were observed in DOC and FDOM analysis, proving that contamination did not occur during filtration. A control bottle containing only F/2 medium was incubated in the same conditions and no significant differences were observed at the end of the experiment (details not shown).
Phytoplankton biomass B, in pg C cell–1, was estimated with the following conversion factors: B = 0.216·V 0.939 for P.minimum and M. pusilla, and B = 0.288·V 0.811 for diatoms (Menden-Deuer and Lessard 2000), where V is the cell volume in µm3 and was calculated for the different species following the geometric models given by Sun and Liu (2003).
Determination of FDOM
To quantify the production of FDOM, samples were measured immediately after collection following Nieto-Cid et al. (2006). Single measurements and emission excitation matrices (EEMs) of the aliquots were performed with a LS 55 Perkin Elmer Luminescence spectrometer, equipped with a xenon discharge lamp, equivalent to 20 kW for 8 μs duration. The detector was a red-sensitive R928

Chapter I
42
photomultiplier, and a photodiode worked as reference detector. Slit widths were 10.0 nm for the excitation and emission wavelengths; scan speed was 250 nm min–1. Measurements were performed at a constant room temperature of 20°C in a 1 cm quartz fluorescence cell. The Ex/Em wavelengths used for single measurements were those established by Coble (1996): Ex/Em 280 nm/350 nm (peak T or F(280/350)) as indicator of protein-like substances and Ex/Em 320 nm/410 nm (peak M or F(320/410)) as indicator of marine humic-like substances. Following Coble (1996), fluorescence measurements were expressed in quinine sulphate units (QSU), i.e., in μg eq QS L-1, by calibrating the LS 55 Perkin Elmer at Ex/Em 350 nm/450 nm against a quinine sulphate dihydrate (QS) standard made up in 0.05 mol L-1 sulphuric acid.
EEMs were performed to track possible changes in the position of the protein- and humic-like fluorescence peaks. These matrices were generated by combining 21 synchronous Ex/Em fluorescence spectra of the sample, obtained for excitation wavelengths from 250 to 400 nm and an offset between the excitation and emission wavelengths of 50 nm for the 1st scan and 250 nm for the 21st scan. Rayleigh scatter does not need to be corrected when the EEMs are generated from synchronous spectra and Raman scatter was corrected by subtracting the pure water (Milli-Q) EEM from the sample EEM.
Determination of dissolved organic carbon
Approximately 10 mL of water were collected in pre-combusted (450ºC, 12 h) glass ampoules for DOC analysis. H3PO4 was added to acidify the sample to pH < 2 and the ampoules were heat-sealed and stored in the dark at 4ºC until analysis. DOC was measured with a Shimadzu TOC-V organic carbon analyser. The system was standardized daily with a potassium hydrogen phthalate standard. Each ampoule was injected 3–5 times and the 3 replicates that yielded a standard deviation <1% were chosen to calculate the average DOC concentration of each sample. The performance of the analyser was tested with the DOM reference materials provided by Prof. D. Hansell (University of Miami). We obtained a concentration of 45.2 ± 0.3 μmol C L-1 for the deep ocean reference (Sargasso Sea deep water, 2600 m) minus blank reference materials, the day when the samples were analyzed. The nominal DOC value provided by the reference laboratory is 45 μmol C L-1.
Phytoplankton cell densities, growth rates, and net percentage of extracellular release
Average of cell abundance ( C ), biomass ( B ), and growth rate (μC) for the four cultures were calculated considering that the species were in exponential growth. Since the cultures were kept in axenic conditions throughout the growing period, it can be assumed that organic carbon dynamics depended only on phytoplankton activity. A proxy for the percentage of net photosynthetic extracellular release (PER) was calculated as APER = ΔDOC/(ΔDOC + ΔB) x 100, where APER is Apparent PER,

Phytoplankton production of CDOM
43
and ΔDOC and ΔB are the net increase of DOC and phytoplankton biomass (both in µg C L-1) through
the incubation time, respectively.
Statistical tools
Paired Student-t-test was used to check for significant differences in the measured variables between the initial and final incubation times (Sokal and Rohlf 1984). Regression model II was applied to calculate linear fitting parameters.
Results
Phytoplankton cell densities and growth rates
Average cell abundance in the different cultures varied between 12 x 103 cells mL-1 for P. minimum and 33 x 105 cells mL-1 for M. pusilla and biomass ranged from 990 µg C L-1 for Chaetoceros sp. to 2272 µg C L-1 for S. costatum. Chaetoceros sp. showed the highest exponential growth rates at 0.89 d-1 and P. minimum the lowest one at 0.45 d-1 (Table 1). These numbers are within the ranges reported in the literature (Rose and Caron 2007).
Production of dissolved organic carbon
DOC increased significantly (p < 0.01) in all cultures. P. minimum, incubated for 7 days, showed the largest bulk DOC rise: 0.85 mg C L-1. Total DOC production in the other three cultures, incubated for 3 days, varied from 0.35 to 0.64 mg C L-1 (Fig. 1a). Apparent PER (APER) values ranged between 10% and 18% (Table 1) and biomass-specific DOC production rates from 86 x 10-3 to 116 x 10-3 µg C µg C -1 d-1 (Table 2). When we normalised to cell density instead of biomass, P. minimum presented the highest DOC production rates and M. pusilla the lowest. Both diatoms Chaetoceros sp. and S. costatum presented similar values of cell-specific DOC production rates (71.1 x 10⁻⁸ and 70.1 x 10⁻⁸ µg C cell-1 d-1, respectively), two orders of magnitude lower than P. minimum (10.2 x 10⁻⁶ µg C cell-1 d-1). Turnover rates of DOC, calculated assuming that they were proportional to cell growth rate and cells were in exponential growth, ranged from 0.04 to 0.07 d-1 (Table 3).

Chapter I
44
Production of FDOM
Fluorescence EEMs of the coloured dissolved organic matter (CDOM) produced by each culture during the incubation time are shown in Fig. 2. These EEMs were obtained by subtracting the fluorescence intensities at the beginning of the culture from the end values. In all cultures, EEMs presented marked fluorescence peaks in the protein- and humic-like areas. In the protein-like area, the most intense peak presented a maximum at Ex/Em 275 nm/358 nm for Chaetoceros sp., P. minimum, and S. costatum cultures, that was slightly displaced towards longer emission wavelengths compared to that established by Coble (1996) at Ex/Em 275 nm/340 nm (peak T). The S. costatum culture presented the highest fluorescence at peak T whereas M. pusilla showed the lowest value and it was centred at an emission wavelength of 345 nm. In the humic-like area all cultures showed a conspicuous peak within the range of the marine humic-like substances defined by Coble (1996) at Ex/Em 312 nm/380-420 nm (peak M). The position of the fluorescence maxima in this area differed for each culture with excitation maxima slightly, but not significantly, displaced to shorter wavelength relative to peak M (Coble 1996). Chaetoceros sp. and P. minimum showed their maxima at Ex/Em 310 nm/399 nm and 316 nm/397 nm with an intensity of 1.36 QSU and 1.19 QSU, respectively. S. costatum and M. pusilla presented this maximum at Ex/Em 306 nm/396 nm and their fluorescence intensities were the most pronounced with 3.89 QSU and 2.03 QSU, respectively.
The EEM of M. pusilla also showed three peaks of lower fluorescence intensity at Ex/Em 348 nm/436 nm, 354 nm/447 nm, and 271 nm/432 nm. Finally, both diatoms showed a third peak that M. pusilla and P. minimum did not produce: Chaetoceros sp. at Ex/Em 280 nm/381 nm (1.56 QSU) and S. costatum at Ex/Em 289 nm/391 nm (3.73 QSU).
Algal culturetime (d)
C(cells mL-1)
B(μg C L-1)
Cµ(d-1)
APER(%)
Chaetoceros sp. 3 162 ± 5.2 x 10³ 990 ± 32 0.89 ± 0.02 11.7 ± 0.5S. costatum 3 303 ± 21 x 103 2272 ± 158 0.87 ± 0.03 10 ± 2.0
P. minimum 7 12.0 ± 0.5 x 10³ 1254 ± 136 0.45 ± 0.02 18 ± 1.0M. pusilla 3 3342 ± 29 x 103 1975 ± 13 0.59 ± 0.05 12.8 ± 0.8
Table 1. Average cell abundances ( C ), biomass ( B ), and growth rates ( Cµ ), calculated considering exponential algal growth. Apparent percentage of net photosynthetic extracellular release (APER) in each algal culture.

Phytoplankton production of CDOM
45
A significant (p < 0.01) net increase of FDOM (peak-M and peak-T) was observed in all cultures during the experiment (Fig. 1b, c). S. costatum exhibited the most pronounced increase: 3.05 ± 0.08 QSU for the humic-like substances. In the case of the protein-like substances, S. costatum also presented the highest increase (3.98 ± 0.06 QSU) whereas M. pusilla presented the lowest increase, 1.56 ± 0.01 QSU. The biomass-specific FDOM production rates were the highest for Chaetoceros sp. (Table 2) in both protein- and humic-like peaks. P. minimum presented the lowest increase of humic-like substances, and M. pusilla the lowest rates of protein-like substances production. For the case of the cell-specific FDOM production rates (data not shown), P. minimum presented the highest and M. pusilla the lowest values in both fluorescent peaks. Diatoms showed similar cell-specific production rates of protein- and humic-like substances. The dimensionless Δpeak-T:Δpeak-M production ratio was calculated: it was maximum for P. minimum (2.49 ± 0.03) and minimum for M. pusilla (0.89 ± 0.03), whereas the diatoms presented intermediate values of 1.91 ± 0.05 for Chaetoceros sp. and 1.31 ± 0.03 for S. costatum.
Turnover rates of peak-T and peak-M were also calculated for all species (Table 3).
DO
C (m
g C
L-1
)1.8
2.1
2.4
2.7
3.0
3.3
3.6
F(32
0/41
0) (Q
SU)
0
1
2
3
4
5
6
.
S. c
osta
tum
P. m
inim
um
M. p
usill
a
F(28
0/35
0) (Q
SU)
0
1
2
3
4
5
6
7
a)
b)
c)
totf
Cha
etoc
eros
spFig. 1. Initial and final concentrations of: (a) DOC (mg C L-1); (b) peak-M (F(320/410)) in QSU; (c) peak-T (F(280/350)) in QSU. Dark bars correspond to initial concentration (to) and grey bars to final concentration (tf).

Chapter I
46
S. costatum presented the highest values for both the protein- and humic-like fluorescence whereas P. minimum presented the lowest turnover rates.
Phytoplankton biomass was significantly correlated with the fluorescence of peak-M (R2 = 0.78; p < 0.0001; Fig. 3a) when data for all species were included. Peak-T and DOC were significantly correlated with phytoplankton biomass (Fig. 3b, c), but with lower R2 (0.36 and 0.44 for peak-T and DOC, respectively).
Discussion
Since all cultures were kept axenic during the course of the experiment, carbon dynamics were based exclusively on phytoplankton activity. We calculated a proxy to PER, apparent PER (APER), substituting ∆POC (particulate organic carbon) by ∆Biomass, assuming that the production of transparent exopolymer particles (TEP) and DOC uptake did not occur during the course of the experiment. It is likely that these processes were negligible during the exponential phase of the cultures, but we have no direct evidence to prove it. The observed build-up of DOC concurs with many studies showing significant DOC excretion by phytoplankton (Bjørnsen 1988). Net APER values obtained in this work were in the range of PER values found by other authors using the 14C incorporation method. Mague et al. (1980) obtained a PER of 8% during the exponential growth phase of S. costatum, which is very close to the APER of 10% found in our study for the same species. According to Lancelot and Billen (1985), PER values are higher for microflagellates, with an inverse relationship to nutrient concentration. In our experiments, with excess nutrients, we obtained APER values of 13% for Micromonas, which is at the lower end of the PER range (10% to 60%) found by Lancelot and Billen (1985). Field-work carried out in the North Sea by Lancelot (1983) showed that, within the same range of inorganic nitrogen concentrations, flagellates presented higher PER values than diatoms. The same author obtained low PER values (<10%) when diatom species dominated the bloom, irrespective of nutrient conditions. We also found this trend in our experimental work: the cultures of M. pusilla and P. minimum presented higher APER values (13% and 18%, respectively) than the diatoms (< 12%).
In all cultures, humic- and protein-like substances increased during the course of the incubations. Because bacteria were absent, it implies that the increases in DOC and FDOM were exclusively due to phytoplankton metabolism. The amount and quality of FDOM produced was different depending on the species. Factors such as nutrients, light and growth phase can affect PER (Obernosterer and Herndl 1995); so, it is likely that FDOM, as a fraction of the released DOM, is affected by the same factors. Here, the four species were incubated under identical experimental conditions and, therefore,

Phytoplankton production of CDOM
47
Fig. 2. Excitation-emission matrices (EEMs) of the FDOM produced in the cultures, in quinine sulphate units (QSU). Note that these values are neither normalized to incubation time nor to biomass. All the species were incubated for 3 days except P. minimum incubated for 7 days.
250 300 350 400
Excitation (nm)
300
350
400
450
500
Emis
sion
(nm
)
Chaetoceros
250 300 350 400
Excitation (nm)
250 300 350 400
Excitation (nm)
300
350
400
450
500
Emission (nm
)
250 300 350 400
Excitation (nm)
300
350
400
450
500
Emis
sion
(nm
)
S. costatum
P. minimum M. pusilla
sp.
320 330 340 350 360
Excitation (nm)
420
430
440
450
460 Emission
(nm)
X
X
X
XX
X
X
X
X
X
X

Chapter I
48
it can be assumed that the differences found on the excreted organic substances between cultures were attributable to specific differences in metabolic activity. The Δpeak-T:Δpeak-M ratio was significantly different among species, indicating that the selected dinoflagellates exuded relatively more protein-like than humic-like substances as compared with the diatoms, and the latter produced relatively more than the prasinophyte. A low value of this ratio would indicate a relative dominance of the exudation of the products of early degradation (respiration) over the synthesis products by healthy marine phytoplankton, since it has been reported that humic-like substances are a by-product of the microbial respiration (Nieto-Cid et al. 2006).
The variations in the position of the peak-T and peak-M fluorescence maxima in the EEMs indicate that different substances are being produced by each culture, i.e., that the quality of the organic matter produced by phytoplankton was different depending on the species. It is difficult to know the cause of those variations in the fluorescence maxima without concurrent molecular analysis. For example, tryptophan is highly sensitive to the polarity of its surrounding environment. Frequently, spectral shifts are observed as a result of binding ligands, protein-protein associations, and denaturation, among others (Lakowicz 1983).
Both diatoms showed a peak at Ex/Em 280 nm/381 nm for Chaetoceros sp. and slightly displaced at longer wavelengths, 289 nm/391 nm, for S. costatum. A similar peak (Ex/Em 280 nm/370 nm) was found by Coble et al. (1998) in samples collected in the upper 100 m of a coastal upwelling system, where chlorophyll was high. That peak (called peak-N) had not been previously reported and the authors concluded that it could not be a humic-like peak but appeared to be associated with production of new CDOM in that marine environment. Our results support their conclusion as well as show that peak-N is produced by marine phytoplankton. The absence of this peak in the cultures of the other two species (P. minimum and M. pusilla), could indicate that the compounds associated to this peak are only produced by diatoms, or that the peak was masked by other fluorescence peaks in the other cultures. It would
SpeciesΔDOC/ ( B · t)
(µg C µg C-1 d-1)Δpeak-T/ ( B · t)
(µg eq QS µg C-1 d-1)Δpeak-M/ ( B · t)
(µg eq QS µg C-1 d-1)
Chaetoceros sp. 116 ± 11 x 10-3 9.1 ± 0.8 x 10⁻⁴ 4.8 ± 0.1 x 10⁻⁴
S. costatum 93 ± 13 x 10-3 5.8 ± 0.1 x 10⁻⁴ 4.5 ± 0.1 x 10⁻⁴
P. minimum 97 ± 9 x 10⁻³ 3.2 ± 0.2 x 10⁻⁴ 1.3 ± 0.03 x 10⁻⁴
M. pusilla 86 ± 5 x 10⁻³ 2.6 ± 0.02 x 10⁻⁴ 3.0 ± 0.1 x 10⁻⁴
Table 2. Net increase of the concentration of DOC and the fluorescence of peak-T and peak-M normalized to average biomass ( B ) and incubation time (t).

Phytoplankton production of CDOM
49
be worthwhile to explore in future experiments the possible specificity of FDOM compounds produced by different groups of phytoplankton.
The EEM of M. pusilla was compared with the EEM of a natural seawater sample, taken at the Blanes Bay Microbial Observatory (http://www.icm.csic.es/bio/projects/icmicrobis/bbmo/) in the NW Mediterranean Sea, during a Micromonas bloom (R. Massana personal communication), in February 2007 (details not shown). A peak at Ex/Em 283 nm/358 nm, which could correspond to the peak-T by Coble (1996), was found in the natural sample. This peak is slightly displaced to longer wavelengths than the peak T of the M. pusilla culture (Ex/Em 275 nm/345 nm). The EEM of the natural sample also showed a maximum at Ex/Em 348 nm/434 nm that coincided with the peak at Ex/Em 348 nm/436 nm detected in the axenic culture. These maxima coincide with the peak-C defined by Coble et al. (1998). Certainly, it should not be expected that the EEM of a natural sample, even if taken during an almost monospecific Micromonas bloom, would match completely the peaks found in a Micromonas axenic culture. The EEM of the Micromonas culture shown in Fig. 2 reflects the production of fluorescent materials only by this species. On the other hand, the fluorescence fingerprint of the natural sample results from the production and/or accumulation of FDOM due to the activity of plankton assemblages, the
Fig. 3. (a) Plot of peak-M fluorescence (F(320/410)) in QSU vs. phytoplankton biomass (mg C L-1), (b) Plot of peak-T fluorescence (F(280/350)) in QSU vs. biomass (mg C L-1), and (c) DOC (mg C L-1) vs. biomass (mg C L-1).
0 2 4 6 8
peak
-T (Q
SU)
0
1
2
3
4
5
6
0 2 4 6 8
peak
-M (Q
SU)
0
1
2
3
4
5
6
Y = 1.3(±0.3) + 0.5(±0.1)·XR² = 0.78; p < 0.0001
Y = 1.0(±0.7) + 0.7(±0.3)·XR² = 0.36; p < 0.014
Phytoplankton biomass (mg C L-1)
0 2 4 6 8
DO
C (m
g C
L-1 )
1.8
2.1
2.4
2.7
3.0
3.3
3.6
Y = 2.2(±0.2) + 0.2(±0.1)·XR² = 0.44; p < 0.013
a
b
c
Chapter I
50
transformations by photo-chemical and biological reactions, and/or the inputs of terrestrial FDOM.
With these considerations in mind, the correspondence between the EEM of a natural Micromonas bloom and that from a Micromonas axenic culture is indeed remarkable.
Several studies have confirmed that carbohydrates constitute the major fraction of compounds released by phytoplankton. The next largest fraction is composed of N-compounds with the most prominent members being amino acids, peptides, and proteins (Myklestad 2000). Studies about dissolved free amino acids (DFAA) excreted by phytoplankton (Martin-Jézéquel et al. 1988) have found that the most prominent excreted free amino acids are Ser, Gly, Lys, Ala, Glu, Asp, Orn, and His (Myklestad 2000). Yamashita and Tanoue (2003) observed a high correlation between protein-like fluorescence intensities and total amino acids in the ocean meaning that fluorescence intensities (i.e., peak-T) may be a useful indicator of the dynamics of dissolved amino acids. We found a significant increase of protein-like fluorescence per unit of biomass during the experiments for all the species examined suggesting that phytoplankton excretes fluorescent protein-like material during growth. Stedmon and Markager (2005) applied parallel factor analysis (PARAFAC) analysis to EEMs from a phytoplankton bloom sample and found two components in the protein-like region. One of them, with a maximum at Ex/Em 280 nm/338 nm was more susceptible to microbial degradation than the one that peaks at Ex/Em 275 nm/306 nm. Note that our peak-T is close to the former, more labile, component.
Microbial processes are an important source of humic-like compounds (Yentsch and Reichert 1961). However, previous experimental and field studies have concluded that phytoplankton can not be a direct source of fluorescent humic-like substances, mainly because of a lack of correlation between phytoplankton biomass and CDOM (Nelson et al. 1998; Rochelle-Newall and Fisher 2002). However, our study shows a clear increase of humic-like substances during the incubation of four different phytoplankton axenic cultures. This contrast may be attributable to a variety of causes. In field studies it is difficult to isolate the variables influencing CDOM dynamics and bacterial activity and UV radiation could mask the actual humic-like CDOM production role of phytoplankton as it has been shown that bacteria do produce such compounds (Tranvik 1993; Nieto-Cid et al. 2006) and that natural UV radiation photodegrades them (Moran et al. 2000; Nieto-Cid et al. 2006). To our knowledge, ours is the first study focusing on FDOM production, where phytoplankton cultures were maintained axenic until the end of the experiment. Therefore, the lack of a connection between humic-like CDOM and phytoplankton in previous experimental approaches could be caused by bacterial activity. Rochelle-Newall and Fisher (2002) analyzed fluorescence at longer wavelengths (Ex/Em 335 nm/450 nm) than those we used, in a region where we observed smaller increases in the intensity of fluorescence (data not shown). In our experiment, in absence of bacteria and UV radiation, the good correlation obtained between algal biomass and marine humic-like CDOM (n = 16, R2 = 0.78, p < 0.001) indicates that phytoplankton is indeed a net source of humic-like CDOM.
Phytoplankton production of CDOM
51
Previous studies with natural samples had suggested that phytoplankton could release protein-like compounds, measured as peak-T (Nieto-Cid et al. 2006). The correlation between peak-T and biomass found here was also significant (R2 = 0.36, p < 0.01) but lower than that between peak-M and
biomass,suggesting that the dynamics of protein-like substances are species specific. Determann et al. (1998) observed the same pattern in non-axenic algae cultures that included cells and exudates. They found that fluorescence intensities (Ex/Em 230 nm/ 330 nm) normalized to phytoplankton cell numbers were a function of the species and also dependent on the physiological status. Moreover, it has been demonstrated that phytoplankton excretes amino acids but can take them up too (Paerl 1991). So, we cannot exclude the possibility of some uptake of protein-like substances by phytoplankton, and this could also contribute to a decrease in the correlation between peak-T and phytoplankton biomass.
How and why healthy phytoplankton cells release amino acids and humic substances to the medium is unclear. The DOC excretion by phytoplankton has been widely discussed. Bjornsen (1988) proposed passive diffusion as the most likely mechanism. It is known that phytoplankton exudes low molecular weight photosynthetic metabolites and by-products of the degradation of cellular polymeric material (Myklestad 2000). In this sense, phytogenic marine humic substances can be considered a by-product of aerobic respiration.
To assess the relevance of our results in nature, we have roughly estimated the contribution of phytoplankton to the production of coloured humic-like substances in the highly productive coastal upwelling system of the Ría de Vigo (NW Iberian Peninsula). Seasonal cycles of peak-M (Nieto–Cid et al. 2006) and autotrophic carbon biomass (B) (Teixeira and Figueiras 2009) were obtained in the surface layer of this ecosystem during year 2002. A significant positive linear relationship (n = 8, R2 = 0.78, p < 0.001) was obtained between peak-M and biomass, with a slope of 2.9 ± 0.6 μg eq QS mg C-1. Considering that the slope of the linear regression of the curve in Fig. 3a is 0.5 ± 0.1 μg eq QS mg C-1, the contribution of phytoplankton to the build-up of peak-M in the surface layer of the coastal upwelling system of the Ría de Vigo should be 18 ± 9% if the relationships obtained in cultures were transferable to nature. Although this is certainly a rough estimation, it indicates that the contribution of phytoplankton to the production of coloured humic-like substances is potentially important, thus, further studies are necessary to assess the contribution of phytoplankton to the autochthonous CDOM pool in the marine ecosystem.
The optical characterisation of exudates produced by axenic cultures of four common phytoplankton species showed that these organisms produced CDOM, detected by the build-up of fluorescent protein- and humic-like materials. Whereas the exudation of protein-like substances by healthy phytoplankton cells has been recognised as a common but intriguing process, the in situ production of marine-humic like substances has been traditionally associated with bacterial respiration. Although

Chapter I
52
further studies are needed to examine the composition of the FDOM and its role in the physiology of phytoplankton, this work demonstrates unequivocally for the first time that phytoplankton cells in exponential growth also exude fluorescent humic-like substances and that the quality of this material is different for each species. As for the case of bacteria, it is hypothesised that the exudation of humic materials by phytoplankton could ultimately be derived from phytoplankton respiration. These results have clear implications for understanding the cycle of coloured DOM in the photic layer of coastal and open ocean waters by providing evidence for a previously unrecognized process contributing to the in situ production of CDOM.
Acknowledgements
We thank Francisco Torres for technical assistance. Organic carbon measurements were performed at the Nutrient Analysis Service of Institut de Ciències del Mar-CSIC, by V. Pérez and M. Abad, under the supervision of E. Berdalet. This study was funded by an I3P-predoctoral fellowship to C.R.-C. from the Consejo Superior de Investigaciones Científicas (CSIC) within the project: Organic matter sources, microbial diversity, and coastal marine pelagic ecosystem functioning (respiration and carbon use). (MODIVUS, CTM2005-04795/MAR). H.S. beneficed from fellowships from the Spanish ‘Ministerio de Educación y Ciencia’ (SB2006-0060 and JCI-2008-2727) and Portuguese ‘Fundação para a Ciência e a Tecnologia’ (FRH/BPD/34041/2006). Finally, we would like to express our gratitude to two anonymous reviewers for their constructive comments.
Species μDOC ( d-1) μT (d-1) μM ( d
-1)
Chaetoceros sp. 3.9 ± 0.3 x 10⁻² 22 ± 1 x 10⁻² 18.5 ± 0.1 x 10⁻²
S. costatum 7.1 ± 0.9 x 10⁻² 45.4 ± 0.3 x 10⁻² 32.3 ± 0.2 x 10⁻²
P. minimum 4.3 ± 0.3 x 10⁻² 19.6 ± 0.6 x 10⁻² 7.9 ± 0.1 x 10⁻²
M. pusilla 6.7 ± 0.4 x 10⁻² 30.16 ± 0.06 x 10⁻² 25.2 ± 0.3 x 10⁻²
Table 3. Turnover rates of the concentration of DOC and the fluorescence of peak-T and peak-M for each culture calculated as μDOC = ln[DOC(tf)/DOC(to)]/t; μT = ln[peak-T(tf)/peak-T(to)]/t; and μM = ln[peak-M(tf)/peak-M(to)]/t.

Phytoplankton production of CDOM
53
References
Arrigo, K.R., Brown, C.W., 1996. Impact of chromophoric dissolved organic matter on UV inhibition of primary productivity in the sea. Mar. Ecol. Prog. Ser. 140, 207-216.
Azam, F., Fenchel, T., Field, J.G., Gray, J.S., Meyer-Reil, L.A., Thingstad, F., 1983. The ecological role of water-column microbes in the sea. Mar. Ecol. Prog. Ser. 10, 257-263.
Bjørnsen, P.K. 1988. Phytoplankton exudation of organic matter: Why do healthy cells do it? Limnol. Oceanogr. 33, 151-154.
Carder, K.L., Steward, R.G., Harvey, G.R., Ortner, P.B., 1989. Marine humic and fulvic acids: their effects on remote sensing of ocean chlorophyll. Limnol. Oceanogr. 34, 68-81.
Chen, R.F., Bada, J. L., 1992. The fluorescence of dissolved organic matter in seawater. Mar. Chem. 37, 191-221.
Coble, P.G., 1996. Characterization of marine and terrestrial DOM in seawater using excitation-emission matrix spectroscopy. Mar. Chem. 51, 325-346.
Coble, P.G., Del Castillo, C.E., Avril, B., 1998. Distribution and optical properties of CDOM in the Arabian Sea during the 1995 Southwest Monsoon. Deep-Sea Res II. 45, 2195-2223.
Coble, P.G., 2007. Marine optical biogeochemistry: the chemistry of ocean color. Chem. Rev. 107, 402-418.
Determann, S., Lobbes, J.M., Reuter, R., Rullköter, J., 1998. Ultraviolet fluorescence excitation and emission spectroscopy of marine algae and bacteria. Mar. Chem. 62, 137-156.
Goldman, J.C., Hansell, D.A., Dennett, M.R., 1992. Chemical characterization of three large oceanic diatoms: potential impact on water column chemistry. Mar. Ecol. Prog. Ser. 88, 257-270.
Hansell, D.A. 2002. DOC in the global ocean carbon cycle. In: Hansell, D.A. and Carlson, C.A. (Eds.), Biogeochemistry of marine dissolved organic matter. Academic Press, pp. 509-546.
Herndl, G.J., Müller-Niklas, G., Frick, J., 1993. Major role of ultraviolet-B in controlling bacterioplankton

Chapter I
54
growth in the surface layer of the ocean. Nature 361, 717-719.
Kieber, R.J., Hydro, L.H., Seaton, P.J., 1997. Photooxidation of triglycerides and fatty acids in seawater: implication toward the formation of marine humic substances. Limnol. Oceanogr. 42, 1454-1462.
Kramer, G.D., Herndl, G.J., 2004. Photo- and bioreactivity of chromophoric dissolved organic matter produced by marine bacterioplankton. Aquat. Microb. Ecol. 36, 239-246.
Lakowicz, J.R., 1983. Principles of fluorescence spectroscopy. Plenum Press.
Lancelot, C., 1983. Factors affecting phytoplankton extracellular release in the Southern Bight of the North Sea. Mar. Ecol. Prog. Ser. 12, 115-121.
Lancelot, C., Billen, G., 1985. Carbon-nitrogen relationships in nutrient metabolism of coastal marine ecosystems. In: Jannasch, H.W., Williams, P.J.le B. (Eds.), Advances in aquatic microbiology, vol. 3. Academic Press, pp. 263-321.
Mague, T.H., Friberg, E., Hughes, D.J., Morris, I., 1980. Extracellular release of carbon by marine phytoplankton; a physiological approach. Limnol. Oceanogr. 25, 262-279.
Martin-Jézéquel, V., Poulet, S.A., Harris, R.P., Moal, J., Samain, J.F., 1988. Interspecific and intraspecific composition and variation of free amino acids in marine phytoplankton. Mar. Ecol. Prog. Ser. 44, 303-313.
Menden-Deuer, S., Lessard, E.J., 2000. Carbon to volume relationships for dinoflagellates, diatoms, and other protist plankton. Limnol. Oceanogr. 45, 569-579.
Midorikawa, T., Tanoue, E., 1998. Molecular masses and chromophoric properties of dissolved organic ligands for copper(II) in oceanic water. Mar. Chem. 62, 219-239.
Moran, M.A., Sheldon, W.M., Zepp, R.G., 2000. Carbon loss and optical property changes during long-term photochemical and biological degradation of estuarine dissolved organic matter. Limnol. Oceanogr. 45, 1254-1264.
Myklestad, S.M., 2000. Dissolved organic carbon from phytoplankton, In: Wangersky, P. (Ed.), The handbook of environmental chemistry. Marine chemistry, vol. 5D. Springer, pp. 111-148.

Phytoplankton production of CDOM
55
Nelson, N.B., Siegel, D.A., Michaels, A.F., 1998. Seasonal dynamics of coloured dissolved material in the Sargasso Sea. Deep-Sea Res I. 45, 931-957.
Nieto-Cid, M., Álvarez-Salgado, X.A., Pérez, F.F., 2006. Microbial and photochemical reactivity of fluorescent dissolved organic matter in a coastal upwelling system. Limnol. Oceanogr. 51, 1391-1400.
Obernosterer, I., Herndl, G.J., 1995. Phytoplankton extracellular release and bacterial growth: dependence on the inorganic N: P ratio. Mar. Ecol. Prog. Ser. 116, 247-257.
Ortega-Retuerta, E., Frazer, T.K., Duarte, C.M., Ruiz-Halpern, S., Tovar-Sánchez, A., Arrieta, J.M., Reche, I., 2009. Biogeneration of chromophoric dissolved organic matter by bacteria and krill in the Southern Ocean. Limnol. Oceanogr. 54, 1941–1950.
Paerl, H. W., 1991. Ecophysiological and trophic implications of light-stimulated amino acid utilization in marine picoplankton. Appl. Environ. Microbiol. 57, 473-479.
Rochelle-Newall, E.J., Fisher, T.R., 2002. Production of chromophoric dissolved organic matter fluorescence in marine and estuarine environments: an investigation into the role of phytoplankton. Mar. Chem. 77, 7 -21.
Rose, J.M., Caron, D.A., 2007. Does low temperature constrain the growth rates of heterotrophic protists? Evidence and implications for algal blooms in cold waters. Limnol. Oceanogr. 52, 886-895.
Seritti, A., Morelli, E., Nannicini, L., Del Vecchio, R., 1994. Production of hydrophobic fluorescent organic matter by the marine diatom Phaeodactylum tricornutum. Chemosphere 28, 117-129.
Sokal, F.F., Rohlf, F.J., 1984. Introduction to biostatistics. W.H. Freeman.
Stedmon, C.A., Markager, S., 2005. Tracing the production and degradation of autochthonous fractions of dissolved organic matter by fluorescence analysis. Limnol. Oceanogr. 50, 1415–1426.
Steinberg, D.K., Nelson, N.B., Carlson, C.A., Prusak, A.C., 2004. Production of chromophoric dissolved organic matter (CDOM) in the open ocean by zooplankton and the colonial cyanobacterium Trichodesmium spp. Mar. Ecol. Prog. Ser. 267, 45-56.
Sun, J., Liu D., 2003. Geometric models for calculating cell biovolume and surface area for phytoplankton. J. Plankton Res. 25,1331-1346.

Chapter I
56
Teixeira, I.G., Figueiras, F.G., 2009. Feeding behaviour and non-linear responses in dilution experiments in a coastal upwelling system. Aquat. Microb. Ecol. 55, 53-63.
Tranvik, L.J., 1993. Microbial transformation of labile dissolved organic matter into humic-like matter in seawater. FEMS Microb. Ecol. 12, 177-183.
Twardowski, M.S., Donaghay, P.L., 2001. Separating in situ and terrigenous sources of absorption by dissolved materials in coastal waters. J. Geophys. Res. 106, 2545-2560.
Yamashita, Y., Tanoue, E., 2003. Chemical characterization of protein-like fluorophores in DOM in relation to aromatic amino acids. Mar. Chem. 82, 255- 271.
Yentsch, C. S., Reichert, C.A., 1961. The interrelationship between water-soluble yellow substances and chloroplastic pigments in marine algae. Bot. Mar. 3, 65-74.

Chapter II:
Net production/consumption of fluorescent coloured dissolved organic matter by natural bacterial assemblages growing on marine phytoplankton exudates

Chapter II
58
Co-authors:
Hugo Sarmento, Xosé Antón Álvarez-Salgado, Josep M. Gasol and Celia Marrasé.

Production/consumption of CDOM by bacteria
59
Abstract
Among these FDOM producers, phytoplankton is the most abundant organisms in terms of biomass. Therefore, the quantitative and qualitative analysis of the FDOM produced by phytoplankton and its comparison with that produced by bacteria is essential to better understand the distributions of CDOM in the oceans as well as the role of CDOM in the global carbon cycle. We examined the net uptake/release of coloured dissolved organic matter (CDOM) by a natural bacterial community growing on DOM exudates from four phytoplankton species cultured in axenic conditions. The species of phytoplankton DOM-producer did not influence the bacterial biomass yield. The phytoplankton exudates contained fluorescent humic- and protein-like substances. The humic-like substances excreted by phytoplankton (Ex/Em: 310 nm/392 nm; P. Coble’s peak-M) were utilised by bacteria in different proportions depending on the phytoplankton species of origin; about 30% of the humic-like substances excreted by S. costatum were consumed while the percentages were reduced to 5% and 10% for Chaetoceros sp. and M. pusilla, respectively. Furthermore, bacteria produced humic-like substances that fluoresce at Ex/Em: 340 nm/440 nm (Coble’s peak-C), i.e. more aromatic than those generated by phytoplankton. The induced fluorescent emission of the more aromatic CDOM produced by prokaryotes was significantly (p < 0.05) higher than that from the more aliphatic CDOM produced by eukaryotes. The final composition of the bacterial community growing on the exudates differed markedly depending on the phytoplankton species of origin. Among the bacterial group examined, Alteromonas and Roseobacter were the dominant bacterial groups during all the incubation on Chaetoceros spp. and P. minimum exudates, respectively. In S. costatum and M. pusilla exudates, the dominant bacterial group shifted during the course of the incubations. In the exponential growth phase, Alteromonas was the dominant group growing on S. costatum exudates, but it was replaced by Roseobacter afterwards. On M. pusilla exudates Roseobacter was replaced by Bacteroidetes after the exponential growth phase. The study of these fluorescence excitation-emission matrices in relation to different bacterial groups could be a step further in the characterization of DOM produced by bacteria and in the identification of the sources of DOM in the environment.

Chapter II
60
Production/consumption of CDOM by bacteria
61
Introduction
Coloured dissolved organic matter (CDOM) is receiving increasing attention due to its important role in aquatic ecosystems. It regulates UV and visible light penetration in the water column thus influencing primary productivity (Arrigo and Brown, 1996) and preventing cellular DNA damage (Häder and Sinha, 2005; Herndl et al., 1993). CDOM can also form complexes with metals reducing the concentrations of free ions in seawater (Midorikawa and Tanoue, 1998). In addition, changes in the optical properties of CDOM are suitable to trace microbial and photochemical degradation processes (Nieto-Cid et al., 2006; Romera-Castillo et al., 2011) and, more specifically, the in situ formation of bio-refractory humic materials from bio-available DOM (Lønborg et al., 2010). Due to their optical properties, CDOM have also been the focus of remote sensing studies to map the global distribution and to correct the chlorophyll signal. The absorption spectrum of CDOM overlaps with that of chlorophyll a, affecting the satellite-derived estimates of phytoplankton biomass and activity in the oceans, especially in coastal areas (Siegel et al., 2002).
The fraction of CDOM that emits induced fluorescence light is called fluorescent dissolved organic matter (FDOM). Two main groups of fluorophores have been differentiated following Coble et al. (Coble et al., 1998): protein-like substances, which fluoresce around Ex/Em: 280 nm/350 nm (peak-T); and humic-like substances which fluoresce at two pairs of wavelengths, Ex/Em: 312 nm/380-420 nm of autochthonous (marine) origin (peak-M), and Ex/Em 340 nm/440 nm of allochthonous (terrestrial) origin (peak-C). Both peaks, -M and –C, have been found in samples from freshwater and seawater environments. However, a shift to longer wavelengths of the humic-like peaks in freshwater samples has been reported (Coble, 1996) because terrestrial humic substances are more aromatic than marine humic substances (Benner, 2003). Additionally, and independently of their origin, humic substances also fluoresce in the UV-C region of the spectrum, at Ex/Em: 250 nm/450 nm (Coble, 1996; Coble et al., 1998).
Humic materials have been traditionally considered photodegradable but resistant to bacterial degradation. In fact, when humic-like FDOM is not exposed to natural UV radiation levels, it can accumulate in the ocean at centennial to millennial time-scales within the global conveyor belt (Chen and Bada, 1992; Yamashita and Tanoue, 2008). Therefore, the formation of bio-resistant CDOM during the degradation of bio-available DOM would allow the sequestration of anthropogenic CO2 in a dissolved organic form for hundreds to thousands of years, as part of the recently coined “microbial carbon pump” sequestration mechanism (Jiao et al., 2010).
Global carbon flux estimates require quantitative information about the degradation rates of biogenic organic matter. Although the bioavailability of phytoplankton exudates has been recurrently

Chapter II
62
studied (Obernosterer and Herndl, 1995; Sundh, 1992; Sundh and Bell, 1992), few works have dealt with the exudation of CDOM by phytoplankton (Romera-Castillo et al., 2010). In fact, marine FDOM has been mainly considered a by-product of the bacterial metabolism (Chen and Bada, 1992; Nieto-Cid et al., 2006; Yamashita and Tanoue, 2008) until some recent studies have shown that it can be produced by zooplankton (Steinberg et al., 2004; Urban-Rich et al., 2006), krill (Ortega-Retuerta et al., 2010) and also by phytoplankton cells (Romera-Castillo et al., 2010). Since phytoplankton is the most abundant organisms in terms of biomass among these FDOM producers. The analysis of the FDOM produced by phytoplankton and its comparison with that produced by bacteria is essential to better understand the role of CDOM in the global carbon cycle.
In addition, while bacterioplankton structure is modulated by the amount and quality of the available substrates (eg., (Pinhassi et al., 2004; Rooney-Varga et al., 2005), activity of different group of bacteria can shape organic matter composition. However, to the best of our knowledge, there is a lack of studies examining the changes in the fluorescence signal of the DOC and bacterial community composition in controlled conditions. Since fluorescence excitation-emission matrices are fingerprints of DOM structure, the study of these EEMs in relation to different bacterial groups could be a step further in the characterization of DOM produced by bacteria and in the identification of the sources of DOM in the environment.
The objective of the present work is to quantify the net production/consumption of CDOM by a natural bacterial community growing on exudates derived from four phytoplankton species (Chaetoceros sp., Skeletonema costatum, Prorocentrum minimum and Micromonas pusilla) cultured in axenic conditions. To this end, the time course of the induced fluorescent excitation-emission properties of CDOM was followed as well as its relationship with changes in the structure of the bacterial community. Moreover, we wanted to investigate whether the bacterial groups selected by the treatments can be associated to characteristic DOM fluorescent signals.
Material and methods
Phytoplankton cultures
Algal exudates were produced from axenic cultures of four phytoplankton species. The axenic species obtained from the Provasoli-Guillard National Center for Culture of Marine Phytoplankton (CCMP) (https://ccmp.bigelow.org/) were cultured in axenic conditions as described in Romera-Castillo et al. (Romera-Castillo et al., 2010). The strains used were the diatoms Chaetoceros sp. (CCMP199) and Skeletonema costatum (CCMP2092) (Greville) Cleve, the dinoflagellate Prorocentrum

Production/consumption of CDOM by bacteria
63
minimum (CCMP1329) (Pavillard) J. Schiller, and the prasinophyte Micromonas pusilla (R.W. Butcher) (CCMP1545) I. Manton and M. Parke. The four species produced significant amounts of FDOM (Romera-Castillo et al., 2010).
The cultured volume (1.4 L) of each phytoplankton species was filtered through a 0.2 μm Sterivex cartridge and inoculated with 150 mL of natural seawater filtered twice through 0.6 µm polycarbonate filter to eliminate predators of bacteria, such as small flagellates. The inoculum was taken on 7 May 2008 from the Blanes Bay Microbial Observatory (http://www.icm.csic.es/bio/projects/icmicrobis/bbmo/). Then, each 1.55 L inoculated sample was distributed in 36 polycarbonate bottles of 60 mL filled with 40 mL of the inoculated exudates.
The bottles were incubated for 34 days and sampled at times 0 (T0), 4 (T4), 12 (T12), 21 (T21) and 34 days (T34). At each sampling time, 4 of the initial 36 bottles per treatment were sacrificed: three replicates were used for TOC, DOC and FDOM analysis and bacterial counts and one for Catalyzed reporter deposition Fluorescence In Situ Hybridization (CARD-FISH).
Bacterial community biomass and structure
Heterotrophic bacteria were counted in the four bottles with a FacsCalibur (Becton & Dickinson) flow cytometer equipped with a 15 mW Argon-ion laser (488 nm emission) as described in Gasol and del Giorgio (Gasol and Del Giorgio, 2000). For each sample, 4 mL of water were collected and fixed immediately with cold glutaraldehyde 10% (final concentration 1%), left in the dark for 10 min at room temperature and then stored at -80°C. Later, 400 μL of sample received a diluted SYTO-13 (Molecular Probes Inc., Eugene, OR, USA) stock (10:1) at 2.5 μmo L-1 final concentration, left for about 10 min in the dark to complete the staining and run in the flow cytometer. At least 30000 events were acquired for each subsample (usually 90000 events). Fluorescent beads (1 μm, Fluoresbrite carboxylate microspheres, Polysciences Inc., Warrington, PA) were added at a known density as internal standards. The bead standard concentration was determined by epifluorescence microscopy. Heterotrophic bacteria were detected by their signature in a plot of side scatter (SSC) vs. FL1 (green fluorescence). Data analysis was performed with the Paint-A-Gate software (Becton & Dickinson).
Bacterial cell size (V, in µm3 cell-1) was estimated using the relationship between the average bacterial size and the average fluorescence of the SYTO-13– stained sample relative to beads (FL1 bacteria/FL1 beads) reported by Gasol and del Giorgio (Gasol and Del Giorgio, 2000):
V = 0.0075 + 0.11 · (FL1 bacteria/FL1 beads)
Bacterial biomass (BB, in Pg C cell-1) was calculated by using the carbon-to-volume (V, in µm3.cell-1)

Chapter II
64
relationship derived by Norland (Norland, 1993) from the data of Simon and Azam (Simon and Azam, 1989):
BB = 0.12 · V0.7
Bacterial community composition (BCC) was obtained by catalyzed reporter deposition fluorescent in situ hybridization (CARD-FISH). Three to five mL samples were fixed with paraformaldehyde (1% final concentration), and bacterial cells were collected onto 0.2 µm polycarbonate filters (Whatman) and kept at -80°C until hybridization. Four horseradish peroxidase probes were used, following the protocol of Pernthaler et al. (Pernthaler et al., 2004): ALT1413, CF319a, ROS537 and SAR11, targeting respectively the Alteromonas, the Bacteroidetes, the Roseobacter and SAR11 clades (further details in Sarmento & Gasol, submitted). The NON338 probe was used as a negative control. After permeabilization with lysozyme and achromopeptidase, several filter sections were cut and hybridized for 2h at 35°C (Pernthaler et al., 2004). Probe GAM42a was used with competitor oligonucleotides as described in (Manz et al., 1992). Filter portions were then counterstained with DAPI (1µg mL-1) before enumeration with an epifluorescence microscope. A minimum of 10 fields per filter-portion were counted, and at least 400 cells per group were counted. The selected groups were expressed as a percentage relative to the total DAPI-stained bacterial cells.
Dissolved organic carbon (DOC) and fluorescent dissolved organic matter (FDOM)
Triplicate DOC and FDOM samples were filtered through GF/F filters with an acid-cleaned syringe. Milli-Q water was filtered through the filtration system and no significant enrichment was observed in DOC and FDOM concentrations, discarding contamination during filtration.
Approximately 10 mL of water were collected in pre-combusted (450ºC, 12 h) glass ampoules for DOC analysis. H3PO4 was added to acidify the sample to pH < 2 and the ampoules were heat-sealed and stored in the dark at 4ºC until analysis. DOC was measured with a Shimadzu TOC-V organic carbon analyser. The system was standardized daily with potassium hydrogen phthalate. Each ampoule was injected 3–5 times and the average area of the 3 replicates that yielded a standard deviation <1% were chosen to calculate the average DOC concentration of each sample after subtraction of the average area of the freshly-produced UV-irradiated milli-Q water used as a blank. The performance of the analyser was tested with the DOC reference materials provided by Prof. D. Hansell (University of Miami). We obtained a concentration of 45.2 ± 0.3 μmol C L-1 for the deep ocean reference (Sargasso Sea deep water, 2600 m) minus blank reference materials, the day when the samples were analyzed. The nominal DOC value provided by the reference laboratory (Certified Reference Materials for DOC analysis, Batch 04, 2004) is 45 μmol C L-1.
Production/consumption of CDOM by bacteria
65
Samples for FDOM analysis were measured immediately after collection. Single measurements at specific excitation-emission wavelengths as well as excitation-emission matrices (EEMs) of the aliquots were performed with a LS 55 Perkin Elmer Luminescence spectrometer, equipped with a xenon discharge lamp, equivalent to 20 kW for 8 μs duration. The detector was a red-sensitive R928 photomultiplier, and a photodiode worked as reference detector. Slit widths were 10.0 nm for the excitation and emission wavelengths and the scan speed was 250 nm min–1. Measurements were performed at a constant room temperature of 20°C in a 1 cm quartz fluorescence cell. To compare with other works, the Ex/Em wavelengths used for single measurements were those established by Coble (Coble, 1996): Ex/Em: 280 nm/350 nm (peak T or F(280/350)) as indicator of protein-like substances and Ex/Em: 320 nm/410 nm (peak M or F(320/410)) and Ex/Em: 340 nm/440 nm (peak C or F(340/440)) as indicators of humic-like substances. Following Coble (Coble, 1996), fluorescence measurements were expressed in quinine sulphate units (QSU), i.e., in μg eq QS L-1, by calibrating the LS 55 Perkin Elmer at Ex/Em: 350 nm/450 nm against a quinine sulphate dihydrate (QS) standard made up in 0.05 mol L-1 sulphuric acid.
EEMs were performed to track for possible changes in the position of the protein- and humic-like fluorescence peaks. These matrices were generated by combining 21 synchronous Ex/Em fluorescence spectra of the sample, obtained for excitation wavelengths from 250 to 400 nm and an offset between the excitation and emission wavelengths of 50 nm for the 1st scan and 250 nm for the 21st scan. Rayleigh scatter does not need to be corrected when the EEMs are generated from synchronous spectra and Raman scatter was corrected by subtracting the EEM of pure water (Milli-Q) from the EEM of the sample.
Paired Student-t-test was used to check for significant differences in the measured variables between, the initial, intermediate and final incubation times (Sokal and Rohlf, 1984).
Results
Time course of bacterial biomass
Bacterial biomass increased similarly in the four cultures throughout the initial 4 days of exponential growth (Fig. 1) reaching concentrations that ranged from 204 ± 17 to 244 ± 8 μg C L-1. It kept increasing until day 12 only in the treatment with P. minimum exudates, reaching 269 ± 5 μg C L-1. Bacterial biomass decreased significantly (p > 0.05) after day 4 except on P. minimum exudates, where it decreased after day 12. No significant changes were observed from day 12 until the end of the experiment in the rest of cultures.
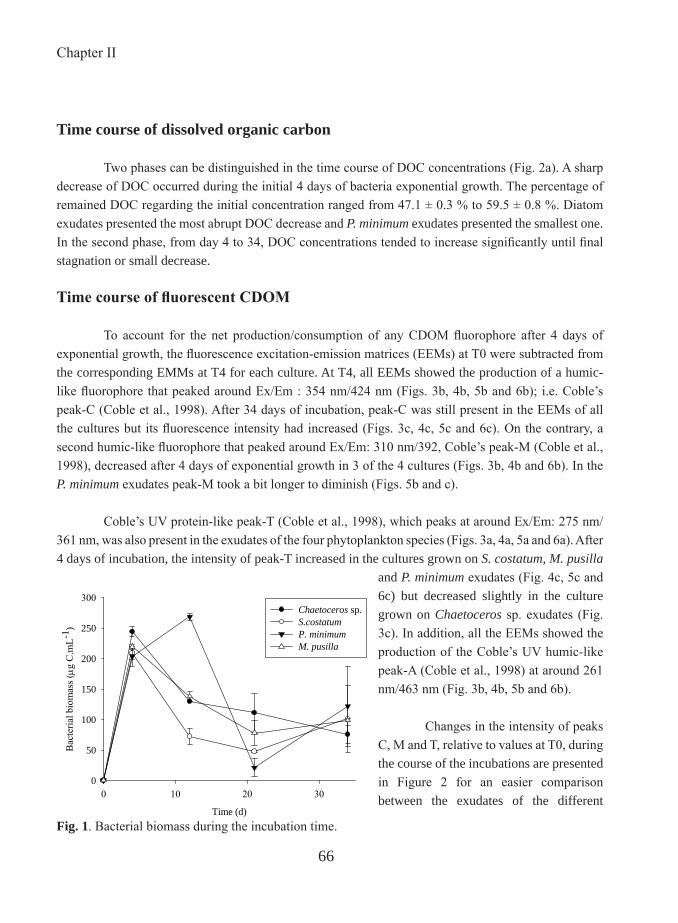
Chapter II
66
Time course of dissolved organic carbon
Two phases can be distinguished in the time course of DOC concentrations (Fig. 2a). A sharp decrease of DOC occurred during the initial 4 days of bacteria exponential growth. The percentage of remained DOC regarding the initial concentration ranged from 47.1 ± 0.3 % to 59.5 ± 0.8 %. Diatom exudates presented the most abrupt DOC decrease and P. minimum exudates presented the smallest one. In the second phase, from day 4 to 34, DOC concentrations tended to increase significantly until final stagnation or small decrease.
Time course of fluorescent CDOM
To account for the net production/consumption of any CDOM fluorophore after 4 days of exponential growth, the fluorescence excitation-emission matrices (EEMs) at T0 were subtracted from the corresponding EMMs at T4 for each culture. At T4, all EEMs showed the production of a humic-like fluorophore that peaked around Ex/Em : 354 nm/424 nm (Figs. 3b, 4b, 5b and 6b); i.e. Coble’s peak-C (Coble et al., 1998). After 34 days of incubation, peak-C was still present in the EEMs of all the cultures but its fluorescence intensity had increased (Figs. 3c, 4c, 5c and 6c). On the contrary, a second humic-like fluorophore that peaked around Ex/Em: 310 nm/392, Coble’s peak-M (Coble et al., 1998), decreased after 4 days of exponential growth in 3 of the 4 cultures (Figs. 3b, 4b and 6b). In the P. minimum exudates peak-M took a bit longer to diminish (Figs. 5b and c).
Coble’s UV protein-like peak-T (Coble et al., 1998), which peaks at around Ex/Em: 275 nm/ 361 nm, was also present in the exudates of the four phytoplankton species (Figs. 3a, 4a, 5a and 6a). After 4 days of incubation, the intensity of peak-T increased in the cultures grown on S. costatum, M. pusilla
and P. minimum exudates (Fig. 4c, 5c and 6c) but decreased slightly in the culture grown on Chaetoceros sp. exudates (Fig. 3c). In addition, all the EEMs showed the production of the Coble’s UV humic-like peak-A (Coble et al., 1998) at around 261 nm/463 nm (Fig. 3b, 4b, 5b and 6b).
Changes in the intensity of peaks C, M and T, relative to values at T0, during the course of the incubations are presented in Figure 2 for an easier comparison between the exudates of the different
Fig. 1. Bacterial biomass during the incubation time.Time (d)
0 10 20 30
Bac
teria
l bio
mas
s (g
C.m
L-1)
0
50
100
150
200
250
300Chaetoceros sp.S.costatumP. minimumM. pusilla

Production/consumption of CDOM by bacteria
67
phytoplankton species. The initial values of these parameters are summarised in Table 1. Peak-C increased significantly (p < 0.001) until T21 in all cultures (Fig. 2b) with the highest variation during the first four days; the corresponding net production rates are summarised in Table 2. On the contrary, peak-M increased significantly (p < 0.05) only in the P. minimum exudates culture (Fig. 2c). For the other 3 species, a significant decrease (p < 0.05) occurred during the initial 4 days of incubation. The most pronounced decrease, by 30%, was observed in the culture grown on S. costatum exudates, prolonged until the end of the experiment. During the stationary phase, peak-M experienced a significant (p < 0.05) increase only from T12 to T21. Net bacterial production rates of peaks C and M per unit of carbon biomass and day were calculated for all treatments, during the exponential phase, to compare them with the net production rates of humic-like substances by marine phytoplankton during the exponential growth already obtained by Romera-Castillo et al. (2010). We obtained net productions of peak-C between 15 ± 2 x 10⁻⁴ and 63 ± 2 x 10⁻⁴ QSU μg C-1 L d-1 and the highest net consumption of peak-M, -117 ± 4 x 10⁻⁴ QSU μg C-1 L d-1, corresponded to the bacteria grown on S. costatum exudates.
In general, peak-T increased significantly in all cultures during the exponential growth phase (T4) and, then, decreased dramatically up to the end of the experiment (Fig. 2d). The bacterial culture on M. pusilla exudates underwent the largest increase (77%). However, Chaetoceros sp. did not show a significant variation of peak-T until the end of the incubation time (T34) when it sharply decreased by 41%. The net production of peak-T per carbon biomass and day ranged between 5 ± 5 x 10⁻⁴ and 164 ± 19 x 10-4 QSU μg C-1 L d-1.
Fig.2. Percentages of a) DOC, b) peak-C (F(340/440)), c) peak-M (F(320/410)) and d) peak-T (F(280/350)) regarding to their initials values for all the incubations times.
Chaetoceros sp.S.costatumP. minimumM. pusilla
Time (d)0 10 20 30
F(32
0/41
0) (%
)
60
70
80
90
100
110
120
0 10 20 30
F(34
0/44
0) (%
)
90100110120130140150160170
Time (d)0 10 20 30
F(28
0/35
0) (%
)
406080
100120140160180200
0 10 20 30
DO
C (%
)
40
50
60
70
80
90
100
110 a) b)
c) d)
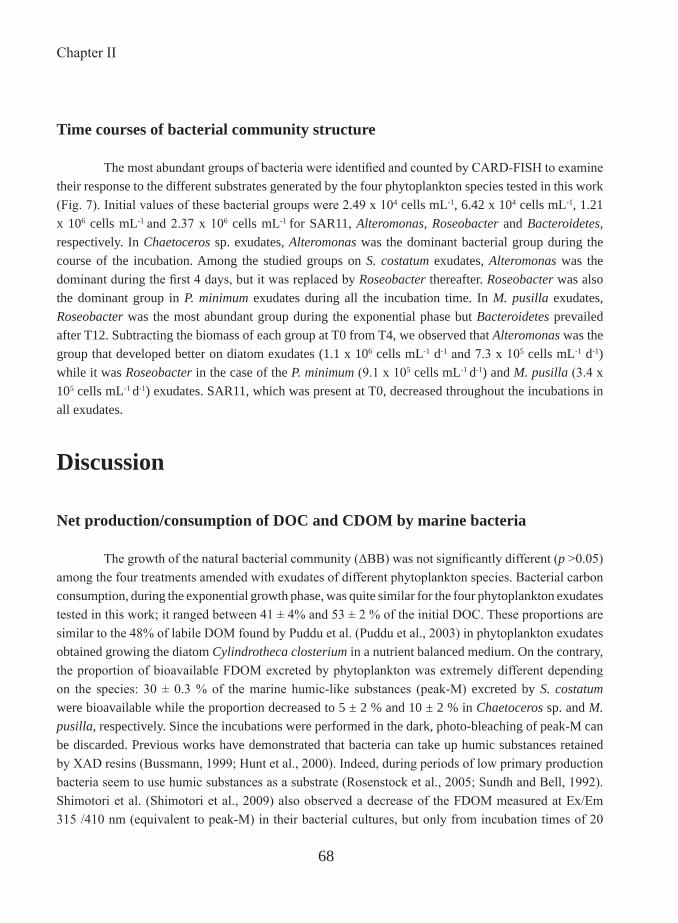
Chapter II
68
Time courses of bacterial community structure
The most abundant groups of bacteria were identified and counted by CARD-FISH to examine their response to the different substrates generated by the four phytoplankton species tested in this work (Fig. 7). Initial values of these bacterial groups were 2.49 x 10⁴ cells mL-1, 6.42 x 10⁴ cells mL-1, 1.21 x 10⁶ cells mL-1 and 2.37 x 10⁶ cells mL-1 for SAR11, Alteromonas, Roseobacter and Bacteroidetes, respectively. In Chaetoceros sp. exudates, Alteromonas was the dominant bacterial group during the course of the incubation. Among the studied groups on S. costatum exudates, Alteromonas was the dominant during the first 4 days, but it was replaced by Roseobacter thereafter. Roseobacter was also the dominant group in P. minimum exudates during all the incubation time. In M. pusilla exudates, Roseobacter was the most abundant group during the exponential phase but Bacteroidetes prevailed after T12. Subtracting the biomass of each group at T0 from T4, we observed that Alteromonas was the group that developed better on diatom exudates (1.1 x 10⁶ cells mL-1 d-1 and 7.3 x 10⁵ cells mL-1 d-1) while it was Roseobacter in the case of the P. minimum (9.1 x 10⁵ cells mL-1 d-1) and M. pusilla (3.4 x 10⁵ cells mL-1 d-1) exudates. SAR11, which was present at T0, decreased throughout the incubations in all exudates.
Discussion
Net production/consumption of DOC and CDOM by marine bacteria
The growth of the natural bacterial community (ΔBB) was not significantly different (p >0.05) among the four treatments amended with exudates of different phytoplankton species. Bacterial carbon consumption, during the exponential growth phase, was quite similar for the four phytoplankton exudates tested in this work; it ranged between 41 ± 4% and 53 ± 2 % of the initial DOC. These proportions are similar to the 48% of labile DOM found by Puddu et al. (Puddu et al., 2003) in phytoplankton exudates obtained growing the diatom Cylindrotheca closterium in a nutrient balanced medium. On the contrary, the proportion of bioavailable FDOM excreted by phytoplankton was extremely different depending on the species: 30 ± 0.3 % of the marine humic-like substances (peak-M) excreted by S. costatum were bioavailable while the proportion decreased to 5 ± 2 % and 10 ± 2 % in Chaetoceros sp. and M. pusilla, respectively. Since the incubations were performed in the dark, photo-bleaching of peak-M can be discarded. Previous works have demonstrated that bacteria can take up humic substances retained by XAD resins (Bussmann, 1999; Hunt et al., 2000). Indeed, during periods of low primary production bacteria seem to use humic substances as a substrate (Rosenstock et al., 2005; Sundh and Bell, 1992). Shimotori et al. (Shimotori et al., 2009) also observed a decrease of the FDOM measured at Ex/Em 315 /410 nm (equivalent to peak-M) in their bacterial cultures, but only from incubation times of 20
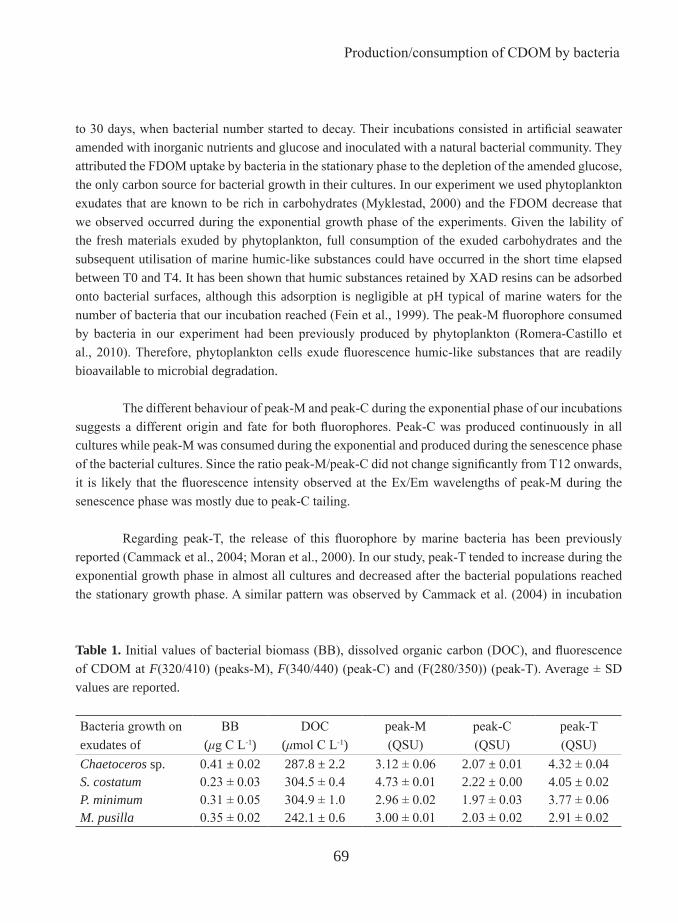
Production/consumption of CDOM by bacteria
69
to 30 days, when bacterial number started to decay. Their incubations consisted in artificial seawater amended with inorganic nutrients and glucose and inoculated with a natural bacterial community. They attributed the FDOM uptake by bacteria in the stationary phase to the depletion of the amended glucose, the only carbon source for bacterial growth in their cultures. In our experiment we used phytoplankton exudates that are known to be rich in carbohydrates (Myklestad, 2000) and the FDOM decrease that we observed occurred during the exponential growth phase of the experiments. Given the lability of the fresh materials exuded by phytoplankton, full consumption of the exuded carbohydrates and the subsequent utilisation of marine humic-like substances could have occurred in the short time elapsed between T0 and T4. It has been shown that humic substances retained by XAD resins can be adsorbed onto bacterial surfaces, although this adsorption is negligible at pH typical of marine waters for the number of bacteria that our incubation reached (Fein et al., 1999). The peak-M fluorophore consumed by bacteria in our experiment had been previously produced by phytoplankton (Romera-Castillo et al., 2010). Therefore, phytoplankton cells exude fluorescence humic-like substances that are readily bioavailable to microbial degradation.
The different behaviour of peak-M and peak-C during the exponential phase of our incubations suggests a different origin and fate for both fluorophores. Peak-C was produced continuously in all cultures while peak-M was consumed during the exponential and produced during the senescence phase of the bacterial cultures. Since the ratio peak-M/peak-C did not change significantly from T12 onwards, it is likely that the fluorescence intensity observed at the Ex/Em wavelengths of peak-M during the senescence phase was mostly due to peak-C tailing.
Regarding peak-T, the release of this fluorophore by marine bacteria has been previously reported (Cammack et al., 2004; Moran et al., 2000). In our study, peak-T tended to increase during the exponential growth phase in almost all cultures and decreased after the bacterial populations reached the stationary growth phase. A similar pattern was observed by Cammack et al. (2004) in incubation
Table 1. Initial values of bacterial biomass (BB), dissolved organic carbon (DOC), and fluorescence of CDOM at F(320/410) (peaks-M), F(340/440) (peak-C) and (F(280/350)) (peak-T). Average ± SD values are reported.
Bacteria growth onexudates of
BB(μg C L-1)
DOC(μmol C L-1)
peak-M(QSU)
peak-C(QSU)
peak-T(QSU)
Chaetoceros sp. 0.41 ± 0.02 287.8 ± 2.2 3.12 ± 0.06 2.07 ± 0.01 4.32 ± 0.04S. costatum 0.23 ± 0.03 304.5 ± 0.4 4.73 ± 0.01 2.22 ± 0.00 4.05 ± 0.02P. minimum 0.31 ± 0.05 304.9 ± 1.0 2.96 ± 0.02 1.97 ± 0.03 3.77 ± 0.06M. pusilla 0.35 ± 0.02 242.1 ± 0.6 3.00 ± 0.01 2.03 ± 0.02 2.91 ± 0.02

Chapter II
70
Fig. 3. Excitation-emission matrices of the bacterial incubation grown in Chaetoceros sp. exudates at a) initial time and subtracted EEMs between b) time at day 4 and initial time and c) final time and initial time of incubation.
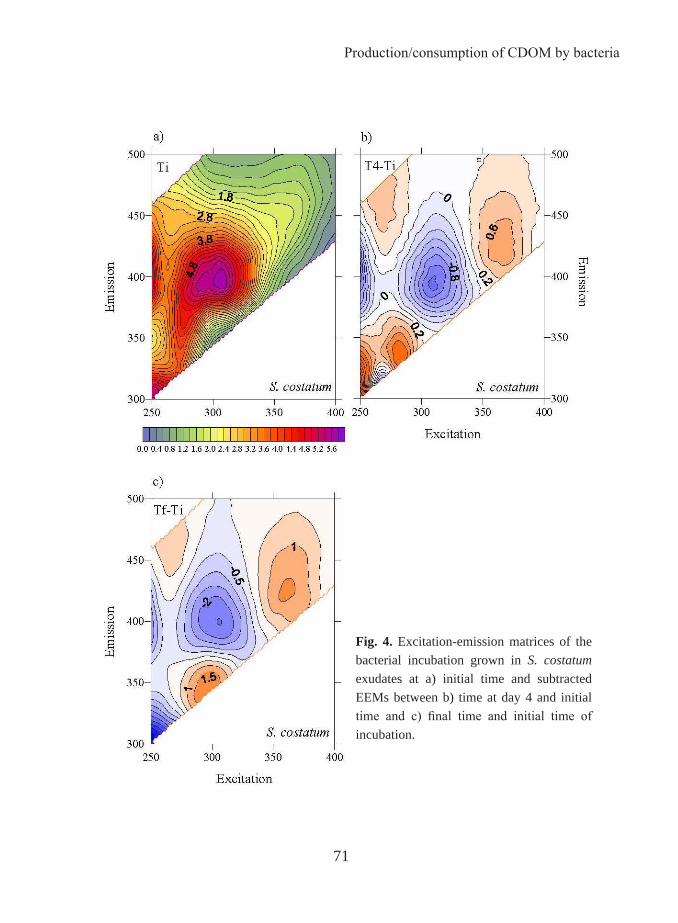
Production/consumption of CDOM by bacteria
71
Fig. 4. Excitation-emission matrices of the bacterial incubation grown in S. costatum exudates at a) initial time and subtracted EEMs between b) time at day 4 and initial time and c) final time and initial time of incubation.

Chapter II
72
experiments performed in lake waters of different trophic status. They suggested that peak-T reflects the balance between bacterial consumption and production of a small fraction of the DOM pool and that it could be a by-product of bacterial metabolism. The significant positive correlation that we found between peak-T and bacterial biomass (R2 = 0.40; p < 0.01; N = 16) supports this statement. Kawasaki and Benner (Kawasaki and Benner, 2006) also found an increase of total dissolved amino acids (TDAA) matching a peak in bacterial biomass. This is consistent as well with our results since protein-like material increased, in general, during the bacterial exponential growth phase. However, since we have used GF/F filters that could have not retained 100% of the BB, a partial contribution of the aromatic amino acids containing cells to the peak-T signal cannot be discarded.
Wavelength shifts in EEMs as indicators of changes in the chemical structure of CDOM
EEMs provide complementary information about the chemical structure, specially the aromaticity, of the FDOM produced or consumed by marine phytoplankton and bacteria. In all cultures except in that of Chaetoceros sp. bacteria produced protein-like substances and the peak-T shifted toslightly longer excitation and shorter emission wavelengths than the peak-T reported by Coble (Coble et al., 1998). Tryptophan is the most fluorescent of the three aromatic amino acids: tryptophan, tyrosine and phenylalanine (Lakowicz, 1983). Therefore, the fluorescence observed in the protein-like region should mainly due to the presence of this amino acid. The wavelength of the emitted light is a better indicator of the chemical environment of the fluorophore than the intensity. Tryptophan residues which are exposed to water have maximum fluorescence at emission wavelengths of about 340-350 nm, whereas totally buried residues (e.g., being part of peptides) fluoresce at about 330 nm (Lakowicz, 1983). The maximum intensities in the peak-T region found in our bacterial cultures, presented an Ex/Em maximum at 280 nm / 335 nm, which is an indication of the release of aromatic amino-acids by bacteria in a more buried combined form (e.g., bound to peptides) rather than in a free form. That maximum matches with the fluorescence maximum of the enzyme nuclease (Ex/Em 280 nm/334 nm, (Lakowicz, 1983). This exoenzyme could have been excreted by bacteria to hydrolyze DNA and consume their products (Paul et al., 1988). It differs from the protein-like substances excreted by phytoplankton since the maximum peak produced by three species of phytoplankton in that region was at Ex/Em 275 nm/358 nm (Romera-Castillo et al., 2010).
At the same time of our incubations, a control test with Blanes Bay seawater filtered through 0.2 μm and inoculated with the same bacterial community than we used to inoculate the treatments was performed. In this control test, bacteria produced protein-like substances with a longer emission maximum wavelength (358 nm) than those grown on phytoplankton exudates. This could mean either that bacteria release different products depending on what they consumed as resource or that specific bacterial types, which release protein fluorescing at these wavelengths, have been selected in the control
Production/consumption of CDOM by bacteria
73
treatment, due to the substrate conditions. The later hypothesis is supported by the fact that CARD-FISH analyses showed differences in bacterial community composition depending on the phytoplankton species that produced the exudates. Indeed, the bacterial community selected in the control test was different from the one developing in the treatments with phytoplankton exudates (i.e. no Bacteroidetes appeared until T5, data not shown).
Polypeptides are part of the dissolved combined amino acids (DCAA) pool and some authors have reported that protein and DCAAs are relatively more important as bacterial substrates than DFAAs (Coffin, 1989; Keil and Kirchman, 1999; Kroer et al., 1994; Rosenstock and Simon, 1993), although others reported DFAA to be the preferred substrate by bacteria (Keil and Kirchman, 1993). Using radiolabelled proteins to examine the relative significance of protein versus DFAAs as bacterial substrates, Kiel and Kirchman (1993) found that bacteria preferred proteins in the oligotrophic Sargasso Sea (Keil and Kirchman, 1999), but DFAAs in the eutrophic Delaware Bay (Keil and Kirchman, 1993). Since our treatments with phytoplankton exudates were performed in nutrient-rich conditions, bacteria could have used DFAA and released peptides. Moreover, nutrients were in very low concentrations in the control treatment, where the released protein-like substances presented its emission maximum at 358 nm, which is characteristic of a free tryptophan residue.
Production of humic-like substances: marine phytoplankton versus marine bacteria
Peak-M has traditionally been associated to the humic materials produced in situ in marine ecosystems since the EEMs of natural seawater samples usually present a fluorescence maximum in that region. In contrast, the EEMs of natural samples with a predominant terrestrial origin present a fluorescence maximum at peak-C, shifted to significantly longer excitation and emission wavelengths than peak-M (Coble et al., 1998). Therefore, in our culture experiments with marine bacteria growing on marine phytoplankton exudates, production of peak-M fluorescence should be expected. However, our study demonstrates that the main humic-like fluorophore produced by marine bacteria grown on marine phytoplankton exudates was peak-C.
Furthermore, our results show that marine phytoplankton is able to produce substances fluorescing at peak-M, which are consumed or transformed by marine bacteria that, in turn, produce other humic-like substances that fluoresce at peak-C, at significantly longer wavelengths. Any shift of a humic-like fluorescent emission maximum to longer wavelengths is an unequivocal indication of increased aromaticity and poly-condensation of humic materials (Chen et al., 2003). Therefore, attending to the position of both humic-like peak maxima, humic materials exuded by phytoplankton are more aliphatic (blue shifted) than the more aromatic humic materials produced by bacteria (red shifted). This does not necessarily mean that phytoplankton does not exude fluorescent substances in

Chapter II
74
Fig. 5. Excitation-emission matrices of the bacterial incubation grown in P. minimum exudates at a) initial time and subtracted EEMs between b) time at day 4 and initial time and c) final time and initial time of incubation.
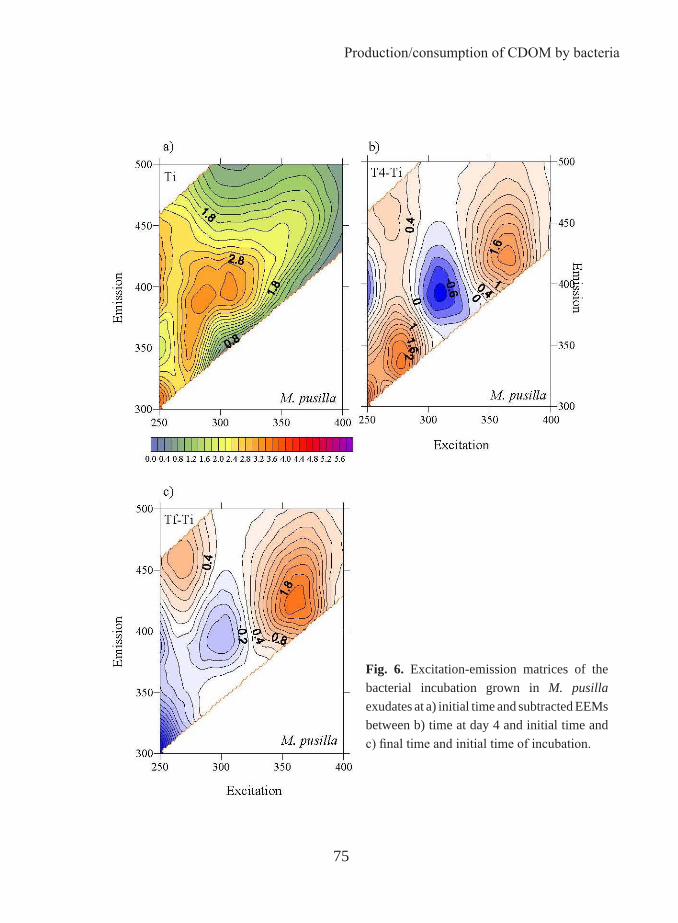
Production/consumption of CDOM by bacteria
75
Fig. 6. Excitation-emission matrices of the bacterial incubation grown in M. pusilla exudates at a) initial time and subtracted EEMs between b) time at day 4 and initial time and c) final time and initial time of incubation.

Chapter II
76
Table 2. Bacterial versus phytoplankton net production of fluorescent CDOM normalized to average biomass and incubation time during the exponential growth phase.
the Peak-C region; in fact, Romera-Castillo et al. (Romera-Castillo et al., 2010) reported the production of this peak by M. pusilla, although maximum production was observed in the peak-M region. Preferential consumption of peak-M by marine bacteria concurs with other studies that reported a higher bioavailability with increasing aliphatic carbon moieties in a compound (Moran and Hodson, 1990; Sun et al., 1997).
Considering our results, we could hypothesise that the more aliphatic humic-like substances that fluoresce at peak-M are mostly produced as a by-product of the eukaryotes metabolism. Conversely, the more aromatic substances fluorescing at peak-C could be associated to prokaryotes by-products. This hypothesis is also supported by the evidence that copepods exude humic-like substances that fluoresce at peak-M (Urban-Rich et al., 2006) and that a strong signal in the peak-C region was found in cultures of Synechoccocus and Procloroccocus (data not shown). Furthermore, it has been reported that FDOM intensity at peak-M is higher in the euphotic zone (Coble, 1996), where phyto and microzooplankton are also abundant, and decreases with depth. However, the intensity of peak-C- increases with depth (Coble, 1996) and it is widely known that organic matter transformations in the twilight zone are dominated by bacterial activity which could generate higher fluorescence at this peak.
In general, the production of peaks T and C normalized to the bacterial biomass, during the exponential growth phase was about one order of magnitude higher for marine bacteria than for marine phytoplankton. This fact could explain the lack of correlation between chlorophyll and CDOM that some authors have reported (Nelson et al., 1998; Rochelle-Newall and Fisher, 2002), which they attributed to the in situ production of CDOM by bacteria concluding that phytoplankton was not a direct source of
BB fromTi-T4
ΔDOC/ (BB·t)(µg C µg C-1 d-1)
Δpeak-T/ (BB·t)(QSU µg C-1 L d-1)
Δpeak-M/ (BB·t)(QSU µg C-1 L d-1)
Δpeak-C/ (BB·t)(QSU µg C-1 L d-1)
Bacteria grown on Chaetoceros sp. 38.2 ± 0.8 -11.3 ± 0.4 5 ± 5 x 10⁻⁴ -11 ± 3 x 10⁻⁴ 61 ± 2 x 10⁻⁴
S. costatum 30.7 ± 1.0 -15.77 ± 0.08 34 ± 7 x 10⁻⁴ -117 ± 4 x 10⁻⁴ 15 ± 2 x 10⁻⁴
P. minimum 31.4 ± 1.6 -11.8 ± 0.2 84 ± 8 x 10⁻⁴ 9 ± 3 x 10⁻⁴ 34 ± 3 x 10⁻⁴
M. pusilla 34.1 ± 0.8 -9.9 ± 0.1 164 ± 19 x 10-4 -21 ± 3 x 10⁻⁴ 63 ± 2 x 10⁻⁴
Production byChaetoceros sp. 116 ± 11 x 10-3 9.1 ± 0.8 x 10⁻⁴ 4.8 ± 0.1 x 10⁻⁴ 2.4 ± 0.05 x 10⁻⁴
S. costatum 93 ± 13 x 10-3 5.8 ± 0.1 x 10⁻⁴ 4.5 ± 0.1 x 10⁻⁴ 1.3 ± x 0.02 10-4
P. minimum 97 ± 9 x 10⁻³ 3.2 ± 0.2 x 10⁻⁴ 1.3 ± 0.03 x 10⁻⁴ 0.8 ± 0.04 x 10⁻⁴
M. pusilla 86 ± 5 x 10⁻³ 2.6 ± 0.02 x 10⁻⁴ 3.0 ± 0.1 x 10⁻⁴ 1.7 ± x 0.02 10-4
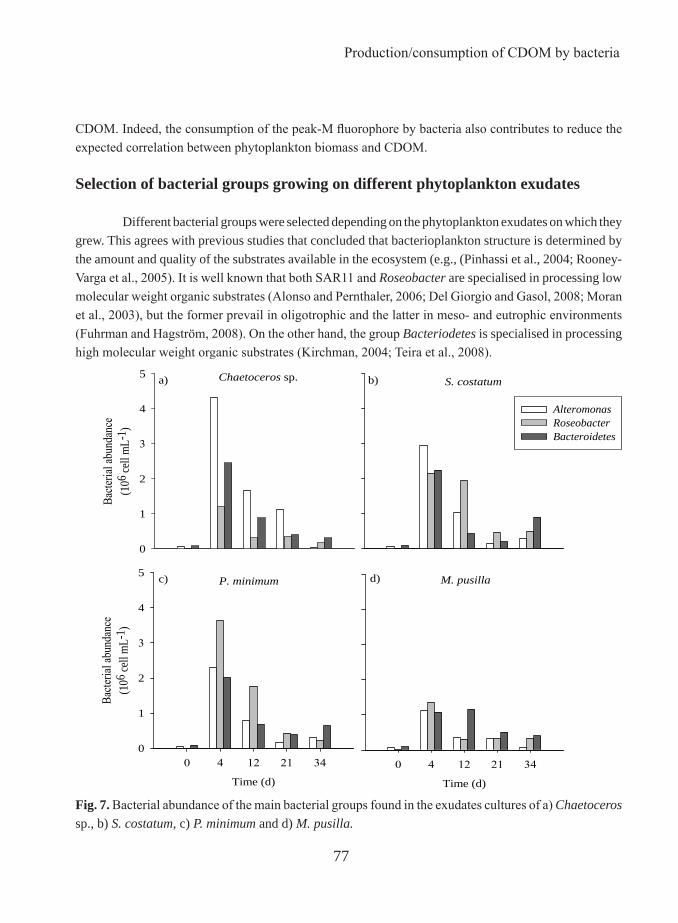
Production/consumption of CDOM by bacteria
77
CDOM. Indeed, the consumption of the peak-M fluorophore by bacteria also contributes to reduce the expected correlation between phytoplankton biomass and CDOM.
Selection of bacterial groups growing on different phytoplankton exudates
Different bacterial groups were selected depending on the phytoplankton exudates on which they grew. This agrees with previous studies that concluded that bacterioplankton structure is determined by the amount and quality of the substrates available in the ecosystem (e.g., (Pinhassi et al., 2004; Rooney-Varga et al., 2005). It is well known that both SAR11 and Roseobacter are specialised in processing low molecular weight organic substrates (Alonso and Pernthaler, 2006; Del Giorgio and Gasol, 2008; Moran et al., 2003), but the former prevail in oligotrophic and the latter in meso- and eutrophic environments (Fuhrman and Hagström, 2008). On the other hand, the group Bacteriodetes is specialised in processing high molecular weight organic substrates (Kirchman, 2004; Teira et al., 2008).
Fig. 7. Bacterial abundance of the main bacterial groups found in the exudates cultures of a) Chaetoceros sp., b) S. costatum, c) P. minimum and d) M. pusilla.
Chaetoceros sp.
Bacte
rial a
bund
ance
(106
cell
mL-
1 )
0
1
2
3
4
5S. costatum
P. minimum
Time (d)
0 4 12 21 34
Bacte
rial a
bund
ance
(106
cell
mL-
1 )
0
1
2
3
4
5M. pusilla
Time (d)
0 4 12 21 34
a) b)
c) d)
AlteromonasRoseobacterBacteroidetes

Chapter II
78
With these general considerations in mind, it can be straightforwardly explained why SAR11, which was present in the natural bacterial community of the (oligotrophic) Blanes Bay Observatory water that we used as inoculum, was not selected in any of our (eutrophic) cultures. The fact that after 4 days of incubation the highest cells numbers corresponded to the group Alteromonas grown on Chaetoceros sp. exudates could be the result of the production, by this diatom species, of a specific substrate, in which Alteromonas is specialised. Sarmento and Gasol (unpublished results), in short time (24h) incubations, have also found that the DOC from Chaetoceros sp. exudates was a highly bioavailable substrate and that Alteromonas was again the bacterial group preferentially selected. Even if Schäfer et al. (Schäfer et al., 2002) did not find Gammaproteobacteria in 6 mono-algal diatom non-axenic cultures, our work indicates that this class can also be associated with diatoms.
We did not observe significant correlations between humic-like peaks and bacterial numbers probably due to some factors: 1) humic-like peaks seem to present a different behaviour depending on the bacterial growth phase; 2) sometimes peak-M and peak-C tailings are overlapped to each others making the distinction between both peaks difficult. Therefore, if these correlations are hardly observed in lab experiments in a natural system these observations will be very difficult to see.
However, we observed a significant linear correlation between peak-T and bacterial biomass (R2 = 0.80, p < 0.001, n = 20) when data from all times and all cultures are plotted together. Also the abundances of the bacterial groups Roseobacter, Alteromonas and Bacteroidetes cell numbers were significantly and positively correlated with the fluorescence intensity of peak-T: (R2 > 0.6 p < 0.01, n = 20) although this correlation could be due to the good relationship between these bacterial groups and total bacterial biomass. This correlation had previously been observed in the Ría de Vigo (Teira et al., 2009) and could be indicative of the excretion of protein materials by bacteria.
Suzuki et al (Suzuki et al., 2001) found that the growth of members of the Flavobacteriaceae (subgroup of Bacteroidetes) was not affected when inorganic nitrogen was excluded from the medium. These authors suggested this observation to indicate that these bacteria could utilize amino acids as sole nitrogen source. Others studies reported that this group of bacteria notably grow when abundant amounts of dissolved proteins are available (Cottrell and Kirchman, 2000; Pinhassi et al., 1999). In our experiment, the negative correlation found between Δpeak-T and ΔBacteroidetes during the exponential phase supports this observation. Moreover, in the M. pusilla exudates, the largest amount of protein-like substances was produced during the exponential bacterial growth phase (Table 2, Fig. 2d). These protein-like substances were likely in the form of proteins rather than as free amino acids according to the shift of peak-T observed in the EEM (Fig. 5b). This could also explain the dominance of Bacteroidetes after T12 in the sample grown on M. Pusilla exudates.
Even if the fact that the phytoplankton exudates influence bacterial community composition in
Production/consumption of CDOM by bacteria
79
each treatment is observable from our results, the association of each bacterial group with a particular fluorescent humic-like peak is not clear. More studies are needed to asses it but from our results it could be suggested that the production of humic-like fluorescent material is a by-product of bacteria metabolism in general and not due to the activity of particular bacterial group(s).
Conclusions
Marine phytoplankton exudates contain fluorescent CDOM that is bioavailable to bacterial degradation. These exudates contain aliphatic blue-shifted fluorescent humic-like substances (P. Coble’s peak-M) that are readily taken up by marine bacteria that, in turn, exude aromatic red-shifted humic-like substances (P. Coble’s peak-C) during both the exponential and stationary growth phases. Based on this and previous results by other authors, we hypothesize that peak-M could be a by-product preferentially associated to catabolism of marine eukaryotic cells, whereas peak-C could be associated to catabolism by marine prokaryotes.
Marine bacteria produced humic- and protein-like substances an order of magnitude faster than phytoplankton when normalized to their respective biomasses. This fact, together with the photo degradability of aromatic compounds, is likely the reason behind the lack of correlation observed between phytoplankton biomass and CDOM in both, in situ measurements and satellite-derived estimates.
Although the type of algal species from which the exudates came from did not influence bacterial growth, the exudates influenced bacterial community structure by preferentially selecting bacterial groups with contrasting substrate preferences, such as Altermonas, Roseobacter or Bacterioidetes.
Acknowledgements
This work was supported by project SUMMER, grant number CTM2008–03309/MAR, C.R.-C. was funded by a I3P-CSIC predoctoral fellowship within the project MODIVUS, CTM2005-04795/MAR and H.S. benefited from fellowships from the Spanish ‘Ministerio de Educación y Ciencia’ (SB2006-0060 and JCI-2008-2727) and Portuguese ‘Fundação para a Ciência e a Tecnologia’ (FRH/BPD/34041/2006).
Chapter II
80
References
Alonso, C., Pernthaler, J., 2006. Roseobacter and SAR11 dominate microbial glucose uptake in coastal North Sea waters. Environ. Microbiol. 8, 2022-2030.
Arrigo, K.R., Brown, C.W., 1996. Impact of chromophoric dissolved organic matter on UV inhibition of primary productivity in the sea. Mar. Ecol. Prog. Ser. 140, 207-216.
Benner, R. 2003. Molecular indicators of the Bioavailability of Dissolved Organic Matter. In: Findlay, S., Sinsabaugh, R. (Eds.), Aquatic Ecosystems: Interactivity of Dissolved Organic Matter. Academic Press, New York, p.121-137.
Bussmann, I., 1999. Bacterial utilization of humic substances from the Arctic Ocean. Aquat. Microb. Ecol. 19, 37-45.
Cammack, W.K.L., Kalff, J., Prairie, Y.T., Smith, E.M., 2004. Fluorescent Dissolved Organic Matter in Lakes: Relationships with Heterotrophic Metabolism. Limnol. Oceanogr. 49, 2034-2045.
Coble, P.G. 1996. Characterization of marine and terrestrial DOM in seawater using excitation-emission matrix spectroscopy. Mar. Chem. 51, 325-346.
Coble, P.G., Del Castillo, C.E., Avril, B., 1998. Distribution and optical properties of CDOM in the Arabian Sea during the 1995 Southwest Monsoon. Deep-Sea Res. II 45, 2195-2223.
Coffin, R.B., 1989. Bacterial Uptake of Dissolved Free and Combined Amino Acids in Estuarine Waters. Limnol. and Oceanogr. 34, 531-542.
Cottrell, M.T., Kirchman, D.L., 2000. Natural Assemblages of Marine Proteobacteria and Members of the Cytophaga-Flavobacter Cluster Consuming Low- and High-Molecular-Weight Dissolved Organic Matter. Appl. Environ. Microbiol. 66, 1692-1697.
Chen, J., LeBoeuf, E.J., Dai, S., Gu, B., 2003. Fluorescence spectroscopic studies of natural organic matter fractions. Chemosphere 50, 639-647.
Chen, R.F., Bada, J.L., 1992. The fluorescence of dissolved organic matter in seawater. Mar Chem 37, 191-221.

Production/consumption of CDOM by bacteria
81
Del Giorgio, P.A., Gasol, J.M., 2008. Physiological structure and single-cell activity in marine bacterioplankton. In: Kirchman, D.L. (Ed.), Microbial ecology of the oceans, 2nd ed. Wiley-Blackwell p. 243–285.
Fein, J.B., Boily, J.-F., Güçlü, K., Kaulbach, E., 1999. Experimental study of humic acid adsorption onto bacteria and Al-oxide mineral surfaces. Chem. Geol. 162, 33-45.
Fuhrman, J.A., Hagström, Å., 2008. Bacterial and archaeal community structure and its patterns. In: Kirchman, D.L. (Ed.), Microbial Ecology of the Oceans. Wiley, p. 45-90.
Gasol, J.M., Del Giorgio, P.A., 2000. Using flow cytometry for counting natural planktonic bacteria and understanding the structure of planktonic bacterial communities. Scientia Marina 64, 197.
Häder, D.-P., Sinha, R.P., 2005. Solar ultraviolet radiation-induced DNA damage in aquatic organisms: Potential environmental impact. Mutation Research 571, 221–233.
Herndl, G.J., Muller-Niklas, G., Frick, J., 1993. Major role of ultraviolet-B in controlling bacterioplankton growth in the surface layer of the ocean. Nature 361, 717-719.
Hunt, A.P., Parry, J.D., Hamilton-Taylor, J., 2000. Further Evidence of Elemental Composition as an Indicator of the Bioavailability of Humic Substances to Bacteria. Limnol. Oceanogr. 45, 237-241.
Jiao, N., Herndl, G.J., Hansell, D.A., Benner, R., Kattner, G., Wilhelm, S.W., Kirchman, D.L., Weinbauer, M.G., Luo, T., Chen, F., Azam, F., 2010. Microbial production of recalcitrant dissolved organic matter: long-term carbon storage in the global ocean. Nat. Rev. Micro. 8, 593-599.
Kawasaki, N., Benner, R., 2006. Bacterial release of dissolved organic matter during cell growth and decline: Molecular origin and composition. Limnol. Oceanogr 51, 2170-2180.
Keil, R.G., Kirchman, D.L., 1993. Dissolved Combined Amino Acids: Chemical Form and Utilization by Marine Bacteria. Limnol. Oceanogr. 38, 1256-1270.
Keil, R.G., Kirchman, D.L., 1999. Utilization of dissolved protein and amino acids in the northern Sargasso Sea. Aquat. Microb. Ecol. 18, 293-300.
Kirchman, D.L., 2004. A primer on dissolved organic material and heterotrophic prokaryotes in the oceans. In: Follows, M., Oguz, T. (Ed.), The Ocean Carbon Cycle and Climate, NATO Science

Chapter II
82
Series. Academic Publishers, Dordrecht, the Netherlands: Kluwer, p. 31-66.
Kroer, N.S., Jorgensen, N.O.G., Coffin, R.B., 1994. Utilization of Dissolved Nitrogen by Heterotrophic Bacterioplankton: a Comparison of Three Ecosystems. Appl. Environ. Microbiol. 60, 4116-4123.
Lakowicz, J.R., 1983. Principles of fluorescence spectroscopy. Plenum Press.
Lønborg, C., Alvarez-Salgado, X.A., Martinez-Garcia, S., Miller, A.E.J., Teira, E., 2010. Stoichiometry of dissolved organic matter and the kinetics of its microbial degradation in a coastal upwelling system. Aquat. Microb. Ecol. 58,117-126.
Manz, W., Amann, R., Ludwig, W., Wagner, M., Schleifer, K.H., 1992. Phylogenetic oligodeoxynucleotide probes for the major subclasses of Proteobacteria —problems and solutions. Syst. Appl. Microbiol. 15, 593–600.
Midorikawa, T., Tanoue, E., 1998. Molecular masses and chromophoric properties of dissolved organic ligands for copper(II) in oceanic water. Mar. Chem. 62, 219-239.
Moran, M.A., Hodson, R.E., 1990. Bacterial Production on Humic and Nonhumic Components of Dissolved Organic Carbon. Limnol. Oceanogr. 35, 1744-1756.
Moran, M.A., Sheldon, W.M., Zepp, R.G., 2000. Carbon Loss and Optical Property Changes during Long-Term Photochemical and Biological Degradation of Estuarine Dissolved Organic Matter. Limnol. Oceanogr. 45, 1254-1264.
Moran, M.A., González, J.M., Kiene, R.P. 2003. Linking a Bacterial Taxon to Sulfur Cycling in the Sea: Studies of the Marine Roseobacter Group. Geomicrob. J. 20, 375 – 388.
Myklestad, S.M., 2000. Dissolved Organic Carbon from Phytoplankton. In: Wangersky, P. (Ed.), The Handbook of Environmental Chemistry, vol. 5. Part D. Marine Chemistry. Springer-Verlag, Berlin Heidelberg, p.111-148.
Nelson, N.B., Siegel, D.A., Michaels, A.F., 1998. Seasonal dynamics of colored dissolved material in the Sargasso Sea. Deep Sea Res. I 45, 931-957.
Nieto-Cid, M., Álvarez-Salgado, X.A., Pérez, F.F., 2006. Microbial and photochemical reactivity of fluorescent dissolved organic matter in a coastal upwelling system. Limnol. Oceanogr. 51, 1391-1400.

Production/consumption of CDOM by bacteria
83
Norland, S., 1993. The relationship between biomass and volume of bacteria. In: Kemp, P., Sherr, B.F., Sherr, E.B., Cole, J.J. (Ed.), Handbook of methods in aquatic microbial ecology. Lewis Publishing, p. 303–307.
Obernosterer, I., Herndl, G.J., 1995. Phytoplankton extracellular release and bacterial growth: dependence on the inorganic N: P ratio. Mar. Ecol. Progr. Ser. 116, 247-257.
Ortega-Retuerta, E., Reche, I., Pulido-Villena, E., Agustí, S., Duarte, C.M., 2010. Distribution and photoreactivity of chromophoric dissolved organic matter in the Antarctic Peninsula (Southern Ocean). Mar. Chem. 118, 129-139.
Paul, J.H., DeFlaun, M.F., Jeffrey, W.H., 1988. Mechanisms of DNA Utilization by Estuarine Microbial Populations. Appl. Environ. Microbiol. 54:1682-1688.
Pernthaler, A., Pernthaler, J., Amann, R., 2004. Sensitive multi-color fluorescence in situ hybridization for the identification of environmental microorganisms. In: Kowalchuk, G.A., Bruijn, F.J.d., Head, I.M., Akkermans, A.D., van Elsas, J.D. (Ed.), Molecular Microbial Ecology Manual, second ed, vol. 3.11. Springer, p. 711-726.
Pinhassi, J., Azam, F., Hemphälä, J., Long, R.A., Martinez, J., Zweifel, U.L., Ake, H., 1999. Coupling between bacterioplankton species composition, population dynamics, and organic matter degradation. Aquat. Microb. Ecol. 17, 13-26.
Pinhassi, J., Sala, M.M., Havskum, H., Peters, F., Guadayol, O., Malits, A., Marrase C., 2004. Changes in Bacterioplankton Composition under Different Phytoplankton Regimens. Appl. Environ. Microbiol. 70, 6753-6766.
Puddu, A., Zoppini, A., Fazi, S., Rosati, M., Amalfitano, S., Magaletti, E., 2003. Bacterial uptake of DOM released from P-limited phytoplankton. FEMS Microbiol. Ecol. 46, 257-268.
Rochelle-Newall, E.J., Fisher, T.R., 2002. Production of chromophoric dissolved organic matter fluorescence in marine and estuarine environments: an investigation into the role of phytoplankton. Mar. Chem. 77, 7 -21.
Romera-Castillo, C., Sarmento, H., Álvarez-Salgado, A.X., Gasol, J.M., Marrasé, C., 2010. Production of chromophoric dissolved organic matter by marine phytoplankton. Limnol. Oceanogr. 55, 446–454.
Chapter II
84
Romera-Castillo, C., Nieto-Cid, M., Castro, C.G., Marrasé, C., Largier, J., Barton, E.D., Álvarez-Salgado, A.X., 2011. Fluorescence: absorption coefficient ratio - tracing photochemical and microbial degradation processes affecting coloured dissolved organic matter in a coastal system. Mar. Chem.
Rooney-Varga, J.N., Giewat, M.W., Savin, M.C., Sood, S., LeGresley, M., Martin, J. L., 2005. Links between phytoplankton and bacterial community dynamics in a coastal marine environment. Microb. Ecol. 49 49, 163-175.
Rosenstock, B., Simon, M., 1993. Use of Dissolved Combined and Free Amino Acids by Planktonic Bacteria in Lake Constance. Limnol. Oceanogr. 38, 1521-1531.
Rosenstock, B., Zwisler, W., Simon, M., 2005. Bacterial Consumption of Humic and Non-Humic Low and High Molecular Weight DOM and the Effect of Solar Irradiation on the Turnover of Labile DOM in the Southern Ocean. Microb. Ecol. 50, 90-101.
Schäfer, H., Abbas, B., Witte, H., Muyzer, G., 2002. Genetic diversity of ‘satellite’ bacteria present in cultures of marine diatoms. FEMS Microbiol. Ecol. 42, 25-35.
Shimotori, K., Omori, Y., Hama, T., 2009. Bacterial production of marine humic-like fluorescent dissolved organic matter and its biogeochemical importance. Aquat. Microb. Ecol. 58, 55-66.
Siegel, D.A., Maritorena, S., Nelson, N.B., 2002. Global distribution and dynamics of colored dissolved and detrital organic materials. J. Geophys. Res. 107, 3228.
Simon, M., Azam, F., 1989. Protein content and protein sintesis rates of planktonic marine bacteria. Mar. Ecol. Prog. Ser. 51, 201–213.
Sokal, F.F., Rohlf, F. J., 1984. Introduction to biostatistics. W. H. Freeman.
Sun, L., Perdue, E.M., Meyer, J.L., Weis, J., 1997. Use of Elemental Composition to Predict Bioavailability of Dissolved Organic Matter in a Georgia River. Use of Elemental Limnol. Oceanogr. 42, 714-721.
Sundh, I., 1992. Biochemical Composition of Dissolved Organic Carbon Derived from Phytoplankton and Used by Heterotrophic Bacteria. Appl. Environ. Microbiol. 58, 2938-2947.
Sundh, I., Bell, R.T., 1992. Extracellular dissolved organic carbon released from phytoplankton as a

Production/consumption of CDOM by bacteria
85
source of carbon for heterotrophic bacteria in lakes of different humic content.Hydrobiologia 229, 93-106.
Suzuki, M.T., Preston, C.M., Chavez, F.P., DeLong, E.F., 2001. Quantitative mapping of bacterioplankton populations in seawater: field tests across an upwelling plume in Monterey Bay. Aquat. Microb. Ecol. 24,117-127.
Teira, E., Gasol, J.M., Aranguren-Gassis, M., Fernández, A., González, J., Lekunberri, I., Álvarez-Salgado, X.A., 2008. Linkages between bacterioplankton community composition, heterotrophic carbon cycling and environmental conditions in a highly dynamic coastal ecosystem. Environ. Microbiol. 10, 906-917.
Teira, E., Nieto-Cid, M., Álvarez-Salgado, X.A., 2009. Bacterial community composition and colored dissolved organic matter in a coastal upwelling ecosystem. Aquat. Microb. Ecol. 55, 131-142.
Urban-Rich, J., McCarty, J.T., Fernández, D., Acuña, J.L., 2006. Larvaceans and copepods excrete fluorescent dissolved organic matter (FDOM). J. Exp. Mar. Biol. Ecol. 332, 96- 105.
Yamashita, Y., Tanoue, E., 2008. Production of bio-refractory fluorescent dissolved organic matter in the ocean interior. Nature Geosci. 1, 579-582.


Chapter III:
Optical properties of ultrafiltered dissolved organic matter (UDOM) from contrasting aquatic environments and their alteration by sunlight

88
Chapter III
Co-authors:
M. Nieto-Cid, C. Marrasé, D.J. Repeta and X.A. Álvarez-Salgado

89
Optical properties of UDOM and photochemistry
Abstract
We have determined the absorption and induced fluorescence spectra of natural dissolved organic matter isolated by tangential flow filtration (1 KDa cut off) from estuarine, interstitial, coastal, enclosed sea and open ocean waters. Absorption coefficients at fixed wavelengths, absorption spectral slopes over different wavelength ranges, fluorescence intensities at the Ex/Em wavelengths of protein- and humic-like fluorophores, and the fluorescence quantum yield at 340 nm have been used as simple, fast and inexpensive proxies to the chemical structure of the isolated materials. They showed that the average molecular weight and aromaticity of the materials decreased significantly from estuarine > coastal > enclose sea > open ocean waters and increased significantly with depth; a pattern that can be explained on basis of the continental or marine origin of the samples and their exposure to natural radiation. Exposition of the isolates to sunlight revealed that the absorption and fluorescence emission intensities decreased at wavelengths > 300 nm due to the photobleaching of the humic-like fluorophores. On the contrary, they increased at wavelengths < 300 nm probably due to conformational changes in the humic substances containing bound proteins, which give rise to change in the resonance energy transfer among amino acids residues.

90
Chapter III
91
Optical properties of UDOM and photochemistry
Introduction
Oceanic dissolved organic matter (DOM) is one of the largest and most dynamic reservoirs of reduced carbon on Earth; the global dissolved organic carbon pool is estimated to be 662 Pg C (Hansell et al., 2009), comparable to the carbon stock of terrestrial biomass, 600 Pg C, or the CO2 accumulated in the atmosphere, 720 Pg C (Hedges et al., 1992). Therefore, minor changes in the DOM pool could considerably impact atmospheric CO2 concentrations and the radiation balance on Earth (Hedges et al., 2002; Peltier et al., 2007). Despite its importance in global change and ocean biogeochemical cycles, the chemical composition and structure of less than 10% of the constituents of the DOM pool are currently known (Benner, 2002).
Molecular and structural characterisation of marine DOM requires isolation of the material from seawater and enrichment to higher concentrations. The heterogeneity of the DOM pool, which covers a broad range of chemical affinities and molecular weights, makes difficult a quantitative and representative extraction with the conventional methods of solid phase extraction (SPE) and ultrafiltration (UF). On the one hand, SPE Amberlite XAD resins and C18 phases separate on basis of the polarity of the substances, retaining the more hydrophobic components that hardly represent more than 1/3 of the bulk DOM (Mopper et al., 2007; Guo and Sun, 2009; Perdue and Benner, 2009). Other sorbents recently used in SPE methods are the commercially pre-packed chemically modified hydrophilic styrene divinyl benzene polymers, particularly PPL, which are able to recover up to about 2/3 of the DOM pool (Dittmar et al., 2008). However SPE methods require low pH and/or the elution with organic solvents, which could alter the structure and composition of the isolated material, specifically resulting in significantly altered optical properties (Green and Blough, 1994). On the other hand, UF techniques separate the DOM components based upon size, even though the material (hydrophilic or hydrophobic) of the membrane, the operation conditions (filtration pressure, concentration factor) and the matrix effects (e. g., ionic strength and pH) influences the efficiency of the method (Benner 2002; Perdue and Benner, 2009). UF has the additional advantages of processing large volumes of seawater allowing the isolation of hundreds of milligrams of material and it is thought to yield DOM extracts that are more representative of the original material (Mopper, 1996). Molecular weight cut-off ranges for UF membranes used to isolate DOM are typically 1 to 3 KDa and efficiencies range from 20 to 99% of the total DOM in a whole water sample (McCarthy et al., 1996; Benner et al., 1997; Burdige and Gardner, 1998; Everett et al., 1999; Hedges et al., 2000; Kaiser et al., 2003; Kaiser et al., 2004; Kaiser and Sulzberger, 2004). Five to 35% of DOC in seawater is in the form of HMW-DOM (>1KDa) and from 10 to 40% of the DOC in seawater can be isolated and concentrated with these membranes (Benner et al., 1997; Mopper et al., 2007). Finally, more recently, reverse osmosis linked to pulse electro-dialysis (RO/ED) has successfully isolated >60% of water and salt-free unbiased marine DOM (Gurtler et al., 2008).

92
Chapter III
The high molecular weight fraction of DOM (HMW-DOM) includes materials that are able to absorb the UV and visible radiation and to re-emit it as fluorescent light (Engelhaupt et al., 2003; Mopper et al., 1996; Thurman, 1985; Wheeler, 1976). Optical characterisation of the coloured (CDOM) and induced fluorescent (FDOM) fractions of ultrafiltered DOM (UDOM) by absorption and induced fluorescence spectroscopy do not provide specific information about the molecular components of DOM as the state-of-the-art high resolution molecular magnetic resonance or mass spectroscopy techniques (Mopper et al., 2007). However, they are reliable probes for the changes in average molecular weight and aromaticity experienced by the DOM pool as a consequence of photochemical and biological processes (Coble, 1996; Coble, 2007; Moran et al., 2000; Nieto-Cid et al., 2006; Stedmon and Markager, 2005). Absorption coefficients at particular wavelengths, absorption coefficient ratios and spectral slopes have been used as indicators for the molecular size and the conjugation of UDOM (Carder et al., 1989; Dahlén et al., 1996; Weishaar et al., 2003). Fluorescence excitation-emission matrices allow distinguishing between fluorophores characteristic of protein- and humic-like substances (Coble, 1996; 2007; Stedmon and Markager, 2005). The optical properties of the HMW can vary depending on the aquatic system. For instance, the humic-like substances in samples from freshwater; the highest fluorescence at around Ex/Em 350–360/453–466 (peak-C) was found in the HMW fraction (>1 kDa, Bezile and Guo 2006) but in a lower fraction (500 Da-1 kDa) in samples from an estuary (Huget et al. 2010). However, peak-M was found in the LMW fraction (< 500 Da) for estuarine samples (Huget et al. 2010). Moreover, indices combining the absorption and fluorescence properties of DOM, such as the fluorescence quantum yield, also provide relevant information on the chemical structure of these materials (Green and Blough, 1994; Romera-Castillo et al., 2011).
CDOM and FDOM produced from the decomposition of nonliving terrestrial plant material is
introduced in the oceans by rivers and streams (Sulzberger and Durisch-Kaiser, 2009) and, to a lesser extend, by rain water (Kieber et al., 2006). This terrestrial CDOM is relevant only in coastal areas affected by strong continental runoff. However, most of the CDOM in the oceans is produced in situ, mainly in the form of humic substances generated as a by-product of bacterial degradation processes (Chen and Bada, 1992; Stedmon and Markager, 2005; Nieto-Cid et al., 2006; Yamashita and Tanoue, 2008; Romera-Castillo et al., 2011). Production of CDOM by phytoplankton, zooplankton and krill has also been reported in some recent studies (Steinberg et al., 2004; Ortega-Retuerta et al., 2009; Romera-Castillo et al., 2010). Humic substances can also be produced in the surface ocean through complex photochemical reactions of photo-humification (Kieber et al., 1997). Conversely, photo-degradation by natural sunlight is able to break down CDOM into colourless organic substances, CO and CO2 (Mopper and Kieber, 1991; Moran and Zepp, 1997), producing dramatic losses of absorption and induced fluorescence (Skoog et al., 1996; Del Castillo et al., 1999; Moran et al., 2000; Nieto-Cid et al., 2006).
Absorption and fluorescence spectra of DOM isolated by cross–flow ultrafiltration from contrasting riverine, interstitial sediments, estuarine, coastal, enclosed and open ocean natural water

93
Optical properties of UDOM and photochemistry
samples will be examined in this study. An assortment of indices will be produced — including bulk and specific absorption and induced fluorescence coefficients and ratios at relevant wavelengths, spectral slopes and fluorescence quantum yields — to characterise the isolated materials and learn about their origin and the biogeochemical transformations that they experienced in the environment before been collected. In addition, the alteration produced by the natural sunlight on the optical properties of these materials will also be reported and discussed. The response of a natural bacterial community to UDOM irradiated samples will be examined in a companion paper.
Materials and Methods
Ultrafiltered dissolved organic matter (UDOM) samples
DOM was concentrated from natural waters collected in contrasting aquatic environments: riverine, estuarine, coastal, enclosed and open ocean sites. The riverine sample was taken in the Delaware River; estuarine samples were collected in Chesapeake Bay and West Neck Bay (Long Island, NY), being the latter from surface interstitial sediment waters; the coastal sample was from Woods Hole; and ocean samples from the enclosed Black Sea and the open Subtropical North Pacific at Hawaii. Black sea and Hawaii samples were collected at three and two depths, respectively (Table 1).
A large amount of water (> 300 L) was concentrated through a flow–cross ultra–filtration system, following the methodology described by Repeta et al. (2002). Briefly, samples were filtered through a Whatman GF/F and/or 0.2 µm polycarbonate capsule filter to remove particulate matter and the high molecular weight fraction concentrated (10-100 x) using a 1 nm spiral-wound filter (Amicon, Separation Engineering). UDOM concentrates were rendered largely salt-free by repeated dilution/concentration with ultrapure Milli-Q water. The remaining water was removed by lyophilization to yield a final product that was 15-38% carbon by weight (Table 1).
Approximately 0.6 mg of the dried concentrate was diluted in 0.2 μm filtered aged surface Sargasso Sea water (150 mL). Aliquots were taken for the analysis of the concentration of DOC, and the absorption and fluorescence excitation-emission spectra of DOM. The carbon content and optical properties of the aged Sargasso Sea water (control) were also determined.
DOC concentration of UDOM dissolved in aged Sargasso Sea water
Approximately 10 mL of water were collected in pre-combusted (450ºC, 12 h) glass ampoules for DOC analysis. H3PO4 was added to acidify the sample at pH < 2 and the ampoules were heat-sealed and

94
Chapter III
stored at 4ºC. DOC was measured with a Shimadzu TOC-CVS organic carbon analyser. The system was standardised daily with potassium hydrogen phthalate. The precision of the DOC measurements was ±0.01 mg L–1 of C. DOM reference materials provided by Prof. D. Hansell (Miami University) were analysed daily in order to test the performance of the analyser. We obtained average concentrations of 0.55 ± 0.02 mg L-1 of C for the deep ocean reference (Sargasso Sea deep water, 2600 m) minus blank reference materials. The nominal DOC value provided by the reference laboratory is 0.53 ± 0.02 mg L-1of C.
The concentrations of DOC (UDOC, in mg L-1 of C) and DOM (UDOM, in mg L-1) added to the aged surface Sargasso Sea water were calculated as:
(1)
(2)
where DOC and DOCSSW are the concentrations of DOC in the solution and in the aged surface Sargasso Sea water, respectively; and %C is the percentage of carbon in the dried UDOM as determined with a Perkin Elmer 2400 CHN analyser (Table 1). %C increases from 14.7% for the Delaware River to 37.8% for Chesapeake Bay. %N, also provided in Table 1, varied from 0.83% for the Delaware River to 2.7% for the Hawaii surface sample. The C/N ratio (w/w) of the dried UDOM samples ranged from 12 for Chesapeake Bay to 21 for the Black Sea surface sample and it was as low as 10 for West Neck Bay surface sediments. Initial DOC and salinity values of the ultrafiltered seawater samples are also reported in Table 1.
Optical properties of UDOM dissolved in aged Sargasso Sea water
Absorption spectra from 250 to 700 nm were recorded in a Varian Cary 50 Bio Spectrophotometer. Measurements were performed at constant room temperature (20ºC) in a 10cm quartz cell. MQ water was used as blank. The absorption coefficient at each wavelength, aCDOM(λ) (in m-1), was calculated as 23.03·Abs(λ), where Abs(λ) is the absorbance at wavelength λ. The aCDOM(λ) spectra divided by the concentration of UDOC, i.e. the C-specific absorption coefficient spectra, a*CDOM(λ), were fitted to the equation:
a*CDOM(λ) = a*CDOM(254)· exp [S·(λ – 254)] + K (3)
where a*CDOM(254) is the C-specific absorption coefficient at the reference wavelength of 254 nm (in m2 g–1 of C), also named as SUVA(254) in the literature (Weishaar et al., 2003); S is the spectral slope over the range 250–500 nm (in nm–1); and K is a background constant caused by fine size particles, micro air
C%UDOCUDOM
SSWDOCDOCUDOC
95
Optical properties of UDOM and photochemistry
bubbles or colloidal material present in the sample, refractive index differences between the sample and the reference, or attenuation not due to organic matter (in m2 g-1 of C). From a*CDOM(254) and S we also obtain (1) the absorption coefficient ratio at 254 nm and 365 nm, aCDOM(254/365); and (2) the C-specific absorption coefficient at 340 nm, a*CDOM(340), necessary for the subsequent calculation of fluorescence quantum yields (see below). Apart from the spectral slope over the range 250-500 nm, slopes over two narrower wavelength ranges, S(275-295) and S(350-400) were also calculated using linear regressions of the log-transformed C-specific absorption spectra following Helms et al., (2008).
Single excitation-emission (Ex/Em) fluorescence measurements were performed with a Photon Technology International (PTI) Model A1010 spectrofluorometer equipped with a double excitation monochromator, a single emission monochromator, and a cooled photomultiplier assembly. The slit widths were set to 4 nm. The specific Ex/Em wavelengths pairs were those established by Coble (1996): peak T or F(280/350), at Ex/Em 280/350, an indicator of protein-like substances; peak M or F(320/410), at Ex/Em 320/410, an indicator of marine humic-like substances; and peak C or F(340/440), at 340/440 nm, an indicator of terrestrial humic-like substances. Fluorescence measurements were expressed in quinine sulphate units (QSU) by calibrating the spectrofluorometer at Ex/Em 350 nm/450 nm against a quinine sulphate dihydrate (QS) standard in 0.1N sulphuric acid. A solution of sulphuric acid 0.1 N in Milli-Q water was used as a blank. The equivalent concentration of each peak was determined by subtracting the blank height from the average peak height, and dividing by the slope of the standard curve. Again, the fluorescence of the aged surface Sargasso Sea water was subtracted to the samples and the resulting values were divided by the concentration of UDOC, to obtain the corresponding C-specific induced fluorescence intensities.
Fluorescence excitation-emission matrices of the UDOM dissolved in aged surface Sargasso Sea water were performed with a Hitachi F-4500 Fluorescence Spectrophotometer equipped with a xenon discharge lamp. Slit widths were 5 nm for the excitation and emission wavelengths and scan speed 2400 nm/min. Measurements were performed at a constant room temperature of 20°C in a 1cm quartz fluorescence cell. Emission scans were recorded between 300 nm and 550 nm at 2 nm intervals for excitation wavelengths between 250 nm and 450 nm at 5 nm intervals. Factory-set excitation and emission corrections were used by the instrument. Rayleigh scatter was corrected by setting to zero any fluorescence value recorded at λem ≤ λex + 20 nm. Raman scatter was corrected by subtracting the EEM of the aged surface Sargasso Sea water that was used as a blank. Since the absorption coefficients of all samples at any wavelength were < 10 m-1, it was not necessary to correct for inner filters effects (Stedmon and Bro, 2008). Finally, the fluorescence units were converted into QSU and, then, divided by the concentration of UDOC to be expressed in C-specific fluorescence units, QSU mg C-1 L.
Finally, the quantum yield of fluorescence at excitation 340 nm, Φ(340), is the portion of the light absorbed by the UDOM solutions at 340 nm that is re-emitted as fluorescent light. Φ(340) of the
96
Chapter III
samples was determined following Romera-Castillo et al. (2011). It was calculated by comparison to the fluorescence emission between 400 and 600 nm from the quinine sulphate standard in 0.1 N H2SO4 using the equation:
(4)
Where aCDOM(340)QS is the absorption coefficients of the QS standard at 340 nm (in m-1); F(400-600) and F(400-600)QS are the average integrated fluorescence spectra between 400 and 600 nm at a fixed excitation wavelength of 340 nm (in QSU) of the sample and the QS standard, respectively; and Φ(340)QS is the dimensionless fluorescence quantum yield of the QS standard, 0.54 according to Melhuish (1961).
Figure 1a shows the relationship between F(400–600)QS and F(340/440)QS for the quinine sulphate standards and Figure 1b the same relationship for the UDOM samples. Given that F(400–600)QS and F(400–600) can be estimated from F(340/440)QS and F(340/440) using the dimensionless conversion factors obtained from the regressions showed in Figure 1 (0.71 ± 0.01 for QS and 0.94 ± 0.03 for the UDOM samples), the ratios F(400–600)QS/aCDOM(340)QS and F(400–600)/aCDOM(340) of eq. (4) can be obtained from the ratios F(340/440)QS/aCDOM(340)QS and F(340/440)/aCDOM(340) respectively. Therefore, eq. 4 can be rewritten as:
(5)
Where β = 4 10-3 is a dimensionless factor that accounts for the conversion of punctual into integrated fluorescence of the QS standards and the samples (Figures 1a & b) and for the F(340/440)QS/aCDOM(340)
QS factor of 329 ± 14 QSU m obtained from the regression in Figure 1c.
Photo-reactivity experiments
Four of the UDOM samples (Delaware River (DwR), Woods Hole (WHC) and Hawaii at surface and 600m (Hi0 and Hi600, respectively) were chosen to study their response to the exposure to natural sunlight attending to their contrasting origins (riverine, coastal, and surface and deep open ocean samples) and optical properties.
Approximately 16 mg of the dried concentrates were dissolved in 0.2 μm filtered aged surface Sargasso Sea water (4 L), to reach a UDOC concentration close to 1 mg L-1 of C. The resulting solutions were filtered again through a 0.2 μm membrane Millipore filter (GTTP). The 0.2 μm filtered aged surface Sargasso Sea water was used as a control.
QSQS
QSCDOM
CDOM
340·)006(400
(340)·
(340))006(400340Fa
aF
(340)
(340/440)101.02.2)340(
(340/440)340340CDOM
3
CDOMQS a
FaF

97
Optical properties of UDOM and photochemistry
Sam
ple
Dep
th(m
)La
titud
e(d
egre
e)Lo
ngitu
de(d
egre
e)D
OC
(mg
C ·
L-1)
Salin
ity%
C%
N
Bla
ck S
eaSu
rfac
e41
º 18.
25’–
42º 3
1.00
’ N29
º 05.
66’–
30º 3
0.00
’ EN
D18
.134
.93
1.66
Bla
ck S
ea90
m42
º 31.
00’ N
30º 4
3.53
’ EN
D20
.430
.57
2.34
Bla
ck S
ea75
041
º 24.
99’ N
29º 0
5.66
’ E
ND
22.2
35.7
92.
26H
awai
iSu
rfac
e19
º 43’
38.
48”
N15
6º 0
3’ 3
2.57
” W
0.
8435
.735
.43
2.79
Haw
aii
600
19º 4
3’ 3
8.48
” N
156º
03’
32.
57”
W
0.43
35.4
32.2
12.
53W
oods
Hol
eSu
rfac
e41
º 31’
50.
83”
N70
º 38’
43.
34”
W1.
2230
.732
.40
2.48
Che
sape
ake
Bay
Surf
ace
36º4
7’ N
75º5
1’ W
1.07
35.3
37.8
13.
23D
elaw
are
Riv
erSu
rfac
e39
º 37’
N75
º 33’
W2.
256
1.5
14.7
30.
83W
est N
eck
Bay
(NY
)Se
dim
ents
41º 0
4’ N
72º 2
1’ W
26
.4N
D22
.15
2.14
Tabl
e 1.
Geo
grap
hic
orig
in (p
ositi
on, d
epth
), sa
linity
and
dis
solv
ed o
rgan
ic c
arbo
n (D
OC
) con
cent
ratio
n of
the
orig
inal
sam
ples
and
el
emen
tal c
arbo
n (%
C)
and
nitro
gen
(%N
) pro
porti
ons o
f the
cor
resp
ondi
ng u
ltrafi
ltere
d m
ater
ials
.

98
Chapter III
Acid cleaned and combusted quartz flasks (500 mL) were filled in triplicate with each solution. The samples were exposed to natural sunlight in a water bath on the roof of a building of the Woods Hole Oceanographic Institution, MA, during 57 hours. Dark controls were placed in triplicate in wrapped quartz flask in the same bath. The average irradiation over the incubation period was 272 W m–2 (ranging from 0 to 900 W m–2) in the Martha’s Vineyard Coastal Observatory. Solar radiation is measured at the top of the meteorological mast at the shore laboratory using an Eppley Model PSP (Precision Spectral Pyranometer). The PSP uses a glass dome that uniformly transits radiation between 0.285 and 2.8 µm. A calibration factor is applied to provide the total solar irradiance in watts per square meter (http://mvcodata.whoi.edu/cgi–bin/mvco/mvco.cgi). Since the experiments were performed in April, there was not water recirculation or refrigeration in the bath. Ambient temperature ranged from 3.0 to 13.5ºC with a mean value of 7.8ºC. DOM absorbance and fluorescence and DOC concentrations were measured in the light and dark samples at the beginning (0 h) and end (57 h) of the incubation period.
F(340/440) (QSU)0 2 4 6 8 10 12
F(40
0-60
0) (Q
SU)
0
2
4
6
8
10
12
F(340/440)QS (QSU)0 10 20 30 40 50
F(40
0-60
0)Q
S(Q
SU)
0
5
10
15
20
25
30
35
Y = 0.94(±0.04) · XR2 = 0.985
Y = 0.71(±0.02) · XR2 = 0.997
aCDOM(340)QS (m-1)
0.00 0.02 0.04 0.06 0.08 0.10 0.12 0.14
F(34
0/44
0)Q
S (Q
SU)
0
10
20
30
40
50
Y = 329.41(±14.32) · XR2 = 0.988
a)
b)
c)
Figure 1. Linear correlation of a) average integrated fluorescence emission between 400 and 600 nm, F(400-600), versus the fluorescence emission at 440 nm, F(340/440), when excited at 340 nm for quinine sulphate; b) F(400-600) versus F(340/440) for the UDOM samples; c) F(340/440) versus absorption coefficient at 340 nm, aCDOM(340), for quinine sulphate.

99
Optical properties of UDOM and photochemistry
Results and Discussion
Optical characterisation of UDOM
Significant differences (p < 0.001) were observed in the C-specific absorption spectra of the materials characterised in this work (Figure 2). a*CDOM(254) decreased ocean-wards: river UDOM absorbs more short UV radiation than estuarine and coastal UDOM, and the latter more than UDOM from the surface ocean (Table 2). This 20-fold increase of a*CDOM(254) in Delaware river compared to the surface water off Hawaii is consistent with the high concentrations of CDOM transported by rivers, which originates from the decomposition of nonliving plant material and are introduced into aquatic systems via leaching and runoff (Sulzberger and Durisch-Kaiser, 2009). These are progressively diluted in estuarine, coastal and open ocean waters (Coble, 2007; Vodacek and Blough, 1997). Apart from the relevance of leaching for the colour of continental waters, the Delaware River sample was collected at the turbidity maximum zone (TMZ) of Delaware Bay that results from a combination of flocculation induced by gravitational circulation and tidal resuspension of bottom sediments (Biggs et al., 1983). Annual mean of salinity at the TMZ is about 5 pss throughout the year (Mannino and Harvey, 2004)
Wavelength (nm)
250 300 350 400 450 500 550 600
a*CD
OM
(m2 g
C-1)
0
1
2
3
4
5
6Black Sea 0mBlack Sea 90mBlack Sea 750mHawaii 0mHawaii 600mWoods HoleChesapeake BayDelaware RiverWest Neck Bay (NY)
Figure 2. C-specific absorption spectra of the UDOM samples normalised to DOC.

100
Chapter III
and, in addition, the sampling site is immediately downstream of Philadelphia, which is an area of substantial shipping, industrial, and urban activity (Albert, 1988). Regarding the estuarine and coastal samples, whereas the West Neck Bay (NY) collection site receives copious anthropogenic inputs, the Woods Hole and Chesapeake Bay sites can be considered pristine. a*CDOM(254) of the surface UDOM of the enclosed Black Sea was 4-fold than in the surface open Subtropical North Pacific at Hawaii. This is again owing to the surface Black sea receives important inputs of CDOM–rich continental waters from the surrounding lands and, conversely, the surface layer of the subtropical gyre of the North Pacific is an open ocean area not affected by continental waters. Since the UV-C radiation (200-280 nm) is absorbed by the ozone layer of the atmosphere and it is not produced naturally on the Earth surface, the value of a*CDOM(254) for the UDOM samples collected for this study should not be affected by the permanent exposure of surface ocean waters to the natural UV radiation.
By contrast, a*CDOM (340) was sensitive to the natural UV-A radiation (320-400 nm) on the Earth surface; it has been reported that UV-A radiation is more important for the photolysis of DOM molecules >1 KDa than UV-B radiation (Engelhaupt et al., 2003). For this reason, both the high levels of CDOM transported by rivers and its exposure to natural UV-A during mixing in estuaries, coasts, enclosed seas and open oceans, have to be claimed to explain the variability of a*CDOM(340) observed in Table 2 (Sulzberger and Durisch-Kaiser, 2009; Vodacek and Blough, 1997). Whereas a*CDOM(340) was about 40% of a*CDOM(254) in river, estuarine and coastal UDOM samples, it reduced to 20% of a*CDOM(254) in the permanently exposed to the natural UV-A surface waters of the Black Sea and the Subtropical North Pacific at Hawaii. The annual mean shortwave radiation in the western cyclonic gyre of the Black Sea is 148 Wm–2 (Schrum et al., 2001) whereas in Hawaii it is 230 W m–2 (Letelier et al., 2008). This, and the fact that Hawaii surface waters receive lower terrestrial inputs, could be the reasons why this UDOM sample presented the lowest a*CDOM(340) value.
a*CDOM(254) and a*CDOM(340) of UDOM in the ocean increased significantly with depth, both in the Black Sea and the Hawaii samples (Table 2), as a consequence of the production and accumulation of CDOM during bacterial degradation processes (Nelson et al., 2002; Yamashita and Tanoue, 2008; Swan et al., 2009). The Black Sea is a unique environment almost completely isolated from the World Ocean (Özsoy and Ünlüata, 1997). The three samples from this enclosed sea were from the western cyclonic gyre at depths characterised by contrasting optical and chemical conditions: (1) the surface layer sample is affected by natural UV radiation and it is well oxygenized; (2) the 90 m sample is residually affected by the UV radiation and it is within the sub–oxic layer, where oxygen concentration is low and nitrate is the primary electron acceptor; and (3) the 750 m sample was collected from the anoxic Black Sea, characterized by a complete lack of oxygen and a high concentration of hydrogen sulphide (Yakushev et al., 2005). Oxygen depletion in the suboxic and anoxic layers of the Black Sea as a result of the respiration of sinking organic matter during decades to centuries (Hay et al., 1990; Yakushev et al., 2005) is the reason behind the high a*CDOM(254) and a*CDOM(340) values in the dark
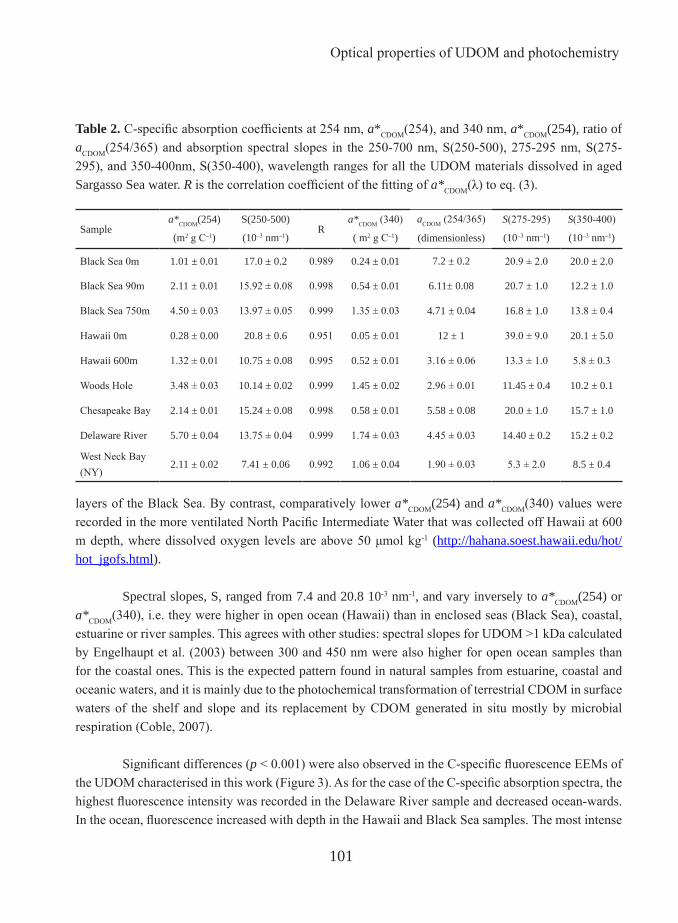
101
Optical properties of UDOM and photochemistry
layers of the Black Sea. By contrast, comparatively lower a*CDOM(254) and a*CDOM(340) values were recorded in the more ventilated North Pacific Intermediate Water that was collected off Hawaii at 600 m depth, where dissolved oxygen levels are above 50 μmol kg-1 (http://hahana.soest.hawaii.edu/hot/hot_jgofs.html).
Spectral slopes, S, ranged from 7.4 and 20.8 10-3 nm-1, and vary inversely to a*CDOM(254) or a*CDOM(340), i.e. they were higher in open ocean (Hawaii) than in enclosed seas (Black Sea), coastal, estuarine or river samples. This agrees with other studies: spectral slopes for UDOM >1 kDa calculated by Engelhaupt et al. (2003) between 300 and 450 nm were also higher for open ocean samples than for the coastal ones. This is the expected pattern found in natural samples from estuarine, coastal and oceanic waters, and it is mainly due to the photochemical transformation of terrestrial CDOM in surface waters of the shelf and slope and its replacement by CDOM generated in situ mostly by microbial respiration (Coble, 2007).
Significant differences (p < 0.001) were also observed in the C-specific fluorescence EEMs of the UDOM characterised in this work (Figure 3). As for the case of the C-specific absorption spectra, the highest fluorescence intensity was recorded in the Delaware River sample and decreased ocean-wards. In the ocean, fluorescence increased with depth in the Hawaii and Black Sea samples. The most intense
Samplea*CDOM(254) S(250-500)
Ra*CDOM (340) aCDOM (254/365) S(275-295) S(350-400)
(m2 g C–1) (10–3 nm–1) ( m2 g C–1) (dimensionless) (10–3 nm–1) (10–3 nm–1)
Black Sea 0m 1.01 ± 0.01 17.0 ± 0.2 0.989 0.24 ± 0.01 7.2 ± 0.2 20.9 ± 2.0 20.0 ± 2.0
Black Sea 90m 2.11 ± 0.01 15.92 ± 0.08 0.998 0.54 ± 0.01 6.11± 0.08 20.7 ± 1.0 12.2 ± 1.0
Black Sea 750m 4.50 ± 0.03 13.97 ± 0.05 0.999 1.35 ± 0.03 4.71 ± 0.04 16.8 ± 1.0 13.8 ± 0.4
Hawaii 0m 0.28 ± 0.00 20.8 ± 0.6 0.951 0.05 ± 0.01 12 ± 1 39.0 ± 9.0 20.1 ± 5.0
Hawaii 600m 1.32 ± 0.01 10.75 ± 0.08 0.995 0.52 ± 0.01 3.16 ± 0.06 13.3 ± 1.0 5.8 ± 0.3
Woods Hole 3.48 ± 0.03 10.14 ± 0.02 0.999 1.45 ± 0.02 2.96 ± 0.01 11.45 ± 0.4 10.2 ± 0.1
Chesapeake Bay 2.14 ± 0.01 15.24 ± 0.08 0.998 0.58 ± 0.01 5.58 ± 0.08 20.0 ± 1.0 15.7 ± 1.0
Delaware River 5.70 ± 0.04 13.75 ± 0.04 0.999 1.74 ± 0.03 4.45 ± 0.03 14.40 ± 0.2 15.2 ± 0.2
West Neck Bay (NY)
2.11 ± 0.02 7.41 ± 0.06 0.992 1.06 ± 0.04 1.90 ± 0.03 5.3 ± 2.0 8.5 ± 0.4
Table 2. C-specific absorption coefficients at 254 nm, a*CDOM(254), and 340 nm, a*CDOM(254), ratio of aCDOM(254/365) and absorption spectral slopes in the 250-700 nm, S(250-500), 275-295 nm, S(275-295), and 350-400nm, S(350-400), wavelength ranges for all the UDOM materials dissolved in aged Sargasso Sea water. R is the correlation coefficient of the fitting of a*CDOM(λ) to eq. (3).

102
Chapter III
emission signal in the EEMs of all UDOM samples was observed from 425 to 460 nm when excited at 250 nm. It corresponds to the peak-A defined by Coble (1996), which is characteristic of humic substances, either terrestrial or marine. As for the case of a*CDOM(254), the intensity of peak-A decreased in the order river > coastal > estuarine > surface ocean samples. The remarkable intensity of peak-A in the anoxic waters of the Black Sea at 750 m may results from the accumulation of humic material produced by aerobic bacterial respiration (Nieto-Cid et al., 2006; Yamashita and Tanoue, 2008).
The terrestrial and marine humic-like peaks C and M, were also easily detectable in all EEMs except in the surface ocean waters from Hawaii and the Black Sea, i.e. the samples that experienced a longer exposure time to the natural radiation. The protein-like peak-T is also present in almost all the UDOM samples. It was not significant in the Hawaii samples and it was very low in the Woods Hole one. In the Black Sea, the intensity of peak-T increased with depth. Table 3 summarized the C-specific fluorescence of peaks C and M and T (in QSU mg C-1 L). The humic-like fluorophores followed the same pattern than a*CDOM(340), i.e. they increased shore- and downwards. C-specific peak-T fluorescence in the Black Sea was twice at 750 m than at the surface layer and the lowest values, < 0.20 QSU mg C-1 L, were recorded in Hawaii. Finally, the largest C-specific peak-T values, > 0.95 QSU mg C-1 L, were recorded in the coastal and riverine samples.
The proportion of organic nitrogen in the dried materials (%N; Table 1) correlated positive and significantly (p < 0.05) with the salinity of the water samples from which they were isolated (Figure 4a). This agrees with the observations made by other authors who found evidences of a higher proportion of proteins in marine than in terrestrial UDOM samples (Repeta et al. 2002; Benner 2003). Higher values of C-specific protein-like peak-T fluorescence would be expected in samples with higher %N. However, the plot of these two variables shows three groups of samples (Figure 4b). The black dots shows the group formed by the West Neck Bay, the Chesapeake Bay and the three samples from the Black Sea, which follow the expected positive and significant (R2 = 0.91, p < 0.001) linear correlation between %N and peak-T. The Delaware River samples (grey dot) is characterised by higher than expected peak-T fluorescence. It could be explained by the presence of hydrocarbons derived from substantial shipping, industrial, and urban activities in the sample collection area, which also fluoresce in the peak-T region of the spectrum. Finally, the white dots shows a group formed by the Woods Hole and Hawaii samples, which are characterised by lower than expected peak-T fluorescence. This behaviour could be due to a lower proportion of fluorescent aromatic amino acids in the isolated protein material form of these samples and/or the relative position of the fluorescent residues in the protein and the presence of other moieties. The latter affects the resonance energy transfer among tryptophan residues (Lackowik, 2006) that could lead to relatively low peak-T fluorescence for a given proportion of proteins.

103
Optical properties of UDOM and photochemistry
250 300 350 400 450
300
350
400
450
500
550
Black Sea 0m
250 300 350 400 450
Black Sea 90m
250 300 350 400 450
300
350
400
450
500
550
Black Sea 750m
300
350
400
450
500
550
300
350
400
450
500
550
Woods HoleHawaii 600mHawaii surface
300
350
400
450
500
550
Cheasepeake Bay
250 300 350 400 450
Delaware River250 300 350 400 450
300
350
400
450
500
550
West Neck Bay
250 300 350 400 450300
350
400
450
500
550
300
350
400
450
500
550
Control
Excitation
Emiss
ion
Excitation
Emiss
ion
Emiss
ion
Emiss
ion
Excitation
Figure 3. Excitation-emission matrices of the UDOM samples normalized to DOC (in QSU L mg C-1).

104
Chapter III
Average molecular weight and aromaticity of the UDOM
The optical properties of UDOM provide useful information about some molecular characteristics of the samples such as the average molecular weight or the degree of aromaticity. a*CDOM(254) is commonly used to determine the relative abundance of aromatic C=C bonds in substituted benzenes or polyphenols and has been suggested as an index of the average number of rings and their condensation degree in natural DOM samples by Weishaar et al. (2003). These authors found a good correlation between a*CDOM(254) and the percentage of aromaticity determined by 13C–NMR spectroscopy. In our study, a*CDOM(254) indicated that aromaticity increased with depth and from open ocean to river samples (Table 2).
The absorption coefficient ratio aCDOM(254/365), commonly used in freshwater research as an optical index of the average molecular weight of DOM (Dahlén et al. 1996; Engelhaupt et al. 2003), decreased downwards both in the Black Sea and the Hawaii samples and was higher in the oceanic than in near shore and river samples (Table 2). Since the higher the aCDOM(254/365) ratio the lower the average molecular weight of DOM (Dahlén et al., 1996; Engelhaupt et al., 2003; Dalzell et al., 2009), our results support that humification processes either in continental drainage basins, estuaries, coasts, or
Salinity
0 10 20 30 40
Nitr
ogen
(%)
0.5
1.0
1.5
2.0
2.5
3.0
3.5
R2 = 0.88; p < 0.05
F(280/350) (QSU)
0.0 0.2 0.4 0.6N
itrog
en (%
)0.5
1.0
1.5
2.0
2.5
3.0
3.5
DwR
BS0
ChB
Hi0
Hi600WHC
BS90
WNBBS750
a) b)
Figure 4. Relationships between the nitrogen proportion in the UDOM isolates (%N) and a) the salinity of the samples and b) the protein-like fluorescence, F(280/350), of UDOM dissolved in aged Sargasso sea water. BS0, Black Sea surface; BS90, Black Sea 90 m; BS750, Black Sea 750 m; ChB, Chesapeake Bay; DwR, Delaware River; Hi0, Hawaii surface; Hi600, Hawaii 600 m; WHC, Woods Hole Coastal; WNB, West Neck Bay.

105
Optical properties of UDOM and photochemistry
ocean waters produce HMW-DOM. On the other hand, the increasing value of this ratio ocean-ward and upward suggests that low molecular weight DOM (LMW-DOM) compounds are more abundant in the surface and in the open ocean. This is likely due to the photo-degradation processes which break down HMW-DOM into LWM-DOM in surface waters.
More recently, Helms et al. (2008) have suggested the use of the short UV wave range spectral slope S(275–295) and the long UV wave range spectral slope S(350–400) as a proxy to the average molecular weight of DOM and its alteration by dark aerobic microbial processes and exposure to UV light. These authors reported that the ratio S(275–295)/S(350–400) is >1 for marine samples and the opposite trend holds for highly coloured, terrestrially dominated samples. The values of S(275–295) and S(350–400) for our UDOM samples showed this pattern (Table 2): S(275–295) is lower than S(350–400) only for the Delaware River and West Neck Bay samples, i.e. those containing elevated proportions of terrestrially derived highly aromatic DOM, either natural or anthropogenic.
To estimate the fluorescent quantum yield, Ф(340), the dimensionless factor β (= 4(± 0.1)·10-3) was calculated from all the UDOM samples. This conversion factor was not significantly different from that obtained with natural samples of the Ría de Vigo (Romera-Castillo et al., 2011). It suggests that the value of β is universal and can be used to obtain the fluorescent quantum yield in any aquatic ecosystem independently of the instrument used.
Our quantum yields ranged between 0.24 and 0.73%, somewhat lower than the mean value of 1% obtained in natural samples (Green and Blough, 1994; Vodacek et al., 1995; Ferrari et al., 1996;
Sample F(340/440)/DOC F(320/410)/DOC F(280/350)/DOC Ф(340)
(QSU mg C-1 L) (QSU mg C-1 L) (QSU mg C-1 L) (%)Black Sea 0m 0.26 ± 0.01 0.48 ± 0.02 0.30 ± 0.02 0.24 ± 0.01Black Sea 90m 1.29 ± 0.03 1.37 ± 0.04 0.58 ± 0.02 0.52 ± 0.01Black Sea 750m 3.73 ± 0.08 3.8 ± 0.1 0.70 ± 0.10 0.59 ± 0.01Hawaii 0m 0.10 ± 0.01 0.28 ± 0.01 0.20 ± 0.01 0.5 ± 0.1Hawaii 600m 1.12 ± 0.03 1.14 ± 0.02 0.18 ± 0.02 0.46 ± 0.01Woods Hole 1.61 ± 0.05 1.62 ± 0.04 0.33 ± 0.01 024 ± 0.01Chesapeake bay 0.93 ± 0.03 1.13 ± 0.03 1.58 ± 0.04 0.35 ± 0.01Delaware River 5.9 ± 0.2 5.5 ± 0.1 1.21 ± 0.08 0.73 ± 0.02West Neck Bay (NY) 1.37 ± 0.07 1.88 ± 0.09 0.95 ± 0.04 0.28 ± 0.01
Table 3. C-specific fluorescence intensities at peaks C (F(340/440)), M (F(320/410)) and T (F(280/350)), and fluorescence quantum yield at 340 nm for all the UDOM materials dissolved in aged Sargasso Sea water.

106
Chapter III
Vodacek and Blough, 1997; Ferrari, 2000; Zepp et al., 2004; Romera-Castillo et al., 2011). The Black Sea surface sample showed the lowest Ф(340), which increased sharply below the photic layer (Table 3). Since the higher Ф(340) the higher the aromaticity of DOM (Birks, 1970; Turro, 1991), the increase of Ф(340) with depth in the Black Sea is consistent with the change observed in a*CDOM(254). Mopper et al. (1996) also found higher fluorescence to absorption ratios in deep relative to surface marine waters. Consistently, Benner (1992) reported that UDOM (> 1 KDa) from surface waters had a lower relative abundance of aromatic or olefinic carbons than UDOM from deep waters. However, for the case of the Hawaii samples we obtained a constant with depth values of Ф(340) instead of the increase observed in a*CDOM(254).
UDOM isolated from the Delaware River presented the highest Ф(340), which decreased in estuarine and, even more, in coastal samples. A higher percentage of aromatic carbons for riverine samples have also been reported in comparison with marine samples (Coble, 1996). This observation is also valid for the UDOM fraction > 1 KDa, since the 13C–NMR analysis of HMW-DOM from river and ocean samples showed that terrestrial humic substances are more aromatic and isotopically depleted in 13C relative to marine organic matter (Repeta et al., 2002; Benner, 2003). Consistently, the terrestrial material was predominant in the site where the Delaware River sample was collected (Mannino and Harvey, 1999). The lower Ф(340) of estuarine and coastal samples can be explained by a lower contribution of aromatic terrestrial humic substances. In addition, the possible reduction of Ф(340) by photodegradation increases with the exposure time of the samples to the natural UV radiation. In this sense, river samples have a lower residence time than estuarine samples and the later lower than coastal samples.
Wavelength (nm)
250 300 350 400 450 500 550 600
aCD
OM
() (
m-1
)
-0.3
-0.2
-0.1
0.0
0.1
0.2
0.3
0.4 Hawaii SurfaceHawaii 600 mDelaware RiverWoods Hole CoastControl
Figure 5. Absorption spectra of the dark minus the irradiated UDOM samples dissolved in aged Sargasso Sea water.

107
Optical properties of UDOM and photochemistry
Hi0 Hi600 DwR WHC Control
a CD
OM
(254
/365
)
0
10
20
30
40
50
Hi0 Hi600 DwR WHC Control
S(2
50-5
00) (
nm-1
)
0.000
0.005
0.010
0.015
0.020
0.025
0.030
0.035
Hi0 Hi600 DwR WHC Control
a*CD
OM
(254
) (m
2 g-1
C)
0.0
0.5
1.0
1.5
2.0
2.5
3.0
3.5LightDarka)
Hi0 Hi600 DwR WHC Control
a CD
OM
(340
) (m
-1)
0.0
0.2
0.4
0.6
0.8
1.0
1.2 b)
c)
Hi0 Hi600 DwR WHC Control
S (2
75-2
95) (
nm-1
)
0.00
0.01
0.02
0.03
0.04
0.05
0.06
0.07
d)
Hi0 Hi600 DwR WHC Control
S (3
50-4
00) (
nm-1
)
0.000
0.005
0.010
0.015
0.020
0.025e) f)
Figure 6. a) C-specific absorption coefficient at 254 nm; b) absorption coefficient at 340 nm; c) 254 nm to 365 nm absorption coefficient ratio, aCDOM(254/365) ratio; spectral slopes at d) 250–500 nm e) 275–295 nm and f) 350–400 nm at the end of the incubation time. White bars: irradiated samples; Black bars: dark controls. DwR, Delaware River; Hi0, Hawaii surface; Hi600, Hawaii 600 m; WHC, Woods Hole Coastal.

108
Chapter III
Photo-reactivity of UDOM
Subtraction of the irradiated from the dark absorption spectra of each sample indicated that maximum colour loss occurred between 280 and 350 nm (Figure 5), i.e. not only in the UV-B range but also in almost all the UV-A range, as observed by Vähätalo et al. (2000). The compounds absorbing between 275 and 350 nm were almost negligible in the Hawaii surface sample and in aged Sargasso Sea water because both came from waters exposed to sunlight for prolonged periods. It is noticeable that in all samples but in the Woods Hole Coast, negative values were observed in Figure 5 at wavelengths < 280 nm. This implies that photo-humification processes have occurred during the irradiation of those samples, which resulted in the production of new compounds absorbing at wavelengths < 280 nm.
Since the UV light that reaches the Earth surface is mainly UV-A and UV-B, there should not be significant differences in a*CDOM(254) between the irradiated samples and their respective dark controls (Figure 6a). This was the case of the control aged Sargasso Sea Water and the UDOM of the Delaware River and the coast of Woods Hole. The irradiated UDOM samples from Hawaii showed a significant increase of a*CDOM(254) compared with its dark control (p < 0.01 for the surface sample and p < 0.05 for the 600 m sample) suggesting the occurrence of photo-humification (Kieber et al., 1997; Ortega-Retuerta et al., 2010).
By contrast, all the naturally irradiated UDOM samples but Hawaii surface presented a significant decrease of aCDOM(340) compared with the corresponding dark controls (Figure 6b). It should be noted that the aged surface Sargasso Sea water used to
Hi0 Hi600 DwR WHC Control
F(3
40/4
40) (
QSU
)
0
1
2
3
4LightDark
Hi0 Hi600 DwR WHC Control
F(2
80/3
50) (
QSU
)
0.0
0.5
1.0
1.5
2.0
2.5
Hi0 Hi600 DwR WHC Control
(3
40)
0.0
0.2
0.4
0.6
0.8
1.0
1.2
a)
b)
c)
Figure 7. Fluorescence intensity at a) peak-C, F(340/440), and b) peak-T, F(280/350) and c) fluorescence quantum yield at 340 nm at the end of the incubation time. White bars: irradiated samples; Black bars: dark controls. DwR, Delaware River; Hi0, Hawaii surface; Hi600, Hawaii 600 m; WHC, Woods Hole Coastal.

109
Optical properties of UDOM and photochemistry
dissolve the UDOM does not respond significantly to UV irradiation. The Hawaii 600 m sample showed the highest percentual decrease, about 30%, followed by the Delaware River and Woods Hole UDOM samples that showed a similar colour loss of about 23%.
The aCDOM(254/365) ratio increased in all UDOM irradiated samples compared with the corresponding dark controls (Figure 6c), suggesting a decrease of the average molecular weigh of the coloured substances degraded to colourless compounds by natural radiation. This concurs with other studies that analysed the production of LMW-DOM from HMW-DOM mediated by photochemical reactions (Allard et al., 1994; Moran and Zepp, 1997). The increase of the aCDOM(254/365) ratio in the irradiated samples regarding the dark controls was larger in the Hawaii surface ocean UDOM sample (11 ± 2) followed by the Hawaii sample at 600 m (4.9 ± 0.7). River and coastal samples presented lower values of 2.6 ± 0.6 and 2.5 ± 0.7, respectively.
The spectral slope S(250-500) increased significantly with the natural irradiation (Figure 6d) due to the relatively faster photo bleaching in the UV-A range of the spectrum (e.g. Kowalczuk et al., 2003). At the end of the incubation time, S(275-295) was significantly (p < 0.05) higher for all irradiated UDOM samples than for the corresponding dark controls whereas S(350–400) remained invariable (Figures 6e-f). Therefore, S(275–295) is more sensitive to radiation than S(350–400), resulting more useful to trace photochemical processes in seawater.
All irradiated UDOM samples showed a significant decrease of the fluorescence at peak-C compared with the corresponding dark controls (Figure 7a). Fluorescence photobleaching was larger in the Delaware River sample (about 60%), it decreased in coastal UDOM samples and was minimum in open ocean samples. In Hawaii, the sample from 600 m underwent a decrease of fluorescence higher than the one collected at the surface. These results concur with those obtained by other authors who found that deep-water DOM is more photo-reactive than DOM from surface waters (Mopper et al., 1991; Obernosterer et al., 2001; Nieto-Cid et al., 2006).
Fluorescence intensity at peak-T tended to increased in all the irradiated samples (Figure 7b), specially in Hawaii surface and deep ones. Note that the Hawaii samples exhibited a lower than expected peak-T fluorescence for the %N that they contain (Figure 4b), which was related to the position of the tryptophan residues and the presence of other moieties that can affect the fluorescence intensity of proteins (Lackowik, 2006). Given that most of the nitrogen in humic substances is in the form of amino acids (Schnitzer 1985; Rosenstock et al. 2005), we hypothesised that the observed increments of the fluorescence intensity at peak-T after irradiation could occur through the cleavage of humic substances by natural radiation. The concentration of humic-bound dissolved amino acids constitutes from 34% to 64% of the total dissolved amino acids (Rosenstock et al., 2005). The released protein material would have lower molecular weight and higher induced fluorescence at peak-T than when it was bounded. In

110
Chapter III
support of this hypothesis, it has been shown that the fluorescence efficiency of tryptophan bound to phytoplankton proteins is about two orders of magnitude lower than the fluorescence efficiency of the dissolved free amino acid (Determann et al., 1998).
Finally, a significant decrease of the quantum yield was observed in all the irradiated UDOM samples compared with the corresponding dark controls (Figure 7c), i.e. the decrease of fluorescence is larger than the decrease of absorption when the UDOM is irradiated with natural sunlight. The Delaware River UDOM sample presented the largest percentage loss of quantum yield (46%) and the Hawaii samples the lowest. This contrast with the results found by Vodacek and Blough (1997), who reported no change in quantum yield with photo-degradation, but concurs with results by De Haan (1993), who observed a quicker decrease of fluorescence than absorption with radiation.
Acknowledgements
We thank to Dr. Robert Chen for the spectrometric instruments and lab installations. This study was funded by a travel I3P-predoctoral fellowship to C.R.-C. from the Consejo Superior de Investigaciones Científicas (CSIC) within the project: Organic matter sources, microbial diversity, and coastal marine pelagic ecosystem functioning (respiration and carbon use). (MODIVUS, CTM2005-04795/MAR). N.N.-C. was funded by a Marie Curie I.O.F. D.J.R. received support from the National Science Foundation DBI 0424599 and the Gordon and Betty Moore Foundation.
References
Albert, R.C., 1988. The Historical Context of Water Quality Management for the Delaware Estuary. Estuaries, 11(2): 99-107.
Allard, B., Borén, H., Petterson, C. and Zhang, G., 1994. Degradation of humic substances by UV-irradiation. Environment International, 20: 97–101.
Benner, R., Pakulski, J.D., McCarthy, M., Hedges, J.l. and Hatcher, P.G., 1992. BuIk Chemical Characteristics of Dissolved Organic Matter in the Ocean. Science, 255: 1561-1564.
Benner, R., Biddanda, B., Black, B. and McCarthy, M., 1997. Abundance, size distribution, and stable carbon and nitrogen isotopic compositions of marine organic matter isolated by tangential-flow
111
Optical properties of UDOM and photochemistry
ultrafiltration. Marine Chemistry, 57(3-4): 243-263.
Benner, R., 2002. Chemical composition and reactivity. In: Hansell, D., Carlson, C. (Eds.), 2002. Biogeochemistry of 730 Marine Dissolved Organic Matter. Academic Press, San Diego, pp. 59-90.
Benner, R., 2003. Molecular indicators of the Bioavailability of Dissolved Organic Matter. In: Findlay, S. and Sinsabaugh, R. (Eds.), Aquatic Ecosystems: Interactivity of Dissolved Organic Matter. Academic Press, New York, pp. 121-137.
Biggs, R.B., Sharp, J. H., Church, T.M. and Tramontano J.M., 1983. Optical Properties, Suspended Sediments, and Chemistry Associated with the Turbidity Maxima of the Delaware Estuary. Can. J. Fish. Aquat. Sci. 40(S1): s172–s179.
Birks, J.B., 1970. Photophysics of aromatic molecules. Willey-Interscience, London.
Carder, K.L., Steward, R.G., Harvey, G.R. and Ortner, P.B., 1989. Marine Humic and Fulvic Acids: Their Effects on Remote Sensing of Ocean Chlorophyll. Limnology and Oceanography, 34(1): 68-81.
Coble, P.G., 1996. Characterization of marine and terrestrial DOM in seawater using excitation-emission matrix spectroscopy. Marine Chemistry, 51: 325-346.
Coble, P.G., 2007. Marine Optical Biogeochemistry: The Chemistry of Ocean Color. Chemical Review, 107: 402-418.
Chen, R.F. and Bada, J.L., 1992. The fluorescence of dissolved organic matter in seawater. Marine Chemistry, 37(3-4): 191-221.
Dahlén, J., Bertilsson, S. and Pettersson, C., 1996. Effects of UV-A irradiation on dissolved organic matter in humic surface waters. Environment International, 22(5): 501-506.
Dalzell, B.J., Minor, E.C. and Mopper, K.M., 2009. Photodegradation of estuarine dissolved organic matter: a multi-method assessment of DOM transformation. Organic Geochemistry, 40(2): 243-257.
De Haan, H., 1993. Solar UV-Light Penetration and Photodegradation of Humic Substances in Peaty Lake Water. Limnology and Oceanography, 38(5): 1072-1076.

112
Chapter III
Del Castillo, C.E., Coble, P.G., Morell, J.M., López, M.J. and Corredor, J.E., 1999. Analysis of the optical properties of the Orinoco River plume by absorption and fluorescence spectroscopy. Marine Chemistry 66: 35-51.
Determann, S., Lobbes, J.M., Reuter, R. and Rullkötter, J., 1998. Ultraviolet fluorescence excitation and emission spectroscopy of marine algae and bacteria. Marine Chemistry, 62: 137-156.
Dittmar, T., Koch, B., Hertkorn, N. and Kattner, G., 2008. A simple and efficient method for the solid-phase extraction of dissolved organic matter (SPE-DOM) from seawater. Limnology and Oceanography: Methods, 6: 230-235.
Engelhaupt, E., Bianchi, T.S., Wetzel, R.G. and Tarr, M.A., 2003. Photochemical transformations and bacterial utilization of high-molecular-weight dissolved organic carbon in a southern Louisiana tidal stream (Bayou Trepagnier). Biogeochemistry, 62: 39-58.
Ferrari, G.M., Dowell, M.D., Grossi, S. and Targa, C., 1996. Relationship between the optical properties of chromophoric dissolved organic matter and total concentration of dissolved organic carbon in the southern Baltic Sea region. Marine Chemistry, 55(3-4): 299-316.
Ferrari, G.M., 2000. The relationship between chromophoric dissolved organic matter and dissolved organic carbon in the European Atlantic coastal area and in the West Mediterranean Sea (Gulf of Lions). Marine Chemistry, 70(4): 339-357.
Green, S.A. and Blough, N.V., 1994. Optical Absorption and Fluorescence Properties of Chromophoric Dissolved Organic Matter in Natural Waters. Limnol. Oceanogr, 39 (8): 1903-1916.
Guo, L. and Sun, M.-Y., 2009. Isotope composition of organic matter in seawater. In: Wurl, O. (Ed), Practical Guidelines for the Analysis of Seawater. Taylor and Francis Group, LLC, pp. 97-123.
Gurtler, B.K., Vetter, T.A., Perdue, E.M., Ingall, E., Koprivnjak, J.K. and Pfromm, P.H., 2008. Combining reverse osmosis and pulsed electrical current electrodialysis for improved recovery of dissolved organic matter from seawater. J. Membr. Sci. 323: 328-336.
Hansell, D.A., Carlson, C.A., Repeta, D.J. and Reiner, S., 2009. Dissolved organic matter in the ocean. Oceanography, 22(4): 202-211.
Hay, B.J., Honjo, S., Kempe, S., Ittekkot, V.A., Degens, E.T., Konuk, T. and Izdar, E., 1990. Interannual

113
Optical properties of UDOM and photochemistry
variability in particle flux in the southwestern Black Sea Deep sea Research, 37(6): 911-928.
Hedges, J.I., Hatcher, P.G., Ertel, J.R. and Meyers-Schulte, K.J., 1992. A comparison of dissolved humic substances from seawater with Amazon River counterparts by 13C-NMR spectrometry. Geochimica et Cosmochimica Acta, 56: 1753-1757.
Hedges, J.I., Baldock, J.A., Gélinas, Y., Lee ,C., Peterson, M.L., Wakeham, S.G., 2002. The biochemical and elemental compositions of marine plankton: A NMR perspective. Marine Chemistry, 78(1): 47-63.
Helms, J.R. et al., 2008. Absorption spectral slopes and slope ratios as indicators of molecular weight, source, and photobleaching of chromophoric dissolved organic matter. Limnol. Oceanogr, 53(3): 955-969.
Kieber, R.J., Hydro, L.H. and Seaton, P.J., 1997. Photooxidation of Triglycerides and Fatty Acids in Seawater: Implication Toward the Formation of Marine Humic Substances. Limnology and Oceanography, 42(6): 1454-1462.
Kieber, R.J., Whitehead, R.F., Reid, S.N., Willey, J.D. and Seaton, P.J., 2006. Chromophoric dissolved organic matter (CDOM) in rainwater, southeastern North Carolina, USA. Journal of Atmospheric Chemistry 54(1): 21-41.
Kowalczuk, P., Cooper, W.J., Whitehead, R.F., Durakao, R.J., M. and Sheldon, W., 2003. Characterization of CDOM in an organic rich river and surrounding coastal ocean in the South Atlantic Bight. Aquat. Sci., 65(4): 381–398.
Lakowic, J.R., 2006. Principles of Fluorescence Spectroscopy. Springer.
Letelier, R.M., Strutton, P.G. and Karl, D.M., 2008. Physical and ecological uncertainties in the widespread implementation of controlled upwelling in the North Pacific Subtropical Gyre. Mar. Ecol. Prog. Ser. 371: 305–308.
Mannino, A. and Harvey, H.R., 1999. Lipid composition in particulate and dissolved organic matter in the Delaware Estuary: sources and diagenetic patterns. Geochimica et Cosmochimica Acta, 63(15): 2219-2235.
Mannino, A. and Harvey, H.R., 2004. Black Carbon in Estuarine and Coastal Ocean Dissolved Organic Matter. Limnology and Oceanography, 49(3): 735-740.

114
Chapter III
Melhuish, W.H., 1961. Quantum efficiencies of fluorescence of organic substances: effect of solvent and concentration of the fluorescent solute J. Phys. Chem., 65 (2): 229-235.
Mopper, K. and Kieber, D.J., 1991. Distribution and biological turnover of dissolved organic compounds in the water column of the Black Sea. Deep-sea Research, 38(Suppl. 2): S1021-S1047.
Mopper, K., Zhou, X., Kieber, R.J., Kieber, D. J., Sikorski, R.J. and Jones, R.D., 1991. Photochemical degradation of dissolved organic carbon and its impact on the oceanic carbon cycle. Nature, 353(6339): 60-62.
Mopper, K., Feng, Z., Bentjen, S.B. and Chen, R.F., 1996. Effects of cross-flow filtration on the absorption and fluorescence properties of seawater. Marine Chemistry, 55(1-2): 53-74.
Mopper, K., Stubbins, A., Ritchie, J.D., Bialk, H.M. and Hatcher, P.G., 2007. Advanced Instrumental Approaches for Characterization of Marine Dissolved Organic Matter: Extraction Techniques, Mass Spectrometry, and Nuclear Magnetic Resonance Spectroscopy. Chemical reviews, 107: 419-442.
Moran, M.A. and Zepp, R.G., 1997. Role of photoreactions in the formation of biologically labile compounds from dissolved organic matter. Limnology and Oceanography, 42(6): 1307-1316.
Moran, M.A., Sheldon, W.M. and Zepp, R.G., 2000. Carbon Loss and Optical Property Changes during Long-Term Photochemical and Biological Degradation of Estuarine Dissolved Organic Matter. Limnology and Oceanography, 45(6): 1254-1264.
Nelson, N.B. and D.A. Siegel, 2002. Chromophoric DOM in the Open Ocean. In: Hansell, D.A. and Carlson C.A. (eds), Biogeochemistry of Marine Dissolved Organic Matter. Academic Press, San Diego, CA. pp. 547-578.
Nieto-Cid, M., Álvarez-Salgado, X.A. and Pérez, F.F., 2006. Microbial and photochemical reactivity of fluorescent dissolved organic matter in a coastal upwelling system. Limnology and Oceanography, 51(3): 1391-1400.
Obernosterer, I., Sempéré, R. and Herndl, G.J., 2001. Ultraviolet radiation induces reversal of the bioavailability of DOM to marine bacterioplankton. Aquatic Microbial Eoclogy, 24: 61-68.
Ortega-Retuerta, E. et al., 2009. Biogeneration of chromophoric dissolved organic matter by bacteria

115
Optical properties of UDOM and photochemistry
and krill in the Southern Ocean. Limnol. Oceanogr, 54(6): 1941–1950.
Ortega-Retuerta, E., Reche, I., Pulido-Villena, E., Agustí, S. and Duarte, C.M., 2010. Distribution and photoreactivity of chromophoric dissolved organic matter in the Antarctic Peninsula (Southern Ocean). Marine Chemistry, 118(3-4): 129-139.
Özsoy, E. and Ünlüata, Ü., 1997. Oceanography of the Black Sea: A review of some recent results. Earth-Science Reviews, 42(4): 231-272.
Peltier, W.R., Liu, Y. and Crowley, J.W., 2007. Snowball Earth prevention by dissolved organic carbon remineralization. Nature, 450: 813-819.
Perdue, E. M., and R. Benner. 2009. Marine organic matter, pp. 407-449, In: Biophysico-Chemical Processes Involving Natural Nonliving Organic Matter in Environmental Systems, N. Senesi, B. Xing, and P. M. Huang (eds), IUPAC Book Series, Wiley, NJ.
Repeta, D.J., Quan, T.M., Aluwihare, L.I. and Accardi, A., 2002. Chemical characterization of high molecular weight dissolved organic matter in fresh and marine waters. Geochimica et Cosmochimica Acta, 66(6): 955–962.
Romera-Castillo, C., Sarmento, H., Álvarez-Salgado, A.X., Gasol, J.M. and Marrasé, C., 2010. Production of chromophoric dissolved organic matter by marine phytoplankton. Limnol. Oceanogr., 55(1): 446–454.
Romera-Castillo, C., Nieto-Cid, M., Castro, C.G., Marrasé, C., Largier, J., Barton, E.D. and Álvarez-Salgado, X.A., 2011. Fluorescence: absorption coefficient ratio - tracing photochemical and microbial degradation processes affecting coloured dissolved organic matter in a coastal system. Mar. Chem. Doi: 10.1016/j.marchem.2011.02.001.
Rosenstock, B., Zwisler, W. and Simon, M., 2005. Bacterial Consumption of Humic and Non-Humic Low and High Molecular Weight DOM and the Effect of Solar Irradiation on the Turnover of Labile DOM in the Southern Ocean Microbial Ecology, 50(1): 90-101.
Schnitzer, M., 1985. Nature of nitrogen of humic substances from soil. In: Aiken, G.R., Mcknight, D.M., Wershaw, R.L., MacCarthy, P. (Eds.), Humic Substances in Soil, Sediment and Water. John Wiley & Sons, New York, pp. 303– 325.
Schrum, C., Staneva, J., Stanev, E. and Özsoy, E., 2001. Air-sea exchange in the Black Sea estimated from atmospheric analysis for the period 1979-1993. Journal of Marine Systems, 31(1-3):

116
Chapter III
3-19.
Skoog, A., Wedborg, M. and Fogelqvist, E., 1996. Photobleaching of fluorescence and the organic carbon concentration in a coastal environment. Marine Chemistry, 55(3-4): 333-345.
Stedmon, C.A. and Markager, S., 2005. Title Tracing the production and degradation of autochthonous fractions of dissolved organic matter using fluorescence analysis. Journal Limnology and Oceanography, 50(5): 1415-1426.
Stedmon, C.A. and Bro, R., 2008. Characterizing dissolved organic matter fluorescence with parallel factor analysis: a tutorial Limnology and Oceanography: Methods, 6: 572–579.
Steinberg, D.K., Nelson, N.B., Carlson, C.A. and Prusak, A.C., 2004. Production of chromophoric dissolved organic matter (CDOM) in the open ocean by zooplankton and the colonial cyanobacterium Trichodesmium spp. Marine Ecology Progress Series, 267: 45-56.
Sulzberger, B. and Durisch-Kaiser, E., 2009. Chemical characterization of dissolved organic matter (DOM): A prerequisite for understanding UV-induced changes of DOM absorption properties and bioavailability. Aquatic Sciences.
Swan, C.M., Siegel, D.A., Nelson, N.B., Carlson, C.A. and Nasir, E., 2009. Biogeochemical and hydrographic controls on chromophoric dissolved organic matter distribution in the Pacific Ocean. Deep Sea Research Part I: Oceanographic Research Papers, 56(12): 2175-2192.
Thurman, E.M., 1985. Organic Geochemistry of Natural Waters. Chapter 10. Aquatic Humic Substances. Eds. Martinus Nijhoff and Dr W. Junk Publishers.
Turro, N.J., 1991. Modern molecular photochemistry. University Science Books.
Vähätalo, A.V., Salkinoja-Salonen, M., Taalas, P. and Salonen, K., 2000. Spectrum of the Quantum Yield for Photochemical Mineralization of Dissolved Organic Carbon in a Humic Lake. Limnology and Oceanography, 45(3): 664-676.
Vodacek, A., Hoge, F.E., Swift, R.N., Yungel, J.K., Peltzer, E.T. and Blough, N.V., 1995. The Use of in Situ and Airborne Fluorescence Measurements to Determine UV Absorption Coefficients and DOC Concentrations in Surface Waters. Limnology and Oceanography, 40(2): 411-415.
Vodacek, A. and Blough, N.V., 1997. Seasonal variation of CDOM in the Middle Atlantic Bight: Terrestrial inputs and photooxidation. Proceedings of SPIE-The International Society for
117
Optical properties of UDOM and photochemistry
Optical Engineering, 2963(Ocean Optics XIII): 132-137.
Weishaar, J.L. et al., 2003. Evaluation of Specific Ultraviolet Absorbance as an Indicator of the Chemical Composition and Reactivity of Dissolved Organic Carbon. Enviromental Science and Technology, 37 (20): 4702-4708.
Wheeler, J.R., 1976. Fractionation by molecular weight of organic substances in Georgia coastal water. Limnology and Oceanography, 21: 846-852.
Yakushev, E.V., Podymov, O. and Chasovnikov, V.K., 2005. Seasonal Changes in the Hydrochemical Structure of the black sea redox zone. Oceanography, 18(2): 48-5.
Yamashita, Y. and Tanoue, E., 2008. Production of bio-refractory fluorescent dissolved organic matter in the ocean interior. Nature Geoscience, 1: 579-582.
Zepp, R.G., Sheldon, W.M. and Moran, M.A., 2004. Dissolved organic fluorophores in southeastern US coastal waters: correction method for eliminating Rayleigh and Raman scattering peaks in excitation-emission matrices. Marine Chemistry, 89(1-4): 15-36.


Chapter IV:
Fluorescence: absorption coefficient ratio – tracing photochemical and microbial degradation processes affecting coloured dissolved organic matter in a coastal system

Chapter IV
120
Co-authors:
Mar Nieto-Cid, Carmen G. Castro, Cèlia Marrasé, John Largier, Eric Desmond Barton and Xosé Antón Álvarez-Salgado

Biogeochemical processes affecting CDOM in Ría de Vigo
121
Abstract
The optical properties of coloured dissolved organic matter (CDOM) —absorption coefficient, induced fluorescence, and fluorescence quantum yield — were determined in the coastal eutrophic system of the Ría de Vigo (NW Spain) under two contrasting situations: a downwelling event in September 2006 and an upwelling event in June 2007. Significantly different optical properties were recorded in the shelf surface (higher absorption coefficient, lower quantum yield) and bottom (lower absorption coefficient, higher quantum yield) waters that entered the embayment during downwelling and upwelling conditions, respectively. Continental waters presented distinctly high CDOM levels. The spatial and temporal variability of the induced fluorescence to absorption coefficient ratio during the mixing of shelf and continental waters was used to quantify the relative importance of photochemical and microbial processes under these contrasting hydrographic conditions. Photochemical processes were dominant during the downwelling episode: 86% of the variability of CDOM can be explained by photochemical degradation. On the contrary, microbial processes prevailed during the upwelling event: 77% of the total variability of CDOM was explained by microbial respiration.
Keywords: coloured DOM; fluorescent DOM; fluorescence quantum yield; coastal upwelling

Chapter IV
122

Biogeochemical processes affecting CDOM in Ría de Vigo
123
Introduction
Coloured dissolved organic matter (CDOM) is the main UV-absorbing component in aquatic systems, contributing to prevent DNA damage in aquatic organisms, especially in a global change context of stratospheric ozone reduction (Häder and Sinha, 2005 and references therein). CDOM also absorbs radiation in the visible spectral range interfering with satellite-derived chlorophyll estimates, a fact that has stimulated the study of these materials in coastal and open ocean systems (e.g. Hoge et al., 1993; Vodacek and Blough, 1997; Siegel et al., 2002). A fraction of CDOM can emit the absorbed radiation as fluorescent light (Coble, 1996, 2007). In most estuaries and coastal areas, CDOM constitutes a dominant fraction of the DOM pool and good positive correlations are obtained between the induced fluorescence emission of CDOM, the absorption coefficient at the fluorescence excitation wavelength, and the concentration of dissolved organic carbon, DOC (e.g. Hoge et al., 1993; Vodacek et al., 1995; 1997; Ferrari et al., 1996; Ferrari, 2000; Del Vecchio and Blough, 2004; Del Castillo and Miller, 2008; Kowalczuk et al., 2010). In most of these cases, the more sensitive, simpler and quicker fluorescence spectroscopy measurements have been used to estimate CDOM absorption and DOC concentrations, especially for the calibration of remote sensing colour sensors. The goodness of the linear relationships between induced fluorescence and absorption coefficient, and between absorption coefficient and DOC, depend on the narrow variability of the fluorescence to absorption coefficient ratio, i.e. the fluorescence quantum yield, and the absorption coefficient to DOC ratio, i.e. the carbon specific absorption coefficient (Green and Blough, 1994; Vodacek et al., 1995). In some areas, CDOM absorption coefficient or induced fluorescence measurements can be used together with salinity to solve the mixing of three coastal water masses (e.g. Klinkhammer et al., 2000; Stedmon et al., 2010). The benefit of this approach depends on how conservative the behaviour of the optical properties of CDOM is during water mass mixing.
However, it is well known that DOC and CDOM are produced and consumed by biogeochemical processes during the mixing of water masses of contrasting origins. The most important CDOM sink is photo-degradation mediated by natural UV-light, which break down the coloured molecules into smaller and colourless ones (Chen and Bada, 1992; Moran et al., 2000). On the other hand, the main source of CDOM is aerobic autotrophic and heterotrophic microbial respiration (Yentsch and Reichert, 1961; Kramer and Herndl, 2004; Nieto-Cid et al., 2006; Romera-Castillo et al., 2010) and, to a lesser extent, abiotic reactions of photo-humification (Kieber et al., 1997). DOC and CDOM absorption and fluorescence have a different response to these processes, thus altering the fluorescence quantum yield and carbon specific absorption coefficient (e.g. De Haan, 1993; Moran et al., 2000; Lønborg et al., 2010).
The in situ production of fluorescent CDOM is 5-fold the terrestrial inputs measured in the ocean interior (Yamashita and Tanoue, 2008). Although in coastal areas more affected by freshwater discharges terrestrial inputs will gain importance, net fluorescent CDOM production rates in the

Chapter IV
124
eutrophic embayment of the Ria de Vigo (NW Spain) still were 3-fold the continental inputs as calculated from Nieto-Cid et al. (2005). This observation, together with the dynamic nature of this coastal inlet intermittently affected by wind-driven upwelling and downwelling events (Doval et al., 1997; Álvarez-Salgado et al., 2001), makes the Ría de Vigo an excellent location to study the spatial and temporal variability of the optical properties of CDOM under contrasting hydrographic conditions and infer the relative importance of photochemical and microbial processes during the mixing of continental and oceanic waters in a coastal upwelling system.
Materials and methods
Survey area
The Ría de Vigo is a large (3.12 km3) V-shaped coastal embayment in the NW Iberian Peninsula (Figure 1). The River Oitaben-Verdugo is the main freshwater source, with an average annual flow of 15 m3 s-1 (Gago et al., 2005). It drains into San Simon Bay, a sedimentary basin in the innermost part of the embayment. The mouth of the ría, where it opens to the Atlantic Ocean, is divided by the Cíes Islands into northern (2.5 km wide, 25 m deep) and southern (5 km wide, 60 m deep) entrances. The hydrography of the Ría de Vigo is dictated by coastal wind stress, which is upwelling-favourable from April-May to September-October and downwelling-favourable the rest of the year (Wooster et al. 1976; Torres et al. 2003). The upwelling-favourable season appears as a succession of wind stress/relaxation cycles of period 10-20 days (Álvarez-Salgado et al., 1993), when the cold nutrient-rich and DOC-poor Eastern North Atlantic Central Water (ENACW) enters the ría (Doval et al., 1997; Álvarez-Salgado et al., 2001; Nieto-Cid et al., 2005). The transition from the upwelling- to the downwelling-favourable seasons occurs from mid September to mid October and it is characterised by the entry of warm, nutrient-poor and DOC-rich shelf surface waters into the ría (Doval et al., 1997; Álvarez-Salgado et al., 2001; Nieto-Cid et al., 2005). Whereas during the upwelling-favourable season the microplankton community (> 20 µm) is dominated by diatoms and the net community metabolism is autotrophic, in the transition from the upwelling- to the downwelling-favourable season dinoflagellates prevail and the metabolism is balanced or net heterotrophic (Figueiras and Ríos, 1993; Cermeño et al., 2006; Piedracoba et al., 2008).
Sampling program
Water samples were collected aboard R/V Mytilus during two contrasting periods: from 26 to 30 September 2006, during the transition from the upwelling- to the downwelling-favourable season, and from 25 to 28 June 2007, during the upwelling season. On 26 and 30 September 2006 and 25 and
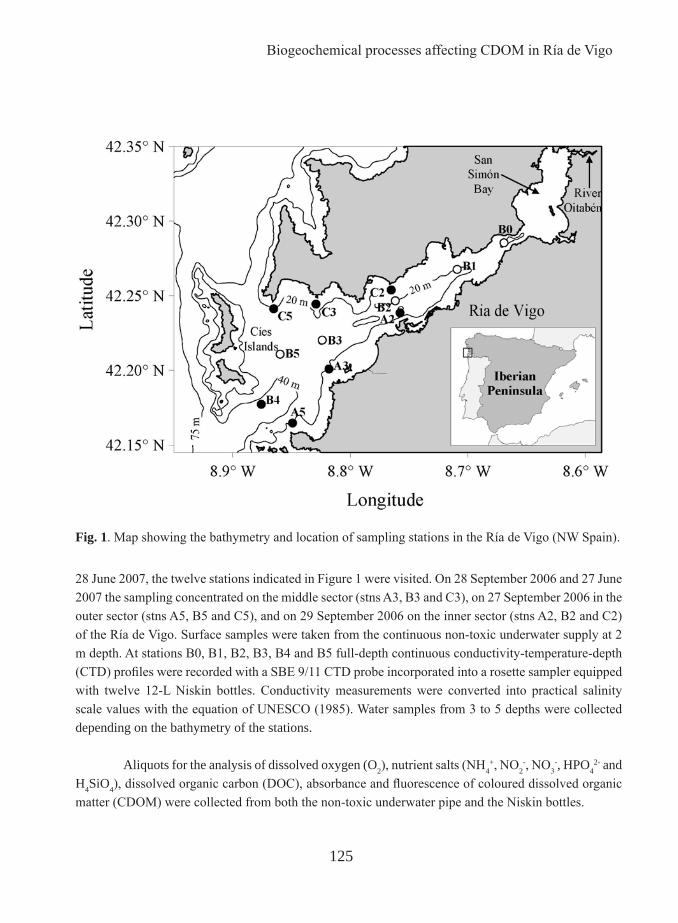
Biogeochemical processes affecting CDOM in Ría de Vigo
125
28 June 2007, the twelve stations indicated in Figure 1 were visited. On 28 September 2006 and 27 June 2007 the sampling concentrated on the middle sector (stns A3, B3 and C3), on 27 September 2006 in the outer sector (stns A5, B5 and C5), and on 29 September 2006 on the inner sector (stns A2, B2 and C2) of the Ría de Vigo. Surface samples were taken from the continuous non-toxic underwater supply at 2 m depth. At stations B0, B1, B2, B3, B4 and B5 full-depth continuous conductivity-temperature-depth (CTD) profiles were recorded with a SBE 9/11 CTD probe incorporated into a rosette sampler equipped with twelve 12-L Niskin bottles. Conductivity measurements were converted into practical salinity scale values with the equation of UNESCO (1985). Water samples from 3 to 5 depths were collected depending on the bathymetry of the stations.
Aliquots for the analysis of dissolved oxygen (O2), nutrient salts (NH4+, NO2
-, NO3-, HPO4
2- and H4SiO4), dissolved organic carbon (DOC), absorbance and fluorescence of coloured dissolved organic matter (CDOM) were collected from both the non-toxic underwater pipe and the Niskin bottles.
Fig. 1. Map showing the bathymetry and location of sampling stations in the Ría de Vigo (NW Spain).

Chapter IV
126
Coastal wind data over the study periods (Figure 1) were obtained from a mooring located about 60 km offshore of Cabo Silleiro ran by Spanish Port Authority (Puertos del Estado, http://www.puertos.es). Hourly data were checked for outliers, and any gaps of less than 6 hours were filled by interpolation with a cubic spline before the series was low pass filtered to remove periods less than 40 h and then sub-sampled to produce 6 hourly series.
Temperature observations were available from TidBit thermistor loggers and SeaBird MicroCat SBE37 recorders moored at 42º 12.4’N, 8º 48.6’W in 21 m depth, close to stn A3 on the southern side of the central ría (Figure 1). The data were compared with CTD profiles made at the site to check that accuracy lay within the quoted manufacturers’ specifications. The TidBits have a nominal accuracy of ±0.2ºC and precision of ±0.02ºC, while the MicroCats have quoted values of ±0.002ºC precision and ±0.0001ºC resolution. The temperature series, recorded at 2 minute intervals, were edited for outliers before averaging to 1 hour intervals.
Chemical analysis
Dissolved oxygen was determined by the Winkler method with potentiometric endpoint detection using a Titrino 72’ analyser (Metrohm) with an analytical precision of ±0.5 µmol kg-1. Oxygen concentrations were referred to the oxidation state of nitrate (O2cor) by considering that the ammonium and nitrite of the samples were oxidised to nitrate. Since 0.5 mol of oxygen is necessary to oxidise 1 mol of nitrite to nitrate and 2 mol of oxygen is required to oxidise 1 mol of ammonium to nitrate.
(1)
This correction allows comparison of dissolved oxygen consumption versus nutrient salts and CDOM production independently of the oxidation state of the inorganic nitrogen form involved in the organic matter mineralisation process. The corrected Apparent Oxygen Utilisation (AOU), i.e. the difference between the dissolved oxygen concentration at saturation and the actual corrected oxygen concentration of the sample, was calculated following UNESCO (1986).
Samples for nutrient salts analysis were collected in 50 mL polyethylene bottles and preserved at 4ºC until determination in the base laboratory within 4 h of collection using standard segmented flow analysis (SFA) procedures. The precisions of the methods are ±0.02 µmol kg-1 for nitrite, ±0.1 µmol kg-1 for nitrate, ±0.05 µmol kg-1 for ammonium, ±0.02 µmol kg-1 for phosphate and ±0.05 µmol kg-1 for silicate.
Samples for DOM analyses were taken in 500 mL acid-washed glass flasks and transported into the base laboratory within 4 hours of collection. Once in the laboratory, aliquots for DOC, and
4222 NH2NO21OcorO

Biogeochemical processes affecting CDOM in Ría de Vigo
127
absorbance and fluorescence of CDOM were immediately filtered through precombusted (450ºC, 4 h) Whatman GF/F filters in an acid-cleaned all-glass filtration system, under positive pressure with low N2 flow.
Approximately 10 mL of the filtrate were collected for DOC determination in precombusted (450ºC, 12 h) glass ampoules. These samples were acidified with H3PO4 to pH < 2 and the ampoules were heat-sealed and stored in the dark at 4ºC until analysis. DOC was measured with a Shimadzu TOC-CVS organic carbon analyser. The system was standardised daily with potassium hydrogen phthalate. The concentration of DOC was determined by subtracting the instrument blank area from the average peak area and dividing by the slope of the standard curve. The precision of the equipment was ±0.7 µmol L-1. The accuracy was tested daily with the DOC reference materials provided by Prof. D.A. Hansell (Miami University). We obtained average concentrations of 45.7 ± 1.6 µmol L-1 for the deep ocean reference (Sargasso Sea deep water, 2600 m) minus blank reference materials. The nominal DOC value provided by the reference laboratory is 44.0 ± 1.5 µmol L-1.
Optical measurements
Absorbance of CDOM was measured within 4 hours of collection using a Beckman Counter DU 800 spectrophotometer equipped with a 10 cm quartz round cell. Spectral scans were collected in a wavelength range of 250-700 nm at a constant room temperature of 25ºC. Pre-filtered (0.2 µm) Milli-Q water was used as the reference for all samples. Absorption coefficients were calculated using the equation:
(2)
where ABS(λ) is the absorbance at wavelength λ, and l is the cell length in meters.
Using the Levenberg-Marquardt algorithms implemented in the Stat Soft Inc. STATISTICA software we obtained the coefficients aCDOM(340), S and K that best fit the equation:
(3)
where aCDOM(340) is the absorption coefficient at wavelength 340 nm (in m-1), S is the spectral slope (in nm-1) and K is a background constant caused by residual scattering by fine size particle fractions, micro-air bubbles or colloidal material present in the sample, refractive index differences between sample and the reference, or attenuation not due to organic matter (in m-1). The estimated detection limit of
λABSl
2.303 λCDOM a
KSaa 340λ-exp(340)λ CDOMCDOM
Chapter IV
128
this spectrophotometer is 0.001 absorbance units or 0.02 m-1. The carbon specific CDOM absorption coefficient at 340 nm, a*CDOM(340), was calculated dividing aCDOM(340) by the DOC concentration.
Induced fluorescence of CDOM (FDOM) was measured after 4 hours of collection with a Perkin Elmer LS 55 luminescence spectrometer, equipped with a xenon discharge lamp, equivalent to 20 kW for 8 μs duration. The detector was a red-sensitive R928 photomultiplier and a photodiode worked as reference detector. Slit widths were 10.0 nm for the excitation and emission wavelengths. Measurements were performed at a constant room temperature of 25ºC in a 1cm quartz fluorescence cell. MQ water was used as a reference blank for fluorescence analysis. Fluorescence intensity was measured at a fixed excitation/emission wavelength of 340 nm/440 nm, F(340/440), which is characteristic of humic-like substances (Coble, 1996). The spectrofluorometer was calibrated daily with quinine sulphate in 0.1 N sulphuric acid. F(340/440) was expressed in μg L-1 of quinine sulphate, hereafter quinine sulphate units (QSU). The equivalent concentration of each peak was determined by subtracting the MQ blank peak height from the sample average peak height, and dividing by the slope of the standard curve. The precision was ± 0.1 QSU.
The quantum yield of fluorescence at 340nm, Φ(340), is the portion of the light absorbed at 340 nm, aCDOM(340), that is re-emitted as fluorescent light. Φ(340), for the samples was determined using the ratio of the absorption coefficient at 340 nm and the corresponding fluorescence emission between 400 and 600 nm from the quinine sulphate standard in 0.1 N H2SO4 using the equation (Green and Blough, 1994):
(4)
where aCDOM(340) and aCDOM(340)QS are the absorption coefficients of the sample and the QS standard (in m-1), respectively; F(400-600) and F(400-600)QS are the average integrated fluorescence spectra between 400 and 600 nm at a fixed excitation wavelength of 340 nm (in μg QS L-1) of the sample and the QS standard, respectively; and Φ(340)QS is the dimensionless fluorescence quantum yield of the QS standard, equal to 0.54 according to Melhuish (1961).
Although fluorescence spectra between 400 and 600 nm, F(400-600), were recorded in 34 out of the 197 samples collected in the Ría de Vigo, the very good linear correlation between F(340/440) and F(400-600) (R2 = 0.87, n = 34, p < 0.001) reveals that F(400-600) can be estimated from F(340/440) using the dimensionless conversion factor of 0.62 ± 0.05. Therefore, the ratio F(400-600)/ aCDOM(340) can be obtained from the ratio F(340/440)/ aCDOM(340) for all the samples collected in this study, in such a way that eq. (4) can be rewritten as:
QS(340)·600)-(400(340)
·(340)600)-(400(340)
QS
QSCDOM
CDOM Fa
aF

Biogeochemical processes affecting CDOM in Ría de Vigo
129
(5)
where β = 4.2(±0.3) 10-3 m-1 QSU-1 is a constant that accounts for the conversion factor F(400-600)/ F(340/440) and for the F(400-600)QS/ aCDOM(340)QS ratio.
Results
Hydrography and dynamics of the Ría de Vigo in September 06 and July 07
From 25 to 30 September 2006 coastal winds evolved from northerly to southerly, i.e. from upwelling- to downwelling-favourable (Figure 2a). Concomitantly, water temperature at stn A3 (Figure 2b) traced the replacement of water colder than 16.8 ºC (top 25m) on 25 September by warmer shelf surface water >18ºC (top 25 m) on 30 September. The evolution of surface temperature from 25 September (Figure 3a) to 30 September (Figure 3b), indicates that the transition from upwelling- to downwelling favourable winds was not a local phenomenon observed only at stn A3. It affected the entire ría from surface to bottom, and from the outer to the inner segment of the embayment. Salinity varied in a very narrow range, from 35.1 in the surface inner ría (Figure 3c, d) to 35.7 in the bottom outer ría (not shown).
From 25 to 28 June 2007, as a response to the strong northerly winds that were blowing on the shelf (Figure 2c), the cold (<13ºC) and salty (>35.7) Eastern North Atlantic Central Water (ENACW) entered the ría through the bottom of the southern mouth. Cooling due to upwelling was perceptible when comparing the sea surface temperature distributions of 25 June (Figure 3e) and 28 June (Figure 3f). The 14ºC isotherm was at >30 m depth on 25 June, and reached 15 m depth three days later (Figure 4a, b). Salinity exhibited in this case a wider range of variability, from 31.1 in the surface inner ría (Figure 3g, h) to 35.9 in the bottom outer ría (not shown). The warmer and fresher waters observed in the inner ría are the result of the mixing of the oceanic ENACW with the continental waters carried by the river Oitabén-Verdugo, which represent >5% in samples of salinity <34.
Nutrient status under contrasting hydrographic conditions
Shelf surface waters that entered the ría during the downwelling event sampled in September 06 were nutrient-poorer than the waters inside the ría (Figure 5a, b). Phosphate and silicate distributions (not shown) followed a parallel pattern to the total inorganic nitrogen (TIN) distribution, presenting
(340)
(340/440)100.2)2.2(
(340)(340/440)
340340CDOM
3
CDOMQS a
FaF

Chapter IV
130
Fig. 2. Coastal winds (a, c) and thermistor records (b, d) at stn A3 during the September 06 and June 07 sampling periods.

Biogeochemical processes affecting CDOM in Ría de Vigo
131
significant linear correlations (R2 = 0.74, n = 112, p < 0.001 and R2 = 0.69, n = 112, p < 0.001) for phosphate and silicate, respectively. The predominant form of inorganic nitrogen was ammonium, which represented 81 ± 2% of TIN (eq. 1 in Table 1), i.e. pointing to a system dominated by recycled production (Eppley and Peterson, 1979). This contrasts with the negative values of AOU in the nutrient-poor shelf surface waters that entered the ría, lower than those of the water in the inner part of the ría, where positive values of AOU were recorded (Figure 5c, d). The distribution of DOC (Figure 5e, f) was more complex: on 25 September, a strong gradient was observed between the DOC-rich (>100 µmol L-1) surface waters coming from the sedimentary basin of San Simon Bay and the DOC-poor (<65 µmol L-1) waters of the bottom outer ría. On 30 September, shelf surface waters, which have an intermediate
DOC concentration (about 80 µmol L-1), modified the DOC distribution of the ría.
During the event sampled on June 07, the upwelling of nutrient-rich and dissolved oxygen-poor oceanic ENACW produced a clear impact on the distributions of total inorganic nitrogen (Figure 4c, d and 6a, b) and AOU (Figures 4e, f and 6c, d). Nitrate was the predominant inorganic nitrogen form in this case, representing 82 ± 3% of TIN (eq. 2 in Table 1), which is characteristic of a system dominated by new production (Eppley and Peterson 1979). The DOC distributions of June 07 (Figures 4g, h and 6e, f) traced the entry of the DOC-poor (< 68 μmol L-1) oceanic ENACW. The signal of the river Oitaben-Verdugo after crossing San Simón bay is also visible in the surface innermost stations, where a DOC value of 112 μmol L-1 was recorded.
Optical properties of CDOM under contrasting hydrographic conditions
During the downwelling event sampled in September 06, the DOC-rich waters coming from the sedimentary basin of San Simón bay presented the highest values of aCDOM(340), >0.77 m-1 (Figure 7a, b). Shelf surface waters were characterised by much lower values of aCDOM(340), 0.34 ± 0.02 m-1 (average ± SD of the surface sample at stn B5). On the contrary, Φ(340) were not that different: 0.82 ± 0.03% for the surface sample of stn B0 and 0.76 ± 0.02% for the surface sample of stn B5 (Figure 7c, d). The distribution of F(340/440) (data not shown) was parallel to aCDOM(340): r2= 0.79, n = 112, p < 0.001. The surface distribution of aCDOM(340) on 25 September shows the mixing of the coloured waters from the inner ría with the bleached waters from the adjacent shelf (Figure 4i & 8a). Five days later, the surface layer of the ría reflected the intrusion of CDOM-poor shelf surface waters into the inner ría (Figure 4j & 8b). Similar patterns are observed in the distributions of Φ(340) (Figures 4k, l & 8c, d).
During the upwelling event sampled on June 07, the oceanic ENACW cooler than 14ºC that occupied the bottom of the ría presented relatively low aCDOM(340) but high Φ(340) values, 0.23 ± 0.04 m-1 and 1.2 ± 0.3% respectively (Figures 4i-l), compared with the warmer waters in the ría before the upwelling episode. The influence of the CDOM transported by the river Oitaben-Verdugo through San Simon Bay can also be traced in the low salinity water of the innermost part of the ría, where an
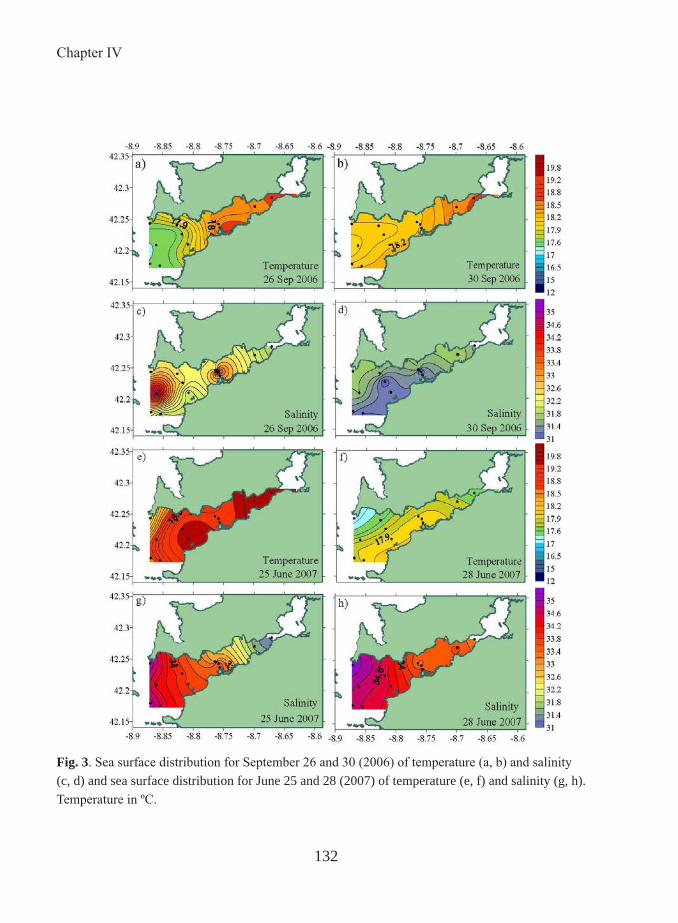
Chapter IV
132
Fig. 3. Sea surface distribution for September 26 and 30 (2006) of temperature (a, b) and salinity (c, d) and sea surface distribution for June 25 and 28 (2007) of temperature (e, f) and salinity (g, h). Temperature in ºC.

Biogeochemical processes affecting CDOM in Ría de Vigo
133
Fig. 4. Vertical distributions for June 25 and 28 (2007) of temperature (a, b) in ºC; total inorganic nitrogen (TIN) (c, d) in μmol·L-1; apparent oxygen utilization (AOU) (e, f) in μmol·Kg-1; dissolved organic carbon (DOC) (g, h) in μmol·L-1; CDOM absorption coefficient at 340nm, aCDOM(340) (i, j), in m-1 and CDOM fluorescence quantum yield at 340 nm, Φ(340) (k, l). X-axis is distance from station B0.
Chapter IV
134
aCDOM(340) value of 1.82 m-1 was recorded. The highest values of Φ(340), 1.6 ± 0.1%, were observed in the inner ría, below 10 m on 28 June. This maximum is coincident with the maxima observed in TIN (Figure 4d) and AOU (Figure 4f). In this case, the linear correlation of F(340/440) with aCDOM(340) was lower than in September 06 (r2 = 0.60, n = 80, p < 0.001) when the outlying samples B0 (2 m) on 25 June and B3(20 m) on 27 June are excluded from the analysis.
Absorption spectral slopes, S (not shown), were not significantly different during the upwelling and downwelling periods: they ranged between 0.018 nm-1 and 0.023 nm-1 during the former and between 0.018 nm-1 and 0.024 nm-1during the latter period. S varied inversely to aCDOM(340) but the log transformed plot of the two variables (Fig. 9) shows that the slope of the relationship between S and aCDOM(340) (regression model II; Sokal and Rolf, 1995) was significantly higher for the downwelling (-0.26 ± 0.01) than for the upwelling period (-0.16 ± 0.01). For the case of the upwelling period, the two outlying samples (grey dots) were not considered. If they are included in the analysis the determination coefficient of the relationship increases (r2 = 0.76) but the origin intercept and slope of the regression does not change significantly.
Discussion
Optical properties of CDOM in the Ría de Vigo: comparison with other marine systems
The average ± SD values of the absorption coefficient, aCDOM(340), and carbon-specific CDOM absorption coefficient, a*CDOM(340), at 340 nm in the Ría de Vigo were significantly higher (p < 0.001) during the downwelling (0.43 ± 0.11 m-1 and 5.4 ± 1.1 m2 mol C-1) than during the upwelling event (0.35 ± 0.14 m-1 and 4.5 ± 1.3 m2 mol C-1). On the contrary, Φ(340) was significantly lower (p < 0.001) during the downwelling (0.81 ± 0.11%) than during the upwelling episode (1.03 ± 0.30%, Table 2). Day and Faloona (2009) also found less coloured surface waters in association with intense upwelling episodes in the Northern California coast. The distributions of aCDOM(λ) and a*CDOM(λ) in the Ría de Vigo, resulting from the mixing of DOC and CDOM-rich continental waters with DOC and CDOM-poor ocean waters, is characteristic of most coastal systems (e.g. Vodacek and Blough, 1997; Chen et al., 2002; Del Vecchio and Blough, 2004). This mixing pattern results in a decrease of aCDOM(λ) with depth. However, in other coastal upwelling regions drier and more irradiated than the NW Iberian Peninsula, aCDOM(λ) tends to increase with depth (Coble et al., 1998; Kudela et al., 2006).
The variety of wavelengths used in the literature to determine aCDOM(λ) —325, 355, 375 and 443 nm being the most common— makes difficult the direct comparison of this parameter obtained in the Ría de Vigo with other marine systems. In this work, we have used aCDOM(340) to allow the quantitative
Biogeochemical processes affecting CDOM in Ría de Vigo
135
estimation of Φ(340) referred to a quinine sulphate standard of known fluorescence quantum yield. In any case, average ± SD values for the referred wavelengths are reported in Table 2. The significant difference observed in aCDOM(340) between the upwelling and the downwelling episodes sampled in this study (see above) is also observed for the other wavelengths. The average ± SD values of aCDOM(325), aCDOM(355), aCDOM(375) and aCDOM(443) recorded in the Ría de Vigo for both periods —0.54 ± 0.17 m-1 , 0.29 ± 0.10 m-1, 0.20 ± 0.07 m-1 and 0.051 ± 0.023 m-1 (Table 2), respectively— are higher than in continental shelf surface waters but lower than in estuaries and coastal inlets affected by important freshwater inputs (e.g. Vodacek and Blough, 1997; Ferrari, 2000; Babin et al., 2003; Del Vecchio and Blough, 2004; Nelson et al., 2010; Kowalczuk et al., 2010). Our surface values of aCDOM(λ) are in the
upper end of those reported in other coastal upwelling regions such as Northern California (Day and Faloona, 2009), Mauritania (Bricaud et al., 1981) or Arabia (Coble et al., 1998). They are also significantly higher than in coastal oligothrophic sites such as the Blanes Bay Observatory in the NW Mediterranean, where aCDOM(325) was 0.28 ± 0.09 m-1 and aCDOM(443) was 0.016 ± 0.015 m-1 (average ± SD) over an annual cycle (Romera-Castillo et al., unpub. data) and in oligotrophic open ocean waters (Nelson et al., 2004, 2007, 2010; Swan et al., 2009).
As for the case of aCDOM(λ), direct comparison of absolute values of S obtained by different authors is difficult because they have used different fitting procedures across different wavelength ranges and S slightly differs depending on those choices (Ferrari, 2000; Stedmon et al., 2000; Blough and Del Vecchio, 2002). In our case, spectral slopes were determined over the range 250-500 nm, and the observed values, 0.0205 ± 0.0013 nm-1 (average ± SD), are close to those reported by Babin et al. (2003), 0.0176 ± 0.0020 nm-1 (average ± SD; wavelength range 350-750 nm),who considered a wide variety of coastal and open ocean systems. Our values are also between those reported by Ferrari, (2000) for surface open ocean (0.025 nm-1 and more) and coastal waters (0.013-0.018 nm-1) calculated over a wavelength range of 350-480 nm. Bricaud et al., (1981) obtained lower S mean values, 0.0150 ± 0.0023 nm-1, in the Mauritanian upwelling region for a wavelength range of 375-500 nm.
Although absolute values of S are not directly comparable, some common trends can be defined. This is the case of the inverse relationship between S and aCDOM(λ) reported in our Figure 9, which is observed in most coastal and open ocean waters (e.g. Del Castillo and Coble, 2000; Stedmon et al., 2000; Stedmon and Markager, 2001; Nelson et al., 2010). In general, i) CDOM of terrestrial origin is characterised by lower spectral slopes than CDOM of marine origin; ii) microbial degradation processes lowers; and iii) photodegradation rises the spectral slopes (Del Vecchio and Blough, 2004; Nelson et al., 2007, 2010). With these considerations in mind, the remarkably higher slope of the relationship between aCDOM(340) and S for September 06 compared with June 07 suggests a dominance of photodegradation over microbial processes during the downwelling period and the contrary during the upwelling period, especially considering that the effect of continental waters (that would tend to lower the slopes) is larger during the upwelling period.

Chapter IV
136
The concentration of DOC correlated with aCDOM(340) for both periods (eq. 3 and 4, Table 1). Equations 3 and 4 are not significantly different, neither in the y-intercept nor in the slope. Therefore, the relationship between DOC and aCDOM(340) can be presented under an unique regression equation (Eq. 5, Table 1). The y-intercept, 49 ± 1μmol L-1, represents the colourless DOC. Since the average ± SD concentration of DOC for all the samples taken in the Ría de Vigo in September 2006 and June 2007 is 77 ± 13 μmol L-1, the coloured DOC would represent 36 ± 20% of the bulk DOC. This value is within the
Fig. 5. Sea surface distributions for September 26 and 30 (2006) of total inorganic nitrogen (TIN) (a, b) in μmol·L-1; apparent oxygen utilization (AOU) (c, d) in μmol·Kg-1 and dissolved organic carbon (DOC) (e, f) in μmol·L-1.

Biogeochemical processes affecting CDOM in Ría de Vigo
137
range of the characteristic values for open ocean, approx. 20%, and coastal areas, up to 70% (e.g. Ferrari, 1996; Del Vecchio and Blough, 2004; Coble, 2007; Kowalczuk et al., 2010). That appears reasonable because wind-driven upwelling/downwelling systems are coastal areas with enhanced oceanic influence. The inverse of the slope of eq. 5 (Table 1), 14.5 (±0.8) m2 mol C-1, represents the mean value of the DOC specific absorption coefficient, a*CDOM(340), for the coloured DOC fraction. Using the factor 0.74 ± 0.02 (to convert aCDOM(340) into aCDOM(355)), the mean specific CDOM absorption coefficient of the coloured DOC of Ría de Vigo at 355 nm, a*CDOM(355), results 20 ± 1 m2 mol C-1, a relatively high
Fig. 6. Sea surface distributions for June 25 and 28 (2007) of total inorganic nitrogen (TIN) in μmol·L-1 (a, b); apparent oxygen utilization (AOU) (c, d) in μmol·Kg-1 and of dissolved organic carbon (DOC) (e, f) in μmol·L-1.

Chapter IV
138
value compared with other coastal areas. a*CDOM(355) for the coloured DOC in Middle Atlantic Bight samples with aCDOM(355) < 1 m-1 (reduced river plume influence) ranged from 8 to 18 m2 mol C-1 (Del Vechhio and Blough, 2004). Regression slopes larger than 20 m2 mol C-1 are obtained only for samples with aCDOM(355) > 1 m-1 (strong river plume influence). Ferrari et al. (1996) also reported relatively low values of a*CDOM(355), around 14-15 m2 mol C-1, in the Southern Baltic Sea, where aCDOM(355) was always above 1 m-1. Lower specific absorption coefficient, 16 m2 mol C-1, were also obtained by Vodacek and Blough, (1997) in Delaware Bay. In the Gulf of Lions (NW Mediterranean), a*CDOM(355) ranged from 4 ± 2 m2 mol C-1 in surface marine waters to 23 ± 7 m2 mol C-1 in the river Rhone plume (Ferrari, 2000). On the contrary, a much higher value of a*CDOM(355), 32 ± 1 m2 mol C-1, was obtained by Kowalczuk et al., (2010) in the South Atlantic Bight, where aCDOM(355) up to 20 m-1 were recorded.
It has been shown in the results section that F(340/440) correlated significantly with aCDOM(340) in the Ría de Vigo during the two study periods. A good linear correlation between the fluorescence emission of CDOM and the absorption coefficient at the fluorescence excitation wavelength has been found in most coastal areas, allowing the estimation of absorption coefficients from fluorescence measurements (e.g. Hoge et al., 1993; Vodacek et al., 1995; 1997; Ferrari et al., 1996; Ferrari, 2000; Del Vecchio and Blough, 2004; Kowalczuk et al., 2010). This is because the variability of Φ(λ) is usually at least one order of magnitude lower than the variability of a(λ) (Green and Blough, 1994). Our values of Φ(340), which range from 0.56% to 1.76%, were close to the 1% reported by other authors for coastal waters (Green and Blough, 1994; Vodacek and Blough, 1997; Ferrari et al., 1996, 2000; Zepp et al., 2004). The coefficients of variation of aCDOM(340) and Φ(340) were 26% and 14% during the downwelling and 40% and 29% during the upwelling period, respectively. Therefore, although Φ(340) was less variable than aCDOM(340), the variability was of the same order of magnitude. This is the reason behind the relatively low coefficients of determination found in the Ría de Vigo (R2 = 0.79 for the downwelling and 0.60 for the upwelling period) compared with published values usually higher than 0.90 (Kowalczuk et al., 2010). Φ(λ) is altered by biotic as well as abiotic processes. On the one hand, laboratory experiments on the photobleaching of humic substances show that fluorescence decreases faster than absorption, implying a decrease of Φ(λ) (De Haan, 1993). On the other hand, laboratory experiment on the degradation of natural DOM from the Ría de Vigo showed that fluorescence builds up faster than absorption during the microbial production of CDOM, which implies an increase of Φ(λ) (Lønborg et al., 2010). Consequently, the significantly lower values of Φ(340) observed during the downwelling than during the upwelling period suggest that photodegradation was more relevant than microbial production under downwelling conditions, when the irradiated shelf surface waters entered the Ría, and the contrary under upwelling conditions, when the aged ENACW upwelled on the shelf and flowed into the ría. This deduction is consistent with the significant difference observed between the regression slopes of the logarithmic plot of aCDOM(340) and S for both periods (see above).
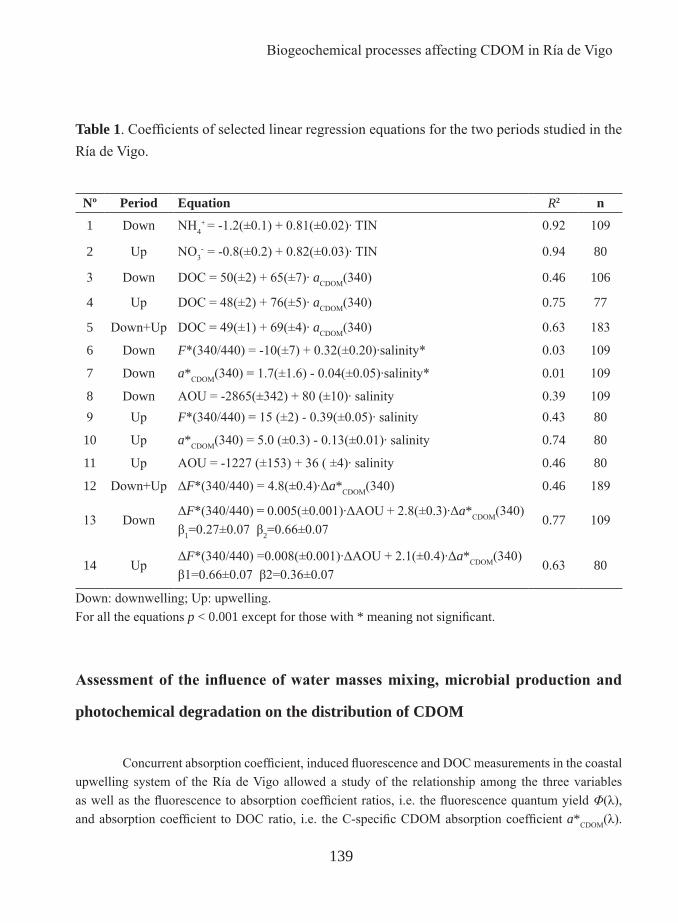
Biogeochemical processes affecting CDOM in Ría de Vigo
139
Table 1. Coefficients of selected linear regression equations for the two periods studied in the Ría de Vigo.
Nº Period Equation R2 n
1 Down NH4+ = -1.2(±0.1) + 0.81(±0.02)· TIN 0.92 109
2 Up NO3- = -0.8(±0.2) + 0.82(±0.03)· TIN 0.94 80
3 Down DOC = 50(±2) + 65(±7)· aCDOM(340) 0.46 106
4 Up DOC = 48(±2) + 76(±5)· aCDOM(340) 0.75 77
5 Down+Up DOC = 49(±1) + 69(±4)· aCDOM(340) 0.63 183
6 Down F*(340/440) = -10(±7) + 0.32(±0.20)·salinity* 0.03 109
7 Down a*CDOM(340) = 1.7(±1.6) - 0.04(±0.05)·salinity* 0.01 109
8 Down AOU = -2865(±342) + 80 (±10)· salinity 0.39 1099 Up F*(340/440) = 15 (±2) - 0.39(±0.05)· salinity 0.43 80
10 Up a*CDOM(340) = 5.0 (±0.3) - 0.13(±0.01)· salinity 0.74 80
11 Up AOU = -1227 (±153) + 36 ( ±4)· salinity 0.46 80
12 Down+Up ΔF*(340/440) = 4.8(±0.4)·Δa*CDOM(340) 0.46 189
13 DownΔF*(340/440) = 0.005(±0.001)·ΔAOU + 2.8(±0.3)·Δa*CDOM(340)β1=0.27±0.07 β2=0.66±0.07
0.77 109
14 UpΔF*(340/440) =0.008(±0.001)·ΔAOU + 2.1(±0.4)·Δa*CDOM(340) β1=0.66±0.07 β2=0.36±0.07
0.63 80
Down: downwelling; Up: upwelling.For all the equations p < 0.001 except for those with * meaning not significant.
Assessment of the influence of water masses mixing, microbial production and
photochemical degradation on the distribution of CDOM
Concurrent absorption coefficient, induced fluorescence and DOC measurements in the coastal upwelling system of the Ría de Vigo allowed a study of the relationship among the three variables as well as the fluorescence to absorption coefficient ratios, i.e. the fluorescence quantum yield Φ(λ), and absorption coefficient to DOC ratio, i.e. the C-specific CDOM absorption coefficient a*CDOM(λ).

Chapter IV
140
Since contrasting coastal upwelling and downwelling conditions were sampled, we have been able to characterise the optical properties of the shelf surface waters that enter the rías during downwelling events (aCDOM(340) = 0.34 ± 0.02 m-1, a*CDOM(340) = 4.5 ± 0.5 m2 mol C-1, Φ(340) = 0.76 ± 0.02%; average ± SD of surface samples at stn B5 in September 06) and the bottom shelf ENACW that enter the rías during upwelling events (aCDOM(340) = 0.23 ± 0.04 m-1, a*CDOM(340) = 3.6 ± 0.7 m2 mol C-1, Φ(340) = 1.2 ± 0.3%; average ± SD of samples colder than 14ºC in June 07). The values of aCDOM(340), a*CDOM(340), and Φ(340) of these water types were significantly different (p < 0.001). These two different shelf
Fig. 7. Sea surface distributions for September 26 and 30 (2006) of CDOM absorption coefficient at 340nm (aCDOM(340)) (a, b) in m-1; CDOM fluorescence quantum yield at 340 nm, Φ(340) (c, d) and Δ2F*(340/440) (e, f).

Biogeochemical processes affecting CDOM in Ría de Vigo
141
waters were forced to mix with the significantly more coloured (aCDOM(340) > 0.7 m-1, a*CDOM(340) > 7.5 m2 mol C-1, Φ(340) > 0.8%) brackish waters, exported from San Simón Bay, by the positive (negative) residual circulation characteristic of upwelling-favourable (downwelling-favourable) conditions.
The distributions of the absorption coefficient and the induced fluorescence of CDOM in any marine ecosystem depend on (1) water masses mixing; and biogeochemical processes of two categories: (2) microbial and (3) photochemical. In the case of the Ría de Vigo, to remove the continental and oceanic waters mixing effects, we considered our system as a two end-member mixing problem (Doval et al.
Fig. 8. Sea surface distributions for June 25 and 28 (2007) of CDOM absorption coefficient at 340nm (aCDOM(340)) (a, b) in m-1; CDOM fluorescence quantum yield at 340 nm, Φ(340) (c, d) and Δ2F*(340/440) (e, f).

Chapter IV
142
1997; Nieto-Cid et al. 2005) that can be solved by considering the residuals of the linear correlations of the absorption coefficient and fluorescence of CDOM with salinity. Given the significant correlation of the optical properties of CDOM with DOC (Eqs. 3-5), absorption coefficient and fluorescence to DOC ratios, a*CDOM(340) and F*(340/440), are used to remove that dependence. During the upwelling event of June 07 the optical properties of DOM were more dependent on water mass mixing than during the downwelling event of September 06, when no significant correlations were found between either a*CDOM(340) or F*(340/440) with salinity (see Eqs 6, 7, 9 and 10 in Table 1). The residuals of the regression of a*CDOM(340) with salinity, Δa*CDOM(340), correlated significantly with the residuals of the correlation of F*(340/440) with salinity, ΔF*(340/440), (see Eq. 12 in Table 1) and the slope of that correlation, 4.8 ± 0.4 m QSU, was not significantly different for both study periods. If this slope of 4.8 ± 0.4 m QSU is multiplied by the conversion factor 2.2 (±0.2) 10-3 m-1 QSU-1 of eq. 5 produces a value of 1.1 ± 0.1% that can be considered the average Φ(340) of the Ría de Vigo, independently of the mixing of water masses and the dominant hydrographic conditions. However, the linear correlation between ΔF*(340/440) and Δa*CDOM(340) explains only 46% of the observed variability (R2 = 0.46 form Eq. 12 in Table 1). Figures 7e, f and 8e, f show the horizontal distributions of the residuals of the linear regression between ΔF*(340/440) and Δa*CDOM(340), Δ2F*(340/440). The variability of Δ2F*(340/440) is equivalent to the variability of Φ(340) independent of the mixing of water masses. If the distributions of Δ2F*(340/440) were stochastic it would mean that the values of Δ2F*(340/440) are just a consequence of the errors associated to the collection and determination of F*(340/440) and a*CDOM(340). However, the distributions of Δ2F*(340/440) are systematic: the values are predominantly negative in September 06 (Figures 7e, f) and predominantly positive in June 07 (Figures 8e, f). For a given period, they increase down- and shore-wards. A systematic distribution of residuals means that environmental factors, other
than the mixing of water masses, are affecting the distributions of F*(340/440) and a*CDOM(340).
Fig. 9. Logarithmic plot of the spectral slope, S in the range of 250-500nm versus absorption coefficient at 340 nm, aCDOM(340), for the downwelling (black dots) and upwelling period (open dots).
Biogeochemical processes affecting CDOM in Ría de Vigo
143
Considering that Φ(340) decreases during photo-degradation (De Haan, 1993) and increases during microbial degradation processes (Lønborg et al., 2010), and that the variability of Δ2F*(340/440) is equivalent to the variability of Φ(340), positive values of Δ2F*(340/440) indicate a larger relative influence of microbial degradation processes while negative values a larger relative influence of photo degradation processes. Consequently, microbial processes were more relevant in June 07 than in September 06 and within each period, photochemical processes gained importance in the surface layer of the outermost stations.
The relative importance of photochemical and microbial respiration processes on the distributions of ΔF*(340/440) and Δa*CDOM(340) can be quantified by means of the parameters of the multiple linear regression of ΔF*(340/440) versus ΔAOU and Δa*CDOM(340) for each period (eqs 13 and 14 in Table 1). The AOU reflects the net ecosystem metabolism (NEM; Smith and Hollibaugh, 1997), this is the net production of dissolved oxygen due to primary producers minus the net consumption by the respiration of all the autotrophs and heterotrophs living in the study system. Previous studies in the Ría de Vigo have demonstrated that the oxygen budget of this embayment is controlled by the microbial food web (Cermeño et al., 2006; Piedracoba et al., 2008). In addition, the AOU in the surface mixed layer is affected by the exchange of dissolved oxygen with the atmosphere when moderate to strong winds blow into the ría (Piedracoba et al., 2008). For the particular case of the study period, the average ± SD local wind speed estimated at 10 m over the sea surface (u10) was 0.79 ± 0.78 m s-1 in September 06 and 1.66 ± 0.82 m s-1 in June 07. The corresponding piston velocities (k) calculated with the Wanninkhof’s (1992) formula, k = 0.31·u10
2·(Sc/589)-1/2, were 0.04 and 0.20 m d-1, respectively. Sc is the dimensionless Schmidt number. With these values of k, the average AOU of the surface layer (-41 ± 20 μmol kg-1 for September 06 and -25 ± 25 μmol kg-1 for June 07) and considering that the surface layer is 5 m thick, the resulting oxygen fluxes would be as low as 0.36 μmol kg-1 d-1 in September 06 and 0.97 μmol kg-1 d-1 in June 07, in both cases from the sea surface to the atmosphere. Given that the flushing time of the surface layer during moderate upwelling and downwelling events in the Ría de Vigo is about 2-3 days (Álvarez-Salgado et al., 2001; Piedracoba et al., 2008), oxygen exchange can be neglected for the purposes of this work. Therefore, AOU is an unequivocal indicator of the aerobic microbial metabolism and ΔAOU are the residuals of the linear regression of AOU with salinity, which is significant during the downwelling event of September 06 and the upwelling event of June 07 (eqs 8 and 11 in Table 1).
When the variables ΔF*(340/440), ΔAOU and Δa*CDOM(340) are normalised and the regression slopes are of the same sign, the square of the resulting normalised regression slope (β1
2) indicates the proportion of the variability of ΔF*(340/440) explained by ΔAOU if Δa*CDOM(340) is kept constant. Consistently, β2
2 indicates the proportion of the variability of ΔF*(340/440) explained by Δa*CDOM(340) if ΔAOU is kept constant. Therefore, the ratio β1
2 /(β12 + β2
2) indicates theproportion of the biogeochemical ariability of ΔF*(340/440) that is due to microbial respiration and

Chapter IV
144
β22 /(β1
2 + β22) the proportion due to photo degradation. Equations 13 and 14 in Table 1 show the
values of β1 and β2. For the downwelling period of September 2006, β1 = 0.27 ± 0.07 and β2= 0.66 ± 0.07. Therefore, the relative contribution of photo- and biodegradation processes would be 86% and 14%, respectively. If the same procedure is followed for the upwelling event of June 07, only 23% of the variability of ΔF*(340/440) was due to photochemical process while 77% was due to microbial respiration. Note that R2 > β1
2 + β22 in both periods because the two predictor variables, Δa*CDOM(340)
and ΔAOU, covaried between themselves. However, using β1 and β2 ensures that the dependence of the predictor variables among them is ruled out of the analysis. Therefore, in this section we have been able to quantify the differential impact of microbial and photochemical processes on the optical properties of CDOM under contrasting downwelling and upwelling conditions. These differences had been previously suggested qualitatively by the distributions of Φ(340) and the regression slopes of the logarithmic plot of aCDOM(340) and S for both periods.
Table 2. Average ± SD values of the absorption coefficient (m-1) at several wavelengths, the spectral slope over the 250-500 nm wavelength range, and the fluorescent quantum yield at 340 nm for downwelling, upwelling, and both period in the Ría de Vigo. All samples collected in September 06 and June 07 were used to calculate the average ± SD values for downwelling and upwelling conditions, respectively. The last column of Table 2 was produced with all the samples collected in both periods.
Downwelling Upwelling Downwelling + UpwellingaCDOM(325) 0.57 ± 0.03 0.47 ± 0.19 0.54 ± 0.17aCDOM(340) 0.43 ± 0.11 0.35 ± 0.14 0.40 ± 0.13aCDOM(355) 0.32 ± 0.08 0.26 ± 0.11 0.29 ± 0.10aCDOM(375) 0.21 ± 0.06 0.17 ± 0.08 0.20 ± 0.07aCDOM(443) 0.055 ± 0.02 0.043 ± 0.02 0.051 ± 0.023S 0.020 ± 0.001 0.02 ± 0.001 0.021 ± 0.001Φ(340) 0.81 ± 0.11% 1.03 ± 0.30% 0.91 ± 0.3
Biogeochemical processes affecting CDOM in Ría de Vigo
145
Conclusions
Absorption coefficient and induced fluorescence of CDOM have been recurrently used in the literature to estimate DOC concentrations in coastal systems. The success of the prediction of DOC from aCDOM(λ) and/or F(λ) depends on a narrow variability of the carbon specific CDOM absorption coefficient, a*CDOM(λ), and the fluorescence quantum yield, Φ(λ). The best estimates have been obtained in coastal areas affected by strong freshwater influences, where the variability of a*CDOM(λ) and Φ(λ) is usually several orders of magnitude lower than aCDOM(λ) and F(λ). However, our work shows that a detailed study of the limited spatial and temporal variability of Φ(λ) in a particular coastal system can help to elucidate the relative importance of the microbial and photochemical processes that control the changes of the absorption coefficient and induced fluorescence properties produced and consumed in that system. In the case study of the Ría de Vigo, we obtained that 86% of the variability of Φ(340) during the mixing of shelf surface and continental waters under downwelling conditions was due to the photodegradation of CDOM. On the contrary, during the mixing of bottom shelf and continental waters under upwelling conditions, 77% of the variability of Φ(340) was due to microbial respiration. Concurrent induced fluorescence and absorption coefficient measurements in other coastal system would allow application of this methodology to infer the biogeochemical processes that control CDOM variability during estuarine mixing.
Acknowledgements
We wish to express our gratitude to all the participants in the CRIA project and to the captain and crew of the R/V Mytilus. Support for this work came from the Xunta de Galicia, grant number PGIDIT–05MA40201PR. C.M. was funded by project SUMMER, grant number CTM2008–03309/MAR, C.R.-C. was funded by a I3P-CSIC predoctoral fellowship and N.N.-C. was funded by a Marie Curie I.O.F. to carry out this work. We wish also express our gratitude to two anonymous reviewers for their comments.

Chapter IV
146
References
Álvarez-Salgado, X.A., Rosón, G. Pérez, F. F., Pazos, Y., 1993. Hydrographic variability off the Rías Baixas (NW Spain) during the upwelling season. J. Geophys. Res. 98, 14447–14455.
Álvarez-Salgado, X.A., Gago, J., Miguez, B.M., Perez, F.F., 2001. Net Ecosystem Production of Dissolved Organic Carbon in a Coastal Upwelling System: The Ria de Vigo, Iberian Margin of the North Atlantic. Limnology and Oceanography, 46, 135-147.
Babin, M., Stramski, D., Ferrari, G.M., Claustre, H., Bricaud, A., Obolensky, G., Hoepffner, N., 2003. Variations in the light absorption coefficients of phytoplankton, nonalgal particles, and dissolved organic matter in coastal waters around Europe. J. Geophys. Res. 108, 3122.
Blough, N.V., Del Vecchio, R. Chromophoric dissolved organic matter (CDOM) in the coastal environment. In: Hansell, D.A. and Carlson, C.A. (Eds), 2002. Biogeochemistry of Marine Dissolved Organic Matter. San Diego: Academic Press, p. 509–546.
Bricaud, A., Morel, A., Prieur, L., 1981. Absorption by dissolved organic matter of the sea (yellow substance) in the UV and visible domains. Limnol. Oceanogr. 26, 43-53.
Cermeño, P., Marañón, E., Pérez, V., Serret, P., Fernández, E., Castro, C.G., 2006. Phytoplankton size structure and primary production in a highly dynamic coastal ecosystem (Ría de Vigo, NW-Spain): Seasonal and short-time scale variability. Estuar. Coast. Shelf Sci. 67, 251-266.
Chen, R.F., Bada, J.L., 1992. The fluorescence of dissolved organic matter in seawater. Mar. Chem., 37, 191-221.
Chen, R.F., Zhang, Y., Vlahos, P. and Rudnick, S.M., 2002. The fluorescence of dissolved organic matter in the Mid-Atlantic Bight. Deep Sea Res. II 49(20), 4439-4459.
Coble, P.G., 1996. Characterization of marine and terrestrial DOM in seawater using excitation-emission matrix spectroscopy. Mar. Chem. 51, 325-346.
Coble, P.G., 2007. Marine Optical Biogeochemistry: The Chemistry of Ocean Color. Chem. Rev. 107: 402-418.
Coble, P.G., Del Castillo, C.E., Avril, B., 1998. Distribution and optical properties of CDOM in the Arabian Sea during the 1995 Southwest Monsoon. Deep-Sea Res. II 45, 2195-2223.

Biogeochemical processes affecting CDOM in Ría de Vigo
147
Day, D.A., Faloona, I., 2009. Carbon monoxide and chromophoric dissolved organic matter cycles in the shelf waters of the northern California upwelling system. J. of Geophys. Res. 114, C01006.
De Haan, H., 1993. Solar UV-Light Penetration and Photodegradation of Humic Substances in Peaty Lake Water. Limnol. and Oceanogr. 38, 1072-1076.
Del Castillo, C.E., Coble, P.G., 2000. Seasonal variability of the colored dissolved organic matter during the 1994-95 NE and SW Monsoons in the Arabian Sea. Deep Sea Res. II 47, 1563-1579.
Del Castillo, C.E., Miller, R.L., 2008. On the use of ocean color remote sensing to measure the transport of dissolved organic carbon by the Mississippi River Plume. Remote Sensing of Environment 112, 836-844.
Del Vecchio, R., Blough, N.V., 2004. Spatial and seasonal distribution of chromophoric dissolved organic matter and dissolved organic carbon in the Middle Atlantic Bight. Mar. Chem. 89, 169-187.
Doval, M.D., Álvarez-Salgado, X.A., Fiz, F.P.r., 1997. Dissolved organic matter in a temperate embayment affected by coastal upwelling. Mar. Ecol. Prog. Ser. 157, 21-37.
Eppley, R.W., Peterson, B.J. 1979. Particulate organic matter flux and planktonic new production in the deep ocean. Nature 282, 677-680.
Ferrari, G.M., Dowell, M.D., Grossi, S., Targa, C., 1996. Relationship between the optical properties of chromophoric dissolved organic matter and total concentration of dissolved organic carbon in the southern Baltic Sea region. Mar. Chem. 55, 299-316.
Ferrari, G.M., 2000. The relationship between chromophoric dissolved organic matter and dissolved organic carbon in the European Atlantic coastal area and in the West Mediterranean Sea (Gulf of Lions). Mar. Chem. 70, 339-357.
Figueiras, F. G., A. F. Ríos. 1993. Phytoplankton succession, red tides and the hydrographic regime in the Rias Bajas of Galicia. In: Smayda, T. J., Shimizu, Y. (Eds.), Toxic Phytoplankton Blooms in the Sea. Elsevier Science Publishers B.V., pp. 239-244.
Gago, J., Álvarez-Salgado, X.A., Nieto-Cid, M., Brea, S., Piedracoba, S., 2005. Continental inputs of C, N, P and Si species to the Ría de Vigo (NW Spain). Estuarine, Coastal and Shelf Science, 65, 74-82.

Chapter IV
148
Green, S.A., Blough, N.V., 1994. Optical Absorption and Fluorescence Properties of Chromophoric Dissolved Organic Matter in Natural Waters. Limnol. Oceanogr. 39, 1903-1916.
Häder, D.-P, Sinha, R.P., 2005. Solar ultraviolet radiation-induced DNA damage in aquatic organisms: Potential environmental impact. Mutation Research 571: 221–233.
Hoge, F.E., Swift, R.N., Yungel, J.K., 1993. Fluorescence of Dissolved Organic Matter: A Comparison of North Pacific and North Atlantic Oceans During April 1991. J. Geophys. Res. 98, 22,779-22,787.
Kieber, R.J., Hydro, L.H., Seaton, P.J., 1997. Photooxidation of Triglycerides and Fatty Acids in Seawater: Implication Toward the Formation of Marine Humic Substances. Limnol. and Oceanogr. 42, 1454-1462.
Klinkhammer, G.P., McManus, J., Colbert, D., Rudnicki, M.D., 2000. Behavior of terrestrial dissolved organic matter at the continent-ocean boundary from high-resolution distributions. Geochim. Cosmochim. Acta 64, 2765-2774.
Kowalczuk, P., Cooper, W. J., Durako, M. J., Kahn, A. E., Gonsior, M., Young, H., 2010. Characterization of dissolved organic matter fluorescence in the South Atlantic Bight with use of PARAFAC model: Relationships between fluorescence and its components, absorption coefficients and organic carbon concentrations. Mar. Chem. 118, 22-36.
Kramer, G.D., Herndl, G.J., 2004. Photo- and bioreactivity of chromophoric dissolved organic matter produced by marine bacterioplankton. Aquat. Microb. Ecol. 36, 239-246.
Kudela, R.M., Garfield, N., Brulanda, K.W., 2006. Bio-optical signatures and biogeochemistry from intense upwelling and relaxation in coastal California. Deep Sea Res. II 53, 2999–3022.
Lønborg, C., Alvarez-Salgado, X.A., Martinez-Garcia, S., Miller, A.E.J., Teira, E., 2010. Stoichiometry of dissolved organic matter and the kinetics of its microbial degradation in a coastal upwelling system. Aquat. Microb. Ecol. 58, 117-126.
Moran, M.A., Sheldon, W.M., Zepp, R.G., 2000. Carbon Loss and Optical Property Changes during Long-Term Photochemical and Biological Degradation of Estuarine Dissolved Organic Matter. Limnol. and Oceanogr. 45, 1254-1264.

Biogeochemical processes affecting CDOM in Ría de Vigo
149
Melhuish, W.H., 1961. Quantum efficiencies of fluorescence of organic substances: effect of solvent and concentration of the fluorescent solute. J. Phys. Chem. 65, 229-235.
Nelson, N.B., Craig, A.C., Steinberg, D.K., 2004. Production of chromophoric dissolved organic matter by Sargasso Sea microbes. Mar. Chem. 89, 273– 287.
Nelson, N.B., Siegel, D. A., Carlson, C. A., Swan, C., Smethie, Jr W. M., Khatiwala, S., 2007. Hydrography of chromophoric dissolved organic matter in the North Atlantic. Deep Sea Res. I 54, 710-731.
Nelson, N.B., Siegel, D.A., Carlson, C.A., Swan, C.M., 2010. Tracing global biogeochemical cycles and meridional overturning circulation using chromophoric dissolved organic matter. Geophys. Res. Letters 37, L03610.
Nieto-Cid, M., Álvarez-Salgado, X.A., Gago, J., Pérez, F.F., 2005. DOM fluorescence, a tracer for biogeochemical processes in a coastal upwelling system (NW Iberian Peninsula). Mar. Ecol. Prog. Ser. 297, 33-50.
Nieto-Cid, M., Álvarez-Salgado, X.A., Pérez, F.F., 2006. Microbial and photochemical reactivity of fluorescent dissolved organic matter in a coastal upwelling system. Limnol. and Oceanogr. 51, 1391-1400.
Piedracoba S., Nieto–Cid, M., Teixeira, I.G., Garrido, J.L., Álvarez–Salgado, X.A., Rosón, G.., Castro, C.G., Pérez, F.F., 2008. Physical–biological coupling in the coastal upwelling system of the Ría de Vigo (NW Spain). II: An in vitro approach. Mar. Ecol. Progr. Ser. 353: 41–53.
Romera-Castillo, C., Sarmento, H., Álvarez-Salgado, A.X., Gasol, J.M., Marrasé, C., 2010. Production of chromophoric dissolved organic matter by marine phytoplankton. Limnol. Oceanogr, 55, 446–454.
Siegel, D.A., Maritorena, S., Nelson, N.B., 2002. Global distribution and dynamics of colored dissolved and detrital organic materials. J. Geophys. Res. 107, 3228.
Smith, S.V., Hollibaugh J.T., 1997. Annual cycle and interannual variability of ecosystem metabolism in a temperate climate embayment. Ecol. Monogr. 67, 509-533.
Stedmon, C.A., Markager, S., Kaas, H., 2000. Optical Properties and Signatures of Chromophoric Dissolved Organic Matter (CDOM) in Danish Coastal Waters. Estuar. Coast. Shelf Sci. 51, 267-278.

Chapter IV
150
Stedmon, C.A., Markager, S., 2001. The optics of chromophoric dissolved organic matter (CDOM) in the Greenland Sea: An algorithm for differentiation between marine and terrestrially derived organic matter. Limnol. Oceanogr, 46, 2087–2093.
Stedmon, C.A., Osburn, C.L., Kragh, T., 2010. Tracing water mass mixing in the Baltic–North Sea transition zone using the optical properties of coloured dissolved organic matter. Estuar. Coast. Shelf Sci. 87, 156-162.
Swan, C.M., Siegel, D.A., Nelson, N.B., Carlson, C.A., Nasir, E., 2009. Biogeochemical and hydrographic controls on chromophoric dissolved organic matter distribution in the Pacific Ocean. Deep Sea Res. I 56, 2175-2192.
Sokal, F. F., F. J. Rohlf. 1995. Biometry. Freeman.
Torres, R., Barton, E.D., Miller, P., Fanjul, E., 2003. Spatial patterns of wind and sea surface temperature in the Galician upwelling region. J. Geophys. Res. 108, 3130.
Vodacek, A., Hoge, F. E., Swift, R. N., Yungel, J. K., Peltzer, E. T., Blough, N. V., 1995. The use of in situ and airborne fluorescence measurements to determine UV absorption coefficients and DOC concentrations in surface waters. Limnol. and Oceanogr. 40, 411-415.
Vodacek, A., Blough, N.V., 1997. Seasonal variation of CDOM and DOC in the Middle Atlantic Bight: Terrestrial inputs and photooxidation. Limnol. Oceanogr. 42, 674-686.
Wanninkhof, R. 1992. Relationship between wind speed and gas exchange over the ocean. J. Geophys. Res. 97, 7373-7382.
Wooster W.S., Bakun A., McLain D.R., 1976. The seasonal upwelling cycle along the eastern boundary of the North Atlantic. J. Mar. Res. 34, 131–140.
Yamashita, Y., Tanoue, E., 2008. Production of bio-refractory fluorescent dissolved organic matter in the ocean interior. Nature Geosci. 1, 579-582.
Yentsch, C.S., Reichert, C.A., 1961. The Interrelationship between Water-Soluble Yellow Substances and Chloroplastic Pigments in Marine Algae. Bot. Mar. 3, 65-74.

Biogeochemical processes affecting CDOM in Ría de Vigo
151
Zepp, R.G., Sheldon, W.M., Moran, M.A., 2004. Dissolved organic fluorophores in southeastern US coastal waters: correction method for eliminating Rayleigh and Raman scattering peaks in excitation-emission matrices. Mar. Chem. 89, 15-36.

Chapter V:
Seasonal variability of different dissolved organic matter fractions followed by absorption and fluorescence spectroscopy in an oligotrophic coastal system (Blanes Bay, NW Mediterranean)

Chapter V
154

Seasonal cycle of CDOM in Blanes Bay
155
Abstract
Harmonic analysis of 2 ½ years of data collected with fortnight to monthly frequency were made in the oligotrophic Bay of Blanes (NW Mediterranean). The study revealed that the water column mixing-stratification cycle imposed by natural radiation dictates the seasonal built up of the bulk and different coloured fractions of dissolved organic matter (DOM). Dissolved organic carbon, DOC, accumulated during the spring and summer reaching the annual maximum by mid September, one month later than water temperature. The seasonal cycle of the fluorescence of aromatic protein-like substances, F(280/350), a labile fraction of DOM, was in phase with DOC, suggesting that malfunctioning of the microbial loop by severe nutrient limitation is the reason behind the late summer accumulation of these materials. The absorptivity of the conjugated carbon double bonds characteristic of refractory DOM, a*CDOM(254), a by-product of microbial respiration, reached annual maximum values in late April. Conversely, the fluorescence of aromatic humic-like substances absorbing in the UV-A region, F(340/440), presented an annual minimum in early August, because of the prevalence of photo-degradation over microbial production of this fluorophore.

Chapter V
156

Seasonal cycle of CDOM in Blanes Bay
157
Introduction
Coloured dissolved organic matter (CDOM) includes all dissolved organic compounds that absorb ultraviolet and visible radiation. It is the major factor controlling the attenuation of UV radiation in the ocean (Kirk, 1994), which affect both primary and bacterial production (Herndl et al., 1993; Smith and Cullen, 1995). The absorption properties of CDOM are due to the occurrence of conjugated carbon double bonds; when they form aromatic rings, fluorescence emission of the absorbed light often occurs (Stedmon and Alvarez-Salgado, 2011). The absorption coefficients and spectral slopes have been used as tracer of the refractory DOM structure and as indicator of the origin of the DOM (i.e., Dahlén et al., 1996; Nelson et al., 2004; Helms et al., 2008). The fraction of CDOM that emits as fluorescence the absorbed UV radiation is called fluorescent dissolved organic matter (FDOM). The consecution of some emission fluorescence spectra collected at different wavelengths of excitation result in excitation emission matrices (EEMs) where different peaks characteristics of aromatic compounds can be distinguished (Coble et al., 1996). Named peaks –C, –M and –A are due to fluorophors of humic-like substances while peak-T does of protein-like substances. This can help us to follow the dynamics of different pools of DOM that not always have the same source and sink.
The variability of absorption and fluorescent has been found to be a useful tracer of biogeochemical processes in coastal systems (Romera-Castillo et al. 2011). Main biogeochemical processes affecting the optical properties of the DOM are 1) photodegradation, provoking a loss of absorption and fluorescence at UVB and UVA wavelengths; 2) biodegradation, originating an increase in absorption and fluorescence. Therefore, the study of the variations of both variables as well as the index obtained from them (i.e., aCDOM(254), S(250-500), fluorescent quantum yield) allows us to semi-quantify the main processes affecting the system.
In coastal areas, the strength of seasonal cycles is more notably than in open ocean (Bringham and Lukas, 1996). This could be other process affecting CDOM variability. Some works have studied the seasonal variability of CDOM in coastal systems (i.e., Vodacek and Blough, 1997; Conmy et al., 2004) but not many presented data with continuous periodicity (Nelson et al., 1998; Para et al., 2010).
The Blanes Bay Microbial Observatory is a reference station in the NW Mediterranean Sea placed 1 Km offshore of the town of Blanes. In summer, the population of Blanes increases by about 5-fold, because the tourism, increasing the sewage discharge into the bay (Duarte et al., 1999). Due to the low concentration of nutrients and the production limited by phosphorous the most of the year, it is considerer an oligotrophic system (Lucea et al. 2005). The prolonged period of high atmospheric pressure and associated high irradiance and calm waters in late winter is the main seasonal trigger in the NW Mediterranean Sea, setting the development of phytoplankton blooms (Duarte et al., 1999). This station
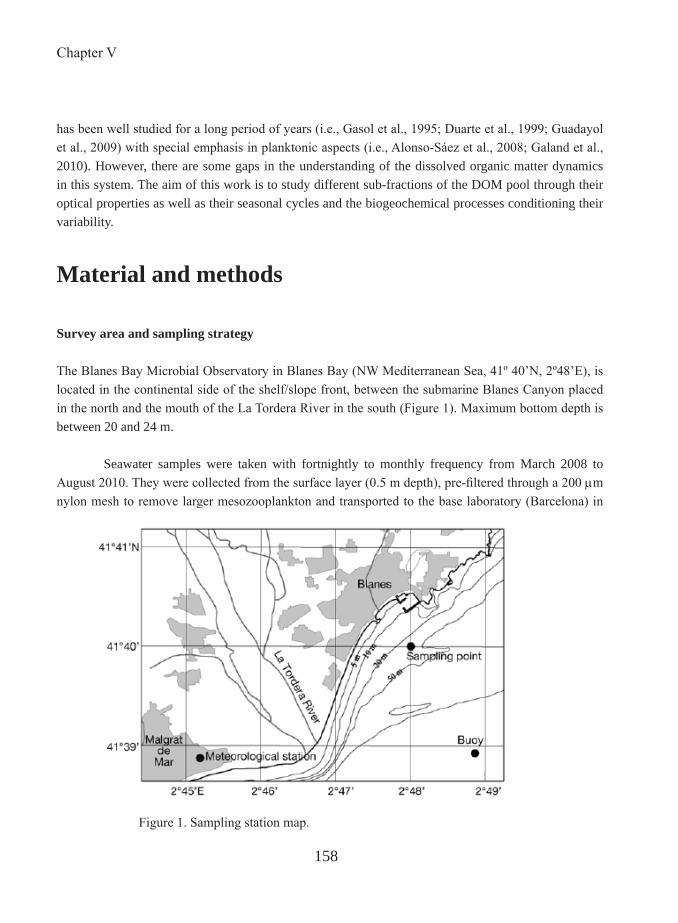
Chapter V
158
has been well studied for a long period of years (i.e., Gasol et al., 1995; Duarte et al., 1999; Guadayol et al., 2009) with special emphasis in planktonic aspects (i.e., Alonso-Sáez et al., 2008; Galand et al., 2010). However, there are some gaps in the understanding of the dissolved organic matter dynamics in this system. The aim of this work is to study different sub-fractions of the DOM pool through their optical properties as well as their seasonal cycles and the biogeochemical processes conditioning their variability.
Material and methods
Survey area and sampling strategy
The Blanes Bay Microbial Observatory in Blanes Bay (NW Mediterranean Sea, 41º 40’N, 2º48’E), is located in the continental side of the shelf/slope front, between the submarine Blanes Canyon placed in the north and the mouth of the La Tordera River in the south (Figure 1). Maximum bottom depth is between 20 and 24 m.
Seawater samples were taken with fortnightly to monthly frequency from March 2008 to August 2010. They were collected from the surface layer (0.5 m depth), pre-filtered through a 200 µm nylon mesh to remove larger mesozooplankton and transported to the base laboratory (Barcelona) in
21
Figure 1. Sampling station map.

Seasonal cycle of CDOM in Blanes Bay
159
acid-washed 25 L polycarbonate carboys within 2 hours. In situ water salinity and temperature were measured with an YSI 556 MPS Multi Probe system.
Chemical analysis
For the analysis of the carbon content and the absorption and fluorescence properties of DOM, samples were filtered through Whatman GF/F filter using an acid-cleaned glass filtration system. Approximately 10 mL of water were collected in pre-combusted (450ºC, 12 h) glass ampoules for dissolved organic carbon (DOC) determination. H3PO4 was added to acidify the sample to pH < 2 and the ampoules were heat-sealed and stored in the dark at 4ºC until analysis. DOC was measured with a Shimadzu TOC-V organic carbon analyser. The system was standardized daily with potassium hydrogen phthalate. Each ampoule was injected 3–5 times and the average area of the 3 replicates that yielded a standard deviation <1% were chosen to calculate the average DOC concentration of each sample after subtraction of the average area of the freshly-produced UV-irradiated milli-Q water used as a blank.
Samples for CDOM and FDOM determination were measured immediately after filtration, between 2 and 3 h after collection.
CDOM absorption was measured in a Varian Cary spectrophotometer equipped with a 10 cm quartz cell. Spectral scan were collected between 250 and 750 nm at a constant room temperature of 20ºC. Milli-Q water was used as blank. The absorption coefficient at any wavelength, aCDOM(λ) (in m-1), was calculated as 2.303·Abs(λ)/l, where Abs(λ) is the absorbance at wavelength λ, and l is the cell length in meters. Using the Levenberg-Marquardt algorithms implemented in the Stat Soft Inc. STATISTICA software, we obtained the coefficients aCDOM(254), S and K that best fit the equation:
(1)
where aCDOM(254) is the absorption coefficient at wavelength 254 nm (in m-1), S is the spectral slope (in nm-1) and K is a background constant caused by residual scattering by fine size particle fractions, micro-air bubbles or colloidal material present in the sample, refractive index differences between sample and the reference, or attenuation not due to organic matter (in m-1). The carbon specific absorption coefficient at 254 nm, a*CDOM(254) or SUVA254 (Weishaar et al., 2003), was calculated dividing aCDOM(254) by the DOC concentration.
CDOM induced fluorescence (FDOM) was determined with a LS 55 Perkin Elmer Luminescence spectrometer, equipped with a xenon discharge lamp, equivalent to 20 kW for 8 μs duration. The instrument has 2 monochromators that ranged between 200 and 800 nm for excitation wavelengths and between 200 and 900 nm for emission wavelengths. The detector was a red-sensitive
KSaa 254λ-exp(254)λ CDOMCDOM
Chapter V
160
R928 photomultiplier, and a photodiode worked as reference detector. Slit widths were fixed to 10 nm for the excitation and emission wavelengths and the scan speed was 250 nm min–1. Measurements were performed at a constant room temperature of 20°C in a 1 cm quartz fluorescence cell. Single measurements at specific excitation-emission wavelengths (Ex/Em) were performed. To compare with other works, the wavelengths chosen for the Ex/Em pair measurements were those previously established by Coble (1996): 280 nm/350 nm (peak-T) for protein-like substances; and 320 nm/410 nm (peak-M) and 340 nm/440 nm (peak-C) for humic-like substances absorbing in the UV-C. The fluorescence of UV-radiated Milli-Q at those Ex/Em pairs was subtracted to all samples. Following Coble (1996), fluorescence intensities were expressed in quinine sulphate units (QSU) by calibrating the instrument at Ex/Em: 350 nm/450 nm against a quinine sulphate dihydrate (QS) standard made up in 0.05 mol L-1 sulphuric acid. Fluorescence intensities of peak-T, peak-M and peak-C in QSU has been named as F(280/350), F(320/410) and F(340/400), respectively.
Finally, the quantum yield of fluorescence at excitation 340 nm, Φ(340), was obtained from the ratio of the fluorescence intensity at peak-C, F(340/440), to the absorption coefficient at 340 nm, aCDOM(340), multiplied by the universal factor of 2.2(±0.1) 10-3 m-1 QSU-1 obtained by Romera-Castillo et al. (2011):
(2)
Harmonic analysis of the time series
To obtain the annual mean (b1), amplitude (b2) and diphase (b3) parameters defining the seasonal cycle of any variable (Y), a harmonic analysis of the annual component (period, 365 days) of each time series has been performed. Again, using the Levenberg-Marquardt algorithms implemented in the Stat Soft Inc. STATISTICA software, we fitted the data of water temperature, salinity, DOC, aCDOM(254), a*CDOM(254), S, F(340/440), Φ(340), and F(280/350) to the following trigonometric equation:
(3)
where t is the Julian day (ranging from 1 to 365/366). From the diphase parameter, b3, we calculated the Julian day at which each time series achieved the annual maximum value.
)33652·cos(21 btbb Y
)340(a)440/340(F102.2)340( 3
CDOM

Seasonal cycle of CDOM in Blanes Bay
161
Results
Annual cycles of the bulk and coloured fractions of DOM
Sea surface temperature in Blanes Bay followed a well-defined annual cycle (Fig. 2a) that explains 90% of the variability of the time series with an average annual mean of 16.8 ± 0.2 ºC (Table 1). The lowest temperatures, 11.5ºC, occurred by mid February at the time of maximum winter mixing, and the highest, 22.1 ºC, were recorded by mid August (Julian day, 231 ± 3), when summer stratification was highest. Conversely, the annual cycle explained only 24% of the variability of the time series of salinity (Fig. 2b). Salinity was quite stable around the annual average of 37.98 ± 0.04, the amplitude being just 0.18 ± 0.02, except during a few particular dates associated with rainwater episodes.
DOC and the optical properties of CDOM also described statistically significant annual cycles. Eq. 3 explained 56% of the variability of DOC. The annual mean concentration of DOC was 81 ± 2 µmol C L-1; it accumulated in the surface layer of Blanes Bay from the annual minimum of 64 µmol C L-1 recorded by early March to the annual maximum of 98 µmol C L-1 by mid September (Julian day 252 ± 19; Fig. 2c, Table 1), about one month later than the maximum of sea surface temperature. These are the typical annual values but higher values reaching 140 µmol C L-1 has been sporadically registered.
Fifty three percent of the variability of the absorption coefficient at 254 nm, aCDOM(254), an indicator of the abundance of conjugated carbon double bounds (Lakowicz et al., 2006), was explained by eq. 3. Although aCDOM(254) also accumulated through the spring and summer, the annual maximum absorption of 1.75 m-1 (Fig. 2d) occurred by late July (Julian day, 210 ± 10), i.e. 42 ± 13 days before the annual maximum of DOC (Table 1). The diphase of DOC and aCDOM(254), led to an annual cycle of a*CDOM(254) that reaches the annual maximum of 22.4 m2 mol C-1 by late April (Julian day, 114 ± 20). a*CDOM(254) is used as an aromaticity index since Weishaar et al. (2003) found a good correlation between this variable and the percentage of aromaticity determined by 13C–NMR spectroscopy. Therefore, the seasonal accumulation of aromatic DOM compounds absorbing in the UV-C region of the spectrum was out of phase with the accumulation of the bulk DOM, which occurred almost 5 months latter (138 ± 22 days). Other useful indices are the absorption coefficient ratio at 254 nm to 365 nm, aCDOM(254/365) and the absorption spectral slope, S (Fig. 2e), which are inversely correlated with the average molecular weight of DOM (Dahlen et al. 1996; Engelhaupt et al. 2003). In our study, both variables described statistically significant annual cycles that explained 25-32% of the total variability of the time series and were in phase with the annual cycle of DOC.
The fluorescence of aromatic humic-like substances absorbing in the UV-A region of the spectrum, F(340/440), followed an annual cycle that explained 47% of the variability of the time series

Chapter V
162
VariableA
nnual mean (b1)
Am
plitude (b2)D
iphase (b3)R
2n
Time series
maxim
um (Julian
day)Tem
perature (ºC)
16.8 ± 0.2-5.3 ± 0.3
24.30 ± 0.050.90
37231 ± 3
Salinity37.98 ± 0.04
0.18 ± 0.06-18.06 ± 0.32
0.2437
319 ± 19D
OC
(μmol L
-1)81 ± 2
-17 ± 45.1 ± 0.1
0.5632
252 ± 9a
CD
OM (254) (m
-1)1.58 ± 0.02
-0.18 ± 0.04-0.5 ± 0.2
0.5325
210 ± 10a*
CD
OM (254) (m
2 mol C
-1)19 ± 1
-3 ± 11.18 ± 0.34
0.4023
114 ± 20a
CD
OM (254/365)
15.3 ± 0.6-2.3 ± 0.9
17.7 ± 0.40.25
25248 ± 21
S(250-500) (nm-1)
0.0257 ± 0.0004-0.0016 ± 0.0005
-1.1 ± 0.30.32
25248 ± 18
F(340/440) (QSU
)0.50 ± 0.02
0.13 ± 0.03-0.6 ± 0.2
0.4735
34 ± 10F(280/350) (Q
SU)
1.11 ± 0.050.25 ± 0.07
8.1 ± 0.30.27
35260 ± 16
Q.Y. (%
)0.65 ± 0.02
0.16 ± 0.03-0.3 ± 0.2
0.5025
17 ± 10A
ll the variables fitted the equation with p < 0.01.
Table 1. Value ± standard error of the estimation of the param
eters of eq. 3 for the time series of the study variables: annual m
ean (b1), am
plitude (b2) and diphase (b3). Coefficients b1 and b2 are expressed in the units of the each variable and b3 is expressed in radians.
The Julian day when the annual m
aximum
of each variable occurred was calculated from
b3. R2, coefficient of determ
ination of the regression equation; p, level of significance; n, num
ber of data of each time series.

Seasonal cycle of CDOM in Blanes Bay
163
and was out of phase with aCDOM(254) and DOC. F(340/440) evolved from an annual maximum of 0.63 QSU by early February to a minimum of 0.36 QSU by early August (Fig. 2f). The distribution of the fluorescence quantum yield at 340 nm, Φ (340), an spare aromaticity index (Birks, 1970; Turro, 1991) followed also a statistically significant seasonal cycle that explained 50% of its variability and was in phase with F(340/440) (Table 1). Annual average Φ (340) was 0.65 ± 0.02%, ranging from an annual maximum of 0.81% to a minimum of 0.49%. Conversely, the fluorescence of aromatic protein-like substances (Fig. 2g) described an annual cycle that explained 27% of the variability of the time series and was in phase with DOC, reaching the annual maximum by mid September (Julian day, 260 ± 16; Table 1).
Deseasonalized time series
The studied variables were deseasonalised by subtracting the annual cycles modelled with eq. 3 (dotted lines in Figure 2) from the original times series (open dots in Figure 2). The deseasonalised time series of the fluorescence of the humic-like peak-C, ΔF(340/440) (Figure 3a) was generally opposite to the deseasonalised time series of salinity, ΔSal (Figure 3b). In fact, a significantly negative linear correlation (R2 = 0.44, p < 0.01) existed between ΔF(340/440) and ΔSal (Table 2). ΔSal was negatively correlated with the aromaticity index Φ (340) (R2 = 0.33, p < 0.01). On the other hand, the deseasonalised time series of the protein-like peak-T, ΔF(280/350) (Figure 3c) and the bulk DOC, ΔDOC (Figure 3d), followed the same trend; a significantly positive linear correlation (R2 = 0.49, p < 0.01) existed between ΔF(280/350) and ΔDOC (Table 2).
Discussion
The Blanes Bay Microbial Observatory is representative for pristine oligotrophic coastal ecosystems which sporadically receives nutrients and terrestrial carbon inputs during stormy periods (Gudadayol et al., 2009). The annual cycle of sea surface temperature traces the seasonal evolution from winter mixing to summer stratification characteristic of temperate latitudes. Increasing water column stratification throughout the spring and summer prevents the upward flux of new inorganic nutrients to the surface layer, leading to severe oligotrophic conditions (Sommaruga et al., 2005; Alonso-Sáez et al., 2008). Nutrient concentrations during the summer seasons of the studied years were around 0.03 µmol L-1 for phosphate, 0.3 µmol L-1 for inorganic nitrogen, and 0.1 µmol L-1 for silicate (data not shown). The typical annual range of DOC concentrations recorded during the study period, from 64 µmol L-1 in late winter to 98 µmol L-1 in late summer, has been previously observed in Blanes Bay (Lucea et al., 2005; Alonso-Sáez et al., 2008) as well as in other temperate marine ecosystems relatively unaffected by terrestrial inputs as (Nelson et al., 1998; Álvarez-Salgado et al., 2001). The accumulation of DOC of

Chapter V
164
22
tem
pera
ture
(ºC
)
101316192225
salin
ity
36.837.237.638.038.4
F(34
0/44
0) (Q
SU)
0.00.20.40.60.81.0
DO
C (µ
mol
L-1
)
50
80
110
140
S(25
0-50
0) (n
m-1
)
0.020
0.024
0.028
0.032a C
DO
M(2
54 (m
-1)
1.31.51.71.92.1
month/year
03/0
8
05/0
8
07/0
8
09/0
8
11/0
8
01/0
9
03/0
9
05/0
9
07/0
9
09/0
9
11/0
9
01/1
0
03/1
0
05/1
0
07/1
0
09/1
0 F(
280/
350)
(QSU
)
0.40.81.21.62.02.4
a)
b)
c)
d)
e)
f)
g)
Figure 2. Seasonal distribution of a) temperature (ºC), b) salinity, c) DOC (µmol·L-1), d) aCDOM(254), e) Spectral slope at 250-500 range (nm-1), f) peak-T or F(280/350) and g) peak-C or F(340/440). Modelled values (dotted line) and measured values (open dots).

Seasonal cycle of CDOM in Blanes Bay
165
40 µmol C L-1 observed in Blanes is similar to that reported in the temperate stations of Hawaii Ocean Time Series (40µmol C L-1, http://hahana.soest.hawaii.edu/hot/) but doubles that of Bermuda Atlantic Time Series Study (15 µmol C L-1, Nelson et al., 1998).
The refractory and labile aromatic dissolved materials traced by aCDOM(254) and peak-T, respectively, accumulated also in Blanes Bay during the spring and summer. However, aCDOM(254) reached its annual maximum about 1 ½ months before than peak -T that, in turns, was in phase with DOC. Therefore, the optical properties of CDOM allowed distinguishing the differential accumulation of two DOC pools of contrasting bioavailability. Among the microbial respiration by-product there are compounds with conjugated carbon double bonds traced by aCDOM(254) since bacteria produce fluorescent humic-like substances at Ex/Em 250/435 nm (Romera-Castillo et al., submit.). Coefficient aCDOM(254) is higher in surface waters because biological activity is more intense in the photic layer and photobleaching of this material does not occur because the natural UV-C radiation is unable to reach the Earth surface (Fichot and Benner, 2011). Therefore, the annual minimum of aCDOM(254) is recorded in winter because of mixing with the less coloured bottom waters of Blanes Bay and it accumulates during the spring and summer because of net production by microbial respiration in the stratified surface layer. Coherently, the maximum proportion of conjugated carbon double bonds per unit of organic carbon, a*CDOM(254), occurred in spring, when biological activity is maximum in Blanes Bay (Alonso-Sáez et al., 2008).
The fact that the annual cycle of peak-T is in phase with DOC, suggests that the DOC accumulated in Blanes Bay contains not only the refractory materials traced by aCDOM(254) but also biologically labile materials, including fluorescent free and combined aromatic amino acids. In this sense, it is known that continued maintenance of the photosynthetic machinery after nutrient exhaustion may be accompanied by excretion of DOM and especially carbohydrates (Norman et al., 1995). Despite the potential lability of the exuded materials, they cannot be processed by heterotrophic bacteria because of nutrient limitation (Thingstad et al., 1997). Therefore, the summer accumulation of DOC in oligotrophic systems is likely due to a malfunctioning of the microbial loop (Thingstad et al., 1997). The accumulation of DOM is a common mechanism that has also been evidenced in this and other oligotrophic aquatic environments (i.e., Sargasso Sea, Thingstad et al., 1997; Siegel et al., 2002) as well as in experimental mesocosms (Norman et al., 1995). And the accumulation of protein-like substances in summer was also observed in Florida Bay (Jaffé et al., 2008).
The annual cycle of the coloured and fluorescent refractory humic-like materials that absorbs natural light at wavelengths >300 nm, i.e. in the UV-B and UV-A range of the spectrum, in Blanes Bay, results from the prevalence of consumption by photodegradation over production by microbial respiration of these materials (Coble, 2007). This pattern has been previously observed in other marine ecosystems little influenced by continental runoff such as the oligotrophic BATS site (Nelson et al., 1998; 2004) or

Chapter V
166
the eutrophic Iberian coastal upwelling system (Nieto-Cid et al. 2006; Romera-Castillo et al., 2011) and it is the reason behind the relatively low values of the absorption coefficient (Nelson et al., 2010) and the induced fluorescence (Yamashita and Tanoue 2008) of CDOM in surface ocean waters. Therefore, the annual maximum accumulation of aCDOM(340) (not shown) and F(340/440) is recorded in winter because of mixing with the more coloured/fluorescent bottom waters of Blanes Bay and because it is degradated during the spring and summer as a consequence of intense photobleaching in the stratified surface layer. Note that this annual pattern is opposite for the refractory coloured materials absorbing at wavelengths <300 nm, represented here by aCDOM(254), which does not experience photobleaching.
Annual mean aCDOM(340) in Blanes Bay was 0.17 ± 0.01 m-1, which does not differ from the average values reported for the NW Mediterranean in the Bay of Marseilles (Ferrari et al. 2000; Para et al. 2010). These absorption coefficients are higher than those found in oligotrophic open ocean waters (Nelson et al., 2010) but lower than in eutrophic coastal upwelling areas (Coble et al., 1998; Day and Faloona, 2009; Romera-Castillo et al., 2011). In the particular case of the Ría de Vigo (NW Spain), aCDOM(340) ranged from 0.43 ± 0.11 m-1 for downwelling to 0.35 ± 0.14 m-1 for upwelling conditions (Romera-Castillo et al. 2011). Given that the average DOC concentration in the Ría de Vigo, 78 μmol L-1, and Blanes Bay, 81 μmol L-1, are quite comparable, the carbon specific absorption coefficient at 340 nm was about twice in the eutrophic than in the oligotrophic coastal system.
Photobleaching reduced F(340/440) in Blanes Bay by 42% from the annual maximum in early February to the annual minimum in early August. This fraction is close to that reported in the Middle Atlantic Bight where this percent was ~30% (Vodacek and Blough, 1997) and that in the eutrophic coastal system of Ría de Vigo (40-50%, Nieto-Cid et al., 2006). This could be due to the difference in the radiation intensity as well as the nature of the DOM.
Photobleaching of humic-like materials produces a dramatic loss of aromaticity and a decrease of the molecular weight of the irradiated materials (Moran and Zepp, 1997; Osburn et al., 2001). Coherently, our annual cycles of the aromaticity indices a*CDOM(254) and Φ(340) and the average molecular weight indices aCDOM(254/365) and S agree with the photodegradation of aromatic and high molecular weigh compounds during the summer to produce colourless more aliphatic and lower molecular weigh products, CO and CO2 (Moran and Zepp, 1997). Therefore, the fraction of CDOM that reaches maximum concentrations by mid-September seems to be of relatively low average molecular weight and aromaticity. Although labile compounds are formed during photodegradation processes (Moran and Zepp, 1997; Obernosterer et al., 1999), the previously referred malfunctioning of the microbial loop could lead to the accumulation of these materials in the stratified surface layer.
The annual mean ± amplitude of the absorption spectral slope, 0.0257 ± 0016 nm-1, obtained in Blanes Bay (Table 1) are relatively high when compared with the values reported for surface waters

Seasonal cycle of CDOM in Blanes Bay
167
23
F(34
0/44
0) (Q
SU)
-0.2-0.10.00.10.2
F(28
0/35
0) (Q
SU)
-0.4-0.20.00.20.40.60.81.0
Month/year
03/0
8
05/0
8
07/0
8
09/0
8
11/0
8
01/0
9
03/0
9
05/0
9
07/0
9
09/0
9
11/0
9
01/1
0
03/1
0
05/1
0
07/1
0
DO
C (µ
mol
L-1
)-20-10010203040
salin
ity
-1.0-0.8-0.6-0.4-0.20.00.20.4
a)
b)
c)
d)
Figure 3. Seasonal distribution of the deseasonalized a) peak-C or F(340/440), b) salinity, c) peak-T or F(280/350) and d) DOC (µmol·L-1).

Chapter V
168
of the Gulf of Lions (0.017 ± 0.003 nm-1, Ferrari et al. 2000) and the Bay of Marseilles (0.019 ± 0.003 nm-1, Para et al. 2010), both in the NW Mediterranean Sea, or for an eutrophic coastal embayment as the Ría de Vigo (0.0205 ± 0.0013 nm-1; Romera Castillo et al., 2011). Continental CDOM inputs and photodegradation processes tend both to rise absorption spectral slopes (Del Vecchio and Blough, 2004; Nelson et al., 2010). Since natural irradiation is not far different between both sites rounding 162 W/m2 (Ruiz et al., 2008; www.meteogalicia.es), the reason behind the relatively high values of S in Blanes Bay is likely because Blanes Bay has less terrestrial influence than the Bay of Marseille, which is close to the major source of freshwater and terrigenous particles of the NW Mediterranean Sea (Rhône River, Pont, 1996) or the Ría de Vigo, which directly receive Oitaben-Verdugo river waters with an average annual flow of 15 m3 s–1 (Nogueira et al. 1997). As in Blanes, absorption spectral slopes in Marseille are relatively lower during winter and higher during summer (Ruiz et al., 2008) as a consequence of the characteristic seasonal increase of photo-degradation at temperate latitudes.
The annual mean ± amplitude of the fluorescence quantum yield at 340 nm found in Blanes Bay, 0.65 ± 0.16%, is within the range of values reported for the Gulf of Lions but lower than the average yields recorded in the more eutrophic Rhône river plume (0.96%; Ferrari, 2000) and Ria de Vigo (0.91 ± 0.30%). Laboratory experiments have shown that photobleaching produces a decrease, and microbial degradation an increase, of the fluorescence quantum yield (De Haan, 1993; Lønborg et al., 2010). Therefore, the distinct values of Φ(340) found in oligotrophic and eutrophic sites can be explained on basis on a larger influence of microbial degradation in the latter.
The seasonal cycle of the fluorescent humic-like substances is disrupted by the episodic arrival of continental waters to the sampling site, which can be traced by a decrease of salinity (Figure 2b). Lower salinities are usually accompanied by higher values of F(340/440) (Figure 3a and b); in fact, a significant negative correlation was observed between the deseasonalised times series of salinity, F(340/440) and Φ(340) (Table 2). This is because continental waters are characterised by higher humic-like fluorescence values produced by more aromatic compounds than marine waters
Equation R2 p NΔF(340/440) = -0.27 (± 0.05) · ΔSal 0.44 < 0.01 34
ΔΦ(340) = -0.25 (± 0.07) · ΔSal 0.33 < 0.01 26ΔF(280/350) = 0.018 (±0.003) · ΔDOC 0.49 < 0.01 31
Table 2. Coefficients of the linear regression equations between the deseasonalised time series of the fluorescence of peak-C, F(340/440), and peak-T, F(280/350), the absorption coefficient at 254 nm, aCDOM(254), and the fluorescence quantum yield at 340 nm, Φ(340), with salinity and DOC. R2, coefficient of determination of the regression equation; p, level of significance; n, number of data of each time series.
Seasonal cycle of CDOM in Blanes Bay
169
(Coble, 1996; Repeta et al., 2002; Benner, 2003). F(340/440) measured at the mouth of River Tordera, placed south of the sampling site, on the 15/05/2008 were as high as 53 QSU while DOC and nutrient values were of 263 µmol L-1 C, 0.072 µmol L-1 PO4 and 90.3 µmol L-1 NIT, respectively (unpub. data). Furthermore, continental runoff also transport new inorganic nutrients to the sampling site that can contribute to enhance microbial activity, which is known to also produce humic-like substances (Shimotori et al., 2009; Romera-Castillo et al., 2010, 2011). Coherently, the major sources of the interannual differences in the microplanktonic metabolism are the variability in rainfall and continental runoff (Satta et al., 1996). The fact that the marked salinity decrease observed in June 2008 was not accompanied by a large increase of F(340/440) could be due to photodegradation of continental humic substances during advection to the sampling site and/or a delay in the stimulation of microbes by nutrients transported by continental waters. In this sense, the effects of continental runoff are visible on the autotrophic activity at the sampling station around 11 days after the river discharge (Guadayol et al. 2009).
For the case of the protein-like compounds, the coupling observed between the annual cycles of F(280/350) and DOC, persists when the deseasonalised time series are compared (Figure 3; Table 2). The extremely high values of F(280/350) recorded in September 2008 and 2010 (Figure 3c) were accompanied by high concentrations of DOC too (Figure 3d). Therefore, as previously observed by Lønborg et al. (2010) in the eutrophic Ría de Vigo, the fluorescence of protein-like substances could be used as a tracer for the evolution of DOC at seasonal and shorter time scales.
Conclusions
At least two different refractory pools of DOM and a labile one could be distinguished in Blanes Bay through the optical properties of the DOM. Each one describes a characteristic seasonal cycle indicating that source and sink of these DOM sub-fractions are not the same. The DOM that built up in late summer in Blanes Bay seems to be relatively rich in protein materials and present relatively low average molecular weight and aromaticity. Even if it combines some requirement to be available by bacterial, the exhaustion of nutrient would avoid its incorporation into the microbial loop. Regarding the refractory pool of the fluorescent humic-like substances, apart to the seasonality imposed for the natural radiation, the main process affecting their variability is the continental runoff. In this work, we have demonstrated that the absorption and fluorescence spectroscopy are good tools to incorporate in time-series monitoring programs since they provide valorous information about the DOM pool.

Chapter V
170
ReferencesAlonso-Sáez, L. et al., 2008. Factors Controlling the Year-Round Variability in Carbon Flux Through
Bacteria in a Coastal Marine System. Ecosystems 11(3), 397-409.
Álvarez-Salgado, X.A., Gago, J., Miguez, B.M. and Perez, F.F., 2001. Net Ecosystem Production of Dissolved Organic Carbon in a Coastal Upwelling System: The Ria de Vigo, Iberian Margin of the North Atlantic. Limnol. Oceanogr. 46(1), 135-147.
Benner, R., 2003. Molecular indicators of the Bioavailability of Dissolved Organic Matter. In: Findlay, S., Sinsabaugh, R. (Eds.), Aquatic Ecosystems: Interactivity of Dissolved Organic Matter. Academic Press, New York, p.121-137.
Bingham, F.M., Lukas, R., 1996. Seasonal cycles of temperature, salinity and dissolved oxygen observed in the Hawaii Ocean Time-series. Deep Sea Res. Part II 43(2-3), 199-213.
Birks, J.B., 1970. Photophysics of aromatic molecules. Willey-Interscience, London.
Coble, P.G., 1996. Characterization of marine and terrestrial DOM in seawater using excitation-emission matrix spectroscopy. Mar. Chem. 51, 325-346.
Coble, P.G., Del Castillo, C.E., Avril, B., 1998. Distribution and optical properties of CDOM in the Arabian Sea during the 1995 Southwest Monsoon. Deep-Sea Res. II 45, 2195-2223.
Coble, P.G., 2007. Marine Optical Biogeochemistry: The Chemistry of Ocean Color. Chem. Rev. 107, 402-418.
Conmy, R.N., Coble, P.G., Chen, R.F., Gardner, B.G., 2004. Optical properties of colored dissolved organic matter in the Northern Gulf of Mexico. Mar. Chem. 89, 127- 144.
Dahlén, J., Bertilsson, S., Pettersson, C., 1996. Effects of UV-A irradiation on dissolved organic matter in humic surface waters. Environ. Int. 22(5), 501-506.
Day, D.A., Faloona, I., 2009. Carbon monoxide and chromophoric dissolved organic matter cycles in the shelf waters of the northern California upwelling system. J. Geophys. Res. 114(C01006).
De Haan, H., 1993. Solar UV-Light Penetration and Photodegradation of Humic Substances in Peaty Lake Water. Limnol. Oceanogr. 38(5), 1072-1076.

Seasonal cycle of CDOM in Blanes Bay
171
Del Vecchio, R., Blough, N.V., 2004. Spatial and seasonal distribution of chromophoric dissolved organic matter and dissolved organic carbon in the Middle Atlantic Bight. Mar. Chem. 89(1-4), 169-187.
Duarte, C.M., Agustí, S., Kennedy, H., Vaqué, D.,1999. The Mediterranean climate as a template for Mediterranean marine ecosystems: The example of the northeast Spanish littoral. Progr. Oceanogr. 44, 245-270.
Engelhaupt, E., Bianchi, T.S., Wetzel, R.G., Tarr, M.A., 2003. Photochemical transformations and bacterial utilization of high-molecular-weight dissolved organic carbon in a southern Louisiana tidal stream (Bayou Trepagnier). Biogeochemistry 62, 39-58.
Ferrari, G.M., 2000. The relationship between chromophoric dissolved organic matter and dissolved organic carbon in the European Atlantic coastal area and in the West Mediterranean Sea (Gulf of Lions). Mar. Chem. 70(4), 339-357.
Fichot, C.G., Benner, R., 2011. A novel method to estimate DOC concentrations from CDOM absorption coefficients in coastal waters. Geophys. Res. Lett., 38(3), L03610.
Galand, P., C. Gutiérrez-Provecho, R. Massana, J.M. Gasol AND E. O. Casamayor (2010) Inter-annual recurrence of archaeal assemblages in the coastal NW Mediterranean Sea (Blanes Bay Microbial Observatory). Limnol. Oceanogr. 55: 2117-2125.
Gasol, J.M., del Giorgio, P.A., Massana, R., Duarte, C.M.,1995. Active versus inactive bacteria: size-dependence in a coastal marine plankton community. Mar. Ecol. Prog. Ser. 128, 91-97.
Guadayol, Ò. et al., 2009. Episodic meteorological and nutrient-load events as drivers of coastal planktonic ecosystem dynamics: a time-series analysis. Mar. Ecol. Prog. Ser. 381, 139–155.
Helms, J.R. et al., 2008. Absorption spectral slopes and slope ratios as indicators of molecular weight, source, and photobleaching of chromophoric dissolved organic matter. Limnol. Oceanogr, 53(3), 955-969.
Herndl, G.J., Muller-Niklas, G., Frick, J., 1993. Major role of ultraviolet-B in controlling bacterioplankton growth in the surface layer of the ocean. Nature 361, 717-719.
Jaffé, R. et al., 2008. Spatial and temporal variations in DOM composition in ecosystems: The importance of long-term monitoring of optical properties. J. Geophys. Res. 113, G04032.

Chapter V
172
Kirk, J. T. O., 1994. Light and Photosynthesis in Aquatic Ecosystems, 2nd edn., Cambridge University. Press, Cambridge, 1994
Lakowic, J.R., 2006. Principles of Fluorescence Spectroscopy. Springer.
Lønborg, C., Álvarez-Salgado, X.A., Davidson, K., Martínez-García, S., Teira, E., 2010. Assessing the microbial bioavailability and degradation rate constants of dissolved organic matter by fluorescence spectroscopy in the coastal upwelling system of the Ría de Vigo. Mar. Chem. 119(1-4), 121-129.
Lucea, A., Duarte, C.M., Agustí, S., Kennedy, H., 2005. Nutrient dynamics and ecosystem metabolism in the Bay of Blanes (NW Mediterranean). Biogeochemistry 73(2), 303-323.
Moran, M.A., Zepp, R.G., 1997. Role of photoreactions in the formation of biologically labile compounds from dissolved organic matter. Limnol. Oceanogr. 42(6), 1307-1316.
Nelson, N.B., Siegel, D.A., Michaels, A.F., 1998. Seasonal dynamics of colored dissolved material in the Sargasso Sea. Deep Sea Res. I 45(6), 931-957.
Nelson, N.B., Craig, A.C., Steinberg, D.K., 2004. Production of chromophoric dissolved organic matter by Sargasso Sea microbes. Mar. Chem. 89, 273– 287.
Nelson, N.B., Siegel, D.A., Carlson, C.A. and Swan, C.M., 2010. Tracing global biogeochemical cycles and meridional overturning circulation using chromophoric dissolved organic matter. Geophys. Res. Let. 37, L03610.
Nieto-Cid, M., Álvarez-Salgado, X.A., Pérez, F.F., 2006. Microbial and photochemical reactivity of fluorescent dissolved organic matter in a coastal upwelling system. Limnol. Oceanogr. 51(3), 1391-1400.
Norman, B., Zweifel, U.L., Hopkinson, C.S., Fry, B., 1995. Production and utilization of dissolved organic carbon during an experimental diatom bloom Limnol. Oceanogr. 40(5), 898-907.
Obernosterer, I., Reitner, B., Herndl, G.J., 1999. Contrasting Effects of Solar Radiation on Dissolved Organic Matter and Its Bioavailability to Marine Bacterioplankton. Limnol. Oceanogr. 44(7), 1645-1654.

Seasonal cycle of CDOM in Blanes Bay
173
Osburn, C.L., Morris, D.P., Thorn, K.A., Moeller, R.E., 2001. Chemical and optical changes in freshwater dissolved organic matter exposed to solar radiation. Biogeochemistry 54(3), 251-278.
Para, J. et al., 2010. Fluorescence and absorption properties of chromophoric dissolved organic matter (CDOM) in coastal surface waters of the Northwestern Mediterranean Sea (Bay of Marseilles, France). Biogeosci. Discuss. 7, 5675-5718.
Pont, D., 1996. Evaluation of water fluxes and sediment supply. Meddelt, Venezia, October 2–5.
Repeta, D.J., Quan, T.M., Aluwihare, L.I. and Accardi, A., 2002. Chemical characterization of high molecular weight dissolved organic matter in fresh and marine waters. Geochim. Cosmochim. Ac. 66(6), 955–962.
Romera-Castillo, C., Sarmento, H., Álvarez-Salgado, A.X., Gasol, J.M., Marrasé, C., 2010. Production of chromophoric dissolved organic matter by marine phytoplankton. Limnol. Oceanogr., 55(1), 446–454.
Romera-Castillo, C. et al., 2011. Fluorescence: absorption coefficient ratio - tracing photochemical and microbial degradation processes affecting coloured dissolved organic matter in a coastal system. Mar. Chem. in press.
Romera-Castillo, C., Sarmento, H., Álvarez-Salgado, A.X., Gasol, J.M., Marrasé, C., 2011. Net production/consumption of fluorescent coloured dissolved organic matter by natural bacterial assemblages growing on marine phytoplankton exudates. Subbmited.
Ruiz, S., Gomis, D., Sotillo, M.G., Josey, S.A., 2008. Characterization of surface heat fluxes in the Mediterranean Sea from a 44-year high-resolution atmospheric data set. Global Planet Change 63, 258–274.
Satta, M.P., Agustí, S., Mura, M.P., Vaqué, D., Duarte, C.M., 1996. Microplankton respiration and net community metabolism in a bay on the NW Mediterranean coast. Aquat. Microb. Ecol. 10, 165-172.
Shimotori, K., Omori, Y., Hama, T., 2009. Bacterial production of marine humic-like fluorescent dissolved organic matter and its biogeochemical importance. Aquatic Microbial Ecol. 58(1), 55-66.
Siegel, D.A., Maritorena, S., Nelson, N.B., 2002. Global distribution and dynamics of colored dissolved

and detrital organic materials. J. Geophys. Res. 107(C12).
Smith, R. C., J. J. Cullen, 1995. Effect of UV radiation on phytoplankton, Rev. Geophys. 33, 1211-1223.
Sommaruga, R., Hofer, J.S., Alonso-Saez, L. and Gasol, J.M., 2005. Differential Sunlight Sensitivity of Picophytoplankton from Surface Mediterranean Coastal Waters. Appl. Environ. Microbiol., 71(4): 2154-2157.
Stedmon,C.A., Álvarez-Salgado, X.A., 2011. Shedding light on a black box: UV-visible spectroscopic characterization of marine dissolved organic matter. Submitted.
Turro, N.J., 1991. Modern molecular photochemistry. University Science Books.
Thingstad, T.F., Hagström, A., Rassoulzadegan, F., 1997. Accumulation of degradable DOC in surface waters: Is it caused by a malfunctioning microbial loop? Limnol. Oceanogr. 42(2), 398-404.
Vodacek, A., Blough, N.V., 1997. Seasonal variation of CDOM in the Middle Atlantic Bight: Terrestrial inputs and photooxidation. Proceedings of SPIE-The International Society for Optical Engineering, 2963(Ocean Optics XIII): 132-137.
Weishaar, J.L. et al., 2003. Evaluation of Specific Ultraviolet Absorbance as an Indicator of the Chemical Composition and Reactivity of Dissolved Organic Carbon. Environ. Sci. Technol. 37 (20), 4702-4708.
Yamashita, Y., Tanoue, E., 2008. Production of bio-refractory fluorescent dissolved organic matter in the ocean interior. Nat. Geosci. 1, 579-582.C., 2010. Production of chromophoric dissolved organic matter by marine phytoplankton. Limnol. Oceanogr., 55(1), 446–454.

Synthesis and dicussion

177
Synthesis and discussion
Synthesis and discussion
In this thesis, some aspects concerning the optical properties of the dissolved organic matter (DOM) have been broached. Chapters 1 and 2 have contributed to the understanding of the in situ production and transformations of coloured/fluorescent DOM mediated by biological activities. The application of the ultrafiltration technique to concentrate the DOM from water samples from different aquatic environments allowed for the determination of some structural characteristics of the DOM as described in Chapter 3. Moreover, the main sink of the coloured/fluorescent DOM, the photodegradation, has also been analysed in those samples showing that the optical response of these concentrated substances to sunlight strongly depended on its origin. In Chapter 4 and 5, the different biogeochemical processes affecting the variability of CDOM and FDOM in two coastal systems have been examined in relation to physical drivers and trophic status.
The observation of different fluorescent signals of the DOM produced by different microorganisms, in Chapter 1 and 2, is a step forward in the characterization of the dissolved organic matter and the identification of its sources. The conviction that marine phytoplankton was unable to produce coloured DOM was quite common among scientists devoted to FDOM studies. In 1998, after some field observations, Nelson et al. suggested that CDOM was produced by bacteria and that it had no relation with phytoplankton. Later, in 2002 Rochelle-Newall et al. corroborated it by means of laboratory experiments. However, none of these authors presented excitation-emission matrices data. Their conclusion were based on single measurements made at one single excitation-emission wavelengths (F(355/450) or peak-C) in the case of Rochelle-Newall et al. and on the absorption coefficient at 300 nm in the case of Nelson et al. Despite these facts, scientific community accepted these conclusions and no further experiments to address the subject in a more exhaustively way were performed. In this thesis, this topic is raised again to demonstrate for the first time the production of FDOM by phytoplankton and the identification of different fluorescent peaks characteristics of the metabolism of each organism. Moreover, it proves the importance of the study of all range of excitation/emission of fluorescent when we talk about FDOM in general. Among the FDOM producers, phytoplankton and heterotrophic bacteria are the most abundant group of organisms in terms of biomass. Therefore, the quantitative and qualitative analysis of the FDOM produced by phytoplankton and its comparison with that produced by bacteria is essential to better understand the distributions of CDOM in the oceans as well as its role in the global carbon cycle
The association of the fluorescence peak-M to eukaryotes and the peak-C to prokaryotes allows us to distinguish between different biological origins of the organic matter. Nevertheless, this observation on the field is very difficult owing to different factors: 1) peak tails overlap which each other in many cases; 2) humic-like fluorescence is not a conservative property. The fluorescent DOM in

178
Synthesis and discussion
the euphotic layer is continually changing due to the sensitivity of this matter to photodegradation and, at the same time, the production of these compounds by microorganisms as well as continental runoffs. Therefore, it is not rare that we did not find a good significant correlation between bacteria and peak-C and phytoplankton and peak-M in the nature (NW Mediterranean Sea and Ría de Vigo, Chapters 4 and 5).
In November 2007, in a cruise in the Atlantic Ocean (from Cádiz to Lazarote) within the CANOA project, samples for FDOM were taken and measured from different water masses throughout the transect. Figure 1 show the T-S diagram with the ratio peak-C/peak-M in the Z-axis. Warmest and saltiest waters correspond to surface samples where the ratio is lower indicating a higher importance of the peak-M. It is in these euphotic samples where a higher concentration of phytoplankton biomass occurs. However, the coldest and less salty water showed a higher peak-C/peak-M ratio demonstrating the increasing importance of peak-C with depth, where there is no autotrophic activity and respiration is dominated by bacteria. This fact corroborates in field what had already been observed in the controlled experiments described in Chapter 1 and 2. These results will help to interpret field data about variability of CDOM and to parameterize CDOM production rates in the context of biogeochemical models.
The chemical patterns observed in the ultrafiltrated DOM from different origins using structural determination techniques (i.e., Nuclear Magnetic Resonance, Repeta et al., 2002; Benner, 2003) agree with our conclusions of Chapter 3 where
an approach to the chemical structure of the DOM was made using optical spectroscopy. The average molecular weight and the aromaticity decrease oceanward from river to open ocean mainly due to the
Figrure 1. Station map of the CANOA cruise stations.
Figure 2. Temperature-Salinity (T-S) diagram of the samples collected in CANOA cruise. Peak-C/Peak-M ratio in the Z-axis.
179
Synthesis and discussion
dilution of the terrestrial DOM and its photodegradation during its way to open ocean. Sunlight radiation produces a loss of colour, fluorescence, average molecular weigh and aromaticity of the DOM (Chapter 3) and this is coherent with previous works (Moran and Zepp et al., 1997; Osburn et al., 2001).
The two coastal environments studied in this thesis are characterized by different trophic status, Ría de Vigo is an eutrophic environment while Blanes Bay is representative for an oligotrophic ecosystem. In Chapter 4 and 5, the utility of the optical properties of the dissolved organic matter as tracer of biogeochemical processes has been demonstrated and quantified for the first time in Chapter 4. Both Chapters revealed the different DOM composition in each system as well as the biogeochemical processes affecting the variability of FDOM. In Ría de Vigo, average fluorescent quantum yield, Φ(340), was higher during the upwelling event than during downwelling one, indicating a higher concentration of aromatic compounds. This makes sense since photo-degradation was the dominant process during the downwelling period which is known to provoke a loss of the aromaticity of the DOM (Osburn et al., 2001). In comparison with Blanes Bay, Ría de Vigo DOM seems to have higher proportion of aromatic and high molecular weight compounds. This is mostly owing to two factors: i) Ría receives higher continental runoff than Blanes Bay and terrestrial DOM is more aromatic and present a higher proportion of high molecular weigh compounds than marine DOM (Chapter 3, Repeta et al., 2002; Benner, 2003). The main source of CDOM in Blanes Bay is the continental runoff (Chapter 5) either directly or indirectly, by the stimulation of microbes by nutrients transported by continental waters. However, terrestrial carbon and nutrient inputs are sporadic events after heavy rains (Satta et al., 1996; Gudadayol et al., 2009) while in Ría de Vigo, the continental runoff from rivers are continuously pouring freshwater into the Ría and precipitations are more frequent than in Blanes Bay (Rosón et al., 2008); ii) the higher autochthonous production of CDOM/FDOM in Ría de Vigo as consequence of the upwelled waters are its main inputs of nutrient in Ría de Vigo. Microbial degradation of the DOM produces an increase of its aromaticity (De Haan, 1993; Lønborg et al., 2010) and microorganims are the main autochthonous source of CDOM in Ría de Vigo (Nieto-Cid et al. 2005).
Regarding the biogeochemical processes affecting both coastal systems, while in the Ría de Vigo fluorescent humic-like compounds, F(340/440), variability is more dependent on the water masses, the seasonality imposed by natural radiation determines the variability in Blanes Bay. The stratification-homogenization cycle by which a temperate system as Blanes Bay is affected contrasts with a system where the wind driven upwelling-downwelling events are the main forcing factors. In Ria de Vigo, when the variability due to the dynamic of water masses is removed we found microbial degradation as the main biogeochemical process governing the optical properties DOM during the upwelling event while during the downwelling period photo-degradation played the major role.
The measurement of the optical properties of the DOM has demonstrated to be a very useful tool in oceanographic studies. Despite its limitations in the direct characterization of the molecular

180
Synthesis and discussion
structures composing the DOM and in the quantification of carbon, the speed and the low cost of this measurement make possible rapid results on board, which is very convenient in oceanographic studies. Moreover, some qualitative information about the molecular structure of the DOM can be determined by mean of its optical properties.
DOM is the most important intermediate in the global carbon cycle (Battin et al., 2008) and most of oceanic DOM is considered bio-refractory (Hansell et al., 2009) and mainly produced in the microbial carbon pump (Jiao et al., 2010). In the deep ocean, fluorescent humic-like substances are a by-product of the microbial respiration (Nieto-Cid et al., 2006; Yamashita and Tanoue, 2008) and are resistant to biological degradation. Since sunlight radiation does not reach such depths, it accumulates in the interior ocean for millennial of years (Yamashita and Tanoue, 2008). Therefore the in situ production of humic-like substances is one of the key processes in maintaining the oceanic pool of refractory DOM and its optical properties can be use to trace it (Stedmon and Álvarez-Salgado, submit.). For future works, an attempt to link the optical spectroscopy with techniques of molecular characterization of the DOM as this will undoubtedly allow us to widen our knowledge about the chemical structures composing the CDOM and FDOM fraction.
References
Battin, T.J., Kaplan, L.A. Findlay, S., Hopkinson, C.S., Marti, E., Packman, A.I., Newbold, J.D., Sabater, F., 2008. Biophysical controls on organic carbon fluxes in fluvial networks. Nat. Geosci. 1(2), 95-100.
Benner, R., 2003. Molecular indicators of the Bioavailability of Dissolved Organic Matter. In: Findlay, S., Sinsabaugh, R. (Eds), Aquatic Ecosystems: Interactivity of Dissolved Organic Matter. Academic Press, New York.
De Haan, H., 1993. Solar UV-Light Penetration and Photodegradation of Humic Substances in Peaty Lake Water. Limnol. Oceanogr. 38(5), 1072-1076.
Guadayol, Ò. et al., 2009. Episodic meteorological and nutrient-load events as drivers of coastal planktonic ecosystem dynamics: a time-series analysis. Mar. Ecol. Prog. Ser. 381, 139–155.
Hansell, D.A., Carlson, C.A., Repeta, D.J., Reiner, S., 2009. Dissolved organic matter in the ocean. Oceanography, 22(4), 202-211.

181
Synthesis and discussion
Jiao, N. et al., 2010. Microbial production of recalcitrant dissolved organic matter: long-term carbon storage in the global ocean. Nat Rev Micro, 8(8), 593-599.
Lønborg, C., Álvarez-Salgado, X.A., Davidson, K., Martínez-García, S., Teira, E., 2010. Assessing the microbial bioavailability and degradation rate constants of dissolved organic matter by fluorescence spectroscopy in the coastal upwelling system of the Ría de Vigo. Mar. Chem. 119(1-4), 121-129.
Moran, M.A., Zepp, R.G., 1997. Role of photoreactions in the formation of biologically labile compounds from dissolved organic matter. Limnol. Oceanogr. 42(6), 1307-1316.
Nelson, N.B., Siegel, D.A., Michaels, A.F., 1998. Seasonal dynamics of colored dissolved material in the Sargasso Sea. Deep Sea Res. Part I: Oceanographic Research Papers, 45(6), 931-957.
Nieto-Cid, M., Álvarez-Salgado, X.A., Gago, J., Pérez, F.F., 2005. DOM fluorescence, a tracer for biogeochemical processes in a coastal upwelling system (NW Iberian Peninsula). Mar. Ecol. Prog. Ser. 297 33-50.
Nieto-Cid, M., Álvarez-Salgado, X.A., Pérez, F.F., 2006. Microbial and photochemical reactivity of fluorescent dissolved organic matter in a coastal upwelling system. Limnol. Oceanogr. 51(3), 1391-1400.
Osburn, C.L., Morris, D.P., Thorn, K.A., Moeller, R.E., 2001. Chemical and optical changes in freshwater dissolved organic matter exposed to solar radiation. Biogeochemistry, 54(3), 251-278.
Repeta, D.J., Quan, T.M., Aluwihare, L.I., Accardi, A., 2002. Chemical characterization of high molecular weight dissolved organic matter in fresh and marine waters. Geochimica et Cosmochimica Acta, 66(6), 955–962.
Rochelle-Newall, E.J., Fisher, T.R., 2002. Production of chromophoric dissolved organic matter fluorescence in marine and estuarine environments: an investigation into the role of phytoplankton. Mar. Chem. 77 7 -21.
Rosón, G., Cabanas, J.M., Pérez, F.F., 2008. Hidrografía y dinámica de la Ría de Vigo. In: Gónzales-Garcés Santiso, A., Vilas Martín, F., Álvarez-Salgado, X.A. (Eds.), La Ría de Vigo. Instituto de Estudios Vigueses. Vigo.
Satta, M.P., Agustí, S., Mura, M.P., Vaqué, D., Duarte, C.M., 1996. Microplankton respiration and net

182
Synthesis and discussion
community metabolism in a bay on the NW Mediterranean coast. Aquat. Microb. Ecol. 10, 165-172.
Stedmon, C.A., Álvarez-Salgado, X.A., 2011. Shedding light on a black box: UV-visible spectroscopic characterization of marine dissolved organic matter. Submitted.
Yamashita, Y., Tanoue, E., 2008. Production of bio-refractory fluorescent dissolved organic matter in the ocean interior. Nature Geoscience, 1, 579-582.

Conclusions

184
Conclusions
185
Conclusions
It has been demonstrated that analysis of optical properties of DOM is a powerful tool to characterize the origin of its coloured compounds as well as to identify the different mechanisms that govern its transformations.
The results presented here prove, for the first time, that marine phytoplankton produce humic-like substances absorbing at Ex/Em 320/410 nm (peak-M). These compounds are bio-available for bacteria, which concurrently produce other humic-like substances fluorescing at Ex/Em 340/440 nm (peak-C). The production of protein-like and humic-like substances by phytoplankton was one order of magnitude lower than that generated by bacteria.
The aromaticity degree of ultrafiltrated dissolved organic matter (UDOM) isolated from different environments decreased oceanward (estuarine > coastal > enclose sea > open ocean waters). The sensitivity of theses substances to radiation was higher in riverine waters than in the open ocean. The exposure to sunlight radiation produced a decrease of absorption at wavelengths >300 nm and an increase of that at wavelengths < 300 nm in the UDOM samples.
Analysis of optical properties of the DOM applied to seawater from Ria de Vigo permitted to trace biogeochemical processes. It was possible to identify photodegradation as the predominant mechanism influencing FDOM variability during the downwelling period. In contrast, microbial biodegradation was the main process affecting the variability of FDOM during the upwelling event.
DOM and its optical properties followed a very clear seasonal cycle in the temperate coastal system of Blanes Bay. At least three sub-fractions of DOM with different seasonal patterns could be distinguished through the study of its absorption and fluorescence. The more bio-labile one, represented by the protein-like substances, was accumulated during the summer season. In contrast, a group of humic-like substances more refractory to biological activity but susceptible to photo-degradation presented their minimum values in summer. Finally, a third sub-fraction of DOM resulted to be refractory to photo and microbial degradation and they accumulated in spring-summer.


Agradecimientos
Acknowledgement

188

Agradecimientos - Acknowledgement
189
Agradecimientos
A mis directores de tesis, Celia y Pepe. Gracias por todo lo que me habéis enseñado, por vuestra paciencia infinita, por el tiempo de dedicado a este trabajo y por los buenos momentos. Por vuestro valor científico y sobre todo, humano. Siempre dispuestos a pringar como cualquiera hasta las mil analizando fluorescencias o lo que hiciera falta. Cèlia, por haberme dado la oportunidad de hacer este trabajo, por tu positividad y tus palabras de ánimo que siempre suben la moral. Tu buena predisposición y tu entusiasmo ante cualquier idea, tus explicaciones de estadística y de ecología. Pepe, una suerte enorme tenerte de director, gracias por todo lo que me has enseñado, tanto científicamente como de todo, un pozo de sabiduría! y siempre desafiante de la ley de la entropía. Por las buenas historias y anécdotas contadas a la luz del fluorímetro. Un enorme GRACIAS a los dos.
A Mar, componente importante de nuestro tele-grupo. Que me has hecho ver la luz en más de una ocasión con su experiencia. Por los buenos momentos en EEUU, Puerto Rico,.. y los que vengan! Al resto de co-autores de los capítulos de este trabajo, por su paciencia y sus rápidas correcciones en la mayoría de los casos, Pep (visca tu eficiencia y tus lecciones magistrales! han sido de gran ayuda), Hugo, Carmen, Xelu, Des.
Al departamento de biología marina y ecología del ICM, en general, porque todos en mayor o menor medida habéis contribuido a la realización de esta tesis aunque sólo haya sido generando buen ambiente. Moltes gràcies! Por las buenas amistades que he hecho aquí a lo largo de estos años.A Estela, por poner tanta “sal” a las comidas con historias y risas y por tu apoyo durante toda la tesis! A Mireia, por estar siempre a mi izquierda para comentar lo que fuera y animar. A las que ya volaron pero fueron parte importante de este período, Lidia, Erica, Bea Díez, Ceci.A mis compañeros del despacho molón, Mireia y Silvia y a los “chavalines” Claudio y Juancho. Por esas cervezas que quedan pendientes, no dejemos que caduquen esta vez!A Irene, Vane y Clara, siempre prontas a solucionarte cualquier problema. Evaristo, por tu ayuda y las conversaciones científicas a la hora del café. Berta, porque has sido de gran ayuda en nuestro mini-grupo desde que viniste.A Eva Flo, por ese viaje a morrocolandia que quedó pendiente por culpa de esta tesis… Isabel, por tu buena predisposición y por los buenos momentos que ha habido y habrán!A las que empezasteis a la vez que yo este “viaje” y con las que he pasado tan buenos momentos, Clara (enhorabuena casi-doctora, mantén siempre esa alegría!), Arancha (ánimos que ya queda muy poco!). Y a los demás que habéis compartido buenos momentos conmigo Pati, Rodrigo, Martí, Mariona, Ana Gomes, Elena, Patri (mucha suerte con tu tesis!). A Bea F., Raquel, Montse, Ero (ya os queda poco a vosotras también!), Cristina (buena clase teórica de PCR y DGGE), Elisabet Sà y Elisabet Sañé, Miriam, Rachele.
Agradecimientos - Acknowledgement
190
A los “grandes jefes” que han aportado sabiduría a esta tesis, siempre dispuestos a resolver cualquier duda, Pep, Carles, Rafel, Elisa, Miquel, Albert, Enric, Dolors, Ramón, Marta, Mikel Latasa. Porque todos y cada uno de vosotros, me habéis ayudado en algún que otro momento.Al futuro inmediato de la oceanografía, los post-docs que cabalgan entre el “gran jefe” y el estudiante medio, Silvia Acinas, Isabel, Hugo, Marta Sebastián, Bibiana.A todos aquellos que pueblan los pasillos del instituto y saludan al pasar amenizando los largos trayectos hasta el baño o el laboratorio, Ana Mari, Fran, Pedro, Andrea, Albert, Matina, A los que habéis ayudado en algún momento de este trabajo como parte de vuestras prácticas y que ha sido de gran ayuda! Fran, Encarna, Sandra, Adriá…
A Gemma Vila, porque juntas hemos sabido sortear los inconvenientes externos a nosotras y ha sido una suerte que fueras tú mi homóloga de FDOM en Blanes! Mucho ánimo que te queda muy poco y va a salir muy bien!
A todo el departamento de Oceanoloxía del IIM de Vigo. ¡Muchísimas gracias por la acogida! Porque me habéis hecho sentir como en casa desde el primer día, desde ayudándome con instalaciones informáticas varias (Fer y Antón), procesamiento de datos,…etc hasta ofreciéndome casa y dándome a conocer la vida nocturna de Vigo. Merche, Diana, Miguel, Paola, Marquitos, Toni, Kiko, Thomas, Oscar, Bibiana. David, gracias por estar ahí, por la campaña CAIBEX, vivan los tripletes!! Y gracias también por las correcciones en gallego aguetense! A la alegría del departamento, que lo mismo te hacen un análisis de DOC que te bailan una conga, Rosa, Vane (qué risa en el jacuzzi granadino!), Mónica y Antón (mi salvación en los últimos días de tesis ayudándome a desconectar con divertidas historias varias de primos e informática), Fer (el único gallego capaz de pronunciar correctamente la “s” aspirada), Isabel (entaoooo!!! Gracias por tu amistad y por lo bien que lo hemos pasado. Woooooo!!! Ahora síiii!!!). A Maria José, María “la rubia”, Trini, Belén, que también habeis estado ahí siempre con una palabra amable en la boca.Y como no, este instituto también cuenta con “grandes jefes” que ayudan cuando lo necesitas, Paco, Carmen, Des, Aida.
A Dan Repeta, por su acogida en el laboratorio de Woods Hole.
A los compañeros del laboratorio de Bremerhaven, por todo lo que me ayudasteis y lo bien que estuve allí aunque me tuviera que acostumbrar a comer en 15 min. Danke shön a Gerhard por su disponibilidad, a Boris y a Kai-Uwe, por enseñarme el análisis de amino ácidos. A Martin, Dittas, Oliver y Ruth, gracias por la acogida. Y a Luisa y Desi por aquellos días, hicisteis que esa estancia fuera genial. Vivan las cenas cubanas!
A mi amiga Laura. Que aunque físicamente lejos estas siempre cerca. Mucha suerte en tu nueva etapa! A
Agradecimientos - Acknowledgement
191
Majo, Irene y Lorena. A Jaime, “sin fallo” desde el principio, venga que ya te queda poco a ti también. A Max, incansable, siempre dispuesto a ayudar en lo que haga falta. A Francisco y a Luca, siempre maquinando planes. A mis flamenquitas! Sandra, Montse, Irene, Olga, me habéis ayudado muchísimo a desconectar y a ver otras perspectivas!
A mia famiglia di Barcelona! Grazie mille! Perque mi avete fatto sentire benissimo, per vuostri animi, per vuestro cariño e amigizia, perque non mi ha mancato mai un piatto a tavola! Ema, Ernesto, Lisilla, Ida, Silvio, Lorenzo, un enorme GRACIAS. Geo, por tu amistad y tu ayuda, próxima estación, Blanes. E anche Jacopo e Claudio.
A Lorenzo, pieza clave en estos años. Perque tutto lo que mi hai insegnato ha un valore incalcolabile. Per tuo amore e tuo affetto sense limiti. Per que sei il puo tera de i teri!
Y como no, a los más importantes, sin los cuales no estaría aquí... a mi familia. A mis padres y a mi hermana Marta, que siempre están dispuestos a escucharme y apoyarme. Que han vivido conmigo todas las aventuras de esta tesis. A mis tíos, Asún y Alfonso y a mis primos, Paloma y David, que también están ahí siempre. Y a mis abuelos, mis grandes admiradores, siempre pendientes de cualquier barco que salga en la TV por si me ven dentro.
A todos vosotros Gracias!