Adverse Events in Patients With Community-Acquired Pneumonia at an Academic Tertiary Emergency...
10
Adverse Events in Patients With Community-Acquired Pneumonia at an Academic Tertiary Emergency Department Do They Contribute to Hospital Death? Renata Daud-Gallotti, MD, PhD,* Hillegonda Maria Dutilh Novaes, MD, PhD, y Maria Cecı ´lia Lorenzi, MD, PhD, z Jose ´ Eluf-Neto, MD, PhD, y Mirna Namie Okamura, RN, MS, y Vladimir Ribeiro Pinto Pizzo, MD,* and Irineu Tadeu Velasco, MD, PhD* Abstract: A matched case-control study was carried out at a Brazilian academic medical emergency department to identify the occurrence of adverse events (AEs) in patients with community- acquired pneumonia (CAP) and disclose their association with in- hospital death. The cases comprised 101 consecutive deaths and the controls 101 discharged patients admitted for CAP from March 1996 to September 1999. Adverse events were classified according to severity, potential causes, the occurrence of nosocomial in- fections, and the related professional category. A total of 603 AEs were identified, predominating among the deceased patients: 456 events (75.6%) in 85 cases and 147 (24.4%) in 55 controls. Severe AEs also predominated among the cases. Procedures and nursing activities were the main AE-related potential causes. The oc- currence of at least 1 AE was associated with a higher risk of death (3.25-fold). This association was stronger when either severe AEs (8.37-fold) or medical AEs (4.23-fold) were analyzed. (Infect Dis Clin Pract 2006;14:350 – 359) C ommunity-acquired pneumonia (CAP) is defined as pneumonia not acquired in hospitals or other long-term- care facilities, causing nearly 5 million episodes of illness annually in the United States. Approximately 20% of those episodes require hospitalization. 1–3 Mortality rates of CAP range from 5% to 36% in hospitalized patients, representing the sixth leading overall cause of death and the most common infectious cause of death. 4–6 Recently, efforts have been made to evaluate and improve the quality of CAP management, but substantial variations in quality of care still persist. 7–10 A widespread approach to evaluate quality of medical care is the identification of adverse events (AEs), defined as unintended injuries or complications caused by health care management rather than the underlying condition of the patient. 11 Previous important studies described AE rates of 2.9% to 16.6% of all admissions, 12 – 18 and half of them were considered preventable, that is, resulting from errors. Although most of the AEs led to minimal impairments, death was associated to 4.9% to 13.6% of the events, 12 – 18 making AEs the eighth leading cause of death in the United States. 19 Several factors have been associated to AE occurrence, including urgent care. 20 Emergency departments (EDs) are considered error-prone environments, facilitating the occur- rence of AEs. 21,22 Overcrowding, unrestricted access, the presence of young and inexperienced professionals, lack of supervision, insufficient information regarding patient’s previous medical situation, frequent interruptions in medical care, and shortage of nurse staff and resources contribute to this unfavorable scenario. 23 – 25 Considering that EDs are the source of admission and site of initial treatment for almost 75% of patients with CAP, 26 we aimed to evaluate the occurrence of AEs in CAP during ED hospitalizations, describing their degree of severity, potential causes, and related professional categories involved in patient care. We also aimed to identify the association between AEs and hospital death in patients with CAP, identifying their significance when compared with other usual potential risk factors for hospital death, such as severity of illness on admission and demographic and health care characteristics. METHODS Design and Setting This retrospective study with a 1:1 matched case- control design was conducted at the medical ED of a 1100- bed tertiary university hospital in Sa ˜o Paulo, Brazil. The medical ED is responsible for providing clinical, urgent care to individuals older than 12 years (excluding cardiologic and psychiatric emergencies, referred to specific associated 350 Infectious Diseases in Clinical Practice Volume 14, Number 6, November 2006 Original Article *Medical Emergency Medicine, Department of Hospital das Clı ´nicas, yDepartment of Preventive Medicine and zSleep Laboratory of The Heart Institute of Hospital das Clı ´nicas, University of Sa ˜o Paulo School of Medicine, Sa ˜o Paulo, SP, Brazil. Presented at the XXXII Brazilian Congress of Pneumology 2004, November 13 to 17, Salvador, Bahia, Brazil. Supported by a grant from the Fundac ¸a ˜o de Amparo a ` Pesquisa do Estado de Sa ˜o Paulo (FAPESP), grant no. 2002/09277-0. Address correspondence and reprint requests to Renata Daud-Gallotti, MD, PhD, Alameda Itu, 1420 apt 101, Sa ˜o Paulo, SP, Brazil. E-mail: [email protected]. Copyright n 2006 by Lippincott Williams & Wilkins ISSN: 1056-9103/06/1406-0350 Copyr ight © Lippincott Williams & Wilkins. Unauthor iz ed reproduction of this article is prohibited.
Transcript of Adverse Events in Patients With Community-Acquired Pneumonia at an Academic Tertiary Emergency...

Adverse Events in Patients With Community-AcquiredPneumonia at an Academic Tertiary
Emergency DepartmentDo They Contribute to Hospital Death?
Renata Daud-Gallotti, MD, PhD,* Hillegonda Maria Dutilh Novaes, MD, PhD,yMaria Cecılia Lorenzi, MD, PhD,z Jose Eluf-Neto, MD, PhD,y Mirna Namie Okamura, RN, MS,y
Vladimir Ribeiro Pinto Pizzo, MD,* and Irineu Tadeu Velasco, MD, PhD*
Abstract: A matched case-control study was carried out at a
Brazilian academic medical emergency department to identify the
occurrence of adverse events (AEs) in patients with community-
acquired pneumonia (CAP) and disclose their association with in-
hospital death. The cases comprised 101 consecutive deaths and the
controls 101 discharged patients admitted for CAP from March
1996 to September 1999. Adverse events were classified according
to severity, potential causes, the occurrence of nosocomial in-
fections, and the related professional category. A total of 603 AEs
were identified, predominating among the deceased patients: 456
events (75.6%) in 85 cases and 147 (24.4%) in 55 controls. Severe
AEs also predominated among the cases. Procedures and nursing
activities were the main AE-related potential causes. The oc-
currence of at least 1 AE was associated with a higher risk of death
(3.25-fold). This association was stronger when either severe AEs
(8.37-fold) or medical AEs (4.23-fold) were analyzed.
(Infect Dis Clin Pract 2006;14:350–359)
Community-acquired pneumonia (CAP) is defined aspneumonia not acquired in hospitals or other long-term-
care facilities, causing nearly 5 million episodes of illnessannually in the United States. Approximately 20% of thoseepisodes require hospitalization.1 – 3 Mortality rates of CAPrange from 5% to 36% in hospitalized patients, representingthe sixth leading overall cause of death and the mostcommon infectious cause of death.4 – 6 Recently, efforts havebeen made to evaluate and improve the quality of CAP
management, but substantial variations in quality of care stillpersist.7 – 10
A widespread approach to evaluate quality of medicalcare is the identification of adverse events (AEs), defined asunintended injuries or complications caused by health caremanagement rather than the underlying condition of thepatient.11 Previous important studies described AE rates of2.9% to 16.6% of all admissions,12 – 18 and half of them wereconsidered preventable, that is, resulting from errors.Although most of the AEs led to minimal impairments,death was associated to 4.9% to 13.6% of the events,12 – 18
making AEs the eighth leading cause of death in the UnitedStates.19
Several factors have been associated to AE occurrence,including urgent care.20 Emergency departments (EDs) areconsidered error-prone environments, facilitating the occur-rence of AEs.21,22 Overcrowding, unrestricted access, thepresence of young and inexperienced professionals, lack ofsupervision, insufficient information regarding patient’sprevious medical situation, frequent interruptions in medicalcare, and shortage of nurse staff and resources contribute tothis unfavorable scenario.23 – 25
Considering that EDs are the source of admission andsite of initial treatment for almost 75% of patients withCAP,26 we aimed to evaluate the occurrence of AEs in CAPduring ED hospitalizations, describing their degree ofseverity, potential causes, and related professional categoriesinvolved in patient care. We also aimed to identify theassociation between AEs and hospital death in patients withCAP, identifying their significance when compared withother usual potential risk factors for hospital death, such asseverity of illness on admission and demographic and healthcare characteristics.
METHODS
Design and SettingThis retrospective study with a 1:1 matched case-
control design was conducted at the medical ED of a 1100-bed tertiary university hospital in Sao Paulo, Brazil. Themedical ED is responsible for providing clinical, urgent careto individuals older than 12 years (excluding cardiologic andpsychiatric emergencies, referred to specific associated
350 Infectious Diseases in Clinical Practice � Volume 14, Number 6, November 2006
Original Article
*Medical Emergency Medicine, Department of Hospital das Clınicas,yDepartment of Preventive Medicine and zSleep Laboratory of TheHeart Institute of Hospital das Clınicas, University of Sao Paulo Schoolof Medicine, Sao Paulo, SP, Brazil.
Presented at the XXXII Brazilian Congress of Pneumology 2004, November
13 to 17, Salvador, Bahia, Brazil.
Supported by a grant from the Fundacao de Amparo a Pesquisa do Estado de
Sao Paulo (FAPESP), grant no. 2002/09277-0.Address correspondence and reprint requests to Renata Daud-Gallotti, MD,
PhD, Alameda Itu, 1420 apt 101, Sao Paulo, SP, Brazil. E-mail:[email protected].
Copyright n 2006 by Lippincott Williams & Wilkins
ISSN: 1056-9103/06/1406-0350
Copyr ight © Lippincott Williams & Wilkins. Unauthorized reproduction of this article is prohibited.

units), treating an average of 60,000 patients annually, mostof them remaining in the ED during the entire hospitalizationcourse. The medical ED is staffed with 2 or 3 supervisorphysicians, 2 to 6 attending physicians with different medicalspecialties (cardiology, neurology, endocrinology, generalmedicine, nephrology, infectious diseases, and gastroenter-ology), 5 or 6 internal medicine residents (first and secondyear to 1 month rotation), 3 to 5 last-year medical students(clerks to 3 weeks rotation), 3 to 6 licensed nurses, and 15 to18 nursing assistants. Our local ethics committee approvedthe study protocol.
PatientsFrom March 1996 to September 1999, patients
admitted to the medical ED with pneumonia as the primarydiagnosis, classified according to the International Classifi-cation of Diseases, Tenth Revision27 (ICD-10—J12 to J16and J18), were retrospectively identified. Patients wereexcluded from review if they were younger than 18 years, theinitial chest radiographic findings were not consistent withpneumonia according to the admitting physician, they werehospitalized in the previous 10 days, were infected with thehuman immunodeficiency virus (HIV), had a diagnosis oftuberculosis, or had been transferred from another acute carefacility. During the study period, the medical ED followedthe recommendations of the American Thoracic Society andof the Infectious Diseases Society of America regarding CAPmanagement.2,28
In this period, there were 18,920 admissions to themedical ED, 597 (3.2%) of them were pneumonia-relatedhospitalizations. The case group comprised all 121 consecu-tive patients admitted with pneumonia as the primarydiagnosis who died during ED stay. The medical records of2 cases were not found and 18 cases met exclusion criteria (10were transferred from acute care hospitals, 5 had a priorhospitalization in the last 10 days, and 3 were HIV-seropositive). The final case group comprised 101 patients.For each case, a control was matched for the smallestdifference between the case and control admission date. Themean difference between the control and its respective caseadmission date was 0.6 ± 4.2 days (median = 0 day, minimumvalue = 0 day, maximum value = 23 days).
Data Collection and ProcessingThe process of data collection has been detailed
previously.29 Two trained abstractors, a nurse and aphysician not affiliated with the ED team, collected datafrom medical charts and registered the information in aspecially designed data extraction form. The reviewers werenot blinded to patient condition, but a very strict routine fordata extraction was adopted. Two researchers analyzed eachcompleted questionnaire with the review group. Wheneverthe occurrence of an event remained controversial despitemeticulous analysis of patient records, the episode wasexcluded from the analysis.
DefinitionsInformation related to demographic characteristics
and ED length of stay was registered. Comorbidities were
recorded with the Modified Charlson Index.30 Data related tomedical interventions performed during ED stay werecollected to evaluate the characteristics of care delivered.The ability to walk unassisted on admission was registered toassess patient functional capacity. Continuity of health carewas assessed using the number of different administrativeboundaries crossed by patients during the ED hospitalization(ie, if patients were transferred from the emergency room tothe observation room during ED stay).
Pneumonia severity on admission was assessed usingthe Pneumonia Severity Index31 (PSI), a well-validateddisease severity predictor of 30-day mortality for patientswith CAP.32 – 34 Patients were assigned to 1 of 5 severitycategories based on demographic characteristics, coexistingillnesses, features of physical examination on admission,laboratory results, and chest x-ray findings. Class I patientshave the least severe disease, whereas class V patients arethose with the highest degree of severity. Laboratory valuesused were the first recorded in the initial 24 hours of EDadmission. When laboratory examinations were not per-formed during this admission, their results were consideredto be normal. According to the PSI scores, patients weregrouped in 2 main categories: those with PSI scores �90points (classes I to III) and those with higher scores (classesIV and V).
Adverse events were defined as complications due tohealth care management during ED hospitalization regard-less of the underlying patient condition. The AE classifica-tion adopted in this study has been detailed elsewhere.29
Each AE was categorized regarding its degree of severi-ty,29,35 potential cause,29,35 related professional categoryinvolved in patient care,29,36 and the occurrence of noso-comial infections.29,36,37 The severity degree was classifiedin major and minor according to the intensity of risk imposedfor patients by the AEs. Major events corresponded to life-threatening complications or severe problems persisting atdischarge from the medical ED. Regarding their potentialcauses, AEs were classified as resulting from drugs, diag-nostic or therapeutic interventions, falls, nursing activities,dietary management, transfusions, or miscellaneous.29,35 Theprofessional categorization aimed to characterize AEs inrelation to the different professionals responsible for care andincluded medical, nursing-care related, and administrativecategories.29,36
Statistical AnalysisData were double-entered into a computerized data-
base and verified for consistency. The reviewers’ agreementlevel regarding the occurrence of AEs was assessed by thepercentage of agreement and kappa coefficient determina-tion. For quantitative variables, means, standard deviations,medians, minimum and maximum values were presented.Means were compared with Student t or Mann-Whitney Utests whenever appropriate. Categorical variables werepresented in absolute and relative frequencies. Univariateand multivariate conditional logistic regression analyseswere used to estimate the risk of death associated to selectedfactors, and odds ratios (OR) and 95% corresponding
n 2006 Lippincott Williams & Wilkins 351
Infectious Diseases in Clinical Practice � Volume 14, Number 6, November 2006 Adverse Events in CAP
Copyr ight © Lippincott Williams & Wilkins. Unauthorized reproduction of this article is prohibited.

confidence intervals (CI) were calculated. A multivariatemodel was constructed for the whole group of AEs and foreach category separately (major, minor, medical, nursing,and administrative). Variables with P < 0.20 in the univariateanalysis were hierarchically entered in the multivariatemodel (stepwise forward). Variables with collinearity or ahigh percentage of missing values were not included in theanalysis. The independent variables retained in the finalmodel were selected based on their clinical relevance andnumerical significance. Two-tailed P values were considered
significant if �0.05. Data were analyzed using Statasoftware, Version 8.0 (Stata Corporation, Tex).
RESULTSA total of 101 pairs of patients were analyzed. The
distribution of cases and controls and the univariate analysisconcerning demographic aspects, severity on admission, andcharacteristics of health care delivered are presented inTable 1. Cases were older than controls and most of them
TABLE 1. Distribution of Cases and Controls and Univariate Conditional Analyses According to Demographic Features, Degree ofSeverity on Admission, and Characteristics of Health Care Delivered
Variable Cases (%) Controls (%) OR 95% CI P
Age (y)
Mean ± SD (Md, min-max) 63.0 ± 18.4 (66, 18–98) 56.6 ± 21.8 (60, 18–94) 0.024*
�60 40 (39.6) 52 (51.5) 1
>60 61 (60.4) 49 (48.5) 1.60 0.92–2.80 0.099y
Sex
Female 39 (38.6) 53 (52.5) 1
Male 62 (61.4) 48 (47.5) 1.88 1.02–3.44 0.042y
Race
White 75 (74.3) 79 (78.2) 1
Nonwhite 26 (25.7) 22 (21.8) 1.20 0.66–2.17 0.547y
PSI scoresz
Mean ± SD (Md, min-max) 155.4 ± 34.1 (126,76–222) 96.5 ± 43.9 (126, 11–204) <0.001x
�90 2 (2.2) 42 (43.8) 1
>90 90 (97.8) 54 (56.2) 38.0 5.22–276.73 <0.001y
Ability to walk unassisted on admissionk
Yes 25 (32.1) 73 (78.5) 1
No 53 (67.9) 20 (21.5) 8.50 3.02–23.95 <0.001*
Charlson index (modified)
Mean ± SD (Md, min-max) 3.1 ± 2.2 (2, 0–9) 2.1 ± 2.2 (2, 0–9) <0.001x
0 9 (8.9) 22 (21.8) 1
�1 92 (91.1) 79 (78.2) 2.86 1.21–6.76 0.017y
Length of stay (d)
Mean ± SD (Md, min-max) 4.2 ± 5.2 (2, 0–33) 2.0 ± 2.0 (1, 0–13) <0.001x
�2 days 50 (49.5) 82 (81.2) 1
>2 days 51 (50.5) 19 (18.8) 3.67 1.94–6.96 <0.001y
No. health care teams involved
Mean ± SD (Md, min-max) 1.9 ± 0.5 (2, 1–3) 1.4 ± 0.5 (2, 1–3) <0.001x
1 60 (16.8) 17 (59.4) 1
>1 41 (83.2) 84 (40.6) 11.75 4.23–32.61 <0.001y
Procedures
Mean ± SD (Md, min-max) 4,1 ± 2.1 (2, 0–9) 1.1 ± 0.8 (2, 0–5) <0.001x
0 1 (1.0) 16 (15.8) 1
�1 100 (99.0) 85 (84.2) — — —
*Student t test P value.yConditional univariate logistic regression P value.zMissing data for 9 cases and 5 controls—92 pairs.xMann-Whitney U test P value.kMissing data for 23 cases and 8 controls—71 pairs.OR indicates crude odds ratio; CI, confidence interval; n, number of cases or controls; SD, standard deviation; Md, median; min, minimum value; max,
maximum value.
352 n 2006 Lippincott Williams & Wilkins
Daud-Gallotti et al Infectious Diseases in Clinical Practice � Volume 14, Number 6, November 2006
Copyr ight © Lippincott Williams & Wilkins. Unauthorized reproduction of this article is prohibited.
were men (61.4%). No statistical significant difference wasfound between both study groups regarding race. Over 90%of the cases and 78% of the controls had at least 1 coexistingillness on admission. Malignancies were the predominantcomorbidity found in both study groups, affecting 67patients. Chronic obstructive lung disease was detected in39 patients. The mean Charlson score was higher in casescompared to controls.
Regarding clinical status on admission, the vastmajority of cases were admitted in more severe conditions.In fact, almost all of them were PSI class IV or V, whereasless than 57% of the controls belonged to these groups. Thedistribution of cases and controls concerning PSI classifica-tion is presented in Figure 1. Also, the functional capacitywas lower in the case group.
Cases remained hospitalized in the ED for a longerperiod and crossed a higher number of administrativeboundaries during their ED stay, being cared therefore byseveral professional teams. Also, cases underwent morefrequent and complex procedures than controls during EDhospitalization. In fact, all cases underwent at least 1intervention, whereas almost 16% of the controls underwent
no procedures during ED stay. Intubation and mechanicalventilation were carried out only in the case group, andcorresponded to frequent procedures in this group. Also,central venous catheterization strongly predominated amongthe cases.
The main causes of death were sepsis secondary topneumonia, malignancies, and pulmonary embolism. Thesediagnoses were confirmed by autopsy in almost all patients.
Adverse EventsA total of 603 AEs was found in both groups: 456
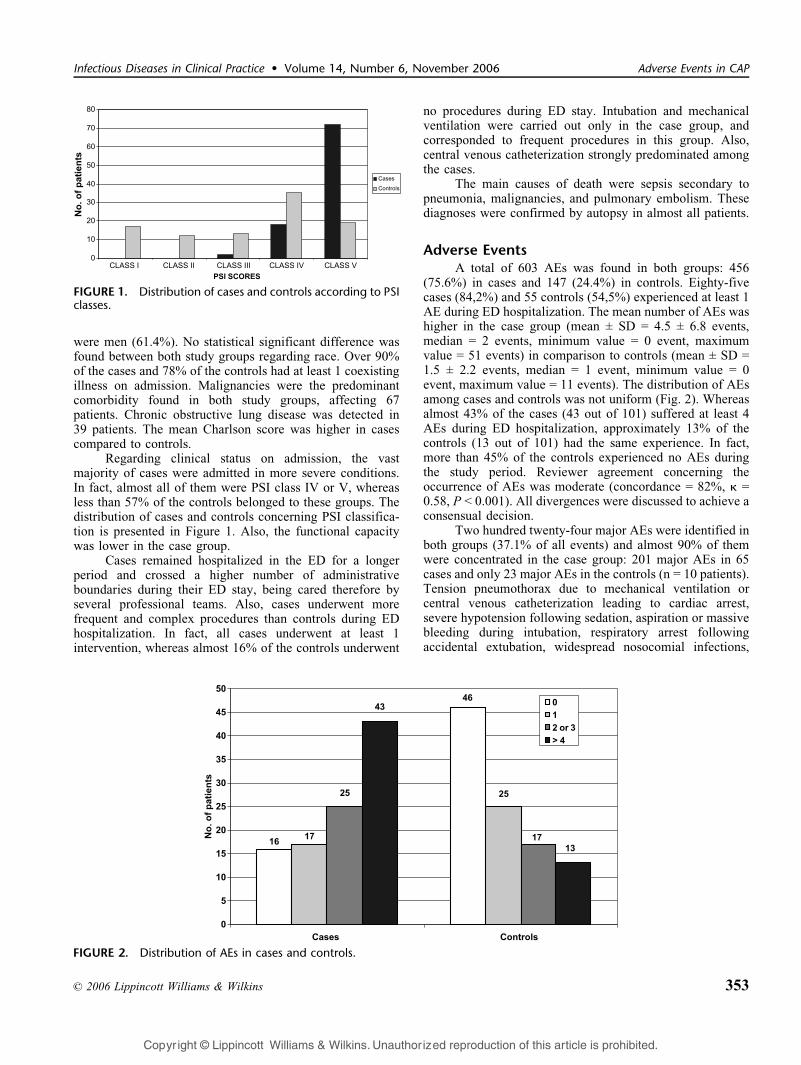
(75.6%) in cases and 147 (24.4%) in controls. Eighty-fivecases (84,2%) and 55 controls (54,5%) experienced at least 1AE during ED hospitalization. The mean number of AEs washigher in the case group (mean ± SD = 4.5 ± 6.8 events,median = 2 events, minimum value = 0 event, maximumvalue = 51 events) in comparison to controls (mean ± SD =1.5 ± 2.2 events, median = 1 event, minimum value = 0event, maximum value = 11 events). The distribution of AEsamong cases and controls was not uniform (Fig. 2). Whereasalmost 43% of the cases (43 out of 101) suffered at least 4AEs during ED hospitalization, approximately 13% of thecontrols (13 out of 101) had the same experience. In fact,more than 45% of the controls experienced no AEs duringthe study period. Reviewer agreement concerning theoccurrence of AEs was moderate (concordance = 82%, k =0.58, P < 0.001). All divergences were discussed to achieve aconsensual decision.
Two hundred twenty-four major AEs were identified inboth groups (37.1% of all events) and almost 90% of themwere concentrated in the case group: 201 major AEs in 65cases and only 23 major AEs in the controls (n = 10 patients).Tension pneumothorax due to mechanical ventilation orcentral venous catheterization leading to cardiac arrest,severe hypotension following sedation, aspiration or massivebleeding during intubation, respiratory arrest followingaccidental extubation, widespread nosocomial infections,
FIGURE 1. Distribution of cases and controls according to PSIclasses.
FIGURE 2. Distribution of AEs in cases and controls.
n 2006 Lippincott Williams & Wilkins 353
Infectious Diseases in Clinical Practice � Volume 14, Number 6, November 2006 Adverse Events in CAP
Copyr ight © Lippincott Williams & Wilkins. Unauthorized reproduction of this article is prohibited.

and severe in-hospital hypoglycemic episodes are examplesof major AEs related to death. The vast majority of theAEs identified in the control group (124 out of 147, 84.4%)were categorized as minor AEs, whereas this happenedwith less than 60% of the AEs detected in cases (255 out of456, 55.9%).
The distribution of AEs according to their potentialcause is summarized in Table 2. Diagnostic and therapeuticprocedures accounted for 22.4% of all events, followed bynursing activities (20.7% of all events). Procedures were themain potential cause of AEs in cases, whereas nursingactivities were the preponderant AE potential cause incontrols. In 71 patients, 135 procedure-related events wereidentified: 118 episodes in 60 cases and 17 events in 11controls. Intubation was the procedure more frequentlyimplicated with AE occurrence in the case group—24 casessuffered 28 intubation-related complications—leading main-ly to aspiration, bleeding, and cardiovascular collapse. In thecontrol group, simpler procedures were implicated with theoccurrence of AEs, mainly delayed complementary examsaffecting patient management. Nursing activities accountedfor 125 AEs: 70 episodes in 35 cases and 55 in 32 controls.Diet management and drugs were related to the occurrenceof 13.4% and 10.4% of all events, respectively.
Table 3 shows the distribution of AEs in both studygroups according to the related professional category andthe occurrence of nosocomial infections. More than 4 outof each 10 AEs identified in both groups (43.8% of allevents) involved nursing professionals, therefore represent-ing the most frequent professional-related AE category.Fifty-seven cases and 38 controls suffered at least 1nursing-care–related AE during their medical ED hospi-talization. Inadequate prescription follow-up was the mostcommon problem, with 193 occurrences involving 43cases and 33 controls. Of the 264 nursing AEs, less thanone fifth (48 episodes) were considered of higher severity(major AEs).
Medical AEs were the next most frequent professionalcategory related to AEs, with 223 events (37.0% of allevents): 180 episodes in 68 cases and 43 events in 23
controls. Almost 70% of all reported medical AEs (155 outof 223) corresponded to life-threatening complications orpersisted at discharge from the medical ED, being thereforecharacterized as major AEs. Hypoglycemia, inadequatefollow-up, and procedure-related problems accounted formore than 93% of all medical complications (208 out of 223events). Hypoglycemia was the isolated most frequentmedical AE, with 103 episodes (84 events in 24 cases and19 episodes in 9 controls).
Administrative AEs were detected in 70 patients, with108 occurrences (17.9% of all events): 77 episodes in 47cases and 31 events in 23 controls. The vast majority of thereported administrative AEs were considered of minorseverity (94 out of 108 episodes). Nonavailable medications,examinations, or procedures and insufficient bed availabilitywere the most frequent organizational problems, with 94occurrences (87.0% of all administrative AEs).
TABLE 2. Distribution of Adverse Events in Cases and ControlsAccording to the Potential Cause
Potential Cause
Cases
(n = 85)
Controls
(n = 55) Total
Diagnostic or therapeuticprocedures
118 17 135
Nursing activities 70 55 125
Dietary management 71 10 81
Drug 45 18 63
Transfusion 5 1 6
Fall/trauma 1 1 2
Miscellaneous 146 45 191
Total 456 147 603
n indicates number of cases or controls with AEs.
TABLE 3. Distribution of Adverse Events in Cases and ControlsAccording to the Professional Category Involved in PatientCare and the Occurrence of Nosocomial Infections
Type of AE Cases Controls Total
Nursing care (major) 191 (46) 73 (2) 264 (48)
Inadequate prescriptionfollow-up
129 64 193
Problems related to catheters 39 7 46
Delays to obtain andsend samples
9 1 10
Decubitus ulcers 8 0 8
Accidental extubation 4 0 4
Falls/traumas 1 1 2
Others 1 0 1
Medical (major) 180 (135) 43 (20) 223 (155)
Hypoglycemic episodes 84 19 103
Inadequate follow-up 39 20 59
Problems related toprocedures
42 4 46
Bleeding and pulmonaryembolism
7 0 7
Drug reaction 3 0 3
Surgical 3 0 3
Others 2 0 2
Administrative (major) 77 (12) 31 (1) 108 (13)
Medication not available 40 18 58
Examinations and equipmentnot available
23 8 31
Insufficient bed availability 9 4 13
Lack of hemoderivates 5 1 6
Nosocomial infections (major) 8 (7) 0 8 (7)
Cutaneous 3 0 3
Lower respiratory tract 2 0 2
Urinary tract 2 0 2
Ocular 1 0 1
Total 456 147 603
354 n 2006 Lippincott Williams & Wilkins
Daud-Gallotti et al Infectious Diseases in Clinical Practice � Volume 14, Number 6, November 2006
Copyr ight © Lippincott Williams & Wilkins. Unauthorized reproduction of this article is prohibited.

We found 8 episodes of nosocomial infections (1.3%of 603 events), all of them in the case group, affecting 7patients. All except 1 nosocomial infection episode werecharacterized as major AEs.
The crude OR estimates for the different AE categoriesare presented in Table 4. The presence of at least 1 AE duringmedical ED hospitalization was significantly associated with ahigher risk of death (OR, 4.00; 95% CI, 2.00–8.00). Thisassociation was stronger when medical AEs were analyzed(OR, 5.40; 95% CI, 2.75–10.60). The strongest associationwas found with major AEs (OR, 10.17; 95% CI, 4.40–23.52).
Table 5 presents the multivariate conditional logisticregression models constructed with all AEs and with eachAE category (major, minor, medical, nursing, administrative,and nosocomial infections) for 92 pairs of patients, includingthe following variables: PSI, length of stay, presence ofcomorbidities, sex, and age. The occurrence of at least 1 AEduring the ED hospitalization was significantly associatedwith death (adjusted OR, 3.25; 95% CI, 1.32–8.03; P =0.010). The degree of severity on admission (PSI score) wasthe most important predictor for death during ED hospital-ization. Length of stay in the ED also remained as anindependent risk factor for in-hospital mortality, but on alower scale.
When the multivariate logistic regression includedmajor AEs, the association with death was even stronger(adjusted OR, 8.37; 95% CI, 2.77–25.26; P < 0.001). The PSI
score was again the most relevant risk factor for hospitaldeath. Minor AEs were not retained in the correspondingmodel.
TABLE 4. Crude Odds Ratio Estimates for All Adverse Events, Major and Minor Adverse Events, Nosocomial Infections and AdverseEvent Related Professional Categories
Type of AE Cases, n (%) Controls, n (%) OR 95% CI P
All AEs
No 16 (15.8) 46 (45.4) 1
Yes 85 (84.2) 55 (54.5) 4.00 2.00–8.00 <0.001
Major AEs
No 36 (35.6) 91 (90.1) 1
Yes 65 (64.4) 10 (9.9) 10.17 4.40–23.52 <0.001
Minor AEs
No 29 (28.7) 47 (46.5) 1
Yes 72 (71.3) 54 (53.5) 2.20 1.19–4.05 0.011
Medical AEs
No 34 (33.7) 78 (77.2) 1
Yes 67 (66.3) 23 (22.8) 5.40 2.75–10.60 <0.001
Administrative AEs
No 53 (52.5) 78 (77.2) 1
Yes 48 (47.5) 23 (22.8) 3.27 1.67–6.43 0.001
Nursing care AEs
No 44 (43.6) 63 (62.4) 1
Yes 57 (56.4) 38 (37.6) 2.00 1.15–3.47 0.014
Nosocomial infections
No 94 (93.1) 101 (100.0) 1
Yes 7 (6.9) 0 (0.0) — — —
n indicates number of cases or controls; OR, crude odds ratio; CI, confidence interval; P, conditional univariate logistic regression P value; AEs, adverseevents.
TABLE 5. Multivariate Conditional Logistic RegressionPredicting the Risk of Death for All Adverse Events, MajorAdverse Events, and Medical Adverse Events (n = 92 pairs)
Variables (reference) OR OR* 95% CI P
All AEs
PSI scores (�90) 38.00 27.60 3.65–208.49 0.001
All AEs (0) 4.00 3.25 1.32–8.03 0.010
Length of stay (�2 d) 3.67 2.76 1.17–6.50 0.020
Major AEs
PSI scores (�90) 38.00 17.69 2.15–145.64 0.008
Major AEs (0) 10.17 8.37 2.77–25.26 <0.001
Length of stay (�2 d) 3.67 2.05 0.76–5.58 0.156
Medical AEs
PSI scores (�90) 38.00 23.27 3.00–180.01 0.003
Medical AEs (0) 5.40 4.23 1.74–10.29 0.001
Length of stay (�2 d) 3.67 2.99 1.16–7.70 0.023
OR indicates crude odds ratio; OR*, adjusted odds ratio for the variablesshown in the table; CI, confidence interval; P, conditional multivariatelogistic regression P value; AEs, adverse events.
n 2006 Lippincott Williams & Wilkins 355
Infectious Diseases in Clinical Practice � Volume 14, Number 6, November 2006 Adverse Events in CAP
Copyr ight © Lippincott Williams & Wilkins. Unauthorized reproduction of this article is prohibited.

Concerning the multivariate logistic regression includ-ing each of the different professional categories of AEs andthe occurrence of nosocomial infections, only medical AEsshowed a significant association with death (adjusted OR,4.23; 95% CI, 1.74–10.29; P = 0.001). In this model, the PSIscore imposed again the highest risk for death.
DISCUSSIONCommunity-acquired pneumonia is one of the most
frequent severe acute infections in adults, leading toapproximately 1 million hospitalizations every year andconsuming huge amounts of health care resources in theUnited States.38 – 40 Many studies focusing on CAP manage-ment have been published recently, providing importanttools for clinical decisions regarding initial assessment, needfor hospitalization, choice of appropriate antimicrobials,timing of antibiotic administration, earlier transition fromintravenous to oral therapy, safe criteria for hospitaldischarge and return to usual activities.26,33,41 – 54 Neverthe-less, considerable variations in the quality of care deliveredto these patients have been found among countries, regionalareas, and health care facilities, even when controlling forclinical severity, with a significant proportion of patientsreceiving substandard care.55 – 60
Adverse event monitoring is a valuable tool to evaluateand improve the quality of health care,61,62 giving essentialinformation concerning the nature, facilitating conditions,and preventive measures related to these complications.63 – 67
Emergency departments are the main and sometimes the soleportal to health care for most patients with CAP seekingcare.26
Retrospective analysis of medical charts is consideredan appropriate approach to identify the occurrence ofAEs.68 – 71 In fact, most studies involving AE detection inhospitalized patients adopted this methodology.12 – 19,35,36,72
The few prior investigations involving exclusively EDs havealso demonstrated the viability of AE identification review-ing patient records.29,73 – 75 Moreover, most studies regardingCAP management also adopted this strategy to analyze thedifferent aspects of the quality of care delivered to thesepatients.9,10,32,33,41,42,48,52,55 – 58,60 However, not all AEs arerecorded in medical charts, and retrospective studies arelikely to underestimate AE occurrence.76
Concerning the study design, prior case-control studieshave been carried out to evaluate the relationship betweenAEs and hospital death.36,62,77,78 This methodology alsopermits the understanding of the importance of thesecomplications when compared with other potential risk factorsfor death.29,36,77,78 In this study, patients were matched foradmission period to permit a greater similarity between casesand controls in terms of the health care teams involved inpatient care, ED environment, and clinical approach. Healthcare characteristics play an important role in AE occurrenceand hospital mortality.10,12 – 20,23,29,55,56,62,73 Patients were notmatched for illness severity on admission because we wantedto analyze not only the influence of this variable in hospitalmortality but also its relation with the occurrence of AEs.Pneumonia severity index is considered an important
predictor of CAP mortality31 – 34 and is our major indicatorof clinical severity. Previous investigations have pointed outthe critical role of admissional clinical status in both hospitalmortality and AE occurrence.10,12 – 20,29,36,62
To investigate the influence of AEs in patientoutcomes in our ED, we chose 2 well-defined diseaseentities with different hospital mortality rates, stroke29 andCAP, considered good tracers79,80 for quality assessment.We adopted a wider AE characterization, not conditioned tomeasurable disability, prolonged length of stay or death,because we aimed to investigate the overall presence andimpact of AEs in the service process of care, not only theirdirect effects on the patients. We found that AEs werefrequent and predominated in the deceased in comparison todischarged patients, involving 84.2% and 54.5% of them,respectively. The predominance of AEs among hospitaldeaths in relation to discharged patients has already beenreported in a prior case-control study carried out in a Spanishtertiary teaching hospital.36 However, it is noteworthy thatour results are remarkably higher than formerly reported. Infact, few studies involved exclusively EDs, previouslydescribed as settings where errors are frequent,21 – 25,73,74
averaging 1 in every 5 admitted patients.81 Also, the absenceof a standardized AE definition makes comparison of thestudies very difficult.20,22,23 Important population-basedstudies, adopting more restrictive AE definition (associatedto measurable injury, prolonged length of stay or death),described notably lower AE rates.14 – 19 On the other hand,investigations using wider AE definitions (complications notnecessary resulting in injury) showed higher proportions ofpatients affected by these events.35,36,73 All above consid-erations may partially explain the higher proportion of AEsdetected in the present study.
Confirming prior investigations, we found that most ofthe AEs detected in both groups were considered of minorseverity.12 – 20,62 Nevertheless, the proportion of major AEswas higher among the deceased patients. The preponderanceof severe complications among hospital deaths has alreadybeen described.12 – 20,29,62
Many efforts have been made to understand thepotential causes for AE occurrence.19,20,63 Medication prob-lems are frequently considered the isolated most importantnonsurgical AE category.12 – 15,18,19,82 It is noteworthy,however, that we found that drug-related AEs correspondedto less than 11% of the reported complications. As we did notfocus on drug interaction or medication error, our data may beunderestimated. In fact, as in our prior investigation withstroke patients,29 we found that procedures and nursingactivities were the preponderant AE potential causes,accounting for more than 40% of the events.
Regarding AE professional categorization, we identifiedthat AEs related to nursing and medical performance areasaccounted for more than 80% of all reported events. In fact,nursing-care–related AEs have been described as the mostfrequent professional category.36 Several factors contribute tothis scenario, including insufficient nurse staff, higher exposuredue to more patient manipulation, and better quality of nursingnotes in medical charts.81,83–85 Deficiencies related to
356 n 2006 Lippincott Williams & Wilkins
Daud-Gallotti et al Infectious Diseases in Clinical Practice � Volume 14, Number 6, November 2006
Copyr ight © Lippincott Williams & Wilkins. Unauthorized reproduction of this article is prohibited.

prescription follow-up were the preponderant problem, corrob-orating prior data that demonstrated that approximately half ofthe patients with CAP, who transferred from the ED to theinternal medicine service of a tertiary academic hospital,suffered delays in the administration of prescribed antibiotics.86
Although very frequent, the great majority of the nursing AEsidentified in the present study led to minimal impairment,seeming not to impose a higher risk of death in the affectedpatients. These findings contrast with earlier studies thatdescribed a significant association between nursing AEs and in-hospital mortality.36
Medical AEs were mainly severe, and essentiallycorresponded to hypoglycemia, deficiencies in clinicalfollow-up and procedure complications, confirming priorinvestigations.13 – 15,17,23,29,36,73,74,81,87 – 90 Hypoglycemia isregarded as an important error marker in hospitalizedpatients.22 Moreover, diagnostic or therapeutic flaws andmonitoring problems were referred as predominant medicalcare deficiencies not only in studies focusing on all hospitaladmissions13 – 15,17,23,36,73,74,81,87 – 90 but also in those specif-ically related to CAP hospitalizations. Studies publishedformerly have demonstrated that a significant proportion ofCAP inpatients had not received antibiotics timely, had nothad their culture bloods drawn within 24 hours of hospitaladmission, or had not been discharged timely after achievingclinical stability.8 – 10,32,41,42,45,55 – 60
We found that the occurrence of at least 1 AE duringED hospitalization in CAP patients imposed a higher risk ofdeath (adjusted OR, 3.25; 95% CI, 1.32–8.03; P = 0.010).This association was even stronger when either medical(adjusted OR, 4.23; 95% CI, 1.74–10.29; P = 0.001) ormajor (adjusted OR, 8.37; 95% CI, 2.77–25.26; P < 0.001)AEs were analyzed. The association between AEs and deathwas observed after controlling for PSI scores. Our findingsconcur with those from former studies that pointed out therole of AEs, especially those more serious, in patientoutcomes during hospitalization.12 – 20,29,36,62 However,those results do not mean that AEs were directly responsiblefor patient deaths, as many patients carried a higher riskof death related to their clinical conditions, independentlyof any AE occurrence.29,91 Severity on admission was themost important predictor of death among our patients, asformerly demonstrated by several important investiga-tions.33,34,42,45,55,56,92 Moreover, the literature supports thesignificant role of PSI scores in predicting the risk of deathin hospitalized patients with CAP.10,33,34,42,45,55,56,92,93
Three recent studies focusing on the predictors of mortalityin patients with CAP highlighted the critical value ofassessing selected clinical conditions in predicting unfavor-able outcomes, including increasing age, sex, coexistingillnesses, evidence of aspiration, and functional status onadmission.94 – 96 Despite the outstanding role of severity onadmission in patient outcomes, our findings suggest that theoccurrence of AEs during ED hospitalization did contributeto hospital deaths.
This study has some limitations. One of them isrelated to its observational retrospective nature because itwas based on the review of possibly incomplete medicalrecords. Secondly, it was conducted at the medical ED of
only one major teaching hospital, limiting potential gene-ralization of our results. Also, this study enrolled patientsadmitted from 1996 to 1999, and some findings may bedifferent today. Moreover, Brazilian EDs may differ fromhealth care facilities in other countries and ED lengths ofstay over 24 hours are very common. However, the lite-rature supports that the AE scenario seems not to havechanged significantly in the past years.97 In addition, thereviewers were not blinded to patient outcomes since chartscould not be modified or copied for research purposes. Also,the reviewer agreement concerning AE occurrence was onlymoderate, like most of the previous AE investigations. Tominimize biases, rigorous criteria for AE definition andcharacterization were adopted. Moreover, all identified AEswere discussed with the researchers to achieve a consensus.Controversial findings were excluded from the analyses.Regarding the retrospective determination of PSI scores, ourassumption that missing values were normal, a strategyfrequently adopted,52,93 might have underestimated somescores. Finally, although we tried to incorporate variablespreviously related to the occurrence of AEs and hospitalmortality, some potential confounders may have remainedwithout control.
CONCLUSIONSIn summary, we found that AEs were frequent among
CAP patients admitted to our ED, predominating in thedeceased patients. Although most of these complications ledto minimal impairments, approximately 37% of them wereregarded as severe AEs. Diagnostic or therapeutic proceduresand nursing activities accounted for nearly 4 out of each 10identified AEs. Regarding the AE-related professionalcharacterization, complications related to nursing andphysician performance areas predominated. The occurrenceof AEs during ED hospitalization was associated with ahigher risk of death in the CAP-affected patients. Consid-ering the impact of CAP in the health care system and therole of EDs in receiving most of these patients, monitoringAEs and exteriorizing their facilitating conditions are crucialto improve the quality of care delivered to CAP patients inthese settings.
REFERENCES
1. Clinical classification for health policy research: hospital inpatientstatistics, 1996. Rockville, MD: Agency for Health Care Policy andResearch; 1999; Publication no. 99–0034.
2. Barlett JG, Breiman RF, Mandell LA, et al. Community-acquiredpneumonia in adults: guidelines for management. Clin Infect Dis.1998;26:811–838.
3. Niederman MS, McCombs JS, Unger AN, et al. The cost of treatingcommunity-acquired pneumonia. Clin Ther. 1998;20:820–837.
4. Pneumonia and influenza death rates—United States, 1979–1994.MMWR Morb Mortal Wkly Rep. 1995;44:535–537.
5. Centers for Disease Control and prevention. Premature deaths, monthlymortality and monthly physician contacts—United States [Abstract].MMWR Morb Mortal Wkly Rep. 1997;46:556.
6. Marrie TJ. Community-acquired pneumonia: epidemiology, etiology,treatment. Infect Dis Clin North Am. 1998;12:723–740.
7. Fine MJ, Smith MA, Carson CA, et al. Prognosis and outcomes ofpatients with community-acquired pneumonia: a meta-analysis. JAMA.1996;275:134–141.
n 2006 Lippincott Williams & Wilkins 357
Infectious Diseases in Clinical Practice � Volume 14, Number 6, November 2006 Adverse Events in CAP
Copyr ight © Lippincott Williams & Wilkins. Unauthorized reproduction of this article is prohibited.

8. Fine MJ, Hough LJ, Medsger AR, et al. The hospital admission decisionfor patients with community-acquired pneumonia: results from thepneumonia patient outcomes research team cohort study. Arch InternMed. 1997;157:36–44.
9. Lim AF, Tan JS, Murphy DP. Factors influencing length of stay, time toresolution of morbidity, and cost of patient care: a comparativeretrospective study of short-stay and long-stay patients hospitalizedfor simple pneumonia (DRG 89 and 90). Infect Dis Clin Pract. 2001;10:375–383.
10. Dedier J, Singer DE, Chang Y, et al. Process of care, illness severity,and outcomes in the management of community acquired pneumonia atacademic hospitals. Arch Intern Med. 2001;161:2099–2104.
11. Hiatt HH, Barnes BA, Brennan TA, et al. A study of medical injury andmedical malpractice. N Engl J Med. 1989;321:480–484.
12. Brennan TA, Leape LL, Laird NM, et al. Incidence of adverse eventsand negligence in hospitalized patients. Results of the Harvard MedicalPractice Study I. N Engl J Med. 1991;324:370–376.
13. Leape LL, Brennan TA, Laird N, et al. The nature of adverse events inhospitalized patients. Results of the Harvard Medical Practice Study II.N Engl J Med. 1991;324:377–384.
14. Thomas EJ, Studdert DM, Burstin HR, et al. Incidence and types ofadverse events and negligent care in Utah and Colorado. Med Care.2000;38:261–271.
15. Wilson RM, Runciman WB, Gibberd RW, et al. The quality inAustralian health care study. Med J Aust. 1995;163:458–471.
16. Vincent C, Neale G, Woloshynowych M. Adverse events in Britishhospitals: preliminary retrospective record review. BMJ. 2001;322:517–519.
17. Davis P, Lay-Yee R, Briant R, et al. Preventable in-hospital medicalinjury under the ‘‘no fault’’ system in New Zealand. Qual Saf HealthCare. 2003;12:251–256.
18. Baker GR, Norton PG, Flintoft V, et al. The Canadian adverse eventsstudy: the incidence of adverse events among hospital patients inCanada. CMAJ. 2004;170:1678–1686.
19. Khon LT, Corrigan JM, Donaldson MS, eds. To Err Is Human: Buildinga Safer Health System. Institute of Medicine Report. Washington, DC:National Academic Press; 1999.
20. Weingart SN, Wilson McL, Gibberd RW, et al. Epidemiology ofmedical error. BMJ. 2000;320:774–777.
21. Boreham NC, Shea CE, Mackway-Jones K. Clinical risk and collectivecompetence in the hospital emergency department in the UK. Soc SciMed. 2000;51:83–91.
22. Handler JA, Gillam M, Sanders AB, et al. Defining, identifying, andmeasuring error in emergency medicine. Acad Emerg Med. 2000;7:1183–1188.
23. Schenkel S. Promoting patient safety and preventing medical error inemergency departments. Acad Emerg Med. 2000;7:1204–1222.
24. Adams JG, Bohan JS. System contributions to error. Acad Emerg Med.2000;7:1189–1193.
25. Vincent C, Simon R, Sutcliffe K, et al. Errors conference: executivesummary. Acad Emerg Med. 2000;7:1180–1182.
26. Yealy DM, Auble TE, Stone RA, et al. The emergency departmentcommunity-acquired pneumonia trial: methodology of a qualityimprovement intervention. Ann Emerg Med. 2004;43:770–782.
27. International Statistical Classification of Diseases and Related HealthProblems, 1989 Revision (10th revision—ICD-10). Geneva: WorldHealth Organization; 1992.
28. Niederman MS, Bass JB Jr, Campbell GD, et al. American ThoracicSociety. Guidelines for the initial management of adults withcommunity-acquired pneumonia: diagnosis, assessment of severity;and initial antimicrobial therapy. Am Rev Respir Dis. 1993;148:1418–1426.
29. Daud-Gallotti R, Novaes HMD, Lorenzi MC, et al. Adverse events anddeath in stroke patients admitted to the emergency department of atertiary university hospital. Eur J Emerg Med. 2005;12:63–71.
30. Librero J, Peiro S, Ordinana R. Chronic comorbidity and outcomes ofhospital care: length of stay, mortality, and readmission at 30 and 365days. J Clin Epidemiol. 1999;52:171–179.
31. Fine MJ, Auble TE, Yealy DM, et al. A prediction rule to identify lowrisk patients with community-acquired pneumonia. N Engl J Med.1997;336:243–250.
32. Atlas SJ, Benzer TI, Borowsky LH, et al. Safety increasing the proportion
of patients with community-acquired pneumonia treated as outpatients: aninterventional trial. Arch Intern Med. 1998;158:1350–1356.
33. Marrie TJ, Lau CY, Wheeler SL, et al. A controlled trial of a criticalpathway for treatment of community-acquired pneumonia. JAMA.2000;283:749–755.
34. Armour BS, Pitts SR, Pitts MM, et al. Validation of the pneumoniaseverity index among patients treated at home or in the hospital. DisManage Health Outcomes. 2003;11:595–601.
35. Steel K, Gertman PM, Crescenzi C, et al. Iatrogenic illness on a generalmedical service at a university hospital.NEngl JMed. 1981;304:638–642.
36. Garcia-Martin M, Lardelli-Claret P, Bueno-Cavanillas A, et al. Pro-portion of hospital deaths associated with adverse events. J ClinEpidemiol. 1997;50:1319–1326.
37. Garner JS, Jarvis WR, Emori TG, et al. CDC definitions for nosocomialinfections. In: Olmsted RN, ed. APIC Infection Control and AppliedEpidemiology: Principles and Practice. St. Louis: Mosby; 1996:A1-A20. Available at: http://www.apic.org/pdf/cdcdefs.pdf. AccessedJanuary 12, 2004.
38. Fine MJ, Pratt HM, Obrosky DS, et al. Relation between length ofhospital stay and costs of care for patients with community-acquiredpneumonia. Am J Med. 2000;109:378–385.
39. Colice GL, Morley MA, Asce C, et al. Treatment costs of community-acquired pneumonia in an employed population. Chest. 2004;125:2140–2145.
40. Orrick JJ, Segal R, Johns TE, et al. Resource use and cost of care forpatients hospitalized with community-acquired pneumonia. Pharma-coeconomics. 2004;22:751–757.
41. Halm EA, Fine MJ, Marrie TJ, et al. Time to clinical stability in patientshospitalized with community-acquired pneumonia: implications forpractice guidelines. JAMA. 1998;279:1452–1457.
42. Fine MJ, Stone RA, Singer DE, et al. Processes and outcomes of care forpatients with community-acquired pneumonia: results from thepneumonia patient outcomes research team (PORT) cohort study. ArchIntern Med. 1999;159:970–980.
43. Niederman MS, Mandell LA, Anzueto A, et al. America ThoracicSociety. Guidelines for the management of adults with community-acquired pneumonia. Diagnosis, assessment of severity, antimicrobialtherapy, and prevention. Am J Respir Crit Care Med. 2001;163:1730–1754.
44. Halm EA, Teirstein AS. Management of community-acquired pneumo-nia. N Engl J Med. 2002;347:2039–2045.
45. Menendez R, Ferrando D, Valles JM, et al. Influence of deviation fromguidelines on the outcome of community-acquired pneumonia. Chest.2002;122:612–617.
46. Mandell LA, Barlett JG, Dowell SF, et al. Update of practice guidelinesfor the management of community-acquired pneumonia in immuno-competent adults. Clin Infect Dis. 2003;37:1405–1433.
47. Silber SH, Garret C, Singh R, et al. Early administration of antibioticsdoes not shorten time to clinical stability in patients with moderate-to-severe community-acquired pneumonia. Chest. 2003;124:1798–1804.
48. Goss CH, Rubenfeld GD, Park DR, et al. Cost and incidence of socialcomordities in low-risk patients with community-acquired pneumoniaadmitted to a public hospital. Chest. 2003;124:2148–2155.
49. Metlay JP, Fine MJ. Testing strategies in the initial management ofpatients with community-acquired pneumonia. Ann Intern Med.2003;138:109–118.
50. Tan JS, File TM Jr. Management of community-acquired pneumonia. Afocus on conversion from hospital to the ambulatory setting. Am JRespir Med. 2003;2:385–394.
51. Macfarlane JT, Boldy D. 2004 update of BTS pneumonia guidelineswhat’s new? Thorax. 2004;59:364–366.
52. Campbell SG, Patrick W, Urquhart DG, et al. Patients with communityacquired pneumonia discharged from the emergency departmentaccording to a clinical practice guideline. Emerg Med J. 2004;21:667–669.
53. Carratala J, Fernandez-Sabe N, Ortega L, et al. Outpatient carecompared with hospitalization for community-acquired pneumonia.A randomized trial in low risk patients. Ann Intern Med. 2005;142:165–172.
54. Ramsdell J, Narsavage GL, Fink JB. Management of community-acquired pneumonia in the home. An American College of ChestPhysicians clinical position statement. Chest. 2005;127:1752–1763.
358 n 2006 Lippincott Williams & Wilkins
Daud-Gallotti et al Infectious Diseases in Clinical Practice � Volume 14, Number 6, November 2006
Copyr ight © Lippincott Williams & Wilkins. Unauthorized reproduction of this article is prohibited.

55. Meehan TP, Fine MJ, Krumholz H, et al. Quality of care, process andoutcomes in elderly patients with community-acquired pneumonia.JAMA. 1997;278:2080–2084.
56. Feagan BG, Marrie TJ, Lau CY, et al. Treatment and outcomes ofcommunity-acquired pneumonia at Canadian hospitals. CMAJ.2000;162:1415–1420.
57. Halm EA, Fine MJ, Kapoor WN, et al. Instability on hospital dischargeand the risk of adverse outcomes in patients with pneumonia. ArchIntern Med. 2002;162:1278–1284.
58. Halm EA, Horowitz C, Silver A, et al. Limited impact of a multicenterintervention to improve the quality and efficiency of pneumonia care.Chest. 2004;126:100–107.
59. Mandell L. Decision about treating community-acquired pneumonia.Ann Intern Med. 2005;142:215–216.
60. Mazzola JL, Oren PS, DeBellis RJ, et al. Evaluation of antibiotic usagewith a local community-acquired pneumonia guideline. Infect Dis ClinPract. 2005;13:60–64.
61. Leape LL, Woods DD, Hatlie MJ, et al. Promoting patient safety bypreventing medical error. JAMA. 1998;280:1444–1447.
62. Zhan C, Miller MR. Excess length of stay, charges, and mortalityattributable to medical injuries during hospitalization. JAMA. 2003;290:1868–1874.
63. Committee on Quality Health Care in America. Institute of Medicine.Crossing the Quality Chasm: A New Health System for the 21st Century.Washington, DC: National Academy Press; 2001.
64. Geraci JM. In-hospital complication occurrence as a screen for quality-of-care problems: what’s next? Med Care. 2000;38:777–780.
65. Press I. The measure of quality. Q Manage Health Care. 2004;13:202–209.
66. Chang A, Schyve PM, Croteau RJ, et al. The JCAHO patient safety eventtaxonomy: a standardized terminology and classification schema for nearmisses and adverse events. Int J Qual Health Care. 2005;17:95–105.
67. Leape LL, Berwick DM. Five years after To Err is Human. What havewe learned? JAMA. 2005;293:2384–2390.
68. Weingart SN, Iezzoni LI, Davis RB, et al. Use of administrative data tofind substandard care: validation of the complications screeningprogram. Med Care. 2000;38:796–806.
69. Thomas EJ, Petersen LA. Measuring errors and adverse events in healthcare. J Gen Intern Med. 2003;18:61–67.
70. Davis P, Lay-Yee R, Scott A, et al. Acknowledgement of ‘‘no fault’’medical injury: review of patients’ hospital records in New Zealand.BMJ. 2003;326:79–80.
71. Michel P, Quenon JL, de Sarasqueta AM, et al. Comparison of threemethods for estimating rates of adverse events and rates of preventableadverse events in acute care hospitals. BMJ. 2004;328:199.
72. Forster AJ, Asmis TR, Clark HD, et al. Ottawa hospital patient safetystudy: incidence and timing of adverse events in patients admitted to aCanadian teaching hospital. CMAJ. 2004;170:1235–40.
73. Wolff AM, Bourke J. Detecting and reducing adverse events in anAustralian rural base hospital emergency department using medicalrecord screening and review. Emerg Med J. 2002;19:35–40.
74. Seward E, Greig E, Preston S, et al. A confidential study of deaths afteremergency medical admission: issues relating to quality of care. ClinMed. 2003;3:425–434.
75. Braithwaite RS, DeVita MA, Mahidhara R, et al. Use of medical
emergency team (MET) responses to detect medical errors. Qual SafHealth Care. 2004;13:255–259.
76. Leape LL. Institute of Medicine medical error figures are notexaggerated. JAMA. 2000;284:95–97.
77. Gross PA, Antwerpen CV. Nosocomial infections and hospital deaths—a case control study. Am J Med. 1983;75:658–662.
78. Garcia-Martin M, Lardelli-Claret P, Jimenez-Moleon JJ, et al. Pro-portion of hospital deaths potentially attributable to nosocomialinfection. Infect Control Hosp Epidemiol. 2001;22:708–714.
79. Kessner DM, Kalk CE, Singer J. Assessing health quality—the case fortracers. N Engl J Med. 1973;288:189–194.
80. Wray NP, Ashton CM, Kuykendall DH, et al. Using administrativedatabases to evaluate the quality of medical care: a conceptualframework. Soc Sci Med. 1995;40:1707–1715.
81. Fordyce J, Blank FS, Pekow P, et al. Errors in a busy emergencydepartment. Ann Emerg Med. 2003;42:324–333.
82. McCarter TG, Centafont R, Daly FN, et al. Reducing medication errors:a regional approach for hospitals. Drug Saf. 2003;26:937–950.
83. Needleman J, Buerhaus P, Mattke S, et al. Nurse-staffing levels and thequality of care in hospitals. N Engl J Med. 2002;346:1715–1722.
84. Schriver JA, Talmadge R, Chuong R, et al. Emergency nursing:historical, current, and future roles. Acad Emerg Med. 2003;10:798–804.
85. Unruh L. Licensed nurse staffing and adverse events in hospitals. MedCare. 2003;41:142–152.
86. Shah MN, Schmit J, Croley WC, et al. Continuity of antibiotic therapyin patients admitted from the emergency department. Ann Emerg Med.2003;42:117–123.
87. Kuhn GJ. Diagnostic errors. Acad Emerg Med. 2002;9:740–750.88. Goldberg RM, Kuhn G, Andrew LB, et al. Coping with medical
mistakes and errors in judgment. Ann Emerg Med. 2002;39:287–292.89. Cosby KS. A framework for classifying factors that contribute to error
in the emergency department. Ann Emerg Med. 2003;42:815–823.90. Chern C-H, How C-K, Wang L-M, et al. Decreasing clinically
significant adverse events using feedback to emergency physicians oftelephone follow-up outcomes. Ann Emerg Med. 2005;45:15–23.
91. McDonald CJ, Weiner M, Hui SL. Deaths due to medical errors areexaggerated in Institute of Medicine report. JAMA. 2000;284:93–95.
92. Lim WS, Macfarlane JT. Importance of severity of illness assessment inmanagement of lower respiratory infections. Curr Opin Infect Dis.2004;17:121–125.
93. Montersen EM, Coley CM, Singer DE, et al. Causes of death for patientswith community-acquired pneumonia. Results from the pneumoniapatient outcomes research team cohort study. Arch Intern Med.2002;162:1059–1064.
94. Marrie TJ, Carriere KC, Jin Y, et al. Factors associated with deathamong adults <55 years of age hospitalized for community-acquiredpneumonia. Clin Infect Dis. 2003;36:413–421.
95. Ewig S, Roux A, Bauer T, et al. Validation of predictive rules andindices of severity for community acquired pneumonia. Thorax. 2004;59:421–427.
96. Marrie TJ, LieLing W. Factors influencing in-hospital mortality incommunity-acquired pneumonia. A prospective study of patients notinitially admitted to the ICU. Chest. 2005;127:1260–1270.
97. Altman DE, Clancy C, Blendon RJ. Improving patient safety—fiveyears after IOM report. N Engl J Med. 2004;351;20:2041–2043.
n 2006 Lippincott Williams & Wilkins 359
Infectious Diseases in Clinical Practice � Volume 14, Number 6, November 2006 Adverse Events in CAP
Copyr ight © Lippincott Williams & Wilkins. Unauthorized reproduction of this article is prohibited.