Advanced performance analysis of the Illinois agility test based on the tangential velocity and...
12
This article was downloaded by: [RMIT University], [Miss Clara Usma] On: 03 July 2011, At: 21:50 Publisher: Routledge Informa Ltd Registered in England and Wales Registered Number: 1072954 Registered office: Mortimer House, 37-41 Mortimer Street, London W1T 3JH, UK Sports Technology Publication details, including instructions for authors and subscription information: http://www.tandfonline.com/loi/rtec20 Advanced performance analysis of the Illinois agility test based on the tangential velocity and turning radius in wheelchair rugby athletes Clara Cristina Usma-Alvarez a , Julian Jang Ching Chua a , Franz Konstantin Fuss a , Aleksandar Subic a & Michael Burton a a School of Aerospace, Mechanical and Manufacturing Engineering, RMIT University, Melbourne, Australia Available online: 30 Jun 2011 To cite this article: Clara Cristina Usma-Alvarez, Julian Jang Ching Chua, Franz Konstantin Fuss, Aleksandar Subic & Michael Burton (2010): Advanced performance analysis of the Illinois agility test based on the tangential velocity and turning radius in wheelchair rugby athletes, Sports Technology, 3:3, 204-214 To link to this article: http://dx.doi.org/10.1080/19346182.2011.564284 PLEASE SCROLL DOWN FOR ARTICLE Full terms and conditions of use: http://www.tandfonline.com/page/terms-and-conditions This article may be used for research, teaching and private study purposes. Any substantial or systematic reproduction, re-distribution, re-selling, loan, sub-licensing, systematic supply or distribution in any form to anyone is expressly forbidden. The publisher does not give any warranty express or implied or make any representation that the contents will be complete or accurate or up to date. The accuracy of any instructions, formulae and drug doses should be independently verified with primary sources. The publisher shall not be liable for any loss, actions, claims, proceedings, demand or costs or damages whatsoever or howsoever caused arising directly or indirectly in connection with or arising out of the use of this material.
Transcript of Advanced performance analysis of the Illinois agility test based on the tangential velocity and...

This article was downloaded by: [RMIT University], [Miss Clara Usma]On: 03 July 2011, At: 21:50Publisher: RoutledgeInforma Ltd Registered in England and Wales Registered Number: 1072954 Registered office: Mortimer House,37-41 Mortimer Street, London W1T 3JH, UK
Sports TechnologyPublication details, including instructions for authors and subscription information:http://www.tandfonline.com/loi/rtec20
Advanced performance analysis of the Illinois agilitytest based on the tangential velocity and turning radiusin wheelchair rugby athletesClara Cristina Usma-Alvarez a , Julian Jang Ching Chua a , Franz Konstantin Fuss a ,Aleksandar Subic a & Michael Burton aa School of Aerospace, Mechanical and Manufacturing Engineering, RMIT University,Melbourne, Australia
Available online: 30 Jun 2011
To cite this article: Clara Cristina Usma-Alvarez, Julian Jang Ching Chua, Franz Konstantin Fuss, Aleksandar Subic & MichaelBurton (2010): Advanced performance analysis of the Illinois agility test based on the tangential velocity and turning radius inwheelchair rugby athletes, Sports Technology, 3:3, 204-214
To link to this article: http://dx.doi.org/10.1080/19346182.2011.564284
PLEASE SCROLL DOWN FOR ARTICLE
Full terms and conditions of use: http://www.tandfonline.com/page/terms-and-conditions
This article may be used for research, teaching and private study purposes. Any substantial or systematicreproduction, re-distribution, re-selling, loan, sub-licensing, systematic supply or distribution in any form toanyone is expressly forbidden.
The publisher does not give any warranty express or implied or make any representation that the contentswill be complete or accurate or up to date. The accuracy of any instructions, formulae and drug doses shouldbe independently verified with primary sources. The publisher shall not be liable for any loss, actions, claims,proceedings, demand or costs or damages whatsoever or howsoever caused arising directly or indirectly inconnection with or arising out of the use of this material.
RESEARCH ARTICLE
Advanced performance analysis of the Illinois agility test based on thetangential velocity and turning radius in wheelchair rugby athletes
CLARA CRISTINA USMA-ALVAREZ, JULIAN JANG CHING CHUA,
FRANZ KONSTANTIN FUSS, ALEKSANDAR SUBIC, & MICHAEL BURTON
School of Aerospace, Mechanical and Manufacturing Engineering, RMIT University, Melbourne, Australia
(Received 30 November 2010; accepted 20 January 2011)
AbstractThe Illinois agility test is a timed task suitable for wheelchair sports with multidirectional movements and it is commonly usedto evaluate the agility performance of athletes. In addition to test times, tangential velocities and turning radii are parametersof high importance in the assessment of agility performance. The main objective of this study is to develop a method thatallows the evaluation of the tangential velocity and turning radius that are achieved during the Illinois agility test, which isusually used for training wheelchair rugby athletes. A group of nine Paralympic wheelchair rugby athletes performed threetrials of the Illinois agility test using their own custom made chairs. The wheelchairs were instrumented with a 6 DOF(degrees of freedom) sensor (accelerometer/gyrometer). Linear accelerations, angular velocities and test times were recordedduring the test. The investigation of obtained performance enabled identification of instantaneous radii and tangentialvelocities of the turning chair for each of the 11 turns of the Illinois test. To evaluate an athlete’s performance, hypothesesbased on optimisation strategy of performance for the test’s turning circuit were considered as follows: (1) athletes produce alonger rc in turns 3, 4, 5, 7, 8 and 9; (2) athletes produce a shorter rc (turning radius) in turns 2, 6 and 10; and (3) athletesproduce a longer rc in turns 1 and 11.
According to the performance parameters mentioned above, four performance quadrants could be identified for differentturn radii and velocities. The performance assessment of athletes presented here showed no significant difference in turningradius between expected longer and shorter radius turns in individual athletes. It was concluded that using turning radius as aperformance parameter is not appropriate. Velocity in the expected shorter radii proved to be generally larger than the one inthe expected longer radii with significant difference in four of the nine athletes. Significant difference was found between radiiof group A (low pointer athletes) and group B (mid pointer athletes), and larger radii were observed in group A (low pointerathletes). The differences in velocities between groups A and C, and between B and C were significant (P # 0.001 each). Themethod developed and proposed proved to be valid for assisting performance assessment of wheelchair sports athletes usingthe Illinois agility test for training purposes. The study concludes that, in addition to test times, the use of instrumentedchairs, a higher sample size and the application of the method presented are recommended for Illinois agility test assessment.
Keywords: Illinois agility test, wheelchair athletes’ performance, wheelchair rugby sport, tangential velocity, turning radius
Introduction
First introduced in 1977 in Canada, and granted full
medal status at the 2000 Summer Paralympic Games
in Sydney, wheelchair rugby is a growing competitive
sport with more than 32 countries actively participat-
ing, of which 23 compete at a professional level
(International Wheelchair Rugby Federation, 2009).
The main objective of the game is to carry a ball
(typically a volleyball) across the opposing team’s
goal line. Wheelchair rugby dynamics can be defined
as starting, sprinting, braking, turning (pivoting) and
blocking, which are the skills that are inherently
related to handling the wheelchair (International
WheelchairRugby FederationTechnical Commission,
2008a; Usma-Alvarez, Subic, Burton, & Fuss, 2010;
Vanlandewijck, Daly, & Theisen, 2001).
Current rugby wheelchairs are specifically
designed to meet the individual anthropometric
needs of each athlete due to high level of correlation
ISSN 1934-6182 print/ISSN 1934-6190 online q 2010 Taylor & Francis
DOI: 10.1080/19346182.2011.564284
Correspondence: C.C. Usma-Alvarez, School of Aerospace, Mechanical and Manufacturing, Engineering, RMIT University, PO Box 71, Bundoora,
Melbourne, VIC 3083, Australia. E-mail: [email protected]
Sports Technology, August 2010; 3(3): 204–214
Dow
nloa
ded
by [
RM
IT U
nive
rsity
], [
Mis
s C
lara
Usm
a] a
t 21:
50 0
3 Ju
ly 2
011
between athlete’s performance and wheelchair
design. A specific setting in terms of seat height has
significant effects on a wide range of variables,
including mechanical efficiency and hand range of
motion due to change in hand rim reach (Woude,
Veeger, Rozendal, & Sargeant, 1989). These vari-
ables can have a substantial effect upon an athlete’s
ability to achieve specific speeds or manoeuvrability
capacity levels.
In general, the Illinois agility test is a timed task
involving straight sprinting and multidirectional
movement around stationary obstacles and it is
performed across a wide range of team sports
(Sheppard & Young, 2006). Studies to date involving
able-bodied sports indicate that agility performance
does not appear to be strongly linked with straight-
speed segment components (Buttifant, Graham, &
Cross, 1999; Young, Hawken, & McDonald, 1996).
These studies concluded that training for change of
direction, speed and agility must involve highly
specific training that recognises the individual
demands of the sport (Sheppard & Young, 2006).
In the setting of wheelchair rugby, the Illinois
agility test is highly regarded for training purposes.
However, to our knowledge, investigations of
performance criteria relating to the Illinois agility
test for wheelchair sports are not available, in spite of
the Illinois agility test’s use and regarded importance
for athletes and coaches in the field.
Qualitative studies to date have shown that
tangential velocities and turning radii during the
Illinois agility test are variables of high importance
for wheelchair rugby athletes and coaches (Usma-
Alvarez et al., 2010). However necessary, time
measurement alone does not appear to be sufficient
for a comprehensive performance assessment of a test
that involves a high proportion of multidirectional
movement.
In addition, the general setting of an Illinois agility
test favours controlled acceleration rather than
top speed as it involves extensive acceleration activity
with multidirectional body changes (Sheppard &
Young, 2006). Hence, if an athlete’s skill was to be
assessed from the results of the Illinois agility tests, it
would be beneficial to consider instantaneous radius
and tangential velocity of the turning wheelchair-
athlete system, as these variables impact the test’s
elapsed time.
The study presented in this article deals with the
use of accelerometer data in wheelchair sports
performance to develop and validate a method by
which to evaluate the tangential velocity and turning
radius achieved during the Illinois agility test. It also
presents an example of how the method can be used
to evaluate the performance of different athletes
through the use of performance hypotheses.
The main objectives of the study involve: (1)
recording athletes’ linear and angular accelerations
during the Illinois test; (2) developing and validating
a method that calculates the tangential velocity and
radius of curvature of a turning wheelchair; and (3)
analysing the athlete’s performance with the aid of
the method developed and the use of performance
hypotheses.
The following sections of this article will give a
detailed explanation of the experimental method
developed for determining the instantaneous radius
and tangential velocity of the turning wheelchair. In
addition, data obtained from wheelchair rugby
Paralympic athletes will be presented and analysed
against set performance criteria. To evaluate athletes’
performance, hypotheses for the performance par-
ameters of turning radius and velocity were
considered in order to favour elapsed time on each
turning segment of the test circuit. Results of each
individual athlete’s performance as well as
group categories will be discussed.
Experimental investigation
Test participants
A group of athletes from the Australian wheelchair
rugby Paralympic team volunteered to participate in
this study. The group was comprised of nine male
participants aged between 22 and 42 years-old, each
of whom had a significant amount of experience in
participating in wheelchair rugby at an elite level.
Table I presents test participant’s characteristics,
including disability level, sport classification as well
as their typical weekly training hours.
The performance data obtained from the nine
athletes (27 experiments) was used to develop and
validate the method to obtain the tangential velocity
and radius of curvature previously outlined in the
study’s objectives.
Per regulation, wheelchair rugby athletes are
placed within one of seven sport classifications,
which range from 0.5 to 3.5 points. The higher
number is intended for those athletes who have
higher physical function on court (International
WheelchairRugby FederationTechnical Commission,
2008b). Due to differences in athletes’ performance
levels and for the purpose of demonstrating a possible
performance analysis tool with the aid of the method
developed, the athletes and experimental results were
further categorised in line with their sports classifi-
cation into three groups (these are also outlined in
Table I): group A–low pointers: Athletes with sports
class categories ranging from 0.5–1.5; group B–mid
pointers: Athletes with sports class categories ranging
from 1.5–2.5; and group C–high pointers: Athletes
with sports class categories ranging from 2.5–3.5.
Performance analysis of the Illinois agility test in wheelchair rugby 205
Dow
nloa
ded
by [
RM
IT U
nive
rsity
], [
Mis
s C
lara
Usm
a] a
t 21:
50 0
3 Ju
ly 2
011

These groupings have been developed based on the
approach that was adopted by Mason, van der
Woude, and Goosey-Tolfrey (2006), and with the
aim of presenting the analysis of the performance
data obtained, highlighting effects of sports classifi-
cations and demonstrating analysis of significance
between participants as a performance analysis
example using the method developed in this research.
The categorisation of athletes ensures that the
results are matched against athletes of similar
characteristics (upper body range of mobility).
Current performance values for the main categories
of wheelchair rugby athletes will be reported as an
example of method’s scope.
The athletes were fully informed of the research
procedures and potential risks and written consent
was obtained from all research participants. Ethics
approval was obtained from the RMIT University
Human Research Ethics Committee prior to the
experimental study.
Instrumentation
Because of the strong correlation between wheelchair
configuration and performance, all athletes com-
pleted testing using their own custom built match
chairs. The study of experienced athletes’ perform-
ances using their own customised equipment is
appropriate and highly regarded, as the athlete’s
wheelchair is considered an extension of the athlete’s
body for game rules compliance (International
WheelchairRugby FederationTechnical Commission,
2008a).Hence, all conclusions on performance for the
purpose of this study will be based on wheelchair þ
athlete system. All test wheelchairs were specifically
designed to meet each athlete’s individual anthropo-
metric needs and the mechanical characteristics of
all chairs complied with section four of the
International Wheelchair Rugby Federation IWRF
rules (International Wheelchair Rugby Federation
Technical Commission, 2008a).
The wheelchairs were instrumented with a 6 DOF
(degrees of freedom) sensor (accelerometer þ
gyrometer) at 100Hz sample rate (minimaxX,
Catapult Innovations Pty Ltd, Scoresby, Australia)
which measured the linear accelerations and angular
velocities along/about the three axes of an orthogonal
coordinate system. The three acceleration readings of
the sensor were calibrated using a drop test, based on
gravitational acceleration (9.81m/s2) at small vel-
ocities. The three angular velocities were calibrated
with a turntable at known rpm values.
Each wheelchair was instrumented by securely
placing the sensor in the upright position (x-axis
directed to the left side of the chair’s forward position)
on the pick bar of the chair. The sensor’s positive y-axis
was positioned on the chair’s sagittal plane in line with
Table
I.Participants’data,wheelchairmass
and
dvalue.
Group
Participant
Disabilitylevel
andclassification
Age(year)
Mass
(kg)
Size(m
)Traininghours/w
eek
Elite
experience
(years)
Chairmass
(kg)
dvalue(m
)
A(low
pointer)
A1
C5–1.5
32
71.28
1.82
16
117.77
0.69
A2
C6–0.5
39
73.77
1.83
16
12
17.15
0.56
A3
C6–1.5
36
64.00
1.88
15
316.27
0.59
B(m
idpointer)
B1
C6/7–2.0
24
87
1.87
10
217
0.54
B2
C7–2.0
34
71
1.87
15–20
10
17
0.57
B3
C6/7–2.0
22
84
1.97
20
418
0.55
C(highpointer)
C1
Spinalneu
rologicaldisorder–3.0
42
94.15
1.70
10
15
18.79
0.55
C2
C6/7
Inc–3.0
23
70.09
1.85
18–20
218.94
0.53
C3
C7Inc–2.5
40
95.00
1.90
10
16
17.23
0.57
C. C. Usma-Alvarez et al.206
Dow
nloa
ded
by [
RM
IT U
nive
rsity
], [
Mis
s C
lara
Usm
a] a
t 21:
50 0
3 Ju
ly 2
011

the chair’s forward position. The distance between the
sensor’s centre and themidpoint of the line connecting
the hubs of the wheels (referred as d in Figure 2 and
Table I) was recorded for each athlete.
Testing protocol – Illinois agility test. The experimental
tests were carried out during a single day session at an
indoor basketball court in exactly the same
conditions as a regular Illinois agility test setting to
ensure that the athletes familiarised quickly with the
task. In this specific setting of the Illinois agility test
the athletes were required to sprint across a
predetermined path where 11 turns around
different gates took place (as shown in Figure 1).
The length of the course was 10m and the width or
distance between the start and finish points was 5m.
Four cones were used to mark the start, finish and the
two turning points. Another five cones were placed at
the centre of the course and spaced 1.5m apart,
starting 2m from the finish line as shown in Figure 1.
Testing was performed by lining up the athlete on
the starting line. Once an athlete was ready to start,
the sensor was switched on and the athlete was
requested to remain still for 5 s in order to normalise
acceleration data (reading of zero acceleration). On
Figure 1. Illinois agility test setting provided by the athletes’ coach.
Figure 2. Top view of a rugby wheelchair: d ¼ distance between centre of accelerometer and midpoint of the line connecting the hubs of the
wheels (C), IC ¼ instant centre of the turning wheelchair, rc ¼ turning radius of the wheelchair (from IC to C), ra ¼ distance between IC
and centre of accelerometer, u ¼ angle between ra and rc, ax and ay ¼ components of the instantaneous resultant of the horizontal
acceleration, a r and a t ¼ radial and tangential acceleration.
Performance analysis of the Illinois agility test in wheelchair rugby 207
Dow
nloa
ded
by [
RM
IT U
nive
rsity
], [
Mis
s C
lara
Usm
a] a
t 21:
50 0
3 Ju
ly 2
011
the “go” command a stopwatch was initiated and the
athlete pushed around the course in the direction
indicated without knocking the cones over (Figure 1).
Athletes were requested to perform the drill in same
conditions as a regular training session. The overall
trial time was recorded once the athlete reached the
finish line and accelerometer data were recorded for
further 5 s with the chair completely stopped. Three
different data sets were taken for each athlete with
2min rest in between sets. The measurement
protocol was the same for all participants and
reference video footage was recorded for each trial.
Data processing
To synchronise stopwatch and accelerometer data,
the slight offset of the data at zero acceleration (due
to normalising activity prior to test) was corrected
such that ay (forward/backward acceleration) over-
lapped the zero acceleration line before evident
acceleration activity (start of stopwatch) was
initiated. Video data was also taken on same “go”
command as the stopwatch and was used as reference
to further analyse acceleration data. This visual data
helped in the identification of sections and turns of
the Illinois agility test setting in the acceleration
dataset as peaks in the angular acceleration curve.
Original and filtered data were analysed and
percentages of real numbers retrieved were com-
pared. Highest percentages of real numbers were
achieved by using original (not filtered) data.
Therefore filtering was avoided for obtaining
experimental results. Further data processing
included conversion of angular velocity data about
vertical axis from deg/s to rad/s.
The three trials for each athlete were averaged and
results analysed according to the method developed
for determining the instantaneous radius and
tangential velocity as explained in the following
section.
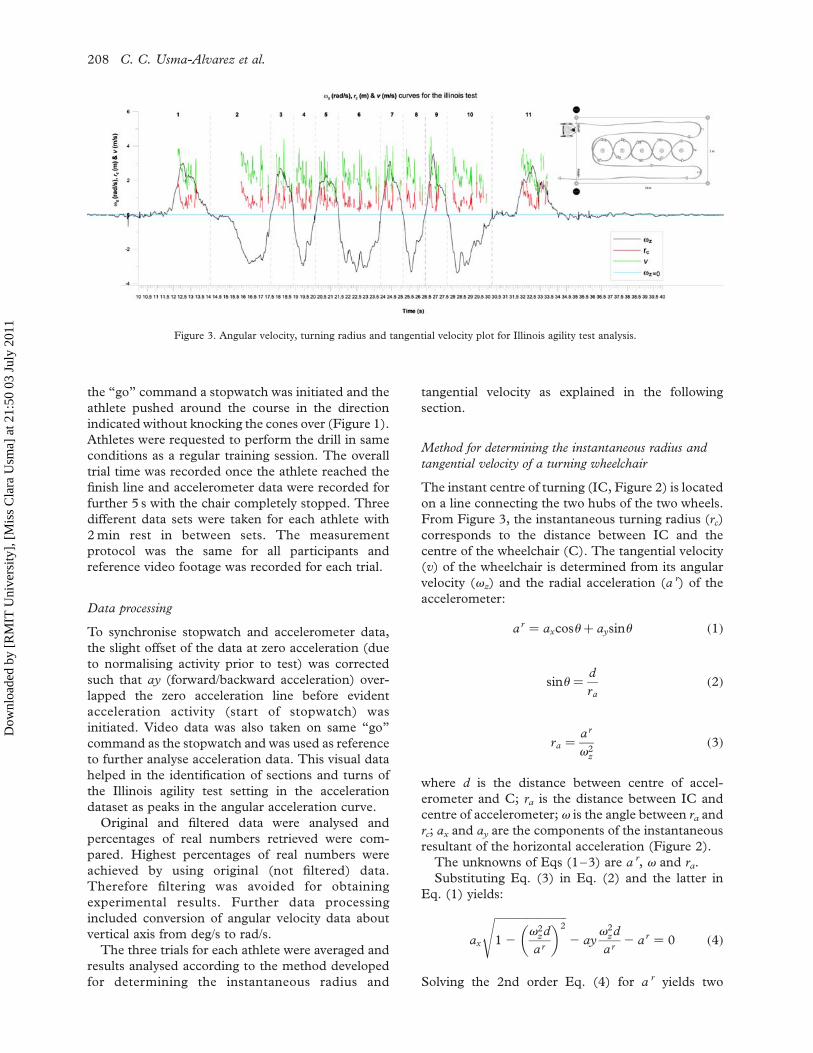
Method for determining the instantaneous radius and
tangential velocity of a turning wheelchair
The instant centre of turning (IC, Figure 2) is located
on a line connecting the two hubs of the two wheels.
From Figure 3, the instantaneous turning radius (rc)
corresponds to the distance between IC and the
centre of the wheelchair (C). The tangential velocity
(v) of the wheelchair is determined from its angular
velocity (vz) and the radial acceleration (a r) of the
accelerometer:
ar ¼ axcosuþ aysinu ð1Þ
sinu ¼d
ra
ð2Þ
ra ¼ar
v2z
ð3Þ
where d is the distance between centre of accel-
erometer and C; ra is the distance between IC and
centre of accelerometer; v is the angle between ra and
rc; ax and ay are the components of the instantaneous
resultant of the horizontal acceleration (Figure 2).
The unknowns of Eqs (1–3) are a r, v and ra.
Substituting Eq. (3) in Eq. (2) and the latter in
Eq. (1) yields:
ax
ffiffiffiffiffiffiffiffiffiffiffiffiffiffiffiffiffiffiffiffiffiffiffiffiffiffi12
v2zd
ar
� �2s
2 ayv2
zd
ar2 ar ¼ 0 ð4Þ
Solving the 2nd order Eq. (4) for a r yields two
Figure 3. Angular velocity, turning radius and tangential velocity plot for Illinois agility test analysis.
C. C. Usma-Alvarez et al.208
Dow
nloa
ded
by [
RM
IT U
nive
rsity
], [
Mis
s C
lara
Usm
a] a
t 21:
50 0
3 Ju
ly 2
011
solutions:
ar1 ¼
ffiffiffiffiffiffiffiffiffiffiffiffiffiB þ C
2
rð5aÞ
and
ar2 ¼
ffiffiffiffiffiffiffiffiffiffiffiffiffiffiB 2 C
2
rð5bÞ
where:
B ¼ a2x 2 2d ayv
2z ð6Þ
and:
C ¼
ffiffiffiffiffiffiffiffiffiffiffiffiffiffiffiffiffiffiffiffiffiffiffiffiffiffiffiffiffiffiffiffiffiffiffiffiffiffiffiffiffiffiffiffiffiffiB2 2 4d 2v4
z a2x þ a2
y
� �rð7Þ
Eq. (5b) delivers a r , dwhich implies thatv in Eq. (2)
is no longer real. C in Eq. (7) can, in rare cases, be
imaginary, if 4d 2v4z a2
x þ a2y
� �. B2. The angle v is
calculated from Eq. (2), and rc and v from
rc ¼d
tan uð8Þ
v ¼ vzrc
j j ð9Þ
When moving along a straight path, v z ¼ 0 and rc¼ 1. In order to obtain the data v z, rc, v at the turns
only, all data with rc . 2m were removed (Figure 3).
Subsequently, the average rc and v were calculated for
each turn.
Validation
In order to achieve the second objective of this study
and prove the validity of the developed method, it was
necessary tohave a known radius andvelocity value as a
target for expected performance in order to eliminate
ambiguity of an unknown target value (i.e. skill based
validation). A rugby wheelchair, instrumented as
shown in Figure 2 was moved twice around the
circumference of a circle (7208), and the time taken to
do this was recorded with a stopwatch. Thewheelchair
was moved at different velocities around circles of
diameters of 2.16m, 1.36m and 0.72m, resulting in
average linear speeds of 0.5–2m/s. Additionally, the
accelerometer was placed on the turntable of a
polishing machine that was rotated at 50, 55, 60, 65
and 70 rpm with the accelerometer unit of the sensor
placed at a distance of 100mm from the rotation
centre. From the data that was recorded, rc was
calculated and compared to the original radius. The
radius calculated was on average 1.015 times larger
than the original one, resulting in an error of 1.5%.
The coefficient of determination (r2) of the linear
regression through origin was 0.9958.
Data analysis
A typical angular velocity plot of the Illinois agility
test drill is shown in Figure 3. From this figure, the
number of turns performed during the test and their
direction can be identified as the plot peaks (black
curve). The turning radius (rc) of the wheelchair (red
curve) as well as the linear velocity (v) (green curve)
achieved on each turn are also presented in this
graph. As mentioned above, when v z ¼ 0, rc ¼ 1.
Therefore, rc data larger than 2m were removed in
order to confine the data to turning radii of # 2m.
From Figure 3 is also noticeable that, as expected,
the velocity data seem to be larger when vz
approached zero. As point of reference zero vz is
indicated in blue in Figure 3. Calculation of the mean
of v and rc of each peak provided results for analysis of
each turn of the Illinois agility test for each of the
participants.
Average time for each participant [A (1–3),
B (1–3), C (1–3)] as well as category average are
presented in Table II. Descriptive statistics were used
to analyse each participant’s data as well as category
subgroups (A, B, C) effects. Statistical significance
was denoted by P , 0.05.
Demonstration of performance analysis using the method
developed
In order to analyse the performance of test
participants, a predefined set of performance
parameters were required. In order to favour elapsed
time and to relate the analysis of the test to
wheelchair rugby game dynamics, the Illinois agility
test results for all nine athletes were analysed as to the
following optimisation of performance:
(1) Velocity v: the larger v the better; large v results
in fast movements during turn.
(2) Turns 3, 4, 5, 7, 8 and 9: the longer rc the better;
longer rc enables direct path, closer to obstacles
gates or cones.
(3) Turns 2, 6 and 10: the shorter rc the better; short
rc reduces the gap between wheelchair and
obstacles, gates or cones.
Table II. Test time average in seconds for each athlete and
classification group (e.g. Athlete A1 ¼ 28.72 s, classification group
A ¼ 30.42 s).
1 2 3 Classification average
A 28.72 31.95 30.59 30.42
B 29.58 27.25 27.39 28.07
C 29.40 28.06 29.04 28.83
Performance analysis of the Illinois agility test in wheelchair rugby 209
Dow
nloa
ded
by [
RM
IT U
nive
rsity
], [
Mis
s C
lara
Usm
a] a
t 21:
50 0
3 Ju
ly 2
011

(4) Turns 1 and 11: no clear trend: longer rc allows
the velocity to be maintained, whereas shorter rc
results in less time spent performing the turn at a
smaller velocity. The decision between these two
options is guided by energy principles: it is
preferable to maintain the kinetic energy rather
than decelerating before and accelerating after
the turn.
The hypotheses based on optimisation strategy of
performance, which were tested in this study, were as
follows:
(1) athletes produce a longer rc in turns 3, 4, 5, 7, 8
and 9;
(2) athletes produce a shorter rc in turns 2, 6 and 10;
and
(3) athletes produce a longer rc in turns 1 and 11.
According these hypotheses, and following the test
circuit shown in Figure 4a (turn identification
number in the test circuit), four performance
quadrants can be identified for different turn radii
and velocities as shown in Figure 4b.
Is important to note that a hypothesis of expected
performance is necessary prior to analysis of results
and is subjected to athlete or coach demands for
performance targets. For instance, a desired per-
formance can be targeted to suit a specific game
strategy or to train specific athlete’s skills. This
hypothesis is to be confirmed or rejected with
application of the method proposed. Assessment
(acceptance or rejection) and discussion of hypoth-
eses for the complete research sample will be
presented on the following sections.
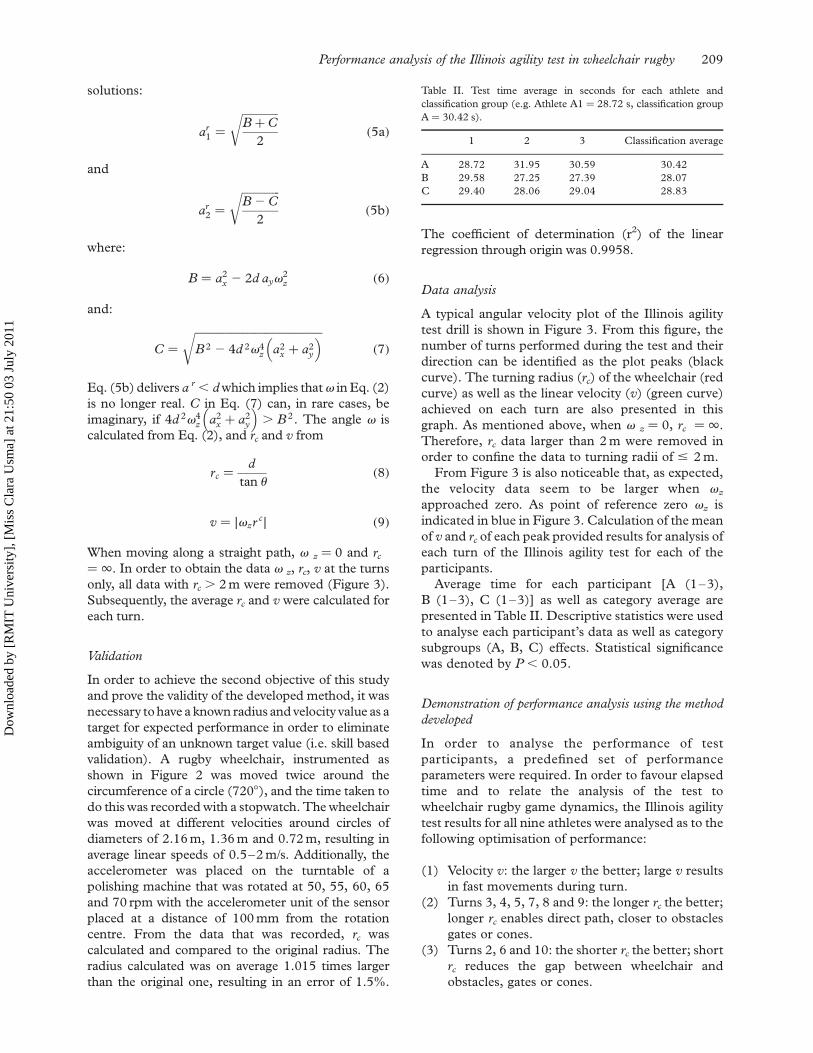
Figure 5 presents data for participant B3 as an
example of the results analysed for each of the
athlete’s data. The turning radius rc and tangential
velocity v is plotted against the turn number for three
runs performed by each of the athletes. In addition,
averaged trials for each athlete were used to assess
change of direction performance for each athlete
according to values of tangential velocity and
instantaneous radius for each turn. This information
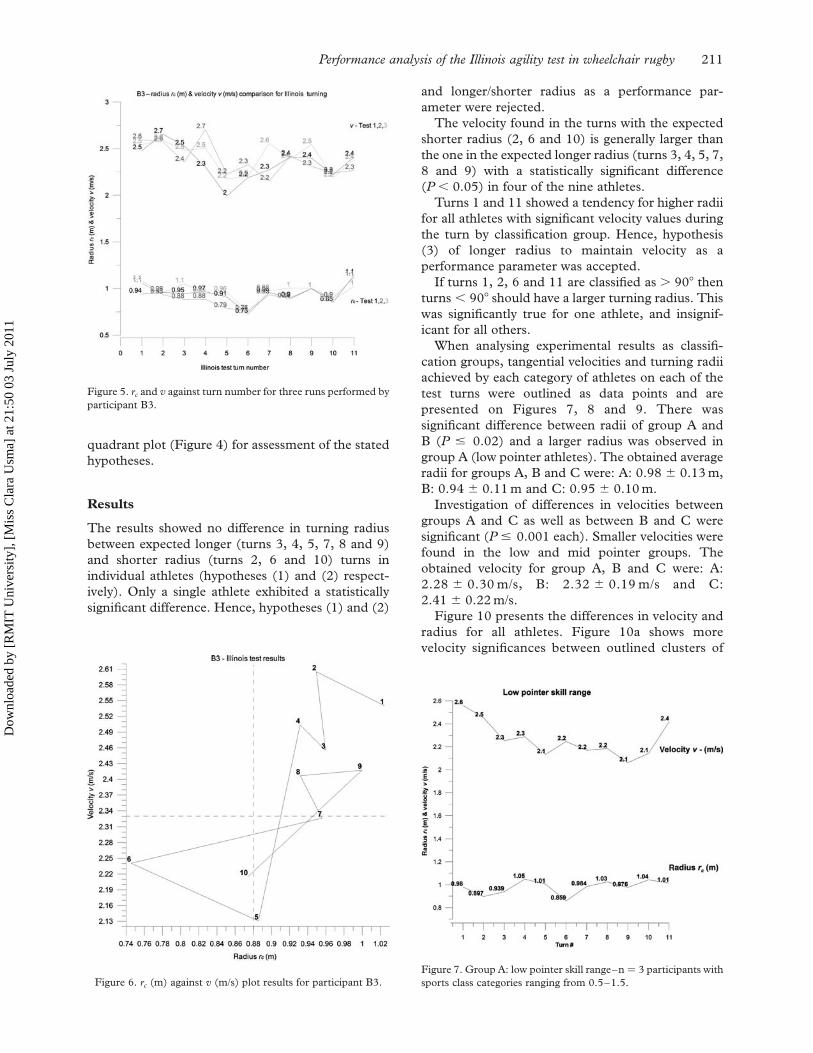
is presented for participant B3 in Figure 6, where the
tangential velocity v (m/s) ( y axis) against the
instantaneous radius rc (m) (x axis) are plotted for
each of the Illinois turns (numbered in Figures 1 and
3) to show the location of the turn numbers on the
Figure 4a. Turn identification number in test turning circuit.
Figure 4b. Performance quadrants for radii and tangential velocity
performance by turn number identified in Figure 4a.
C. C. Usma-Alvarez et al.210
Dow
nloa
ded
by [
RM
IT U
nive
rsity
], [
Mis
s C
lara
Usm
a] a
t 21:
50 0
3 Ju
ly 2
011
quadrant plot (Figure 4) for assessment of the stated
hypotheses.
Results
The results showed no difference in turning radius
between expected longer (turns 3, 4, 5, 7, 8 and 9)
and shorter radius (turns 2, 6 and 10) turns in
individual athletes (hypotheses (1) and (2) respect-
ively). Only a single athlete exhibited a statistically
significant difference. Hence, hypotheses (1) and (2)
and longer/shorter radius as a performance par-
ameter were rejected.
The velocity found in the turns with the expected
shorter radius (2, 6 and 10) is generally larger than
the one in the expected longer radius (turns 3, 4, 5, 7,
8 and 9) with a statistically significant difference
(P , 0.05) in four of the nine athletes.
Turns 1 and 11 showed a tendency for higher radii
for all athletes with significant velocity values during
the turn by classification group. Hence, hypothesis
(3) of longer radius to maintain velocity as a
performance parameter was accepted.
If turns 1, 2, 6 and 11 are classified as . 908 then
turns , 908 should have a larger turning radius. This
was significantly true for one athlete, and insignif-
icant for all others.
When analysing experimental results as classifi-
cation groups, tangential velocities and turning radii
achieved by each category of athletes on each of the
test turns were outlined as data points and are
presented on Figures 7, 8 and 9. There was
significant difference between radii of group A and
B (P # 0.02) and a larger radius was observed in
group A (low pointer athletes). The obtained average
radii for groups A, B and C were: A: 0.98 ^ 0.13m,
B: 0.94 ^ 0.11m and C: 0.95 ^ 0.10m.
Investigation of differences in velocities between
groups A and C as well as between B and C were
significant (P # 0.001 each). Smaller velocities were
found in the low and mid pointer groups. The
obtained velocity for group A, B and C were: A:
2.28 ^ 0.30m/s, B: 2.32 ^ 0.19m/s and C:
2.41 ^ 0.22m/s.
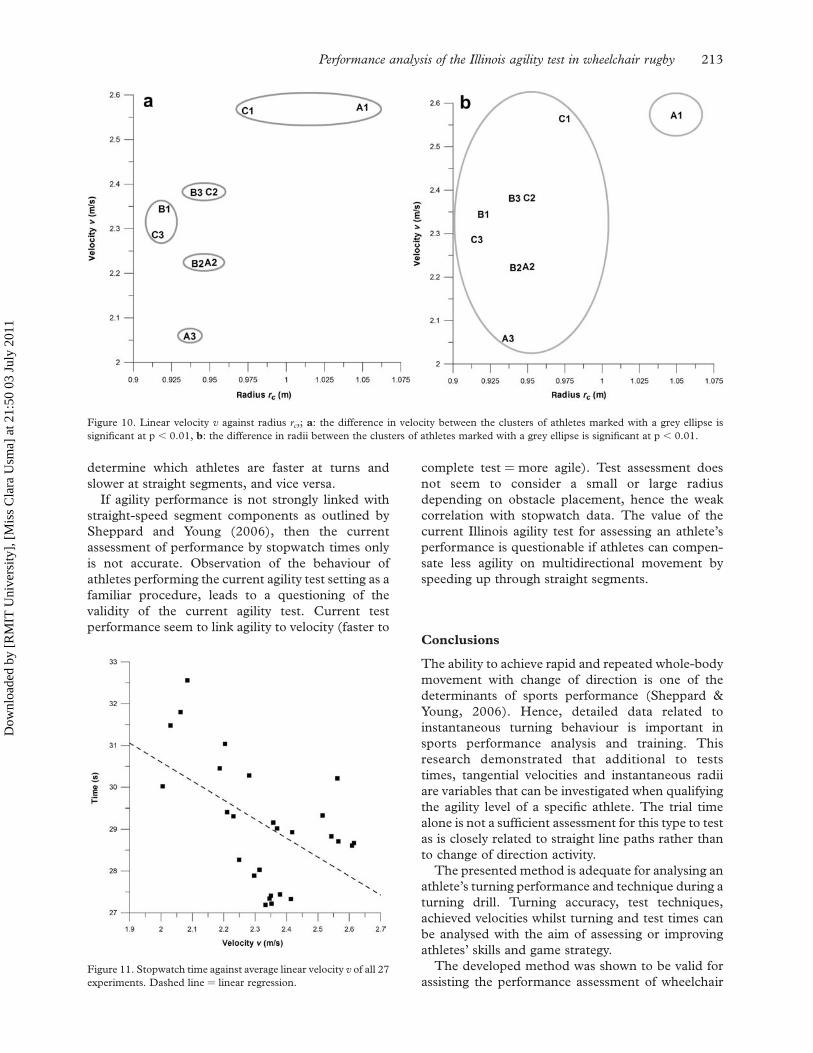
Figure 10 presents the differences in velocity and
radius for all athletes. Figure 10a shows more
velocity significances between outlined clusters of
Figure 5. rc and v against turn number for three runs performed by
participant B3.
Figure 6. rc (m) against v (m/s) plot results for participant B3.
Figure 7. Group A: low pointer skill range–n ¼ 3 participants with
sports class categories ranging from 0.5–1.5.
Performance analysis of the Illinois agility test in wheelchair rugby 211
Dow
nloa
ded
by [
RM
IT U
nive
rsity
], [
Mis
s C
lara
Usm
a] a
t 21:
50 0
3 Ju
ly 2
011
athletes with a smaller standard deviation.
Figure 10b shows less significance in turning radius
between outlined clusters of athletes with a larger
standard deviation.
Stopwatch time (Table II) does not correlate
strongly with mean turning velocity. Still, the general
trend is: the shorter the stopwatch time, the faster the
linear velocity during turns. However, the coeffi-
cients of determination (r2) and correlation (r) are
0.276 and 0.526 respectively, indicating that only
27.6% of the stopwatch time is due to the linear
velocity during turns. Figure 11 presents the
stopwatch time against linear velocity v of all 27
experiments.
Discussion of results
The results of current study demonstrate that, in
addition to test times, tangential velocities and
instantaneous radii can also be studied to achieve a
better performance assessment of athletes during a
turning task test.
Hypotheses assessment for the available research
sample showed that only hypothesis (3) could be
accepted as performance parameter.
The assessment of the performance parameters
hypothesised, namely the turning radius and velocity,
showed that only the performance parameter of
velocity seems to be relevant for the assessment of the
available sample, since it was found to have more
significance than the parameter of turning radius.
Smaller velocities were found in both in the low
and mid pointer groups. This confirmed the
importance of faster velocity as a performance
parameter, as group C was known to be the higher
performance group. As evident from Figure 10,
velocity was a better performance parameter than
radius.
The significant difference between radii of groups
A and B (P ¼ 0.02) and the larger radius observed in
group A (low pointer athletes) is understandable as
category groups have a known variance in perform-
ance ability. In general, group A is expected to have
the most reduced limb ability out of the three groups.
In addition, the wheelchairs used by group A athletes
are usually longer and less manoeuvrable in terms of
turning activity than those used by athletes in the
other groups.
According to the hypotheses outlined, larger radii
in low pointers (group A) would be understandable if
the velocity was higher. However, it was evident that
radius was not an appropriate performance par-
ameter in this case.
In regards to test times; the fact that the stopwatch
time did not correlate strongly with the mean velocity
is understandable considering that the test time was
also dependent on the speed achieved in the straight
segments of the test (before and after turns 1 and 11)
whereas the velocity presented in the study was
determined only at the turns.
Low velocities were observed for participants B2
and C2 on turns other than 1, 2 and 11. Yet, these
participants recorded two of the fastest times
according to the stopwatch data. Further examin-
ation of visual data for the two participants displayed
a more controlled turning technique during the
continuing turning section of the test. Their
technique correlates with their rc curves, as high
accuracy on turning keeps smaller radii and thus,
generally constant angular velocity was observed.
Consequently, the overall test time helps to
Figure 8. Group B: mid pointer skill range–n ¼ 3 participants with
sports class categories ranging between 1.5–2.5.
Figure 9. Group C: high pointer skill range–n ¼ 3 participants
with sports class categories ranging between 2.5–3.5.
C. C. Usma-Alvarez et al.212
Dow
nloa
ded
by [
RM
IT U
nive
rsity
], [
Mis
s C
lara
Usm
a] a
t 21:
50 0
3 Ju
ly 2
011
determine which athletes are faster at turns and
slower at straight segments, and vice versa.
If agility performance is not strongly linked with
straight-speed segment components as outlined by
Sheppard and Young (2006), then the current
assessment of performance by stopwatch times only
is not accurate. Observation of the behaviour of
athletes performing the current agility test setting as a
familiar procedure, leads to a questioning of the
validity of the current agility test. Current test
performance seem to link agility to velocity (faster to
complete test ¼ more agile). Test assessment does
not seem to consider a small or large radius
depending on obstacle placement, hence the weak
correlation with stopwatch data. The value of the
current Illinois agility test for assessing an athlete’s
performance is questionable if athletes can compen-
sate less agility on multidirectional movement by
speeding up through straight segments.
Conclusions
The ability to achieve rapid and repeated whole-body
movement with change of direction is one of the
determinants of sports performance (Sheppard &
Young, 2006). Hence, detailed data related to
instantaneous turning behaviour is important in
sports performance analysis and training. This
research demonstrated that additional to tests
times, tangential velocities and instantaneous radii
are variables that can be investigated when qualifying
the agility level of a specific athlete. The trial time
alone is not a sufficient assessment for this type to test
as is closely related to straight line paths rather than
to change of direction activity.
The presented method is adequate for analysing an
athlete’s turning performance and technique during a
turning drill. Turning accuracy, test techniques,
achieved velocities whilst turning and test times can
be analysed with the aim of assessing or improving
athletes’ skills and game strategy.
The developed method was shown to be valid for
assisting the performance assessment of wheelchair
Figure 10. Linear velocity v against radius rc,; a: the difference in velocity between the clusters of athletes marked with a grey ellipse is
significant at p , 0.01, b: the difference in radii between the clusters of athletes marked with a grey ellipse is significant at p , 0.01.
Figure 11. Stopwatch time against average linear velocity v of all 27
experiments. Dashed line ¼ linear regression.
Performance analysis of the Illinois agility test in wheelchair rugby 213
Dow
nloa
ded
by [
RM
IT U
nive
rsity
], [
Mis
s C
lara
Usm
a] a
t 21:
50 0
3 Ju
ly 2
011
sports athletes using the Illinois agility test for
training purposes.
The evaluation presented in this paper has been
performed and presented from a sports engineering
perspective based on the investigation of change of
direction speed and radius of turning of the wheel-
chair. In the context of sports science, Sheppard and
Young (2006) have offered the most recent definition
of the term “agility”: “a rapid whole-body movement
with change of velocity or direction in response to a
stimulus”. This study does not include factors such
as an athlete’s reaction component or decision
making. Hence, the researchers aim is not to assess
the athlete’s agility but to provide a method that
could serve as a performance assessment tool.
Desired performance parameters should be analysed
and set according to match strategy and an athlete’s
performance target for confirmation of the
hypothesis.
Averaged trials were used to analyse the athlete’s
performance as mode of demonstration with avail-
able data samples. When assessing an athlete’s
performance using this or any other method, a
greater data sample of trials per athlete is
recommended to improve the accuracy of an athlete’s
performance results, as well as to analyse the
consistency of a participant’s performance.
We suggest improving the performance assessment
of the Illinois agility test by using instrumented
wheelchairs and applying the method described in
this paper. Although, only the linear (tangential)
velocity seems to be a performance parameter, and
turning radius was not found to be an accurate
measure of performance in the sample analysed,
applicability of the turning radius could be a potential
performance parameter if a fixed path as mobility
target was enforced in the protocol and valid for
training purposes.
References
Buttifant, D., Graham, K., & Cross, K. (1999). Agility and speed
measurement in soccer players are two different performance
parameters. In Fourth world congress of science and football.
Sydney: University of Technology, February 22–26.
International Wheelchair Rugby Federation Technical Commission
(2008a). International Wheelchair Rugby Federation rules 2008.
Retrieved October 27, 2008, from http://www.iwrf.com/rules.
htm
International Wheelchair Rugby Federation Technical Commission
(2008b). IWRF classification manual (3rd ed.). RetrievedApril 30,
2009, from http://www.iwrf.com/classification.htm
International Wheelchair Rugby Federation (2009). International
Wheelchair Rugby Federation homepage. Retrieved May 12, 2009,
from http://www.iwrf.com
Mason, B. S., van der Woude, L. H. V., & Goosey-Tolfrey, V. L.
(2009). Influence of glove type on mobility performance for
wheelchair rugby players.American Journal of Physical Medicine &
Rehabilitation, 88 (7), 559–570.
Sheppard, J. M., & Young, W. B. (2006). Agility literature review:
Classifications, training and testing. Journal of Sports Sciences,
24(9), 919–932.
Usma-Alvarez, C. C., Subic, A., Burton,M., & Fuss, F. K. (2010).
Identification of design requirements for rugby wheelchairs using the
QFD method. Procedia Engineering, 2 (2), 2749–2755.
Vanlandewijck, Y., Daly, D. J., & Theisen, D. M. (2001).
Wheelchair propulsion biomechanics: Implications for wheel-
chair sports. Sports Medicine, 31(5), 339–367.
Woude, L. V. d., Veeger, D., Rozendal, R., & Sargeant, T. (1989).
Seat height in handrim wheelchair propulsion. Journal of
Rehabilitation Research and Development, 26, 31–50.
Young, W. B., Hawken, M., & McDonald, L. (1996).
Relationship between speed, agility, and strength qualities in
Australian Rules football. Strength and Conditioning Coach, 4(4),
3–6.
C. C. Usma-Alvarez et al.214
Dow
nloa
ded
by [
RM
IT U
nive
rsity
], [
Mis
s C
lara
Usm
a] a
t 21:
50 0
3 Ju
ly 2
011