Adoption of quality assurance systems in dairy processing ...
264
Lincoln University Digital Thesis Copyright Statement The digital copy of this thesis is protected by the Copyright Act 1994 (New Zealand). This thesis may be consulted by you, provided you comply with the provisions of the Act and the following conditions of use: you will use the copy only for the purposes of research or private study you will recognise the author's right to be identified as the author of the thesis and due acknowledgement will be made to the author where appropriate you will obtain the author's permission before publishing any material from the thesis.
-
Upload
khangminh22 -
Category
Documents
-
view
3 -
download
0
Transcript of Adoption of quality assurance systems in dairy processing ...
Lincoln University Digital Thesis
Copyright Statement
The digital copy of this thesis is protected by the Copyright Act 1994 (New Zealand).
This thesis may be consulted by you, provided you comply with the provisions of the Act and the following conditions of use:
you will use the copy only for the purposes of research or private study you will recognise the author's right to be identified as the author of the thesis and
due acknowledgement will be made to the author where appropriate you will obtain the author's permission before publishing any material from the
thesis.
Adoption of Quality Assurance Systems in Dairy
Processing Firms in Vietnam
-----------------------------------------
A thesis
submitted in partial fulfilment
of the requirements for the Degree of
Doctor of Philosophy in Agricultural Management
at
Lincoln University
by
Nguyen Chi Trung
-----------------------------------------
Lincoln University
2013
ii
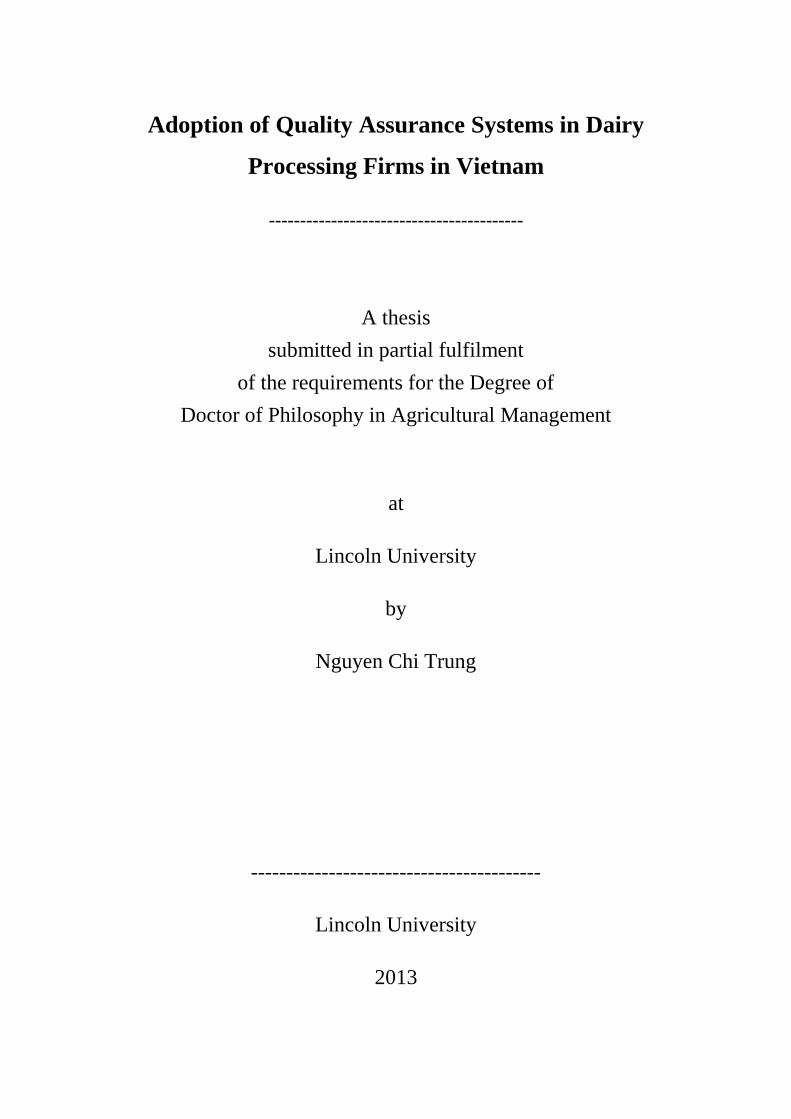
Abstract of a thesis submitted in partial fulfillment of the requirements for the
Degree of Doctor of Philosophy in Agricultural Management
Abstract
Adoption of Quality Assurance Systems in Dairy Processing Firms in
Vietnam
By
Nguyen Chi Trung
Internationally, concerns over food safety and quality have been increasing as a result of a
number of food safety scares. Governments worldwide have responded to these concerns
through encouraging or mandating firms in the food industry to use quality assurance systems
(QAS‟s), such as HACCP, ISO 9000 and ISO 22000. In emerging economies, such as
Vietnam, the importance of these systems is now being recognized. The dairy industry in
Vietnam is small, but dairy production is increasing dramatically in line with growing
consumption of dairy products. To address the increasing demand for milk quantity and
quality, QAS‟s are now being adopted by dairy processing firms.
The purpose of this research was to gain an understanding of quality processes and adoption
of QAS‟s in dairy processing firms in Vietnam in the context of their wider supply chains.
Five dairy processors and their associated supply chains were selected along with three
QAS‟s (HACCP, ISO 9000 and ISO 22000). A case study method was employed to explore
and gain a greater understanding of quality at the processor and chain level and the adoption
of QAS‟s at the processor level. This was done by constructing and utilizing a model that
linked processors‟ motivations to adopt, factors that influenced adoption, and perceived
outcomes from adoption, within the context of their wider supply chain environment.
It was observed that quality management was fragmented along supply chains, with different
QAS‟s in place at different stages of the chain to different degrees. Quality assurance was
iii
observed to be weakest at the collector level, and the distributor and retail level. Also, it was
seen that larger farmers had quality management than small farmers. Quality assurance was
likely to be better throughout the chain when the processor had integrated forward or
backwards. In addition, QAS‟s were met to minimum standards necessary for certification
and inspection for compliance could be infrequent.
It was found that legal factors were a strong influence on processing firms in adopting
QAS‟s. Market pressure was also a strong influence for larger firms. Related to this factor
was competition between dairy firms to position themselves in the growing market. External
support had an important impact on the decision of small firms to adopt, and firm size did not
emerge as a factor that had an impact on this decision. However, top management support
was found to be an important factor. These factors influencing adoption varied across QAS‟s,
but overall trends were observable.
The research showed that there were differences in perceived organisational outcomes from
the adoption of QAS‟s by processing firms. However, in general, the impact was perceived to
be positive. This was particularly so for business performance and this was observed for both
HACCP and ISO 9000, which have been operating in these companies for some time. This
indicates that firms place importance on market positioning and that QAS‟s are an important
device in this market positioning.
Insights that emerge from these results increases the understanding of quality processes and
the adoption of QAS‟s in food industries in emerging economies. Quality assurance in food
industries in such countries is at an early stage, with fragmentation of quality assurance along
the chain, but a willingness to adopt QAS‟s to position favourably in a growing market.
Processors could be well-positioned to take a lead role in improving quality, and along with
government agencies, which also have a key role, could work towards diffusing quality up
and down the chain.
Keywords: quality assurance systems, QAS‟s, adoption, agribusiness processors, dairy firms,
supply chains, Vietnam, emerging economies.
iv
ACKNOWLEDGEMENT
At the outset of this report of a research endeavour conducted as a partial fulfilment of a PhD
in Agricultural Management, first and foremost, I would like to thank my supervisor,
Associate Professor Dr Sandra Martin, for her help, guidance, and generous support
throughout the course of my PhD study.
Also, I would like to thank my associate supervisors, Dr Jeff Heyl and Dr Peter Nuthall. Dr
Heyl gave me rich knowledge of quality and operational management, and methodology
approaches, and Dr Nuthall, who gave me more understanding of farm management and
research techniques. My thanks also goes to Dr Michael Lyne. I would like to thank Dr Mark
Wilson for his invaluable advice for approaches and methods in research of quality
management system in the initial research stage.
Several organizations contributed financially to my research, and without them it would be
been virtually impossible to complete this thesis. I would especially like to express my
gratitude to Lincoln University for its financial support to enable me to do field work and
collect data and information for this thesis and to the graduate administrative staff in the
Faculty of Commerce for their administrative support and help.
Special thanks goes to organizations‟ experts, academicians, directors, and managers in
Vietnam, who gave me time, and necessary support in terms of administration, paperworks,
and provided secondary data. These include the National Institute of Agriculture Planning
and Projection (Dr Chinh, Dr Linh, Mr Hung, Ms Hoa), the National Productivity Center
Vietnam (Mr Anh), the Strategic Institute for Industry Development Policy (Dr Duc), the
Division of Food Safety and Hygiene, Department of Science and Technology of Ministry of
Industry and Commerce (Ms Nga), the Institute for Policy and Strategy for Agriculture and
Rural Development (Dr Phong), Department of Livestock Husbandry of Ministry of
Agriculture and Rural Development (Dr Son, Dr Giao), the Vietnam Dairy Association (Dr
Pho), office of website of Vietnamdairy.com (Dr Vang), dairy companies, plants, Moc Chau
company (Mr Nhan, Mr Cuong), Vinamilk company (North and South plants, head office
HCMC) (Mr Dai, Mr Thang), Dutch Lady Vietnam (FrieslandCampina Vietnam) Company
(North and South plants, Head Office in Binh Duong) (Mr Tan, Mr Hung), IDP Milk
v
Company (Mr Khai), Hanoi Milk Holdings company (Ms Hong). I would also like to thank
all persons participating in interviews. These were smallholding farmers, collectors,
managers, senior experts of companies and plants, wholesalers and retailers.
I sincerely thanks go to my lecturers, colleagues, and friends in Lincoln University for giving
me support, encouragement, and sharing knowledge, especially Mr Quan, Mr Hieu, Mr Hung,
Mr Huy, Ms Van (Vietnam), Mr Mahendra, Mr Salil (Nepal), and Ms Ludia (Indonesia).
Finally but most importantly, I devote the most deep gratitude to my family Dad and Mum,
and parents-in-law in Vietnam, and brothers-in-law in New Zealand, for their unfailing love,
spirit, encouragement and support. More thanks to my Dad who always encourages me to go
overseas to study and to get into scientific research. You are my pride, and give me advice
and wisdom. Warm love and affection goes to my wife, Ms Hong, and two daughters Ms Anh
(Emily) and Ms My (Hamy) for their patience, support and going with me throughout the
difficult period of doing research and writing a thesis.
Lincoln University, January 2013
Nguyen Chi Trung
BA (Economics), MSc (Agriculture Systems)
vi
Contents
Abstract ii
Acknowledgement iii
Contents vi
List of tables viii
List of figures ix
Abreviations xii
Chapter 1 Introduction............................................................................................................. 1
1.1 Quality concerns and Quality Assurance Systems ............................................................ 1
1.2 Study Context .................................................................................................................... 4
1.3 Rationale and Research Objectives ................................................................................. 13
1.4 Thesis Structure ............................................................................................................... 15
Chapter 2 Literature Review ................................................................................................. 16
2.1 Quality Definition and QA Systems ................................................................................ 16
2.1.1 What is quality? ................................................................................................... 16
2.1.2 Quality assurance systems in the food sector ...................................................... 18
2.1.3 Supply chains and quality management .............................................................. 25
2.1.4 Conclusion ........................................................................................................... 26
2.2 Motivation to Adopt QAS‟s by Firms ............................................................................. 26
2.2.1 External motivations ............................................................................................ 26
2.2.2 Internal motivations ............................................................................................. 28
2.3 Adoption of QAS‟s and the External Environment ......................................................... 31
2.3.1 Introduction ......................................................................................................... 31
2.3.2 Legal and regulatory forces ................................................................................. 33
2.3.3 Market factors ...................................................................................................... 35
2.3.4 External support ................................................................................................... 36
2.4 Organizational Characteristics and Adoption of QAS .................................................... 37
2.4.1 Introduction ......................................................................................................... 37
2.4.2 Size of firm .......................................................................................................... 38
2.4.3 Top management support .................................................................................... 39
2.4.4 Organisational structure ....................................................................................... 40
2.4.5 Nature of firm and product .................................................................................. 41
2.5 Impact of an Adoption of QAS‟s on Organisational Outcomes ...................................... 42
2.5.1 Introduction ......................................................................................................... 42
2.5.2 Adoption of QA systems and firm‟s performance ............................................... 43
2.5.3 Adoption QA systems and product performance ................................................ 45
2.6 Chapter Summary ............................................................................................................ 47
Chapter 3 Theoretical Framework and Methodology ......................................................... 49
3.1 Theoretical Framework ................................................................................................... 49
vii
3.2 The Case Study Research Method ................................................................................... 53
3.2.1 Choice of case study method ............................................................................... 53
3.2.2 Philosophy ........................................................................................................... 53
3.2.3 Criticisms ............................................................................................................. 54
3.3 Operationalizing the Case Study Method ........................................................................ 55
3.3.1 Case selection and design .................................................................................... 55
3.3.2 Procedures ........................................................................................................... 57
3.3.3 Data triangulation ................................................................................................ 60
3.3.4 Data analysis and case presentation ..................................................................... 61
3.3.5 Ethical considerations .......................................................................................... 63
Chapter 4 Result 1- Moc Chau Dairy Company case- Description and Analysis ............. 65
4.1 Description ...................................................................................................................... 65
4.1.1 Overview ............................................................................................................. 65
4.1.2 Governance structure ........................................................................................... 66
4.1.3 Supply chain structure ......................................................................................... 69
4.1.4 Business strategy and QA systems ...................................................................... 71
4.1.5 Supply chain stakeholders ................................................................................... 71
4.1.6 Conclusions ......................................................................................................... 85
4.2 Analysis ........................................................................................................................... 86
4.2.1 Introduction ......................................................................................................... 86
4.2.2 Perceived factors influencing adoption of QAS‟s ............................................... 87
4.2.3 Perceived impacts of QA systems on organisational outcomes .......................... 98
4.2.4 Conclusions ....................................................................................................... 103
Chapter 5 Results 2- Large firms: Dutchlady Vietnam and Vinamilk cases –
Description and Analysis ...................................................................................................... 107
5.1 Dutch Lady Vietnam (DLM) ......................................................................................... 107
5.1.1 Overview ........................................................................................................... 107
5.1.2 Governance structure ......................................................................................... 109
5.1.3 Supply chain structure ....................................................................................... 110
5.1.4 Business strategy and QA systems .................................................................... 113
5.1.5 Perceived factors influencing adoption of QAS‟s ............................................. 114
5.1.6 Perceived impacts of QA systems on organisational outcomes ........................ 118
5.1.7 Conclusions ....................................................................................................... 122
5.2 Vinamilk (VNM) ........................................................................................................... 123
5.2.1 Overview ........................................................................................................... 123
5.2.2 Governance structure ......................................................................................... 126
5.2.3 Supply chain structure ....................................................................................... 127
5.2.4 Business strategy and QA systems .................................................................... 129
5.2.5 Perceived factors influencing adoption of QAS‟s ............................................. 130
5.2.6 Perceived impact of QA systems on organisational outcomes .......................... 133
5.2.7 Conclusion ......................................................................................................... 136
5.3 Chapter Conclusion ....................................................................................................... 136
Chapter 6 Result 3- Small Firms: Hanoimilk and IDP cases-Description and Analysis 138
6.1 Hanoimilk Company (HNM) ........................................................................................ 138
6.1.1 Overview ........................................................................................................... 138
viii
6.1.2 Governance structure ......................................................................................... 140
6.1.3 Supply chain structure ....................................................................................... 142
6.1.4 Business strategy and QA systems .................................................................... 143
6.1.5 Perceived factors influencing adoption of QAS‟s ............................................. 145
6.1.6 Perceived impacts of QA systems on organisational outcomes ........................ 147
6.1.7 Conclusion ......................................................................................................... 151
6.2 International Dairy Products Joint Stock Company (IDP) ............................................ 152
6.2.1 Overview ........................................................................................................... 152
6.2.2 Governance structure ......................................................................................... 153
6.2.3 Supply chain structure ....................................................................................... 154
6.2.4 Business strategy and QA systems .................................................................... 157
6.2.5 Perceived factors influencing the adoption of QAS‟s ....................................... 158
6.2.6 Perceived impact of QA systems on organisational outcomes .......................... 161
6.3 Chapter Conclusion ....................................................................................................... 163
Chapter 7 Cross-case Analysis, Discussion and Conclusions............................................ 164
7.1 Discussion on the Main Findings .................................................................................. 164
7.1.1 Characteristics of supply chains, processes and QA systems ............................ 164
7.1.2 Processing firms and QA systems ..................................................................... 172
7.1.3 Key motivations for adopting different QA systems ......................................... 175
7.1.4 Key factors influencing the adoption decision .................................................. 179
7.1.5 Impacts of QA systems on organisational outcomes ......................................... 189
7.2 Key Insights ................................................................................................................... 197
7.2.1 Emerging economies and food quality management ......................................... 197
7.2.1 The lead role of processing companies in quality assurance ............................. 198
7.2.2 Assurance of quality and perceived organisational outcomes ........................... 199
7.3 Conclusions ................................................................................................................... 199
7.3.1 Research contribution ........................................................................................ 199
7.3.2 Limitations of the research ................................................................................ 203
7.3.3 Suggestions for future research ......................................................................... 204
7.3.4 Implications of the research ............................................................................... 204
Appendix A Protocol questions for interview .................................................................... 228
A.1 Appendix A.1 Protocol Questions for interviewing small farm producers ................... 228
A.2 Appendix A.2. protocol questions for interviewing collectors...................................... 231
A.3 Appendix A.3. protocol questions for interviewing processors/plants.......................... 233
A.4 Appendix A.4. protocol Questions for Interviewing distributors .................................. 237
A.5 Appendix A.5. Protocol questions for interviewing retailers ........................................ 239
Appendix B Questionnaire form for post surveying .......................................................... 241
Appendix C Major dairy companies in Vietnam ............................................................... 249
Appendix D Schedule time ................................................................................................... 251
Appendix E Dairy processing in Moc Chau milk plant..................................................... 252
ix
List of Tables
Table 1-1 Dairy cows and milk output by provinces in 2009 .................................................... 7 Table 2-1 Eight dimensions of product quality ....................................................................... 17 Table 2-2 Differences between QA systems ............................................................................ 25 Table 3-1 Number of interviewees and respondents by company ........................................... 60 Table 3-2 Identification codes used for the respondents ......................................................... 62 Table 4-1 Typical dairy farms –MCM case ............................................................................. 73 Table 4-2 Characteristics of input providers for farms-MCM case ......................................... 74 Table 4-3 Main features of collection point – MCM case ....................................................... 77
Table 4-4 Main features of milk processing plants – MCM case ............................................ 79 Table 4-5 Motivations for seeking QAS‟s – MCM case ......................................................... 88 Table 4-6 Perceived environmental factors influencing adoption of QAS‟s-MCM case ........ 94 Table 4-7 Perceived organisational factors influencing adoption of QAS‟s-MCM case ........ 95 Table 4-8 Realised business performance - MCM case ........................................................... 99 Table 4-9 Perceived impacts of QA systems on business performance – MCM case ........... 100 Table 4-10 Perceived Impacts of QA systems on operational performance-MCM case ........ 101 Table 4-11 Perceived impact of QA systems on quality performance – MCM case .............. 102 Table 5-1 Motivations for seeking QA systems – DLM case ................................................. 115 Table 5-2 Perceived factors influencing adoption of QAS‟s – DLM case ............................. 117 Table 5-3 Perceived impacts of QA systems on business performance – DLM case. ............ 119 Table 5-4 Perceived impact of QA systems on operational performance – DLM case .......... 120
Table 5-5 Perceived impact of QA systems on quality performance- DLM case .................. 121 Table 5-6 Motivations for seeking QAS‟s – VNM case ......................................................... 131 Table 5-7 Perceived factors influencing adoption of QAS‟s- VNM case .............................. 133 Table 5-8 Perceived impacts of QA system on business performance- VNM case ............... 134 Table 5-9 Perceived impact of QA systems on operational performance – VNM case ......... 135 Table 5-10 Perceived impact of QA systems on quality performance – VNM case .............. 136 Table 6-1 Motivations for seeking QA systems – HNM case ................................................ 145 Table 6-2 Perceived factors influencing the adoption of QAS‟s -HNM case ......................... 147 Table 6-3 Perceived impact of QA systems on business performance – HNM case .............. 149 Table 6-4 Perceived impact of QA systems on operational performance – HNM case ......... 150
Table 6-5 Perceived impact of QA systems on quality performance – HNM case ................ 151 Table 6-6 Motivations for seeking QA system -IDP case ...................................................... 158
Table 6-7 Perceived factors influencing adoption of ISO 22000 – IDP case ......................... 160 Table 6-8 Perceived impact of QA systems on business performance ................................... 162 Table 6-9 Perceived impact of QA system on operational performance ................................ 162 Table 6-10 Perceived impact of QA system on product performance .................................... 163 Table 7-1 Characteristics of supply chains ............................................................................. 165
Table 7-2 Supply chain processes and processor activities .................................................... 167 Table 7-3 Quality processes .................................................................................................... 169 Table 7-4 Quality systems and standards adopted by actors in supply chains ...................... 171 Table 7-5 The adoption of QA systems by dairy firms .......................................................... 173 Table 7-6 Motivations for adopting HACCP .......................................................................... 175
Table 7-7 Motivations for adopting ISO 9000 ........................................................................ 176
Table 7-8 Motivations for adopting ISO 22000 ...................................................................... 177
Table 7-9 Perceived factors influencing adoption of HACCP................................................ 179
x
Table 7-10 Perceived factors influencing adoption of ISO 9000 ........................................... 180 Table 7-11 Perceived factors influencing adoption of ISO 22000 ......................................... 181 Table 7-12 Organisation context factors in analysed cases .................................................... 187 Table 7-13 Perceived impacts of HACCP on organisational outcomes ................................. 190 Table 7-14 Perceived impacts of the ISO 9000 on organisational outcomes ........................ 193 Table 7-15 Perceived impacts of the ISO 22000 on organisational outcomes ...................... 195 Table 7-16 Comparison of results of current study with some previous research ................. 201
List of Figures
Figure 1-1 Map of dairy production and processing plants in Vietnam ................................... 6 Figure 1-2 Typical dairy chain and QA systems in Vietnam ................................................. 10 Figure 1-3 Thesis structure ..................................................................................................... 15 Figure 2-1 Seven principles of HACCP .................................................................................. 19 Figure 2-2 ISO 9000 certification process .............................................................................. 21 Figure 2-3 Business environment and organization ................................................................ 32 Figure 3-1 Theoretical model .................................................................................................. 50 Figure 3-2 Factors influencing the adoption of QAS‟s .......................................................... 51 Figure 3-3 Impact of QAS‟s on organisational outcomes and measures ............................... 52 Figure 4-1 Governance structure of MCM .............................................................................. 67 Figure 4-2 Supply chain structure and QA systems adopted - MCM case ............................. 70 Figure 4-3 Perceived factors influencing the adoption of QAS‟s -MCM case ..................... 104 Figure 4-4 Perceived impacts of HACCP system on organization outcomes –MCM case .. 105 Figure 4-5 Perceived impacts of ISO 9000 system on organisation outcomes-MCM case .. 106 Figure 5-1 Trend in revenue and profit (2005-2010) – DLM Vietnam ................................. 108 Figure 5-2 Governance Structure - DLM Vietnam ............................................................... 110 Figure 5-3 Supply chain structure – DLM Vietnam .............................................................. 111 Figure 5-4 Market share (%) by products – DLM Vietnam .................................................. 112 Figure 5-5 Growth of turnover and profit (2005-2010) -VNM case ..................................... 124 Figure 5-6 Major products – VNM case ............................................................................... 125 Figure 5-7 Management board structure- VNM case ............................................................ 126 Figure 5-8 Dairy supply chain – VNM case .......................................................................... 128 Figure 6-1 Trend in turnover, and profit in 2005-2010 – HNM case .................................... 139 Figure 6-2 Major products – HNM case ............................................................................... 140 Figure 6-3 Governance structure – HNM case ..................................................................... 141 Figure 6-4 Supply Chain Structure – HNM case .................................................................. 143 Figure 6-5 Governance structure of IDP ............................................................................... 154 Figure 6-6 Supply Chain of HNM ......................................................................................... 156
xi
Abbreviations
QAS‟s Quality assurance systems
QA Quality assurance
ASQ American Society of Quality
FAO The United Nation Food and Agriculture Organisation
WHO World Health Organisation
GMP Good manufacturing practice
HACCP Hazard analysis of Critical Control Points
GHP Good Hygiene Practice
WFP World Food Program
CAC Codex Alimentarius Commission
NACMCF National Advisory Committee on Microbiological Criteria for Foods
ICMSF International Commission on Microbiological Specifications for Foods
CCP Critical Control points
ISO International Standardization Organisation
ISO/TC 176 ISO Technical Committee 176
PRP Prerequisite programs
EurepGAP European Good Agriculture Practice
BRC British Retail Consortium
SQF Safe Quality Food
SCQM Supply Chain Quality Management
VND Vietnamese Monetary Unit
UHT Ultra High Temperature
MOH Vietnam Ministry of Public Health
VPC Vietnam Productivity Center
R&D Research and development
VND Vietnamese monetary unit (1,000 VND=49cent US)
STAMEQ Directorate for standards, metrology, and quality
QUARCERT Vietnam Certification Center
GMP Good manufacturing practice
GHP Good Hygienic Practice
GDP Gross Domestic Products
GSO General Statistical Office
DLH Department of Livestock Husbandry
NIAPP National Institute of Agricultural Planning and Projection
USDA US Department of Agriculture
MARD Ministry of Agriculture and Rural Development
MOI Ministry of Industry and Commerce
1
Chapter 1
Introduction
This study focuses on quality assurance in the dairy industry in Vietnam. This Chapter
introduces the study. It begins with a discussion of quality concerns in the agri-food industry
and the increasing important of quality assurance systems in the industry (Section 1.1). The
context for the study, the Vietnamese dairy industry and adoption of QAS‟s, is then
introduced in Section 1.2., and aims and specific research objectives are outlined in Section
1.3, and finally, the structure of the thesis is presented in Section 1.4.
1.1 Quality concerns and Quality Assurance Systems
Concerns with food safety and quality have been on the agenda of policy- makers and
managers concerned with food production and processing for some time. This interest in
quality and safety has increased with recent changes in agri-food systems internationally
(Krieger et al., 2007). Despite these efforts to address to quality and food safety, consumers
have become increasingly concerned about these issues as food-borne illness and outbreaks
continue to occur and are widely publicised. For example, it is estimated millions of people in
OEDC countries get ill every year from food contamination (Rocourt et al., 2003). There is
also evidence that confidence in food supply has been affected by health concerns linked to
incidents such as Salmonella in poultry, Bovine Spongiform Encephalopathy (BSE) in cattle,
and a rise in reported food poisoning incidents, which increased from less than 15,000 in
1982 to over 100,000 by 1998 (Baines & Manley, 1999). Such concerns are not only
happening in developed economies, but also emerging economies. For example, the milk
contamination melamine scandal, which affected a number of companies, including the Sanlu
group, one of China's largest baby milk powder manufacturers, caused 6,244 babies to fall ill
with 158 having acute kidney failure and 4 deaths (Zhang, 2008).
As a result, consumers have become very critical about food safety and food quality due to
these food contamination incidents, which have received a great deal of media attention
(Redmond & Griffith, 2003; Rocourt et al., 2003). In response to these concerns,
governments have introduced stricter legislation related to food control to force enterprises to
ensure quality and safety of products, and to encourage them to apply voluntary, or even
2
mandatory, quality assurance systems (QAS‟s), particularly in developed economies. In the
United States, European countries, and many other such developed countries, these concerns
about the efficacy of food safety controls in the food supply chain (Henson & Holt, 2000),
have led to mandate QAS‟s in their food sectors (Deohar, 2003).
Food quality management has become increasingly challenging due to a number of factors,
such as changes in consumption patterns, developments in technology, increasing legislative
requirements and changing environmental conditions (Motarjemi & Kaferstain, 1999;
Motarjemi & Mortimore, 2005; Luning & Marcelis, 2006, 2007; Luning et al., 2008). One of
the ways to ensure quality and safety of product is to adopt quality/safety assurance systems
within individual firms, and even across the entire food chain. These efforts can bring more
safe food “from farm to table”. As a result, the food supply chain has responded to the
demand of quality through the introduction of more sophisticated quality management
systems (Caswell et al., 1998). Examples in the area of food safety include HACCP and
statistical process control (Caswell & Hooker, 1996; Sumner, 2003). ISO quality
management systems have also received considerable support from firms seeking to improve
their competitiveness in changing markets (Zaibet & Bredahl, 1997; Fouayzi et al., 2006;
Nguyen T et al., 2003).
There has been a move from the old end of line product inspection approach towards the
newer approach to quality assurance, where links in the food chain assume responsibility for
safety through control of their own processes (Trienekens & Zuurbier, 2008). This means that
quality assurance is required at each step in the food production chain to ensure safe food and
to show compliance with regulatory and customer requirements (Trienekens, 2006). Such
QAS‟s have become important in terms of assuring safety and quality in the food sector
(Aggelogiannopoulos et al., 2007).
QAS‟s range from food safety systems to complete quality assurance systems, and are usually
constructed by various quality organizations. QAS‟s can be classified by level and scale
including international or global, national, local, and even private scales for product or
service quality (Trienkens & Zuurbier, 2008). The most common QAS‟s operating in the
agri-food industry are Good Manufacturing Practice (GMP) and Good Hygienic Practice
(GHP), Hazard Analysis of Critical Control Points (HACCP), which originated from Codex
Alimentarius Commission (CAC, a joint initiative by FAO and WHO initiative), and the ISO
3
series, consisting of the ISO 9000 family, ISO 14000, and ISO 22000 from the International
Standardisation Organisation (Briz et al., 2005; Trienekens & Zuurbier, 2008) .
With respect to legal enforcement or otherwise, quality systems are of two types - obligatory
and voluntary. HACCP is obligatory in developed countries for food sectors to ensure safe
products to consumers. Other quality management systems, such as ISO, can be used in
enterprises on a voluntary basis (Sikora & Strada, 2006). However, many food processing
and packaging companies are trying to move towards world class quality by building a solid
structure using a number of systems together, such as GMP, HACCP, and the ISO family, on
a voluntary basis (Surak & Simpson, 1994). These QA systems focus on processes; i.e.
process organisation, process control and process improvement (Krieger et al., 2007). Such
systems (for example, HACCP and ISO management systems, or their equivalent) are
increasingly being adopted (Baines & Manley, 1999).
Emerging economies are recognising the importance of quality assurance, and in particular
food safety assurance. According to Fueller et al., (2006), one of the key approaches to
building brand equity among Chinese dairy companies is establishing a reputation for
supplying products that have high quality and are safe. Chinese companies have not relied
solely on their reputation, but have also pursued certifications related to food safety on a
voluntary basis. For example, Yili attained HACCP certification for a number of milk
products in 2002 and 2003, several years before it was required by the government. However,
the recent melamine milk contamination scandal illustrates one of the challenges in
controlling and monitoring quality in procurement of raw milk and processing in emerging
economies.
It is generally agreed that food firms have become increasingly concerned about food quality
and are applying QAS‟s (Mamalis et al., 2009). A wide range of studies utilising disciplines
in economics and business have attempted to provide a plausible explanation for the
underlying reasons driving a business to adopt QAS‟s (Tsekouras et al., 2002). The
motivation for food suppliers to undertake food safety controls operates at two levels
(Caswell & Henson,1997). First, controls can be market-driven, for example, demand-side
shifts due to enhanced reputation linked to certification or labelling, or supply-side shifts due
to improvements in efficiency. Second, controls can be mandated by direct public regulation
of production processes or end-product safety or liability standards (Henson & Northern,
1997). Thus, regulation can also provide a motivation for adoption by firms (Baron &
4
Baron,1980; Cole & Sommers,1981; Rugman & Verbeke, 1998; Henson & Heasman, 1999).
The decision to select business counterparts has been shown to be positively influenced when
the supplier has an ISO 9000 registration (Deloite & Touche, 1994) and many buyers often
use the list of ISO-registered suppliers as their only source for identifying potential suppliers.
Marketing provides another major explanation for the adoption of ISO 9000. Juran (1995)
posited that the major reason for seeking certification is maintenance or expansion of
markets. QAS‟s can also be instrumental in achieving efficiency gains in a food chain by
reducing coordination costs and increasing compatibility between links in the chain. In
particular, large firms may have strong internal incentives to adopt QAS‟s, which can be seen
as a means for increasing the efficiency of operations (Holleran et al., 1999). Furthermore,
agri-food business firms around the world are increasingly using QAS‟s to improve their
product and production processes (Capmany et al., 2000; Ebrahimpour et al., 2007).
Adoption of any innovation is affected by external and internal factors. Adoption of QAS‟s is
influenced by environment factors (Wang, 2008; Hashem & Tann, 2007), political forces
(Chau & Tam,1997; Tornatzky & Fleischer, 1990), culture (Kaynak, 2003; van der Spiegel,
2004), top management, firms characteristics (Aggelogiannopoulos et al.,2007), governance
structure (Damanpour, 1987), initial costs, firm size, and profitability (Tsekouras et al.,
2006).
Evidence of the benefits that QAS adoption bring businesses is mixed and unclear.
Operational aspects of performance can be enhanced in ISO 9000- registered companies;
however, market position and competitiveness seems to be less strongly related to registration
(Sun, 1999). Performance is thought to improve through increases in revenue, and accessing
new markets or customers (Corbett et al., 2005; Terlaak & King, 2006), and financial
performance is also thought to be improved from ISO 9000 (Corbett et al., 2005; Terlaak &
King, 2006; Heras et al., 2002). However, it has also been shown that, though operational
efficiency is improved, this may not translate into improved financial performance (Naveh &
Marcus, 2005). Thus, a positive and clear association between ISO 9000 and superior
business performance has still to be demonstrated through field research.
1.2 Study Context
Vietnam has a livestock resource that forms an integral part in its agricultural system, and is
an important part of livelihoods for the rural and semi urban population in much of the
5
country. Livestock is used for many purposes, and includes the provision of draught power,
food supply, source of income, means of transportation, and an alternate energy source. In
milk production areas, it provides a source of income, social prestige, and plays a role in
hunger alleviation and poverty reduction. With regard to the national economy, livestock
production is significant, contributing approximately 27% of agriculture‟s share of GDP
(DLH Department of Livestock Husbandry, 2010; NIAPP National Institute of Agricultural
Planning and Projection, 2010).
The number of dairy cows and volume of milk production is increasing in Vietnam. In 2009,
the country had 115,000 dairy cows and milk output was 278,000 tons. The country set a goal
of increasing dairy cow numbers to 500,000 in 2015, and of producing 1.9 million tons (MOI
Ministry of Industry and Commerce, 2009). Collection and processing segments are growing
and many companies are entering this segment. The number of processing companies
increased dramatically from 13 in 2000 to 72 in 2008 (GSO General Statistical Office, 2009).
The gross value of dairy sector product was 7,000 billion VND (700 million USD), which
accounted for 5% of gross food and beverage output value, or 1% of gross industrial output
value (MOI, 2009).
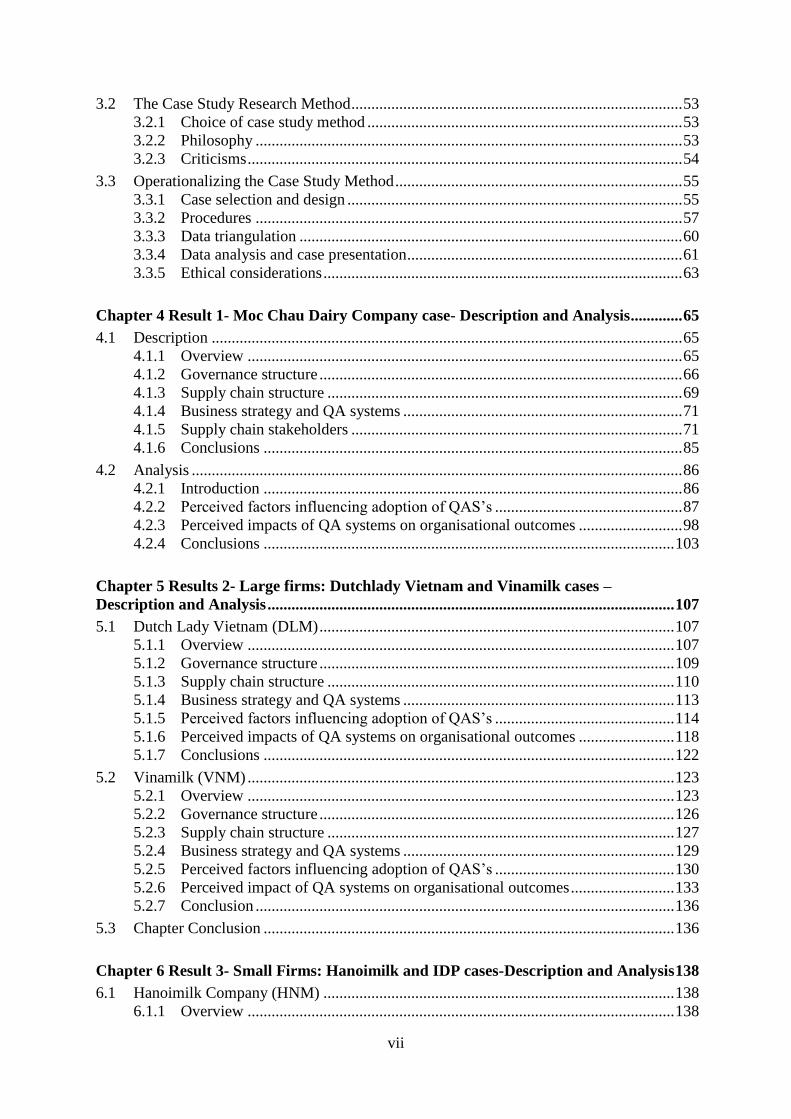
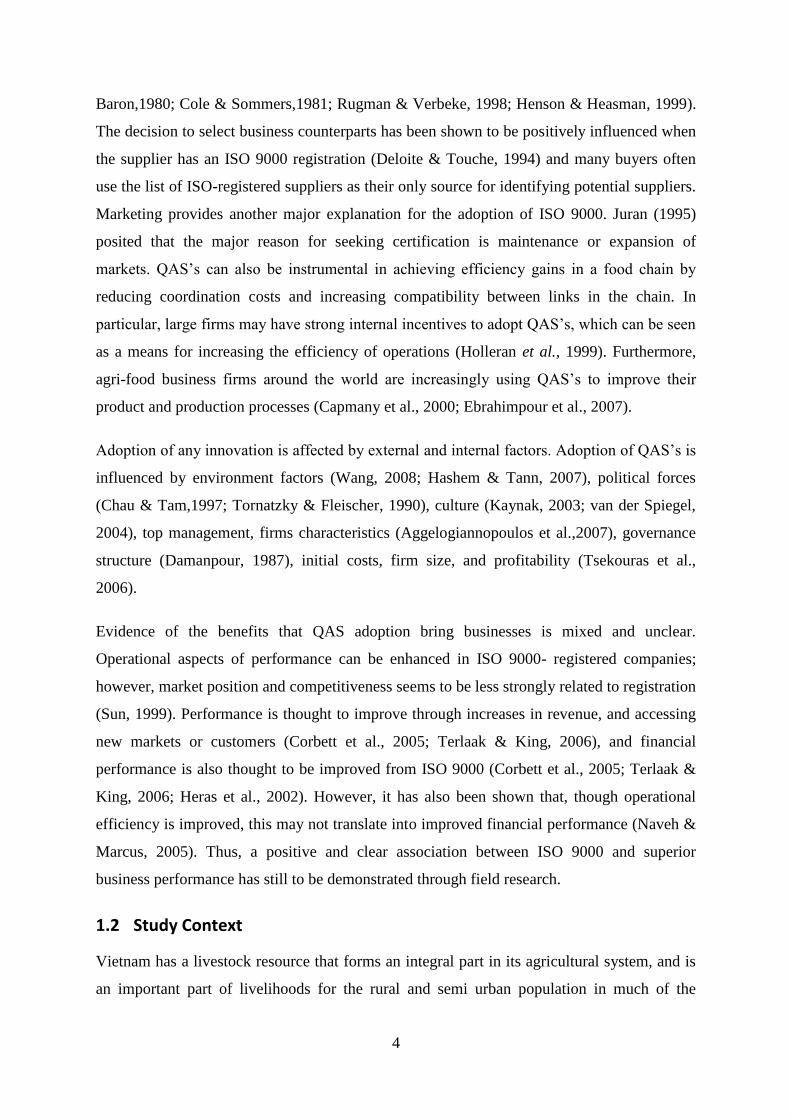
Dairy farming is mainly concentrated in the South of the country, which accounts for 83% of
dairy cow numbers. Ho Chi Minh City at 73,328 head accounts for 64% of total dairy cows,
and this is followed by other provinces such as Long An, Son La, and Ha Noi (GSO, 2010;
DLH, 2010). The country has 5 traditional dairy farming districts where dairy cows are
concentrated, these being Ba Vi, Phu Dong (Ha Noi), Moc Chau (Son La), Da Lat (Lam
Dong), and the suburbs of Ho Chi Minh City (NIAPP, 2009). A visual representation is
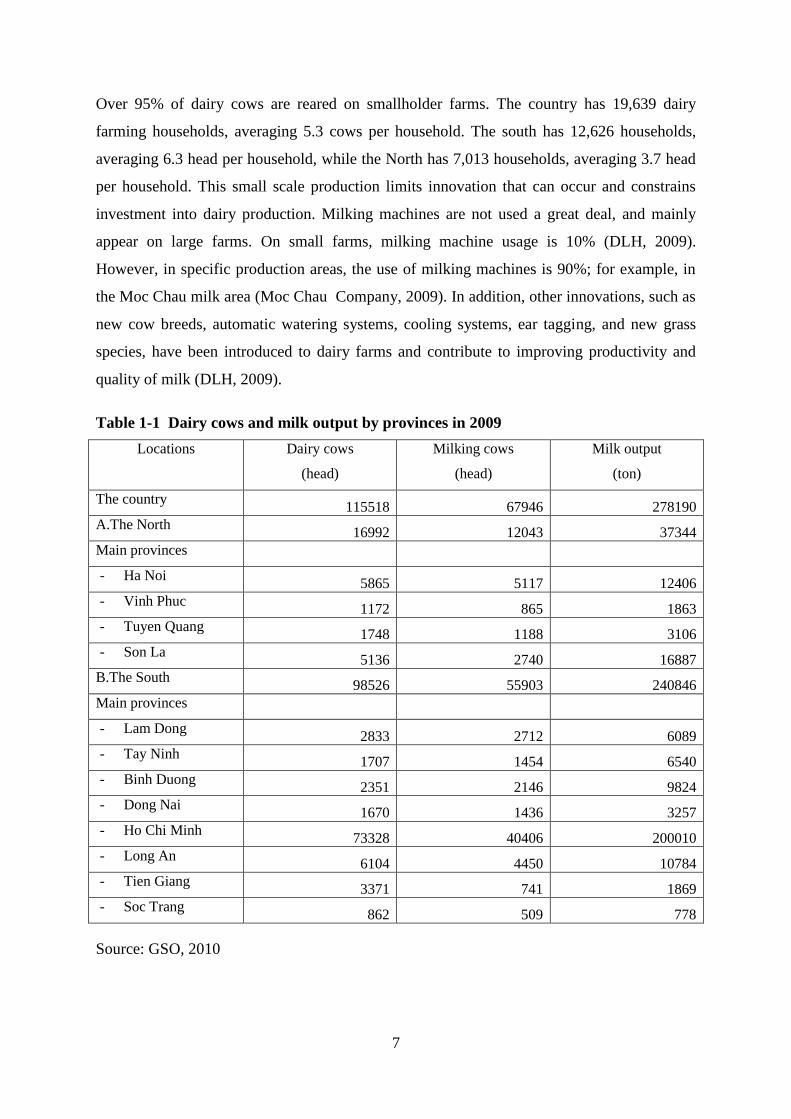
shown in the Dairy Production and Processing Plants map (Figure 1-1), and the number of
dairy cows and milk output by province is shown in Table 1-1.
6
Tuyen Quang Milk Plant
NUTIFOOD COMPANY
CAN THO MILK PLANT VNM
TAN DAI VIET COMPANY
THAILAND
CAMBODIA
DUTCH LADY VIETNAM
NESTLE VIETNAM
LOTHAMILK PLANT
HANOIHANOIHANOIHANOIHANOIHANOIHANOIHANOIHANOI
TIEN SON MILK PLANT VNM
TUYEN QUANG MILK PLANT VNM
NGHE AN MILK PLANT VNM
THONG NHAT MILK PLANT VNM
TRUONG THO MILK PLANT VNM
HO CHI MINH CITYHO CHI MINH CITYHO CHI MINH CITYHO CHI MINH CITYHO CHI MINH CITYHO CHI MINH CITYHO CHI MINH CITYHO CHI MINH CITYHO CHI MINH CITY
BA VI MILK PLANT IDP
CHUONG MY MILK PLANT IDP
THANH HOA MILK PLANT T H
LAOS
HA NOI MILK PLANT HNM
MOC CHAU MILK MCM
PEOPLE'S REPUBLIC OF CHINA
DA NANG MILK PLANT VNM
BINH DINH MILK PLANT VNM
DA NANGDA NANGDA NANGDA NANGDA NANGDA NANGDA NANGDA NANGDA NANG
LADOMILK PLANT
Figure 1-1 Map of dairy production and processing plants in Vietnam
Source: Department of Husbandry Livestock, MARD, 2009
7
Over 95% of dairy cows are reared on smallholder farms. The country has 19,639 dairy
farming households, averaging 5.3 cows per household. The south has 12,626 households,
averaging 6.3 head per household, while the North has 7,013 households, averaging 3.7 head
per household. This small scale production limits innovation that can occur and constrains
investment into dairy production. Milking machines are not used a great deal, and mainly
appear on large farms. On small farms, milking machine usage is 10% (DLH, 2009).
However, in specific production areas, the use of milking machines is 90%; for example, in
the Moc Chau milk area (Moc Chau Company, 2009). In addition, other innovations, such as
new cow breeds, automatic watering systems, cooling systems, ear tagging, and new grass
species, have been introduced to dairy farms and contribute to improving productivity and
quality of milk (DLH, 2009).
Table 1-1 Dairy cows and milk output by provinces in 2009
Locations Dairy cows
(head)
Milking cows
(head)
Milk output
(ton)
The country 115518 67946 278190
A.The North 16992 12043 37344
Main provinces
- Ha Noi 5865 5117 12406
- Vinh Phuc 1172 865 1863
- Tuyen Quang 1748 1188 3106
- Son La 5136 2740 16887
B.The South 98526 55903 240846
Main provinces
- Lam Dong 2833 2712 6089
- Tay Ninh 1707 1454 6540
- Binh Duong 2351 2146 9824
- Dong Nai 1670 1436 3257
- Ho Chi Minh 73328 40406 200010
- Long An 6104 4450 10784
- Tien Giang 3371 741 1869
- Soc Trang 862 509 778
Source: GSO, 2010
8
Dairy cows in Vietnam are mainly Holstein Friesian- hybrid cross, with 85% of the total
dairy cow herd having 50% or more Holstein Friesian bloodlines. The proportion of pure
Holstein Friesian is 14% of the total cow herd, and the remaining is other breeds, such as
Ayrshire, Brown Swiss, Jersey, etc. Demand for dairy breeds in the country cannot be
satisfied domestically. To satisfy this demand, the import of dairy cows is three times the
export of dairy cows (Dinh, 2008).
In line with the growth of the economy and the increase in incomes, demand for fluid milk is
rapidly rising. However, annual raw milk production only meets 20-30% of the demand for
consumption and the remainder is imported (Nguyen, 2009; Dinh, 2008). Despite this
situation, Vietnam showed the highest percentage of milk production growth worldwide, with
a 10% production increase in the year 2004. This is followed by similar growth in other
emerging economies, such as China, Thailand, Lebanon and Jordan. This growth results from
the fact that dairy development has been strongly promoted by the Vietnam government since
October 2001 (Akey, 2004). However, this dairy industry growth has focused more on
increased quantity and there is now recognition that it is time to focus more on quality in
dairy production (Dairyvietnam, 2009).
As well as this growth in production, the consumption of dairy products in Vietnam has
been growing significantly over recent decades, despite being still low in comparison to
other ASEAN countries. It is estimated that the per capita consumption of dairy products is
around 9 kg per annum (USDA, 2004) and that only 10% of the population in Vietnam
consumes dairy products (MARD Ministry of Agricultural and Rural Development, 2009).
The increase in both production and consumption is driven by changes in consumption
patterns that result from high economic growth as well as the effects of population growth
(Faye & Loiseau, 2002). This growth creates larger markets for dairy companies.
Milk is a highly perishable product, and needs to be processed to lengthen its shelf-life.
Processing also makes possible a range of diversified products, such as UHT, pasteurized and
sterilized milk, fresh milk, powdered milk, and flavoured milk. In Vietnam, in response to the
growth of dairy herds, milk processing plants have been established and are in operation.
There are now 72 establishments and businesses involved in the production, marketing, and
processing segments (MOI, 2009). With respect to processors, Vinamilk has the largest share
in the distribution and milk procurement market, followed by DutchLady Vietnam and
Hanoimilk (Habubank Securities, 2009).
9
The main products produced by the dairy sector are condensed milk, powdered milk, UHT
milk and yoghurt. As well, other products such as nutrition milk powder, ice cream, cheese,
soymilk, juice, milk cake, and candy are also produced by processors. Up to 2008, the
processing and manufacturing capacity of dairy companies was 154,000 tons of condensed
milk, 46,000 tons of powdered milk, 439,000 tons of fresh sterilised and UHT milk, and
80,000 tons of yoghurt (MOI, 2009). Both Vinamilk and DutchLady Vietnam occupied a
large proportion of processing; particularly, 87% of condensed milk and 76% of powdered
milk.
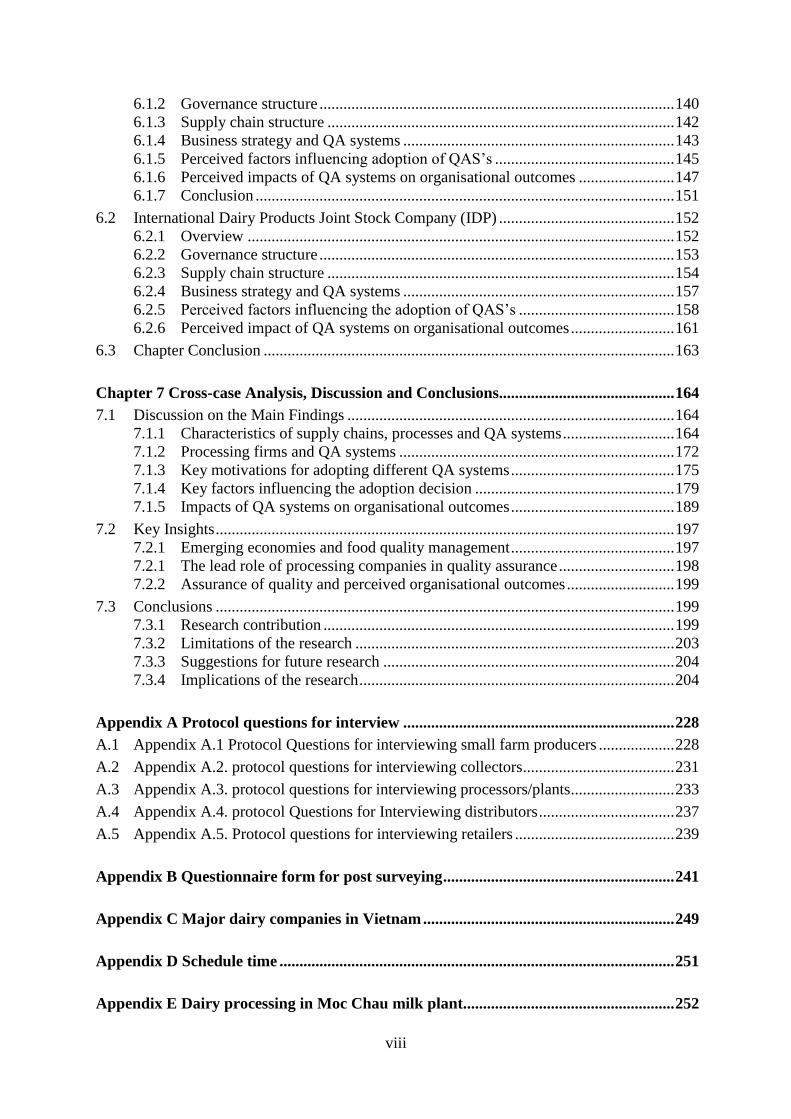
In this sector, dairy supply chains are formed and the main actors that are involved in these
chains are input providers, dairy farmers, collectors, processors/companies, distributors, and
retailers. This is shown in Figure 1-2. Input providers are mainly foreign companies, such as
TetraPak and Delco, and domestic dairy companies, such as Vinamilk, Moc Chau company,
Dutchlady Vietnam, and other private companies. Foreign companies supply machines and
equipment for production and processing, such as packaging lines, cooling systems, and
milking machines, while dairy companies provide veterinary services, credit services, grass
forages. Other private companies supply hand tools and equipment, such as tanks, milk
testers, and milking machines.
Dairy farmers, the core units for producing raw fresh milk, rear and milk cows for income, or
have a mix of on-farm and off-farm income sources. They are categorised into private
(smallholders), ex-State farm, company workers, and joint-stock farmers (who are
shareholders in dairy companies). Farms mostly use family labour, especially smallholders,
while hired labour is used on large farms, and workers are employed in farms owned by dairy
companies. Farmers produce milk and sell raw milk to processors, either directly or indirectly
via collectors/intermediaries. Five percent of volume is withheld to use for the family and to
rear calves, and is processed on-farm into products, such as yoghurt and cakes. Milk is
brought to collection points and plants by means of transportation, such as vans, trucks, and
mostly motorbikes; and is kept in milk containers, such as tanks made of plastics, aluminium
or stainless steel, depending on the farm. Collectors or intermediaries are diversified in
ownership and levels of involvement in chains, and include dealers, collectors-cum-farmer,
collecting staff of companies, and cooperatives. These various collection methods mean
quality is controlled in different ways.
10
GAHP Good animal husbandry practice GDFP Good dairy farming practice GDP Good distribution practices GMP Good manufacturing practice
Figure 1-2 Typical dairy chain and QA systems in Vietnam
Most of the dairy processors in Vietnam are medium to small, according to the Vietnamese
classification1. Seventy two companies and businesses are involving in processing,
manufacturing and trading dairy products (MOI, 2009). They produce a relatively diverse
range of products, including fresh, UHT milk, condensed milk, cheese, butter, powdered
milk, and yoghurt. There are two large companies, Vinamilk and Dutch Lady Vietnam.
Vinamilk, which is State controlled, has 15 plants (Vinamilk, 2007), and Dutch Lady
Vietnam, which is foreign owned, has 2 plants. These companies have 50 percent and 25
percent of the share in the procurement market, respectively (Dinh, 2008). Other small
companies, such as Hanoimilk, Anco, Moc Chau, Nutifood, Elovi, Hancofood, Lothamilk,
Vixumilk, H&T, S&N, and Dalatmilk, are joint ventured or in private ownership, and these
and other small companies cover the remaining distribution and procurement markets
1 Firm size, considered by capital registered and number of employees, less than 100 billion VND or under 300
employees, are indicators of small and medium size (VinaSME, 2009).
Dairy Supply Chain
From farm
Milk production
(dairy farms)
Sale of raw milk
Local, national
Milk processing (Vinamilk, Moc Chau
milk,)
Sale of dairy products import
wholesale retailer trade
Consumers
To table
Stakeholders’ responsibility for dairy quality
GAHP GDFP
GDP GMP HACCP
ISO 9000 ISO 22000
GDP
National standards TCVN, food safety regulations
11
(Nguyen A.P., 2007; Phan, 2007). (See Appendix C for more detail on milk companies in
Vietnam).
Distributors distribute the final products to consumers, via marketing channels, such as
wholesalers, who are company branches and monopoly distributors, and under them, there
are agents, shops, and corner-shops for distributing directly to consumers. In this segment,
milk is packaged and transported, and its quality relates to the conditions in the distribution
chain. As such, it will be affected by conditions of package, storage and transportation.
Depending on companies, their distribution systems are different in size, type of products,
level of control, and targeted and focused marketing areas. For example, Vinamilk has good
distribution systems, with 9400 major agents, and 15,000 shops, and retailer shops throughout
provinces in Vietnam (Vinamilk, 2010).
Milk quality and quality management is a „hot‟ issue in Vietnam, with increased concern by
consumers after incidences related to quality occurred in domestic and foreign milk products,
such as low protein, and melamine contamination (MOI, 2009). Quality issues of dairy
products are continuing to appear in public media and in workshops on improving the quality
and safety of these products (Dang, 2009). Examples include “quality is not assured in
Vietnam” (Asia Business News, 2009, p2), “large recalls of milk that has contaminated
content that causes allergies” for consumers (VTCnews, 2010, p1). As a result, the
importance of quality and quality assurance systems is now being recognised in this very
significant industry. Responding to the situation, the dairy companies has been to comply
with requirements of national standards, and international quality systems, such as the ISO
series.
In Vietnam, there are certain standards that food processors are obligated to follow that come
from national regulation. However, there is not the same presence of international QAS‟s for
other actors/players in the upstream and downstream stages of the food chain, such as
producers (farmers) and retailers. Since being introduced for the first time in 1998, a few of
the QAS‟s (i.e. HACCP and ISO) have been implemented by manufacturing and processing
food companies (VQSC, 2008). In the dairy industry, some companies, such as Dutchlady
Vietnam and Moc Chau Company, are applying ISO 9001:2000. It is common that large
companies with reputation brands and modern processing technology have been certified to
international standards, for example, Vinamilk and Dutch Lady Vietnam. However, other
actors in the supply chain comply with national standards, or private standards (Figure 1-2).
12
There are some large food processing companies that are applying two QAS‟s (HACCP and
ISO 9000), such as Nestle Vietnam (a joint ventured enterprise) (Le, 2007; STAMEQ, 2008),
and Vinamilk, the largest milk corporation. Vinamilk has recently renovated technology and
changed from quality management that was product-based to quality management that is
process-based by applying both HACCP and ISO 9000 quality assurance systems (MOI,
2008). However, the proportion of firms obtaining a quality certification is still relatively
low. One study suggests that fewer than 10% of total food processing firms in the entire
country are quality certified, and the diffusion process for QAS‟s is relatively slow
(STAMEQ, 2008). This situation applies also to the dairy industry. Forty percent of large and
medium firms apply both HACCP and ISO quality assurance systems while small percent of
small firms also apply both. Other small firms have been applying an individual QAS, either
HACCP or ISO, or even only GMP or GHP (MOI, 2009; STAMEQ, 2008). GMP/GHP is
considered the lowest level of certification, or a prerequisite to other quality assurance
systems.
The absence of quality standards in some segments of the food chain and the inadequate
application of QA systems in dairy factories are thought to be reasons for poor quality in the
dairy supply system. Milk quality is considered a major bottleneck in the absence of any
standardized milk quality testing scheme for the country with no independent quality control
agency carrying out regular checks at farms, collecting centres and processing factories
(Nancy et al., 2007). As a result, the safety and quality of dairy food products are not reliably
assured.
Food processors and manufacturers in Vietnam, especially small- and medium-sized food
processors, are starting to consider QAS‟s as a key attribute to compete on domestic and
global markets and have begun to adopt these systems (Le, 2007). In addition, they are
satisfying requirements of national regulations in agriculture products (STAMEQ, 2008;
MOI, 2009). Enforcement of quality regulations is controlled by different public authorities,
including Ministry of Public Health, Ministry of Agriculture and Rural Development, and
Ministry of Technology and Science (Ambhanoi, 2009). The government mandates some QA
systems in specific sub-sectors in the food industry. For aquatic production, HACCP is
mandatory and there are plans to mandate HACCP for the remaining sub-sectors in the food
industry (Vietnam Government, 2006). Vietnamese regulatory agencies try to improve the
quality perception of food processing industries and to enhance the diffusion of these quality
13
assurance systems through encouraging and supporting firms to apply new quality assurance
systems, such as ISO 9001:2000, ISO 14001 and HACCP through specific support programs.
Furthermore, many certifying companies and third party certifiers, ranging from State to
private and from joint- ventured to foreign owned, have been established to support access to
quality certification. As a result of such efforts, the number of food companies adopting
quality assurance systems has increased. About 600 enterprises, including 200 food
processing establishments, are certificated for individual QAS (that is ISO 9000).
The adoption of QAS‟s to improve quality may be affected by firm size and regulation
enforcement. Small sized firms may not apply quality assurance systems on a voluntary basis
since certification and inspection costs are high and a heavy burden for such type of firms.
Large firms can more easily access quality assurance systems and adopt them on a voluntary
basis, since the cost burden for implementation (investment, technology, human training) and
obtaining certification is relatively small for this type of firm. At the firm level, low capital
budgets for improving machines, technology, and for improving quality can pose a challenge,
while at the food chain level, loose integration and relationships among participants/actors
may make it more difficult to monitor and guarantee dairy quality. The relationship between
dairy producers and processing enterprises is often governed by verbal contracts, with the
exception of some dairy workers who belong to joint-ventured dairies and have written
contracts (Dinh, 2008). Thus, low resources at firm level and loose governance in the food
chain can cause difficulties in improving quality.
The above discussion shows interrelationships between the adoption of QAS‟s, motivations,
external and internal factors influencing adoption, and product quality. There appears to be a
need to have greater insight into these linkages in Vietnam conditions, which may contribute
to a greater understanding of successful adoption of QAS‟s and diffusion of these systems in
the dairy industry, and ultimately, may lead to quality improvement.
1.3 Rationale and Research Objectives
In summary, concerns about food safety and quality by governments, businesses and
consumers have been increasing globally. Governments in developed countries encourage or
mandate businesses to adopt particular QAS‟s, and quality assurance has changed from end
product inspection to process control, and is moving from plant based application to
application along the supply chain. Following the trend in developed countries, QAS‟s are
14
now becoming important in emerging economies, and is becoming a tool for assurance of
food safety and building brand reputation.
Various motivations have been put forward for adopting QAS‟s, which can be driven by
maintenance or expansion of market, a vehicle for assessing supplies and improving
processes or efficiency. A range of internal and external factors may be associated with
adoption; e.g. the environment in which firms operate, firm characteristics, and so on. Despite
motivations and high expectations from the adoption of QAS‟s, there is not a lot of evidence
on the operational outcomes that may occur.
Vietnam‟s dairy industry has been growing rapidly, which is shown through the dramatically
increasing number of dairy processing firms, number of cows and milk output. But
constraints in production also exist, such as small scale production, and low level of
technology. Satisfying the high demand for fluid milk, changes of consumer demand, and
reducing dependence on imports, means that it is a good time for the dairy industry to
develop an orientation towards quality. In this regards, processing, which transforms
perishable milk into a range of products with longer shelf-life becomes a very important
segment in the chain. It is a big challenge for quality improvement and adoption of QAS‟s in
a situation where there are some big companies, but most small companies, and raw milk is
supplied by mostly small farms.
Along the Vietnamese dairy supply chains, products flow through many actors before
reaching consumers. This includes farmers, collectors, processors, and distributors. In
relation to this, a multitude of standards are applied, such as different standards at different
stages in the chain, and different standards by different firms.
The fundamental purpose of this research is to gain an understanding of quality processes and
adoption of QAS‟s in dairy processing firms within the context of the broader supply chain.
More specifically, there is a need to investigate linkages between motivations for the
adoption of QAS‟s in Vietnam dairy processing firms and their supply chain environment, as
well as internal and external factors influencing such adoption. There is also a need to
investigate what perceived organisational outcomes have resulted from this adoption of
QAS‟s. To attain this, four interconnecting research questions are posed.
1. What quality processes and systems are used by dairy processing companies and their
associated supply chains?
15
2. What were the motivations of dairy processors in Vietnam for adopting particular QA
systems?
3. What role is played by different contextual factors in the adoption of particular QA
systems in the Vietnam dairy industry, which is a developing country context?
4. What were the perceived organisational outcomes resulting from the adoption of these
QA systems?
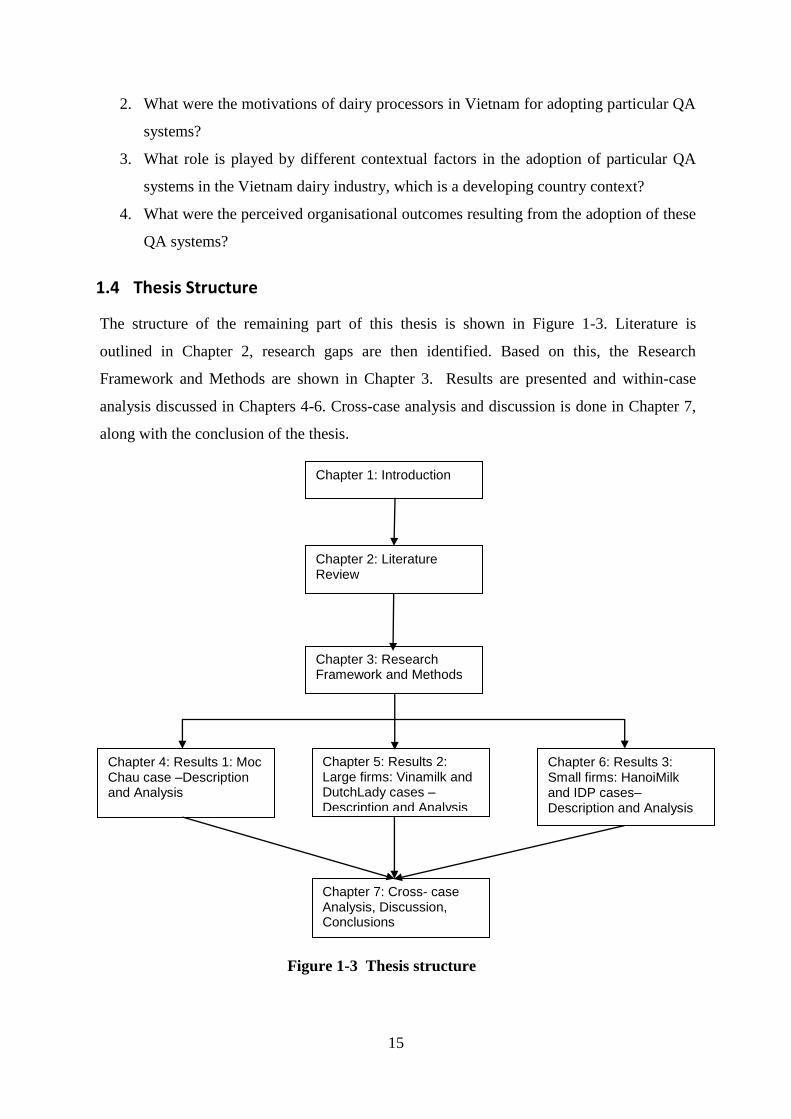
1.4 Thesis Structure
The structure of the remaining part of this thesis is shown in Figure 1-3. Literature is
outlined in Chapter 2, research gaps are then identified. Based on this, the Research
Framework and Methods are shown in Chapter 3. Results are presented and within-case
analysis discussed in Chapters 4-6. Cross-case analysis and discussion is done in Chapter 7,
along with the conclusion of the thesis.
Figure 1-3 Thesis structure
Chapter 1: Introduction
Chapter 2: Literature Review
Chapter 7: Cross- case Analysis, Discussion, Conclusions
Chapter 3: Research Framework and Methods
Chapter 5: Results 2: Large firms: Vinamilk and DutchLady cases – Description and Analysis
Chapter 4: Results 1: Moc Chau case –Description and Analysis
Chapter 6: Results 3: Small firms: HanoiMilk and IDP cases– Description and Analysis
16
Chapter 2
Literature Review
Chapter 1 highlighted issues related to a range of quality management issues, including the
importance of safe food, and the background context of the dairy sector in Vietnam. It then
introduced the research questions. This Chapter reviews some recent international literature
on issues related to quality, quality assurance system adoption, and their impacts on
organisational performance. In Section 2.1, quality is briefly defined and some quality
assurance systems (QASs) are described. This is followed in Section 2.2 with literature on the
motivations for adopting QAS‟s by firms, including internal and external motivations. In
Section 2.3, factors in the external environment that can influence the adoption of QAS‟s are
identified, and in Section 2.4, internal organisational factors that can affect the adoption of
QAS‟s are discussed. Finally, in Section 2.5, literature on the impact of QAS‟s on
organisational outcomes is discussed.
2.1 Quality Definition and QA Systems
2.1.1 What is quality?
The understanding of what quality means and its definition has changed and become broader
over time. Some earlier definitions were narrower, stressing uniformity about a correct target
(Deming, 1986) , product excellence measured in terms of a set of specifications to be met
within set tolerance levels (Kramer & Twigg, 1962) and conformance to requirement
(Crosby, 1980). However, it was also recognized that the definition is broader than this,
including fitness of purpose (Juran & Gryna, 1970). More recently, it has included measures
of product excellence, such as taste, appearance and nutritional content, and those
characteristics relevant to determining consumer acceptance (Portter & Hotchkiss, 1995).
A further aspect of product quality took into consideration its dimensions, which include
strategic as well as operational aspects that play an important role in characterising the
product presented to customers. In this context, there are two broad aspects of quality. The
first is design quality – meeting or exceeding the needs and expectations of customers; the
second is conformance quality – the extent to which a process is able to meet design
17
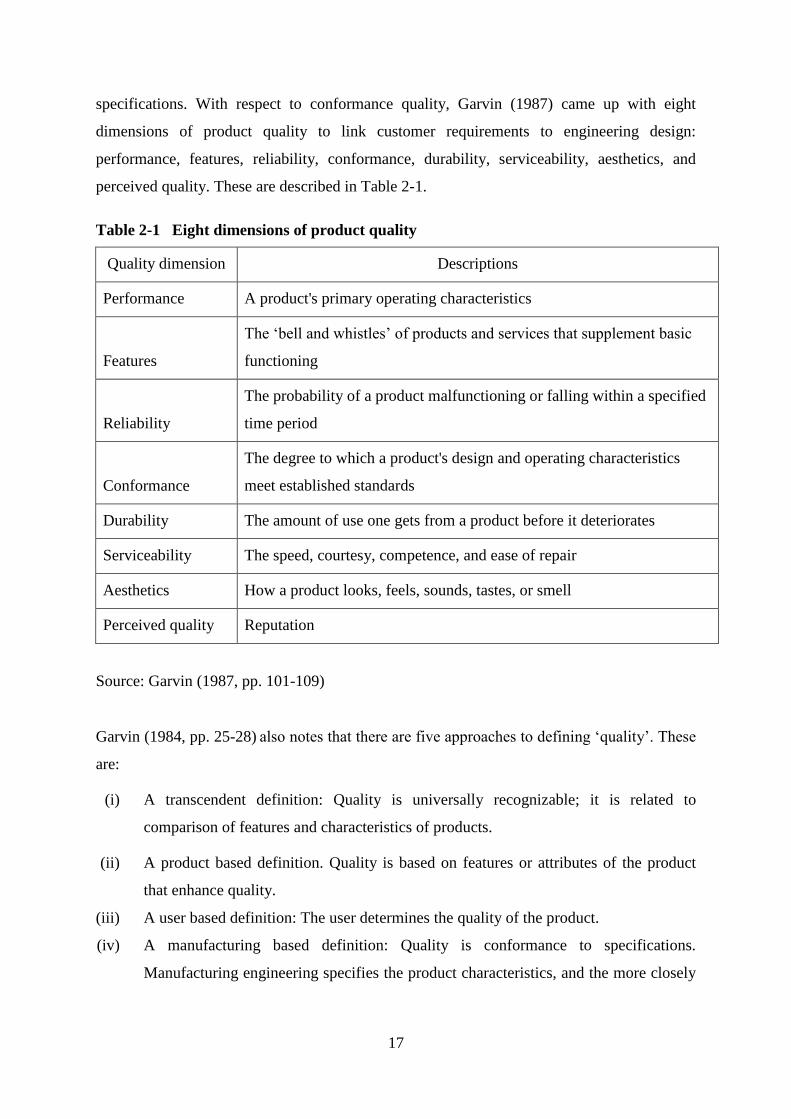
specifications. With respect to conformance quality, Garvin (1987) came up with eight
dimensions of product quality to link customer requirements to engineering design:
performance, features, reliability, conformance, durability, serviceability, aesthetics, and
perceived quality. These are described in Table 2-1.
Table 2-1 Eight dimensions of product quality
Quality dimension Descriptions
Performance A product's primary operating characteristics
Features
The „bell and whistles‟ of products and services that supplement basic
functioning
Reliability
The probability of a product malfunctioning or falling within a specified
time period
Conformance
The degree to which a product's design and operating characteristics
meet established standards
Durability The amount of use one gets from a product before it deteriorates
Serviceability The speed, courtesy, competence, and ease of repair
Aesthetics How a product looks, feels, sounds, tastes, or smell
Perceived quality Reputation
Source: Garvin (1987, pp. 101-109)
Garvin (1984, pp. 25-28) also notes that there are five approaches to defining „quality‟. These
are:
(i) A transcendent definition: Quality is universally recognizable; it is related to
comparison of features and characteristics of products.
(ii) A product based definition. Quality is based on features or attributes of the product
that enhance quality.
(iii) A user based definition: The user determines the quality of the product.
(iv) A manufacturing based definition: Quality is conformance to specifications.
Manufacturing engineering specifies the product characteristics, and the more closely
18
manufacturing can conform to those requirements, the better the quality of the
product.
(v) A value based definition: The element of price is introduced into the definition of
quality. Quality is the degree of excellence at an acceptable price and the control of
variability at an acceptable cost. Value comprises price and quality of product and
service.
More recent formal definitions take into account many of the features of previous definitions,
and have been standardized by regulatory bodies; for instance, ISO 9000: 2000 quality
management systems - fundamentals and vocabulary. Recently FAO/WHO publications
defined quality as the degree to which a set of inherent characterisics fulfils requirements as a
product or service. With this updated definition, the implication is that quality is relative to
what something should be and what it is (FAO/WHO, 2003) . The American Society of
Quality (ASQ) defines quality as “the totality of characteristics of a product or service that
bear on its ability to satisfy a given need” (ASQ, 2002, p.56). Both definitions are widely
accepted in food quality management nowadays and will be used to guide this research.
2.1.2 Quality assurance systems in the food sector
The most common QA systems operating in the agri-food industry are Good Manufacturing
Practice (GMP), Hazard Analysis of Critical Control Points (HACCP), and the International
Standards Organisation (ISO) series. Good Manufacturing Practice (GMP) and Good
Hygiene Practice (GHP) are interrelated. GMP contains ten principles that introduce
employees to critical behaviours to maintain good manufacturing practices in plants (WFP,
2008). GHP is a subset of this, and refers to procedures that must be undertaken and hygiene
conditions that have to be fulfilled and monitored at all stages of production or trade in order
to guarantee food safety (Knaflewska & Pospiech, 2007). GHP denotes all the actions that
must be undertaken and conditions to be fulfilled in order to ensure that production of food,
wrapping materials and other materials expected to be in contact with food, is executed in a
proper way to guarantee safe end products and safe food for human consumption.
2.1.2.1 HACCP
HACCP (Hazard Analysis of Critical Control Point) is a food safety program that was
developed nearly 30 years ago for NASA, based on regulations of the United Nations Codex
19
Alimentarius Commission (CAC) (Sperber et al., 1998) to ensure the safety of food products
that were to be used by the astronauts in the space program (WFP, 2008). HACCP is a
systematic approach to the identification, evaluation, and control of steps in food
manufacturing, which are critical to product safety (Codex Alimentarius, 1997; NACMCF,
1992; Trienekens & Zuurbier, 2008; Sumner, 2003). It identifies risks in the production
processes that can lead to unsafe products, and designs measurements to reduce these risks to
an acceptable level (FAO, 1998; Sumner, 2003). The HACCP system establishes process
control through identifying points in the production process that are most critical to monitor
and control. HACCP‟s preventative focus is seen as more cost effective than testing a product
and then destroying or reworking it (ICMSF, 1988). The system can be applied to control any
stage in the food system, and is designed to provide enough feedback to direct corrective
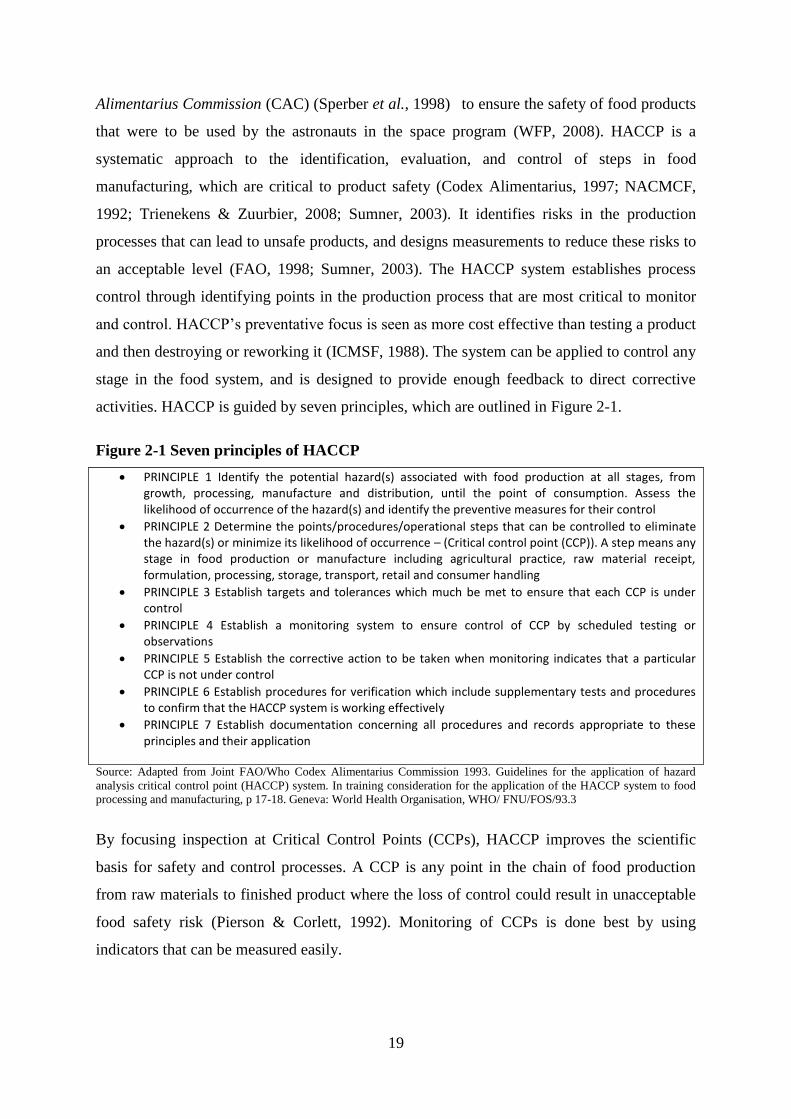
activities. HACCP is guided by seven principles, which are outlined in Figure 2-1.
Figure 2-1 Seven principles of HACCP
PRINCIPLE 1 Identify the potential hazard(s) associated with food production at all stages, from growth, processing, manufacture and distribution, until the point of consumption. Assess the likelihood of occurrence of the hazard(s) and identify the preventive measures for their control
PRINCIPLE 2 Determine the points/procedures/operational steps that can be controlled to eliminate the hazard(s) or minimize its likelihood of occurrence – (Critical control point (CCP)). A step means any stage in food production or manufacture including agricultural practice, raw material receipt, formulation, processing, storage, transport, retail and consumer handling
PRINCIPLE 3 Establish targets and tolerances which much be met to ensure that each CCP is under control
PRINCIPLE 4 Establish a monitoring system to ensure control of CCP by scheduled testing or observations
PRINCIPLE 5 Establish the corrective action to be taken when monitoring indicates that a particular CCP is not under control
PRINCIPLE 6 Establish procedures for verification which include supplementary tests and procedures to confirm that the HACCP system is working effectively
PRINCIPLE 7 Establish documentation concerning all procedures and records appropriate to these principles and their application
Source: Adapted from Joint FAO/Who Codex Alimentarius Commission 1993. Guidelines for the application of hazard
analysis critical control point (HACCP) system. In training consideration for the application of the HACCP system to food
processing and manufacturing, p 17-18. Geneva: World Health Organisation, WHO/ FNU/FOS/93.3
By focusing inspection at Critical Control Points (CCPs), HACCP improves the scientific
basis for safety and control processes. A CCP is any point in the chain of food production
from raw materials to finished product where the loss of control could result in unacceptable
food safety risk (Pierson & Corlett, 1992). Monitoring of CCPs is done best by using
indicators that can be measured easily.
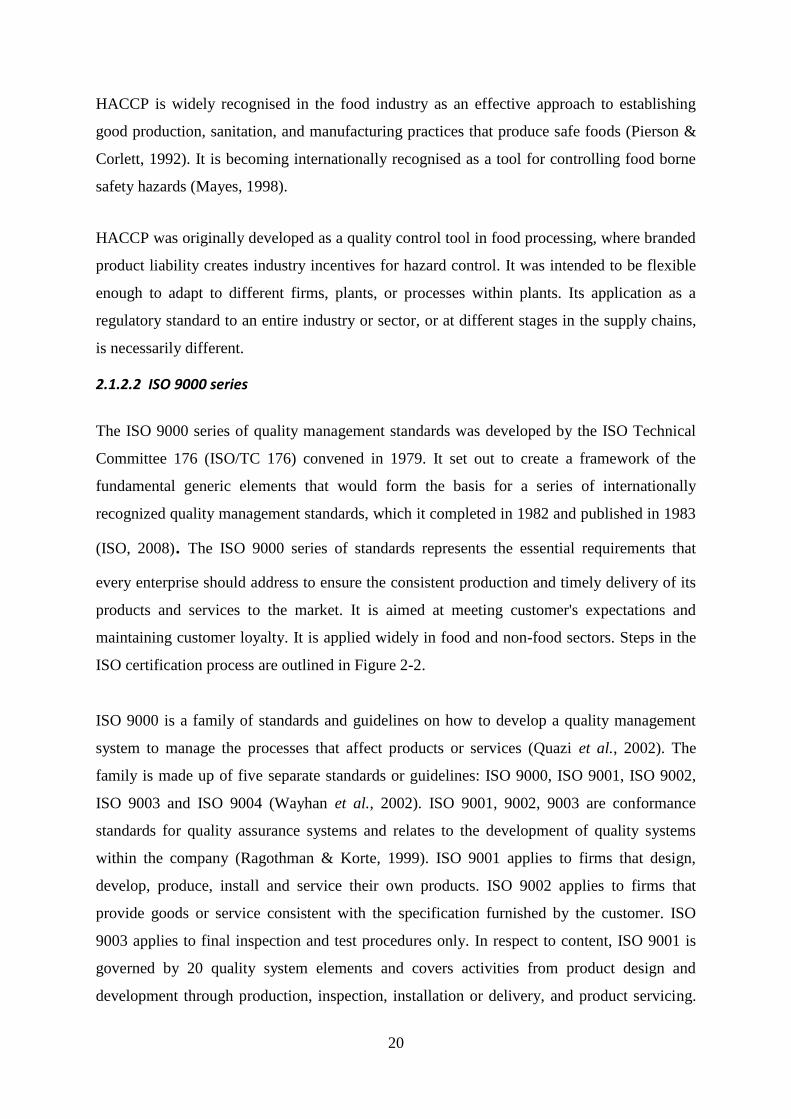
20
HACCP is widely recognised in the food industry as an effective approach to establishing
good production, sanitation, and manufacturing practices that produce safe foods (Pierson &
Corlett, 1992). It is becoming internationally recognised as a tool for controlling food borne
safety hazards (Mayes, 1998).
HACCP was originally developed as a quality control tool in food processing, where branded
product liability creates industry incentives for hazard control. It was intended to be flexible
enough to adapt to different firms, plants, or processes within plants. Its application as a
regulatory standard to an entire industry or sector, or at different stages in the supply chains,
is necessarily different.
2.1.2.2 ISO 9000 series
The ISO 9000 series of quality management standards was developed by the ISO Technical
Committee 176 (ISO/TC 176) convened in 1979. It set out to create a framework of the
fundamental generic elements that would form the basis for a series of internationally
recognized quality management standards, which it completed in 1982 and published in 1983
(ISO, 2008). The ISO 9000 series of standards represents the essential requirements that
every enterprise should address to ensure the consistent production and timely delivery of its
products and services to the market. It is aimed at meeting customer's expectations and
maintaining customer loyalty. It is applied widely in food and non-food sectors. Steps in the
ISO certification process are outlined in Figure 2-2.
ISO 9000 is a family of standards and guidelines on how to develop a quality management
system to manage the processes that affect products or services (Quazi et al., 2002). The
family is made up of five separate standards or guidelines: ISO 9000, ISO 9001, ISO 9002,
ISO 9003 and ISO 9004 (Wayhan et al., 2002). ISO 9001, 9002, 9003 are conformance
standards for quality assurance systems and relates to the development of quality systems
within the company (Ragothman & Korte, 1999). ISO 9001 applies to firms that design,
develop, produce, install and service their own products. ISO 9002 applies to firms that
provide goods or service consistent with the specification furnished by the customer. ISO
9003 applies to final inspection and test procedures only. In respect to content, ISO 9001 is
governed by 20 quality system elements and covers activities from product design and
development through production, inspection, installation or delivery, and product servicing.
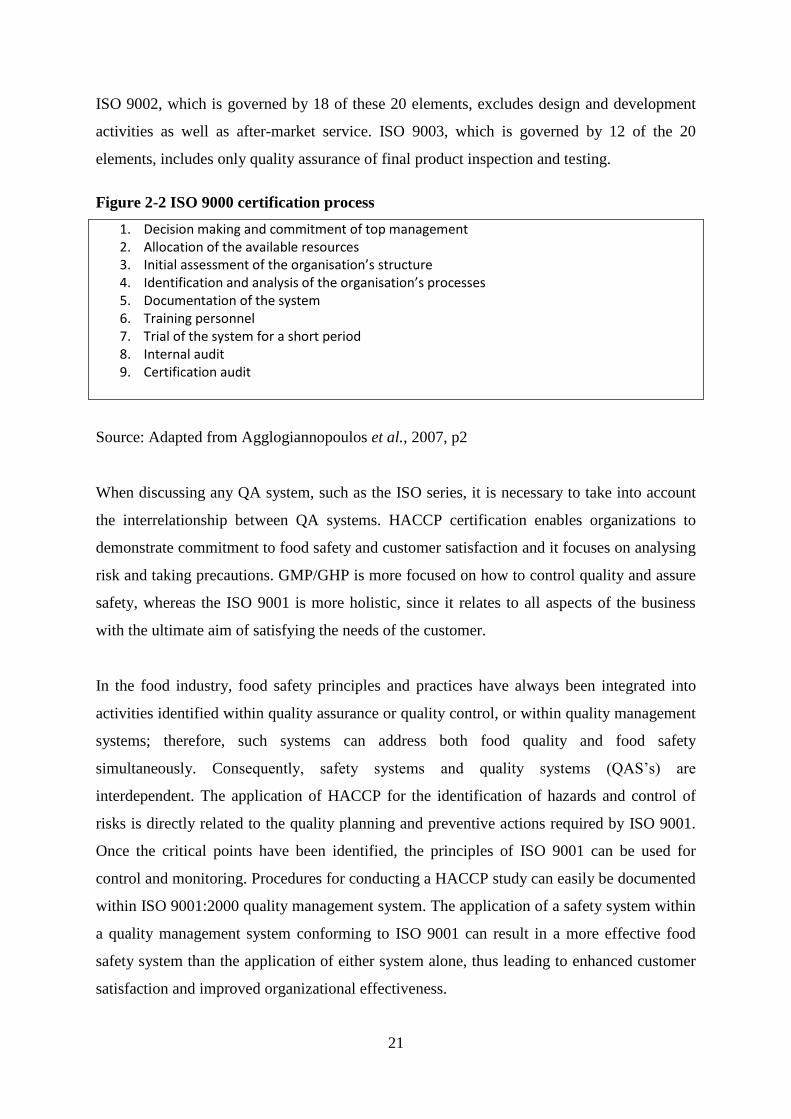
21
ISO 9002, which is governed by 18 of these 20 elements, excludes design and development
activities as well as after-market service. ISO 9003, which is governed by 12 of the 20
elements, includes only quality assurance of final product inspection and testing.
Figure 2-2 ISO 9000 certification process
1. Decision making and commitment of top management 2. Allocation of the available resources 3. Initial assessment of the organisation’s structure 4. Identification and analysis of the organisation’s processes 5. Documentation of the system 6. Training personnel 7. Trial of the system for a short period 8. Internal audit 9. Certification audit
Source: Adapted from Agglogiannopoulos et al., 2007, p2
When discussing any QA system, such as the ISO series, it is necessary to take into account
the interrelationship between QA systems. HACCP certification enables organizations to
demonstrate commitment to food safety and customer satisfaction and it focuses on analysing
risk and taking precautions. GMP/GHP is more focused on how to control quality and assure
safety, whereas the ISO 9001 is more holistic, since it relates to all aspects of the business
with the ultimate aim of satisfying the needs of the customer.
In the food industry, food safety principles and practices have always been integrated into
activities identified within quality assurance or quality control, or within quality management
systems; therefore, such systems can address both food quality and food safety
simultaneously. Consequently, safety systems and quality systems (QAS‟s) are
interdependent. The application of HACCP for the identification of hazards and control of
risks is directly related to the quality planning and preventive actions required by ISO 9001.
Once the critical points have been identified, the principles of ISO 9001 can be used for
control and monitoring. Procedures for conducting a HACCP study can easily be documented
within ISO 9001:2000 quality management system. The application of a safety system within
a quality management system conforming to ISO 9001 can result in a more effective food
safety system than the application of either system alone, thus leading to enhanced customer
satisfaction and improved organizational effectiveness.
22
The ISO 9001 requirements have had three revisions since it was originally issued by ISO.
These are ISO 9001: 9004, ISO 9001: 2000, ISO 9001: 2008 (ISO, 2008). The meaning of
quality used in the context of ISO 9000 was concerned with the totality of characteristics that
satisfy needs, but in the 2000 version, this meaning was changed. Quality in ISO 9000:2000
was defined as the degree to which a set of inherent characteristics fulfils requirements. The
former definition focused on a product or service, but this new definition implies that quality
is relative to what something should be compared to what it is. However, when comparing
ISO 9001: 2000 and ISO 9001: 2008, ISO 9001: 2008 has been developed in order to clarify
the existing requirements of ISO 9001: 2000, and to improve its compatibility with another
ISO standard, ISO 14001: 2004. ISO 9001: 2008 does not introduce extra requirements or
change what the intention of the ISO 9001: 2000 standard is. Certification to ISO 9001: 2008
is not deemed to be an upgrade, and organizations that are certified to ISO 9001: 2000 may
be given the same status as those who have already received a new certificate for ISO 9001:
2008 (ISO, 2008). There are also small differences in content of ISO versions. For example,
in regard to ISO 9001: 1994 and ISO 9001: 2000, version 2000 reduces the 20 quality
standard elements shown in version 1994 into only four groups which include responsibility
of top managers, resource management, product creation, and measurement, analysis and
improvement.
In the different ISO series, - ISO 9000, ISO 9001, and ISO 9004 version 2000 - there are
different purposes of application. The ISO 9000: 2000 has its focus on the quality
management system- fundamentals and vocabulary; ISO 9001:2000 on the quality
management system- requirements; ISO 9004:2000 on the quality management system –
guidelines for performance improvements. ISO 9001 and ISO 9004 are quality management
systems that have been designed to complement each other, but can also be used
independently. ISO 9001 specifies requirements for a quality management system that can be
used for internal application by organizations, for certification, or for contractual purposes. It
also focuses on the effectiveness of the quality management system in meeting customer
requirements as mentioned previously. ISO 9004 gives guidance on a wider range of
objectives of a quality management system than does ISO 9001, particularly for the continual
improvement of an organisation‟s overall performance and efficiency, as well as its
effectiveness. ISO 9004 is recommended as a guide for an organization whose top
management wishes to move beyond the requirements of ISO 9001 in pursuit of continual
23
improvement of performance. However, it is not intended for certification for contractual
purposes.
As noted previously, prior to 1994, the ISO 9000 series consisted of five separate standards:
ISO 9000, 9001, 9002, 9003, and 9004. The 2000 version of the ISO 9000 family of
standards replaced the 1994 version of several of these standards. This included ISO 8402:
1994 (later subsumed under ISO9000), quality management and quality assurance –
vocabulary; ISO 9000-1: 1994, quality management and quality assurance standards - part 1:
guidelines for selection and use; ISO 9002: 1994, quality systems - model for quality
assurance in production, installation and servicing; ISO 9003: 1994 quality systems- model
for quality assurance in final inspection and test; ISO 9004-1: 1994, quality management and
quality system elements-part 1: guidelines. ISO 9001:2000 now consolidates the former ISO
9001/9002/9003 in the old standards into a single document and is the only standard to which
certification is now assessed (Briz et al., 2005). The ISO 9001:2008 standard does not divide
into separate standards, in the same way as ISO 9001: 2000 did, and is the only standard that
defines the ISO 9001: 2008 quality management system- requirements (ISO, 2008).
2.1.2.3 ISO 22000: 2005
ISO 22000 is an international, auditable standard that specifies the requirements for a food
safety management system by incorporating all the elements of GMP and HACCP together
with a comprehensive management system (Pillay & Muliyil, 2005). Food safety experts
have found that well functioning prerequisite programs (PRPs) simplify and strengthen the
HACCP plan. Hence ISO 22000 is a HACCP-type standard and fits very well with ISO 9001:
2000, having been especially developed to assure food safety. ISO 22000 combines the
HACCP principles and application steps with prerequisite programs, using hazard analysis to
determine the strategy to be used to ensure hazard control by combining the prerequisite
programs and a HACCP plan (Faergemand & Jespersen, 2004). The new standards offer an
alternative to food enterprises that do not implement ISO 9001 and want to have an effective
food safety management system (Aggelogiannopoulos et al., 2007). It combines a series of
advantages, involving quality management, external and in-house communications,
designating responsibility, implementing crisis management, continual improvement, good
health practice and differentiating between prerequisite program (PRP) and critical control
points (CCP) (Talbot, 2007).
24
In summary, the basic QA systems are GMP, HACCP and ISO series and these have been
described in some detail. Universal definitions of quality are accepted and have been widely
used in food quality management systems. The key feature of these definitions is satisfying
and exceeding expectations of customers shown in the requirement in the quality assurance
systems.
2.1.2.4 Other systems and comparisons of QA systems
In addition to these key systems, there are other QA certifications in the food industry. These
include EurepGAP, BRC, and SQF. Some of these certifications combine some of the key
systems previously discussed.
EurepGAP, now GLOBALGAP, is a common standard for farm management practices
created in the late 1990s by several European supermarket chains and their major suppliers.
GAP is an acronym for Good Agricultural Practices. The aim was to bring conformity to
different retailers' supplier standards, lack of which had been creating problems for farmers.
It is now the world's most widely implemented farm certification scheme. Most European
customers for agricultural products now demand evidence of EurepGAP certification as a
prerequisite for doing business. The standard was developed using the HACCP guidelines
published by FAO, and is governed according to the ISO Guide 65 for certifications schemes
(Globalgap, 2012).
In 1998, the British Retail Consortium (BRC) with participants, such as TESCO and
Sainsbury, took the initiative to define common criteria for the inspection of suppliers of food
products. The inspections are carried out by certified inspection organisations. Before BRC
was introduced, retailers carried out inspections separately; however, joint inspections reduce
costs. Retailers in other European countries now also demand inspections according to BRC
rules and for accompanying quality reports from their suppliers. The norms of the BRC are
converging with HACCP norms, although more attention is paid to a documented quality
management system, factory environment and facilities, product and process control and
personnel (Trienekens & Zuburbier, 2008).
Safe Quality Food (SQF) aims at quality assurance from a total supply chain perspective. The
SQF program is based on the principles of HACCP and ISO 9000 series norms. SQF has two
norms. SQF 1000 focuses on primary producers, and all other companies are certified
25
according to SQF2000. SQF was developed in Australia and is internationally well accepted.
An advantage is that SQF can be included in the product label (Trienekens & Zuburbier,
2008; van de Spiegel, 2004).
A comparison of different QA systems is shown in Table 2-2. This compares aims, methods,
location in supply chain, and perspectives.
Table 2-2 Differences between QA systems
Source: Adapted from Spiegel, 2004, p5.
2.1.3 Supply chains and quality management
There is growing attention to global supply chain management (Lin et al., 2005). One of
definitions of supply chain management is that it is a holistic and a strategic approach to
demand, operations, procurement, and logistics process management (Kuei et al. 2002). The
effective management of technology and quality is a key to gaining an increased quality and
enhanced competitive position in today‟s global environment. Kuei and Madu (2001) define
supply chain quality management (SCQM) as consisting of three simple components as
follows:
(i) SC: a production – distribution network;
(ii) Q: meeting market demands correctly, and achieving customer satisfaction rapidly
and profitably; and
(iii) M: enabling conditions and enhancing trust necessary to achieve supply chain quality.
26
Some articles offer insights on the critical success factors for traditional quality in a broader
supply chain quality context. Saraph et al., (1989) reported that eight critical factors could be
used for traditional quality management assessment. These factors are the role of top
management leadership, the role of the quality department, training, product/service design,
supplier quality management, process management, quality data and reporting, and employee
relations. Kannan et al., (1998) laid emphasis on supplier evaluation, supplier involvement,
and decentralization of purchasing to enhance supply chain quality. Krause et al., (1998)
identified five factors for supplier selection: quality, delivery, cost, flexibility, and
innovation. Wong et al., 1999, conducted a study on the interaction between manufacturers
and suppliers, and found that factors such as cooperation, trust, and long term relationships
enhance quality among supply chain members. Krause et al. (2000) reported that supplier
performance would determine the long term success of the purchasing firms. Many
purchasing firms have indicated that the critical supplier improvement areas include quality,
delivery, cost reduction, new technology adoption, financial health, and product design.
2.1.4 Conclusion
This Section introduces basic knowledge about quality and quality assurance is the first step
to exploring further areas, such as supply chain and quality management along the chain.
These concepts provide a context for discussing the motivations of firms for adopting QA
systems, external and internal factors influencing adoption, and outcomes firms gained after
adoption.
2.2 Motivation to Adopt QAS’s by Firms
2.2.1 External motivations
The term „motivation‟ is used in this research to refer to the driving forces behind the
adoption of QASs by firms. Motivations are categorized into two types, namely external and
internal ones. External and internal motivation for adopting QAS are indicated in a number of
research studies; for example, motivations to adopt ISO 9000 in the agri-food sector
(Holleran & Bredahl, 1997; Turner et al., 2000; Lloyds Register Quality Assurance, 1995)
and motivations to adopt HACCP (Henson & Northen, 1997; Henson & Holt, 2000) .
External motivations identified include satisfying legal requirements established by national
governments in domestic markets (Henson et al., 1999) or rules imposed by international
customers (that is, HACCP certification is obligatory when exporting food products to
27
developed countries), or requirements of players in the food chain. For example, retailers
often insist that their suppliers have quality system certifications in order to increase
assurance of the supply of safe foods. Therefore, satisfying a legal regulation and customer‟s
requirements are external motivations to adopt QASs that was identified in previous research.
The motivation for adopting a QAS differs among individual firms according to regulatory
and market factors associated with their own particular circumstances. For example, certain
manufacturers may implement HACCP regardless of government regulation, perhaps because
it is the industry norm or is required by major buyers of their products. Others may not be
induced to implement HACCP even if legally required to do so (Henson & Holt, 2000).
Henson & Holt indicate four motives for adoption of a QAS, such as internal efficiency,
accreditation, direct external requirement, and recommended good practice. They noted that
customer requirement is the most important motive for businesses to adopt HACCP in the
dairy sector of the UK. In another study of motivations for seeking a quality system by beef
producers in the UK, Spriggs et al. (2000) report that the reasons for adopting a QAS are to
ensure compliance with government regulations, to ensure compliance with supermarket
regulations, to convince consumers of quality, and to protect large specialist producers.
A reason identified for adopting ISO 9000 is that it was externally imposed by international
and national customers who do not identify high quality suppliers by self- auditing their
production and quality processes. This argument is confirmed by a study among US
businesses which show that the decision to select counterparts is positively influenced when
suppliers have an ISO 9000 registration (Deloitte & Touche, 1994). Ferguson (1996) argues
that many industrial buyers often use the list of ISO registered suppliers as their only source
for identifying potential suppliers. Thus, despite the opinion expressed by early researchers
on quality management that adoption of ISO is not externally mandated or controlled
(Deming, 1986; Ishikawa, 1986 ; Juran, 1982
), the reason for adopting ISO 9000 certification
more recently may be related to a safe way of doing business with suppliers.
Maintaining existing markets and expanding new markets can be motivations for business
firms in competitive global markets to adopt QAS‟s. Hobbs et al. (2002) argue that
maintaining access to the US and other foreign markets are important reasons for Canadian
businesses to make a decision to adopt HACCP. They noted that Canadian firms wishing to
28
export meat, for example, to the United States must have a HACCP system in place although
it is not yet mandatory under Canadian regulations. This situation is also referred to in a study
of Nguyen et al. (2003) on obtaining HACCP and ISO for satisfying requirements of export.
Marketing advantage can provide a major explanation for the adoption of the ISO9000
system. In fact, Juran (1995) argued that the major reason for seeking certification is
maintenance or expansion of markets. ISO9000 certification can be an important marketing
cue, building up trust with industrial customers, and final customers. Research shows that
anticipated marketing advantage, and specifically, increasing market share and providing
access to new markets, have been critical factors that encourage the pursuit of ISO 9000
(Capmany et al., 2000) . In one study, the ability to sustain or increase market share was
ranked fourth and sixth among the top 10 anticipated benefits of ISO 9000 certification
(Skrabec et al., 1997). This finding is also confirmed in the research of Briz et al. (2005) on
motivations for applying ISO 9000 in the SME food industry in Spain, with „increase market
share‟ and „access new markets‟ considered as motivations that were ranked highly.
Unnevehr & Jensen (1998) indicated that firms have incentives for HACCP adoption to
prevent losses of market share when an outbreak occurs.
There are further motivations to adopt a QAS, such as enhancing a company‟s reputation and
image (see Hassan et al., 2009; Khatri & Colins, 2007; Ebrahimpour et al., 1997), increasing
competitive ability and becoming a leader among competitors (see Rao et al., 1997 ; Briz et
al., 2005; Capmany et al., 2000), being mandatory and recommended by corporates, trade
and business (Turner et al., 2000 ; Deohar, 2003)
. While these motivations are highlighted in
these articles, they are not considered as fully as the other motivations mentioned above.
2.2.2 Internal motivations
Internal motivation for firms to adopt a QAS that have been highlighted by some authors are
cost reduction, and improvement of product quality (Ebrahimpour et al., 1997; Deohard,
2003; Hassan et al., 2009; Withers & Ebrahimpour, 1996; Jin et al., 2008). In particular,
motivations of reducing costs and gaining efficiencies in operation have been documented in
a number of studies (Ebrahimpour et al., 1997; Carlsson & Carlsson, 1996; Khatri & Colins,
2007; Seddon et al., 1993). However, it has been noted that ISO 9000 registration can result
in non-value added costs if it is adopted solely on the basis of marketing (Curcovic & Pagell,
29
1999). ISO 9000 registration can be leveraged into a competitive advantage when it is made
consistent with a firm‟s strategic direction (Curcovic & Pagell, 1999). Thus, the willingness
to adopt ISO 9000 can occur if it is perceived by the firm‟s management as important to
competitive success (Withers & Ebrahimpour, 2000).
The adoption of ISO requires the production of extensive documentation, including manuals
specifying who is responsible for quality and how quality is to be achieved, job instructions
explaining how QAS tasks are performed and records proving that the system works
(Curkovic & Pagell, 1999). Also, the production process is documented and then audited to
ensure the process is followed. By following ISO 9000 procedures, an ISO 9000 certified
firm can improve its operational efficiency by reducing product failure rates, improving
management control of the firm activities, familiarizing staff with production, processes, and
through establishing corrective action procedures. Internally driven reasons to adopt ISO
9000 (e.g., to improve operational efficiency or to reduce error rates, wastage, and costs) are
shown in research by Turner et al., (2000). Seddon et al., (1993) studied ISO 9000 firms and
found the internal motivation of cost reduction as one the often cited adoption benefits.
Others argue that lowering the transaction costs between business partners in the value chain
would be an advantageous internal motivation to adopt QAS (Caswell et al., 1998; Holleran
et al., 1999). This has the potential of reducing transactions costs by serving as the seller‟s
guarantee of quality. In particular, transaction costs involved in an exchange between a
customer and supplier may include supplier identification, contract negotiation and contract
verification and enforcement. Some or all of these types of transactions costs may be
potentially reduced, thereby increasing firm and/or sector competitiveness (Holleran et al.,
1999). However, sometimes high costs related to adoption of ISO 9000 may serve as a barrier
to entry, excluding from commerce those firms that can not incur the registration cost or are
uncertain of recouping it (Tsekouras et al., 2002). Several studies have shown that food
producers adopt HACCP in order to satisfy downstream customers in the food chain
(Mazzoco, 1996; Henson et al., 1998).
Finally, profitability is an important factor in the decision for SMEs to invest in a QAS.
Glancey (1998) argues that small firm entrepreneurs typically rely on retained profits as their
primary source of capital for expansion so as to avoid external lenders having a stake in the
30
firm. This implies a positive relationship between profitability and the decision to undertake
further investment. Thus, profitability is expected to have a positive relationship to the
decision to adopt ISO 9000 as a new investment, at least in SMEs (Tsekouras et al., 2002).
Improving quality of product is also an internal motivation to adopt a QAS (Withers &
Ebrahimpour, 2000; Henson & Holt (1999; 2003); Turner et al., 2000; Jin et al., 2008;
Mandonado-Siman et al 2009; Mazzoco, 1996; Bredahl & Zaibet, 1995; Deohar, 2003).
Bredahl & Zaibet (1995) show that most firms who adopt a QAS have seen not only a decline
in transactions cost, but also have experienced improvements related to their production
processes and final product. Fearne et al. (2001) argue that motivations to adopt QAS‟s are to
obtain goals such as a safety and quality guarantee. In this regard, it was found in recent
research in India and China that improving product quality is an important motivation to
adopt HACCP by firms in the agri-food sector (Deodhar, 2003; Jin et al., 2008). Conversely,
research in the UK found that firms seeking to improve operational efficiency may view a
QAS, such as ISO 9000, as a tool to improve internal operations (Holleran et al., 1999).
Walgenbach (2007) in his qualitative interviews found that internal motivation is enhancing
business processes. Ebrahimpour et al., (1997) indicated that „improving product quality‟
motivation is ranked high among motivations to adopt ISO 9000. Further, other internal
reasons for firms to adopt a QAS are improving operational efficiency and reducing
production costs (Henson & Northen, 1999; Henson & Holt 1999; Turner et al., 2000; Lloyd
Register Quality Assurance, 1995; Madonadon-Siman et al., 2009; Nguyen et al., 2004) and
being recognized as employing “best practice‟, a „good system‟, and new technology and
innovation (Henson & Holt, 1999; Herath & Henson; Deohar, 2003; Miles et al; Jayasinghe-
Mudalige & Henson; Mandonado-Siman, 2009).
Studies on QA systems and quality assurance devoted to the dairy industry are very few, even
in developed countries. For example, in the EU, there are studies on dairy supply chain and
coordination regimes, the role of foreign direct investment (FDI) with changes of chains
(Dries et al., 2004), but not specifically in quality management. In the UK, an exemption was
Henson and Holt (2003), who studied the motivation of dairy firms to adopt HACCP, which
indicated that four broad motivations - internal efficiency, accreditation, direct external
requirement and good practice existed-for the adoption of QAS‟s. With respect to the dairy
industry, Beekhuis-Gibbon et al., (2011) studied implementation of a HACCP based-system
to prevent and control mastitis in dairy herds in Ireland; Karaman et al, (2012), studied
31
barriers and benefits of the implementation of HACCP in the Turkish dairy industry, but at
more technical level, not managerial approach. In New Zealand, one study on HACCP/RMP
and export performances for meat sector was undertaken by Cao (2007).
Thus, in summary, motivation to adopt quality assurance systems may be external or internal,
with major external motivations including satisfying legal regulations, and maintaining and
expanding markets, while major internal motivations are reduction of costs, and improvement
of quality. Adopting a QAS can also provide a means of selecting high quality suppliers and
reducing the transaction costs of dealing with them. However, motivations to adopt QAS‟s
are diverse and they may differ between individual firms, across countries, as well as sectors
within the food industry. Much of the research reported here is focused on individual QAS‟s,
and there is not a comparison between QAS‟s, so it is difficult to draw conclusions.
Furthermore, many of the results report evidence from the developed economies such as the
US, Canada, and UK, and it is not clear how these results apply to emerging economies, such
as Vietnam.
Although these previous studies have provided a good insight into the motivations for food
processors to adopt QASs, they are subject to some limitations. They often disregard the
context within which a firm operates (Manchester Business School, 1996). In the following
section, literature on these context factors is explored more fully.
2.3 Adoption of QAS’s and the External Environment
2.3.1 Introduction
The term „business environment‟ or „organizational environment‟ is often used
interchangeably in strategic management literature to mean the macro environment, industry
environment, and internal environment (see Figure 2-3) (Worldwide Learning Limited,
2007); or the macro environment, and intermediate environment (Worthington & Britton,
2006).
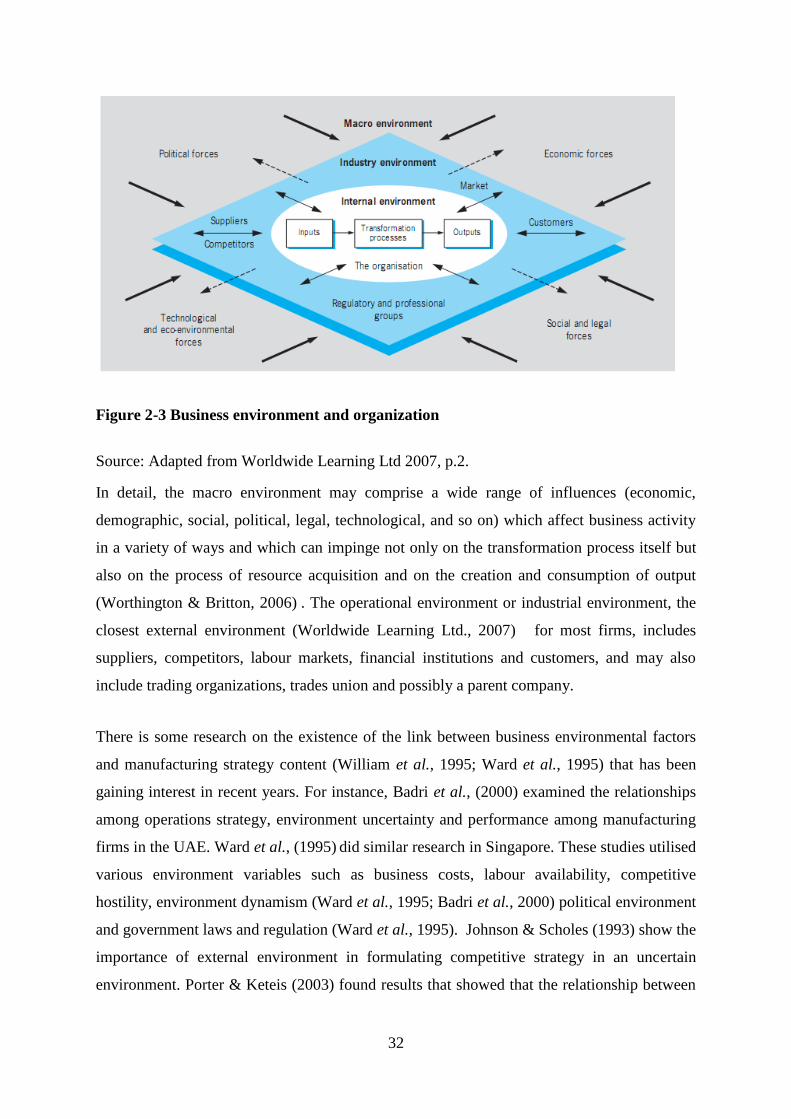
32
Figure 2-3 Business environment and organization
Source: Adapted from Worldwide Learning Ltd 2007, p.2.
In detail, the macro environment may comprise a wide range of influences (economic,
demographic, social, political, legal, technological, and so on) which affect business activity
in a variety of ways and which can impinge not only on the transformation process itself but
also on the process of resource acquisition and on the creation and consumption of output
(Worthington & Britton, 2006) . The operational environment or industrial environment, the
closest external environment (Worldwide Learning Ltd., 2007)
for most firms, includes
suppliers, competitors, labour markets, financial institutions and customers, and may also
include trading organizations, trades union and possibly a parent company.
There is some research on the existence of the link between business environmental factors
and manufacturing strategy content (William et al., 1995; Ward et al., 1995) that has been
gaining interest in recent years. For instance, Badri et al., (2000) examined the relationships
among operations strategy, environment uncertainty and performance among manufacturing
firms in the UAE. Ward et al., (1995) did similar research in Singapore. These studies utilised
various environment variables such as business costs, labour availability, competitive
hostility, environment dynamism (Ward et al., 1995; Badri et al., 2000) political environment
and government laws and regulation (Ward et al., 1995). Johnson & Scholes (1993) show the
importance of external environment in formulating competitive strategy in an uncertain
environment. Porter & Keteis (2003) found results that showed that the relationship between
33
firms and the local business environment depends on synergy between social and economic
objectives and is influenced by factors from the external environment.
Along with this relationship between elements of strategic management and environment
factors, research has focused on the relationship between environmental factors and adoption
of QAS‟s. In the following section, the literature on the influences of external environment
factors on the adoption of QAS‟s is presented.
The environmental context is the domain in which an organization operates, involving factors
related to competitors, industry sector, governmental agencies, and environmental
uncertainty. These factors may encourage or impede innovation adoption (Chau & Tam,
1997; Tornatzky & Fleischer, 1990). In another perspective, Holleran et al., (1999) comment
that market power of suppliers and customers, the legal environment, and the degree of
involvement in international markets are forces affecting a firm‟s decision to seek
certification for a quality assurance system. Further, Anderson et al., (1999) have investigated
the economic and political forces that influence a manager‟s decision on QAS‟s. For instance,
he noted that ISO 9000 is a better quality management tool for some industry and competitive
situations than for others.
2.3.2 Legal and regulatory forces
The legal environment is a force affecting a firm‟s decision to seek certification to a QAS.
Another important force is the degree to which regulations are enforced. For instance, the
1990 Food Safety Act (FSA) significantly affected QAS diffusion in the UK food sector
(Holleran et al., 1999).
In regulating businesses by way of public legislation, Stigler (1971) noted that governments
force businesses to operate within certain constraints. For example, with certain legislation
related to food safety, business firms often demonstrate a commitment to their assurance of
safe products (Unnevehr & Jenson 1999), thus satisfying a public policy goal that places food
safety enhancement as a top priority to avoid loss to society. However, in practice, firms
strive to maintain or improve both safety and quality attributes together and such efforts are
closely interrelated and most likely are managed as the whole (Herath et al. 2007).
34
Regulation has become a major element of the environment in which firms operate. This
element constrains a firm‟s strategic behaviour. Marcus (1984) reports three main strategic
choices faced by a firm in general in it its response to regulations (i) stonewalling –where the
firm attempts to ignore the problems created by the regulation; (ii) opportunity seeking-where
the firm sees the regulation as an opportunity to gain competitive or other advantages; (iii) a
mixed strategy-where new product development and heavy marketing might characterize a
firm‟s response, which may be in a new area for the firm.
With respect to quality, firms‟ intentions to obey regulations controlling safety and quality of
product can depend on a range of factors. According to Pelzman (1976), firms may attempt to
adapt the regulatory process in an attempt to gain strategic advantage. In this regard, Hooker
et al., (2002) examine meat processing firms operating in Texas in the USA, and argue that
firms were restructuring the facility and staff to comply with HACCP regulations of the
USDA. According to Rugman & Verbeke (1998), a response of firms to be in compliance
with regulation depends on the expected economic benefits. They suggest that a firm may
choose to comply voluntarily with regulation if it is triggered by „market –based incentives‟
such as first mover advantage. However, in many cases, compliance with regulation depends
on the strength of the enforcement authorities, i.e. regulatory incentives. In the case of the
food processing sector, Henson & Heasman (1999) show that enforcement could play a very
different role in the regulatory process for assuring safety of food.
The regulatory environment in a particular country may provide an incentive for firms to
adopt a particular QAS so that legal obligations can be met (Holleran et al 1999). For
example, European public policy can influence the external business environment and
consequently anything related to the adoption and application of QAS‟s in small food
enterprises. The level of public interest in human health and quality of life, social welfare,
employment, and competitiveness can determine the type and intensity of measures,
including public policy. Because these issues are influenced by the application of QAS‟s in
enterprises, governments have a strong incentive to pay attention to this fact and to contribute
to the diffusion of QAS application in a larger number of small food enterprises (Antle,
1996). Firms within the processing sector can also find that they are subject to different
regulations at the federal, provincial and/or municipality levels (see Wolf 1986, 1979).
35
Studies of firms‟ compliance to governmental regulation have found conflicting results (Cole
& Somners, 1981; Baron & Baron, 1980). Many of these studies have only focused on the
impact of food safety legislation on food processing firms operating in developed countries
(Caswell & Johnson, 1991; Henson & Heasman, 1999 ). However, the interrelationship
between regulation activities of government and the strategic behaviour of firms, including
their adoption of QAS‟s, is not well researched in the literature in the context of processing
sectors in emerging economies.
2.3.3 Market factors
Some studies indicate that there is an association between the markets a firm serves and
quality assurance system adoption. Dumicic et al. (2005), in his study of implementing ISO
as a QAS in firms in Croatia, argue that market structure and implementation of QAS are
related, and that firms having foreign markets are more ready to adopt and implement QAS
than other firms having domestic and regional markets. Similarly, HACCP is used by
Canadian firms exporting their products to the US (Hobbs et al., 2002), and by exporters in
developing countries exporting to the EU (Jaffee & Masakure, 2005). In addition, domestic
market characteristics, such as level of income, patterns of consumption, consumers‟
educational levels, consumers‟ perception of safety and quality of products may lead to an
incentive to adopt a QAS, and so be of interest by firms if they wish to conquer such markets.
There is no doubt that food and agribusiness firms have, increasingly, to deal with
competitive markets in which meeting customer requirements for produce and services, and
efficiency and reliability of their delivery becomes a key aspect for competitiveness. As a
result, it has been observed that firms are implementing QAS, i.e. ISO 9000, TQM, (Ziggers
& Trienkens, 1999). Market specific characteristics can influence the adoption of QAS, and
firms serving province, inter province, or foreign markets may pay different attention to
whether to adopt a QAS or not (Jayasinghe-Mudalige & Henson, 2004).
Business partners‟ pressure is another factor that can influence adoption of a QAS in a firm.
When a firm operates in the food chain environment, they have competitors and partners,
including suppliers and retailers. Partnership can be either transactional or cooperative, and
can be characterised as a „regulatory‟ system in order to establish an efficient and reliable
flow of transactions (Ziggers &Trienkens, 1999). Thus, major and large business partners
often recommend or request their suppliers to have a particular QAS, because they are not
36
able to trace the quality and safety of products firms supply. Therefore, most QAS‟s have the
status of „a license to operate‟ in most businesses (Walgenbach, 2007). This factor has been
termed „pressure of customer‟ in previous research (Terziovski et al., 2003; Chow-Chua et
al., 2003; Maritnez-Lorente & Martinez-Costa, 2004). In this regard, one study notes that,
since the incidence of food borne diseases and food risks is perceived to have increased,
quality awareness of customers is also increasing. That leads to high demand for quality and
safe products. As a result, the supply chain linkage has changed, as retailers require suppliers
to guarantee quality and safety and request suppliers to have a QAS; for instance, HACCP
(Spiegel, 2002). In contrast, Taylor and Kane (2005) found that lots of small food industries
are poorly encouraged by their customers to apply the HACCP system, because their food
market is basically small scale with local clients and a high number of retailers.
The degree to which contracts are enforced also influences the decision to adopt a particular
quality assurance system. Such contract pressures force firms to demonstrate the safety of
their products on an on-going basis, necessitating the internal analysis of raw materials and of
the products (Holleran et al., 1999).
In developing countries, production systems tend to be extremely diverse, and often have
many small scale, unorganized producer and informal markets. The food sector is rapidly
evolving in these countries. The food processing industry is often fragmented, and there is
little purchasing power in terms of consumer demand for food considered safe (FAO, 2003).
However, growth of supply chain partnerships may lead to customers having safe food, by
increasing coordination and tightening relationships, thus gradually changing quality
assurance to reduce transaction costs.
2.3.4 External support
External support refers to factors outside of firms, such as government and related
organizations‟ and agencies‟ support, for training and resources, etc. This factor may
encourage or impede adoption of a QAS in firms (Premkumar & Robert, 1999). Cole (1985)
concluded that the Japanese government was a key player in the diffusion of quality systems.
In other examples, the Indian government has supported companies that want to obtain
quality systems certification, through subsidizing a part of setting-up costs when a business
registers to adopt a quality assurance system. A QAS will be easier for a firm to adopt in the
37
country where the government offers encouragement. For instance, in Singapore, government
offered support for ISO 9000, and in Greece, the Greek Ministry of Development, via a
blueprint for an increase of competitiveness in small and medium Greek enterprises,
financially supported SMEs with implementing and certifying a QAS, according to ISO 9000
requirements (Aggelogiannopoulos et al., 2007). This type of external support may be
relevant for dairy food businesses in Vietnam, since most dairy firms are small and medium
sized with limited resources, both financial and human. External support might come from
trading associations as well as government. Variable degrees of trading association support
were highlighted in a study of Deodhar (2003). More recently, Jouve (1994) considered as
very important, the trade association‟s role in supporting and promoting a HACCP system for
small businesses.
In summary, external environment factors, including legal and regulatory forces, market
factors, and external support may be important variables to research with respect to their
influences on the adoption of QAS‟s in firms.
2.4 Organizational Characteristics and Adoption of QAS
2.4.1 Introduction
Generally speaking, „organizational characteristics‟ is a broad term referring to all firm-
related characteristics, but the term is used differently in different research. However, the
term „organisational characteristics‟ commonly includes discussion on firm size, goods
produced, the nature of the business, type of production system, ownership structure and firm
location (Fouayzi et al., 2006; Jayasinghe-Mudalige & Henson, 2004), and financial
characteristics (Herath et al., 2007). It can also include managerial characteristics and
organisational structure (Damanpour, 1987).
In a more general sense, a number of the authors have identified organizational characteristics
that encourage innovation adoption within an organization (Rogers, 1995). While much
research has examined the influence of organizational characteristics, it has been argued that
there remains a gap relating to the lack of consensus regarding the role of specific variables in
facilitating or impeding innovation adoption (Damanpour, 1991). Therefore, further research
38
on the association between organizational characteristics and innovation adoption in the form
of quality assurance systems, would be useful.
2.4.2 Size of firm
In the literature, there is some evidence of a relationship between firm size and the adoption
of a QAS. For example, recent studies indicated that incentives for ISO 9000 adoption differ
depending on firm size (Holleran & Bredahl, 1997; Lloyds Register Quality Assurance, 1995;
Seldon et al., 1993), and for HACCP adoption (Antle, 1996; MacDonnald et al., 1996;
Anderson & Lee, 2001; MacDonald & Crutchfield, 1996).
Small firms have often been slow to adopt QA systems (Brown & Loughton, 1998; Yusof &
Aspinwall, 2000). Firm size directly affects certification costs, which, in turn, affects the
ability of a firm to undertake certification. One of the main criticisms of ISO 9000
certification is that it really addresses large companies that have not only the required
financial resources, but also the skilled workforce and the competent management able to
document the scheme, carry out changes and audit the new processes (Tsekouras et al.,
2002). Likewise, Celaya et al. (2007) found firm size had a favourable influence on HACCP
adoption when consisting of firms that had more than 50 employees in relation to firms with
less than 50 employees.
Small firms‟ resources are more limited than those of large firms. Small firms may not have a
quality assurance office, so staff resources may need to be diverted to QAS adoption to
complete the paperwork, implement the systems and maintain the system. Implementing ISO
9000 typically forces small firms to allocate proportionately more resource to implementation
of this system than large firms (Holleran et al., 1999). As a result, it is not surprising to find
study results that indicated that larger firms are more likely to adopt QAS than small firms in
the dairy sector in Poland (Pieniadz & Hockmann, 2007).
However, some studies on the relationship between firm‟s size and adoption of QAS‟s
indicate contrasting results. As expected, several authors have suggested that the
implementation of QAS is size dependent (Ghodbadian & Gallear, 1996; Seldon et al., 1993,
Holleran et al., 1999) and others note that ISO is positively linked to firm size (Adam, 1999;
Garr et al., 1997). However, results from another study did not find significant differences in
39
seeking ISO 9000 in terms of firm size (Briz et al., 2005). Thus, research to determine
whether this association holds in the Vietnamese dairy processing sector would be useful.
2.4.3 Top management support
In addition to the firm size factor, another factor that possibly affects the adoption of quality
assurance systems is top management support. To obtain quality results, it has been noted that
the initiative must be taken at the highest managerial levels (Vasconcellos, 2004). Top
management support and commitment has a vital role when adopting a quality system, since
they will be responsible for identifying the main process needed for a quality system and its
application throughout the organization (Aggelogiannopoulos et al., 2007). They will also
establish suitable performance indicators for each of the main processes of the organization in
order for them to be monitored and measured (Geraedts et al., 2001).
Top management commitment is also important for the success of a quality initiative that has
been implemented. For instance, according to the guide for implementing ISO 9001: 2000,
the top management (managing director or chief executive) must demonstrate a commitment
and a determination to implement the quality system in the organization. Without such top
management commitment, no quality initiative can succeed.
Commonly, decision making starts from top managers on the basis of a cost-benefit analysis
of adopting a QAS. Top managers will have a good understanding of the expected and
potential benefits of adopting such a system (that is increase in sales, less rejects/product out
of specification/rework product, and so on) (Khatri & Collins, 2007). Management support
may take several forms, such as providing strategic vision and directing various levels of the
organization towards the importance of an innovation (Ramanurthy & Premkumar, 1995),
and also refers to “the continual active and enthusiastic approval of senior executives for a
proposed innovation” (Sultan & Chan, 2000, p. 111).
In this regard, Kaynak (2003), and Spiegel (2002) indicated that successful implementation of
quality assurance systems also require an effective change in organisational culture, which is
almost impossible without concentrated management support. The management of firms can
show such support by establishing both organizational and technical systems to communicate
internally and externally about their quality performance (Beulens et al., 2003).
40
Thus, top management support is a critical issue in innovation adoption and deployment (Teo
et al. 1998). They do this through providing a supportive climate and adequate resources
(Premkumar & Robbers, 1999; Rogers, 1995; Sultan &Chan, 2000; Zmud, 1984) .
Characteristics of top management can also affect the decision to adopt a new QAS. For
instance, previous studies identified the educational level of top managers, their skills and
awareness, and their ability to manage risks after a decision (Papadakis & Barwise, 2002) as
important factors. There are also research studies on the impact of the top manager on
strategy decision making (Kauer et al., 2007; Papadakis & Barwise, 2002). Thus, human
characteristics pertaining to the management of a firm like age, level of education, and risk
tolerability, and so on, are thought to have an impact on the decision of a firm, both implicitly
and explicitly, to adopt a QAS or not (Caswell et al., 1998).
2.4.4 Organisational structure
Three properties of organisational structure - formalization, centralization, and complexity –
have been identified in previous business organization research (Choi, 2002; Damanpour
1991). Formalization refers to the degree to which decisions and working relationships are
governed by formal rules, standard policies and procedures (Holsapple & Joshi, 2001). It
includes „the degree to which an organization emphasizes following rules and procedures in
the role performance of its members (Rogers, 1995, p.380), and implies that all procedures
for a quality standard is written, and unit responsibility is assigned to divisions of
departments. If this occurs, the potential of adopting a QAS become easier. For instance, if
the firm has a quality division and has experience in a particular QAS, it is easier to
implement another QAS. Most innovation research reports formalization to be positively
associated with the adoption of innovation (Moch & Morse, 1977; Zmud 1982).
Centralisation refers to the place in the organization where decisions are made, and defines
the groups that have the power to contribute to the decision making process (Neil, 2006).
That is, it identifies which organization members participate in decisions associated with
strategies, policies and allocating resources (Hage & Aiken 1967). Likewise, it is „the degree
to which power and control in a system are concentrated in the hands of relatively few
individuals (Rogers, 1995, p.379). This can also be referred to as the locus of decision
authority and control within an organizational entity (Caruane et al., 1998). Concentration of
41
power in a group of persons may contribute to a fast decision to adopt a new innovation such
as a QAS. Prior research findings vary with regard to the influence of centralization on
innovation adoption (Rogers, 1995; Zmud, 1982). While some authors have found a negative
influence (Damanpour 1991; Grover and Goslar 1993; Moch & Morse, 1977), others have
found an insignificant relationship between centralization and adoption of innovation (Lai &
Guynes, 1997).
Complexity entails “division of labor, job titles, multiple divisions, and hierarchical levels”
(Hall, 1992, p. 50). In a complex organization, tasks are divided (horizontal complexity),
supervised (vertical complexity), and dispersed to field or branch offices (geographical
complexity). Complexity is comprised of horizontal and vertical differentiation, where
horizontal differentiation refers to the number of different positions and different sub units in
the organization and vertical differentiation refers to the number of job positions between the
top layer and those involved with the actual production of output and the greater the number
and diversity of occupations, the greater the complexity.
The influence of organizational structure on decisions has been shown in studies of
relationship knowledge management and organizational structure, and organizational
performance (Choi, 2002); adoption of new innovations and organizational structure
(Damanpour, 1991), and quality and firm performance and firm structure (Spiegel, 2004).
Specific research on the impact of this factor on the adoption of QAS‟s would be useful.
2.4.5 Nature of firm and product
The financial situation of a firm may be seen as a factor that affects a decision whether to
adopt a QAS or not, and one study does indicate that the financial status of a firm will have
an impact on its decision to adopt a QAS (Antle, 1996). Commonly, investing in obtaining
and maintaining QAS‟s in a firm is acknowledged to be a strategic instrument in both food
marketing and production (Achterbosch & van Tongeren, 2002), which indicates a long term
perspective. For a company with an adequate financial budget, investment in a QAS is a
small item, but for other firms lacking financial resources, investment in a QAS becomes
more difficult. Specific variables related to a firm‟s financial status that are used commonly
in the studies on impact of organizational factors on the adoption of a QAS are fixed assets
42
value, ratio of turnover per fixed assets value (see Herath, 2007; Hassan et al., 2009), and
average annual revenue (Teo et al., 2009) .
Production processes have a number of specific characteristics that affect product quality and
quality assurance; for instance, dairy products require cooling, storage and transport. Where
product has a high risk of being unsafe, then measures for addressing this would receive more
attention and be rapidly introduced. In addition, quality variations can appear among
producers and different lots of produce (Trienkens & Zuurbier, 2008) . This can create issues
in adopting a QAS, since factors related to product quality and safety variations have to be
addressed. Research has been conducted on exploring differences in adopting and
implementing QAS‟s across sub-sectors in the food industry, such as fruit, vegetables, cereal,
and wine (see Canavari et al., 1998) ; and food processing and services (Jin et al., 2006), or
with particular products of firms (Jayasinghe-Mudalige & Henson, 2004).
Other characteristics are also important factors such as age of firms, experience in alternative
QAS application. Type of production activities (Herath et al., 2007; Hassan et al.,2009; Cao,
2008), type of ownership (Ebrahimpour et al., 1997; Henriques &Sadorskey, 1996;
Jayasinghe-Mudalige & Henson, 2004; Salahedin, 2007), and customers of firms
(Jayasinghe-Mudalige & Henson, 2004) are shown in studies on relationships between firm
characteristics and adoption of QAS.
In conclusion, organisational characteristics variables that are highlighted in previous studies
are very diverse. However, major variables such as firm size, top management, organisational
structure, and financial and product nature have been shown to affect the adoption decision of
firms to a greater or lesser degree. A study integrating all these variables in the decision to
adopt a QAS would be useful.
2.5 Impact of an Adoption of QAS’s on Organisational Outcomes
2.5.1 Introduction
The definition of successful business performance is a controversial issue in management,
largely due to the multidimensional meanings and goals that have been assigned to this term
(Murphy et al., 1996). Financial performance is at the core of organisational effectiveness
(Chakravarthy, 1986), while operational performance measures such as product quality and
43
market share define a broader conceptualization of organisational performance by focusing
on factors that ultimately lead to financial performance (Hofer & Sandberg, 1987).
One of the challenges in measurement of firm performance is that measured performance on
the basis of firm specific objectives means that performance measures are difficult to
compare. Most measures of performance tend to focus on enterprise shareholders‟ profits. In
order to control for firm size, profits are related to sales, assets, or equity. The majority of
empirical studies (Hatten & Hatten, 1985; Strandskov, 1999) use return on assets (ROA), and
within industry, return on sales, as an established measure of profitability (Vorhies &
Morgan, 2005). However, profitability has the disadvantage of neglecting dynamic aspects of
firm success. Some studies, therefore, use growth indicators such as change in sales (CIS)
(Morgan & Strong, 2003; Strandskov, 1999), or value of total sales, and thus, growth of total
sales (Havnes & Senneseth, 2001). Anderson & Sohan (1999), in a study examining the
impact of TQM application on business performance of furniture companies in Australia,
used four measures for business performance: sales variance, return on assets, sales volume,
and market share. Martinez- Costa et al (2008)
used two variables for examining
performance, which are ROA and productivity of firms, before and after adopting ISO 9000.
Some other studies using measures for financial performance such as sales (Corbett et al.,
2005) , market share (Forker et al 1996), ROA or ROS (Corbett et al., 2005; Forker et al.,
1996), return on equity (Staw & Epstein, 2000), return on investment (Forker et al 1996),
income (Easton & Jarell, 1998), and income over assets and over sales (Lima et al., 2000) .
Often research on the impact of adoption of a QAS on organisational outcomes has aimed at
assessing the financial performance benefits for firms from QAS‟s, such as ISO 9000
adoption, and a body of literature that studies the effects of ISO 9000 share the general
assumption that ISO 9000 adoption will improve an organisation‟s financial performance
(Naveh & Marcus, 2005; Simmons & White, 1999). Prior research highlights two possible
sources of performance improvements from ISO 9000. One of these is from cost reduction,
and another is from quality improvement (Withers & Ebrahimpour, 2000; Curkovic,1999).
2.5.2 Adoption of QA systems and firm’s performance
There are a number of studies on the impact of adoption of a QAS on a firm‟s performance
(Rayner & Porter, 1991; Ebrahimpour et al., 1997; Askey & Dale, 1994; Anderson et al.,
44
1999 ; Meagan & Taylor, 1997; Withers & Ebrahimpour, 2000)
. However, there is still no
general agreement regarding the effects of any particular QAS, such as ISO 9000, on firms‟
performance. One perception seems to be that it has no positive influence (Simmon, 1999;
Terziovski et al., 1997; Wayhan et al., 2002). However, there are also some optimistic views
Romano, 2000 ; Withers & Ebrahimpour, 2001. In particular, Naser et al. (2004)
found that
there is association between ISO 9000 certification and the financial performance of
Malaysian companies. The experience in Singapore shows that ISO 9000 certification has
provided significant benefits to companies, and many organizations trying to adopt TQM
have chosen ISO 9000 as a stepping stone towards TQM (Quazi & Padibjo, 1997).
Some authors studied costs and benefits of certification and claim that investment in a QAS
may be a burden without adequate returns for some firms (Martin & Anderson, 2000; Antle,
1999). Others examine whether the effects of adopting a QAS are significantly different for
companies in different sectors or of different sizes (Caswell et al., 1998). However, if
consumers reward firms for supplying safe products, then one would expect a positive
correlation between the adoption of a QAS and firm‟s performance.
Guilhon et al., 1998 surveyed 42 French firms regarding ISO 9000 certification and reported
that the quality program had improved organizational performance (commitment and process
quality) but had not significantly improved financial performance (sales, market share, and
profit). However, they noted that a large proportion of the sample was in the process of
certification and this could have accounted for their findings. Anderson & Sohal (1999)
surveyed 670 small businesses in Australia, and reported that quality practices and
procedures were perceived to have the highest impact on the overall competitiveness of the
business, followed by sales, market share, employment levels, and cash flow.
Recent empirical studies have concluded that the most important benefits sought from ISO
9000 are profit improvement, and marketing benefits (Wayhan et al., 2002; Eklof et
al.,1999). Buttle (1996) surveyed 1,220 certified UK companies, and found that improving
operations and marketing gains were claimed by most of the firms following quality
certification. Similar findings were found by Casadesus et al., (2000) in the study of 500
Spanish firms. Moreover, financial benefits have been found in certified companies; they had
a significantly higher rate of return than before they were certified (Heras et al., 2002).
45
Similarly, Capmany et al., (2000) surveyed 325 firms and results showed that the key
changes for agribusiness and the other industries were increases in customer satisfaction,
product traceability, information quality, and sales. Turner et al., (2000) surveyed 32 agri-
firms in South Africa and concluded that certification had a positive impact on document
process, overall firm performance, and quality of output. In this regard, Uyar (2008) studied
102 industry enterprises in Turkey, and his findings indicated that implementing a QAS
correlated significantly positively with profitability, with companies that implement QAS
being more likely to have higher profitability ratios than companies that do not implement a
QAS.
Hassan et al., (2009) provides some evidence that the adoption of food safety and quality
systems is positively associated with a firm‟s performance. In particular, their results suggest
that adoption intensities and market shares are closely linked. In this regard, Hassan et al.,
(2009) noted that QAS adoption is positively associated with market share and productivity
level. Caswell et al., (1998 ), and Holleran et al. (1999)
discuss the importance of lowering
transaction costs that resulted from adoption of QAS‟s, i.e. ISO 9000 and HACCP. Khatri &
Colins (2007) found that, when HACCP was adopted in Australian businesses, it had a
positive impact on market share.
Bocker et al. (2003) investigated whether ISO 9000 certification does affect firm‟s
performance. The quality manager of a sample of 27 British agribusiness firms rated a set of
13 performance indicators. Most firms rated the impacts of certification positively. The
authors also concluded that the adoption of quality assurance systems is of key importance
for the competitiveness of agribusiness firms. In another agribusiness study, Maza & Ramirez
(2003) examine the effects of ISO 9000 certification on the Spanish agribusiness sector. They
concluded that the adoption of ISO 9000 impacted positively on the quality of units produced
and profit margins.
2.5.3 Adoption QA systems and product performance
There are some studies on the impact of QAS‟s on product quality itself. Rayner and Porter
(1991) reported that 75 percent of the UK firms in their study claimed product quality had
improved. Other studies indicate that ISO 9000 results in the perception of higher quality
(Zhu & Scheuermann, 1999; Sissell, 1996), but it is argued that this outcome would seem to
imply only that the certification effort has served as a public signal that quality management
46
is being practiced (Anderson et al., 1999). In this context, Sun (1999) investigated ISO 9000
certification in Norwegian companies and found that it was significantly correlated with
quality results, especially the reduction of defective products and customer complaints.
Further, Turner et al., (2000) also found that ISO 9000 certification by African agribusinesses
has an impact on quality of output, and a decrease of error rates.
Withers & Ebrahimpour (2000) discuss adoption of ISO 9000 by businesses in the
manufacturing sector in the US and its effect on the firm‟s product quality using eight
dimensions suggested by Garvin (1987) and a five point scale for assessing. They found
mixed results with some dimensions of quality much improved, but some had not improved
after adopting ISO 9000.
There is not much research on the impact of HACCP and GMP on product quality
improvement, although Khatri & Colins (2007) are exception to this. Their results show that
the benefits of food safety systems incorporating HACCP within the meat industry in
Australia have been widespread and significant. In particular, Australian firms reported a
reduction in rejects/rework/out of specification products, reduction in customer complaints
and an increase in improved product hygiene.
Product quality is also included in some other studies, and it is measured in different ways.
Some measure performance with a combination of different operative results obtained by the
firm, together with financial and product quality measurements. In this sense, Teriovzski et
al., (1997) use operating performance (product quality, timeliness, and productivity),
customer satisfaction, employee morale, and business performance.
In summary, some prior studies have examined the impact of QAS adoption on business
performance. However, most of them focus on the ISO 9000 scheme rather than other QAS‟s,
such as HACCP, and there appears to be no research that compares and contrasts outcomes
from adopting particular QAS‟s. Studies have considered the relationship between adopting
QAS‟s and firm performance, rather than emphasizing the adoption of QAS‟s and outcomes
related to product quality improvement. Therefore, a study conducted with different quality
assurance systems will be useful, especially for the Vietnamese food industry, and
particularly, the dairy processing sector.
47
2.6 Chapter Summary
The QAS‟s applied in the agri-food industry are diverse, but those related to quality and
safety management are GMP, HACCP and the ISO series. The universally accepted
definition of quality incorporated into ISO and ASQ focuses on satisfying and exceeding
expectations of the customer.
These QAS‟s have been applied in various sectors aiming at assuring quality and safety of a
product or service. Much research has attempted to find motivations for firms to adopt a QAS
and these can be categorized into external and internal drivers. The major external
motivations are satisfying legal regulations and maintaining and expanding markets, and
major internal motivations are reduction of costs, and improvement of quality, efficiency in
operations, and as a consequence, enhancement of the competitive ability of firms.
Motivations to adopt QAS‟s by individual firms are diverse and could vary across countries,
as well as sectors, within the food industry.
Although prior studies have provided a good insight into the motivations for food processors
to adopt QASs, they are subject to some limitations in the context of this particular study.
Much of the research is focused on separate QAS‟s, and there is little comparison between
QAS‟s, so it is difficult to draw conclusions. Furthermore, results are more applicable to
developed economies such as the US, Canada, and UK, and it is not clear how these results
apply to emerging economies, such as Vietnam. Finally, much research has been conducted at
the firm level, but there is very little information on the impact chain level factors on the
firm.
Therefore, there is a need for a study that takes greater account of all factors (i.e. internal and
external) that impact on the outcomes of dairy processors decisions to adopt of particular
QAS. The context within which a firm operates can underlie motivation and so impact on the
decision to adopt a QAS. External environment factors, including legal and regulatory forces,
market factors, and external support may be important variables to research with respect to
their influences on adoption of a QAS by firms. Research on such factors has been
undertaken in other fields, such as manufacture, IT, service, but is sparse in the food industry
in emerging economies.
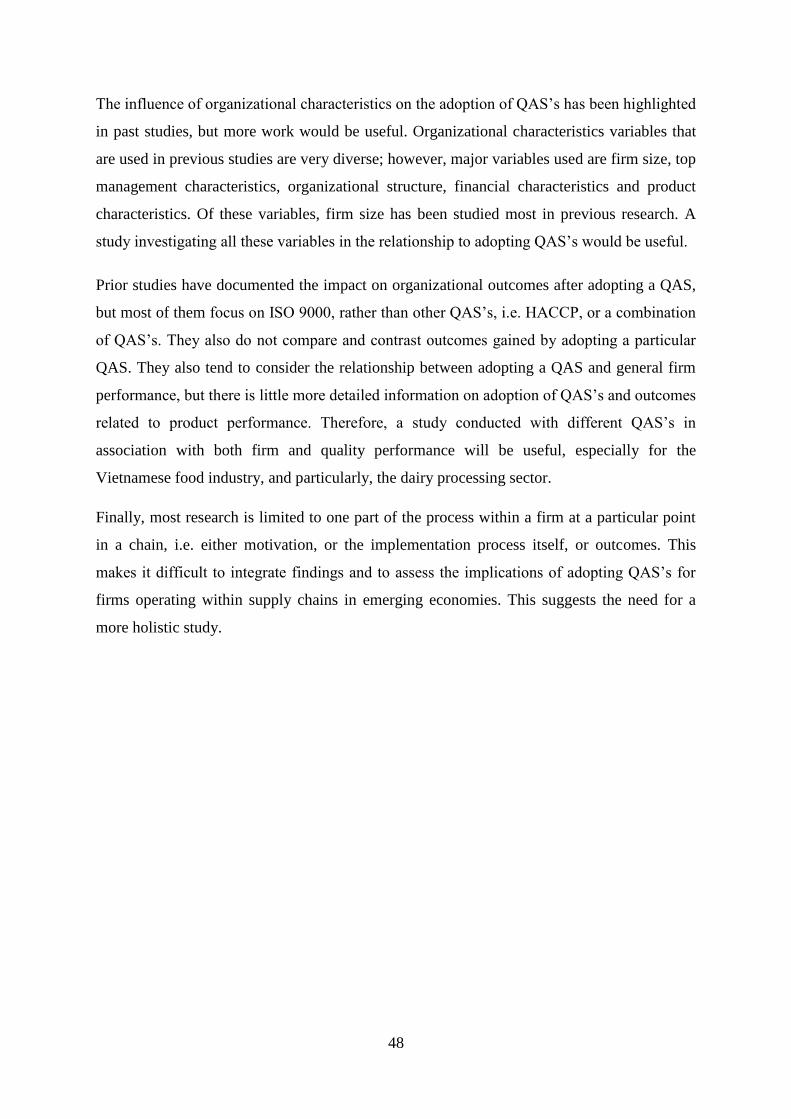
48
The influence of organizational characteristics on the adoption of QAS‟s has been highlighted
in past studies, but more work would be useful. Organizational characteristics variables that
are used in previous studies are very diverse; however, major variables used are firm size, top
management characteristics, organizational structure, financial characteristics and product
characteristics. Of these variables, firm size has been studied most in previous research. A
study investigating all these variables in the relationship to adopting QAS‟s would be useful.
Prior studies have documented the impact on organizational outcomes after adopting a QAS,
but most of them focus on ISO 9000, rather than other QAS‟s, i.e. HACCP, or a combination
of QAS‟s. They also do not compare and contrast outcomes gained by adopting a particular
QAS. They also tend to consider the relationship between adopting a QAS and general firm
performance, but there is little more detailed information on adoption of QAS‟s and outcomes
related to product performance. Therefore, a study conducted with different QAS‟s in
association with both firm and quality performance will be useful, especially for the
Vietnamese food industry, and particularly, the dairy processing sector.
Finally, most research is limited to one part of the process within a firm at a particular point
in a chain, i.e. either motivation, or the implementation process itself, or outcomes. This
makes it difficult to integrate findings and to assess the implications of adopting QAS‟s for
firms operating within supply chains in emerging economies. This suggests the need for a
more holistic study.
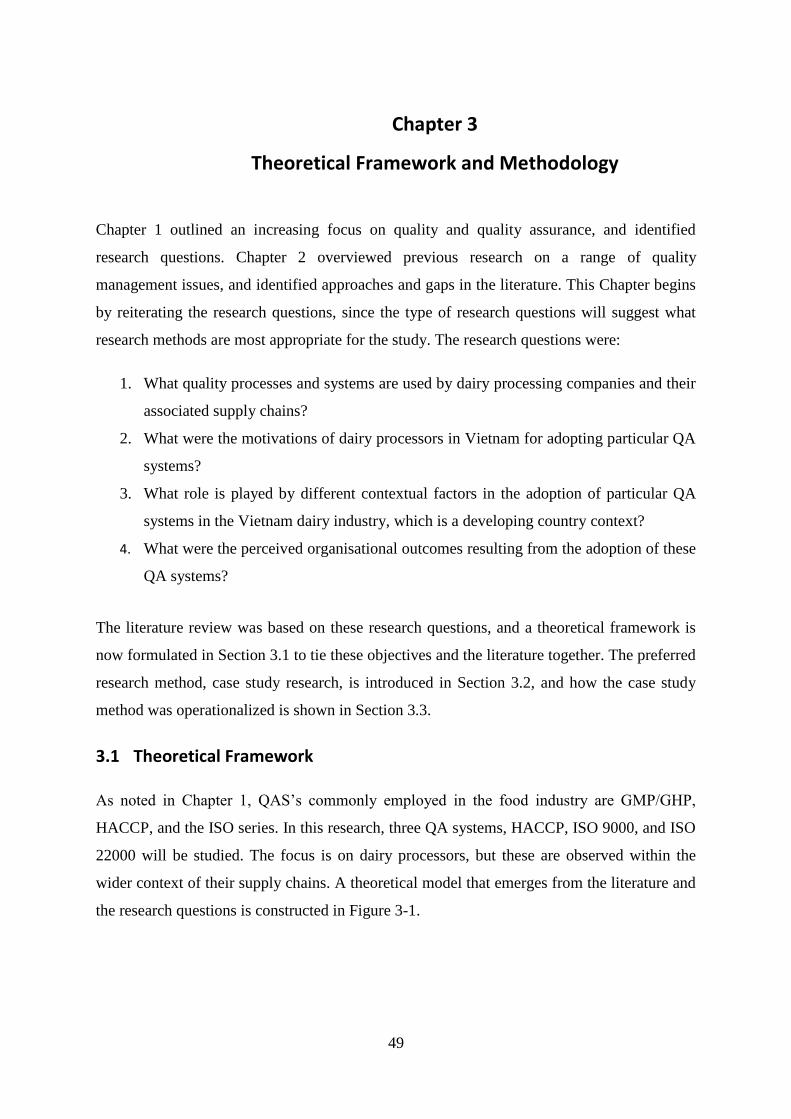
49
Chapter 3
Theoretical Framework and Methodology
Chapter 1 outlined an increasing focus on quality and quality assurance, and identified
research questions. Chapter 2 overviewed previous research on a range of quality
management issues, and identified approaches and gaps in the literature. This Chapter begins
by reiterating the research questions, since the type of research questions will suggest what
research methods are most appropriate for the study. The research questions were:
1. What quality processes and systems are used by dairy processing companies and their
associated supply chains?
2. What were the motivations of dairy processors in Vietnam for adopting particular QA
systems?
3. What role is played by different contextual factors in the adoption of particular QA
systems in the Vietnam dairy industry, which is a developing country context?
4. What were the perceived organisational outcomes resulting from the adoption of these
QA systems?
The literature review was based on these research questions, and a theoretical framework is
now formulated in Section 3.1 to tie these objectives and the literature together. The preferred
research method, case study research, is introduced in Section 3.2, and how the case study
method was operationalized is shown in Section 3.3.
3.1 Theoretical Framework
As noted in Chapter 1, QAS‟s commonly employed in the food industry are GMP/GHP,
HACCP, and the ISO series. In this research, three QA systems, HACCP, ISO 9000, and ISO
22000 will be studied. The focus is on dairy processors, but these are observed within the
wider context of their supply chains. A theoretical model that emerges from the literature and
the research questions is constructed in Figure 3-1.
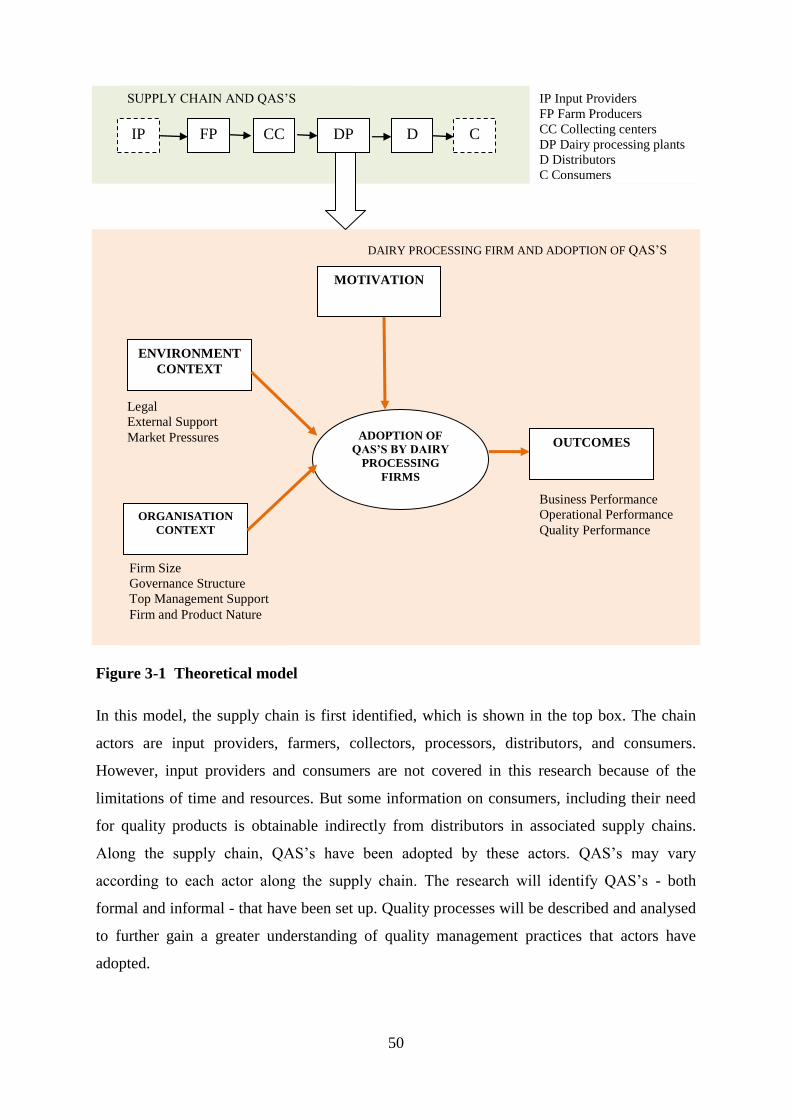
50
Figure 3-1 Theoretical model
In this model, the supply chain is first identified, which is shown in the top box. The chain
actors are input providers, farmers, collectors, processors, distributors, and consumers.
However, input providers and consumers are not covered in this research because of the
limitations of time and resources. But some information on consumers, including their need
for quality products is obtainable indirectly from distributors in associated supply chains.
Along the supply chain, QAS‟s have been adopted by these actors. QAS‟s may vary
according to each actor along the supply chain. The research will identify QAS‟s - both
formal and informal - that have been set up. Quality processes will be described and analysed
to further gain a greater understanding of quality management practices that actors have
adopted.
IP FP DP D C
MOTIVATION
ENVIRONMENT
CONTEXT
ORGANISATION
CONTEXT
OUTCOMES ADOPTION OF
QAS’S BY DAIRY
PROCESSING
FIRMS
SUPPLY CHAIN AND QAS‟S
DAIRY PROCESSING FIRM AND ADOPTION OF QAS‟S
ADOPTION
IP Input Providers
FP Farm Producers
CC Collecting centers
DP Dairy processing plants
D Distributors
C Consumers
Business Performance
Operational Performance
Quality Performance
Legal
External Support
Market Pressures
Firm Size
Governance Structure
Top Management Support
Firm and Product Nature
CC
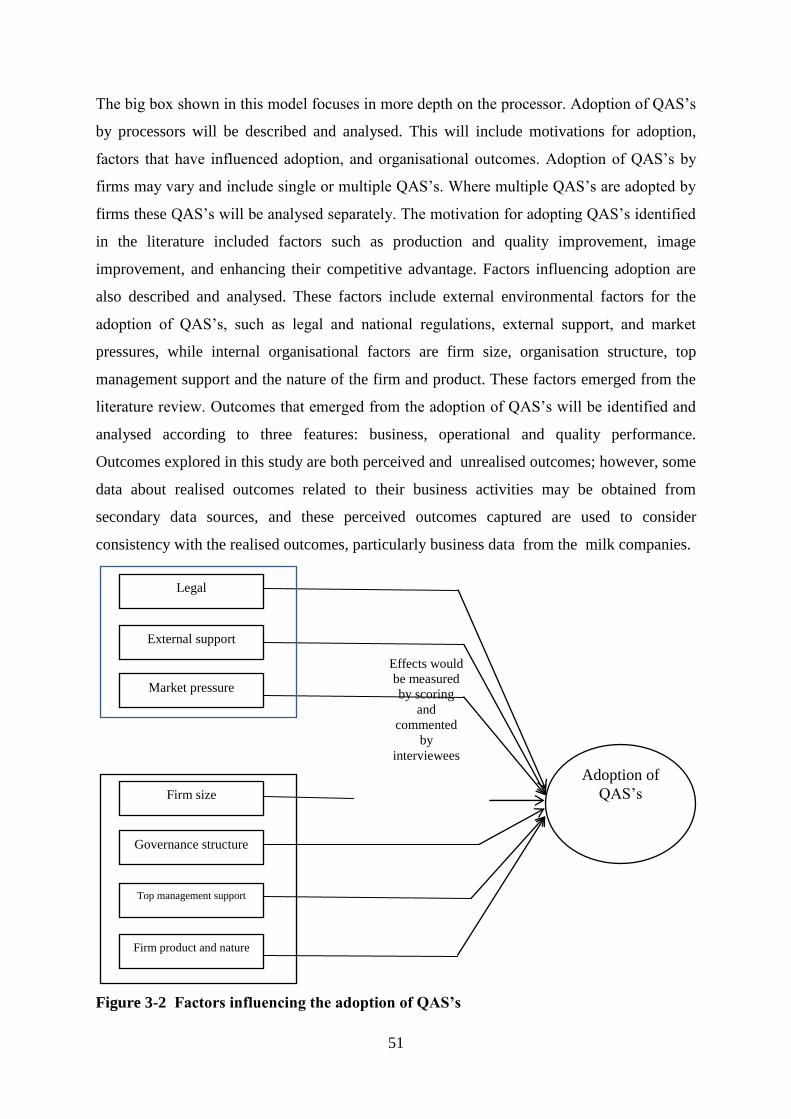
51
The big box shown in this model focuses in more depth on the processor. Adoption of QAS‟s
by processors will be described and analysed. This will include motivations for adoption,
factors that have influenced adoption, and organisational outcomes. Adoption of QAS‟s by
firms may vary and include single or multiple QAS‟s. Where multiple QAS‟s are adopted by
firms these QAS‟s will be analysed separately. The motivation for adopting QAS‟s identified
in the literature included factors such as production and quality improvement, image
improvement, and enhancing their competitive advantage. Factors influencing adoption are
also described and analysed. These factors include external environmental factors for the
adoption of QAS‟s, such as legal and national regulations, external support, and market
pressures, while internal organisational factors are firm size, organisation structure, top
management support and the nature of the firm and product. These factors emerged from the
literature review. Outcomes that emerged from the adoption of QAS‟s will be identified and
analysed according to three features: business, operational and quality performance.
Outcomes explored in this study are both perceived and unrealised outcomes; however, some
data about realised outcomes related to their business activities may be obtained from
secondary data sources, and these perceived outcomes captured are used to consider
consistency with the realised outcomes, particularly business data from the milk companies.
Figure 3-2 Factors influencing the adoption of QAS’s
Legal
Market pressure
External support
Firm size
Adoption of
QAS‟s
Top management support
Governance structure
Firm product and nature
Effects would
be measured
by scoring
and
commented
by
interviewees
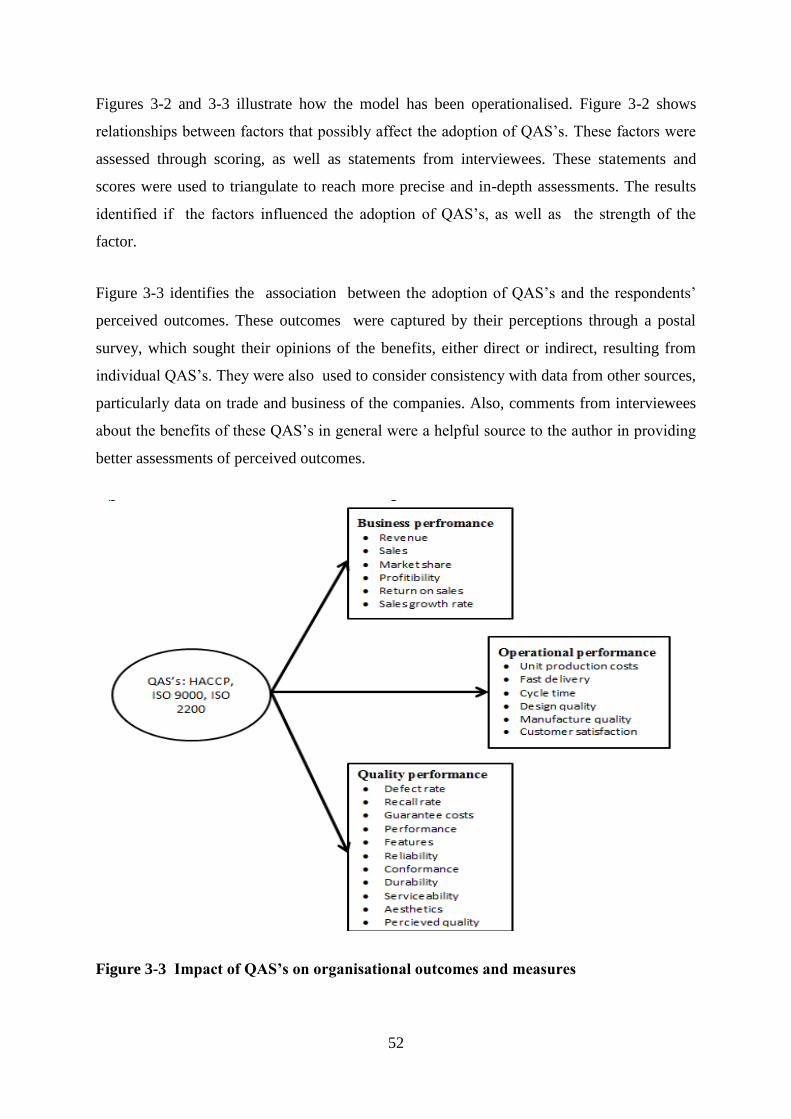
52
Figures 3-2 and 3-3 illustrate how the model has been operationalised. Figure 3-2 shows
relationships between factors that possibly affect the adoption of QAS‟s. These factors were
assessed through scoring, as well as statements from interviewees. These statements and
scores were used to triangulate to reach more precise and in-depth assessments. The results
identified if the factors influenced the adoption of QAS‟s, as well as the strength of the
factor.
Figure 3-3 identifies the association between the adoption of QAS‟s and the respondents‟
perceived outcomes. These outcomes were captured by their perceptions through a postal
survey, which sought their opinions of the benefits, either direct or indirect, resulting from
individual QAS‟s. They were also used to consider consistency with data from other sources,
particularly data on trade and business of the companies. Also, comments from interviewees
about the benefits of these QAS‟s in general were a helpful source to the author in providing
better assessments of perceived outcomes.
Figure 3-3 Impact of QAS’s on organisational outcomes and measures
53
3.2 The Case Study Research Method
3.2.1 Choice of case study method
The selection of an appropriate method for answering the research questions is an important
step in any research (Billones, 1999; Williams, 1997). According to Holbert and Speece
(1993), the research method and design is about considering how the researcher goes about
assessing what is needed. The choice of research method depends on the type of research
questions to be answered, the degree of control the researcher has over the subject to be
investigated, and whether the focus is on contemporary or historical events (Yin, 2009). After
taking account of these three factors, researchers then choose the most appropriate research
method, which may include experiments, surveys, archival analysis, history and case study
(Yin, 1994). This study aims to gain a greater understanding of quality processes and
adoption of QAS‟s along the supply chain, and to elicit experiences from respondents on
adoption of QAS‟s at processing plants. These are „What‟ questions, and imply an
exploratory type of research. This kind of research question can be answered by adopting
anyone of the five methods cited above.
Another important point to consider when choosing research methods is the complexity of the
phenomenon to be studied. The case study strategy is useful in situations where the
researcher wants to know how about the context, and how the evolution of the phenomenon
of interest affects the outcome. For these sorts of complex situations, it is preferable to other
methods (Yin, 1994). Such complexity involves the observation of several variables in order
to characterise the phenomenon. The large number of variables and the relationships between
them would make it difficult to perform any kind of quantitative statistical sampling (Yin,
1994). This situation applies in this study. Furthermore, in this study, the total population of
interest is 72, of which less than 25 companies have adopted QAS‟s, so meaningful
quantitative analysis would be difficult with such a small sample. Additionally, since this
research has a key exploratory element, qualitative data collection methods are considered
more appropriate.
3.2.2 Philosophy
A case study is „an empirical enquiry that investigates a contemporary phenomenon within its
real-life context, especially when the boundaries between phenomenon and context are not
54
clearly evident‟ and it „relies on multiple sources of evidence‟ (Yin, 1994, p.13).
Case study research is usually associated with the main types of qualitative research, such as
action research, ethnography and grounded theory (Myers, 2009). Although considered as
qualitative methods, some authors argue that case studies, as with other qualitative methods,
can include quantitative evidence (Yin, 1994). The case study method allows investigators to
gain a holistic and meaningful understanding of processes and interrelationships (Yin, 2003).
Case study focus groups and in-depth interviews can yield very useful information on
potentially complex phenomena (De Ruyter &Scholl, 1998; Gummeson, 2005).
Qualitative research is an inductive approach which involves intensive fieldwork. The
researcher gathers information directly from the people who are experiencing the
phenomenon (Creswell, 1994). Qualitative research is an especially useful approach when the
variables and theory base are weak or unknown (Morse, 1991). The researcher builds a
rational explanation through the interpretation of details and the collection of data, both of
which involve some degree of subjectivity (Locke et al., 1987). This introduces a drawback
of the method, which is the limited generalizability of findings – though this is reduced by
cross-case comparison – and limitations in replicating the study (Yin, 1994).
Qualitative research can be exploratory, both exploratory and explanatory, or explanatory
only. Exploratory research is aimed at describing phenomena, and is not particularly
concerned with understanding why behaviour is the way it is. This type of research is very
useful for setting out baselines of how we think the world is. It is also starting point for
research into phenomena of which is little known. Explanatory research is deeper in the sense
that it describes phenomena and attempts to explain why behaviour is the way it is (John et
al., 2007). Research that is a combination of exploratory and explanatory, aims to do both to
some extent. This type of approach is becoming more popular (Yin, 2003; Miles &
Huberman, 1994).
3.2.3 Criticisms
The case study method allows investigators to gain a holistic and meaningful understanding
of processes and interrelationships (Yin, 2003) and can provide useful information on
potentially complex phenomenon (De Ruyter &Scholl, 1998; Gummeson, 2005). The key
55
strengths of the qualitative method include data richness and a more holistic representation of
reality.
However, this qualitative method also has its limitations, which must be acknowledged.
Criteria for assessing research quality in quantitative research are well established, involving
validity, generalisation, reliability, and objectivity (Lincoln & Guba, 1985). These same
criteria are inappropriate when assessing qualitative work. One of reasons for this is that
qualitative research is specific to a time and place (Silverman,2001). Consequently, they
cannot be precisely replicated, unlike laboratory experiments in the quantitative tradition.
The case study is often seen as a method that is not rigorous enough and is biased. Yin (1994)
argues that this perception was formed because some researchers in the past have been untidy
and swayed by equivocal evidence that influenced their research findings and conclusions.
Therefore, Yin (2009) proposes techniques and tools, which aim to improve case study
documentation, ensure greater transparency, and the ability to replicate, and therefore
increase confidence in case study findings and conclusions. Such tools include the case study
protocol, which outlines sampling procedures, construction of interview questionnaires,
interviewing techniques, case analysis and reporting, and cross-case analysis.
A more pragmatic limitation is that the case study is also said to be too long and produces an
unreadable document. Yin (2009) admits that the composition of long case study reports has
happened in the past, and suggests alternative techniques for writing case studies in order to
avoid the traditional long narrative. Case study labelling is very time consuming and this
strategy is commonly confused with methods of data collection that take a long time, such as
ethnography or participant observation (Yin, 2009).
3.3 Operationalizing the Case Study Method
3.3.1 Case selection and design
The sample selected for qualitative research should be purposive, based on theoretical
underpinnings and aimed at gaining theoretical understanding (Eisenhardt, 1989; Miles &
Huberman, 1994). The logic underlying the selection of multiple case studies is the same as
the replication logic used in experiments (Yin, 2009). In this research, both theoretical and
literal replications were employed. Yin (2009) notes that literal replication allows insight
56
from cases to be confirmed. Theoretical replication allows theoretical insights to emerge by
reconciling differences in cases. The number of cases to be studied depends on the focus of
the research question. Single cases can provide for in-depth investigation and rich
descriptions, whereas multiple case designs allow both literal and theoretical replication to
take place and cross-case comparisons to occur.
There is no ideal number of cases. (Yin, 2009) suggests that more replications give greater
certainty. Eisenhardt (1989) suggests that both single case and multiple case designs can be
adopted for explorative research. Where explanatory research is undertaken, a single case
may provide the basis for developing explanations of why a phenomenon occurs, and these
may then be further investigated by applying them to additional cases with other features.
When multiple cases are used, the number of cases can be determined by the principle of
saturation; that is, new insights are no longer gained by studying new cases.
The aim of this study is to gain an understanding of quality processes and adoption of QAS‟s
in dairy processing firms in Vietnam within the context of their broader supply chains.
Selected case studies will include dairy companies and plants that have adopted different QA
systems. In this study, five companies (out of 72 dairy companies) were selected, of which
two larger sized companies (VNM and DLM) occupy a large market share in the distribution
of end products and procurement of raw milk from farmers (60% market share milk products
and 80% volume of raw milk from farmers nationally), and three small sized companies
(market share of each these companies 3%). The selection of particular cases within the size
categories was based on different types of QAS‟s that were used by dairy processing firms,
as well as different firm features, such as ownership. Advice from quality experts in
Vietnam, and from the Vietnamese Dairy Association, was used to assist the selection
process. It also considered the traveling and likely field work duration. Specific
characteristics of dairy companies, such as whether its plants were in the same place, or
located in different places, were considered. In the North 3 companies (working with 5
plants) were selected. Two companies were selected in the south. State ownership was
another criteria to consider to help depict an overview of quality assurance in each sector of
the dairy industry. This selection of five cases can be categoried into ownership, two State
owned, two private, and one foreign owned, into size, two large sized, and three small sized,
so may attain rich comparison and contrast across cases in respect to size and ownership.
57
In summary, the cases were chosen to ensure both literal and theoretical replication of factors
to be explored (Yin, 2009). That is, there were similarities between some of the companies
with respect to their characteristics, which allowed emerging insights to be confirmed.
However, there were also differences, which allowed more theoretical insights to emerge.
involving the The broad unit of analysis is the supply chain, within which processing firms
operate. Hence, the key unit of analysis is the processing firm, which forms an embedded
unit of analysis within the broader chain (Yin, 2009).
3.3.2 Procedures
Reports and documentation were collected at the interview stage. An assessment of
information sources was conducted to review existing data and conditions pertaining to the
dairy industry. Contact was made with NIAPP (National Institute of Agricultural Planning
and Projection), the researcher‟s former employer. A letter of introduction was then provided
by NIAPP to obtain the necessary official permission to approach and organise a meeting
with the director of the board of the companies. These letters were posted. Fortunately , two
companies, Moc Chau and Vinamilk, were familiar with, and used to working with, NIAPP
on past projects, and three other companies responded favourably. Meetings followed
regulations on the right to share information internally within government organisations for
research purposes.
Each introductory interview lasted 45-60 minutes, and secondary documents also were
collected at this stage. After this meeting, a letter of introduction from these five companies
permitted visiting and contacting other actors in their supply chains. For two of the
companies, farmers, collectors and some retailers who were near processing plants were
visited and voluntarily participated in interviews, while for other distributors and retailers
within other supply chains, interviews were mainly organised in the urban cities Ha Noi and
Ho Chi Minh after receiving permission from the companies to begin interviewing.
Distributors and retailers outside the company management were randomly selected and
asked for permission to obtain data and information with a condition that their participation
in the research was voluntary.
A small postal and email survey was organised to obtain some preliminary information and
data from respondents within plants, including directors, vice directors, plant managers, and
58
employees. This occurred from June to September, 2010 either before or after face-to-face
meetings and interviews for research. (See details Time schedule in Appendix D).
Semi-structured questions were used for interviews with the actors in the supply chains.
These included a description of production, processing, technical requirements, perceptions,
and institutional issues for dairy farms. For collecting centres, it included processes, technical
requirements, price formulation, and perceptions). For distributors, it covered processes,
governance, and perceptions. For the processor, it was more complex and in two parts: part A
covered processes, and part B dealt with QAS‟s and motivation, environmental context,
organisational characteristics context, and organisation outcomes (See Protocol semi-
structured questions in Appendix A1, A2, A3, and A4).
While primary data constituted the main source of information for this study, secondary
sources were also relied upon for information. This related to evolution, areas of
implementation, international trends, motivation, and the future development of QAS‟s.
After the interview, a further mail survey was sent to processors to gain more precise
information and to gain further information to supplement the interview (see Questionnaire
form in Appendix B). This was considered an effective tool with low costs. Before this mail
survey, the questionnaire was designed and pre-tested. Questionnaires were filled in by
company directors, plant managers, senior quality staff who had a responsibility for quality
management or related work in this field, as well as employees in the 5 companies. The
questionnaire was constructed in English and Vietnamese. All respondents were asked if their
company was certified with particular QAS‟s. In addition, the reasons for certification were
solicited, and possible factors that influenced the decision to adopt QAS‟s were covered. The
outcomes resulting from QAS‟s were also requested. These questions were aimed at
obtaining perceptions, and respondents were asked to rank their answers on a Likert 5- point-
scale.
The research package was mailed and consisted of two copies of the study questionnaire, a
letter of explanation, an informed consent form and a self-addressed stamped envelope for
returning the survey instruments. A code number for tracking purposes only was assigned to
the survey instruments to monitor returns. Two mailings were included in this study: the
original questionnaire and subsequently a follow-up notice to all participants to thank them
59
for participation and to serve as a reminder to complete the survey. The follow-up notice was
intended to increase the response rate and was sent out two weeks after the initial mailing. In
addition, the name and telephone number of the researcher was included in the survey packet
for respondents to contact if they had any questions.
The companies selected in this research and their key parameters are listed below.
1) The Moc Chau milk company which is located in the Moc Chau district, Son La province.
It specialises in supplying dairy products and cows. It is a State-owned business under the
Livestock Corporation of the Ministry of Agriculture and Rural Development. The company
has its own farms and also purchases milk from private farms. The company has two small
plants, and the main products it produces are fresh and UHT milk, milk cake, and yoghurt.
Total turnover is approximately 370 billion VND (US$16.5 million). QAS‟s adopted are
HACCP and ISO 9000.
2) The DutchLady Vietnam company, now FrieslandCampina Vietnam, which is located in
the Thuan An district, Binh Duong province, and has two plants. One plant is in Binh Duong
province, and another is in Ha Nam province. It is foreign owned, and the dairy products it
produces include fresh and UHT milk, flavoured milk, and powdered milk. Total turnover is
approximately 5,800 billion VND ($US290 million). QAS‟s adopted are HACCP, ISO 9000
and ISO 22000.
3) The HanoiMilk company which is privately owned, and is located in the Me Linh district,
Ha Noi. It has one plant and produces dairy products, such as fresh and UHT milk, and
yoghurt. Its total turnover is approximately 350 billion VND ($US17.5 million). QAS‟s
adopted are HACCP, ISO 9000 and ISO 22000.
4) The Vinamilk company which is located in Ho Chi Minh City.The State has a large share
in its ownership. It has 15 plants and is involved in many activities, and produces dairy
products, including fresh and UHT milk, flavoured milk, powdered milk, condensed milk,
yoghurt, ice cream, butter and cheese. Total turnover is 16,000 billion VND, (US$800
million). QAS‟s adopted are HACCP and ISO 9000.
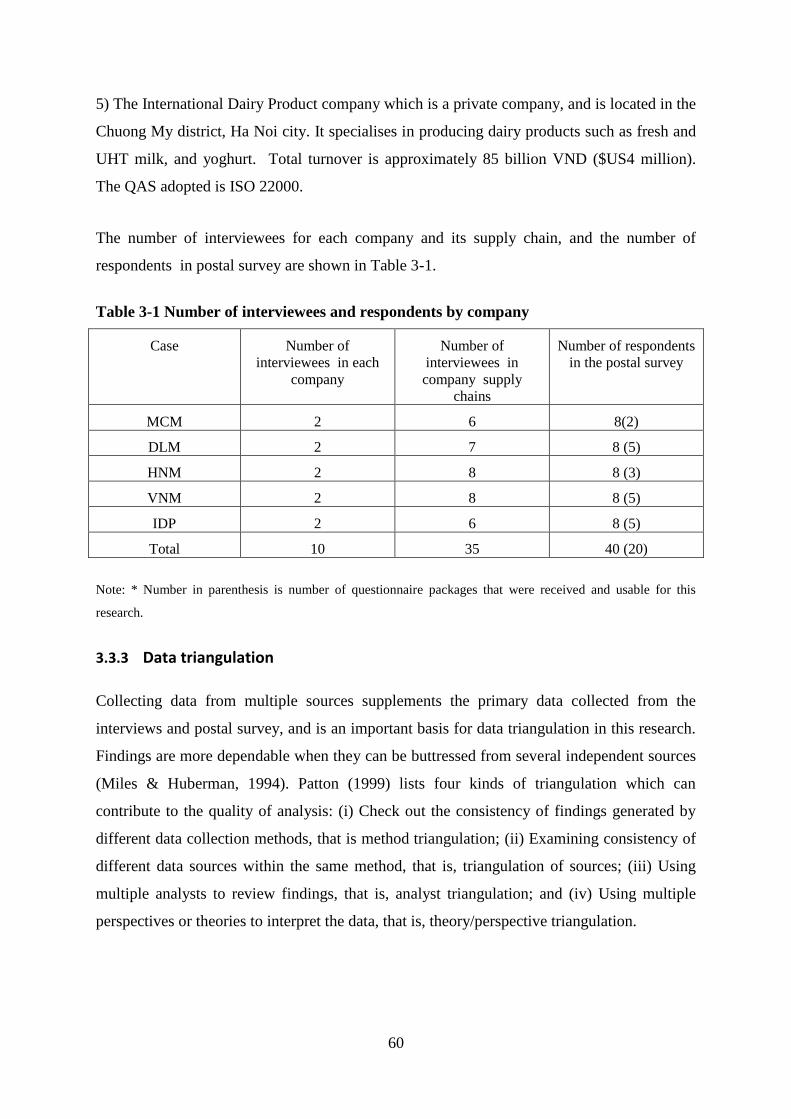
60
5) The International Dairy Product company which is a private company, and is located in the
Chuong My district, Ha Noi city. It specialises in producing dairy products such as fresh and
UHT milk, and yoghurt. Total turnover is approximately 85 billion VND ($US4 million).
The QAS adopted is ISO 22000.
The number of interviewees for each company and its supply chain, and the number of
respondents in postal survey are shown in Table 3-1.
Table 3-1 Number of interviewees and respondents by company
Case Number of
interviewees in each
company
Number of
interviewees in
company supply
chains
Number of respondents
in the postal survey
MCM 2 6 8(2)
DLM 2 7 8 (5)
HNM 2 8 8 (3)
VNM 2 8 8 (5)
IDP 2 6 8 (5)
Total 10 35 40 (20)
Note: * Number in parenthesis is number of questionnaire packages that were received and usable for this
research.
3.3.3 Data triangulation
Collecting data from multiple sources supplements the primary data collected from the
interviews and postal survey, and is an important basis for data triangulation in this research.
Findings are more dependable when they can be buttressed from several independent sources
(Miles & Huberman, 1994). Patton (1999) lists four kinds of triangulation which can
contribute to the quality of analysis: (i) Check out the consistency of findings generated by
different data collection methods, that is method triangulation; (ii) Examining consistency of
different data sources within the same method, that is, triangulation of sources; (iii) Using
multiple analysts to review findings, that is, analyst triangulation; and (iv) Using multiple
perspectives or theories to interpret the data, that is, theory/perspective triangulation.
61
3.3.4 Data analysis and case presentation
The purpose of qualitative inquiry is to produce findings through analysis, interpretation and
the presentation of the findings. The key task of data analysis is to make sense of large
amounts of data, reduce the quantity of information, identify patterns, and construct a
framework for communicating what the data reveals (Patton, 1990). Data analysis is an
unstructured part of qualitative research (Miles & Huberman, 1994), and many different
approaches are used.
The approach for analysing the semi-structured interviews undertaken in this study followed
some of Miles and Huberman‟s (1994) suggestions for analysis. This included:
a) Assigning codes to the material obtained from interviews and secondary sources;
b) Adding comments to the material;
c) Sorting the material to identify similar patterns and themes;
d) Identify generalisations that explain the data;
Case analysis follows suggestions of Miles and Huberman, (1994) and Yin (1993) and
consists of the hree stages within-case analysis, data reduction, and cross-case analysis.
Within-case analysis
Within case analysis involves organising the data by specific cases for in-depth study. It is
necessary to reduce the volume of data (Eisenhardt, 1989). The steps used in this study were
adapted from Patton (1990). These involve:
1) Organising the raw case data including interview transcripts, notes from observations,
secondary documentation on the organisation, and other material about the case.
2) Summarising case data and organising it into files for each company and its supply
chain.
3) Editing and summarising case information. Data was organised by theme relating to
research questions.
With respect to the presentation of the cases, an in-depth discussion to fully capture the
context of Vietnam dairy supply chains and their associated context was created. Therefore,
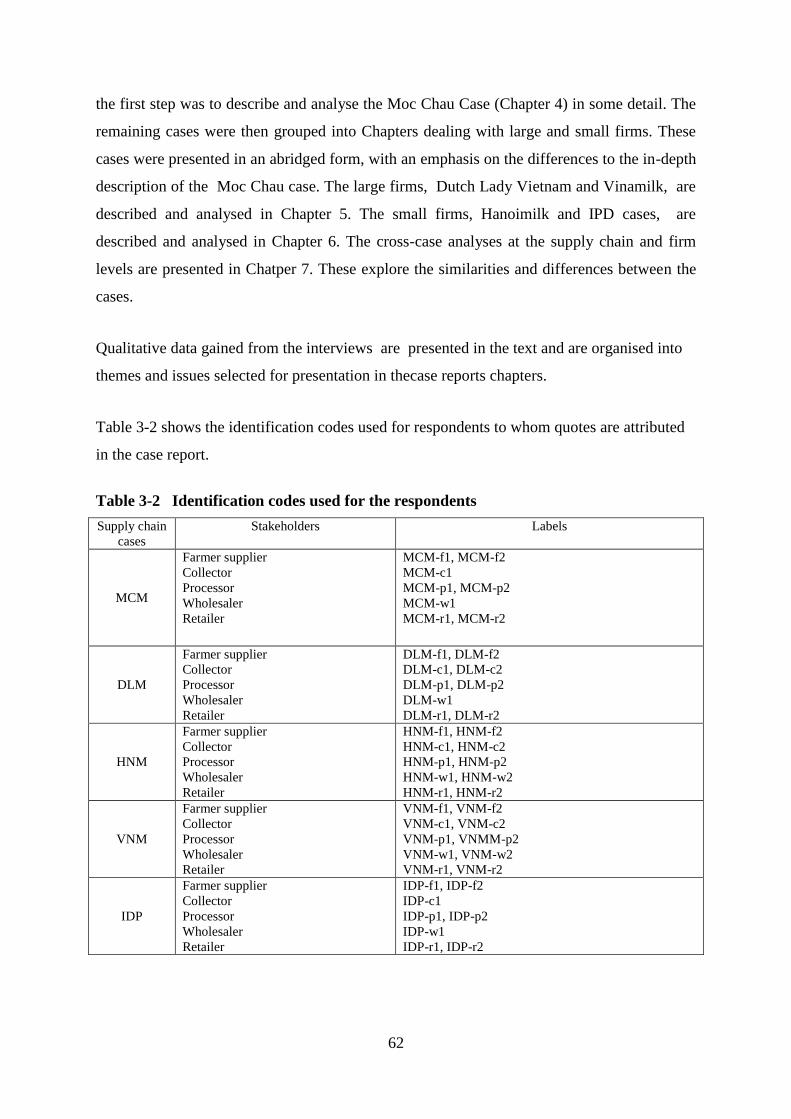
62
the first step was to describe and analyse the Moc Chau Case (Chapter 4) in some detail. The
remaining cases were then grouped into Chapters dealing with large and small firms. These
cases were presented in an abridged form, with an emphasis on the differences to the in-depth
description of the Moc Chau case. The large firms, Dutch Lady Vietnam and Vinamilk, are
described and analysed in Chapter 5. The small firms, Hanoimilk and IPD cases, are
described and analysed in Chapter 6. The cross-case analyses at the supply chain and firm
levels are presented in Chatper 7. These explore the similarities and differences between the
cases.
Qualitative data gained from the interviews are presented in the text and are organised into
themes and issues selected for presentation in thecase reports chapters.
Table 3-2 shows the identification codes used for respondents to whom quotes are attributed
in the case report.
Table 3-2 Identification codes used for the respondents
Supply chain
cases
Stakeholders Labels
MCM
Farmer supplier
Collector
Processor
Wholesaler
Retailer
MCM-f1, MCM-f2
MCM-c1
MCM-p1, MCM-p2
MCM-w1
MCM-r1, MCM-r2
DLM
Farmer supplier
Collector
Processor
Wholesaler
Retailer
DLM-f1, DLM-f2
DLM-c1, DLM-c2
DLM-p1, DLM-p2
DLM-w1
DLM-r1, DLM-r2
HNM
Farmer supplier
Collector
Processor
Wholesaler
Retailer
HNM-f1, HNM-f2
HNM-c1, HNM-c2
HNM-p1, HNM-p2
HNM-w1, HNM-w2
HNM-r1, HNM-r2
VNM
Farmer supplier
Collector
Processor
Wholesaler
Retailer
VNM-f1, VNM-f2
VNM-c1, VNM-c2
VNM-p1, VNMM-p2
VNM-w1, VNM-w2
VNM-r1, VNM-r2
IDP
Farmer supplier
Collector
Processor
Wholesaler
Retailer
IDP-f1, IDP-f2
IDP-c1
IDP-p1, IDP-p2
IDP-w1
IDP-r1, IDP-r2
63
The survey data was assessed and presented in in various ways. For example, motivation was
rated on the 1-5 Likert scale representing from strongly unimportant to strongly important.
The most important motivations were then ranked, and presented for each case. A similar
process was followed for the factors influencing the adoption of QAS‟s. Each factor was
rated on a 1-5 scale from unimportant/no effect to very important/high effect. These answers
were clustered into low influence (1-2), moderate influence (3), high influence (4-5).
Likewise, organisational outcomes that resulted from implementation of QA systems were
rated for individual QA systems using a list of measures on a 1-5 scale with attributes from
„no increase‟ to „strong increase‟, which was clustered into L (1-2) no increase, M (3) some
increase, H (4-5) large increase.
Cross-case analysis
As noted previously, evidence from multiple cases is considered more compelling than single
case studies with the overall study being more robust (Herriott & Firestone, 1983).
Comparing and contrasting cases can determine differences and similarities between cases,
and so provide defensible answers to research questions as well as higher-level insights (Yin,
1994). The basic technique for comparing across cases was in this study pattern matching.
The cross case analysis strategy was performed at the supply chain and company levels.
As noted, the presentation of the cross-case analysis is in Chapter 7. In this Chapter the
quality processes and QAS‟s adopted by actors is described (Research Question 1). At the
company level, the motivations, the factors perceived to have influenced adoption of
particular QAS‟s, and organisational outcomes perceived to have resulted from the adoption
are compared (Research Questions 2-4).
3.3.5 Ethical considerations
The data required for this research are all concerened with the business activities of these
chains. The principles and guidelines of the Lincoln University Human Ethics Committee
(HEC) states that interviews with professionals in the areas of their duties and competence,
and non-interactive observation of these people in the course of everyday life, do not come
under the scope of HEC. Therefore, HEC approval for this reseach was not sought. However,
the collection of data and information followed Vietnamese regulations on the right to share
information in internal official organisations for research purposes. Interviews were
64
conducted and followed official protocol questions (prior to conducting the fieldwork). At the
beginning of every interview, it was clearly explained that the interview was voluntary, and
that participants were free not to answer any of the questions in the course of the interview.
To maintain the privacy of these interviewees, their actual names have not been revealed in
this thesis.
65
Chapter 4
Result 1- Moc Chau Dairy Company case- Description and Analysis
Chapter 4 describes and analyses the case study of the Moc Chau dairy company in respect of
its development stages (Section 4.1.1.), governance structure (Section 4.1.2), its supply chain
structure (Section 4.1.3) and business strategy (Section 4.1.4). Further discussion in depth on
stakeholders in the supply chain with respect to production and quality processes is presented
in Section 4.1.5. The analysis of the case is presented in Section 4.2 with respect to factors
impacting on adoption decisions (Section 4.2.2), and perceived outcomes the company
achieved after implementing QA systems (Section 4.2.3). Finally, findings are presented in
Section 4.2.4. This particular case study is presented in depth so that the context and
processes within Vietnam‟s dairy industry can be fully explored.
4.1 Description
4.1.1 Overview
The Moc Chau cow breeders and dairy company (MCM), a subsidiary of the Vietnam
Livestock Husbandry Corporation, is located in the Moc Chau State Farm town, Moc Chau
district, Son La province. It is 194 km North West from Hanoi with a land area of 1,600
hectares, of which 969 hectares is agricultural land. Dairy cow numbers at MCM are over
5,500. The company has gone through a number of development stages: establishment (1958-
1960), initial growth and cooperative farm changes (1961-1982), enlarging scale (1983-
1987), further reform (1987-1998) and a subsequent growth period (1998 – 2010). The
company carried out „equitisation‟ (partial privatization) in 2005, and now has joint
ownership with the State holding 51% and other shareholders, including private investors and
farmers, holding 49% of the legal registered capital of 17 billion VND (Moc Chau company,
2010).
Regarding its capital assets, the MCM has two milk processing plants and one feed
production plant. The two plants each have an office for conducting regular meetings and
other purposes and each has a building that houses milk processing facilities. The plants have
a cream separator and complementary facilities such as filling, pasteurizing and automatic
66
packing facilities. One milk processing plant began operation in 1994 and another in 2003.
The assets are currently valued at approximately 80 billion VND (equivalent 4 million USD).
The MCM is one of the smaller-sized businesses producing and processing dairy products in
Vietnam. Currently, 140 employees work for the company. The company reports a
remarkable growth in turnover from 91 billion VND in 2006, to 230 billion VND in 2007, to
320 billion VND in 2008, and to 360 billion VND in 2009 (Moc Chau Company, 2010).
The MCM focuses on serving domestic markets with liquid milk and has a market share of
3% nationally (Mekong Securities, 2009). Its major market is in the Northern provinces in
Vietnam. The company has a strategy of product diversification, but, as noted, its main
products are fresh and UHT milk produced from fresh milk sourced from the Moc Chau
plateau, where cool weather suits cow and pasture development. The company‟s milk
products, such as the „Thao Nguyen‟ brand of fresh milk and the „Moc Chau‟ brand of UHT
milk, have received national awards, such as first prize for quality in exhibitions,
competitions, and trade- fairs. In summary, MCM is growing rapidly in the Northern market
in Vietnam, where it is pursuing market leadership.
Currently, MCM‟s competitors in the market for liquid dairy products are the International
Dairy Products Company (IDP) and the Hanoi Milk Holdings Company (HNM). However,
the competition does not seem to be strong, since each company targets different niche
markets for its products. For example, IDP has the Ba Vi brand of drinking yoghurt, HNM
has the IZZI brand of fresh milk packaged in small boxes of 110ml, while MCM‟s strong
point is its Moc Chau brand with different kinds of fresh, sterilized and UHT milk packaged
in milk bags and packs of 180ml and 110ml with various fruit flavours. Traditional milk cake
is also sold.
4.1.2 Governance structure
The majority shareholding of MCM is held by the government‟s Livestock Corporation
Vietnam. MCM has an Administrative Council, a Management Board, an Internal Auditing
Board, and functional departments (See Figure 4-1).
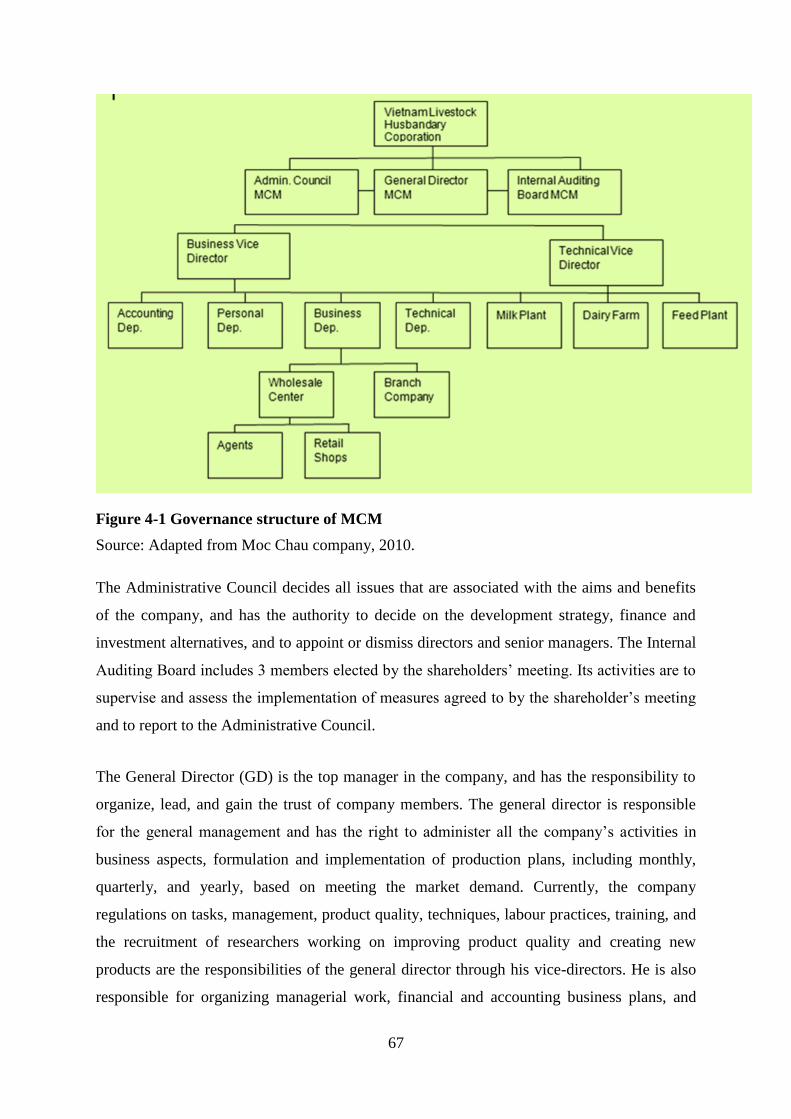
67
Figure 4-1 Governance structure of MCM
Source: Adapted from Moc Chau company, 2010.
The Administrative Council decides all issues that are associated with the aims and benefits
of the company, and has the authority to decide on the development strategy, finance and
investment alternatives, and to appoint or dismiss directors and senior managers. The Internal
Auditing Board includes 3 members elected by the shareholders‟ meeting. Its activities are to
supervise and assess the implementation of measures agreed to by the shareholder‟s meeting
and to report to the Administrative Council.
The General Director (GD) is the top manager in the company, and has the responsibility to
organize, lead, and gain the trust of company members. The general director is responsible
for the general management and has the right to administer all the company‟s activities in
business aspects, formulation and implementation of production plans, including monthly,
quarterly, and yearly, based on meeting the market demand. Currently, the company
regulations on tasks, management, product quality, techniques, labour practices, training, and
the recruitment of researchers working on improving product quality and creating new
products are the responsibilities of the general director through his vice-directors. He is also
responsible for organizing managerial work, financial and accounting business plans, and
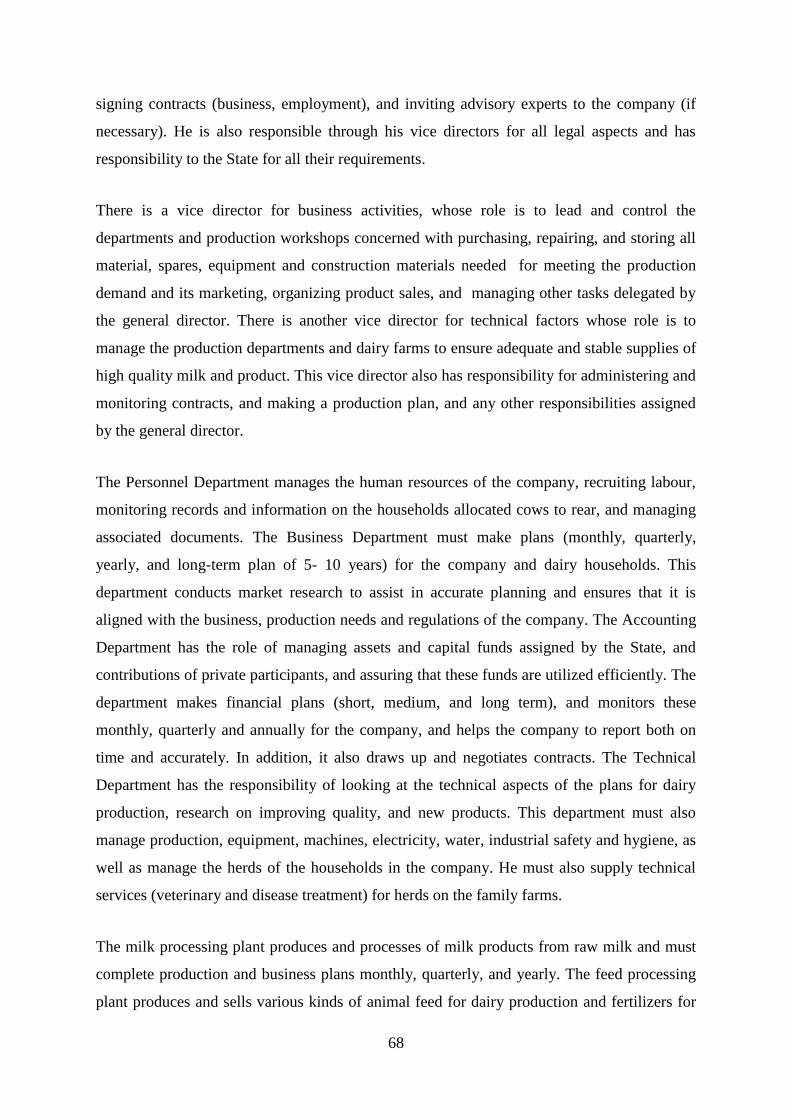
68
signing contracts (business, employment), and inviting advisory experts to the company (if
necessary). He is also responsible through his vice directors for all legal aspects and has
responsibility to the State for all their requirements.
There is a vice director for business activities, whose role is to lead and control the
departments and production workshops concerned with purchasing, repairing, and storing all
material, spares, equipment and construction materials needed for meeting the production
demand and its marketing, organizing product sales, and managing other tasks delegated by
the general director. There is another vice director for technical factors whose role is to
manage the production departments and dairy farms to ensure adequate and stable supplies of
high quality milk and product. This vice director also has responsibility for administering and
monitoring contracts, and making a production plan, and any other responsibilities assigned
by the general director.
The Personnel Department manages the human resources of the company, recruiting labour,
monitoring records and information on the households allocated cows to rear, and managing
associated documents. The Business Department must make plans (monthly, quarterly,
yearly, and long-term plan of 5- 10 years) for the company and dairy households. This
department conducts market research to assist in accurate planning and ensures that it is
aligned with the business, production needs and regulations of the company. The Accounting
Department has the role of managing assets and capital funds assigned by the State, and
contributions of private participants, and assuring that these funds are utilized efficiently. The
department makes financial plans (short, medium, and long term), and monitors these
monthly, quarterly and annually for the company, and helps the company to report both on
time and accurately. In addition, it also draws up and negotiates contracts. The Technical
Department has the responsibility of looking at the technical aspects of the plans for dairy
production, research on improving quality, and new products. This department must also
manage production, equipment, machines, electricity, water, industrial safety and hygiene, as
well as manage the herds of the households in the company. He must also supply technical
services (veterinary and disease treatment) for herds on the family farms.
The milk processing plant produces and processes of milk products from raw milk and must
complete production and business plans monthly, quarterly, and yearly. The feed processing
plant produces and sells various kinds of animal feed for dairy production and fertilizers for
69
pastures. The dairy farms have contracts to supply milk to the company, and are under the
management of the company when deciding on farm management practices. The company
decides cow numbers and land areas.
The company branch acts as a wholesale centre and its agents are involved in the distribution
stage of the products, and in market research. This company branch is in Ha Noi. The director
of the company branch must report the business and sales situation to the company monthly,
quarterly and yearly. Through the wholesale centre, the company‟s dairy products are
distributed to the markets. The wholesale centre has a warehouse for storing dairy products
before distributing to retail shops and agents in the Northern provinces in Viet Nam (Moc
Chau company, 2008).
4.1.3 Supply chain structure
The company has a predominantly vertically integrated structure along the supply chain
(Figure 4-2). Private suppliers sell milk to the company, but they are also shareholders
through contributing capital to the company according to the value of their cow herds. In
addition, there are dairy farms owned by the company who hire labour to run them. Dairy
smallholders sell most of the fresh milk they produce to the milk processing plants of the
company via collection systems owned by the company, and receive payment. They also
receive technical support and assistance from the company such as veterinary services,
training services, breeds from the company, input materials, machines, equipment, cow
insurance, and credit for buying cows. Currently, there are 700 farms supplying MCM.
Fresh milk is processed in the two milk processing plants of the company. The total annual
capacity of the two plants is approximately 20-25 million litres. Processed milk products are
distributed through the company‟s distribution systems, including wholesale outlets and
agents, retailing shops in schools in Ha Noi, and retail outlets and corner shops in provinces
from the Northern provinces to Quang Ngai province. At present, the company has a
wholesale shop in Cat Linh and 250 sale agents, and 2,000 retail shops, mainly in urban cities
(Moc Chau Company, 2009).
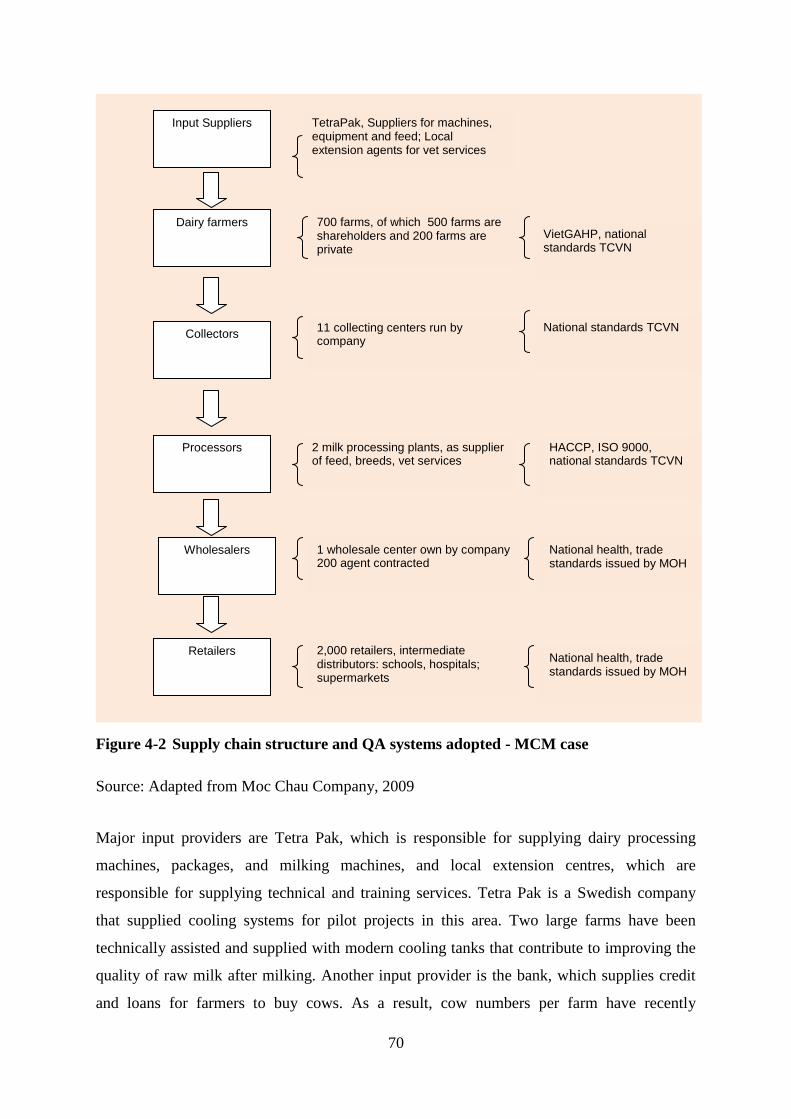
70
Figure 4-2 Supply chain structure and QA systems adopted - MCM case
Source: Adapted from Moc Chau Company, 2009
Major input providers are Tetra Pak, which is responsible for supplying dairy processing
machines, packages, and milking machines, and local extension centres, which are
responsible for supplying technical and training services. Tetra Pak is a Swedish company
that supplied cooling systems for pilot projects in this area. Two large farms have been
technically assisted and supplied with modern cooling tanks that contribute to improving the
quality of raw milk after milking. Another input provider is the bank, which supplies credit
and loans for farmers to buy cows. As a result, cow numbers per farm have recently
Dairy farmers
Collectors
Processors
Wholesalers
Retailers
700 farms, of which 500 farms are shareholders and 200 farms are private
11 collecting centers run by company
2 milk processing plants, as supplier of feed, breeds, vet services
1 wholesale center own by company 200 agent contracted
2,000 retailers, intermediate distributors: schools, hospitals; supermarkets
VietGAHP, national standards TCVN
National standards TCVN
HACCP, ISO 9000, national standards TCVN
National health, trade standards issued by MOH
National health, trade standards issued by MOH
Input Suppliers TetraPak, Suppliers for machines, equipment and feed; Local extension agents for vet services
71
increased. Over the years, the banks have lent farmers around 20 -30 billion VND (1-1.5
million USD) (Vietnamnet, 2009). MCM itself provides inputs to farmers such as alfalfa and
other hay for supplementary feed, which is imported from countries such as USA and
Australia, and has close relationships with breeding and scientific centres in the country that
supply materials and provide needed training courses to farmers. The company also provides
veterinary services at low cost and sells genetically improved cows to farmers.
4.1.4 Business strategy and QA systems
The MCM has a long-term strategy for development of products and their quality. The
company‟s target is to be in a leading position in regional milk markets, especially for
pasteurized and UHT milk in the Northern markets. The company has a commitment to
assure high quality milk to consumers. The MCM has acquired two international quality
certifications, ISO 9001:2000 and HACCP. The company adopted HACCP in 2001 and
obtained certification for ISO 9001:2000 in 2003 (VPC Vietnam Productivity Centre, 2010).
4.1.5 Supply chain stakeholders
4.1.5.1 Dairy farms
General Information
Milk production is one of the most important activities in the Moc Chau region, which is a
traditional milk production area in the country, and generates the main income for farmers in
this region. Average annual farm income is VND90-100m (US$4 -5 thousand). There are 700
farms in this area. Most farms in Moc Chau are small scale. Herd size varies from 15 dairy
cows on small and medium farms to over 35 dairy cows on large farms. Farm milk
production is influenced by the number of cows, the availability of natural pasture and water,
and type of cow breed. Milk production also depends on the natural environment, and the
better the environment, the better the milk production and vice versa. The Moc Chau region
has good weather for dairy production and is very suitable for rearing dairy cows (NIAPP,
2007).
Two farmers were interviewed and the farms visited. These were originally in the Moc Chau
State Farm, which sold cows to farms as part of the privatization process. Some farms
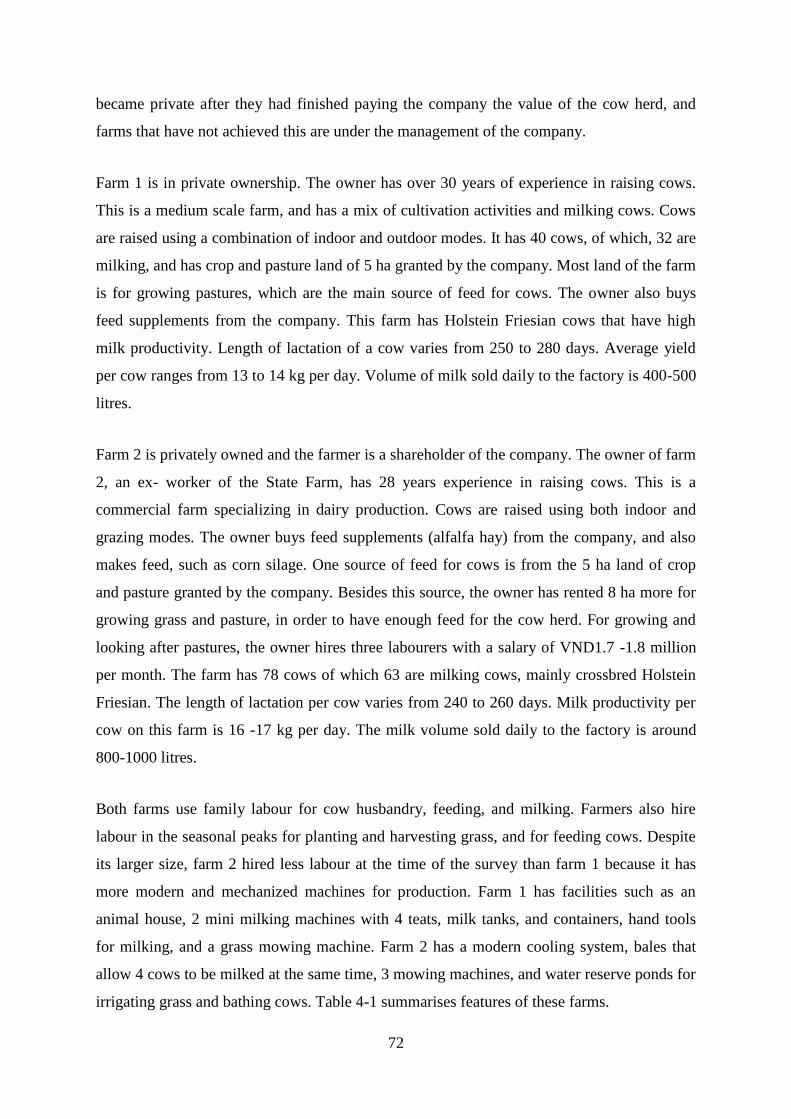
72
became private after they had finished paying the company the value of the cow herd, and
farms that have not achieved this are under the management of the company.
Farm 1 is in private ownership. The owner has over 30 years of experience in raising cows.
This is a medium scale farm, and has a mix of cultivation activities and milking cows. Cows
are raised using a combination of indoor and outdoor modes. It has 40 cows, of which, 32 are
milking, and has crop and pasture land of 5 ha granted by the company. Most land of the farm
is for growing pastures, which are the main source of feed for cows. The owner also buys
feed supplements from the company. This farm has Holstein Friesian cows that have high
milk productivity. Length of lactation of a cow varies from 250 to 280 days. Average yield
per cow ranges from 13 to 14 kg per day. Volume of milk sold daily to the factory is 400-500
litres.
Farm 2 is privately owned and the farmer is a shareholder of the company. The owner of farm
2, an ex- worker of the State Farm, has 28 years experience in raising cows. This is a
commercial farm specializing in dairy production. Cows are raised using both indoor and
grazing modes. The owner buys feed supplements (alfalfa hay) from the company, and also
makes feed, such as corn silage. One source of feed for cows is from the 5 ha land of crop
and pasture granted by the company. Besides this source, the owner has rented 8 ha more for
growing grass and pasture, in order to have enough feed for the cow herd. For growing and
looking after pastures, the owner hires three labourers with a salary of VND1.7 -1.8 million
per month. The farm has 78 cows of which 63 are milking cows, mainly crossbred Holstein
Friesian. The length of lactation per cow varies from 240 to 260 days. Milk productivity per
cow on this farm is 16 -17 kg per day. The milk volume sold daily to the factory is around
800-1000 litres.
Both farms use family labour for cow husbandry, feeding, and milking. Farmers also hire
labour in the seasonal peaks for planting and harvesting grass, and for feeding cows. Despite
its larger size, farm 2 hired less labour at the time of the survey than farm 1 because it has
more modern and mechanized machines for production. Farm 1 has facilities such as an
animal house, 2 mini milking machines with 4 teats, milk tanks, and containers, hand tools
for milking, and a grass mowing machine. Farm 2 has a modern cooling system, bales that
allow 4 cows to be milked at the same time, 3 mowing machines, and water reserve ponds for
irrigating grass and bathing cows. Table 4-1 summarises features of these farms.
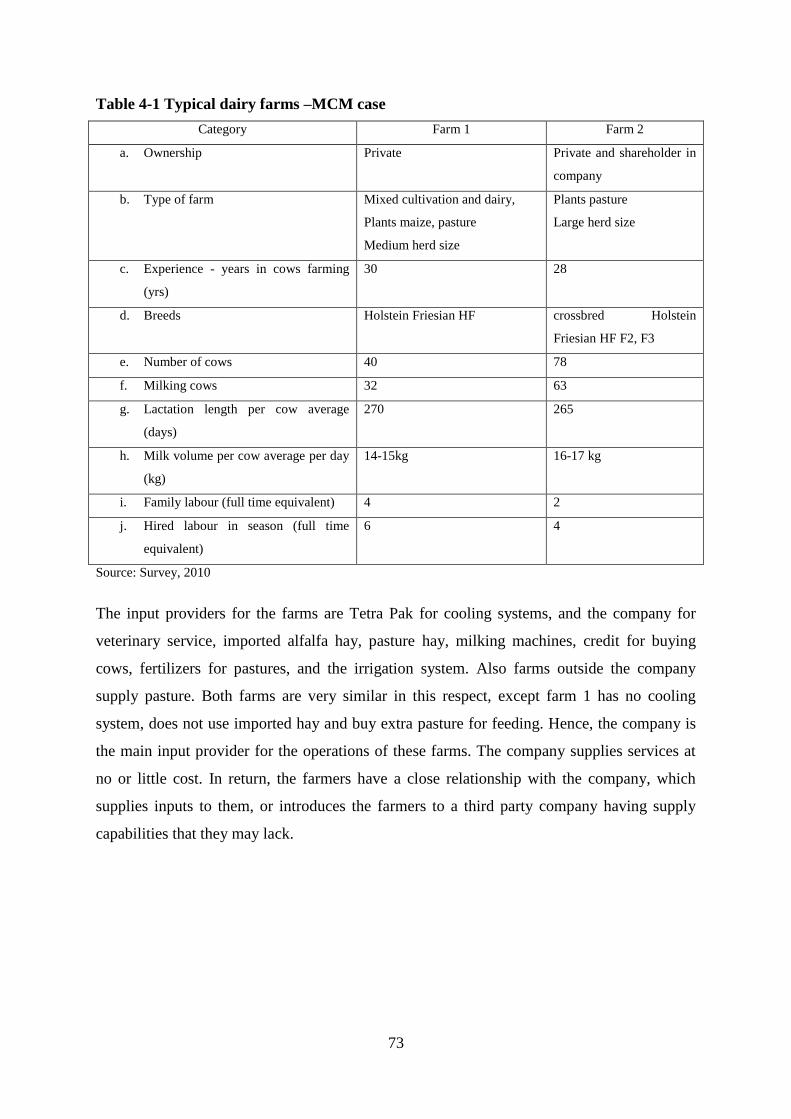
73
Table 4-1 Typical dairy farms –MCM case
Category Farm 1 Farm 2
a. Ownership Private Private and shareholder in
company
b. Type of farm Mixed cultivation and dairy,
Plants maize, pasture
Medium herd size
Plants pasture
Large herd size
c. Experience - years in cows farming
(yrs)
30 28
d. Breeds Holstein Friesian HF crossbred Holstein
Friesian HF F2, F3
e. Number of cows 40 78
f. Milking cows 32 63
g. Lactation length per cow average
(days)
270 265
h. Milk volume per cow average per day
(kg)
14-15kg 16-17 kg
i. Family labour (full time equivalent) 4 2
j. Hired labour in season (full time
equivalent)
6 4
Source: Survey, 2010
The input providers for the farms are Tetra Pak for cooling systems, and the company for
veterinary service, imported alfalfa hay, pasture hay, milking machines, credit for buying
cows, fertilizers for pastures, and the irrigation system. Also farms outside the company
supply pasture. Both farms are very similar in this respect, except farm 1 has no cooling
system, does not use imported hay and buy extra pasture for feeding. Hence, the company is
the main input provider for the operations of these farms. The company supplies services at
no or little cost. In return, the farmers have a close relationship with the company, which
supplies inputs to them, or introduces the farmers to a third party company having supply
capabilities that they may lack.
74
Table 4-2 Characteristics of input providers for farms-MCM case
Category Farm 1 Farm 2
a. Input providers (equipment, concentrated feeds,
veterinary services )
MCM MCM, Tetra Pak
b. Technical services and support
Through company technical staff visits
Buying imported alfalfa, hay from company at low
prices
Yes
No
Yes
Yes
c. Providing credit, loan sources MCM MCM, banks
Source: Survey, 2010.
Milking processes
Cows are milked twice a day on both farms, once in the morning and again in the afternoon.
Farms endeavour to follow hygienic and safe procedures in milking such as washing hands
using drinking water, using clean containers and clean cloths, and buckets with covers for
containers so excluding flies, insects, and other matter. Both farms have permanent places for
milking with a cement floor and iron roof.
Both farms have milking machines, but a different number of milking machines because of
differences in the volume of milk produced. Farm 1 uses 3 mini milking machines with 4 teat
cups. During a milking, 3 cows are milked at a time, each for 3-4 minutes. The milk is cooled
by well water in vats for 20-30 minutes before delivery to collection points. Farm 2 uses
milking bales with 16 teats, and during one milking, 4 cows are milked for 4-5 minutes. Milk
is cooled in the refrigerated cooling system run by electricity. It has a 400 litre capacity tank
installed by Tetra Pak under the pilot project.
Time stored after milking affects quality of milk, so after milking, milk needs to be brought
as soon as possible to collection points. Both farms are not far from collection stations. Farm
1 is 3 km from a collection point, and farm 2 is 700 m to the nearest collection point. The
company itself has 11 collection points for collecting milk from farms, and tries to shorten
the time from farms to collection points. The time that milk is stored on farms at present is up
to 3-4 hours, but may be up to 5-6 hours for farms having modern cooled systems. Such
systems are equipped under the pilot project of the Tetra Pak. The company recommends that
after milking they should bring the milk to collection points as quickly as possible.
75
QA system and quality concerns
There are no international QA systems, such as HACCP, applied at the farm level in Viet
Nam. Application of HACCP principles for farms has been discussed, but not considered
feasible. As an alternative to HACCP, the formulation of good agricultural practice GAP and
good dairy farming practice GDFP has been proposed in many countries, including Vietnam.
The dairy farms are applying Vietnamese Good Animal Husbandry Practice (VietGAHP).
Both farms surveyed in the Moc Chau area are the same with respect to the adoption of a QA
system in terms of starting time and the procedures they learnt from training courses. As
mentioned above, the company is a subsidiary of the Vietnam Livestock Husbandry
Corporation that is under the management of the Ministry of Agriculture and Rural
Development (MARD). These farms have had a trial application of a QA system, the
VietGAHP, as decreed by the MARD. This has been the ministerial standard for dairy
production since 2009 when MARD introduced a program to encourage the production of
clean and safe milk. The objectives of GAHP are to assure good conditions for feeding,
planting clean grass, and practicing hygiene procedures on farms that focus on animal
welfare, diseases treatment, especially mastitis, breed, and environmental conditions (MARD,
2008).
The content of VietGAHP is far-reaching, and includes selecting an appropriate site for dairy
cow husbandry, designing cow housing, and equipment management, breed genetics and
breed management, hygiene of cow housing, milking hygiene management, feed, drinking
water, bathing water, cow herd management, disease management, preservation and use of
veterinary drugs, waste water and environment management, employee management, record
keeping, document storage, internal auditing (MARD, 2008). There are a number of
indicators for monitoring the QA system. For example, in the breed management section,
indicators such as the clear origin of cow and the historical documentation of cows received
by the farmer when buying a cow and the quality of breeds must meet contemporary
requirements. In the husbandry hygiene section, equipment must be assured to be hygienic,
separate vehicles used for transporting milk and feed on the farm, and disinfecting milk cans
used to transport milk (MARD, 2008).
76
In practice, the indicators are often not achieved in conditions where dairy production is less
developed in Vietnam; for example, with animal welfare indicators, such as the monitoring
and treatment of mastitis. This condition is a concern in dairy production throughout the
world, including Vietnam. This condition causes decline of milk productivity and quality
(Khai, 2010) and it requires antibiotics for treatment. This condition occurs often in cows in
the area. Residue from mastitis treatment is one of reasons for rejecting milk by the company.
Furthermore, hygienic conditions may also not be met. These include dirty floors, not enough
clean cloths for milking, and re-using cloths, which can result in milk that is not hygienic. As
a result, rejects in collecting milk from farms still occur. For example, on farm 1, the number
of the rejects in the previous year was 4, whereas for farm 2 with its higher number of cows,
the number was 6. Generally, outcomes from the adoption of this QA system by farmers are
not clear at this time because this system has been only implemented for a year.
Quality testing
Controlling and inspecting milk quality through tests on farms does not occur at present.
Most fresh milk is checked at the collection point or on reception by the factory if farmers
deliver milk there; that is, testing milk is only done by the company when it receives milk. As
a result, farmers do not have any information about milk quality that is produced by them,
except grades of their milk. Some writers have commented that milk quality in Vietnam is
poorly managed and handled on farms, especially small farms, because of lack of testing and
checking equipment, and poor farming practices applied by farmers (Tuyen, 2007; Nancy et
al., 2007).
4.1.5.2 Collectors
General information
Collectors are intermediaries who collect raw milk from farmers. In other dairy production
areas in Vietnam, there are dealers in milk collection; but in Moc Chau area, there are only
collectors of the company. The explanation for this is the company was originally an ex-State
farm in the past, so other dealers and traders have not entered business in this area. To collect
milk from the farms and be convenient for dairy farmers, the company has 11 collection
points within 12-13 km diameter close to production areas. This assures that, after milking,
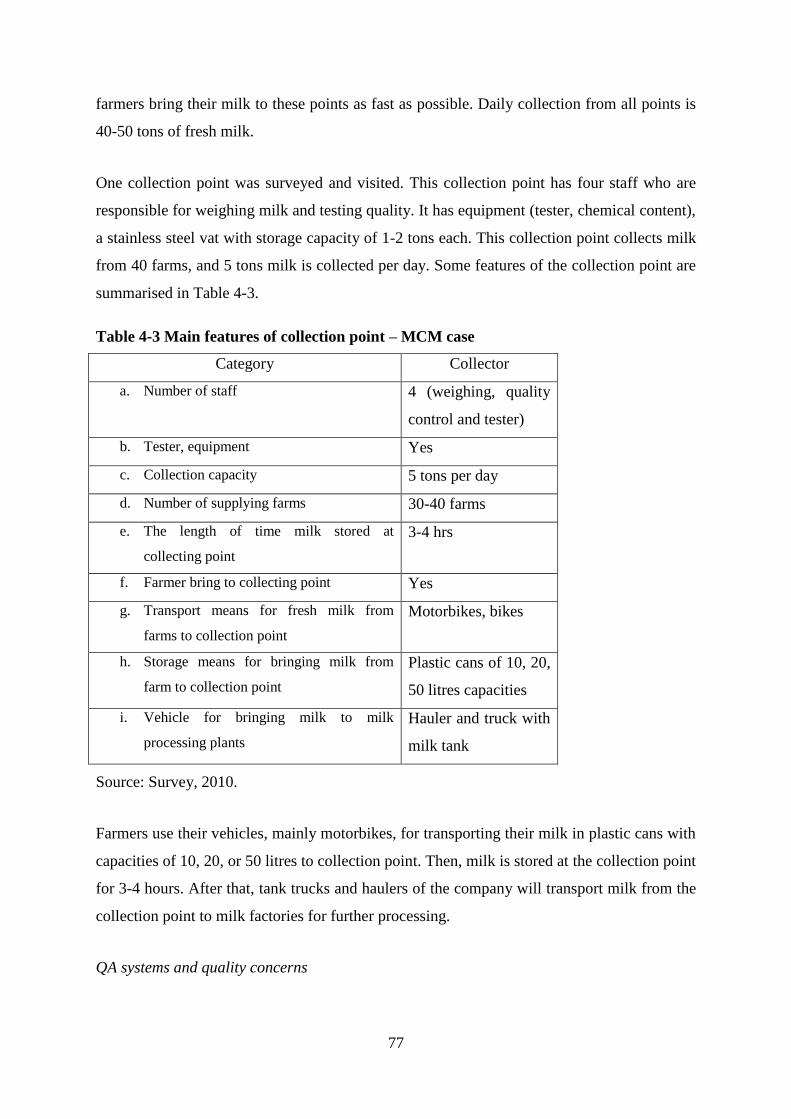
77
farmers bring their milk to these points as fast as possible. Daily collection from all points is
40-50 tons of fresh milk.
One collection point was surveyed and visited. This collection point has four staff who are
responsible for weighing milk and testing quality. It has equipment (tester, chemical content),
a stainless steel vat with storage capacity of 1-2 tons each. This collection point collects milk
from 40 farms, and 5 tons milk is collected per day. Some features of the collection point are
summarised in Table 4-3.
Table 4-3 Main features of collection point – MCM case
Category Collector
a. Number of staff 4 (weighing, quality
control and tester)
b. Tester, equipment Yes
c. Collection capacity 5 tons per day
d. Number of supplying farms 30-40 farms
e. The length of time milk stored at
collecting point
3-4 hrs
f. Farmer bring to collecting point Yes
g. Transport means for fresh milk from
farms to collection point
Motorbikes, bikes
h. Storage means for bringing milk from
farm to collection point
Plastic cans of 10, 20,
50 litres capacities
i. Vehicle for bringing milk to milk
processing plants
Hauler and truck with
milk tank
Source: Survey, 2010.
Farmers use their vehicles, mainly motorbikes, for transporting their milk in plastic cans with
capacities of 10, 20, or 50 litres to collection point. Then, milk is stored at the collection point
for 3-4 hours. After that, tank trucks and haulers of the company will transport milk from the
collection point to milk factories for further processing.
QA systems and quality concerns
78
At the surveyed time, there was not any QA system applied in the collection point, but quality
tests were done when collecting milk from farmers. The MCM has a strict and stringent
quality policy regarding intake of raw milk. At this stage, quality tests are conducted to
ensure that only fresh milk of the highest quality is accepted at the plant premises.
Internationally recognized tests are used to check for adulteration, microbiological
contamination and adequacy of nutritional content. Milk is easily spoiled and perishable after
a short time, so processors need to be compliant to strict procedures in collecting to lengthen
its shelf life (FAO, 2009).
At MCM, quality is tested daily against requirements at collection points and again at
inception into the factory. At the factory, the compositions of incoming milk are tested for
dry% ratio, protein, fat% ratio, and water by tests and visual inspection. Furthermore,
periodically, milk samples are taken randomly. Every day, quality staff takes 2 random
samples. In total, 14 samples a week are sent to a lab of the company for testing specific
parameters. These tests are for residues (chemical, metal, etc.) and additives. Tests used are
methylene blue colourless, alcohol, pH test, and other tests.
4.1.5.3 Processor
General information
As mentioned above, the company has two milk processing plants. One has a designed
capacity of 80 tons per day and another 40 tons per day. The number of employees in plant 1
is 165 and plant 2 is 138. Plant 1 produces sterilized, fresh milk, milk cake, and butter, and
plant 2 produces UHT milk and butter (Table 4-4).
The plants are short of milk supplies in the off-peak months during winter when milk yields
per cow are low and cows are being dried off. The time that the plants are not operating is
due to a lack of milk. This period is not as long as in other areas since Moc Chau area is very
suitable for milk production.
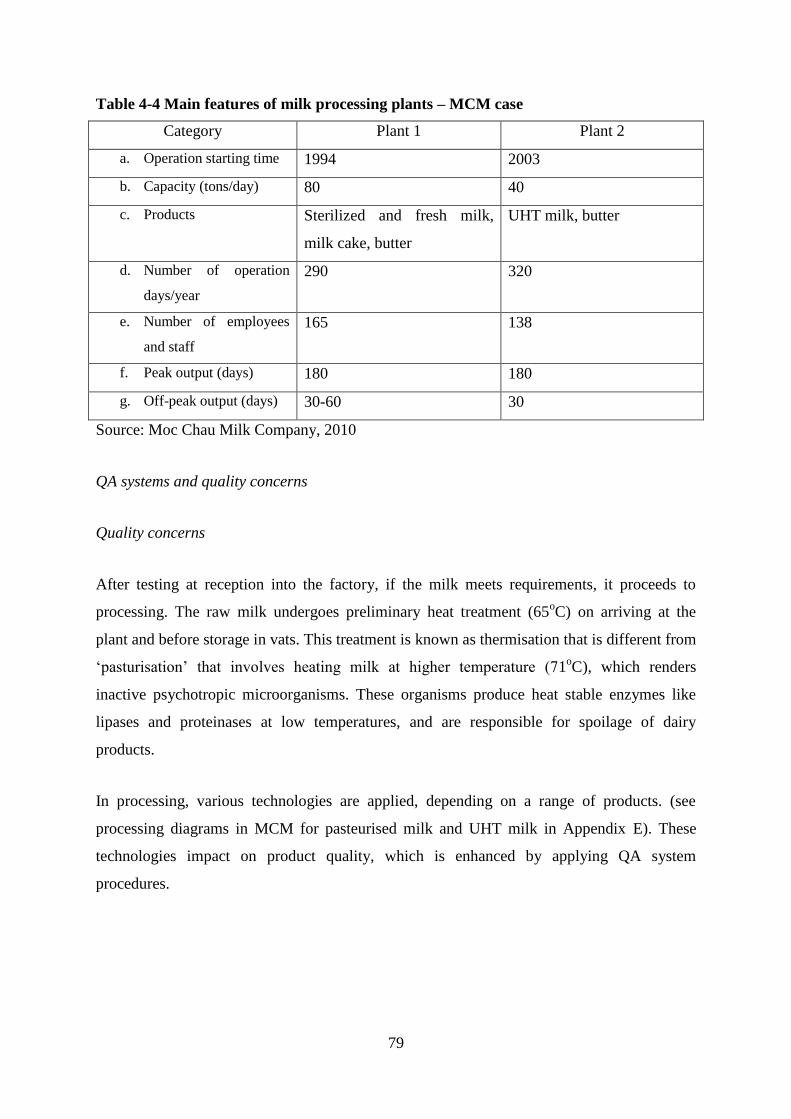
79
Table 4-4 Main features of milk processing plants – MCM case
Category Plant 1 Plant 2
a. Operation starting time 1994 2003
b. Capacity (tons/day) 80 40
c. Products Sterilized and fresh milk,
milk cake, butter
UHT milk, butter
d. Number of operation
days/year
290 320
e. Number of employees
and staff
165 138
f. Peak output (days) 180 180
g. Off-peak output (days) 30-60 30
Source: Moc Chau Milk Company, 2010
QA systems and quality concerns
Quality concerns
After testing at reception into the factory, if the milk meets requirements, it proceeds to
processing. The raw milk undergoes preliminary heat treatment (65oC) on arriving at the
plant and before storage in vats. This treatment is known as thermisation that is different from
„pasturisation‟ that involves heating milk at higher temperature (71oC), which renders
inactive psychotropic microorganisms. These organisms produce heat stable enzymes like
lipases and proteinases at low temperatures, and are responsible for spoilage of dairy
products.
In processing, various technologies are applied, depending on a range of products. (see
processing diagrams in MCM for pasteurised milk and UHT milk in Appendix E). These
technologies impact on product quality, which is enhanced by applying QA system
procedures.
80
QA systems in place
The plants have applied two international QA systems, HACCP and ISO. As noted above,
HACCP was first adopted in 2001 and ISO 9000 in 2003. Both certifications have been
issued by QUACERT, the State standards certifying organization; and plants must comply
with the requirements of these systems in order to gain certification. For example, in plant 1,
the milk is unloaded from haulers and is pumped into storage tanks, then filtered to separate
solid and other material; and in going through these stages, each process is identified for
Critical Control Points CCPs. For each type of milk product, different technology is applied,
so identification of CCPs is more complicated. During milk processing procedures, hazards
can occur at any stage from receiving the input milk to the storage phases.
According to feedback from respondents, the factors that affected the final milk products are
the quality of raw milk, the processing technology and processing techniques, storage
capability, and the inventory time for the final products. To keep final products free from
hazards and to ensure safety and quality, HACCP procedures and principles are crucial tools.
At present, MCM applies HACCP, as well as other measures associated with changes in
management and human resources needed to adapt to specific conditions. Validation of the
HACCP system shows through antibiotic testing methods, pasteurization parameters, product
formulations, product cooling rates, and raw material specifications. The plant manager
illustrated the difficulty and complicatious in applying of the HACCP in the plant:
„[…] Any change in the product formulation or process, such as changes in procedures on the
line, changes in equipment, change in raw materials supplier or specifications, changes in
cleaning processes and changes in testing method technology, leads to changes of procedures
to identify CCPs‟(MCM-p2).
The company encountered difficulties in the implementation of HACCP in the plants. Such
difficulties were identified by the plant manager:
„in implementation of this system [HACCP], we are lacking of capital to invest in modern
technology and testing equipment; a lack of experts or specialists with high capabilities and
skills in quality management, supply chain management and statistical knowledge; the low
level of employee quality control awareness and the intransigence of quality control
behaviour. The intransigence caused a lack of CCPs monitoring verification. For example,
lack of holding tubes, pH probes, lab control cultures, and a lack of validation of processing
81
parameters for innovative products, excessive document and record keeping that leads a tick
mentality and mindlessly filling form‟ (MCM-p2).
Another QAS, the ISO 9000, is adopted within the plants. The requirements of ISO have been
complied with by the company. However, similar to HACCP, the requirements of the ISO
9000 system have not been implemented completely in the plants of the company, but only to
minimal level requirements. Within ISO implementation, some steps are difficult to do,
which leads to varying degrees of implementation of ISO between the two certified plants.
One of reasons for this is lack of commitment of all employees to implementation. The
manager commented:
„…though commitment of top managers is there but understanding and participation of
employee for it [ISO] is limited‟ (MCM-p1).
Other difficulties are document development and control for this system. The company has a
team for ISO, but staff have a mix of activities or responsibilities, so efficiency is not high.
Furthermore, documentation for the ISO system are many and complicated (manual, 6
required procedure documents and 20 records). Internal auditing is necessary for trial
operation before external auditing. In the internal auditing process, considering documents
for improvement needs professional level of quality staff. Furthermore, duration and
frequency of training is a problem. The duration of training for employees to have an
understanding of ISO 9000 is short, normally 2-4 days, with basic knowledge of ISO
requirements and implementation steps. This does not result in thoroughly understanding
ISO. Quality staff and managers participate in training courses organized and provided by
quality agencies, but number of courses is small.
„…our team limit in quality knowledge because of lack of training courses and professional in
quality management „ (MCM-p1).
4.1.5.4 Wholesaler
General information
Manufactured and processed dairy products are distributed to consumers through the
wholesale and retail systems of the company. As mentioned above, the company has a
82
wholesale centre in Hanoi where products are distributed to retailers and agents in the
northern provinces of Vietnam.
QA system and quality concerns
Quality control in this segment mainly focuses on transport, storage, and warehouse
conditions. Dairy products are transported from milk processing plant to the wholesale centre
by refrigerated vehicles that assure product is of good quality. Then products are stored in
warehouses equipped with cooling systems to prolong shelf-life of milk products. However,
in summer, the temperature is high, which also affects milk quality, especially products that
are displayed and sold directly to consumers at milk shops.
While international QA systems implementation could improve quality in distribution stage,
there is not an international QA system applied in this stage, though HACCP or ISO, in
principle, can be extended to apply for this segment, as in other countries. Conditions for the
adoption of such systems at wholesale level are favourable because this wholesaling function
is part of the company. A QA system is in the planning stage and under consideration at the
wholesale level. The wholesale manager commented:
„ I have no ideas about this [QA system], and am waiting for decision from the company, …‟
(MCM-w1).
4.1.5.5 Retailer
General information
Distribution of final dairy products is done with agents (contracted) in urban cities, and
metropolitan areas. Quality issues to be addressed in this segment of the chain are assuring
quality via good storage and hygienic practices in shops that sell directly milk products to
consumers, and managing by-date products.
Surveyed retailers are located in different areas that have different customers. One is near the
company, and another is selling milk product in an urban area. They have equipment to
assure dairy products have proper storage, one has a fridge to store milk and ice cream,
another has two, one fridge –freezer and one fridge. MCMr1 is selling only dairy products
83
and MCMr2 is doing dairy products, cakes, and derived fruit juice, cakes, and breakfast
serving. In general, retailers‟ facilities are still poor, and hygienic practices are not in place;
for example, acts such as keeping the floors and tables clean, and utensils, glasses, spoons
sterilized, are not done frequently, and do not follow any procedures.
The retailers have a contract with the company, and mainly order goods from the wholesale
centre by phone when goods are sold out. Two retailers are small size, and so each time, they
order 2-3 boxes of 24 milk packs for selling.
In sum, poor facilities are shown for two retailers, and hygienic practices are not done
properly and frequently. That leads storage conditions for products are often near minimal
standards that are fresh milk is kept one day, pasteurised milk 7 days, and UHT 3 months.
Quality processes
Two factors affecting quality in distribution are transportation and storage conditions. In the
MCM chain, therefore, transportation from wholesaler to retailer, or from company to
retailer, and storage conditions in shops and sale outlets are considered. One retailer is not far
from the company and another retailer is in an urban area and far from the company. Quality
reduction through transportation and storage for the retailer near the company is lower than
for the other retailers further away from the company. Dairy products are transported from
wholesale to retailer mainly by motorbikes. As indicated by the wholesale manager:
„…we have warehouses equipped with good facilities to store [dairy] products before
distribution. However, quality problems may appear in following stages, in particular,
transport from wholesale to retail shops and agent by motorbikes, if what does occur when
it is summer, milk quality is sure to be reduced‟ (MCM-w1).
There are not international QA systems for these retailers. Reasons for not adopting
international QA systems, such as HACCP, ISO, BRC, are limited knowledge and
understanding of retailers about these systems. One retailer knew the name of these systems,
but did not know reasons why they do not apply them in practice.
„Yes, we know some quality programs, that are HACCP and ISO…Not clear reasons, but I guess that
we have not searched for any program that may apply in distribution stage…‟ (MCM-r1).
84
Another retailer did not know anything about these systems, but hoped to have one to
increase their sales.
„…we have no idea about it [QA system]…we don‟t know [reasons]. If having a quality
program that makes sales better, we may apply‟ (MCM-r2).
In addition, it is noted that there is not motivation for distributors in this chain to adopt QA
systems. For example, with respect to market pressures and competitive environment for this
MCM case, the decision making process and power leadership in the chain to apply QA
systems depends on the company.
Competition among chains is one factor that may lead to the adoption of QA system.
However, chains seem to be quite optimistic in the retailing segment, and this is one of the
reasons retailers do not adopt any QA system. Distributors, especially retailers, and even
agents, are selling milk products from different producers, even when an agent, according to
contract, only has permission to sell milk products from the company. Entry conditions for
agents are regulated but contract conditions may in practice be broken. A retailer said that:
„…we are selling some milk products from other suppliers to have more cash‟ (MCM-r2).
Furthermore, another reason is that consumers themselves do not insist on food quality and
safety certifications. One retailer stated that:
„They [consumers] never require us to have any QA system like a proof of quality assurance
of dairy products that we are selling‟ (MCM-r2).
Though there is no international QA system applied to retailers, a national standard for food
safety has been applied. This certification is issued by the Ministry of Public Health (MOH)
for food shops having conditions for food safety and hygiene. The objective of this regulation
is to enforce all sellers to sell safe food products to consumers. This is compulsory for all
food shops, including milk shops. That is also the reason why the standard that shops are
applying is popular in practice.
85
4.1.6 Conclusions
In this section, the MCM was described in terms of its historical and development process,
governance structure, its relationships and support to suppliers and distributors, and quality
processes in the food chain.
MCM, a joint stock company, has a long history with over 50 years in dairy production and
business. The company is small size and has two plants where milk is processed and
manufactured into final products, such as fresh milk, pasteurised milk, drinking yoghurt, and
milk cake. As a result of diversifying its range of dairy products and developing its source of
raw milk for production, in recent years, its turnover has seen remarkable growth. The
company produces dairy products to meet domestic demand, and its major market is Northern
provinces in Vietnam, where competition in distribution among competitors is not strong. Its
competitors in the North are IDP, HNM, Elovi company, Ba Vi company, VNFuture
company, and Phu Dong company, of which, HNM is larger company, and the remaining
ones are as small as MCM. These competitors have 6-7 years experience in dairy production
and business.
Regarding the MCM‟s supply chain, the company has a predominantly integrated structure
with 700 dairy farmers as suppliers producing milk on their farms, selling milk to the
company, and receiving technical support from company. The milk sourced from farmers is
then processed further in two plants into final products, which are then distributed to the
market through wholesale and retail channels in urban cities. Involved in the supply chain are
input suppliers and support organisations that play an important role in maintaining MCM‟s
production. These main input suppliers are Tetra Pak, MCM itself, banks and local extension
agents. Tetra Pak supplies machines and apparatus for farmers and the company; the MCM
supplies concentration feed and supports technical services to farmers; and the banks supply
credit to farmers to buy cows, feed, and machines. Support organizations, such as local
extension agents, provide veterinary services and extension training.
Some stakeholders in the chain have been adopted QA systems at different levels and at
different times for specific purposes. Farms have applied a QA system, VietGAHP, since
2009. This application is a trial of a clean milk program by MARD. The objective of this
86
system is to assure milk production is hygienic and safe through implementing good practices
in raising cows, milking, storage and transportation, as well as disease prevention and
control.
The next actor in the chain is the company/processor, which is considered the chain leader in
quality management and developing QA systems throughout the chain. MCM has
implemented ISO 9000 and HACCP within plants. ISO9000 began to be implemented in
2003 and HACCP in 2001. Other actors in the chain, collectors and wholesalers, do not apply
international QA systems, but comply with national standards and regulations. Collectors are
under the company‟s management, and are important intermediaries who collect milk from
farmers. Their functions are storing and testing quality at the first reception point.
Wholesalers have a vital role in distribution as well as quality management, from which end-
products are stored and transported to retailers. Retailers then distribute dairy products to the
market. Although application of international QA systems is not applied at this stage, a
national QA system, such as the food hygienic and safe certification for retailers and
industrial standards and procedures for storages and departure facilities for wholesalers, is
enforced. The wholesaler centre of the MCM has complied with the requirements of national
food certification since 1996 and industrial standards since 1997. In respect to food retailers,
once opening shops, retailers must comply with requirements of a national QA system, and
this system is mandatory. The two surveyed retailers have conformed to the national food
hygiene certification since 1995 and 1993, respectively.
In summary, implementation of these QA systems has occurred at different degrees and
times. Factors leading to these results are discussed further below.
4.2 Analysis
4.2.1 Introduction
As described in Chapter 3, one component of this study is to consider adoption of QA
systems by actors in the chain and factors influencing on this adoption process. These factors
include environment context, organisation characteristics context, and motivations/reasons
for adoption. Regarding environment context, three main factors identified by the literature
87
were legal, external support for firms in the chain, and market pressures. Organization
characteristics include firm size, top management, structure, and the nature of the firm‟s
products. Finally, motivations/reasons for the adoption of QA systems may be both internal
and external.
4.2.2 Perceived factors influencing adoption of QAS’s
4.2.2.1 Motivation
As mentioned above, MCM has two milk plants and one feed plant, of which the two milk
plants have obtained quality certifications, HACCP and ISO. Motivations for the adoption of
these systems were explored through interviewing a vice director. The two QA systems were
adopted separately at different times and are not integrated. The HACCP is often adopted
first by the food processors, and MCM is one example of this. The MCM gives reasons for
seeking HACCP certification, and these are related to quality improvement and meeting
international standards in order to maintain their existing customer base. The Vice director,
who was the Planning Department‟s head when the company adopted this system, recalls:
“I participated in meetings of directorate board that time when they [director and managers]
recognised that likely approaching international quality system that was popular in food
industry on the world was necessary if company desired to have high quality milk products
and preserve existing customers. HACCP system that they considered was their one of choices
then” (MCM-p1).
Prior to the adoption of QA systems by MCM, their competitive situation among dairy
processors was not strong in the Northern market; therefore, raising competitive advantage
through the adoption of them was not the primary reason that was considered by the MCM.
“In reality, up to 2005, the company did not have competitors in the Northern market. Most
milk companies, such as Elovi, Phu Dong, IDP, have been established since then” (MCM-p1).
It therefore appears that the MCM considered quality improvement as a motivation for
becoming certified HACCP. Motivations for adopting the HACCP system are different from
those for ISO 9000. ISO 9000 targets customer satisfaction through proper and efficient
management regimes, which leads to cost reduction and indirectly lead to quality
88
improvement. The company considered ISO 9000 system to be vital for entering new
markets. As commented by the vice director of the MCM:
“ISO 9000 system may bring us costs reduction and less error products in production and […]
our company also applies ISO 9000 with expectation of expanding markets to the Central and
Southern provinces where consumers may know more of this quality system” (MCM- p1).
The vice director identified factors that motivated ISO certification. These were to ensure
uniformity between two plants, retain existing customers, improve efficient utilization of
facilities and machines, and improve skills and attitude of employees towards quality. As
noted above, it appeared that the MCM become QA systems certified for both internal (firm
driven) and external (customer driven) reasons. Primary reasons for adoption of HACCP and
ISO 9000 are also different. While the primary motivation for the company to become
HACCP certified is primarily quality improvement, primary motivations of the company to
become ISO 9000 certified are expanding new markets and become more efficient, and so
reducing costs. This conclusion is consistent with opinions of interviewees assessed by a five-
point-scale in the survey‟s questionnaire and shown in Table 4-5:
Table 4-5 Motivations for seeking QAS’s – MCM case
Top five
motivations
HACCP ISO 9000
1 Improving product quality (I) Expanding market (E)
2 Improving company‟s image through
QA systems (E)
Improving company‟s image through QA
systems (E)
3 Expanding markets (E) Improve quality (I)
4 Raising competitive advantages over
competitors
Raising competitive advantages over
competitors
5 Improving skills of employee, staff
toward quality (I)
Improving skills of employee, staff toward
quality (I)
Note: I internal; E external
Once the managers were motivated to adopt a QA system, they considered factors, such as
the costs of QA systems and perceived benefits once the QA system was in place when
deciding to adopt. In particular, they considered the costs of initial set up and maintenance of
these systems. When the company began the process, it lacked information of these QA
systems and expected high benefits. However, the MCM, as a smaller company, indicated
89
that high fixed costs were associated with the implementation and maintenance of QA
system, and these were a bigger problem than setting up costs.
According to Vietnam Productivity Centre (VPC), setup costs such as hiring external
auditors, documentation, training courses for QA systems in Viet Nam is not high in
comparison with other countries. For instance, the auditing fee, not including training courses
and documentation, is around VND98 million (USD4,300) for a HACCP certificate, and is
VND76 million (USD3,800) for an ISO 9000 certificate (Dau, Q.A., personal
communication, July 5, 2010). However, investment in upgrading machines and equipment
may be high because machines and technologies in the two plants are old and out-of-date. As
a result, the ability to comply with requirements that are set by HACCP or ISO depends on
ability of the company to upgrade machines and equipment to standard requirements. As
noted by a vice director of the MCM:
“…costs for procuring machines to meet requirements of QA system was relatively high, this
was one of reasons why we relied on assistances from foreign projects and programs of the
government [when adopting QA systems]” (MCM- p1).
4.2.2.2 Environment context
External Support
The company received support when it was chosen as part of a quality improvement
initiative. HACCP has been adopted after a 1997 UNDP project invested in the company with
fresh milk assembly line and provided training courses on producing good quality milk.
Quality strategies had been considered by the company in a voluntary capacity but needed
external support by a facilitator. Facilitation of quality campaigns were organised by the
STAMEQ. Quality campaigns were also given attention by the governing bodies from 2000
with diffusions of quality systems within food processors in Vietnam. For example, the
HACCP program has been supported by Ministry of Industry (MOI). In this ministry, a
professional department (Department of Science and Technology) monitors progress on the
HACCP program‟s diffusion in businesses in industry. Quality organisations, such as VDP
and QUARCERT, through government programs, have supported domestic businesses in
obtaining the ISO 9000 certifications by providing training courses (VPC, 2009). The MCM
90
got such support to assist it to introduce HACCP and ISO 9000. In short, factors that
facilitated the MCM to adopt QA systems were assistance from an international body, the
UNDP, and national organizations, the VPC and MOI, which ensures support for a part of
setting up costs, and supplying information on QA systems for the MCM.
“Supports from foreign organizations, and associated authorities and agencies are vital for us
to think better quality system applicable soon in practice. Decision to adopt quality system is
as usual on cost benefit basis, if we have supports for quality activities, this adoption [of QA
system] occurred easily and sooner” (MCM-p1).
Development of SMEs in general and MCM in particular was given attention by the
government and other related organisations in the Reform process. Therefore, in combination
with other factors, external support was a factor in assisting MCM to obtain QA systems.
Market pressures
It appears that any association between QA system adoption and buyers‟ pressure and
requirement, as well as competition from competitors of the company, was not strong. Most
competitors of MCM are newly established and these competitors have traded dairy products
in the Northern provinces since 2005. As a vice director commented:
“… [prior 2005] in the North, MCM was the first dairy company adopting QA system, and
when the company adopted HACCP, there were few companies in dairy market. Under that
situation, MCM seemed to have a monopoly in supplying fresh milk products to consumers.
Furthermore, we did not have enough milk to sell because demand for Moc Chau milk was so
high”. (MCM- p1)
As mentioned above, before 2005, competition within the dairy market was not fierce,
especially in the Northern markets and for liquid milk. Therefore, it seems unlikely that this
was a factor that affected the company‟s decision to adopt QA systems in order to gain
competitive advantage and a lead on competitors in the market. Another factor could have an
association with the adoption of QA systems by the company is buyers‟ pressure; that is
consumers and retailers in down-stream requiring a dairy company to have quality
certification. But this association was not present in this case. For MCM case, it was found
91
that the perception and understanding of consumers of quality labels on milk packs and milk
bags, which show the company has applied QA systems, is limited. As reported by a
wholesaler of MCM:
„…consumer did not pay much notice to quality labels [with QA system symbols], and they
seem not to know more of meanings of these labels…” (MCM-w1).
This may be a reason why the company did not rely heavily on pressure from consumers
when it decided to establish QA systems. Instead, its attitudes and strategies towards quality
improvement and supplying high quality milk to consumers seems to be geared to protecting
consumer as well as keeping its reputation intact.
Legal
The legal requirements for food safety and quality have been established by government, with
the objective of protecting consumers and ensuring that foods are fit for human consumption.
These requirements are contained in food laws and regulations. As mentioned in previous
Chapter 1, in recent years, three important laws have been approved and issued by the
Vietnamese National Assembly relating to food safety and hygiene. These are the Ordinance
on Hygiene and Safety of Foods 2003, the Food Law 2008; and the Law on the Quality of
Products and Goods 2008 (FCNA Food Committee of National Assembly, 2009). The
Ordinance on the Hygiene and Safety of Foods 2003 focuses on the protection of consumers,
and with this Act has come a particular understanding of the term „reasonable precautions‟.
Consequently, the contribution of formal QA systems to food safety management has been
recognized legally. As with quality management, prevention has become the byword for food
safety management.
In seeking to comply with the requirements of the Food Law, and to ensure ability to mount a
competent defence in the event of prosecution under the Law, many food companies have
implemented HACCP systems. A relevant of the Ordinance on the Hygiene and Safety of
Foods 2003 stated that:
92
” This Ordinance regulates the ensuring of hygiene and safety of foodstuffs
during the process of manufacture and trading and the prevention and
remedying of poisonous foodstuffs and contagion via foodstuffs.” (Article 1,
the Ordinance on the Hygiene and Safety of Foods 2003, p1, Vietnamese
National Assembly, 2003).
“Trading in foodstuffs is a conditional business line. Organizations, family
households and individuals manufacturing and trading foodstuffs shall be
responsible for the hygiene and safety of the foodstuffs manufactured or
traded.” (Article 4, the Ordinance on the Hygiene and Safety of Foods 2003,
p1, Vietnamese National Assembly, 2003).
In the Law on the Quality of Products and Goods 2008, it is stated that:
“…Producers must comply with requirements of product quality in the
production as follows: applying management systems is aiming at assuring
product quality that they produce conforms with applied and announced
standards, technical standards accordingly…” (Article 28, Law on the
Quality of Products and Goods 2008, p.32, 2008)
However, at the time when the company made a decision on the choice of a QA system, it
was influenced more by the Ordinance on the Hygiene and Safety of Foods 2003. In the food
industry, MCM is one of the businesses processing and manufacturing dairy products. As
such, legislation and national regulations is one of factors that require the MCM to obtain a
QA certificate. As commented director of MCM:
“ We do business in dairy products. Safety of consumers is very important for us. Therefore,
we frequently search for proper measures to improve product quality […] and must have an
obligation with the State laws and regulations related to foodstuff safety. An application of
international quality systems is one of our choices. We think it is also the best option”
(MCM-p1).
The government started its HACCP plan in 2002 and has since enforced it. This sets up the
target of “aiming for eighty percent of foodstuff processors have HACCP certificate by the
year 2010, and 100% food processors have HACCP certificate by the year 2020” (MOH,
93
2010, p.1). There seems to be a relationship between this plan and the quality strategies of
food businesses, including dairy businesses; and HACCP is starting to be mandatory for food
processors. For example, the Decision 37/2007 issued by Ministry of Public Health MOH,
mandates HACCP for businesses doing business in 10 “high risk” foods groups2, such as
dairy, fish, meat, vegetable, fruit. This is likely to be one of factors that motivate domestic
food businesses to begin to meet the necessary conditions to obtain HACCP. However, the
MCM was not influenced strongly by this particular Decision because it adopted HACCP in
2001.
In contrast to the law relating to the HACCP system, the legislations and acts do not regulate
the firms to become certified ISO 9000 system. As defined, ISO is quality assurance tool and
is characterized by more voluntary application than the HACCP system. In this case,
government often publicises ISO 9000 and seeks participation from the firms. This means
that firms do not rely on any act for its adoption decision. That is one of reasons why firms
often obtain HACCP system prior to ISO9000.
In addition to legal requirements, national and ministerial standards are considered as
requirements for the food industry to assure products are fit for consumer consumption. Dairy
products are classified as a high-risk food product in aspects of risks in consumption and
harming consumers (Decision 11/2006/QD-BYT). In Vietnam, National Standards known as
TCVN are established for product groups. For example, for dairy products, the standards
TCVN 7028:2002, TCVN 7029: 2002, and TCVN 7030: 2002 are technical regulations for
sterilized milk, sterilized homogenised milk, and yoghurt milk products, respectively
(Vietnam SPS organisation, n.d). Dairy businesses have an obligation to meet these
requirements as a prerequisite for its production and manufacture activities. Hence, the MCM
is a dairy business that must comply with the requirements for producing fresh and sterilized
milk products. These National Standards are mandatory for dairy businesses. A benefit of
them is that they give them experience and so become basic prerequisites in accessing other
international quality standards.
2 High risk foods are foods with a high possibility of contamination by biological, chemical and/or physical
agents and which may affect the health of consumers (The Ordinance on the Hygiene and Safety of Foods 2003,
Article 3.11).
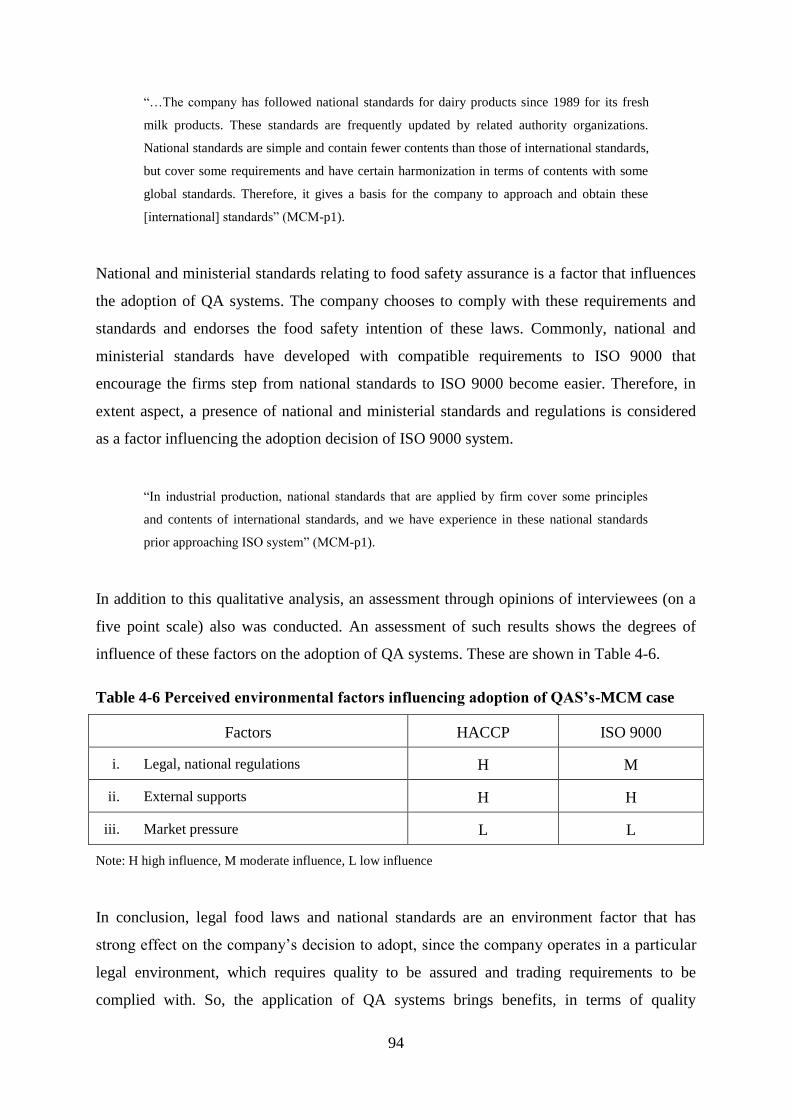
94
“…The company has followed national standards for dairy products since 1989 for its fresh
milk products. These standards are frequently updated by related authority organizations.
National standards are simple and contain fewer contents than those of international standards,
but cover some requirements and have certain harmonization in terms of contents with some
global standards. Therefore, it gives a basis for the company to approach and obtain these
[international] standards” (MCM-p1).
National and ministerial standards relating to food safety assurance is a factor that influences
the adoption of QA systems. The company chooses to comply with these requirements and
standards and endorses the food safety intention of these laws. Commonly, national and
ministerial standards have developed with compatible requirements to ISO 9000 that
encourage the firms step from national standards to ISO 9000 become easier. Therefore, in
extent aspect, a presence of national and ministerial standards and regulations is considered
as a factor influencing the adoption decision of ISO 9000 system.
“In industrial production, national standards that are applied by firm cover some principles
and contents of international standards, and we have experience in these national standards
prior approaching ISO system” (MCM-p1).
In addition to this qualitative analysis, an assessment through opinions of interviewees (on a
five point scale) also was conducted. An assessment of such results shows the degrees of
influence of these factors on the adoption of QA systems. These are shown in Table 4-6.
Table 4-6 Perceived environmental factors influencing adoption of QAS’s-MCM case
Factors HACCP ISO 9000
i. Legal, national regulations H M
ii. External supports H H
iii. Market pressure L L
Note: H high influence, M moderate influence, L low influence
In conclusion, legal food laws and national standards are an environment factor that has
strong effect on the company‟s decision to adopt, since the company operates in a particular
legal environment, which requires quality to be assured and trading requirements to be
complied with. So, the application of QA systems brings benefits, in terms of quality
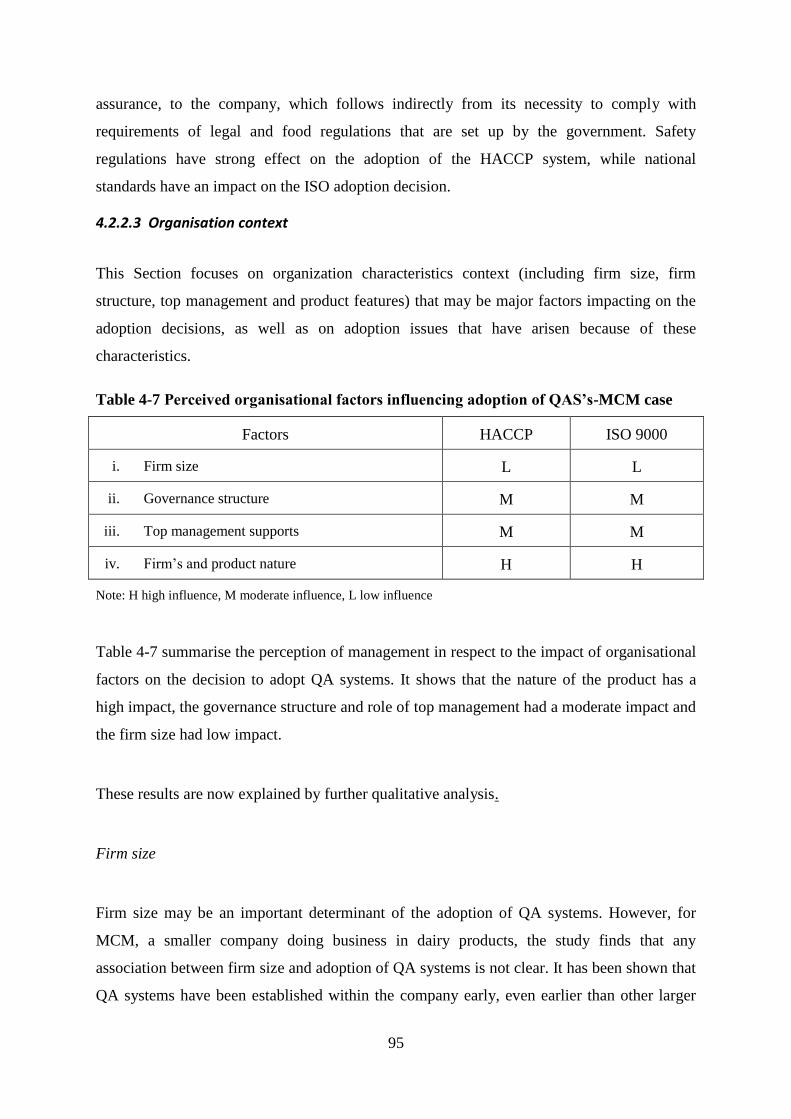
95
assurance, to the company, which follows indirectly from its necessity to comply with
requirements of legal and food regulations that are set up by the government. Safety
regulations have strong effect on the adoption of the HACCP system, while national
standards have an impact on the ISO adoption decision.
4.2.2.3 Organisation context
This Section focuses on organization characteristics context (including firm size, firm
structure, top management and product features) that may be major factors impacting on the
adoption decisions, as well as on adoption issues that have arisen because of these
characteristics.
Table 4-7 Perceived organisational factors influencing adoption of QAS’s-MCM case
Factors HACCP ISO 9000
i. Firm size L L
ii. Governance structure M M
iii. Top management supports M M
iv. Firm‟s and product nature H H
Note: H high influence, M moderate influence, L low influence
Table 4-7 summarise the perception of management in respect to the impact of organisational
factors on the decision to adopt QA systems. It shows that the nature of the product has a
high impact, the governance structure and role of top management had a moderate impact and
the firm size had low impact.
These results are now explained by further qualitative analysis.
Firm size
Firm size may be an important determinant of the adoption of QA systems. However, for
MCM, a smaller company doing business in dairy products, the study finds that any
association between firm size and adoption of QA systems is not clear. It has been shown that
QA systems have been established within the company early, even earlier than other larger
96
dairy businesses in the country. As noted above, small and medium sized firms in Vietnam
usually receive certain support from the government through development programs.
Furthermore, low costs for setting up initial QA systems may be a favourable condition for
these businesses in getting quality certification. As assessed by a plant manager:
“The company has two milk plants and a feed plant, and to put them on uniform quality
system certification has been a concern of directors. The company is small size that is
advantage for getting quality certifications, especially a small plant size bears lower a set up
cost to get HACCP than large plants. Besides, support from the government in obtaining a
quality system is applicable for small and medium firms. This is one factor for a quality
system coming into practice in our company” (MCM-p2).
This indicates that small firms may have an advantage over larger firms in obtain QA systems
because of lower set up costs for QA systems, such as registrar‟s cost and auditing fees. The
only problem for MCM is the high costs for upgrading its technology and facilities. However,
the extent of such costs depends on the plants‟ status and the necessity for maintenance of the
QA systems in the long term.
Governance structure
With respect to complexity, the MCM has some complexity, since it performs different
activities, including selling dairy products: fresh milk, sterilized milk, drinking yoghurt, and
cake milk. Many diverse and hierarchical departments within the MCM organisation can
affect the adoption of QA systems, as quality management is part of the process. The
company has a QC division reporting issues relating to product quality to its administration
department. Some quality issues have arisen because of the complexity of processes:
“Production process is complicated and includes many activities, quality control is difficult,
furthermore, mixed up assigning tasks to staff [QC] occurs”(MCM-p1)
The calibre of personnel team has a vital role in determining whether QA systems are
adopted efficiently within plants of the company for HACCP, and within the company and
plants for ISO9000. The MCM has a long history in dairy production, so it has extensive
97
prior experience in quality management. This experience is one of the factors that makes the
decision-making process easier.
“QC staff group with their experience is a thinking tank for quality and first wave of quality
systems” (MCM-p1).
However, one limitation could be posed by the organization structure, as the QC division is
responsible directly to the administration department. There is not a separate quality
management section, and it is not directly ruled and led by the directorate board but by the
administration department. Hence, decision making requires two stages of agreement among
plant managers, administration department, and the director board.
“[…] MCM is still owned by the State with major share, so its organisational structure found
like old planning management style” (MCM-p1).
Top management support
The top management factor deals with the role of top managers (directors and plant
managers) and their influence on quality control and decision processes of QA system
adoption. The managers who are the decision makers on quality management strategies and
the application of this innovation (i.e. QA system) have an undergraduate education, though
not in food technology or microbial biology, but they are concerned about producing quality
products and give a lot of encouragement to employees and staff. They got commitments
from employees before the discussion to adopt QA systems, which they considered vital. The
influence of this factor appears to be strong with respect to promoting a QA system in place.
The Directorate board of the MCM was appreciated highly by MARD when they applied QA
systems for quality improvement.
“The company has directors who have high qualification in management and support
strongly a quality campaign that company pursuits” (MCM-p2).
98
Firm’s and product nature
As noted above, MCM is doing business in dairy products, which is the one of ten high-risk
food groups classified by Vietnamese authorities. Because of characteristics of these
products, the company puts strong emphasis on complying with standards requirements to
avoid unnecessary penalties and fines, and uses this feature to support the sustainable growth
in sales and profit. In this regard, the decision of dairy processor to adopt QA systems is
different from that for other processors in the food sector, such as tea, maize or rice. These
products often do not cause immediate harm to consumers in respect to food poisoning or
acute food-borne illness.
“Product is also factor we think of improving quality, and following international standards,
and easy to accept by consumers on the markets, especially dairy products that are sensitive
and easy spoiled may affect people‟s health. We need to prove our products safe and good for
consumers in domestic. … Dairy products are required highly by consumers in terms of
quality and safety for their health. The application of HACCP may allow us to satisfy that
demands of consumer” (MCM-p1).
4.2.3 Perceived impacts of QA systems on organisational outcomes
One of the objectives of this study is to identify any associations between QA systems and
organisation outcomes. There will be interactions and interrelationships among QA systems
and between the various performance dimensions and so associations between them may be
difficult to identify. Therefore, objective measures were supplemented by subjective
perceptions of outcomes. A list of potential outcomes from QA systems were identified and
shown to respondents, which they were then asked to rank. Firm‟s outcomes were measured
through business and financial results, and production quality dimensions. Overall outcomes
were evaluated by respondents‟ opinions, and data from the company‟s reports.
According to reports of the company, MCM‟s business results have changed dramatically in
recent years. Its turnover has shown rapid growth, in line with an increase of profit, and
salaries paid for employees. Furthermore, its market for dairy products has expanded to 35
out of 65 provinces in the country. These business results are detailed in Table 4-8.
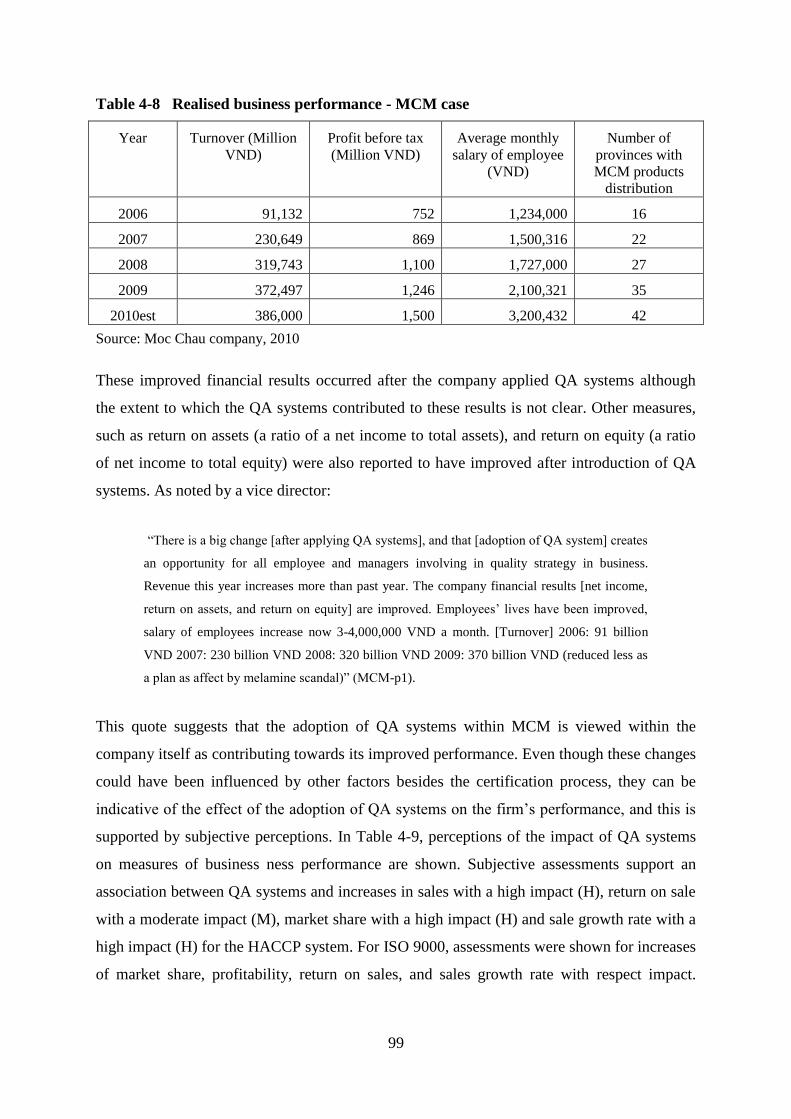
99
Table 4-8 Realised business performance - MCM case
Year Turnover (Million
VND)
Profit before tax
(Million VND)
Average monthly
salary of employee
(VND)
Number of
provinces with
MCM products
distribution
2006 91,132 752 1,234,000 16
2007 230,649 869 1,500,316 22
2008 319,743 1,100 1,727,000 27
2009 372,497 1,246 2,100,321 35
2010est 386,000 1,500 3,200,432 42
Source: Moc Chau company, 2010
These improved financial results occurred after the company applied QA systems although
the extent to which the QA systems contributed to these results is not clear. Other measures,
such as return on assets (a ratio of a net income to total assets), and return on equity (a ratio
of net income to total equity) were also reported to have improved after introduction of QA
systems. As noted by a vice director:
“There is a big change [after applying QA systems], and that [adoption of QA system] creates
an opportunity for all employee and managers involving in quality strategy in business.
Revenue this year increases more than past year. The company financial results [net income,
return on assets, and return on equity] are improved. Employees‟ lives have been improved,
salary of employees increase now 3-4,000,000 VND a month. [Turnover] 2006: 91 billion
VND 2007: 230 billion VND 2008: 320 billion VND 2009: 370 billion VND (reduced less as
a plan as affect by melamine scandal)” (MCM-p1).
This quote suggests that the adoption of QA systems within MCM is viewed within the
company itself as contributing towards its improved performance. Even though these changes
could have been influenced by other factors besides the certification process, they can be
indicative of the effect of the adoption of QA systems on the firm‟s performance, and this is
supported by subjective perceptions. In Table 4-9, perceptions of the impact of QA systems
on measures of business ness performance are shown. Subjective assessments support an
association between QA systems and increases in sales with a high impact (H), return on sale
with a moderate impact (M), market share with a high impact (H) and sale growth rate with a
high impact (H) for the HACCP system. For ISO 9000, assessments were shown for increases
of market share, profitability, return on sales, and sales growth rate with respect impact.
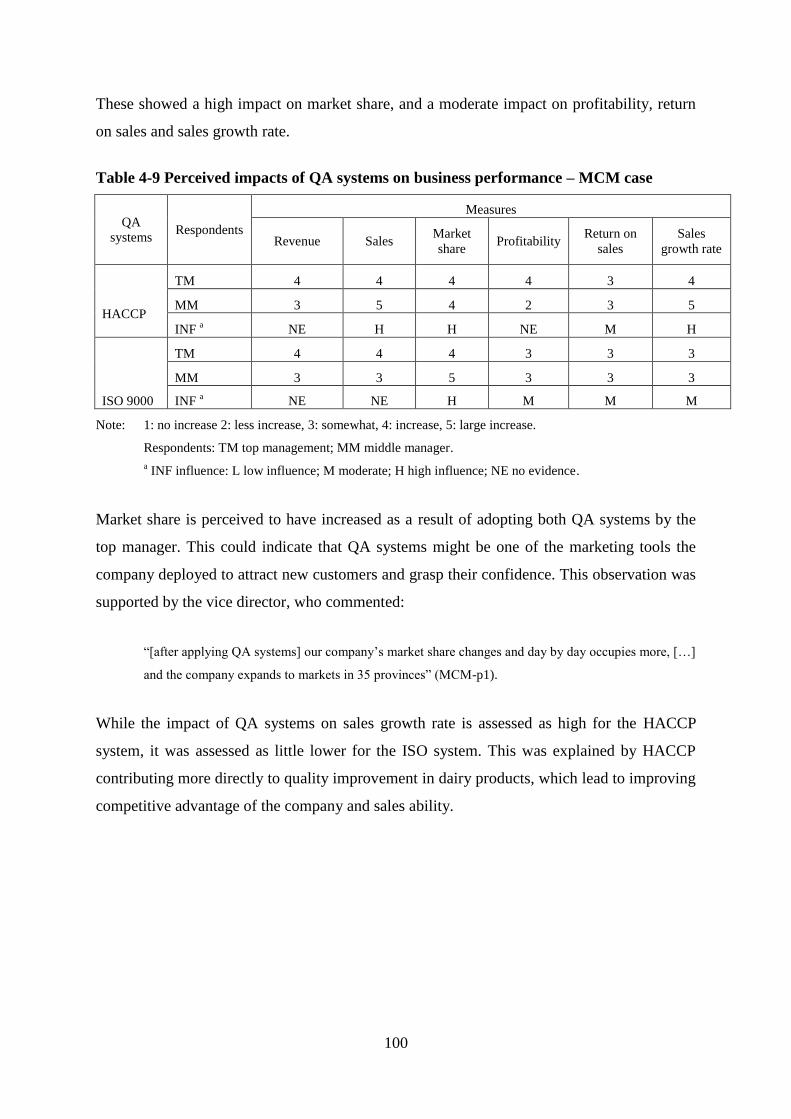
100
These showed a high impact on market share, and a moderate impact on profitability, return
on sales and sales growth rate.
Table 4-9 Perceived impacts of QA systems on business performance – MCM case
QA
systems Respondents
Measures
Revenue Sales Market
share Profitability
Return on
sales
Sales
growth rate
HACCP
TM 4 4 4 4 3 4
MM 3 5 4 2 3 5
INF a NE H H NE M H
ISO 9000
TM 4 4 4 3 3 3
MM 3 3 5 3 3 3
INF a NE NE H M M M
Note: 1: no increase 2: less increase, 3: somewhat, 4: increase, 5: large increase.
Respondents: TM top management; MM middle manager.
a INF influence: L low influence; M moderate; H high influence; NE no evidence.
Market share is perceived to have increased as a result of adopting both QA systems by the
top manager. This could indicate that QA systems might be one of the marketing tools the
company deployed to attract new customers and grasp their confidence. This observation was
supported by the vice director, who commented:
“[after applying QA systems] our company‟s market share changes and day by day occupies more, […]
and the company expands to markets in 35 provinces” (MCM-p1).
While the impact of QA systems on sales growth rate is assessed as high for the HACCP
system, it was assessed as little lower for the ISO system. This was explained by HACCP
contributing more directly to quality improvement in dairy products, which lead to improving
competitive advantage of the company and sales ability.
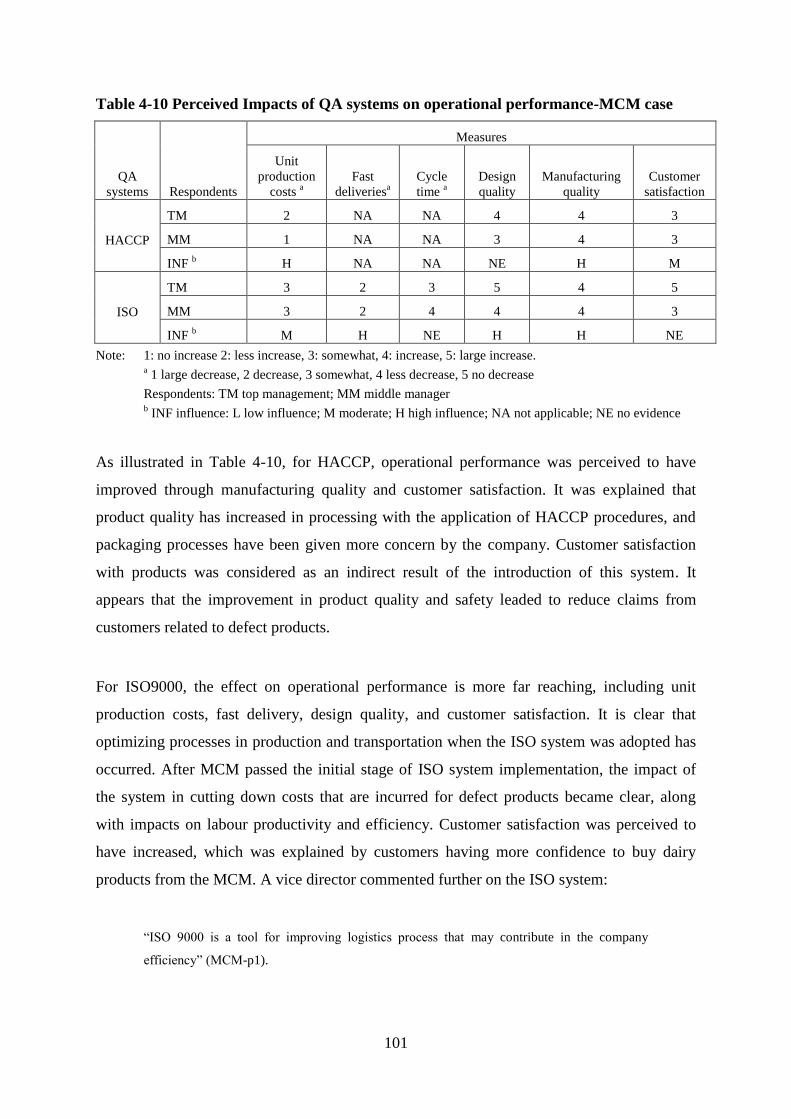
101
Table 4-10 Perceived Impacts of QA systems on operational performance-MCM case
QA
systems Respondents
Measures
Unit
production
costs a
Fast
deliveriesa
Cycle
time a
Design
quality
Manufacturing
quality
Customer
satisfaction
HACCP
TM 2 NA NA 4 4 3
MM 1 NA NA 3 4 3
INF b H NA NA NE H M
ISO
TM 3 2 3 5 4 5
MM 3 2 4 4 4 3
INF b M H NE H H NE
Note: 1: no increase 2: less increase, 3: somewhat, 4: increase, 5: large increase. a 1 large decrease, 2 decrease, 3 somewhat, 4 less decrease, 5 no decrease
Respondents: TM top management; MM middle manager b INF influence: L low influence; M moderate; H high influence; NA not applicable; NE no evidence
As illustrated in Table 4-10, for HACCP, operational performance was perceived to have
improved through manufacturing quality and customer satisfaction. It was explained that
product quality has increased in processing with the application of HACCP procedures, and
packaging processes have been given more concern by the company. Customer satisfaction
with products was considered as an indirect result of the introduction of this system. It
appears that the improvement in product quality and safety leaded to reduce claims from
customers related to defect products.
For ISO9000, the effect on operational performance is more far reaching, including unit
production costs, fast delivery, design quality, and customer satisfaction. It is clear that
optimizing processes in production and transportation when the ISO system was adopted has
occurred. After MCM passed the initial stage of ISO system implementation, the impact of
the system in cutting down costs that are incurred for defect products became clear, along
with impacts on labour productivity and efficiency. Customer satisfaction was perceived to
have increased, which was explained by customers having more confidence to buy dairy
products from the MCM. A vice director commented further on the ISO system:
“ISO 9000 is a tool for improving logistics process that may contribute in the company
efficiency” (MCM-p1).
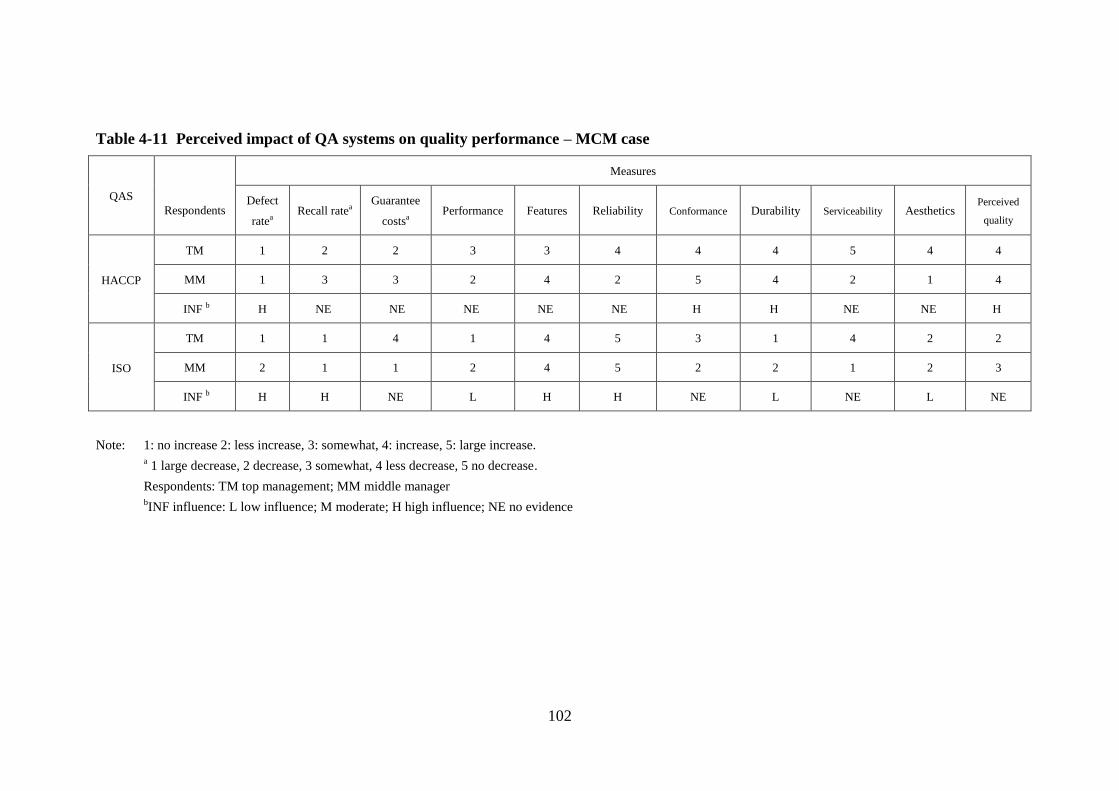
102
Table 4-11 Perceived impact of QA systems on quality performance – MCM case
QAS
Respondents
Measures
Defect
ratea Recall ratea
Guarantee
costsa Performance Features Reliability Conformance Durability Serviceability Aesthetics
Perceived
quality
HACCP
TM 1 2 2 3 3 4 4 4 5 4 4
MM 1 3 3 2 4 2 5 4 2 1 4
INF b H NE NE NE NE NE H H NE NE H
ISO
TM 1 1 4 1 4 5 3 1 4 2 2
MM 2 1 1 2 4 5 2 2 1 2 3
INF b H H NE L H H NE L NE L NE
Note: 1: no increase 2: less increase, 3: somewhat, 4: increase, 5: large increase. a 1 large decrease, 2 decrease, 3 somewhat, 4 less decrease, 5 no decrease.
Respondents: TM top management; MM middle manager bINF influence: L low influence; M moderate; H high influence; NE no evidence
103
As illustrated in Table 4-11, the key effects of QA systems on product quality performance
was perceived to be in decreases of defect rate, and increases of conformance, durability, and
perceived quality after the company adopted HACCP, and increases of features and reliability
resulting from the adoption of ISO9000. The system also contributed to product quality
improvement. A vice director commented on effects of the two QA systems:
“ both [HACCP and ISO] systems bring direct and indirect benefits to the company in terms of
improving product quality in general…” (MCM-p1).
4.2.4 Conclusions
The Section analysed reasons that motivate the MCM to adopt QA systems. Primary reasons
for the adoption of the HACCP system are quality improvement and meeting international
standards to maintain its customer base, but not competition with its competitors. Primary
reasons for the adoption of the ISO 9000 system are customer satisfaction through efficient
management regimes, which leads to cost reduction and quality improvement. Reasons such
as uniformity between plants, retaining existing customers, improving efficient utilization and
improving skills/attitudes of employee are also mentioned. Issues arising in implementation
were explored, and it was concluded that set up costs were not high, but costs for upgrading
equipment, machinery and technology were high.
The study also focused on factors that impact on adoption decisions. Factors were considered
under two major categories, environment context and organisation characteristics context. For
the MCM case, there was a moderate impact from external support factors on its adoption
decision. This support was from an international organization (i.e. UNDP) through providing
training courses and capital support, and national organizations such as STAMEQ, VPC,
MOI, through initial support of partial setting up costs for QA systems registration. There did
not appear to be any impact from market pressure factors on MCM‟s adoption decision in
respect to buyer pressure and competitor pressure. This finding shows that legal food law and
national standards are an environment factor that has a strong influence on the company‟s
decision to adopt, since the company operates in a particular legal environment, which
requires quality to be assured and trading requirements to be complied with. Safety
regulations have a strong effect on HACCP system adoption, while national standards have
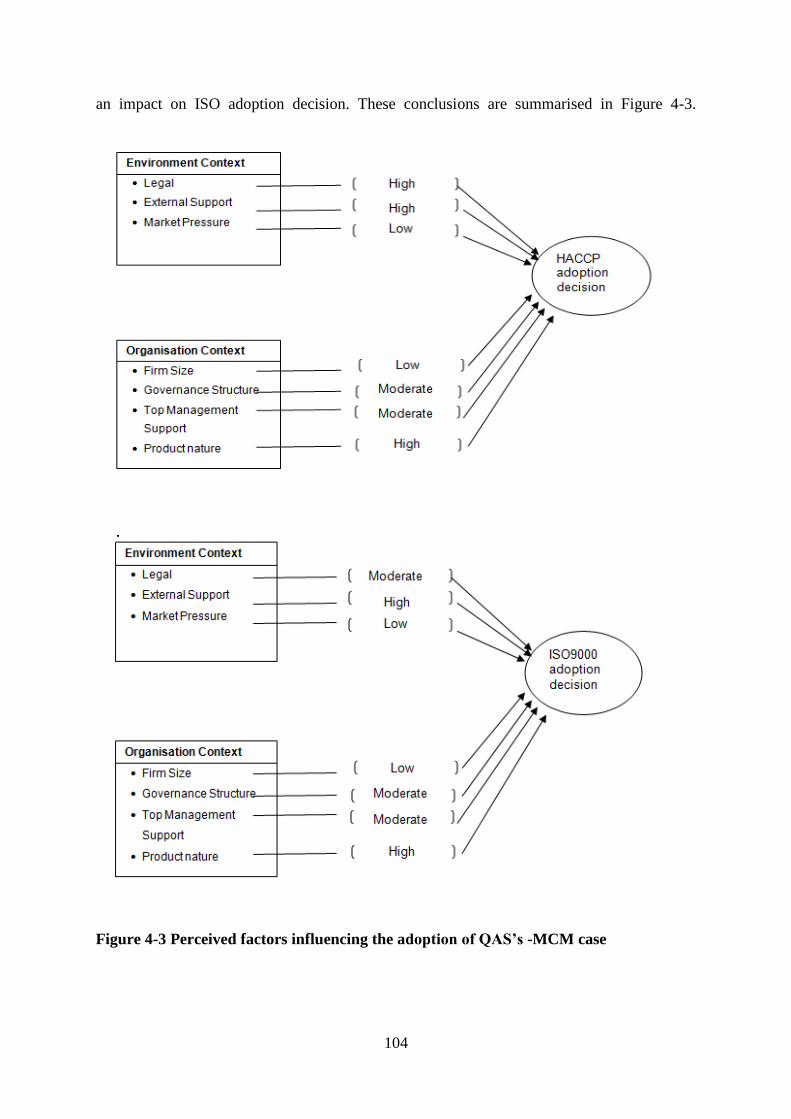
104
an impact on ISO adoption decision. These conclusions are summarised in Figure 4-3.
Figure 4-3 Perceived factors influencing the adoption of QAS’s -MCM case
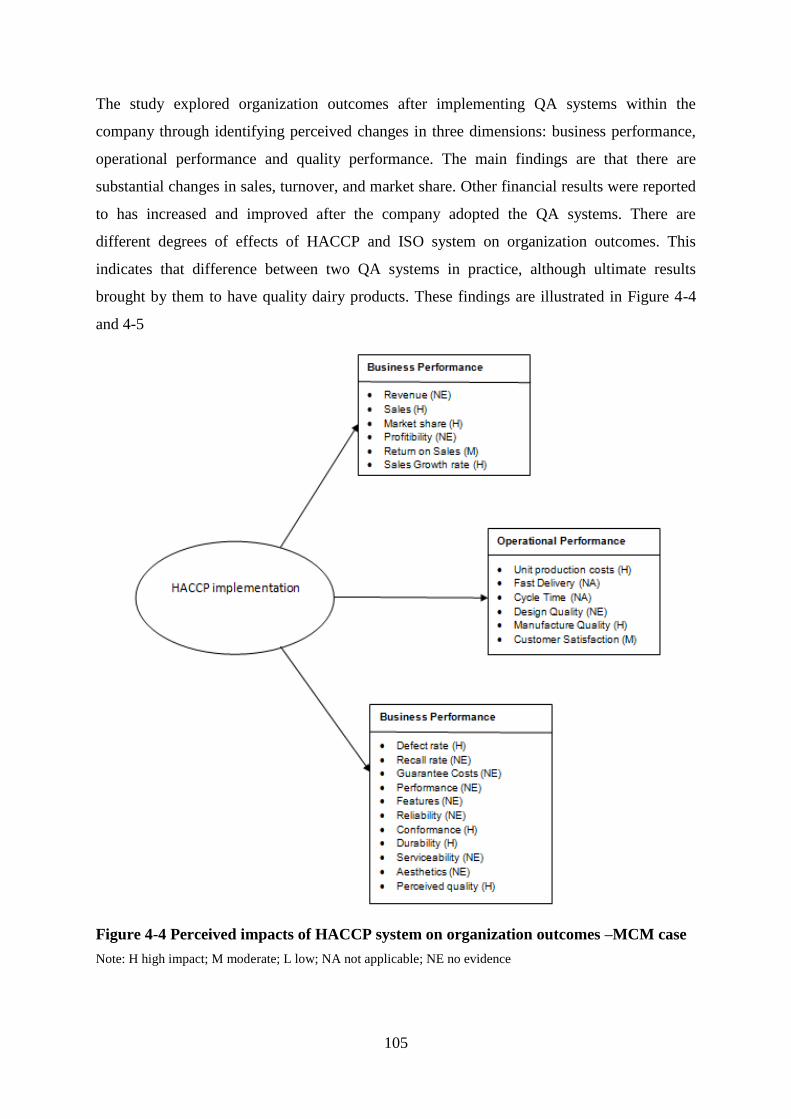
105
The study explored organization outcomes after implementing QA systems within the
company through identifying perceived changes in three dimensions: business performance,
operational performance and quality performance. The main findings are that there are
substantial changes in sales, turnover, and market share. Other financial results were reported
to has increased and improved after the company adopted the QA systems. There are
different degrees of effects of HACCP and ISO system on organization outcomes. This
indicates that difference between two QA systems in practice, although ultimate results
brought by them to have quality dairy products. These findings are illustrated in Figure 4-4
and 4-5
Figure 4-4 Perceived impacts of HACCP system on organization outcomes –MCM case
Note: H high impact; M moderate; L low; NA not applicable; NE no evidence
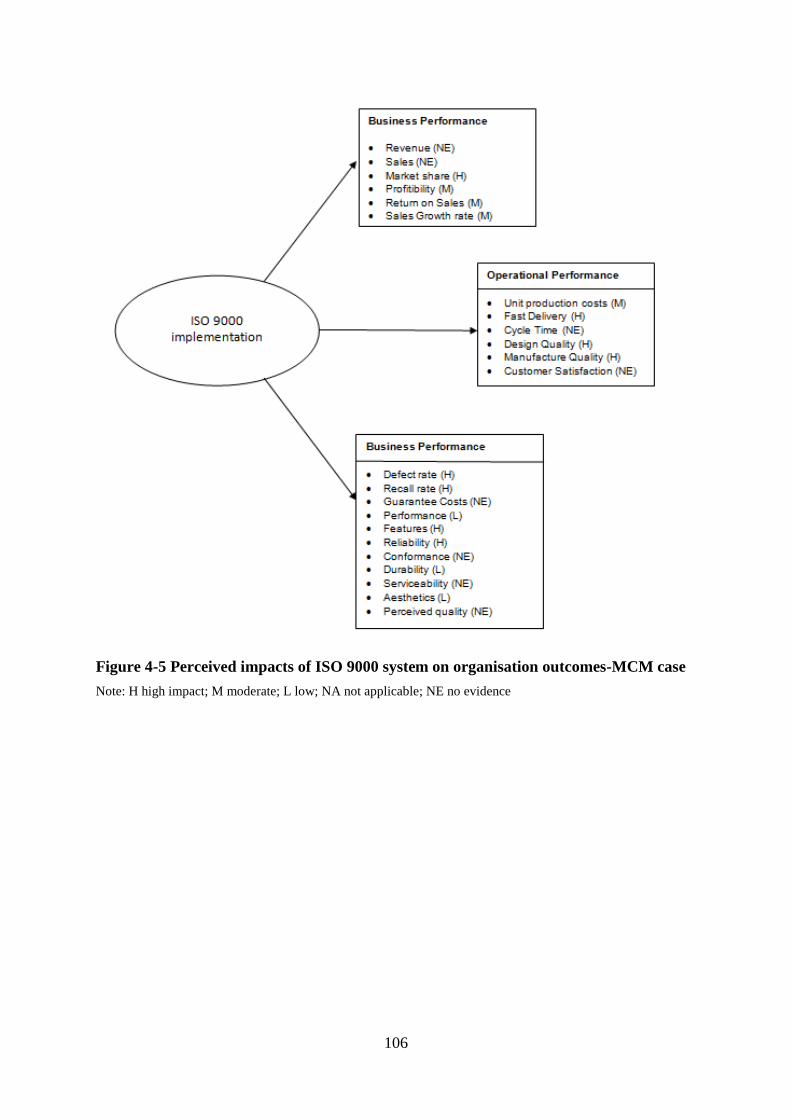
106
Figure 4-5 Perceived impacts of ISO 9000 system on organisation outcomes-MCM case
Note: H high impact; M moderate; L low; NA not applicable; NE no evidence
107
Chapter 5
Results 2- Large firms: Dutchlady Vietnam and Vinamilk cases –
Description and Analysis
Chapter 5 contains a brief description of two cases, DutchLady Vietnam (DLM) and
Vinamilk (VNM), which are large companies. Differences and similarities between these
cases and Moc Chau Milk Company (MCM), which were described in detail in Chapter 4, are
outlined with respect of the firm nature, governance structure and supply chain structure. A
brief analysis of factors impacting on the adoption decision and organisational outcomes is
also presented for each individual case.
5.1 Dutch Lady Vietnam (DLM)
5.1.1 Overview
The Dutch Lady Vietnam (DLM), renamed Friesland Campina Viet Nam in 2009, is one of
the largest manufacturers of dairy and dairy-related products in Vietnam. DLM was
originally a joint venture between Royal Friesland Foods (Friesland Coberco Dairy Foods)
and Protrade based in Vietnam, with its main establishment in Binh Duong province and a
network of regional sales offices in other parts of Vietnam. The parent company, the Royal
Friesland Foods, is one of the largest dairy companies in the world with its headquarters in
the Netherlands and business activities in many countries. Protrade was a local company
established in the old planned economy. Such ventures are categorized into two types: central
and local. All these enterprises have been run with State capital. Protrade was founded in
1982, and was one of the commercial business units of Binh Duong Province. It engages in
garment export, has timber, food and beverage, construction interests, a golf resort, and
rubber and paper businesses operated through its subsidiaries.
The name of the operating company was changed from Foremost to Dutch Lady Vietnam
(DLM) in 2006, and then to FrieslandCampina Vietnam in 2009. The company has an
impressive history of significant milestones beginning in 1924, when the first 150 cartons of
Dutch Lady sweetened condensed milk were imported and sold in Vietnam. In 1993, the
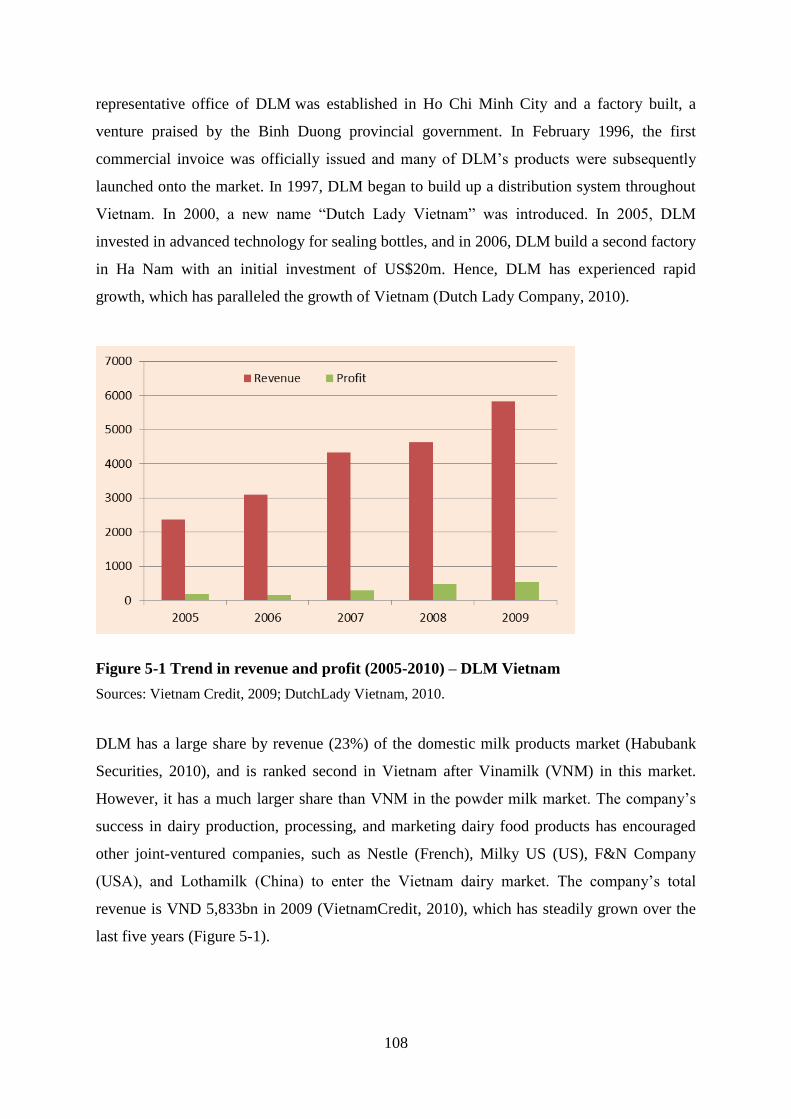
108
representative office of DLM was established in Ho Chi Minh City and a factory built, a
venture praised by the Binh Duong provincial government. In February 1996, the first
commercial invoice was officially issued and many of DLM‟s products were subsequently
launched onto the market. In 1997, DLM began to build up a distribution system throughout
Vietnam. In 2000, a new name “Dutch Lady Vietnam” was introduced. In 2005, DLM
invested in advanced technology for sealing bottles, and in 2006, DLM build a second factory
in Ha Nam with an initial investment of US$20m. Hence, DLM has experienced rapid
growth, which has paralleled the growth of Vietnam (Dutch Lady Company, 2010).
Figure 5-1 Trend in revenue and profit (2005-2010) – DLM Vietnam
Sources: Vietnam Credit, 2009; DutchLady Vietnam, 2010.
DLM has a large share by revenue (23%) of the domestic milk products market (Habubank
Securities, 2010), and is ranked second in Vietnam after Vinamilk (VNM) in this market.
However, it has a much larger share than VNM in the powder milk market. The company‟s
success in dairy production, processing, and marketing dairy food products has encouraged
other joint-ventured companies, such as Nestle (French), Milky US (US), F&N Company
(USA), and Lothamilk (China) to enter the Vietnam dairy market. The company‟s total
revenue is VND 5,833bn in 2009 (VietnamCredit, 2010), which has steadily grown over the
last five years (Figure 5-1).
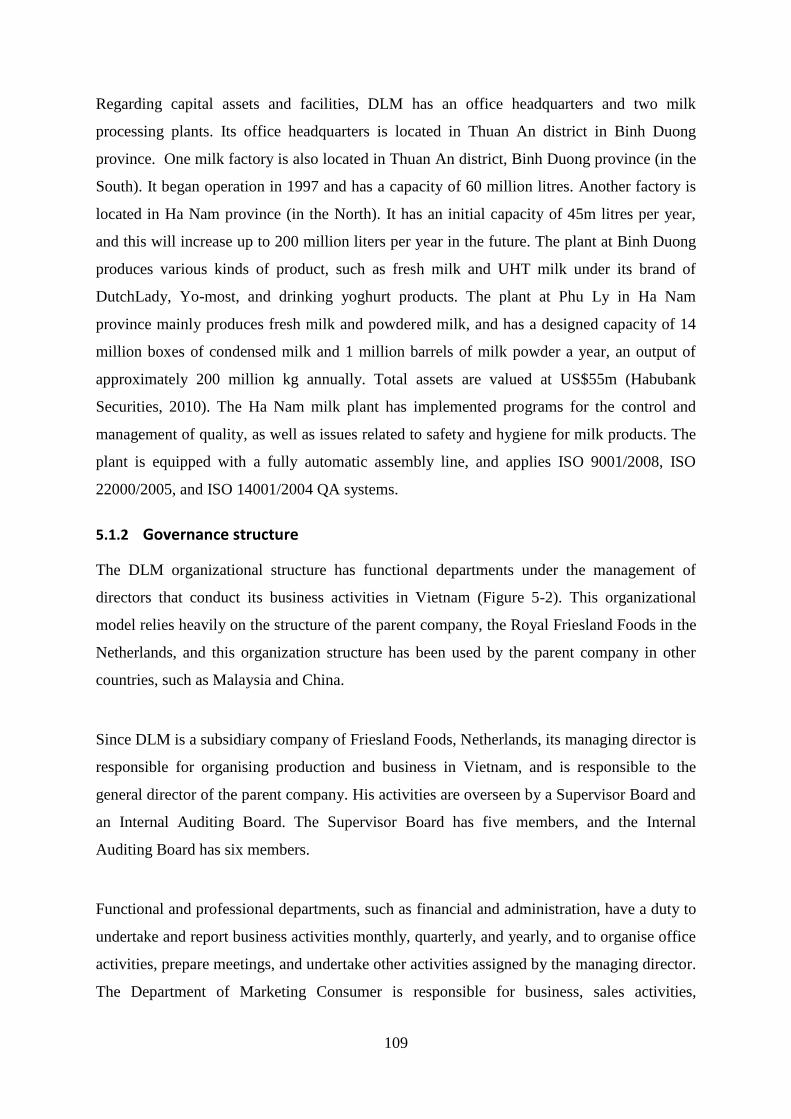
109
Regarding capital assets and facilities, DLM has an office headquarters and two milk
processing plants. Its office headquarters is located in Thuan An district in Binh Duong
province. One milk factory is also located in Thuan An district, Binh Duong province (in the
South). It began operation in 1997 and has a capacity of 60 million litres. Another factory is
located in Ha Nam province (in the North). It has an initial capacity of 45m litres per year,
and this will increase up to 200 million liters per year in the future. The plant at Binh Duong
produces various kinds of product, such as fresh milk and UHT milk under its brand of
DutchLady, Yo-most, and drinking yoghurt products. The plant at Phu Ly in Ha Nam
province mainly produces fresh milk and powdered milk, and has a designed capacity of 14
million boxes of condensed milk and 1 million barrels of milk powder a year, an output of
approximately 200 million kg annually. Total assets are valued at US$55m (Habubank
Securities, 2010). The Ha Nam milk plant has implemented programs for the control and
management of quality, as well as issues related to safety and hygiene for milk products. The
plant is equipped with a fully automatic assembly line, and applies ISO 9001/2008, ISO
22000/2005, and ISO 14001/2004 QA systems.
5.1.2 Governance structure
The DLM organizational structure has functional departments under the management of
directors that conduct its business activities in Vietnam (Figure 5-2). This organizational
model relies heavily on the structure of the parent company, the Royal Friesland Foods in the
Netherlands, and this organization structure has been used by the parent company in other
countries, such as Malaysia and China.
Since DLM is a subsidiary company of Friesland Foods, Netherlands, its managing director is
responsible for organising production and business in Vietnam, and is responsible to the
general director of the parent company. His activities are overseen by a Supervisor Board and
an Internal Auditing Board. The Supervisor Board has five members, and the Internal
Auditing Board has six members.
Functional and professional departments, such as financial and administration, have a duty to
undertake and report business activities monthly, quarterly, and yearly, and to organise office
activities, prepare meetings, and undertake other activities assigned by the managing director.
The Department of Marketing Consumer is responsible for business, sales activities,
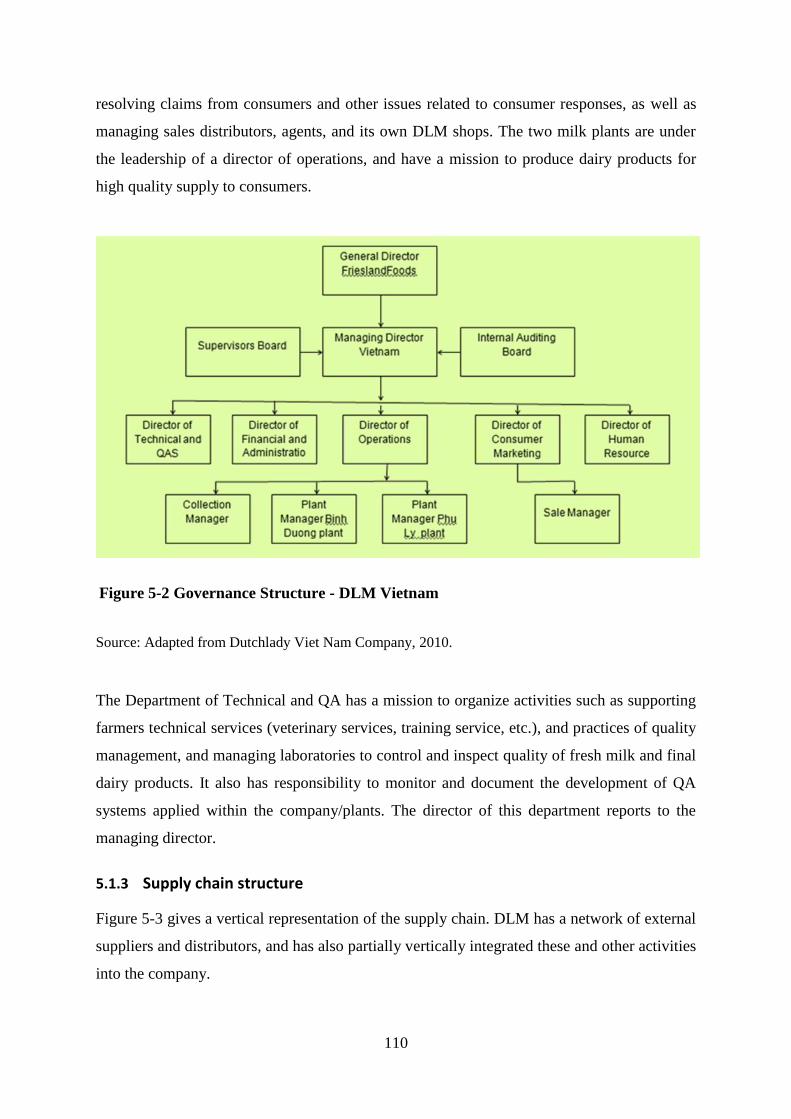
110
resolving claims from consumers and other issues related to consumer responses, as well as
managing sales distributors, agents, and its own DLM shops. The two milk plants are under
the leadership of a director of operations, and have a mission to produce dairy products for
high quality supply to consumers.
Figure 5-2 Governance Structure - DLM Vietnam
Source: Adapted from Dutchlady Viet Nam Company, 2010.
The Department of Technical and QA has a mission to organize activities such as supporting
farmers technical services (veterinary services, training service, etc.), and practices of quality
management, and managing laboratories to control and inspect quality of fresh milk and final
dairy products. It also has responsibility to monitor and document the development of QA
systems applied within the company/plants. The director of this department reports to the
managing director.
5.1.3 Supply chain structure
Figure 5-3 gives a vertical representation of the supply chain. DLM has a network of external
suppliers and distributors, and has also partially vertically integrated these and other activities
into the company.
111
. ttrendsmnf
Boundary for vertical integration within DLM
Figure 5-3 Supply chain structure – DLM Vietnam
Source: Adapted from DutchLady, 2010
Suppliers are dairy farms that are from Binh Duong province, rural suburbs of Ho Chi Minh
City, Long An province, and Lam Dong province. The number of suppliers is 2,500 farms
and the number of cows supplying milk to the company is over 27,000. The volume of daily
milk collected in a day is 170 tons (DutchLady Company, 2010). Farms have signed contracts
to supply raw milk to the company. Because of this close relationship with suppliers, the
company has a stable source of fresh milk for its plants.
The company has established 39 collecting points, where dairy farmers can sell milk directly
to the company. These company collecting points are located in Binh Duong, Long An, Tay
Ninh and Ho Chi Minh City. In addition, the company has built 3 chilling centres with an
investment of US$1.7m (VNexpress, 2010). Milk procured from farmers is chilled in these
centres before transporting to plants for further processing.
Milk products are distributed through the company‟s system of agents and retailers. Over
time, the number of distributors has increased. At present, the distribution system includes 7
head distributors, 145 wholesale outlets and 80,000 retailers in the whole country (Dutch
Lady, 2010a). Annual turnover via retail shops is VND1,100b (equivalent US$60m)
Input supplies Production Processing Marketing
DLM’s extension
TetraPak, Delta
Local extension agents
.Banks
. DLM’s own farms
.Farmers
.Co-ops
Binh Duong plant
Ha Nam plant
DLM’s own distributors
Private distributors
Agents
Collection
DLM’s own collectors
Dealers
Milking Co-ops
112
(Dutchlady, 2010b). The main products of the company are fresh milk, condensed milk,
powdered milk and its key brands are Yo-most and Dutchlady.
Figure 5-4 Market share (%) by products – DLM Vietnam
Sources: FSC, 2009; DutchLady, 2010
Market share is different for each dairy product marketed and distributed by the company
(Figure 5-4). DLM enjoys a share of 23% by turnover. On a product basis, this is 26.6% for
fresh milk (holding second position), 20% for milk powder (holding first position of
companies for milk powder in Vietnam (of which, VNM 16%, and imported 64%)), 25% for
yoghurt, and 21% for condensed milk with sugar in domestic market (FSC, 2009). This
confirms that DLM is one of the largest dairy companies in the country.
There is a major difference in size of DLM compared to MCM. For example, DLM has over
2,500 farms supplying fresh milk, while MCM has only 700 farms doing so. Even though
both have 2 milk processing plants, the capacity of two DLM‟s plants is larger much than
MCM‟s plants. There are also differences in terms of ownership, governance structure, and
supply chain structure. DLM is a foreign owned company and the experience, management
expertise and the knowledge of the CEO and senior managers is thought to be better other
companies. In addition, marketing and public relation strategies are very systematic and
evaluated carefully (Huyen, 2011).
In this DLM case, it was found that chain structure characteristics show major differences
compared to the MCM case, in respect to the nature of collectors, producers, and distributors.
At each chain level, differences in ownership and management regimes are found. Suppliers
113
supplying fresh milk to the processing plants include private smallholder farms, DLM‟s own
farms, and cooperatives with the dual purposes of purchasing and producing fresh milk. Like
MCM, DLM maintains supplies from small private farms, owning less than 10 dairy cows.
However, in MCM, farms are located in a more concentrated area around the company than
farms are in DLM. That results in difference in procurement of fresh milk, as DLM is larger
than MCM in respect to collection area, daily volume, and number of farms from which it
purchases fresh milk.
Similarities between the two cases are found in that both have their own farm systems
supplying fresh milk to processing plants, although DLM supplies 15% volume of milk from
its own farms (43 tons per day), while for MCM, this ratio is over 50%. DLM‟s own farms
have modern technology and facilities, and are of large size with 2000 dairy cows, which is
larger than farms owned by MCM. For both cases, there is an average 8 cows per farm for
private supplies, and both maintain relationships with these private smallholder farms.
However, DLM works with 1,500 farms while MCM works with only 500 farms. Because
they have their own farms, both can control and improve quality in active ways, such as
investing in more advanced machinery and equipment, and hiring employees with higher
qualifications for their establishments. Both cases show contractual relationships with small
farmers. Written contracts between the company and suppliers exist in order to ensure that
quality and quantity of fresh milk supplied to plants is good quality and stable.
5.1.4 Business strategy and QA systems
With respect to the company‟s vision, it has a commitment towards „assuring top quality and
bringing rich and safe nutrition sources to its consumers.‟ (DutchLady, 2010a, p1). To
achieve this vision, the company launched the Dairy Farming Program in 1995. After 10
years‟ implementation, it was deemed successful, and the program will continue. Milk quality
management implemented from farm to plant is a key to the success of the program. To
achieve this, farmers have training courses and communication about procedures associated
with hygienic milking and transporting. Staff of the company involved in the program are
also trained to maintain quality in the whole collection systems. Infrastructure and
organization of collection have been supported and consolidated through the ISO system. The
effectiveness of this system is bringing benefits to farmers through producing milk of high
114
quality, which contributes to generating and raising incomes from dairy production, and
furthermore benefits DLM through its collection of high quality milk (Dutchlady, 2009).
DLM has obtained international QA systems and is the earliest of the foreign-owned
companies to do so in the dairy industry in Viet Nam. These systems are HACCP in 2002,
ISO 9000 achieved by the company in 2000, upgraded to ISO 9000/2008 in 2008, ISO
22000/2005 in 2009 (Dutchlady, 2010a). In addition, DLM has also applied for ISO 14000-
environmental standard and OHSAS 18000- International Health and Occupation Safety
Specification System. With the implementation of these QA programs, the company has
demonstrated its commitment to supplying consumers with high quality milk products.
5.1.5 Perceived factors influencing adoption of QAS’s
5.1.5.1 Motivation
Stages in decision-making in the adoption of QA systems were explored in interviews. Like
MCM, information was sought on the motivation for the adoption of QA systems. Reasons
the company considered important were „improving competitive advantages‟ in the domestic
market over other competitors including larger companies, and related to this, expanding its
market, and increasing the market share for its products. DLM‟s marketing manager stated:
“QA systems will help our company to have leading position in the dairy market. ISO 9000
system will improve procedures and processes that we are applying for production and
collection of fresh milk in our assembly system”. (DLMp1).
DLM‟s plant manager also stressed internal motivational factors, as well as external
advantages. He stated:
“The HACCP system we chose is appropriate and will benefit company and consumers in
respect of quality and safety” (DLMp2).
To explore further the motivations of management for the adoption of QA systems, the
opinion of top manager was collected. (Table 5-1).
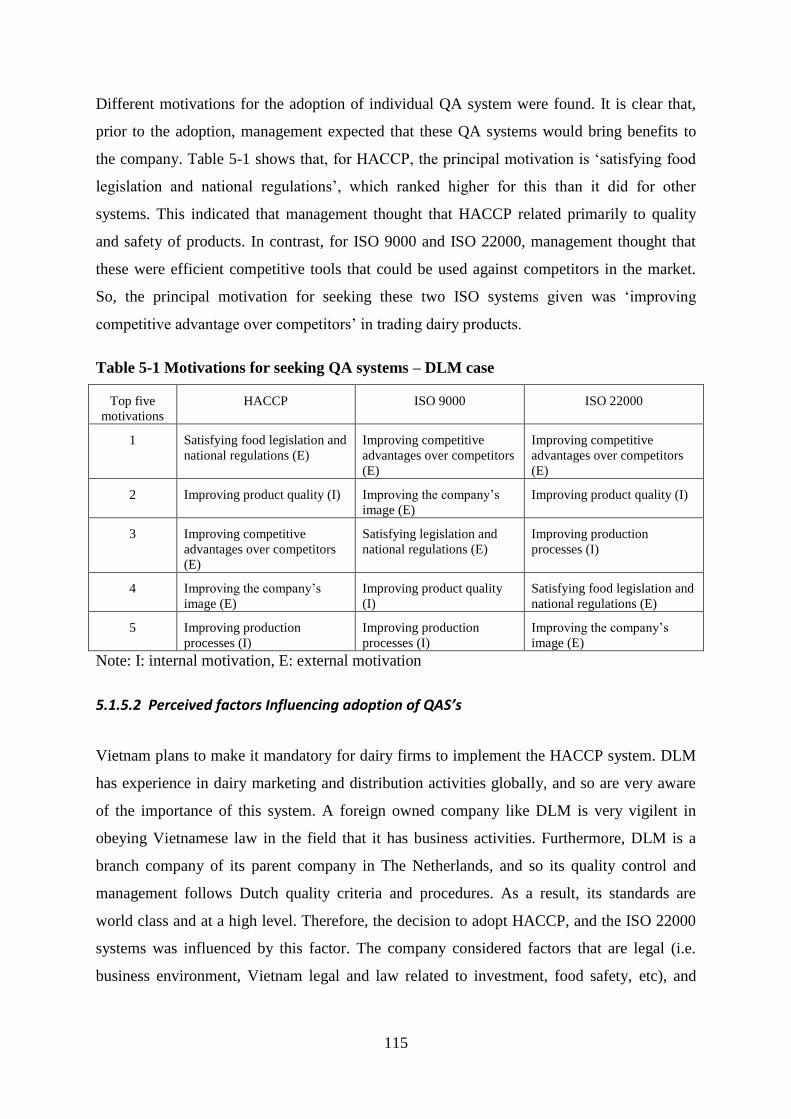
115
Different motivations for the adoption of individual QA system were found. It is clear that,
prior to the adoption, management expected that these QA systems would bring benefits to
the company. Table 5-1 shows that, for HACCP, the principal motivation is „satisfying food
legislation and national regulations‟, which ranked higher for this than it did for other
systems. This indicated that management thought that HACCP related primarily to quality
and safety of products. In contrast, for ISO 9000 and ISO 22000, management thought that
these were efficient competitive tools that could be used against competitors in the market.
So, the principal motivation for seeking these two ISO systems given was „improving
competitive advantage over competitors‟ in trading dairy products.
Table 5-1 Motivations for seeking QA systems – DLM case
Top five
motivations
HACCP ISO 9000 ISO 22000
1 Satisfying food legislation and
national regulations (E)
Improving competitive
advantages over competitors
(E)
Improving competitive
advantages over competitors
(E)
2 Improving product quality (I) Improving the company‟s
image (E)
Improving product quality (I)
3 Improving competitive
advantages over competitors
(E)
Satisfying legislation and
national regulations (E)
Improving production
processes (I)
4 Improving the company‟s
image (E)
Improving product quality
(I)
Satisfying food legislation and
national regulations (E)
5 Improving production
processes (I)
Improving production
processes (I)
Improving the company‟s
image (E)
Note: I: internal motivation, E: external motivation
5.1.5.2 Perceived factors Influencing adoption of QAS’s
Vietnam plans to make it mandatory for dairy firms to implement the HACCP system. DLM
has experience in dairy marketing and distribution activities globally, and so are very aware
of the importance of this system. A foreign owned company like DLM is very vigilent in
obeying Vietnamese law in the field that it has business activities. Furthermore, DLM is a
branch company of its parent company in The Netherlands, and so its quality control and
management follows Dutch quality criteria and procedures. As a result, its standards are
world class and at a high level. Therefore, the decision to adopt HACCP, and the ISO 22000
systems was influenced by this factor. The company considered factors that are legal (i.e.
business environment, Vietnam legal and law related to investment, food safety, etc), and
116
quality regulations from its parent company (Friesland Foods, 2008) as primary factors
influencing its decision to adopt all QA systems.
One environment context factor considered in the wider analysis is external support from
government or external organisations. This factor was not relevant in this case because DLM
itself did not receive any support from government, trading and industrial associations. It is
not even a formal member of the Vietnam Dairy Association VDA that was founded in 2010
(VDA, 2010).
Market pressure was found to impact strongly on the QA system adoption decision, since
competition with other companies, such as Vinamilk in the Southern market, requires the
company to have QA systems that can provide tools for the company advertising images to
demonstrate product quality and thus improve its competitive advantage. Within the food
chain environment, relationships between supplier and buyer are supported by written
contract, with quality norms included in these contracts. This supports DLM‟s QA systems,
especially in relation to wholesalers and retailers outside the company.
Opinions of DLM‟s top manager of factors impacting on the adoption decision were further
explored, and the results are shown in Table 5-2.
With respect to the environment context, food legal and national regulations affected the
adoption of all individual QA systems. This factor was ranked highly for all QA systems,
however, for the HACCP system, it was perceived by DLM‟s top manager to have an even
stronger impact than for other QA systems decision, and also was a key factor influencing the
adoption decision overall. This reflects mandatory enforcement of HACCP from Government
and related food safety and quality authorities for food businesses, and DLM has been
influenced by this mandate. This factor has also influenced the decision to adopt other QA
systems but less so, because DLM has introduced QA systems, such as ISO 9000, ISO 22000,
that are voluntary rather than mandatory. Market pressure is another factor that was explored.
This factor was perceived to have a high influence on the decision of the company to adopt
ISO systems in particular, because in the dairy market at present, there are three large dairy
companies, VNM, HNM, and DLM, all of which compete strongly to gain market share. This
reflects the resource base view (RBV) that any company has a stronger competitive
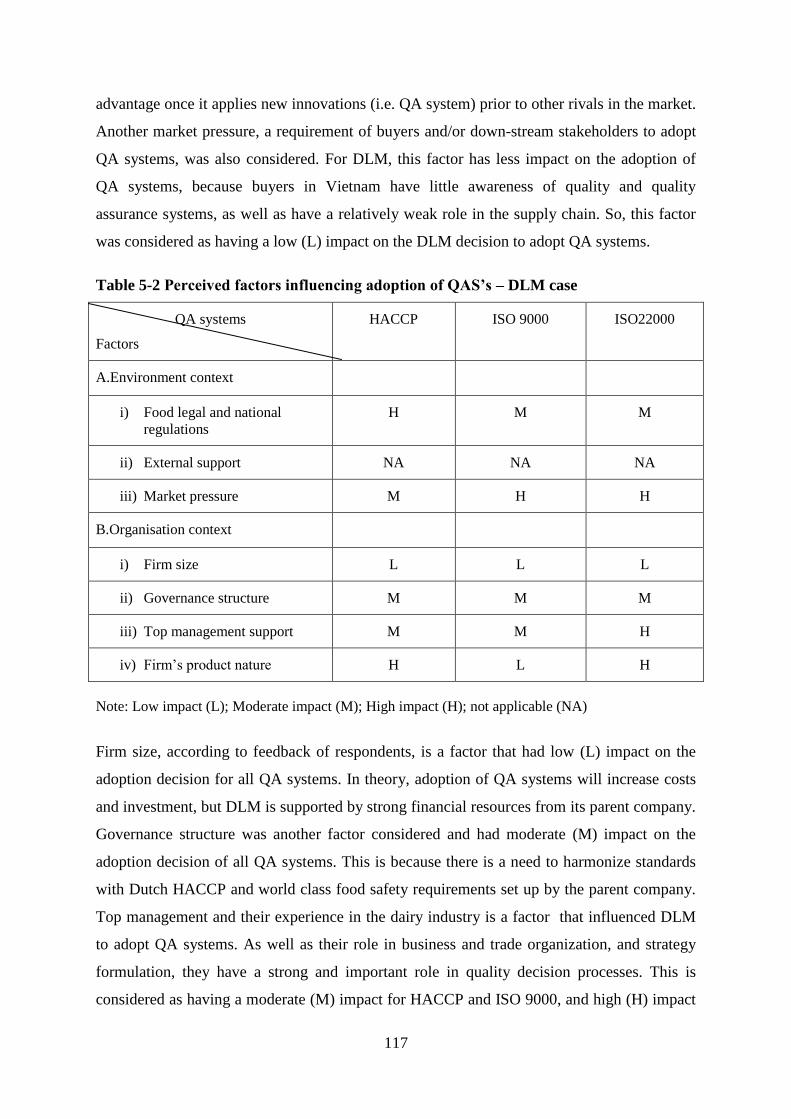
117
advantage once it applies new innovations (i.e. QA system) prior to other rivals in the market.
Another market pressure, a requirement of buyers and/or down-stream stakeholders to adopt
QA systems, was also considered. For DLM, this factor has less impact on the adoption of
QA systems, because buyers in Vietnam have little awareness of quality and quality
assurance systems, as well as have a relatively weak role in the supply chain. So, this factor
was considered as having a low (L) impact on the DLM decision to adopt QA systems.
Table 5-2 Perceived factors influencing adoption of QAS’s – DLM case
QA systems
Factors
HACCP ISO 9000 ISO22000
A.Environment context
i) Food legal and national
regulations
H M M
ii) External support NA NA NA
iii) Market pressure M H H
B.Organisation context
i) Firm size L L L
ii) Governance structure M M M
iii) Top management support M M H
iv) Firm‟s product nature H L H
Note: Low impact (L); Moderate impact (M); High impact (H); not applicable (NA)
Firm size, according to feedback of respondents, is a factor that had low (L) impact on the
adoption decision for all QA systems. In theory, adoption of QA systems will increase costs
and investment, but DLM is supported by strong financial resources from its parent company.
Governance structure was another factor considered and had moderate (M) impact on the
adoption decision of all QA systems. This is because there is a need to harmonize standards
with Dutch HACCP and world class food safety requirements set up by the parent company.
Top management and their experience in the dairy industry is a factor that influenced DLM
to adopt QA systems. As well as their role in business and trade organization, and strategy
formulation, they have a strong and important role in quality decision processes. This is
considered as having a moderate (M) impact for HACCP and ISO 9000, and high (H) impact
118
for the ISO22000 adoption decision. This conclusion was reached because they are
integrating their quality strategy into the business strategy of the company, as well as
organizing quality activities within the company, and empowering quality staff to raise
employees‟ awareness of quality philosophies and activities. Product nature is another factor
that management considered when QA systems were adopted. Manufacturing more kinds of
product makes it more complicated to implement HACCP, and imposes more work gathering
quality information, and internal auditing, etc for the ISO series systems. This factor was
assessed to have a high (H) influence on the adoption of HACCP, and a moderate impact (M)
for ISO adoption decision.
5.1.6 Perceived impacts of QA systems on organisational outcomes
According to DLM‟s top management, QA systems benefited the company both in respect of
business results and of changing employees‟ behaviours towards quality. A DLM marketing
manager commented:
“Quality programs are one of factors benefiting the company in term of improving business
state, through financial indicators improved and grown up, beside of raising skills and senses
of employees and staff in quality, quality culture becomes expanded within our company”
(DLM-p1).
Opinions from respondents were collected from questionnaires and are summarised in Table
5.3 – 5.5. Changes in organisation outcomes resulted by QA systems were perceived to have
difference across individual QA systems.
As seen in Table 5-3, according to respondents, ISO 22000 did not have much impact on
business performance, which was assessed as having a low (L) impact for all but one
measure. HACCP and ISO 9000 were assessed to have a moderate (M) and high (H) impact
on business performance since implementation of these systems. That is consistent with the
length of implementation of these QA systems within the company. Both HACCP and ISO
9000 systems were attempted first within the company, while ISO 22000 has just been done
recently. This means that the experienced duration of HACCP is 10 years, and for ISO 9000
is 8 years, while for ISO22000, it is only one year. Differences in assessment of business
performance between ISO 9000 and HACCP arise because each was adopted for different
purposes. For example, market share increase was perceived as having a moderate (M)
impact after implementing HACCP, while ISO 9000 was perceived as having a high (H)
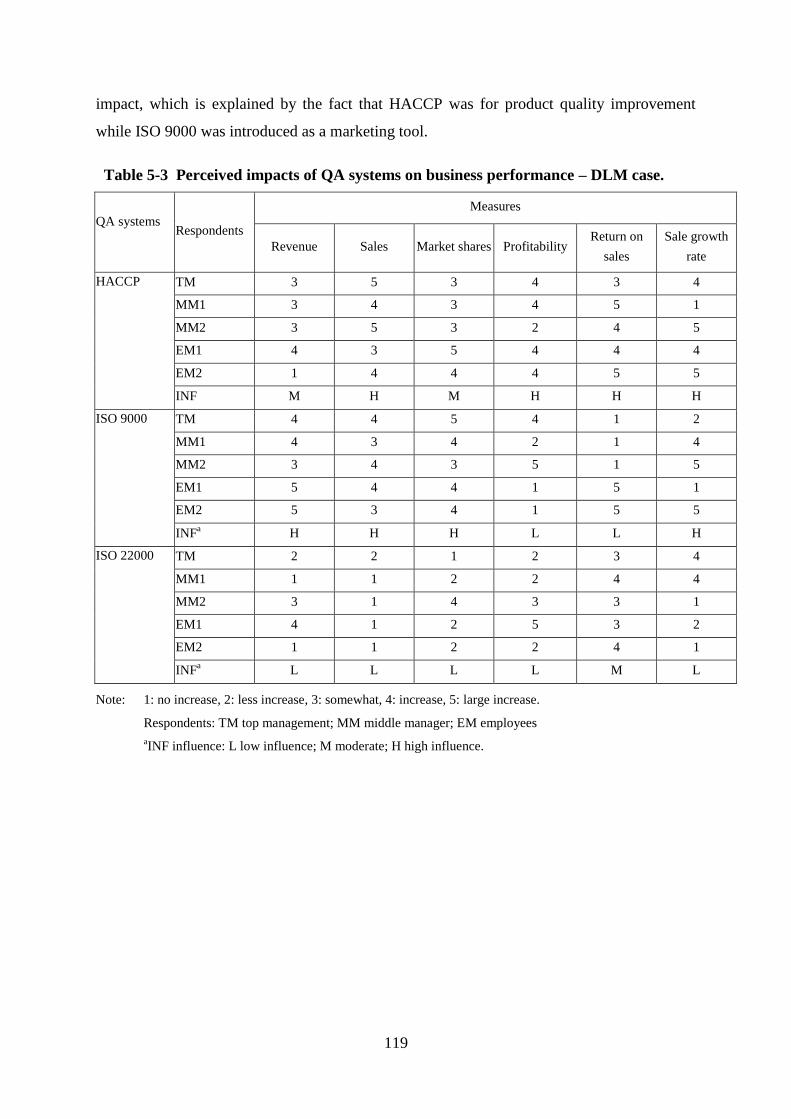
119
impact, which is explained by the fact that HACCP was for product quality improvement
while ISO 9000 was introduced as a marketing tool.
Table 5-3 Perceived impacts of QA systems on business performance – DLM case.
QA systems
Respondents
Measures
Revenue Sales Market shares Profitability Return on
sales
Sale growth
rate
HACCP
TM 3 5 3 4 3 4
MM1 3 4 3 4 5 1
MM2 3 5 3 2 4 5
EM1 4 3 5 4 4 4
EM2 1 4 4 4 5 5
INF M H M H H H
ISO 9000
TM 4 4 5 4 1 2
MM1 4 3 4 2 1 4
MM2 3 4 3 5 1 5
EM1 5 4 4 1 5 1
EM2 5 3 4 1 5 5
INFa H H H L L H
ISO 22000
TM 2 2 1 2 3 4
MM1 1 1 2 2 4 4
MM2 3 1 4 3 3 1
EM1 4 1 2 5 3 2
EM2 1 1 2 2 4 1
INFa L L L L M L
Note: 1: no increase, 2: less increase, 3: somewhat, 4: increase, 5: large increase.
Respondents: TM top management; MM middle manager; EM employees
aINF influence: L low influence; M moderate; H high influence.
120
Table 5-4 Perceived impact of QA systems on operational performance – DLM case
QA
systems
Respondents
Measures
Unit
production
costsa
Fast
deliveriesa
Cycle
timea
Design
quality
Manufacturing
quality
Customer
satisfaction
HACCP
TM 1 NA NA
3 4 1
MM1 4 NA NA 3 3 5
MM2 1 NA NA 4 3 2
EM1 3 NA NA 4 2 4
EM2 2 NA NA 3 3 4
INFb H NA NA M M H
ISO 9000
TM 3 5 1 5 2 4
MM1 3 1 2 3 1 3
MM2 3 2 5 5 1 3
EM1 5 5 3 1 5 4
EM2 4 4 2 5 5 4
INFb M H L H L H
ISO
22000
TM 5 1 2 2 3 2
MM1 3 1 3 1 1 5
MM2 5 5 5 1 3 4
EM1 3 1 4 1 3 4
EM2 1 2 4 3 4 2
INFb L L H L M H
Note: 1: no increase, 2: less increase, 3: somewhat, 4: increase, 5: large increase. a1: large decrease, 2 decrease, 3: somewhat, 4: less decrease, 5: no decrease.
Respondents: TM top management; MM middle manager; EM employees
bINF influence: L low influence; M moderate; H high influence; NA not applicable.
Table 5-4 shows the perceived impact of QA systems on operational performance. This
illustrate the different purposes of introducing individual QA systems. For example,
production costs were perceived to have increased less for ISO 9000 (and so assessed as a
moderate (M) impact), whereas after implementing HACCP, these costs increased more (and
were assessed as a high (H) impact. Some measures are not applied for HACCP, and are only
assessed for ISO 9000 or ISO 22000, such as “fast deliveries” „cycle time‟ and „quality
design‟.
121
Table 5-5 Perceived impact of QA systems on quality performance- DLM case
Measures
HACCP ISO900 ISO22000
TP MM1 MM2 EM1 EM2 INFb TP MM1 MM2 EM1 EM2 INF
b TP MM1 MM2 EM1 EM2 INF
b
a. Defect ratea 1 3 1 1 2 H 2 2 4 2 3 H 3 2 4 3 3 M
b. Recall ratea 2 1 1 1 1 H 1 4 4 5 3 H 2 4 1 2 2 H
c. Guarantee costsa 1 2 2 3 2 H 3 3 3 4 2 M 2 3 1 1 2 L
d. Performance 3 3 3 2 3 M 2 1 1 2 1 L 3 5 3 3 2 M
e. Features 5 5 2 5 2 H 3 3 3 5 5 M 4 5 2 3 4 H
f. Reliability 2 2 1 4 1 L 3 3 4 4 5 H 3 4 3 1 3 M
g. Conformance 2 2 4 4 5 H 4 2 4 1 3 NE 4 4 1 5 4 H
h. Durability 2 5 4 1 3 NE 4 2 4 1 2 L 2 5 4 1 5 H
i. Serviceability 2 3 2 2 2 L 5 5 1 4 3 H 3 3 5 3 2 M
j. Aesthetics 5 4 5 2 2 H 3 1 1 3 2 L 1 5 1 1 1 L
k. Perceived quality 2 5 5 5 2 H 2 5 4 4 3 H 2 2 4 1 2 L
Note: 1: no increase, 2: less increase, 3: somewhat, 4: increase, 5: large increase. a1: large decrease, 2 decrease, 3: somewhat, 4: less decrease, 5: no decrease.
Respondents: TM top management; MM middle manager; EM employees
bINF influence: L low influence; M moderate; H high influence; NE no evidence; NA not applicable.
122
As seen in Table 5-5, measures of quality performance, including „guarantee costs‟, „recall
rate‟, „defect rate‟, were perceived to have strongly decreased, when HACCP and ISO 9000
were implemented. Hence, these measures are assessed as being strongly impacted by the QA
systems.
It can be seen that individual QA systems have different perceived impacts on organisation
outcomes, according to the perception of respondents. However, results indicate a trend of
influence of QA systems. HACCP and ISO 9000 were thought to have a strong influence on
outcomes, while for ISO22000, respondents perceived that there was moderate influence.
This may arise from the fact that it is just newly introduced, and so it requires more work and
coordination in the supply chain in the initial stage, especially given DLM‟s partial vertical
integration. Perceived quality performance was assessed to have been impacted less by this
system, which indicates that the duration of application may not yet be meaningful.
Furthermore, fresh milk with quality controlled under ISO22000 supplied by DLM‟s own
farm, is minor compared to other sources supplied by mainly private small farms, which may
also have an impact.
5.1.7 Conclusions
This Section described DLM, as a foreign owned dairy company, which is one of the largest
dairy companies in Vietnam. Quality activities from production to marketing are engaged in
by the company. It has implemented three QA systems, HACCP, ISO 9000, and ISO 22000.
DLM coordinated and organized its supply chain with quality controls, and contractual
relationships with farmers as suppliers for quality inputs to its milk processing plants.
Factors perceived as affecting the adoption decision were analysed. Within the environment
context, legal factors had a strong impact on adoption decision, especially for HACCP
adoption. This is similar to the previous case, MCM, in this respect. With respect to
organisation context, factors such as firm size, was assessed to have a low influence on the
decision adoption for all QA systems, with the reason given was that the company gets
support from the parent company. The role of governance structure and top management
support also had an influence on the adoption decision. This results from the direction and
functions of the CEO, and the desire to harmonize parent company and world class safety
123
standards with the food legal environment in Vietnam. The complex nature of dairy products
had a strong impact on HACCP adoption in particular and also ISO 22000, but not ISO 9000.
With respect to perceived outcomes after implementing individual QA systems, business
performance was perceived to have been impacted strongly with increase in measures such as
sales, profitability, return on sales, and growth of sales. There were assessed to have a high
impact (H) for the HACCP system; with perceived increases in measures relating to revenue,
sales, market share, and growth of sales rate, for the ISO 9000 system. Opinions for ISO
22000 were that it had not yet benefited the company in respect of improving measures of
business performance. This difference in perceived business performance seems to result
from the earlier adoption of HACCP and ISO 9000, compared to later adoption of ISO
22000:2005.
5.2 Vinamilk (VNM)
5.2.1 Overview
VNM is a State run corporation producing and marketing dairy products, and supplying
services in the dairy industry. Apart from dairy production and manufacture, the company has
other business activities, such as trading in processed foods, spare parts, materials, chemicals,
and raw materials, trading in real estate, including real estate brokerage and leasing, trading
in warehouses and wharves, automobile goods transportation, loading and unloading goods,
manufacturing and trading in alcohol, beer, beverages, processed foods, and tea, coffee
(Vinamilk, 2006). The company has been established since 1976, and was at first owned by
the State after a nationalisation process. In 2003, it was equitised and changed into joint stock
ownership with State shareholding of 43%. It has a head office in Ho Chi Minh City,
branches in big cities, including Da Nang, Bien Hoa, Ha Noi, Can Tho, and processing plants
located in provinces throughout the country.
The company employs the largest number of employees and has the highest turnover of all
dairy companies in Vietnam. It has 4,000 employee, and turnover was VND20 thousand
billion VND (1 billion USD) in 2010 with growth rate of 15% in the past five years. It is in
top 200 dairy companies worldwide (Vinamilk, 2010; VietStock, 2010).
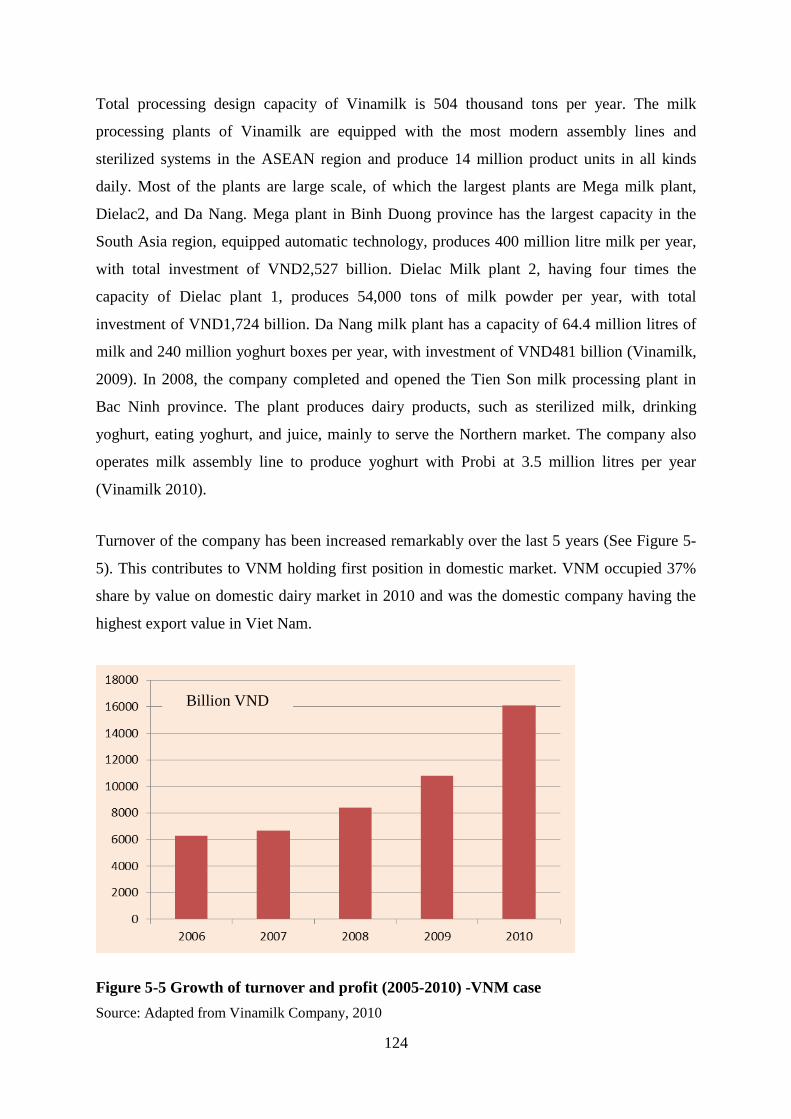
124
Total processing design capacity of Vinamilk is 504 thousand tons per year. The milk
processing plants of Vinamilk are equipped with the most modern assembly lines and
sterilized systems in the ASEAN region and produce 14 million product units in all kinds
daily. Most of the plants are large scale, of which the largest plants are Mega milk plant,
Dielac2, and Da Nang. Mega plant in Binh Duong province has the largest capacity in the
South Asia region, equipped automatic technology, produces 400 million litre milk per year,
with total investment of VND2,527 billion. Dielac Milk plant 2, having four times the
capacity of Dielac plant 1, produces 54,000 tons of milk powder per year, with total
investment of VND1,724 billion. Da Nang milk plant has a capacity of 64.4 million litres of
milk and 240 million yoghurt boxes per year, with investment of VND481 billion (Vinamilk,
2009). In 2008, the company completed and opened the Tien Son milk processing plant in
Bac Ninh province. The plant produces dairy products, such as sterilized milk, drinking
yoghurt, eating yoghurt, and juice, mainly to serve the Northern market. The company also
operates milk assembly line to produce yoghurt with Probi at 3.5 million litres per year
(Vinamilk 2010).
Turnover of the company has been increased remarkably over the last 5 years (See Figure 5-
5). This contributes to VNM holding first position in domestic market. VNM occupied 37%
share by value on domestic dairy market in 2010 and was the domestic company having the
highest export value in Viet Nam.
Figure 5-5 Growth of turnover and profit (2005-2010) -VNM case
Source: Adapted from Vinamilk Company, 2010
Billion VND
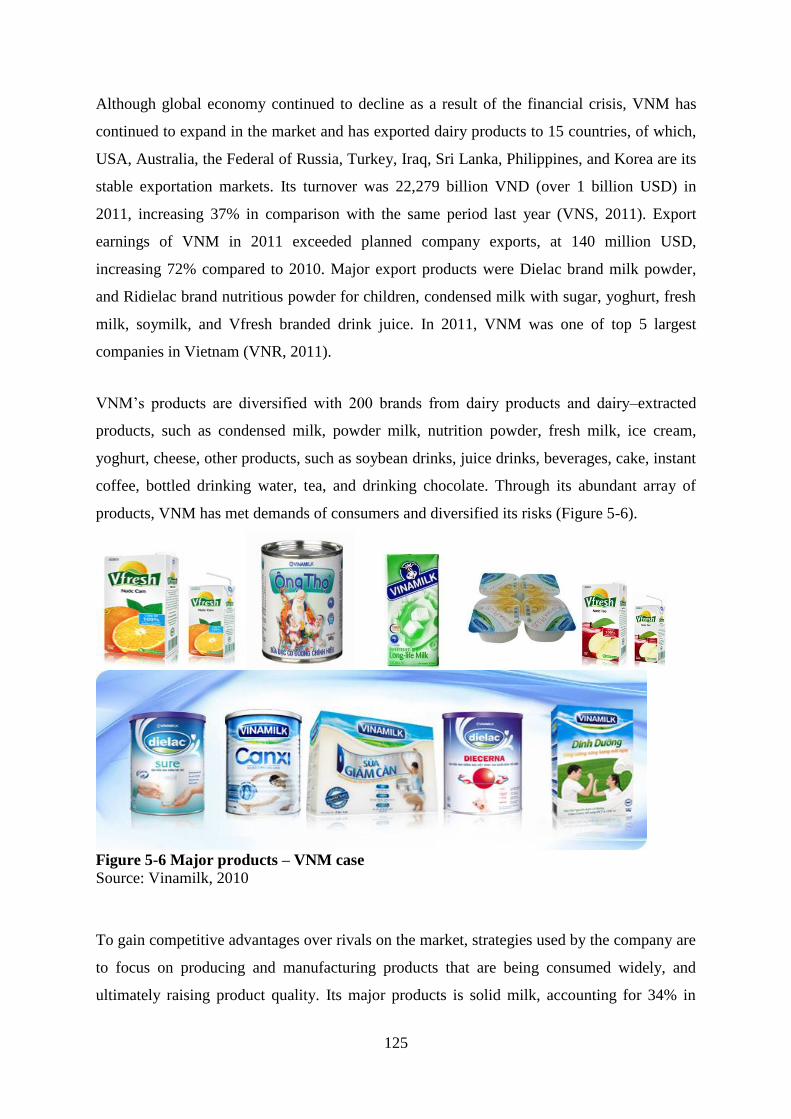
125
Although global economy continued to decline as a result of the financial crisis, VNM has
continued to expand in the market and has exported dairy products to 15 countries, of which,
USA, Australia, the Federal of Russia, Turkey, Iraq, Sri Lanka, Philippines, and Korea are its
stable exportation markets. Its turnover was 22,279 billion VND (over 1 billion USD) in
2011, increasing 37% in comparison with the same period last year (VNS, 2011). Export
earnings of VNM in 2011 exceeded planned company exports, at 140 million USD,
increasing 72% compared to 2010. Major export products were Dielac brand milk powder,
and Ridielac brand nutritious powder for children, condensed milk with sugar, yoghurt, fresh
milk, soymilk, and Vfresh branded drink juice. In 2011, VNM was one of top 5 largest
companies in Vietnam (VNR, 2011).
VNM‟s products are diversified with 200 brands from dairy products and dairy–extracted
products, such as condensed milk, powder milk, nutrition powder, fresh milk, ice cream,
yoghurt, cheese, other products, such as soybean drinks, juice drinks, beverages, cake, instant
coffee, bottled drinking water, tea, and drinking chocolate. Through its abundant array of
products, VNM has met demands of consumers and diversified its risks (Figure 5-6).
Figure 5-6 Major products – VNM case
Source: Vinamilk, 2010
To gain competitive advantages over rivals on the market, strategies used by the company are
to focus on producing and manufacturing products that are being consumed widely, and
ultimately raising product quality. Its major products is solid milk, accounting for 34% in
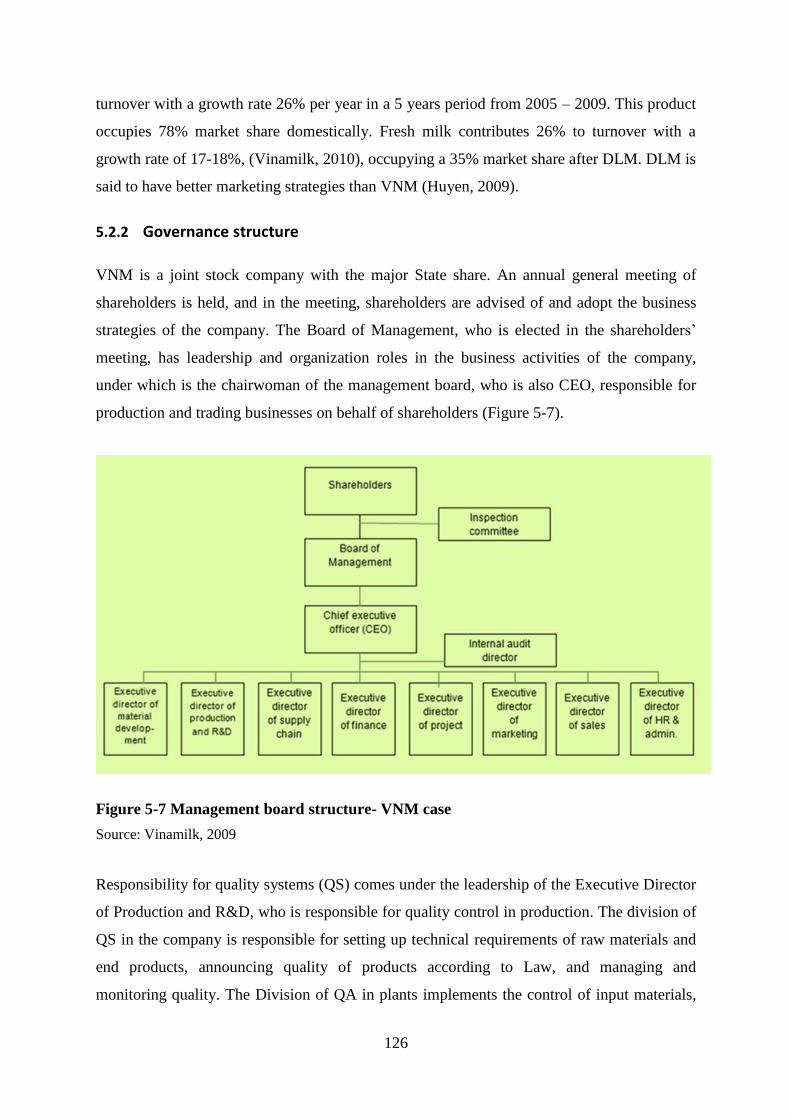
126
turnover with a growth rate 26% per year in a 5 years period from 2005 – 2009. This product
occupies 78% market share domestically. Fresh milk contributes 26% to turnover with a
growth rate of 17-18%, (Vinamilk, 2010), occupying a 35% market share after DLM. DLM is
said to have better marketing strategies than VNM (Huyen, 2009).
5.2.2 Governance structure
VNM is a joint stock company with the major State share. An annual general meeting of
shareholders is held, and in the meeting, shareholders are advised of and adopt the business
strategies of the company. The Board of Management, who is elected in the shareholders‟
meeting, has leadership and organization roles in the business activities of the company,
under which is the chairwoman of the management board, who is also CEO, responsible for
production and trading businesses on behalf of shareholders (Figure 5-7).
Figure 5-7 Management board structure- VNM case
Source: Vinamilk, 2009 “extraordinary meeting report”
Responsibility for quality systems (QS) comes under the leadership of the Executive Director
of Production and R&D, who is responsible for quality control in production. The division of
QS in the company is responsible for setting up technical requirements of raw materials and
end products, announcing quality of products according to Law, and managing and
monitoring quality. The Division of QA in plants implements the control of input materials,
127
technical specifications of processing, analyzing end products, and allowing products to
markets if goods achieved acceptable criteria.
5.2.3 Supply chain structure
The supply chain of Vinamilk includes major input suppliers, independent dairy farmers, its
own farms, and imported milk powder. TetraPak (Sweden), Moboloc (Germany) are
companies supplying packaging, containers, machines, and equipment. Dairy farmers, own
farms in provinces such as Can Tho, Ho Chi Minh, Lam Dong, and Nghe An, supply fresh
milk as raw material for dairy processing plants (see Figure 5-8). In the supply chain, VNM
has the leading role in procurement and distribution of milk products. It collects milk
produced on private farms and its own farms. VNM is also the company occupying the
largest share in the procurement and collection of fresh milk on domestic market (48% of the
share in 2008 (VNSC, 2009), which was larger than DLM and MCM).
VNM‟s supply chain is a partially integrated vertical structure and is similar to other cases,
such as DLM and MCM. The chain is organised with own farms satisfying the partial
demand of milk to plants, and with most small farmers supplying to plants through collection
systems of VNM, dealers, and cooperatives.
In dairy production, VNM owns dairy farms in Can Tho, Lam Dong, Nghe An, Tuyen
Quang, and Ho Chi Minh provinces, and each farm has over 2,000 cows, with an average
milk yield of 25 – 30 litre per cow a day. These farms are equipped with industrial facilities,
sheds, shelter, parlours, automatic milking machines, and modern sanitized systems. These
farms supply fresh milk to processing plants. Beyond this source, contracted farms supply
milk to plants. Establishing its own farms to supply milk to processing plants in VNM is
similar to that of other companies, MCM and DLM; however, it has a difference from MCM
in that are farms are located in a more focused area within 20 -30 km diameter.
In distribution, the company maintains both traditional and modern marketing channels. For
the traditional channel, VNM has branches, 220 head distributors, 14,000 retail shops, 14
show rooms in Ha Noi, Da Nang, Ho Chi Minh City, and Can Tho. Besides this, VNM
supplies to grocery stores and supermarkets, and metros, as modern distribution to
consumers, with 1,400 level 1 agents. 5,000 level 2 agents. It maintains 170,000 retail outlets,
and groceries located in 64 provinces and cities in the country (Vinamilk, 2010; Luong,
128
2010). This is larger than the number of retail outlets of DLM, around 150,000 in 2009
(Dutchlady, 2009; Phan, 2009). Grocery is one of retailing types that are popular in Vietnam.
In grocery, a shop keeper, apart from selling other products, sells dairy products supplied by
various dairy companies, such as DLM, HNM, and BaVi Milk Company. VNM has strong
competition with rivals, such as DLM, in occupying domestic market share. Its market share
was 37% by value (Vinamilk, 2010) compared to 35% devoted to DLM (Dacco, 2010).
Figure 5-8 Dairy supply chain – VNM case
Source: Adapted from Vinamilk, 2009
To distribute and market dairy products fast and efficiently, the company has an agent
network spread out in the provinces. In each province, VNM‟s marketing executives receive
a part of their salary awarded according to sales, which encourages them enlist retail agents.
129
This agent network is an advantage of VNM over its rivals. However, efficient management
of agents, especially in isolated remote areas, is a challenge to the VNM because of
limitations in transportation. According to transport recommendations, maximum loading is
only 8 boxes, but in practice, up to 15 boxes are transported, which leads to unloading
damage of containers. VNM also faces difficulties in storage and in monitoring. For example,
in remote areas, there are no cooling facilities for fresh milk. The market for VNM‟s product
is very large, covering the country, so monitoring is very difficult, especially access to small
shops in remote and isolated areas. In addition, transporting products with cooling vehicles is
only accessible to agents, and head distributors, and after that, transporting dairy products is
by other means, such as motorbikes and trucks, where quality assurance is ignored (Luong,
2010).
5.2.4 Business strategy and QA systems
The company has quality policy that is oriented toward customers. “Leverage our customer‟s
belief through continuous innovation and development in quality, safety, competitive price
and customer-oriented services committed to satisfy all customer demands” (Vinamilk, 2006,
p2) is a part of long- term development strategy of the company. With its goal to become one
of the largest dairy businesses in the world with the turnover of USD3 billion by 2017, VNM
invests in depth in technology and processing machines. Plants have been newly-built to
produce high quality products, such as the milk powder plant equipped with the modern and
advanced assembly line in joint venture establishment with Miraka company (New Zealand)
with total investment of NZD90m. (Vinamilk, 2010), Mega milk processing plant in Binh
Duong province, and Tien Son milk processing plant in Bac Ninh province.
Milk supplies are concern of the company, because, at present, they are heavily reliant on
imports with high prices and passive supplies. Therefore, the company intends to reduce
dependence on this source and maintain domestic supply with high quality. Strategies for
quality that have been adopted and are successful are strictly controlling fresh milk, signing
contracts with farmers with compulsory terms, such as „absolutely not purchasing fresh milk
from hired milking workers‟. To support improving farming skills and hygienic practices for
dairy producers in dairy production, the company has signed an agreement with the Friesland
Campina company (DLM) to build together a dairy farming technical and training center in
Lam Dong province. The company has invested in building its own dairy farms equipped
with modern industrial and large scale technology. Such dairy farms have been built in Nghe
130
An, Vinh Phuc, Lam Dong, Binh Dinh, Binh Duong, and Soc Trang provinces, each farm
having 2,000 cows to supply an average of 30 million litres of milk a year. As a result, VNM
has basically assured fresh milk sources for its production and operation.
VNM is in collaboration with three European corporations, DSM (Swiss), Lonza (Swiss), and
Chris Hansen (Denmark) to research and apply nutritious science in dairy production and
manufacture. These are world-leading corporations in nutrition, especially in biological and
microbiological technology. With this international collaboration and application of advanced
equipment and the most modern laboratories, VNM employed domestic and foreign
specialists have manufactured specific milk formulas with international quality (VNS 2011).
To satisfy the increasing demand of high quality dairy products of consumers, VNM has
achieved two QA certifications. These are international HACCP certification in 2004 and
ISO 9000/2000 certification in 2000 (Vinamilk, 2010).
5.2.5 Perceived factors influencing adoption of QAS’s
5.2.5.1 Motivation
VNM is large company, exports dairy products, and has long history in production and
marketing. Regarding HACCP adoption, one of reasons given by the management was the
application of HACCP aims to satisfy a requirement of buyers in export markets. In such
circumstance, the company gets entry into countries where certification is required as quality
assurance, which means VNM must adapt to the food laws and Acts issued by these
countries‟ related authorities. An Executive Director of Marketing commented:
“ our buyers require the company to have this [HACCP] as proof of quality assurance” (VNM- p1).
The company gave another reason to pursue HACCP certification, which was gaining
competitive advantages over rivals in domestic and foreign markets. It is appear that
companies like to achieve the HACCP system as a tool for expanding into new markets. He
continued:
“ our company plans to export to potential markets where strong fiercely competition existed
among the companies having achieved HACCP certification, if we have not achieved this
system, jumping in new market becomes impossible…” (VNMp1).
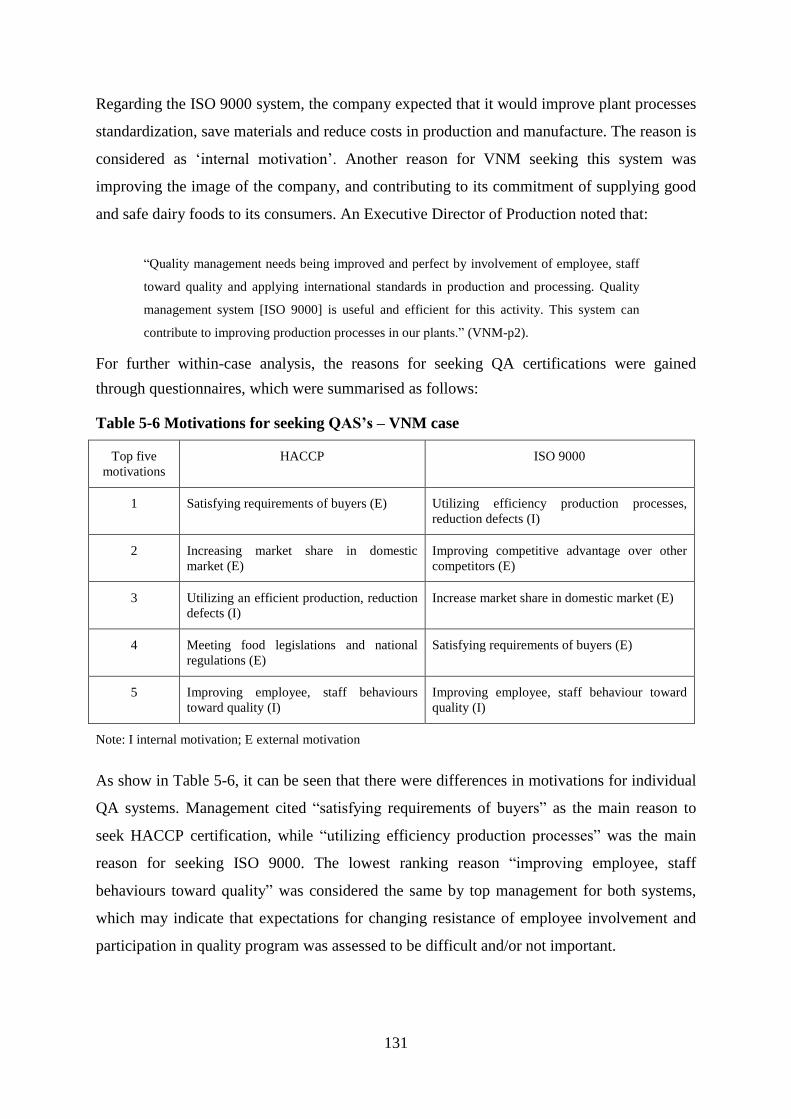
131
Regarding the ISO 9000 system, the company expected that it would improve plant processes
standardization, save materials and reduce costs in production and manufacture. The reason is
considered as „internal motivation‟. Another reason for VNM seeking this system was
improving the image of the company, and contributing to its commitment of supplying good
and safe dairy foods to its consumers. An Executive Director of Production noted that:
“Quality management needs being improved and perfect by involvement of employee, staff
toward quality and applying international standards in production and processing. Quality
management system [ISO 9000] is useful and efficient for this activity. This system can
contribute to improving production processes in our plants.” (VNM-p2).
For further within-case analysis, the reasons for seeking QA certifications were gained
through questionnaires, which were summarised as follows:
Table 5-6 Motivations for seeking QAS’s – VNM case
Top five
motivations
HACCP ISO 9000
1 Satisfying requirements of buyers (E) Utilizing efficiency production processes,
reduction defects (I)
2 Increasing market share in domestic
market (E)
Improving competitive advantage over other
competitors (E)
3 Utilizing an efficient production, reduction
defects (I)
Increase market share in domestic market (E)
4 Meeting food legislations and national
regulations (E)
Satisfying requirements of buyers (E)
5 Improving employee, staff behaviours
toward quality (I)
Improving employee, staff behaviour toward
quality (I)
Note: I internal motivation; E external motivation
As show in Table 5-6, it can be seen that there were differences in motivations for individual
QA systems. Management cited “satisfying requirements of buyers” as the main reason to
seek HACCP certification, while “utilizing efficiency production processes” was the main
reason for seeking ISO 9000. The lowest ranking reason “improving employee, staff
behaviours toward quality” was considered the same by top management for both systems,
which may indicate that expectations for changing resistance of employee involvement and
participation in quality program was assessed to be difficult and/or not important.
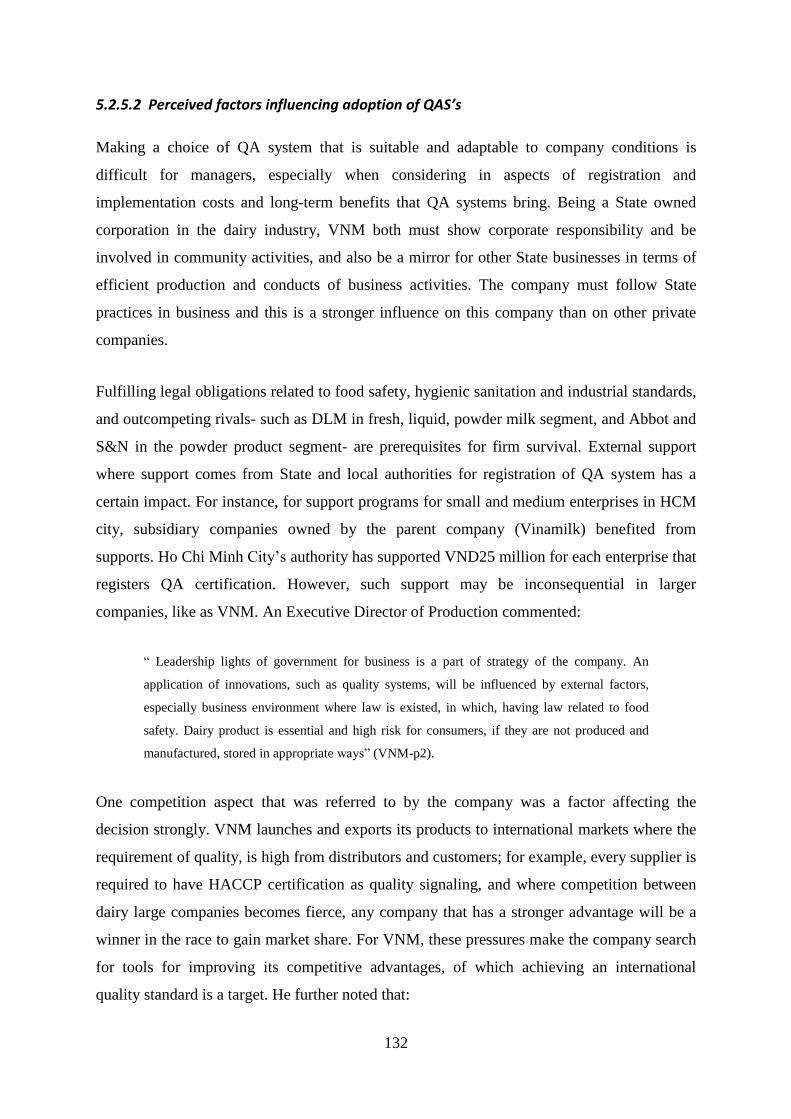
132
5.2.5.2 Perceived factors influencing adoption of QAS’s
Making a choice of QA system that is suitable and adaptable to company conditions is
difficult for managers, especially when considering in aspects of registration and
implementation costs and long-term benefits that QA systems bring. Being a State owned
corporation in the dairy industry, VNM both must show corporate responsibility and be
involved in community activities, and also be a mirror for other State businesses in terms of
efficient production and conducts of business activities. The company must follow State
practices in business and this is a stronger influence on this company than on other private
companies.
Fulfilling legal obligations related to food safety, hygienic sanitation and industrial standards,
and outcompeting rivals- such as DLM in fresh, liquid, powder milk segment, and Abbot and
S&N in the powder product segment- are prerequisites for firm survival. External support
where support comes from State and local authorities for registration of QA system has a
certain impact. For instance, for support programs for small and medium enterprises in HCM
city, subsidiary companies owned by the parent company (Vinamilk) benefited from
supports. Ho Chi Minh City‟s authority has supported VND25 million for each enterprise that
registers QA certification. However, such support may be inconsequential in larger
companies, like as VNM. An Executive Director of Production commented:
“ Leadership lights of government for business is a part of strategy of the company. An
application of innovations, such as quality systems, will be influenced by external factors,
especially business environment where law is existed, in which, having law related to food
safety. Dairy product is essential and high risk for consumers, if they are not produced and
manufactured, stored in appropriate ways” (VNM-p2).
One competition aspect that was referred to by the company was a factor affecting the
decision strongly. VNM launches and exports its products to international markets where the
requirement of quality, is high from distributors and customers; for example, every supplier is
required to have HACCP certification as quality signaling, and where competition between
dairy large companies becomes fierce, any company that has a stronger advantage will be a
winner in the race to gain market share. For VNM, these pressures make the company search
for tools for improving its competitive advantages, of which achieving an international
quality standard is a target. He further noted that:
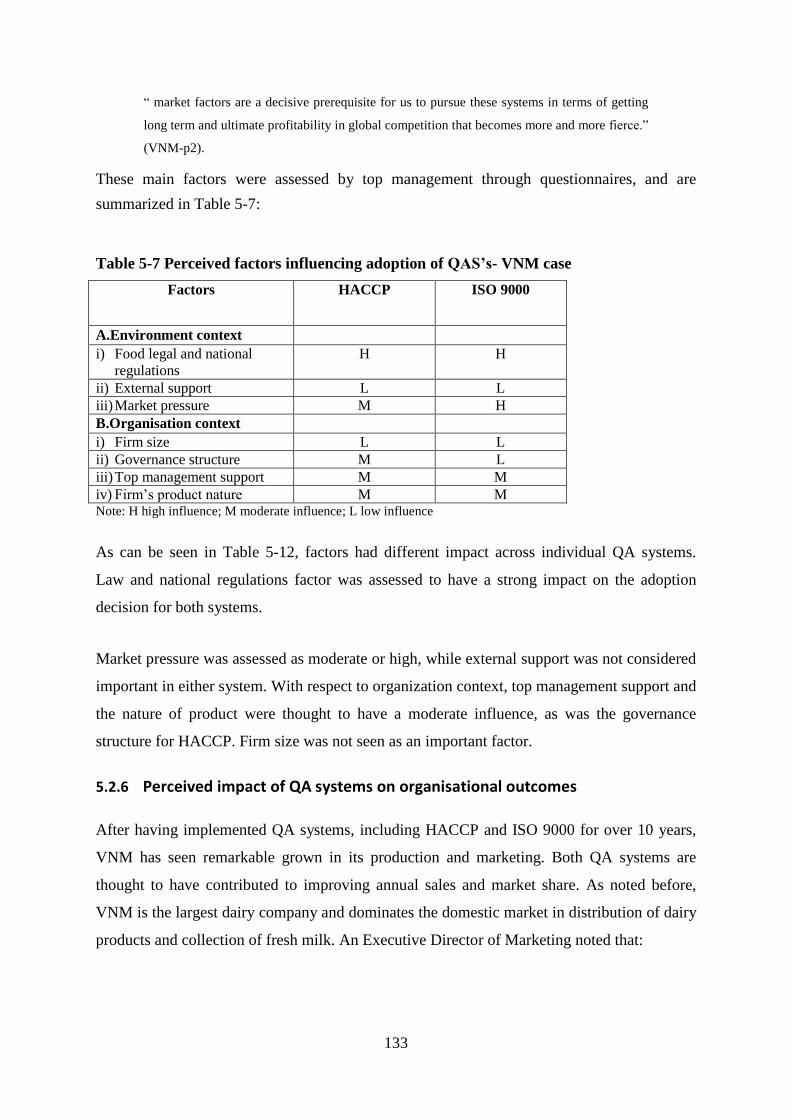
133
“ market factors are a decisive prerequisite for us to pursue these systems in terms of getting
long term and ultimate profitability in global competition that becomes more and more fierce.”
(VNM-p2).
These main factors were assessed by top management through questionnaires, and are
summarized in Table 5-7:
Table 5-7 Perceived factors influencing adoption of QAS’s- VNM case
Factors HACCP ISO 9000
A.Environment context i) Food legal and national
regulations
H H
ii) External support L L iii) Market pressure M H B.Organisation context i) Firm size L L ii) Governance structure M L iii) Top management support M M iv) Firm‟s product nature M M Note: H high influence; M moderate influence; L low influence
As can be seen in Table 5-12, factors had different impact across individual QA systems.
Law and national regulations factor was assessed to have a strong impact on the adoption
decision for both systems.
Market pressure was assessed as moderate or high, while external support was not considered
important in either system. With respect to organization context, top management support and
the nature of product were thought to have a moderate influence, as was the governance
structure for HACCP. Firm size was not seen as an important factor.
5.2.6 Perceived impact of QA systems on organisational outcomes
After having implemented QA systems, including HACCP and ISO 9000 for over 10 years,
VNM has seen remarkable grown in its production and marketing. Both QA systems are
thought to have contributed to improving annual sales and market share. As noted before,
VNM is the largest dairy company and dominates the domestic market in distribution of dairy
products and collection of fresh milk. An Executive Director of Marketing noted that:
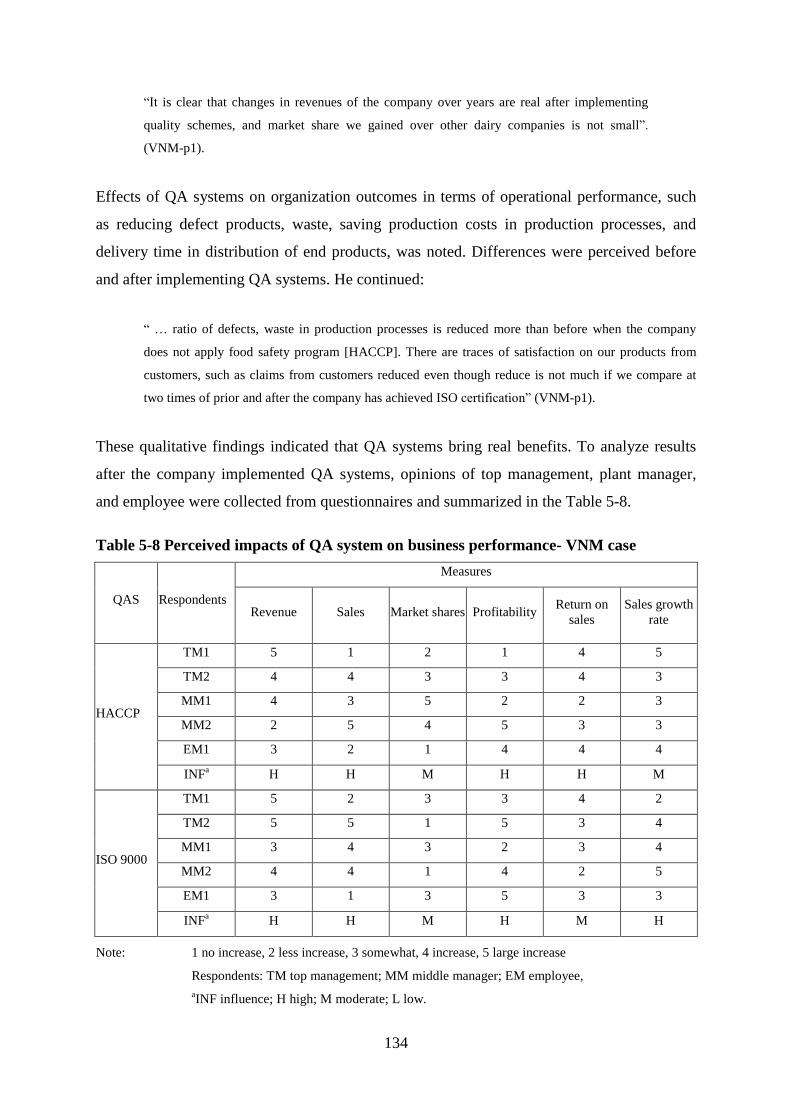
134
“It is clear that changes in revenues of the company over years are real after implementing
quality schemes, and market share we gained over other dairy companies is not small”.
(VNM-p1).
Effects of QA systems on organization outcomes in terms of operational performance, such
as reducing defect products, waste, saving production costs in production processes, and
delivery time in distribution of end products, was noted. Differences were perceived before
and after implementing QA systems. He continued:
“ … ratio of defects, waste in production processes is reduced more than before when the company
does not apply food safety program [HACCP]. There are traces of satisfaction on our products from
customers, such as claims from customers reduced even though reduce is not much if we compare at
two times of prior and after the company has achieved ISO certification” (VNM-p1).
These qualitative findings indicated that QA systems bring real benefits. To analyze results
after the company implemented QA systems, opinions of top management, plant manager,
and employee were collected from questionnaires and summarized in the Table 5-8.
Table 5-8 Perceived impacts of QA system on business performance- VNM case
QAS Respondents
Measures
Revenue Sales Market shares Profitability Return on
sales
Sales growth
rate
HACCP
TM1 5 1 2 1 4 5
TM2 4 4 3 3 4 3
MM1 4 3 5 2 2 3
MM2 2 5 4 5 3 3
EM1 3 2 1 4 4 4
INFa H H M H H M
ISO 9000
TM1 5 2 3 3 4 2
TM2 5 5 1 5 3 4
MM1 3 4 3 2 3 4
MM2 4 4 1 4 2 5
EM1 3 1 3 5 3 3
INFa H H M H M H
Note: 1 no increase, 2 less increase, 3 somewhat, 4 increase, 5 large increase
Respondents: TM top management; MM middle manager; EM employee,
aINF influence; H high; M moderate; L low.
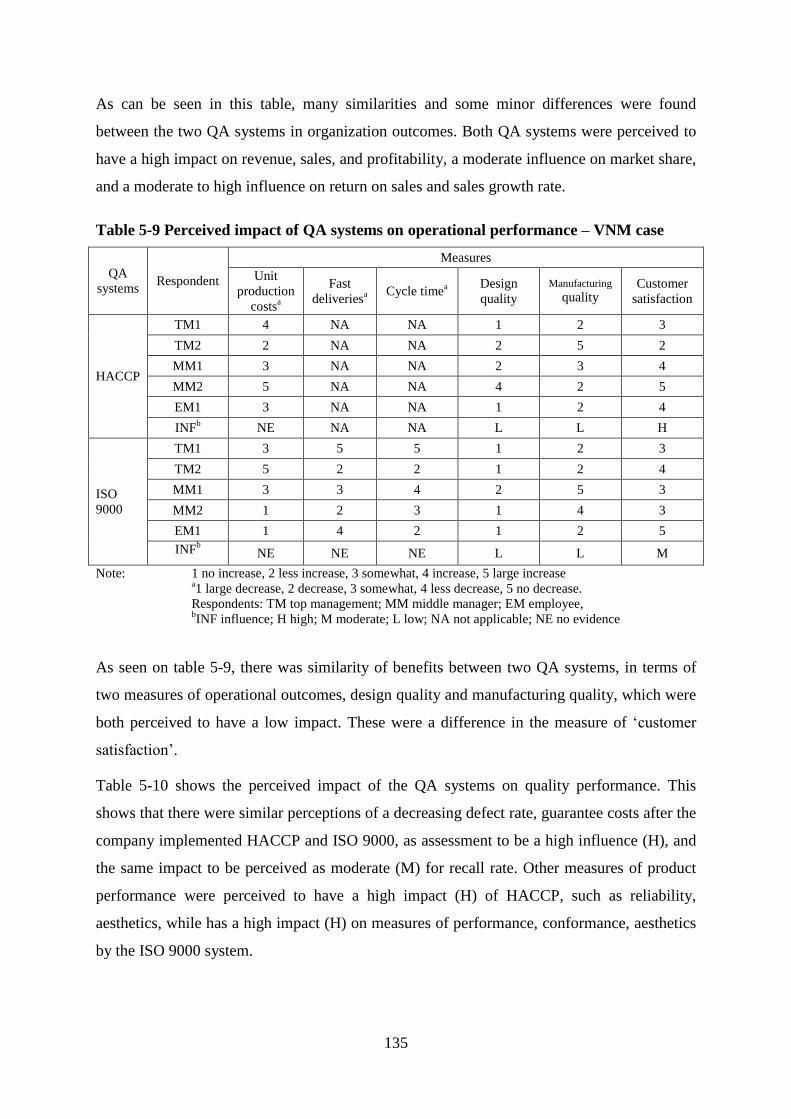
135
As can be seen in this table, many similarities and some minor differences were found
between the two QA systems in organization outcomes. Both QA systems were perceived to
have a high impact on revenue, sales, and profitability, a moderate influence on market share,
and a moderate to high influence on return on sales and sales growth rate.
Table 5-9 Perceived impact of QA systems on operational performance – VNM case
QA
systems Respondent
Measures
Unit
production
costsa
Fast
deliveriesa
Cycle timea
Design
quality
Manufacturing quality
Customer
satisfaction
HACCP
TM1 4 NA NA 1 2 3
TM2 2 NA NA 2 5 2
MM1 3 NA NA 2 3 4
MM2 5 NA NA 4 2 5
EM1 3 NA NA 1 2 4
INFb NE NA NA L L H
ISO
9000
TM1 3 5 5 1 2 3
TM2 5 2 2 1 2 4
MM1 3 3 4 2 5 3
MM2 1 2 3 1 4 3
EM1 1 4 2 1 2 5
INFb NE NE NE L L M
Note: 1 no increase, 2 less increase, 3 somewhat, 4 increase, 5 large increase a1 large decrease, 2 decrease, 3 somewhat, 4 less decrease, 5 no decrease.
Respondents: TM top management; MM middle manager; EM employee, bINF influence; H high; M moderate; L low; NA not applicable; NE no evidence
As seen on table 5-9, there was similarity of benefits between two QA systems, in terms of
two measures of operational outcomes, design quality and manufacturing quality, which were
both perceived to have a low impact. These were a difference in the measure of „customer
satisfaction‟.
Table 5-10 shows the perceived impact of the QA systems on quality performance. This
shows that there were similar perceptions of a decreasing defect rate, guarantee costs after the
company implemented HACCP and ISO 9000, as assessment to be a high influence (H), and
the same impact to be perceived as moderate (M) for recall rate. Other measures of product
performance were perceived to have a high impact (H) of HACCP, such as reliability,
aesthetics, while has a high impact (H) on measures of performance, conformance, aesthetics
by the ISO 9000 system.
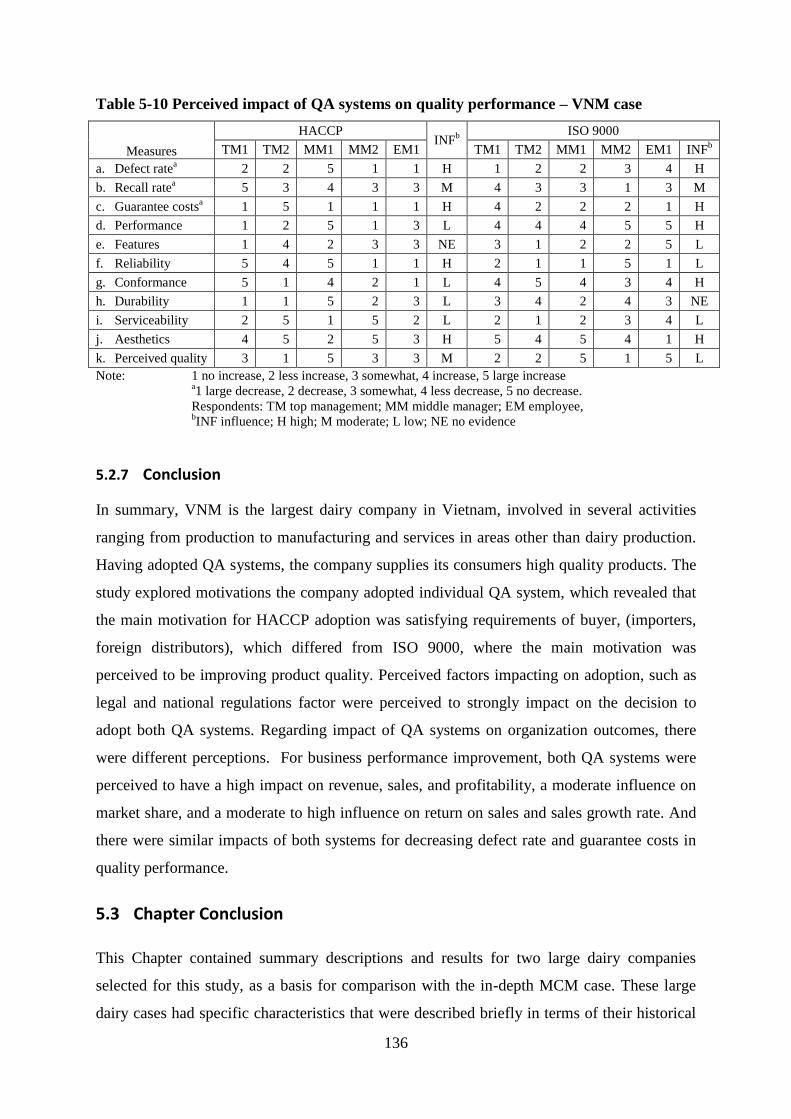
136
Table 5-10 Perceived impact of QA systems on quality performance – VNM case
Measures
HACCP INF
b
ISO 9000
TM1 TM2 MM1 MM2 EM1 TM1 TM2 MM1 MM2 EM1 INFb
a. Defect ratea 2 2 5 1 1 H 1 2 2 3 4 H
b. Recall ratea 5 3 4 3 3 M 4 3 3 1 3 M
c. Guarantee costsa 1 5 1 1 1 H 4 2 2 2 1 H
d. Performance 1 2 5 1 3 L 4 4 4 5 5 H
e. Features 1 4 2 3 3 NE 3 1 2 2 5 L
f. Reliability 5 4 5 1 1 H 2 1 1 5 1 L
g. Conformance 5 1 4 2 1 L 4 5 4 3 4 H
h. Durability 1 1 5 2 3 L 3 4 2 4 3 NE
i. Serviceability 2 5 1 5 2 L 2 1 2 3 4 L
j. Aesthetics 4 5 2 5 3 H 5 4 5 4 1 H
k. Perceived quality 3 1 5 3 3 M 2 2 5 1 5 L
Note: 1 no increase, 2 less increase, 3 somewhat, 4 increase, 5 large increase a1 large decrease, 2 decrease, 3 somewhat, 4 less decrease, 5 no decrease.
Respondents: TM top management; MM middle manager; EM employee, bINF influence; H high; M moderate; L low; NE no evidence
5.2.7 Conclusion
In summary, VNM is the largest dairy company in Vietnam, involved in several activities
ranging from production to manufacturing and services in areas other than dairy production.
Having adopted QA systems, the company supplies its consumers high quality products. The
study explored motivations the company adopted individual QA system, which revealed that
the main motivation for HACCP adoption was satisfying requirements of buyer, (importers,
foreign distributors), which differed from ISO 9000, where the main motivation was
perceived to be improving product quality. Perceived factors impacting on adoption, such as
legal and national regulations factor were perceived to strongly impact on the decision to
adopt both QA systems. Regarding impact of QA systems on organization outcomes, there
were different perceptions. For business performance improvement, both QA systems were
perceived to have a high impact on revenue, sales, and profitability, a moderate influence on
market share, and a moderate to high influence on return on sales and sales growth rate. And
there were similar impacts of both systems for decreasing defect rate and guarantee costs in
quality performance.
5.3 Chapter Conclusion
This Chapter contained summary descriptions and results for two large dairy companies
selected for this study, as a basis for comparison with the in-depth MCM case. These large
dairy cases had specific characteristics that were described briefly in terms of their historical
137
development and processes, production capacity, types of products, supply chain, and
governance structure. The strategies and quality assurance systems the companies are
applying within the company and its plants were identified. These two companies occupy a
total market share of 80% between them in the domestic market.
The two companies differ from each other in terms of their establishment and development,
size and capacity, capital capability, and ownership. However, they are similar in respect to
their degree of coordination (partial vertically integrated coordination by processor). The
differences may impact on the decision to adopt QA systems. These similarities and
differences will be explored further in Chapter 7, where the cross-case analysis is presented.
138
Chapter 6
Result 3- Small Firms: Hanoimilk and IDP cases-Description
and Analysis
In this Chapter, the remaining two cases are presented. These are both small companies,
Hanoimilk Company and the International Dairy Products Joint Stock Company (IDP). As
with Chapter 5, any new differences and similarities between these cases and the Moc Chau
Milk Company (MCM) are outlined with respect to the firm nature, governance structure and
supply chain structure. A brief analysis of factors impacting on adoption and organisational
outcomes is also presented for each individual case.
6.1 Hanoimilk Company (HNM)
6.1.1 Overview
HNM is a food company in northern Vietnam, with its main activities including processing
and marketing milk, soymilk, dairy foods, processing agricultural product, foodstuffs, drinks,
juice and other business activities (Hanoimilk, 2009). It was established in 2001 and began
operation formally in 2003. It has its headquarters office and milk processing plant in Vinh
Phuc province. The company has three branches in Hanoi, Binh Duong and Ho Chi Minh
City.
The number of employees and staff working in the company is 250 and the average salary per
worker was VND4,090,000 (≈USD210) monthly in 2010 (Hanoimilk, 2010). From 2005 to
2008, its turnover and profit were relatively static (Figure 6-1).
The company has gone through stages in the course of its development. On March 8, 2002,
HNM began to build its milk processing plant in Ha Noi. It has an annual capacity of 150
million litre, which is a large scale plant for Vietnam with an investment of VND100 billion
(≈ US$60 million). On April 4, 2002, VNM signed a contract to purchase modern milk
processing equipment and machines from Tetra Pak, Sweden. After one year of building and
trials, the milk processing plant began to formally operate. By October 2004, 100 million
product units of milk were processed in total. On 5 May, 2006, VNM moved its office and
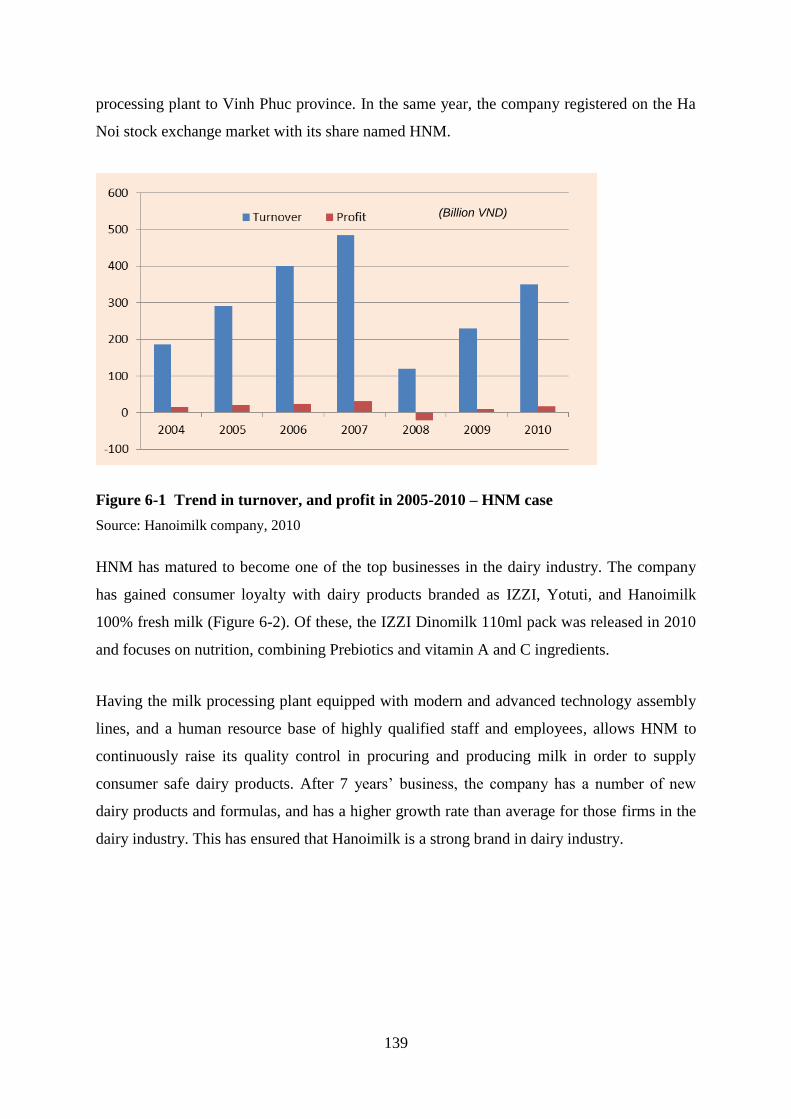
139
processing plant to Vinh Phuc province. In the same year, the company registered on the Ha
Noi stock exchange market with its share named HNM.
Figure 6-1 Trend in turnover, and profit in 2005-2010 – HNM case
Source: Hanoimilk company, 2010
HNM has matured to become one of the top businesses in the dairy industry. The company
has gained consumer loyalty with dairy products branded as IZZI, Yotuti, and Hanoimilk
100% fresh milk (Figure 6-2). Of these, the IZZI Dinomilk 110ml pack was released in 2010
and focuses on nutrition, combining Prebiotics and vitamin A and C ingredients.
Having the milk processing plant equipped with modern and advanced technology assembly
lines, and a human resource base of highly qualified staff and employees, allows HNM to
continuously raise its quality control in procuring and producing milk in order to supply
consumer safe dairy products. After 7 years‟ business, the company has a number of new
dairy products and formulas, and has a higher growth rate than average for those firms in the
dairy industry. This has ensured that Hanoimilk is a strong brand in dairy industry.
(Billion VND)
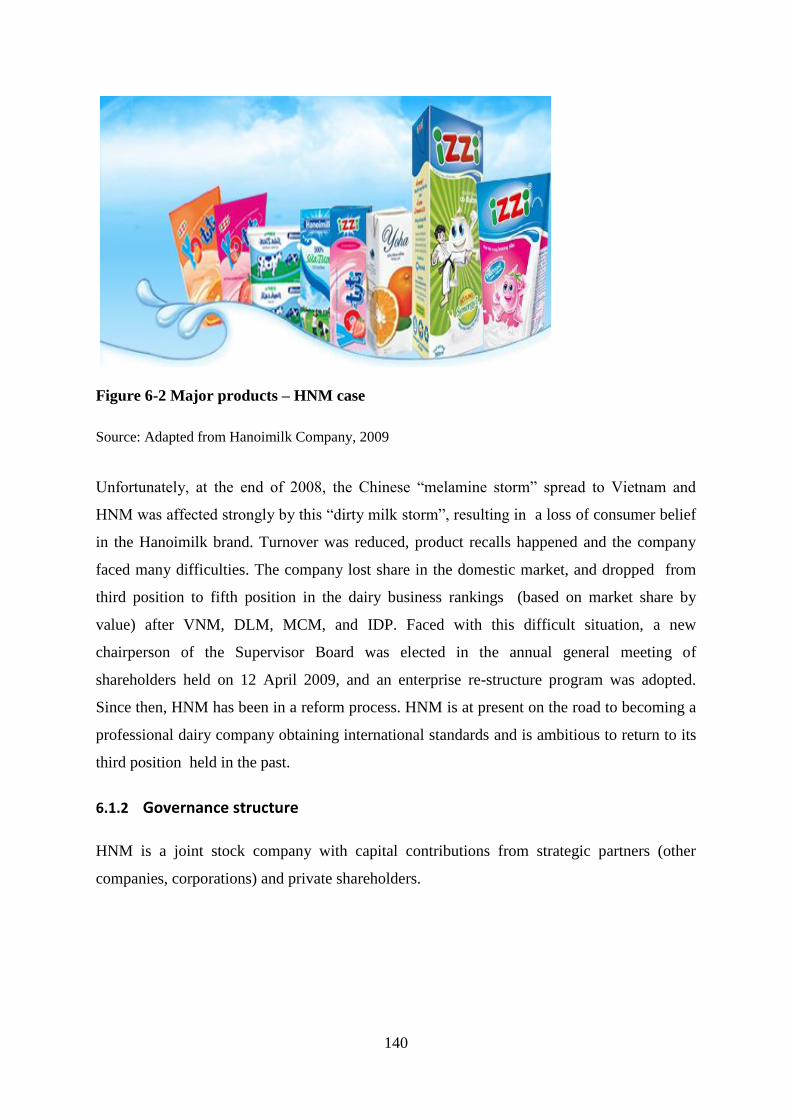
140
Figure 6-2 Major products – HNM case
Source: Adapted from Hanoimilk Company, 2009
Unfortunately, at the end of 2008, the Chinese “melamine storm” spread to Vietnam and
HNM was affected strongly by this “dirty milk storm”, resulting in a loss of consumer belief
in the Hanoimilk brand. Turnover was reduced, product recalls happened and the company
faced many difficulties. The company lost share in the domestic market, and dropped from
third position to fifth position in the dairy business rankings (based on market share by
value) after VNM, DLM, MCM, and IDP. Faced with this difficult situation, a new
chairperson of the Supervisor Board was elected in the annual general meeting of
shareholders held on 12 April 2009, and an enterprise re-structure program was adopted.
Since then, HNM has been in a reform process. HNM is at present on the road to becoming a
professional dairy company obtaining international standards and is ambitious to return to its
third position held in the past.
6.1.2 Governance structure
HNM is a joint stock company with capital contributions from strategic partners (other
companies, corporations) and private shareholders.
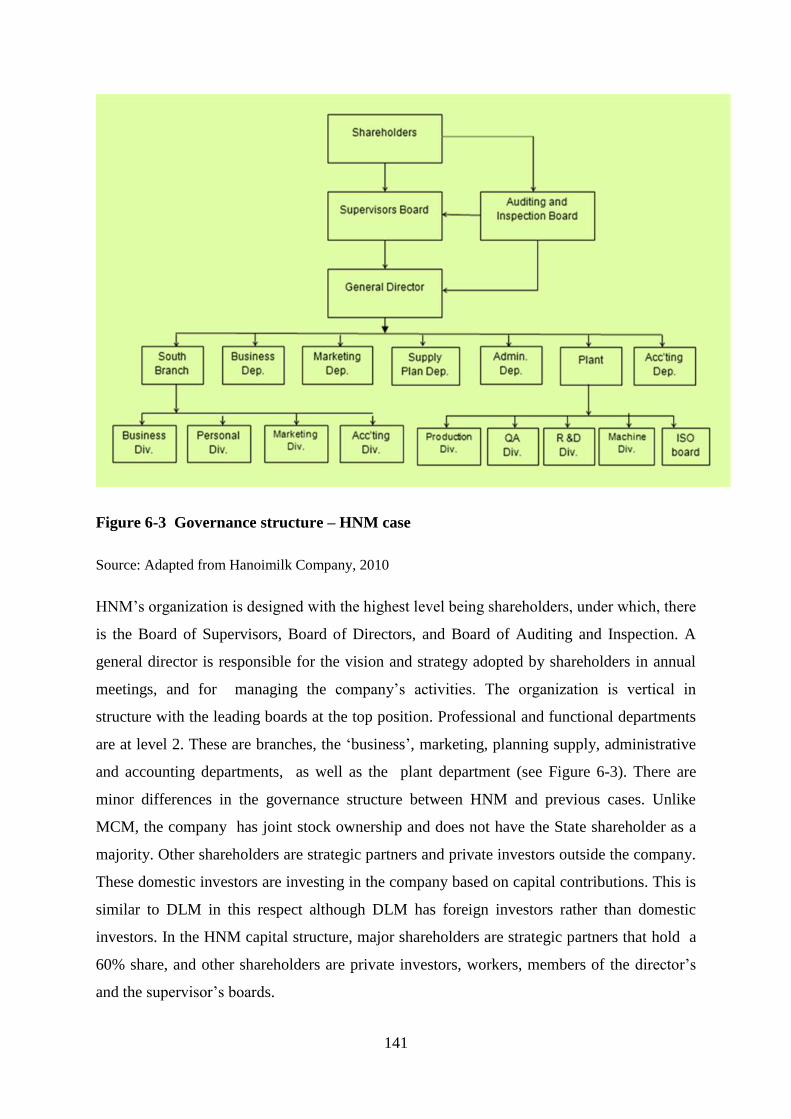
141
Figure 6-3 Governance structure – HNM case
Source: Adapted from Hanoimilk Company, 2010
HNM‟s organization is designed with the highest level being shareholders, under which, there
is the Board of Supervisors, Board of Directors, and Board of Auditing and Inspection. A
general director is responsible for the vision and strategy adopted by shareholders in annual
meetings, and for managing the company‟s activities. The organization is vertical in
structure with the leading boards at the top position. Professional and functional departments
are at level 2. These are branches, the „business‟, marketing, planning supply, administrative
and accounting departments, as well as the plant department (see Figure 6-3). There are
minor differences in the governance structure between HNM and previous cases. Unlike
MCM, the company has joint stock ownership and does not have the State shareholder as a
majority. Other shareholders are strategic partners and private investors outside the company.
These domestic investors are investing in the company based on capital contributions. This is
similar to DLM in this respect although DLM has foreign investors rather than domestic
investors. In the HNM capital structure, major shareholders are strategic partners that hold a
60% share, and other shareholders are private investors, workers, members of the director‟s
and the supervisor‟s boards.
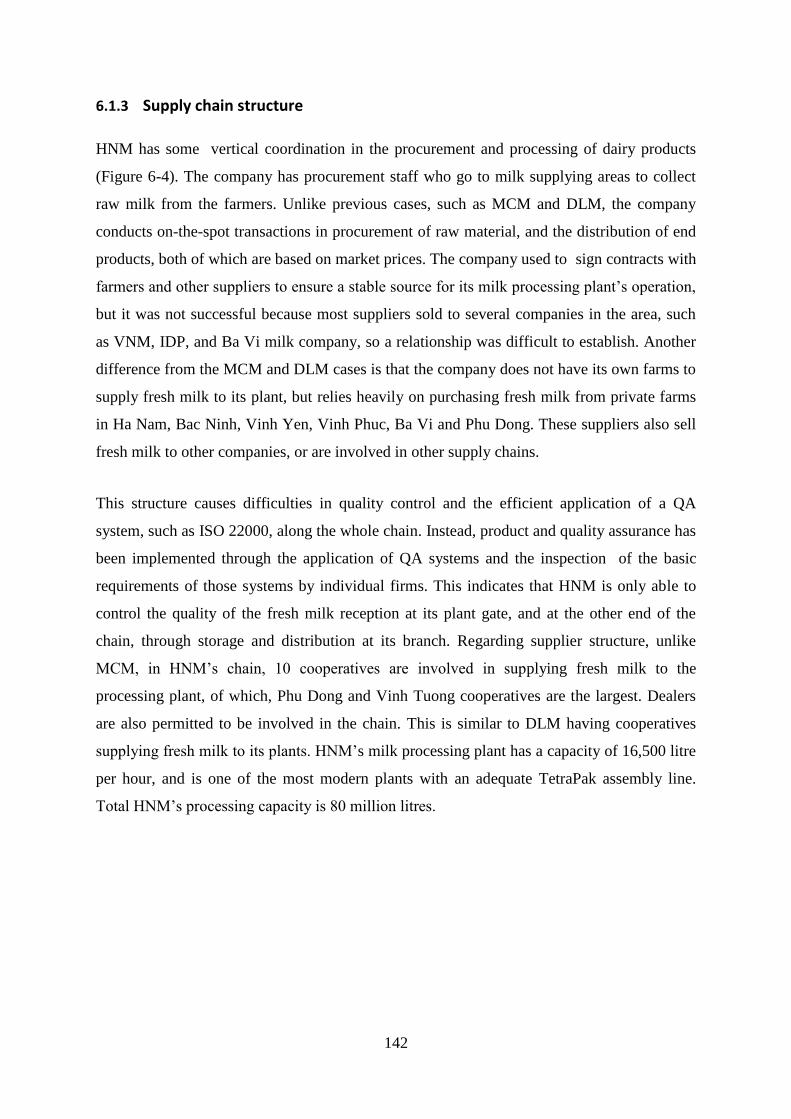
142
6.1.3 Supply chain structure
HNM has some vertical coordination in the procurement and processing of dairy products
(Figure 6-4). The company has procurement staff who go to milk supplying areas to collect
raw milk from the farmers. Unlike previous cases, such as MCM and DLM, the company
conducts on-the-spot transactions in procurement of raw material, and the distribution of end
products, both of which are based on market prices. The company used to sign contracts with
farmers and other suppliers to ensure a stable source for its milk processing plant‟s operation,
but it was not successful because most suppliers sold to several companies in the area, such
as VNM, IDP, and Ba Vi milk company, so a relationship was difficult to establish. Another
difference from the MCM and DLM cases is that the company does not have its own farms to
supply fresh milk to its plant, but relies heavily on purchasing fresh milk from private farms
in Ha Nam, Bac Ninh, Vinh Yen, Vinh Phuc, Ba Vi and Phu Dong. These suppliers also sell
fresh milk to other companies, or are involved in other supply chains.
This structure causes difficulties in quality control and the efficient application of a QA
system, such as ISO 22000, along the whole chain. Instead, product and quality assurance has
been implemented through the application of QA systems and the inspection of the basic
requirements of those systems by individual firms. This indicates that HNM is only able to
control the quality of the fresh milk reception at its plant gate, and at the other end of the
chain, through storage and distribution at its branch. Regarding supplier structure, unlike
MCM, in HNM‟s chain, 10 cooperatives are involved in supplying fresh milk to the
processing plant, of which, Phu Dong and Vinh Tuong cooperatives are the largest. Dealers
are also permitted to be involved in the chain. This is similar to DLM having cooperatives
supplying fresh milk to its plants. HNM‟s milk processing plant has a capacity of 16,500 litre
per hour, and is one of the most modern plants with an adequate TetraPak assembly line.
Total HNM‟s processing capacity is 80 million litres.
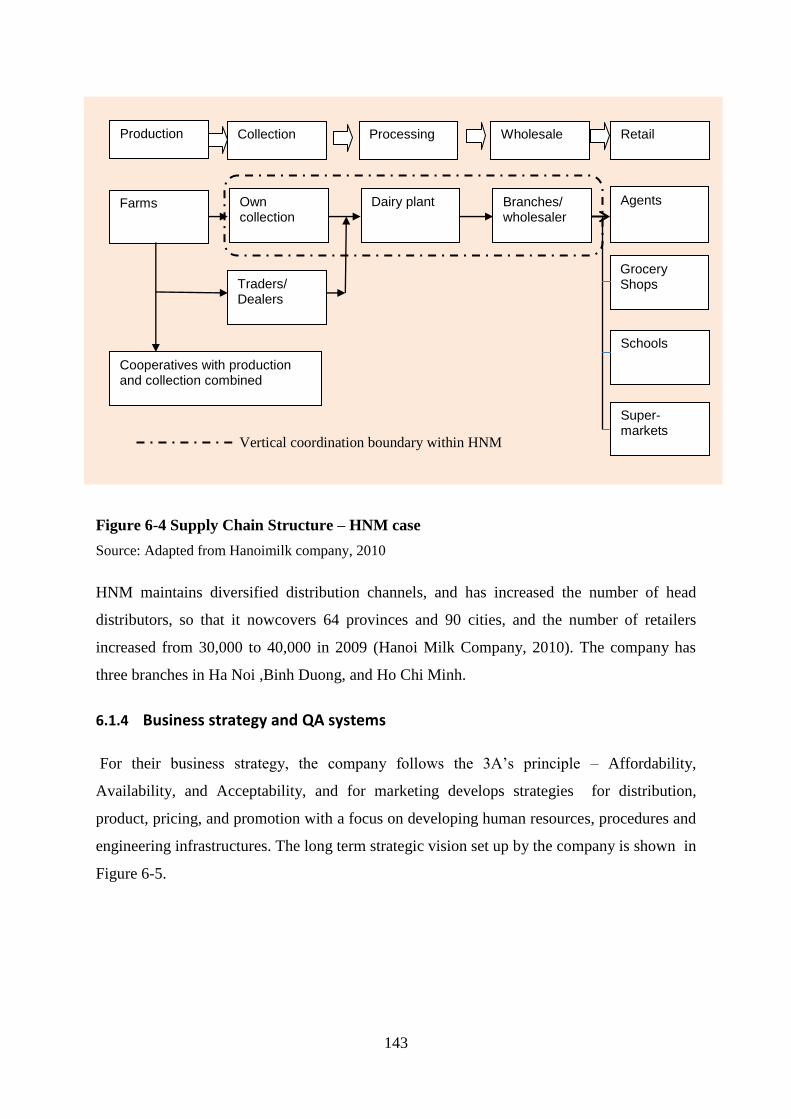
143
Vertical coordination boundary within HNM
Figure 6-4 Supply Chain Structure – HNM case
Source: Adapted from Hanoimilk company, 2010
HNM maintains diversified distribution channels, and has increased the number of head
distributors, so that it nowcovers 64 provinces and 90 cities, and the number of retailers
increased from 30,000 to 40,000 in 2009 (Hanoi Milk Company, 2010). The company has
three branches in Ha Noi ,Binh Duong, and Ho Chi Minh.
6.1.4 Business strategy and QA systems
For their business strategy, the company follows the 3A‟s principle – Affordability,
Availability, and Acceptability, and for marketing develops strategies for distribution,
product, pricing, and promotion with a focus on developing human resources, procedures and
engineering infrastructures. The long term strategic vision set up by the company is shown in
Figure 6-5.
Farms
Cooperatives with production and collection combined
Production Collection Processing Wholesale Retail
Own collection
Traders/ Dealers
Dairy plant Branches/ wholesaler
Agents
Grocery Shops
Schools
Super- markets
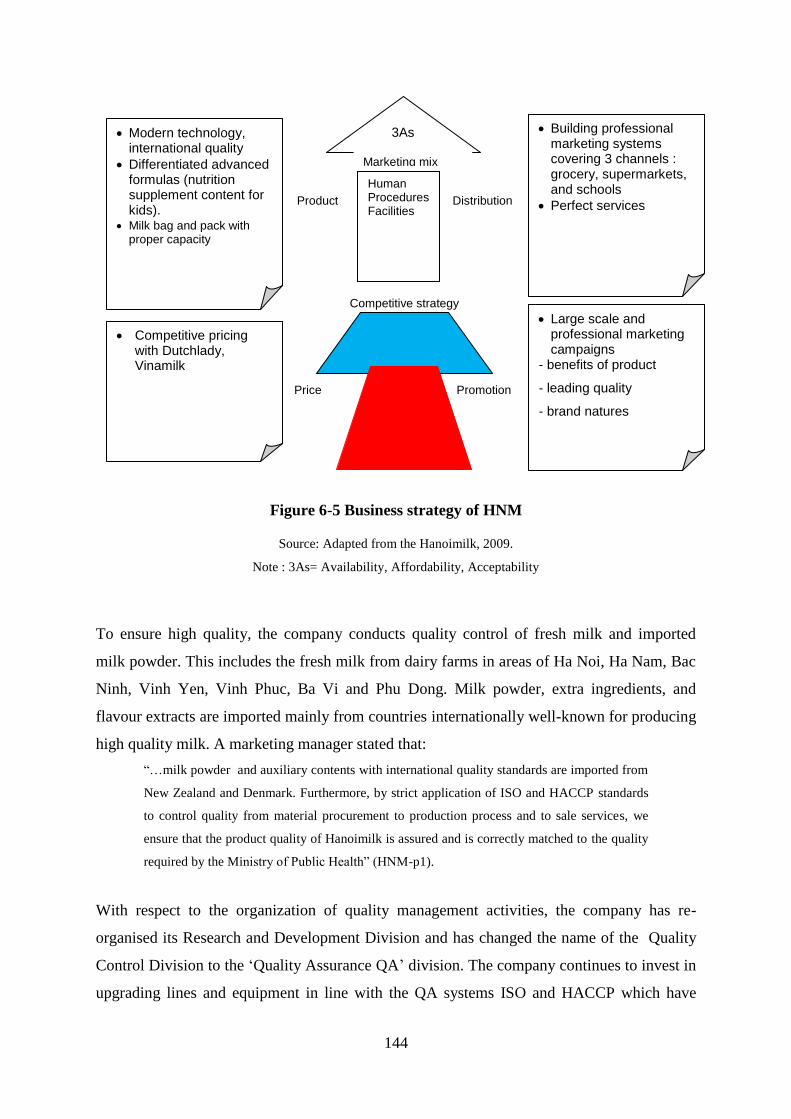
144
Figure 6-5 Business strategy of HNM
Source: Adapted from the Hanoimilk, 2009.
Note : 3As= Availability, Affordability, Acceptability
To ensure high quality, the company conducts quality control of fresh milk and imported
milk powder. This includes the fresh milk from dairy farms in areas of Ha Noi, Ha Nam, Bac
Ninh, Vinh Yen, Vinh Phuc, Ba Vi and Phu Dong. Milk powder, extra ingredients, and
flavour extracts are imported mainly from countries internationally well-known for producing
high quality milk. A marketing manager stated that:
“…milk powder and auxiliary contents with international quality standards are imported from
New Zealand and Denmark. Furthermore, by strict application of ISO and HACCP standards
to control quality from material procurement to production process and to sale services, we
ensure that the product quality of Hanoimilk is assured and is correctly matched to the quality
required by the Ministry of Public Health” (HNM-p1).
With respect to the organization of quality management activities, the company has re-
organised its Research and Development Division and has changed the name of the Quality
Control Division to the „Quality Assurance QA‟ division. The company continues to invest in
upgrading lines and equipment in line with the QA systems ISO and HACCP which have
Modern technology, international quality
Differentiated advanced formulas (nutrition supplement content for kids).
Milk bag and pack with proper capacity
Building professional marketing systems covering 3 channels : grocery, supermarkets, and schools
Perfect services
3As
Human Procedures Facilities
Distribution Product
Competitive strategy
Marketing mix
Large scale and professional marketing campaigns
- benefits of product
- leading quality
- brand natures
Competitive pricing with Dutchlady, Vinamilk
Price Promotion
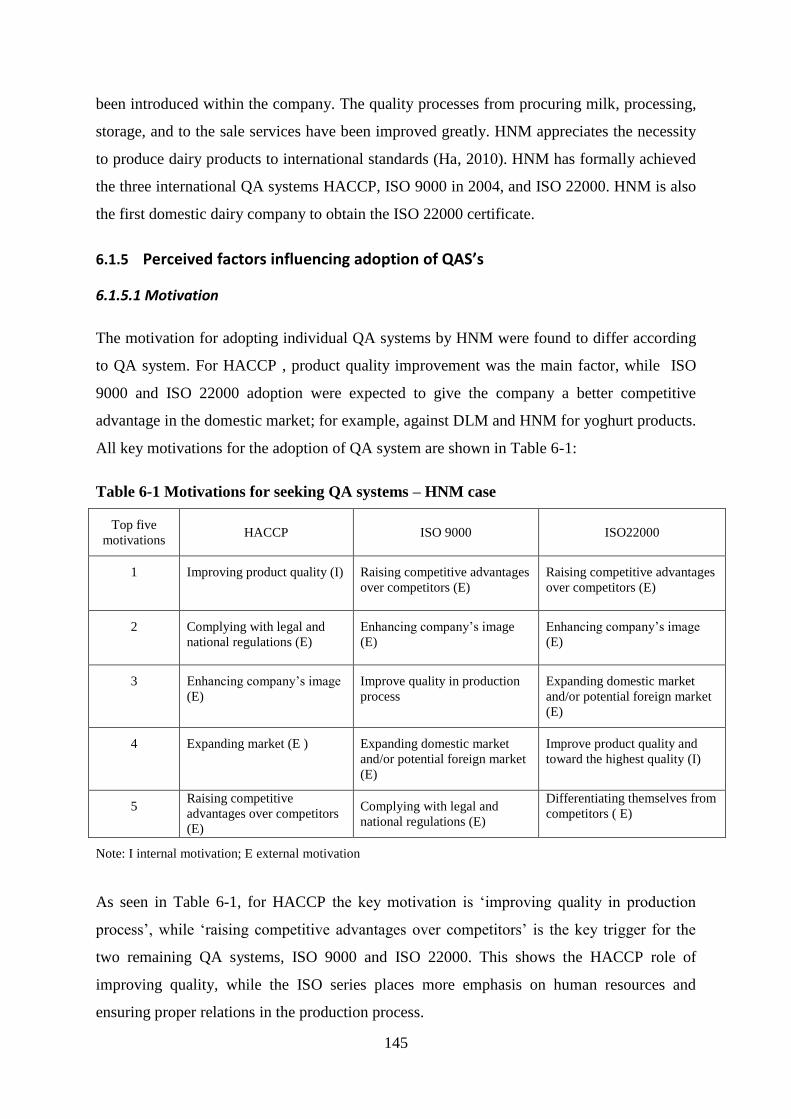
145
been introduced within the company. The quality processes from procuring milk, processing,
storage, and to the sale services have been improved greatly. HNM appreciates the necessity
to produce dairy products to international standards (Ha, 2010). HNM has formally achieved
the three international QA systems HACCP, ISO 9000 in 2004, and ISO 22000. HNM is also
the first domestic dairy company to obtain the ISO 22000 certificate.
6.1.5 Perceived factors influencing adoption of QAS’s
6.1.5.1 Motivation
The motivation for adopting individual QA systems by HNM were found to differ according
to QA system. For HACCP , product quality improvement was the main factor, while ISO
9000 and ISO 22000 adoption were expected to give the company a better competitive
advantage in the domestic market; for example, against DLM and HNM for yoghurt products.
All key motivations for the adoption of QA system are shown in Table 6-1:
Table 6-1 Motivations for seeking QA systems – HNM case
Top five
motivations HACCP ISO 9000 ISO22000
1 Improving product quality (I) Raising competitive advantages
over competitors (E)
Raising competitive advantages
over competitors (E)
2 Complying with legal and
national regulations (E)
Enhancing company‟s image
(E)
Enhancing company‟s image
(E)
3 Enhancing company‟s image
(E)
Improve quality in production
process
Expanding domestic market
and/or potential foreign market
(E)
4 Expanding market (E ) Expanding domestic market
and/or potential foreign market
(E)
Improve product quality and
toward the highest quality (I)
5 Raising competitive
advantages over competitors
(E)
Complying with legal and
national regulations (E)
Differentiating themselves from
competitors ( E)
Note: I internal motivation; E external motivation
As seen in Table 6-1, for HACCP the key motivation is „improving quality in production
process‟, while „raising competitive advantages over competitors‟ is the key trigger for the
two remaining QA systems, ISO 9000 and ISO 22000. This shows the HACCP role of
improving quality, while the ISO series places more emphasis on human resources and
ensuring proper relations in the production process.
146
6.1.5.2 Perceived factors influencing adoption of QAS’s
In this particular within-case analysis, legal factors, including food safety legislation issued
by related authorities and ministries, was perceived to be critically important to the adoption
decision for the HACCP system. This factor was perceived to have a stronger influence on
this system than on other QA systems. This was due to the enforcement and mandatory nature
of HACCP within food businesses carried out by the government in recent years. It is likely
to also have been influenced by the experience HNM had with the melamine scandal.
Another factor, market pressure, was perceived to have a high influence on the adoption
decision for HACCP and ISO 22000. It was explained by the officials that they liked to
differentiate their products by the adoption of QA systems particularly when they started to
compete with larger companies, such as DLM and VNM in northern markets in recent years
(See Table 6-2). This different influence of this factor between the three QA system
adoptions was perceived to have a moderate influence on the adoption of ISO 9000. It may
be concluded that the company has competed with other companies by using QA systems for
quality improvement rather than a marketing tool per se.
According to one respondent, external support had a role in the diffusion of QA systems.
Such support, such as certifying bodies offering training courses related to QA systems, were
more for ISO 9000 than HACCP. So, this factor was not perceived as having strongly
affected HACCP‟s adoption decision.
“ we received some guidance through butterfly leaf and documentation that talked about
HACCP from certifying companies. This documentation is only an introduction and suggests
the company register, and shows necessary conditions that the company needs to have. For
ISO 9000 system, we learned that we would benefit from training courses for quality staff and
employees. This is a favour for the company if it involves obtaining international standards”
(HNM-p1).
The governance structure was another factor affecting the QA adoption decision in respect to
the organisation and qualifications of the top managers‟. The Board of Directors members in
HNM have high qualifications and education, which may impact on promoting QA systems
within the company. Most members of the supervisory and directorial boards have doctoral
degrees and have 20 years‟ experience in business and management. This factor promotes the
introduction of new QA systems within the company as well as quality campaigns. Unlike
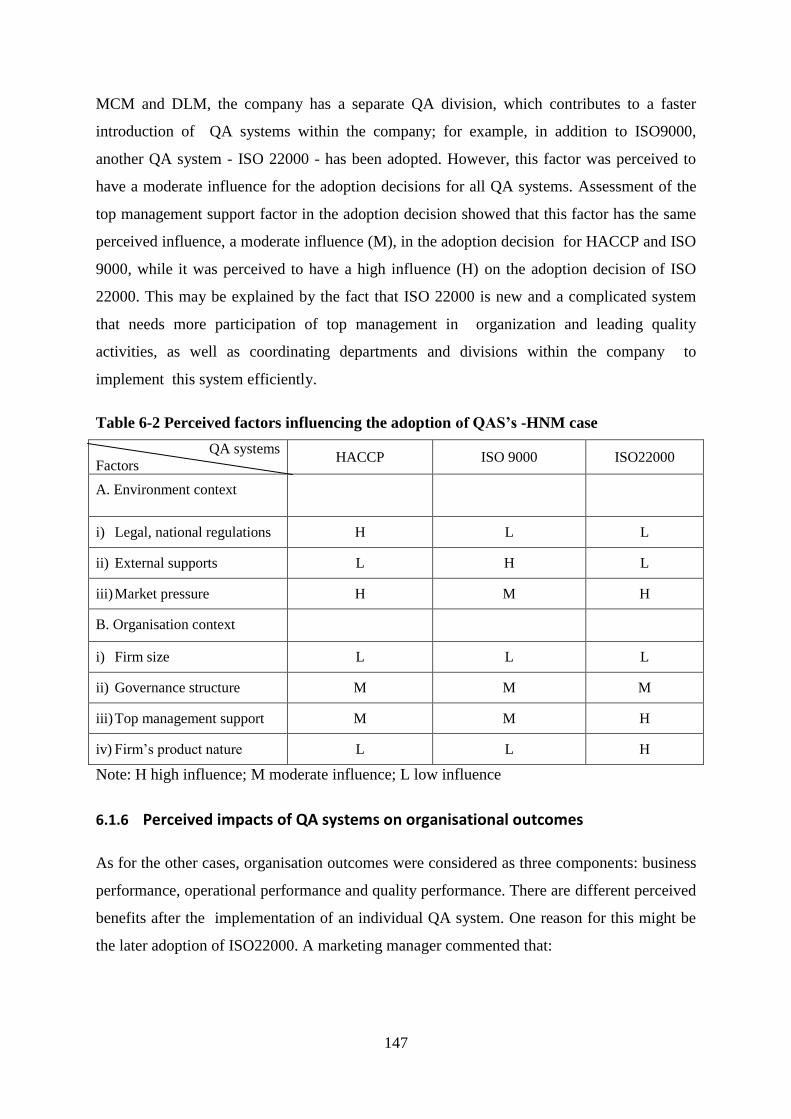
147
MCM and DLM, the company has a separate QA division, which contributes to a faster
introduction of QA systems within the company; for example, in addition to ISO9000,
another QA system - ISO 22000 - has been adopted. However, this factor was perceived to
have a moderate influence for the adoption decisions for all QA systems. Assessment of the
top management support factor in the adoption decision showed that this factor has the same
perceived influence, a moderate influence (M), in the adoption decision for HACCP and ISO
9000, while it was perceived to have a high influence (H) on the adoption decision of ISO
22000. This may be explained by the fact that ISO 22000 is new and a complicated system
that needs more participation of top management in organization and leading quality
activities, as well as coordinating departments and divisions within the company to
implement this system efficiently.
Table 6-2 Perceived factors influencing the adoption of QAS’s -HNM case
QA systems Factors
HACCP ISO 9000 ISO22000
A. Environment context
i) Legal, national regulations H L L
ii) External supports L H L
iii) Market pressure H M H
B. Organisation context
i) Firm size L L L
ii) Governance structure M M M
iii) Top management support M M H
iv) Firm‟s product nature L L H
Note: H high influence; M moderate influence; L low influence
6.1.6 Perceived impacts of QA systems on organisational outcomes
As for the other cases, organisation outcomes were considered as three components: business
performance, operational performance and quality performance. There are different perceived
benefits after the implementation of an individual QA system. One reason for this might be
the later adoption of ISO22000. A marketing manager commented that:
148
“ company has really benefited from quality programs adopted in terms of increasing turnover
in the past three years, improving the position of the company on the market, and improving
the behaviour of employees toward quality and safety; however, such achievements obtained
over the years resulted more from HACCP and ISO 9000. The new system ISO 22000: 2005,
in practice, has just been adopted for one year, which does not allow assessing the results
achieved” (HNM-p1).
It was also noted that the QA systems were not necessarily totally responsible for better
organizational outcomes. One respondent suggested:
“Our perception of benefits from quality systems is different between each person, …
According to our data, turnover that has been increasing after the scandal does not imply
quality programs contributed to all the improvement even if the „accident‟ shock, like the
melamine scandal, recently wiped off the total achievements that we obtained before”
(HNM-p2).
However, other comments indicated that the company‟s performance has improved when it
adopted QA systems, and has improved more over the last 5-6 years, which is an appropriate
period for an assessment of the changes in measurements of performance. A marketing
manager stated that:
“It is clear that business performance has improved after we adopted quality programs that
help in product and market aspects” (HNM-p1).
“… plant‟s activities and the involvement of employees in quality control and commitments
has improved and this result is considered in part due to the success of quality programs in
practice” (HNM-p2).
The company has options to adopt, reject, abort, and resume quality programs. According to
these systems‟ guides and requirements, QA certifications are valid for 3 years, and after
three years, a company may continue or abort participating in the QA system. Currently,
HNM still adopts and maintains these QA systems within its plant. This is also evidence of
the benefit brought by these systems, and explains why the company pursues them.
To gain an insight into the perceived impacts of QA systems, opinions were synthesized from
the questionnaires. Results are shown in Table 6-3. There was perceived to be a higher
influence by the HACCP system than other systems on business performance measures.
149
Respondents cited increased sales and market share as showing “high influence‟ when it
adopted the HACCP system, with „low influence‟ for ISO 9000 and „no evidence‟ for ISO
22000. For HACCP, an high influence was also noted for the return on sales and the sales
growth rate. ISO 9000 was perceived to have a high influence on profitability, return on sales,
and sales growth rate, with less impact on these factors perceived for ISO 22000.
Table 6-3 Perceived impact of QA systems on business performance – HNM case
QA
system Respondent Revenue Sales
Market
shares Profitability
Return on
sales
Sales
growth rate
HACCP
TM 3 4 2 3 4 2
MM 3 3 4 2 5 4
EM 5 4 5 4 5 5
INF a M H H NE H H
ISO9000
TM 2 2 2 5 4 4
MM 5 1 5 3 1 4
EM 2 1 2 5 5 1
INF a L L L H H H
ISO22200
TM 5 5 3 1 3 2
MM 2 3 1 3 2 3
EM 2 2 5 3 1 3
INF a L NE NE M L M
Note: 1: no increase, 2: less increase, 3: somewhat, 4: increase, 5: large increase.
Respondents: TM top management; MM middle manager; EM employees
a INF influence: L low influence; M moderate; H high influence; NE no evidence.
For the impacts from the implementation of QA systems on operational outcomes, the
research results indicated there were different impacts for different measures across the
individual QA systems. For example, HACCP was perceived to have increased „customer
satisfaction‟, which may be a reflection that quality improved after implementation of this
system. This outcome is the same for ISO 9000 in this respect. For ISO9000, other measures
were perceived to have improved, such as „fast deliveries‟ and „manufacturing quality‟.
Despite having been the last system adopted, ISO 22000 was perceived to have made a
contribution to manufacturing quality and, in addition, other measures were improved, such
as fast deliveries and cycle time. In contrast, customer satisfaction was perceived to have a
moderate impact that can possibly be explained by the length of implementation. It was noted
that it was hard to implement this system in the initial stage, and at the time it was
implemented within the plant, it had been implemented by other firms in the chain.
150
Table 6-4 Perceived impact of QA systems on operational performance – HNM case
QA
systems Respondents
Unit
production
costs a
Fast
deliveriesa
Cycle
timea
Design
quality
Manufacturi
ng quality
Customer
satisfaction
HACCP
TM 2 NA NA 5 3 4
MM 1 NA NA 3 1 3
EM 2 NA NA 2 4 4
INF b H NA NA NE NE H
ISO9000
TM 2 1 4 5 4 4
MM 3 1 1 3 4 5
EM 5 2 3 2 3 4
INF b NE H NE NE H H
ISO22200
TM 1 2 1 2 5 1
MM 3 4 1 4 2 2
EM 3 1 5 1 5 4
INF b M H H M H M
Note: 1: no increase, 2: less increase, 3: somewhat, 4: increase, 5: large increase. a 1: large decrease, 2: decrease, 3: somewhat, 4: less decrease, 5: no decrease.
TM top management; MM middle manager; EM employees b INF influence: L low influence; M moderate; H high influence.
Assessment of respondents for impacts of QA systems on quality performance found there
was benefit relating to outcomes such as perceived defect rate, recall rate, and guarantee
costs, all of which decreased strongly. These were assessed to have a high influence after
implementing the three QA systems, and this result was the same for all three systems. The
remaining measures for quality performance, such as product „performance‟ showed a high
influence for HACCP, with a moderate influence for ISO 22000. It was strange that there was
no difference between HACCP and ISO 9000 in measures for quality performance, overall,
where it is assessed to be low influence (in other words, less impact resulted from
implementation of these systems), while there was „moderate influence‟ (with a range from
„increase to strongly increase‟) for ISO 22000.
151
Table 6-5 Perceived impact of QA systems on quality performance – HNM case
Measures
HACCP
ISO9000
ISO22200
TM MM EM INFb TM MM EM INF
b TM MM EM INF
b
a. Defect rate a 2 4 1 H 2 2 1 H 2 1 2 H
b. Recall rate a 1 2 3 H 1 1 1 H 3 1 1 H
c. Guarantee costs a 1 2 1 H 2 2 1 H 1 1 4 H
d. Performance 2 4 5 H 4 1 3 NE 5 3 3 M
e. Features 2 1 1 L 4 1 2 L 3 3 2 M
f. Reliability 2 5 4 H 1 3 5 NE 2 2 5 M
g. Conformance 5 1 2 L 2 3 2 L 1 1 5 M
h. Durability 3 2 5 NE 1 3 2 L 1 4 1 M
i. Serviceability 2 4 1 L 4 5 5 H 5 3 2 M
j. Aesthetics 3 1 5 NE 3 2 2 L 5 3 2 M
k. Perceived quality 2 4 3 NE 1 5 2 L 4 3 2 M
Note: 1: no increase, 2: less increase, 3: somewhat, 4: increase, 5: large increase. a 1: large decrease, 2: decrease, 3: somewhat, 4: less decrease, 5: no decrease.
TM top management; MM middle manager; EM employees b INF influence: L low influence; M moderate; H high influence.
6.1.7 Conclusion
HNM is a dairy company that holds third position for dairy companies in Vietnam based on
market share (value). In spite of being a new company that entered the market after 2000,
HNM has had a dramatic growth in sales, and has made progress in developing new milk
formulas and products. To satisfy the increasing demand for high quality dairy products, the
company has sought international standards, and currently has achieved HACCP, ISO 9000,
and ISO 22000.
During the adoption of QA systems, top management decisions were affected by internal and
external factors which were explored in this research. Differences between the motivation for
individual systems were identified. The first motivation for seeking HACCP was satisfying
food legislation and national regulations, while „improving competitive advantages over
competitors‟ was the key motivation for the two remaining QA systems. Other motivations
were also found to differ between each QA system.
Factors impacting on the adoption decision were found to have no difference between these
systems, which emphasized that legal factors were important considerations by the top
152
manager. Other external factors, such as government support, flexible training courses and
external auditing consultation offers from certifying bodies, were considered to have a
moderate impact on the decision.
Perceived benefits the company obtained after implementing QA systems were explored. It
was concluded that there were different perceived benefits from different QA systems. The
HACCP system was perceived to contribute to increases in business performance, such as
sales and market share; and ISO 9000 was perceived to have a high impact (increase and
strongly increase) for measures of profitability, return on sales, and the sales growth rate.
This differed from ISO 22000, which was perceived to have a low impact on these measures.
For impacts of QA systems on operational outcomes, the research results indicated that
HACCP was perceived to have increased „customer satisfaction‟, a reflection of quality
improvement after implementation of this system. This outcome was the same for ISO 9000.
For ISO9000, other measures were perceived to have improved, such as „fast deliveries‟ and
„manufacturing quality‟. For impacts of QA systems on quality performance, it was found
that there were benefits to outcomes such as the perceived defect rate, recall rate, and
guarantee costs, all of which were perceived to have decreased strongly after implementing
three QA systems. The result was the same for the three systems. The remaining measures for
quality performance, such as product „performance‟ showed a high impact from HACCP, but
with a moderate influence for ISO 22000.
6.2 International Dairy Products Joint Stock Company (IDP)
6.2.1 Overview
The International Dairy Products Joint Stock Company (IDP) is a domestic dairy company
that has its headquarters in Ha Noi. It has two milk plants located in areas of large raw milk
access in Northern Vietnam; Truong Yen milk plant in Chuong My district and Ba Vi milk
plant in Ba Vi district in Ha Noi city. The company employs 134 full-time staff and
employees. The company‟s turnover was VND85 billion in 2009 (IDP, 2009).
IDP was established in 2004 and is one of the new companies to enter the dairy market. It is a
late company participating in the dairy market, so it may have learned some lessons from
other companies in the application of new technology and innovations. In its early days, the
153
company installed a modern production line with advanced technology to process the milk.
Its packaging and sealing lines were the most modern in Asia when erected.
The company has gone through growth stages with changes to its organisation structure and
name, and new products have been launched into the market. On September 4, 2004, the Ha
Tay Foods and Milk Processing Co. Ltd was established. On May 12, 2005, the company was
renamed to IDP Co. Ltd. On October 26, 2005, the company was again renamed to IDP Joint
Stock Company. In September 2010, the company celebrated the opening of its second milk
processing plant in the Ba Vi district. In its product history, the company produced and
introduced sterilized milk with the Purina brand in 2004, introduced UHT milk, yoghurt with
the z‟Dozzi brand in 2005, introduced UHT yoghurt milk with its Disney brand, and in June
2008, it produced sterilized milk, UHT milk, and stir yoghurt milk with the „Ba Vi‟ brand
(IDP, 2009).
Owing to modern equipment and assembly lines, the product of the company was awarded
prestigious prizes, such as the „Europe golden cup and certification for quality‟ by the Trade
Leader Club in Madrid in Spain (IDP, n.d.). They also produce a vegetable oil product with
the brand of Vinaoil. Their products are well-known by consumers in urban areas.
The company can be classified into the group of small businesses in the dairy industry. Its
major competitors in milk collection and product markets in the North are Moc Chau Dairy
Company (MCM), Elovi Dairy Company, HanoiMilk Company, and BaVi Dairy Company.
These companies procure milk in the same area, BaVi district, where the number of cows was
16,000 and number of farms was 5,000 in 2010. However, IDP is procuring over 80% of the
volume of milk in this area (approx. 9,600 tons per year) (IDP, 2009). To date, the capital
assets of the company are valued at approximately 13 million USD, which includes its main
processing assembly line, and collection centres, as well as transport. Equipment and
machines in its milk plants include cream separators, UHT, sterilized machines, sealing and
filling lines.
6.2.2 Governance structure
The IDP organisation is similar to other joint stock companies that are operating in Vietnam,
with ultimate authority vested in a general annual meeting of shareholders.
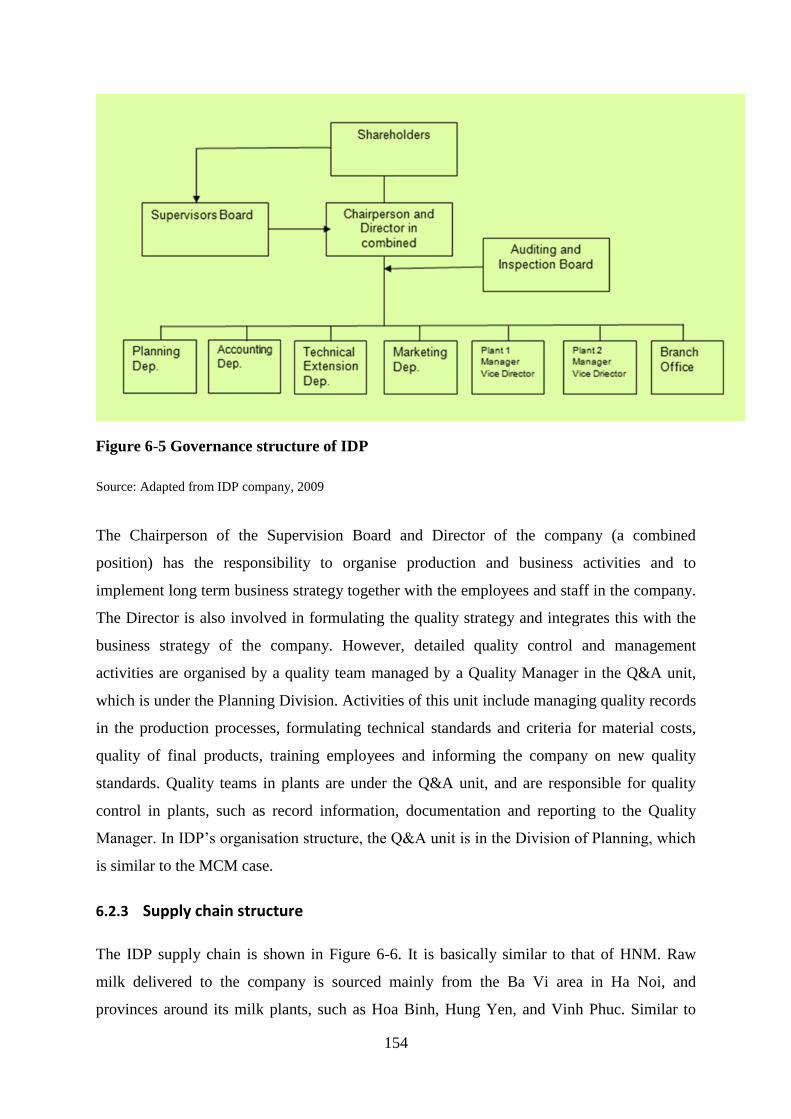
154
Figure 6-5 Governance structure of IDP
Source: Adapted from IDP company, 2009
The Chairperson of the Supervision Board and Director of the company (a combined
position) has the responsibility to organise production and business activities and to
implement long term business strategy together with the employees and staff in the company.
The Director is also involved in formulating the quality strategy and integrates this with the
business strategy of the company. However, detailed quality control and management
activities are organised by a quality team managed by a Quality Manager in the Q&A unit,
which is under the Planning Division. Activities of this unit include managing quality records
in the production processes, formulating technical standards and criteria for material costs,
quality of final products, training employees and informing the company on new quality
standards. Quality teams in plants are under the Q&A unit, and are responsible for quality
control in plants, such as record information, documentation and reporting to the Quality
Manager. In IDP‟s organisation structure, the Q&A unit is in the Division of Planning, which
is similar to the MCM case.
6.2.3 Supply chain structure
The IDP supply chain is shown in Figure 6-6. It is basically similar to that of HNM. Raw
milk delivered to the company is sourced mainly from the Ba Vi area in Ha Noi, and
provinces around its milk plants, such as Hoa Binh, Hung Yen, and Vinh Phuc. Similar to
155
HNM, the company purchases milk from small farmers with or without signed contracts, but
most transactions are „spot market‟. For contracted farmer suppliers, the IDP procures all the
milk they produce, and has subsidization policies to benefit these supplies. The company
supports farmers through supplying credit without interest, and farmers pay back by
deduction from their milk supplies. This loan helps farms to purchase a milking machine and
a bulk tank. This support that IDP supplies is the same in the other companies, such as DLM
and VNM, who also supply credit at a low or free interest rate and agree to purchase all milk
the farms produce. The company also collaborates with the Ba Vi Grassland Centre to
provide training courses on dairy cow farming skills to farmers. This contributes to
improving the quality of the milk produced on the farms. Recently, the company has
established a training centre with the dual purpose of demonstration and training (Ba Vi dairy
farm model). This centre plans to train 16,000 farmers from 8,000 farms on farming skills,
and milk hygiene. Through such training, farmers can utilise their land to provide feed for
their cows (Baomoi.com, 2012). This centre is a large demonstration dairy farming the
country‟s North, covering 25 hectares and costing an initial VND40 billion. This Ba Vi dairy
farm model includes breeding, feeding and milking sections using hi-tech equipment
imported from Sweden‟s DeLaval. The aim of the dairy farm is to help farmers establish their
own farms in an efficient way. This is similar to VNM and DLM who also have training
centres.
Suppliers in the IDP case are similar to suppliers in the HNM case, but there are no
cooperatives for suppliers. There are larger numbers of small farm supplying to IDP than to
HNM and MCM. Farms raising 4-5 milk cows account for 83% of dairy farms in this area
(Tuyen, 2007; Suzuki, 2005).
IDP has other input suppliers for materials such as packs, sugar, machines and equipment for
its production. They are TetraPak, DeLaval, and APV. This is similar to other cases. These
input suppliers are largely foreign companies who have more sophisticated technology and
experience in supplying inputs to the dairy industry in Vietnam.
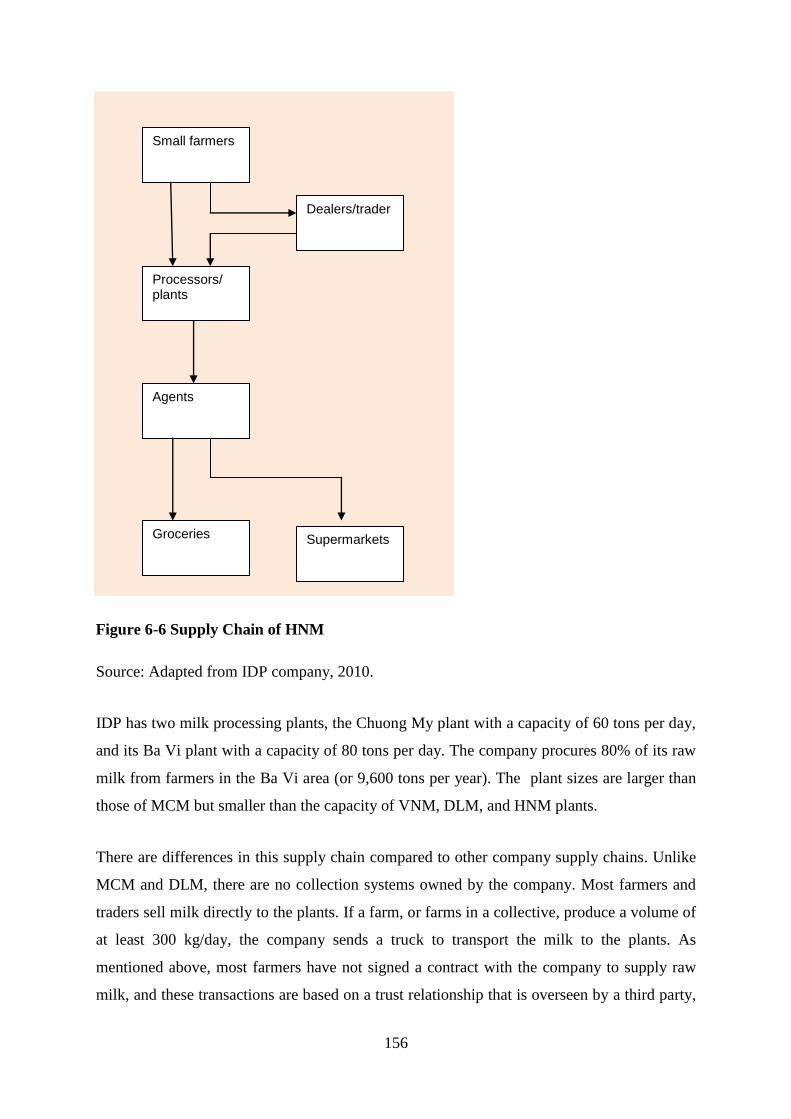
156
Figure 6-6 Supply Chain of HNM
Source: Adapted from IDP company, 2010.
IDP has two milk processing plants, the Chuong My plant with a capacity of 60 tons per day,
and its Ba Vi plant with a capacity of 80 tons per day. The company procures 80% of its raw
milk from farmers in the Ba Vi area (or 9,600 tons per year). The plant sizes are larger than
those of MCM but smaller than the capacity of VNM, DLM, and HNM plants.
There are differences in this supply chain compared to other company supply chains. Unlike
MCM and DLM, there are no collection systems owned by the company. Most farmers and
traders sell milk directly to the plants. If a farm, or farms in a collective, produce a volume of
at least 300 kg/day, the company sends a truck to transport the milk to the plants. As
mentioned above, most farmers have not signed a contract with the company to supply raw
milk, and these transactions are based on a trust relationship that is overseen by a third party,
Supermarkets Groceries
Agents
Supermarkets Small farmers
Processors/ plants
Dealers/trader
157
the District People‟s Committee, which is the government administration authority. This is
the same system used by HNM in the procurement of milk from small farmers.
The company has distribution system for dairy products in domestic markets, mainly in the
urban areas of the Northern provinces. The company has signed contracts to supply end
products to 140 agents in urban Hanoi. This market coverage is smaller than for other cases,
such as HNM, MCM, and VNM. Grocery stores and supermarkets are the final retailers in the
IDP‟s dairy chain and supply of dairy products to end consumers. This IDP retail network is
also smaller than those in other cases such as HNM, VNM, and DLM.
6.2.4 Business strategy and QA systems
The company‟s long term strategy is to supply high quality and safe products to consumers
with its Ba Vi brand. To carry out this strategy, the company has invested in technology,
processing, and also has established good relationships with its farmer suppliers. A vice-
manager of a milk plant noted that:
“ The company supplied credit to farmers to buy a cow, milking machines, filter cloth, and
utensils at zero interest rate, and assured the farmers they would purchase all their milk”
(IDP-p2) .
In addition, it is one of the later companies to enter the market, so it may have gained from
the experience of other companies. Recognising the important role of quality in the
competitive market, and in order to attract new customers, the IDP Company obtained ISO
22000/2005 certification for the Chuong My milk plant in 2006. However, due to its small
company size and its limited resources, the company has been not been able to afford to
implement more than one QA system at this stage. A plant manager-cum-vice-Director
commented:
“We had difficulty in making a decision to adopt quality programs. Applying more than one
quality program would extend our limited financial resources. We are not able to afford this at
this stage because our business is very small. An additional QA may be used to ensure one
quality standard when another plant is planned” (IDP-p2).
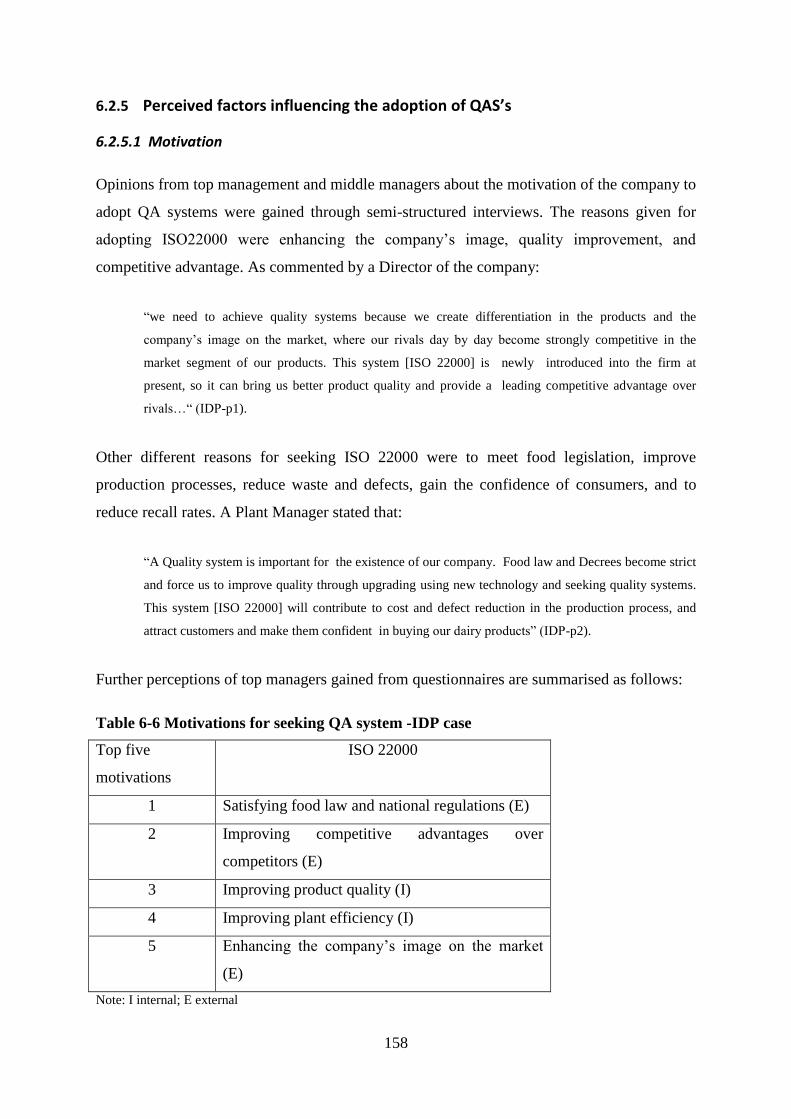
158
6.2.5 Perceived factors influencing the adoption of QAS’s
6.2.5.1 Motivation
Opinions from top management and middle managers about the motivation of the company to
adopt QA systems were gained through semi-structured interviews. The reasons given for
adopting ISO22000 were enhancing the company‟s image, quality improvement, and
competitive advantage. As commented by a Director of the company:
“we need to achieve quality systems because we create differentiation in the products and the
company‟s image on the market, where our rivals day by day become strongly competitive in the
market segment of our products. This system [ISO 22000] is newly introduced into the firm at
present, so it can bring us better product quality and provide a leading competitive advantage over
rivals…“ (IDP-p1).
Other different reasons for seeking ISO 22000 were to meet food legislation, improve
production processes, reduce waste and defects, gain the confidence of consumers, and to
reduce recall rates. A Plant Manager stated that:
“A Quality system is important for the existence of our company. Food law and Decrees become strict
and force us to improve quality through upgrading using new technology and seeking quality systems.
This system [ISO 22000] will contribute to cost and defect reduction in the production process, and
attract customers and make them confident in buying our dairy products” (IDP-p2).
Further perceptions of top managers gained from questionnaires are summarised as follows:
Table 6-6 Motivations for seeking QA system -IDP case
Top five
motivations
ISO 22000
1 Satisfying food law and national regulations (E)
2 Improving competitive advantages over
competitors (E)
3 Improving product quality (I)
4 Improving plant efficiency (I)
5 Enhancing the company‟s image on the market
(E)
Note: I internal; E external
159
The main reason for IDP to adopt ISO 22000 was satisfying and meeting laws and national
standards related to food safety and hygiene sanitation. It is clear that in trading food
products, safety is of importance to consumers and society, and it is also a strategy to pursue
the long term profitability of the company. The Law and Decrees that were conformed to by
the company are complex, requiring involvement of all employees and top management. The
lowest ranking reason was improving the company‟s image on the market, which reflected
the fact that the company does not use ISO 22000 as a marketing or public relations tool, and
in practice, consumers in Vietnam have a limited knowledge of these general quality systems.
6.2.5.2 Perceived factors influencing the adoption of QAS’s
As noted before, the impact of the government through issues such as legislation and support
systems affects the company adoption decision. Government assistance includes support for
consultancies and certification body fees, and the cost of training courses. External support
from the national standards body, consultants and the certification body also influenced the
adoption decision. Feedback from the top management indicated the company received
support from the national standards organization, STAMEQ, such as providing information
when the company searched for information about the quality standards. A Director of IDP
commented:
“…To pursue quality and better meet the demand for dairy products by consumers, our
company seeks international standards that are not popular in Vietnam, in which ISO
22000/2005, perhaps, is the best these days. In this search, we received the valued support
from the Department of Scientific and Technology, and the registrar body, QUARCERT.”
(IDP-p1).
Market pressures from competitors, and the requirements of buyers are also factors that can
affect the adoption decision; however, this factor was perceived to have a low impact. It was
explained that IDP has a small market share, like MCM, so it focuses on specific products
where it has a strong advantage, such as fresh milk and stir yoghurt. In addition, the company
exploits its “Ba Vi‟ brand that is well known by consumers. As mentioned above, consumers
in Vietnam have limited understanding of quality assurance, but they know the history and
reputation of a brand when making a choice of dairy products. A Director of IDP continued:
“Consumers still believe and trust in purchasing dairy products [Ba Vi brand] from us, and
our mission is supplying the best and safest dairy products to consumers using all measures
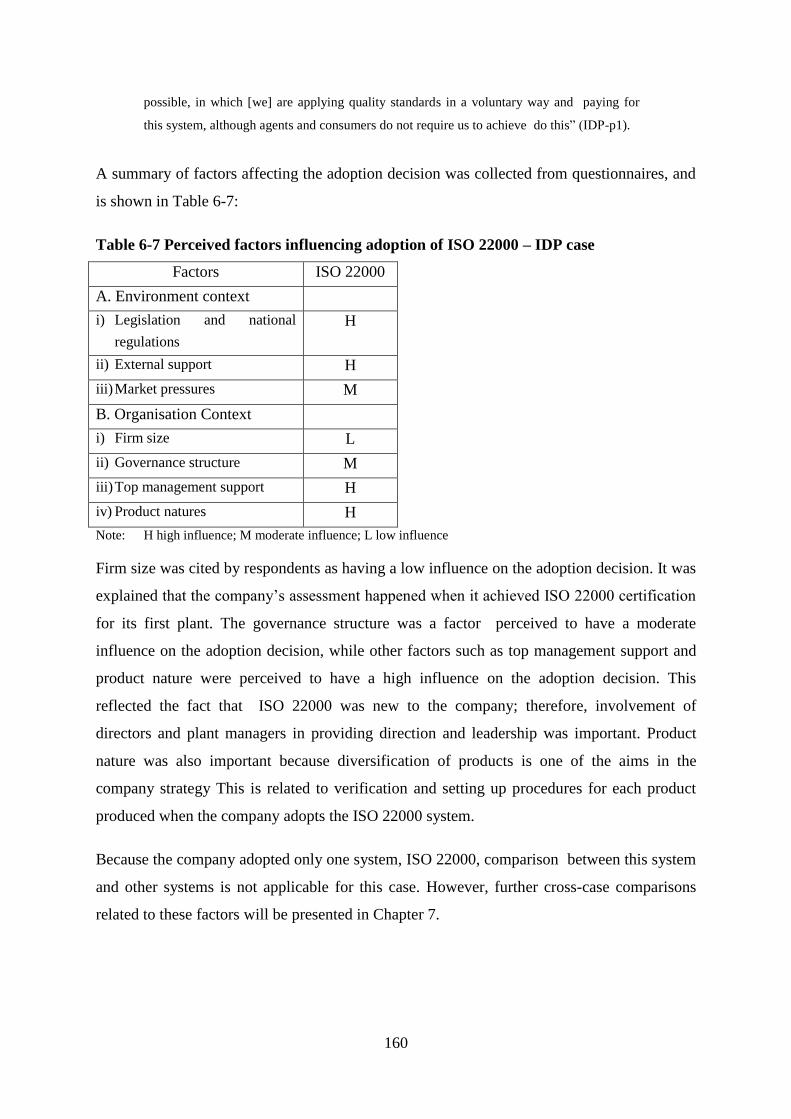
160
possible, in which [we] are applying quality standards in a voluntary way and paying for
this system, although agents and consumers do not require us to achieve do this” (IDP-p1).
A summary of factors affecting the adoption decision was collected from questionnaires, and
is shown in Table 6-7:
Table 6-7 Perceived factors influencing adoption of ISO 22000 – IDP case
Factors ISO 22000
A. Environment context
i) Legislation and national
regulations
H
ii) External support H
iii) Market pressures M
B. Organisation Context
i) Firm size L
ii) Governance structure M
iii) Top management support H
iv) Product natures H
Note: H high influence; M moderate influence; L low influence
Firm size was cited by respondents as having a low influence on the adoption decision. It was
explained that the company‟s assessment happened when it achieved ISO 22000 certification
for its first plant. The governance structure was a factor perceived to have a moderate
influence on the adoption decision, while other factors such as top management support and
product nature were perceived to have a high influence on the adoption decision. This
reflected the fact that ISO 22000 was new to the company; therefore, involvement of
directors and plant managers in providing direction and leadership was important. Product
nature was also important because diversification of products is one of the aims in the
company strategy This is related to verification and setting up procedures for each product
produced when the company adopts the ISO 22000 system.
Because the company adopted only one system, ISO 22000, comparison between this system
and other systems is not applicable for this case. However, further cross-case comparisons
related to these factors will be presented in Chapter 7.
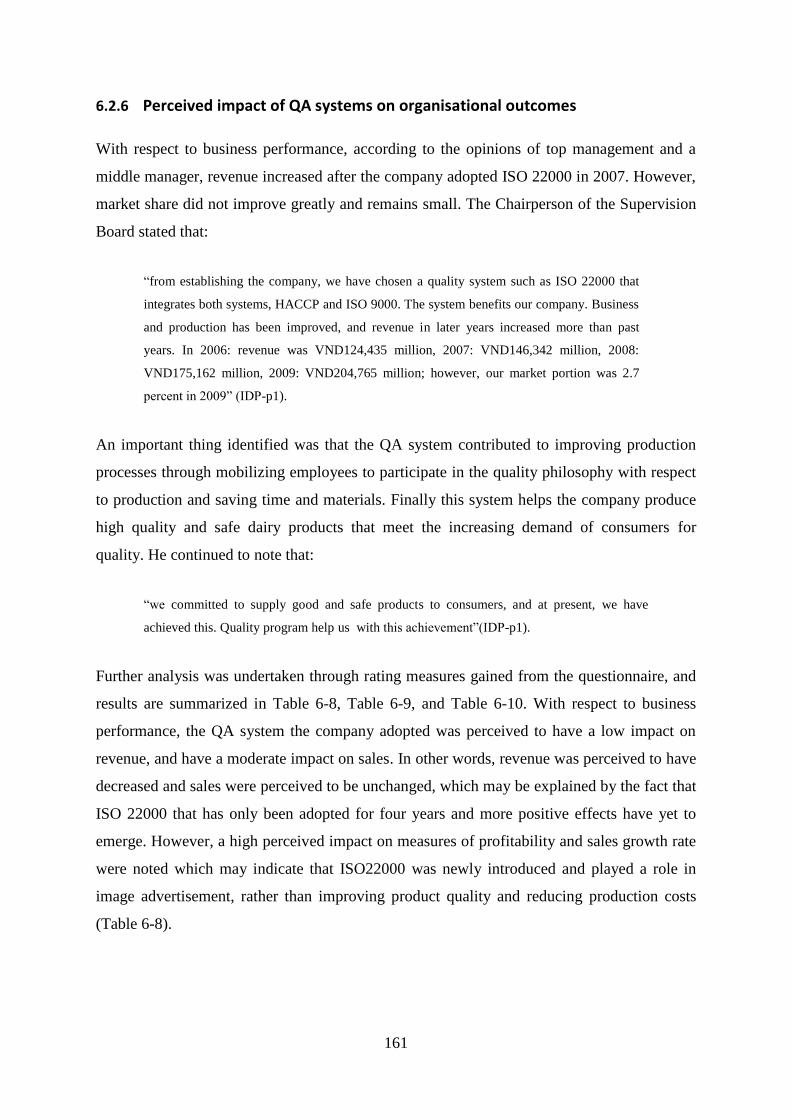
161
6.2.6 Perceived impact of QA systems on organisational outcomes
With respect to business performance, according to the opinions of top management and a
middle manager, revenue increased after the company adopted ISO 22000 in 2007. However,
market share did not improve greatly and remains small. The Chairperson of the Supervision
Board stated that:
“from establishing the company, we have chosen a quality system such as ISO 22000 that
integrates both systems, HACCP and ISO 9000. The system benefits our company. Business
and production has been improved, and revenue in later years increased more than past
years. In 2006: revenue was VND124,435 million, 2007: VND146,342 million, 2008:
VND175,162 million, 2009: VND204,765 million; however, our market portion was 2.7
percent in 2009” (IDP-p1).
An important thing identified was that the QA system contributed to improving production
processes through mobilizing employees to participate in the quality philosophy with respect
to production and saving time and materials. Finally this system helps the company produce
high quality and safe dairy products that meet the increasing demand of consumers for
quality. He continued to note that:
“we committed to supply good and safe products to consumers, and at present, we have
achieved this. Quality program help us with this achievement”(IDP-p1).
Further analysis was undertaken through rating measures gained from the questionnaire, and
results are summarized in Table 6-8, Table 6-9, and Table 6-10. With respect to business
performance, the QA system the company adopted was perceived to have a low impact on
revenue, and have a moderate impact on sales. In other words, revenue was perceived to have
decreased and sales were perceived to be unchanged, which may be explained by the fact that
ISO 22000 that has only been adopted for four years and more positive effects have yet to
emerge. However, a high perceived impact on measures of profitability and sales growth rate
were noted which may indicate that ISO22000 was newly introduced and played a role in
image advertisement, rather than improving product quality and reducing production costs
(Table 6-8).
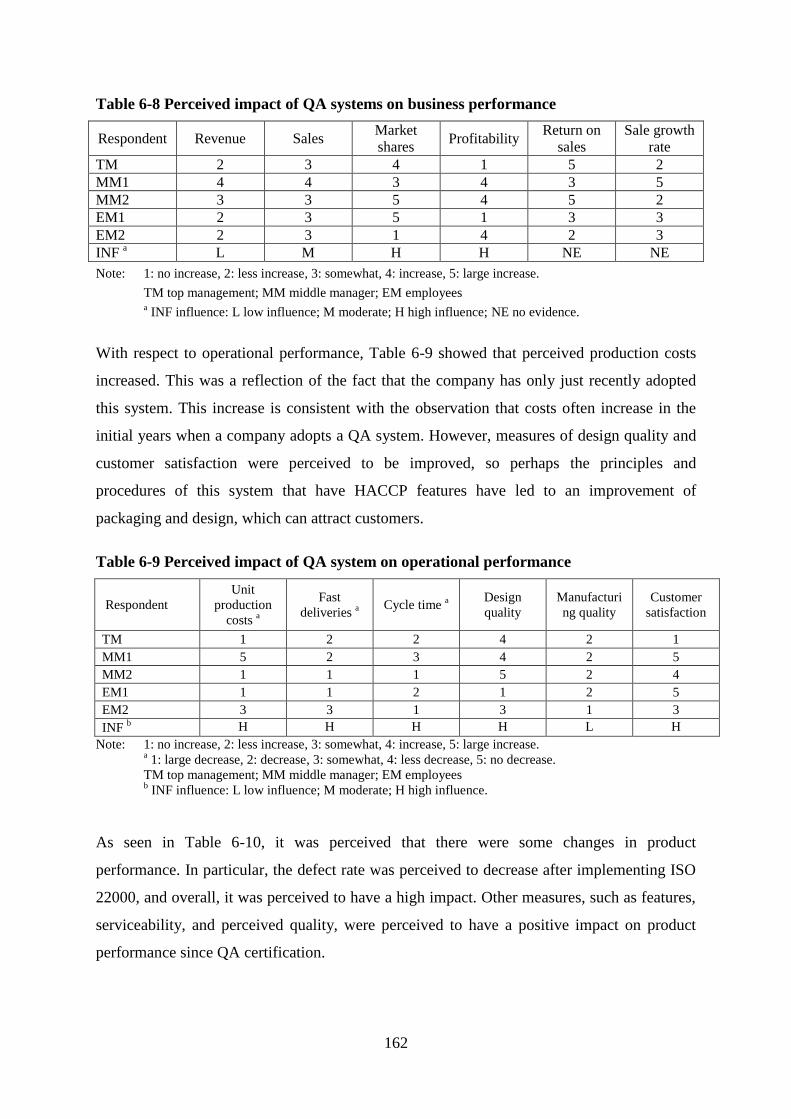
162
Table 6-8 Perceived impact of QA systems on business performance
Respondent Revenue Sales Market
shares Profitability
Return on
sales Sale growth
rate TM 2 3 4 1 5 2 MM1 4 4 3 4 3 5 MM2 3 3 5 4 5 2 EM1 2 3 5 1 3 3 EM2 2 3 1 4 2 3 INF
a L M H H NE NE
Note: 1: no increase, 2: less increase, 3: somewhat, 4: increase, 5: large increase.
TM top management; MM middle manager; EM employees a INF influence: L low influence; M moderate; H high influence; NE no evidence.
With respect to operational performance, Table 6-9 showed that perceived production costs
increased. This was a reflection of the fact that the company has only just recently adopted
this system. This increase is consistent with the observation that costs often increase in the
initial years when a company adopts a QA system. However, measures of design quality and
customer satisfaction were perceived to be improved, so perhaps the principles and
procedures of this system that have HACCP features have led to an improvement of
packaging and design, which can attract customers.
Table 6-9 Perceived impact of QA system on operational performance
Respondent
Unit
production
costs a
Fast
deliveries a
Cycle time a
Design
quality
Manufacturi
ng quality
Customer
satisfaction
TM 1 2 2 4 2 1
MM1 5 2 3 4 2 5
MM2 1 1 1 5 2 4
EM1 1 1 2 1 2 5
EM2 3 3 1 3 1 3
INF b H H H H L H
Note: 1: no increase, 2: less increase, 3: somewhat, 4: increase, 5: large increase. a 1: large decrease, 2: decrease, 3: somewhat, 4: less decrease, 5: no decrease.
TM top management; MM middle manager; EM employees b INF influence: L low influence; M moderate; H high influence.
As seen in Table 6-10, it was perceived that there were some changes in product
performance. In particular, the defect rate was perceived to decrease after implementing ISO
22000, and overall, it was perceived to have a high impact. Other measures, such as features,
serviceability, and perceived quality, were perceived to have a positive impact on product
performance since QA certification.
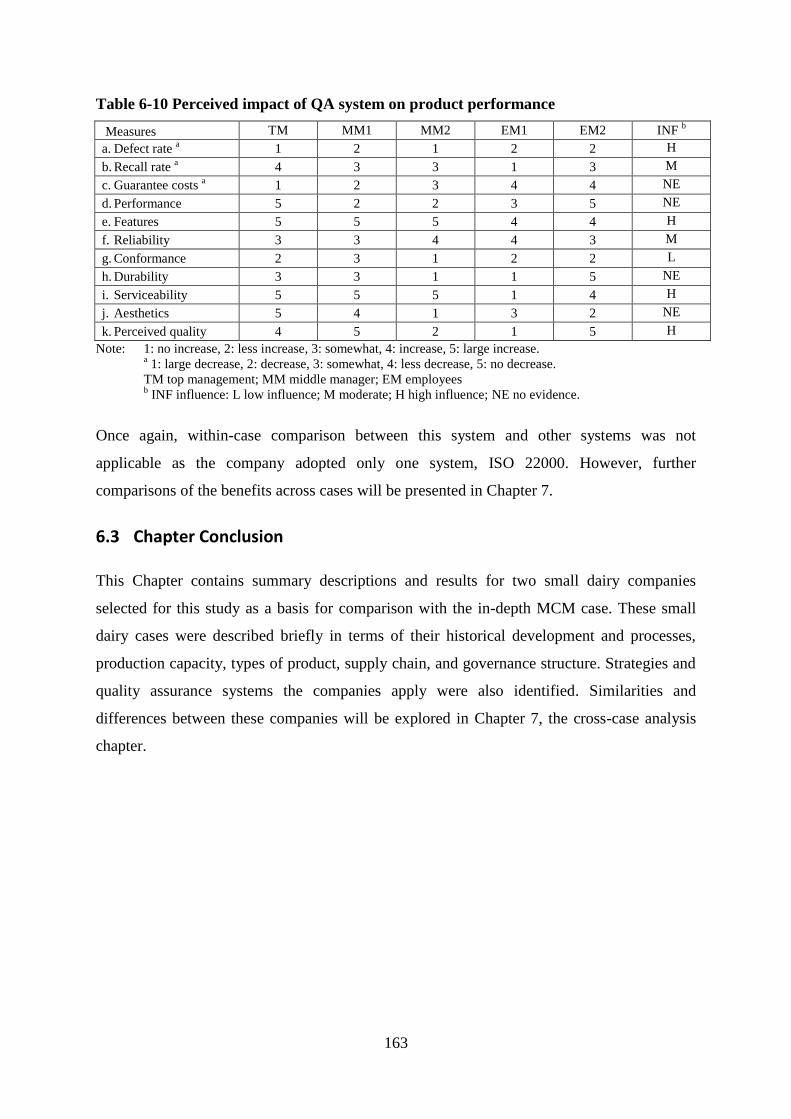
163
Table 6-10 Perceived impact of QA system on product performance Measures TM MM1 MM2 EM1 EM2 INF
b
a. Defect rate a 1 2 1 2 2 H
b. Recall rate a 4 3 3 1 3 M
c. Guarantee costs a 1 2 3 4 4 NE
d. Performance 5 2 2 3 5 NE
e. Features 5 5 5 4 4 H
f. Reliability 3 3 4 4 3 M
g. Conformance 2 3 1 2 2 L
h. Durability 3 3 1 1 5 NE
i. Serviceability 5 5 5 1 4 H
j. Aesthetics 5 4 1 3 2 NE
k. Perceived quality 4 5 2 1 5 H
Note: 1: no increase, 2: less increase, 3: somewhat, 4: increase, 5: large increase. a 1: large decrease, 2: decrease, 3: somewhat, 4: less decrease, 5: no decrease.
TM top management; MM middle manager; EM employees b INF influence: L low influence; M moderate; H high influence; NE no evidence.
Once again, within-case comparison between this system and other systems was not
applicable as the company adopted only one system, ISO 22000. However, further
comparisons of the benefits across cases will be presented in Chapter 7.
6.3 Chapter Conclusion
This Chapter contains summary descriptions and results for two small dairy companies
selected for this study as a basis for comparison with the in-depth MCM case. These small
dairy cases were described briefly in terms of their historical development and processes,
production capacity, types of product, supply chain, and governance structure. Strategies and
quality assurance systems the companies apply were also identified. Similarities and
differences between these companies will be explored in Chapter 7, the cross-case analysis
chapter.
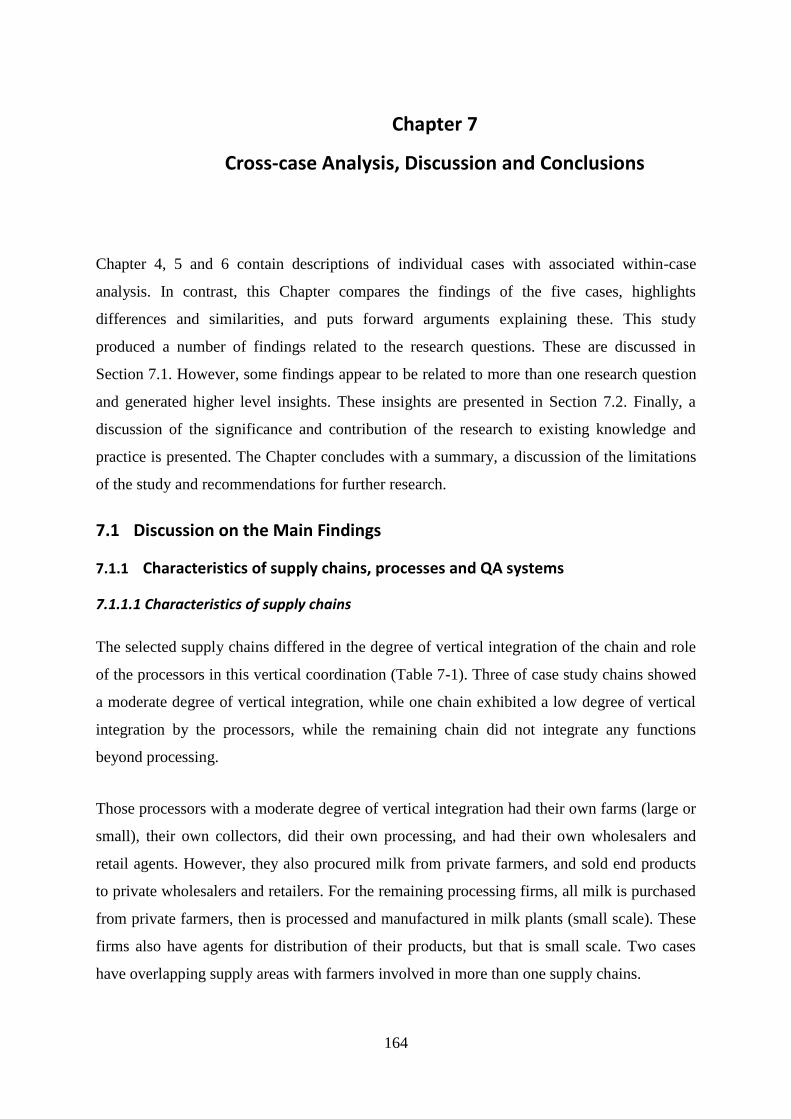
164
Chapter 7
Cross-case Analysis, Discussion and Conclusions
Chapter 4, 5 and 6 contain descriptions of individual cases with associated within-case
analysis. In contrast, this Chapter compares the findings of the five cases, highlights
differences and similarities, and puts forward arguments explaining these. This study
produced a number of findings related to the research questions. These are discussed in
Section 7.1. However, some findings appear to be related to more than one research question
and generated higher level insights. These insights are presented in Section 7.2. Finally, a
discussion of the significance and contribution of the research to existing knowledge and
practice is presented. The Chapter concludes with a summary, a discussion of the limitations
of the study and recommendations for further research.
7.1 Discussion on the Main Findings
7.1.1 Characteristics of supply chains, processes and QA systems
7.1.1.1 Characteristics of supply chains
The selected supply chains differed in the degree of vertical integration of the chain and role
of the processors in this vertical coordination (Table 7-1). Three of case study chains showed
a moderate degree of vertical integration, while one chain exhibited a low degree of vertical
integration by the processors, while the remaining chain did not integrate any functions
beyond processing.
Those processors with a moderate degree of vertical integration had their own farms (large or
small), their own collectors, did their own processing, and had their own wholesalers and
retail agents. However, they also procured milk from private farmers, and sold end products
to private wholesalers and retailers. For the remaining processing firms, all milk is purchased
from private farmers, then is processed and manufactured in milk plants (small scale). These
firms also have agents for distribution of their products, but that is small scale. Two cases
have overlapping supply areas with farmers involved in more than one supply chains.
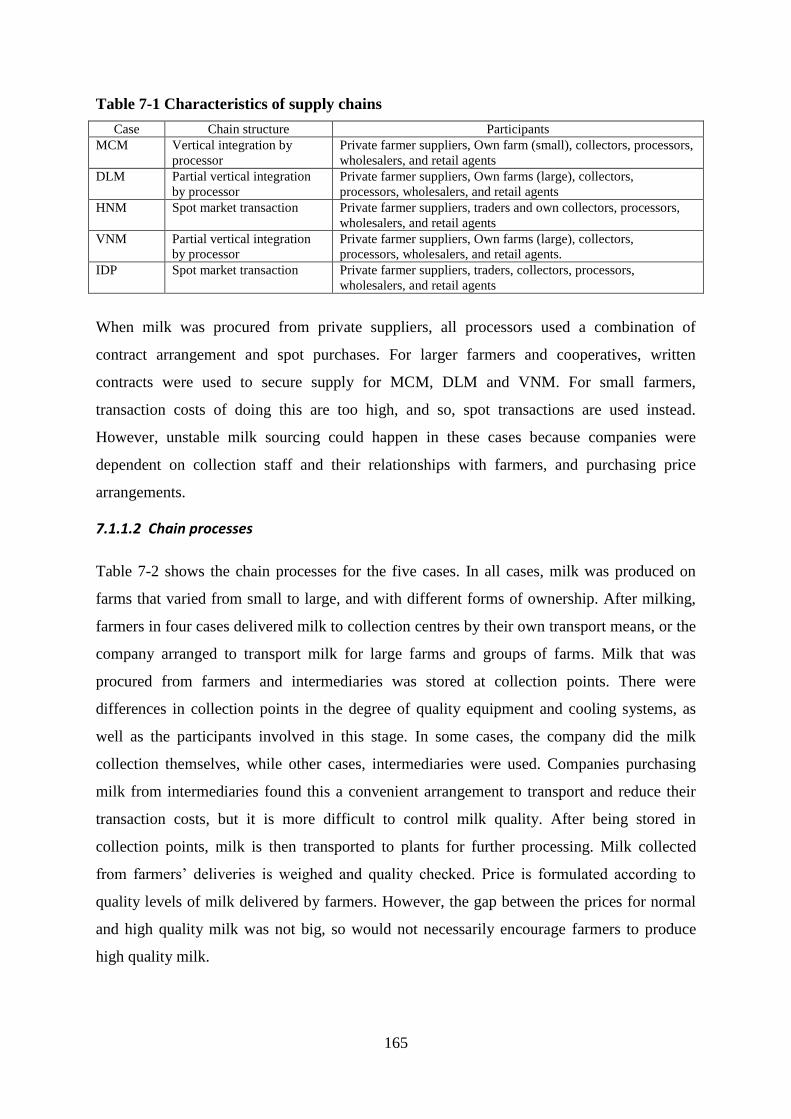
165
Table 7-1 Characteristics of supply chains
Case Chain structure Participants
MCM Vertical integration by
processor
Private farmer suppliers, Own farm (small), collectors, processors,
wholesalers, and retail agents
DLM Partial vertical integration
by processor
Private farmer suppliers, Own farms (large), collectors,
processors, wholesalers, and retail agents
HNM Spot market transaction Private farmer suppliers, traders and own collectors, processors,
wholesalers, and retail agents
VNM Partial vertical integration
by processor
Private farmer suppliers, Own farms (large), collectors,
processors, wholesalers, and retail agents.
IDP Spot market transaction Private farmer suppliers, traders, collectors, processors,
wholesalers, and retail agents
When milk was procured from private suppliers, all processors used a combination of
contract arrangement and spot purchases. For larger farmers and cooperatives, written
contracts were used to secure supply for MCM, DLM and VNM. For small farmers,
transaction costs of doing this are too high, and so, spot transactions are used instead.
However, unstable milk sourcing could happen in these cases because companies were
dependent on collection staff and their relationships with farmers, and purchasing price
arrangements.
7.1.1.2 Chain processes
Table 7-2 shows the chain processes for the five cases. In all cases, milk was produced on
farms that varied from small to large, and with different forms of ownership. After milking,
farmers in four cases delivered milk to collection centres by their own transport means, or the
company arranged to transport milk for large farms and groups of farms. Milk that was
procured from farmers and intermediaries was stored at collection points. There were
differences in collection points in the degree of quality equipment and cooling systems, as
well as the participants involved in this stage. In some cases, the company did the milk
collection themselves, while other cases, intermediaries were used. Companies purchasing
milk from intermediaries found this a convenient arrangement to transport and reduce their
transaction costs, but it is more difficult to control milk quality. After being stored in
collection points, milk is then transported to plants for further processing. Milk collected
from farmers‟ deliveries is weighed and quality checked. Price is formulated according to
quality levels of milk delivered by farmers. However, the gap between the prices for normal
and high quality milk was not big, so would not necessarily encourage farmers to produce
high quality milk.
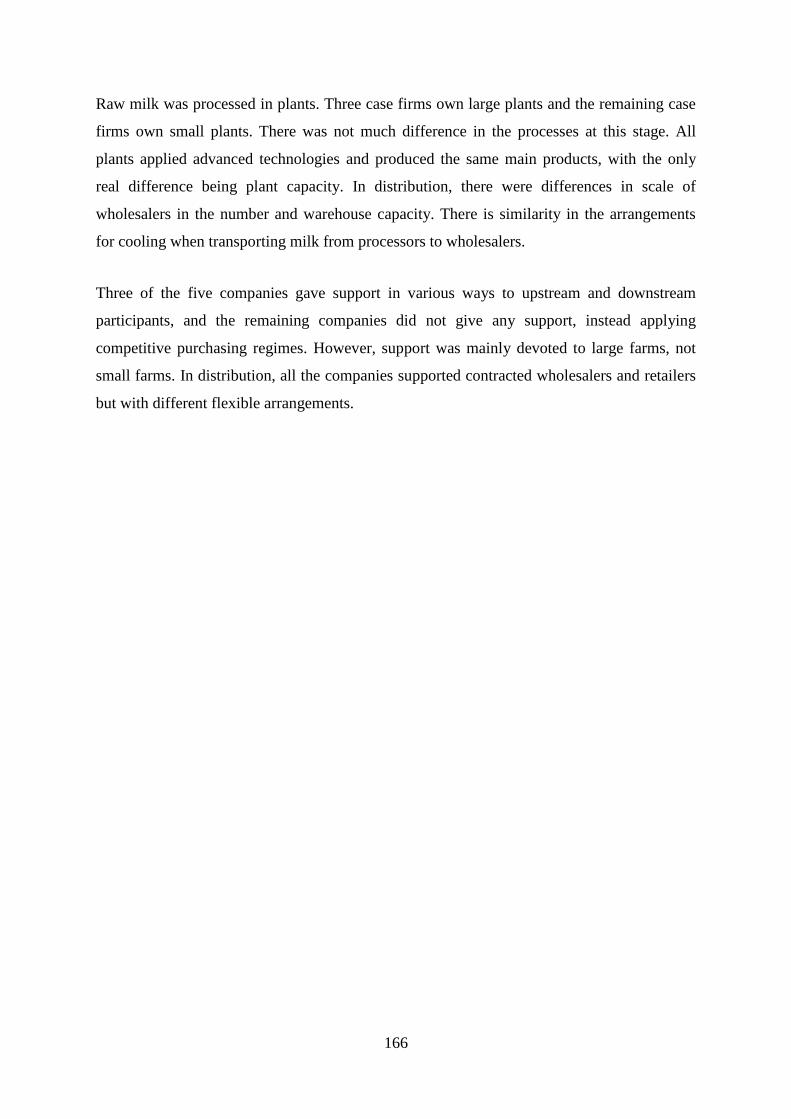
166
Raw milk was processed in plants. Three case firms own large plants and the remaining case
firms own small plants. There was not much difference in the processes at this stage. All
plants applied advanced technologies and produced the same main products, with the only
real difference being plant capacity. In distribution, there were differences in scale of
wholesalers in the number and warehouse capacity. There is similarity in the arrangements
for cooling when transporting milk from processors to wholesalers.
Three of the five companies gave support in various ways to upstream and downstream
participants, and the remaining companies did not give any support, instead applying
competitive purchasing regimes. However, support was mainly devoted to large farms, not
small farms. In distribution, all the companies supported contracted wholesalers and retailers
but with different flexible arrangements.
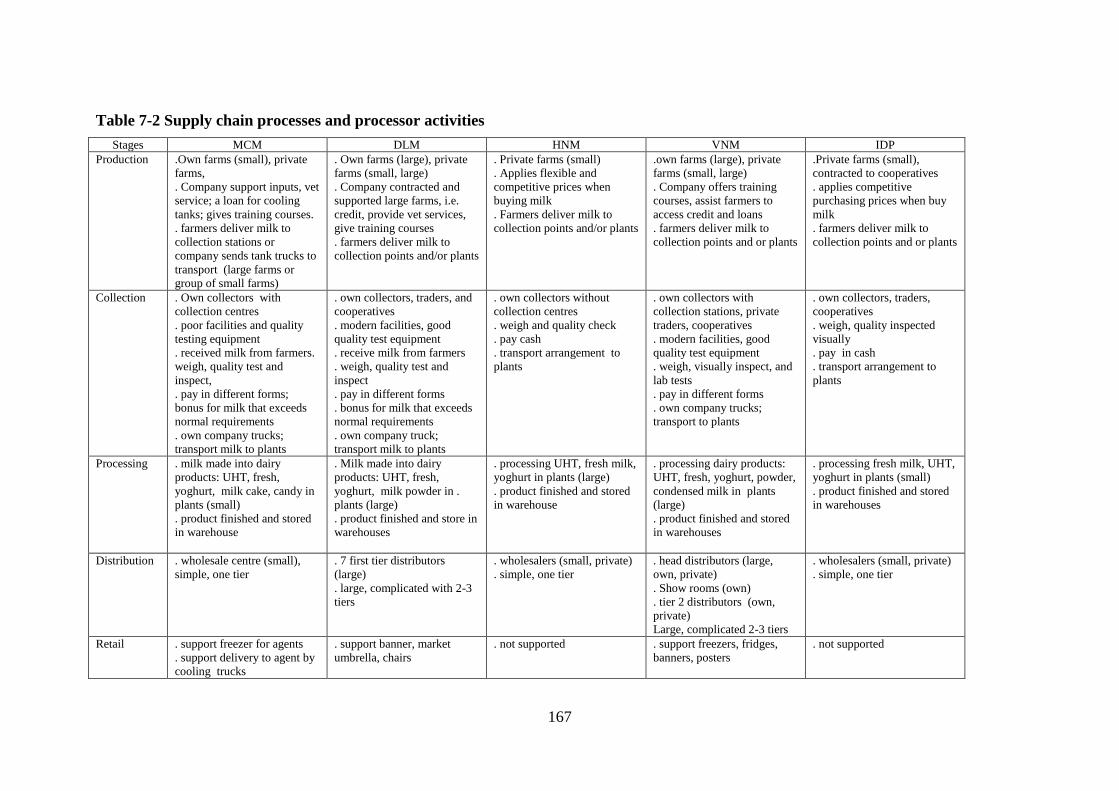
167
Table 7-2 Supply chain processes and processor activities
Stages MCM DLM HNM VNM IDP
Production .Own farms (small), private
farms,
. Company support inputs, vet
service; a loan for cooling
tanks; gives training courses.
. farmers deliver milk to
collection stations or
company sends tank trucks to
transport (large farms or
group of small farms)
. Own farms (large), private
farms (small, large)
. Company contracted and
supported large farms, i.e.
credit, provide vet services,
give training courses
. farmers deliver milk to
collection points and/or plants
. Private farms (small)
. Applies flexible and
competitive prices when
buying milk
. Farmers deliver milk to
collection points and/or plants
.own farms (large), private
farms (small, large)
. Company offers training
courses, assist farmers to
access credit and loans
. farmers deliver milk to
collection points and or plants
.Private farms (small),
contracted to cooperatives
. applies competitive
purchasing prices when buy
milk
. farmers deliver milk to
collection points and or plants
Collection . Own collectors with
collection centres
. poor facilities and quality
testing equipment
. received milk from farmers.
weigh, quality test and
inspect,
. pay in different forms;
bonus for milk that exceeds
normal requirements
. own company trucks;
transport milk to plants
. own collectors, traders, and
cooperatives
. modern facilities, good
quality test equipment
. receive milk from farmers
. weigh, quality test and
inspect
. pay in different forms
. bonus for milk that exceeds
normal requirements
. own company truck;
transport milk to plants
. own collectors without
collection centres
. weigh and quality check
. pay cash
. transport arrangement to
plants
. own collectors with
collection stations, private
traders, cooperatives
. modern facilities, good
quality test equipment
. weigh, visually inspect, and
lab tests
. pay in different forms
. own company trucks;
transport to plants
. own collectors, traders,
cooperatives
. weigh, quality inspected
visually
. pay in cash
. transport arrangement to
plants
Processing . milk made into dairy
products: UHT, fresh,
yoghurt, milk cake, candy in
plants (small)
. product finished and stored
in warehouse
. Milk made into dairy
products: UHT, fresh,
yoghurt, milk powder in .
plants (large)
. product finished and store in
warehouses
. processing UHT, fresh milk,
yoghurt in plants (large)
. product finished and stored
in warehouse
. processing dairy products:
UHT, fresh, yoghurt, powder,
condensed milk in plants
(large)
. product finished and stored
in warehouses
. processing fresh milk, UHT,
yoghurt in plants (small)
. product finished and stored
in warehouses
Distribution . wholesale centre (small),
simple, one tier
. 7 first tier distributors
(large)
. large, complicated with 2-3
tiers
. wholesalers (small, private)
. simple, one tier
. head distributors (large,
own, private)
. Show rooms (own)
. tier 2 distributors (own,
private)
Large, complicated 2-3 tiers
. wholesalers (small, private)
. simple, one tier
Retail . support freezer for agents
. support delivery to agent by
cooling trucks
. support banner, market
umbrella, chairs
. not supported . support freezers, fridges,
banners, posters
. not supported
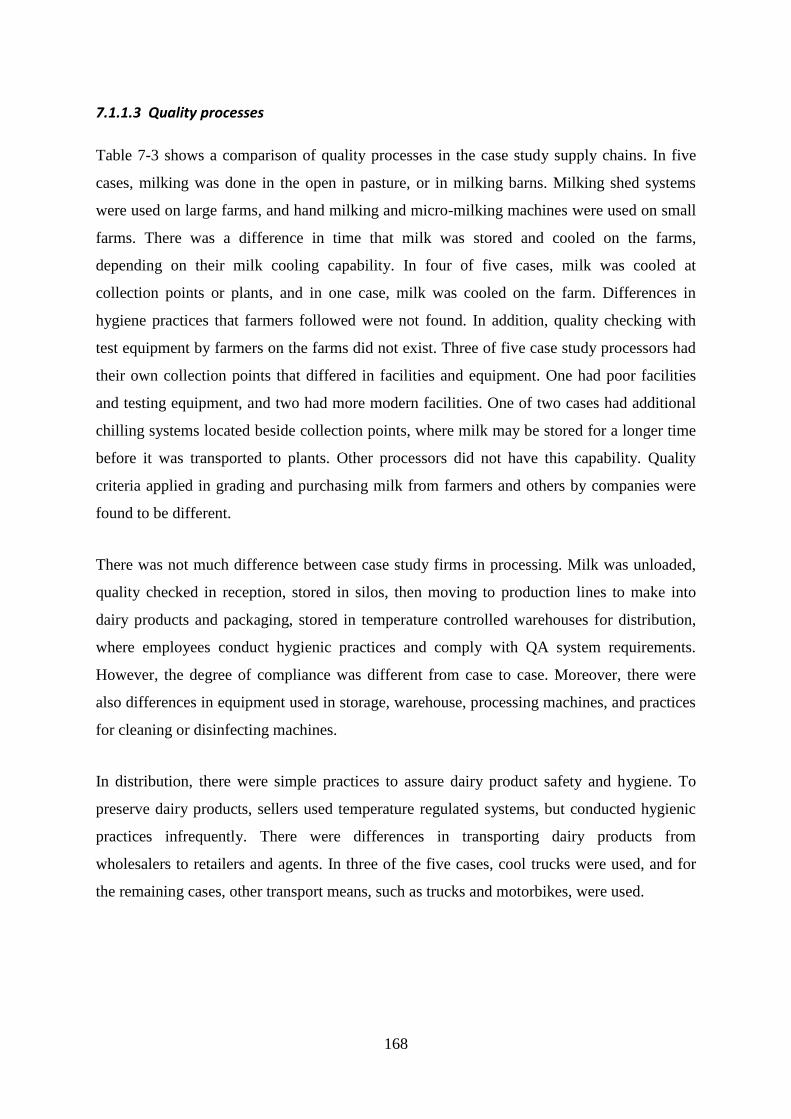
168
7.1.1.3 Quality processes
Table 7-3 shows a comparison of quality processes in the case study supply chains. In five
cases, milking was done in the open in pasture, or in milking barns. Milking shed systems
were used on large farms, and hand milking and micro-milking machines were used on small
farms. There was a difference in time that milk was stored and cooled on the farms,
depending on their milk cooling capability. In four of five cases, milk was cooled at
collection points or plants, and in one case, milk was cooled on the farm. Differences in
hygiene practices that farmers followed were not found. In addition, quality checking with
test equipment by farmers on the farms did not exist. Three of five case study processors had
their own collection points that differed in facilities and equipment. One had poor facilities
and testing equipment, and two had more modern facilities. One of two cases had additional
chilling systems located beside collection points, where milk may be stored for a longer time
before it was transported to plants. Other processors did not have this capability. Quality
criteria applied in grading and purchasing milk from farmers and others by companies were
found to be different.
There was not much difference between case study firms in processing. Milk was unloaded,
quality checked in reception, stored in silos, then moving to production lines to make into
dairy products and packaging, stored in temperature controlled warehouses for distribution,
where employees conduct hygienic practices and comply with QA system requirements.
However, the degree of compliance was different from case to case. Moreover, there were
also differences in equipment used in storage, warehouse, processing machines, and practices
for cleaning or disinfecting machines.
In distribution, there were simple practices to assure dairy product safety and hygiene. To
preserve dairy products, sellers used temperature regulated systems, but conducted hygienic
practices infrequently. There were differences in transporting dairy products from
wholesalers to retailers and agents. In three of the five cases, cool trucks were used, and for
the remaining cases, other transport means, such as trucks and motorbikes, were used.
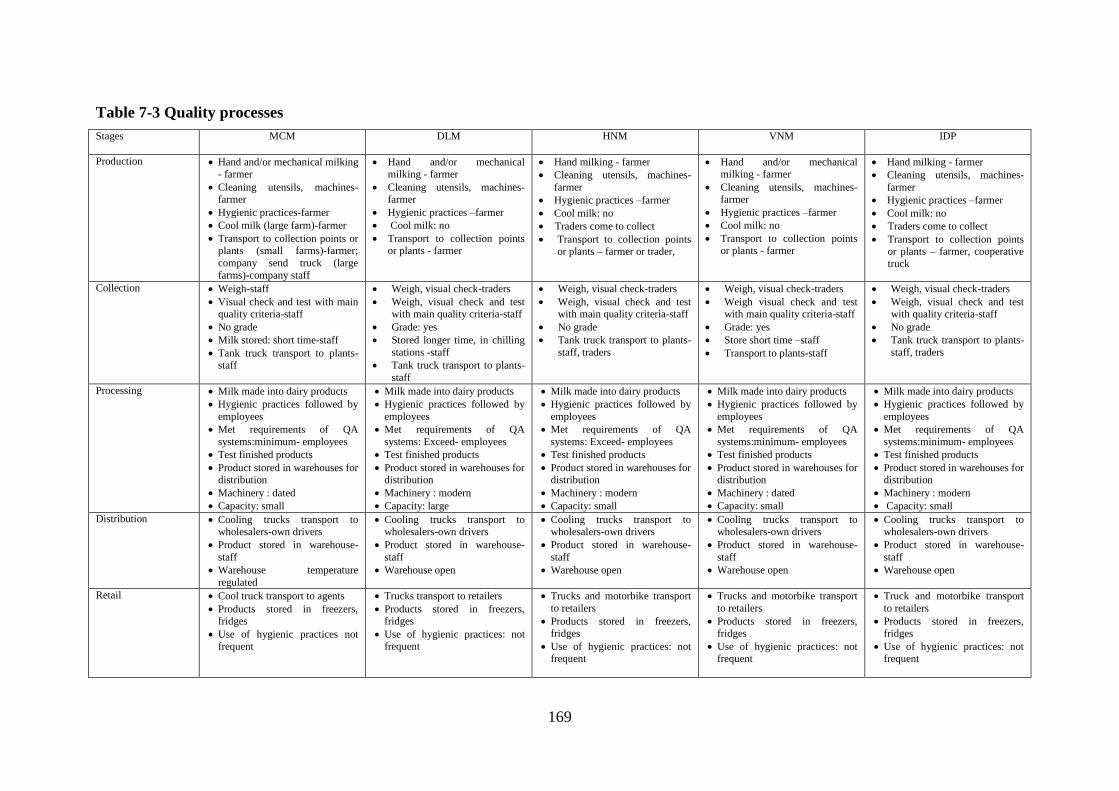
169
Table 7-3 Quality processes
Stages MCM DLM
HNM VNM IDP
Production Hand and/or mechanical milking - farmer
Cleaning utensils, machines- farmer
Hygienic practices-farmer
Cool milk (large farm)-farmer
Transport to collection points or plants (small farms)-farmer;
company send truck (large
farms)-company staff
Hand and/or mechanical milking - farmer
Cleaning utensils, machines- farmer
Hygienic practices –farmer
Cool milk: no
Transport to collection points or plants - farmer
Hand milking - farmer
Cleaning utensils, machines-
farmer
Hygienic practices –farmer
Cool milk: no
Traders come to collect
Transport to collection points or plants – farmer or trader,
Hand and/or mechanical milking - farmer
Cleaning utensils, machines- farmer
Hygienic practices –farmer
Cool milk: no
Transport to collection points or plants - farmer
Hand milking - farmer
Cleaning utensils, machines-
farmer
Hygienic practices –farmer
Cool milk: no
Traders come to collect
Transport to collection points or plants – farmer, cooperative
truck
Collection Weigh-staff
Visual check and test with main quality criteria-staff
No grade
Milk stored: short time-staff
Tank truck transport to plants-staff
Weigh, visual check-traders
Weigh, visual check and test with main quality criteria-staff
Grade: yes
Stored longer time, in chilling
stations -staff
Tank truck transport to plants-
staff
Weigh, visual check-traders
Weigh, visual check and test with main quality criteria-staff
No grade
Tank truck transport to plants-
staff, traders
Weigh, visual check-traders
Weigh visual check and test with main quality criteria-staff
Grade: yes
Store short time –staff
Transport to plants-staff
Weigh, visual check-traders
Weigh, visual check and test with quality criteria-staff
No grade
Tank truck transport to plants-
staff, traders
Processing Milk made into dairy products
Hygienic practices followed by
employees
Met requirements of QA
systems:minimum- employees
Test finished products
Product stored in warehouses for distribution
Machinery : dated
Capacity: small
Milk made into dairy products
Hygienic practices followed by
employees
Met requirements of QA
systems: Exceed- employees
Test finished products
Product stored in warehouses for distribution
Machinery : modern
Capacity: large
Milk made into dairy products
Hygienic practices followed by
employees
Met requirements of QA
systems: Exceed- employees
Test finished products
Product stored in warehouses for distribution
Machinery : modern
Capacity: small
Milk made into dairy products
Hygienic practices followed by
employees
Met requirements of QA
systems:minimum- employees
Test finished products
Product stored in warehouses for distribution
Machinery : dated
Capacity: small
Milk made into dairy products
Hygienic practices followed by
employees
Met requirements of QA
systems:minimum- employees
Test finished products
Product stored in warehouses for distribution
Machinery : modern
Capacity: small
Distribution Cooling trucks transport to wholesalers-own drivers
Product stored in warehouse-
staff
Warehouse temperature
regulated
Cooling trucks transport to wholesalers-own drivers
Product stored in warehouse-
staff
Warehouse open
Cooling trucks transport to wholesalers-own drivers
Product stored in warehouse-
staff
Warehouse open
Cooling trucks transport to wholesalers-own drivers
Product stored in warehouse-
staff
Warehouse open
Cooling trucks transport to wholesalers-own drivers
Product stored in warehouse-
staff
Warehouse open
Retail Cool truck transport to agents
Products stored in freezers, fridges
Use of hygienic practices not frequent
Trucks transport to retailers
Products stored in freezers, fridges
Use of hygienic practices: not frequent
Trucks and motorbike transport
to retailers
Products stored in freezers, fridges
Use of hygienic practices: not frequent
Trucks and motorbike transport
to retailers
Products stored in freezers, fridges
Use of hygienic practices: not frequent
Truck and motorbike transport
to retailers
Products stored in freezers, fridges
Use of hygienic practices: not frequent
170
7.1.1.4 QA systems
Table 7-4 shows quality systems in place for all cases. There are quality systems used in all
stages of the supply chain for all cases. However, there are some differences in standards and
QA systems adopted by actors in particular supply chains. In four cases, farmers followed
hygienic practices to produce safe milk, and in one case, farmers also complied with GAHP
requirements, although they were not certified. Private farms followed national and
sector/industry standards on either a mandatory or volunteer basis. However, inspection for
compliance of these standards by related organisations and local authorities was not frequent.
In three of five cases, farms owned by processing companies also followed their companies‟
standards. Milk quality is related to milking practice, and relies on the equipment, storage
time, cooling systems, and transport, thereby including all hygienic practices used by farmers.
At the collection stage, three of the five cases had their own collection points that followed
national and ministerial standards for hygienic requirements, such as cleaning, and
disinfecting tank containers, and cooling milk at proper temperatures. These collection points
also conform with the requirements of the processing company. The collectors sent by the
companies to supply areas to collect milk followed organisation standards. Private collectors,
or traders, collecting milk from farms appeared not to follow any standard. In their
procurement processes, milk was stored for a longer time in tank trucks, because of the
purchasing arrangements, which affected milk quality. Variation of quality milk will also
depend on the storage equipment, and hygienic practices that staff conduct at this stage.
There were differences in the adoption of QA systems at the processing stage. All cases
complied with national and ministerial standards, but differed in adoption of international
standards they had in place (HACCP, ISO 9000, and ISO 22000). This feature is discussed
further in the following section.
At the distribution stage, for all selected cases, wholesaler and retailers gained national food
hygiene certifications. These standards are mandatory for traders in food trading. However,
inspection by related organisations and local authorities was limited.
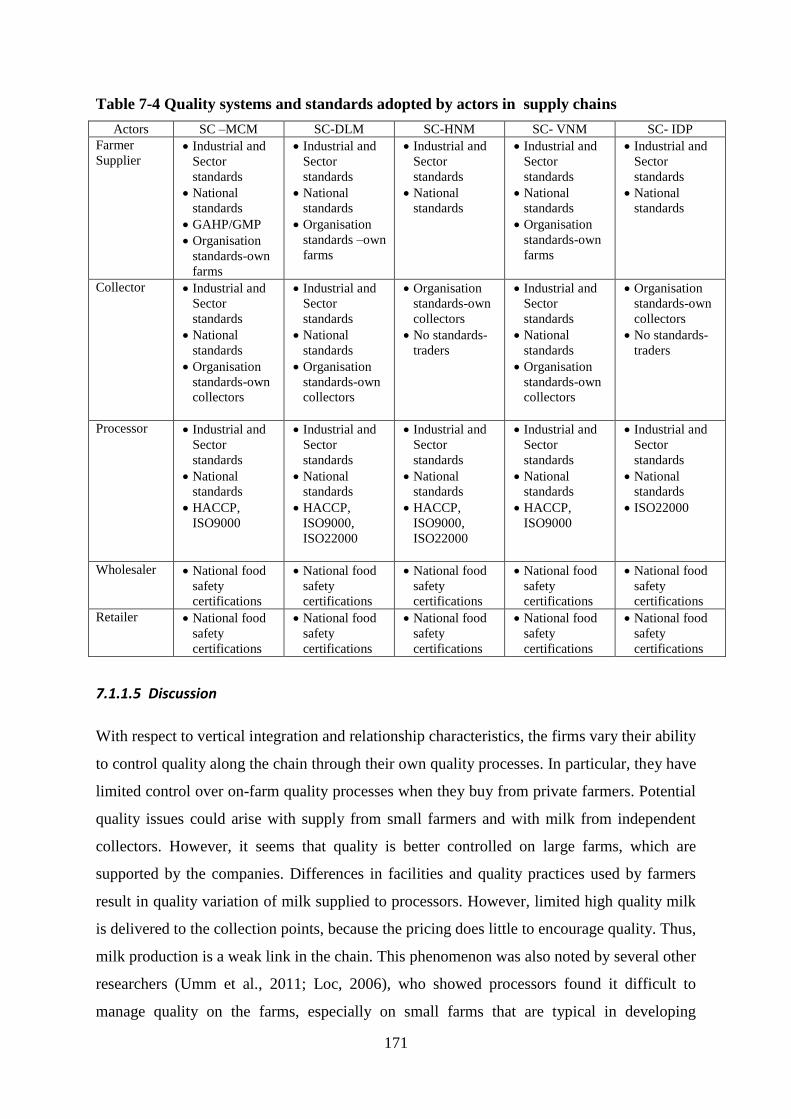
171
Table 7-4 Quality systems and standards adopted by actors in supply chains
Actors SC –MCM SC-DLM SC-HNM SC- VNM SC- IDP
Farmer
Supplier Industrial and
Sector
standards
National
standards
GAHP/GMP
Organisation
standards-own
farms
Industrial and
Sector
standards
National
standards
Organisation
standards –own
farms
Industrial and
Sector
standards
National
standards
Industrial and
Sector
standards
National
standards
Organisation
standards-own
farms
Industrial and
Sector
standards
National
standards
Collector Industrial and
Sector
standards
National
standards
Organisation
standards-own
collectors
Industrial and
Sector
standards
National
standards
Organisation
standards-own
collectors
Organisation
standards-own
collectors
No standards-
traders
Industrial and
Sector
standards
National
standards
Organisation
standards-own
collectors
Organisation
standards-own
collectors
No standards-
traders
Processor Industrial and
Sector
standards
National
standards
HACCP,
ISO9000
Industrial and
Sector
standards
National
standards
HACCP,
ISO9000,
ISO22000
Industrial and
Sector
standards
National
standards
HACCP,
ISO9000,
ISO22000
Industrial and
Sector
standards
National
standards
HACCP,
ISO9000
Industrial and
Sector
standards
National
standards
ISO22000
Wholesaler National food
safety
certifications
National food
safety
certifications
National food
safety
certifications
National food
safety
certifications
National food
safety
certifications
Retailer National food
safety
certifications
National food
safety
certifications
National food
safety
certifications
National food
safety
certifications
National food
safety
certifications
7.1.1.5 Discussion
With respect to vertical integration and relationship characteristics, the firms vary their ability
to control quality along the chain through their own quality processes. In particular, they have
limited control over on-farm quality processes when they buy from private farmers. Potential
quality issues could arise with supply from small farmers and with milk from independent
collectors. However, it seems that quality is better controlled on large farms, which are
supported by the companies. Differences in facilities and quality practices used by farmers
result in quality variation of milk supplied to processors. However, limited high quality milk
is delivered to the collection points, because the pricing does little to encourage quality. Thus,
milk production is a weak link in the chain. This phenomenon was also noted by several other
researchers (Umm et al., 2011; Loc, 2006), who showed processors found it difficult to
manage quality on the farms, especially on small farms that are typical in developing
172
countries, and because of fragmentation of the producers. It is reported that the processing
companies had a strategy to reduce transaction costs through purchasing milk from
independent collectors and intermediaries, and that their concerns focused on quantity rather
than quality (Umm et al., 2011). Consistent with this research, prior research has found
processors helped large and medium farms in preference to small farms (Swinnen et al.,
2004; van Berkum, 2004).
The processing stage was well controlled by processors, although differences in technology
and hygienic standards also cause variations in product quality between cases. Quality issues
might also arise at the distribution stage, where product preservation and transport issues are
more of a focus than quality and hygienic practices. Control over the product in the
distribution stage is often under-emphasised because of specific features of the dairy products
that are regulated. For example, the shelf-life of processed products varies depending on the
kind of product; i.e. UHT and fresh milk. In this study, it was found that there were issues
with cooling in transport and refrigerator equipment used, and evidence of poor hygienic
practices in the distribution phase along with poor product preservation strategies. This is
caused by the small scale and fragmented nature of the distribution system, which limits
investment in improving quality and product preservation. As well, inspection by related
organisations and local authorities is infrequent, which can potentially mean quality issues
are not identified. This phenomena has also been referred to in prior research by Farina et al.
(2005); Loc (2005), along with limited enforcement of compliance with safety standards
(Umm et al., 2011).
Responsibility for monitoring was a shared function, and local authorities‟ compliance
inspection was inconsistent and inefficient. National and ministerial standards were
implemented by companies but there was limited, and so ineffective, monitoring of milk
safety. Requirements of these standards are lower than those of international standards. These
findings are consistent with those observed in other studies in developing countries, such as
in the dairy sector in Pakistan (Umm et al., 2011).
7.1.2 Processing firms and QA systems
The five processing firms represent a very heterogeneous group in terms of size, QA systems,
and the number of years they have been certified. Firm size, when measured by number of
employees, ranges from small (1-200 employees for cases MCM, HNM, and IDP) through to
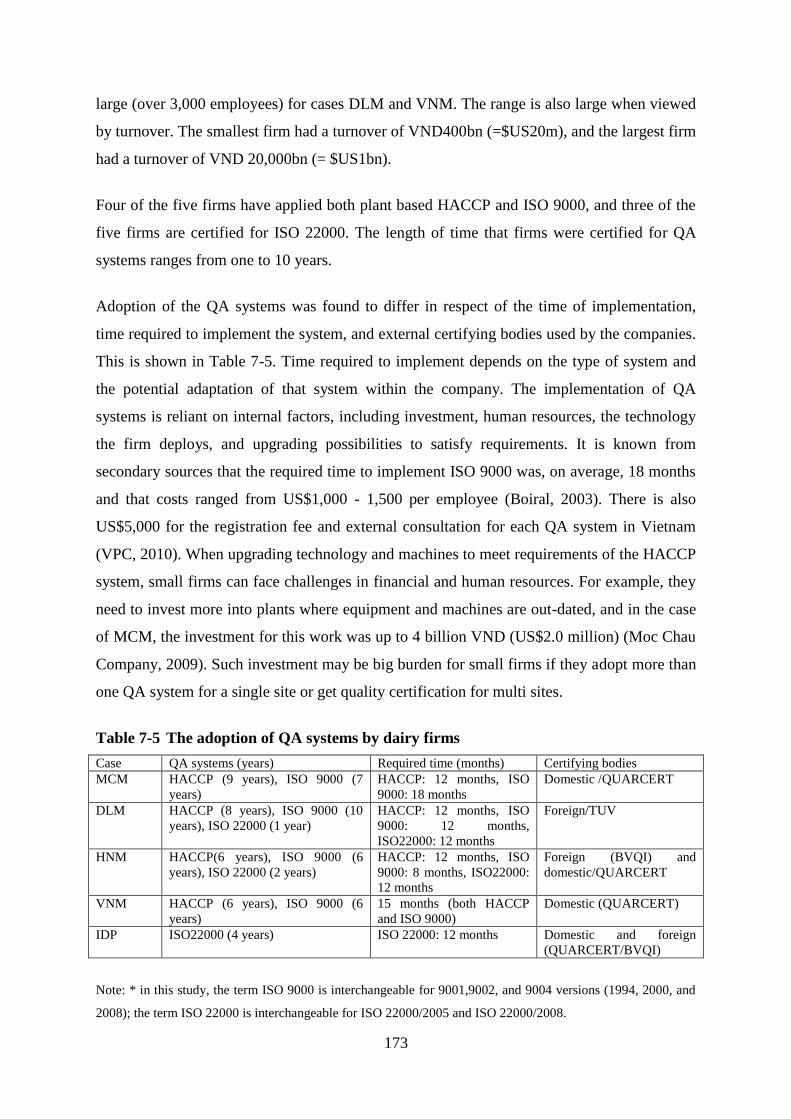
173
large (over 3,000 employees) for cases DLM and VNM. The range is also large when viewed
by turnover. The smallest firm had a turnover of VND400bn (=$US20m), and the largest firm
had a turnover of VND 20,000bn (= $US1bn).
Four of the five firms have applied both plant based HACCP and ISO 9000, and three of the
five firms are certified for ISO 22000. The length of time that firms were certified for QA
systems ranges from one to 10 years.
Adoption of the QA systems was found to differ in respect of the time of implementation,
time required to implement the system, and external certifying bodies used by the companies.
This is shown in Table 7-5. Time required to implement depends on the type of system and
the potential adaptation of that system within the company. The implementation of QA
systems is reliant on internal factors, including investment, human resources, the technology
the firm deploys, and upgrading possibilities to satisfy requirements. It is known from
secondary sources that the required time to implement ISO 9000 was, on average, 18 months
and that costs ranged from US$1,000 - 1,500 per employee (Boiral, 2003). There is also
US$5,000 for the registration fee and external consultation for each QA system in Vietnam
(VPC, 2010). When upgrading technology and machines to meet requirements of the HACCP
system, small firms can face challenges in financial and human resources. For example, they
need to invest more into plants where equipment and machines are out-dated, and in the case
of MCM, the investment for this work was up to 4 billion VND (US$2.0 million) (Moc Chau
Company, 2009). Such investment may be big burden for small firms if they adopt more than
one QA system for a single site or get quality certification for multi sites.
Table 7-5 The adoption of QA systems by dairy firms
Case QA systems (years) Required time (months) Certifying bodies
MCM HACCP (9 years), ISO 9000 (7
years)
HACCP: 12 months, ISO
9000: 18 months
Domestic /QUARCERT
DLM HACCP (8 years), ISO 9000 (10
years), ISO 22000 (1 year)
HACCP: 12 months, ISO
9000: 12 months,
ISO22000: 12 months
Foreign/TUV
HNM HACCP(6 years), ISO 9000 (6
years), ISO 22000 (2 years)
HACCP: 12 months, ISO
9000: 8 months, ISO22000:
12 months
Foreign (BVQI) and
domestic/QUARCERT
VNM HACCP (6 years), ISO 9000 (6
years)
15 months (both HACCP
and ISO 9000)
Domestic (QUARCERT)
IDP ISO22000 (4 years) ISO 22000: 12 months Domestic and foreign
(QUARCERT/BVQI)
Note: * in this study, the term ISO 9000 is interchangeable for 9001,9002, and 9004 versions (1994, 2000, and
2008); the term ISO 22000 is interchangeable for ISO 22000/2005 and ISO 22000/2008.
174
To place the adoption of QA systems into a wider context, it is acknowledged that high
quality products are the essence of a company‟s survival and competitiveness in the
marketplace (Garvin, 1987). To help achieve these goals, companies adopt QA systems.
Safety assurance systems are required to ensure the safety of food and to show compliance
with regulatory and customer requirements at each step in the food chain (Trienekens &
Zuurbier, 2007). Therefore, the implementation of QA systems in the global market
strengthens companies‟ position and improves their competitiveness (Karipidis et al., 2009).
As a result, food companies are implementing QA systems, such as HACCP and ISO 9000 in
order to adopt quality practices (Ziggers & Trienekens, 1999). The HACCP system focuses
mainly on assurance of technical requirements while ISO 9000 focuses more on management
aspects (Luning et al., 2006; Loc, 2006). ISO 22000 standards is aimed at managing safety in
the food chain (Manning & Baines, 2004). Therefore, ISO 22000 provides the basis for
demonstrating a company‟s compliance to quality system by establishing the documentation
and procedural standards that must be met.
A trend of adopting or integrating more than one QA system within an establishment is
becoming popular, which indicates the role of quality systems in improving business
comparative advantage (Karipidis et al., 2009) and the value of certification achieved from
third party certifying bodies. Such certifications are publicly recognized as signal for food
safety. Recent studies show that the number of firms adopting multiple systems in place is
increasing, especially in food sector (Herath et al., 2004).
Which QA system is adopted by firms depends on requirement of buyers, and also on
available human and financial resources of businesses. Choosing certifying bodies for
certification is related to the value of certifying bodies in firm publicly, and costs incurred for
registration. In respect to certifying bodies, good recognition usually attracts customers (Jin,
et al., 2008). Small firms face more limited options compared to larger firms. Limited
resources in small firms lowers the number of adopters of QA systems for single or multiple
site-based certifications (Holleran et al., 1999; Herath et al., 2007). Small firms have a further
disadvantage in adoption compared to larger firms. Implementing ISO 9000, for example,
forces small firms to allocate a greater proportion of their resources to implementation than
larger firms (Holleran et al., 1999), and large firms are more likely to adopt QA systems than
small firms (Pieniadz &Hockmann, 2007). These observations from the literature are
explored further in the context of this study in Section 7.1.3 and 7.1.4.
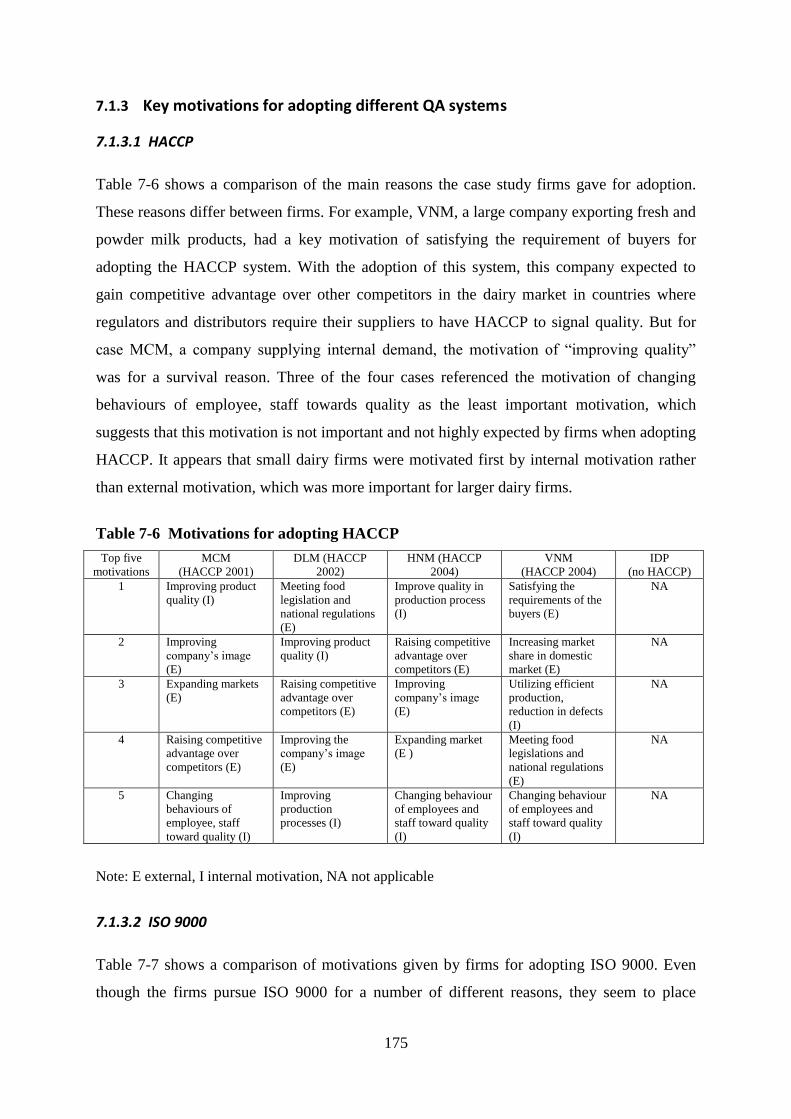
175
7.1.3 Key motivations for adopting different QA systems
7.1.3.1 HACCP
Table 7-6 shows a comparison of the main reasons the case study firms gave for adoption.
These reasons differ between firms. For example, VNM, a large company exporting fresh and
powder milk products, had a key motivation of satisfying the requirement of buyers for
adopting the HACCP system. With the adoption of this system, this company expected to
gain competitive advantage over other competitors in the dairy market in countries where
regulators and distributors require their suppliers to have HACCP to signal quality. But for
case MCM, a company supplying internal demand, the motivation of “improving quality”
was for a survival reason. Three of the four cases referenced the motivation of changing
behaviours of employee, staff towards quality as the least important motivation, which
suggests that this motivation is not important and not highly expected by firms when adopting
HACCP. It appears that small dairy firms were motivated first by internal motivation rather
than external motivation, which was more important for larger dairy firms.
Table 7-6 Motivations for adopting HACCP
Top five
motivations
MCM
(HACCP 2001)
DLM (HACCP
2002)
HNM (HACCP
2004)
VNM
(HACCP 2004)
IDP
(no HACCP)
1 Improving product
quality (I)
Meeting food
legislation and
national regulations
(E)
Improve quality in
production process
(I)
Satisfying the
requirements of the
buyers (E)
NA
2 Improving
company‟s image
(E)
Improving product
quality (I)
Raising competitive
advantage over
competitors (E)
Increasing market
share in domestic
market (E)
NA
3 Expanding markets
(E)
Raising competitive
advantage over
competitors (E)
Improving
company‟s image
(E)
Utilizing efficient
production,
reduction in defects
(I)
NA
4 Raising competitive
advantage over
competitors (E)
Improving the
company‟s image
(E)
Expanding market
(E )
Meeting food
legislations and
national regulations
(E)
NA
5 Changing
behaviours of
employee, staff
toward quality (I)
Improving
production
processes (I)
Changing behaviour
of employees and
staff toward quality
(I)
Changing behaviour
of employees and
staff toward quality
(I)
NA
Note: E external, I internal motivation, NA not applicable
7.1.3.2 ISO 9000
Table 7-7 shows a comparison of motivations given by firms for adopting ISO 9000. Even
though the firms pursue ISO 9000 for a number of different reasons, they seem to place
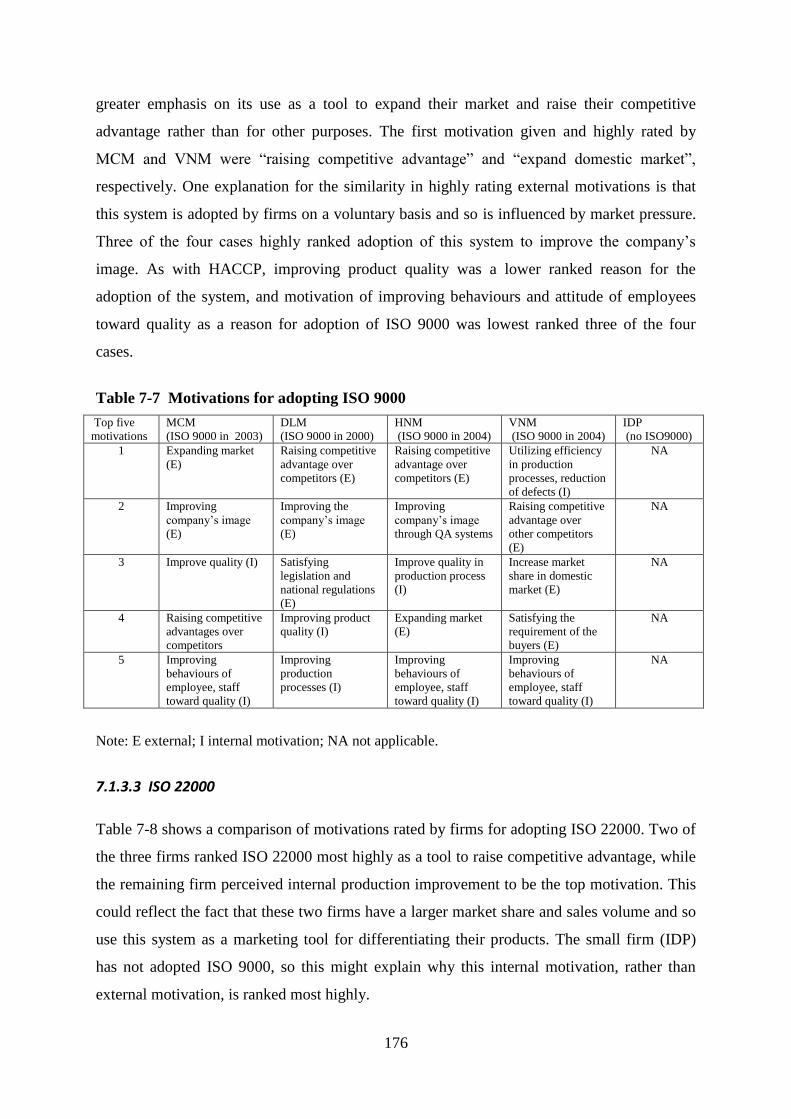
176
greater emphasis on its use as a tool to expand their market and raise their competitive
advantage rather than for other purposes. The first motivation given and highly rated by
MCM and VNM were “raising competitive advantage” and “expand domestic market”,
respectively. One explanation for the similarity in highly rating external motivations is that
this system is adopted by firms on a voluntary basis and so is influenced by market pressure.
Three of the four cases highly ranked adoption of this system to improve the company‟s
image. As with HACCP, improving product quality was a lower ranked reason for the
adoption of the system, and motivation of improving behaviours and attitude of employees
toward quality as a reason for adoption of ISO 9000 was lowest ranked three of the four
cases.
Table 7-7 Motivations for adopting ISO 9000
Top five
motivations
MCM
(ISO 9000 in 2003)
DLM
(ISO 9000 in 2000)
HNM
(ISO 9000 in 2004)
VNM
(ISO 9000 in 2004)
IDP
(no ISO9000)
1 Expanding market
(E)
Raising competitive
advantage over
competitors (E)
Raising competitive
advantage over
competitors (E)
Utilizing efficiency
in production
processes, reduction
of defects (I)
NA
2 Improving
company‟s image
(E)
Improving the
company‟s image
(E)
Improving
company‟s image
through QA systems
Raising competitive
advantage over
other competitors
(E)
NA
3 Improve quality (I) Satisfying
legislation and
national regulations
(E)
Improve quality in
production process
(I)
Increase market
share in domestic
market (E)
NA
4 Raising competitive
advantages over
competitors
Improving product
quality (I)
Expanding market
(E)
Satisfying the
requirement of the
buyers (E)
NA
5 Improving
behaviours of
employee, staff
toward quality (I)
Improving
production
processes (I)
Improving
behaviours of
employee, staff
toward quality (I)
Improving
behaviours of
employee, staff
toward quality (I)
NA
Note: E external; I internal motivation; NA not applicable.
7.1.3.3 ISO 22000
Table 7-8 shows a comparison of motivations rated by firms for adopting ISO 22000. Two of
the three firms ranked ISO 22000 most highly as a tool to raise competitive advantage, while
the remaining firm perceived internal production improvement to be the top motivation. This
could reflect the fact that these two firms have a larger market share and sales volume and so
use this system as a marketing tool for differentiating their products. The small firm (IDP)
has not adopted ISO 9000, so this might explain why this internal motivation, rather than
external motivation, is ranked most highly.
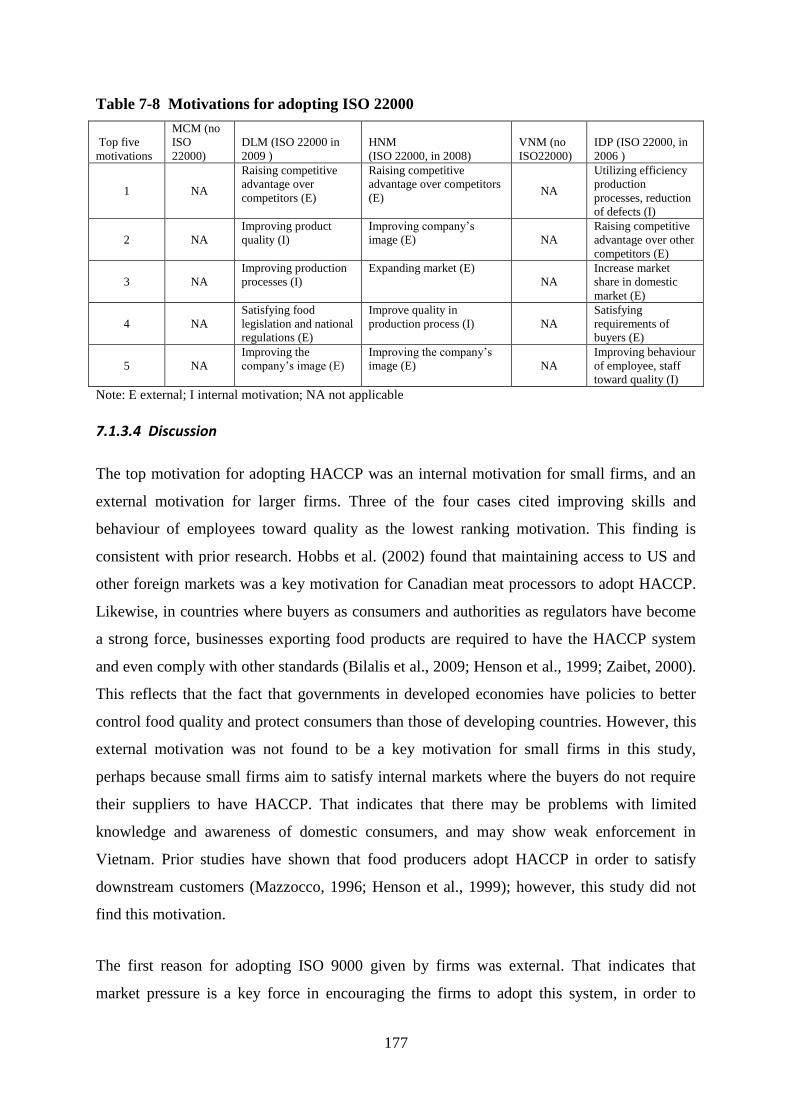
177
Table 7-8 Motivations for adopting ISO 22000
Top five
motivations
MCM (no
ISO
22000)
DLM (ISO 22000 in
2009 )
HNM
(ISO 22000, in 2008)
VNM (no
ISO22000)
IDP (ISO 22000, in
2006 )
1 NA
Raising competitive
advantage over
competitors (E)
Raising competitive
advantage over competitors
(E) NA
Utilizing efficiency
production
processes, reduction
of defects (I)
2 NA
Improving product
quality (I)
Improving company‟s
image (E) NA
Raising competitive
advantage over other
competitors (E)
3 NA
Improving production
processes (I)
Expanding market (E)
NA
Increase market
share in domestic
market (E)
4 NA
Satisfying food
legislation and national
regulations (E)
Improve quality in
production process (I) NA
Satisfying
requirements of
buyers (E)
5 NA
Improving the
company‟s image (E)
Improving the company‟s
image (E) NA
Improving behaviour
of employee, staff
toward quality (I)
Note: E external; I internal motivation; NA not applicable
7.1.3.4 Discussion
The top motivation for adopting HACCP was an internal motivation for small firms, and an
external motivation for larger firms. Three of the four cases cited improving skills and
behaviour of employees toward quality as the lowest ranking motivation. This finding is
consistent with prior research. Hobbs et al. (2002) found that maintaining access to US and
other foreign markets was a key motivation for Canadian meat processors to adopt HACCP.
Likewise, in countries where buyers as consumers and authorities as regulators have become
a strong force, businesses exporting food products are required to have the HACCP system
and even comply with other standards (Bilalis et al., 2009; Henson et al., 1999; Zaibet, 2000).
This reflects that the fact that governments in developed economies have policies to better
control food quality and protect consumers than those of developing countries. However, this
external motivation was not found to be a key motivation for small firms in this study,
perhaps because small firms aim to satisfy internal markets where the buyers do not require
their suppliers to have HACCP. That indicates that there may be problems with limited
knowledge and awareness of domestic consumers, and may show weak enforcement in
Vietnam. Prior studies have shown that food producers adopt HACCP in order to satisfy
downstream customers (Mazzocco, 1996; Henson et al., 1999); however, this study did not
find this motivation.
The first reason for adopting ISO 9000 given by firms was external. That indicates that
market pressure is a key force in encouraging the firms to adopt this system, in order to
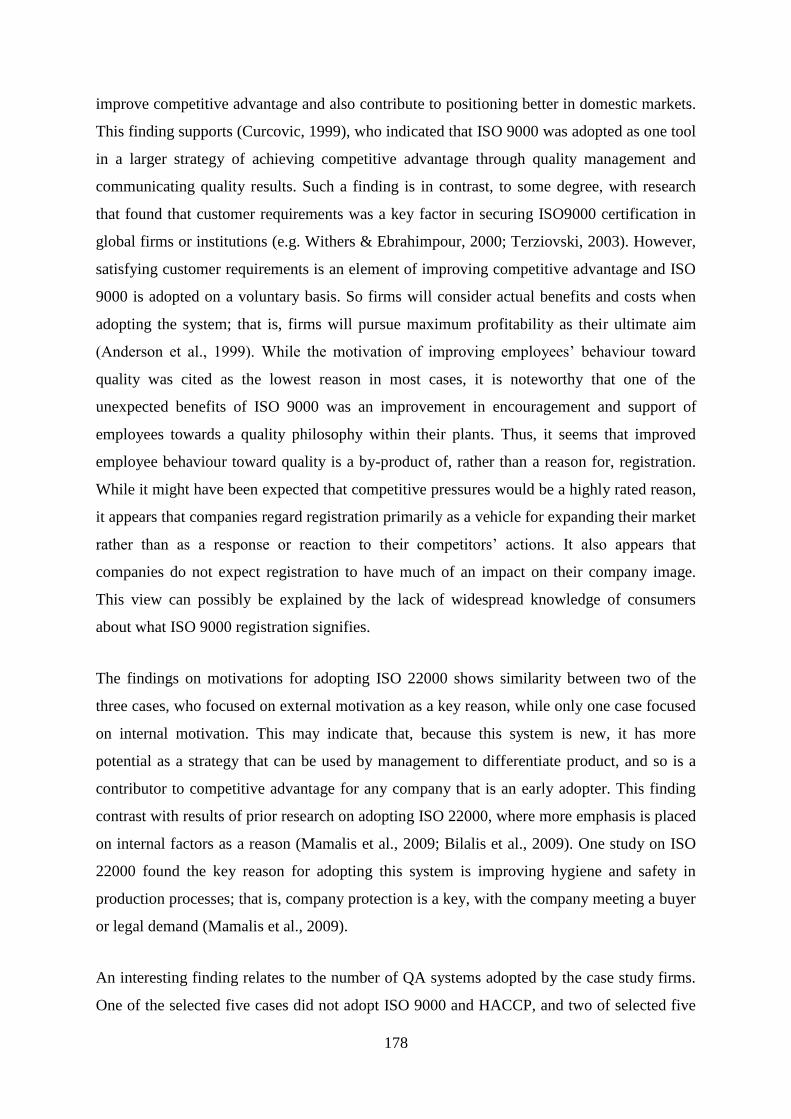
178
improve competitive advantage and also contribute to positioning better in domestic markets.
This finding supports (Curcovic, 1999), who indicated that ISO 9000 was adopted as one tool
in a larger strategy of achieving competitive advantage through quality management and
communicating quality results. Such a finding is in contrast, to some degree, with research
that found that customer requirements was a key factor in securing ISO9000 certification in
global firms or institutions (e.g. Withers & Ebrahimpour, 2000; Terziovski, 2003). However,
satisfying customer requirements is an element of improving competitive advantage and ISO
9000 is adopted on a voluntary basis. So firms will consider actual benefits and costs when
adopting the system; that is, firms will pursue maximum profitability as their ultimate aim
(Anderson et al., 1999). While the motivation of improving employees‟ behaviour toward
quality was cited as the lowest reason in most cases, it is noteworthy that one of the
unexpected benefits of ISO 9000 was an improvement in encouragement and support of
employees towards a quality philosophy within their plants. Thus, it seems that improved
employee behaviour toward quality is a by-product of, rather than a reason for, registration.
While it might have been expected that competitive pressures would be a highly rated reason,
it appears that companies regard registration primarily as a vehicle for expanding their market
rather than as a response or reaction to their competitors‟ actions. It also appears that
companies do not expect registration to have much of an impact on their company image.
This view can possibly be explained by the lack of widespread knowledge of consumers
about what ISO 9000 registration signifies.
The findings on motivations for adopting ISO 22000 shows similarity between two of the
three cases, who focused on external motivation as a key reason, while only one case focused
on internal motivation. This may indicate that, because this system is new, it has more
potential as a strategy that can be used by management to differentiate product, and so is a
contributor to competitive advantage for any company that is an early adopter. This finding
contrast with results of prior research on adopting ISO 22000, where more emphasis is placed
on internal factors as a reason (Mamalis et al., 2009; Bilalis et al., 2009). One study on ISO
22000 found the key reason for adopting this system is improving hygiene and safety in
production processes; that is, company protection is a key, with the company meeting a buyer
or legal demand (Mamalis et al., 2009).
An interesting finding relates to the number of QA systems adopted by the case study firms.
One of the selected five cases did not adopt ISO 9000 and HACCP, and two of selected five
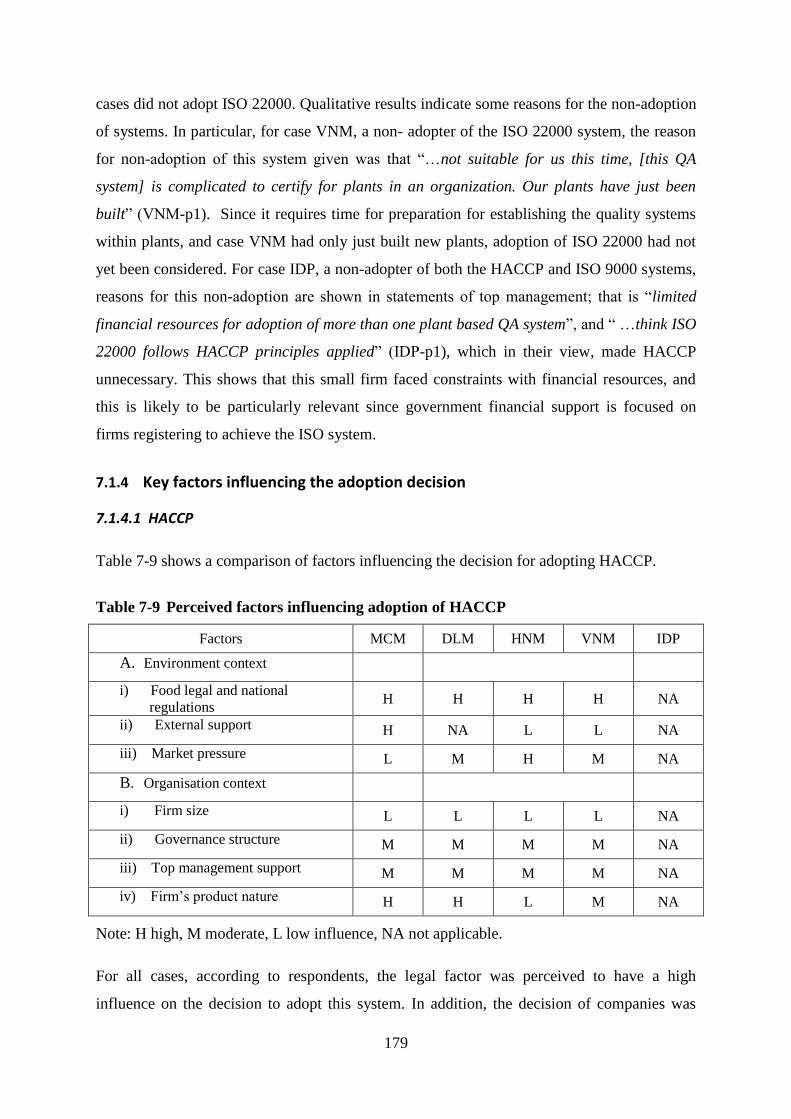
179
cases did not adopt ISO 22000. Qualitative results indicate some reasons for the non-adoption
of systems. In particular, for case VNM, a non- adopter of the ISO 22000 system, the reason
for non-adoption of this system given was that “…not suitable for us this time, [this QA
system] is complicated to certify for plants in an organization. Our plants have just been
built” (VNM-p1). Since it requires time for preparation for establishing the quality systems
within plants, and case VNM had only just built new plants, adoption of ISO 22000 had not
yet been considered. For case IDP, a non-adopter of both the HACCP and ISO 9000 systems,
reasons for this non-adoption are shown in statements of top management; that is “limited
financial resources for adoption of more than one plant based QA system”, and “ …think ISO
22000 follows HACCP principles applied” (IDP-p1), which in their view, made HACCP
unnecessary. This shows that this small firm faced constraints with financial resources, and
this is likely to be particularly relevant since government financial support is focused on
firms registering to achieve the ISO system.
7.1.4 Key factors influencing the adoption decision
7.1.4.1 HACCP
Table 7-9 shows a comparison of factors influencing the decision for adopting HACCP.
Table 7-9 Perceived factors influencing adoption of HACCP
Factors MCM DLM HNM VNM IDP
A. Environment context
i) Food legal and national
regulations H H H H NA
ii) External support H NA L L NA
iii) Market pressure L M H M NA
B. Organisation context
i) Firm size L L L L NA
ii) Governance structure M M M M NA
iii) Top management support M M M M NA
iv) Firm‟s product nature H H L M NA
Note: H high, M moderate, L low influence, NA not applicable.
For all cases, according to respondents, the legal factor was perceived to have a high
influence on the decision to adopt this system. In addition, the decision of companies was
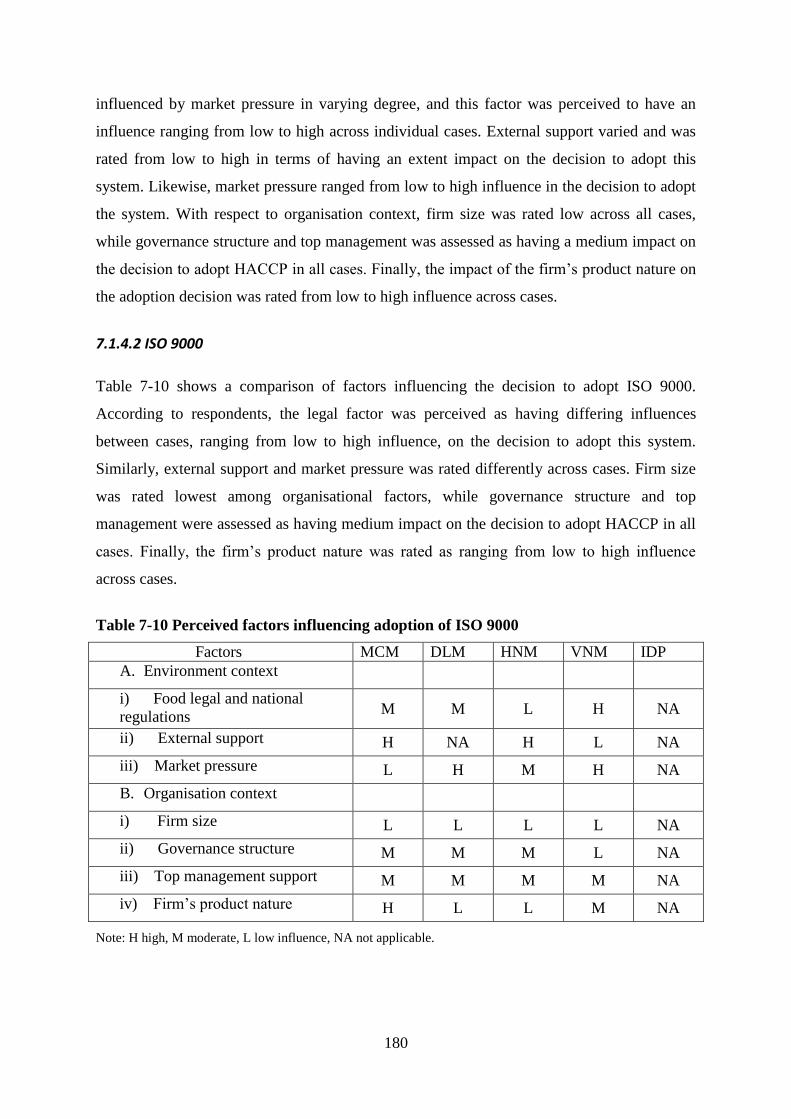
180
influenced by market pressure in varying degree, and this factor was perceived to have an
influence ranging from low to high across individual cases. External support varied and was
rated from low to high in terms of having an extent impact on the decision to adopt this
system. Likewise, market pressure ranged from low to high influence in the decision to adopt
the system. With respect to organisation context, firm size was rated low across all cases,
while governance structure and top management was assessed as having a medium impact on
the decision to adopt HACCP in all cases. Finally, the impact of the firm‟s product nature on
the adoption decision was rated from low to high influence across cases.
7.1.4.2 ISO 9000
Table 7-10 shows a comparison of factors influencing the decision to adopt ISO 9000.
According to respondents, the legal factor was perceived as having differing influences
between cases, ranging from low to high influence, on the decision to adopt this system.
Similarly, external support and market pressure was rated differently across cases. Firm size
was rated lowest among organisational factors, while governance structure and top
management were assessed as having medium impact on the decision to adopt HACCP in all
cases. Finally, the firm‟s product nature was rated as ranging from low to high influence
across cases.
Table 7-10 Perceived factors influencing adoption of ISO 9000
Factors MCM DLM HNM VNM IDP
A. Environment context
i) Food legal and national
regulations M M L H NA
ii) External support H NA H L NA
iii) Market pressure L H M H NA
B. Organisation context
i) Firm size L L L L NA
ii) Governance structure M M M L NA
iii) Top management support M M M M NA
iv) Firm‟s product nature H L L M NA
Note: H high, M moderate, L low influence, NA not applicable.
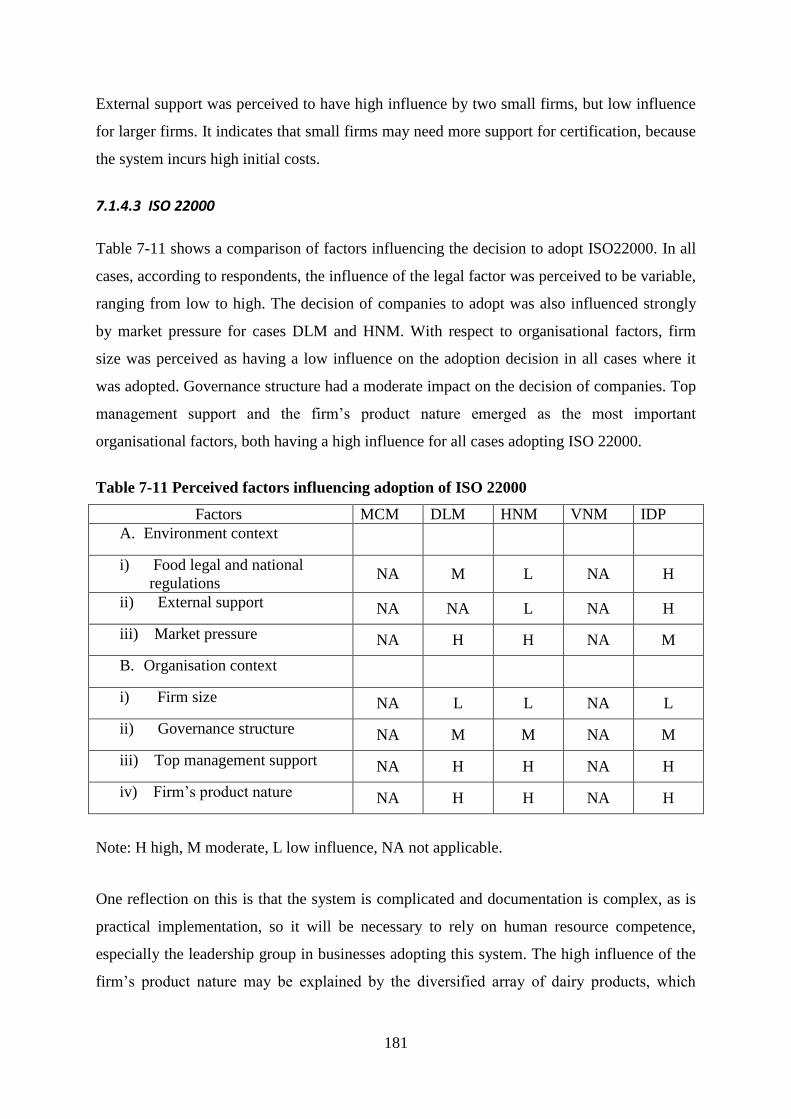
181
External support was perceived to have high influence by two small firms, but low influence
for larger firms. It indicates that small firms may need more support for certification, because
the system incurs high initial costs.
7.1.4.3 ISO 22000
Table 7-11 shows a comparison of factors influencing the decision to adopt ISO22000. In all
cases, according to respondents, the influence of the legal factor was perceived to be variable,
ranging from low to high. The decision of companies to adopt was also influenced strongly
by market pressure for cases DLM and HNM. With respect to organisational factors, firm
size was perceived as having a low influence on the adoption decision in all cases where it
was adopted. Governance structure had a moderate impact on the decision of companies. Top
management support and the firm‟s product nature emerged as the most important
organisational factors, both having a high influence for all cases adopting ISO 22000.
Table 7-11 Perceived factors influencing adoption of ISO 22000
Factors MCM DLM HNM VNM IDP
A. Environment context
i) Food legal and national
regulations NA M L NA H
ii) External support NA NA L NA H
iii) Market pressure NA H H NA M
B. Organisation context
i) Firm size NA L L NA L
ii) Governance structure NA M M NA M
iii) Top management support NA H H NA H
iv) Firm‟s product nature NA H H NA H
Note: H high, M moderate, L low influence, NA not applicable.
One reflection on this is that the system is complicated and documentation is complex, as is
practical implementation, so it will be necessary to rely on human resource competence,
especially the leadership group in businesses adopting this system. The high influence of the
firm‟s product nature may be explained by the diversified array of dairy products, which
182
leads to detailed identification of CCPs for each product. This will take time for organisation
and establishment of these procedures.
7.1.4.4 Discussion
Some issues were discussed partially in the above section, and now other factors will be
considered in more depth. These are external factors, such as legal, market pressure, and
external support. In addition, internal factors, such as firm size, governance structure, and top
management support will also be discussed.
Legal
It was found that the legal factor strongly influenced the decision of companies to adopt
HACCP. It appears that companies are increasingly mindful of the safety regulations that
govern their operations, and that their inability to adhere to these regulatory pressures may
result in serious penalties, including legal sanction, costly court proceedings, fines and
penalties. Hence, fear of legal sanction is considered a primary reason why companies adopt
QA systems in general and HACCP in particular. Legal sanctions can encourage companies
to publicly disclose safety handling activities because doing so can reduce external suspicions
about their quality assurance activities.
It needs to be recognised that Vietnam runs an economy with a State orientation, where the
State has a powerful role in legal enforcement, typically characterised by a top down
approach and command to businesses, particularly businesses in food production and the
manufacturing sector. In principle, the government forces its requirements through decrees
sanctioned by legislation and law, such as Ordinances and Directives on food safety3, to
protect consumers and reduce the cost to society caused by poisonous substances and illness
borne by unsafe foods. These decrees establish a legal framework to regulate firms and force
them to produce, manufacture, and distribute safe foods to consumers. It also rules the
business environment where firms operate, and constrains their strategic behaviours,
particularly for a heavily regulated sector, such as a dairy sector. In particular, it appears that
the Decree on Safety and Hygiene of Foods 1997 has an important impact on the decision to
adopt HACCP, as it forces firms producing and trading in dairy products to do so in a safe
3 Main legislation and regulation related to food safety are the Food Law, the Law on Safe Goods Trading, the Decree on
Safety and Hygienic of Foodstuff 1997, the Ordinance on Food Hygienic and Safety 2007, National HACCP plan by the
year 2010 formulated in 2003, and national and industry standards.
183
way to assure benefits to consumers. Furthermore, dairy businesses that were established
after 2003 might have been influenced by the HACCP National Plan 2003, which mandates
food establishments to have HACCP, although it has some exemptions4. Regulatory pressure
is shown also by indirect actions by government on the decisions of companies.
Within the State-owned companies, the government has also direct intervention and a direct
impact on these companies‟ business strategies through its legal representatives on the
Supervisor Board. However, this intervention has become weaker in recent years, as the State
has conducted an „equitisation‟ process, and reduced its stake in the registered capital of these
companies; for example, in cases MCM and VNM, it has changed from 100% State capital to
50% and 42%, respectively (Moc Chau Company, 2009; Vinamilk company, 2010).
The influence of legal factors on the decision to adopt was also shown strongly for foreign
companies. This reflects the fact that foreign companies, with a view to protect new markets,
pursue their obligation to follow rules and laws in these markets, and safety in their business
activities. This finding supports prior research by Henson & Heasman (1999), and Caswell &
Johnson (1991), who also found that a legal factor strongly affected the adoption of HACCP.
Jin et al. (2008) found that external factors may affect the decision as whether or not to adopt
the HACCP system in Chinese businesses, and also indicated that compliance with the law
and the recommendation of industry associations was one of the most important factors.
However, firms also expected to gain economic benefits (i.e. market share or profitability)
when it responded to compliance requirements. Hooker et al. (2002) researched meat
processing firms complying with regulations of the USDA and found that Canadian firms
followed these regulations to export product to USA, and Henson & Heasman (1999)
emphasised the role of enforcement in regulatory process for assuring safety of food.
Legal factors had less influence on the adoption decision for the two remaining systems, ISO
9000 and ISO 22000, which reflects the voluntary nature of these systems. There are not
many law articles or decrees ruling these systems. Government also uses encouragement
rather than mandating or forcing firms to adopt such systems. This effect of the legal factor
may be explained as guiding how to make these systems compatible with national standards;
for example, both TCVN5 and ISO 9000. These findings support Anderson et al. (1999), who
4 Case IDP, HACCP principles embedded in ISO 22000: 2005, was accepted as HACCP approved but not certified.
5 Vietnam Standards established or harmonized with other international standards by STAMEQ, national
standardization organization.
184
showed that, to an extent, economic and political forces influenced managers to adopt ISO
9000. For ISO 22000, the legal factor is not so significant. An explanation for this is that this
system is relatively new, and the government seems not to have policies for regulating this
system, or plans to encourage its adoption.
Market Pressures
This research finds that market pressure encourages companies to adopt QA systems in
general, but this factor is a higher force for large firms than for small firms. Market pressure
shows up as competition pressure rather than other forces, perhaps because upstream
stakeholders in the supply chain do not require processors to achieve QA systems. This may
be explained by the observation that domestic consumers are thought to have limited
knowledge and awareness of product quality and QA systems; therefore, they are a weak
force in negotiation with suppliers on price, quantity and quality of products. In an emerging
economy context like Vietnam, they are not able to request their suppliers to have QA
systems. This weakness can also be observed with intermediate businesses, such as
wholesalers and agents. Supply contracts are signed between agents/ purchasers and
supplier/sellers, but processors have more power in contract negotiation in the quality and
quantity norms they set up, while purchasers have weaker power in requesting their suppliers
to obtain QA systems as a quality signal. This finding supports (Wang et al., 2006) indicated
that customer requirement alone was not enough to pressure organisations to obtain ISO 9000
certification. However, it contrasts with results of others (Ziggers, 1999; Walgenbach, 2007;
Terziovski et al., 2003), who found partners were able to request their suppliers to have QA
system, as „pressure from customers‟. However, these stakeholders, as noted in the chains in
their research, are more powerful than those in supply chains in this research. This reflects
features of an emerging economy, such as Vietnam.
As a result, competition between dairy firms is one of the key factors affecting the adoption
of QA systems. To survive in the market economy, firms compete to gain market share, and
gain a stronger position over rivals. For the dairy products market in Vietnam, it was found
that competition was not so strong between companies with small market share, because
these firms addressed this by focusing on a market niche for particular dairy food products.
These appear to be stronger competition between larger companies that have large market
share. It is possible that the competition factor forces larger companies to apply new
technology and innovations, including QA systems, thus incorporating quality improvement
185
into their long term strategy. Such a finding is consistent with that of Ebrahimpour (2003),
who indicated that ISO9000 a competitive tool to win the lead over competitors.
External Support
This research finds that external support impacted on the adoption decision. There are
different influences on adoption decisions because support that benefited companies differs in
types and level, and also by supporting organisations. External support is of importance for
small firms, but not for larger firms. This is consistent with the observation that small firms in
Vietnam are lacking financial resources, whereas the cost for setting up systems, such as ISO
9000 is initially often high, including registration fee, training, etc. The support went to
businesses to achieve the ISO 9000 system rather than other QA systems, because the
HACCP system is mandated by government within the food industry in general, and in the
dairy sector in particular. On the other hand, ISO 22000 is new system just introduced into
businesses in recent years. In general, businesses expect to have support once they register for
QA certification. This result is similar to those of other previous studies in developing
countries, where a tendency to offer support to SMEs in QA system registration is noted, as
these can be considered as tools for improving national competitive advantage; for example,
ISO 9000 in Greece (Aggelogiannopoulos et al., 2007), and HACCP in India (Deodhar,
2003).
Firm Size
It was found that the adoption decision was influenced by organisational context to different
degrees in different firms. These are summarised in Table 7-12. Firm size was perceived to
be of lesser importance to the decision, especially for small firms. In this study, it was shown
that they received external support. Such support facilitates and encourages firms to move
towards quality and efficiency. For larger firms, this factor was perceived to have a low
influence on their decision, as these companies have fair financial resources sourced from
government investment and capital or from their parent corporation‟s capital. This
observation is in contrast to previous studies that indicated firm size did affect the adoption of
HACCP (Henson & Holt, 2000; Shavell, 1987; MacDonald & Crutchfield, 1996) and of ISO
9000 (Ghodbadian & Gallear, 1996; Adams, 1999; Garr et al., 1997). As noted above, the
dairy firms in this study received an external support to set up QA systems, which explains
this contrasting finding.
186
Governance structure
Governance structure plays a vital role in efficiently implementing a business strategy of
companies. In addition, where quality management practices and its activities is embedded,
this is affected by organisation structure. The study revealed that governance structure had a
moderate impact on the adoption decision, shown by moderate influence rated by
respondents. Organization structure is based on ownership type, which has a key role in the
diffusion of QA systems. When ownership lies partly with the State, the company is an early
beneficiary of interventions and information from government when the State launches new
policies and strategic programs, such as the HACCP national program. One of the aspects in
organization structure observed was complexity in organization characteristics, such as the
company having a QA division, and roles and function of top management (i.e. CEO/director
and chairperson of Supervisors Board combined, or independent).
Governance is also affected by company structure. This can influence where the QA system
is embedded, and whether it is implemented with a quality division/department organization.
If information sharing from plant teams is isolated from the company headquarters‟ QA
divisions, this may have some effect on adoption decision. The governance structure may
also determine whether a QA division is separated under director management or a planning
department. Key factors are availability of human resources for the quality team, and linkages
of plant quality teams with the company, in the case of scattered plants (case DLM, case
VNM, case IDP), where the quality team was under regional office or branches.
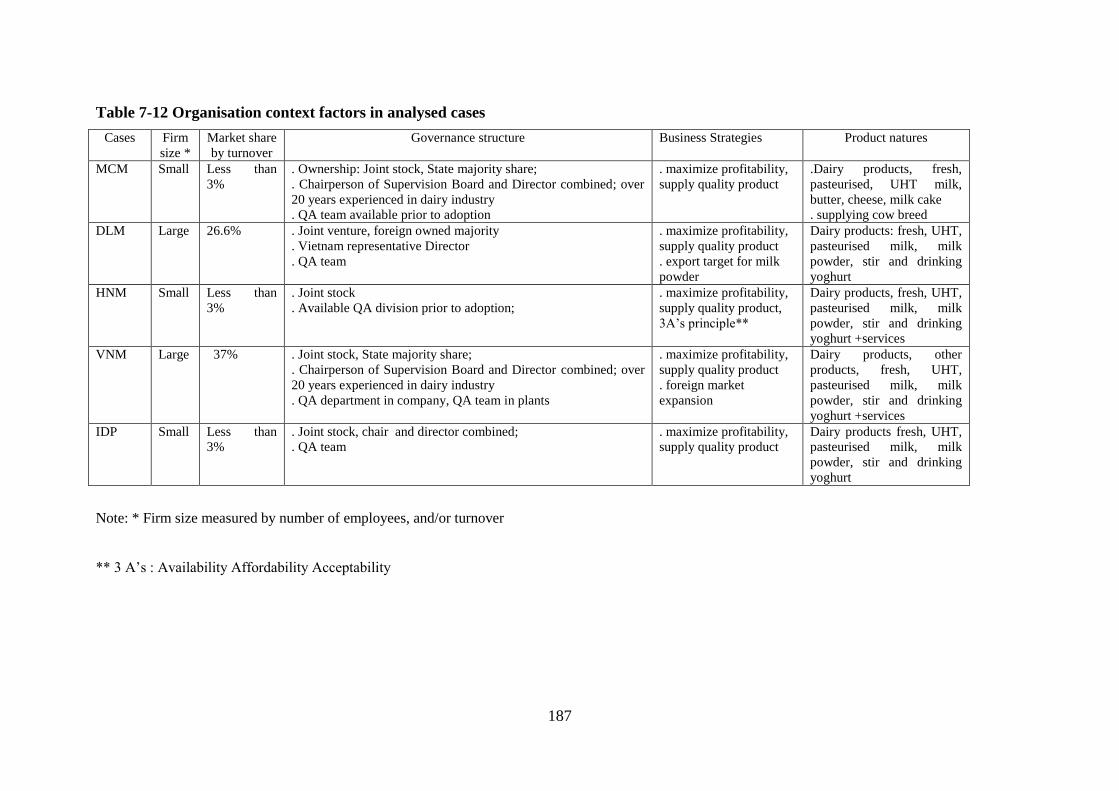
187
Table 7-12 Organisation context factors in analysed cases
Cases Firm
size *
Market share
by turnover
Governance structure Business Strategies Product natures
MCM Small Less than
3%
. Ownership: Joint stock, State majority share;
. Chairperson of Supervision Board and Director combined; over
20 years experienced in dairy industry
. QA team available prior to adoption
. maximize profitability,
supply quality product
.Dairy products, fresh,
pasteurised, UHT milk,
butter, cheese, milk cake
. supplying cow breed
DLM Large 26.6% . Joint venture, foreign owned majority
. Vietnam representative Director
. QA team
. maximize profitability,
supply quality product
. export target for milk
powder
Dairy products: fresh, UHT,
pasteurised milk, milk
powder, stir and drinking
yoghurt
HNM Small Less than
3%
. Joint stock
. Available QA division prior to adoption;
. maximize profitability,
supply quality product,
3A‟s principle**
Dairy products, fresh, UHT,
pasteurised milk, milk
powder, stir and drinking
yoghurt +services
VNM Large 37% . Joint stock, State majority share;
. Chairperson of Supervision Board and Director combined; over
20 years experienced in dairy industry
. QA department in company, QA team in plants
. maximize profitability,
supply quality product
. foreign market
expansion
Dairy products, other
products, fresh, UHT,
pasteurised milk, milk
powder, stir and drinking
yoghurt +services
IDP Small Less than
3%
. Joint stock, chair and director combined;
. QA team
. maximize profitability,
supply quality product
Dairy products fresh, UHT,
pasteurised milk, milk
powder, stir and drinking
yoghurt
Note: * Firm size measured by number of employees, and/or turnover
** 3 A‟s : Availability Affordability Acceptability
188
Top management support
It was found that top management support had a high impact on the decision to adopt. This
reflects the fact that top management‟s attributes, such as education and experience is of
importance when integrating business and quality strategies, and ensuring adoption occurs as
expected. For example, in state owned dairy companies, top management had over 20 years‟
experience specialising in dairy production and trade, and such managers encouraged the
adoption of QA system easier and faster than other companies. This finding supports prior
study that indicated that characteristics of top management affected the decision to adopt QA
systems. These included education level of top management, skill and awareness, and ability
to manage risks after a decision is made (Papadakis & Barwise, 2002).
In addition, the structure of top management in dairy firms impacted on the adoption
decision. In this regard, it was found that when the positions of CEO and chairperson of the
supervision board were independent; that is, two positions held by two persons, then decisive
decision making by the top management was observed. However, for case VNM, this
structure was not observed, and it appears that the decision to adopt by top management was
slower than other cases. Hence, the adoption decision may be affected by organisation
structure6. In this study, case DLM and VNM‟s organization was observed to be a
mechanistic structure, focused on organizing and controlling activities and making employee
behaviour predictable, an approach often used when the environment surrounding an
organization stable. In such a structure, authority is centralized at the top of the managerial
hierarchy, roles and tasks are clearly specified, employees are closely supervised, and
emphasis is on strict discipline and order. However, for other cases such as HNM and IDP,
organisation structure was more organic, with authority decentralised and devolved to middle
managers to encourage them to take responsibility and to respond effectively to the
unexpected, therefore reacting quickly to a changing environment.
These observations support previous studies on management structure and the adoption of
innovations. Thompson (1965) finds a negative relationship between centralisation and
innovation, and that a participatory work environment facilitates innovation by increasing
organisation member‟s awareness, commitment and involvement. Daft & Becker (1978)
argue that low professionalism, high formalisation, and high centralisation facilitate
6 There are two types of organization structure, mechanistic and organic (Spencer, 1994)
189
administrative innovations, while the inverse conditions facilitate technical innovations. Etlie
et al. (1984) argue that structure complexity and decentralisation should lead to more
incremental innovations. Similarly, Dewar & Dutton (1986) and Khan & Manopichetwanna
(1989) argue that top managers are irrelevant or even have a negative impact on
implementation of process innovations.
7.1.5 Impacts of QA systems on organisational outcomes
7.1.5.1 HACCP
Table 7-13 shows a summary comparison of the perceived impacts of HACCP on
organisation outcomes across the four cases that adopted HACCP. Organisational outcomes
are categorised according to business, operational, and quality performance.
It was found that HACCP had a perceived impact on business performance, though the
impact of this system on business performance was mixed, ranging from moderate to high for
different measures. However, it had high perceived impact on „sales‟ measure after adoption.
This may be explained by the fact that most companies adopting this system perceived that
HACCP has had effect on safety, and the reduction of defects and waste, which is interpreted
as better product quality, a feature grasped by customers, who then contributed into
increasing sales of the companies. However, it was perceived to have had a mixed impact on
other measures, such as market share. Two of the four cases stated there appears to be an
increase of market share, while other remaining cases did not. This difference may be
explained by the observation that two cases are small firms that experienced fast growth of
their market share, while the two larger firms found the growth of their market share slower.
It is also worthy to note that larger firms have switched their strategy to focus on overseas
market expansion, while small firms have attempted to introduce a range of new products that
contributed to increase their share on the domestic market.
It was found that HACCP had a perceived impact on operational performance. This was
shown through a perceived increase in „customer satisfaction‟. Three of the four cases
perceived that HACCP had a strong impact on this dimension, while one case did not. The
difference indicated that the challenge of implementation of HACCP within plants is high,
and it is difficult for companies to create value from this system through the reduction of
claims on products from customers.
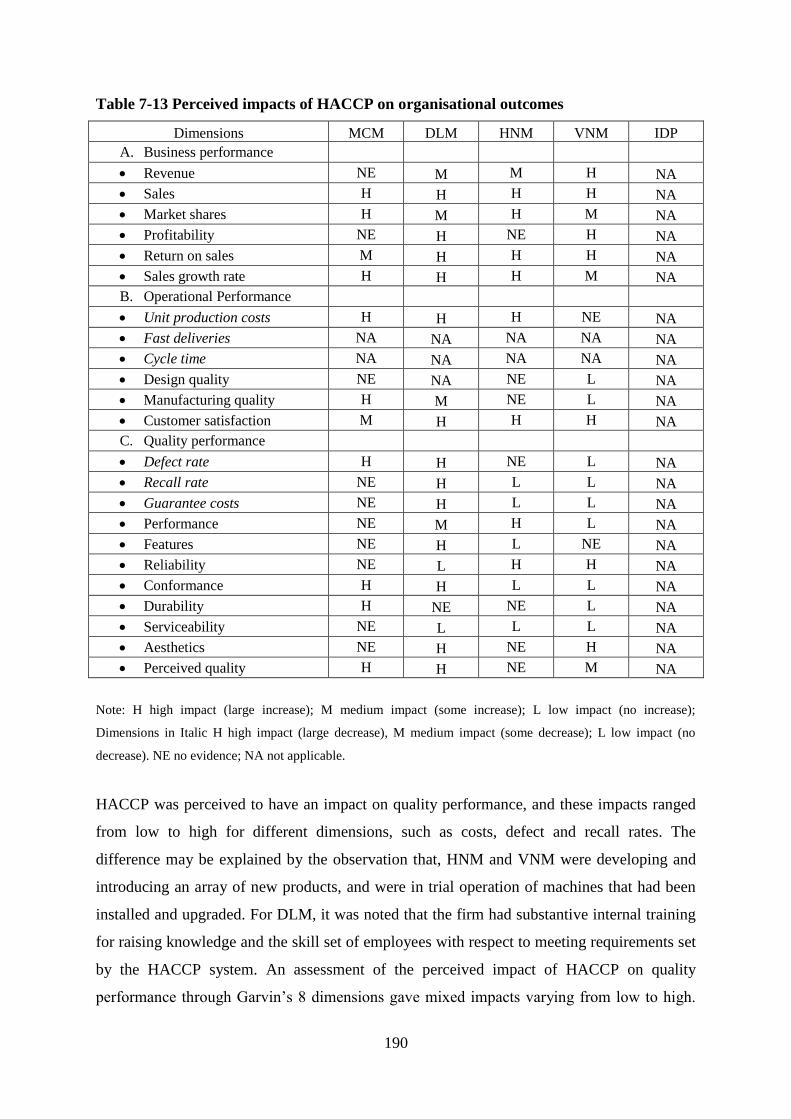
190
Table 7-13 Perceived impacts of HACCP on organisational outcomes
Dimensions MCM DLM HNM VNM IDP
A. Business performance
Revenue NE M M H NA
Sales H H H H NA
Market shares H M H M NA
Profitability NE H NE H NA
Return on sales M H H H NA
Sales growth rate H H H M NA
B. Operational Performance
Unit production costs H H H NE NA
Fast deliveries NA NA NA NA NA
Cycle time NA NA NA NA NA
Design quality NE NA NE L NA
Manufacturing quality H M NE L NA
Customer satisfaction M H H H NA
C. Quality performance
Defect rate H H NE L NA
Recall rate NE H L L NA
Guarantee costs NE H L L NA
Performance NE M H L NA
Features NE H L NE NA
Reliability NE L H H NA
Conformance H H L L NA
Durability H NE NE L NA
Serviceability NE L L L NA
Aesthetics NE H NE H NA
Perceived quality H H NE M NA
Note: H high impact (large increase); M medium impact (some increase); L low impact (no increase);
Dimensions in Italic H high impact (large decrease), M medium impact (some decrease); L low impact (no
decrease). NE no evidence; NA not applicable.
HACCP was perceived to have an impact on quality performance, and these impacts ranged
from low to high for different dimensions, such as costs, defect and recall rates. The
difference may be explained by the observation that, HNM and VNM were developing and
introducing an array of new products, and were in trial operation of machines that had been
installed and upgraded. For DLM, it was noted that the firm had substantive internal training
for raising knowledge and the skill set of employees with respect to meeting requirements set
by the HACCP system. An assessment of the perceived impact of HACCP on quality
performance through Garvin‟s 8 dimensions gave mixed impacts varying from low to high.
191
For example, for the “conformance‟ measure, two of the four cases perceived that HACCP
had a high impact, while two the remaining cases did not. This difference appears to be
influenced more by complicated procedures and organisation and implementation of this
system within the plant.
These results support prior research that found that HACCP contributed to improving
business performance. These studies found a range of improvements, such as enhanced
access to markets, cost effectiveness, time savings, production efficiency, employee
development, improved information and communication, enhanced compliance with
regulation organisational development, improved product quality and safety (Taylor, 2001;
Romano et al., 2004; Trienkens & Zuurbier, 2008), and changes in sales and market share
(Khatri & Collin, 2007). One study showed market share improved over a number of years
after fish companies in Oman adopted HACCP for exported products to the EU (Zaibet,
2000). Australian firms gained a reduction in rejects/rework/out of specification products,
reduction in customer complaints, improved product hygiene, improved morale and an
increase in overseas markets after adopting HACCP (Khatri & Colin, 2007). Nganje (1999),
who studied HACCP implementation in the US meat industry and found that firms with
HACCP were shown to be more efficient after adoption than before HACCP adoption. A
second relevant set of studies (e.g., Maldonado et al., 2005; Henson et al., 1999) pointed out
that the relevance and realization of certain benefits from adopting HACCP systems differ by
context.
7.1.5.2 ISO 9000
Table 7-14 shows a comparison of the perceived impacts of ISO 9000 on organisational
outcomes across the four cases. Firms had mixed benefits after implementing ISO 9000,
ranging from low to high. In particular, the rating from HNM was low, which showed there
was not a perceived impact of ISO 9000 on revenue, sales, and market share. This reflects the
fact that the company has just emerged from the melamine scandal. For DLM, respondents
perceived that ISO 9000 had a high impact on business performance. This was shown by a
perceived increase in revenue, sales, and market share, and sales growth rate, though
unchanged profitability and return on sales. This is explained by the observation that the
company was paying the increased costs incurred for raising the capacity of its Phu Ly plant
and expanding its distribution network to the North of Vietnam. For VNM, dimensions of
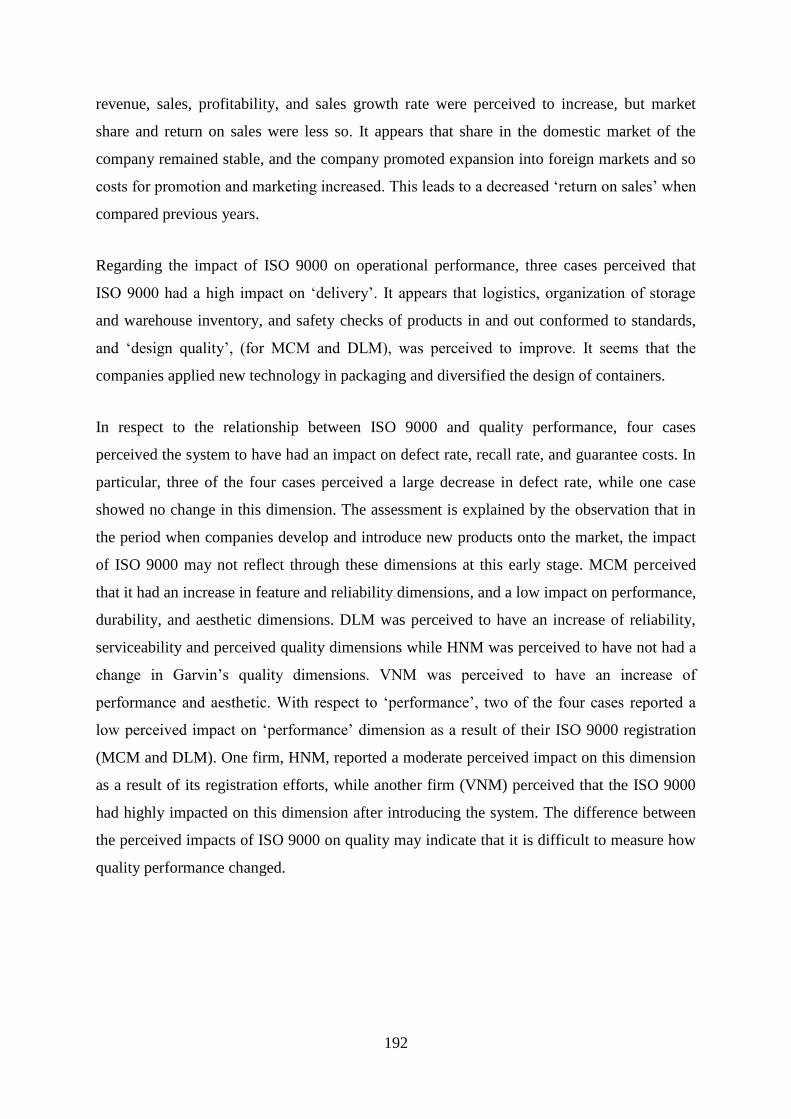
192
revenue, sales, profitability, and sales growth rate were perceived to increase, but market
share and return on sales were less so. It appears that share in the domestic market of the
company remained stable, and the company promoted expansion into foreign markets and so
costs for promotion and marketing increased. This leads to a decreased „return on sales‟ when
compared previous years.
Regarding the impact of ISO 9000 on operational performance, three cases perceived that
ISO 9000 had a high impact on „delivery‟. It appears that logistics, organization of storage
and warehouse inventory, and safety checks of products in and out conformed to standards,
and „design quality‟, (for MCM and DLM), was perceived to improve. It seems that the
companies applied new technology in packaging and diversified the design of containers.
In respect to the relationship between ISO 9000 and quality performance, four cases
perceived the system to have had an impact on defect rate, recall rate, and guarantee costs. In
particular, three of the four cases perceived a large decrease in defect rate, while one case
showed no change in this dimension. The assessment is explained by the observation that in
the period when companies develop and introduce new products onto the market, the impact
of ISO 9000 may not reflect through these dimensions at this early stage. MCM perceived
that it had an increase in feature and reliability dimensions, and a low impact on performance,
durability, and aesthetic dimensions. DLM was perceived to have an increase of reliability,
serviceability and perceived quality dimensions while HNM was perceived to have not had a
change in Garvin‟s quality dimensions. VNM was perceived to have an increase of
performance and aesthetic. With respect to „performance‟, two of the four cases reported a
low perceived impact on „performance‟ dimension as a result of their ISO 9000 registration
(MCM and DLM). One firm, HNM, reported a moderate perceived impact on this dimension
as a result of its registration efforts, while another firm (VNM) perceived that the ISO 9000
had highly impacted on this dimension after introducing the system. The difference between
the perceived impacts of ISO 9000 on quality may indicate that it is difficult to measure how
quality performance changed.
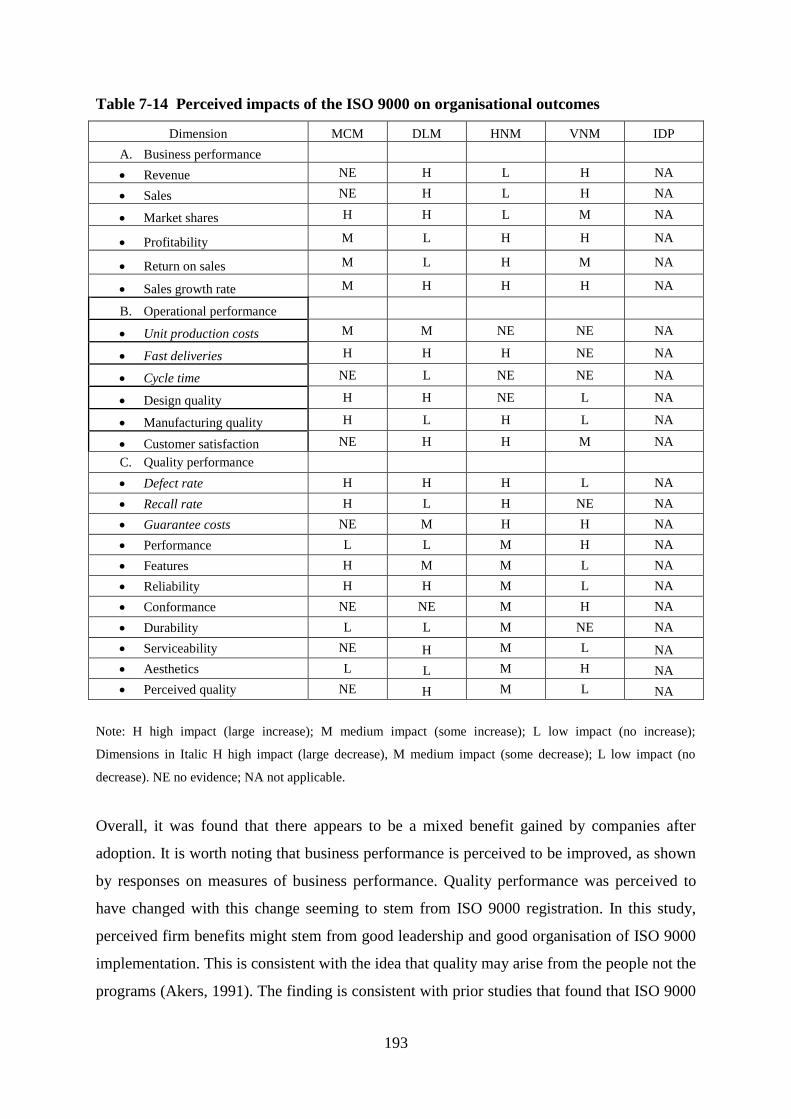
193
Table 7-14 Perceived impacts of the ISO 9000 on organisational outcomes
Dimension MCM DLM HNM VNM IDP
A. Business performance
Revenue NE H L H NA
Sales NE H L H NA
Market shares H H L M NA
Profitability M L H H NA
Return on sales M L H M NA
Sales growth rate M H H H NA
B. Operational performance
Unit production costs M M NE NE NA
Fast deliveries H H H NE NA
Cycle time NE L NE NE NA
Design quality H H NE L NA
Manufacturing quality H L H L NA
Customer satisfaction NE H H M NA
C. Quality performance
Defect rate H H H L NA
Recall rate H L H NE NA
Guarantee costs NE M H H NA
Performance L L M H NA
Features H M M L NA
Reliability H H M L NA
Conformance NE NE M H NA
Durability L L M NE NA
Serviceability NE H M L NA
Aesthetics L L M H NA
Perceived quality NE H M L NA
Note: H high impact (large increase); M medium impact (some increase); L low impact (no increase);
Dimensions in Italic H high impact (large decrease), M medium impact (some decrease); L low impact (no
decrease). NE no evidence; NA not applicable.
Overall, it was found that there appears to be a mixed benefit gained by companies after
adoption. It is worth noting that business performance is perceived to be improved, as shown
by responses on measures of business performance. Quality performance was perceived to
have changed with this change seeming to stem from ISO 9000 registration. In this study,
perceived firm benefits might stem from good leadership and good organisation of ISO 9000
implementation. This is consistent with the idea that quality may arise from the people not the
programs (Akers, 1991). The finding is consistent with prior studies that found that ISO 9000
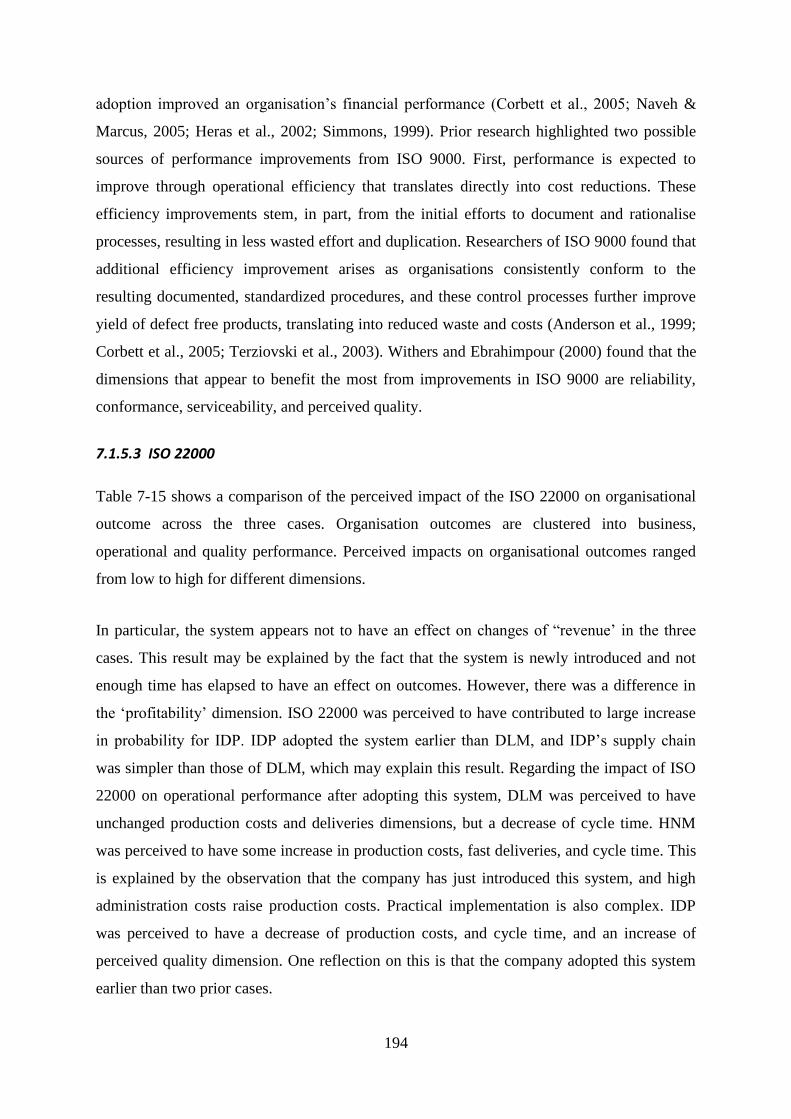
194
adoption improved an organisation‟s financial performance (Corbett et al., 2005; Naveh &
Marcus, 2005; Heras et al., 2002; Simmons, 1999). Prior research highlighted two possible
sources of performance improvements from ISO 9000. First, performance is expected to
improve through operational efficiency that translates directly into cost reductions. These
efficiency improvements stem, in part, from the initial efforts to document and rationalise
processes, resulting in less wasted effort and duplication. Researchers of ISO 9000 found that
additional efficiency improvement arises as organisations consistently conform to the
resulting documented, standardized procedures, and these control processes further improve
yield of defect free products, translating into reduced waste and costs (Anderson et al., 1999;
Corbett et al., 2005; Terziovski et al., 2003). Withers and Ebrahimpour (2000) found that the
dimensions that appear to benefit the most from improvements in ISO 9000 are reliability,
conformance, serviceability, and perceived quality.
7.1.5.3 ISO 22000
Table 7-15 shows a comparison of the perceived impact of the ISO 22000 on organisational
outcome across the three cases. Organisation outcomes are clustered into business,
operational and quality performance. Perceived impacts on organisational outcomes ranged
from low to high for different dimensions.
In particular, the system appears not to have an effect on changes of “revenue‟ in the three
cases. This result may be explained by the fact that the system is newly introduced and not
enough time has elapsed to have an effect on outcomes. However, there was a difference in
the „profitability‟ dimension. ISO 22000 was perceived to have contributed to large increase
in probability for IDP. IDP adopted the system earlier than DLM, and IDP‟s supply chain
was simpler than those of DLM, which may explain this result. Regarding the impact of ISO
22000 on operational performance after adopting this system, DLM was perceived to have
unchanged production costs and deliveries dimensions, but a decrease of cycle time. HNM
was perceived to have some increase in production costs, fast deliveries, and cycle time. This
is explained by the observation that the company has just introduced this system, and high
administration costs raise production costs. Practical implementation is also complex. IDP
was perceived to have a decrease of production costs, and cycle time, and an increase of
perceived quality dimension. One reflection on this is that the company adopted this system
earlier than two prior cases.
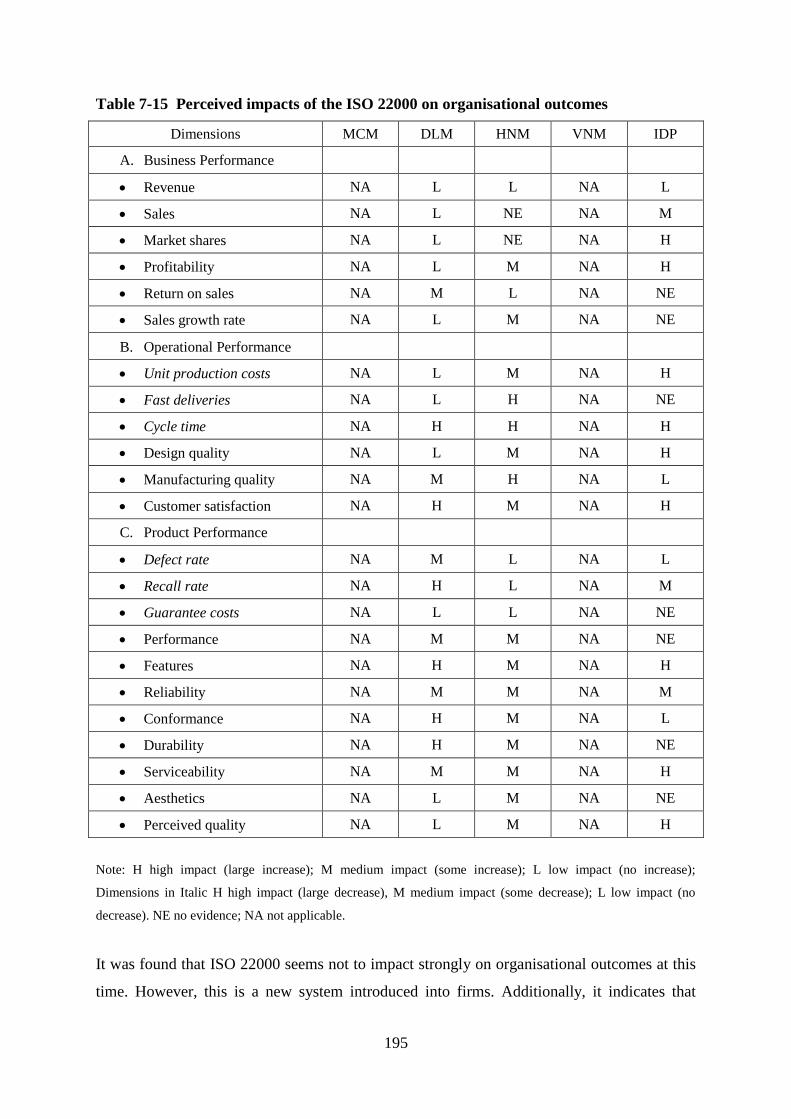
195
Table 7-15 Perceived impacts of the ISO 22000 on organisational outcomes
Dimensions MCM DLM HNM VNM IDP
A. Business Performance
Revenue NA L L NA L
Sales NA L NE NA M
Market shares NA L NE NA H
Profitability NA L M NA H
Return on sales NA M L NA NE
Sales growth rate NA L M NA NE
B. Operational Performance
Unit production costs NA L M NA H
Fast deliveries NA L H NA NE
Cycle time NA H H NA H
Design quality NA L M NA H
Manufacturing quality NA M H NA L
Customer satisfaction NA H M NA H
C. Product Performance
Defect rate NA M L NA L
Recall rate NA H L NA M
Guarantee costs NA L L NA NE
Performance NA M M NA NE
Features NA H M NA H
Reliability NA M M NA M
Conformance NA H M NA L
Durability NA H M NA NE
Serviceability NA M M NA H
Aesthetics NA L M NA NE
Perceived quality NA L M NA H
Note: H high impact (large increase); M medium impact (some increase); L low impact (no increase);
Dimensions in Italic H high impact (large decrease), M medium impact (some decrease); L low impact (no
decrease). NE no evidence; NA not applicable.
It was found that ISO 22000 seems not to impact strongly on organisational outcomes at this
time. However, this is a new system introduced into firms. Additionally, it indicates that
196
complicated characteristics of the system in organisation and its procedures. Even though the
system focuses on ensuring safety in the supply chain, rather than just in the plant, in this
study, it was observed that there was no trace of diffusion of the system along the supply
chain at the moment, no indication of an association between company and certified
suppliers. This finding contrasts with prior research that indicated that ISO 22000 contributed
to an increase in sales in firms in the service sector (Bilalis et al., 2009). However, maybe this
system has a higher effect in the service sector than food sector. One piece of research
showed that ISO 22000 led to an increase of safety and quality rather than other measures
(Mamalis et al., 2009).
7.1.5.4 Comparisons of impact of particular QA systems
Qualitative results indicate that changes of organisational outcomes resulted from QA
systems. According to feedback from top management, it was noted that ISO 9000 and
HACCP “…creates an opportunities for all employees and managers to have quality strategy
in business. Revenue this year increases more than past year…” (MCM-p1). This indicates
that QA systems may have benefited firms with respect to behaviours and culture, in terms of
quality philosophy and understanding of this. In addition, firms achieved business
improvements over time. This is shown in comments on DLM and HNM“… improving
business state, …raising skills and senses of employee staff in quality and quality culture …”
(DLM-p1), “…increasing turnover in past three years, improving position of the company on
the market, improving behaviours of employee toward quality and safety…” (HNM-p1).
Also, a QA system helps firms to improve in production processes and save costs when
defect rates fall“…changes in revenues of the company over years are real…”; “…ratio of
defects, waste in production process is reduced more than before…[HACCP]…improving
satisfaction on our products from customers …[ISO9000]” (VNM-p1); “…situation of
business and production has been improved, revenue in later year increased more than past
years…”(IDP-p1). It may be concluded that companies benefitted from QA systems,
especially from improvement in business performance and change of behaviour and attitude
of employees and staff in their understanding of quality.
There were differences perceived organisational outcomes between cases after implementing
QA systems. However, there appears a trend showing positive an impact of QAS‟s on
organisational outcomes. For example, it was found that HACCP had a perceived impact on
197
business performance, which was shown through a perceived increase in sales of the firms
after adoption. On the other hand, the perceived impact of ISO 9000 and ISO 22000 was not
uniform across cases. HACCP and ISO 9000 had clearer impacts on business performance
than did ISO 22000.
With respect to the perceived impact of QA systems on business performance, regardless a
size of firm, HACCP benefited firms in respect to improving business performance. Variation
of perceived benefits that firms obtained after adoption of this system may be explained by
different organisational and management efforts to implement this system in plants.
Perceived benefits from the introduction of ISO 9000 were similar to HACCP in some
respects. In particular, business performance was perceived to improve. However, there were
differences, which may stem from ISO 9000 having a focus on good leadership within
companies. In comparison with ISO 22000, HACCP and ISO 9000 were adopted by firms, so
their impacts on organisational outcomes appeared to be clearer and significant, while ISO
22000 seems not to have impacted strongly on organisational outcomes at the moment
because it is a new system introduced into dairy firms with some complicated characteristics.
7.2 Key Insights
The cross-case analysis gave insight into quality assurance and adoption of QAS‟s by dairy
processing firms in Vietnam. This section focuses on interrelationships of quality assurance,
and adoption of QAS‟s, motivations, influenced factors and organisational outcomes, and the
insights that emerge from these.
7.2.1 Emerging economies and food quality management
Much research on issues related to quality management has been conducted on developed
country issues; however, such research is scare in emerging countries, where food quality is
only now beginning to be recognised as important issue, and paid attention to by consumers
and functional agencies. This study on the adoption of QAS‟s in the dairy processing sector
in Vietnam gives some insight into quality management in high growth, emerging countries
and so helps to fill this gap.
198
Vietnam is an emerging country and has rapidly growing income, population, and so has an
increasing demand for food and higher quality food, including dairy products. Not
surprisingly, the introduction of QAS‟s into businesses is linked to establishing a competitive
position in this growing market. However, in a more static market place, a focus on
maintaining market position and reducing costs might be associated with the introduction of
QAS‟s. As this emerging market grows, embedding a quality strategy within the business
strategy of companies is important as companies cope with stronger competitions in the
powdered milk segment, and more products are imported and distributed by foreign
distributors in domestic markets.
However, an additional feature of Vietnam as an emerging economy is that the country is
characterised as a market economy but with a planning orientation. This means intervention
of the State in both direct and indirect ways, in businesses and their environment. This
includes dairy companies, where some companies have a major State share, such as Vinamilk
and Moc Chau. This State involvement affects the company strategies, and also supports
these companies in seeking competitive advantage over other rivals in dairy markets.
7.2.1 The lead role of processing companies in quality assurance
In developed countries, quality can be assured along the entire supply chains to supply safe
and quality food to consumers. It can involve all actors in these chains because of the large
scale in production and manufacture at each stage of the chain. Such whole chain quality
assruance can create barriers to entry. In addition, processors also have a powerful role in
such chains, which contributes to mobilising other actors and maintaining the supply and
distribution relationships for suppliers certified with QAS‟s.
In contrast, in Vietnam, quality assurance is observed and emphasised in processing plants,
but less so in other parts of the supply chain. These are several reasons for this, but the
principal reason is very fragmented management along the chain, without a whole chain
focus. The processing companies are only just adopting QAS‟s, either compulsorily or
voluntarily within their plants. Thus quality seems to be only better controlled and addressed
in this processing and manufacturing stages, and these companies are in a position to play a
lead role in diffusing quality up and down the chain.
199
In this respect, some companies have integrated their operations both forward and backward,
which will allow them greater control over the chain, including quality control. In addition,
government is playing a key role in quality assurance since it sets national standards, supports
processors (e.g. small and medium scale companies) and farmers in the processors‟ chains.
Therefore, a key challenge for emerging economies is how to support and manage the process
of assuring quality along the entire chain, recognising the key role of processors in this task.
7.2.2 Assurance of quality and perceived organisational outcomes
Lack of quality assurance along the chain can be linked to claims of unsafe dairy products.
The weakest parts of the supply chain are distribution of end products and the supply
(collection) of raw milk. In addition, quality within processing firms is assured only to
minimum levels. Despite this appearently low level of quality assurance, within firms,
perception of perceived organisational outcomes seems to be more optimistic, especially with
respect to business performance. This is consistent with operating in a rapidly growing,
emerging economy, where quality concerns start to increase as consumers have increasing
income and more understanding of quality than before. As noted previously, QAS‟s can then
become marketing tools and quality labels that attract buyers. Other perceived outcomes,
such as operational and quality performance, were more mixed. This reflects the newness of
QA in Vietnam, the external rather than internal focus of QAS‟s and the minimum level of
application of QA systems within firms.
In an emerging economy, it might be concluded that firms are moving towards quality
assurance. This contrasts to the situation in more developed economies where the focus will
be more on refinement of QAS‟s. This indicates that challenges in quality assurance are quite
different in these different contexts.
7.3 Conclusions
7.3.1 Research contribution
7.3.1.1 Contributions to the literature
The contribution of this research to the literature arises from the development and use of a
multi-perspective model that links motivation, factors influencing the adoption of QAS‟s, and
perceived outcomes for processing firms within the broader supply chain. The application of
this model was to an emerging economy context.
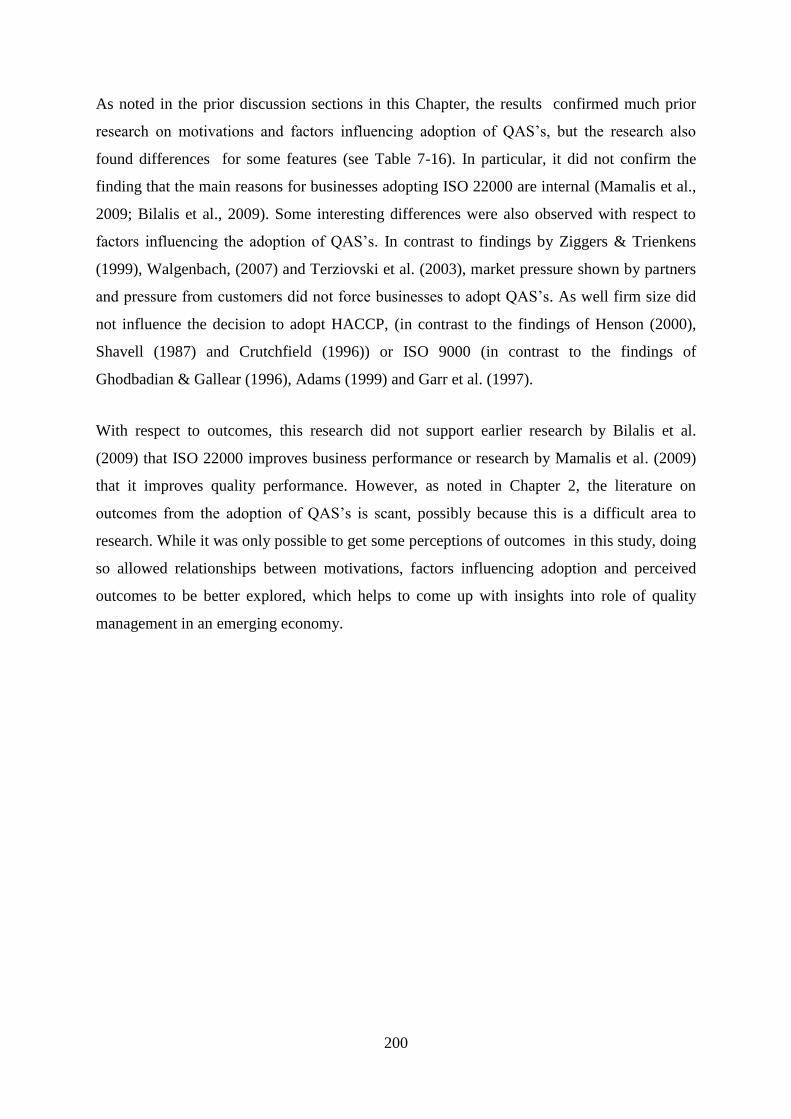
200
As noted in the prior discussion sections in this Chapter, the results confirmed much prior
research on motivations and factors influencing adoption of QAS‟s, but the research also
found differences for some features (see Table 7-16). In particular, it did not confirm the
finding that the main reasons for businesses adopting ISO 22000 are internal (Mamalis et al.,
2009; Bilalis et al., 2009). Some interesting differences were also observed with respect to
factors influencing the adoption of QAS‟s. In contrast to findings by Ziggers & Trienkens
(1999), Walgenbach, (2007) and Terziovski et al. (2003), market pressure shown by partners
and pressure from customers did not force businesses to adopt QAS‟s. As well firm size did
not influence the decision to adopt HACCP, (in contrast to the findings of Henson (2000),
Shavell (1987) and Crutchfield (1996)) or ISO 9000 (in contrast to the findings of
Ghodbadian & Gallear (1996), Adams (1999) and Garr et al. (1997).
With respect to outcomes, this research did not support earlier research by Bilalis et al.
(2009) that ISO 22000 improves business performance or research by Mamalis et al. (2009)
that it improves quality performance. However, as noted in Chapter 2, the literature on
outcomes from the adoption of QAS‟s is scant, possibly because this is a difficult area to
research. While it was only possible to get some perceptions of outcomes in this study, doing
so allowed relationships between motivations, factors influencing adoption and perceived
outcomes to be better explored, which helps to come up with insights into role of quality
management in an emerging economy.
201
Table 7-16 Comparison of results of current study with some previous research
Topics Findings Authors Did current
study confirm
findings
Motivation
to adopt
QAS‟s
Main reason for businesses adopting HACCP is
that is requirement of buyers in export markets
Bilalis et al., 2009; Henson et al.
1998 ; Hobb et al., 2002; Zaibet,
2000
Yes
Main reason for businesses adopting ISO 9000
is that is improving competitive advantage
Curcovic, 1999; Withers &
Ebrahimpour, 2000; Terziovski,
2003
Yes
Main reasons for businesses adopting ISO 22000
are internal.
Mamalis et al., 2009 ; Bilalis et
al. 2009
No
Factors
influencing
adoption of
QAS‟s
Legal factor strongly influences adoption of
HACCP, but has less influence to other QAS‟s
Henson, 2010, Caswell, 2003; Jin
et al. 2008; Hooker et al.,
2002 ;Henson & Heasman, 1999.
Yes
Market pressure shown by partners and pressure
by customers forces businesses to adopt QAS‟s
Ziggers & Trienkens, 1999 ;
Walgenbach, 2007; Terziovski et
al., 2003.
No
External support considered important to SME
to adopt QAS‟s
Aggelogiannopoulos et al., 2007 Yes
Firm size influences decision to adopt HACCP Henson, 2000 ; Shavell, 1987 ;
Crutchfield, 1996 ;
No
Firm size influences decision to adopt ISO 9000 Ghodbadian &Gallear, 1996 ;
Adams, 1999 ; Garr et al., 1997
No
Governance structure influencing in adoption of
QAS‟s
Moch & Morse, 1977; Zmud,
1982
Yes
Top management support influencing adoption
of QAS‟s
Thompson, 1965; Daft & Becker,
1978;
Yes
Impact of
QAS‟s on
organisatio
nal
outcomes
HACCP improves business performance, Khatri & Collin, 2007; Taylor,
2001; Romano et al., 2004
Yes
HACCP improves operational performance Khatri & Collin, 2007; Yes
HACCP improves quality performance Trienkens & Zuubier, 2008; Yes
ISO9000 improves business performance Anderson et al., 1999; Corbett et
al., 2005 ; Terziovski et al., 2003.
Yes
ISO 9000 improves operational performance Withers & Ebrahimpour, 2000;
Curkovic, 1999.
Yes
ISO 9000 improves quality performance Withers & Ebrahimpour, 2000; Yes
ISO 22000 improves business performance Bilalis et al., 2009 No
ISO 22000 improves operational performance No prior research observed. -
ISO 22000 improves quality performance. Mamalis et al., 2009. No
A key contribution to the literature of this research was the influence of external factors in the
establishment and improvement of QAS‟s in an emerging economy. That is, quality
management is occurring within the context of a rapidly growing economy, where population
incomes are growing. QAS‟s are being put in place as a market positioning device and with
the sanction and support of government. As a result, the key perceived outcomes will relate to
business performance.
202
7.3.1.2 Operational and policy implications
This research on quality assurance and adoption has some concrete policy implications.
Results obtained from the research revealed that QAS adoption along the chain is fragmented
with different systems and standards seen at different points in the chain. It was also seen that
the processors are playing a key lead role and other parts of the chain have weak quality
assurance, such as collectors and distributors/retailers.
Government and its functional organisations have a key role to play to strengthen quality
management in dairy supply chains, in order to reduce the loss to society that may result from
unsafe dairy products. It can do this in a number of ways.
Government can strengthen inspection and auditing of QAS‟s to ensure compliance through
frequent inspection. At present, adherence to standards is minimal, and government can lift
the adherence to standards to approach best practice internationally, and accept the challenge
of eliminating any constraints associated with the implementation of QAS‟s at all stages of
the chain. It can also assist with training staff in the certification bodies. It should pay
attention to statutory and regulatory requirements, administrative procedures and other
requirements that could negatively impact on QAS‟s adoption.
As processing firms are key firms in the chain, government should work with them to diffuse
quality up and down the chain, in order to ensure that dairy products satisfy the increasing
and higher quality demand of its consumers. Likewise, it should continue to work with other
parts of the chain on quality management. For example, extending its efforts to small farmers
as well as continuing to work with larger farmers. It also needs to look at collection and the
distribution/retail level and how it can get cost effective quality management in the chain.
Government also has a role in harmonising standards along the chain, especially harmonising
Vietnamese standards (TCVN) with international standards. This will require input by its
functional departments and related Ministries, including the Ministry of Science and
Technology, which could be considered the host and focal point of this effort. In
collaboration with the Department of Science and Technology, and the Department of
Quality Assurance for Agricultural Products of the Ministry of Agriculture and Rural
203
Development, they could research and issue standards and introduce these to dairy firms and
their supply chains.
The government could also contribute to raising consumers‟ awareness of the importance of
quality products, and so strengthen their position in these supply chains. It has a role in
providing public media campaigns. It can also raise the profile of Vietnam‟s emerging quality
status in overseas markets. This could include researching solutions to any trade-related
issues and conflicts relating to quality of dairy products, and ensuring that Vietnam‟s quality
standards for dairy products are aligned with international standards.
7.3.2 Limitations of the research
Although this research contributes to the literature on quality assurance and QAS‟s adoption,
and associated factors, it has some limitations. The first limitation is the selection of the
cases. The empirical research focused on five case studies. Although the research has yielded
interesting theoretical insights, the results cannot be extrapolated to the Vietnamese dairy
sector as a whole in any quantitative sense. However, it is worth highlighting that some of the
chains studied conduct a reasonable volume of business within the sector they belong to. This
increases the chances that the issues identified and studied here are important issues for the
Vietnamese dairy sectors.
A second limitation relates to the fact that the study has only investigated perceived
outcomes, rather than actual outcomes. However, these perceptions were compared to other
data and information from secondary sources, particularly historical data on the state of
businesses after adopting these QAS‟s. A related limitation may be the interviewees may not
be aware of actual outcomes and other aspects of QA systems. In addition, quality issues
relating to dairy products is sensitive information that could impact on public and consumer
perception, and so the reputation of the company. This places limitations on the depth
possible with results. This reliance on the perceptions of respondents is an unavoidable bias
although the author used multiple data sources and triangulation where possible. Despite this
limitation, key theoretical findings were able to be made.
The research has been conducted in the context of an emerging economy. However, Vietnam
may not be representative of other emerging economies because of its planned system, which
means that government can play a strong focused role. Despite this difference, there are other
features, such as rapid growth, that are consistent with other emerging economies.
204
7.3.3 Suggestions for future research
The limitations of the research give rise to a number of suggestions for further research.
Further quantitative research covering a larger representative sample of dairy processing
companies, farmers, collectors, and retailers/distributors could explore regression
relationships between factors that were constructed in the theoretical model in this research.
Also, based on the development of the current research, empirical research looking on
whether perceived outcomes matches realised outcomes for multitude QAS‟s would be
interesting in the operational and quality management area. In addition, extending the
research linking motivations, factors influencing adoption and outcomes to other emerging
economies would be meaningful.
7.3.4 Implications of the research
In Vietnam, government directly and indirectly supports domestic businesses, including dairy
businesses. It was shown in this study that Government has a vital role in promoting QA in
dairy companies that are producing and manufacturing safe dairy products to serve domestic
markets. The State-owned companies received both indirect support, as well as direct support
through State investment, while privately owned businesses received indirect support, mainly
through programs to enhance quality, such as adoping QAS‟s in plants. This finding
illustrates the role that government can play in encouraging businesses to adopt QAS‟s. The
adoption of QAS‟s can then begin the process of raising the competitive advantage of
domestic enterprises relative to foreign companies in Vietnam, and increasing their ability to
integrate into the global economy.
Foreign-owned companies entering the Vietnam market can play a role in upgrading quality.
Notonly do they bring advanced technologyand management skills, but also transmit ideas on
quality to domestic firms. For example, DLM is a foreign-owned company, which had or
gained registered international quality certifications – HACCP, ISO 9000 and ISO 22000 –
when it entered the country. It continues to update these certifications. This places pressure
on its competitors, which are then forced to imitate it, in order to compete.
With respect to ownership structure, most of the surveyed companieswere organised as joint
stock companies, so ultimate power resides with shareholders, who express this at their
annual meeting, where they give their opinions about development strategy, and quality
205
strategy, as well as moderating activities of top management. The results of the research did
not give a lot of guidance on whether some ownership structures might enhance quality better
than others. However, with respect to management structure, the Directors Board played a
larger role in some companies than others. For example, some positions were held by one
person, such as Chairperson of the Supervisors Board in combination with general Director.
In such a situation, his/her leadership style may be very conducive to introducing and
maintaining QA programs. The research found that the activities of management boards; for
example, in re-structuring the QA department (HNM), strengthening internal training and
reducing intermediaries in milk procurement (DLM), changing management structure and
supporting downstream actors (VNM), have all contributed to improved QA for dairy
products.
The dairy companies investigated have differences in their historical development. In
particular, some companies, such as MCM and VNM, have a long history, and have
experienced more stages in their development than other companies. Prior to the 1990s, most
companies operated in a highly planned economy, and at that time, quality perhaps was not
so important. However, today, in a market economy, quality seems to be a decisive
competitive factor for businesses in order to gain market share. In this context, VNM is State-
owned, and occupies the greatest market share in both milk distribution and procurement.
This means that companies that enter the market later have to formulate specific business
strategies, so that they can survive and prosper in the market. For example, one product
strategy is operating in a „niche market‟. Thus, a situation is observed where VNM exploits it
strengths by focussing on dairy powder and fresh milk with flavours, while HNM sees its
competitive advantage in stirred yoghurt. MCM is recognised for 100% fresh milk, and have
implemented a quality strategy, where they rapidly gained QA certification, and organised a
vertically integrated supply chain appropriate for this, thus reducing any reliance on other
actors outside their own firm, since they cannot control quality for these actors.
206
LIST OF REFERENCES
Achterbosch, T., & Tongeren, van F. (2002). Food safety measures and developing countries:
Literature overview. The Hague, the Netherlands: LEI Agricultural Economics
Research Institute. Retrieved March 12, 2010, from
http://www.lei.dlo.nl/wever/UK/Research%20Areas/FoodSafetyDCs.pdf
Adams, M. (1999). Determinants of ISO accreditation in the New Zealand manufacturing
sector. Omega, 27, 285-292.
Aggelogiannopoulos, D., Drosinos, E. H., & Athanasopoulos, P. (2007). Implementation of a
quality management system (QMS) according to the ISO 9000 family in a Greek
small sized winery: a case study. Food Control, 18 (2007), 18,1077-1085.
Agroviet. (2009). Dairy cattle production and development plan for 2002 -2010. Retrieved
April 10, 2009, from http:// www.agroviet.gov.vn/dairysector
Akey. (2004). Dairy Newsletter. Retrieved January, 2009, from
http://www.akey.com/ruminant/dairy/pdf%20dairy%20newsletters/2004_04_augsept_
dairy_newsletter.
Ambdk. (2009). Food safery and hygiene control. Retrieved November 3, 2009, from
http://www.ambhanoi.um.dk/en/menu/CommercialServices/MarketOpportunities/Sect
or+Analysis/Food+safety+and+hygiene+control/
Anderson, M., & Sohal, A. S. (1999). A study of the relationship between quality
management practices and performance in small businesses. International Journal of
Quality and Reliability Management, 16 (9), 859-877.
Anderson, S. W., Daly, J. D., & Johnson, M. F. (1999). Why firms seek ISO 9000
certification: Regulatory compliance or competitive advantage? Production and
Operations Management, 8(1), 28-43.
Antle, J. M. (1996). Efficiency food safety regulation in the food manufacturing sector.
American Journal of Agricultural Economics, 78, 1242-1247.
Antle, J. M. (1999). Benefits and costs of food safety regulation. Food Policy, 24(6), 605 –
623.
Askey, J. M., & Dale, B. G. (1994). From ISO 9000 series registration to total quality
management: an examination. Quality Management Journal,1(4), 67-76.
ASQ (American Society of Quality). (2002). Quality glossary. Quality Progress, 35 (7), 43-
44.
207
Badri, M. A., & Davis, D. (2000). Operations strategy, environment uncertainty and
performance: a path analytic model of industries in developing countries. Omega,
28(2), 155-173.
Baines, R., & Manley, W. (1999). Implications of food assurance on UK primary producers.
RICS research conference ROOTS‟ 99. Royal Institution of Chartered Surveyors.
Bao Viet Securities Company. (2009). Vinamilk. Analysis report. HCMC: Bao Viet Securities
Company.
Baomoi.com. (2012). IDP open Ba Vi grass demonstration field. Retrieved December 12,
2012, from http://www.baomoi.com/Khanh-thanh-trai-bo-sua-va-dong-co-mau-Ba-
Vi/45/8008568.epi
Baron, B., & Baron, P. B. (1980). A regulatory compliance model. Journal of Contemporary
Business, 9(2), 139-150.
Barwise, P. (2002). How much do CEOs and top managers matter in strategic decision-
making?. British Journal of Management, 13(1), 83-95.
Beekhuis-Gibbon, L., Whyte, P., O‟Grady, L., More, S. J., & Doherty, M. L. (2011). A
HACCP-based approach to mastitis control in dairy herds. Irish Veterinary Journal, 6,
1-2.
Beulens, A. J. M., Broens, D. F., Folstar, P., & Hofstede, G. J. (2003). Food safety and
transparency in food chains and networks, relationships and challenges. Food
Control, 16(6), 481-486.
Bilalis, D., Stathis, I., Konstantas, A., & Pasiali, S. (2009). Comparison between HACCP and
ISO 22000 in Greek organic food sector. Journal of Food, Agriculture and
Environment, 7 (2), 237-242.
Billones, R. G. (1999). Consumer and Farmer Perceptions of the New Zealand Dairy
Industry’s Image. Unpublished master‟s thesis, Massey University, Palmerston North,
New Zealand.
Bocker, A., Bredahl, M. E., & Northern, J. (2003). ISO 9000 certification in British
agribusiness: motivations and performance impacts. Proceedings of the 82nd
International European Seminar on Quality Assurance, Risk Management and
Environment Control in Agriculture of Food Supply Network (pp.51-60). Bonn,
Germany: International Seminar of the European Association of Agricultural
Economists.
Boiral, O. (2003). ISO 9000: outside the iron cage. Organisation Science, 14 (6), 720-737.
Briz, J., Nuria, A., Marian, G., Teresa, B., & Isabel, de F. (2006). Quality management and
improvement in the Spanish SME food industry: the adoption of ISO 9000. Paper
presented in the XI Congress of the EAAE, Copenhagen, Denmark, pp.1-14.
208
Buttle, F. (1996). An investigation of the willingness of UK certified firms to recommend
ISO 9000. International Journal of Quality Science, 1 (2), 40-50.
Canavari, M., Regazzi, D., & Spadoni, R. (1998). Evaluation of quality assurance systems in
the agri-food sector. Paper presented in the Sixth Joint Conference on Food,
Agriculture and the Environment, Minneapolis, Minnesota, USA, pp.1-17.
Cao, K. Q. T. T. (2007). An Economic Analysis of Hazard Analaysis of Critical Control Point
–Based Risk Management Programme in the New Zealand Meat Industry .
Unpublished doctoral thesis, University of Waikato, Waikato, New Zealand.
Capmany, C., Hooker, N. H., Ozuna, T. Jr., & van Tilburg, A. A. D. (2000). ISO 9000 – a
marketing tool for US agribusiness. International Food and Agribusiness
Management Review, 3(1), 41-53.
Casadesus, M., Heras, I., & Ochoa, C. (2000). The benefits of the implementation of the ISO
9000 normative: empirical research in the Spanish companies. Paper presented in the
Fifth World Conference on Production and Operations Management, Seville, Spain,
pp.1-10.
Caswell, J. A., & Henson, S. J. (1997). Interaction of private and public food quality control
systems in global markets. In R.L. Loader, S.J. Henson & W.B. Trail (Eds.),
Globalisation of the food industry: policy implications (pp. 217-236). Reading, UK:
Department of Agricultural and Food Economics, the University of Reading.
Caswell, J. A., & Hooker, N. H. (1996). HACCP as International trade standard. American
Journal of Agricultural Economics, 78(3), 775-779.
Caswell, J. A., & Johnson, G. V. (1991). Firm strategic response to food safety and nutrition
regulatory. In J.A. Caswell (Ed.), Economics of food safety (pp. 273-297). New York:
Elsevier.
Caswell, J. A., Bredahl, M. E., & Hooker, N. H. (1998). How quality meta-systems are
affecting the food industry. Review of Agricultural Economics, 20(2), 547-557.
Celaya, C., Zabala, S.M., Perez, P., Medina, G., Manas, J., Fouz, J., Alonso, R., Anton, A., &
Agundo, N. (2007). The HACCP system implementation in small business of
Madrid‟s community 2007. Food Control, 18(10), 1314-1321.
Chakravarthy, B. S. (1986). Measuring strategic performance. Strategic Management Journal
7(September –October), 437-458.
Chau, P. Y. K., & Tam, K. Y. (1997). Factors affecting the adoption of open systems: an
exploratory study. MIS Quarterly, 21(1), 1-24.
Choi, B. (2002). Knowledge Management Enablers, Processes, and Organizational
Performance: an Integration and Empirical Examination. Unpublished doctoral
thesis, Korea Advanced Institute of Science and Technology, Korea.
209
Cole, R. J., & Somers, M. (1980). Business and government regulation: a theory of
compliance decisions. Journal of Contempory Business, 10(1), 143-53.
Cole, R.E. (1985). The macro politics of organizational change: a competitive analysis of the
spread of small group activities. Administrative Science Quarterly, 30, 560 - 585.
Commodity Product Quality Law( 2008). Vietnam National Assembly, pp.1- 362.
Corbett, C. J., Montes-Sancho, M. S., & Kirsch, D. A. (2005). The financial impact of ISO
9000 certification in the United States: An empirical analysis. Management Science,
51(7), 1046-1059.
Creswell, J. W. (1994). Research design: qualitative and quantitative approaches. Thousand
Oaks, CA: SAGE Publications.
Creswell, J. W., & Tashakkori, A. (2007). Developing publishable mixed methods
manuscripts Editorial. Journal of Mixed Methods Research, 1 (2), 107-111.
Crosby, P. B. (1980). Quality is free. New York: McGraw-Hill.
Curkovic, S., & Pagell, M. (1999). A critical examination of the ability of ISO 9000
certification to lead to a competitive advantage. Journal of Quality Management, 4(1),
1-17.
Daft, R., & Becker, S. (1978). Innovation in organization: innovation adoption in school
organisations. New York: Elsevier.
Dairyvietnam. (2009). Development of dairy sector in Viet Nam. Retrieved October 19,
2009, from http://www.dairyvietnam.org.vn.
Damanpour, F. (1987). The adoption of technological, administrative, and ancillary
innovations: impact of organizational factors . Journal of Management, 13(4), 675-
688.
Damanpour, F. (1991). Organizational innovation; a meta analysis of effects of determinants
and moderators. Academy of Management Journal, 34 (3), 555-590.
Dang, T.H. (2009). Milk price of Vietnam is the highest in the world. Retrieved June 19,
2009, from http://nhandan.org.vn/tinbai.
De Ruyter, K., & Scholl, S. (1998). Positioning qualitative marketing approach: reflelections
from theory and practice. Qualitative Market Research, 1(1), 7-14.
Decision 11/(2006)/QD-BYT. Ten high risk food groups. Ministry of Public Health, Hanoi,
Vietnam.
Deloitte & Touche. (1994). US firms see striking paybacks from ISO 9000 registration.
Quality Progress, (January), 26-27.
Deming, E. (1986). Out of crisis. Boston: MIT Press.
210
Deohar, S. Y. (2003). Motivation for and cost of HACCP in Indian food processing industry.
Ahmadabad, India: Indian Institute Management.
Dewar, R. D., & Dutton, J. E. (1986). The adoption of radical and incremental innovations:
an empirical analysis. Management Science, 36(2), 123-139.
Dinh, V. C. (2008). Dairy market and problems related to development of dairy production in
Vietnam. Retrieved September 15, 2008, from
http://www.dairyvietnam.org.vn/vi/publications.php?mnu=5&nid=120&type=1
DLH (Department of Livestock Husbandry). (2010). Development planning on livestock
sector by the year 2020 and vision 2030. Unpublished , Hanoi, Vietnam.
Dries, L., & Swinnen, J. F. M. (2004). Foreign direct investment, vertical integration and
local suppliers: Evidence from the Polish dairy sector. World Development, 32(9),
1525-1544.
Dumicic, K., Lazibat, T., & Matic, B. (2005). Quality system implementation and market
structure. Ekonomski Pregled, 56(9), 615-633.
Dutchlady (2010a). Annual report on production and business. Unpublished, Binh Duong,
Vietnam.
Dutchlady (2010b). Report of director board. Unpublished, Binh Duong, Vietnam.
Dutchlady company (2010). Overview of Dutch Lady Vietnam company. Retrieved April 7,
2011, from http://suanuoc.dutchlady.com.vn/gioi-thieu
Ebrahimpour, M., Withers, B., & Hikmet, N. (1997). Experiences of US and foreign-owned
firms: a new perspective on ISO 9000 implementation. International Journal of
Production Research, 37 (2), 567-576.
Eisenhardt, K. M. (1989). Building theories from case study research. Academy of
Management Review, 14 (4), 532-550.
Eklof, J. A., Hack, L. P., & Westlund, A. (1999). On measuring interactions between
customer satisfaction and financial results. Total Quality Management, 10 (12), 1233-
1246.
Etlie, J. E., Bridges, W. P., & O‟Keefe, R. D. (1984). Organisational strategy and structure
differences for radical versus incremental innovation. Management Science, 30(6),
682-695.
Faergemand, J., & Jespersen, FD. (2004). ISO 22000 to ensure integrity of food supply chain,
. ISO Management Systems ISO Insider Review, 4(September –October), 21-24.
FAO (Food and Agriculture Organisation). (1998). Food Quality and Safety Systems - A
Training Manual on Food Hygiene and the Hazard Analysis and Critical Control
Point (HACCP) System. Rome, Italy: FAO.
211
FAO (Food and Agriculture Organisation). (2009). Smallholder dairy development: Lessons
learned in Asia. Bangkok, Thailand: FAO regional office for Asia and Pacific.
FAO/WHO. (2003). Assuring food safety and quality: guidelines for strengthening national
food control systems. Joint FAO/WHO Publication. FAO Food and Nutrition Paper
76. Rome, Italy: FAO/WHO.
Faye, B., & Loiseau, G. (20022000). Sources of contamination in dairy supply chains and
approaches to quality control (pp.1-5). In E. Hanak, E. Boutrip, P. Fabre & M. Pinairo
(Eds.), Proceedings of the International Workshop on Food Safety Management in
Developing Countries CIRAD-FAO. Montpellier, France: International Workshop on
Food Safety Management in Developing Countries.
Fayouzi, H., Caswell, J. A., & Hooker, N. H. (2006). Motivations of fresh cut produce firms
to implement quality management systems. Review of Agricultural Economics, 28(1),
132-146.
Fearne, A., Hornibrook, S., & Dedman, S. (2001). The management of perceived risk in the
food supply chain: a comparative study of retailer- led beef quality assurance schemes
in Germany and Italy. International Food and Agribusiness Management Review, 4
(1), 19-36.
Ferguson, W. (1996). Impact of the ISO 9000 series standard on industry marketing.
Industrial Marketing Management, 25(4), 305-310.
Foodstuff Safety and Hygiene Ordinance 2003. Vietnam National Assembly, Hanoi,
Vietnam.
Forker, L.B., Vickery, S.K., & Drooge, S.L. (1996). The contribution of quality to business
performance. International Journal of Operations and Production Management,
16(8), 44-62.
Friesland Foods. (2006). Sustainability report 2006. Friesland foods N.V., the Netherland.
Retrieved 18 July, 2010, from
www.frieslandcampina.com/.../80B508C3934B439DBF747647D407ED...
FSC (First Securities Company). (2009). Analytic report on dairy industry. Unpublished, Ho
Chi Minh City, Vietnam.
Fueller, F. H., Huang, J., Ma, H., & Rozelle, S. (2006). Got Milk? The rapid rise of China‟s
dairy sector and its future prospects. Food Policy, 31 (6), 201-215.
Garr, S., Mak, Y. T., & Needam, J. (1997). Differences in strategy, quality management
practices and performance reporting systems between ISO accredited and non-ISO
accredited companies. Management and Accounting Research, 8(4), 383-403.
Garvin, D. (1984). What does „product quality‟ really mean? Sloan Management Review,
Fall, 25-28.
212
Garvin, D. (1987). Competing on the eight dimensions of quality. Harvard Business Review,
65(6), 101-109.
Geraedts, H. P. A., Montenarie, R., & van Jijk, P. P. (2001). The benefits of total quality
management. Computerized Medical Imaging and Graphics, 25(2), 217-220.
Ghodbadian, A., & Gallear, D. N. (1996). Total quality management in SMEs. Omega, 24(1),
83-106.
Glancey, K. (1998). Determinants of growth and profitability in small entrepreneurial firms.
International of Entrepreneurial Behaviour and Research, 4(1), 18-27.
Globalgap.org. (2012). Guides for global GAP. Retrieved November 13, 2012, from
http://globalgap.org.
GOV (Government of Vietnam). (2006). Decision No 43 adoption of national programme for
assuring food safety and hygiene by the year 2010. Retrieved November 2, 2009,
from http://www.chinhphu.vn/vanbanpq/lawdocs/QD43TTG.rtf?id=15671.
GSO (General Statistical Office). (2009). Statistics Yearbook. Hanoi, Vietnam: Statistical
Publishing House.
GSO (General Statistical Office). (2010). Statistics Yearbook. Hanoi, Vietnam: Statistical
Publishing House.
Guilhon, A., Martin, J. & Weill, M. (1998). Quality approaches in small or medium sized
enterprises: methodology and survey results. Total Quality Management, 9(8), 689-
701.
Gummesson, E. (2005). Qualitative research in marketing. European Journal of Marketing,
39 (3-4), 304-329.
Habubank Securities. (2009). Dairy industry report. Unpublished, Hanoi, Vietnam.
Hall, R. H. (2002). Organizations: Structure, Processes, and Outcomes (8th ed.). Upper
Saddle River, New Jersey: Prentice Hall.
Hanoimilk. (2009). Annual report of business and production. Unpublished, Vinh Phuc,
Vietnam.
Hashem, G., & Tann, J. (2007). The adoption of ISO 9001 standards within the Egyptian
context: A diffusion of innovation approach. Total Quality Management and Business
Excellence, 18 (6), 631-652.
Hassan, Z. A., Green, R., & Herath, D. (2009). An empirical analysis of the adoption of food
safety and quality practices in the Canadian food processing industry. Essay in honour
of Stanley R. Johnson. Retrieved October 1, 2009, from
http://www.bepress.com/sjohnson/art18.
213
Hatten, K. J., & Hatten, M. L. (1985). Some empirical insights for strategic marketers: the
case of beer. In H. Thomas & D. M. Gardner (Eds.), Strategic marketing and
management (pp. 275-292). Chichester: John and Sons Ltd.
Havnes, P. A., & Senneseth, K. (2001). Do networks work, panel study of firm growth
among SME network. Small Business Economics, 16(4), 293-302.
Henriques, I., & Sadorsky, P. (1996). The determinants of an environmentally responsive
firm: an empirical approach. Journal of Environmental Economics and Management,
30(3), 381-395.
Henson, S., & Heasman, M. (1999). Food safety regulation and the firm: Understanding the
process of compliance. Food Policy, 23(1), 9-23.
Henson, S., & Holt, G. (2000). Exploring incentives for adoption of food safety controls:
HACCP implementation in UK dairy sector. Review of Agricultural Economics,
22(12), 407-420.
Henson, S., & Northen, J. (1997). Public and private regulationof foodsafety: the case of the
UK fresh meat sector. In G. Schiefer & R. Helbig (Eds.), Quality management and
process improvement for competitive advantage in agriculture and food. Bonn:
University of Bonn.
Henson, S., Holt, G., & Northern, J. (1999). Costs and benefits of implementing HACCP in
the UK dairy processing sector. Food Control, 10(2), 99-106.
Heras, I., Casadesus, M., & Dick, M. P. G. (2002). ISO 9000 certification and the bottom
line: a comparative study of the profitability of Basque region companies. Managerial
Auditing Journal, 17 (1), 72-78.
Heras, I., Dick, M. P. G., & Casadesus, M. (2002). ISO 9000 registration impact on sales and
profitability: a longitudinal analysis of performance before and after accreditation.
International Journal of Quality and Reliability Management, 19(6), 774-791.
Herath, D., Hassan, Z., & Henson, S. (2007). Adoption of food safety and quality controls.
Do firm characteristics matter? Evidence from the Canadian food processing sector.
Canadian Journal of Agricultural Economics, 55(3), 299-314.
Herriot, R., & Firestone, W. (1983). Multisite qualitative policy research: optimizing
description and generalizability. Journal of Education Research, 12(2), 14-19.
Hobbs, J. E., Fearne, A., & Sprigss, J. (2002). Incentive structures for food safety and quality
assurance: an international comparison, Food Control, 13(2), 77-81.
Holber, N. B., & Speece, M. W. (1993). Pratical marketing research– an integrated global
perspective. Singapore: Prentice Hall.
Holleran, E., & Bredahl., M. E. (1997). Food safety, transaction costs and institutional
innovation in the British food sector. In G. Schiefer & R. Hillbig (Eds.), Quality
214
management and process improvement for competitive advantage in agriculture and
food. Bonn: University of Bonn.
Holleran, E., Bredahl, M. E. & Zaibet, L. (1999). Private incentives for adopting food safety
and quality assurance. Food Policy, 24(6), 669-683.
Holsapple, C. W., & Joshi, K. D. (2001). Organizational knowledge resources. Decision
Support Systems, 31(1), 39-54.
Hooker, N. H., Nayga, Jr. R. M., & Siebert, J. W. (2002). The impact of HACCP on cost and
product exit. Journal of Agricultural and Applied Economics, 34(1), 165-174.
Huyen, H. (2011). Marketing strategy of Dutch Lady Company. Report, Hanoi, Vietnam.
ICMSF. (1988). Microorganism in food 4, application of the Hazard Analysis Critical
Control Point (HACCP) system to ensure microbiological safety and quality. Oxford:
Blackwell Scientific Publications.
IDP (International Dairy Products company) (2009). Overview of IDP company. Retrieved
March 12, 2010, from http://www.IDP.com.vn
IDP (International Dairy Products company). (2008). Annual report on production and
business. Unpublished, Hanoi, Vietnam.
IDP (International Dairy Products company). (2009). Annual report on production and
business. Unpublished, Hanoi, Vietnam.
Ishikawa, K. (1986). Guide to quality control. New York: Kraus International Publications.
ISO (International Standardisation Organisation). (2008). Implementation guidance for ISO
9001: 2008. Geneva, Swiss: Secretariat of ISO/TC176/SC2.
Jaffee, S., & Masakure, O. (2005). Strategic use of private standards to enhance international
competitiveness: Vegetable exports from Kenya and elsewhere. Food Policy, 30(3),
316-333.
Jayasinghe - Mudalige, U., & Henson, S. (2004). Quantifying the impact of economic
incentives on firms‟ food safety responsiveness: the case of red meat and poultry
sector in Canada. A selected paper presented at the Annual American Agricultural
Economics Association Meeting, Denver, Colorado, August 1-4, 2004 (pp.1-28).
Jin, S., Zhou, J., & Ye, J. (2008). Adoption of HACCP system in the Chinese food industry: a
comparative analysis. Food Control, 19(8), 823-828.
John, A., Khan, H. T. A., Raeside, R., & White, D. (2007). Research methods for graduate
business and social science students. London: SAGE publications.
Johnson, G., & Scholes, K. (1997). Exploring corporate strategy (3nd ed.). New York:
Prentice Hall.
215
Jouve, J. L. (1994). HACCP as applied in the EEC. Food Control, 5(3), 181-186.
Juran, J. M., & Gryna F. M. (1970). Quality planning and analysis. New York: McGraw-Hill
Juran, J.M. (1982). Upper management and quality. New York: Juran Institute.
Juran, J.M. (1995). A history of managing for quality: the evolution, trends and future
directions of managing for quality. Milwaukee, WI: ASQ Quality Press.
Kannan, V. R., Tan, K., & Handfield, R. B. (1998). Managing competition, quality customer
relations, and the supply base, and its impact on firm. In Proceedings of the Decision
Science Institute (pp. 1259-1261). Las Vegas, Nevada, USA.
Karaman, A. D., Cobanoglu, F., Tunalioglu, R., & Ova, G. (2012). Barriers and benefits of
the implementation of food safety management systems among the Turkish dairy
industry. Food Control, 25 (2), 732-739.
Kauer, D., Prinzessin zu Waldeck, T. C., & Schäffer, U. (2007). Effects of top management
team characteristics on strategic decision making: shifting attention to team member
personalities and mediating processes. Management Decision, 45(6), 942-967.
Kaynak, H. (2003). The relationship between Total Quality Management practices and their
effects on firm performance. Journal of Operations Management, 21 (4), 405-435.
Khan, A. M., & Manopichetwanna, V. (1989). Innovative and non-innovative small firms:
type and characteristics. Management Science, 35(5), 597-606.
Khatri, Y., & Collins, R. (2007). Impact and status of HACCP in the Australian meat
industry. British Food Journal, 109 (5), 343-354.
Knaflewska, J., & Pospiech, E. (2007). Quality assurance systems in food industry and health
security of food. Acta Sci. Pol., Technol. Aliment, 6(2), 75-85.
Kramer, A., & Twigg, B. A. (1962). Fundamentals of quality control for food
industry.Westport: AVI Publishing Company Inc.
Krause, D. R., Pagell, M., & Curkovic, S. (1998). Purchasing strategy: an empirical analysis.
In Proceedings of the Decision Science Institute (pp. 1259-1261). Atlanta, USA:
Decision Science Institute.
Krause, D. R., Scannell, T. V., & Calantone, R. J. (2000). A structure analysis if the
effectiveness of buying firms‟ strategy to improve supplier performance. Decision
Sciences, 31 (1), 33-55.
Krieger, S., Schiefer, G., & de Silva, A. C. (2007). Costs and benefits in food quality systems:
concept and a multi criteria evaluation approach. Agricultural management,
Marketing and Finance working document, 22. Rome, Italy: FAO.
Kuei, C., & Madu, C. N. (2001). Identifying critical factors for supply chain quality
management. Asia Pacific Management Review, 6(4), 409-423.
216
Kuei, C., Madu, C. N., Lin, C., & Chow, W. S. (2002). Developing supply chain strategies
based on the survey of supply chain quality and technology management. The
International Journal of Quality and Reliability Management, 19(7), 889-901.
Le, T. N. (2005). Country paper of Vietnam. In M. Satin (Ed.), Quality enhancement in food
processing through HACCP (pp.172-176). Tokyo, Japan: Asian Productivity
Organisation.
Lieberson, S., & O‟Connor, J. F. (1972). Leadership and organizational performance: study
of large corporation. American Sociology Review, 37(2), 117-130.
Lima, M. A. M., Resende, M., & Hansenclever, L. (2000). Quality certification and
performance of Brazilian firms: an empirical study. International Journal of
Production Economics, 66(2), 143-147.
Lin, C., Chow, W. S., Madu, C. N., Kuei, C. H., & Yu, P. P. (2005). A structural equation
model of supply chain quality manangement and organizational performance.
International Journal of Production Economics, 96, 355-365.
Lincoln, Y. S., & Guba, E. G. (1985). Naturalistic inquiry. Beverly Hills, CA: Sage
Publications, Inc.
Lloyds Register Quality Assurance (1995). ISO 9000: setting standards for better business.
New Jersey: Hoboken.
Loc, V. T. T. (2006). Seafood supply chain quality management: The Shrimp supply chain
quality management perspective of seafood companies in Mekong Delta Vietnam.
Paper presented at the 7th International Conference in Agrifood chains and
Networks, Ede, Netherlands (pp.1-15).
Locke, L. F. (1987). Proposals that work: a guide for planning dissertation and great
proposals. Newbury Park, London: SAGE.
Luning, P. A., & Marcelis ,W. J. (2007). A conceptual model of food quality management
function based on a techno managerial approach. Trends in Food Science and
Technology, 18(3), 159-166.
Luning, P. A., & Marcelis, W. J. (2006). A techno managerial approach in food quality
management research. Trend in Food Science & Technology, 17(7), 378-385.
Luning, P. A., Bango, L., Kussaga, J., Jovira, J., & Marcelis, W. J. (2008). Comprehensive
analysis and differentiated assessment of food safety control systems: a diagnosis
instrument. Trends in Food Science and Technology,19(10), 522-534.
Luong, B. V. (2010). Vinamilk marketing strategy research. Unpublished undergraduate
thesis. University of Ho Chi Minh, Vietnam.
MacDonald, J. M., & Crutchfield, S. (1996). Modelling the costs of food safety regulations.
American Journal of Agricultural Economics, 78, 1285-1290.
217
Maldonado, E., Henson, S., Caswell, J., Leos, L., Maninez, P., Aranda, G., & Cadena, J.
(2005). Cost-benefit analysis of HACCP implement in the Mexican meat industry.
Food Control, 16(4), 375-381.
Maldonado-Siman, E., Ruiz-Flores, A., Nunez-Dominguez, R., Gonzalez-Alcorta, M., &
Hernandez-Rodriguez, B. A. (2009). Level of adoption of quality management
systems in Mexican pork industry. In D. Li & Z. Chunjiang (Eds.), Computer and
Computing Technologies in Agriculture II, Vol 3 (pp. 1747-1756). Boston: Springer.
Mamalis, S., Kafetzopoulos, D. P., & Aggelopoulos, S. (2009). The new food safety standard
ISO 22000. Assessment, comparison and correlation with HACCP and ISO
9000:2000. The practical implementation in victual business. Paper prepared for
presentation at the 113th EAAE seminar “A resilient European food industry and food
chain in a challenging world”, Chania, Crete, Greece. Retrieved December 13, 2012,
from http://ageconsearch.umn.edu/bitstream/58088/2/Mamalis.pdf
Manchester Business School. (1995). ISO 9000: does it work? Surrey: SGS Yarsley.
Marcus, A. E. (1984). The adversary economy. London, England: Quorum books.
MARD (Ministry of Agricultural and Rural Development). (2007). Vietnamese dairy sector
overview. Retrieved September 14, 2008, from http://www.agroviet.gov.vn
MARD (Ministry of Agricultural and Rural Development). (2008). Manual for implementing
Good Animal Husbandry Practices VietGAHP. Unpublished, Hanoi, Vietnam.
MARD (Ministry of Agricultural and Rural Development). (2009). Dairy cattle production
and development plan 2002 – 2010. Retrieved June 24, 2009 from
http://www.agroviet.gov.vn.
Martin, S. A., & Anderson, D. W. (2000). HACCP adoption in US food industry. In L. D.
Unnevehr (Ed.), The economics of HACCP: costs and benefits, (pp. 15-28). St Pault
Minnesota: Eagan Press.
Martinez-Costa, M., Martinez-Lorente, A. R., & Choi, T. Y. (2008). Simultaneous
consideration of TQM and ISO 9000 on performance and motivation: an empirical
study of Spanish companies. International Journal of Production Economics, 113
(1), 23-29.
Mayes, T. (1998). Risk analysis in HACCP: burden or benefit?. Food Control, 9 (2-3), 171-
176.
Maza, M. T., & Ramirez, V. (2003). Reasons for the implementation of ISO 9000 standards
and main achievements and modifications obtained in companies. Application in
Spanish agribusiness. In G. Schiefer & U. Rickert (Eds.), Proceedings of the 82nd
European Seminar on Quality Assurance, Risk Management, and Environmental
Control in Agriculture of Food Supply Network (pp. 61-70). Bonn, Germany:
European Seminar on Quality Assurance, Risk Management, and Environmental
Control in Agriculture of Food Supply Network.
218
Mazzoco, M. A. (1996). HACCP as a business management tool. American Journal of
Agricultural Economics,78(3), 770-774.
Meagal, S. T., & Taylor, W. A. (1997). Factors influencing a successful transition from ISO
9000 to TQM. International Journal of Quality and Reliability Management, 14 (2),
100-117.
Mehta, S., & Wilcock, A. (1996). Quality system standards in the Canadian food beverage
industry. Quality Management Journal, 4(1), 72-96.
Mekong Securities. (2009). Dairy industry Analytic report. Unpublished. Ho Chi Minh City,
Vietnam.
Miles, M. B., & Huberman, A. M. (1994). Qualitative data analysis (2nd ed.). Thousand
Oaks, California: Sage Publications.
Moc Chau Company. (2008). Annual report of production and business in 2008.
Unpublished. Moc Chau, Vietnam.
Moc Chau Company. (2009). Annual report of production and business in 2009.
Unpublished. Moc Chau, Vietnam.
Moc Chau Company. (2009). Overview of Moc Chau company. Retrieved October 12, 2009,
from http://www.mocchaumilk.com
Moc Chau Company. (2010). Overview of Moc Chau company. Retrieved August 10, 2010,
from http://www.mocchaumilk.com.
Moc Chau Company. (2011). Overview of Moc Chau company. Retrieved March 12, 2011,
from http://www.mocchaumilk.com.
MOI (Ministry of Industry and Commerce). (2008). Situation of implementing quality
management systems in business firms in Vietnam. Retrieved December 14, 2008,
from http://www.moi.gov.vn/News/detail.asp?Sub=10&id=18491
MOI (Ministry of Industry and Commerce). (2009). Development plan of dairy industry
Vietnam by the year 2020 and vision 2025. (in Vietnamese). Hanoi, Vietnam, pp.1-
154.
MOI (Ministry of Industry and Commerce). (2010). Master plan of dairy industry
development in Vietnam towards year 2020. Report. (in Vietnamese). Hanoi,
Vietnam, pp.1-247.
Morgan, R. E., & Strong, C. A. (2003). Business performance and dimensions of strategic
orientation. Journal of Business research, 56 (3), 163- 176.
Morse, J. M. (1991). Approaches to qualitative-quantitative methodological triangulation.
Nursing Research, 40(2), 120-123.
219
Motarjemi, Y., & Keferstain, F. (1999). Food safety Hazard analysis and critical control
points and the increase in foodborne disease: a Paradox? Food Control, 10 (4-5), 325
- 333.
Motarjemi, Y., & Mortimore, S. (2005). Industry need and expectations to meet food safety.
Food Control, 16 (6), 523-529.
Myers, M. D. (2009). Qualitative research in business and management. London: SAGE
Publications.
NACMCF. (1992). Hazard analysis and critical control point system. International Journal of
Food Microbiology, 16, 1-23.
Nancy, B. L, Luca, F., Patric, G., Trung, P. Q., & Dominic, S. (2006). Review, analysis,, and
dissemination of experienced in dairy production in Vietnam. Rome: FAO.
Naser, K. Y., Karbhari, M., & Mokhtar, Z. (2004). Impact of ISO 9000 Registration on
company performance evidence from Malaysia. Managerial Auditing Journal, 19 (4),
509 - 516.
Naveh, E., & Marcus, A. (2005). Achieving competitive advantage through implementing
and replicable management standard: Installing and using ISO 9000. Journal of
Operations Management, 24(1), 1-26.
Nganje, W. (1999). Assessing the Impact of Regulated HACCP on the Efficiency and
Profitibility of Meat Processing and Packing Sectors. Unpublished dissertation,
University of Illinois, USA.
Nguyen, T., Wilcock, A., & Aung, M. (2003). Food safety and quality systems in Canada:
An exploratory study. International Journal of Quality reliability Management,
21(6), 655-671.
Nguyen, A. P. (2007). Lessons learned studies: Case of Vietnam. Improved market access
and small holder dairy farmer participation for sustainable dairy development
(CFC/FIGMDP/16FT).Report FAO/CFC (pp.1-18). Retrieved June 16, 2009, from:
http://dairyasia.org/file/Information/Improved%20Market%20Access%20and%20Sm
all%20Dairy%20Farmers_Vietnam.pdf
Nguyen, A. P. (2009). Vietnam: the emergence of a rapidly growing industry in small holder
development: Lessons learned in Asia. Bangkok, Thailand: FAO.
NIAPP (National Institute of Agricultural Planning and Projection). (2010). Development
strategy for developing livestock by the year 2010 and 2020. Unpublished, Hanoi,
Vietnam, pp. 1-178.
NIAPP (National Institute of Agricultural Planning and Projection). (2007). Development
plan for dairy cow herd in Vietnam. Hanoi, Vietnam, pp. 1-252.
Papadakis, V. M., & Barwise, P. (2002). How much do CEOs and top managers matter in
strategic decision making? British Journal Management, 13(1), 83-95.
220
Patton, M. Q. (1990). Qualitative evaluation and research methods (2nd ed.). Newbury Park,
California: SAGE Publications.
Phan, T. G. T. (2007). Vietnam. In W. Vorley, A. Fearne & D. Ray (Eds.). Re-governing
markets: a place for small-scale producers in modern agri food chains? (pp. 125-
130). Hampshire: Gower Publishing Limited.
Pieniadz, A., & Hockmann, H. (2007). Incentive compatible pricing and quality adoption: the
case of the Polish dairy sector. Paper presented at the 104 th (joint) EAAE-IAAE
Seminar Agricultural Economics and Transition “ What was Expected What We
Observed the Lessons Learned”(pp.1-14). Budapest, Hungary: Corvinus University of
Budapest.
Pierson, M. D., & Corlett, D. A. Jr. (1992). HACCP: Principles and applications (2nd ed.).
New York: Van Nostrand Reinhold.
Pillay, V., & Muliyil, V. (2005). ISO 22000 Food safety management systems, the one
universal food safety management system standard that works across all other.
London, UK: SGS systems & certifications services. Retrieved fromMarch 14, 2010,
from http://uk.sgs.com/white_paper_ISO_22000_2.pdf.
Porter, M., & Keteis, C. (2003). UK competitiveness : moving to the next stage. Economic
Papers ESRC. Retrieved March 4, 2011, from
http://www.bis.gov.uk/files/file14771.pdf
Potter, N. N., & Hotchkiss, J. H. (1995). Food science (5th ed.). New York: Chapman and
Hall.
Premkumar, G., & Ramaurthy, K. (1999). The role of interorganizational and organizational
factors on the decision mode for adoption of interorganizational systems. Decision
Sciences, 26(3), 303-306.
Premkumar, G., & Roberts, M. (1999). Adoption of new information technologies in rural
small businesses. Omega, 27(4), 467-484.
Quazi, H. A., & Padibjo, S. R. (1997). ISO certification –a Singapore experience. The TQM
Magazine, 9 (5), 364-371.
Rao, S. S., Ragu-Nathan, T. S., & Solis, L. E. (1997). Does ISO 9000 have an effect on
quality management practices? An international study. Total Quality Management, 8
(6), 335-346.
Rayner, P., & Porter, L.J. (1991). BS 5750/ISO 9000: The experience of small and medium-
sized firms. International Journal of Quality & Reliability Management, 8(6), 16-28.
Redmond, E. C., & Griffith, C. J. (2003). Consumer food handling in the home: a review of
food safety studies. Journal of Food Protection, 66(1), 130 - 161.
Rocourt, J., Moy, G., Vierk, K., & Schlundt, J. (2003). The present state of foodborne disease
in OECD countries. Geneva: World Health Organisation, Food Safety Department.
221
Rogers, E. M. (1995). Diffusion of Innovations (4th ed.). New York: Free Press.
Romano, D., Cavicchi, A., Rocchi, B., & Stephani, G. (2004). Costs and benefits of
compliance for HACCP in Italian meat and dairy sectors. Retrieved 12 January, 2010,
from http://ageconsearch.umn.edu/bitstream/24983/1/sp04ro02.pdf
Romano, P. (2000). ISO 9000: What is its impact on performance? Quality Management
Journal, 7(3), 38-56.
Rugman, A. M., & Verbeke, A. (1998). Corporate strategies environmental regulations.
Strategic Management Journal, 19 (4), 363-375.
Rungtusanatham, M. J., Choi, T. Y., Hollingworth, D. G., Wu, Z., & Forza, C. (2003).
Survey research in operations management: historical analysis. Journal of Operations
Management, 21(4), 475-488.
Salaheldin, S. I. (2007). The impact of organizational characteristics on AMT adoption: A
study of Egyptian manufacturers. Journal of Manufacturing Technology Management,
18 (4), 443-460.
Saraph, J. V., Benson, P. G., & Schoroeder, R. G. (1989). An instrument for measuring the
critical factors of quality management. Decision Science, 20 (4), 810-829.
Seddon, J., David, R., Loughran, M., & Murrell, R. (1993). BS 5750 Implementation and
value added: a survey of registered companies. Buckingham, UK: Vanguard
Consulting Ltd.
Shavell, S. (1987). Economic analysis of accident law. Cambridge, M.A: Havard University
Press.
Sikora, T., & Strade, T. (2006). Safety and quality assurance, and management systems and
management in food industry. Retrieved June 13, 2010, from
http://www.ip.aua.gr/Studies/Sikora-Strada_final.pdf
Silverman, D. (2001). Interpreting qualitative data: Method for analyzing talk, text and
interaction (2nd ed.). London: Sage.
Simmons, B.L. (1999). The relationship between ISO 9000 and business performance: Does
registration really matter? Journal of Management Issues, 11 (3), 330-343.
Sissell, K. (1996). Survey rates ISO 9000 success. Chemical Week, 158, 33.
Skrabec, R., Quentin, Jr., Ragu-Nathan, T. S., Rao, S. S., & Bhatt, B. T. (1997). ISO 9000:
Do the benefits outweigh the costs?. Industrial Management, 39(6), 26-33.
Somers, R., Hoang, K. G., Smis, T., & Verle, P. (2008). Re-empower paused dairy
development in Vietnam. Hanoi, Vietnam: Vietnam Belgium Dairy Project.
Spencer, B. (1994). Models of organization and total quality management: a comparison and
critical evaluation. Academy of Management Review, 19(3), 446-471.
222
Sperber, W. H. (1998). Future developments in food safety and HACCP. Food Control, 92
(2-3), 129-130.
Spiegel, M. van der. (2002). Measuring Effectiveness of Food Quality Management. Doctoral
dissertation, University of Wagenningen, the Netherland.
Spriggs, J., Hobbs, J., & Fearne, A. (2000). Beef producers attitudes to coordination and
quality assurance in Canada and the UK. International Food Agribusiness Review, 3,
95-109.
STAMEQ (Directorate for Standards, Metrology and Quality). (2008). Present state of
quality registration in Vietnam. Retrieved November 21, 2008, from
http://www.stameq.gov.vn
Staw, B. M., & Epstein, L. D. (2000). What bandwagons bring: effect of popular
management techniques on corporate performance, reputation, and CEO pay.
Administrative Science Quaterly, 45(3), 523-556.
Stigler, G. (1971). The theory of economic regulation. Bell Journal Economics and
Management Science, 2(1), 3-21.
Strandskov, J. (1999). Sources of competitive advantage and business performance in
European meat processing industry. MAPP working paper No. 63, Aarhus:Aarhus
School of Business.
Sultan, F., & Chan, L. (2000). The adoption of new technology: the case of object-oriented
computing in software companies. IEEE transactions on Engineering Management
47(1), 106-126.
Sumner, J. (1995). A guide to food quality assurance. Deviot, Australia: M& S Food
Consultants Pty Ltd.
Sun, H. (1999). Diffusion and contribution of total quality management: an empirical study in
Norway. Total Quality Management, 10(6), 901-914.
Surak, J. G., & Simpson, K. E. (1994). Using ISO 9000 standards as a quality
framework. Food Technology, 48(9), 63-64.
Suzuki, K. (2005). Investigation into the constraints to Dairy Cattle Health and Production in
Northern Vietnam. Doctoral Thesis, The Royal Veterinary College University of
London, UK.
Talbot, V. (2007). ISO 22000 standard: A food safety standards in the food industry,
developments and challenges. International Journal of Production Economics, 113
(1), 107-122.
Taylor, E. (2001). HACCP in small companies: benefits or burden? Food Control, 12, 217-
222.
223
Taylor, E., & Kane, K. (2005). Reducing the burden of HACCP on SMEs. Food Control,
16(10), 833-839.
Teo, T. S. H., & Raganathan, C. (1998). An empirical study of adopter and non adopter of the
internet in Singapore. Information and Management, 34(6), 339-345.
Terlaak, A., & King, A. (2006). The effect of certification with the ISO 9000 quality
management standard: a signaling approach. Journal of Economic Behaviour and
Organization, 60 (4), 579-602.
Terziovski, M., Samson, D., & Dow, D. (1995). The impact of ISO 9000 certification on
customer satisfaction. Asia Pacific Journal of Quality Management 4, 66-68.
Terziovski, M., Samson, D., & Dow, D. (1997). The business value of quality management
systems certification. Evidence from Australia and New Zealand. Journal of
Operations Management, 15(1), 1-18.
The Asia Business News (2009, November 14). Asia dairy production, p1. Hanoi, Vietnam.
The Decision 11/2006 QD-BYT. ( 2006). On the 10 high risk foods groups regulation.
Ministry of Public Health. Hanoi, Vietnam.
The Law on the Quality of Products and Goods (2008). Vietnamese National Assembly,
Hanoi, Vietnam.
The Ordinance on the Hygiene and Safety of Foods (2003). Vietnamese National Assembly,
Hanoi, Vietnam.
Thompson, V. A. (1965). Bureaucracy and innovation. Administrative Science Quarterly, 10
(June), 1-20.
Tornatzky, L. G., & Fleischer, M. (1990). The process of technological innovation.
Lexington, MA: Lexington books.
Trienekens, J. (2006). Impact of quality standards on food chains: comparison of three
regions. IAMA symposium 2006. Retrieved October 11, 2010, from
http://www.webalice.it/andrea.marescotti/.../3-1-Standards/2006_Trienekens.pdf
Trienekens, J., & P. Zuurbier. (2008). Quality and safety standards in food industry,
developments and challenges. International Journal of Production Economics,
113(1), 107 - 122.
Tsekouras, K., Dimara, E., & Skuras, D. (2002). Adoption of a quality assurance scheme and
its effect on firm performance: A study of Greek firms implementing ISO 9000.Total
Quality Management, 13(6), 827-841.
Turner, C. R., Ortmann, G., & Lyne, M. (2000). Adoption of ISO 9000 Quality assurance
standards by South African agribusiness firms. Agribusiness, 16 (3), 295-307.
224
Tuyen, D. K. (2007). Dairy herd development in Vietnam. Animal Husbandry Review. , 12,
11-154.
Tuyen, D. K. (2009). Present status of dairy production 2001- 2009 and forecast 2010 -2020.
Unpublished manuscript. Hanoi, Vietnam.
Umm, E., Zia, T., Mahmood, & Ali, M. R. (2011). Dairy Development development in
Pakistan. Rome, Italy: FAO (Food and Agriculture Organisation).
Unnevehr, L. J., & Jensen, H. H. (1998). The economic implications of using HACCP as a
food safety regulatory standard. Working paper 99-WP 228. Center for Agricultural
and rural Development Iowa State University, Ames, Iowa.
Unnevehr, L. J., & Jensen, H. H. (1999). The economic implications of using HACCP as a
food safety regulatory standard. Food Policy, 24(6), 625-635.
USDA (United States Department of Agriculture, Foreign Agriculture Service (FAS). (2006).
Vietnam livestock and Products Annual 2006. Global Agriculture Information
Network GAIN report VM 6054. American Embassy, Hanoi, Vietnam.
Uyar, A. (2008). An empirical investigation of the relationship between quality initiatives and
financial performance. Eurasian Journal of Business and Economics, 1(1): 25-36.
van Berkum, S. (2004). Vertical coordination in ECA supply chains: Evidence from the dairy
sector in Romania. Report. Agricultural Economics Institute- LEI, Wageningen
University.
Vasconcellos, J. A. (2004). Quality assurance for food industry: a practical approach. New
York: CRC Press.
VDA (Vietnam Dairy Association). (2010). List of members and formal agencies in VDA.
Ho Chi Minh City, Vietnam.
Vietnam Credit. (2010). Ranking on Vietnamese business report. Unpublished, Hanoi,
Vietnam.
Vietnam SPS organization. (2007). Standards for foods - milk and dairy products. Retrieved
April 21, 2011, from http://spsvietnam.gov.vn/pages/thucpham-
suavasanphamsua.aspx
Vietnamnet. (2009, July 12). Overview of Vinamilk. Retreived August 11, 2010, from
http://www.vinamilk.com.vn
Vietstock. (2010). Financial Analysis Report. Unpublished, Ho Chi Minh City, Vietnam.
Vinamilk (2006). Annual report 2006. Unpublished, Ho Chi Minh City, Vietnam.
Vinamilk. (2007). Annual report 2007. Unpublished, Ho Chi Minh City, Vietnam..
Vinamilk. (2008). Annual report 2008. Unpublished., Ho Chi Minh City, Vietnam.
225
Vinamilk. (2009). Annual report 2009. Unpublished., Ho Chi Minh City, Vietnam.
Vinamilk. (2010). Annual report 2010. Unpublished, Ho Chi Minh City, Vietnam.
Vinasme. (2009, August 24). Decree 56/ ND-CP supporting SME in Vietnam issued by the
Government of Vietnam. Retrieved October 11, 2009, from
http://www.vinasme.com.vn/nd5/detail/co-so-du-lieu/van-ban-phap-luat/nghi-dinh-
cua-chinh-phu-ve-viec-tro-giup-phat-trien-doanh-nghiep-nho-va-
vua/51292.007019.html
Vnexpress. (2010). Dutch Lady company produces milk followed the Dutch standards.
Retrieved 10 June 2010, from http://vnexpress.net/gl/doi-song/mua-
sam/2010/03/3ba19981/
Vohies, D. W., & Morgan, N. A. (2005). Benchmarking marketing capability for sustainable
competitive advantage. Journal of Marketing, 69 (1), 80 - 94.
VPC (Vietnam Productivity Center). (2009). Report on present status of quality certification
registrar. Unpublished, Hanoi, Vietnam.
VPC (Vietnam Productivity Center). (2010). List of registered businesses with quality
certifications. Unpublished, Hanoi, Vietnam.
VSQC (Vietnam Quality Standard Center). (2008). Quality manament systems GMP and
HACCP. Retrieved December 14, 2008 from
http://www.vsqc.org.vn/news000102.aspx
VTCnews. (2009, April 11). Dutch Lady will recall about 1.5 million of fresh milk packs.
Retrieved April 19, 2011, from http://www.vtc.vn/.../co-gai-ha-lan-se-thu-hoi-gan...
Walgenbach, P. (2007). Faeçcade and means of control: the use of ISO 9001 standard. In L.
Theuvsen, M. Spiller, M. Peupert, & G. Jahn (Eds.), Quality management in food
chains (pp. 29-42). Wageningen, the Netherlands.
Wang, M. Y. (2008). Determinants affecting the adoption time of ISO 9000 standards across
countries. Journal of the Chinese Institute of Industrial Engineers, 25 (6), 497-509.
Ward, P. T., Duray, R., Leong. G. K., & Sum, C. H. (1995). Business performance,
operations strategy, and performance: an empirical study of Singapore manufactures.
Journal of Operations Management, 13(2), 99-115.
Wayhan, B. V., Kirche, T. E., & Khumawana, M. B. (2002). ISO 9000 certification: the
financial performance implications. Total Quality Management, 13(2), 217-231.
WFP (World Food Program). (2008). Definitions of quality standards. Retrieved December
15, 2009, from
http://foodquality.wfp.org/FoodSafetyandHygiene/FoodQualitySystems/.
226
William, P. J. (1997). Rapport Building Processes Used by an Expert Farm Management
Consultant. Unpublished master‟s thesis, Massey University, Palmerston North, New
Zealand.
Williams, F. P., D‟Souza, D. E., Rosenfeld, M. E., & Kassaee, M. (1995). Manufacturing
strategy, business strategy and firm performance in a mature industry. Journal of
Operations Management, 13(1), 19-33.
Wither, B., & Ebrahimpour, M. (2000). Does ISO 9000 affect the dimensions of quality used
for competitive advantage? European Management Journal, 18(4), 431-443.
Withers, B.E., & Ebrahimpour, M. (2001). Impact of ISO 9000 registration on European
firms: A case analysis. Integrated Manufacturing Systems, 12(2), 139-151.
Wolf, C. (1979). A theory on non-market failure: framework for implementation analysis.
Journal of Law and Economics, 21(1), 107-139.
Wolf, C. (1986). Markets or governments: choosing between imperfect alternatives. Prepared
for the Alfred S Sloan Foundation.Santa Monica, California, USA: Rand Publisher.
Wong, A., Tjosvold, D., Wong, W. Y. L., & Liu, C. K. (1999). Relationships for quality
management in the Hong Kong China supply chain. International Journal of Quality
and Reliability Management, 16(1), 24-41.
World wide Learning limitedLimited. (2007). Business environment extra management.
London, UK: Worldwide Learning Limited publisher.
Worthington, I., & Britton, C. (2006). Business environment (5th ed.). New York: Prentice-
Hall publisher.
Yin, R. K. (1994). Case study research (2nd ed.). Thousand Oaks, California: Sage
Publications.
Yin, R. K. (2003). Case study research (3nd ed.). Thousand Oaks, California: Sage
Publications.
Yin, R. K. (2009). Case study research –Design and methods (4th ed.). Los Angeles,
California: Sage Publicationss.
Zaibet, L. (2000). Compliance to HACCP and competitiveness of Oman fish industry.
International Food Agribusiness Review, 3(3), 311-321.
Zaibet, L., & Bredahl, M. (1997). Gains from ISO certification in the UK meat sector.
Agribusiness, 13(4), 375-384.
Zhang, H. (2008). Water down the truth. Retrieved Jan 22, 2009, from
http://www.guardian.co.uk/commentisfree/2008/sep/18/china?gusrc=rss&feed=comm
entisfree
227
Zhu, S., & Scheuermann, L. (1999). A comparison of quality programmes: Total quality
management and ISO 9000. Total Quality Management, 10(2), 291-297.
Ziggers, G. W., & Trienkens, J. (1999). Quality assurance in food and agribusiness supply
chains: developing successful partnerships. International Journal of Production
Economics, 60-61, 272-279.
Zmud, R. W. (1984). An examination of “Push Pull” theory applied process innovation
knowledge works. Management Sciences, 30(6), 727-738.
228
Appendix A Protocol questions for interview
A.1 Appendix A.1 Protocol Questions for interviewing small farm producers
Section 1: Production situation of farm
Q1: How many cows do you milk on your farms?
Q2: How many days do you milk a year?
Q3: Does number of days milking varied across years?
Q4: What is average volume of milk a cow per day?
Q5: Which kind of cow breed does your farm own?
Q6: How many workers are working for your farm?
Q7: Are workers family member or hired labour?
Q8: What capital and equipment do you have for dairy farming?
Q9: Who supplies these capital and equipment?
Q10:What is history of your cow diseases in recent years?
Q11: How do you treat when dairy cows suffered diseases?
Q12: If so, milking is ceased or not?
Q13: Milk sample is tested quality with acceptable contents of antibiotics, etc or given away?
Q14: Do you cope with any last rejects of buying milk from company?
Q15: Why did company reject buying the milk from farms that time?
Q16. What is any problem with milk on the farm?
Section 2: Process of producing milk on the farm
Q17: Describe how you milk your cow?
Q18: How often do you milk? (daily/twice daily?)
229
Q19: How much volume per each milking time do you have a day?
Q20: Describe what happens after the cows are milked and before the milk goes to
collectors?
Q21: How long is it stored before being collected?
Q22. If whether bring milk to collecting centers as soon as possible that can improve quality
of milk?
Q23: Is raw milk transported by you or collected by collectors to collecting centers?
Q24.Describe how the milk is transported?
Q25: How often is fresh milk collected by collectors or brought by you to collecting centers?
Section 3: Technical requirements and price formulation for milk
Q1: Who do you sell to (collectors or companies)
Q2: Describe how the prices are set up by collectors or company?
Q3: What requirements related to quality do company demand?
Q4: Do you have any guides about requirements demanded by factory?
Q5: What are disadvantages in improving quality of raw milk in farm?
Q6: What are advantages in improving quality of raw milk in farm?
Section 4: Perceptions about milk quality, quality systems
Q1: What do you think is meant by good quality raw milk?
Q2: Do you know about quality programs? If so, which ones you heard of ?
Q3: Do you know what the requirements of these programs are?
Q4. How about results after application of this program?
Q5: Why are these systems not applied at current time in your farms?
Q6: What about any innovations being applied on your farm?
Section 5: Economic efficiency in milk production
Q1.What about costs such as feed, labour, etc for dairy cow?
Q2: Is there any difference when you follow GMP program?
230
Section 6: Institutional issues
Q1: a.Do you have any training on skills to improve dairy quality on farm?
b.Who provided the trainings?
Q2: Do you involve in any projects or programs to improve dairy productivity and quality?
Q3: How often training courses organized a year?
Q4: Do you have any written contract with company?
Q5: What are details of the contract?
Q6: What is your plan and strategy in the future?
231
A.2 Appendix A.2. protocol questions for interviewing collectors
Section 1: Process of collecting milk from farms
Q1: How many collecting center does your company own?
Q2: How number of employees is working for collecting center?
Q3: What are capital and equipment in collecting center?
Q4: How is hygienic condition of tanks, storages in collecting center?
Q5: How is average distance from these collecting centers to dairy farms that you procure
milk from?
Q6: How many farms does each collecting center procure from?
Q7: What are capital and equipment for testing quality in collecting centers?
Q8: Does the collecting centers or do the farmers bring milk to the collecting centers?
Q9: If the company collects milk from farms, describe the process from the time the milk is
picked up until it reaching the collecting centers?
Q10: Describe the process from the time the milk reaches the collecting center until the time
it leaves?
Q11: How long is the milk stored and chilled in collecting centers?
Q12: How often is raw milk transported to factory?
Q13.What is any problem with dairy quality in collecting center?
Section 2: Technical requirements and prices of milk
Q1: What are common technical requirements for dairy quality when procuring raw milk
from dairy farms?
Q2: Is collecting center belong factory or private?
Q3: If private, who buys the milk?
Q4: What are advantages in improving dairy quality in collecting centers?
232
Q5: What are disadvantages in improving quality in collecting centers?
Section 3: Perceptions about quality systems
Q1: Do you know any about quality programs? If so, what program have you heard of?
Q2.Are any of the programs in place?
Q3: Why are these programs not applied current time in collecting centers?
Q4: What do you understand „good quality to mean at a collecting center?
*
233
A.3 Appendix A.3. protocol questions for interviewing processors/plants
Part A: Factory status and Process
Q1: What year was factory in operational?
Q2: How many employees are working in dairy factory?
Q3: What is designed and actual capacity of factory in processing and manufacturing dairy
products?
Q4: Does your factory cope with shortage of raw milk in seasonality?
Q5: Describe how milk is processed in factory?
Q6: What are kinds of dairy products processed and manufactured by dairy factory?
Q7. How much volume is each kind of products processed and manufactured by factory?
Q8. How often does milk sample be tested? Which are technical criteria for testing milk in
factory?
Q9. Describe the QAS processes in place?
Q10: How do factory treat raw milk not being passed test of quality?
Q11. What is any problem with dairy quality in factory?
Part B. Quality assurance systems and its operation in factory
Section 1: Motivations/expectations
234
Q1:What do you understand by good quality?
Q2: Is there any quality program applied in factory?
Q3: What are your expectations/objectives when adopting QAS in factory?
Section 2: Business Environment
Q1: Does your company have any supports for registration of quality programs?
Q2: If possible, what type of supports do you describe?
Q3: How do trade and industrial associations have a role to support your company to have
registration of quality program?
Q4: What kind of support do you describe?
Q5: Have market pressures from customers and competitors influenced you to adopt a QAS?
Q6: If so, how has pressure of customer influenced your decision?
Section 3: Firm characteristics
Q1: How much do you have expense for setting up quality program?
Q2: How much do you have investment for upgrading technology and equipment, employee,
maintaining QAS?
Q3: Could you describe each component of these costs?
Q4: How are roles of manager board for adopting QAS?
Q5: How do you think about type of products processed and manufactured by firm have any
effect to adoption decisions?
235
Q6: How do you think power leadership factors in management have influenced adoption
decisions?
Section 4: Institutional
Q1: What kinds of document do you prepare to get quality QAS certification?
Q2: What certifying company do you usually register to?
Q3: Does the factory have quality staff?
Q4: What activity does quality staff do?
Q5: How is information and data related to quality control been stored and shared?
Section 5: Advantages and disadvantages QAS applied in factory
Q1: What is your opinion of advantages in application of QAS in your factory?
Q2: What is your opinion of disadvantages in application of QAS in your factory?
Section 6: Outcomes/results after adoption of QAS’s
Q1: What changes are there when adopting QAS in your factory?
Q2: What do you describe more details about changes in business results after adopting
QAS? May describe detail for each particular QA system that the company is adopting.
a. Revenue
b. Sales
c. Market shares
d. Profitability
e. Return on sales
f. Sale growth rate
236
Q2: What do you describe details about changes in operational outcomes after adopting
QAS? May describe in detail for each particular QAS‟s?
a. Unit production costs
b. Fast deliveries
c. Cycle time
d. Design quality
e. Manufacturing quality
f. Customer satisfaction
Q3: What do you describe details about changes in product quality outcomes after adopting
QAS? May describe in detail for each particular QAS‟s?
a. Defect rate
b. Recall rate
c. Guarantee costs
d. Performance
e. Features
f. Reliability
g. Conformance
h. Durability
i. Serviceability
j. Aesthetics
k. Perceived quality
Q4: What is your plan and business strategy in the future?
237
A.4 Appendix A.4. protocol Questions for Interviewing distributors
Section 1: Process
Q1: What kind of dairy products do you sell?
Q2: How do you know if dairy products that you buy are good quality?
Q3: What companies do you buy dairy products from?
Q4: How do you store dairy products to assure quality?
Q5: Describe how do you get dairy products from factory to sell?
Q6: Describe how the products are sold?
Q7: What are advantages in selling dairy products?
Q8: What are disadvantages in selling dairy products?
Section 2: Governance issues
Q1: Do you have any supply contract with dairy company?
Q2: Are these contracts long term with supplying companies?
Q3: How quality terms are shown in contracts between you and dairy company?
Section 3: Perceptions of quality
Q1: What do you understand is meant by dairy quality?
Q2: What is your opinion about relationship of dairy quality and sale prices?
Q3: How is dairy product with quality program label sold?
Q4: Do you know any about quality programs?
238
Q5: If so, what program have you heard of?
Q6: Are any of the programs in place?
Q7: Why are these programs not applied current time in distributors‟?
Q8: What do you understand „good quality‟ to mean at a distributors‟?
Q9: What is your plan and business strategy in the future?
239
A.5 Appendix A.5. Protocol questions for interviewing retailers
Section 1: Process
Q1: What kind of dairy products do you sell?
Q2: How do you know if dairy products that you buy are good quality?
Q3: What companies do you buy dairy products from?
Q4: How do you store dairy products to assure quality?
Q5: Describe how do you get dairy products from factory to sell?
Q6: Describe how the products are sold?
Q7: What are advantages in selling dairy products?
Q8: What are disadvantages in selling dairy products?
Section 2: Economic efficiency
Q1. How about income from sale milk?
Section 3: Governance
Q1: Do you have any supply contract with dairy company?
Q2: are these contracts long term with supplying companies?
Q3: How quality terms are shown in contracts between you and dairy company?
Section 4: Perceptions
Q1: What do you understand is meant by dairy quality?
Q2: What is your opinion about relationship of dairy quality and sale prices?
Q3: How is dairy product with quality program label sold?
240
Q4: Do you know any about quality programs?
Q5: If so, what program have you heard of?
Q6: Are any of the programs in place?
Q7: Why are these programs not applied current time in distributors‟?
Q8: Do you have quality registration issued by MOH?
Q9: What requirements are shown in registration?
Q10: What do you understand „good quality‟ to mean at a distributors‟?
Q11: What is your plan and business strategy in the future?
*
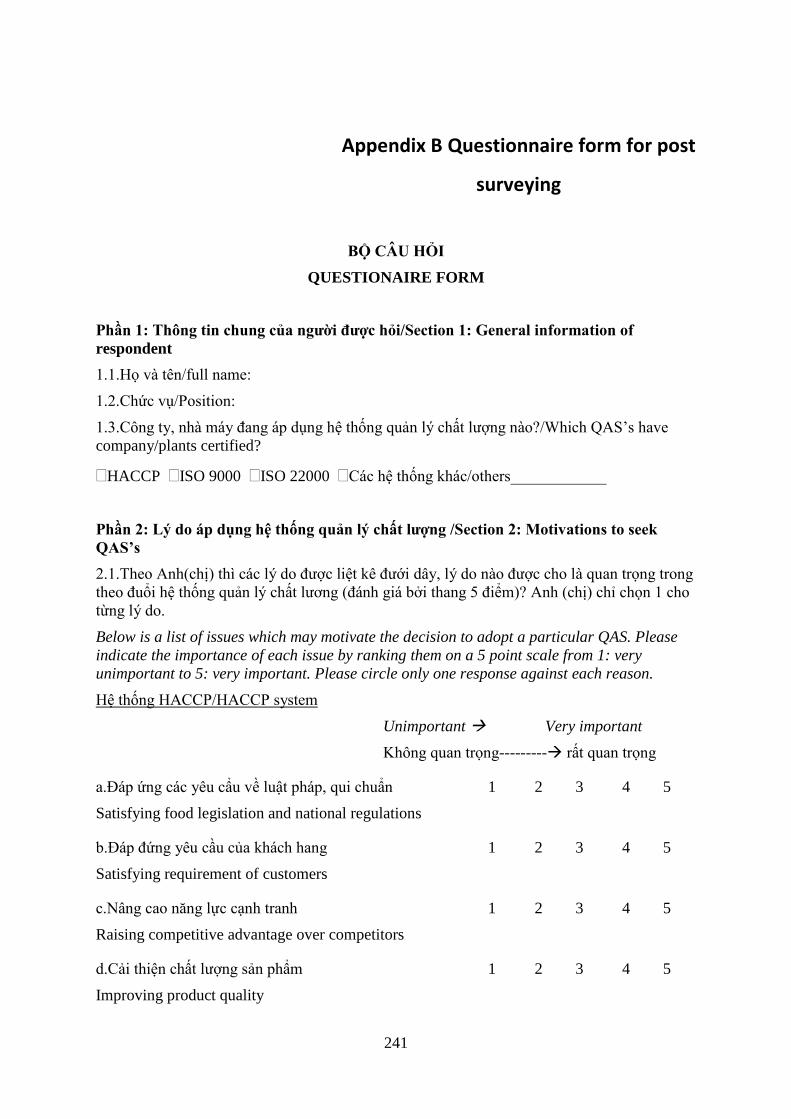
241
Appendix B Questionnaire form for post
surveying
BỘ CÂU HỎI
QUESTIONAIRE FORM
Phần 1: Thông tin chung của người được hỏi/Section 1: General information of
respondent
1.1.Họ và tên/full name:
1.2.Chức vụ/Position:
1.3.Công ty, nhà máy đang áp dụng hệ thống quản lý chất lượng nào?/Which QAS‟s have
company/plants certified?
HACCP ISO 9000 ISO 22000 Các hệ thống khác/others____________
Phần 2: Lý do áp dụng hệ thống quản lý chất lượng /Section 2: Motivations to seek
QAS’s
2.1.Theo Anh(chị) thì các lý do được liệt kê đưới dây, lý do nào được cho là quan trọng trong
theo đuổi hệ thống quản lý chất lương (đánh giá bởi thang 5 điểm)? Anh (chị) chỉ chọn 1 cho
từng lý do.
Below is a list of issues which may motivate the decision to adopt a particular QAS. Please
indicate the importance of each issue by ranking them on a 5 point scale from 1: very
unimportant to 5: very important. Please circle only one response against each reason.
Hệ thống HACCP/HACCP system
Unimportant Very important
Không quan trọng--------- rất quan trọng
a.Đáp ứng các yêu cẩu về luật pháp, qui chuẩn
Satisfying food legislation and national regulations
1 2 3 4 5
b.Đáp đứng yêu cầu của khách hang
Satisfying requirement of customers
1 2 3 4 5
c.Nâng cao năng lực cạnh tranh
Raising competitive advantage over competitors
1 2 3 4 5
d.Cải thiện chất lượng sản phẩm
Improving product quality
1 2 3 4 5
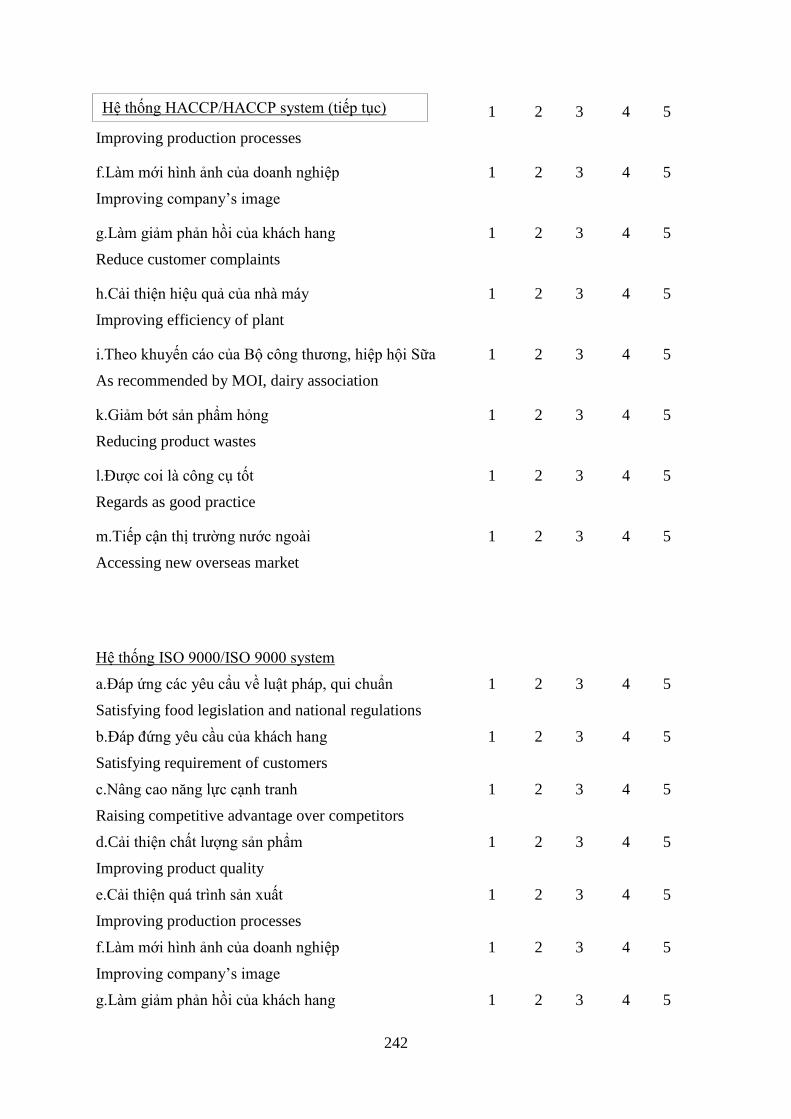
242
e.Cải thiện quá trình sản xuất
Improving production processes
1 2 3 4 5
f.Làm mới hình ảnh của doanh nghiệp
Improving company‟s image
1 2 3 4 5
g.Làm giảm phản hồi của khách hang
Reduce customer complaints
1 2 3 4 5
h.Cải thiện hiệu quả của nhà máy
Improving efficiency of plant
1 2 3 4 5
i.Theo khuyến cáo của Bộ công thương, hiệp hội Sữa
As recommended by MOI, dairy association
1 2 3 4 5
k.Giảm bớt sản phẩm hỏng
Reducing product wastes
1 2 3 4 5
l.Được coi là công cụ tốt
Regards as good practice
1 2 3 4 5
m.Tiếp cận thị trường nước ngoài
Accessing new overseas market
1 2 3 4 5
Hệ thống ISO 9000/ISO 9000 system
a.Đáp ứng các yêu cẩu về luật pháp, qui chuẩn
Satisfying food legislation and national regulations
1 2 3 4 5
b.Đáp đứng yêu cầu của khách hang
Satisfying requirement of customers
1 2 3 4 5
c.Nâng cao năng lực cạnh tranh
Raising competitive advantage over competitors
1 2 3 4 5
d.Cải thiện chất lượng sản phẩm
Improving product quality
1 2 3 4 5
e.Cải thiện quá trình sản xuất
Improving production processes
1 2 3 4 5
f.Làm mới hình ảnh của doanh nghiệp
Improving company‟s image
1 2 3 4 5
g.Làm giảm phản hồi của khách hang 1 2 3 4 5
Hệ thống HACCP/HACCP system (tiếp tục)
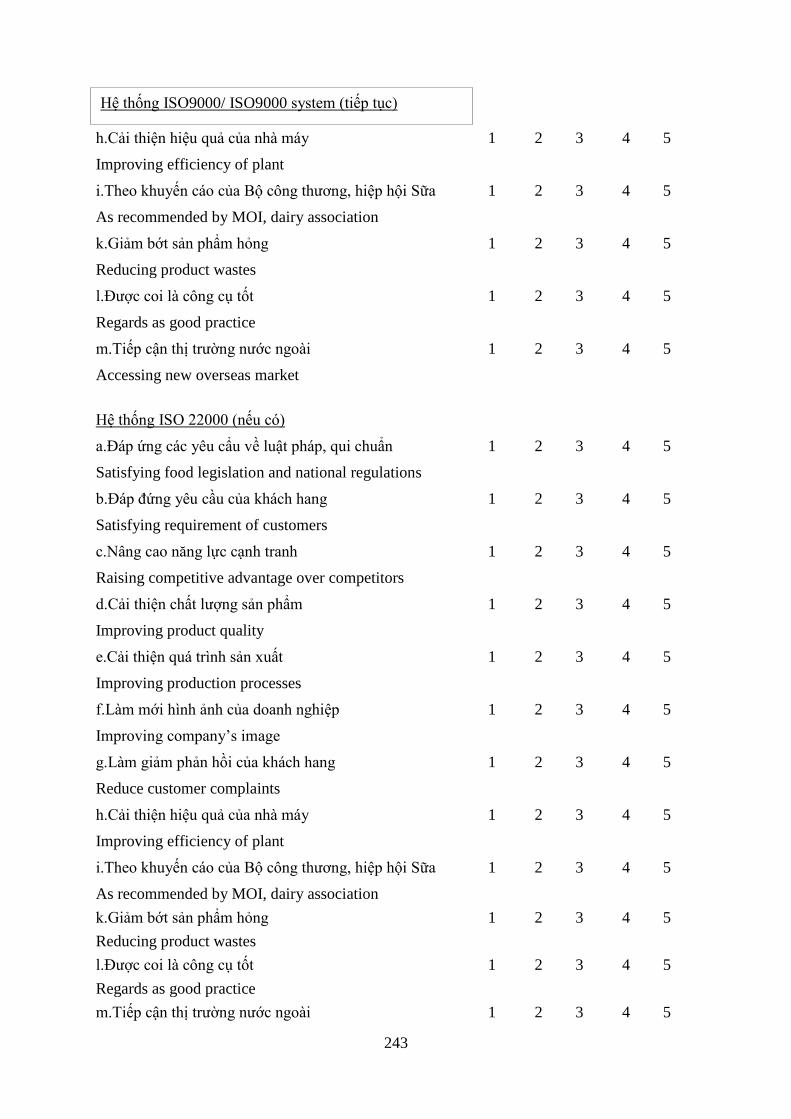
243
Reduce customer complaints
h.Cải thiện hiệu quả của nhà máy
Improving efficiency of plant
1 2 3 4 5
i.Theo khuyến cáo của Bộ công thương, hiệp hội Sữa
As recommended by MOI, dairy association
1 2 3 4 5
k.Giảm bớt sản phẩm hỏng
Reducing product wastes
1 2 3 4 5
l.Được coi là công cụ tốt
Regards as good practice
1 2 3 4 5
m.Tiếp cận thị trường nước ngoài
Accessing new overseas market
1 2 3 4 5
Hệ thống ISO 22000 (nếu có)
a.Đáp ứng các yêu cẩu về luật pháp, qui chuẩn
Satisfying food legislation and national regulations
1 2 3 4 5
b.Đáp đứng yêu cầu của khách hang
Satisfying requirement of customers
1 2 3 4 5
c.Nâng cao năng lực cạnh tranh
Raising competitive advantage over competitors
1 2 3 4 5
d.Cải thiện chất lượng sản phẩm
Improving product quality
1 2 3 4 5
e.Cải thiện quá trình sản xuất
Improving production processes
1 2 3 4 5
f.Làm mới hình ảnh của doanh nghiệp
Improving company‟s image
1 2 3 4 5
g.Làm giảm phản hồi của khách hang
Reduce customer complaints
1 2 3 4 5
h.Cải thiện hiệu quả của nhà máy
Improving efficiency of plant
1 2 3 4 5
i.Theo khuyến cáo của Bộ công thương, hiệp hội Sữa
As recommended by MOI, dairy association
1 2 3 4 5
k.Giảm bớt sản phẩm hỏng
Reducing product wastes
1 2 3 4 5
l.Được coi là công cụ tốt
Regards as good practice
1 2 3 4 5
m.Tiếp cận thị trường nước ngoài 1 2 3 4 5
Hệ thống ISO9000/ ISO9000 system (tiếp tục)
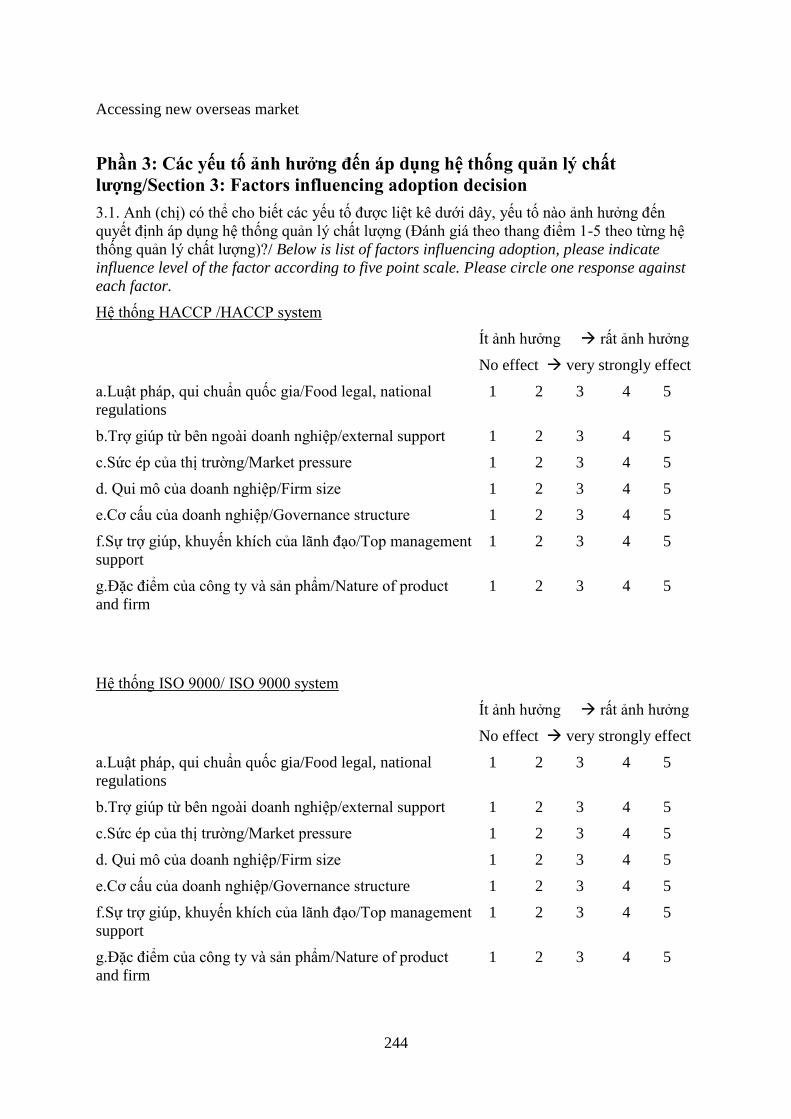
244
Accessing new overseas market
Phần 3: Các yếu tố ảnh hưởng đến áp dụng hệ thống quản lý chất
lượng/Section 3: Factors influencing adoption decision
3.1. Anh (chị) có thể cho biết các yếu tố được liệt kê dưới dây, yếu tố nào ảnh hưởng đến
quyết định áp dụng hệ thống quản lý chất lượng (Đánh giá theo thang điểm 1-5 theo từng hệ
thống quản lý chất lượng)?/ Below is list of factors influencing adoption, please indicate
influence level of the factor according to five point scale. Please circle one response against
each factor.
Hệ thống HACCP /HACCP system
Ít ảnh hưởng rất ảnh hưởng
No effect very strongly effect
a.Luật pháp, qui chuẩn quốc gia/Food legal, national
regulations
1 2 3 4 5
b.Trợ giúp từ bên ngoài doanh nghiệp/external support 1 2 3 4 5
c.Sức ép của thị trường/Market pressure 1 2 3 4 5
d. Qui mô của doanh nghiệp/Firm size 1 2 3 4 5
e.Cơ cấu của doanh nghiệp/Governance structure 1 2 3 4 5
f.Sự trợ giúp, khuyến khích của lãnh đạo/Top management
support
1 2 3 4 5
g.Đặc điểm của công ty và sản phẩm/Nature of product
and firm
1 2 3 4 5
Hệ thống ISO 9000/ ISO 9000 system
Ít ảnh hưởng rất ảnh hưởng
No effect very strongly effect
a.Luật pháp, qui chuẩn quốc gia/Food legal, national
regulations
1 2 3 4 5
b.Trợ giúp từ bên ngoài doanh nghiệp/external support 1 2 3 4 5
c.Sức ép của thị trường/Market pressure 1 2 3 4 5
d. Qui mô của doanh nghiệp/Firm size 1 2 3 4 5
e.Cơ cấu của doanh nghiệp/Governance structure 1 2 3 4 5
f.Sự trợ giúp, khuyến khích của lãnh đạo/Top management
support
1 2 3 4 5
g.Đặc điểm của công ty và sản phẩm/Nature of product
and firm
1 2 3 4 5
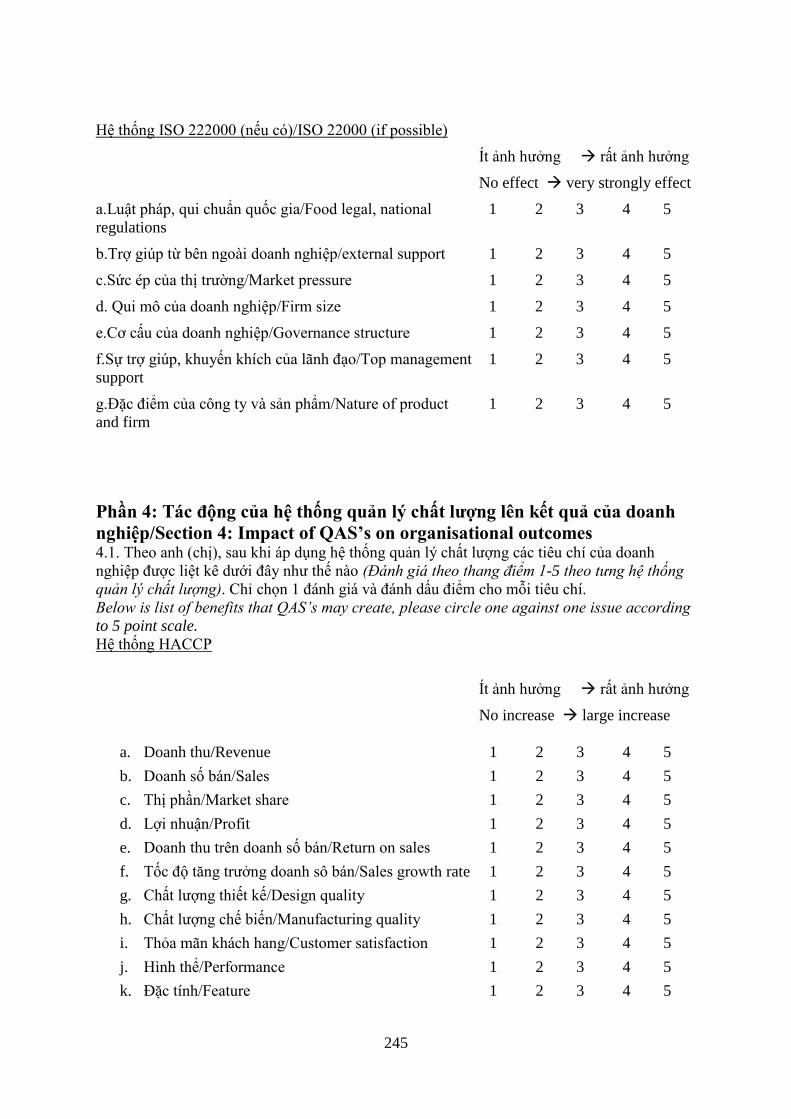
245
Hệ thống ISO 222000 (nếu có)/ISO 22000 (if possible)
Ít ảnh hưởng rất ảnh hưởng
No effect very strongly effect
a.Luật pháp, qui chuẩn quốc gia/Food legal, national
regulations
1 2 3 4 5
b.Trợ giúp từ bên ngoài doanh nghiệp/external support 1 2 3 4 5
c.Sức ép của thị trường/Market pressure 1 2 3 4 5
d. Qui mô của doanh nghiệp/Firm size 1 2 3 4 5
e.Cơ cấu của doanh nghiệp/Governance structure 1 2 3 4 5
f.Sự trợ giúp, khuyến khích của lãnh đạo/Top management
support
1 2 3 4 5
g.Đặc điểm của công ty và sản phẩm/Nature of product
and firm
1 2 3 4 5
Phần 4: Tác động của hệ thống quản lý chất lượng lên kết quả của doanh
nghiệp/Section 4: Impact of QAS’s on organisational outcomes 4.1. Theo anh (chị), sau khi áp dụng hệ thống quản lý chất lượng các tiêu chí của doanh
nghiệp được liệt kê dưới đây như thế nào (Đánh giá theo thang điểm 1-5 theo tưng hệ thống
quản lý chất lượng). Chỉ chọn 1 đánh giá và đánh dấu điểm cho mỗi tiêu chí.
Below is list of benefits that QAS’s may create, please circle one against one issue according
to 5 point scale.
Hệ thống HACCP
Ít ảnh hưởng rất ảnh hưởng
No increase large increase
a. Doanh thu/Revenue 1 2 3 4 5
b. Doanh số bán/Sales 1 2 3 4 5
c. Thị phần/Market share 1 2 3 4 5
d. Lợi nhuận/Profit 1 2 3 4 5
e. Doanh thu trên doanh số bán/Return on sales 1 2 3 4 5
f. Tốc độ tăng trưởng doanh sô bán/Sales growth rate 1 2 3 4 5
g. Chất lượng thiết kế/Design quality 1 2 3 4 5
h. Chất lượng chế biến/Manufacturing quality 1 2 3 4 5
i. Thỏa mãn khách hang/Customer satisfaction 1 2 3 4 5
j. Hình thể/Performance 1 2 3 4 5
k. Đặc tính/Feature 1 2 3 4 5
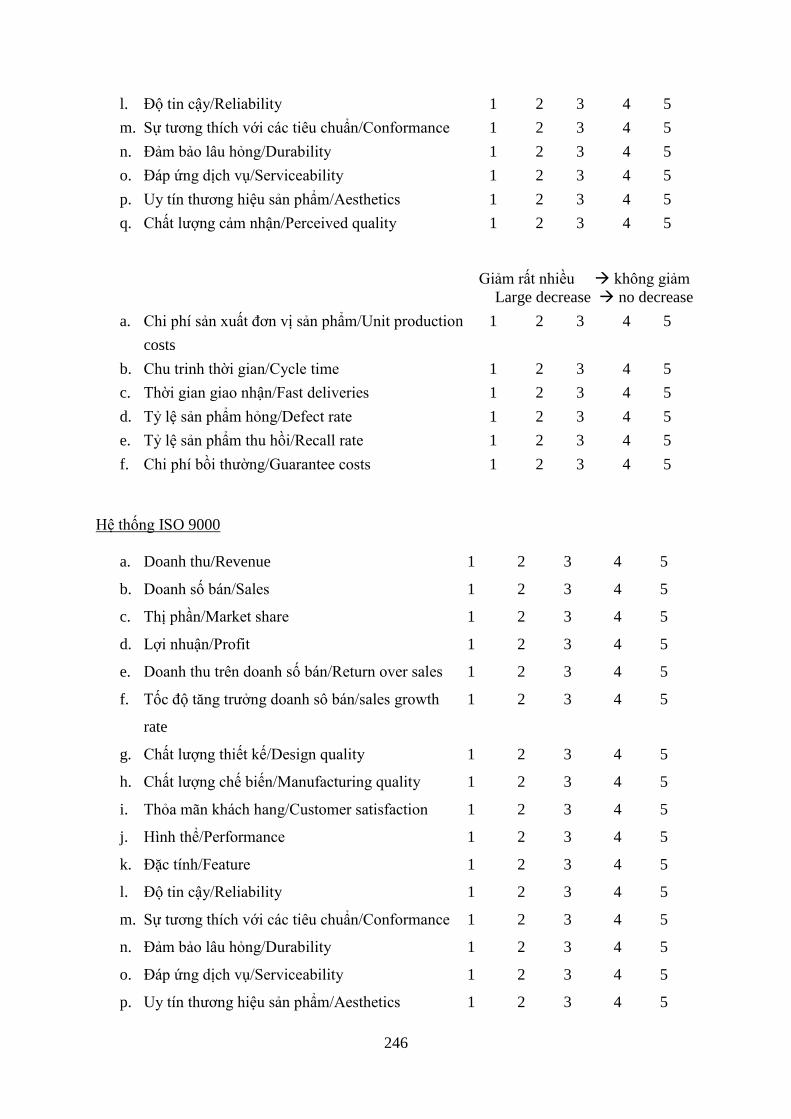
246
l. Độ tin cậy/Reliability 1 2 3 4 5
m. Sự tương thích với các tiêu chuẩn/Conformance 1 2 3 4 5
n. Đảm bảo lâu hỏng/Durability 1 2 3 4 5
o. Đáp ứng dịch vụ/Serviceability 1 2 3 4 5
p. Uy tín thương hiệu sản phẩm/Aesthetics 1 2 3 4 5
q. Chất lượng cảm nhận/Perceived quality 1 2 3 4 5
Giảm rất nhiều không giảm
Large decrease no decrease
a. Chi phí sản xuất đơn vị sản phẩm/Unit production
costs
1 2 3 4 5
b. Chu trinh thời gian/Cycle time 1 2 3 4 5
c. Thời gian giao nhận/Fast deliveries 1 2 3 4 5
d. Tỷ lệ sản phẩm hỏng/Defect rate 1 2 3 4 5
e. Tỷ lệ sản phẩm thu hồi/Recall rate 1 2 3 4 5
f. Chi phí bồi thường/Guarantee costs 1 2 3 4 5
Hệ thống ISO 9000
a. Doanh thu/Revenue 1 2 3 4 5
b. Doanh số bán/Sales 1 2 3 4 5
c. Thị phần/Market share 1 2 3 4 5
d. Lợi nhuận/Profit 1 2 3 4 5
e. Doanh thu trên doanh số bán/Return over sales 1 2 3 4 5
f. Tốc độ tăng trưởng doanh sô bán/sales growth
rate
1 2 3 4 5
g. Chất lượng thiết kế/Design quality 1 2 3 4 5
h. Chất lượng chế biến/Manufacturing quality 1 2 3 4 5
i. Thỏa mãn khách hang/Customer satisfaction 1 2 3 4 5
j. Hình thể/Performance 1 2 3 4 5
k. Đặc tính/Feature 1 2 3 4 5
l. Độ tin cậy/Reliability 1 2 3 4 5
m. Sự tương thích với các tiêu chuẩn/Conformance 1 2 3 4 5
n. Đảm bảo lâu hỏng/Durability 1 2 3 4 5
o. Đáp ứng dịch vụ/Serviceability 1 2 3 4 5
p. Uy tín thương hiệu sản phẩm/Aesthetics 1 2 3 4 5
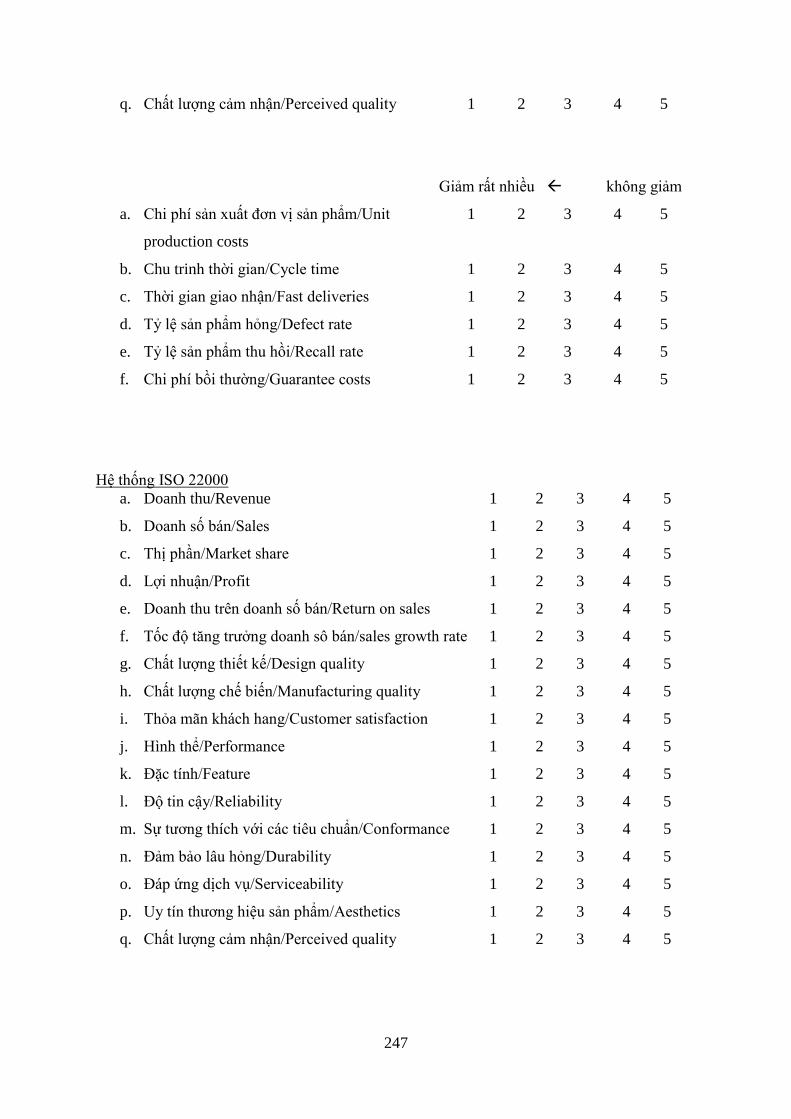
247
q. Chất lượng cảm nhận/Perceived quality 1 2 3 4 5
Giảm rất nhiều không giảm
a. Chi phí sản xuất đơn vị sản phẩm/Unit
production costs
1 2 3 4 5
b. Chu trinh thời gian/Cycle time 1 2 3 4 5
c. Thời gian giao nhận/Fast deliveries 1 2 3 4 5
d. Tỷ lệ sản phẩm hỏng/Defect rate 1 2 3 4 5
e. Tỷ lệ sản phẩm thu hồi/Recall rate 1 2 3 4 5
f. Chi phí bồi thường/Guarantee costs 1 2 3 4 5
Hệ thống ISO 22000
a. Doanh thu/Revenue 1 2 3 4 5
b. Doanh số bán/Sales 1 2 3 4 5
c. Thị phần/Market share 1 2 3 4 5
d. Lợi nhuận/Profit 1 2 3 4 5
e. Doanh thu trên doanh số bán/Return on sales 1 2 3 4 5
f. Tốc độ tăng trưởng doanh sô bán/sales growth rate 1 2 3 4 5
g. Chất lượng thiết kế/Design quality 1 2 3 4 5
h. Chất lượng chế biến/Manufacturing quality 1 2 3 4 5
i. Thỏa mãn khách hang/Customer satisfaction 1 2 3 4 5
j. Hình thể/Performance 1 2 3 4 5
k. Đặc tính/Feature 1 2 3 4 5
l. Độ tin cậy/Reliability 1 2 3 4 5
m. Sự tương thích với các tiêu chuẩn/Conformance 1 2 3 4 5
n. Đảm bảo lâu hỏng/Durability 1 2 3 4 5
o. Đáp ứng dịch vụ/Serviceability 1 2 3 4 5
p. Uy tín thương hiệu sản phẩm/Aesthetics 1 2 3 4 5
q. Chất lượng cảm nhận/Perceived quality 1 2 3 4 5
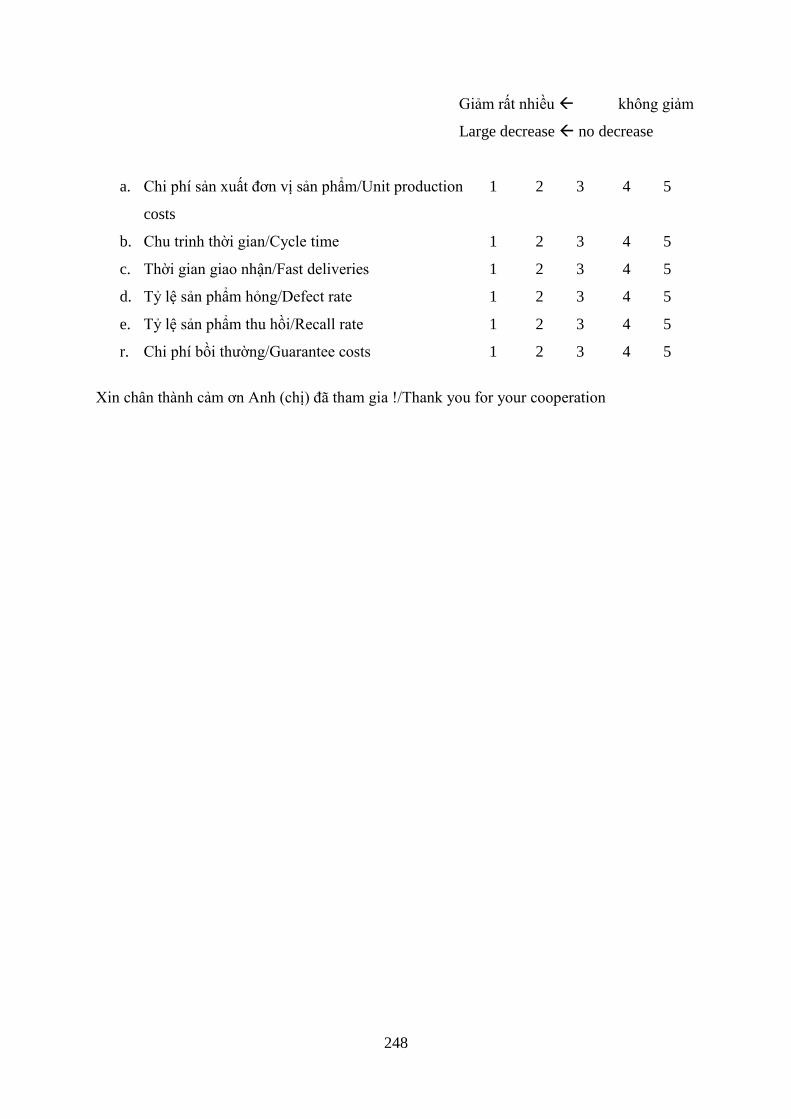
248
Giảm rất nhiều không giảm
Large decrease no decrease
a. Chi phí sản xuất đơn vị sản phẩm/Unit production
costs
1 2 3 4 5
b. Chu trinh thời gian/Cycle time 1 2 3 4 5
c. Thời gian giao nhận/Fast deliveries 1 2 3 4 5
d. Tỷ lệ sản phẩm hỏng/Defect rate 1 2 3 4 5
e. Tỷ lệ sản phẩm thu hồi/Recall rate 1 2 3 4 5
r. Chi phí bồi thường/Guarantee costs 1 2 3 4 5
Xin chân thành cảm ơn Anh (chị) đã tham gia !/Thank you for your cooperation
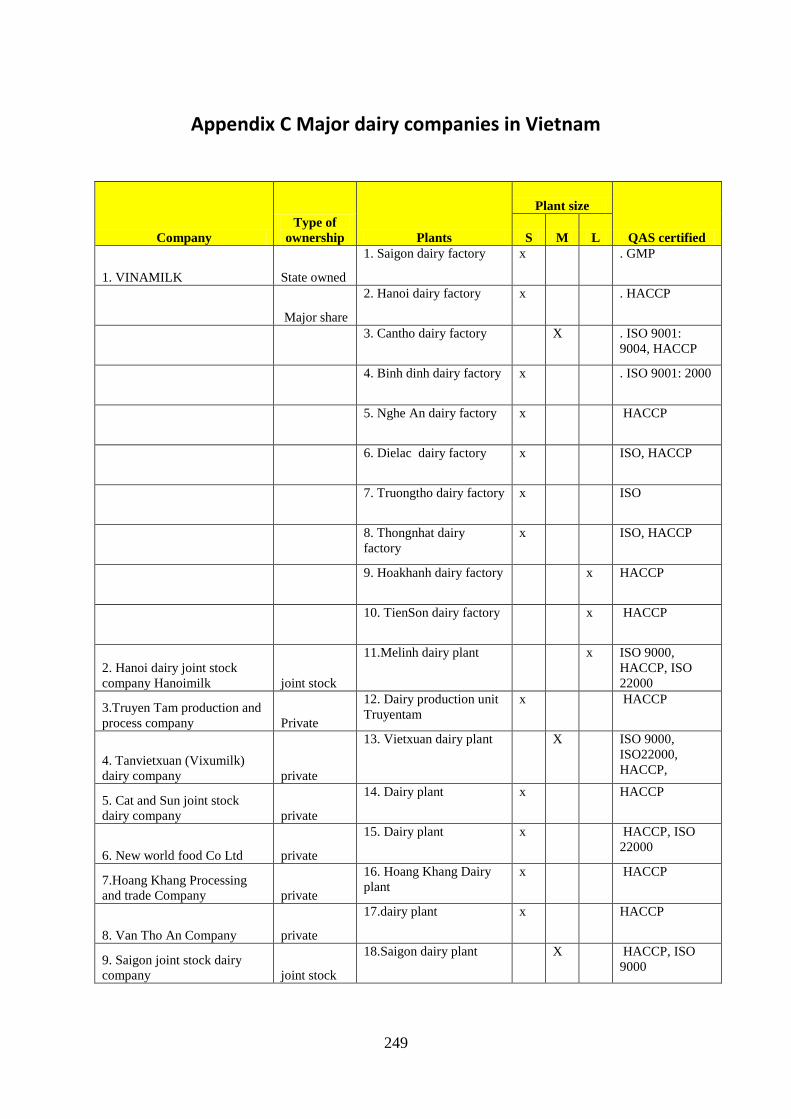
249
Appendix C Major dairy companies in Vietnam
Company
Type of
ownership Plants
Plant size
QAS certified S M L
1. VINAMILK State owned
1. Saigon dairy factory x . GMP
Major share
2. Hanoi dairy factory x . HACCP
3. Cantho dairy factory X . ISO 9001:
9004, HACCP
4. Binh dinh dairy factory x . ISO 9001: 2000
5. Nghe An dairy factory x HACCP
6. Dielac dairy factory x ISO, HACCP
7. Truongtho dairy factory x ISO
8. Thongnhat dairy
factory
x ISO, HACCP
9. Hoakhanh dairy factory x HACCP
10. TienSon dairy factory x HACCP
2. Hanoi dairy joint stock
company Hanoimilk joint stock
11.Melinh dairy plant x ISO 9000,
HACCP, ISO
22000
3.Truyen Tam production and
process company Private
12. Dairy production unit
Truyentam
x HACCP
4. Tanvietxuan (Vixumilk)
dairy company private
13. Vietxuan dairy plant X ISO 9000,
ISO22000,
HACCP,
5. Cat and Sun joint stock
dairy company private
14. Dairy plant x HACCP
6. New world food Co Ltd private
15. Dairy plant x HACCP, ISO
22000
7.Hoang Khang Processing
and trade Company private
16. Hoang Khang Dairy
plant
x HACCP
8. Van Tho An Company private
17.dairy plant x HACCP
9. Saigon joint stock dairy
company joint stock
18.Saigon dairy plant X HACCP, ISO
9000
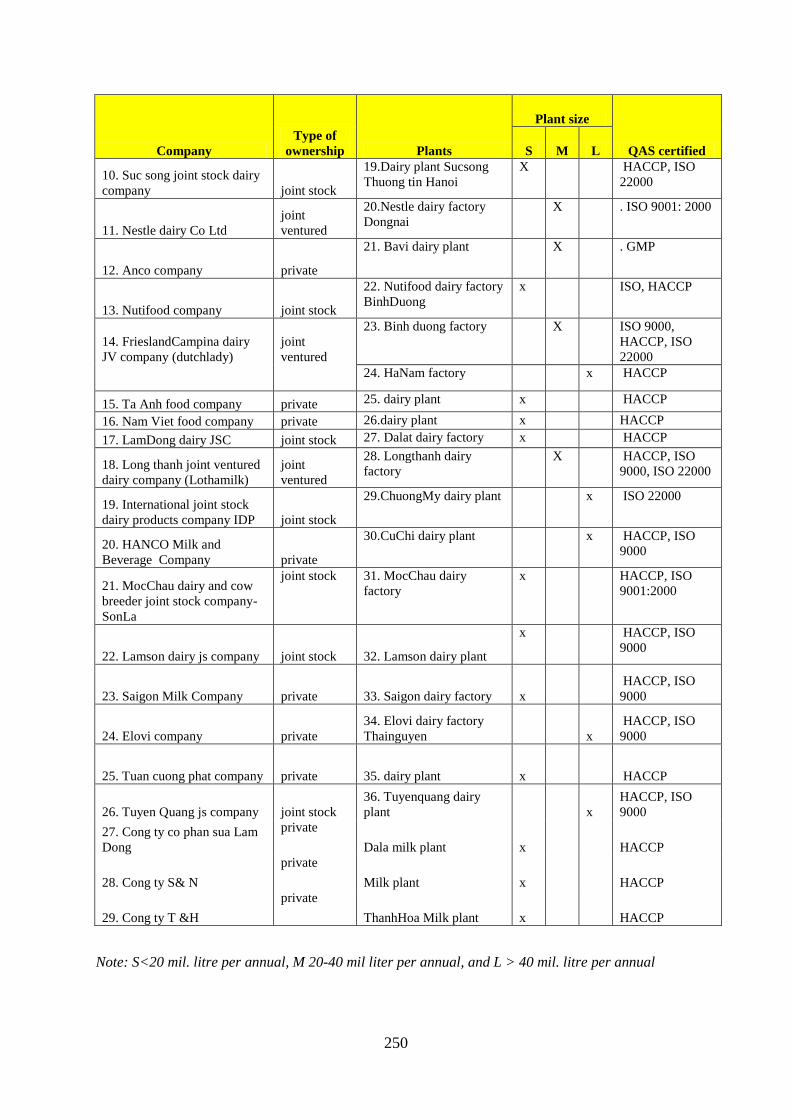
250
Company
Type of
ownership Plants
Plant size
QAS certified S M L
10. Suc song joint stock dairy
company joint stock
19.Dairy plant Sucsong
Thuong tin Hanoi
X HACCP, ISO
22000
11. Nestle dairy Co Ltd
joint
ventured
20.Nestle dairy factory
Dongnai
X . ISO 9001: 2000
12. Anco company private
21. Bavi dairy plant X . GMP
13. Nutifood company joint stock
22. Nutifood dairy factory
BinhDuong
x ISO, HACCP
14. FrieslandCampina dairy
JV company (dutchlady)
joint
ventured
23. Binh duong factory X ISO 9000,
HACCP, ISO
22000
24. HaNam factory x HACCP
15. Ta Anh food company private 25. dairy plant x HACCP
16. Nam Viet food company private 26.dairy plant x HACCP
17. LamDong dairy JSC joint stock 27. Dalat dairy factory x HACCP
18. Long thanh joint ventured
dairy company (Lothamilk)
joint
ventured
28. Longthanh dairy
factory
X HACCP, ISO
9000, ISO 22000
19. International joint stock
dairy products company IDP joint stock
29.ChuongMy dairy plant x ISO 22000
20. HANCO Milk and
Beverage Company private
30.CuChi dairy plant x HACCP, ISO
9000
21. MocChau dairy and cow
breeder joint stock company-
SonLa
joint stock 31. MocChau dairy
factory
x HACCP, ISO
9001:2000
22. Lamson dairy js company joint stock 32. Lamson dairy plant
x HACCP, ISO
9000
23. Saigon Milk Company private 33. Saigon dairy factory x
HACCP, ISO
9000
24. Elovi company private
34. Elovi dairy factory
Thainguyen x
HACCP, ISO
9000
25. Tuan cuong phat company private 35. dairy plant x HACCP
26. Tuyen Quang js company joint stock
36. Tuyenquang dairy
plant x
HACCP, ISO
9000
27. Cong ty co phan sua Lam
Dong
private
Dala milk plant x HACCP
28. Cong ty S& N
private
Milk plant x HACCP
29. Cong ty T &H
private
ThanhHoa Milk plant x HACCP
Note: S<20 mil. litre per annual, M 20-40 mil liter per annual, and L > 40 mil. litre per annual
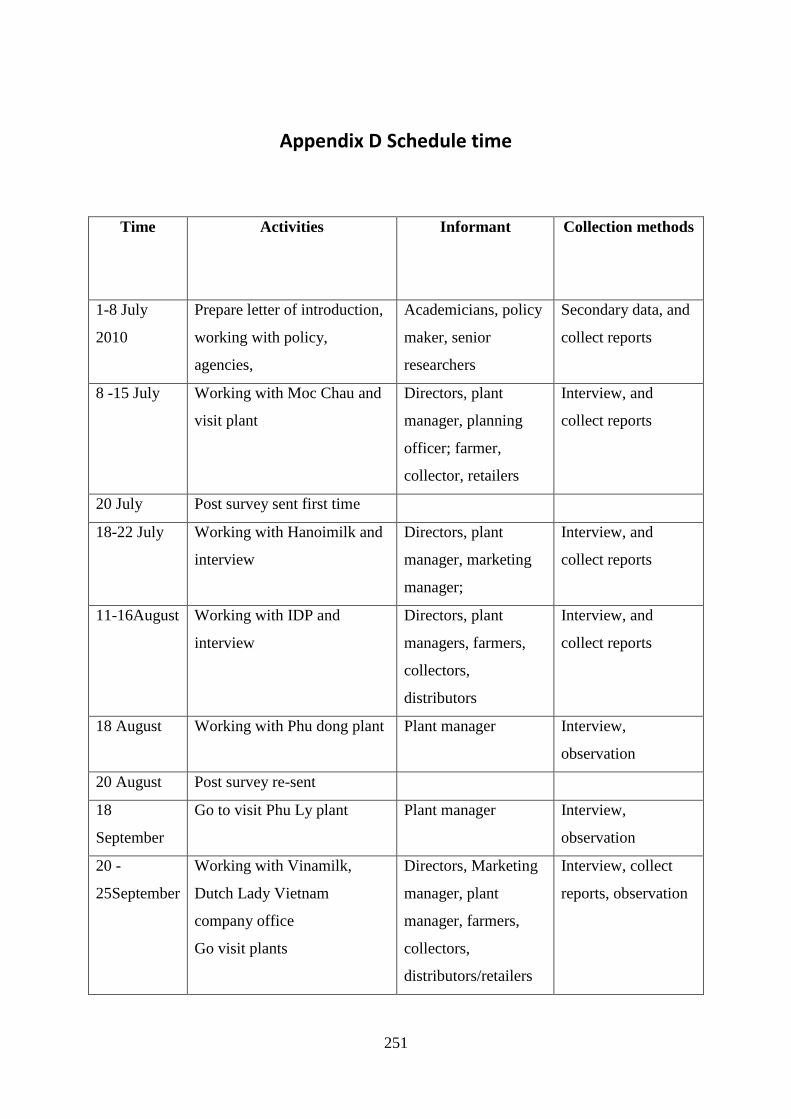
251
Appendix D Schedule time
Time Activities
Informant Collection methods
1-8 July
2010
Prepare letter of introduction,
working with policy,
agencies,
Academicians, policy
maker, senior
researchers
Secondary data, and
collect reports
8 -15 July Working with Moc Chau and
visit plant
Directors, plant
manager, planning
officer; farmer,
collector, retailers
Interview, and
collect reports
20 July Post survey sent first time
18-22 July Working with Hanoimilk and
interview
Directors, plant
manager, marketing
manager;
Interview, and
collect reports
11-16August Working with IDP and
interview
Directors, plant
managers, farmers,
collectors,
distributors
Interview, and
collect reports
18 August Working with Phu dong plant Plant manager Interview,
observation
20 August Post survey re-sent
18
September
Go to visit Phu Ly plant Plant manager Interview,
observation
20 -
25September
Working with Vinamilk,
Dutch Lady Vietnam
company office
Go visit plants
Directors, Marketing
manager, plant
manager, farmers,
collectors,
distributors/retailers
Interview, collect
reports, observation
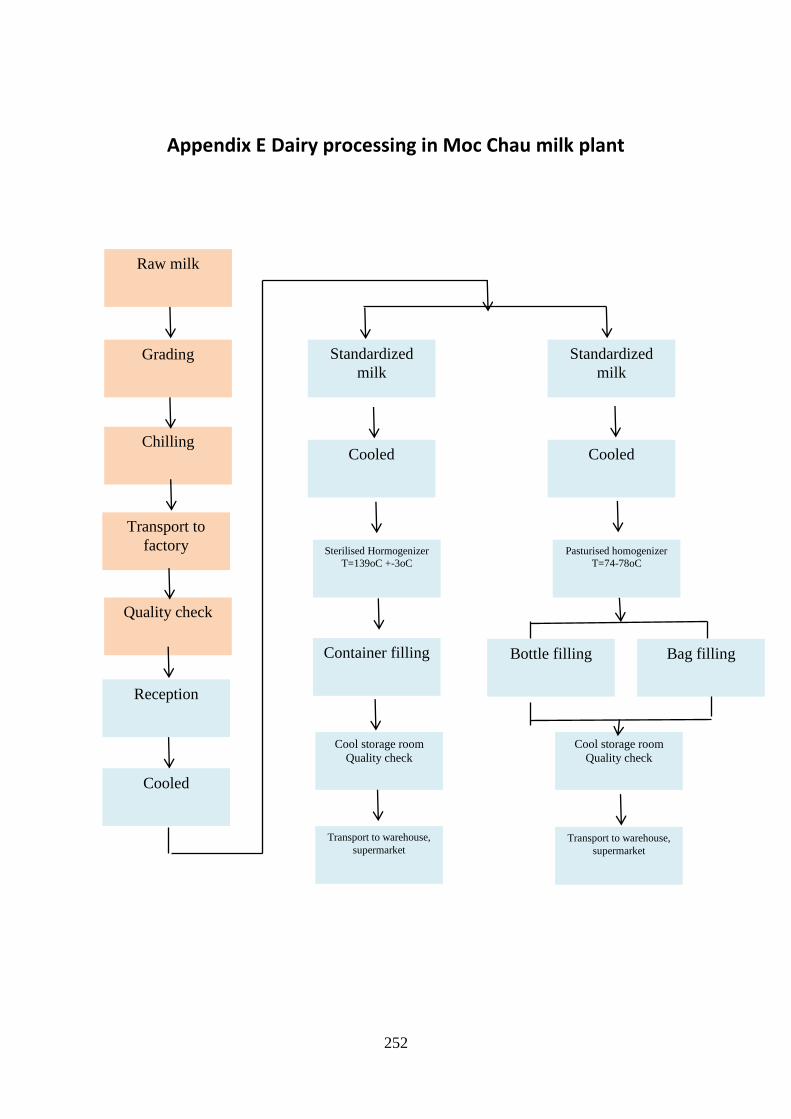
252
Appendix E Dairy processing in Moc Chau milk plant
Raw milk
Quality check
Grading
Chilling
Transport to
factory
Reception
Cooled
Standardized
milk
Standardized
milk
Cooled Cooled
Sterilised Hormogenizer
T=139oC +-3oC
Pasturised homogenizer
T=74-78oC
Container filling Bottle filling
Cool storage room
Quality check
Cool storage room
Quality check
Bag filling
Transport to warehouse,
supermarket Transport to warehouse,
supermarket