Adoption Decision and Demand For Improved Maize Variety: Factors and Challenges
122
1 ADOPTION DECISION AND INTENSITY FOR IMPROVED MAIZE VARIETY BY SMALLHOLDER FARMERS OF JIMMA ARJO WOREDA OF OROMIA REGION: FACTORS AND CHALLENGES BY BIQILA HIRPA BEDASA ADDIS ABABA UNIVERSITY SCHOOL OF GRADUATE STUDIES COLLEGE OF DEVELOPMENT STUDIES JUNE, 2013 ADDIS ABABA, ETHIOPIA
-
Upload
independent -
Category
Documents
-
view
1 -
download
0
Transcript of Adoption Decision and Demand For Improved Maize Variety: Factors and Challenges
1
ADOPTION DECISION AND INTENSITY FOR IMPROVED MAIZE
VARIETY BY SMALLHOLDER FARMERS OF JIMMA ARJO
WOREDA OF OROMIA REGION: FACTORS AND CHALLENGES
BY
BIQILA HIRPA BEDASA
ADDIS ABABA UNIVERSITY
SCHOOL OF GRADUATE STUDIES
COLLEGE OF DEVELOPMENT STUDIES
JUNE, 2013
ADDIS ABABA, ETHIOPIA
2
Abbreviations
CSA Central Statistical Agency
CIMMYT International Maize and Wheat Improvement Center
CBSS Community Based Seed System
DOARD District Office of Agricultural and Rural Development
ESE Ethiopian Seed Enterprise
IFPRI International Food Policy Research Institute
MORAD Ministry of Revenue and Development
NGO Non Governmental Organization
OBA Oromia Bureau of Agriculture
OLS Ordinary Least Square
OSE Oromia Seed Enterprise
TLU Tropical Livestock Unit
3
ADOPTION DECISION AND INTENSITY FOR IMPROVED MAIZE VARIETY BY
SMALLHOLDER FARMERS OF JIMMA ARJO WOREDA OF OROMIA REGION:
FACTORS AND CHALLENGES
BIQILA HIRPA
ADDIS ABABA UNIVERSITY, 2013
Abstract
Transforming smallholder agriculture solely rests on increased adoption rate and optimal
utilization of modern agricultural technologies such as improved seed which enhances
yield and hence ensures food security at a household level. Thus, In order to make
modern agricultural technologies widely adopted and intensively used, all the key factors
affecting the adoption of this technology has to be known clearly and comprehensively.
logit and tobit model are respectively employed in this research to model adoption
decision and the proportion of land allocated to improved maize seed by farm households
in Jimma Arjo Woreda of Oromia region using a data collected from 394 sample
households for 2011/12 cropping season. The result of logit estimation shows marital
status, having family members living in a town or abroad, saving, yield perception,
fertilizer application, distance from output market, production technique, total land
holding, and amount of land allocated to maize all found to significantly determine the
decision of whether to use improved maize seed or not. Besides, total land allocated to
maize production, distance from main output market, having a family/relative living in
town or abroad, saving, production of cash crop, cooperative membership, attending
improved maize demonstration, yield perception, fertilizer application ,maize production
technique, and marital Status are those among those factors affecting our second
outcome decision. Finally, this research paper shed light on those factors so that all
actors (policy makers, seed suppliers and microfinance) operating in improved maize
market would give a due emphasis and take corrective action especially on those factors
that have found to commonly affect the two outcome decisions.
Key words: Food security, logit, smallholder, tobit,

4
Acknowledgements
First and foremost, I would like to thank all our instructors, faculties and other staffs, who
helped us, challenged us, prepare us and expose us to new ideas and perspectives about
our world. Most of all, I appreciate your precious efforts.
A special thank goes to my advisor Dr. Workineh Nigatu whose valuable ideas,
constructive criticism and helpful comments have been helpful throughout this thesis.
Progressing much would have been too challenging without his assistance.
I would also like to appreciate Simbo Asrat for her valuable and endless moral and
financial support throughout this study. Besides, I would like to express my deepest
gratitude for people without whom the field work would not have been possible, namely
the enumerators, the facilitators, the key informants, and all case individuals or
households who take part in this research work.
Moreover, I would not pass without mentioning the special thanks to Zeleke G/Yesus,
Getachew Buli, and Arjo Woreda Office of Agriculture for their support and much other
collaboration during the overall data collection, activities.
Above all, many thank goes to almighty God.

5
TABLE OF CONTENT
Page
ABBREVIATIONS ………………………………………………………………...……2
ABSTRACT …………………………………………………………………….……….3
ACKNOWLEDGMENT ……………………………………………………….….….....4
TABEL OF CONTENT………………………………………………………………..…5
LIST OF TABELS………………………………………………..…………….…..........8
LIST OF FIGURES…………..………………….……………………………………...10
CHAPTER ONE: INTRODUCTION
1.1 Background………………………..…………………………………………….…11
1.2 The Statement of the Problem……………………………………………………..14
1.3 Research Question……….………………………………………………………..16
1.4 Objectives of the Study……………………………………………………………16
1.5. Significance of the study………………………………………………………….17
1.6 Scope and Limitation…………………………………………………………..…..18
1.7 Organization of the Study…………………………………………………….....…19
CHAPTER TWO: REVIEW OF RELATED LITERATURE
2.1 Definition of Adoption and Diffusion of Agricultural Technologies……………...20
2.2 Theories of Adoption and Diffusion of Agricultural Technologies…………….....22
2.3 Stages in Adoption Process…………………………….…..……………………..23
2.4 Approaches Used In Modeling Adoption of Modern Agricultural
Technologies…………………………………………………………………………...27
2.4.1 The Choice of Technique Approach…………………………………………...27
2.4.2 The Target-Input Approach …………………………………………………....28
2.4.3 The Risk Adverse Approach…………………………………………………...29
6
2.5 Empirical Correlates of Farm Technology Adoption Decision…………………..…32
2.5.1 Demographic Factors………………………………………………………...33
2.5.2 Socioeconomic Factors…………………………………………………….....35
2.5.3 Institutional Factors…………………………………………………………...36
2.5.4 Psychological Factors…………………………………………………….…...37
2.6 Seed System and Smallholder Agriculture In Ethiopia…………………………....38
2.6.1 The Formal Seed System………………………………………………….…..39
2.6.2 The Informal Seed System…………………………………………………….42
2.6.3 The Supply-Demand Gap In Seed Market……………….…………………...43
2.7 Adoption of Hybrid Maize Seeds and Food Security…………………………..….45
2.8 Analytical Framework……………………………………………………………..46
2.8.1 Conceptual Framework of the Study Area……………………………….……49
CHAPTER THREE: METHODOLOGY
3.1 Sampling Design…………………………………………...……………….….....51
3.2 Method of Data Analysis………………………………………………….……...54
3.2.1 Descriptive Method…………………………………………………………..54
3.2.2 Econometric Method…………………………………………………...….....55
3.3 Variables Definition and Hypothesis…………………………………….………..60
CHAPTER FOUR: BACKGROUND OF THE STUDY AREA AND THE SAMPLE
RESPONDENTS
4.1 Geographical Setting of the Study Area…………………………………….…….69
4.2 Demographic Characteristics of the Sample Respondents………………….….....73
4.2.1 Asset Ownership of Sample Household………………………………….......75
4.2.2 Membership to Local Institutions………………………………………..…...76
CHAPTER FIVE: RESULTS AND DISCUSIONS
5.1 Descriptive Results………………………………………………..………………78
5.1.1 Adoption Decision and Demographic Characteristics of the
Respondent………………………………………………………………………….78
5.1.2. Adoption Decision and Household Endowment Attribute…….…….……….80

7
5.1.3 Adoption Decision and Institution Related Variables…………………………82
5.1.4. Production Technique and Household Perception Related Characteristics…..84
5.2 Proportion of Land Area Allocated to Improved Maize Variety and Household
Characteristics................................................................................................................88
5.2.1 Decision of Intensity and Households Socioeconomic Characterist……….....90
5.2.2 Major Challenges to Intensification of Improved Maize Production ………...94
5.3 Binary Logistic Regression Result………………………………………………...95
5.4 Estimation of Factors Affecting the Intensity of Improved Maize Seed…………101
CHAPTER SIX: CONCLUSION AND RECOMMENDATION
6.1 Conclusion………………………………………………………………………..108
6.2 Recommendations …………………………………………………..…………...110
References……………………………………………………………………………....112
Appendices………………………………………………………………………...........121
8
LIST OF TABELS
Page
Table 2.1: Area planted With Improved seeds and Chemical Fertilizers in Oromia Region
(2010/11…………………………………………………………………..………….…..40
Table 2.2: Seed supply of Major Cereals in Oromia
Region………………………………………………………………………………..….41
Table 2.3: Area Covered (ha) by Informal Seeds Over the Last Five Years (2005/06-
2009/10)…………………………………..……………………………………………...43
Table 4.1 Distribution of Woreda into Kebeles and Agro ecologies………….………….69
Table 4.2 Population Distribution of the District by Sex and Residence
Category…………………………………………………………………………………72
Table 4.3: Total Land Use Pattern of the District…………….……………………….…73
Table 4.4: Demographic Distributions of Sample Households……………………....….74
Table 4.5: distribution of sample respondents According to Asset Ownership……….....76
Table 4.6: Distribution of Sample Respondents With Institutional Membership………..77
Table 5.1: Adoption Decision and Demographic Characteristics………………………..79
Table 5.2: Adoption Decision and Endowment Characteristics…………………….…...81
Table 5.3: Adoption Decision and Institution Related Variable………………………....82
Table 5.4: Trend for Credit Distribution of the Woreda……………….………………...84
Table 5.5: Adoption Decision and Household Perception and Production
Techniques……………………………..………………………………………..…….…85
Table 5.6 The Status of Adoption Rate of the Sample Respondents……………..…..….87
9
Table 5.7: Reason for Discontinuing the Use of Improved Maize by Household……89
Table 5.8 Amount of Land Allocated Under Improved Maize Seed and Household Asset
Or Endowment Variables (Continuous)….………………………………………..…..90
Table 5.9 Intensity of Decision and Household Characteristics (Nominal)…….……..92
Table 5.10 Major Constraint to Increased Utilization……………………..……….….94
Table 5.11 A Multivariate Logitistic Estimation result…………………………….....98
Table 5.12 Tobit Estimation Result for Factors Affecting Intensity of Decision……103
10
LIST OF FIGURES
Page
Figure 2.1: The Nature of Seed Market (demand/supply) of Oromia Region During
2005/06 - 2010/11 Production Season ……………….……………….………….…....44
Figure 2.2: Analytical Framework of the Study Area…………………...…….………50
Figure 4.1 Map of Jimma Arjo Woreda ……………………………….……….....…..70
11
CHAPTER ONE: INTRODUCTION
1.1 Background
Though agricultural production in Africa has virtually been dominated by small-scale
farmers who produce up to 90 percent of the food consumed, such a high percentage of
farmers cannot meet the food demand of the entire region leading to a huge appropriation
of food aid into the continent annually (Odulaja and Fassil, 1996). The central issue in
forefront of government and policy makers therefore, is to work on how to accelerate the
agricultural production growth rate to meet the food needs of ever-growing population
which takes into account the problems of the majority of poor African farmers (Shields et
al., 1993). To this end, various agricultural technologies have been released to farmers
after being proved to be high yielding and potentially capable of solving food shortage
(Robson, 1990).
In Ethiopia, economic growth strategy formulated by the government in 1991 places high
priority on accelerating agricultural growth to achieve food security and poverty
alleviation; the core target of which was to increase cereal yields by focusing on
technological packages that combined credit, fertilizers, improved seeds and other
packages (Howard et al., 2003). However, the impacts of these implemented policies in
changing the livelihood of small holder farmers in particular and the public at large is
questionable with poor productivity growth and in general with no major benefits for
consumers as food prices do not show declining patterns.
12
According to Byerlee (2007), some of the major factors affecting the results of the
intensification program are low technical efficiency in the use of fertilizer, poor
performance of the extension service, shortcomings in seed quality and timeliness of seed
delivery, promotion of regionally inefficient allocation of fertilizer, no emergence of
private-sector retailers negatively affected by the government’s input distribution tied to
credit, and the generation of an unleveled playing field in the rural finance sector by the
guaranteed loan program with below-market interest rates. In Ethiopia, even though
adoption of improved agricultural technologies has been a long term concern, evidence
indicates that adoption rate of modern agricultural technologies in the country is very low
(Kebede et al., 1990). Small scale farmers’ decisions to adopt or reject agricultural
technologies depend on their objectives and constraints as well as cost and benefit
accruing to it (Million and Belay, 2004).
The seed system in Ethiopia consists of the formal seed sector, the informal or farmer
seed system, as well as the occasional emergency seed programs, which are often
operated by some NGOs and relief agencies. In most cases, it is not easy to differentiate
these three sectors in the seed value chain as there exist convergences of meaning with
respect to its operation and thus it is very difficult to set a clear demarcation line between
those systems (OSE, 2011).
The formal seed sector is the place where farmers can get access to a certified improved
seed though the sector could not adequately meet the seed demand of the vast majority
and it is still limited to a few major crop varieties developed by agricultural research
13
(Asrat et al., 2008). Although the government allowed any legal domestic entity to access
breeder seeds developed by the public institutions, the role of private seed companies did
not expand as expected since most farmers in Ethiopia relay heavily on the informal seed
system which accounted for about 80-90 percent (Zewdie et al., 2008).
Despite the release of several technologies, particularly of improved crop varieties, there
has been limited use of improved seeds by the majority of farmers which further
contributes for low agricultural productivity due mainly to, unavailability (outreach) of
quality seeds at the right place and time coupled with poor promotion system (CSA,
2010). In addition, the demand for commercial seed competes with farmer-saved seed,
making demand for the former highly price elastic (Jayne and Mayers, 2007).
In the study area, Jimma Arjo Woreda, the application of improved maize seed has been
a long practice following its introduction. The major types of improved maize varieties
distributed in the Woreda are; BH-660, BH-543, 30G19, and 30D79. Among those, BH-
660 has been the dominant and widely used variety in the area covering 53 percent of the
total improved maize seed distributed during 2011/12. In Jimma Arjo Woreda, though
farmers had been using improved maize seed since its introduction, the rate of adoption
and intensity of its application remained low as the report from the Woreda Office of
Agriculture reveals. The major constraints related to lower rate of adoption and intensity
increased price of the seed, weak credit facilities and problems related with the
distribution of seed and other complementary inputs like fertilizer and pesticides.

14
1.2 The Statement of the Problem
The adoption of new agricultural technology such as improved seed is central to
agricultural growth and poverty reduction through their effect of increasing agricultural
productivity and hence food self sufficiency (Minten and Barret, 2008). The study by
SG2000, (2002) supports the above argument by stating as maize productivity in western
Ethiopia increased to 5.4 tons per hectare from a 1.6 per hectare in 1993 mainly due to a
higher adoption of improved seed and fertilizer. Seemingly, adoption of improved seeds
has the power to improve household welfare as a study from Mexico cited in Becerril and
Abdulahi (2010) reveals. In addition, a report from World Bank, (2008) depicted a very
low adoption of productivity enhancing technologies have hampered efforts to reduce
rural poverty especially in developing countries.
Even though innovation of the new technologies is believed to improve the welfare of the
poor through enhancing agricultural productivity, the rate and level of improved seed
adoption is far below what is expected due mainly to many interrelated problems. The
causes for low adoption rate and fluctuation in seed uptake is expressed by a number of
attributes ranging from farmer and farm related characteristics to attributes related with
the technology itself, perception of its profitability and other socio economic reason.
Ethiopia has the lowest adoption rate in eastern African standards even though there is
dramatic increase since 1992 due mainly to the introduction of a new extension system
(CIMMYT, 1999). Besides, about 90 percent of seed supplied to farmers is from local
informal sectors which covers about 94 percent of the total cultivated land area and the

15
remaining 10 percent is formal seed (improved) sector which is dominated by
government owned enterprises and few private companies (ESE, 2011). So, this confirms
existence of problems related with adoption decision and the proportion of land allocated
to improved seed (improved maize in our case) as a greater proportion of seed source
comes from local exchange which has not passed through any quality certification.
In Jimma Arjo Woreda, the study area, average annual growth rate of improved maize
shows a decreasing trend. For instance, during 2004/05 production season, 48 quintals of
improved maize (BH-660) has been distributed. After 3 years; that is in 2007/08, the
amount decreased to 13 quintals. In addition, during 2011/12 production season, from the
total of 3180 hectare of land allocated to maize cultivation, the share of improved maize
seed amounted only to 22 percent while the remaining 78 percent of land was allocated to
the production of local maize variety showing the lowest adoption rate of improved
maize seed in the study area.
Among other things, factors that adversely or positively affect the adoption to the new
technologies were not given a due concern, the beneficiaries have not actively
participated in the technology development processes, the indigenous knowledge; which
can play a vital role in improving and enhancing technological development process was
overlooked and thus fail to comprehensively incorporate all the possible factors
explaining adoption decision and intensity of seed uptake.
16
Therefore, for a wider adoption and increased seed uptake, it is up to the researcher and
policy makers to search for the major determinants (institutional, socioeconomic and
human) factors affecting adoption decision and intensity of adopting improved maize
seed. It is such a gap that initiated the researcher to undertake a crossectional studies on
factors affecting adoption decision and proportion of land area allocated to improved
maize variety using the data collected from 394 hoouseholds for the 2011/12 croping
season.
1.3 Research Question
These research paper has been intended to answer the following questions;
1.What are those factors affecting the decision of a smallholder households whether to
purchase improved seed ?
2.What are the major factors afecting the proportion of land allocated to improved maize
seed or the intensity of adoption?
3.What are the major observable constraints behind the decision to adopt and amount of
land allocated to improved maize variety ?
1.4 Objectives of the Study
The General Objective of the paper was to understand and isolate important factors
determining smallholder farmer’s decision to adopt improved maize variety and their
level of Adoption.
17
The Specific Objectives of the study were:
To identify different farmer socioeconomic, institutional and other related factors
affecting the decision of farmers to adopt or not to adopt improved maize seed.
To investigate possible factors that affecting the simultaneous and inseparable
demand decision by farm households. That is the proportion of land area covered
under improved maize variety.
To explore the challenges related with both outcome decision (adoption decision
and proportion of land area allocated to improved maize variety).
1.5. Significance of the Study
In order to boost adoption rate of improved maize seed and its intensity of application to
a desirable level, stakeholders participating in the overall seed value chain has to
understand all the possible determinants of adoption decision and the subsequent decision
of intensity so that they can respond to the needy farmers accordingly. The prime
objectives investigated in this research was the estimation all the possible factors
affecting adoption decision and proportion of land allocated to improved maize variety
for a specific cropping season.
The result of this research would be helpful for extension workers, cooperative union’s
development agents, seed enterprises and other NGO’s in order to work on the
18
relationships established and gaps identified so as to take a quick response. It would also
be helpful for policy maker to redirect resources used for intervention (extension, credit,
demonstration, subsidy scheme) in accordance with the gap. The estimation result shown
in this research wills also calls for further research that would holistically incorporate all
the possible factors affecting adoption decision and proportion of land allocated to the
production improved maize variety in the major maize growing belts of Western Oromia.
1.6 Scope and Limitation
This study was conducted in Jimma Arjo Woreda located in Oromia Regional State.
Factors affecting adoption decision and proportion of land allocated to the chosen
technology were usually separate across the technology type or across crop variety. Thus,
the estimation of adoption decision and intensity of its application are limited to
improved maize only. The major limitations encountered during the study were the
following:
1. Some households were not willing to give correct data regarding their total land
holding for some questions for fear of tax or any other which probably affected the
quality of the data and the analysis made.
2. Some respondents were unable to tell us the exact figure especially question related
with household endowment attribute due mainly to memory lapse or any other case
which had again an impact on the quality of our data.
19
3. Shortage of time and resources was another constraints faced during the study. Since
the sample size was large, it needs more recourses and time.
1.7 Organization of the Study
The thesis is generally organized into six chapters. The first chapters demonstrate an
introductory part which incorporates: background, statement of the problem, research
questions, objectives, significance of the study, and limitations of the study. The second
chapter is devoted to literature review and formulation of analytical framework of the
study. It illustrates briefly the review of literatures related with adoption of agricultural
innovation, the nature of seed market system in the country, the theoretical justification
and empirical evidences related with adoption decision and intensity of applying
improved maize seed and the subsequent constraint related with it. Chapter three deals
with the research methodology where data set of the study, methods of data analysis, and
variables to be analyzed are hypothesized and briefly explained. Chapter depicts about
the general background of the study area and the sample households interviewed. Chapter
five discuses the results of the research outcomes from the data collected and finally
chapter six presents summary and concluding remarks and recommendations.

20
CHAPTER TWO: LITERATURE REVIEW
2.1 Definition of Adoption and Diffusion of Agricultural Technologies
Adoption is defined as the integration of an innovation into farmers’ normal farming
activities over an extended period of time. It does not refers to a permanent behavior
since a farmer may decide to discontinue the use of an innovation for a variety of
personal, institutional, and social reasons one of which might be the availability of
another practice that is better in satisfying farmers’ needs (Dasgupta,1989).
According to Feder et al., (1985), adoption is classified as an individual (farm level)
adoption and aggregate adoption. The former refers to the degree of use of new
technology in long run equilibrium when the farmer has full information about the new
technology and its potential whereas the later refers to the spread of new technology
within a region and is measured by the aggregate level of specific new technology with a
given geographical area or within the given population. Similarly, according to Rogers
(1983), adoption is a mental process through which individual passes. That is, the process
that starts from hearing about an innovation or technology to final adoption decision
indicating that adoption is not a sudden event. Rogers (1983) state adoption as a process
since farmers do not accept innovations immediately until they take time and think over
things before reaching a decision.
The rate of adoption is defined as the percentage of farmers who have adopted a given
technology. Lionberger (1968) indicates that ordinarily adoptions are very slow at first,
increase at an increasing rate until approximately half of the potential adopters have
21
accepted the change. After this, acceptance continues, but at a decreasing rate indicating
that that the rate of adoption follows S-shaped curve.
The intensity of adoption is defined as the level of adoption of a given technology. The
number of hectares planted with improved seed (also tested as the percentage of each
farm planted to improved seed). Nkonya (1997) defines intensity of adoption as the
amount of input applied per hectare as compared to the total land.
It takes time for an innovation to diffuse through a social system. It is unrealistic to
expect that all farmers in a community will adopt an innovation immediately after its
introduction as there is always a variation among the members of a social system in the
way they respond to innovative idea or practice (Shoemaker, 1971).
While there are always a few members in a social system who are so innovative that they
adopt an innovation almost immediately after they come to know about it, the majority
take a long time before accepting the new idea or practice (Dasgupta, 1989). Moreover,
people adopt the innovation in an ordered time sequence, and they may be classified into
adopter categories on the basis of when they first begin using the new idea. According to
Dasgupta, (1989), although farmers often reject an innovation instead of adopting it, non
adoption of an innovation does not necessarily mean rejection as farmers are sometimes
unable to adopt an innovation, even though they have mentally accepted it (probably
because of economic and situational constraints).
22
2.2 Theories of Adoption and Diffusion of Agricultural Technologies
In the literature of innovation of agricultural technologies, adoption and diffusion are
used together and sometimes interchangeably used both referring to the processes that
govern innovation (Feder et al., 1985). According to Sunding and Zilberman (2001),
adoption studies analyze factors that affect if and when a farmer will begin using an
innovation (whether or not a farmer uses improved seed or how much of their land they
cultivate with improved seed) while diffusion studies analyzes how an innovation
penetrates its potential market (share of farmers who use improved seed or in the share of
land in total agricultural land that is cultivated with improved seed). Earlier empirical
studies relating adoption of agricultural innovations describes diffusion as an S-shaped
function of time which has grouped the determinant of adoption and diffusion into 4 parts
(Morris et al., 1999).
i)Varietal Characteristics: Refers to the net benefit to be achieved from utilizing the
variety as compared to its local counterparts which includes yield or expected gross
margin, input prices, uncertainty associated with the variety riskiness of the variety.
ii) Farm-level Characteristics: Includes the assessment or investigation of the climatic
and agro-ecological suitability of the location for the variety and quality of the land (if
the variety fits with the soil of that specific land to be applied to).
iii) Farmer Characteristics: This are usually tied to institution and policy framework
since institutions and government can influence those characteristics under consideration.
23
It includes agronomic expertise & skills, knowledge about variety, risk aversion, capital
availability, and access to credit.
iv) Institutional Characteristics: Refers to all the actors that would take part in the seed
supply, distribution and innovation which have then a greater role to play in determining
the market supply, consumer price and market demand for improved varieties. We will
further group and illustrate this determinants in our conceptual framework model of our
specific study area.
2.3 Stages in Adoption Process
The classical 5-stage concept (awareness, interest, evaluation, trial, adoption) formulated
by the North Central Rural Sociologists Committee has been the most widely accepted
concept in explaining the stages of adoptions. It was initially exposed to a wider criticism
by Campbell (1966) and later also by Rogers and Shoemaker (1971) who then designed
the innovation decision process. According to Rogers (2003) and Gross (1943), adoption
and diffusion studies focus on how farmers evaluate the new seeds and act on the
evaluations which happen in several stages described below.
Stage- 1 Knowledge: This is the characterstics of decision making unit or farmer
community in terms of prior exposure and knowledge of the general farm technology. It
also refers to the cases where individuals evaluate the payoffs from old and new
technology which also takes into account farmers socioeconomic characterstics,
personality varriables and comunication behaviours (Marra et al.,(2003).
24
As an alternative to individual learning, there are also social processes that might
override or replace empirical evaluations of the relative utility of improved seed.
According to Munshi (2004), the social dynamics affecting adoption of innovation are
based on teaching and imitation which will happen possibly through two ways.
i) Farmers copy other farmers on the basis of prestige, regardless of that farmer’s actual
success with the innovation (reinforcing word of mouth from adopters loop).
ii) Farmers also adopt an innovation when and because it has been adopted by many
others (reinforcing word of mouth from non adopters loop). However, adoption of
innovation through social learning has been criticized to operate in all circumstances and
in all socio cultural setup. For instance, social learning may spread maladaptive beliefs
and thus rely largely on biases and other factors that are weakly connected to actual
profitability evaluations especially in the case when the uncertainty is very high (Stone et
al., 2007).
Stage -2 Persuation: This refers to the percieved character of innovation and thus the
innovator or institutions responsible for supplying this innovation has a major role to play
in this process. Rogers (1995) have identified five characteristics of agricultural
innovations which are important in adoption studies as the following.

25
i) Relative Advantage: Is the degree to which an innovation is perceived as better than the
idea it supersede. In other words, it is to mean the superiority of the given technology in
terms of perhaps yield, maturity period and pest or weed resistance than the one that
preceded it.
ii) Compatibility: The degree to which the farmer perceives an innovation to be
consistent with his/her cultural values and beliefs, traditional management objectives, the
existing level of technology and stages of development.
iii) Complexity: The degree to which an innovation is perceived to be complex to
understand and use by farmers.
iv) Trial Ability: The degree to which the innovation could easily be tried by farmer on
his/her farm as most farmers have seen to be better convinced only when they have
physically exposed to the innovation that they want to apply.
v) Observability: The degree to which results of innovation are visible to farmers in
terms of the special attributes related with the innovation as compared to the conventional
ones (better yield, resistance to pest and disease and quality).In the study area, we have
also observed such a characteristics of the innovation to determine the both the
probability of adoption of the innovation and the scale of operations (we will discuss it
later in chapter five).
26
Stage-3 Decision: This is the product of the above process that is finally made by the
user of the innovations about either to accept or not. Adoption decision involves both
continued adoption and withdrawals. Seemingly, rejection involves continued rejection
and latter adoption.
Stage-4 Implementation: the next step after adoption decision that a farmer convinced
and decides to accept the new innovation and then applied it on its plots.
Stage-5: Confirmation: After farmers have decided to implement the innovation, then
she/he confirms Viability and the relative advantage of the new technology as compared
to the pre existing ones (in terms of yield and other parameters).
The determination of which process best explain and influence adoption of agricultural
innovation however depends on the stages of adoption; the characteristics of specific crop
under studies and the socioeconomic and geographic nature of the societies under
investigation (Sebastian and Birgit, (2009). For instance, adoption decisions are driven
more by objective evaluations in the early stages when the share of adopters on the total
farmer population (measured in the cultivated agricultural land) is still low whereas when
the number of adopter increases social dynamics tends to override objective evaluations.
The choice of specific policies to stimulate adoption and diffusion of improved seed too
depend on the relative dominance of the individual and social learning feedback loops,
specific characteristics of the corresponding crops as well as Countries or Regions.
27
2.4 Approaches Used In Modeling Adoption of Modern Agricultural
Technologies
Economic modeling of technology adoption particularly those of which is related to
adoption of high yield varieties (HYV) has taken many different forms. The most
pertinent approaches noted in agricultural technology adoption literature are the choice of
technique approach based on profit maximization, a target input model that focuses on
learning and the risk adverse approach (Mariapia, 2007).
2.4.1 The Choice of Technique Approach (profit maximization Models)
According to this approach, when the household is a price taker in all markets, for all
commodities which it both consumes and produces, optimal household production can be
determined independent of leisure and consumption choices. Thus, given the maximum
income level derived from profit-maximizing production, family labor supply and
commodity consumption decisions can be made (McGuirk and Mundlak , 1991).
The choice of technique approach focuses on choosing inputs to maximize profit which
in turn leads to decision rule that emphasizes prices, input constraints and environmental
factors as the key determinants of the scale of adoption. The most dominant hypothesis in
this approach is the one that is developed by Schultz’s (1964), the hypothesis that farm
households in developing countries are “poor but efficient” which largely relay on two
major aspects.
Firstly, efficiency is the manifestation of adoption of profit maximized farm household
strategy and thus poor farmers according to Schultz allocate resources in a manner
28
consistent with neoclassical model of a firm. Secondly, since farmers are assumed to be
efficient, development effort should aimed at providing the best condition for the
efficient application of these models. In addition, conditions should be laid down to
facilitate the emergency of technical innovation, the only way through which efficient
peasant can increase their output. Thus, since the potentials of all the existing
technologies are exhausted by poor farmers who have the capacity to respond rapidly to
the new opportunities, what are needed are only the new technological options supported
by price signals.
The central idea of this approach rested on the assumption that a farm household decision
is influenced by a single monetary variable that is profit and thus defines happiness in
terms of profit (the objective function).The other assumption is the one that states
economic agents as they are certain of the outcomes of their decision as they possess a
perfect knowledge and information. In addition, they are also free to combine resources
in amount needed to maximize profit without any cultural and institutional restraints.
Thus, the choice of technique approach will characterize the farmer’s production and
consumption decision as long as the above assumption is valid.
2.4.2 The Target-Input Approach (Utility maximization Theories)
Households operating in developing countries are likely to face more than one market
imperfection, which prevents first-best transactions and investments from taking place as
empirical analyses based on the above approach have generally produced negative results
when applied in farm household decision making.
29
In a situation when economic agents are uncertain of their decision, the market is
imperfect (both product and input market) and there exist information asymmetry,
modeling farm households based on profit maximization approach becomes very difficult
(Janvry et al., (1991). According to this approach, a household tries to maximize the
objective function that is a discounted future stream of expected utility from a list of
consumption goods (including home produced goods, purchased goods, and leisure), but
subject to what may be a large set of constraints in which a missing market is yet another
constraint on the household. This approach thus provides a framework which allows for
the possibility of learning from the experience of neighboring farmers and own
experience through Bayesian updating about optimal input use.
2.4.3 The Risk Adverse Approach
The above two approaches (choice of technique and target input) have many defects in
describing a farm household decision because they ignore the effect on farm household
behavior of the uncertainty and risk involved in peasant production, and the social
context in which peasant production takes place. In addition, most of those models are
static and assume that prospects are certain or, equivalently, that households are risk-
neutral (Taylor and Adelman, 2003).
Peasants produce under very high levels of uncertainty induced by natural hazards like
weather, pests, diseases, natural disasters, market fluctuations and social uncertainty
which pose risks to Peasant production and make farmers very cautious in their decision
30
making. Therefore, farmers are generally assumed to exhibit risk aversion in their
decision making. For instance, Lipton (1968) criticized the profit approach and shows
how the existence of uncertainty and risk eroded the theoretical basis of the profit-
maximizing model. He argued that small farmers are, of necessity, risk-averse, because
they have to secure their household needs from their current production or face starvation
and thus there is no room for aiming at higher income levels by taking risky decisions
(Lipton and Longhurst, 1989).
There are two ways of conceptualizing farm households’ risk-aversion: The Standard
Expected Utility Theory (Food First) and the Disaster Avoidance Approach (Safety
First). According to the former approach, farm households make choices from available
risky alternatives, based on what appeals most to their given preferences in relation to
outcomes and their beliefs about the probability of their occurrence. In such a normative
approach, both household behavior and its revealed attitude toward risk (risk aversion)
are reflected in its utility function.
Other things being equal, a risk-averse household prefers a smooth consumption stream
to a fluctuating one, which in contexts of incomplete capital markets or underdeveloped
institutional arrangements entails a low risk portfolio choice of productive activities
(Morduch, 1994). On the other hand, the complexity of risks faced by peasant farmers
has led some analysts to develop allocative choice models that do not depend on the
ability to calculate expected returns for large numbers of alternative prospects or
knowledge about complex probability distribution of outcomes. However, it fails to
31
specify the decision process that makes the outcomes possible, and thus ignores any
important role of decision costs in analyzing decision-making behavior under uncertainty
(Adelman, 2003).
The other model is called the safety first approach. Here, the decision maker is assumed
to ensure survival for him or herself and therefore wants to avoid the risk of his or her
income or return falling below a certain minimum (subsistence) level. Such a criterion
can lead to the household favoring either risky income streams or low risk alternatives.
This is to say that there are no reasons to expect individuals would behave in conformity
with the expected utility theory at very low levels of income, which is in stressful
circumstances (Dasgupta, 1993). Thus, the attraction of the safety-first approach is that it
is a positive method to capture some specific behaviors that can be culled from the
expected utility theory (as the normative model of choice under uncertainty) near
threshold income levels.
So far, most studies made in adoption of agricultural innovations particularly on adoption
of improved seed varieties analyses the determinants of adoption decision and the
subsequent intensity decision following one of the approaches discussed above. The
selection of those approaches for estimating the determinants of adoption decision has
been usually made by taking into account the general socioeconomic and institutional set
up of that specific society under study that has supposed to fall within the approach
selected. Each of those approach listed has a specific problem inherent in their
assumption and thus fail to fully explain all the possible factors guiding adoption of
32
agricultural innovations that fit with the specific characteristics of the society and little
works have been done so far in this area that investigate all those determinants
comprehensively. Thus, this research will lay down some contribution to the literature of
adoption of agricultural technology which takes into account all possible factors
holistically by incorporating the special attributes inherent in each approach.
2.5 Empirical Correlates of Farm Technology Adoption Decision
A cross sectional studies conducted at a micro level have laid down a useful tool in
capturing the varying factors affecting decisions on the adoption of improved
technologies by a farm households, the choice of crops that they are actually growing,
their preferences for a specific technology and hence used as an important tool in policy
decisions especially on the allocation of budget to research, extension and agricultural
development project (CIMMYT, 1993).
Different studies in the past follow different procedures and hence respective models in
analyzing the varying factors that affect the adoption decision and demand for improved
seed varieties by farm households. The selection of each procedures and models thus
depends on the objectives and the realities of the specific localities under investigation.
One of the approaches is the one that model farm household production decision and
consumption decision as different and independent of one another. The choice of such a
model is based on the assumption that; there is different stochastic process that
determines both the discrete outcome and the continuous outcome so that each decision is
33
independent of one another and hence they are treated separately. For instance, the
studies by Gezhaegn, (1999), Genanew and Alemu, (2010) analyses adoption decision
and demand for seed based on a separable household approach and estimate factors
affecting the adoption decision and proportion of land allocated to improved maize using
a double hurdle model (joint use of the probit model and the truncated regression model)
in investigating the adoption decision and demand for improved maize varieties.
The second alternative approach is the one that models adoption decision and demand as
one and interrelated process and thus disproves the former approach up on the notion that
such approach is only consistent with commercially oriented farm households in a
competitive market and thus fail to operate in a small holder farm community
characterized by too much uncertainty, no specialization and imperfections in both
product and input market (Hiebert, 1974) and (Smale, 1994).
Therefore, from the review of past literatures one can learn that, it is the job of the
researcher to choose which approach or procedure to follow to model farm household
adoption decision and the subsequent choice. In this paper, factors affecting both
outcome decisions are grouped and analyzed under demographic, socioeconomic,
psychological, and institutional factors.
2.5.1 Demographic Factors
The descriptive information on age and literacy level of a household age has an important
base in determining both the adoption decision and the subsequent decision of intensity.

34
For example, the study by Tesfaye and Shiferaw, (2001) which has used a logit model in
analyzing adoption decision of 1482 farm households in maize growing regions of
Oromia, Amhara and Southern Regions shows that age of a household head and literacy
level as an important factor in adoption decision. Age of a household head was estimated
to affect the decision as the higher the age of the household head, the better his
experience and hence confidence whereas the latter as increased knowledge and
awareness.
With regards to the educational attainment of the household head, most studies shows
educational status of a household head has also significantly associated with both the
decision to adopt or not and the proportion of area allocated to the variety. For instance,
the study by Zavale et al., (2005) has found a positive and significant correlation between
education and the probability of adoption of improved maize seeds. However, many
studies found to have a negative relationship with regards to both outcome decisions. For
instance, according to studies conducted by CIMMYT (1993) in Tanzania, adoption
decision has no statistically significant relationship with years of formal education. In
Ethiopia also, the effect of educational attainment of the household head has a greater
influence on the timing of decision rather than adoption decision (Weir and Knight,
2000).
A review of empirical literature related with family size adjusted to its adult equivalents
shows many contrasting figure. For instance, Sain.G and J. Martinez, (2004) states that
family size has no significant relationship with decision of whether to adopt improved
35
maize or not. Seemingly, the works by Brush, Taylor, and Bellon (1990) supports the
above argument.
2.5.2 Socioeconomic Factors
Among the proxy for wealth measurement factors that has a positive and significant
correlation is the size of household land holding. The size of farmland owned by the
household is associated with the decision to use improved maize varieties, since land is
the scarcest production resource in this part of the country (Bellon, 1990).
According to Feeder et al., (1985), the coefficient of household land size has a
significantly positive correlation with adoption decision due to the fact that it is a
surrogate for a large number of factors such as size of wealth, access to credit, capacity to
bear risk, access to information and other factors. The study conducted by CMMYT,
(1993) in Tanzania dictates that land size has a positive relationship with adoption of
improved maize. In addition, a study by Sain, G., and J. Martinez, (2004) indicates that
an increase of 10 percent in the total farm area results in an increase of approximately
12.5 percent in the probability of sowing part of the maize acreage with hybrid maize.
This figure is also consistent with those found in other studies on adoption of new
technologies (Brush, Taylor, and Bellon, 1990). On contrary, similar studies by the same
institution CIMMYT (1993) in Ethiopia shows that land size has no significant
correlation with adoption decision rather with the amount of fertilizers purchased.

36
2.5.3 Institutional Factors
Institutions; structured by rules and norms of society play a vital role in protecting,
resource mobilization, resource management, service provision, information exchange,
enhancing popular participation, protecting peasant interest and enhancing their claim
making power, and conflict resolution regulating and in the overall management of the
environment and the general ecosystem (Gidden, 1979).
Institution related variables like membership to primary cooperative, acces to credit,
access to extension service, attending maize seed demonstration have a positive and
significant relationship with both adoption decision and proportion of land area allocated
to improved maize. In most studies, farmers who grew improved varieties were more
likely to have extension contact than farmers who were not. Evidence suggests that
network effects are important for individual decisions and that in the particular context of
agricultural innovations; farmers share information and learn from each other (Foster and
Rosenzweig, 1995) and (Conley and Udry, 2000). The study by Tesfaye and Bedasa,
(2001) reveals that 93% and 32% of adopters attended field demonstrations and use credit
and respectively which implies that, for instance, moving a farmer from a situation of no
access to credit to access would significantly improve adoption decisions. In addition,
access to credit is important factors affecting adoption decision. According to a research
conducted in Ethiopia (Bale highland and lowlands) by CIMMYT (1999), lack of credit
was a constraint for 26% of adopters and 31% of non adopters.

37
Distance from the input and output market has also a positive relationship with adoption
decision because the further away a village or a household is from input and output
markets, the smaller is the likelihood that they will adopt new technology and it is
directly associated with extension contact which helps to improve their knowledge and
builds confidence and hence increase the marginal benefit of adopting the new
technology (Birgit and Sebastian, 2009). Besides, extension contacts also provided
inputs, which increased the correlation between extension contact and use of improved
technologies.
Membership to a primary cooperative also appears to have a positive and significant
influence on adoption decisions via improved information dissemination. For instance, it
is the primary cooperative that improved seed distributions are mad so that members can
easily access seed at reasonable price than the non members (ESE, 2011).
According to Uaiene et al., (2006), Membership to some association is also important for
small holder farmers in that it serves as a potential for overcoming credit market failures).
He argued that inventory credit programs have the potential of creating confidence
between farmers and financial institutions thus allowing farmers to have access to farm
credit from such institutions using their collective grains in a community warehouse as
collateral which would be facilitated if farmers are grouped in associations.
2.5.4 Psychological Factors
Knowledge of technology application acts as an intervening variable between attitudes

38
towards the technology and use of the technology (Rogers, 1961). Farmers’ attitudes;
which are evaluative responses towards the technology are important in determining
adoption of improved technology. Chilonda and Van Huylenbroeck, et al., (2001) suggest
that attitudes towards improved maize varieties place great emphasis on two factors:
Production Characteristics and Income Factors and hence adopters tend to hold positive
attitudes towards the technology than non adopters.
Most studies and literatures of adoption dictates that knowledge of the specific
agricultural technology and the attributes related with its relative yield, disease resistance
and seed quality has a significant and positive relationship with the outcome variables.
This is due to the fact that the more farmers became knowledgeable on a given
technology and its application, the more confident they will be and the lower the
probability of failure.
2.6 Seed System and Smallholder Agriculture in Ethiopia
As agriculture is a core driver of Ethiopia's economy supporting 85 percent of the
population's livelihoods, 46 percent of gross domestic product, and 80 percent of export
value, an efficient and vibrant seed system that provides quality seed to meet the
demands of farmers is an essential enabler to sustain the growing economic and social
development of Ethiopia (IFPRI, 2010).
Majority of farmers in Ethiopia are smallholder farms, producing mostly for own
consumption and generating little marketed surplus. Only 40 percent of the smallholders
cultivate more than 0.90 hectare and these ‘medium-sized farms’ account for three-

39
quarters of total area cultivated. Large farms (averaging 32 hectares per farm) are not
widely spread in Ethiopia and the contribution of these farms to total agricultural output
is insignificant (CSA, 2007).In addition, during 2007/08, smallholder farmers (12.8
million farmers) cultivated 12 million hectares of land or 96.3 percent of the total area
cultivated and they have generated 95 percent of total production for the main crops
(cereals, pulses, oilseeds, vegetables, root crops, fruits, and cash crops). In contrast, large
farms contributed to only 5 percent of total production of which about 2.6 percent
accounts for cereal production in particular.
Seed system in Ethiopia represents the entire complex organizational, institutional, and
individual operations associated with the development, multiplication, processing,
storage, distribution, and marketing of seed in the country (ESE, 2011).Seed systems in
Ethiopia can be divided into two broad types: The Formal System and the Informal
System (sometimes called Local or Farmers Seed System) and Integrated Seed System.
There is also a system referred to as Integrated Seed System. That is forms of seed
systems operating in both systems called community-Based Seed System (CBSS). Thus,
since the first two system systems are operating simultaneously in the country, it is
difficult to demarcate between the two.
2.6.1 The Formal Seed System
According to Dawit et al., (2011), the formal seed system is a system that involves the
production of seed using known sources of planting materials that undergoes certification
40
process for its seed production. It encompasses at least breeding system that supply initial
planting material, licensed seed producers and regulatory system that certify the produced
seed which is governed by strict regulations in order to maintain variety identity and
purity as well as to guarantee physical, physiological and sanitary quality (OSE, 2011).
In Ethiopia, the major actors of the formal system are National Agricultural Research
Systems, Ministry of Agriculture, Ethiopian Seed Enterprise and Private Seed Companies
specializing on specific crops like Pioneer Hi Bred Seed (ESE, 2011).Recently, regional
seed enterprises were also established as public seed enterprises such as Oromiya Seed
Enterprise, Amhara Seed Enterprise, and Southern Nations Nationalities and Peoples
Region Seed Enterprise.
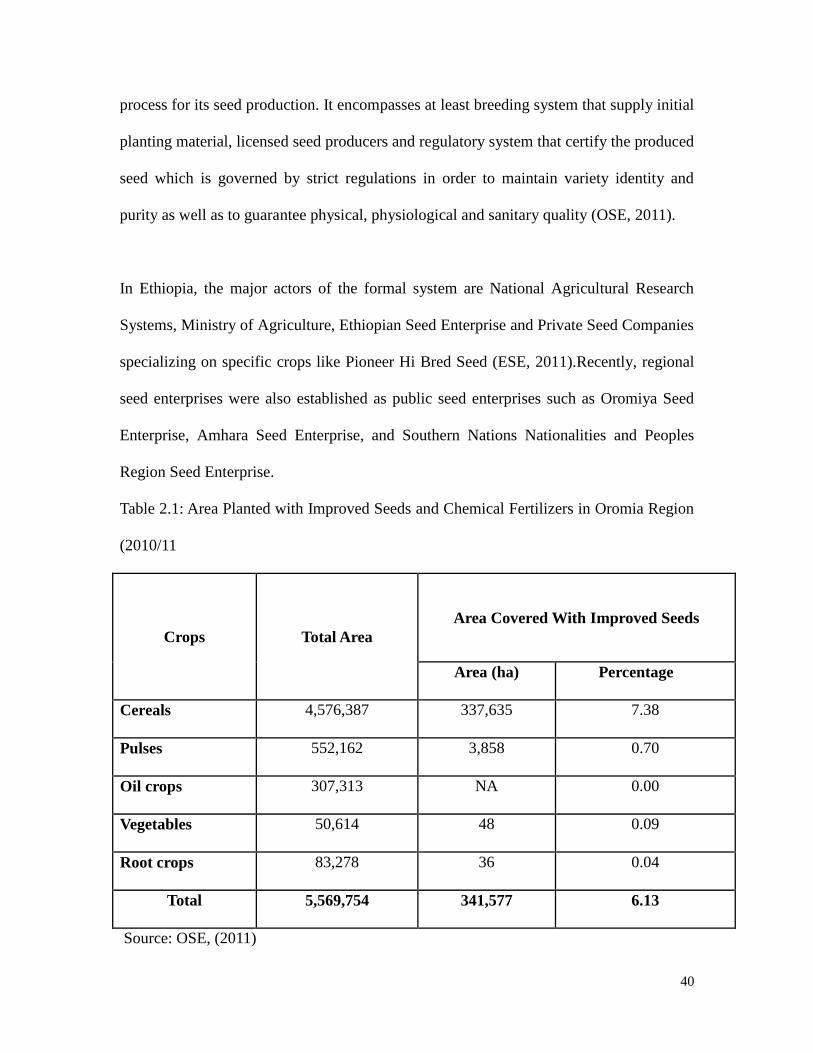
Table 2.1: Area Planted with Improved Seeds and Chemical Fertilizers in Oromia Region
(2010/11
Crops Total Area
Area Covered With Improved Seeds
Area (ha) Percentage
Cereals 4,576,387 337,635 7.38
Pulses 552,162 3,858 0.70
Oil crops 307,313 NA 0.00
Vegetables 50,614 48 0.09
Root crops 83,278 36 0.04
Total 5,569,754 341,577 6.13
Source: OSE, (2011)

41
In addition, private seed producers and farmers (both small scale and commercial) also
play a major role in the overall seed system especially in multiplication of breeder seed.
For instance, in 2008, of all commercially produced seed, 83 percent was produced by
ESE of which 8 percent on its own farms, 35 percent through contracts with large farms
and 39 percent through contracts with small farmers), and the remaining 17 percent by
private producers (ESE, 2011).
Table 2.2: Seed Supply of Major Cereals in Oromia Region from 2008/09 to 2010/11
Crop Seed Production in qt (2008-2010/11)
2008/09 2009/10 2010/11
Wheat 475.6 32,754 17,404
Food Barley - 187 760.5
Malt barley - 1071 1,561.1
Tef
-
181.7
319
Maize hybrid 3,000 31,614.4 20,117.2
Maize OPV 606.1 1,368 115
Sorghum - - 16.6
Hair cot bean - 118 174
Soy bean - 107.8 137.6
Sesame - - 55.3
Onion 1.39 1.00 0.54
Total 4,083
67,403 40,661
Source: Compiled from OSE Annual Reports (2011)
42
The Formal Seed Sector supplies 20,000 to 30,000 tons of seed per year across all crops,
representing only 3 to 6 percent of farmers’ actual seed demand which may also vary
across different crops. Improved seed demand across Cereal itself varies showing the
highest for Maize (50 percent) and lowest for Barely(less than 10 percent).
Though supply shortfalls are the major problems of formal seed sector, farmers have too
little access to affordable, quality, high yielding varieties mainly due to lack of
information, high price in relation to local seeds and problems related with seed
distribution and low access to credit there by leading to low adoption rate (OSE, 2011).
2.6.2 The Informal Seed System
Ethiopian seed enterprise defines Informal Seed System as a seed production and
distribution along with the different actors where there is no legal certification in the
process which includes retained seed by farmers, farmer-to-farmer seed exchange,
community based seed multiplication and distribution. According to Cromwell, Friis-
Hansen, and Turner (1992), five key features distinguish the informal from the formal
system among which are: the informal system is traditional; semi structured, operate at
the individual or community level, uses a wide range of exchange mechanisms, and
usually deal with small quantities of seeds often demanded by farmers.
The Informal Seed System is also known as local system or sometimes as farmers
system, because it operates under non-law regulated and characterized by farmer-to-

43
farmer seed exchange which accounts the highest share of seed production and area
coverage (OSE, 2011).
Table 2.3: Area Covered (ha) by Informal seeds over the Last Five Years (2005/06-
2009/10)
Crops Cropping Season
2005/06 2006/07 2007/08 2008/09 2009/10
Cereals 7,636,935 8,127,710 8,309,899 8,333,097 7,660,560
Pulses 1,283,564 1,373,914 1,509,394 1,568,457 1,358,379
Oil crops 790,471 736,791 702,518 851,626 706,361
Vegetables 116,298 94,636 118,026 159,626 122,832
Root crops 167,189 186,804 180,624 143,761 183,254
Total 10,821,810 11,427,794 11,927,093 12,010,042 10,136,744
Source: CSA, (2010)
For countries like Ethiopia, informal seed sector plays a major role in enhancing seed
security since the bulk of total seeds(about 60-70 percent) are supplied by these system
and much of the cultivated land (about 94% in 2010/11 cropping season) is covered with
seed supplied from the informal seed system ESE (2011).
2.6.3 The Supply-Demand Gap in Seed Market
Though the seed market equilibrium is characterized by huge gap or mismatch between
the supply and demand (demand surpass supply), the supply of these technologies,
44
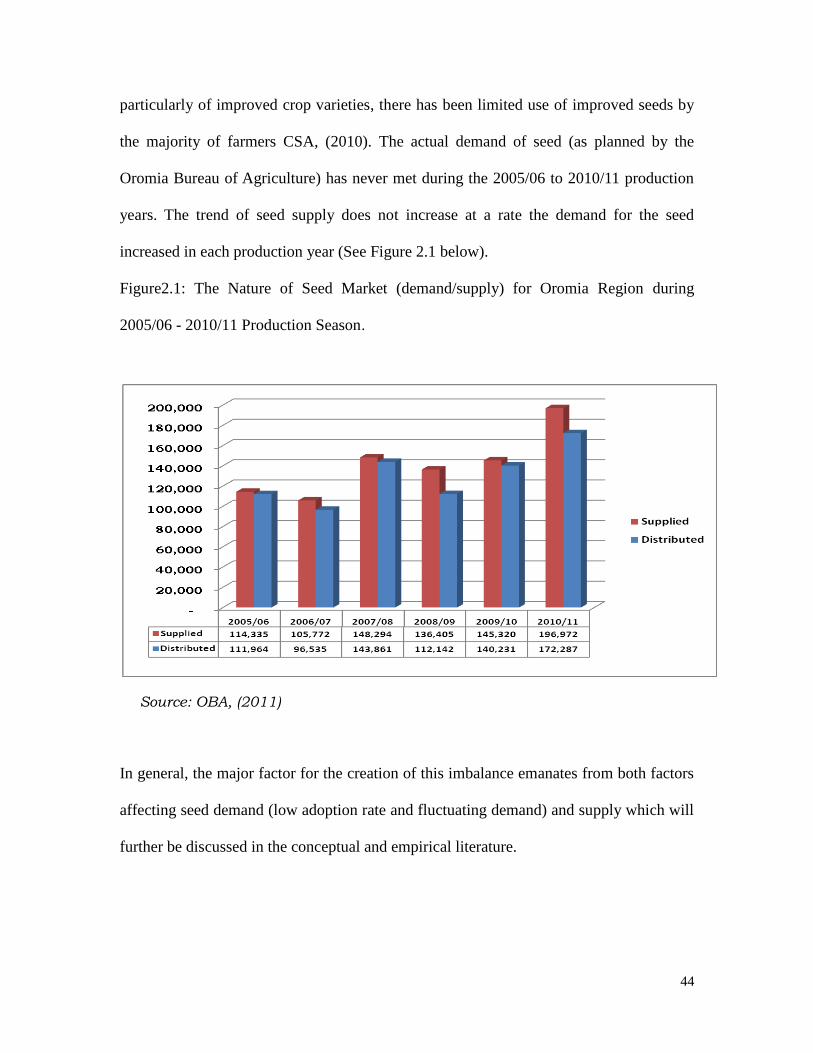
particularly of improved crop varieties, there has been limited use of improved seeds by
the majority of farmers CSA, (2010). The actual demand of seed (as planned by the
Oromia Bureau of Agriculture) has never met during the 2005/06 to 2010/11 production
years. The trend of seed supply does not increase at a rate the demand for the seed
increased in each production year (See Figure 2.1 below).
Figure2.1: The Nature of Seed Market (demand/supply) for Oromia Region during
2005/06 - 2010/11 Production Season.
Source: OBA, (2011)
In general, the major factor for the creation of this imbalance emanates from both factors
affecting seed demand (low adoption rate and fluctuating demand) and supply which will
further be discussed in the conceptual and empirical literature.

45
2.7 Adoption of Hybrid Maize Seeds and Food Security
The adoption of improved technologies for staple crop production is an important means
to increase the productivity of smallholder agriculture in Africa, thereby fostering
economic growth and improved well being for millions of poor households CMMYT,
(1999). Thus, sustainable flow and use of improved agricultural technology is the
solution to increased growth and agricultural productivity. The cultivation of maize
improves the livelihood of small holder farmers both as a means of income and as source
of food calories. For instance in Tanzania, maize is also an important cash crop,
competing with cotton for land and labor and in Kenya, maize is a major staple food and
the main source of income and employment for most households (Ouma et al., 2002).
Maize is grown in most parts of Ethiopia, with the major production regions located in
the southern, western, southwestern, and eastern highlands. In addition, maize is currently
grown across 13 agro-ecological zones which together cover about 90 percent of the
country. Moreover, it is an increasingly popular crop in Ethiopia as the area covered by
improved maize varieties grew from five percent of total area under maize cultivation in
1997 to 20 percent in 2006 (CSA , 2006).
The recent introduction of several new maize varieties in Ethiopia illustrates the potential
importance of this seed industry and the contribution of improved maize varieties to
Ethiopia’s agricultural sector. However, some studies show that despite the predictable
high yield derivable from hybrid maize, the national average grain yields of maize have
fallen short consistently of the potential yields (Alemu, 2001).
46
2.8 Analytical Framework
The Theory of Agricultural Household by Singh, Squire, and Strauss (1986) states
though there are many factors that is considered in adoption decision and demand for
improved technologies, profitability is the major one in determining the overall process
of adoption of new technologies (Byerlee et al., 1980). Such theory applies to decision
making in this context and includes profit maximization as a special case when markets
are perfect and production and consumption decisions are separable. Otherwise, in a case
where the market is not perfect, high uncertainty and limited information. The decision of
whether to use improved seed and subsequent decision of intensity result from the
choices of consumption amounts and product combinations that maximize the utility of
the farm household, subject to a full income constraint that embodies non-farm and farm
income net of expenditures, credit and repayment, and family labor availability.
The starting point for our analysis in this research is based on the assumption that
adoption decision and demand function derived from a non-separable agricultural
household model. That is farm household production and consumption decisions are
unlikely to be separable given imperfections in labor, credit, and other markets. As a
consequence of non-separability, both production and consumption-side variables may
affect household decision to adopt and the subsequent proportion of farm lands allocated
to improved seeds (improved maize in our case). The conceptual model used to estimate
the intensity of use for improved seed can be illustrated using a scheme in which the
farmer must choose between two alternatives: Either using local seed or using improved

47
seed. On the basis of this theory, a household model is specified to explicitly incorporate
variety attributes and used to derive seed demand equations.
Let the household utility function of a household id defined as U .Thus, the prime
objective of the household is to will maximize its expected utility(U) subject to different
set of constraints (production technology, income, time,) which is summarized as follows.
MaxU(chm,clm,cm,cl;zh)
(qhm,qlm,llm,lhm,qxhm,chm,cm,cl) ………………………………………1(Objective Function)
Subject to:
Y[qhm,qxhm, qlm,llm,lhm,ls,qxhm;zq] ……………………2 (Technology Constraint)
(pxhmqxhm+pmcm+ phmchm)-(phmqhm +plmqlm + wls +I )……3 (Full Income Constraint)
Ls+llm+lhm+cl =T……………………….………4 (Labor Time Constraint)
The Lagrangian Utility Maximization Function based on the inseparable household
model is explicitly stated as follows:
L =U(chm,clm,cm,cl;zh) + λ1[Y(qhm,qxhm, qlm,llm,lhm,ls,qxhm;zq)] +λ2[(pxhm qxhm + pmcm +
phmchm) - (phmqhm+plmqlm + wls +I )] +λ3(T- Ls - llm - lhm- cl ) …………………………(5)
Thus, the household can determine the decision of whether to apply the technology or to
stay with the local variety by maximizing the utility derived from consuming the two
alternative products by taking into account the set of constraints listed above. After
deciding the best alternative from the option (modern versus local) or the combination of
the two, the subsequent decision will be the amount of land to be allocated for each
48
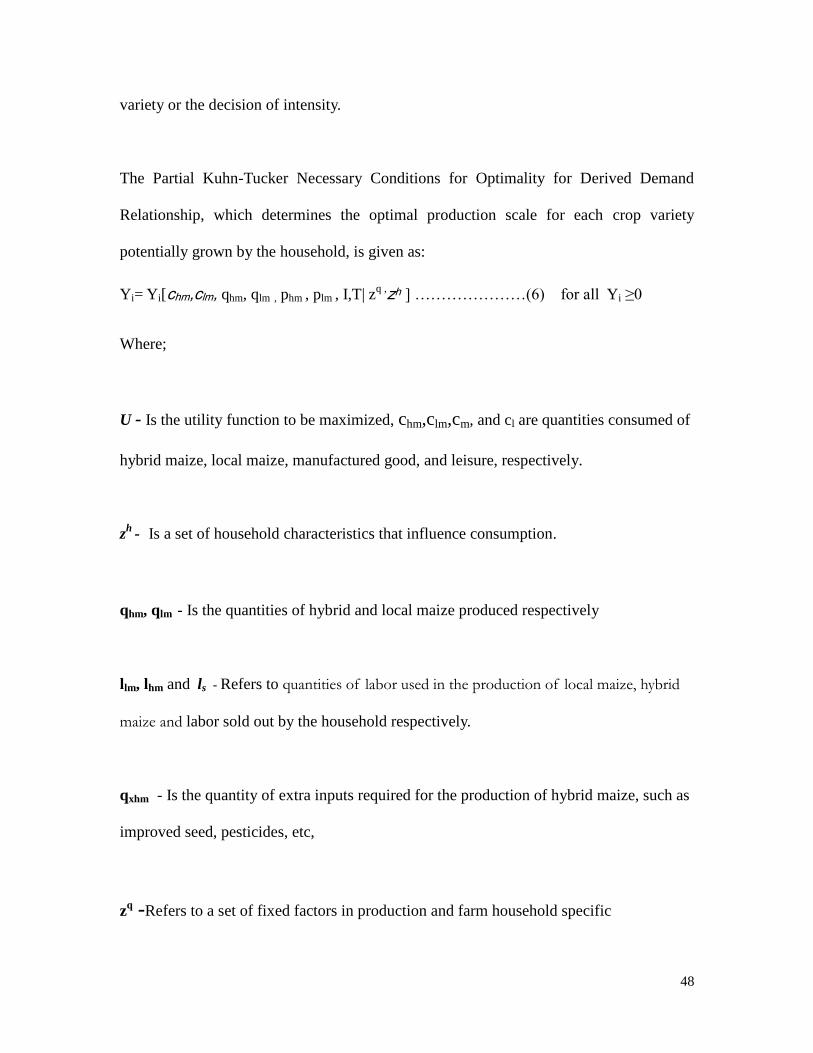
variety or the decision of intensity.
The Partial Kuhn-Tucker Necessary Conditions for Optimality for Derived Demand
Relationship, which determines the optimal production scale for each crop variety
potentially grown by the household, is given as:
Yi= Yi[chm,clm, qhm, qlm , phm , plm , I,T| zq ,zh ] …………………(6) for all Yi ≥0
Where;
U - Is the utility function to be maximized, chm,clm,cm, and cl are quantities consumed of
hybrid maize, local maize, manufactured good, and leisure, respectively.
zh
- Is a set of household characteristics that influence consumption.
qhm, qlm - Is the quantities of hybrid and local maize produced respectively
llm, lhm and ls - Refers to quantities of labor used in the production of local maize, hybrid
maize and labor sold out by the household respectively.
qxhm - Is the quantity of extra inputs required for the production of hybrid maize, such as
improved seed, pesticides, etc,
zq -Refers to a set of fixed factors in production and farm household specific

49
characteristics that influence production.
The coefficient λ1, λ2, λ3 in the above function is a multiplier associated with production
technology, income and time constraint respectively. Thus, the above conceptual model
elaborates the decision that a farm household makes to adopt a given agricultural
technology by comparing the expected utility derived from applying a given technology
against the local variety and thus chooses the one with the best utility. This decision is
based on the notion that the household is operating in an environment characterized by
too much uncertainty and imperfection it was discussed in the target input approach.
2.8.1 Conceptual Framework of the Study Area
The analytical framework constructed below have mainly aimed at explaining different
factors affecting farmers’ adoption decision and intensity of the decision particularly
those which contribute to the variations in adoption and intensity of adoption of improved
maize variety among farmers. The conceptual framework of the study area constructed
below displays systematic relationship existing between our outcome decision (both
adoption decision and intensity) and the different set of farmhouse hold characteristics
grouped under; institution related, demographic, endowment and perception and
production technique. The framework was built in a way to explain the relationship
between our outcome decision and set of household characteristics grouped under four
major categories. In addition there was also some minimal and unobservable relationship
between those covariates which was found during multicolinierty diagnosis.

50
Figure 2.2: Analytical Framework of the Study Area
Source: Sketch by Author
Demographic
Off-farm income
Literacy
Gender
Marital status
Age
Have family
member in town
Endowment Related
Variables
Land
Family size
Livestock
Hired Labor
Livestock
owned
Irrigation
Institution Related
Variables
Cooperative
membership
Credit Access
Attended Field
day
Distance from
DA
Distance from
market
Contact
Extension Agent
Psychological and
production
attributes
Attitude
Knowledge
Production
technique
Fertilizer
application
Adoption Decision
Decision of Intensity
51
CHAPTER THREE: METHODOLOGY
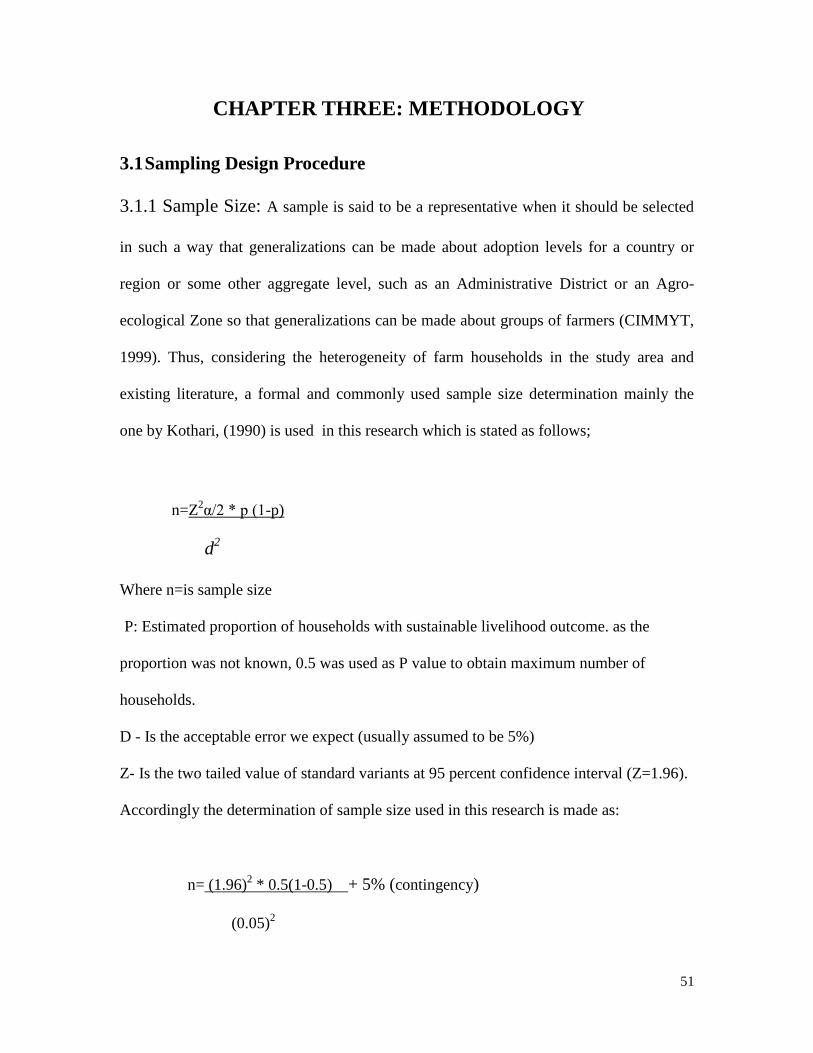
3.1 Sampling Design Procedure
3.1.1 Sample Size: A sample is said to be a representative when it should be selected
in such a way that generalizations can be made about adoption levels for a country or
region or some other aggregate level, such as an Administrative District or an Agro-
ecological Zone so that generalizations can be made about groups of farmers (CIMMYT,
1999). Thus, considering the heterogeneity of farm households in the study area and
existing literature, a formal and commonly used sample size determination mainly the
one by Kothari, (1990) is used in this research which is stated as follows;
n=Z2α/2 * p (1-p)
d2
Where n=is sample size
P: Estimated proportion of households with sustainable livelihood outcome. as the
proportion was not known, 0.5 was used as P value to obtain maximum number of
households.
D - Is the acceptable error we expect (usually assumed to be 5%)
Z- Is the two tailed value of standard variants at 95 percent confidence interval (Z=1.96).
Accordingly the determination of sample size used in this research is made as:
n= (1.96)2 * 0.5(1-0.5) + 5% (contingency)
(0.05)2

52
n=384 + 20 = 404
3.1.2 Sampling Procedure: After fixing the sample size, the two stage random
sampling technique has been used to collect the primary data from farmers that are used
to make our sample size more representative. First, all the 20 Kebeles (Farmers
Association) found under the administration of the Woreda was grouped into three agro
ecological zones namely Lowland, Mid Highland and Highland. Then, the total number
of kebeles to be included in the sample selection from each agro ecology was made by
applying equal proportion based on their size (number of kebeles). Accordingly, a total of
four kebeles was selected two kebeles from Mid Highlands and one kebele from each
Highland and Lowlands (see appendix).
The decision about the specific kebeles selected for data collection was the issue of
serious concern since there were overlapping similarities in temperature, soil types and
amount of rainfall between some agro ecologies. Thus, with the help of woreda
Agronomist, selection was made keeping those heterogeneities (altitude, soil and
rainfall).
In the second stage, after getting the total number of households living in each selected
kebeles from the Woreda Office of Agriculture, the number of households selected from
each kebele was determined by allocating the total sample size of 404 proportionally
across each. Lastly, Lottery Method was applied in identifying the specific household to
be interviewed in the sample within each kebeles giving special emphasis to female
53
household heads since their number was found to be lower. Thus, from the total of 404
farm households, only 394 of them (about 97.5 percent) have been contacted and given
responses. The remaining households were not willing to respond for some known and
unknown reason.
3.1.3 Method of Data Collection and Ethical Consideration
The data required for this study was collected from both primary and secondary sources.
The primary data was collected using structured questionnaires (both close ended and
open ended) that has addressed household’s resource endowment, institutional related
variables, demographic variables and others. The questionnaires were fist written in
English and then translated into Afaan Oromo. Then, the questionnaire was administered
to the farmers by trained enumerators.
The total of four enumerators have been selected, one from each agro ecological zones
and was given training on the subject matter and Techniques of data collection. The
selection was made based on the criterion of 10th
-grade completion, ability to
communicate in Afaan Oromo language, good knowledge of the agriculture and farming
system of the area and good motivation to work. In addition, one supervisor has been
selected who frequently control the overall data collection activities, cross-check
validities and any other errors.
Along with primary data, secondary data was also collected from the Woreda
Agricultural Bureau, Seed Enterprises Offices (both regional and federal), Research
54
Institutions, and Central Statistical Agency. Besides, different Web Pages, administrative
documents (both published and unpublished), and journals were used.
With regards to ethical consideration, all the selected interviewers has given a letter of
permission from Woreda administration. Then, household has been informed before the
interview that all their responses would be kept secret and also they were told not to
respond to any question if they do not want to do so. Accordingly only volunteer 394
household head have been participated in the study based on their verbal consent.
3.2 Method of Data Analysis
To address the various objectives described above, the framework has an inherent
character to encompass all variables that have direct and indirect influence on the issue of
adoption decision and level of adoption by small holder farmers in the study area. Thus,
both descriptive and econometric method of data analysis has been employed in order to
address the objective inherent in this research.
3.2.1 Descriptive Method
Descriptive method was employed to explain the situation of demographic and
socioeconomic variables. Descriptive method was used to access adoption decision and
the intensity of use of improved maize variety in the study area. The specific methods of
data analysis employed here include tools like frequency, mean, standard deviation and
percentage was computed for different variables.

55
3.2.2 Econometric Method
Different studies follow different approaches and subsequently the model appropriate
under each approach following the existence of divergent thought in adoption studies.
Thus, different analytical models like OLS, double hurdle, logit and tobit were to be used
alternatively after fitting it to their respective data. For instance, the study by Genanew
and Alemu (2010) employed a double hurdle model in estimating adoption decision and
the subsequent decision of intensity based on the assumption that the adoption decision
and intensity of use of improved seed are determined by two separate stochastic
processes. Thus, it is up to the researcher to select the best model that fit with the
observed data taking into account the specific attributes of that society. Accordingly,
binary logistic and tobit model was employed in this research in order to estimate factors
affecting adoption decision and the proportion of land allocated to improved maize
respectively. The detail descriptions of these models are presented below.
i) Estimating Adoption Decision of Farm Households
Usually adoption studies uses either probit or logit models alternatively in estimating
adoption decision. The substantive results in both models are generally indistinguishable
and produce very similar results. But, in many studies, logit model was usually preferred
best since the parameter estimates in a logistic regression tend to be 1.6 to 1.8 times
higher than they are in a corresponding probit model (Long, et al., 1997). Accordingly,
logit model has been applied in this research to estimate factors affecting farm household
decision to adopt improved maize seed for 2011/12 production season.

56
A multivariate binary logistic regression was employed using SPSS software to estimate
the first discrete outcome decision (adoption decision). Thus, in order to estimate binary
outcome of adoption decision of ith
farm households logistic regression function at a time
t, the logistic regression function are stated below:
P(Y) = ln[p/(1-p)] = 0 + 1X
Where
P(Y) – is the probability that ith
household will adopt an improved maize seed at a time t
xis a function of n number of explanatory variables expressed as:
p/(1-p) is the "odds ratio which ranges from 0 to ∞ with values greater than 1 associated
with an event being more likely to occur than to not occur and values less than 1
associated with an event that is less likely to occur than not occur.
ln[p/(1-p)]: log odds ratio, or "logit“ ranging from -∞ to +∞
ix =X1 X2 ...nXn e
i’s referring to the coefficient of the logit parameters while Xi’s refers to the covariates.
The coefficients shows by how much the log-odds is in favor adopting improved maize
seed change as the value of the explanatory variable changes by a unit. Accordingly, the
odds ratio and log odds are calculated to estimate the change in dependent variables due
to a unit change in explanatory variables.
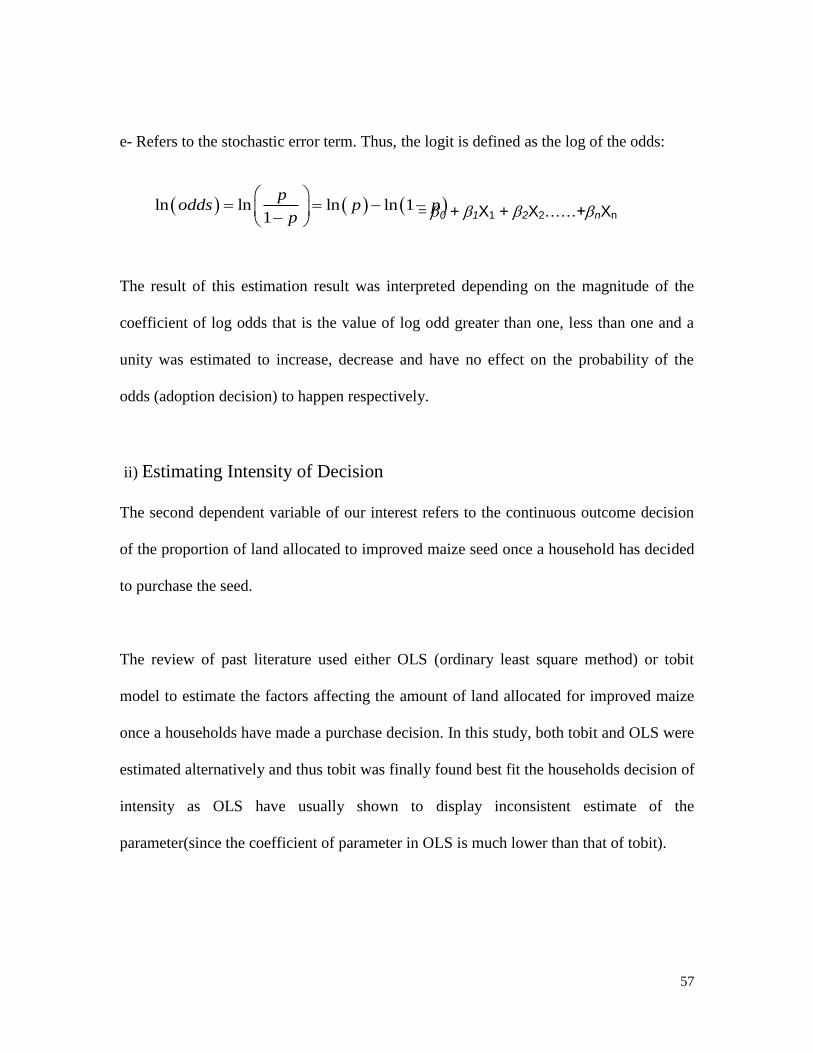
57
e- Refers to the stochastic error term. Thus, the logit is defined as the log of the odds:
=0 + 1X1 + 2X2……+nXn
The result of this estimation result was interpreted depending on the magnitude of the
coefficient of log odds that is the value of log odd greater than one, less than one and a
unity was estimated to increase, decrease and have no effect on the probability of the
odds (adoption decision) to happen respectively.
ii) Estimating Intensity of Decision
The second dependent variable of our interest refers to the continuous outcome decision
of the proportion of land allocated to improved maize seed once a household has decided
to purchase the seed.
The review of past literature used either OLS (ordinary least square method) or tobit
model to estimate the factors affecting the amount of land allocated for improved maize
once a households have made a purchase decision. In this study, both tobit and OLS were
estimated alternatively and thus tobit was finally found best fit the households decision of
intensity as OLS have usually shown to display inconsistent estimate of the
parameter(since the coefficient of parameter in OLS is much lower than that of tobit).
ln ln ln ln 11
podds p p
p
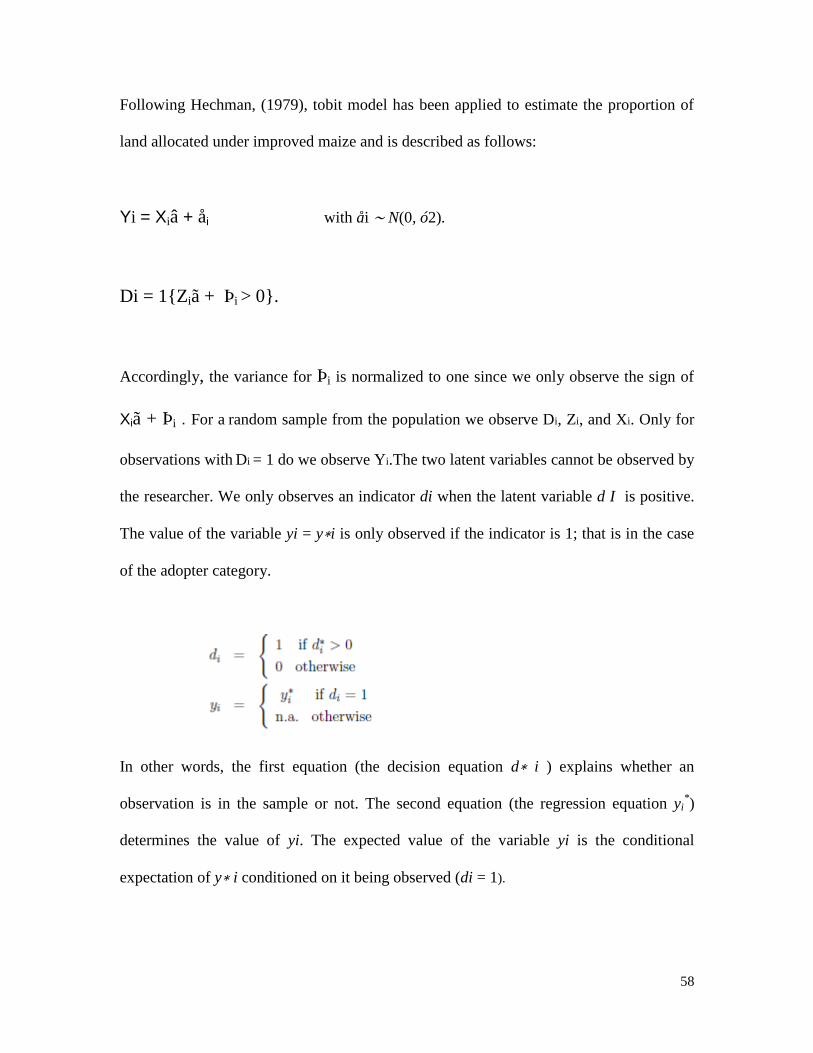
58
Following Hechman, (1979), tobit model has been applied to estimate the proportion of
land allocated under improved maize and is described as follows:
Yi = Xiâ + åi with åi ∼ N(0, ó2).
Di = 1{Ziã + Þi > 0}.
Accordingly, the variance for Þi is normalized to one since we only observe the sign of
Xiã + Þi . For a random sample from the population we observe Di, Zi, and Xi. Only for
observations with Di = 1 do we observe Yi.The two latent variables cannot be observed by
the researcher. We only observes an indicator di when the latent variable d I is positive.
The value of the variable yi = y∗i is only observed if the indicator is 1; that is in the case
of the adopter category.
In other words, the first equation (the decision equation d∗ i ) explains whether an
observation is in the sample or not. The second equation (the regression equation yi*)
determines the value of yi. The expected value of the variable yi is the conditional
expectation of y∗ i conditioned on it being observed (di = 1).

59
The partial effects are used in estimating the impact of explanatory variable on our
continuous outcome which is described as follows. Now, let me compute P(y>0|x)
However, we need to know the overall effect of the parameter estimate rather than the
effect for specific which is stated as:
Thus, our second outcome decision (Tobit Estimation Model) stating the proportion of
land allocated to improved maize (from the total maize production) has the following
form:
Di = βZik + ei ………………………………………………………9
Where;
Di : Is the amount of hectare of land allocated to production of improved maize variety
T : Is the non observed threshold level.
8...............................................................).........()|(
10
1
x
x
xyE
7...............................................................).........(
)(1
),(
)),((
)|0()|0(
10
10
10
10
10
x
x
xxu
P
xxuP
xuxPxyP
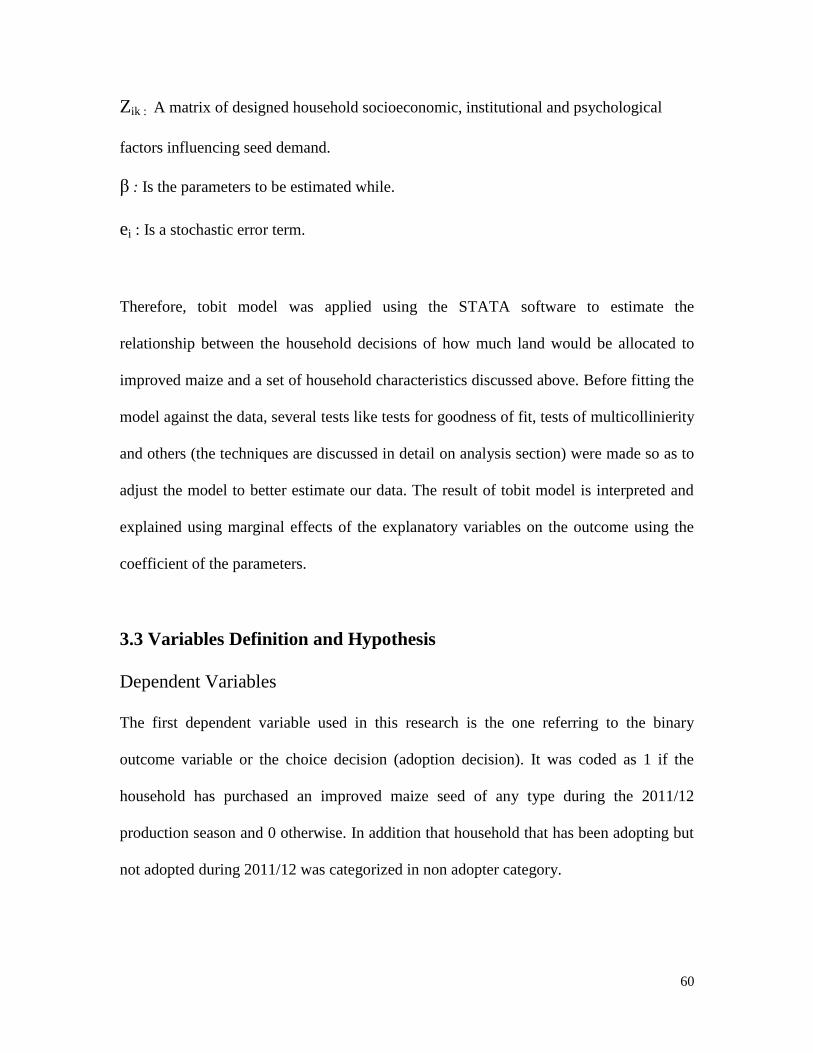
60
Zik : A matrix of designed household socioeconomic, institutional and psychological
factors influencing seed demand.
β : Is the parameters to be estimated while.
ei : Is a stochastic error term.
Therefore, tobit model was applied using the STATA software to estimate the
relationship between the household decisions of how much land would be allocated to
improved maize and a set of household characteristics discussed above. Before fitting the
model against the data, several tests like tests for goodness of fit, tests of multicollinierity
and others (the techniques are discussed in detail on analysis section) were made so as to
adjust the model to better estimate our data. The result of tobit model is interpreted and
explained using marginal effects of the explanatory variables on the outcome using the
coefficient of the parameters.
3.3 Variables Definition and Hypothesis
Dependent Variables
The first dependent variable used in this research is the one referring to the binary
outcome variable or the choice decision (adoption decision). It was coded as 1 if the
household has purchased an improved maize seed of any type during the 2011/12
production season and 0 otherwise. In addition that household that has been adopting but
not adopted during 2011/12 was categorized in non adopter category.
61
The second outcome decision refers to the continuous decision preferably named as
intensity of adoption. It refers to the proportion of land area allocated to improved maize
seeds from the total number of land allocated to total maize production (including the
local maize).The value of the second outcome is numeric with values between 0 and 1
excluding the two extremes (1 and 0 are the two border points).Note that only those
households who vote 1 during the binary adoption decision are included in the second
outcome decision.
Explanatory Variables
Regarding the criteria for choosing explanatory variables, as there is no firm economic
theory that clearly dictates the choice of independent variables used in adoption studies as
in Adesina and Zinnah, (1993) and Langyintuo et al., (2003). In this specific model, the
selection of the variables which tested the factors affecting the incidence and intensity of
adoption are based on prior literature which are categorized as the following.
i) Farmers Socio-economic Variables: (age of a household head, income from off-
farm activities, experience in modern farming method, sex of a household head, and
literacy level of a household head).
ii) Institution Related Variables: member of cooperative union ,access to
formal/informal credit, access to extension service, Attend field day or visit
demonstration plot, Formal training on improved maize production, access to
fertilizer and improved maize on time ,formal training on maize, have a Radio.

62
iii) Farmers Endowment Variables: (total farm size, family size (adjusted to adult
equivalent), livestock ownership size (TLU), hired labor (a dummy), use
community labor for farm operation.
iv) Farmers Psychological Variables: (Prior Knowledge, Perception/Attitude): The
details of explanatory variables determining factors affecting adoption decision and
allocation of land under improved maize are hypothesized as follows.
1. Farm Size: This variable is a proxy to measure a household wealth and it is
expected to be positively associated with both the decision to adopt amount to be
applied improved maize technology since a farmer with a large landholding have
a greater access to resources and better to assume risk. It can also encourage
farmers to intensify their production, in which case a larger farm size is expected
to be negatively related to the adoption of improved maize technology.
2. Literacy Level: The more educated the household head is, the more he allocates
his limited resources by analyzing the net benefit to be achieved from applying
the technology. Education of a farm household head can have a positive influence
on the outcome variables thereby increasing the likelihood of adoption decision.

63
3. Livestock Unit: Possession of livestock is one of farm household’s productive
assets. Thus, it is expected to be positively related with both adoption decision
and intensity of adoption (amount of land covered under improved maize).
4. Extension Service: It is through the extension service which disseminates
information about the improved variety in particular and the overall agricultural
technology knowhow in general to the farm community. So, it is expected to be
positively related with the probability of adoption and the intensity of application.
5. Household Size: As household size is grouped under household endowment
category, large household size is expected to positively affect adoption decision.
Each individual family member is converted into their adult equivalents as per the
conversion factor.
6. Field day Attended (attending maize seed demonstration): Attending a field day
or demonstration of improved maize seed is also expected to positively related to
both outcome decisions through its impact of increasing farmers awareness or
exposure to the technology.
7. Off-Farm Income: Access to other income generating activities out of agriculture
is expected to increase the likelihood of adoption decision through diversifying
their income source so that cost of complementary inputs is easily financed.
64
8. Hired Labor: Hired labor helps farmers to overcome labor constraints, especially
with respect to the number of hand weeding required for improved maize. Thus,
access to hired labor is expected to have a positive and significant influence on
the adoption of maize technologies.
9. Cooperative Membership: Being a member of cooperative union could help the
farmer in easily accessing farm inputs and other related information and hence it
is expected to have positively related with both outcome variables.
10. Access to Credit: Not only the physical availability but also easy access to these
resources can affects the decision of farm community positively. Moreover,
access to credit also affects both decisions through affecting the farm household’s
cash constraints.
11. Farmers Perception of Yield: This variable states the perception or the attitude of
farm household towards yield advantage of the improved maize variety (as
compared to the alternative option i.e local maize, or towards productivity or any
other reasons. Perception is expected to be positively affecting the adoption
decision.
12. Household Perception of Better Resistance Attributes of Improved Maize:
Household perception about the better resistance of improved maize to field and
65
storage pests have expected to be positively related with both our outcome
decisions.
13. Age of a Household Head: Is a proxy to measure number of years of farming
experience of head of a household and is expected to affect both our outcome
positively because the higher the age of household head, the higher they get
information and experience in farm management and practice. The age of
household head is incorporated as one of the explanatory variable because it is
believed that with age, farmers accumulate more personal capital and, thus, show
a greater likelihood of investing in innovations (Nkamleu et al., 1998).
14. Fertilizer Application: Knowledge of Fertilizer application according to the
recommended mixing would have been expected to be positively affected the
adoption decision and intensity of adoption.
15. Maize Planting Practice: This is related to whether they obey during maize
production the recommended spacing between rows and across each plant. And
this is expected to be positively affecting our adoption decision.
16. Distance from Market Center: Refers to the location of household existence both
from input (maize seed market) and output market (cereal market) which is to be
measured by the travel hours it takes. It is expected to negatively correlate with
both outcome variables.
66
17. Gender of Household Age: This refers to whether the head of household to be
investigated is male or female and the correlation is expected to be negative with
both our outcome decision.
18. Amount of Total Maize Produced: This is the amount of hectare of land allocated
to both improved and local seeds. Since increased application of maize seed is
associated with the maize popularity and good perception in a household it is
expected to be significantly associated with both our outcome variables.
19. Distance from DA (Development Agents) Office: The longer the house of a farm
household (in hours of travel) from the development agents, the more difficult
would it be in easily accessing information about agricultural technology. Thus
positive relationship is hypothesized for both outcome variables.
20. Marital Status: Marital status of the household is expected to be positively related
with adoption decision and amount of improved seed applied because the more
the household is married the more they share information and allocate resources
and thus enhancing adoption.
21. Have a Family Member living in a Town or Abroad: This is expected to be
positively related with both decision since having a member living in a town may
67
be interpreted with some form of help (financial, technical) or assistance that
helps a farm household in using the technology.
22. Saving in Cash or in Kind: Farm household who saves the annual produce either
in cash or in kind is financially strong enough to survive any kind of production
shock as compared to those who save not. Thus a positive relationship will be
expected with both outcome decisions.
23. Cash Crop Production: Cash crops have a premium price as compared to the
cereal crops and in some cases, they will be produced more than two times a
year(chat for example).so those households who are engaged in cash crop
production along with cereal ones have expected to positively related with both
outcome decision.
24. Access to Irrigation: Access to irrigation is also expected to positively related with
both outcome decision since access to irrigation is related with increased
production and decreased reliance on rain (and hence reduced expectation of risk
of failure).In addition, access to irrigation facilities would be expected to have a
positive relationship with our continuous outcome; our second outcome decision
through its indirect effect on boosting the farmers financial status through the
production of other food and cash crops which may be harvested more than twice
in a year.
68
25. Perception of Cost: This refers to how the household perceive the cost of
improved maize vis. a Vis. Its benefit (perhaps yield advantage) in relative to the
local variety. The more farmers perceive positively about the cost of improved
maize seeds (along with other complementary packages), the higher probability
that they would be adopted and intensively used. So, positive association is
expected with both of our outcome variables.
69
CHAPTER FOUR: BACKGROUND OF THE STUDY AREA
AND THE SAMPLE RESPONDENTS
4.1 Geographical Setting of the Study Area
4.1.1 Location
Jimma Arjo Woreda is located in East Wollega Zone, Oromia National Regional State.
Located at 379 km from Addis Ababa, the Woreda lies between 8045N and 360 29’E. It
occupies nearly 3.05 percent of the zone’s total area & is contiguous with Nunu Kumba
in the east and Leka Dulecha in the North, and Ilu Abba Bora Zone in the South and
North West of the District. Covering the total land area of about 75, 812 hectare, the
district is situated at an altitude greater than 1200 meters above sea level which is
characterized as tropical and sub tropical types of climate with the mean annual
temperature between 15 0c and 20
0c and means annual rainfall ranging from 1400 to
2000mm.
4.1.2 Topography
Table 4.1 Distribution of Woreda into Kebeles and Agro- ecologies
Agro-ecology Area covered(in
square km)
Percentage Number of Kebeles located
under each Agro-ecology
Lowland 221.50 29 5
Midland 447.95 59 10
Highland 89.02 12 5
Total 758.47 100 20
Source: Jimma Arjo Woreda Office of Agriculture
4.1.3 Relief, Climate and Soil Type
The region is characterized by ups and downs like the other districts bordering it. With
70
the exception of areas along the Dhidhessa River valley, most of the land has higher
altitude; especially areas surrounding Jimma Arjo town has an elevation greater than
2000 meters above sea level.
Figure 4.1 Map of Jimma Arjo Woreda
Source: From Dula et.al, (2007)
71
Regarding climate, most areas of Jimma Arjo are situated at an altitude greater than 1200
meters above sea level; the district is characterized as tropical and sub tropical types of
climate. The area is found in the western highlands of the country where rainfall is
expected throughout the year. However, due to altitudinal variation different parts of the
district receive different amount of rainfall. Accordingly, June, July, and August are the
months when the area receives maximum rainfall. Mean monthly rainfall is minimum
during the months of November, December, January, and February.
The mean annual temperature ranges between 15 o
c and 20 o
c and there is no significant
variation in mean monthly temperature of the district. May is the hottest month with
mean temperature of 190c while July and August are the months when the mean monthly
temperature is registered to be 15oc.In addition, mean annual rainfall is between 1400 and
2000mm. June, July, and August are the months when the area receives maximum
rainfall. Mean monthly rainfall is minimum during the months of November, December,
and January.
The soil type of the district among others include; Dystric Nitosols and Orthic Acrisols.
These are the major soil types in the area which have good agricultural potential. On the
other hand, Orthic Acrisols, which occur mostly on sloping terrain and have less
agricultural potential, occupy the areas along the Dhidhessa river valley.
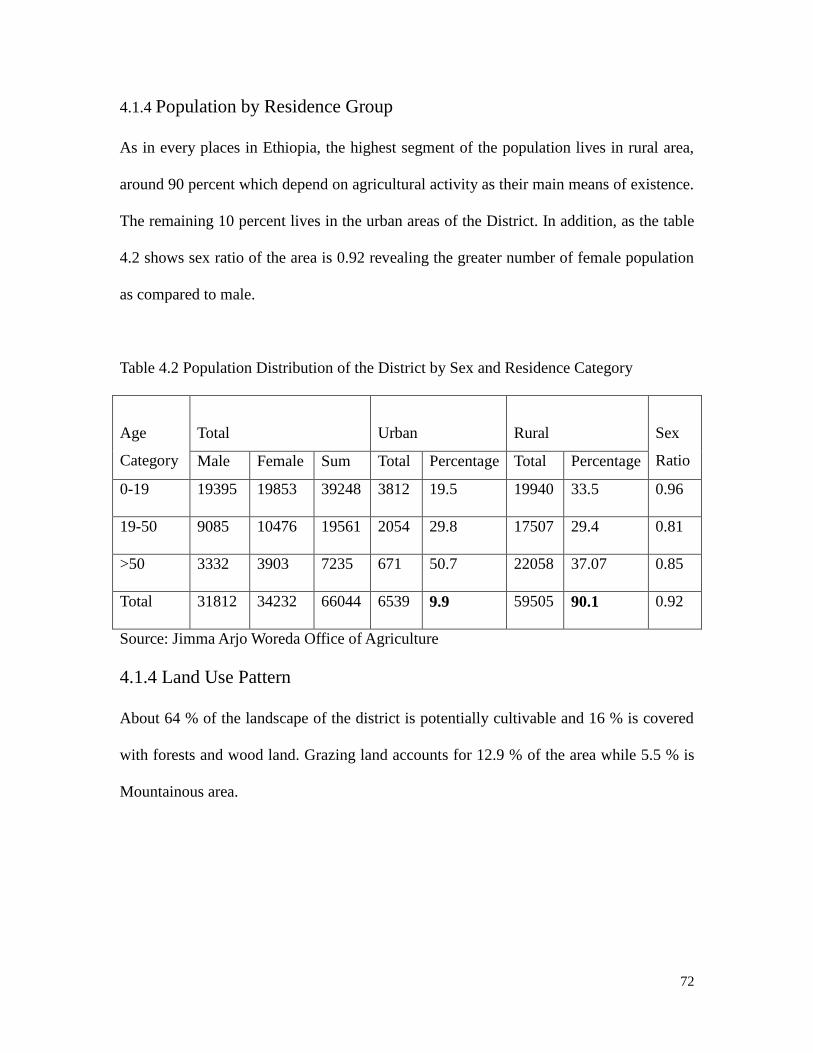
72
4.1.4 Population by Residence Group
As in every places in Ethiopia, the highest segment of the population lives in rural area,
around 90 percent which depend on agricultural activity as their main means of existence.
The remaining 10 percent lives in the urban areas of the District. In addition, as the table
4.2 shows sex ratio of the area is 0.92 revealing the greater number of female population
as compared to male.
Table 4.2 Population Distribution of the District by Sex and Residence Category
Age
Category
Total
Urban
Rural
Sex
Ratio Male Female Sum Total Percentage Total Percentage
0-19 19395 19853 39248 3812 19.5 19940 33.5 0.96
19-50 9085 10476 19561 2054 29.8 17507 29.4 0.81
>50 3332 3903 7235 671 50.7 22058 37.07 0.85
Total 31812 34232 66044 6539 9.9 59505 90.1 0.92
Source: Jimma Arjo Woreda Office of Agriculture
4.1.4 Land Use Pattern
About 64 % of the landscape of the district is potentially cultivable and 16 % is covered
with forests and wood land. Grazing land accounts for 12.9 % of the area while 5.5 % is
Mountainous area.

73
Table 4.3: Total Land Use Pattern of the District
Land use type Size (km 2) Percentage
1 Potential arable land 519.78 76
2 Pasture land / grazing land 88.84 12.99
3 Forest Land 18.19 2.66
4 Swampy & marshy land 3.49 0.51
5 Others 53.62 7.84
Total 683.92 100
Source: Jimma Arjo Woreda Office of Agriculture
4.1.5 Means of Livelihood
The major livelihood incomes in the area includes crop production (Maize, Sorghum, Teff
Nuog, Millet), livestock production (Cattle, Goat, Sheep, Cow’s Milk and Butter sale,
Chicken sale and Egg production) and other food and cash income(Tree sale, sale of
agricultural labor ,Firewood sale, and Honey production).
4.2 Demographic Characteristics of the Sample Respondents
The demographic and socioeconomic descriptors of the community are one of the major
influential factors in dealing with adoption and diffusion of agricultural innovation
particularly of seed and fertilizer (See Table 4.4 below)

74
Table 4.4: Demographic Distributions of Sample Households
Household
demographic
characteristics
Response category Frequency Percentage
Age of
household head
<= 18 1 0.3
19 – 49 294 74.6
50+ 99 25.1
Family size <= 3.8 213 54.1
>3.8 181 45.9
educational level
of household
head
Illiterate 178 45.2
1-6 126 32
> 7 90 22.8
Ecology
Highland 99 25.1
Mid highland 219 55.6
Lowland 76 19.3
Gender Female 102 25.9
Male 292 74.1
Not married 48 12.2
Married 346 87.8
Source: Field survey, 2013
With regards to educational attainment, about 45 percent of the households interviewed
have not attended any formal education while only 54.8 percent of them attended more
than elementary education.
So, more than half of the sample respondents have attended at least formal education. In
addition, majority of the sample household age is between 19 and 49 (74 %) which is
characterized by productive age group who are physically active enough to engage in
production activities. Moreover, about 88 % of sample respondents have in a marital
union at a time when interview made and more than half of them live in midland while
nearly about 25 % and 19 % live in highland and low land respectively.

75
4.2.1 Asset Ownership of Sample Household
The table 4.5 shows that about 61 % have got credit facilities during the 2011/12
production season which help them in financing their purchase of seed as most of farmers
in developing countries are cash trapped and hence, they need financial assistance to
purchase the technologies and their complementary inputs (Ouma et al., 2006).
Access to hired labor is also available for nearly 63 percent of the household in the study
are. Thus, shortage of labor during production or harvest season could be available for
more than half of the population in the study area.
About 90 % of a respondent operate at a small scale which have less than 2 hectare of
land which will also affect the intensity of use of improved technology (Nkonya et al.,
1997). In addition, about 90 % of sample household have no access to small scale
irrigation which have an implication on the number of times a household could produce
maize in a year. In addition, 35 percent of them hold land less than one hectare.
However, many household head interviewed told that land shortage could not be a big
problem as they could usually have the possibility of harvesting on more extra land size
through using other households land on rent basis or under contract agreement of sharing
the outputs equally (See Table 4.5 below)
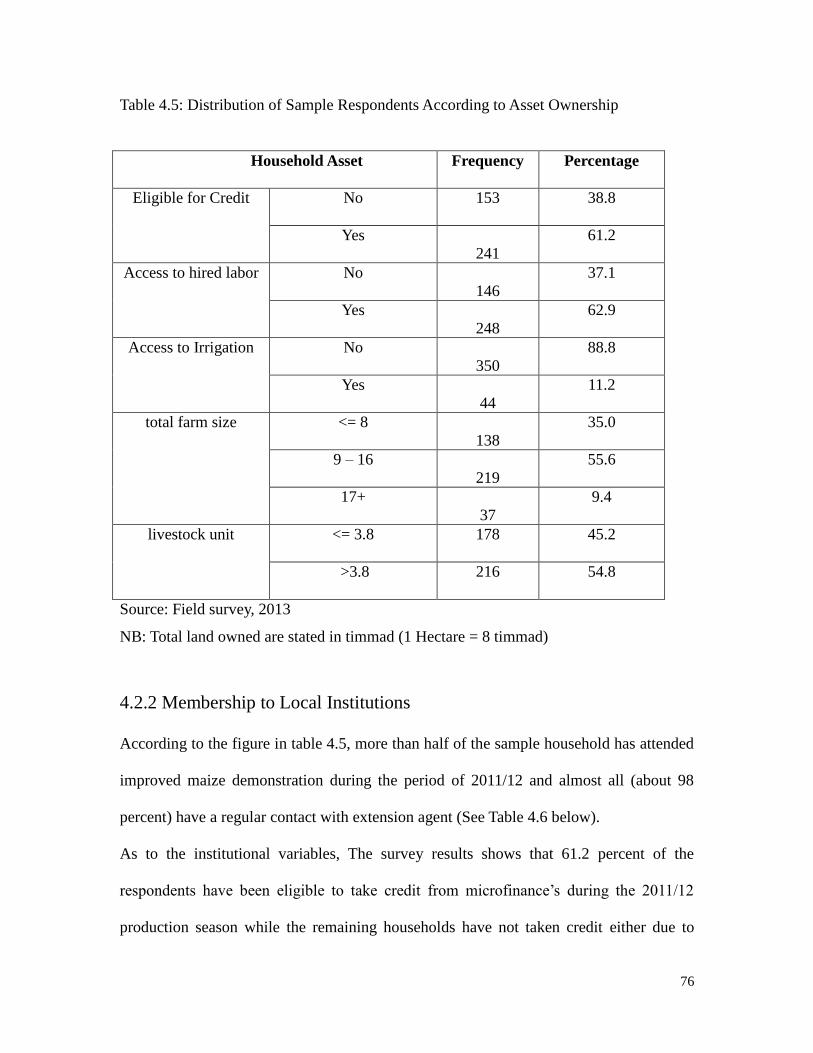
76
Table 4.5: Distribution of Sample Respondents According to Asset Ownership
Household Asset
Frequency Percentage
Eligible for Credit No
153 38.8
Yes
241
61.2
Access to hired labor No
146
37.1
Yes
248
62.9
Access to Irrigation No
350
88.8
Yes
44
11.2
total farm size <= 8
138
35.0
9 – 16
219
55.6
17+
37
9.4
livestock unit <= 3.8
178 45.2
>3.8
216 54.8
Source: Field survey, 2013
NB: Total land owned are stated in timmad (1 Hectare = 8 timmad)
4.2.2 Membership to Local Institutions
According to the figure in table 4.5, more than half of the sample household has attended
improved maize demonstration during the period of 2011/12 and almost all (about 98
percent) have a regular contact with extension agent (See Table 4.6 below).
As to the institutional variables, The survey results shows that 61.2 percent of the
respondents have been eligible to take credit from microfinance’s during the 2011/12
production season while the remaining households have not taken credit either due to
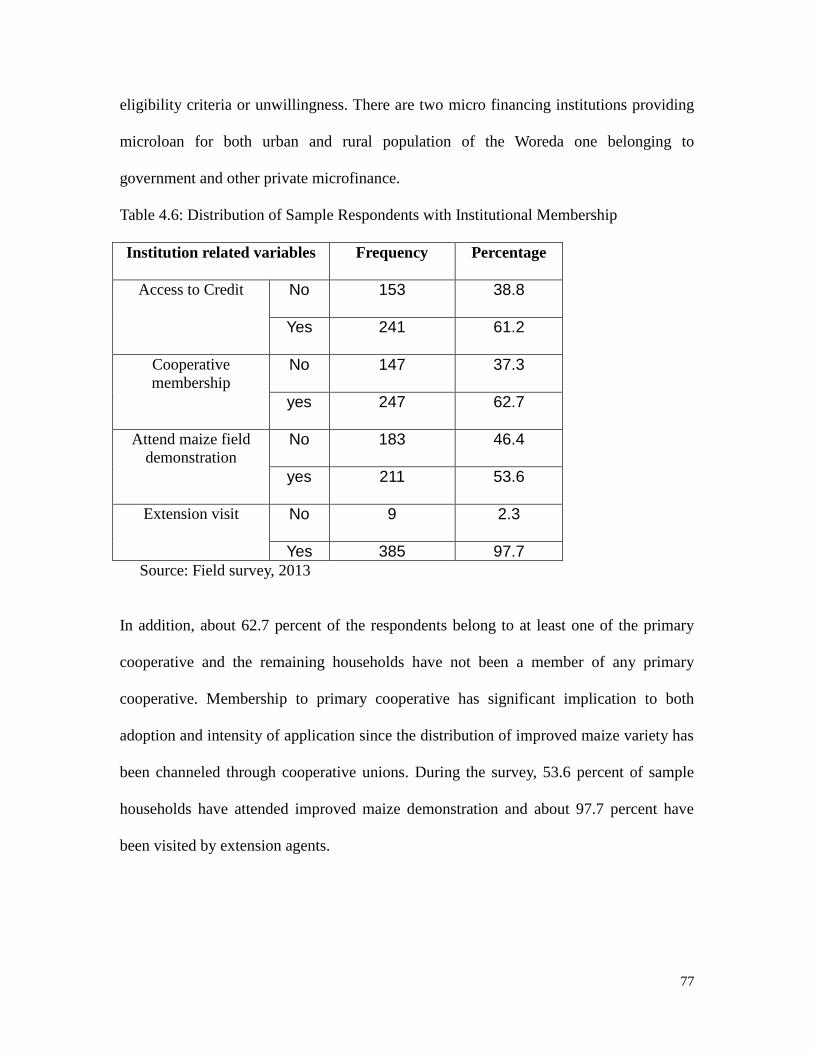
77
eligibility criteria or unwillingness. There are two micro financing institutions providing
microloan for both urban and rural population of the Woreda one belonging to
government and other private microfinance.
Table 4.6: Distribution of Sample Respondents with Institutional Membership
Institution related variables
Frequency Percentage
Access to Credit No
153 38.8
Yes
241 61.2
Cooperative
membership No
147 37.3
yes
247 62.7
Attend maize field
demonstration No
183 46.4
yes
211 53.6
Extension visit No
9 2.3
Yes 385 97.7
Source: Field survey, 2013
In addition, about 62.7 percent of the respondents belong to at least one of the primary
cooperative and the remaining households have not been a member of any primary
cooperative. Membership to primary cooperative has significant implication to both
adoption and intensity of application since the distribution of improved maize variety has
been channeled through cooperative unions. During the survey, 53.6 percent of sample
households have attended improved maize demonstration and about 97.7 percent have
been visited by extension agents.
78
CHAPTER FIVE: RESULTS AND DISCUSIONS
5.1 Bi-variate Analysis
In order to examine the relationship between adoption decision and different set of
household characteristics, chi square and t-test were employed for nominal and
continuous independent variables respectively. Similarly, the second outcome decision,
the proportion of land allocated to improved maize, has been utilized using Pearson
correlation and t-test for continuous and nominal independent variables respectively.
5.1.1 Adoption Decision and Demographic Characteristics of the
Respondent
According to the data from the table 5.1, there exist significant variation in adoption
decision within a household category having a family member living in a town or abroad
and those who have not. The data reveals that about 62.2 percent of adopters are those
households with a family member living in a town or abroad and 68.6 percent of the non
adopters are those who have no any member of family/close relative living in
town/abroad. This could perhaps be due some flow of resources or some kind of support
(it could be financial, technical, moral and other) or information from their relative to the
household. The chi square test at (p<0.01) also shows this systematic association.
With regards to the marital status of the household head, chi square analysis shows no
significant variation; meaning there is not a significant difference in the probability of
adopting improved maize seed depending on the nature of marital ties ( being married

79
and not). Households who have in some form of marital relation accounts for 85.7 and
90.3 percent in adopter and non adopter category respectively meaning that households
who have married has over represented in both category insignificantly.
Table 5.1: Adoption Decision and Demographic Characteristics
Endowment Variables Non-Adopter
Adopter
t-value
N Mean SD N Mean SD
Age of household
head
185 42.52 9.444
209 43.32 10.293
0.634
Educational
attainment of
household head
185 2.71 3.119
209 2.67 2.891
0.016
Endowment Variables
Household
Response
Non Adopter Adopter
χ2 N
Percentage N
Percentage
Do you have a family
member/relative
living in nearby town
or abroad
No 127 61.6 (68.6) 79 39.4 (37.8)
37.436** Yes
58 30.8 (31.4) 130 69.2 (62.2)
Marital status of
household head
Not
married 18 37.5 (9.7) 30 62.5 (14.3)
1.962 married
167 48.2 (90.3)
179 51.8 (85.7)
Gender of household
head
Female 37
54.4 (20)
31 45.6 (14.8)
0.065 Male
148 45.4 (80)
178 54.6 (84.2)
Source: Computed from the survey data
** Significant at (p<0.01) * Significant at ( p<0.05)
NB: The figure in parenthesis shows the percentage within adopter/non adopter category
The result regarding the gender of household head confirm as there is no significant
difference between adoption decisions across the gender group which implies being male
or female is not varied with respect to adoption decision. For instance, being a male
household head or female poses no difference on adoption decision as 55 percent of

80
female headed household did not adopted (20 percent among non-adoption category)
while about 45 percent of male headed households did not adopted. This is against most
of the empirical literatures which states that women are generally discriminated in terms
of access to external inputs and information which in turn affect adoption decision (Dey,
1981).
5.1.2. Adoption Decision and Household Endowment Attributes
Most of previous literatures regarding adoption of agricultural inputs reveals a significant
association between adoption decision and household endowment attributes which was
usually expressed through its effect on building a strong cash reserves. Similarly, the data
from table 5.2 shows the existence of significant mean difference between adopters and
non adopters based on the difference in livestock unit, distance from output market,
family size adjusted to its adult equivalent, total farm land size and existence of a family
member living in a town or abroad.
With regards to total land owned (unit of measurement is timmad that is 8 timmad = 1
hectare), there is a significant (t=9.271 at p<0.01) mean difference between adopters
(12.36) and non adopters (10.95) showing that difference in adoption decision is observed
due to variation in the mean of total land owned.
As with family size and total land allocated to maize production (including the land
allocated to local maize production), significant mean difference is observed among the
adopters and non adopters (See Table 5.2)

81
Table 5.2: Adoption Decision and Endowment Characteristics
Endowment Variables
Non-Adopter
Adopter
t-value
N Mean SD N Mean SD
Total Land Owned
185 10.95 4.48
209
12.36 4.646
9.271**
Family Size(Adult
Equivalent)
185
3.432 1.362
209
4.12 1.634
20.731**
Distance from Nearby
DA Office
185
31.4137 17.119
209
38.222 123.53
0.552
Distance from Nearby
Market Center
185
143.28 44.8
209
152.77 47.996
4.091*
Total Land Allocated to
Maize(in timmad)
185 1.75 0.917
209 3.99 1.19
429.170**
Endowment Variables
Household
response
Non Adopter
Adopter
χ2
N Percentage
N Percentage
Access to Irrigation
No
176 50.2 (95) 174 49.8 (83.2)
13.965**
Yes 9
20.4 (5)
35 79.6 (16.8)
Source: Computed from the survey data
** Significant at (p<0.01) * Significant at (p<0.05)
NB: The figure in parenthesis shows the percentage within adopter/non adopter category.
Significant variation is observed with adopter and non adopters with regards to
households having access to small irrigation and not. The result in table 5.2 shows that
households who have no access to small scale irrigation accounts for 95 percent in non
adopter group and 16.8 percent of households who have purchased improved maize seed
during the 2011/12 production season have access to irrigation. Moreover, the chi square
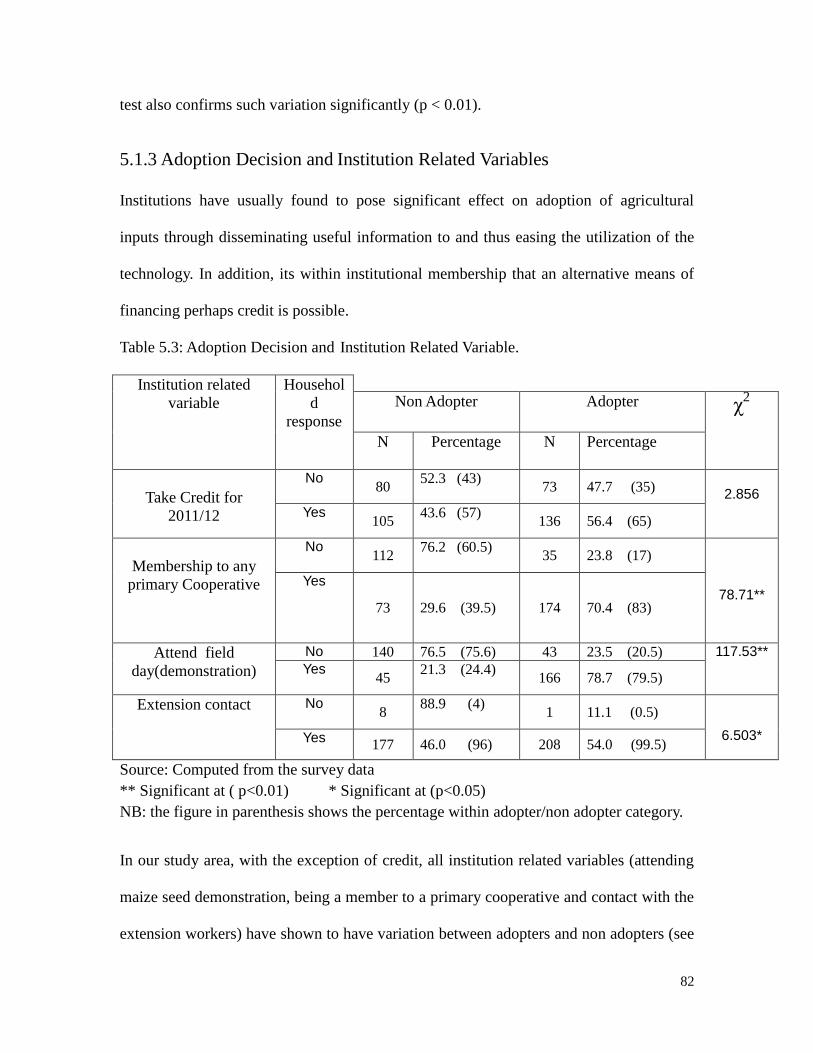
82
test also confirms such variation significantly (p < 0.01).
5.1.3 Adoption Decision and Institution Related Variables
Institutions have usually found to pose significant effect on adoption of agricultural
inputs through disseminating useful information to and thus easing the utilization of the
technology. In addition, its within institutional membership that an alternative means of
financing perhaps credit is possible.
Table 5.3: Adoption Decision and Institution Related Variable.
Institution related
variable
Househol
d
response
Non Adopter
Adopter χ
2
N Percentage
N Percentage
Take Credit for
2011/12
No 80
52.3 (43)
73 47.7 (35)
2.856
Yes 105
43.6 (57)
136 56.4 (65)
Membership to any
primary Cooperative
No 112
76.2 (60.5)
35 23.8 (17)
78.71**
Yes
73 29.6 (39.5) 174 70.4 (83)
Attend field
day(demonstration)
No 140 76.5 (75.6) 43 23.5 (20.5) 117.53**
Yes 45
21.3 (24.4)
166 78.7 (79.5)
Extension contact No 8
88.9 (4)
1 11.1 (0.5)
6.503*
Yes
177 46.0 (96) 208 54.0 (99.5)
Source: Computed from the survey data
** Significant at ( p<0.01) * Significant at (p<0.05)
NB: the figure in parenthesis shows the percentage within adopter/non adopter category.
In our study area, with the exception of credit, all institution related variables (attending
maize seed demonstration, being a member to a primary cooperative and contact with the
extension workers) have shown to have variation between adopters and non adopters (see
83
table 5.3). For instance, about 76 percent of those who are not a member of primary
cooperative have not adopted which accounts for 60 percent within non adopter category
and 70 percent of those who are member has adopted for the year 2011/12 (which
accounts 83 percent among adopter category). This could perhaps be due to the fact that
membership to a primary cooperative is related with efficient delivery of information and
sometimes price discount (from the non members) about the technology.
Likewise, attending demonstration of improved maize seed is in some ways associated
with the probability of adoption decision. About 79.5 percent of those households who
have attended the trial have adopted. Seemingly, from those non adopters, 75.6 percent
have not attended improved maize seed demonstration adopters. The chi square test (at
p<0.01) also confirms this significant association.
On contrary, the Data related with credit shows the existence of some variation in
adoption decision across those who take credit and who do not though not significant.
The review of past literature shows household access to financial capital like credit helps
the farmer in financing their purchase of input as there are huge gap between production
and harvest season (Feder, and Zilberman, 1985). I have tried to take additional data
concerning the overall nature of credit delivery (the timing, the eligibility criteria, the rate
of interest and repayment period) from the manager of Wasasa micro financing manager
of Jimma Arjo district). I have asked him if there has been any problem in loan
repayment, eligibility criteria, and any other problem related with credit delivery that may
contribute for the problem of effective utilization of loan for the purchase of input. He
told me that there is no problem with respect to the problem listed above as for instance
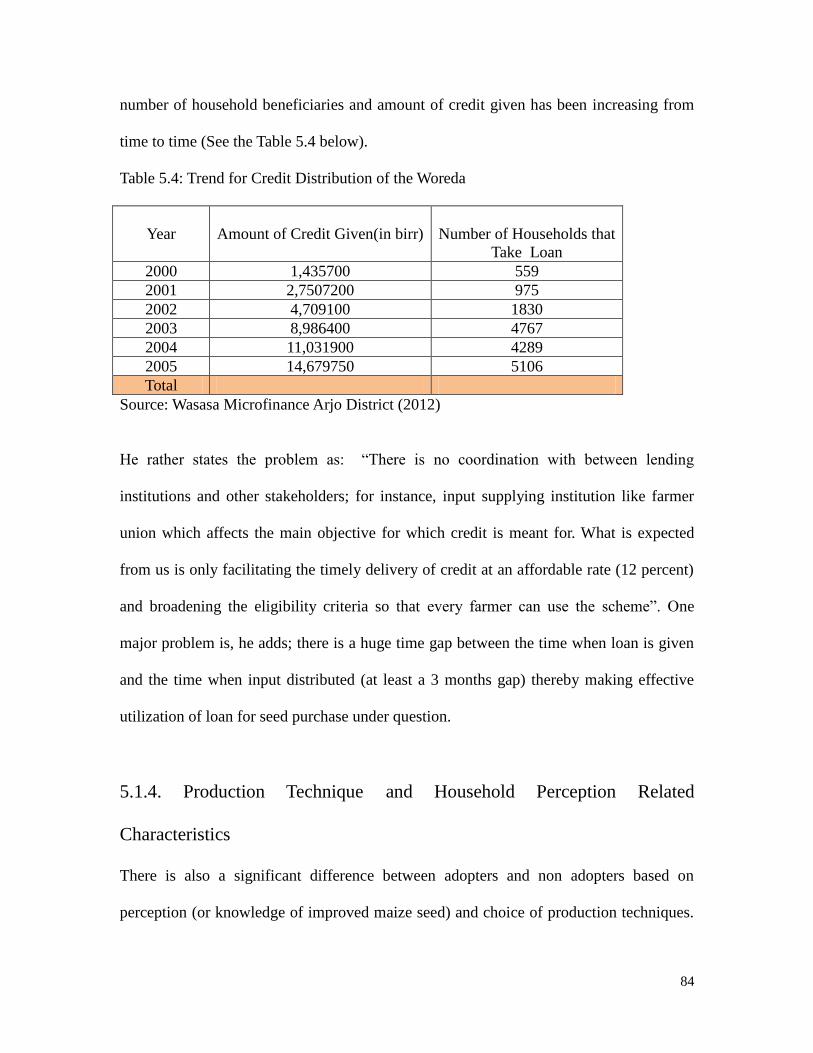
84
number of household beneficiaries and amount of credit given has been increasing from
time to time (See the Table 5.4 below).
Table 5.4: Trend for Credit Distribution of the Woreda
Year
Amount of Credit Given(in birr)
Number of Households that
Take Loan
2000 1,435700 559
2001 2,7507200 975
2002 4,709100 1830
2003 8,986400 4767
2004 11,031900 4289
2005 14,679750 5106
Total
Source: Wasasa Microfinance Arjo District (2012)
He rather states the problem as: “There is no coordination with between lending
institutions and other stakeholders; for instance, input supplying institution like farmer
union which affects the main objective for which credit is meant for. What is expected
from us is only facilitating the timely delivery of credit at an affordable rate (12 percent)
and broadening the eligibility criteria so that every farmer can use the scheme”. One
major problem is, he adds; there is a huge time gap between the time when loan is given
and the time when input distributed (at least a 3 months gap) thereby making effective
utilization of loan for seed purchase under question.
5.1.4. Production Technique and Household Perception Related
Characteristics
There is also a significant difference between adopters and non adopters based on
perception (or knowledge of improved maize seed) and choice of production techniques.

85
For example, the data in yield perception reveals that about 91 percent of non adopters
are those who do not perceive the better yield advantage of improved maize seed than the
local one.
Table 5.5: Adoption Decision and Household Perception and Production Technique
Attributes.
Perception and
technology
related variable
Household
response Non-Adopters Adopters Pearson chi
square
N Percentage N Percentage χ2
Yield
Perception
No 96 51.9 (91.5)
9 4.3 (8.5)
11.792**
Yes 89 48.1 (30.8)
200 95.7 (69.2)
Resistance to
pest and weed
No 135 73.0 (75.8)
43 20.6 (24.2)
108.789**
Yes
50 27.0 (23) 166 79.4 (77)
Cost of
improved
maize seed
No 29 15.7 (30)
68 32.5 (70)
16.124**
Yes 156 84.3 (52.5) 141 67.5 (47.5)
Fertilizer
Recommendati
on
No 129 69.7 (87.7)
18 8.6 (12.3) 154.391**
Yes 56 30.3 (22.6) 191 91.4 (77.4)
Row planting
of maize
No 87 47.0 (95.6) 4 1 (4.4) 110.620**
Yes 98
53.0 (32)
205 98.1 ( 68)
Source: Computed from the survey data ** Significant at (p<0.01)
NB: the figure in the parenthesis shows the percentage within response category
Likewise, 95.7 percent of those who believes in the better yield advantage of improved
seed has adopted during the period (which accounts for 69.2 percent in the adopter
category). That means, by telling a farmhouse hold about the better yield advantage of
improved maize seed, we can increase the probability of adoption significantly. This
86
finding agrees with Ojiako et al., (2007) stating as; the better the yield the particular
improved soya bean seed have, the more probability would it be adopted by the farmer in
northern Nigeria. In addition the work by Adesina and Zinna (1993) also confirms the
same argument stating that yield has significantly influenced farmers’ decision to adopt
improved mangrove swamp varieties of rice in Sierra Leone. Besides, perception about
the better resistance capability to pests and weed, and knowledge of cost effectiveness in
using the seed by the household has also effect on the probability that the seed would be
adopted.
There is also significant association between adoption decision and intensity of fertilizer
application as the result shows that 77.4 percent of adopters have applied fertilizer as per
the recommendation while those who do not obey appropriate fertilizer recommendation
accounts for 87.7 percent of non adopters. Moreover, there are also variation in adoption
decision between those who plant maize in rows (with the recommended spacing between
rows and plants) and those who do not. This manifests some variation across adopter
categories based on differences in production techniques particularly of maize production
technique which in turn give us some clue that differences in production techniques
would induce the decision of adopting improved maize seed.
5.1.5 Major Challenges to Increased Adoption Rate and its Sustainable Use
According to the data from the sample households shown in table 5.6 below, 19 percent
of the household interviewed have never adopted improved varieties of any type during
the period and about 27.9 percent have discontinued using the seed. On the other hand,
11.1 percent of the sample households were new adopters and have never been tested the
87
technology before 2011/12 production season. In addition, 42 percent have continued
using the technology. Accordingly adoption rate in the study area remains about 79
percent.
Table 5.6 The Status of Adoption Rate of the Sample Respondents.
Household
Response
Category
Non Adopter
Adopter
Total
Count
Percentage
Count
Percentage
Have you ever
adopted improved
maize of any type
No
75
19
44
11.1
119
Yes
110
27.9
165
42
275
Total
185
46.9
209
53.1
394
Source: Computed from the survey data
Regarding those non adopters who have discontinued using the seed, I have included an
open ended question asking the reason why they have decided not to purchase the seed
during the 2011/12 production year. About 39 percent respondent stated the reason as “
because of the increasing price of the seed from time to time” while about 35 percent (see
table 5.7) blamed the quality of seed (seed enterprise could not provide a quality
seed).The remaining 19 percent of them responded its due to fertilizer price and other
complementary inputs. The table 5.7 provides the detailed summary for the reason to
discontinuing.

88
Table 5.7: Reason for Discontinuing the Use of Improved Maize by Households
Reason for Discontinuing Number of
Household
Voted
Percentage
Increased price of the seed 43 39
Seed quality becomes low(deteriorated) 38 35
Cannot afford the price of fertilizer with seed 21 19
Others 8 7
Total 110 100
Source: Computed from the survey data
5.2 Proportion of Land Area Allocated to Improved Maize Variety and
Household Characteristics
The second decision following the adoption decision is the decision of intensity of
application (on how much hectare of land to apply the seed) which depends on the same
set of household characteristics as in the case of adoption decision. With intensity, we
mean the proportion of land allocated to improved maize seed from the total land maize
land .Thus, since the adopter households also produce local maize, the proportion of land
allocated to improved maize would lie between 0 and 1 meaning that the amount of land
allocated to improved maize seed would lie between this number.
Households has been classified as less intensive user and more intensive in this research
based on the proportion of the land they have allocated allocate to improved maize from
the total maize produced. That is, as the farmer reduces the amount of land allocated to
local maize, the proportion of land allocated to improved maize reduces relatively as they
share common resources.
89
Table 5.8 Amount of Land Allocated Under Improved Maize Seed and Household Asset
**. Correlation is significant at the 0.01 level (2-tailed).
*. Correlation is significant at the 0.05 level (2-tailed).
According to the data from the table 5.8, the proportion of land allocated to improved
maize seed have shown to display a strong relationship with the age of household head. A
negative relationship reveals the difficulty and complexity associated with the
management of improved maize cultivation. Besides, the degree of conservativeness and
ambitiousness of household head decreases as their age increases which ultimately make
Households Endowment and Other
Related Characteristics
Proportion of Land Allocated to Improved Maize Seed
Age
Pearson Correlation
-0.23**
Sig. (2-tailed) 0.00
Years of Schooling for Household Head
Pearson Correlation
0.15*
Sig. (2-tailed) 0.03
Total Land Holding
Pearson Correlation
-0.57**
Sig. (2-tailed) 0.00
Total land Allocated to Maize
Pearson Correlation
0.47**
Sig. (2-tailed) 0.00
Livestock Unit
Pearson Correlation
0.02
Sig. (2-tailed) 0.76
Family Size
Pearson Correlation
-0.12
Sig. (2-tailed) 0.08
Distance from Input Market
Pearson Correlation
0.01
Sig. (2-tailed) 0.87
Distance from Output Market
Pearson Correlation
0.00
Sig. (2-tailed) 0.96
90
the intensification process very difficult.
The literacy level of a household head measured in years of schooling have shown to
have a positive a significant relationship with the proportion of land allocated to
improved maize variety. The possible explanation behind such relationship is the fact that
household with more years of schooling would easily realize the benefit versus the risk
associated with the utilization of modern agricultural technology and thus easily votes in
favor the intensification process. Besides, this could probably be justified through the fact
that a literate household head can be better in terms of proper management of the
technology and the subsequent yield or gain in productivity which ultimately encourages
them to intensify the utilization.
The proportion of land allocated to improved maize seed has a strong but negative
relationship with the total land holding .That is, as the land holding of a household
increases, the decision to intensify improved maize seed decreases. Besides, such
relationship would be observed due to the credit and other financial and market related
complexity associated with applying modern agricultural technology as the farmer has a
relatively more land. Moreover, Fear of risk related with expected uncertainty in output
price would also work against the intensification process.
Contrarily, household endowment factors like family size and access to or experience of
using hired labor has also revealed insignificant variation across our continuous outcome
category showing the relatively lower importance of these assets in affecting the
proportion of land allocated to improved maize seed. I have tried to include an open
91
ended question asking the respondent where they had labor during the production and
harvest time. More than 90% told me that they have a good mutual help culture within
the community commonly called “Debo” meaning self help association during production
and harvest season so that they interchangeably make a planned use of the family labor
and even sometimes Oxen turn by turn. This would strengthen the above arguments that
place the number of family labor and access to hired labor would pose little or no threat
to the amount of hectare of land allocated under improved maize.
According to the result from table 5.9, there has been an observable significant variation
in proportion of land allocated to improved maize seed between the two household
groups. That is between those household who engaged in other off farm activity and those
who were not. Such variation would be observed due to the variation in means and source
of income earning which helps in financing the utilization of improved maize especially
when the probability of getting credit becomes questionable. Besides, such a variation
might be due to the variation in risk taking ability between the two groups which makes
the intensification process easier for those farmers engaged in other off farm activity as
compared to those who were not.
As with cash crop production, there has also shown an observable mean variation as
those household producing cash crop and those who were not. The proportion of land
allocated to improved maize significantly varies between those who produce only food
crops and those who produce both cash crops and food crops mainly due to the existing
trade off or opportunity cost related with the allocation of land allocated to Maize
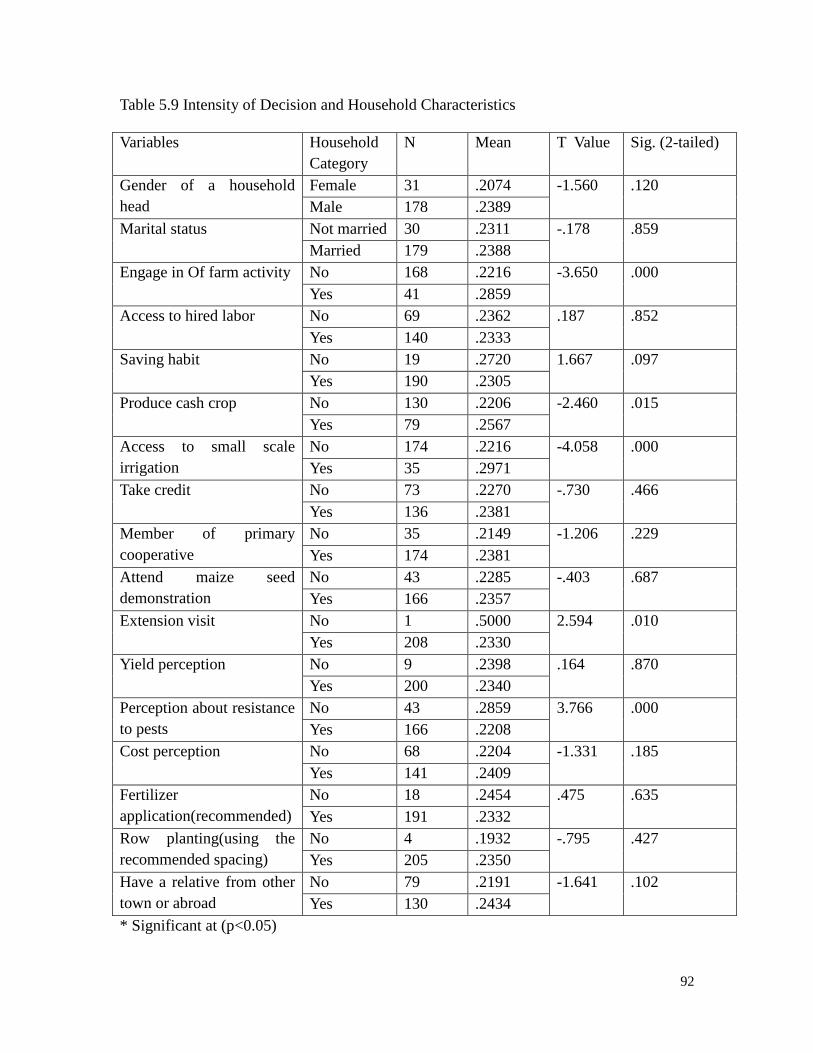
92
Table 5.9 Intensity of Decision and Household Characteristics
Variables Household
Category
N Mean T Value Sig. (2-tailed)
Gender of a household
head
Female 31 .2074 -1.560 .120
Male 178 .2389
Marital status Not married 30 .2311 -.178 .859
Married 179 .2388
Engage in Of farm activity No 168 .2216 -3.650 .000
Yes 41 .2859
Access to hired labor No 69 .2362 .187 .852
Yes 140 .2333
Saving habit No 19 .2720 1.667 .097
Yes 190 .2305
Produce cash crop No 130 .2206 -2.460 .015
Yes 79 .2567
Access to small scale
irrigation
No 174 .2216 -4.058 .000
Yes 35 .2971
Take credit No 73 .2270 -.730 .466
Yes 136 .2381
Member of primary
cooperative
No 35 .2149 -1.206 .229
Yes 174 .2381
Attend maize seed
demonstration
No 43 .2285 -.403 .687
Yes 166 .2357
Extension visit No 1 .5000 2.594 .010
Yes 208 .2330
Yield perception No 9 .2398 .164 .870
Yes 200 .2340
Perception about resistance
to pests
No 43 .2859 3.766 .000
Yes 166 .2208
Cost perception No 68 .2204 -1.331 .185
Yes 141 .2409
Fertilizer
application(recommended)
No 18 .2454 .475 .635
Yes 191 .2332
Row planting(using the
recommended spacing)
No 4 .1932 -.795 .427
Yes 205 .2350
Have a relative from other
town or abroad
No 79 .2191 -1.641 .102
Yes 130 .2434
* Significant at (p<0.05)
93
The analysis for irrigation access has also shown significant variation as the proportion of
land allocated to improved maize between those households that uses small scale
irrigation and those who were not. This might be associated with the fact that those
household with access to irrigation facilities have sufficient access to production of cash
crops with a premium earning thereby posing a significant variation.
The proportion of land allocated to improved maize also varies significantly between
those farmers who frequently visit extension services and those who were not visiting.
Such variation might be due to the fact that extension service would deliver important
information and farm techniques related with the technology and enhance the
intensification. Besides, the extension service will equip farmers with sufficient skills and
knowledge about the technology utilization and thus convince farmers.
The proportion of land allocated to improved maize also varies significantly between
those farmers who perceive in the better resistance of improved maize seeds to pests and
disease and who were not. Such a variation would be observed due to the difference in
the risk of crop failure observed between the two groups under investigation.
The rest of household attributes stated in the above has found to have no mean variation
with the main outcome category since t statistics shown no significant mean differences.
With the exception of extension contact, most Institution related variables and household
perception and technique of production have shown to have no significant variation. That
means, once the household have already adopted these improved maize seed, there shall

94
not be any observable difference in the intensity of its application due to the differential
access to the institutional and other perception attributes (see table 5.9).
5.2.1 Major Challenges to Intensification of Improved Maize Production
The data collected from respondent’s shows that, households (adopter households) differ
in terms of the proportion of land area allocated to improved maize as they rarely apply
the seed in higher proportion as the maximum result shows to be 0.89. I have included an
open ended question (only for adopter households) to state the major reason for lower
allocation of land to the production of improved maize seed. More than 40 percent of
adopter households respond it as “fear of risk” stating that they are not certain about the
profitability of the technology since there are many uncertainties (for instance, lagging of
rainfall, pest outbreak and others) in the whole production process (see table 5.10).
Likewise, 12 percent attribute the reason to the increased cost of seed and other
complementary inputs. Moreover, about 18 percent of adopters state the reason saying
that: “the local seed variety is better in maturing early as compared to the improved ones
and hence better for early consumption by our family”. The study by Ogola and Ayieko,
(2012) also supports these arguments.
Table 5.10 Major Constraint to Increased Utilization of Improved Maize Seed.
Reason for low utilization of improved maize
variety
Count
Percentage
1.High price of seed(cost of seed) 67 12
2.Risk of crop failure(due to pests and weed,
rainfall shortage and others)
89 43
3.Not matured early for consumption by
household
37 18
Others 15 7
Total 208 100
Source: Computed from the data
95
5.3 Binary Logistic Regression Result
Factors Affecting Adoption Decision of Improved Maize Variety
The t-test made in the above section, will only tell us the existence of some association
between the two from the observed difference in mean and do not tell us the nature of
association that exist between the response and explanatory variables. In that case,
multiple regressions are used to estimate the nature of association existing between the
two groups accounting for effects of confounders.
Different researchers used different models to estimate most of the possible factors
affecting the adoption decision and demand for improved maize variety. In these research
a logistic regression was computed so as to estimate the factors affecting improved maize
seed purchase decision. As to this, a binary logistic regression has been applied with the
value 1 if the household has purchased the seed (improved maize) and 0 if not for the
period of 2011/12.
Multi-co linearity Diagnostic and Test of Goodness of Fit
Before estimating the logistic regression two tests are made. One is multicollinierity
diagnostics and this test is made so as to avoid if there exist any systematic correlation
within any of the explanatory variables which inflate the standard error and thus result in
false rejection of the parameter coefficients. so a correlation matrix was computed for all
explanatory variables and thus two variables has shown to have good correlation and thus
one variable is dropped from the model so as to fix the problem.
The second test is made in an attempt of knowing whether the model chosen fits with our

96
data or not. As to this, a classification table and Hosmer and Lemeshow tests are used.
Accordingly, 91.3 percent of the non adopters are correctly predicted as non adopters
while 92.3 percent of adopters are correctly predicted as adopters. In general 91.9 percent
of the households are correctly classified in the model (see annex). Regarding the Hosmer
and Lemeshow tests, the data from the model shows the significance level of 0.790 (see
annex) which leads us to accept the null hypothesis (since it is greater than 0.05) that
states as the model best explains the data.
Multiple Logistic Regression Results
The table below shows all the possible factors affecting (socioeconomic, institutional
technique of production and perception related) the household purchase of improved
maize seed. As to this end, coefficient of parameters, and odds ratio are displayed at
various significance levels. From the total of 23 covariates, only 9 have found to
significantly estimate the binary decision (adoption decision).Out of the 23 variables
entered, only 9 of them have found to significantly describe the outcome decisions. The
other 14 variables failed to significantly estimate the farm household decision of whether
to adopt improved maize seed or not.
To start with, the variable related with household distance from the output market shows
that those who walk greater than 150 minute have 7.104 times more likelihood to
purchase the improved maize than those who walk less than 150 minutes. Such a
relationship may emanate from the expansion of output market at the farm gate that may
benefit those household living at a distant location in real terms than those who reside
closer to the output market. Similar study by Beatrice, Wilfred and Domisiano, (2007)

97
also illustrates such an inverse relationship and attribute the reason to the expansion of
informal seed market which has worked in favor of those households that are located far
from the output market. The result is against our hypothesis and most of the empirical
literatures.
The other parameter is related with the amount of total land allocated to maize production
(both improved and local). The result reveals that those households who allocate more
than 3 timmad of their land to maize seed have a greater likelihood of adopting improved
seed than those household in the reference category. That is, the odds of purchasing
improved maize seed for those who allocate more than 3 timmad of land to maize
cultivation is 26.617 times than the household in the reference category. Possible
justification to such a relationship could illustrate how far the better popularity of maize
(perhaps for consumption) within a family would enhance the probability of adoption
decision.
The data related with the marital status of the household head shows that the likelihood of
deciding to use improved maize decreases by 98.5 percent for those married household
head than the households in the reference category confirming the better likelihood of
adopting for those who were not in a marital ties. Possible reason for such relationship
would lie in the fact that women are cautious and resistant in undertaking a risky business
(Acacia, 2002). Besides, since marital ties are attached to existence of dependents family
members which further made the decision to engage in a risky business more difficult.
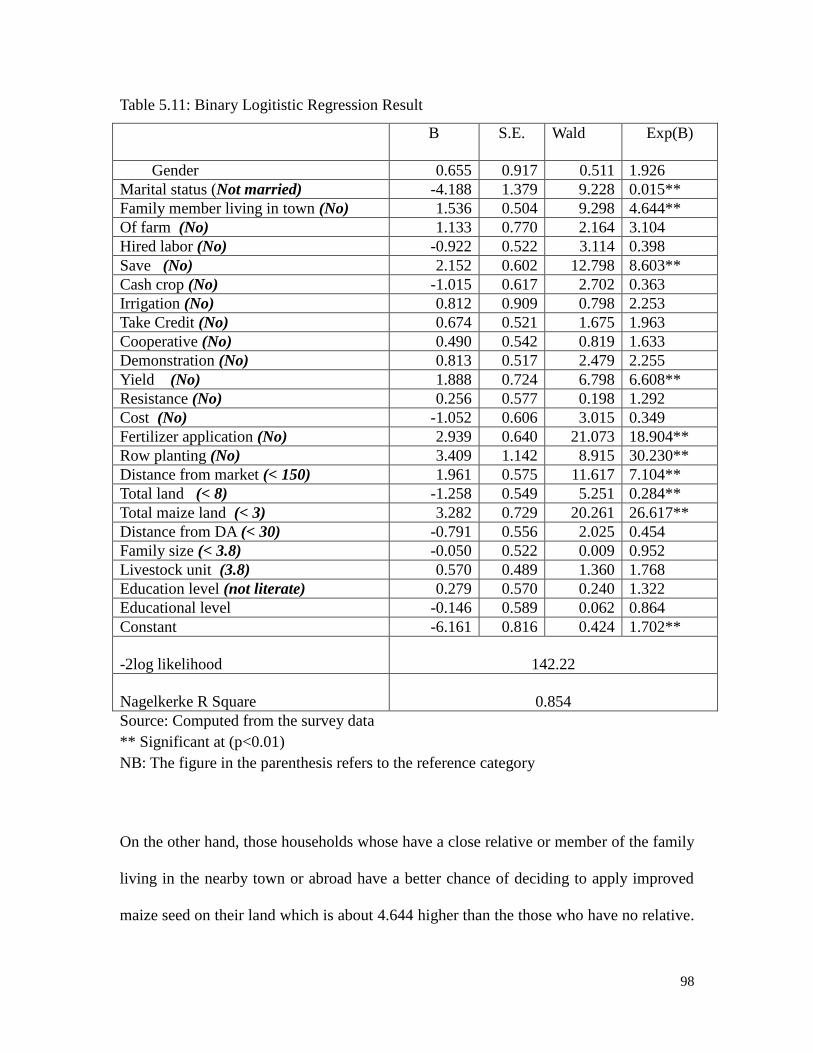
98
Table 5.11: Binary Logitistic Regression Result
B
S.E. Wald Exp(B)
Gender 0.655 0.917 0.511 1.926
Marital status (Not married) -4.188 1.379 9.228 0.015**
Family member living in town (No) 1.536 0.504 9.298 4.644**
Of farm (No) 1.133 0.770 2.164 3.104
Hired labor (No) -0.922 0.522 3.114 0.398
Save (No) 2.152 0.602 12.798 8.603**
Cash crop (No) -1.015 0.617 2.702 0.363
Irrigation (No) 0.812 0.909 0.798 2.253
Take Credit (No) 0.674 0.521 1.675 1.963
Cooperative (No) 0.490 0.542 0.819 1.633
Demonstration (No) 0.813 0.517 2.479 2.255
Yield (No) 1.888 0.724 6.798 6.608**
Resistance (No) 0.256 0.577 0.198 1.292
Cost (No) -1.052 0.606 3.015 0.349
Fertilizer application (No) 2.939 0.640 21.073 18.904**
Row planting (No) 3.409 1.142 8.915 30.230**
Distance from market (< 150) 1.961 0.575 11.617 7.104**
Total land (< 8) -1.258 0.549 5.251 0.284**
Total maize land (< 3) 3.282 0.729 20.261 26.617**
Distance from DA (< 30) -0.791 0.556 2.025 0.454
Family size (< 3.8) -0.050 0.522 0.009 0.952
Livestock unit (3.8) 0.570 0.489 1.360 1.768
Education level (not literate) 0.279 0.570 0.240 1.322
Educational level -0.146 0.589 0.062 0.864
Constant -6.161 0.816 0.424 1.702**
-2log likelihood
142.22
Nagelkerke R Square
0.854
Source: Computed from the survey data
** Significant at (p<0.01)
NB: The figure in the parenthesis refers to the reference category
On the other hand, those households whose have a close relative or member of the family
living in the nearby town or abroad have a better chance of deciding to apply improved
maize seed on their land which is about 4.644 higher than the those who have no relative.

99
These could be explained partly through the existence of some flow of financial or
technical resources across those households’ heads and their relatives which thereby
resulted in high probability of adoption as compared to the households in the reference
category. The figure also in line with the descriptive result depicted in the above section.
The estimation result concerning saving shows a better likelihood for those who saves as
compared to the reference category which depicts that those who saves have a more
likelihood of(8.603 times) adopting improved maize variety than who do not save. Other
things remain constant, saving would help a farm household’s liquidity constraint that
exists between the production and harvest season and helps them in easily financing their
input purchase. This is in line with our descriptive result, the empirical literature and our
hypothesis.
Knowledge of the farm household about the yield advantage of the improved maize has
shown to increase the probability of adopting improved maize by 6.6 times than those
households in the reference category. These shows that as a household get a deeper
knowledge of the varieties special attribute his confidence on the comparative advantage
of the seed increased there by resulting increased likelihood in purchase decision. The
finding by Augustine and Mulugeta, (2010) also supports the same findings stating that
convincing farmers that a given improved variety is superior to the local ones in terms of
yield and resistance to field pests would increase adoption rate by 20% and 6%,
respectively.
100
Households who apply fertilizer as per the blanket recommendation during maize
cultivation have a better likelihood of deciding to buy the improved varieties than their
counterparts. This also shows that users of improved maize are applying complementary
inputs (perhaps fertilizers) more intensively than those farmers who use a local maize
seed. A study by Edilegnaw (2003) and Mulugeta, (2006) are also in line with this
finding.
Similarly, those households that use row planting techniques during maize production has
about 30.230 times greater likelihood of adopting improved maize seed than those who
do not use. This could be also explained as the former has a better knowledge about
modern extension service and its feasibility as compared to the reference category which
can in turn help them in deciding the utilization the new variety (improved maize seed).
Last but not least is the total land holding. Result reveals the kind of inverse relationship
between high total land holding and probability of adoption..That is, the odd of adopting
improved maize seed decreases by 71.6 percent for households with the total land greater
than 8 timmadd or on hectare than those in the reference category. These could perhaps
be justified as those who have small land holding would efficiently utilize the benefit of
the improved technology (perhaps by intensifying it) where as those households having
larger size of land fail to do so (may be due to the costly nature of applying the
technology with other complementary inputs which prohibits them from applying the
seed on larger proportion of their land. Similar study by Uaiene and Rafael, (2005)
supports this fact stating that an easy access to additional land discourages fertilizer and

101
pesticide use, which land is saving technologies.
Moreover, variables like literacy level of a household head, membership to primary
cooperative, engaging on of farm activity, attending maize field day, credit access, access
to small scale irrigation and engaging in cash crop production have found to display the
expected result though not significant.
5.4 Estimation of Factors Affecting the Intensity of Improved Maize
Seed
In the above estimation result (the binary logistic regression), we have grouped those
households into 1 and 0 (adopter and non adopter respectively) based on whether they
have bought improved maize seed or not for the 2011/12 production season. It is clearly
observed that those households who have decided to purchase improved maize seeds
during the period under study could not have totally applied improved maize seeds on all
of their plot; rather, they prefer to produce the local varieties too along with the improved
ones (adopted it partially).Within the adopter household itself, there is variation in the
proportion of land allocated to improved maize variety. Thus, in order to investigate such
a variation, factors determining intensity of applying the seed has to be clearly noted. One
of the objective of these research paper is thus to find those socioeconomic, institutional,
psychological and demographic factors accounting for such variation.
As we have discussed in methodology section, since our data is censored, Tobit model is
selected and tested against the conventional OLS model and thus fitted best to estimate

102
factors affecting the proportion of land allocated to improved seed. Multicollinierity
problem was tested before the model is fitted and as usual, a series of correlation matrix
were developed so that explanatory variable can separately contribute to the variation in
the dependent variable.
The Likelihood ratio tests are made to know if model fits our data and thus the test result
shows the determinants selected can significantly estimate the model with no
distributional violation thereby rejecting the null hypothesis as the determinants selected
was tested to be significantly different from zero. Thus, Tobit model was selected to
isolate the possible factors affecting the proportion of land allocated to improved maize
seed in the study area during the year under review. Thus, the coefficient of parameters
stated in the table 5.12, the coefficient of the parameter shows the marginal effect of the
respective explanatory variable on outcome variable (tested at both 1 and 5 percent of
significance).
Saving is also estimated to have a positive and significant relationship with the
continuous outcome decision (p< 0.05) because saving is usually associated with
ownership of resources and hence little or no reliance on financial support that prohibit
most farmers from scaling up the intensity of modern technology application. This result
is also consistent with the empirical literature and the descriptive results.
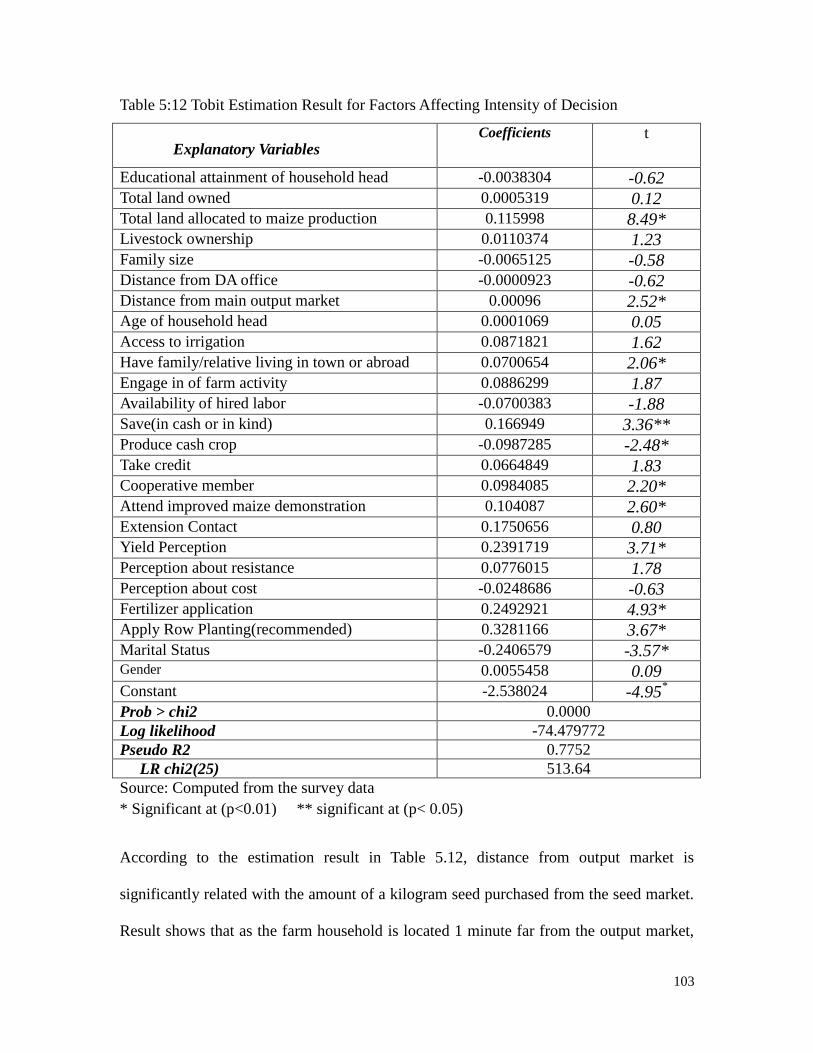
103
Table 5:12 Tobit Estimation Result for Factors Affecting Intensity of Decision
Explanatory Variables
Coefficients t
Educational attainment of household head -0.0038304 -0.62 Total land owned 0.0005319 0.12 Total land allocated to maize production 0.115998 8.49* Livestock ownership 0.0110374 1.23 Family size -0.0065125 -0.58 Distance from DA office -0.0000923 -0.62 Distance from main output market 0.00096 2.52* Age of household head 0.0001069 0.05 Access to irrigation 0.0871821 1.62 Have family/relative living in town or abroad 0.0700654 2.06* Engage in of farm activity 0.0886299 1.87 Availability of hired labor -0.0700383 -1.88 Save(in cash or in kind) 0.166949 3.36** Produce cash crop -0.0987285 -2.48* Take credit 0.0664849 1.83 Cooperative member 0.0984085 2.20* Attend improved maize demonstration 0.104087 2.60* Extension Contact 0.1750656 0.80 Yield Perception 0.2391719 3.71* Perception about resistance 0.0776015 1.78 Perception about cost -0.0248686 -0.63 Fertilizer application 0.2492921 4.93* Apply Row Planting(recommended) 0.3281166 3.67* Marital Status -0.2406579 -3.57* Gender 0.0055458 0.09 Constant -2.538024 -4.95
*
Prob > chi2 0.0000
Log likelihood -74.479772
Pseudo R2 0.7752
LR chi2(25) 513.64
Source: Computed from the survey data
* Significant at (p<0.01) ** significant at (p< 0.05)
According to the estimation result in Table 5.12, distance from output market is
significantly related with the amount of a kilogram seed purchased from the seed market.
Result shows that as the farm household is located 1 minute far from the output market,
104
the amount of timmad of land allocated to improved maize seed increase by .00096
timmad. As discussed in the above logit estimation, such a relationship could be justified
as; since the household is located far from the output market, it promotes crop saving and
avoids misuse of crop output for unwanted consumption there by encouraging household
to intensify the application of the technology use (improved maize in our case). The study
by Beatrice, Wilfred and Domisiano, (2007) made in Western Kenya using probit model
also supports these finding stating that distance from the nearest output market have
positively and significantly related with the probability of adopting stress tolerant maize.
Moreover, the result is against most of empirical literature and our hypothesis though it’s
in line with the descriptive result.
With regards to the production of cash crops, the estimation result also shows statistically
significant but negative relationship between cash crop production and the number of
timmad of land allocated to improved maize seed. Such a negative relationship shows the
tradeoff between the land allocated to both and may be due to the fact that cash crop
earns a premium price than cereal and thus those household who produce cash crops
usually preferred to increase the amount of land allocated to cash crops at the expense of
food crops (improved maize in our case).The study by Salasya, (2005) and Strasberg et
al., (1999) supports this finding stating that households with a large acreage under cash
crops tend to concentrate on them and pay less attention to the food crops. The
descriptive result also gives similar result (chi square test) but it’s opposite to our
hypothesis.

105
Institution related variables like being a member of a primary cooperative and attending
improved maize demonstration is estimated to have a significant and positive relationship
with the intensity of decision. The result being significant at 1 percent significance level
shows the importance of seed promotion and differential access to information in
enhancing the intensity of adoption.
The association with regards to cooperative membership shows the likelihood of
intensifying improved maize seed was higher for those households who belong to at least
one of the primary cooperative. These could be explained as since it is through the
primary cooperative that seed distribution is made, there is price difference across
members and non members that may probably help the members to utilize more than the
non members.
The likelihood of intensifying the application of improved maize is higher for those
household who attends the demonstration of maize significantly (p< 0.01). Attending
demonstration would help in increasing farmer’s knowledge and confidence on the
special attributes of the variety and hence help in increasing the intensification. The study
conducted in western Oromia also supports this finding stating that attending field day
visit has a significant and positive relationship with the probability of participating in
wheat seed multiplication and the amount of land allocated to it (Abdisa et al., 2001).
The estimation result with respect to yield perception shows a significant and positive
relationship to the amount of land allocated to improved maize variety (both at 1 and 5
106
percent significance level) and the result is congruent with both the descriptive and our
hypothesis.
Apparently, the result in fertilizer recommendation depicts significant and positive and
significant association with our outcome variables .which is also in line with the
empirical and theoretical literature.
Using row planting techniques in maize production (in line with the recommended
spacing between rows and column) has also shown to have a positive relationship with
the continuous outcome decision and is attached to knowledge of appropriate production
technique. This result is similar with the theoretical literature, our hypothesis and the
descriptive result.
The result concerning the marital status of a household head shows a negative association
with the amount of seed purchased. The likelihood of intensifying improved maize
increases for the households who were not in a marital tie significantly (at p< 0.01).
possible reason for such a relationship could be due to the fact that decision of intensity
for married households would be difficult since they (especially women’s) are more
reluctant to engage in a business characterized by many risks and uncertainties (Acacia,
2002). This result is against both the descriptive result and our hypothesis.
The result estimated for those farm households who have family member living in a town
or abroad, have a significantly a positive relationship with the proportion of land
107
allocated to improved seed. It shows that those who have member of families living in a
town or abroad have a better chance of intensifying the improved maize production than
those who have not. This may probably affect our outcome variable through remittance
which makes farm households financially strong to purchase seed and other
complementary inputs. This result is also in line with our hypothesis and other empirical
literature.
108
CHAPTER SIX: CONCLUSION AND RECOMENDATION
6.1 Conclusion
Many efforts has been made since long to realize the increased rate of adoption and
optimum uptake of improved maize seed by smallholder farmer with the objective of
increasing their yield and hence enhancing food security. But, such attempt has not
brought the desired result as the data from the study area shows both adoption decision
and intensive use of this yield enhancing technologies was minimum as farmers has little
confidence on the probability that the technology if applied would brought the stated
result. In addition, the adopter household itself either discontinues using the technology
or adopt partially after he has tested it. In order to investigate and justify possible reason
associated to such problem, one has to isolate factors determining adoption decision and
its intensity of use has to be clearly known.
This research is thus intended to shed light on those possible factors behind lower
adoption rate and minimum uptake of improved maize variety by analyzing the major
determinants of adoption decision and proportion of land allocated to improved seeds
based on data collected from 394 farm households during the 2011/12 cropping season.
Thus conclusions are to be forwarded accordingly as the following:
In some instances, those stakeholders concerned in the overall seed market (seed
suppliers, seed multipliers, distributors and microfinance’s) has made little coordinated
efforts in attaining the major objectives for which they are striving for.
109
The major socioeconomic and demographic factors affecting adoption decision and
intensity is distance from main output market, distance from DA office, marital status,
engaging in cash crop production, saving and having a family member or relative living
in town or abroad.
Both adoption decision and intensity of application has found to be less dependent on
household endowment factors as household asset ownership factors like total land owned,
livestock ownership, and availability of both family and hired labor as the estimation
result shows insignificant relationship in both outcome decisions. Thus we can conclude
that adoption decision and intensity of its application is less dependent on of household
resource ownership status and no more a constraints if other factors have found to be
placed accordingly.
Distance from DA office (in minute travelled) is found to be negatively related with
adoption decision showing the better advantage development agents in promoting
improved maize adoption.
Production of cash crops has found to have negatively related with the second outcome
decision (intensity of improved maize application) showing the tradeoff between the
lands allocated to cash crop and food crops.
Institution related variables like conducting improved maize demonstration on farmers
plot and membership to primary cooperatives and saving (in cash or in kind) have found
110
to be vital especially for increasing the intensity of adoption. Besides, institutions also
play a major role not only in promoting the new technology, but also in sustaining it.
Intensive application of other complementary inputs like fertilizer has found to be
significant factors in determining both adoption decision and intensity of its application
as the covariate related with this shows a positive and significant association.
In addition, knowledge about the special attribute of the improved variety in relation to
the conventional ones (like perception about yield advantage, resistance to field and
storage pests) has a pivotal role in enhancing wider adoption. These variables also clearly
manifest the importance of training (both formal and informal) and demonstration in
improving adoption rate and sustain it.
6.2 Recommendations
All the stakeholders (research institutions, cooperative unions, agriculture and rural
development offices and lending institution like microfinance’s) participating in the
overall seed value chain have to jointly operate in a coordinated fashion so as to enhance
adoption rate and boost the intensity of adopting improved maize seed.
Organizations especially those are responsible for seed supply and distribution has to give
a special emphasis and work hard with changing the perception of the variety as the
above analysis shows that farmers have no full confidence in the attributes of improved
maize (like the profitability, yield and resistance to pests and other disease).These

111
findings will also calls for the expansion and further development of farmer based seed
multiplication activities that allows for farmers participation at every stage. It will also
increase farmer’s knowledge about the special attribute of the variety and hence help in
building their confidence. Besides, the results implies that Agricultural research
institutions should continue and strengthen research on production characteristics of
improved maize varieties, including seed quality, drought tolerance and maize meal
quality.
There are no common consensus and sometimes divergences in adoption studies as the
estimated regression results across most studies shows contrasting findings(especially
those made at crop level) showing the existence of some gaps (perhaps variable definition
that stick to specific socioeconomic setup or any other) that needs to be investigated.
This study also recommends the better importance of other complementary inputs to
improved maize seed like fertilizer in enhancing the seed purchase decision and optimum
uptake of improved maize seed by smallholder farmers. Thus facilitating the supply and
efficient distribution of these complementary inputs (not only on timely basis but also at a
remunerative price) has to be given a due emphasis so as to achieve the desired
objectives.

112
References
Abdisa Gemeda, Girma Aboma, H. Verkuijl, and Mwangi, W. (2001.). "Farmers' Maize
Seed Systems in Western Oromia, Ethiopia", Mexico, D.F: International Maize
and Wheat improvement center (CIMMTY) and Ethiopia Agricultural Research
Organization (EARO).
Adesina, A. and M. Zinnah (1993). "Technology characteristics, farmers’ perceptions
and adoption decisions: a Tobit model application in Sierra Leone", A Journal of
Agricultural Economics 9: 297- 311.
Alemu, D. and J. Spillman (2006) "The Ethiopian Seed Systems: Regulation, Institutions
and Stakeholders.", Paper submitted for ESSP polices conference.
Asrat Asfaw, (2008). "Seed relief intervention and resilience of local seed systems under
stress: The case of Humbo Woreda in Southern Ethiopia", Proceedings of
workshop in the improvement of Farmer Based Seed production and revitalization
of the informal Seed supply of local crops and varieties in Ethiopia. 10 April
2008, Wageningen International.
Beatrice,S., W. Mwangi, D. Mwabu and A. Diallo (2007). "Factors influencing adoption
of stress-tolerant maize hybrid (WH 502) in western Kenya", African Journal of
Agricultural Research 2 (10): 544-551,available online at:
<http://www.academicjournals.org/AJAR>.
Becerril, J. and Abdulai,A. (2010). "The impact of improved maize varieties on poverty
in Mexico: A propensity score matching approach", Journal of World Dev. 38(7):
1024-1035.
113
Bekele, G. and Alemu, M. (2010). "Investments in Land Conservation in the Ethiopian
Highlands. A Household Plot-Level Analysis of the Roles of Poverty, Tenure
Security, and Market Incentives." , Environment for Development, Discussion
Paper Series.
Bezabih Emana (2000). "The Role of New Varieties and Chemical Fertilizers under Risk:
The Case of Smallholder in Eastern Oromia, Ethiopia", Ph.D dissertation,
Germany.
Bishaw, Z., S.Yonas, and S.Belay (2008). "The status of the Ethiopian seed industry", in
Marja HT, B Zewdie, B Abdurahman and S Walter(eds) Farmers, Seeds and
Varieties. Wageningen International, the Netherlands.
Brush, S., E. Taylor and M. Bellon (1990). "Biological Diversity and Technology
Adoption in Andean Potato Agriculture", University of California. Mimeo: pp. 9-
20.
Byerlee, D., J. Spielman, D. Alemu, and M.Gautam,(2007). "Policies to Promote Cereal
Intensification in Ethiopia: A Review of Evidence and Experience", IFPRI
Discussion Paper; Washington, D C: International Food Policy Research Institute.
00707.
Campbell, R. (1966.). "A Suggested Paradigm of the Individual Adoption Process".
Rural Sociology 31: 458-466.
CSA, (2006). "Agricultural Sample Survey”, Conducted by Central Statistical Authority
for the year 2006/2007 from September to December, Volume I.
CIMMYT ( 1993). "The adoption of agricultural technology: A guide for survey design",
CIMMYT Economics Program.
114
Conley, T.(2001). "Social Learning through Networks: The Adoption of New Agricultural
Technologies in Ghana", American Journal of Agricultural Economics, 83(3):
668-673.
Cromwell, E., E. Friis-Hansen, and M. Turner (1992). "The Seed Sector in Developing
Countries: A Framework for Performance Analysis “, Working Paper 65, London:
Overseas Development Institute.
Dasgupta, S. (1989). "Diffusion of Agricultural Innovations in Village India", Department
of Sociology and Anthropology, University of Prince Edward Island, Canada.
Dawit Alemu, Mwangi, W., Mandefro Nigussie and J. Spillman (2008). "The Maize Seed
System in Ethiopia: Challenges and Opportunities in drought prone areas",
African Journal of Agricultural Research. 3 (4): 305-314.
Doss, R. (2003). "Understanding farm level technology adoption: Lessons learned from
micro surveys in Eastern Africa." CIMMYT Economics Program Working Paper
No. 03-07.
Edilegnaw Wale ( 2003). "What do farmers financially lose if they fail to use improved
seeds? Some econometric results for wheat and implications for agricultural
extension policy in Ethiopia", Ethio J. Agric. Eco XII (2): 59-79.
Fasil Kebebw and Girma Balcha ( 2004). "Conservation and Utilization of Biodiversity in
Ethiopia, National Strategy and Priorities."
Feder, G. and D. Umali (1993). "The Adoption of Agricultural Innovations” A Review.
Technological Forecasting and Social Change 43: 215-239.
115
Feder, G., Just, R. and Zilberman, D. (1985). "Adoption of agricultural innovations in
developing countries", A survey by Economic Development and Cultural Change
33: 255-298.
Foster, A. and M. Rosenzweig (1995). "Learning by Doing and Learning from Others:
Human Capital and Farm household Change in Agriculture", Journal of Political
Economy 103(6): 1176-1209.
Gemeda, A. and Aboma, G. (2001). "Farmers' Maize Seed Systems in Western Oromia,
Ethiopia", Mexico, D.F: International Maize and Wheat improvement center
(CIMMTY) and Ethiopia Agricultural Research Organization (EARO).
Genanew Bekele and Alemu Mekonnen (2010). "Investments in Land Conservation in the
Ethiopian Highlands", A Household Plot-Level Analysis of the Roles of Poverty,
Tenure Security, and Market Incentives, Discussion Paper Series.
Getahun, D. , W. Mwangi, H. Verkuijl and A. Wondimu (2000). " An assessment of the
adoption of seed and fertilizer packages and the role of credit in smallholder
maize production in Sidamo and North Omo Zone, Ethiopia."
Gezhaegn Ayele (1999). "Economic Analysis of Innovation and adoption of Vertisol
Technology", A Study of Small holders Mixed Farming in the Highlands of
Ethiopia, Stuttgart.
Greene, W. (2000). "Econometric Analysis." 4th Edition, Upper Saddle River, New
Jersey.
Hiebert, D. (1974). "Risk, learning and the adoption of fertilizer responsive varieties."
American Journal of Agricultural Economics 56: 764-68.
116
Howard, J., E. Crawford, V. Kelly, M. Demeke, and J. Jeje (2003). "Promoting High-
Input Maize Technologies in Africa", the Sasakawa-Global 2000 Experience in
Ethiopia and Mozambique. Journal of Food Policy 28: 335-348.
Jayne, T., R. Myers, and J. Nyoro (2007). "The Effects of Government Maize Marketing
Policies on Maize Market Prices in Kenya", Contributed paper, International
Association of Agricultural Economics Tri-Annual Meetings, Gold Coast,
Australia, August 12-18, 2006.
Janvry, M. (1991). "Peasant household behavior with missing markets-some paradoxes
explained." Economic Journal 101: 1400- 1417.
Kebede, Y., Gunjal, K. and Coffin, G. (1990). "Adoption of new technologies in Ethiopian
agriculture: the case of Tegulet-Bulga District, Shoa Province", Agricultural
Economics Journal 4: 27-43.
Kothari (1990). "Research Methodology: Methods and Techniques", 2nd Edition; Wishwa
Prakashan, New Delhi.
Lipton, M. ( 1968). "The Theory of Optimizing Peasant Farming", Journal of
development Studies, 4: 327-351.
Lipton, M., R. Longhurst, W. Mas-Colell, and J. Green (1989). "New Seeds and Poor
People", London.
Marapia (2007). "Farm Household Production Theories:A Review of Institutional and
Behavioral Responses" , Asian Development Review 24(1): 49-68.
Marra, M., Pannell,J and Abadi Ghadim ( 2003). "The economics of risk, uncertainty and
learning in the adoption of new agricultural technologies: where are we on the
117
learning curve?" , A Journal for Agricultural Systems 75: 215-314.
McGuirk, A. and Y. Mundlak (1991). "Incentives and constraints in the transformation
of Punjab agriculture". A Research Report (87) Presented by International Food
Policy Research Institute, Washington D.C.
Million Tadesse, Belay Kasa, Legesse Dadi and Dawit Alemu (2004). "Determinants of
fertilizer use in Gununo area". Proceedings of agricultural technology evaluation
adoption and marketing Ethiopia; Workshop held to discuss results of 1998-2002,
pp: 21-31.
Minten, B. (2008). "Agricultural technology, productivity, and poverty in Madagascar",
World Dev. 36(5): 797-822.
Morduch, J. (1994). "Risk, Production, and Saving: Theory and Evidence from Indian
Households", Harvard University, Cambridge.
Morris, L., Tripp, R. and Dankyi, A. (1999). "Adoption and impact of improved maize
production technologies. A case study of the Ghana Grains Development Project
Economics Program Paper 99-01: pp:38.
Munshi, K. (2004). "Social learning in a heterogeneous population: technology diffusion
in the Indian Green Revolution." Journal of Development Economics 73: 185-
213.
Mwangi, W. and H. Teklewold (2006). " Determinants of adoption of poultry
technology: A double-hurdle approach ", Livestock Research for Rural
Development. vol 3: 1-14.
Nkonya, E., T. Schroeder and D. Norman (1997) "Factors affecting adoption of improved
maize seed and fertilizer in North Tanzania.", Indian journal of Agricultural

118
economics. 48(1): 1-12.
Odulaja, A. and G. Fassil (1996). "Modeling Agricultural Production of Small- Scale in
SSA: A Case Study in Western Kenya" , Agricultural Economics Journal 14 (1-3):
85-91.
Ojiako, A. and V. Manyong (2007). "Determinants of rural farmers’ improved Soybean
adoption decision in northern Nigeria ", Journal of Food Agric. Environ., 5 (2):
215-223.
Ouma, J. and Owuor, G. (2006). "Determinants of improved maize seed and fertilizer use
in Kenya: Policy implication", A Paper presented at the International Association
of Agricultural Economists’ Conference, Gold Cost, Australia, August 12-18.
Robson, E. and M. Smale ( 1991). "Sahellian Africa awaits its ‘green revolution’, Maize
Diversity, Variety Attributes, and Farmers’ Choices in South Eastern Guanajuato"
, journal of World Economic Development and Cultural Change ; 4(6),50(1): 21-
23, Mexico
Rogers, M. (1962). "Diffusion of innovations" , New York: Free Press of Glencoe.
Rogers, M. (1983). "Diffusion of Innovations" , 3rd edition. New York: Macmillan
Publishing Co.Inc..
Rogers, M. (1995). "Diffusion of Innovations" , New York: Free Press.
Rogers, M. and F. Shoemaker (1971). "Communication of Innovation: A Cross-cultural
Approach", Second Edition. The Free Press, New York.
Sain,G.and J.Martínez ( 1999). "Adoption and use of improved maize by small-scale
farmers in Southeast Guatemala", Economics Paper pp.99-104. Mexico D.F.:
119
CIMMYT.
Schultz, W. (1964). "Transforming Traditional Agriculture", New Haven, Yale University
Press.
SG 2000 (2002). "project Activities and outputs", An assessment Conducted from 1993-
2001:Addis Ababa, Ethiopia.
Shields,M. and G.Ranniyan ( 1993). "A Longitudinal Analysis of Factors Influencing
Increased Technology Adoption in Swaziland from 1985 to 1991", Journal of
Development Areas 27: 469-484.
Singh, I., L. Squire and J. Strauss ( 1986). "Agricultural Household Models: Extensions,
Applications and Policy", Baltimore, MD, US: John Hopkins University Press.
Smale, M., E. Just and D. Leathers (1994). "Land allocation in HYV adoption models: An
investigation of alternative explanations ", American Journal of Agricultural
Economics 76: 535-546.
Stone, D. (2007). "Agricultural deskilling and the spread of genetically modified cotton
in Warangal." Current Anthropology 48: 67-87.
Sunding, D. and D. Zilberman (2000). "The agricultural innovation process: Research
and technology adoption in a changing agricultural sector." In: B.L. Gardner and
G.C. Rausser(Eds) Handbook of agricultural economics Vol. 1A.
Taylor, J. and I.Adelman (2003). "Agricultural Household Models: Genesis,Evolution
and Extensions." Review of Economics of the Household 1(1): 33-58.
Teklewold, H. and L. Dadi (2006). "Determinants of adoption of poultry technology: A
double-hurdle approach", Livestock Research for Rural Development 18(3): 1-14.

120
Tesfaye Zegeye, D. Tanner, H. Verkuijl, A.Agidie, and W. Mwangi (2001). " Adoption of
Improved Bread Wheat Varieties and Inorganic Fertilizer by Small-Scale Farmers
in Yelmana Densa and Farta Districts of Northwestern Ethiopia", Mexico, D.F.:
International Maize and Wheat Improvement Center (CIMMYT) and Ethiopian
Agricultural Research Organization (EARO).
Uaiene, N. (2004). "Determinants of Agricultural Technology Adoption in Mozambique",
IFPRI Discussion Paper.
World Bank (2008). "World Development Report on Agriculture for Development”
Washington, DC.
Zavale, H., Mabaya, E. and Christy, R. (2005). "Adoption of Improved Maize Seed by
Smallholder Farmers in Mozambique", SP 2005-03 September 2005. Department
of Applied Economics and Management. Cornell University, Ithaca, New York."
14853-7801.
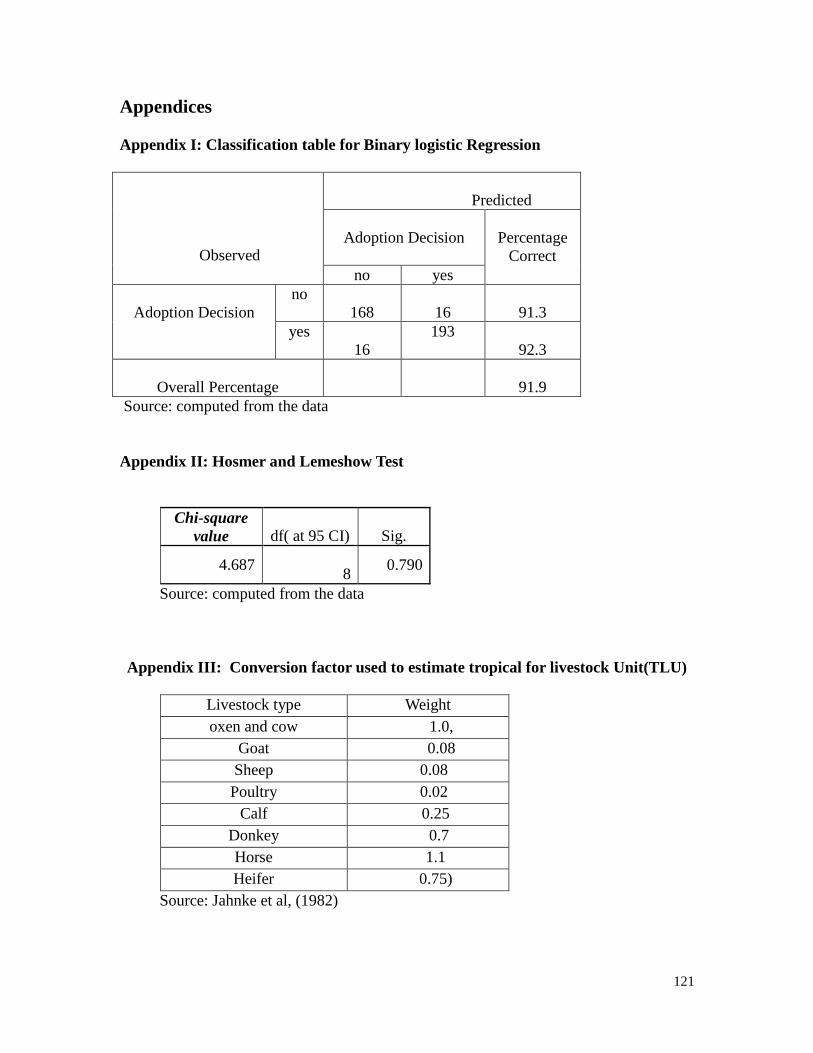
121
Appendices
Appendix I: Classification table for Binary logistic Regression
Observed
Predicted
Adoption Decision
Percentage
Correct
no yes
Adoption Decision
no
168
16
91.3
yes
16
193
92.3
Overall Percentage
91.9
Source: computed from the data
Appendix II: Hosmer and Lemeshow Test
Chi-square
value df( at 95 CI) Sig.
4.687
8 0.790
Source: computed from the data
Appendix III: Conversion factor used to estimate tropical for livestock Unit(TLU)
Livestock type Weight
oxen and cow 1.0,
Goat 0.08
Sheep 0.08
Poultry 0.02
Calf 0.25
Donkey 0.7
Horse 1.1
Heifer 0.75)
Source: Jahnke et al, (1982)
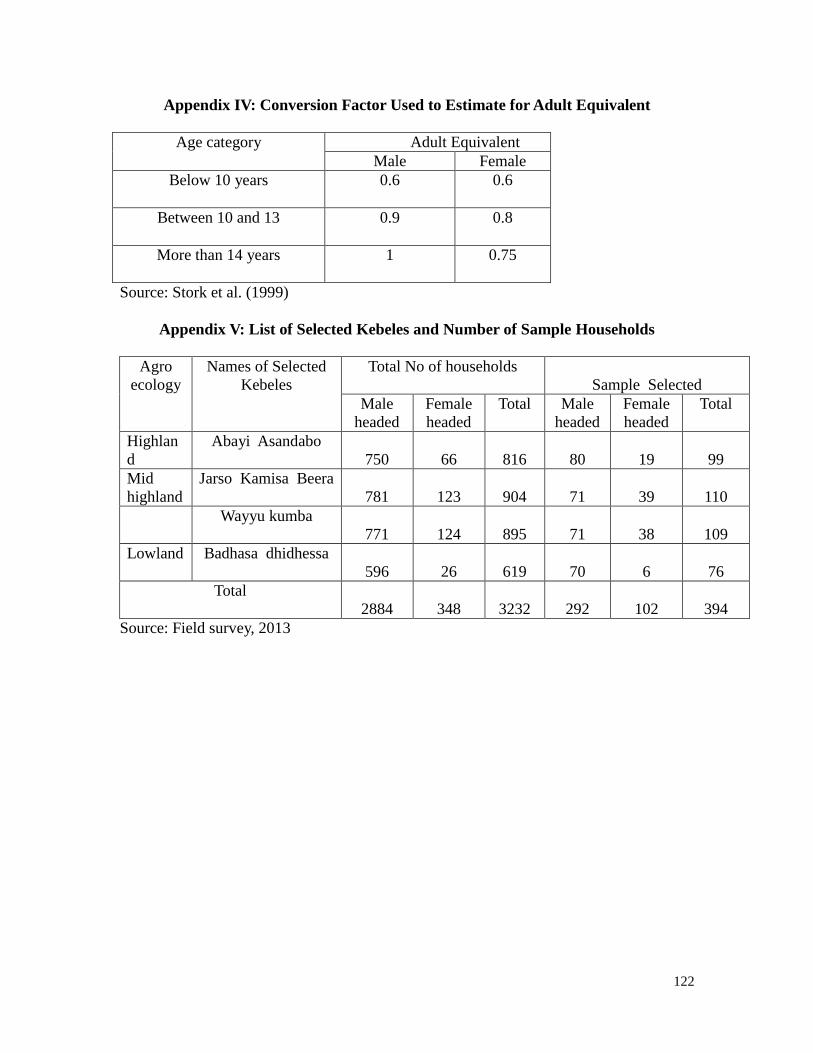
122
Appendix IV: Conversion Factor Used to Estimate for Adult Equivalent
Age category
Adult Equivalent
Male Female
Below 10 years 0.6
0.6
Between 10 and 13 0.9
0.8
More than 14 years 1
0.75
Source: Stork et al. (1999)
Appendix V: List of Selected Kebeles and Number of Sample Households
Agro
ecology
Names of Selected
Kebeles
Total No of households
Sample Selected
Male
headed
Female
headed
Total Male
headed
Female
headed
Total
Highlan
d
Abayi Asandabo
750
66
816
80
19
99
Mid
highland
Jarso Kamisa Beera
781
123
904
71
39
110
Wayyu kumba
771
124
895
71
38
109
Lowland Badhasa dhidhessa
596
26
619
70
6
76
Total
2884
348
3232
292
102
394
Source: Field survey, 2013