Video sensor network for real-time traffic monitoring and surveillance
Upload
independentCategory
view
1download
0
Adjustment of Surveillance Video Systems by a
Performance Evaluation Function
Oscar Perez, Jesus Garcıa, Antonio Berlanga, and Jose M. Molina⋆⋆
Universidad Carlos III de Madrid. Departamento de Informatica.Avenida de la Universidad Carlos III, 22 Colmenarejo 28270. Madrid. Spain.
[email protected], [email protected],
[email protected], [email protected]
Abstract. This paper proposes an evaluation metric for assessing theperformance of a video tracking system. This metric is applied to adjustthe parameters that regulates the video tracking system in order to im-prove the system perfomance. Thus, the automated optimization methodis based on evolutionary computation techniques. The illustration of theprocess is carried out using three very different video sequences in whichthe evaluation function assesses trajectories of airplanes, cars or baggage-trucks in an airport surveillance application.
1 Introduction
The application of video cameras for remote surveillance has increased rapidly inthe industry for security purposes. The installation of many cameras produces agreat problem to human operators because the incompatibility of a high analysisof received images with the analysis of the whole information provided for thesurveillance video camera net. The solution is the automatic analysis of videoframes to represent in a simplify way the video information to be presented tothe operator. A minimal requirement for automatic video surveillance system isthe capacity to track multiple objects or groups of objects in real conditions [1].
The main point of this research consists in the evaluation of surveillanceresults, defining a metric to measure the quality of a proposed configuration [2].The truth values from real images are extracted and stored in a file [3] and [4].To do this, the targets are marked and positioned in each frame with differentattributes. Using this metric in an evaluation function, we can apply differenttechniques to assess suitable parameters and, then, to optimize them. EvolutionStrategies (ES) are selected for this problem [5][6][7][8] and [9] because theypresent high robustness and immunity to local extremes and discontinuities infitness function. This paper demonstrates that the proposed evaluation functioncorrectly guides the ES optimization in this type of problems. The desired resultsare reached once an appropriate fitness function has been defined. This allowsan automatic adjustment of tracker performance accordingly to all specificationsconsidered. Furthermore, one of the principal points of this study is that the
⋆⋆ Funded by CICYT (TIC2002-04491-C02-02)

2
evaluation and potential optimization are not dependent on the specific type oftracking system used.
In the next section, the whole surveillance system is presented, where spe-cific association problems in this application are analyzed. The third sectionpresents the proposed metric. In section fourth, the system output in severalscenarios is presented, indicating the response for complex situations, with realimage sequences of representative ground operations. Finally, some conclusionsare presented.
2 Surveillance video system
This section describes the structure of an image-based tracking system.
Detection and Image
segmentation:
blobs extraction
Detector Update
Background
Background
Computation
Camera i
Images
Track
Update
Track Management
Airport Map and
Image Masks
Blobs-to-tracks
Asociation
Oclusion and
Overlap Logic
Track Extrapolation
Array of local Target
Tracks
Fig. 1. Structure of video surveillance system.
The system architecture is a coupled tracking system where the detectedobjects are processed to initiate and maintain tracks. These tracks represent thereal targets in the scenario and the system estimates their location and cinematicstate. The detected pixels are connected to form image regions referred to asblobs. The association process assigns one or several blobs to each track, whilenot associated blobs are used to initiate tracks [4].
2.1 Detector and blobs extraction
The positioning/tracking algorithm is based on the detection of targets by con-trasting with local background, whose statistics are estimated and updated withthe video sequence. Then, the pixel level detector is able to extract moving fea-tures from background, comparing the difference with a threshold. To illustratethe process, figure 2 depicts the different levels of information interchanged, fromthe raw images until the tracks.
3�� �������� � ���� ���������� ����� ������� �� �������� ��� �
Fig. 2. Information levels in the processing chain.
Finally, the algorithm for blobs extraction marks with a unique label all de-tected pixels connected, by means of a clustering and growing regions algorithm[10]. Then, the rectangles which enclose the resulting blobs are built, and theircentroids and areas are computed. In order to reduce the number of false de-tections due to noise, a minimum area, MIN-AREA, is required to form blobs.This parameter is a second data filter which avoids noisy detections from theprocessing chain.
2.2 Blobs-to-track association
The association problem lies in deciding the most proper grouping of blobs andassigning it to each track for each frame processed. Due to image irregularities,shadows, occlusions, etc., a first problem of imperfect image segmentation ap-pears, resulting in multiple blobs generated for a single target. So, the blobsmust be re-connected before track assignment and updating. However, whenmultiple targets move closely, their image regions may overlap. As a result, sometargets may appear occluded by other targets or obstacles, and some blobs canbe shared by different tracks. For the sake of simplicity, first a rectangular boxhas been used to represent the target. Around the predicted position, a rectan-gular box with the estimated target dimensions is defined, (xmin, xmax, ymin,ymax). Then, an outer gate, computed with a parameter defined as a margin,MARGIN-GATE, is defined. It represents a permissible area in which to searchmore blobs, allowing some freedom to adapt target size and shape. The asso-ciation algorithm analyses the track-to-blob correspondence. It firsts checks ifthe blob and the track rectangular gates are compatible (overlap), and marks asconflictive those blobs which are compatible with two or more different tracks.After gating, a grouping algorithm is used to obtain one ”pseudoblob” for eachtrack. This pseudoblob will be used to update track state. If there is only oneblob associated to the track and the track is not in conflict, the pseudoblob usedto update the local track will be this blob. Otherwise, two cases may occur:
1. A conflict situation arises when there are overlapping regions for severaltargets (conflicting tracks). In this case, the system may discard those blobsgated by several tracks and extrapolate the affected tracks. However, thispolicy may be too much restrictive and might degrade tracking accuracy. Asa result, it has been left open to design by means of a Boolean parameternamed CONFLICT which determines the extrapolation or not of the tracks.
2. When a track is not in conflict, and it has several blobs associated to it, thesewill be merged on a pseudoblob whose bounding limits are the outer limits

4
of all associated blobs. If the group of compatible blobs is too big and notdense enough, some blobs (those which are further away from the centroid)are removed from the list until density and size constraints are held. Thegroup density is compared with a threshold, MINIMUM-DENSITY, andthe pseudo-blob is split back into the original blobs when it is below thethreshold.
2.3 Tracks filtering, initiation and deletion
A recursive filter updates centroid position, rectangle bounds and velocity foreach track from the sequence of assigned values, by means of a decoupled Kalmanfilter for each Cartesian coordinate, with a piecewise constant white accelerationmodel [11]. The acceleration variance that will be evaluated, usually named as”plant-noise”, is directly related with tracking accuracy. The predicted rectan-gular gate, with its search area around, is used for gating. Thus it is importantthat the filter is ”locked” to real trajectory. Otherwise tracks would lose its realblobs and finally drop. So this value must be high enough to allow manoeuvresand projection changes, but not too much, in order to avoid noise. As a result,it is left as an open parameter to be tuned, VARIANCE-ACCEL. Finally, track-ing initialization and management takes blobs which are not associated to anyprevious track. It requires that non-gated blobs extracted in successive frames ac-complish certain properties such as a maximum velocity and similar sizes whichmust be higher than a minimum value established by the parameter MINIMUM-TRACK-AREA. In order to avoid multiple splits of targets, established trackspreclude the initialization of potential tracks in the surrounding areas, using adifferent margin than the one used in the gating search. This value which allowstrack initialization is named MARGIN-INITIALIZATION.
3 Evaluation System
The approach used for this work evaluates the detection and tracking systemperformance using ground truth to provide independent and objective data thatcan be related to the observations extracted and detected from the video se-quence. In each scenario, the ground truth has been extracted frame by frame,selecting the targets and storing the next data for each target:
– Number of analyzed frame– Track identifier– Value of the minimum x coordinates of the rectangle that surrounds the
target– Value of the maximum x coordinates of the rectangle that surrounds the
target– Value of the minimum y coordinates of the rectangle that surrounds the
target– Value of the maximum y coordinates of the rectangle that surrounds the
target
5
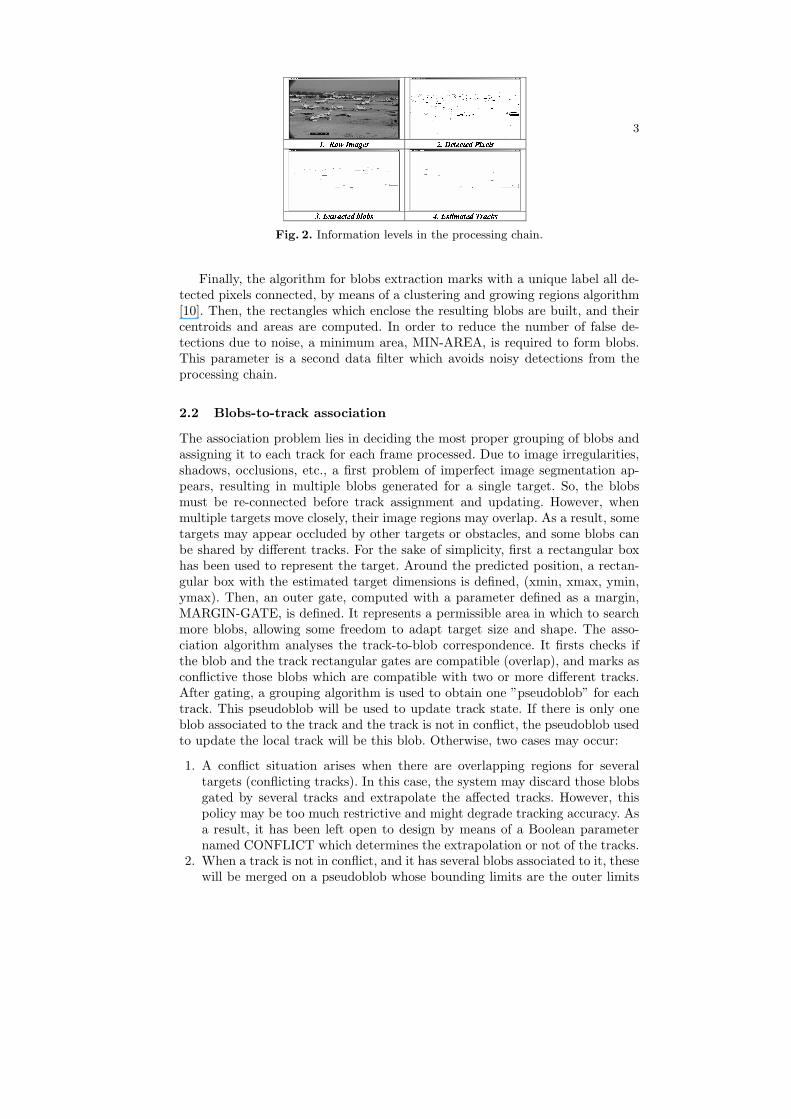
These ground truth is compared to the real detections by the evaluationsystem. First of all, the result tracks are checked to see if they match with theground truth tracks registered in the ground truth table. For example, as wesee in the next pictures (figure 3), the real image shows two aircrafts in theparallel taxiways while the tracking system displays three targets. Then, thetarget which is in the middle of the screen not pass the test and it would bemarked as a mismatched track.
Fig. 3. Example of mismatched track.
If the test is passed, the evaluation system computes four parameters pertarget which are classified into ’accurary metrics’ and ’continuity metrics’:
Accuracy metrics:
– Overlap-area (OAP): Overlap Area Percentage between the real and thedetected blobs.
– X-error (Ex) and Y-error (Ey): Difference in x and y coordinates betweenthe centers of the ideal blob and the detected blobs.
Continuity metrics:
– Number of Tracks per target (NT): It is checked if more than one detectedtrack is matched with the same ideal track. If this happens, the programkeeps the detected track which has a bigger overlapped area value, removesthe other one and marks the frame with a flag that indicates the number ofdetected tracks associated to this ideal one.
– Commutation(C): A commutation occurs when the identifier of a track matchedto an ideal track changes. It typically takes place when the track is lost andrecovered later.
Besides these parameters, an evaluation function has been defined, with theobjective of extracting a number that measures the quality level of the trackingsystem. This number is based on the evaluation metrics specified before. Thus,the resultant number is obtained by means of a weighted sum of different termswhich are computed target by target:

6
– Mismatch (M): A counter which stores how many times the ground truthand the tracked object data do not match up (NT is not 1). Furthermore,this counter is normalized by the difference between the last and first framein which the ideal track disappears and appears (Time of life (T)).
– The three next terms are the total sum of the overlapped areas (∑
OAP ) andthe central errors of x (
∑Ex) and y axes (
∑Ey). They are normalized by
a number which indicates how many times these values are available (thereis not continuity problem) in the whole video sequence (DZ).
– The next two elements are two counters:• Overmatch-counter (Oc): how many times the ground truth track is
matched with more than one tracked object data.• Undermatch-counter (Uc): how many times the ground truth track is not
matched with any track at all.– Finally, the last term is the number of commutations in the track under
study (∑
C). The three last elements are normalized by the same value ofnormalization as the first one (Time of life, T). It is clear that the lowerthe Evaluation function, the better the quality of the tracking system. Withthe objective of minimizing the Evaluation function, the Video SurveillanceSystem has been optimized by ES.
Thus, the evaluation function can be represented as follows:
E =W1M
2π+
W2
∑OAP + W3
∑Ex + W4
∑Ey
DZ+
W5Oc + W6Uc + W7
∑C
T(1)
where W1,2,3,4,5,6,7 are the weights for the parameters. Figure 4 depicts thedifferent stages of the Evaluation System in order to have a clear idea of it.
Performance
Evaluation: Fitness
Function
Continuity Metrics
Estimated Tracks
Ground
Truth
Set of Matched
Tracks: Estimated
Tracks-Ground Truth
Tracks
Accuracy Metrics
Matching up
Tracks
Figure 4. Evaluation System Fig. 4. Evaluation System.
4 Perfomance Optimization
This section of the study shows how the analysis of the evaluation system, andits application to ES optimization, improves considerably the performance of a
7
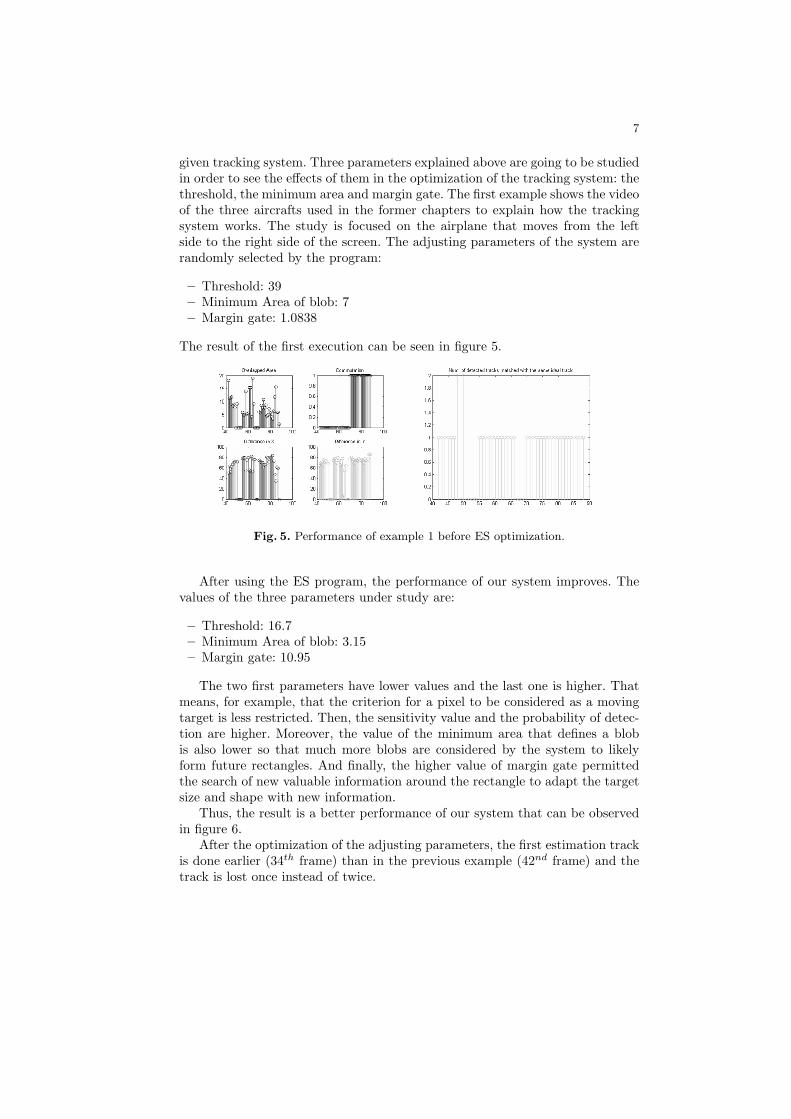
given tracking system. Three parameters explained above are going to be studiedin order to see the effects of them in the optimization of the tracking system: thethreshold, the minimum area and margin gate. The first example shows the videoof the three aircrafts used in the former chapters to explain how the trackingsystem works. The study is focused on the airplane that moves from the leftside to the right side of the screen. The adjusting parameters of the system arerandomly selected by the program:
– Threshold: 39– Minimum Area of blob: 7– Margin gate: 1.0838
The result of the first execution can be seen in figure 5.
Fig. 5. Performance of example 1 before ES optimization.
After using the ES program, the performance of our system improves. Thevalues of the three parameters under study are:
– Threshold: 16.7– Minimum Area of blob: 3.15– Margin gate: 10.95
The two first parameters have lower values and the last one is higher. Thatmeans, for example, that the criterion for a pixel to be considered as a movingtarget is less restricted. Then, the sensitivity value and the probability of detec-tion are higher. Moreover, the value of the minimum area that defines a blobis also lower so that much more blobs are considered by the system to likelyform future rectangles. And finally, the higher value of margin gate permittedthe search of new valuable information around the rectangle to adapt the targetsize and shape with new information.
Thus, the result is a better performance of our system that can be observedin figure 6.
After the optimization of the adjusting parameters, the first estimation trackis done earlier (34th frame) than in the previous example (42nd frame) and thetrack is lost once instead of twice.

8
Fig. 6. Performance of example 1 after ES optimization.
The second example takes the second video considered in former chaptersand the aircraft that goes from the left side to the right side of the screen as themain target to study. The values of the three parameters on which our study isfocus:
– Threshold: 16.7– Minimum Area of blob: 2– Margin gate: 2
The surveillance system performance is shown in figure 7.
– Threshold: 38.94– Minimum Area of blob: 6.9885– Margin gate: 1.0838
The surveillance system performance is shown in figure 8.
Fig. 7. Performance of example 2 before ES optimization.
The new values show the opposite situation that we had in the previousexample. The threshold and the minimum area of blob are higher and the margingate is lower. That means that these values decrease conflicts and interactionamong tracks (no commutation), at the same time that the detection probablyand the criterion threshold to form a blob are lower.

9
Fig. 8. Performance of example 2 after ES optimization.
5 Conclusions
We have presented a novel process to evaluate the performance of a trackingsystem based on the extraction of information from images filmed by a camera.The ground truth tracks, which have been previously selected and stored bya human operator, are compared to the estimated tracks. The comparison iscarried out by means of a set of evaluation metrics which are used to compute anumber that represents the quality of the system. Then, the proposed metric hasbeen applied as the argument to the evolutionary strategy (ES) whose functionis the optimization of the parameters that rule the tracking system. This processis repeated until the result and the parameters are good enough to assure thatthe system will do a proper performance. The study tests several videos andshows the improvement of the results for the optimization of three parametersof the tracking system. In future works we will implement the optimization of thewhole set of parameters using the results of this paper as valuable background.Furthermore, we plan the evaluation over a high value of videos which presentvery different number of targets and weather conditions.
References
1. Rosin, P.L., Ioannidis, E.: Evaluation of global image thresholding for change de-tection, Pattern Recognition Letters, vol. 24, no. 14 (2003) 2345–2356
2. Black, J., Ellis, T., Rosin, P.: A Novel Method for Video Tracking PerformanceEvaluation, Joint IEEE Int. Workshop on Visual Surveillance and PerformanceEvaluation of Tracking and Surveillance (VS-PETS) (2003)
3. Piater, J. H., Crowley, J. L.: Multi-Modal Tracking of Interacting Targets UsingGaussian Approximations. IEEE International Workshop on Performance Evalua-tion of Tracking and Surveillance (PETS) (2001)
4. Pokrajac, D., Latecki, L.J.: Spatiotemporal Blocks-Based Moving Objects entifica-tion and Tracking, IEEE Int. W. Visual Surveillance and Performance Evaluationof Tracking and Surveillance (VS-PETS) (2003)
5. Rechenberg, I.: Evolutionsstrategie’94. frommannholzboog, Stuttgart (1994).
6. Schwefel, H.P.: Evolution and Optimum Seeking: The Sixth Generation. John Wi-ley and Sons, Inc. New York, NY, USA (1995)
10
7. Back, T.: Evolutionary Algorithms in Theory and Practice, Oxford UniversityPress, New York (1996)
8. Back, T., Fogel, D.B., Michalewicz, Z.: Evolutionary Computation: Advanced Al-gorithms and Operators, Institute of Physics, London (2000)
9. Back, T., Fogel, D.B., Michalewicz, Z.: Evolutionary Computation: Basic Algo-rithms and Operators, Institute of Physics, London (2000)
10. Sanka, M., Hlavac, V., Boyle, R.: Image Processing, Analysis and Machine Vision,Brooks/Cole Publishing Company (1999)
11. Blackman, S., Popoli, R.: Design and Analysis of Modern Tracking Systems. ArtechHouse (1999)
Copyright © 2022 FDOKUMEN