Adaptive Scaffolds in Open-Ended Computer-Based Learning ...
309
Adaptive Scaffolds in Open-Ended Computer-Based Learning Environments By James R. Segedy Dissertation Submitted to the Faculty of the Graduate School of Vanderbilt University in partial fulfillment of the requirements for the degree of DOCTOR OF PHILOSOPHY in Computer Science August, 2014 Nashville, Tennessee Approved: Professor Gautam Biswas Professor Julie Adams Professor Robert Bodenheimer Professor Doug Fisher Professor Doug Clark
-
Upload
khangminh22 -
Category
Documents
-
view
3 -
download
0
Transcript of Adaptive Scaffolds in Open-Ended Computer-Based Learning ...

Adaptive Scaffolds in Open-Ended Computer-Based Learning Environments
By
James R. Segedy
Dissertation
Submitted to the Faculty of the
Graduate School of Vanderbilt University
in partial fulfillment of the requirements
for the degree of
DOCTOR OF PHILOSOPHY
in
Computer Science
August, 2014
Nashville, Tennessee
Approved:
Professor Gautam Biswas
Professor Julie Adams
Professor Robert Bodenheimer
Professor Doug Fisher
Professor Doug Clark

ACKNOWLEDGMENTS
No significant achievement is attained in isolation or as the result of individual effort. The same can be said of
this accomplishment, which has been supported and influenced by thousands of people. Family, friends, men-
tors, teachers, co-workers, my dissertation committee, funding agencies, my students, my research subjects,
Goucher College, and Vanderbilt University all share in the credit.
This work has been financially supported by the Institute of Educational Sciences grants #R305H060089
and #R305A120186 and the National Science Foundation’s IIS Award #0904387 and REESE Award
#0633856.
ii

TABLE OF CONTENTS
Page
ACKNOWLEDGMENTS . . . . . . . . . . . . . . . . . . . . . . . . . . . . . . . . . . . . . . . ii
LIST OF TABLES . . . . . . . . . . . . . . . . . . . . . . . . . . . . . . . . . . . . . . . . . . . vi
LIST OF FIGURES . . . . . . . . . . . . . . . . . . . . . . . . . . . . . . . . . . . . . . . . . . . viii
LIST OF ABBREVIATIONS . . . . . . . . . . . . . . . . . . . . . . . . . . . . . . . . . . . . . . x
1 Introduction . . . . . . . . . . . . . . . . . . . . . . . . . . . . . . . . . . . . . . . . . . . . 1
1.1 Problem Overview: Adaptive Scaffolds in Open-Ended Learning Environments . . . . . . 31.2 Research Approach and Contributions . . . . . . . . . . . . . . . . . . . . . . . . . . . . 6
1.2.1 Contributions to the Development of Scaffolding Agents . . . . . . . . . . . . . . 71.2.2 Contributions to the Understanding of Students’ Problem Solving Behaviors . . . . 8
1.3 Dissertation Organization . . . . . . . . . . . . . . . . . . . . . . . . . . . . . . . . . . . 9
2 Theoretical Background and Related Work . . . . . . . . . . . . . . . . . . . . . . . . . . . 10
2.1 The Structure of Knowledge . . . . . . . . . . . . . . . . . . . . . . . . . . . . . . . . . . 112.2 Metacognition . . . . . . . . . . . . . . . . . . . . . . . . . . . . . . . . . . . . . . . . . 132.3 The Scaffolding Metaphor and Adaptive OELEs . . . . . . . . . . . . . . . . . . . . . . . 16
2.3.1 Scaffolds as Interface Features - Limitations . . . . . . . . . . . . . . . . . . . . . 172.3.2 Scaffolds as Activity Sequencing - Limitations . . . . . . . . . . . . . . . . . . . . 182.3.3 Scaffolds as Supportive Actions . . . . . . . . . . . . . . . . . . . . . . . . . . . 192.3.4 The Space of Scaffolds: Suggest-Assert-Modify . . . . . . . . . . . . . . . . . . . 20
2.3.4.1 Suggestion Scaffolds . . . . . . . . . . . . . . . . . . . . . . . . . . . . 212.3.4.2 Assertion Scaffolds . . . . . . . . . . . . . . . . . . . . . . . . . . . . . 222.3.4.3 Modification Scaffolds . . . . . . . . . . . . . . . . . . . . . . . . . . . 22
2.3.5 Summary: Components of Adaptive OELEs . . . . . . . . . . . . . . . . . . . . . 232.4 OELEs: The State of the Art . . . . . . . . . . . . . . . . . . . . . . . . . . . . . . . . . 24
2.4.1 Hypermedia Based OELEs . . . . . . . . . . . . . . . . . . . . . . . . . . . . . . 242.4.2 Modeling and Simulation Based OELEs . . . . . . . . . . . . . . . . . . . . . . . 252.4.3 Immersive Narrative-Centered Environments . . . . . . . . . . . . . . . . . . . . . 27
2.5 Additional Scaffolding Strategies . . . . . . . . . . . . . . . . . . . . . . . . . . . . . . . 282.6 Betty’s Brain . . . . . . . . . . . . . . . . . . . . . . . . . . . . . . . . . . . . . . . . . . 31
2.6.1 Previous Research with Betty’s Brain . . . . . . . . . . . . . . . . . . . . . . . . . 332.7 Critical Review of Previously-Developed OELEs . . . . . . . . . . . . . . . . . . . . . . . 342.8 Summary . . . . . . . . . . . . . . . . . . . . . . . . . . . . . . . . . . . . . . . . . . . . 36
3 Exploratory Studies of Student Behavior in Betty’s Brain . . . . . . . . . . . . . . . . . . . 38
3.1 Study 1: Identifying More and Less Successful Behaviors . . . . . . . . . . . . . . . . . . 383.1.1 Summary of Results . . . . . . . . . . . . . . . . . . . . . . . . . . . . . . . . . . 403.1.2 Discussion . . . . . . . . . . . . . . . . . . . . . . . . . . . . . . . . . . . . . . . 43
3.2 Study 2: Testing Contextualized Conversational Feedback . . . . . . . . . . . . . . . . . . 433.2.1 Summary of Results . . . . . . . . . . . . . . . . . . . . . . . . . . . . . . . . . . 453.2.2 Discussion . . . . . . . . . . . . . . . . . . . . . . . . . . . . . . . . . . . . . . . 49
iii

3.3 Summary and Discussion . . . . . . . . . . . . . . . . . . . . . . . . . . . . . . . . . . . 503.3.1 Limitations . . . . . . . . . . . . . . . . . . . . . . . . . . . . . . . . . . . . . . 50
4 The Coherence Graph Analysis Approach to Learner Modeling in OELEs . . . . . . . . . 53
4.1 Characterizing Problem Solving Processes in OELEs: Task and Process Models . . . . . . 534.2 Representing Skill Levels in Betty’s Brain . . . . . . . . . . . . . . . . . . . . . . . . . . 58
4.2.1 Causal Reasoning Skills . . . . . . . . . . . . . . . . . . . . . . . . . . . . . . . . 584.2.2 Assessing Information Seeking Skills . . . . . . . . . . . . . . . . . . . . . . . . 604.2.3 Assessing Solution Assessment Skills . . . . . . . . . . . . . . . . . . . . . . . . 62
4.3 Coherence Graph Analysis . . . . . . . . . . . . . . . . . . . . . . . . . . . . . . . . . . 634.3.1 Effectiveness . . . . . . . . . . . . . . . . . . . . . . . . . . . . . . . . . . . . . 644.3.2 Coherence, Support, and Potential . . . . . . . . . . . . . . . . . . . . . . . . . . 644.3.3 Incoherence and Negative Support . . . . . . . . . . . . . . . . . . . . . . . . . . 674.3.4 Coherence Graphs: Representing Effectiveness and Coherence in Betty’s Brain . . 674.3.5 Filtering Coherence Graphs . . . . . . . . . . . . . . . . . . . . . . . . . . . . . . 70
4.4 Summary . . . . . . . . . . . . . . . . . . . . . . . . . . . . . . . . . . . . . . . . . . . . 70
5 A New System Architecture for Betty’s Brain . . . . . . . . . . . . . . . . . . . . . . . . . . 72
5.1 The CAILE Software Architecture . . . . . . . . . . . . . . . . . . . . . . . . . . . . . . 725.1.1 CAILE Services . . . . . . . . . . . . . . . . . . . . . . . . . . . . . . . . . . . . 735.1.2 CAILE Modules . . . . . . . . . . . . . . . . . . . . . . . . . . . . . . . . . . . . 75
5.2 Activity Modules in Betty’s Brain . . . . . . . . . . . . . . . . . . . . . . . . . . . . . . . 805.3 The Betty’s Brain Application Module . . . . . . . . . . . . . . . . . . . . . . . . . . . . 885.4 Summary . . . . . . . . . . . . . . . . . . . . . . . . . . . . . . . . . . . . . . . . . . . . 89
6 Experimental Evaluation of CGA and an Accompanying Adaptive Scaffolding Strategy . . 91
6.1 A Three-Stage Scaffolding Strategy for Betty’s Brain . . . . . . . . . . . . . . . . . . . . 916.1.1 General Learner-Directed Support . . . . . . . . . . . . . . . . . . . . . . . . . . 946.1.2 Diagnosis Support with Feedback . . . . . . . . . . . . . . . . . . . . . . . . . . 956.1.3 Guided Practice Support . . . . . . . . . . . . . . . . . . . . . . . . . . . . . . . 96
6.2 Study 3: Testing the CGA-based Learner Model and Three-Stage Scaffolding Strategy . . . 976.2.1 Materials and Method . . . . . . . . . . . . . . . . . . . . . . . . . . . . . . . . . 99
6.2.1.1 Participants . . . . . . . . . . . . . . . . . . . . . . . . . . . . . . . . . 996.2.1.2 Topic Units and Text Resources . . . . . . . . . . . . . . . . . . . . . . 996.2.1.3 Betty’s Brain Interface and Features . . . . . . . . . . . . . . . . . . . . 1026.2.1.4 Learning Assessments . . . . . . . . . . . . . . . . . . . . . . . . . . . 1056.2.1.5 Log File Analysis . . . . . . . . . . . . . . . . . . . . . . . . . . . . . 1076.2.1.6 Procedure . . . . . . . . . . . . . . . . . . . . . . . . . . . . . . . . . . 109
6.2.2 Results . . . . . . . . . . . . . . . . . . . . . . . . . . . . . . . . . . . . . . . . . 1106.2.2.1 Assessment Test Performance . . . . . . . . . . . . . . . . . . . . . . . 1106.2.2.2 Investigating the Effect of the Scaffolding Strategies . . . . . . . . . . . 1136.2.2.3 Behavioral Analysis By Condition . . . . . . . . . . . . . . . . . . . . . 1166.2.2.4 Correlations between Behavior, Learning, and Performance Metrics . . . 1206.2.2.5 Exploratory Clustering and Classification Analyses . . . . . . . . . . . . 124
6.2.3 Discussion . . . . . . . . . . . . . . . . . . . . . . . . . . . . . . . . . . . . . . . 133
7 Discussion and Conclusions . . . . . . . . . . . . . . . . . . . . . . . . . . . . . . . . . . . . 136
7.1 Contributions to the Development of Scaffolding Agents . . . . . . . . . . . . . . . . . . . 1367.2 Contributions to the Understanding of Students’ Open-Ended Problem Solving Behaviors . 1377.3 Future Research Directions . . . . . . . . . . . . . . . . . . . . . . . . . . . . . . . . . . 139
iv

REFERENCES . . . . . . . . . . . . . . . . . . . . . . . . . . . . . . . . . . . . . . . . . . . . . 142
A Reference Materials for Study 1 . . . . . . . . . . . . . . . . . . . . . . . . . . . . . . . . . 151
A.1 Assessment Test Questions . . . . . . . . . . . . . . . . . . . . . . . . . . . . . . . . . . 151A.1.1 Science Content Questions . . . . . . . . . . . . . . . . . . . . . . . . . . . . . . 151A.1.2 Causal Reasoning Questions . . . . . . . . . . . . . . . . . . . . . . . . . . . . . 153A.1.3 Short Answer Questions . . . . . . . . . . . . . . . . . . . . . . . . . . . . . . . 154
A.2 Science Resources . . . . . . . . . . . . . . . . . . . . . . . . . . . . . . . . . . . . . . . 154A.3 Causal Reasoning Training Packet . . . . . . . . . . . . . . . . . . . . . . . . . . . . . . 163
B Reference Materials for Study 2 . . . . . . . . . . . . . . . . . . . . . . . . . . . . . . . . . 170
B.1 Assessment Test Questions . . . . . . . . . . . . . . . . . . . . . . . . . . . . . . . . . . 170B.1.1 Science Content Questions . . . . . . . . . . . . . . . . . . . . . . . . . . . . . . 170B.1.2 Causal Reasoning Questions . . . . . . . . . . . . . . . . . . . . . . . . . . . . . 172B.1.3 Short Answer Questions . . . . . . . . . . . . . . . . . . . . . . . . . . . . . . . 174
B.2 Science Resources . . . . . . . . . . . . . . . . . . . . . . . . . . . . . . . . . . . . . . . 174B.3 Causal Reasoning Training Packet . . . . . . . . . . . . . . . . . . . . . . . . . . . . . . 197
C Reference Materials for Study 3 . . . . . . . . . . . . . . . . . . . . . . . . . . . . . . . . . 216
C.1 Assessment Test Questions . . . . . . . . . . . . . . . . . . . . . . . . . . . . . . . . . . 216C.1.1 Climate Change Questions . . . . . . . . . . . . . . . . . . . . . . . . . . . . . . 216
C.1.1.1 Science Content Questions . . . . . . . . . . . . . . . . . . . . . . . . . 216C.1.1.2 Short Answer Questions . . . . . . . . . . . . . . . . . . . . . . . . . . 218
C.1.2 Thermoregulation Questions . . . . . . . . . . . . . . . . . . . . . . . . . . . . . 218C.1.2.1 Science Content Questions . . . . . . . . . . . . . . . . . . . . . . . . . 218C.1.2.2 Short Answer Questions . . . . . . . . . . . . . . . . . . . . . . . . . . 220
C.1.3 Skill Problems . . . . . . . . . . . . . . . . . . . . . . . . . . . . . . . . . . . . . 221C.1.3.1 Causal Reasoning Problems . . . . . . . . . . . . . . . . . . . . . . . . 221C.1.3.2 Reading Problems . . . . . . . . . . . . . . . . . . . . . . . . . . . . . 222C.1.3.3 Quiz Evaluation Problems . . . . . . . . . . . . . . . . . . . . . . . . . 223
C.2 Science Resources . . . . . . . . . . . . . . . . . . . . . . . . . . . . . . . . . . . . . . . 231C.2.1 Climate Change Resources . . . . . . . . . . . . . . . . . . . . . . . . . . . . . . 231C.2.2 Thermoregulation Resources . . . . . . . . . . . . . . . . . . . . . . . . . . . . . 252
C.3 Teacher’s Guide . . . . . . . . . . . . . . . . . . . . . . . . . . . . . . . . . . . . . . . . 260C.4 Mr. Davis’s Training Script . . . . . . . . . . . . . . . . . . . . . . . . . . . . . . . . . . 282C.5 Forest Ecosystem Resources and Expert Map . . . . . . . . . . . . . . . . . . . . . . . . . 290
D Sample CGA-based Teacher Report . . . . . . . . . . . . . . . . . . . . . . . . . . . . . . . 296
v

LIST OF TABLES
Table Page
2.1 Types of Assertion Scaffolds with Examples. . . . . . . . . . . . . . . . . . . . . . . . . 22
3.1 Study 1 high vs. low performers - HMM State Output. . . . . . . . . . . . . . . . . . . . 41
3.2 Study 1 high vs. low performers - Differentially frequent patterns. . . . . . . . . . . . . . 42
3.3 Study 2 differentially frequent patterns. . . . . . . . . . . . . . . . . . . . . . . . . . . . 48
3.4 Study 2 differentially frequent patterns including map checking actions. . . . . . . . . . . 49
4.1 Skills related to students’ ability to reason with a causal map. Example questions andanswers refer to the causal map displayed in Figure 4.3. . . . . . . . . . . . . . . . . . . 61
4.2 Examples of text passages that describe the causal relation “Ticks increase tacks.” . . . . 62
4.3 Skills related to students’ ability to interpret quiz results. . . . . . . . . . . . . . . . . . . 63
6.1 Questions available during learner directed support. . . . . . . . . . . . . . . . . . . . . 94
6.2 Skills tracked by Mr. Davis broken up by difficulty. . . . . . . . . . . . . . . . . . . . . 96
6.3 Study 3 features available in each version of Betty’s Brain. . . . . . . . . . . . . . . . . . 110
6.4 Study 3 climate change unit test scores. . . . . . . . . . . . . . . . . . . . . . . . . . . . 111
6.5 Study 3 thermoregulation unit test scores. . . . . . . . . . . . . . . . . . . . . . . . . . . 112
6.6 Study 3 map scores. . . . . . . . . . . . . . . . . . . . . . . . . . . . . . . . . . . . . . 113
6.7 Study 3 PS group hint responsiveness means (and standard deviations). . . . . . . . . . . 114
6.8 Study 3 Unit 1 learning gains separated by whether or not students received guided practiceon each problem type. . . . . . . . . . . . . . . . . . . . . . . . . . . . . . . . . . . . . 116
6.9 Study 3 behavioral metrics for both units. . . . . . . . . . . . . . . . . . . . . . . . . . . 119
6.10 Study 3 Unit 1 behavior and performance correlations. . . . . . . . . . . . . . . . . . . . 120
6.11 Study 3 Unit 1 behavior correlations. . . . . . . . . . . . . . . . . . . . . . . . . . . . . 121
6.12 Study 3 Unit 2 behavior and performance correlations. . . . . . . . . . . . . . . . . . . . 122
6.13 Study 3 Unit 2 behavior and skill level correlations. . . . . . . . . . . . . . . . . . . . . 123
6.14 Study 3 Unit 1 behaviors by cluster. . . . . . . . . . . . . . . . . . . . . . . . . . . . . . 125
vi

6.15 Study 3 Unit 1 pretest-posttest results by cluster. . . . . . . . . . . . . . . . . . . . . . . 126
6.16 Study 3 Unit 1 map scores by cluster (max = 25). . . . . . . . . . . . . . . . . . . . . . . 128
6.17 Study 3 Unit 2 behaviors by cluster. . . . . . . . . . . . . . . . . . . . . . . . . . . . . . 129
6.18 Study 3 Unit 2 pretest-posttest results by cluster. . . . . . . . . . . . . . . . . . . . . . . 130
6.19 Study 3 Unit 2 map scores by cluster (max = 15). . . . . . . . . . . . . . . . . . . . . . . 131
6.20 Study 3 shifts in behavior profiles across the two units. . . . . . . . . . . . . . . . . . . . 132
vii

LIST OF FIGURES
Figure Page
2.1 The scaffolding process. . . . . . . . . . . . . . . . . . . . . . . . . . . . . . . . . . . . 19
2.2 The Suggest-Assert-Modify taxonomy. . . . . . . . . . . . . . . . . . . . . . . . . . . . 21
2.3 Modification scaffolds. . . . . . . . . . . . . . . . . . . . . . . . . . . . . . . . . . . . 23
2.4 Betty’s Brain system with resources and query window. . . . . . . . . . . . . . . . . . . 32
3.1 Study 1 derived HMMs for high- and low-performing student groups. . . . . . . . . . . . 41
3.2 Study 2 derived HMMs for the PA and CC groups. . . . . . . . . . . . . . . . . . . . . . 46
3.3 Study 2 state output probabilities for the PA and CC group HMMs. . . . . . . . . . . . . 47
4.1 Metacognitive process model for OELEs. . . . . . . . . . . . . . . . . . . . . . . . . . . 54
4.2 Task model for OELEs. Directed links represent dependency relations. . . . . . . . . . . 55
4.3 An example causal map with abstract concepts. . . . . . . . . . . . . . . . . . . . . . . . 60
4.4 Coherence graph of the first 10 actions a learner executed in Betty’s Brain while learn-ing about thermoregulation. Black links represent temporal links among actuated nodes;green links represent coherence relations among actions; red links represent incoherencerelations among actions; and actions in the right-hand column have not been executed bythe learner. . . . . . . . . . . . . . . . . . . . . . . . . . . . . . . . . . . . . . . . . . . 69
5.1 The CAILE architecture. . . . . . . . . . . . . . . . . . . . . . . . . . . . . . . . . . . . 73
5.2 Betty’s Brain organized as a CAILE application. . . . . . . . . . . . . . . . . . . . . . . 74
5.3 A partial behavior tree describing Betty’s behavior in Betty’s Brain. . . . . . . . . . . . . 79
5.4 The execution flow in response to a user’s expression of intent in an activity module. . . . 81
5.5 An example prompt from the agent conversation module. . . . . . . . . . . . . . . . . . 82
5.6 The causal map module view with three concepts and two annotated links. . . . . . . . . 83
5.7 The causal map quiz module view with an incorrect question selected. . . . . . . . . . . 85
5.8 The notebook module view. . . . . . . . . . . . . . . . . . . . . . . . . . . . . . . . . . 86
5.9 The resource library module view. . . . . . . . . . . . . . . . . . . . . . . . . . . . . . . 87
5.10 The Betty’s Brain master view during a conversation with Betty. . . . . . . . . . . . . . . 89
viii
6.1 State machine of the three-stage scaffolding strategy. . . . . . . . . . . . . . . . . . . . . 93
6.2 Climate change expert map used during Study 3 . . . . . . . . . . . . . . . . . . . . . . 100
6.3 Thermoregulation expert map used during Study 3 . . . . . . . . . . . . . . . . . . . . . 101
6.4 The causal reasoning practice problem module view. . . . . . . . . . . . . . . . . . . . . 104
6.5 The reading practice problem module view. . . . . . . . . . . . . . . . . . . . . . . . . . 104
6.6 The quizzing practice problem module view. . . . . . . . . . . . . . . . . . . . . . . . . 105
6.7 Study 3 learning curves of guided practice problem performance. . . . . . . . . . . . . . 115
6.8 Study 3 percent of support relations captured in windows of varying sizes. . . . . . . . . 118
6.9 Study 3 dendrogram of students’ climate change behavior profiles. . . . . . . . . . . . . 125
6.10 Study 3 dendrogram of students’ thermoregulation behavior profiles. . . . . . . . . . . . 128
A.1 Study 1 abstract causal map used for causal reasoning problems. . . . . . . . . . . . . . 154
B.1 Study 2 abstract causal maps used for causal reasoning problems. . . . . . . . . . . . . . 173
C.1 Study 3 abstract causal maps used for causal reasoning problems. . . . . . . . . . . . . . 222
C.2 Forest ecosystem expert map used during Study 3. . . . . . . . . . . . . . . . . . . . . . 291
ix

LIST OF ABBREVIATIONS
CAILE Choice-Adaptive Intelligent Learning Environment
CBLE Computer-Based Learning Environment
CGA Coherence Graph Analysis
HMM Hidden Markov Model
ICAP Interactive Constructive Active Passive
ITS Intelligent Tutoring System
OELE Open-Ended Learning Environment
SAM Suggest-Assert-Modify
SRL Self-Regulated Learning
TSS Three-Stage Scaffolding
x

CHAPTER 1
Introduction
Over the past several decades, technology has continually assumed an essential and transformative role in
the teaching and learning process. This can best be seen in recent trends in education: flipped classroom
approaches to instruction, 1-to-1 tablet programs, computer-based learning environments (CBLEs) that un-
derstand what each individual knows and does not know, and massive open online courses, or MOOCs,
which connect as many as hundreds of thousands of learners all studying the same topic within a shared vir-
tual space. With each new technology-oriented trend comes new hope for the future of education; technology
is viewed as a means of providing access to information in rich, engaging, interactive spaces where students
can experiment, learn, and grow.
In many ways, these hopes are well-founded; technology has the potential to offer students an endless
supply of personalized, one-on-one attention. Virtual tutors can observe students, interact with them, interpret
their behavior, and attempt to support their learning in ways that may offer advantages over human tutoring
(Anderson et al., 1995; Azevedo et al., 2010a; Conati et al., 2006; Leelawong and Biswas, 2008; Luckin and
Hammerton, 2002; Perry and Winne, 2006; Roll et al., 2011; Winters et al., 2008). This feeling may best be
summed up by Graesser and McNamara (2010):
“We are convinced that pedagogical [software] agents hold considerable promise in optimizing
interaction-centered tutoring and training. The dialogue strategies of the agent can be consistent,
precise, complex, adaptive, and durable. This is in sharp contrast to human tutors who rarely
possess these desirable features. It is extremely difficult to train a human tutor to systematically
apply a strategy that goes against the grain of his or her natural conversational inclinations. It
is nearly impossible to train a human to perform complex quantitative computations that pre-
cisely track student characteristics and that formulate dialogue moves that optimally adapt to
the learner. And of course human tutors get fatigued, whereas computers are tireless” (235).
In addition to endless attention and perfect execution of tutoring strategies, CBLEs can capture, analyze,
and report every interaction they have with learners. This abundance of data, if properly analyzed, filtered,
and understood, can provide new opportunities for researchers, educators, and policy makers to gain better
understandings of how people learn. Moreover, educational data can be analyzed in real-time to personalize
instruction for learners in ways that lead to measurable optimizations of the teaching and learning processes
(cf. Baker and Yacef 2009; Romero and Ventura 2010). The potential of this technology is at the heart of two
1

relatively new research communities: the International Educational Data Mining Society and the Society for
Learning Analytics Research.
While the potential of CBLEs is widely recognized, the task of realizing that potential is mired in chal-
lenges. Human tutors can quickly perceive and utilize a wealth of information about a student: mood, en-
gagement and effort, fatigue, confusion, frustration, and environmental factors, among others. It is this ability
to measure (albeit qualitatively) and respond to students in meaningful ways that unlocks the potential of a
fruitful teaching and learning partnership. The same cannot be said of most CBLEs, which usually model
students as computational agents that either perform correctly or incorrectly (e.g., Anderson et al. 1995; Van-
Lehn 1988). Thus, while CBLEs can provide students with endless attention, they lack understanding of a
variety of student attributes that are essential to supporting a student’s development.
In attempting to overcome these challenges, researchers have developed methods for modeling students’
metacognitive, affective, and motivational characteristics using data from CBLEs. Encouragingly, these
methods have achieved some level of accuracy, and there has been some work in developing methods for
utilizing this information to support students during learning (Bondareva et al., 2013; Azevedo et al., 2013;
Rodrigo et al., 2012). However, these approaches rely heavily on either: (i) building automated detectors
using data generated from human observations of student learning; or (ii) utilizing multiple streams of bio-
sensor data (e.g., galvanic skin response, eye tracking, facial recognition, and pressure sensors). Each of
these approaches suffers from drawbacks. The automated detector approach has been shown to suffer from
accuracy problems. For example, Baker et al. (2012) constructed a set of affect detectors for the Geometry
Cognitive Tutor (Koedinger and Corbett, 2006). This required 408.5 person minutes of human coding, and a
subsequent evaluation of the detectors with new data found that the detectors consistently misclassified stu-
dents’ emotional states (on average, Cohen’s κ = 0.30). The bio-sensor approach, presented in Azevedo et al.
(2013), suffers from scalability problems; it relies on the availability of expensive equipment not typically
found in classrooms.
Other limiting factors of CBLEs relate to the types of learning they are designed to support and the auto-
mated tutoring strategies that have been designed for them. Traditionally, CBLEs have focused on students’
acquisition of domain knowledge (e.g., facts, definitions, and formulas) and procedural skills (e.g., complet-
ing algebra problems or balancing chemical equations; Anderson et al. 1995; McLaren et al. 2006; Mitrovic
2003; VanLehn et al. 2005). The tutoring strategies constructed for these environments usually employ a
“progressive hints” strategy (VanLehn, 2006): when a student struggles, the system provides a general hint
designed to push the student in the right direction. Should the student continue to struggle, the system will
provide a more specific hint. This continues until either the student’s performance improves or the system
provides a “bottom-out hint” that tells the student exactly what to do in order to proceed in her problem-
2

solving.
In recent years, there have been efforts to expand the repertoire of CBLEs, both in terms of what they
teach and how they adaptively support student learning. In particular, researchers have expressed a continuing
interest in developing CBLEs that can support students in learning to employ self-regulated learning (SRL)
strategies as they work on their learning tasks (Winters et al., 2008). SRL is an active theory of learning that
describes how people, when faced with complex learning tasks, perhaps beyond their current capabilities,
are able to set goals and then create and continuously monitor plans for achieving those goals. SRL is a
multi-faceted construct: it involves emotional and behavioral control; management of one’s learning envi-
ronment and cognitive resources, perseverance in the face of difficulties, and social interactions to promote
effective learning (Zimmerman and Schunk, 2011). For decades, researchers have recognized the advantages
for learners who are self-regulated (e.g., Butler and Winne 1995), and devising techniques for teaching the
various aspects of self-regulation is an active area of research. Bransford and Schwartz (1999) stress the value
of SRL in preparing students for future learning, noting the importance of being able to moderate one’s own
learning and problem solving in the absence of the guided and structured environments encountered in most
formal academic settings. Once outside of these environments, problem solving tasks and the accompanying
learning needed to succeed in them are no longer driven by teacher-defined guidelines for what, when, and
how to learn. Rather, learners must often choose their own need-based learning goals and plan how to go
about achieving them.
It is within this context that the present dissertation research is situated. In particular, the presented work
provides a novel approach for interpreting student behavior and performance and then adaptively supporting
students working in open-ended computer-based learning environments.
1.1 Problem Overview: Adaptive Scaffolds in Open-Ended Learning Environments
Open-ended learning environments (OELEs; Clarebout and Elen 2008; Land et al. 2012; Land 2000) are a
class of CBLEs that focus on supporting learners’ development of metacognitive strategies for managing their
learning processes (e.g., Azevedo et al. 2010a; Conati et al. 2006; Leelawong and Biswas 2008; Luckin and
Hammerton 2002; Perry and Winne 2006; Roll et al. 2011; Winters et al. 2008). Metacognition (Brown, 1975;
Flavell, 1976) is a key component of SRL that describes the ability to reason about, manage, and redirect
one’s own approach to learning (Whitebread and Cardenas, 2012). Metacognition is often broken down into
two sub-components: knowledge and regulation (Young and Fry, 2008; Flavell et al., 1985; Schraw et al.,
2006; Whitebread et al., 2009). Metacognitive knowledge refers to an individual’s understanding of their own
cognition and strategies for managing that cognition. Metacognitive regulation refers to how metacognitive
knowledge is used in order to create plans, monitor and manage the effectiveness of those plans, and then
3

reflect on the outcome of plan execution in order to refine metacognitive knowledge.
OELEs create opportunities for students to practice and develop their capacity for metacognitive regula-
tion in the context of authentic and complex problem-solving tasks. These environments are learner-centered;
they provide students with a learning context and a set of tools for exploring, hypothesizing, and building solu-
tions to problems. Examples include hypermedia learning environments (e.g., Azevedo et al. 2012), modeling
and simulation learning environments (e.g., Barab et al. 2000; Leelawong and Biswas 2008; Sengupta et al.
2013; van Joolingen et al. 2005), and immersive narrative-centered learning environments (e.g., Clark et al.
2011; Clarke and Dede 2005; Spires et al. 2011). While OELEs may vary in the particular sets of tools they
provide, they often include tools for: (i) seeking and acquiring information, (ii) applying that information to
a problem-solving context, and (iii) assessing the quality of the constructed solution. For example, students
may be given the following task:
Use the provided simulation software to investigate which properties relate to the distance that a
ball will travel when allowed to roll down a ramp, and then use what you learn to design a ramp
suitable for wheelchairs. To test a solution, enter the details of your ramp into the system and
press “test.”
To accomplish this example task, students must manage their learning processes in order to (i) use the
system’s resources (such as definitions, explanations, and the simulation) to learn about factors important
to the design of ramps, (ii) apply their knowledge to a problem-solving context by designing a wheelchair
ramp, and (iii) monitor and assess their developing understanding by testing their constructed ramp. As part
of managing their learning processes, students need to plan their interactions with the system, evaluate their
progress toward completing the goal, and, when necessary, modify their approach to learning and problem-
solving.
By the very nature of the choices they afford for learning and problem solving, OELEs provide opportu-
nities for students to exercise higher-order reasoning skills that include: (i) cognitive processes for accessing
and interpreting information, constructing problem solutions, and assessing constructed solutions; and (ii)
metacognitive processes for coordinating their use of cognitive processes and reflecting on the outcome of
solution assessments. However, research has shown that students often do not utilize well-developed regu-
latory processes necessary for achieving success (Azevedo, 2005; Azevedo et al., 2010a; Hacker and Don-
loskey, 2009; Zimmerman and Schunk, 2011). These students typically make ineffective, suboptimal learning
choices when they independently work toward completing open-ended tasks (Mayer, 2004; Land, 2000; Roll
et al., 2011). Without adaptive scaffolds, they often use tools incorrectly and adopt suboptimal learning
strategies (Azevedo and Hadwin, 2005; Segedy et al., 2011b). Adaptive scaffolds refer to actions taken by
4

a scaffolding agent (e.g., a tutor or a computer-based software agent embedded within a CBLE), based on
the learner’s interactions, intended to support the learner in completing a task (Puntambekar and Hubscher,
2005). Such scaffolds often seek to highlight differences between desired and current learner performance
and provide direction to students who are unsure of how to proceed.
Providing adaptive scaffolds to support learners is a complex multi-dimensional problem (Azevedo and
Jacobson, 2008); it requires developing systematic analysis techniques for diagnosing learners’ specific needs
as they relate to one or more cognitive and metacognitive processes and then responding to those needs ac-
cording to a pedagogical model of learning and teaching. This involves identifying and assessing learners’
skill proficiencies, interpreting their action sequences in terms of metacognitive regulation strategies, and
evaluating their success in accomplishing their current tasks. The open-ended nature of OELEs further ex-
acerbates the problem; since these environments are learner-centered, they typically do not restrict the ap-
proaches that learners take to solving their problems. Thus, interpreting and assessing students’ learning
behavior is inherently complex; students may simultaneously pursue, modify, and abandon any of a large
number of possible approaches to solving their problem.
While research in the field of educational technology has produced several OELEs to help middle school
students learn strategies for metacognitive regulation (e.g., Azevedo et al. 2010b; Leelawong and Biswas
2008), few of them provide adaptive scaffolds that target students’ understanding of domain knowledge,
cognitive processes, and metacognitive strategies in a unified framework. Instead, these systems include
non-adaptive interface features (e.g., lists of sub-goals or guiding questions) designed to provide support for
learners who choose to use them, and they expect learners to come to the learning environment with either:
(i) sufficient background knowledge and skill proficiency; or (ii) the self-regulative capabilities necessary
for independently seeking out missing knowledge and practicing underdeveloped skills. Such an approach
alienates a large number of learners; while several students with higher levels of prior knowledge and self-
regulative capabilities show large learning gains as a result of their experience learning with OELEs, many
of their less capable counterparts instead experience significant confusion and frustration, greatly limiting the
population of learners for which OELEs lead to meaningful learning (Azevedo and Witherspoon, 2009; Land,
2000; Sabourin et al., 2012; Segedy et al., 2012a). In other words, despite the promise of advanced computer
technology to provide students with adaptive, differentiated instruction (e.g., Benjamin 2005), most OELEs
still provide what amounts to a “one size fits all” instructional model, and students unable to adapt to the
requirements of the learning activity (e.g., because of insufficient prior knowledge) often fail to adequately
learn the targeted information.
This dissertation research addresses some of the aforementioned limitations of CBLEs by developing and
evaluating a novel approach to providing adaptive scaffolds to learners in OELEs. Accomplishing this task
5

has involved the following:
1. developing theoretically-grounded task and process models of managing one’s own learning and prob-
lem solving in an OELE;
2. developing and evaluating an analysis framework for interpreting students’ behaviors in OELEs in
ways that lead to meaningful, actionable insights about their problem-solving approaches, including
their understanding of: (i) relevant background knowledge; (ii) skills related to information seeking,
solution construction, and solution evaluation; and (iii) metacognitive knowledge that is important for
managing complex problem-solving processes;
3. developing and evaluating a tutoring strategy that takes advantage of these interpretations and provides
students with adaptive support based on their needs.
1.2 Research Approach and Contributions
The research presented in this dissertation has focused on expanding the repertoire of scaffolding agents in
OELEs. This has involved studying middle school students using an OELE called Betty’s Brain (Leelawong
and Biswas, 2008) as part of their science classroom activities. The research is organized into two primary
phases of work, each of which has produced a number of research contributions to the field of educational
technology.
The first phase of research involved conducting two studies of students using Betty’s Brain and experi-
menting with methods for analyzing the resulting student use data. These studies were designed and executed
collaboratively with several members of the Teachable Agents group at Vanderbilt University. The first study
was observational, and the goals of the research were to understand how students behaved when confronted
with the Betty’s Brain learning task. The data analysis techniques applied to the data from these studies uti-
lized summaries of overall student behavior, hidden Markov model analysis (Rabiner, 1989), and sequential
pattern mining (Agrawal and Srikant, 1995) to identify common behavior patterns across students as well as
behavior patterns that distinguish different groups of students. Experimental results, presented in Section 3.1,
identify characteristics of more and less successful students in Betty’s Brain.
The second study tested the effect of providing automated adaptive support to students in the form of
contextualized conversational feedback on student learning behaviors. Students were divided into two treat-
ment groups: experimental and control, and students in the control group received a baseline version of the
automated support. The results of this study, presented in Section 3.2, show that students in the experimental
group were more successful in completing the Betty’s Brain learning task than students in the control group.
6

Behavioral analysis comparing experimental and control group students showed that students in the experi-
mental group more often coordinated their use of information seeking tools, solution construction tools, and
solution assessment tools when compared to students in the control group.
The second phase of research used lessons learned from the first phase to devise process and task models
of problem solving processes involved in the successful completion of open-ended learning tasks (presented
in Section 4.1). The process model represents a general model of the processes involved in metacognitive
regulation, and the task model represents the tasks that students may need to carry out in order to achieve
success in Betty’s Brain. More specifically, the task model provides a hierarchical representation of: (i)
general tasks that are common across all OELEs; (ii) Betty’s Brain specific instantiations of these tasks; and
(iii) interface features through which students can complete their Betty’s Brain tasks.
These models then serve as a basis for the primary contributions of this research: the development and
testing of novel approaches to designing computer-based scaffolding agents in OELEs.
1.2.1 Contributions to the Development of Scaffolding Agents
A computer-based scaffolding agent’s ability to support students in their learning and problem solving is
dependent on both its methods for analyzing and interpreting a student’s behaviors and the library of scaffolds
(i.e., supportive actions) that it can perform. A significant portion of this dissertation research involved
developing novel approaches for: (i) interpreting student behavior; and (ii) providing adaptive scaffolds to
struggling students.
The behavior interpretation method, called the Coherence Graph Analysis (CGA) approach to analyzing
data from OELEs, is described in Chapter 4. CGA characterizes students by the correctness of their actions,
their skillfulness in completing tasks from the task model, and the “coherence” of their problem-solving
approaches. This approach is more comprehensive than the approaches utilized in previously-developed
OELEs (presented in Chapter 2); these OELEs typically represent students in terms of the correctness of
their actions and their simple usage statistics (e.g., the number of times they accessed each system resource).
Thus, CGA provides data about students’ approaches to open-ended problem solving that is not available in
previously-developed OELEs. In particular, this approach provides new insight into students’ open-ended
problem solving behaviors by illustrating relationships between actions that provide information and actions
that utilize that information. Additionally, once CGA has been designed for a particular learning environment,
its execution is automated and relies only on interpreting information available via standard input streams (i.e.,
a keyboard and a mouse) and the structure of the interface. Thus, once CGA has been incorporated into a
learning environment, it does not suffer from the accuracy and scalability issues identified previously.
The adaptive scaffolding strategy, called the Three-Stage Scaffolding (TSS) strategy, is presented in Sec-
7

tion 6.1, The TSS strategy includes a more diverse set of scaffolds than the scaffolding strategies utilized
in previously-developed OELEs. The scaffolding strategies in these systems mainly focus on reviewing in-
formation the student has just encountered, telling students that an aspect of their solution is incorrect, and
making general suggestions about how to proceed. Should students continue to struggle despite receiving
scaffolds, these systems typically adopt one of two approaches: (i) they tell students exactly what they need
to do to advance toward their goal, or (ii) they continue to provide general suggestions while letting students
continue to struggle. The TSS strategy provides an alternative to this approach; it involves interacting with
students in order to construct a more accurate understanding of their skill levels, and it then works to address
underdeveloped skills through guided practice scaffolds. In effect, this strategy attempts to teach students how
to achieve success for themselves, and it represents a novel approach to automated scaffolding in OELEs.
In order to implement and test CGA and the TSS strategy within the Betty’s Brain learning environment,
the Betty’s Brain software was redesigned and reimplemented. The resulting CAILE architecture is general
and flexible, and it provides several new features not available in previous versions of Betty’s Brain.
1.2.2 Contributions to the Understanding of Students’ Problem Solving Behaviors
The primary contribution of this dissertation research is the analysis and characterization of students’ open-
ended problem solving behaviors via CGA. An evaluation of this approach and the TSS strategy (presented in
Chapter 6) with 98 6th-grade students learning two instructional units showed that students’ problem solving
behaviors, as characterized by CGA, were strongly predictive of their ability to complete the Betty’s Brain
learning task and weakly-to-moderately predictive of their learning. This demonstrates the potential value of
CGA in identifying students who are not benefiting from their use of the system.
To further illustrate the value of CGA, clustering analysis was employed to identify common student
behavior profiles. This analysis identified a set of distinct behavior profiles among the students. Importantly,
the identified behavior profiles persisted from the first to the second instructional unit. Moreover, the profiles
persisted despite significant changes in students’ behaviors from the first unit to the second unit. In regards
to these behavior changes, the study identified a productive strategy shift; when students used Betty’s Brain
to study a second unit, their learning behaviors improved, and these improvements were associated with
higher skill levels and better learning when compared with the first topic. These analyses provide insight
into students’ open-ended problem solving behaviors not available before the development of CGA, and such
insight can be used to impact several aspects of teachers’ instructional decisions.
8

1.3 Dissertation Organization
The remainder of this dissertation is organized as follows: Chapter 2 reviews related literature and establishes
the framework for the dissertation research on adaptive scaffolding in OELEs. Chapter 3 presents the class-
room studies of students using Betty’s Brain executed during the first phase of research. Chapter 4 details the
task and process models of problem solving processes involved in the successful completion of open-ended
learning tasks as well as the CGA approach to behavioral analysis in OELEs. Chapter 5 discusses the changes
made to the Betty’s Brain system architecture. Chapter 6 presents the TSS strategy tested during the second
phase of research as well as the the classroom evaluation of this strategy and the CGA approach. Chapter 7
provides a summary of the presented work on adaptive scaffolding in OELEs and future research directions.
9

CHAPTER 2
Theoretical Background and Related Work
Open-ended learning environments emerged as a paradigm in educational technology in the 1990s with a goal
of creating learning environments based on the constructivist theory of learning (Land et al., 2012; Jonassen,
1991). Constructivist theory posits that learning is the process of actively constructing one’s own meaning
and understanding of the world based on current and past experiences. In this conception, each individual’s
understanding of the world is unique, and learning activities such as reading, problem solving, and taking part
in discussions affect each learner differently (Fosnot, 2005). A natural consequence of this philosophical view
is that students learn best when they have opportunities to construct and negotiate their own understanding as
part of completing their learning activities (Land et al., 2012).
One recent instantiation of this theory is the ICAP framework presented by Chi (2009). This framework
classifies learning activities as being either interactive, constructive, active, or passive. Passive learning activ-
ities are those in which the student is not overtly doing anything, and they include activities such as attending
a lecture or watching a video. Active learning activities are the opposite; they include any activity in which
the learner is overtly doing something; this includes writing summaries, pointing to something on a display,
or rotating an object, among others. Constructive learning activities are a subset of active learning activities
in which the student produces new information not provided as part of the learning activity. Chi (2009) high-
lighted this difference by comparing the process of underlining important information in the text to explaining
the ideas in a text in their own words. While both activities may be considered active, only the second can be
constructive. If the learner explains the text using examples or ideas not presented in the text, then they are
said to be constructing new information. Interactive learning activities are those in which multiple individ-
uals co-construct knowledge through conversation. For conversation to be considered interactive, multiple
individuals must engage in constructive activities that build on each other’s contributions. By reviewing rel-
evant literature, Chi (2009) provided evidence for the ICAP Hypothesis, which makes predictions about the
effectiveness of learning activities in producing measurable differences in learning:
“Overall, active is better than passive, constructive is better than active, and interactive is better
than constructive” (88).
OELEs implement the constructivist theory of learning by providing opportunities for learning-by-doing
(Land, 2000). Learners are presented with a learning context and a set of tools for pursuing their learning and
problem-solving tasks; however, it is up to the learners to decide how to use the available tools to accomplish
10

their tasks. This flexibility allows students to approach the task in a way that is determined by the task
requirements, the information they are encountering, and their understanding of that information as it evolves
during the course of learning.
However, there is a risk associated with constructivist prescriptions of learning as embodied by OELEs.
Jonassen (1991) notes that constructivist learning activities shift control of learning from the instructor to the
student. OELEs, and constructivist learning activities more generally, require students to assume control of
their learning processes by employing multiple cognitive and metacognitive processes as they construct and
negotiate meaning in pursuit of completing their learning activities (Fosnot, 2005). In terms of the ICAP
framework, open-ended learning tasks are active, but the extent to which they are constructive or interactive
depends on students’ engagement with them. This dependence on learner control may constitute a signifi-
cant challenge for students, many of whom experience difficulties when attempting to employ metacognitive
processes during learning (Azevedo, 2005; Azevedo et al., 2010a; Hacker and Donloskey, 2009; Zimmerman
and Schunk, 2011). To support these learners, OELEs must adapt to their needs.
2.1 The Structure of Knowledge
A critical design decision in educational technology relates to the structure and representation of knowledge.
To adapt to students, CBLEs must make judgments about what they know and do not know, and this requires
a computational representation of student knowledge.
The standard approach to representing student knowledge in CBLEs is as a set of inter-related knowledge
components such as facts, concepts, and principles (VanLehn, 2006). Koedinger et al. (2012) present an
extensive taxonomy of knowledge components, which they define as “acquired unit[s] of cognitive function
or structure that can be inferred from performance on a set of related tasks” (764). This taxonomy is a
part of a broader framework of knowledge, learning, and instruction that describes the teaching and learning
process as consisting of instructional events, assessment events, learning events, and knowledge components.
Learning events are internal to the student, and they result in changes to the student’s knowledge components.
Instructional events attempt to trigger specific learning events, and assessment events are those that require
the student to respond in some way (e.g., by answering a question or completing a task) in order to make
inferences about a subset of the student’s knowledge components.
According to this taxonomy, knowledge components are general, versatile constructs that can represent
any piece of knowledge. Importantly, a knowledge component may or may not be “correct,” where correct
knowledge components are consistent with a set of external standards (e.g., standards produced in relation
to a curricular goal). Besides correctness, Koedinger et al.’s taxonomy characterizes each knowledge com-
ponent by its application conditions, response conditions, whether or not it includes a verbal explanation,
11

and whether or not it includes a rationale. Application conditions can either be constant or variable, where
constant application conditions are those in which the knowledge component applies in only one situation
(e.g., knowing how to pluralize the word “dog”), and variable application conditions are those in which the
knowledge component applies to multiple situations (e.g. knowing how to pluralize any word). When a
knowledge component has variable application conditions, its response condition may be constant or vari-
able, where constant response conditions are those in which the knowledge component always produces the
same response (e.g., an association between multiple animals that are herbivores and the label “herbivore”),
and variable response conditions are those in which applying the knowledge component may lead to multiple
responses (e.g., the ability to categorize any animal as “carnivore,” “herbivore,” or “omnivore”).
A knowledge component is “verbal” if students can explain it. This characteristic of a knowledge com-
ponent is meant to distinguish whether or not students can, according to Koedinger et al. (2012): “‘do’ but
not explain (indicating non-verbal knowledge), explain but not do (indicating ‘inert’ verbal knowledge), or
do and explain (indicating both non-verbal and verbal knowledge)” (769). For example, people that read
English are able to recognize individual letters; however, they may not know how to explain the process of
recognizing those letters. If they cannot, then their knowledge component is non-verbal. Different types of
knowledge are desirable under certain conditions that depend on the goal of instruction. In some cases, verbal
knowledge is a critical goal of instruction; in others, it does not go far enough. For example, students are
often expected to be able to both verbalize and justify a piece of knowledge by providing a rationale (e.g., “In
the northern hemisphere, the days are shorter during the winter months because during that time, the north-
ern hemisphere is tilted away from the sun”). When a piece of knowledge can be rationalized, knowledge
components with rationales indicate a deeper understanding than knowledge components without rationales.
knowledge components form a foundation for the representation of student knowledge. All information
necessary for the successful completion of a task can be represented as an interconnected network of knowl-
edge components. For example, a student’s ability to learn one knowledge component may be dependent on
whether or not that student possesses certain prerequisite knowledge components. Similarly, one knowledge
component may represent a relationship between two or more knowledge components. Using this represen-
tation, CBLEs may be equipped with:
• A set of knowledge components that model the target knowledge of the domain;
• A set of instructional procedures that the CBLE can utilize to invoke changes in specific student knowl-
edge components;
• A set of assessment procedures that the CBLE can utilize to determine the extent to which a learner
understands a knowledge component;
12
CBLEs may also include a set of incorrect or partially-correct knowledge components that represent
common student misconceptions (called bugs; Brown and Burton 1978). The system can observe student
performance during assessment events and adjust a set of confidence values, one per knowledge component,
that indicate the system’s confidence in the fact that the student currently knows that knowledge component
(Wenger, 1987).
From the provided examples, it is clear that many knowledge components can be modeled as production
rules (Anderson, 1996), which are IF-THEN statements that codify procedural and conditional information,
as in the following example: “[IF] you need to pluralize a word [AND] that word ends in ‘y,’ [THEN] change
the ‘y’ to ‘i’ and add ‘es.”’ These condition-action rules form the basis of metacognitive regulation, as they
represent information about both: (i) students’ knowledge of problem-solving procedures (the THEN clause);
and (ii) students’ knowledge about when procedures apply (the IF clause). Metacognition, its components,
and methods for representing it are discussed in more detail next.
2.2 Metacognition
Flavell (1979) defined metacognition as “thinking about one’s own thinking.” When applied to learning
situations, metacognition encompasses (Cross and Paris, 1988; Hennessey, 1999; Martinez, 2006):
• The knowledge and control learners exhibit over their thinking and learning activities;
• Awareness of one’s own thinking and conceptions;
• Active monitoring of one’s cognitive processes;
• An attempt to regulate one’s cognitive processes to support learning; and
• The application of a set of strategies for developing one’s own approach to solving problems.
More generally, metacognition is made up of two constituent parts (Flavell et al., 1985; Schraw et al.,
2006; Whitebread et al., 2009): metacognitive knowledge and metacognitive regulation. Metacognitive
knowledge is composed of declarative, procedural, and conditional information about one’s own cognitive
system (Flavell et al., 1985; Veenman, 2012; Schraw et al., 2006), all of which can be represented as knowl-
edge components. Declarative knowledge represents “knowing that” information (Anderson, 1996). Such
information is often conceptualized as being represented as and with schemata: mental structures that rep-
resent a concept and the features that characterize it (Winne, 2001). For example, a schema representing a
human memory system might contain features such as how long it takes to memorize new facts and how
many chunks of information can be safely retained in short term memory. Features correspond to variables
in an algebra expression or computer program; they can take on any of a number of values when instantiated;
13

and an “instance” of the human memory system schema may represent an existing human’s memory system.
Thus, declarative metacognitive knowledge contains information that may be represented by a schema; this
includes facts, definitions, concepts, and understandings of relationships that pertain to one’s own cognitive
system.
Procedural knowledge represents “how-to” information: sets of actions that, when executed in a partially-
ordered sequence, can accomplish a task. When applied to metacognition, procedural knowledge represents
a person’s understanding of methods for accomplishing tasks and their own ability to execute those meth-
ods. Conditional knowledge represents a person’s understanding about when procedures should be executed.
Winne (2001) conceptualizes this knowledge as complex production rules that dictate which tasks are most
appropriate given one’s current situation and goal as well as which strategies are most appropriate for accom-
plishing the selected tasks. In summary, metacognitive knowledge deals with issues of awareness of one’s
own cognitive abilities and the interplay between that knowledge, the nature of the tasks at hand, and the
strategies one can employ to successfully perform those tasks (Flavell et al., 1985; Veenman, 2012).
Metacognitive regulation is composed of activities related to goal selection, planning, monitoring, control,
and reflection (Schraw et al., 2006; Winne, 2001; Zohar and Dori, 2012; Schraw and Moshman, 1995). Goal
selection describes the process of analyzing the current state of the learning task in order to select appropriate
goals and sub-goals. Planning involves selecting a set of activities for reaching a selected goal or sub-goal.
In planning, learners leverage their understanding of both the tools they have available and metacognitive
strategies they may have for achieving the selected goal. A metacognitive strategy is a generalized plan
template that a learner may apply in situations with recognizable features (as specified in the [IF] clause
of conditional knowledge). For example, researchers have identified several metacognitive strategies for
explicitly encoding information encountered while reading complex science texts (Veenman, 2011); these
strategies include paraphrasing the material, interpreting and elaborating on the content, and predicting the
topic of the next paragraph (McNamara, 2004). When utilized during the planning process, these strategies
are transformed into task-driven plans that apply to the current learning situation (e.g., paraphrasing the
passage that was just read).
Monitoring describes the process of observing and evaluating one’s own plan execution at two levels: the
effectiveness of each particular action and the plan’s overall effectiveness. The result of these monitoring
processes may lead students to exercise control by abandoning or modifying their plan as they execute it. For
example, students may decide to re-read a paragraph if they feel they did not understand it. Once a plan has
been completed or abandoned, students may engage in reflection, during which they analyze the effectiveness
of their plan in order to improve their own metacognitive knowledge. They may modify their understanding
of the task and how to accomplish it based on what aspects of their plan were more or less successful. For
14

example, after repeated unsuccessful attempts at understanding a paragraph, a learner may decide to abandon
their reading plan and reflect on why they were unable to understand the text. This may lead the learner
to update their understanding of how difficult the reading material is relative to their current abilities, and
during subsequent goal selection they may decide to first learn the definitions of unknown words in the
reading material. Selecting this goal may involve the application of the following metacognitive strategy:
If you find that you are unable to complete a task because you do not understand important back-
ground knowledge, then look for a way to obtain that knowledge before continuing to complete
the task.
Metacognitive regulation is often considered a subset of SRL that deals directly with cognition without
explicitly considering its interactions with emotional or motivational constructs (Whitebread and Cardenas,
2012). Despite this, models of self-regulation are valuable in demonstrating the processes of regulating
one’s own cognitive learning activities, and many of the principles embedded within models of SRL are
closely related to metacognitive regulation. For example, most models of SRL describe multiple and recursive
stages incorporating cognitive and metacognitive processes (Butler and Winne, 1995; Greene and Azevedo,
2007; Pintrich, 2004; Schraw et al., 2006; Winne and Hadwin, 1998; Zimmerman and Schunk, 2001). In
an orientation and planning stage, self-regulated learners may begin by analyzing the learning task, setting
goals, and creating plans for achieving those goals. In this phase, learners determine what needs to be learned
or accomplished and decide how best to achieve those aims. Subsequently, in an enactment or learning phase,
learners employ their chosen strategies to learn, solve problems, and complete the tasks at hand. During this
phase, self-regulated learners continually monitor and control their learning. Finally, in a reflection or self-
assessment phase, learners may metacognitively evaluate and reflect on the success of their approach, and
then use these evaluations to alter their metacognitive knowledge and their understanding of the learning task.
Importantly, these phases are interactive and recursive. For example, learners’ chosen goals can constrain
their strategy selection and evaluation criteria, and learners’ self-assessments may cause them to refine or
abandon their current goals or strategies.
These conceptions of metacognition and self-regulation imply strong interrelationships between learners’
metacognitive abilities and their understanding of, familiarity with, and effectiveness in executing related
cognitive processes. For example, Veenman (2011, 2012), building upon earlier work by Nelson (1996),
characterizes cognition as dealing with knowledge of objects and operations on objects (the object level)
while characterizing metacognition as the corresponding meta-level that contains information about cognitive
processes, including their effectiveness in accomplishing tasks. He conceptualizes the result of metacognitive
processing as a set of self-instructions that actively and explicitly direct one’s cognitive processing, and he
15

conceptualizes one’s proficiency in efficiently generating appropriate self-instructions (both during planning
and monitoring) as metacognitive skillfulness. Veenman (2012) describes the interplay of cognition and
metacognition as follows:
“Cognitive activities are needed for the execution of task-related processes on the object level,
whereas metacognitive activity represents the executive function on the meta-level for regulating
cognitive activity. Thus, [metacognition is] much like a General who cannot win a war without
cognitive soldiers. On the other hand, an unorganized army will neither succeed” (27).
An important implication of this interplay relates to the dependence of metacognition on cognition (Land,
2000). In other words, metacognitive knowledge may not be sufficient to achieve success in OELEs, espe-
cially for novice learners who lack the cognitive skills and background knowledge necessary for interpreting,
understanding, and organizing critical aspects of the problem under study (Bransford et al., 2000). For ex-
ample, students may understand that they should look up background knowledge but not know where to start
looking or how to search for relevant information. Inexperienced learners may also lack knowledge of ef-
fective metacognitive strategies, instead utilizing less optimal strategies in performing their tasks (Azevedo,
2005; Biswas et al., 2010; Kinnebrew et al., 2013; Schraw et al., 2002; Veenman and Spaans, 2005; Winne,
1996). Thus, supporting learners in OELEs requires supporting their learning about and practicing of both
cognitive processes and metacognitive strategies together. To do this, OELEs require methods for observing
student learning activities, interpreting those activities to infer students’ understanding of and proficiency
with cognitive and metacognitive processes, and providing appropriate adaptive scaffolds to support students
as they pursue their learning tasks within the adaptive OELE. The structure of adaptive OELEs designed to
accomplish these tasks is presented next.
2.3 The Scaffolding Metaphor and Adaptive OELEs
As mentioned previously, OELEs broadly consist of a learning context and a set of tools for pursuing learning
and problem-solving activities. The learning context defines the motivation and purpose for learning, and the
tools allow learners to search for and acquire information, construct problem solutions, and test those solu-
tions. Because of their relation to constructivist learning theory, OELEs typically do not enforce constraints
on how students move between and among the various system tools to accomplish their tasks. Adaptive OE-
LEs additionally include methods for observing student learning activities, analyzing those activities to infer
student needs, and scaffolding students as they pursue their learning tasks within the OELE.
The term scaffolding, as it relates to education, was introduced by Wood et al. (1976) as a metaphor
describing how teachers and tutors assist learners in completing learning tasks that, without assistance, the
16

learners would be unable to complete:
“...scaffolding consists essentially of the adult “controlling” those elements of the task that are
initially beyond the learner’s capacity, thus permitting him to concentrate upon and complete
only those elements that are within his range of competence” (90).
Additionally, the authors list six “scaffolding functions” that tutors may employ: recruitment, reduction in
degrees of freedom, direction maintenance, marking critical features, frustration control, and demonstration.
This definition of the scaffolding process focuses on a relationship between two people and their interactions;
it highlights the difficult but important task of continually diagnosing and adapting to the needs of the learner,
whether that involves providing additional support, in the case that the learner is struggling, or removing
support, in the case that the learner is excelling (Puntambekar and Hubscher, 2005; Wood and Wood, 1999).
Since this metaphor was introduced, researchers have expanded and generalized it to the point where the
precise meaning of “scaffolding” is not entirely clear; the term has been applied to several different aspects of
CBLEs. Some researchers define scaffolds as interface features (e.g., explanation construction tools; Reiser
2004). Others define scaffolds as activity sequencing within the CBLE (e.g., requiring students to answer
questions before starting an invention task; Roll et al. 2012). Still others define scaffolds as supportive
actions taken by a CBLE for the purpose of supporting the learner in completing their task (e.g., providing
hints; Azevedo and Jacobson 2008; Segedy et al. 2013a).
2.3.1 Scaffolds as Interface Features - Limitations
A number of researchers use the term “scaffold” to refer to supportive interface features in a CBLE. These
features have been been referred to as fixed scaffolds (Azevedo et al., 2004), blanket scaffolds (Puntambekar
and Hubscher, 2005), and hard scaffolds (Saye and Brush, 2002). They generally refer to non-adaptive CBLE
features included specifically to help learners complete the task. For example, Azevedo et al. (2004) provided
students learning from a hypermedia environment with a set of sub-goals for them to achieve. These sub-goals
were intended to help guide students’ learning by listing the concepts that they should be able to explain. As
another example, Reiser (2004) discussed a software tool called ExplanationConstructor, which is included in
the Biology Guided Inquiry Learning Environment. The tool provides an interface for constructing scientific
explanations and recording research questions, hypotheses, and evidence.
This conception of scaffolding suffers from two key limitations: first, it is not compatible with the original
notion of scaffolding. The software tools described in these papers are static; they neither diagnose student
needs nor do they adaptively control any aspect of the learning task. Rather, they are affordances that students
may choose to utilize in regulating their own learning. Second, there exists a difficulty in clearly delineating
17

which interface features are scaffolds and which are not. Sherin et al. (2004) present an excellent discussion
of the difficulties of applying the scaffolding metaphor to interface features. They consider a situation in
which a child is sitting at a table using paper, a pencil, and a calculator to solve a mathematics word problem
that includes a diagram. The authors then attempt to answer the question “which features of this situation
are scaffolds?” While they note that some researchers might be inclined to designate the calculator as a
scaffold, they also point out that the same reasoning could be applied to the pencil and paper: they reduce the
complexity of the task, allowing the student to focus on other, more pertinent aspects of learning and problem
solving. Thus, they conclude, anyone who would classify a calculator as a scaffold must also classify the
pencil and paper as scaffolds. Further, they suggest other aspects of the learning environment, even those not
directly related to the learning activity, could be classified as scaffolds. Without the table, the child would
have trouble writing out the solution, and without the diagram, she may have to visualize the problem scenario
in her head.
2.3.2 Scaffolds as Activity Sequencing - Limitations
Researchers also use the scaffolding metaphor to refer to activity sequencing included as part of the learning
environment. In these situations, learners are required to complete a set of tasks in an order decided upon
ahead of time and “hard-coded” into the CBLE’s instructional sequence. In this notion of scaffolding, some
of the tasks in the sequence serve as “scaffolds,” as they prepare students to perform more effectively in future
activities. For example, Roll and colleagues (2012) tested the effect of an activity sequence in helping students
learn more effectively from invention activities (Kapur, 2008; Schwartz et al., 2009). Before students began
attempting to invent a mathematical formula for uncertainty in slopes, they were instructed to qualitatively
analyze the set of provided contrasting cases, explain the reasoning behind their analysis, and discuss their
analysis with other students. The authors found results that supported the value of requiring students to
engage in these activities.
Applying the scaffolding metaphor to activity sequencing presents some of the same challenges that arose
when applying the metaphor to interface elements. In one sense, it could be argued that activity sequencing
accomplishes some of the scaffolding functions listed in Wood et al. (1976). An appropriate sequence of
activities should decrease the need for reducing the degrees of freedom, as the sequence could start with
simple activities and gradually grow more complex. They could also serve to mark critical features, control
frustration, and demonstrate important skills. However, the metaphor breaks down when one considers the
importance of diagnosing student needs and controlling aspects of the learning task. The sequence of activi-
ties in these learning environments is fixed; all students complete the activities in the same order. Moreover,
the sequence cannot be changed in real time in order to adapt to the needs of learners.
18

Figure 2.1: The scaffolding process.
2.3.3 Scaffolds as Supportive Actions
In the third conceptualization of the scaffolding metaphor, scaffolds as supportive actions, an intentional
being (human or computer) takes on the role of a scaffolding agent. Scaffolding agents continually monitor
the learner’s progress in completing a task, and they make decisions about what actions to take to support
the learner (Azevedo and Jacobson, 2008; Segedy et al., 2013a). These actions may include, for example,
offering relevant information to learners as they work, changing the set of available tools, or demonstrating
and explaining how to perform a task. In accordance with Hadwin et al. (2005), Pea (2004), Puntambekar and
Hubscher (2005), and several others, scaffolding, then, describes a continually unfolding process, illustrated
in Figure 2.1 in which the scaffolding agent assesses learner needs, creating and continuously updating a
model of the learner. Based on its own observations and reasoning, the agent chooses a set of scaffolds (i.e.,
supportive actions) to implement. As learners gain an understanding of the domain knowledge, cognitive
processes, and metacognitive strategies targeted by the learning activity, the scaffolding agent recognizes
this increasing proficiency and gradually withdraws the use of adaptive scaffolds. This effectively creates a
situation in which scaffolding agents play a supportive role: they provide scaffolds according to student need,
but continually monitor student progress and decrease their use of scaffolds as the learner becomes more
successful in accomplishing her tasks. This technique is known as fading (Sherin et al., 2004), and it allows
learners to gradually take control of their learning as they become comfortable with the information and
processes necessary for success in the learning environment. Ideally, learners will gain a deep understanding
of the information and processes such that they are able to apply them in the completion of future learning
tasks.
The notion of scaffolding described above focuses on the importance of ongoing assessment and scaffold
implementation conducted by the scaffolding agent. In CBLEs, assessment normally occurs passively as
19

the scaffolding agent interprets the actions students take during learning. However, certain situations may
prompt the agent to engage in dynamic assessment (Kalyuga and Sweller, 2005), in which it seeks to improve
specific aspects of its understanding of the learner by asking targeted questions or prompting the learner to
solve specific problems. Thus, in addition to selecting scaffolds to implement, the scaffolding agent may also
choose to passively observe or actively assess the learner.
Applying the scaffolding metaphor to supportive actions does not suffer from the same limitations as the
previous two notions of scaffolding. In considering the original definition of scaffolding, Wood et al. (1976)’s
description of the tutor’s scaffolding functions are all compatible with supportive actions. A scaffolding agent
is able to control aspects of the task beyond the learner’s capabilities, manage frustration, reduce the degrees
of freedom, and so on. As such, permanent features of a learning environment will hereafter be referred to
as interface features, while scaffolds will refer to supportive actions taken by a scaffolding agent that provide
learners with temporary assistance according to their current needs.
2.3.4 The Space of Scaffolds: Suggest-Assert-Modify
The space of supportive action scaffolds includes several possibilities both at the individual action level and
at the level of complex scaffolding strategies. Such strategies may involve coordination of several supportive
actions interleaved with decisions based on the scaffolding agent’s ongoing diagnosis. For example, Chi
et al. (2001) presented 15 different scaffolding strategies observed during tutor-student interactions. These
strategies included one-way communication, such as offering hints, fill-in-the-blank prompts, explanations,
and correct answers to the student. They also included interactive communication, such as asking the learner
to explain their reasoning and correcting mistakes in the explanation. Understanding the differences between
these techniques, including when and why a certain type of scaffold may be more effective than another,
remains an important area of research.
Pea (2004) framed this problem as defining the what, why, and how of scaffolds. What information
should the scaffolding agent (or simply “agent”) focus on, why should the agent employ a scaffold, and how
does the agent actually scaffold the learner (i.e., what action does it take)? This framework was later revised
by Azevedo and Jacobson (2008). The revised framework replaces the why question with a when question:
when should the agent scaffold learners? It also introduces a new question: who or what should provide the
scaffolds? This last question relates to the effect of different types of scaffolding agents. Should the agent be
a human, either outside the CBLE or within it? Should it be an embodied character within the CBLE, or is
it sufficient to use unembodied system-generated scaffolds? In sum, understanding how to scaffold learners
requires researchers to define the what, when, how, and by whom or what of supportive action scaffolds.
This section describes a taxonomy (shown in Figure 2.2) that builds upon the work of Azevedo and
20

Figure 2.2: The Suggest-Assert-Modify taxonomy.
Jacobson (2008); it addresses the “how” question of scaffolding by defining the space of scaffolds available to
agents as a set of suggestions, assertions, and learning task modifications (an earlier version of this taxonomy
appears in Segedy et al. 2013d).
2.3.4.1 Suggestion Scaffolds
Suggestion scaffolds provide information to learners for the purpose of prompting them to engage in a spe-
cific behavior. By executing the recommended behavior, learners should encounter critical information that,
if properly internalized, would allow them to make progress in accomplishing the learning task. The taxon-
omy classifies suggestions based on whether they target overt behaviors (e.g., pressing a button or accessing
a resource), metacognitive activities (e.g. planning, monitoring, and reflecting) or cognitive knowledge inte-
gration activities.
Knowledge integration is the process of analyzing and connecting multiple chunks of information in order
to achieve new understandings about how they are related (Anderson, 1996; Winne, 2001). It can target sev-
eral cognitive processes, such as: (i) goal orientation, in which learners integrate chunks of information with
their understanding of their current goal; (ii) explanation construction, in which learners assemble chunks of
information to explain a system, process, or phenomenon; (iii) prediction, in which learners integrate chunks
21

Assertion Category ExampleDeclarative - Problem Domain Sunfish eat Mosquito Fish.Declarative - Cognitive Processes You have to know how to multiply fractions.Declarative - Metacognitive Strategies The “cross-multiply” strategy may help you.Declarative - Learner Behavior You have not tried any division problems.
ProceduralTo multiply fractions, first multiply the numerators,and then multiply the denominators.
ConditionalThe “benchmark” strategy could be used wheneveryou need to compare two proper fractions.
EvaluativeYou do not seem to have a good understanding ofhow to compare two proper fractions.
Table 2.1: Types of Assertion Scaffolds with Examples.
of information with a hypothetical scenario, and several others.
2.3.4.2 Assertion Scaffolds
Assertion scaffolds communicate information to learners as being true; ideally, learners will integrate this
information with their current understanding as they continue working toward completing their learning task.
Unlike suggestions, assertion scaffolds do not directly encourage learners to engage in a particular behavior;
they only state information.
The taxonomy distinguishes between four types of assertion scaffolds: declarative, procedural, condi-
tional, and evaluative. Declarative assertions communicate “knowing that” information (Anderson, 1996),
which was described in Section 2.2. These assertions are further divided based on their topic, which may be
the problem domain, cognitive processes, metacognitive strategies, or the learner’s behavior while using the
system. Examples of each type of declarative assertion are listed in Table 2.1.
Procedural assertions communicate “how-to” information, which was described in Section 2.2: sets of
actions that, when executed in a partially-ordered sequence, can accomplish a task. Conditional assertions
communicate information represented as complex production rules that identify both when cognitive pro-
cesses are applicable and whether or not they should be executed based on the current context (Winne, 2001).
Finally, evaluative assertions communicate evaluations of the learner’s performance and understanding. For
example, the system may assert that the learner does not seem to understand how to compare two proper
fractions.
2.3.4.3 Modification Scaffolds
Modification scaffolds, unlike suggestion and assertion scaffolds, do not operate by communicating informa-
tion to the learner; rather, they change aspects of the learning task itself. In doing so, they seek to adapt the
task to the learner’s needs and ability level. The taxonomy differentiates between two types of modification
22

Figure 2.3: Modification scaffolds.
scaffolds: adjustments and interventions. Both types are further illustrated in Figure 2.3.
Adjustment scaffolds operate by changing elements of the task in an attempt to change its difficulty
level, and the taxonomy identifies two types of adjustments: difficulty adjustments and feature availability
adjustments. Difficulty adjustments operate by changing the number of constituent acts required to reach
solution, and they could be used to make a task easier or more difficult. Feature availability adjustments
operate by changing the number of tools, features, or options available to the learner. For example, the
scaffolding agent may block access to certain tools or resources in order to focus the learner’s attention
on other, more useful approaches to completing their tasks. Intervention scaffolds, rather than modifying
features of the overall task, operate by temporarily shifting the learner’s attention from their primary task to
an intervention task. Upon completion of the intervention task, learners may return to the primary task. There
are several different types of intervention tasks available to scaffolding agents. Simply put, any learning task
could be used as an intervention scaffold. The agent may: demonstrate the proper use of a skill; ask the
learner to complete assessment problems; or ask the learner to explain what they were trying to do and then
provide feedback on the quality of the learner’s plan.
The Suggest-Assert-Modify (SAM) taxonomy represents the basic set of techniques available to scaffold-
ing agents in CBLEs. The remainder of this dissertation will leverage the SAM taxonomy in describing the
scaffolds employed both in this dissertation research and in related research, which is discussed in Section
2.4.
2.3.5 Summary: Components of Adaptive OELEs
Adaptive OELEs, in addition to providing a learning context and tools for learning, include methods by
which they can diagnose or infer learners’ needs and then provide adaptive support. As students pursue their
learning tasks in the OELE, their actions serve as input to the scaffolding agent’s Learner Modeling Module.
23

Learner modeling describes the process by which the OELE both measures and represents various aspects of
the learner as a result of observing the learner’s actions (Wenger, 1987). These measures form a model of
the learner, and they can include several aspects of learners, such as their current understanding of various
pieces of information, their stated intermediate goals, and their current estimated cognitive-affective state
(Baker et al., 2010). The learner model, then, drives a pedagogical function that selects and implements a set
of pedagogical actions (i.e., scaffolds or assessments). These pedagogical actions influence student behavior,
which leads to an updated learner model.
Altogether, then, adaptive OELEs may be characterized by the following:
• The learning context;
• The available tools for seeking out and acquiring information;
• The structure of a solution and the tools available for solution construction;
• The structure and content of the evaluative feedback from a solution test;
• The learner modeling module, including the structure of the learner model and the algorithms for its
construction; and
• The pedagogical function.
The remainder of this chapter discusses automated scaffolding agents in greater detail. I review previously
developed OELEs and scaffolding agents. In doing so, I will introduce Betty’s Brain (Leelawong and Biswas,
2008), an OELE focused on science learning and problem solving. All of the research reported in this
dissertation was conducted using this learning environment.
2.4 OELEs: The State of the Art
A large number of OELEs have been developed for several different types of learning tasks and topics.
Overall, these OELEs fall into three distinct categories: hypermedia based OELEs, modeling and simulation
based OELEs, and immersive narrative-centered OELEs. All of these systems provide a learning context and
a set of tools for pursuing learning. However, most existing OELEs contain little to no adaptive scaffolding.
2.4.1 Hypermedia Based OELEs
In hypermedia based OELEs, the learning context generally centers on sifting through and synthesizing large
amounts of information presented as a set of structured hypermedia resources. Learners are provided with
tools for organizing the information contained in the resources, and the goal often entails either produc-
ing a written document (e.g., a summary or a position paper) or preparing for summative assessments that
24

exist outside of the system (e.g., a written examination). These systems do not usually provide solution
assessment tools. For example, Decision Point! (Brush and Saye, 2001) provides information about the
African-American Civil Rights Movement of the 1950s and 1960s in the United States. Students learning
with Decision Point! are assigned the role of civil rights leaders in the year 1968, and their goal is to pro-
pose a set of strategies for furthering the cause of equal rights. The environment includes interface features,
such as guiding questions and organized note-taking templates, designed to help students organize and syn-
thesize critical information. However, students’ proposals are graded outside of the system, and the system
does not include a scaffolding agent. Similar functionality is built into Artemis (Lumpe and Butler, 2002),
a hypermedia learning environment that allows students to collect and organize information in service of
addressing a driving question. Like Decision Point!, Artemis does not automatically assess student work,
interpret students’ behaviors, or offer adaptive scaffolds.
MetaTutor (Azevedo et al., 2012; Bouchet et al., 2013), on the other hand, does interpret learner behav-
iors as they learn from hypermedia resources. In MetaTutor, students are expected to learn about a scientific
process or system (e.g., the human circulatory system), and they demonstrate their understanding by answer-
ing a set of multiple-choice and free response questions within the OELE. The system includes a scaffolding
agent that measures student behaviors as a set of factors including: the hypermedia pages visited by the
learner, the length of time spent on each hypermedia page, the learner’s current goals, and whether or not
they choose to zoom in on a hypermedia page’s image (Bouchet et al., 2013). The MetaTutor scaffolding
agent then uses those factors to decide when to provide adaptive scaffolds in the form of suggestions (e.g.,
“You should re-read the page about the components of the heart”) and short interventions during which the
student must answer self-reflection questions (e.g. “How well do you think you have learned the information
on this page?”). The rules used for deciding when to scaffold a learner are based on combinations of these
factors. For example, if the amount of time that a student spends on a page is longer than the average (pre-
sumably based on previously-collected data), then the scaffolding agent asks the student to rate how well they
learned the material. As another example, one out of every three times a student views a hypermedia page for
57 seconds or more, the system asks her to judge whether or not she already knows the material on the page.
Thus, the learner model does not store information based on what a learner knows or doesn’t know; rather, it
attempts to guide learners toward utilizing appropriate strategies for regulating their learning processes.
2.4.2 Modeling and Simulation Based OELEs
In modeling and simulation based OELEs, the emphasis is on constructing an accurate model of a domain,
process, or system and testing that model by using it to drive a simulation. The particular information ac-
quisition tools available are less important; they may be in the form of hypermedia resources, instructional
25

videos, or simulations for exploration, among others. For example, Co-Lab (Bravo et al., 2006; van Joolingen
et al., 2005) allows learners to study a scientific system by observing it in several simulations. Learners then
create hypotheses to explain what they observe by building a model of the phenomena, and they test their
model by running additional experiments with the simulation. As students work, they have access to tools for
organizing hypotheses as a set of relationships in a model, designing experiments to test those relationships,
and organizing the results of multiple experiments over time. The system provides automated methods for
analyzing and providing feedback about students’ constructed models, but the system does not include a scaf-
folding agent. ErgoMotion (Land and Hannafin, 1997) allows students to learn the principles of Newtonian
mechanics by designing and testing roller coasters. Learners model aspects of roller coasters, such as the
size of three hills, the motor size of the cars, and the radius of a series of horizontal curves. To seek out and
acquire information, learners have access to instructional videos that explain key physics concepts and their
relation to roller coasters. When students test a coaster, they view a video clip of people riding it. Depending
on the design of the coaster, the car will either complete the track, run out of momentum while on the track,
or fall off the track. Students use this information to revise their designs as they seek to create a fun and safe
coaster. Like Co-Lab, ErgoMotion does not include a scaffolding agent.
Ecolab (Luckin and du Boulay, 1999; Luckin and Hammerton, 2002) is also a modeling and simulation
based OELE. The system provides a set of activities, each marked with a difficulty level, in which students
model various aspects of food chains and food webs. As students complete activities, the scaffolding agent
observes their actions and intervenes whenever the student specifies an incorrect relationship (e.g., caterpillars
eat thistles). It notifies students that the relationship is incorrect, and also provides a hint as to what they
should do. Ecolab employs a progressive hints scaffolding strategy. For each relationship in the model, the
system includes a progression of five hints, each more specific than the previous one. The first hint is vague;
it provides the student with an opportunity to think deeply about their current problem and the contents of
the hint (e.g., Caterpillars do not eat thistles. Try again.). Conversely, the final hint tells students exactly
how to complete the task (e.g., “Thistle” is not the right sort of organism. Try “rose-leaves” instead.). When
students believe they have specified all of the relationships in the activity, they press a done button. The
system then evaluates their model; if the model is incomplete, the scaffolding agent provides a hint about one
of the relationships they still need to add.
Learners using Ecolab are free to choose the order in which to perform their learning activities, and the
scaffolding agent, in addition to providing hints for how to complete activities, uses information about the
number of mistakes students make while completing activities to create an overlay learner model (Wenger,
1987). Overlay models consist of a set of values that represent how confident the system is that the learner
understands each knowledge component required for successfully completing the learning activities. Ecolab’s
26

scaffolding agent uses the learner model to select a set of activities that are within the student’s zone of
proximal development (Vygotsky, 1978). The theory behind the zone of proximal development is that an
individual learns the most when the skill or knowledge required for a task is not proportionally too great
for the individual’s ability. If the task is too easy relative to ability, there is little for the individual to learn;
if the task is too hard, the individual does not have a sufficient foundation and cannot be successful. By
comparing the scaffolding agent’s “ideal activity selections” to the student’s selected activity, the agent infers
the student’s understanding of their own knowledge levels. Should students choose activities that are too
easy or too difficult, the system prompts them to reconsider their choice, sometimes including a more specific
suggestion (e.g., “You should try an easier activity”).
2.4.3 Immersive Narrative-Centered Environments
In immersive narrative-centered OELEs, learners are immersed in an open-ended learning task in the context
of an engaging story. Learners typically control avatars that are embedded in the story world, and their actions
in the environment contribute to the development of the narrative. In these environments, the primary focus
is on the narrative, and learners perform a variety of tasks in service of furthering that narrative (Spires et al.,
2011). Tasks may involve: learning via objects in the environment; finding, organizing, and synthesizing data
to answer questions; or hypothesis generation and experimentation; among others. Thus, narrative-centered
OELEs offer the ability to present multiple types of learning tasks in one environment by integrating them into
the context of the narrative. For example, learners using River City (Clarke and Dede, 2005) take on the role
of medical scientists investigating potential causes of illness in the city. As medical scientists, the learners are
expected to interview residents, industry executives, and university professors; form and test hypotheses by
collecting data from the environment and running simulations; and present their findings in a comprehensive
report. The report is then discussed with other students and the teacher outside of the learning environment.
Thus, there are no tools for automatically assessing the quality of a student’s report. Additionally, the system
does not include a scaffolding agent.
In Crystal Island (McQuiggan et al., 2008; Rowe et al., 2011; Spires et al., 2011), learners take on the
role of a microbiologist charged with investigating the identity and source of an infectious disease plaguing a
research station on Crystal Island. Learners work through five tasks in which they learn about pathogens by
interacting with the environment, speaking with computer controlled characters, reading books from a virtual
library, and testing objects and computer characters for infection using a virtual research laboratory. As they
explore the island and complete tasks, they compile their findings in a “diagnosis worksheet,” an evidence-
based document that describes recorded symptoms, laboratory testing results, beliefs about various candidate
diagnoses, and a final diagnosis of the source of the disease. Learners can assess their diagnosis worksheet by
27
asking a computer-controlled expert nurse to verify its accuracy. Crystal Island includes a simple scaffolding
agent; its learner modeling module keeps track of the number of laboratory experiments that learners have
conducted, and after every five experiments, it intervenes by requiring students to correctly answer questions
about microbiology. Additionally, the agent keeps track of the information that the learner encounters while
conversing with computer-controlled characters, and it occasionally quizzes students on that information after
the conversation ends.
Surge (Clark et al., 2011) is a narrative-centered OELE in which learners take on the role of Surge, “a
smart and brave female alien who is being called upon to save the adorable Fuzzies from the evil Emperor
Hooke” (2182). Learners save the Fuzzies by using their developing understanding of Newtonian mechanics
to navigate Surge’s spaceship through a series of levels: environments filled with obstacles and challenges
(e.g., maintain constant velocity while passing through a velocity detector). By using the keyboard, learners
apply impulses to the ship, and they must apply the correct set of impulses to navigate the obstacles, meet the
challenge requirements, and save Fuzzies located in the environment. In Surge, students’ solutions take on
the form of a plan that they execute in real-time as Surge’s ship navigates the environment, and they receive
real-time assessments of their plans visually as they observe the effect of applying their impulses. However,
the system does not include a scaffolding agent.
2.5 Additional Scaffolding Strategies
In addition to the scaffolding strategies reviewed above, researchers have invested effort into developing
scaffolding agents for Intelligent Tutoring Systems (ITSs; VanLehn 2006). ITSs are a class of CBLEs in
which learners are presented with small multi-step problems in a well-defined domain (e.g., geometry or
Newtonian mechanics). Students progress through these problems step-by-step, and they must perform each
step correctly in order to proceed to the next step. When students submit an incorrect answer to a step,
they are, at a minimum, told that their submission is incorrect. However, several ITSs provide additional
feedback meant to help students understand the cause of their errors (for a review of such feedback and issues
surrounding its design, see Shute 2008).
One common strategy for scaffolding students in ITSs is a variant of the progressive hints strategy known
as “Point, Teach, and Bottom-Out.” In this strategy, the scaffolding agent provides hints to students whenever
they submit an incorrect solution to a step, and these hints progress from “Pointing Hints” to “Teaching Hints”
to “Bottom-out Hints,” where, according to VanLehn (2006):
“Pointing hints mention problem conditions that should remind the student of the knowledge
component’s relevance. Teaching hints describe the knowledge component briefly and show how
28
to apply it. Bottom-out hints tell the student [how to apply the knowledge component to solve]
the [current problem] step” (p. 242).
ITSs usually vary in when they provide hints. While some ITSs provide a hint every time a student submits
an incorrect answer, other ITSs place constraints on how often students can receive help. For example, they
may limit hints to once per minute (Roll et al., 2011). Some ITSs additionally provide a hint button, allowing
students to obtain hints on-demand without submitting a solution to the problem. Almost every ITS includes
bottom-out hints with their systems, and students can choose to take advantage of those hints such that they
complete problems without exerting effort or learning the material targeted by the ITS. In the ITS literature,
this is called either gaming the system (Baker et al., 2006; Roscoe et al., 2013) or hint abuse (Roll et al.,
2011).
Significant effort has gone into designing scaffolding strategies that detect hint abuse and scaffold students
based on their use of it. For example, Rodrigo et al. (2012) embedded two scaffolding behaviors into an ITS
for learning about scatterplots. The first behavior involved employing negative emotional feedback. When the
scaffolding agent determined that the student was abusing hints, a suggestion scaffold was employed in which
a virtual computer character, named Scooter the Tutor, would express sadness (via a graphical representation).
If the student continued to abuse hints, Scooter would express anger, and if the student stopped gaming the
system, Scooter would express happiness. The second scaffolding behavior was also initiated in response to
the student abusing hints. If a student obtained the answer to a step via hint abuse, the student was required
to complete additional problems similar to the one the student had just attempted to bypass. A study of
students’ use of this system, along with these scaffolding strategies, showed benefits in terms of reducing
hint use and increasing learning in students (Baker et al., 2006). As another example, Roll et al. (2011)
developed a HelpTutor add on to an ITS called the Geometry Cognitive Tutor (Koedinger and Corbett, 2006).
HelpTutor observes students as they solve geometry problems, and, based on the problem difficulty relative
to the scaffolding agent’s estimate of the student’s ability, makes suggestions about when students should or
should not ask for help. If a student exhibits hint abuse behavior, the system suggests that she spend time
considering the information in each hint. If a student exhibits hint avoidance behavior, in which she chooses
not to request hints when she is struggling, the system reminds her of the hint button and encourages her to
use it.
This strategy of suggesting that students adopt alternative learning behaviors is a feature of several
CBLEs, including Ecolab, which was described previously. Inq-ITS (Sao Pedro et al., 2013), a CBLE for
science inquiry learning (but not an ITS, according to the definition provided in VanLehn 2006), also makes
use of this strategy. In Inq-ITS, students are tasked with utilizing the control of variables strategy (Chen and
29

Klahr, 1999) in order to investigate the relationships between variables in contrived situations. For example,
students may be asked to investigate the phase change properties of ice with driving questions such as: “If
the amount of ice in a container decreases, does the time required to melt the ice also decrease?” Students
are expected to run controlled experiments and collect data in order to answer these questions. If the sys-
tem’s scaffolding agent, Rex, detects that students are not running controlled experiments (e.g., by changing
multiple variables between experiments), are running experiments not related to their driving question, or
are not recording the results of their experiments, he provides scaffolds to help students improve their ap-
proaches. These scaffolds range from general suggestions, such as “Do not forget to record the results of
your experiments,” to more specific assertions, such as “You need to keep track of how much ice you put in
the container and how long it took that ice to melt. That way, you can compare these results to the results of
another experiment where you use more ice.”
Guided task decomposition is an approach to scaffolding students employed in the ASSISTments (Men-
dicino et al., 2009) and AutoTutor (Graesser and McNamara, 2010) CBLEs. This strategy is applicable to
situations in which students are given a relatively short problem, as is done in ITSs. However, unlike ITSs,
these problems ask students to solve a multi-step problem without step-by-step guidance from the computer.
For example, they may be asked to solve a complex algebraic equation using several operations in a single
step. This allows students who have achieved mastery of the material to verify their understanding more
efficiently and without going through the step-by-step operations that they already understand. When stu-
dents answer one of these problems incorrectly, the system responds by first decomposing the task into the
set of steps required to solve the problem, and then guiding students through each step, as is done in an ITS.
This approach allows the scaffolding agent to identify student misconceptions as they relate to specific steps
necessary for completing the problem, and it also provides students with an example of how to break down a
multi-step problem.
In terms of the SAM framework, guided task decomposition is one of the few examples of a scaffolding
strategy utilizing modification scaffolds, and it is best exemplified in AutoTutor, which teaches science topics
by posing questions and then holding natural language dialogues with learners as they attempt to answer
those questions. When students are unable to answer one of AutoTutor’s questions, the system modifies the
learning task: it decomposes the larger question into a series of smaller questions. To illustrate this process,
consider the example AutoTutor-Learner dialogue from Graesser and McNamara (2010); it shows AutoTutor
asking a learner the following question: The sun exerts a gravitational force on the earth as the earth moves
in its orbit around the sun. Does the earth pull equally on the sun? Explain why. In the example, the learner
indicates that she does not know the answer, and this prompts AutoTutor to alter the learning task by asking
the learner a simpler question: How does Newton’s third law of motion apply to this situation? Again, the
30

learner cannot answer the question, prompting AutoTutor to ask an even simpler question: Newton’s third
law refers to the forces exerted by one body on another ? When the learner successfully responds with
“body,” AutoTutor continues by posing another question, and this dialogue continues until the learner and
AutoTutor co-construct an answer to the original question, with AutoTutor continuing to adjust the learning
task based on the needs of the learner.
2.6 Betty’s Brain
The Betty’s Brain learning environment, shown in Figure 2.4, is an OELE that presents students with the task
of teaching a pedagogical agent (Johnson et al., 2000), named Betty, about science topics by constructing
a causal concept map that represents relevant science phenomena as a set of entities connected by directed
links which represent causal relations. Once taught, Betty can use the map to answer causal questions and
explain those answers by reasoning through chains of links (Leelawong and Biswas, 2008). The goal for
students using Betty’s Brain is to teach Betty a causal map that matches a hidden, expert model of the do-
main (which is also represented as a causal map). Concept mapping (Hilbert and Renkl, 2008; Nesbit and
Adesope, 2006; Novak, 1998) involves translating one’s own knowledge into a verbal-visual representation
consisting of concept nodes (e.g., “vegetation” and “oxygen”) and relational links (e.g., vegetation “releases”
oxygen). Building these maps allows learners to integrate new and prior knowledge as they reorganize their
understanding and connect related ideas. Such integration and organization may help students understand
how individual concepts (e.g. vegetation and sunlight) cohere within deeper principles (e.g. photosynthesis).
The network of causal connections also facilitates inferences. By tracing connections among ideas, students
can infer both proximal and distal relationships.
The students’ learning and teaching tasks are organized around five activities: reading, editing the causal
map, asking Betty questions, asking Betty to explain her answers, and asking Betty to take a quiz. Students
can seek and acquire the domain material they need to teach Betty by reading a set of searchable hypertext
resources. As students read, they need to identify causal relationships, such as “deforestation removes vege-
tation from an area,” and then explicitly teach the information to Betty by adding the two entities to the causal
map and creating the causal link between them (deforestation decreases vegetation). In Betty’s Brain, link
definitions are limited to the qualitative options of “increase” or “decrease.” Students can also add textual
descriptions to each link. For example, the link in Figure 2.4 from deforestation to vegetation is annotated
with the word “destroys.”
Learners can explore Betty’s knowledge by asking questions using the pop-up window displayed in Figure
2.4 (e.g., if garbage and landfills decrease, what effect does it have on polar sea ice?). To answer questions,
Betty uses qualitative reasoning methods that operate through chains of links from the source concept to the
31

Figure 2.4: Betty’s Brain system with resources and query window.
target concept (Forbus, 1984; Leelawong and Biswas, 2008). The learner can further probe Betty’s under-
standing by asking her to explain her answer. Betty illustrates her reasoning through text and animation; she
simultaneously explains her thinking (e.g., The question said that car emissions increase. This causes carbon
dioxide to increase. The increase in carbon dioxide causes...) and animates her explanation by highlighting
concepts and links on the map as she mentions them. By asking questions and listening to explanations,
learners can reflect on Betty’s (and their own) current understanding of the science material and gain a deeper
understanding of the processes under study.
Learners can assess the quality of their constructed map in two ways. First, they can ask Betty to answer a
question. After Betty answers the question, learners can ask Mr. Davis, another pedagogical agent that serves
as a mentor, to evaluate her answer. If the portion of the map that Betty uses to answer the question matches
the expert model (i.e., in answering the question, both maps would utilize the same chains of causal relations
between entities), then Betty’s answer is correct. Note that a link’s textual description is not considered during
this comparison; the algorithm only focuses on the effect of the link (increase or decrease). Learners can also
have Betty take a quiz in which she answers a set of questions. These questions are selected dynamically
by comparing Betty’s current causal map to the expert map. The quiz is designed to reflect the current
32

state of the map. Therefore, a set of questions is chosen (in proportion to the completeness of the map) for
which Betty will generate correct answers. The rest of the quiz questions produce incorrect answers, some of
which are “right for the wrong reason.” This grade refers to situations in which the final outcome of Betty’s
reasoning is correct, but one of the following two cases holds: (i) there is at least one incorrect link in Betty’s
explanation, or (ii) there is at least one link missing from Betty’s explanation. Quiz questions are chosen to
direct the learner’s attention to parts of the map with missing or incorrect links. As such, the quiz serves as
an important source of feedback to the learners. When Betty’s answer is graded as being correct, all of the
causal links that she used to answer the question are also correct. Learners can use Betty’s quiz results to
identify correct and incorrect causal links and then use this information to modify or add to the causal map.
An example quiz from a lesson on climate change is included in Figure 2.4. Each row of the quiz contains
the quiz question, the grade, Betty’s answer, and a button that allows the learner to ask Betty for her current
answer to the question.
Betty’s Brain embodies characteristics of all three types of OELEs. Students learn about a scientific
process or system by sifting through and organizing information in a set of hypermedia resources; they use
what they learn to create an executable model of the process or system under study; they test their model by
executing it to generate answers to quiz questions; and all of these processes are united under the narrative of
teaching Betty. The system also includes a scaffolding agent that models learners according to their system
usage attributes (e.g., how many concepts the learner has added or how many quizzes Betty has taken),
the quality of their causal maps, and their most recent quiz results. The scaffolding agent, represented in
the system as Mr. Davis, uses this information to provide scaffolds in the form of reminders of important
information and suggestions for how students should proceed.
2.6.1 Previous Research with Betty’s Brain
Betty’s Brain was originally developed in order to study the learning-by-teaching instructional paradigm for
CBLEs (Biswas et al., 2005). This paradigm attempts to leverage research from educational psychology that
has identified a tutor learning effect: people generally learn as a consequence of teaching others, and this
effect has been observed in multiple tutoring formats, in people from diverse backgrounds, and across subject
matter domains (Roscoe and Chi, 2007). To this end, Betty’s Brain was designed to elicit three teaching
behaviors from students: (i) structuring information such that Betty can understand it; (ii) taking responsi-
bility for and initiative in directing the teaching and learning processes; and (iii) reflectively monitoring the
effectiveness of their teaching (Biswas et al., 2005).
Multiple evaluations of the system found support for a protege effect of learning by teaching (Chase et al.,
2009); students who constructed causal maps for the purposes of teaching Betty were more motivated, exerted
33

more effort, and achieved higher learning gains when compared to students who constructed causal maps for
themselves. Additionally, students benefited from having access to the query and quiz functions: they created
denser causal maps and identified more correct causal links when compared to students who did not have
access to those interface features (Biswas et al., 2005). However, students with access to the quiz feature
focused almost exclusively on using trial-and-error approaches to make Betty answer quiz questions correctly
(Biswas et al., 2005; Wagster et al., 2007). These students did not attempt to achieve a deep understanding
of the domain in order to infer correct relationships. Rather, they quickly moved between quizzing Betty,
observing her results, and making an uninformed change to her map.
As a result, future versions of the system incorporated dialogue that provided learners with general sug-
gestions for how to be “good teachers.” Mr. Davis would note that good teachers: ask questions and listen
to their students’ explanations; reflect on their students’ answers and explanations in order to plan future
teaching interactions; and avoid giving their students too many quizzes and tests (Leelawong and Biswas,
2008). In studying the effect of this new dialogue, Biswas and colleagues found that students who received
this dialogue, when compared to students who did not, were more likely to engage in the learning behaviors
targeted by the dialogue (Biswas et al., 2005, 2009, 2010; Leelawong and Biswas, 2008; Jeong and Biswas,
2008; Jeong et al., 2008).
In the first phase of this dissertation research, presented in Chapter 3, students’ problem solving behaviors
while using the system were further explored. Specifically, the research explored: (i) differences in the
behaviors of more and less successful students (reported in Biswas et al. 2012; Kinnebrew and Biswas 2012;
Segedy et al. 2012a,b, 2013c); and (ii) the effect of a scaffolding strategy that employed contextualized
conversational feedback (reported in Segedy et al. 2013b).
2.7 Critical Review of Previously-Developed OELEs
The OELEs that have been developed to date generally take one of three forms: hypermedia based OELEs,
modeling and simulation based OELEs, and immersive narrative-centered OELEs. In hypermedia based
OELEs, the learning task mainly consists of searching for, collecting, organizing, and synthesizing infor-
mation from hypermedia resources to produce a written document or prepare for a summative assessment.
In modeling and simulation based OELEs, the learning task involves constructing an executable model of a
phenomenon and solution assessment usually involves observing the resulting simulation to infer whether or
not the model is correct. Ecolab is an exception; students test their solutions by pressing a done button and
are explicitly told whether or not their model is complete. In immersive narrative-centered OELEs, students
assume a role within a story-based world and their actions in the environment serve to further the narrative.
Students in narrative-centered environments may engage in a variety of tasks for acquiring information, con-
34

structing solutions, and testing those solutions. The critical aspect of these OELEs is that the various learning
tasks are united within the context of an immersive story.
The systems described above embody the state of the art in OELE technology. Of particular note is that
only four of the OELEs described include scaffolding agents. The learner modeling modules developed as
part of these four systems are relatively simple; they mainly focus on either system usage attributes (e.g., how
long a student has spent reading a hypermedia page in MetaTutor, the correctness of causal links added in
Betty’s Brain, or the number of experiments a student has conducted in Crystal Island) and what a learner
knows and does not know in terms of facts and definitions (e.g., whether or not students understand the
predators of a caterpillar in Ecolab). The limited information available in the learner models has led to
similarly simple pedagogical functions. These functions mainly focus on reviewing information the student
has just encountered (Crystal Island), telling students that an aspect of their solution is incorrect (Ecolab), and
making general suggestions about how to proceed (Betty’s Brain, Ecolab, and MetaTutor). Should students
continue to struggle despite receiving scaffolds, these systems typically adopt one of two approaches: (i)
they tell students exactly what they need to do to advance toward their goal (Ecolab), or (ii) they continue
to provide general suggestions while letting students continue to struggle (Betty’s Brain, Crystal Island, and
MetaTutor).
A major shortcoming of these scaffolding approaches is that they limit the type of learning that can be sup-
ported by OELEs. These systems offer valuable opportunities for teaching students how to employ cognitive
processes related to searching for information, constructing solutions, and testing solutions; metacognitive
processes related to effective planning and regulation during complex problem solving; and metacognitive
strategies for solving large, complex problems. However, the lack of techniques for measuring students’ use
of both cognitive and metacognitive processes in sufficient detail leaves the system unable to measure or
adaptively support students in learning to use them. For example, the hypermedia OELEs presented here are
unable to infer a learner’s ability to identify and understand important information while reading; as a conse-
quence, they have no method for supporting students in developing effective information seeking strategies.
A similar problem exists in modeling and simulation based OELEs; these systems are typically unable to
analyze the purpose of individual experiments students may conduct within the simulation environment, and
they often have no way of determining whether or not students are able to interpret and understand the results
of running a simulation. As a consequence, many learners struggle to successfully learn from these systems
(Land, 2000; Mayer, 2004). These learners usually lack well-developed understandings of the cognitive and
metacognitive processes important for success in such environments, and without support they encounter
significant difficulties in constructing a correct solution.
To overcome this problem, OELEs sometimes include scaffolds that rely on providing students with some
35

or all of the model building or problem solving steps. For example, Ecolab will eventually tell students ex-
actly which relationships they need to specify in order to construct the complete food web model. This
approach may not be ideal because it may prevent students from learning the skills and strategies necessary
for managing their learning and achieving success themselves. So even though these scaffolds can lead a
student to a correct solution, completion of the learning task may no longer be associated with the desired
learning outcomes. A better approach to scaffolding students may be to adopt a philosophy of coaching
(Burton and Brown, 1979; Crews et al., 1997), which involves interpreting students’ attempts at employ-
ing various cognitive and metacognitive processes, recognizing how and why students are struggling with
those processes, and providing scaffolds that allow students to recognize their errors and improve their future
attempts at employing those processes. Ideally, more sophisticated scaffolding agents in OELEs could intel-
ligently guide students toward employing effective strategies for solving complex problems. Such guidance
may help students learn and incorporate these strategies into their understanding of how to solve the problem.
More importantly, students may be able to draw on their developing understanding of these strategies as they
attempt to solve new problems in the future.
The scaffolding strategies employed in other CBLEs are similar to those employed in the OELEs re-
viewed above. Many of them rely on either providing students part or all of the problem solution (as in
ITSs) or making behavioral suggestions that encourage students to or discourage students from engaging in
particular behaviors (as in Scooter the Tutor, HelpTutor, and Inq-ITS). As such, they suffer from the same
limitations discussed above. However, two scaffolding strategies are worth noting, as the three-stage scaf-
folding approach presented in Chapter 6 builds upon these approaches. The first, employed via Scooter the
Tutor, involves requiring students to demonstrate proficiency with a skill when they choose to abuse hints
within the scatterplot ITS, and the second is guided task decomposition as employed in both ASSISTments
and AutoTutor (and discussed in Section 2.5). These strategies, when used as part of a coaching philosophy,
allow the system to more effectively diagnose and correct the potential causes of student difficulties.
2.8 Summary
OELEs offer active problem-solving tasks that embody the constructivist theory of learning. To be successful
in OELEs, students must manage a complex problem solving process, and this requires the utilization of
metacognitive knowledge to regulate problem-solving processes through goal selection, planning, monitor-
ing, control, and reflection. Metacognition, and SRL more generally, have been identified as critical factors
that predict students’ success in high school, college, and job-training. However, students often struggle to
employ metacognition and achieve success in OELEs.
This chapter has presented, discussed, and critiqued the literature relating to the design and development
36

of adaptive OELEs. Adaptive OELEs provide students with a learning context and a set of tools for: seeking
out and acquiring information, applying that information to the construction of a problem solution, and testing
partial or complete solutions. In addition, adaptive OELEs include automated scaffolding agents that observe
user actions, construct a model of the learner, and then use that model to drive pedagogical decisions in
which they actively diagnose students’ needs and provide them with scaffolds. Scaffolds are defined in this
research as supportive actions taken by a scaffolding agent that assist the learner in completing their learning
objectives.
The remainder of this dissertation focuses on presenting the two phases of research discussed in Chapter
1. The goal of this research is to develop and test methods for designing more effective scaffolding agents for
adaptive OELEs. More specifically, the research develops approaches to both interpreting student behavior
and scaffolding students. Chapter 3 presents the first phase of research, which consists of two classroom
studies of students using Betty’s Brain. Chapter 4 details the task and process models of problem solving
processes involved in the successful completion of open-ended learning tasks as well as the CGA approach to
behavioral analysis in OELEs. Chapter 5 discusses the changes made to the Betty’s Brain system architecture
in order to incorporate the CGA approach into the system. Chapter 6 presents the TSS strategy tested during
the second phase of research as well as the the classroom evaluation of this strategy and the CGA approach.
37

CHAPTER 3
Exploratory Studies of Student Behavior in Betty’s Brain
This chapter presents results from two studies of students learning with Betty’s Brain in order to develop
an understanding of how middle school students approached the open-ended learning task. Specifically, the
research explores: (i) differences in the behaviors of more and less successful students (reported in Biswas
et al. 2012; Kinnebrew and Biswas 2012; Kinnebrew et al. 2013; Segedy et al. 2012a, 2013c, 2014); and (ii)
the effect of a scaffolding strategy that employed contextualized conversational feedback (reported in Segedy
et al. 2013b)1.
A second component of this phase of research involves investigating the value of different techniques for
analyzing students’ interaction trace data, which is generated as students use Betty’s Brain. Specifically, the
studies present results of behavioral data analyses that rely on: (i) creating summative statistics that describe
students’ overall behavior in terms of their accuracy in model building and the relatedness of their actions;
(ii) employing algorithms that construct hidden Markov models (Rabiner, 1989) likely to output the behavior
sequences observed in students’ interaction traces; and (iii) applying sequential pattern analysis algorithms
(Agrawal and Srikant, 1995) to search for behavior patterns that occur frequently both within and across
students’ traces.
3.1 Study 1: Identifying More and Less Successful Behaviors
The first study of student problem-solving behaviors in Betty’s Brain focused on identifying behavioral dif-
ferences between more and less successful students. Forty 8th-grade students used Betty’s Brain to learn
about an instructional unit focusing on the human thermoregulatory system. A majority of the material in this
section has been reported in Biswas et al. (2012); Kinnebrew and Biswas (2012); Kinnebrew et al. (2013);
Segedy et al. (2012a, 2013c, 2014). Additional details of this study are included in Appendix A.
The version of Betty’s Brain used in this study, shown in Figure 2.4, is similar to the version described in
Section 2.6. Students were able to search through and navigate the hypertext resources, ask Betty to answer
questions and explain her answers, and have Betty take quizzes. In addition, students were able to express
their confidence in the correctness of a causal link (e.g., I think this link is definitely correct) through the causal
link editing interface. This provided students with a way to record which links had been used to answer quiz
questions correctly. Students also occasionally received feedback from Mr. Davis about their recent map
1These studies were conceived, designed, and executed collaboratively by several members of the Teachable Agents research groupat Vanderbilt University, including Drs. Gautam Biswas and John Kinnebrew as well as Brian Sulcer and Satabdi Basu.
38

editing operations. Every 4th time students added a distinct correct link, Mr. Davis would inform them that
the link they had just added was correct. Similarly, every 4th time students deleted a distinct incorrect link,
Mr. Davis would inform them that the link they had just deleted was incorrect. Finally, an “FAQ” style
help menu was added to Mr. Davis, allowing students to ask questions about how to identify causal links in
reading materials and how to use quizzes and keep track of quiz results.
In this study, learning was assessed using a pretest-posttest design. Each test consisted of multiple-choice
questions covering students’ understanding of causal reasoning, definitions of thermoregulation concepts,
and causal relationships among those concepts. Additionally, the tests included short answer questions that
asked students to consider a given scenario (e.g., alcohol consumption) and explain its causal impact on the
human thermoregulatory system. To record students’ problem-solving behaviors, this version of Betty’s Brain
generated event-based log files that captured every timestamped action taken by either the student, Betty, or
Mr. Davis. This included: resource page accesses, map edits, queries, explanations, and quizzes. Using these
log files, we conducted three primary sets of analyses:
1. Calculation of summative metrics that describe students’ behaviors on the system.
2. Hidden Markov model analysis, which used students’ action sequences to learn a hidden Markov model
of the states and transition probabilities that were most likely to generate those sequences (Biswas et al.,
2010).
3. Differential sequence mining (Kinnebrew et al., 2013), which identified frequently-employed patterns
of student behaviors that differentiated groups of students.
The summative statistics included the following:
• Map score: the difference between the number of correct and incorrect links on the student’s causal
map. In this study, we separated students into groups based on the highest map score they attained
while working on Betty’s Brain2.
• Map edit correctness: the percentage of map edits that were correct (i.e., the map score of the resulting
map was higher than the map score of the preceding map).
• Overall action relevance (Biswas et al., 2010): the percentage of student actions that were relevant to
previous actions. An action was considered “relevant” if it was “related” to at least one of the previous
2Previous analyses of students’ learning behaviors (Biswas and Sulcer, 2010) provided evidence that a student’s map score at the endof a Betty’s Brain instructional unit was often not the best score they attained over the course of the unit. For example, some studentswould delete everything on their map and start over. If they happened to do this shortly before the end of the intervention, then their finalmap score could be lower than their best map score.
39

student actions within a 3-action window and irrelevant otherwise3. In this analysis, two actions were
considered “related” if they were related to or operated on one of the same causal map concepts or
links.
3.1.1 Summary of Results
Recall that a primary objective of this study was to understand how more and less successful students differ
in their use of Betty’s Brain. To differentiate more and less successful students, we separated them into
High, Medium, and Low groups based on their best map scores and then compared learning and performance
metrics between students in the High (n= 16) and Low (n= 18) groups. Students in the High group exhibited
significantly higher learning gains on science content multiple choice questions than their counterparts in the
Low group (F = 12.448, p = 0.001, Cohen’s d = 1.24). They gained moderately more than Low group
students on causal reasoning items and short answer questions, but these differences did not reach statistical
significance.
High group students were significantly more accurate in their map editing behavior (F = 31.528, p =
0.001, Cohen’s d = 1.940). However, the mean map edit correctness percentage of High group students was
only 60.3%, indicating that even these students made several mistakes when constructing their maps. Addi-
tionally, the actions of High group students achieved significantly higher levels of overall action relevance
(F = 12.401, p = 0.001, Cohen’s d = 1.213) than those of the Low group students. Together, these suggest
that map checking behaviors, including the ability to identify and correct erroneous links, may have played
an important role in the success of the High group students.
The next analysis involved using students’ action sequences to learn a hidden Markov model (HMM;
Rabiner 1989) of the states most likely to generate students’ observed action sequences. The approach to
generating HMMs from students’ behavior data has been presented in Biswas et al. (2010) and Jeong and
Biswas (2008). Figure 3.1 illustrates the two HMMs derived by applying the HMM learning algorithm to
the behavior data of students in the High and Low student groups. The percent value listed within each state
is the relative frequency of that state occurring relative to the other states in the model. The state output
probabilities (i.e., the likelihood of producing each action in a state) are shown in Table 3.1.
In comparing the derived HMMs for the two groups, the largest difference is that the uninformed editing
activities were split into a separate state (Uninformed Editing) in the High group rather than being combined
with the informed editing activities in the Editing & Monitoring state as in the Low group. This provides
some evidence for a more strategic use of edits in the High group, as a significant proportion of their edits
3In all presented results, we employed a three-action window to calculate action relevance. A more complete definition of relevanceand a rationale for its use is presented in (Biswas et al., 2010).
40
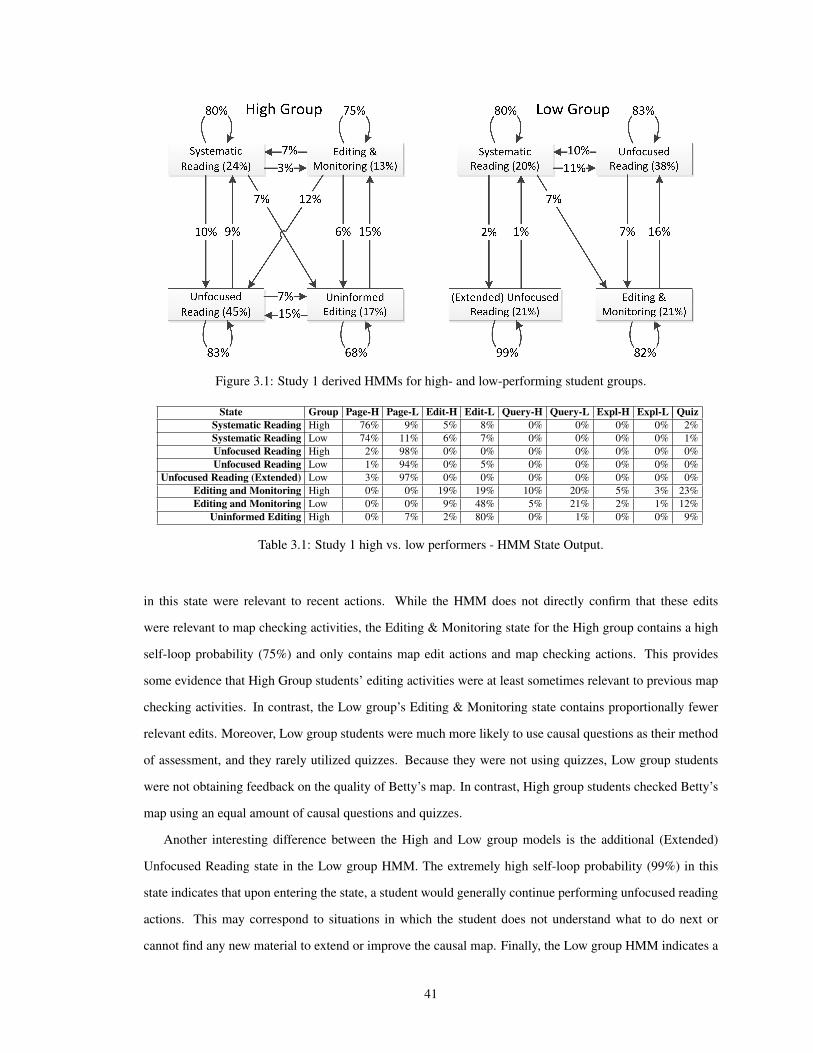
Figure 3.1: Study 1 derived HMMs for high- and low-performing student groups.
State Group Page-H Page-L Edit-H Edit-L Query-H Query-L Expl-H Expl-L QuizSystematic Reading High 76% 9% 5% 8% 0% 0% 0% 0% 2%Systematic Reading Low 74% 11% 6% 7% 0% 0% 0% 0% 1%Unfocused Reading High 2% 98% 0% 0% 0% 0% 0% 0% 0%Unfocused Reading Low 1% 94% 0% 5% 0% 0% 0% 0% 0%
Unfocused Reading (Extended) Low 3% 97% 0% 0% 0% 0% 0% 0% 0%Editing and Monitoring High 0% 0% 19% 19% 10% 20% 5% 3% 23%Editing and Monitoring Low 0% 0% 9% 48% 5% 21% 2% 1% 12%
Uninformed Editing High 0% 7% 2% 80% 0% 1% 0% 0% 9%
Table 3.1: Study 1 high vs. low performers - HMM State Output.
in this state were relevant to recent actions. While the HMM does not directly confirm that these edits
were relevant to map checking activities, the Editing & Monitoring state for the High group contains a high
self-loop probability (75%) and only contains map edit actions and map checking actions. This provides
some evidence that High Group students’ editing activities were at least sometimes relevant to previous map
checking activities. In contrast, the Low group’s Editing & Monitoring state contains proportionally fewer
relevant edits. Moreover, Low group students were much more likely to use causal questions as their method
of assessment, and they rarely utilized quizzes. Because they were not using quizzes, Low group students
were not obtaining feedback on the quality of Betty’s map. In contrast, High group students checked Betty’s
map using an equal amount of causal questions and quizzes.
Another interesting difference between the High and Low group models is the additional (Extended)
Unfocused Reading state in the Low group HMM. The extremely high self-loop probability (99%) in this
state indicates that upon entering the state, a student would generally continue performing unfocused reading
actions. This may correspond to situations in which the student does not understand what to do next or
cannot find any new material to extend or improve the causal map. Finally, the Low group HMM indicates a
41

PatternI-Support Diff
S-Frequent Group(High - Low)
Quiz→ Page-Rel 4.57 HighQuiz→ LinkRem-Rel 4.08 HighLinkRem-Rel→ Quiz 3.92 HighQuiz→ Page-Rel-Mult 3.33 High
LinkAdd-Irrel→ Quiz→ LinkRem-Rel 3.14 HighLinkAdd-Irrel→ Quiz 5.80 Both
LinkAdd-Irrel→ LinkRem-Rel 3.72 BothLinkAdd-Irrel→ Page-Rel 3.61 Both
Quiz→ LinkAdd-Irrel 3.24 BothQuiz→ Query-Rel 3.08 Both
Quiz→ Page-Irrel-Mult -1.18 BothPage-Irrel→ Page-Rel→ Page-Irrel-Mult -2.06 Both
Quiz→ Page-Irrel-Mult→ Page-Irrel-Mult -0.77 LowPage-Irrel-Mult→ Page-Irrel-Mult→ ConcAdd-Irrel -0.84 Low
Page-Irrel→ Page-Irrel-Mult→ Page-Irrel-Mult→ Page-Rel -0.85 LowPage-Irrel-Mult→ Page-Rel-Mult→ Page-Irrel→ Page-Irrel -0.93 Low
Page-Irrel→ Page-Irrel-Mult→ Page-Irrel-Mult -0.99 Low
Table 3.2: Study 1 high vs. low performers - Differentially frequent patterns.
greater overall reliance on unfocused reading (59% expected state occurrence, combining the two Unfocused
Reading states) compared to the High group (45%).
The final analysis involved using students’ action sequences as input to a sequential pattern mining analy-
sis designed to identify differentially frequent patterns between groups of students. This approach, presented
in Kinnebrew et al. (2013), combines sequential pattern mining (Agrawal and Srikant, 1995) and episode
mining (Mannila et al., 1997) to characterize behavior patterns within student sequences according to two
measures: sequence support and instance support. Sequence support is the percentage of sequences in which
the pattern appears, and instance support is the average number of times a pattern appears in the sequences
of a group of students.
Table 3.2 presents 17 behavior patterns sorted by the difference in the two groups’ instance support values.
The High group’s differentially frequent patterns suggest a greater tendency to check low-relevance additions
of causal links by taking quizzes or by reading relevant resources. Further, High group students were more
likely than Low group students to follow quizzes with relevant link removals, suggesting that they were
attempting to correct errors in their map. High group students were also more likely to follow a quiz with
relevant reading or queries, while the Low group students were more likely to follow a quiz with unrelated
reading. Overall, these results suggest a differential effort by the High group to identify and take advantage
of information in the quiz results. These approaches to map checking suggest that High group students were
either more engaged in the task, more able to recover from mistakes, or both.
42

3.1.2 Discussion
Study 1 provided valuable insight into behavioral differences between more and less successful students in
Betty’s Brain. High group students showed significantly higher relative gain on the science content multiple
choice questions when compared with Low group students. Thus, performance in Betty’s Brain predicted stu-
dents’ ability to recognize definitions and causal relationships. High group students were also more accurate
in their map editing and performed more relevant actions when compared to their Low group counterparts.
Sometimes, these actions were related to recent map checking activities, such as questions, explanations, and
quizzes. The sequence mining results confirm this observation, as several of the High group’s differentially
frequent patterns involved interspersing map checking, map editing, and page accesses. While the HMMs
and sequence mining results do not prove that High group students’ edits were motivated by the directly
preceding map checking activities, the fact that their edits tended to be relevant increases the chance that this
was true.
Low group students, on the other hand, struggled to succeed in Betty’s Brain. A higher proportion of their
map edits were incorrect (57.2%, vs. 39.7% in the High group) and a higher proportion of their actions were
not relevant to previous actions (59.4%, vs. 46.7% in the High group). The HMM results show that Low group
students sometimes entered a state of extended unfocused reading, in which they viewed several unrelated
resource pages. Even more discouraging is that once low group students began this unfocused reading pattern,
they tended to persist in it. The sequence mining results show that behavior patterns that were characteristic
of the Low group tended to include map checking and page accesses that were not relevant to recent activities.
One potential explanation for the Low group students’ behaviors is that they may have disengaged from
the learning task, choosing not to exert the mental effort necessary to think critically about how to complete
the Betty’s Brain task. These students may have struggled to understand the task and the resources, or they
may have become discouraged as they continued to see little or no progress. An important direction for future
research is in developing scaffolds that are able to, at least sometimes, re-engage these students and help them
learn how to complete their tasks.
3.2 Study 2: Testing Contextualized Conversational Feedback
The second study tested the effect of a scaffolding strategy for Betty’s Brain based on the idea of contextu-
alized conversational (CC) feedback. A majority of the material in this section has been reported in Segedy
et al. (2013b). Contextualized conversational feedback was contextualized by the student’s task goal (teaching
Betty the correct map), the current causal map, and the student’s recent activities on the system; it explicitly
referenced specific concepts, links, quizzes, and questions that were related to the student’s recent activities
(e.g., adding a link or asking Betty to take a quiz), and it provided explicit information about how these ac-
43
tivities contribute to the student completing their teaching task. Sometimes, this involved providing direct
hints (e.g., “you need to remove the link from deforestation to carbon dioxide” or “you need to add a link
between the concepts global temperature and sea ice”). Additionally, the feedback was delivered through
conversations: mixed-initiative, back-and-forth dialogues between the student and the agent.
This study tested the effect of contextualized conversational feedback by comparing it to a baseline feed-
back approach called prompt-based action-oriented feedback. This feedback was characterized by two main
attributes. First, it was organized into prompts: short statements delivered as one-way communication. After
an agent had finished speaking, the learner had no opportunity to respond to the agent. Second, the feedback
was action-oriented; when students executed an action in the system, agents delivering this feedback sug-
gested potentially useful behaviors and strategies that were linked to that action. For example, every three
to five times a student asked Betty a question, Mr. Davis encouraged that student to “ask [Betty] to explain
her reasoning...to see if her explanations make sense.” Note that this feedback statement does not reference
specific causal links; nor does it reference the question that the student just asked or provide any information
about how requesting Betty’s explanation relates to the student’s ability to complete their teaching task. An
equivalent contextualized conversational statement would ground the same advice in the context of the stu-
dent’s goals and the causal map: “Betty’s answer to the question you just asked her, ‘if car emissions increase,
what happens to vegetation?’ is not right. You should have Betty explain her answer to this question and try
to find her mistake.”
Forty-four 8th-grade students were divided into two treatment groups: PA and CC. The two groups dif-
fered only by the agent interactions that occurred while they used the system: students in the PA condition
received prompt-based action-oriented feedback, and students in the CC group received contextualized con-
versational feedback. All students used Betty’s Brain with an instructional unit focusing on the theory of
climate change. The version of Betty’s Brain used in this study is similar to the version used for Study 1.
Students were able to search through and navigate the hypertext resources, ask Betty to answer questions and
explain her answers, and have Betty take quizzes. However, the “FAQ” that was available during Study 1 was
not available in this version of the system.
Learning was assessed using a pretest-posttest design. Each test consisted of multiple-choice questions
covering students’ understanding of causal reasoning, definitions of climate change concepts, and causal
relationships among those concepts. The tests also included short answer questions that asked students to
consider a given scenario (e.g., an increase in carpooling) and explain its causal impact on the global climate.
As in Study 1, this version of Betty’s Brain generated event-based log files that captured every timestamped
action taken by the student, Betty, or Mr. Davis. This included: page accesses, map edits, queries, explana-
tions, and quizzes. These log files were analyzed using the HMM and sequential pattern mining techniques
44

described in Biswas et al. (2010) and Kinnebrew et al. (2013) and utilized during the Study 1 analyses.
3.2.1 Summary of Results
Students in the CC group exhibited statistically significant gains on all three learning assessment measures,
showing that students in this group improved their understanding of climate change, causal reasoning, and
how to apply their understanding of climate change to hypothetical situations. Conversely, students in the PA
group only showed statistically significant gains on multiple choice questions covering the science content.
A repeated-measures ANOVA was used to analyze differences in test performance between the two groups,
and this analysis failed to reveal a statistically significant effect of treatment group on science content items
(F = 1.543, p = 0.222), causal reasoning items (F = 0.003, p = 0.955), and short answer questions (F =
0.107, p = 0.746). However, the analysis did reveal an interaction effect of time and treatment group on
causal reasoning items (F = 5.516, p = 0.025). This is mainly due to the fact that while the PA group
students’ performance on these items degraded from pretest to posttest, the CC group students’ performance
on these items improved from pretest to posttest. Altogether, these results show that while CC group students
achieved significant gains on all three test measures, their performance on science content items and short
answer questions did not significantly differ from the performance of PA group students.
Students in the CC group created causal maps that achieved significantly higher scores (µ = 16.00, σ =
4.56) than the maps created by PA group students (µ = 8.88, σ = 7.65). An ANOVA performed on the data
revealed that this difference reached statistical significance (F = 12.472, p = 0.001, Cohen’s d = 1.097). The
contextualized and conversational nature of the feedback, including the direct hints provided to students in
this condition, may have helped students achieve more success in completing the Betty’s Brain learning task.
The HMMs generated with the learning interaction traces of the PA and CC group students appear in
Figure 3.2. These models include five distinct states that are described by the action probabilities in Figure
3.3. The states were interpreted as follows:
• Reading: students were primarily reading the resources.
• Informed Editing: students were primarily making high-relevance edits, suggesting a more focused
map-building effort.
• Uninformed Editing: students were primarily making low-relevance edits, possibly indicating the use
of guessing behaviors.
• Uninformed Editing and Checking: students were performing map checking behaviors like asking
questions and assigning quizzes, and they were also making a significant number of low-relevance
45

Figure 3.2: Study 2 derived HMMs for the PA and CC groups.
edits to their maps. This implies that students were not reflecting on the results of their assessments,
and they may have resorted to trial-and-error methods to correct their maps.
• Informed Editing and Checking: students were making high-relevance changes to their map while also
using questions and quizzes to assess their causal maps. This state likely corresponds to more effective
attempts at employing monitoring strategies to identify and correct erroneous (or missing) information
in the map.
The HMM results illustrate a similar set of behaviors employed by both the PA and CC group students,
although all of the uninformed editing actions in the PA group are combined in the uninformed editing and
checking state rather than being split between it and a separate uninformed editing state in the CC group.
Additionally, the proportions of expected state occurrences are relatively similar between the two groups.
However, two interesting differences in behavior patterns are worth noting: (i) the PA group model has
a lower likelihood (39%) of transitioning directly from informed editing to informed editing and checking
activities compared to the CC group model (61% transition probability); and (ii) the CC group model exhibits
a higher likelihood of following informed editing and checking activities with more reading (29%, vs. 14%
for the PA group model). This indicates that students in the CC group were more likely to: (i) intersperse
map checking activities between their reading and informed editing activities; and (ii) return to reading after
informed editing and checking. These students may have used strategies to both identify potential problems
in their causal map for further exploration with the resources and also confirm that their current causal map
46

Figure 3.3: Study 2 state output probabilities for the PA and CC group HMMs.
47

Pattern i-support (CC - PA) s-Frequent GroupRead-Mult→ Edit-H-Mult→ Read 4.39
CCRead-Mult→ Read-Mult→ Edit-H→ Read 4.11Read-Mult→ Edit-H→ Read-Mult→ Edit-H→ Read 3.11Edit-H→ Read 3.76
Both
Edit-H→ Read-Mult 2.14Read-Mult→ Edit-H→ Read 2.08Edit-L→ Quiz-L −0.91Quiz-L→ Edit-L −1.29Edit-L→ Query-H −1.53Query-H→ Expl-H −2.29
PAEdit-L→ Edit-L −2.35Query-L→ Edit-L −2.47
Table 3.3: Study 2 differentially frequent patterns.
produced correct answers.
Table 3.3 presents the top three differentially frequent patterns in four comparison categories (i.e., cate-
gorized by whether the patterns were s-frequent in one or both groups and in which group they were more
i-frequent; see Kinnebrew et al. 2013 and Segedy et al. 2013b for more information about these categoriza-
tions). This analysis reveals that many of the patterns that were differentially frequent in the CC group were
repeated read-and-edit patterns. Many other read-and-edit sequences were frequent in both groups, but the
differentially frequent sequences for the CC group often included single reads and informed edits, while the
PA group students’ differentially frequent patterns included uninformed edits combined with low relevance
questions and quizzes. These results suggest that the CC group students may have more frequently employed
a strategy in which they read a small portion of the resources and edited their map based on what they learned.
Conversely, PA group students may have engaged in less systematic knowledge construction strategies. In
particular, they may have been less focused and encountered more difficulties.
Because the CC group students’ frequent patterns are dominated by read and edit actions, Table 3.3 does
not provide insight into how CC group students employed map checking activities as they worked. However,
the HMM analysis suggested that there may be important differences in how these two groups checked the
quality of their maps. To better compare students’ map checking activities, Table 3.4 presents the top three
differentially frequent patterns that included at least one query or quiz action in each comparison category.
This analysis illustrates that the CC group was more likely to use queries and quizzes in between se-
quences of reading and single, informed edits. In contrast, the PA group had a differential preference for
using queries before and after individual, uninformed edits. This provides further detail to the HMM results
that illustrated a difference in transitions to the “informed editing and checking” states and from them to the
“reading” states in these groups. These results suggest that CC group students checked their maps in a way
that was more related to the shorter sequences of reading and editing that they were currently involved in.
48

Pattern i-support (CC - PA) s-Frequent GroupRead-Mult→ Edit-H→ Quiz-H→ Edit-H 2.21
CCRead-Mult→ Edit-H→ Read-Mult→ Query-H 1.61Read-Mult→ Edit-H→ Quiz-H→ Read-Mult 1.61Quiz-H→ Edit-H 1.33
Both
Edit-H→ Query-H→ Edit-H 1.31Edit-H→ Query-H→ Read-Mult 1.31Edit-L→ Quiz-L −0.91Quiz-L→ Edit-L −1.29Edit-L→ Query-H −1.53Query-H→ Query-H −2.29
PAQuery-H→ Expl-H −2.29Query-L→ Edit-L −2.47
Table 3.4: Study 2 differentially frequent patterns including map checking actions.
Taken together, Tables 3.3 and 3.4 suggest that CC group students were more systematic in their teaching
activities: they more often interspersed reading, editing, and assessing activities, indicating that their reading
behaviors may have been used to inform their map edits and their assessing behaviors may have been used to
inform further reading activities and map edits.
3.2.2 Discussion
Study 2 provided insight into the potential for automated support in Betty’s Brain to lead to profitable changes
in students’ problem-solving behaviors. The study tested the effectiveness of feedback that was contextual-
ized by the student’s task goal (teaching Betty the correct map), learning artifact (the causal map) and recent
actions; included direct hints; and was presented in a mixed-initiative conversational format. Results showed
that contextualized conversational feedback was associated with more effective problem-solving behaviors
and causal maps that more closely matched the expert map.
However, there are limitations to these results. The study did not isolate the effects of contextualization,
direct hints, and conversation; this limits the interpretability of the results. Further, the CC group students’
learning of science content was not significantly higher than the learning of the PA group students. One
possible reason for this lack of a clear effect on learning may be related to the fact that the feedback, while
being contextualized and conversational, did not provide support for learners who lacked an understanding of
skills related to reading the resources, building Betty’s map, and using quizzes to keep track of which links
are correct and incorrect. For example, Mr. Davis would sometimes suggest reading a section of the resources
but would not provide support for students who did not understand how to identify causal relationships from
reading materials. It may be that some CC group students, particularly those who struggled to identify causal
relations in the science resources, adopted a strategy of relying on direct hints to complete their maps rather
than gaining a stronger understanding of the science content. This could potentially explain why the CC
49

group students did not achieve higher test scores despite creating significantly better maps. As discussed in
Chapters 1 and 2, OELEs that do not provide scaffolds for the basic skills underlying success in the system
may not be useful for students who lack those skills.
3.3 Summary and Discussion
This chapter presented two studies of students using Betty’s Brain, and the goals of these studies were to both:
(i) understand how students navigated the complex open-ended environment; and (ii) investigate the value of
HMM and sequential pattern mining analysis techniques in analyzing the resulting student use data. Several
valuable findings emerged from these studies related to students’ use of the system, the value of the analysis
techniques, and the effect of contextualized conversational feedback on students’ problem-solving behaviors.
Study 1 compared the learning and problem-solving behaviors of students who achieved more and less
success in creating the correct causal map. These comparisons relied on summative statistics, hidden Markov
model analysis, and sequential pattern mining. Results indicated that more successful students: (i) were
better able to recognize science definitions and causal relationships when completing the post-tests; (ii) were
more accurate in map building; (iii) performed actions that were more often relevant to recent actions; and
(iv) were more likely to intersperse relevant reading, map building, and map checking actions, suggesting
that these students were better able to coordinate their use of the system’s tools and regulate their problem
solving. An important finding in Study 1 was the large proportion of students who struggled to succeed in
Betty’s Brain (18 out of 40). These students either chose not to engage with the system or were unsure of
how to go about solving the problem.
Study 2 provided evidence that automated feedback can have an impact on how students learn and solve
problems within Betty’s Brain. Students who received contextualized conversation feedback and direct hints
constructed more accurate causal maps and engaged in behaviors more indicative of self-regulated learn-
ing. Like the high performing students in Study 1, CC group students effectively interspersed reading, map
building, and map checking behaviors.
3.3.1 Limitations
An important goal of this dissertation research is to develop methods for diagnosing and scaffolding students
in real-time. The presented studies provide valuable insight into how students use OELEs, and they also
provide evidence in support of building adaptive scaffolds into Betty’s Brain (as the contextualized conversa-
tional feedback in Study 2 was associated with differences in students’ problem-solving behaviors). However,
these studies suffered from some significant limitations. In particular, the analyses presented in these studies
were limited. While the results were interesting and provided insights into student learning behaviors, they
50
did not provide actionable information that could be used to support students as they learn in Betty’s Brain.
In particular, the HMM and sequence mining algorithms relied on significant action abstraction. They rep-
resented student behaviors as sequences of general actions stripped of almost all of their associated context
(e.g., “Page Access” or “Map Edit”), and this led to results that were difficult to interpret. For example,
knowing that high performing students more frequently employed the pattern “Quiz→ LinkAdd-Irrel” does
not provide specific insights into how to scaffold learners who are or are not employing this behavior pattern.
Moreover, this pattern, more often exhibited by high performing students in Study 1, is not indicative of a
good learning strategy; it indicates that successful students were more likely to follow a quiz with an unin-
formed link addition, an indication of a guessing behavior. Thus, while it is associated with success in the
system during Study 1, it is not a pattern of behavior that should be encouraged by the system.
Even patterns that are indicative of good strategies, such as “Quiz→ Page-Rel,” do not provide insight
into how to scaffold learners. This pattern, more often exhibited by successful students in Study 1, involves
asking Betty to take a quiz and then accessing a relevant page in the resources. Students employing this pattern
may be using quiz results to discover potential mistakes in their map and then looking up related information.
However, this interpretation of the pattern is not conclusive. It is just as likely that these students took a quiz
and then viewed a page related to an action they executed before asking Betty to take a quiz. The loss of
context makes it hard to come to definitive conclusions about the meaning of a pattern or how to incorporate
any particular pattern into a scaffolding strategy. In addition, these analyses considered the occurrence of a
page access without considering its length. So, for example, the “Page-Rel” action could have been anywhere
from a fraction of a second to 45 minutes. This further obscures the true meaning of the detected behavior
patterns. The HMM and sequence mining methods are also limited by the large amounts of data upon which
they rely; the analyses presented here used multiple students’ data from completed studies to construct HMMs
and frequent sequence lists. It would be difficult for these algorithms to dynamically analyze a single student’s
behavior in order to diagnose their strengths and weaknesses and inform subsequent scaffolding decisions.
Thus, the analysis techniques used here suffer from problems related to both interpretability and the online
analysis of student behavior.
Another important limitation in the studies presented above relates to the data that was actually collected.
At the beginning and end of these studies, students were tested on their understanding of causal reasoning
and the science topics under study. However, they were not tested on their understanding of several skills
important for success in Betty’s Brain. For example, the results of Study 2 suggest that students receiving
contextualized conversational feedback employed better problem solving strategies; they interspersed read-
ing, map building, and map checking more often than students in the PA group. However, it is just as likely
that their success in the system was mainly due to the direct hints they received from Mr. Davis. Without
51

any data directly testing CC group students’ understanding of relevant skills and strategies, it is hard to draw
conclusions about these two competing hypotheses. For example, knowing that CC group students were more
effective at identifying causal links from reading materials would provide a much clearer understanding of
whether or not these students understood how to complete the Betty’s Brain task.
The results of Study 1 show that several students struggled to succeed in Betty’s Brain, with many students
creating inaccurate causal maps. More often than not, these students’ map edits were incorrect, and their
actions were more often not related to recent actions. Unfortunately, the data analysis failed to uncover
the fundamental reasons explaining this poor performance. It may be that the students understood how to
complete the Betty’s Brain task but chose not to exert the effort necessary. However, it is just as likely that
these students experienced high levels of confusion and frustration as they struggled to set meaningful goals
and create effective plans. They may have disengaged from the task because they were unsure of how to
proceed, and their resulting problem-solving behaviors were not driven by the goal of succeeding. Testing
students’ skill proficiencies would help discern the sources of students’ difficulties. It may be that certain
students are not prepared to succeed at independent and complex problem-solving tasks without support (as
discussed in Chapter 1). For example, students may not understand the meaning of increase and decrease
links or the causal reasoning language used in Betty’s Brain. Similarly, they may not know effective methods
for identifying causal links from text passages and for using the quiz feature to determine which sections of
the causal map are correct and incorrect. Students with such low prior knowledge may be better served by
engaging in activities that help them learn the skills they need to succeed in Betty’s Brain.
To address these limitations, the remainder of this dissertation develops and tests novel methods for
interpreting learner behaviors in OELEs in real-time during students’ problem solving activities. The in-
terpretation method, called Coherence Graph Analysis and presented in Chapter 4, preserves the context of
students’ actions. This interpretation method is then used to drive a novel three-stage scaffolding strategy
for OELEs described in Chapter 6. The strategy observes student performance, maintains estimates of their
understanding of skills important for success in Betty’s Brain, actively diagnoses the causes of their poor
performance, and provides scaffolds that offer opportunities for self-correction and, when necessary, require
students to engage in skill building exercises.
52

CHAPTER 4
The Coherence Graph Analysis Approach to Learner Modeling in OELEs
As mentioned in Chapter 2 and illustrated in Figure 2.1, learner modeling describes the process by which
the scaffolding agent measures and represents various aspects of learners, such as their performance and
behavior, by observing their actions while using the system (Wenger, 1987). The learner modeling module
is an important component of a scaffolding agent; its purpose is to interpret students’ discrete actions within
the OELE and create a model of the learner that serves as input to the pedagogical function.
This chapter proposes a novel Coherence Graph Analysis (CGA) approach to learner modeling in OELEs.
CGA represents student actions based on their effectiveness in moving the student toward the correct solution,
the amount of potential they generate, and how this potential supports or contradicts students’ future actions.
The resulting coherence graph represents the “what” of students’ problem-solving activities. To formulate
potential reasons that explain students’ behaviors, the learner modeling approach presented in this chapter
combines CGA with a set of knowledge component confidence values (described in Section 2.1) representing
the scaffolding agent’s confidence in the student’s mastery of skills that are important for success in the
system. Together, these measures create a comprehensive understanding of students’ mastery of important
skills as well as their problem-solving behaviors while using the system.
4.1 Characterizing Problem Solving Processes in OELEs: Task and Process Models
In order to assess students’ learning behaviors in OELEs, a scaffolding agent requires methods for interpreting
students’ discrete actions and combining those interpretations to make inferences about their problem-solving
approaches. CGA defines a model-based approach to accomplishing this task that utilizes a task model and
a corresponding process model of the learning processes needed for success in OELEs, and it then utilizes
those models to define assessment metrics for measuring students’ skill levels and behaviors. The goal of
creating these models is to:
1. Enumerate the cognitive and metacognitive processes in which we expect learners to engage; and
2. Describe the relationships between and among these processes in the context of the learning task to
propose a comprehensive task model for OELEs.
As discussed in Chapter 2, learners working in OELEs employ cognitive processes related to accessing
and interpreting information, applying that information to the construction of problem solutions, and assess-
ing the quality of constructed solutions using automated assessments included within the OELE (Clarebout
53

Figure 4.1: Metacognitive process model for OELEs.
and Elen, 2008; Land et al., 2012; Land, 2000). In addition, they need to employ metacognitive processes
for selecting goals, creating plans to achieve those goals, monitoring and controlling their learning as they
execute plans, and reflecting on the effectiveness of their approach as they evaluate their learning progress
(Schraw et al., 2006; Winne, 2001; Veenman, 2011; Schraw and Moshman, 1995; Whitebread and Cardenas,
2012). These metacognitive processes result in a set of self-instructions (i.e., the learner’s plan) that are
executed at the cognitive level and metacognitively monitored and controlled at the meta level (Veenman,
2011). As mentioned in Chapter 2, metacognitive control may result in modifications to the current plan as it
is being executed. These processes and their relationships have been incorporated into a process model and a
corresponding task model, shown in Figures 4.1 and 4.2, respectively.
The process model contains the three broad stages of metacognitive regulation discussed in Chapter 2:
orientation & planning, enactment & learning, and reflection & self assessment. Students may start by orient-
ing themselves to the task and formulating task understanding. A student’s task understanding is necessarily
influenced by her metacognitive knowledge about her own abilities and the strategies she has for completing
a chosen task (Veenman, 2013). Together, these two sources of information, task knowledge and metacogni-
tive knowledge, provide a foundation that governs students’ subsequent goal-setting and planning processes.
While in this stage, students may go back and forth between planning and goal setting if, during planning,
they think of a new approach to completing their task.
Once a plan has been specified, students begin executing it. As they carry out the activities specified in
their plan, students may exercise metacognitive monitoring as they consciously evaluate the effectiveness of
their plan and the success of the activities they are engaging in. The result of these monitoring processes
may lead students to exercise metacognitive control by abandoning or modifying their plan as they execute it.
Once a plan has been completed or abandoned, students may or may not engage in reflection as they analyze
the effectiveness of their plan. Such reflection may lead students to update their metacognitive knowledge
and task understanding.
54
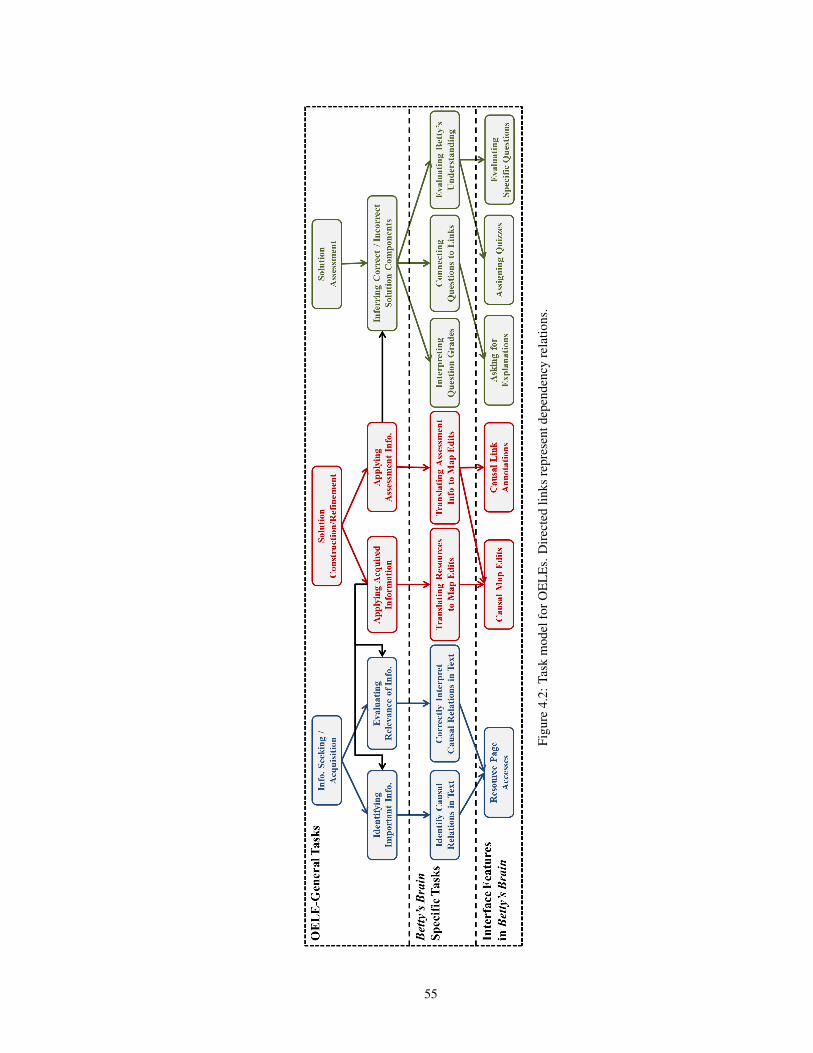
Figu
re4.
2:Ta
skm
odel
forO
EL
Es.
Dir
ecte
dlin
ksre
pres
entd
epen
denc
yre
latio
ns.
55

Whereas the process model illustrates how learners operate at the metacognitive level, the task model
specifies the tasks important for achieving success in Betty’s Brain. To construct this model, we performed
a detailed task driven analysis (similar to cognitive task analysis; Chipman et al. 2000) to derive the primary
tasks that students need to complete to succeed in OELEs and the processes students must be able to execute
in order to complete those tasks. The task model defines three broad classes of OELE tasks related to: (i)
information seeking and acquisition, (ii) solution construction and refinement, and (iii) solution assessment.
Each of these classes of tasks is further broken up into three levels representing: (i) general tasks that are
common across all OELEs (according to the definition of OELE discussed in Chapter 1); (ii) Betty’s Brain
specific instantiations of these tasks; and (iii) interface features through which students can accomplish their
tasks.
The directed links in the task model represent dependency relations. Information seeking and acquisition
tasks depend on one’s ability to identify and evaluate the relevance of information. Solution construction and
refinement tasks depend on one’s ability to apply information gained from both the information seeking tools
and the solution assessment results to constructing and refining the solution in progress. Finally, solution
assessment tasks depend on the learner’s ability to interpret the results of solution assessments as actionable
information that can be used to refine the solution in progress. In order to accomplish these general tasks in
Betty’s Brain, students must understand how to perform the related Betty’s Brain specific tasks by utilizing
the system’s interface features. For example, learners’ ability to infer which of their solution components
(i.e. causal links on Betty’s map) are correct and incorrect depends on their ability to interpret question
grades, connect a question to the causal links that were used to answer the question, and evaluate Betty’s
understanding. Accomplishing these tasks requires using the Betty’s Brain features that allow learners to: (i)
ask Betty to take quizzes and explain answers, and (ii) ask Mr. Davis to evaluate the correctness of Betty’s
most recent answer to a question.
Identifying and evaluating the relevance of important information describes the processes students em-
ploy as they observe, operate on, and make sense of the information presented in an OELE’s information
acquisition tools (Land, 2000; Quintana et al., 2004). Productively employing these processes requires an un-
derstanding of how to identify critical information and interpret it correctly. While learning in Betty’s Brain,
students need to identify reading materials that describe causal relations between entities in the problem do-
main. They must then correctly interpret those relations and integrate them with their internal knowledge
structures in order to create an accurate mental model. Such processes can be difficult for learners; they
may not have a firm grasp of causal reasoning structures and representations, or they may have difficulty in
extracting the correct causal relations from the nuanced, technical writing style typical of science texts (Mc-
Namara, 2004). Further complications exist when the information contained in the resources conflicts with
56

or challenges learners’ naıve or inaccurate understandings of the problem domain. Land (2000) explains that
in such situations, learners are resistant to restructuring their knowledge; instead they often misinterpret the
information in a way that supports their original conceptions.
When constructing problem solutions, learners utilize their developing understanding of the problem
domain to make decisions about how to construct solutions. Productively employing these processes requires
an understanding of: (i) the structure of problem solutions; (ii) the tools available for constructing solutions;
and (iii) methods for translating one’s understanding of the problem domain and solution requirements into
plans for solution construction. In Betty’s Brain, solutions take the form of a causal map constructed using a
visual interface that provides tools for adding, removing, and editing concepts and causal links. Accurately
constructing a causal map requires representational fluency (Suh and Moyer, 2007) in order to convert causal
information between and among the system’s hypertext resources, the student’s internal knowledge structures,
and the causal map repreesntation. Students unfamiliar with causal structures or how to represent knowledge
using them will most likely struggle to succeed in completing the Betty’s Brain learning task (Segedy et al.,
2013b; Roscoe et al., 2013).
Assessing the quality of constructed solutions describes the processes students employ as they submit their
solutions to automated tests within the system and interpret the resulting feedback. Productively employing
these processes requires understanding the structure and meaning of the feedback. While some systems
provide easily interpretable feedback (e.g., “Your solution is wrong because it does not describe how fish
affect algae”), others provide less direct feedback on the quality of a solution. In Betty’s Brain, learners
receive feedback in the form of Betty’s quiz results: a list of questions that are either addressed appropriately
by the model, not addressed by the model, or addressed incorrectly by the model. Learners are expected
to use this information to determine which of their causal links are correct, which are incorrect, and what
information is missing. This requires understanding how to interpret question grades, identify the causal
links used to generate an answer, and obtain assessment information via quizzes and question evaluations. If
students do not understand the relationship between a question, its quiz grade, and the links used to answer
it, then they will most likely experience difficulty in obtaining meaningful information from quizzes.
The presented models of learning in OELEs identify and draw connections between and among the cog-
nitive and metacognitive processes critical for learning in such environments. Students need to leverage their
metacognitive knowledge and task understanding in order to select intermediate goals for completing their
tasks and then create plans for coordinating their use of skills and strategies in service of achieving those
goals. Creating these plans requires understanding the purposes of and relationships between the tasks iden-
tified in the task model. Effective plans will utilize information gained from both information acquisition and
solution assessment activities in order to build and refine a causal map that more closely approximates the
57
ideal solution. Executing these plans requires proficiency in executing the tasks that make them up. Because
students are likely to make mistakes in constructing their solutions, they need to understand how to utilize
the results of solution assessments to direct their thinking as they reflect on the source of their errors.
Overall, these two models imply that in order to properly support learners in OELEs, scaffolding agents
require methods for interpreting and assessing students’ learning behaviors in relation to the tasks listed in the
task model. A significant challenge in developing these interpretation methods is the ambiguity of students’
observable uses of the system’s interface features. As noted by Veenman (2013), students’ observable actions
do not reveal the metacognitive activities that generated them, and inferences about a students’ metacognitive
activities must be based on indicators derived from students’ learning activities. To improve these inferences,
scaffolding agents require additional information about the learner they are observing. The CGA-based
learner model represents this additional information as a set of knowledge component confidence values that
represent the scaffolding agent’s confidence in the student’s mastery of skills that are important for success
in the system. These knowledge component confidence values are discussed next.
4.2 Representing Skill Levels in Betty’s Brain
As discussed in the previous section, a student’s success in Betty’s Brain relies on her skillfulness in complet-
ing tasks related to information seeking and acquisition, solution construction and refinement, and solution
assessment. Such skillfulness draws from both her task understanding and metacognitive knowledge related
to how and when such tasks should be accomplished. In order for the scaffolding agent to make inferences
about potential reasons underlying students’ successful and unsuccessful behaviors while using Betty’s Brain,
it requires methods by which it can estimate the student’s skillfulness. This section discusses the learner
modeling module’s representation of students’ skillfulness in completing Betty’s Brain tasks. In all cases, the
skills presented here were derived via the task driven analysis mentioned previously.
4.2.1 Causal Reasoning Skills
The previous section discussed the importance of understanding the causal map modeling language. When
learners understand causal maps and how to reason with them, they should be better able to translate their
understanding of the problem domain into the causal map representation. To assess learners’ understanding
of these skills, the learner modeling module incorporates a set of knowledge component confidence values
that represent the scaffolding agent’s confidence in the learner’s ability to reason with causal maps. Correctly
reasoning with a causal map requires an understanding of how to reason with: (i) a single causal relation,
(ii) a chain of causal relations, and (iii) multiple chains of causal relations. To reason with a single causal
relation, learners need to understand how to combine the relationship type (i.e., increase or decrease) with
58

the information in the causal question about how the source concept changes. When expanded out, this can
be expressed as the following four rules:
1. If the source concept causes an increase in the target concept, then an increase in the source concept
will cause an increase in the target concept.
2. If the source concept causes an increase in the target concept, then a decrease in the source concept
will cause a decrease in the target concept.
3. If the source concept causes a decrease in the target concept, then an increase in the source concept
will cause a decrease in the target concept.
4. If the source concept causes a decrease in the target concept, then a decrease in the source concept
will cause an increase in the target concept.
These rules can confuse inexperienced learners. One reason for this is that the causal relation captures a
change rather than an absolute relation. In other words, when one reasons with a causal link, an increase or
decrease in the source concept implies a change from a previous value. This is often not apparent to the novice
learner. As a result, learners may struggle to understand why, in Rule 2, the target concept decreases despite
the fact that there is still some of the source concept to increase it. For example, if plants produce oxygen
and the number of plants decreases, then the remaining plants will still produce oxygen. Thus, oxygen is
still increasing. However, since the causal relation models a change from a previous value, the rate at which
oxygen will now increase decreases.
To reason with a chain of causal relations (e.g., A increases B, and B increases C), learners must apply
single-link reasoning to each link in the chain and use the output of one reasoning step (e.g., calculating the
effect of A on B) as the input to the next reasoning step (e.g., calculating the effect of B on C). For example,
Figure 4.3 displays an abstract causal map with 12 concepts and 14 links. To answer the question “If F
increases, what happens to L,” learners must apply the following steps:
1. Apply rule #3 from the previous list to infer that an increase in F will cause a decrease in J.
2. Apply rule #2 from the previous list to infer that a decrease in J will cause a decrease in L.
To reason with multiple chains of causal relations (e.g., to use the map in Figure 4.3 to answer the question
“If B increases, what happens to L?”), learners need to understand how to first derive the effect of each chain
of relations and then combine the effects of each chain into a final answer according to the following three
rules:
59

Figure 4.3: An example causal map with abstract concepts.
1. If the effect of every chain is increase, then the final answer is increase.
2. If the effect of every chain is decrease, then the final answer is decrease.
3. If the effect of some chains is increase and the effect of other chains is decrease, then the final answer is
it depends, since the map does not contain the quantitative information necessary to determine whether
the overall effect of the positive chains is greater than the overall effect of the negative chains, or vice
versa.
This set of skills is summarized in Table 4.1. The learner modeling module uses information gleaned
from students’ problem solving activities to estimate their ability to correctly apply each of these skills.
In the three-stage scaffolding strategy presented in Chapter 6, Mr. Davis would sometimes ask learners to
reason with a single decrease link, and he would use the student’s response to either increase or decrease his
confidence in the student’s understanding of that skill1. The details of how skills were measured in the study
designed to test this learner modeling approach are further discussed in Chapter 6.
4.2.2 Assessing Information Seeking Skills
Section 4.1 identified specific skills important for successfully seeking information, including understand-
ing how to correctly identify and interpret information important for solving the problem. To assess students’
1Researchers have proposed several approaches to using a student’s demonstrated understanding (or lack of understanding) to adjusta related knowledge component confidence value. These techniques range from simple thresholds (e.g., having full confidence in thelearner understanding a skill once she has successfully applied the skill n consecutive times; Baker et al. 2011) to more complex methodssuch as Bayesian knowledge tracing (Corbett and Anderson, 1995) and Bayesian network approaches to student modeling (Millan et al.,2010).
60

Skill Example Question Answer1. Reasoning with a single increase link. If B increases, what will happen to D? D will increase.2. Reasoning with a single decrease link. If B increases, what will happen to E? E will decrease.3. Reasoning with a chain of two increase links. If A increases, what will happen to D? D will increase.4. Reasoning with a chain of two decrease links. If C increases, what will happen to K? K will increase.5. Reasoning with a chain of one increase link and one de-
crease link.If B increases, what will happen to I? I will decrease.
6. Reasoning with two chains of links where each chain re-sults in an increase.
If B increases, what will happen to L? L will increase.
7. Reasoning with two chains of links where each chain re-sults in an decrease.
If C increases, what will happen to L? L will decrease.
8. Reasoning with two chains of links where one chain re-sults in an increase and the other results in a decrease.
If A increases, what will happen to L? It depends.
Table 4.1: Skills related to students’ ability to reason with a causal map. Example questions and answersrefer to the causal map displayed in Figure 4.3.
understanding of these skills, the learner modeling module generates a set of measures that represent the scaf-
folding agent’s confidence in the learner’s ability to identify causal relations from text passages of multiple
complexity levels. Each text passage that describes a causal link is characterized by its presentation, voice,
and the source effect (i.e., whether the causal relation is described in terms of what happens when the source
concept increases or decreases)2. The learner modeling module tracks the learner’s proficiency in correctly
identifying the causal relation in ten types of text passages (examples of each type are listed in Table 4.2).
A text passage presents a causal link using the standard presentation when it specifies the link in terms of
the effect of increasing or decreasing the source concept. For example, the sentence “Friction generates heat”
describes the effect of an increase in the source concept, friction; when the amount of friction increases, so
does the amount of heat. The same causal relation is specified via the if-then presentation as follows: “When
friction increases, heat increases.” The then-if presentation is the opposite, and is specified as follows: “Heat
increases when friction increases.” To be successful in constructing the correct causal model in Betty’s Brain,
students must be able to recognize causal relations in all three of these presentation formats.
A text passage is active if it uses the active voice to describe the causal relation. For example, the sentence
“Vegetation decreases carbon dioxide” is active, and the sentence “Carbon dioxide is decreased by vegeta-
tion” is passive. Additionally, text passages can describe a causal relation in terms of an increase or a decrease
in the source concept. For example, the sentence “Cats decrease milk” describes the effect of increasing cats.
Thus, the sentence’s source effect is “increase.” Conversely, the text passage “A decrease in cats increases
milk” describes the effect of decreasing cats, and the source effect of this sentence is “decrease.”
The causal map language employed in Betty’s Brain requires students to translate causal relations into a
2The characterizations of text passages were derived by analyzing the hypertext resources of all currently-available Betty’s Braininstructional units and classifying the set of text passages that present a causal relationship. The classification presented here representsa subset of all possible methods for expressing the causal relationships used in Betty’s Brain. However, the subset is representative ofthe text decoding skills necessary for succeeding in Betty’s Brain.
61

Presentation Voice Source Effect ExampleStandard Active Increase Ticks increase tacks.Standard Active Decrease A decrease in ticks decreases tacks.Standard Passive Increase Tacks are increased by ticks.Standard Passive Decrease Tacks are decreased by a decrease in ticks.If-Then Active Increase When ticks increase, tacks increase too.If-Then Passive Increase When ticks are increased, tacks are increased too.If-Then Active Decrease When ticks decrease, tacks decrease too.Then-If Active Increase Tacks increase when ticks increase.Then-If Active Decrease Tacks decrease when ticks decrease.Then-If Passive Increase Tacks are increased when ticks are increased.
Table 4.2: Examples of text passages that describe the causal relation “Ticks increase tacks.”
form close to that of standard presentation, active voice, and specified as an increase in the source concept.
Passages that are in other presentation formats (e.g., if-then), are in the passive voice, or that describe a causal
relation in terms of a decrease in the source concept bear less resemblance to the format required by the causal
map language. Thus, when students encounter these passages, they need to understand how to translate them
into the equivalent “standard, active, increase” form in order to teach them to Betty. By characterizing text
passages according to presentation, voice, and source effect, the learner modeling module is able to estimate
students’ ability to infer causal links from the ten different types of text passages listed in Table 4.2.
4.2.3 Assessing Solution Assessment Skills
Section 4.1 also discussed the importance of understanding the structure and meaning of Betty’s quiz results.
When learners understand how to use quiz results to infer which causal links are correct and which are
incorrect, they should be better able to direct their future reading and map editing efforts. To assess learners’
understanding of these skills, the learner modeling module generates measures that represent the scaffolding
agent’s confidence in the learner’s ability to use quiz results to infer information about the correctness of
causal links in Betty’s map. In the version of Betty’s Brain used in Study 3 (discussed in Chapter 6), the quiz
algorithm was modified such that each of Betty’s answers were graded as one of the following: (i) correctly-
answered questions: questions that Betty answers using the same set of causal links as used by the expert
map; (ii) incompletely-answered questions: questions that Betty answers using some, but not all, of the causal
links used by the expert map; and (iii) incorrectly-answered questions: questions that Betty answers using at
least one causal link not used by the expert map. Thus, students must understand how to interpret questions
in each category as they evaluate Betty’s quiz results.
The set of solution assessment skills tracked by the learner modeling module are listed in Table 4.3. When
a question is correct or incomplete, every link that Betty used to answer that question is also correct. When
a question is incorrect, at least one of the links used to answer that question is also incorrect. If the incorrect
62

Skill1. Interpreting a correct one-link answer2. Interpreting a correct multi-link answer3. Interpreting an incomplete one-link answer4. Interpreting an incomplete multi-link answer5. Interpreting an incorrect one-link answer6. Interpreting an incorrect multi-link answer with one unknown link7. Interpreting an incorrect multi-link answer with more than one unknown link8. Interpreting two multi-link answers with overlapping links, one correct and one incorrect9. Interpreting two multi-link answers with overlapping links, one incomplete and one incorrect
Table 4.3: Skills related to students’ ability to interpret quiz results.
question uses some links that are known to be correct, then the learner can use that information to narrow
down the set of potentially incorrect links. For example, if the learner encounters a quiz question that Betty
answered incorrectly, then she can ask Betty to explain her answer. If the learner then notices that all but
one of the links used in Betty’s explanation have already been marked correct, then she can infer that the
unmarked link must be incorrect. The learner modeling module uses information gleaned from students’
problem solving activities to estimate their ability to correctly interpret the results of quizzes. For example,
Mr. Davis may present learners with a hypothetical causal map and set of quiz results and then ask learners to
determine which links are definitely correct, might be incorrect, and are definitely incorrect. In this example,
Mr. Davis then uses the student’s response to either increase or decrease his confidence in learners’ quiz
question interpretation ability.
By keeping track of skills related to learners’ causal reasoning understanding, reading ability, and quiz
interpretation ability, the learner modeling module estimates aspects of students’ task understanding and
metacognitive knowledge, and these estimates can help identify reasons that underly a particular student’s
behavior. When the scaffolding agent notices that a learner is struggling, it can consult these metrics and
the coherence graph representing student behavior (described in the next section). It can then use both of
these sources of information to select pedagogical actions for diagnosing a learner’s skill deficiencies and
providing scaffolds that support the learning of those skills.
4.3 Coherence Graph Analysis
As mentioned previously, assessing students’ metacognitive knowledge is a challenging endeavor. While the
metacognitive process model illustrates how students move between and among goal selection, planning, plan
execution, monitoring, control, and reflection, the learner modeling module only has access to the actions stu-
dents take as they use the system. Thus, it requires systematic analysis techniques for inferring aspects of
learners’ metacognitive knowledge and task understanding using evidence from their activities on the system
(Veenman, 2013). The previous section discussed methods for estimating students’ skillfulness in completing
63

Betty’s Brain tasks. However, students with high levels of skill proficiency may still struggle to regulate
their learning in Betty’s Brain. For example, they may understand how to complete individual tasks without
understanding how to coordinate their skills in service of completing the overall open-ended problem in the
absence of step-by-step guidance. Thus, the learner modeling module also requires methods for representing
students’ choices as they use the system. The Coherence Graph Analysis (CGA) approach addresses this
challenge by combining information from multiple student actions over time to produce measures of coher-
ence. More specifically, CGA evaluates students’ actions based on: (i) their effectiveness in moving them
toward the correct solution; (ii) the amount of potential (i.e., useful information) they generate; and (iii) how
subsequent student actions are supported (or not supported) by the previously-generated potential.
4.3.1 Effectiveness
The first metric related to student behavior while using the system is the effectiveness of their solution con-
struction actions. Solution construction actions in an OELE are considered effective if they move the learner
closer to their task goal. In other words, effective solution construction actions improve the overall quality of
the solution in progress (i.e., Betty’s causal map). This measure is identical to map edit correctness presented
in Section 3.1:
Definition 4.1 The addition, removal, or modification of a causal link is effective if it improves the causal
map score, which is defined as the number of correct links minus the number of incorrect links in the map.
Low levels of effectiveness may imply that learners do not understand or are not proficient in executing
the cognitive skills described in the previous section. However, effectiveness is only a general measure of
performance, and learners may exhibit low levels of effectiveness for a variety of reasons. They may have
difficulty reading the resources, understanding the causal map structure, or understanding how to interpret
quiz results. Moreover, they may understand how to perform easier tasks (e.g., interpreting the results of a
quiz question that Betty answered with one link) but struggle with more difficult tasks (e.g., interpreting the
results of an incorrect quiz question that Betty answered using four links). When learners exhibit continually
low effectiveness, the pedagogical agent may intervene in order to directly assess and scaffold students’
understanding of these skills. In doing so, it may ask learners to answer questions and solve problems and
then use learners’ responses to update the cognitive process confidence measures (see footnote 1).
4.3.2 Coherence, Support, and Potential
CGA analyzes student behavior according to information generated by their actions and whether or not this
information is utilized during subsequent actions. When students take actions that put them into contact with
64

helpful information (e.g., by reading the resources or viewing quiz results), they have generated potential that
should motivate future actions. The assumption is that if students are able to recognize the information in
the resources or quiz results, then they are expected to act on that information. If they do not, CGA assumes
that they did not recognize or understand the importance of the information. This may stem from incomplete
or incorrect task understanding and/or metacognitive knowledge. Additionally, when students edit their map
without encountering any helpful information that is relevant to the map edit, CGA assumes that they are
guessing. These two notions come together in the definition of coherence:
Definition 4.2 Two actions (x,y) taken by a student in an OELE are said to be coherent if the second action,
y, logically follows from information generated by the first action, x (denoted as x⇒ y). In this example, x
provides support for y, and y is supported by x. Should a learner execute x without later executing y, the
learner has created unused potential. Note that actions x and y need not be consecutive.
The task model (Figure 4.2) illustrates two critical coherence relations related to solution construction:
(i) applying information from the resources to editing the map; and (ii) applying inferred link correctness
information to editing the map. More specifically, an information seeking action (e.g., reading about a causal
relationship) may generate support for a future solution construction action (e.g., adding that causal relation-
ship to the map). Similarly, a solution construction action can be supported by information produced during
solution assessment. This latter scenario occurs in Betty’s Brain when a student deletes a causal link from
their map after Betty uses that link to answer a quiz question incorrectly.
CGA assumes that learners with higher levels of coherence among their actions possess stronger metacog-
nitive knowledge and task understanding. Thus, these learners will perform a larger proportion of supported
actions and take advantage of a larger proportion of the potential that their actions generate.
In this dissertation research, CGA incorporates the following coherence relations:
1. Mr. Davis telling the student to read a page in the resources⇒ accessing that page.
2. Accessing a resource page that contains a hyperlink to another resource page⇒ accessing the hyper-
linked page.
3. Accessing a set of resource pages that discuss two concepts that are directly connected in the expert
map but not in the user’s map or that have an incorrect link between them ⇒ adding, removing, or
editing a causal link that connects those concepts.
4. Taking a quiz in which at least one question is incorrect⇒ accessing pages that discuss the concepts
mentioned in the incorrect questions.
65

5. Taking a quiz in which at least one question produces new information concerning a section of the
causal map⇒ asking Betty to explain her answer to that question to see its associated links.
6. Encountering evidence that a specific causal link is correct⇒ adding that causal link to the map (if not
present) and annotating it as being correct.
7. Encountering evidence that a specific causal link is incorrect (or might be incorrect)⇒ deleting it from
the map (if present).
In Betty’s Brain, learners may encounter evidence about the correctness of a causal link through any of
the following methods:
1. They may ask Betty to take a quiz in which she answers a question using only one causal link. In this
case, a correct or incomplete grade proves that the link is correct and an incorrect grade proves that the
link is incorrect.
2. They may view the causal links that Betty used to answer a question that Mr. Davis has graded as
correct or incomplete. When Betty answers a question correctly or incompletely, all of the links she
used to answer that question are also correct. Thus, when students view the causal links used to answer
a correct or incomplete question, they generate correctness information for each link that contributed
to Betty’s answer.
3. They may view the causal links that Betty used to answer a question that Mr. Davis has graded as
incorrect. When Betty answers a question incorrectly, at least one of the links she used to answer that
question is incorrect. If Betty uses n links to answer a question incorrectly and n−1 of them have been
proven correct, then the learner can infer that the remaining link is incorrect.
4. They may employ a guess and check strategy (Segedy et al., 2011b), in which they have Betty take a
quiz, note her quiz score, make a single change to the causal map, and have Betty take a second quiz.
If the second quiz’s score is higher or lower than the first quiz’s score, then students can infer that their
recent causal map edit was correct or incorrect, respectively.
Low levels of coherence may indicate that learners do not possess the metacognitive knowledge or task
understanding necessary for generating coherent plans. However, like effectiveness, coherence is only a
general measure of performance, and learners may exhibit low levels of coherence for a variety of reasons.
They may not understand: (i) the coherence relations, (ii) the related cognitive processes, or (iii) the domain
content. For example, when students have a misconception, they may add an incorrect link to their map due to
66

their incorrect prior knowledge (Segedy et al., 2011b). During solution assessment, they may obtain evidence
that the link is incorrect and then delete it. However, in deleting the link, they may not restructure their own
understanding of the problem domain, and, as a consequence, their established misconception may lead them
to add the same incorrect link at a later point in time. To detect learners’ domain knowledge misconceptions,
the learner modeling module also employs measures of incoherence.
4.3.3 Incoherence and Negative Support
Coherence metrics measure whether or not learners’ actions take advantage of information encountered dur-
ing previous actions on the system. To measure whether or not a learner’s actions contradict the information
generated during previous activities, CGA also produces measures of incoherence.
Definition 4.3 Two actions (x,y) taken by a student in an OELE are incoherent if the second action, y, is
coherent with information that is the negation of information generated by the first action, x (denoted as
x ; y). In this example, x provides negative support for y, and y is contradicted by x.
CGA assumes that learners with higher levels of incoherence among their actions possess a weaker un-
derstanding of the domain and the relations between different concepts in the domain. In this dissertation
research, CGA incorporates the following four incoherence relations:
1. Encountering evidence that a specific causal link is correct ; deleting that causal link from the map.
2. Encountering evidence that a specific causal link is correct ; removing its correctness annotation.
3. Encountering evidence that a specific causal link is incorrect ; adding that causal link to the map.
4. Encountering evidence that a specific causal link is incorrect ; annotating it as being correct.
To track students’ incoherence, the learner modeling module includes a set of incoherence measures,
one for each causal link added by the student, that represents the agent’s confidence that the learner may
require support in restructuring their understanding of the domain material represented by a specific causal
link. When learners perform actions for which they have generated negative support in relation to a particular
causal link, the scaffolding agent increases its confidence that the learner requires support in understanding
that link (see footnote 1).
4.3.4 Coherence Graphs: Representing Effectiveness and Coherence in Betty’s Brain
In order to organize and represent learners’ actions as they use Betty’s Brain, CGA constructs and maintains a
coherence graph consisting of nodes that represent learner actions and directed links that illustrate coherence
67

relations among actions. Coherence graphs include two types of nodes: (i) actuated nodes that represent
actions that the learner has executed on the system, and (ii) potential nodes that represent actions that the
learner has not executed, but for which she has created either positive or negative support3. They also include
three types of directed links: one representing temporal relations among actuated nodes, one representing
positive support, and another representing negative support. Figure 4.4 shows a coherence graph of the first
ten actions executed by a learner using Betty’s Brain to learn about human thermoregulation. The left-hand
column displays the ten actuated nodes, executed in order from top to bottom, and the right-hand column
displays seven potential nodes. The first five potential nodes have positive support, and the last two have
negative support.
In this example, the learner begins by accessing a resource page describing homeostasis. Because this
page does not describe any causal links, no potential is generated. The learner then accesses a page about
body temperatures, which indicates that body temperature is an important aspect of how the body detects
cold temperatures. Thus, by reading this page, the learner has generated support for reading more about
cold temperatures, and a corresponding potential node is added to the unused potential column. The learner
then accesses another page describing blood flow to the skin, and this generates support for reading the page
describing blood vessel constriction. Following this, the learner has Betty take a quiz. Because the learner
has not taught Betty any information yet, she is unable to answer any of the questions, and the quiz does
not produce information about correct or incorrect links. The questions in the quiz mention the concepts
cold temperatures, hypothalamus response, and heat loss. Thus, the quiz generates support for reading about
these concepts. The learner then accesses the dictionary page discussing the hypothalamus response, an
action supported by the most recent quiz. When this happens, the potential node Access Resource Page:
Hypothalamus Response becomes an actuated node. As the learner continues executing actions in the system,
actuated nodes are added to the coherence graph along with their associated coherence relations and potential
nodes. Actuated node #9 is a quiz action that provides evidence that the causal link cold temperatures
decrease body temperature is incorrect. Thus, it provides positive support for deleting that link from the
map and negative support for adding it and annotating it as being correct.
The coherence graph provides a comprehensive structure for representing a learner’s actions in Betty’s
Brain. By traversing the graph, the learner modeling module is able to assess learners’ effectiveness, coher-
ence, incoherence, and derivations thereof. For example, the scaffolding agent can traverse the graph in order
to calculate the percentage of causal link deletions that were supported by evidence from Betty’s quiz results.
To assess specific aspects of students’ behavior (e.g., differences in behavior before and after the scaffolding
3The specific implementation of a coherence graph may differ from this description in order to facilitate scalability. For example, inStudy 3 (presented in Chapter 6), no potential nodes were included in the coherence graph. Instead, each node could: (i) dynamicallygenerate and return its associated set of potential nodes; and (ii) evaluate whether or not it supported a given node.
68

Figure 4.4: Coherence graph of the first 10 actions a learner executed in Betty’s Brain while learning aboutthermoregulation. Black links represent temporal links among actuated nodes; green links represent coher-ence relations among actions; red links represent incoherence relations among actions; and actions in theright-hand column have not been executed by the learner.
69

agent supports a student in learning a skill), coherence graphs may be filtered with a set of constraints.
4.3.5 Filtering Coherence Graphs
The coherence graph provides three general filtering mechanisms that the scaffolding agent can use to explore
different aspects of students’ effectiveness, coherence, and incoherence: (i) windowing constraints, (ii) node
property constraints, and (iii) link property constraints. Windowing constraints allow the scaffolding agent
to examine a specific, contiguous, subset of actuated nodes. For example, the agent may want to examine
the learner’s behaviors over the past n minutes or m actions. Alternatively, the agent may want to examine
all actuated nodes that took place after a specific “event of interest.” Node property constraints allow the
scaffolding agent to examine the set of nodes that meet a specified criteria. For example, the scaffolding
agent may want to view all potential nodes with an indegree of at least n or all actuated nodes that represent
the learner’s resource page accesses. Finally, link property constraints allow the scaffolding agent to view a
subgraph that includes only the specified coherence relations. For example, the agent may want to investigate
students’ activities in relation to the evidence-based coherence relations (e.g., coherence relations generated
when students encountered evidence that a causal link was correct or incorrect). By combining these filters,
the scaffolding agent is able to construct complex views of students’ activities and draw comparisons among
multiple views.
An important advantage of coherence graphs is their generality. Modifying the information contained in
a coherence graph only requires specifying new coherence and incoherence relations, and creating filters for
new node and link properties is straightforward. Thus, coherence graphs and algorithms for traversing them
are inherently general, and they can be used to explore learner behavior in a variety of ways and in several
different OELEs. In analyzing data from experiments with Betty’s Brain, it may be useful to explore the
effect of applying different filtering mechanisms on the behavior of the scaffolding agent.
4.4 Summary
This chapter presented a novel learner modeling approach for OELEs that utilizes estimates of students’
skillfulness and coherence graphs to represent learners’ abilities and behaviors while using the system. This
representation extends current approaches to learner modeling in OELEs by explicitly representing a stu-
dent’s performance information (i.e., the correctness of her actions), skill levels, and the coherence of the
student’s actions. This approach leads to a learner model that can be constructed dynamically as students
use the system, and it is more interpretable and actionable than the HMM and sequence mining represen-
tations utilized during the first phase of this dissertation research. By traversing the coherence graph for a
particular student, the learner modeling module can estimate that student’s metacognitive knowledge and task
70

understanding by measuring the amount of potential they generate, the amount of potential they use, and the
number of unsupported causal map edits they execute. Such information may be used by educators to inform
their pedagogical decisions in relation to each student because it can be used to create meaningful summaries
of each student’s activities.
The cognitive skill confidence values updated as the student uses the program or solves problems posed
by the scaffolding agent provide additional insight into the reasons for students’ behaviors. For example,
students may execute solution construction actions that both have support from recent resource page accesses
and are also not effective. This may be indicative of students who have high task understanding but have not
yet mastered the ability to identify causal relations in text passages. Alternatively, it may be that these students
do not understand the causal reasoning language used in Betty’s Brain. The cognitive skill confidence values
help clarify this issue, especially if they show that the learner is proficient in causal reasoning but struggles
to identify relations in text passages.
Coherence relies on interpreting student behavior in terms of generating and using potential. To accurately
analyze coherence among student actions, CGA requires an understanding of what the learner is focusing on.
In the versions of Betty’s Brain used during the first phase of research (presented in Chapter 3), students
can simultaneously view quiz results, the current causal map, and the resources. This greatly limits the
information available to the learner modeling module. In particular, the current interface makes it difficult
to determine: (i) how long the learner actively engages with a particular source of information (e.g., a quiz
or resource page); and (ii) when the learner’s attention shifts from one source of information to another.
To address this and other limitations of the Betty’s Brain software, the Betty’s Brain interface and system
architecture were completely redesigned. The next chapter discusses these changes in detail.
71

CHAPTER 5
A New System Architecture for Betty’s Brain
A significant component of this dissertation research involved redesigning the Betty’s Brain software. The
entire code-base was restructured in order to create: (i) a core architecture upon which multiple educational
technology applications can be constructed; (ii) a host of new system capabilities necessary for the imple-
mentation of CGA; (iii) a behavior tree implementation of the software agents that interact with students in
Betty’s Brain; and (iv) a redesigned interface that conforms to the requirements of CGA and the adaptive
scaffolding strategy used as part of Study 3 (presented in Chapter 6). The redesign and restructuring of the
software was a collaborative effort involving multiple members of the Teachable Agents Research Group at
Vanderbilt University1.
5.1 The CAILE Software Architecture
The Choice-Adaptive Intelligent Learning Environment (CAILE) software architecture (Figure 5.1) provides
a general, flexible architecture for building CBLEs. CAILE applications are organized into two primary lay-
ers: one of modules and another of service providers (SPs; Schmidt et al. 2000). Modules are independent
functional components organized into a set of controllers that: (i) manage data models and their views; and
(ii) provide read-only access to their data through services. Thus, their organization is similar to the “Model-
View-Controller” design pattern (Gamma et al., 1994). SPs are also independent functional components, but
they include neither views nor controllers. The services provided by both modules and SPs are available to
and shared by all other modules and SPs in the system. In the CAILE architecture, services allow modules
and SPs to access shared data, access components of the external execution environment (e.g., persistent
storage), and communicate with other modules. Each of these layers are encapsulated within one Applica-
tion Module, which coordinates the application life cycle and provides a view of the entire application. To
facilitate flexibility and generality, CAILE applications are further organized into units, which combine the
main application with lesson content and condition-based functionality. This allows CAILE applications to
operate with different lessons (e.g., climate change and thermoregulation) and experimental manipulations
(e.g., different tutoring strategies).
Figure 5.2 shows Betty’s Brain organized as a CAILE application with seven modules and seven SPs.
To simplify the figure, the controllers and data models have been excluded from modules. The agent con-1Brian Sulcer served as lead software designer for the restructuring. He and I worked closely over a 20-month period to design and
implement the new system and ensure that it would meet the requirements of CGA and the new scaffolds that were needed in the system.During implementation, he and I split most of the work. We were supported in this effort by John Kinnebrew, Kirk Loretz, and SatabdiBasu.
72
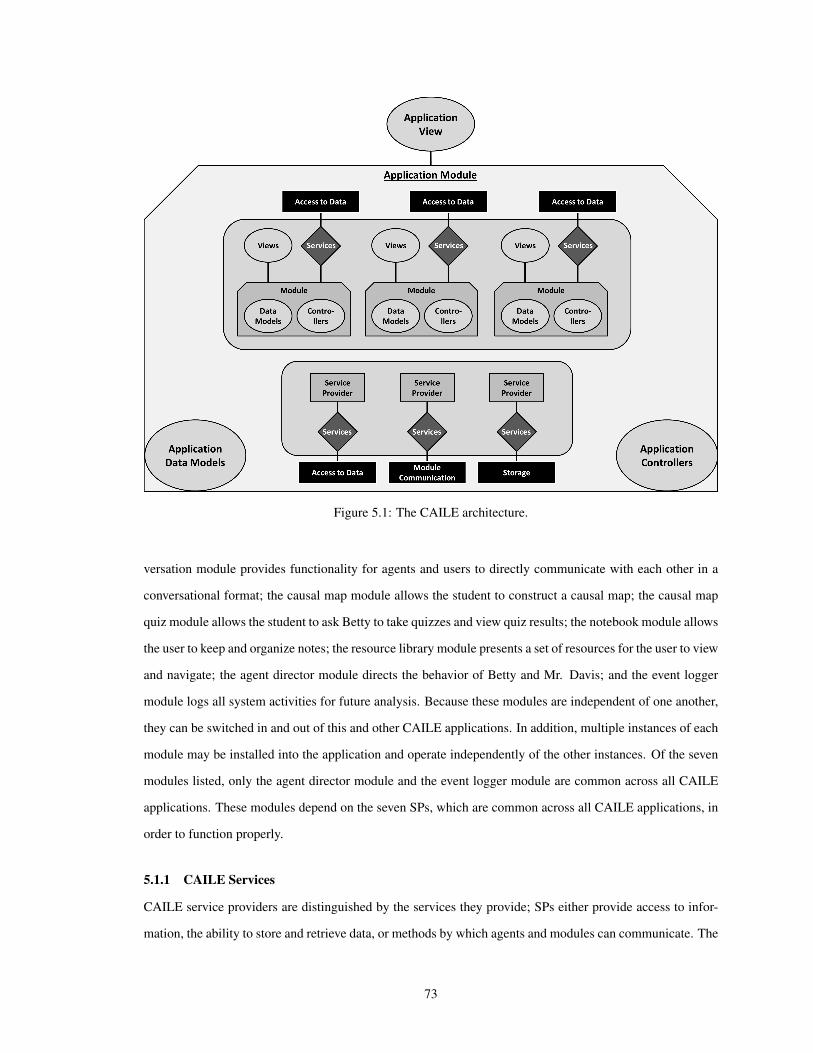
Figure 5.1: The CAILE architecture.
versation module provides functionality for agents and users to directly communicate with each other in a
conversational format; the causal map module allows the student to construct a causal map; the causal map
quiz module allows the student to ask Betty to take quizzes and view quiz results; the notebook module allows
the user to keep and organize notes; the resource library module presents a set of resources for the user to view
and navigate; the agent director module directs the behavior of Betty and Mr. Davis; and the event logger
module logs all system activities for future analysis. Because these modules are independent of one another,
they can be switched in and out of this and other CAILE applications. In addition, multiple instances of each
module may be installed into the application and operate independently of the other instances. Of the seven
modules listed, only the agent director module and the event logger module are common across all CAILE
applications. These modules depend on the seven SPs, which are common across all CAILE applications, in
order to function properly.
5.1.1 CAILE Services
CAILE service providers are distinguished by the services they provide; SPs either provide access to infor-
mation, the ability to store and retrieve data, or methods by which agents and modules can communicate. The
73

Figure 5.2: Betty’s Brain organized as a CAILE application.
agent avatar and session SPs provide access to information; the former provides the names and avatars of
each agent present in the application and the latter provides a unique session identifier and the current time.
The blackboard, persistence, and preference SPs provide access to different types of storage. The blackboard
SP provides a temporary storage space called the blackboard, which is used exclusively by software agents to
store their temporary calculations. The persistence SP provides access to a data storage facility that persists
across sessions with the application; it provides a separate storage space for each combination of user and
unit in the application. The preference SP is similar to the persistence service, but data stored via this service
is available across all units. This allows for application wide preferences, such as the user’s preferred name.
The event bus SP provides a publish/subscribe (Gamma et al., 1994) communication framework through
which agents and module controllers can communicate. Controllers and agents communicate via events; they
publish events to the event bus SP, and they subscribe to the events they are interested in knowing about.
When an event is published, the event bus SP forwards that event on to all interested subscribers. Modules
wishing to communicate with agents or other modules provide protocols (i.e., sets of event specifications) that
describe how they communicate, and CAILE modules typically include two types of protocols: command and
update. Command protocols consist of events that, when published by an agent, represent requests by that
74

agent to make a change to the module’s data or view. For example, the causal map module includes an event
through which agents can request to delete a causal link from the map. Typically, modules allow all requested
changes, and they inform interested subscribers of these changes through update protocols. Thus, whenever
a causal link is deleted from the map (due to processing a command event), an update event describing the
change is published. In CAILE, the user is also represented as an agent. Thus, when the user indicates that
she wants to delete a causal link, a similar command event is published to the event bus SP.
The capability SP provides a simple mechanism through which agents can coordinate their use of mod-
ules. In order to make a change to a module’s data, the agent requesting the change must first acquire an
associated data model capability. When a command event is sent to a module controller, it first checks to see
if the requesting agent has (or can immediately gain access to) the associated capability. If it can, then the
command is accepted and its corresponding update is published. If it cannot, then the command is rejected.
This provides software agents a mechanism through which they can prevent the user from taking certain ac-
tions. If they reserve capabilities associated with specific functionality they wish to block, then the user’s
command events will be rejected. Capabilities can also be used to prevent users from accessing interface
features. Each interface feature is associated with a view capability, and agents can prevent the user from
accessing a particular feature by reserving the associated capability. Note that not all CAILE modules take
advantage of capabilities. In these cases, the module approves each command event it receives and agents
cannot block access to interface features.
Together, these SPs provide several new features that were not available in previous versions of Betty’s
Brain. In previous versions, Betty and Mr. Davis did not have access to persistent storage or methods for
controlling the interface, taking actions within the interface, and blocking the user from taking actions in the
interface. This limited the ability to implement complex scaffolding strategies for Mr. Davis. For example, in
previous versions of Betty’s Brain, his learner modeling module was only based on the information available
to him within a single session. Moreover, since Mr. Davis was unable to prevent the user from taking
actions, he had no way of commanding a student’s attention or requiring her to perform specific actions before
allowing her to continue working on her main task. These implemented changes were absolutely necessary
for developing and incorporating more advanced scaffolding strategies into the Betty’s Brain system.
5.1.2 CAILE Modules
Of the seven modules depicted in Figure 5.1, only the agent director and event logger modules are common
across all CAILE applications. The event logger module is implemented in a simple manner: it subscribes
to all events on the event bus SP and stores them via the persistence SP. The agent director module manages
the operations of all software agents in the system. Software agents in CAILE are represented as a set
75
of sensors, reasoners, and behaviors. Sensors detect events that occur within the application and record
their occurrence on the blackboard. Reasoners analyze information from multiple sensors (as stored on the
blackboard) and record the results of their reasoning on the blackboard. Behaviors view information available
on the blackboard and use it to make decisions on how to act. Behaviors in CAILE agents are organized
into behavior trees (Florez-Puga et al., 2009; Palma et al., 2011), which are a subset of hierarchical finite
state machines that impose additional restrictions on the states and transitions allowed. Nodes in a behavior
tree represent behaviors, and behaviors are composable such that a behavior tree that implements a simple
behavior (e.g., deleting a given causal link from the causal map) can be used within another behavior tree
implementing a more complex behavior (e.g., deleting all causal links from the causal map).
Each behavior in a behavior tree is described by a state that is either invalid, succeeded, failed, or running.
Behaviors in the invalid state have not yet been executed; those in the succeeded state have completed suc-
cessfully; those in the failed state have completed unsuccessfully; and those in the running state are currently
executing. Behaviors can either be actions, conditions, composites, or decorators. Actions are leaf nodes in
the tree, and they result in an agent interacting with a service (e.g., by publishing an event to the event bus SP)
or waiting for an event of interest to take place. Conditions test a condition (usually the value of a variable
stored on the blackboard), and either succeed or fail, accordingly. Conditions may also serve as condition
monitors, which continually test a condition until it does not hold, at which point the condition monitor fails.
Composites are internal nodes that schedule their children for execution, and decorators (Gamma et al., 1994)
add additional functionality to a behavior.
The agent director module currently includes six actions, five conditions, six composites, and two dec-
orators. These base behaviors can be extended in order to create custom behaviors needed in any particular
CAILE application. The six actions include:
1. Publish: the agent publishes an event via the event bus SP.
2. Publish and Wait: the agent publishes an event (usually a command event) via the event bus SP and
then waits for a specific response event (usually an update event).
3. Remove Key: the agent removes a value from the blackboard.
4. Set Key Value: the agent sets the value of a variable on the blackboard.
5. Wait: the agent takes no action for a specified amount of time.
6. Wait for Event: the agent waits until it is notified of a specific event via the event bus service.
The five conditions include:
76

1. Sometimes: a condition that succeeds with a given probability.
2. Value Equals: a condition that succeeds if the given variable on the blackboard matches the given
numeric value.
3. Value Exists: a condition that succeeds if the given variable is currently assigned a value on the
blackboard.
4. Value In Range: a condition that succeeds if the given variable on the blackboard falls within the given
closed numeric range.
5. Value Matches Pattern: a condition that succeeds if the string value for a given variable on the black-
board matches a given regular expression.
The six composites include:
1. Guarded Behavior: a composite behavior consisting of a condition and a behavior. The behavior is
scheduled only if the condition succeeds. If both the condition and behavior succeed, then this behavior
succeeds. It fails otherwise.
2. In Order Selector: a composite behavior that schedules its children for execution in order until one
succeeds. If a child succeeds, the behavior succeeds. If no children succeed, then the behavior fails.
3. Parallel: a composite behavior that schedules all of its children for execution simultaneously. As its
children complete their execution, the parallel behavior accumulates their exit states (i.e., succeeded
or failed) and compares them against a completion policy. If the completion policy is satisfied, any
running children are canceled and the parallel terminates in the appropriate state. If the completion
policy is set to First Fail, then the parallel fails as soon as one of its children fails. If no children fail,
then the parallel succeeds. If the completion policy is set to First Succeed, then the parallel succeeds as
soon as one of its children succeeds. If no children succeed, the parallel fails. If the completion policy is
set to All Fail, then the parallel waits for all children to complete execution and then fails if all children
failed or succeeds otherwise. If the completion policy is set to All Succeed, the parallel waits for all
children to complete execution and then succeeds if all children succeeded or fails otherwise. Finally,
if the completion policy is set to First Finished, the parallel completes as soon as one of its children
completes. If the first child to complete succeeds, so does the parallel behavior. It fails otherwise.
4. Random Selector: a composite behavior that randomly chooses one of its children to schedule for
execution using the given probability distribution. It succeeds if the selected child succeeds, and fails
otherwise.
77

5. Sequence: a composite behavior that schedules its children for execution one at a time and in the given
order. If a child fails, the behavior fails. If all children succeed, then the behavior succeeds.
6. Switch Selector: a composite behavior that schedules one of its children for execution based on the
value of a variable stored via the blackboard service. It succeeds if the selected child succeeds, and
fails otherwise.
The two decorators include:
1. Before and After: schedules the given before and after behaviors for execution before and after the
decorated behavior, respectively. The behavior succeeds only if all behaviors succeed. An after policy
determines what happens when the before behavior fails. If it is set to always, then execution skips
ahead to the after behavior, and, once the after behavior finishes, fails. If it is set to if before succeeds,
then the behavior fails immediately.
2. Repeat: schedules the decorated behavior for execution. Whenever the decorated behavior finishes, it
is reset and scheduled for another execution. This continues indefinitely, and the repeat behavior never
succeeds or fails.
The agent director module executes all agents via an execution cycle, which occurs continuously at a fixed
rate. During each execution cycle, the module executes a sense step, a reason step, and an act step. During
the sense step, all sensors belonging to all agents may write data to the blackboard. Typically, they only
write data to the blackboard if they have sensed new information since the last execution cycle. During the
reason step, all reasoners belonging to all agents may write data to the blackboard. During the act step, the
currently-scheduled behaviors of all agents are executed. If a scheduled behavior is currently in the middle
of executing, it returns the running state and will be revisited during the next cycle. If it is in the invalid state
(meaning that it has been scheduled for execution but has not yet begun executing), then its execution will
begin and it will be revisited during the next cycle. If it is in the succeeded or failed state, it will be removed
from the scheduler and will not be revisited again.
Figure 5.3 shows an example of a partial behavior tree describing some of Betty’s behavior in Betty’s
Brain. The root node is a repeat composite, meaning Betty will continuously schedule the in order selector
node while the application is running. The in order selector schedules each of its children in order, starting
with the guarded behavior on the left. The guarded behavior then evaluates the condition node “User Idle
Time > 6 min.” If the condition evaluates to false, the guarded behavior will fail and the in order selector
will schedule the guarded behavior node on the right. If the “User Requested Conversation” condition also
78

Figure 5.3: A partial behavior tree describing Betty’s behavior in Betty’s Brain.
fails, then the in order selector will fail. At this point, the repeat node will reset and reschedule the in order
selector, which will begin evaluating its children a second time.
Should the user idle time become greater than 6 minutes, the “User Idle Time > 6 min” condition will
succeed, prompting the guarded behavior node to schedule its second child, a before and after decorator.
This decorator then schedules its before behavior, which acquires the program control (via the capability
service). Once it acquires control, it schedules its decorated behavior, which happens to be another before
and after decorator. The second before and after decorator then schedules its before behavior, which acquires
additional capabilities from the capability service. Once the capabilities have been acquired, the second
before and after decorator schedules its decorated behavior, which is a third before and after decorator. This
behavior first starts a conversation with the user and then schedules its decorated behavior, a sequence node
with three children that actually hold the conversation with the user. Once the sequence has finished executing
its children, it succeeds. This prompts the third before and after decorator to schedule its after behavior, which
ends the conversation with the user. Execution then continues until the capabilities and program control have
been relinquished, the first before and after decorator succeeds, the guarded behavior succeeds, and the in
order selector succeeds. At this point, the repeat node again resets and reschedules the in order selector.
79

In summary, the CAILE architecture provides a set of SPs, a logging module, and an agent director
module. To actually construct a CAILE application, developers must design and implement a set of software
agents, activity modules, and the application module. The activity and application modules used in Betty’s
Brain are presented next.
5.2 Activity Modules in Betty’s Brain
An activity module in the CAILE architecture is a module that provides a visual interface with which agents
can interact. Activity modules include an activity controller, view controller, view, and command and update
protocols. The activity module is responsible for managing the state of the activity and its associated data
structures. Thus, it subscribes to events from the command protocol, and, when a command is allowed, sends
out associated update events. The view controller listens for update events and updates the view such that it is
consistent with the data contained in those events. At the same time, the view controller detects expressions
of intent from the user (e.g., indicating that they would like to add the causal link “wolves decrease deer”)
and translates them to the corresponding command events, which it then publishes on the user’s behalf. Thus,
several steps are involved in processing a user’s expressions of intent, and these steps are illustrated in Figure
5.4. When the user expresses intent, her request propagates through the view controller, the event bus, and
the activity controller. In turn, the activity controller accepts the change and publishes an update event. This
event is detected by the view controller, which then updates the view. This design provides two important
benefits. First, actions taken by both the user and the pedagogical agent are processed via the same system
(i.e., command events and corresponding update events). Second, forcing all changes to propagate through
the event bus ensures that they will be logged by the event logger module.
As seen in Figure 5.1, the CAILE application version of Betty’s Brain includes five custom activity mod-
ules: agent conversation, causal map, causal map quiz, notebook, and resource library. The agent conversation
module allows software agents and users to communicate conversationally through prompts. Conversations
are initiated by software agents by sending a Start Conversation command event. If accepted, the module’s
activity controller replies with a Conversation Started update event, and it will refuse any other Start Con-
versation events until the current conversation is ended via an End Conversation command event. Once a
conversation has started, software agents communicate with the user by sending events that command the
agent conversation module to display prompts: text messages from the agent accompanied with a specifica-
tion of how the user can respond. Causal question prompts allow the user to respond with a causal question
(e.g., If wolves decrease, what will happen to deer?); continue prompts allow the user to respond by clicking
on a continue button; multiple choice prompts allow the user to select one of a set of choices and click on a
submit button; and null prompts do not allow the user to respond. Instead, agents must replace the prompt
80

Figu
re5.
4:T
heex
ecut
ion
flow
inre
spon
seto
aus
er’s
expr
essi
onof
inte
ntin
anac
tivity
mod
ule.
81

Figure 5.5: An example prompt from the agent conversation module.
with a new one or end the conversation. Figure 5.5 shows an example prompt from the agent conversation
module.
The causal map module allows users and agents to edit a causal map, as in previous versions of Betty’s
Brain. The module includes command events for adding and removing concepts and links, editing links,
moving concepts and causal links, and annotating causal links with confidence information. Students can
annotate links with either “This link is correct,” which adds a green check-mark, or “This link could be
wrong,” which adds a pink question mark. A second command protocol allows software agents to highlight
concepts and links. This functionality is primarily used by Betty when she explains her answers to questions.
Because software agents need access to the current causal map in order to reference it or explain aspects of
it, the causal map module includes an SP that provides read-only access to Betty’s current causal map.
Figure 5.6 illustrates the causal map module’s view. The buttons on the right side of the screen allow the
user to manipulate the causal map, save it as an image file, and zoom in and out on it. Should software agents
need to block the user’s access to some or all of this functionality, they can reserve capabilities provided by
the activity and view controllers. The activity controller provides a single capability that is necessary for
making any changes to the causal map, and the view controller provides a set of capabilities that block access
to individual interface features (e.g., adding a causal link or deleting a concept). When a software agent
reserves one of these capabilities, the associated buttons on the interface are disabled.
The causal map quiz module allows students to view Betty’s quiz results. The module includes two
command events: one for asking the activity controller to grade a given quiz and one for asking the activity
controller to generate and then grade a quiz. This module includes a new feature not available in previous
versions of Betty’s Brain: sub-quizzes. Users are able to quiz Betty on a single section of the causal map (e.g.,
the greenhouse effect portion of the climate change map). Using these more targeted assessments, students
can build and receive feedback on one section of the causal map at a time.
This new version of Betty’s Brain includes changes to the rules for generating and grading quizzes. Specif-
ically, the quiz generation algorithm calculates each possible quiz question and classifies it into one of the
following categories:
82

Figure 5.6: The causal map module view with three concepts and two annotated links.
1. questions Betty answers correctly, where the answer uses 0 links;
2. questions Betty answers correctly, where the answer uses 1 link;
3. questions Betty answers correctly, where the answer uses 2 or more links;
4. questions Betty answers incorrectly, where the expert answer uses 0 links;
5. questions Betty answers incorrectly, where the expert answer uses 2 or more links and Betty uses 1 or
more links;
6. questions Betty answers incorrectly, where Betty’s answer uses 0 links; and
7. questions Betty answers incorrectly, where the expert answer uses 1 link and Betty’s answer uses 1 or
more links.
Note that in this classification, incomplete and incorrect questions are both considered to be answered
incorrectly. Once the classification is complete, the algorithm takes the following steps:
1. Choose Quiz Size: The size of the quiz is chosen dynamically based on the sizes of Betty’s map and the
expert map. The goal is to keep the number of questions on a quiz less than the number of links in the
student’s map. Doing so minimizes the student’s ability to game the system (Baker et al., 2006) using
the guess-and-check strategy described previously (Segedy et al., 2011b). If the user has added more
83
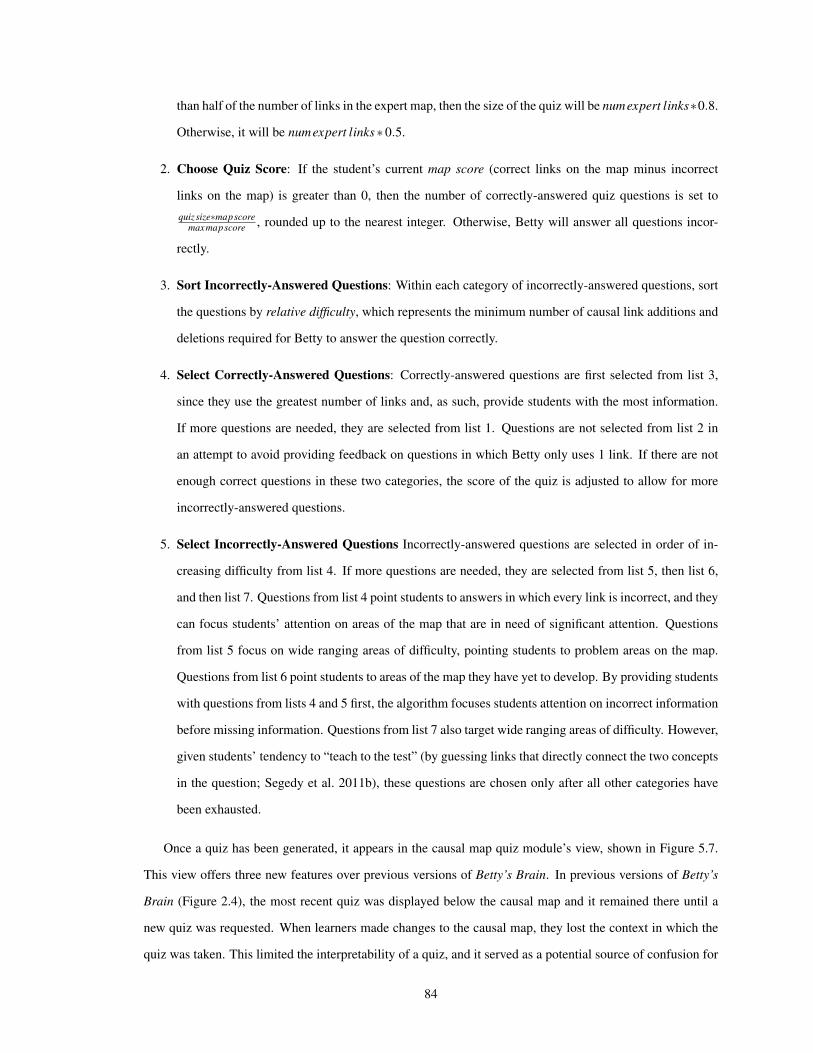
than half of the number of links in the expert map, then the size of the quiz will be numexpert links∗0.8.
Otherwise, it will be numexpert links∗0.5.
2. Choose Quiz Score: If the student’s current map score (correct links on the map minus incorrect
links on the map) is greater than 0, then the number of correctly-answered quiz questions is set to
quizsize∗mapscoremaxmapscore , rounded up to the nearest integer. Otherwise, Betty will answer all questions incor-
rectly.
3. Sort Incorrectly-Answered Questions: Within each category of incorrectly-answered questions, sort
the questions by relative difficulty, which represents the minimum number of causal link additions and
deletions required for Betty to answer the question correctly.
4. Select Correctly-Answered Questions: Correctly-answered questions are first selected from list 3,
since they use the greatest number of links and, as such, provide students with the most information.
If more questions are needed, they are selected from list 1. Questions are not selected from list 2 in
an attempt to avoid providing feedback on questions in which Betty only uses 1 link. If there are not
enough correct questions in these two categories, the score of the quiz is adjusted to allow for more
incorrectly-answered questions.
5. Select Incorrectly-Answered Questions Incorrectly-answered questions are selected in order of in-
creasing difficulty from list 4. If more questions are needed, they are selected from list 5, then list 6,
and then list 7. Questions from list 4 point students to answers in which every link is incorrect, and they
can focus students’ attention on areas of the map that are in need of significant attention. Questions
from list 5 focus on wide ranging areas of difficulty, pointing students to problem areas on the map.
Questions from list 6 point students to areas of the map they have yet to develop. By providing students
with questions from lists 4 and 5 first, the algorithm focuses students attention on incorrect information
before missing information. Questions from list 7 also target wide ranging areas of difficulty. However,
given students’ tendency to “teach to the test” (by guessing links that directly connect the two concepts
in the question; Segedy et al. 2011b), these questions are chosen only after all other categories have
been exhausted.
Once a quiz has been generated, it appears in the causal map quiz module’s view, shown in Figure 5.7.
This view offers three new features over previous versions of Betty’s Brain. In previous versions of Betty’s
Brain (Figure 2.4), the most recent quiz was displayed below the causal map and it remained there until a
new quiz was requested. When learners made changes to the causal map, they lost the context in which the
quiz was taken. This limited the interpretability of a quiz, and it served as a potential source of confusion for
84

Figure 5.7: The causal map quiz module view with an incorrect question selected.
students who may have naturally drawn a connection between the quiz and the current version of the map.
In the new interface, each completed quiz is associated with Betty’s map as it existed when she took that
quiz. This allows students to update their causal maps based on the quiz results while maintaining the context
necessary for further analysis of the quiz. The second new feature allows students to click on a question
within a quiz. When they do, the interface highlights the links that Betty used to answer that question.
In previous versions of Betty’s Brain, students obtained this information by asking Betty a quiz question
and then asking her to explain her answer. This drawback may partially explain why previous studies of
student behavior in Betty’s Brain have shown that students rarely ask for explanations after taking a quiz
(Segedy et al., 2014). The new interface allows students to more easily draw connections between a question
and its associated causal links; ideally, this encourages students to investigate relevant quiz questions more
frequently, and it embeds the activities associated with exploring the quiz results directly within the context
of the quiz. Finally, the third new feature allows students to view all of Betty’s past quizzes. This allows
them to make comparisons between maps that achieved higher and lower quiz scores. The causal map quiz
module’s view controller includes capabilities that can be reserved by agents in order to prevent the user from
either selecting quizzes from the quiz history list or selecting quiz questions from the currently-selected quiz.
The notebook module (the view of which is displayed in Figure 5.8) allows students to create and search
through a set of free text notes that include up to five keywords. Students can add, delete, and edit notes,
and they can also filter the set of displayed notes by selecting a keyword. The module controllers include
85
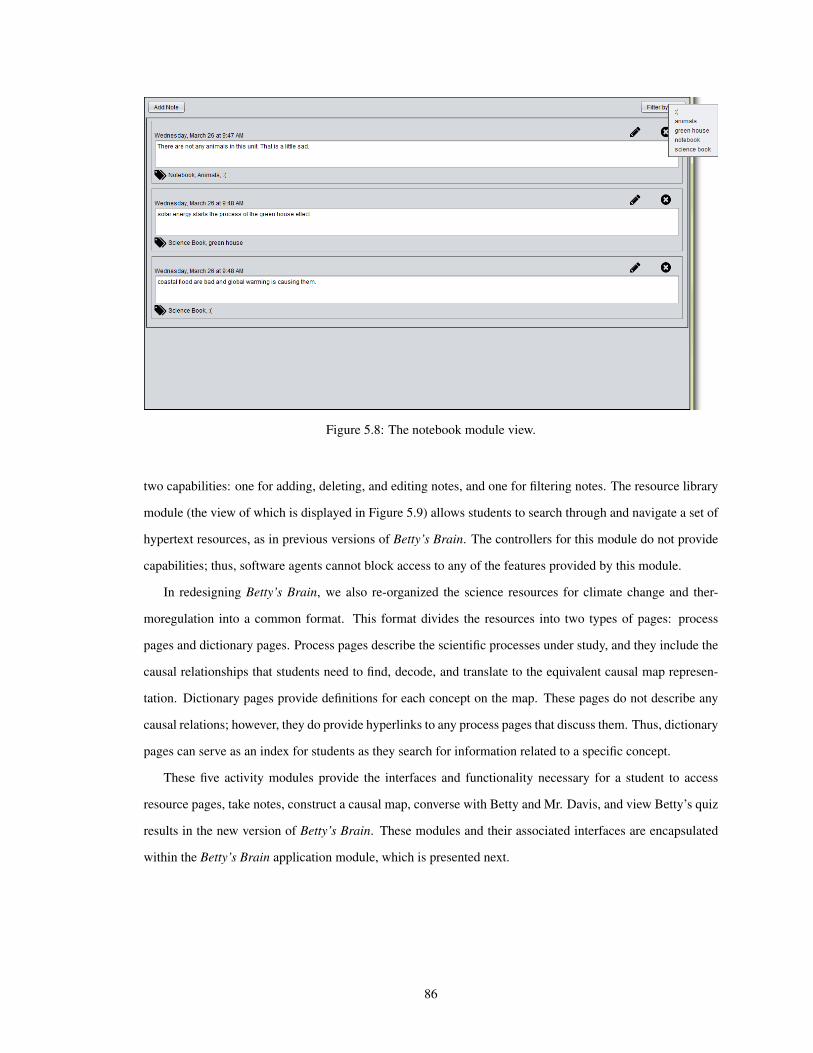
Figure 5.8: The notebook module view.
two capabilities: one for adding, deleting, and editing notes, and one for filtering notes. The resource library
module (the view of which is displayed in Figure 5.9) allows students to search through and navigate a set of
hypertext resources, as in previous versions of Betty’s Brain. The controllers for this module do not provide
capabilities; thus, software agents cannot block access to any of the features provided by this module.
In redesigning Betty’s Brain, we also re-organized the science resources for climate change and ther-
moregulation into a common format. This format divides the resources into two types of pages: process
pages and dictionary pages. Process pages describe the scientific processes under study, and they include the
causal relationships that students need to find, decode, and translate to the equivalent causal map represen-
tation. Dictionary pages provide definitions for each concept on the map. These pages do not describe any
causal relations; however, they do provide hyperlinks to any process pages that discuss them. Thus, dictionary
pages can serve as an index for students as they search for information related to a specific concept.
These five activity modules provide the interfaces and functionality necessary for a student to access
resource pages, take notes, construct a causal map, converse with Betty and Mr. Davis, and view Betty’s quiz
results in the new version of Betty’s Brain. These modules and their associated interfaces are encapsulated
within the Betty’s Brain application module, which is presented next.
86

Figure 5.9: The resource library module view.
87

5.3 The Betty’s Brain Application Module
All CAILE applications include an application module that coordinates the application’s life cycle and pro-
vides a view of the entire application; these tasks are divided between an application controller and an appli-
cation view controller. During the application’s start up procedure, the application controller is responsible
for starting all other module controllers and then publishing an Application Started Event, which informs
all controllers that all other controllers have started successfully and are ready to receive messages from the
event bus service. When the user attempts to exit the application, the application controller also coordinates
the shut down procedure by first publishing an Application Exit Requested event. All other controllers must
reply to this message with either an Application Exit OK event or an Application Exit Denied event, which
includes a message for the user explaining the reason that the module is unable to shut down. For example,
the agent conversation activity controller prevents the application from exiting whenever a conversation is in
progress. When the application controller receives an Application Exit Denied Event, it displays the provided
message to the user and does not exit the application. When all controllers respond with Application Exit
OK, the application controller broadcasts an App Will Exit event, at which point all controllers must prepare
for shutdown and reply with a Ready To Exit Event.
The application view controller manages a “master” view and arranges the views from all other modules
within that view. The master view for Betty’s Brain is displayed in Figure 5.10. It allows users to request
a conversation with either Betty or Mr. Davis, provides a facility for adding a note from any interface via
the Add a note button, and displays the causal map, resources, notebook, and causal map quiz interfaces in a
tabbed pane. When students are in a conversation with an agent, the agent conversation view “pops in” from
the top of the interface, pushing the tabbed pane down. Once the conversation is finished, the conversation
view disappears and the tabbed pane expands to the top of the interface. Normally, students are free to use any
of these features and switch between the four activity views. However, the application controllers provide
capabilities through which agents can block access to these features. For example, Figure 5.10 shows the
application in a state where Betty has reserved the Switch Tabs and Request Conversation capabilities. As
such, the corresponding interface features have been disabled. The application view controller also provides
support for Application Contexts, which are defined as the currently-available set of tabs in the tabbed pane.
Only software agents can change the context, and they can use this to block access to specific activity modules.
The design of the application view differs significantly from previous versions of Betty’s Brain. Previ-
ous versions of Betty’s Brain presented several types of information on the screen simultaneously. In these
versions, learners can shift their attention between the resources, Betty’s map, and the quiz results, but the
system had no mechanism for detecting these shifts. This greatly limited the information available to the
88

Figure 5.10: The Betty’s Brain master view during a conversation with Betty.
learner modeling module. In particular, the old interface made it difficult to determine (i) how long the
learner actively engaged with a particular source of information (e.g., a quiz or resource page), and (ii) when
the learner’s attention shifted from one source of information to another. The ability to detect these shifts
is critical for CGA, which models learner behavior based on where the learners are directing their attention.
The new interface partially addresses this limitation. While the system cannot definitively detect when and
where a learner is focusing her attention, the new interface layout makes it impossible for the learner to focus
on more than one activity at a time. Thus, the scaffolding agent can be reasonably certain that if the learner
is engaged with the program, then she is focusing her attention toward the currently-displayed activity. By
combining this information with information about when the user was last active, the scaffolding agent can
make much stronger assumptions about student attention than were possible in the previous interface.
5.4 Summary
This chapter presented the CAILE software architecture developed in collaboration with members of the
Teachable Agents Group at Vanderbilt University as part of this dissertation research. The CAILE architec-
ture provides capabilities that go beyond what was available in previous versions of Betty’s Brain by providing
a behavior tree language for constructing agent behaviors and allowing software agents to store information
between sessions and take control of the interface. To take advantage of these features, Betty’s Brain was
re-implemented using the CAILE architecture, and its interface was significantly revised to allow the scaf-
89

folding agent to more accurately track students’ attention while using the program. The next chapter presents
an experimental study investigating: (i) the effectiveness of CGA in predicting students’ performance and
learning within Betty’s Brain, and (ii) the effectiveness of the three-stage scaffolding strategy developed as
part of this dissertation research. Both CGA and the three-stage scaffolding strategy take advantage of the
new features provided by the CAILE architecture.
90

CHAPTER 6
Experimental Evaluation of CGA and an Accompanying Adaptive Scaffolding Strategy
The dissertation research presented thus far has involved utilizing Betty’s Brain to: explore students’ open-
ended problem-solving behaviors; test the effect of contextualized conversational feedback on students’ be-
haviors; and test the effectiveness of analysis techniques in providing information that could be used to
scaffold learners. This research resulted in several valuable findings along all of these dimensions. How-
ever, several limitations were identified and discussed at length (see Section 3.3.1) in relation to the analysis
techniques and the scaffolding used in these earlier versions of Betty’s Brain.
To address these limitations, the previous two chapters presented a novel method for analyzing and track-
ing student behavior (called CGA) and a complete redesign of Betty’s Brain to support this analysis method
and provide new capabilities that Mr. Davis can use to scaffold learners. This chapter presents an exper-
imental study designed to investigate the following: (i) the effectiveness of CGA in predicting students’
performance and learning within Betty’s Brain, and (ii) the effectiveness of a three-stage scaffolding strategy
developed as part of this dissertation research. In addition, we characterized the students’ log traces via the
CGA metrics and then performed an exploratory clustering analysis on the results in order to reveal student
behavior profiles based on these metrics. The results of this analysis demonstrate the value of CGA in char-
acterizing student behaviors by discovering distinct behavior profiles exhibited by students while using the
system. This chapter first presents the three-stage scaffolding strategy, and then presents the experimental
study to test both it and CGA.
6.1 A Three-Stage Scaffolding Strategy for Betty’s Brain
As mentioned in Chapter 2 and illustrated in Figure 2.1, a scaffolding agent analyzes the learner model in
order to select appropriate pedagogical actions for assessing and scaffolding learners. Assessments generate
information that the agent can use to improve the learner model, and scaffolds support learners in achieving
their learning objectives. This section presents a novel three-stage scaffolding strategy for OELE scaffolding
agents that utilizes a subset of the information in the CGA-based learner model described in Chapter 4 to
make decisions about how and when to diagnose and scaffold learners using Betty’s Brain. This scaffolding
strategy is designed around a set of principles we have gleaned from the literature on teaching and learning:
• Graduated Assistance: The scaffolding strategy includes three primary levels of support that follow
a progression from minimal to maximal levels of system control. In earlier levels of support, the
learner has complete control over the form and structure of support. In later levels of support, the
91

system is in control. Graduated assistance provides learners with opportunities to manage their own
learning processes. When the system points out students’ areas of weakness, students may attempt
to recover from their mistakes by learning about the skills and strategies that they are struggling with.
This effectively provides opportunities for learners to independently recover from their mistakes before
receiving more restrictive levels of support (Puntambekar and Hubscher, 2005; Stone, 1998).
• Scaffolds to Promote Reflection: When students are struggling to succeed in Betty’s Brain, they may
not understand what they do not know (Graesser and McNamara, 2010), which inhibits their ability
to independently address their knowledge gaps. The three-stage scaffolding strategy helps students
reflect on what they do not know by confronting them with challenges that expose their incomplete
understandings. When students struggle to complete these tasks, it may prompt them to reflect on what
they do not know and take actions to address these knowledge gaps.
• Need-Based Required Practice: As discussed in Chapters 1 and 2, managing one’s own learning
in an OELE is difficult, and learners may not possess the domain knowledge, task understanding, or
metacognitive knowledge necessary for learning in such environments. Should learners be capable of
reflecting on the task requirements and their ability to meet such requirements, they should recognize
their own need to seek help from the system resources. However, research has demonstrated that
learners sometimes avoid seeking help when it would benefit them (Roll et al., 2011; Aleven et al.,
2006). The three-stage scaffolding strategy developed here addresses this concern by requiring students
to practice executing skills related to information seeking, causal reasoning, and quiz evaluation. As
they practice, the system provides feedback (Shute, 2008) using the progressive hints strategy discussed
in Section 2.4.2. Practice with feedback has been identified as a critical component in learning to
execute procedures and make decisions (Anderson et al., 1995; Brunstein et al., 2009).
The scaffolding strategy realizes these principles through three primary stages of support: (i) general
learner-directed support; (ii) diagnosis support with feedback; (iii) and guided practice support. The first
stage, general learner-directed support, mainly consists of a suggestion to ask Mr. Davis clarifying questions
that may help students understand the Betty’s Brain task. Students can choose to follow-up on that suggestion
by asking questions, or they can dismiss the help and continue working on their problem-solving tasks. The
second stage, diagnosis support with feedback, mainly consists of an intervention scaffold in which students
are tested on two of the Betty’s Brain skills listed in Tables 4.1, 4.2, and 4.3 (by solving short problems
that require those skills). The result of this test is shared with learners, and it is designed to provide them
(and the scaffolding agent) with information about their understanding of the selected skills. This effectively
provides learners with an opportunity to reflect on their understanding of these skills and take action based
92

Figure 6.1: State machine of the three-stage scaffolding strategy.
on the results. The third stage, guided practice support, mainly consists of an intervention scaffold in which
students are required to practice using a Betty’s Brain skill until they execute it correctly 5 times.
During the study presented in this chapter, support was activated whenever 3 out of the student’s last 5
causal map edits were unsupported or 3 out of the student’s last 5 causal map edits were ineffective. These
counts were reset at the conclusion of Mr. Davis’s support. The choice of which stage of support to activate
was based on the following: (i) support that the learner has already received, and (ii) the learner’s behavior
and performance during support sessions. These decisions may be represented as the finite state machine
shown in Figure 6.1. The state machine consists of 8 states: four observation states, two learner-directed
support states, one diagnosis support state, and one guided practice support state.
The scaffolding agent began in state Observation-0, and it observed the learner until she demonstrated
low levels of solution construction effectiveness or support. At this point, Mr. Davis activated learner-
directed support as described above (LD Support-0). At the conclusion of learner-directed support, the agent
transitioned to either Observation-1 or Observation-2, depending on whether or not the learner dismissed the
support without asking Mr. Davis a question. By asking questions, learners are demonstrating initiative and
may be taking charge of their learning. The scaffolding agent rewarded these learners; the next time support
was triggered, these learners again received learner-directed support (indicated by state LD Support-1) instead
of the more restrictive diagnosis support. Following this, the agent transitioned to Observation-2.
When the scaffolding agent observed low levels of effectiveness or support from state Observation-2,
it activated diagnosis support with feedback (as described above). When this support concluded, the agent
93

Question Set Question
Information Seeking
How do I get to the science book?What is a dictionary page?What is a science process page?What are cause-and-effect relationships, and how do I find them?Which pages have cause-and-effect relationships on them?
Causal Reasoning
What is a causal map?What is the difference between an increase relationship and a decrease relationship?What are source and target concepts?How do I use a causal relationship to answer questions?
Solution Assessment
How can I make sure that I have taught Betty the right information?How do I ask you to grade Betty’s answer to a question?How do I tell Betty to take a quiz?How can I see which links Betty used to answer a question?What does it mean when Betty’s answer is right (green checkmark)?What does it mean when Betty’s answer is right so far (yellow question mark)?What does it mean when Betty’s answer is wrong (red X or gray question mark)?How can I keep track of which links are right and wrong?
Table 6.1: Questions available during learner directed support.
transitioned to either Observation-2 or Observation-3 based on the student’s performance on the diagnosis
problems. If the learner solved at least 3 problems correctly (out of 4), the scaffolding agent transitioned
to Observation-2. Otherwise, it transitioned to Observation-3. If the learner exhibited low effectiveness or
support while the scaffolding agent was in state Observation-3, then she received guided practice support (as
described above). At the conclusion of guided practice, the agent returned to state Observation-0.
6.1.1 General Learner-Directed Support
When general learner-directed support was activated, Mr. Davis offered to help the learner, and he justified
his offer with an evaluative assertion about the learner’s behavior (e.g., “You seem to be having trouble. Can
I help you with anything?”). This scaffold asks the learner to consider whether or not they need the help Mr.
Davis can provide. Learners can respond by asking a question about information seeking, causal reasoning,
or solution assessment (see Table 6.1). Alternatively, they can refuse Mr. Davis’s offer. To ask Mr. Davis a
question, students needed to engage in an “FAQ” style conversation in which they can select questions from
a drop-down menu. If the student selected a question, Mr. Davis responded with assertions that answer that
question. In some cases, he explained a relevant strategy and then demonstrated the connection between
the strategy and the tasks involved in executing the strategy. For example, when focusing on a strategy for
solution assessment (e.g., focus on Betty’s correct quiz answers first), Mr. Davis first explained the strategy
and then demonstrated the strategy’s reliance on one’s ability to: (i) determine the set of causal links used to
answer a question, and (ii) interpret the correctness of links depending on whether the answer was correct,
partially correct, or incorrect.
94

This level of support was designed to provide learners with optional assistance; they can choose to engage
with Mr. Davis through questions, and they can follow up on their conversations by reading further about
anything that confused them. At any time during learner-directed support, however, students can choose to
end the conversation and resume working on the main Betty’s Brain task.
6.1.2 Diagnosis Support with Feedback
When diagnosis support was activated, Mr. Davis provided help to the learner, and he justified his offer with
an evaluative assertion about the learner’s behavior. He then analyzed the learner model and chose two skills
to diagnose. These selections were based on: (i) Mr. Davis’s confidence in the learner’s understanding of each
skill; (ii) a priority ordering among problems based on their difficulty; and (iii) the number of opportunities
learners have had to demonstrate their understanding of each skill. Mr. Davis’s confidence in a skill was
calculated as a correctness percentage over the previous 10 problems that required that skill (or, if the total
number of problems completed was less than 10, as many problems as they had completed). If students had
not completed at least three problems, the number of correct problem solutions was divided by 3 instead of
by the number of problems attempted. This ensured that the confidence value is not set unreasonably high in
cases where the student completed her first problem correctly.
Each category of skills (i.e., information seeking, causal reasoning, and solution assessment) was broken
up into three skill sets: beginner, intermediate, and advanced (see Table 6.2), and Mr. Davis selected one
skill set from which to select the skills for diagnosis. Beginner skills were prioritized first, then intermediate
skills, and finally advanced skills. More specifically, he selected the highest priority skill set in which the
average confidence value for the skills in that set was below 0.6 (ties were broken randomly). If all skill sets
had an average confidence value greater than or equal to 0.6, he selected the highest priority skill set with an
average confidence value below 0.9. If all skill sets had an average confidence value greater than or equal to
0.9, he chose the skill set with the lowest average confidence value.
Once the two skills were selected, Mr. Davis provided an intervention scaffold in which he asserted
his desire to understand the reason underlying the learner’s recent poor performance. He then required the
learner to complete two problems related to each selected skill. After she completed these problems, Mr.
Davis revealed the results (i.e., the correctness of her solutions) in relation to both skills. For each skill, he
provided an evaluative assertion based on students’ performance on these diagnosis problems (e.g., “You did
really well on the problems that required you to identify links from text passages” or “You had a lot of trouble
using a causal map to answer questions”). For skills that learners exhibited difficulty in performing, Mr.
Davis suggested reading materials that discuss those skills (these reading materials are part of a teacher’s
guide which is described in the next section). Mr. Davis then returned learners to the main Betty’s Brain task.
95

Skill Set Skill
Causal Reasoning Beginner Reasoning with a single increase linkReasoning with a single decrease link
Causal Reasoning IntermediateReasoning with a chain of two increase linksReasoning with a chain of two decrease linksReasoning with a chain of one increase link and one decrease link
Causal Reasoning Advanced
Reasoning with two chains of links where each chain results in an increaseReasoning with two chains of links where each chain results in an decreaseReasoning with two chains of links where one chain results in an increase and the other resultsin a decrease
Information Seeking BeginnerIdentifying links in “Standard-Active-Increase” passagesIdentifying links in “If-Then-Active-Increase” passagesIdentifying links in “Then-if-Active-Increase” passages
Information Seeking IntermediateIdentifying links in “Standard-Passive-Increase” passagesIdentifying links in “If-Then-Passive-Increase” passagesIdentifying links in “Then-If-Passive-Increase” passages
Information Seeking Advanced
Identifying links in “Standard-Active-Decrease” passagesIdentifying links in “Standard-Passive-Decrease” passagesIdentifying links in “If-Then-Active-Decrease” passagesIdentifying links in “Then-If-Active-Decrease” passages
Solution Assessment Beginner
Interpreting a correct one-link answerInterpreting a correct multi-link answerInterpreting an incomplete one-link answerInterpreting an incomplete multi-link answer
Solution Assessment IntermediateInterpreting an incorrect one-link answerInterpreting an incorrect multi-link answer with one unknown linkInterpreting an incorrect multi-link answer with more than one unknown link
Solution Assessment Advanced Interpreting two multi-link answers with overlapping links, one correct and one incorrectInterpreting two multi-link answers with overlapping links, one incomplete and one incorrect
Table 6.2: Skills tracked by Mr. Davis broken up by difficulty.
Diagnosis support was designed to provide learners (and Mr. Davis) with information about their under-
standing of the selected skills. This effectively provided learners with an opportunity to reflect on their own
understanding of these skills and take action based on the results. When learners performed well on a set of
questions, they may have gained confidence in their ability to successfully teach Betty; when they performed
poorly, it may have motivated them to study the skills with which they were struggling.
6.1.3 Guided Practice Support
When guided practice support was activated, Mr. Davis selected the highest priority skill to have students
practice. More specifically, he selected the highest priority skill with a confidence value below 0.6 (ties were
broken randomly). If all skills had a confidence value that was greater than or equal to 0.6, he selected the
highest priority skill with a confidence value below 0.9. If all skills had a confidence value that was greater
than or equal to 0.9, he chose the skill set with the lowest average confidence value. He then addressed
the learner with an evaluative assertion and required her to practice a set of problems related to the selected
skill. When the learner struggled while working to complete a particular problem, Mr. Davis guided her
through the problem using the progressive hints strategy described in Section 2.4.2. These hints operated
by: mentioning critical problem features, suggesting that students consider those features; asserting steps
96

that must be completed by students in order to solve the problem; and, if needed, asserting the problem’s
solution. These “answer giving” hints converted the problem into a worked example that learners can study
in preparation for the next problem (Roll et al., 2011). Once learners had successfully solved five problems
on the first attempt, Mr. Davis provided an evaluative assertion communicating his confidence in the fact that
the learner now understands the skill. Following this, he returned the learner to the main Betty’s Brain task.
Together, the three primary levels of support were expected to help learners gain an understanding of
the skills important for successfully completing the Betty’s Brain learning task. This approach was meant to
address the limitations of previous OELE scaffolding strategies discussed in Section 2.7, which typically rely
on: (i) either providing students part or all of the problem solution; or (ii) making behavioral suggestions that
encourage students to engage in particular behaviors. Neither of these approaches attempt to discover and
address the cause of students’ struggling or teach students the skills they need to achieve success. In contrast,
the three-stage scaffolding strategy interacted with students in order to understand the reasons underlying
their difficulties, and it worked to correct the discovered reasons through guided practice scaffolds.
6.2 Study 3: Testing the CGA-based Learner Model and Three-Stage Scaffolding Strategy
The final study of student behavior in Betty’s Brain conducted as part of this dissertation research tested the
CGA-based learner model and the accompanying three-stage scaffolding strategy outlined in the previous
section. Specifically, the study sought to address the following research questions:
1. How effective are students at executing the tasks necessary for success in Betty’s Brain?
2. How effective is the three-stage scaffolding strategy in helping students learn how to succeed in com-
pleting the Betty’s Brain task?
3. How effective is the CGA-based learner model in providing interpretable and actionable information
about students’ strengths, weaknesses, and problem solving behaviors as they use Betty’s Brain?
Students in this study used the redesigned Betty’s Brain to learn about updated versions of the climate
change and thermoregulation units used in Studies 1 and 2. To explore question one, students completed
exercises that directly tested their understanding of the skills discussed in the previous section (e.g., identify-
ing links in text passages and interpreting quiz results). To explore question two, the three-stage scaffolding
strategy presented above was compared to a progressive hints scaffolding strategy. To explore question three,
the Betty’s Brain scaffolding agent interpreted students’ behaviors using the CGA-based learner modeling
module, and the resulting learner models were saved for post-hoc analyses.
The progressive hints scaffolding strategy provided students with a direct hint after each quiz. Mr. Davis
analyzed the state of Betty’s map after each quiz and chose a link on which to focus his hints. If the student
97

had any incorrect links, Mr. Davis chose the oldest incorrect link on Betty’s map, and post-quiz hints focused
on this link until it was removed. Otherwise, Mr. Davis randomly chose a correct link from among those that
were missing from Betty’s map. If Betty’s map was correct and complete, no hints were provided.
When focusing on an incorrect link, Mr. Davis provided a progression of three hints for the chosen link,
and these hints provided progressively more detail until the link was removed the map. The first two hints
pointed the student to a concept that was connected to the incorrect link, and the third hint told the student
exactly which link to remove from the map. The three hints took the following forms:
1. It looks like Betty is having some trouble. I can see why. At least one of the links on her map is wrong.
Take a look at the concept [X]. Something is not quite right with it.
2. One of the links coming out of [X] is wrong. Try and figure out which one it is.
3. You need to remove the link from [X] to [Y].
If students repeatedly quizzed Betty in an attempt to progress through the hints quickly, Mr. Davis
continued to give students the same hint. In order to progress to a more detailed hint, a subsequent quiz
needed to take place at least 60 seconds after the original hint was delivered or after the student made at least
one change to the causal map. Once Mr. Davis delivered the third hint, he repeated it after every quiz until
the link was removed.
When focusing on a missing correct link, Mr. Davis provided a progression of four hints; the first two
hints pointed the student to the page that described the causal relationship. The third hint provided the
paragraph that described the causal relationship, and the final hint told the student exactly which link to add
to Betty’s map. Note that the function continued providing hints for the chosen link even if incorrect links
were added to Betty’s map. The four hints took the following forms:
1. Looks like Betty has some more to learn. Try reading the page called [PAGE NAME]. There is a causal
relationship on that page that you have not taught Betty yet.
2. You are missing a link that comes out of the [X] concept. Try reading up on [X] and see if you can find
the link.
3. There needs to be a link between the concepts [X] and [Y]. Try figuring out what it should be by
looking at this text from the science book page called [PAGE NAME]: [TEXT].
4. You need to add the link [LINK] to the map. This portion of the science book page called [PAGE
NAME] explains the relationship. See if you can figure out which part of this passage explains the
relationship between [X] and [Y]: [TEXT PASSAGE].
98

6.2.1 Materials and Method
6.2.1.1 Participants
99 6th-grade students from four science classrooms participated in the study. The school was an academic
magnet school with competitive admission requirements. To enroll in this school, students needed to pass all
of their classes and achieve an average grade of “B+” during the previous academic year. These students were
all fluent English speakers, and none were enrolled in special education programs. However, one student
was excused from the study for a medical reason. Therefore, the sample included data from 98 students
divided into three groups. 33 students each were placed into the three-stage scaffolding (TSS) group and the
progressive scaffolding (PS) group. The remaining 32 students served as a control group.
6.2.1.2 Topic Units and Text Resources
Students worked with updated versions of the climate change and human thermoregulation units used in Stud-
ies 1 and 2. The climate change map, shown in Figure 6.2, contained 22 concepts and 25 links representing
the greenhouse effect (solar energy, absorbed light energy, absorbed heat energy, global temperature, and heat
reflected to earth), human activities affecting the global climate (deforestation, vegetation, vehicle use, fac-
tories, electricity generation, fossil fuel use, carbon dioxide, garbage and landfills, and methane), and global
warming’s impacts on the global climate (sea ice, ocean level, coastal flooding, carrying capacity, condensa-
tion, water vapor, precipitation, and drought). The resources were organized into one introductory page, three
pages covering the greenhouse effect, four pages covering human activities, and two pages covering impacts
on the global climate. Additionally, a glossary section provided a description of some of the concepts, one
per page. The text was 31 pages (4,188 words) with a Flesch-Kincaid reading grade level of 8.4.
The thermoregulation map, shown in Figure 6.3, was almost identical to the map used in Study 1. It con-
tained 13 concepts and 15 links representing cold detection (cold temperatures, heat loss, body temperature,
cold detection, hypothalamus response) and three bodily responses to cold: goosebumps (skin contraction,
raised skin hairs, warm air near skin, heat loss), vasoconstriction (blood vessel constriction, blood flow to
the skin, heat loss), and shivering (skeletal muscle contractions, friction in the body, heat in the body). The
resources were organized into two introductory pages discussing the nervous system and homeostasis, one
page discussing cold detection, and three pages discussing the three bodily responses to cold temperatures,
one response per page. Additionally, a dictionary section discussed some of the concepts, one per page. The
text was 15 pages (1,974 words) with a Flesch-Kincaid reading grade level of 9.0.
99

Figu
re6.
2:C
limat
ech
ange
expe
rtm
apus
eddu
ring
Stud
y3
100

Figu
re6.
3:T
herm
oreg
ulat
ion
expe
rtm
apus
eddu
ring
Stud
y3
101

6.2.1.3 Betty’s Brain Interface and Features
The version of Betty’s Brain used in this study was similar to the version presented in Chapter 5 and illustrated
in Figure 5.10. Students had access to hypertext resources, causal map editing tools (including tools for
annotating links as correct or possibly incorrect), note-taking features, and the quiz feature. They were also
able to ask Betty to answer questions and explain her answers, and they were able to ask Mr. Davis to grade
Betty’s answer to a specific question. However, Mr. Davis avoided grading answers that Betty used a single
link to generate, and this was done to prevent students from gaming the system (Baker et al., 2006). Students
were also able to ask Mr. Davis questions about the Betty’s Brain learning task via the “FAQ” conversation
employed during general learner directed support (these questions are listed in Table 6.1).
The system used in this study included the CGA-based learner modeling module presented in Chapter 4.
This module characterized each map edit as either effective or ineffective, and it characterized each eligible
action as either supported or unsupported and either contradicted or not contradicted. In this study, one action
provided positive or negative support for another action if both actions occurred during the same session
within ten-minutes of each other. This was chosen because it was hypothesized to capture most of the actual
coherence relationships between actions taken by students.
In addition, the system included two features not present in Studies 1 and 2. First, all students had access
to a Teacher’s Guide, which was presented in another instance of the resource library module (see Appendix
C). The teacher’s guide was divided into three primary sections that explained skills and strategies for seeking
information, constructing the causal map, and assessing the causal map. For information seeking, the guide
discussed identifying links in different types of text passages, and it discussed methods for recognizing causal
relations in text passages with different presentation formats, voices, and source effects (as discussed in
Section 4.2.2). For constructing the causal map, the guide explained how to use the causal map interface to
construct a causal map. It also explained the mechanics of causal reasoning (as discussed in Section 4.2.1).
For assessing the causal map, the guide discussed using quizzes, explanations, and question evaluations to
check Betty’s map.
A fourth section of the teacher’s guide provided “Teaching Tips from the Experts,” and it included the
following seven suggestions:
1. Make sure you are teaching your student the information she needs to know.
2. Be careful about shortcut relations. A shortcut causal relation is one that skips over important details.
For example, while working on the thermoregulation unit, students might add the link “skin contraction
decreases heat loss.” While this link conveys accurate information, it skips over some of the details
in the expert map explaining that skin contraction causes raised skin hairs that trap warm air near the
102

skin, thereby decreasing heat loss.
3. Use quiz results to annotate links as being correct.
4. Use correctly- and incorrectly-answered questions together to narrow down which links might be in-
correct.
5. Teach your student one section of the science resources at a time.
6. If your student answers a question incorrectly or incompletely using several links, ask Mr. Davis to
grade a question that uses a subset of those links.
7. Do not give your student too many or too few quizzes, and think about each set of quiz results before
asking your student to take a new quiz.
The teacher’s guide was meant to provide all students, regardless of their experimental condition, access
to information about the skills and strategies important for success in Betty’s Brain. In total, the guide was
31 pages (6,247 words) with a Flesch-Kincaid reading grade level of 6.6.
This version of Betty’s Brain also included three practice problem modules. Each module provided
an interface through which Mr. Davis was able to ask (or require) students to solve problems related to
information seeking, causal reasoning, and solution evaluation. These modules were presented in their own
application contexts, meaning that when Mr. Davis wanted a student to solve a problem, he first had to replace
the normal activity tabs (i.e., causal map, resources, notebook, causal map quiz, and teacher’s guide) with a
single tab containing the practice problem module’s activity view. These practice problem modules provided
the functionality required for the three-stage scaffolding strategy presented earlier.
Figure 6.4 shows the causal reasoning practice problem module with a problem and its solution. This
module presented students with an interface in which they were able to complete causal reasoning problems.
These problems challenged students to “Think like Betty” by using an abstract causal map to answer cause-
and-effect questions. Each problem consisted of a causal map and a cause-and-effect question, and students
were expected to: (i) provide the answer to the question; (ii) select the links they used to answer the question;
and (iii) select the number of chains of causal reasoning they used to answer the question.
Figure 6.5 shows the reading practice problem module with a problem and its partial solution. This
module presented students with an interface in which they were able to complete reading problems. These
problems challenged students to “Read like a Scientist” by identifying causal relations in text passages.
Students were expected to select the correct source concept, target concept, and link sign from drop-down
boxes.
103

Figure 6.4: The causal reasoning practice problem module view.
Figure 6.5: The reading practice problem module view.
104

Figure 6.6: The quizzing practice problem module view.
Figure 6.6 shows the quizzing practice problem module with a problem and its partial solution. This
module presented students with an interface in which they were able to complete quiz evaluation problems.
These problems asked students to “Quiz like a Pro” by viewing a hypothetical quiz taken using an abstract
causal map. Students were expected to use their understanding of the relationship between a quiz answer’s
grade and the causal links used to answer that question in order to annotate the links on the map as either
correct, incorrect, or possibly incorrect.
6.2.1.4 Learning Assessments
Learning was assessed using a pretest-posttest design, and each test consisted of a set of computer-based
exercises and a set of paper-and-pencil questions. The computer-based exercises involved solving problems
using the practice problem modules, and the written questions related to the science content. Each computer-
based test consisted of 20 causal reasoning problems, 10 reading problems, and 14 quiz evaluation problems
105

designed to test students’ understanding of the skills listed in Table 6.2 and discussed in Section 4.2 (These
problems are listed in Appendix C).
Causal reasoning problems presented students with an abstract causal map and asked students to rea-
son with the map to answer questions (e.g., “if concept A increases, what would happen to concept B?”
See Figure 6.4). Students were awarded one point for every question they answered correctly, regardless of
whether or not they selected the correct set of links and number of causal chains used to answer the question.
Causal reasoning problems presented students with four possible choices: (i) B would increase; (ii) B would
decrease; (iii) B would not be affected; (iv) or it depends on which causal relations are stronger. Reading
problems presented students with a text passage discussing the relationship between “Ticks” and “Tacks”
(e.g., “Tacks are increased when Ticks are decreased”), and they needed to choose the correct relation be-
tween these two concepts. Students were awarded one point for each correct answer, and they were presented
with four options: Tacks increase Ticks, Tacks decrease Ticks, Ticks increase Tacks, and Ticks decrease
Tacks. Quiz evaluation problems presented students with a hypothetical quiz taken using an abstract causal
map. Students received one point for every problem in which they correctly annotated links according to the
information in the quiz.
Each written test consisted of multiple-choice science content questions and short answer questions (see
Appendix C). The science content questions (climate change n = 7; thermoregulation n = 6) were similar
to the science content questions used in Studies 1 and 2; they tested students’ understanding of primary
concepts and processes (e.g. what is the greenhouse effect?) and simple relations among concepts (e.g., how
does vegetation affect the amount of carbon dioxide in the atmosphere?). Short answer questions (climate
change n = 5; thermoregulation n = 4) were similar to the short answer questions used in Studies 1 and 2.
They asked students to consider a given scenario (e.g., an increase in the amount of people carpooling) and
explain its causal impact on the scientific process or system under study. Short answer questions were coded
by the chain of causal relationships learners used to explain their answers to the questions, which were then
compared to the chain of causal links that were used to derive the answer from the expert map. One point
was awarded for each causal relationship in the student’s answer that came from or was closely related to the
expert map. The maximum combined scores for these questions were 13 for the climate change test and 11
for the thermoregulation test. Two coders independently scored a subset of the pre- and post-tests for each
unit with over 85% agreement, at which point one of the coders individually coded the remaining answers
and computed the scores.
Paired-samples t-tests were used to assess gains from pre-test to post-test for the different categories of
assessment items. Additionally, repeated-measures ANOVAs were used to compare the gains of the different
treatment groups for each measure of learning. With a minimum power of 0.80, a type I error of 0.05, and the
106

sample size available to us (98 students), this study had the power to detect effect sizes of d ≥ 0.55 for t-tests,
f ≥ 0.20 for within-subjects ANOVA factors, f ≥ 0.30 for between-subjects ANOVA factors, and f ≥ 0.20
for within-between ANOVA interactions.
6.2.1.5 Log File Analysis
This version of Betty’s Brain generated event-based logs that captured every timestamped action taken by
either the student, Betty, or Mr. Davis. A subset of these actions were utilized during the analyses of students’
problem-solving behaviors. This subset included:
• Map Edits: an action was recorded whenever an agent made a change to the set of concepts and links
in the causal map. These actions were characterized by the change that was made (e.g., the set of
concepts and links that were added, deleted, or changed).
• Practice Problem Actions: an action was recorded whenever Mr. Davis displayed a practice prob-
lem and whenever the student submitted a solution to a practice problem. Students’ solutions were
characterized by their correctness.
• Causal Link Annotations: an action was recorded whenever an agent made a change to the annotation
of a causal link (e.g., by marking it correct).
• Quiz Actions: an action was recorded whenever Betty took a quiz. These actions were characterized
by the content of the quiz and Betty’s map at the time of the quiz.
In addition, a set of view actions captured the state of the interface as students used the program. Unlike
the previous set of actions, view actions were characterized by their durations. Thus, these actions could
co-occur with other actions. A subset of these actions were utilized during the analyses of students’ problem-
solving behaviors. This subset included:
• Graded Question Views indicated one of the following: (i) Mr. Davis has just graded Betty’s answer
to a specific question, or (ii) the causal map quiz activity was the currently-selected tab and a quiz was
being displayed. In the former case, the view action lasted until the user exited the conversation with
Betty and Mr. Davis; in the latter case, it lasted until the causal map quiz activity was no longer the
currently-selected tab.
• Graded Explanation Views indicated that the user was viewing Betty’s explanation to a graded causal
question. This took place when Mr. Davis graded Betty’s answer to a specific question or when the
user clicked on a question in the causal map quiz view and highlighted the links used to answer that
question. In both cases, graded explanation views and graded question views co-occurred.
107
• Page Views indicated that a page from either the teacher’s guide or the science resources was visible.
These views were characterized by the set of resources being viewed (i.e. the teacher’s guide or the
science resources) and the page being viewed. Thus, when the user selected a different page, the current
page view action ended and a new one began.
View actions were further characterized by their triggers (i.e., the causes of view actions), and triggers
included the following: agent conversations (e.g., viewing Betty’s explanation for an answer to a causal
question through dialog), application starts, application context changes, selection changes within an interface
(e.g., selecting a page in the resources activity module), and tab switches.
These log files provided data for several analyses that sought to address the three research questions
stated at the beginning of this section. First, a set of analyses were performed to determine an appropriate
temporal support window for the CGA-based analyses. The support window specified the maximum amount
of time that separated two coherent actions before they were considered unrelated1. Using the results of these
analyses, coherence graphs were constructed for each student and traversed in order to calculate the following
CGA metrics (note that all metrics involving time used the amount of time the student spent in the default
application context, i.e., time not spent in practice problem modules):
1. The number of causal link edits and annotations made by the student, normalized by number of minutes
in the default application context.
2. The student’s unsupported edit percentage which is the percentage of map edits that were not supported
by previous actions (see Section 4.3 for the set of coherence relations used in this study).
3. The student’s information viewing percentage, which is the percentage of the student’s time spent
viewing either science resource pages or Betty’s graded answers.
4. The student’s potential generation percentage, which is the percentage of the student’s information
viewing time that could have motivated future causal map edits.
5. The student’s used potential percentage, which is the percentage of the student’s potential generating
time that supported a future causal map edit.
Metrics one and two capture the quantity and quality of the student’s map edits in terms of support.
Metrics three, four, and five capture the quantity and quality of the student’s time viewing either the resources
1In this analysis, support was calculated as a binary attribute of an action, and an action was considered “supported” if any actionwithin the temporal support window supported that action. There are several other more complex approaches to representing support.For example, support may be described as a weighted sum of all support relations, with more recent supporting actions having moreweight.
108

or Betty’s graded answers. These speak to the student’s ability to identify sources of information that could
help them solve their problem (potential generation percentage) and then utilize that information in future
map editing activities (used potential percentage). In these analyses, students had to view a page of the
resources for at least 10 seconds for the action to be considered valid for potential generation and used
potential metrics. Similarly, students had to view a set of graded questions for at least 2 seconds. These
cutoffs filter out irrelevant actions (e.g., a page view created when a student switches to the science resources
tab and then quickly selects a different page to read) and disengaged behavior (e.g., flipping through the
resource pages rapidly). The analyses also employed a measure of disengaged time, which is defined as the
sum of all periods of time, at least 5 minutes long, in which the student neither viewed a source of information
(i.e. science resources or graded questions) for at least 30 seconds nor added, changed, deleted, or annotated
any concepts or links. This metric represents periods of time during which the learner is not measurably
engaged with the system. Disengaged percentage is the percentage of the student’s time spent in disengaged
states (not including time spent in practice problem modules).
ANOVAs were used to measure differences in each behavior metric between groups. With a minimum
power of 0.80, a type I error of 0.05, and the sample size available to us (98 students), this study had the
power to detect effect sizes of f ≥ 0.33 for these analyses.
6.2.1.6 Procedure
The study was conducted over a period of approximately 6 weeks. At the beginning of the study, a researcher
spent 20 minutes introducing students to the causal reasoning used by the system. The focus of this lesson was
on understanding the meaning of increase and decrease links as well as how to reason with them. Students
then spent 25 minutes working on the climate change computer pre-test. During the second day, students
finished the computer pre-test and completed the climate change paper pre-test. During the third day, students
were introduced to the software by Mr. Davis. During this tutorial, Mr. Davis told each student the goal (i.e.,
teaching Betty the correct map) and explained each of the system features. As Mr. Davis explained each
system feature, students were required to use the features in specific ways. For example, Mr. Davis asked
students to create a note with the keyword “animals,” and he did not let them proceed until they had followed
his instructions. Students also practiced deleting notes, adding and deleting concepts and links, annotating
links, asking Betty to take a quiz, and viewing Betty’s quiz results. As Mr. Davis introduced system features,
he explained their importance in completing the Betty’s Brain task. For example, he noted that students had
to teach Betty cause-and-effect relationships from the science resources, and he provided an example of a text
passage that described such a relationship. The full text of Mr. Davis’s training script is presented in Appendix
C. Once students completed the training activities, they spent the remainder of the class period independently
109
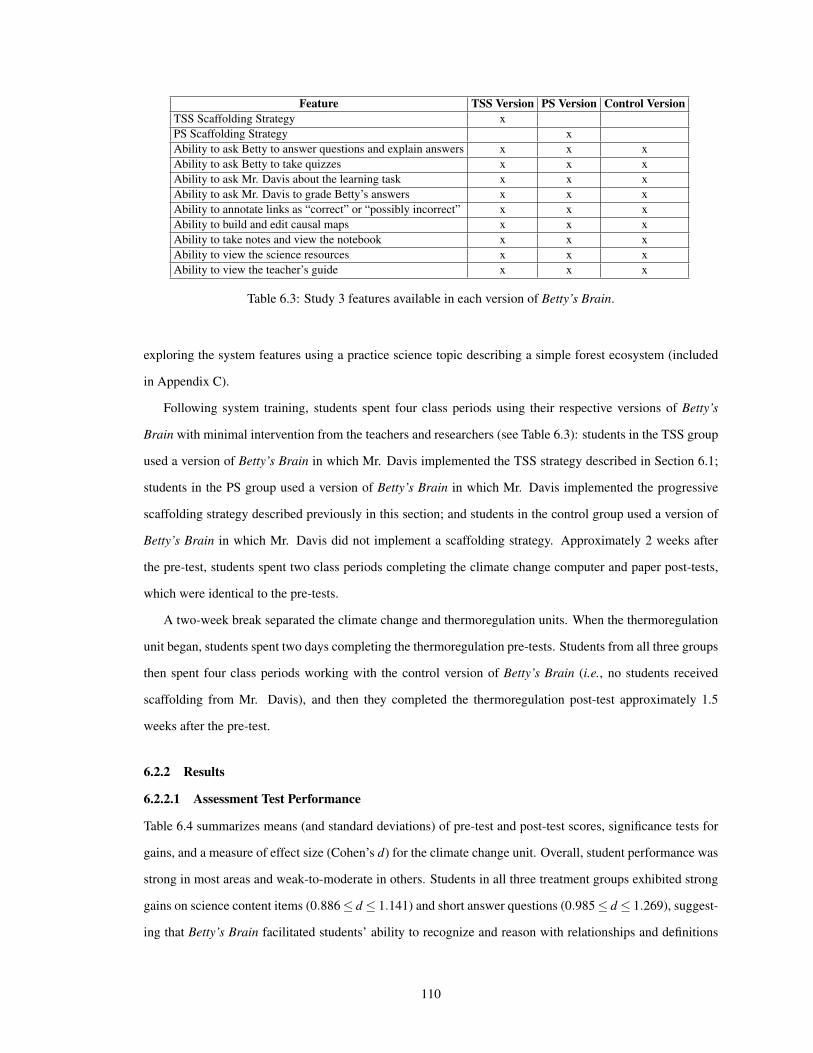
Feature TSS Version PS Version Control VersionTSS Scaffolding Strategy xPS Scaffolding Strategy xAbility to ask Betty to answer questions and explain answers x x xAbility to ask Betty to take quizzes x x xAbility to ask Mr. Davis about the learning task x x xAbility to ask Mr. Davis to grade Betty’s answers x x xAbility to annotate links as “correct” or “possibly incorrect” x x xAbility to build and edit causal maps x x xAbility to take notes and view the notebook x x xAbility to view the science resources x x xAbility to view the teacher’s guide x x x
Table 6.3: Study 3 features available in each version of Betty’s Brain.
exploring the system features using a practice science topic describing a simple forest ecosystem (included
in Appendix C).
Following system training, students spent four class periods using their respective versions of Betty’s
Brain with minimal intervention from the teachers and researchers (see Table 6.3): students in the TSS group
used a version of Betty’s Brain in which Mr. Davis implemented the TSS strategy described in Section 6.1;
students in the PS group used a version of Betty’s Brain in which Mr. Davis implemented the progressive
scaffolding strategy described previously in this section; and students in the control group used a version of
Betty’s Brain in which Mr. Davis did not implement a scaffolding strategy. Approximately 2 weeks after
the pre-test, students spent two class periods completing the climate change computer and paper post-tests,
which were identical to the pre-tests.
A two-week break separated the climate change and thermoregulation units. When the thermoregulation
unit began, students spent two days completing the thermoregulation pre-tests. Students from all three groups
then spent four class periods working with the control version of Betty’s Brain (i.e., no students received
scaffolding from Mr. Davis), and then they completed the thermoregulation post-test approximately 1.5
weeks after the pre-test.
6.2.2 Results
6.2.2.1 Assessment Test Performance
Table 6.4 summarizes means (and standard deviations) of pre-test and post-test scores, significance tests for
gains, and a measure of effect size (Cohen’s d) for the climate change unit. Overall, student performance was
strong in most areas and weak-to-moderate in others. Students in all three treatment groups exhibited strong
gains on science content items (0.886≤ d ≤ 1.141) and short answer questions (0.985≤ d ≤ 1.269), suggest-
ing that Betty’s Brain facilitated students’ ability to recognize and reason with relationships and definitions
110

Measure Maximum Group Pretest Posttest t p d
Science content 7TSS 3.49 (1.44) 5.27 (1.46) 5.824 0.001 1.010PS 3.97 (1.55) 5.12 (1.43) 5.081 0.001 0.886
Control 3.41 (1.56) 5.28 (1.59) 6.463 0.001 1.141
Short answer 13TSS 3.79 (2.44) 6.49 (2.84) 6.515 0.001 1.148PS 4.74 (2.77) 7.38 (2.82) 7.276 0.001 1.269
Control 4.83 (3.60) 7.22 (3.36) 5.553 0.001 0.985
Causal reasoning 20TSS 10.27 (3.38) 11.00 (3.40) 1.158 0.255 0.202PS 9.06 (3.38) 10.42 (4.22) 2.163 0.038 0.384
Control 10.16 (3.14) 10.97 (3.43) 1.291 0.206 0.228
Reading 10TSS 4.12 (1.75) 5.36 (1.64) 4.208 0.001 0.730PS 4.42 (1.86) 5.67 (1.87) 4.756 0.001 0.831
Control 4.50 (1.50) 5.44 (1.74) 3.390 0.002 0.607
Quiz evaluation 14TSS 3.06 (2.38) 5.36 (3.00) 5.227 0.001 0.931PS 4.12 (2.07) 5.12 (1.71) 2.321 0.027 0.407
Control 3.72 (2.22) 6.47 (2.40) 5.614 0.000 0.993
Table 6.4: Study 3 climate change unit test scores.
important for understanding climate change. Students in all three groups also gained moderately-to-strongly
on reading problems (0.607≤ d ≤ 0.831) and quiz evaluation problems (0.407≤ d ≤ 0.993), suggesting that
Betty’s Brain facilitated students’ ability to identify causal relations in text passages and correctly interpret
Betty’s quiz results. Students only exhibited marginal gains on causal reasoning items (0.202≤ d ≤ 0.384),
and only the PS group’s gains reached statistical significance. Thus, students’ use of Betty’s Brain did not
facilitate large increases in students’ ability to reason through abstract causal maps. This may be an effect of
the classroom instruction on causal reasoning delivered just before students completed the pre-test.
Students from the different groups made similar gains on all test items. A repeated-measures ANOVA
run on the data failed to reveal a statistically significant interaction effect of time and group on students’
science content scores (F = 2.046, p = 0.135), short answer scores (F = 0.161, p = 0.852), causal reasoning
problems (F = 0.303, p = 0.739), and reading problems (F = 0.397, p = 0.674). The analysis did reveal
a statistically significant interaction effect of time and group on quiz evaluation problems (F = 4.016, p =
0.021). Students in the PS group gained significantly less on these problems during Unit 1. Together this
suggests that the TSS and progressive scaffolding strategies did not lead to increases in students’ test scores.
Table 6.5 summarizes means (and standard deviations) of pre-test and post-test scores, significant tests
for gains, and a measure of effect size for the thermoregulation unit. Performance on the science content and
short answer items was similar to Unit 1, although the magnitude of the gains was slightly smaller for science
content items (0.710 ≤ d ≤ 0.823) and much larger for short answer questions (1.502 ≤ d ≤ 1.604). This
is largely due to the lower, less varying pre-test scores for these items. Students’ pre-test scores on causal
reasoning and reading problems were slightly higher than the Unit 1 post-test scores, suggesting that students’
ability to execute these skills did not suffer as a result of the two week break. However, students scores on
111

Measure Maximum Group Pretest Posttest t p d
Science content 6TSS 2.36 (1.29) 3.76 (1.79) 4.006 0.001 0.713PS 2.55 (1.30) 3.88 (1.49) 4.070 0.001 0.710
Control 2.53 (1.39) 4.06 (1.63) 4.641 0.001 0.823
Short answer 11TSS 1.05 (1.08) 4.92 (2.77) 8.012 0.001 1.577PS 1.05 (1.03) 4.46 (2.67) 7.781 0.001 1.604
Control 1.19 (1.33) 4.50 (2.21) 8.125 0.001 1.502
Causal reasoning 20TSS 11.58 (3.98) 11.30 (3.80) 0.683 0.500 -0.122PS 11.48 (3.93) 11.94 (4.43) 1.014 0.318 0.182
Control 11.25 (3.52) 11.59 (4.00) 0.847 0.403 0.151
Reading 10TSS 5.85 (1.87) 5.76 (2.14) 0.487 0.629 -0.086PS 6.18 (2.08) 6.48 (2.00) 1.094 0.282 0.189
Control 6.16 (2.03) 6.03 (2.36) 0.519 0.607 -0.098
Quiz evaluation 14TSS 4.67 (2.77) 5.30 (2.83) 1.691 0.101 0.291PS 5.45 (1.91) 5.88 (2.43) 1.269 0.214 0.231
Control 5.69 (2.24) 5.72 (2.28) 0.088 0.930 0.015
Table 6.5: Study 3 thermoregulation unit test scores.
quiz evaluation problems did decrease slightly. Students did not show statistically-significant gains on the
computer-based test scores during Unit 2, suggesting that using Betty’s Brain to learn a second unit did not
support students in developing a greater understanding of causal reasoning, identifying links in text passages,
or evaluating Betty’s quiz results. As in Unit 1, students from the different groups made similar gains on
all Unit 2 test items. A repeated-measures ANOVA run on the data failed to reveal a statistically significant
interaction effect of time and group on science content items (F = 0.091, p = 0.913), short answer questions
(F = 0.464, p = 0.630), causal reasoning problems (F = 0.882, p = 0.417), reading problems (F = 1.006,
p = 0.369), and quiz evaluation problems (F = 0.739, p = 0.480).
Table 6.6 shows the means (and standard deviations) of the best map scores achieved by the students
in each group during each of the two units. Recall that a causal map’s score is the difference between the
number of correct and incorrect links on the map. In both units, the average best map score for students
in each group fell between 6 and 8, meaning that on average, students’ best maps had 6–8 more correct
links than incorrect links. Students’ map scores were similar between the three experimental groups. An
ANOVA run on the data failed to reveal a statistically significant effect of group on best map scores for
climate change (F = 0.359, p = 0.699) and thermoregulation (F = 0.046, p = 0.955). Thus, the TSS and
progressive scaffolding strategies did not have a detectable impact on students’ ability to complete the Betty’s
Brain task.
Together, these results provide insight into the first two questions listed at the beginning of this section.
Regarding the first question, the results demonstrate that students were able to learn skills for executing sev-
eral, but not all, of the tasks necessary for success in Betty’s Brain. The computer test scores achieved during
the Unit 2 post-test were close to 60% of the maximum score for causal reasoning and reading problems and
112

Unit Maximum Group Best Map - Correct Links Best Map - Incorrect Links Best Map Score
Climate Change 25TSS 7.61 (7.64) 1.58 (2.46) 6.03 (6.74)PS 10.21 (8.31) 2.88 (4.03) 7.33 (7.38)
Control 9.22 (7.24) 2.09 (2.46) 7.13 (5.87)
Thermoregulation 15TSS 8.06 (5.59) 1.18 (1.49) 6.88 (5.44)PS 7.46 (5.65) 0.79 (1.32) 6.67 (5.45)
Control 8.16 (5.59) 1.09 (1.61) 7.06 (4.96)
Table 6.6: Study 3 map scores.
just under 50% of the maximum score for quiz evaluation problems. Regarding the second question, the test
scores and map scores failed to reveal any detectable effect of the three-stage scaffolding strategy, suggesting
that it did not impact student learning. However, students’ test scores and map scores were highly variable,
indicating that individual differences in student learning and performance most likely dominated any effect
of the scaffolding strategies implemented by Mr. Davis. To investigate this further, a more detailed set of
analyses investigated the effect of the two scaffolding strategies on students’ behaviors and test score gains.
These results are presented next.
6.2.2.2 Investigating the Effect of the Scaffolding Strategies
The effect of the progressive scaffolding strategy (implemented only during the climate change unit) was
investigated using a measure of hint responsiveness (Segedy et al., 2011a), which is defined as the degree
to which students are accepting of the hints provided by Mr. Davis as he implemented the progressive scaf-
folding strategy. Hint responsiveness is a specific type of coherence in which Mr. Davis’s hints generate
potential for future student actions. Students who take advantage of this potential are said to be more respon-
sive to Mr. Davis’s hints. In the progressive scaffolding strategy, Mr. Davis provided students with hints that
generated two kinds of support: (i) support for reading a page in the resources; and (ii) support for editing
Betty’s map. For each PS group student, we calculated two measures, read hint responsiveness and edit hint
responsiveness, to capture the degree to which students followed up on these hints. Note that some hints
provided support for both reading and editing the map. Hint responsiveness is the percentage of hints that
supported a future action within five minutes of the hint being delivered. To measure the impact of students’
responsiveness on their causal map scores, we also calculated two measures of link edit effectiveness, which
are defined as the percentage of edits supported by Mr. Davis’s hints (or by page views that were supported
by Mr. Davis’s hints) that were correct. These results are presented in Table 6.7.
The results show that on average, PS group students chose not to follow up on several of the hints provided
by Mr. Davis, and they were significantly less responsive to read hints (31.4%) than they were to edit hints
(69.1%). Read hints supported page views that eventually supported an average 6.00 causal link edits and
113

Hint Type Hints Received Hints Utilized Hint Responsiveness Edits Supported Edit EffectivenessRead Hints 14.58 (10.42) 4.73 (5.58) 31.4% (23.4%) 6.00 (9.11) 56.5% (26.0%)Edit Hints 12.67 (11.94) 8.76 (9.28) 69.1% (25.9%) 11.94 (9.61) 64.3% (23.2%)
Table 6.7: Study 3 PS group hint responsiveness means (and standard deviations).
edit hints directly supported an average of 11.94 causal link edits. The effectiveness of these edits was
moderate (56.5% and 64.3%, on average), indicating that students had trouble successfully utilizing some of
Mr. Davis’s hints. In total, PS group students performed an average of 69.18 (σ = 25.45) link edits during
the climate change unit, and Mr. Davis’s hints influenced an average of 24.3% of them.
In the TSS group, Mr. Davis did not provide hints. Rather, he offered to answer students’ questions,
helped students diagnose their own understanding of important skills and strategies, and required students to
practice skills when they continued to struggle over a large number of map edits. Three analyses investigated
the effect of this scaffolding strategy in more detail. The first analysis measured the amount of support
students received from Mr. Davis. On average, students in the TSS group received general learner directed
support 3.00 times (σ = 1.39), diagnosis support 3.21 times (σ = 1.92), and guided practice support 1.55
times (σ = 1.30). Seven out of the 33 students in the TSS group never received guided practice. These
students only triggered Mr. Davis’s support function 3–4 times, meaning they were rarely in a state where 3
out of their last 5 edits were either all unsupported or all ineffective. These students may have been careful to
only edit Betty’s map after finding evidence for their edit in the resources or in quiz results. Alternatively, they
may have found the information in the resources confusing, or they may have been unsure of how to translate
it into the causal map representation. As such, they may have refrained from editing their map frequently. The
remaining students completed an average of 18.93 problems across all guided practice sessions (σ = 11.40).
The small amount of guided practice sessions indicates that students only received guided practice on
1–3 skills out of the 27 listed in Table 6.2. This may explain why students in the TSS group did not achieve
higher learning gains on causal reasoning, reading, and quiz evaluation problems. However, students may
have effectively learned the skills that they practiced. To investigate this, we employed learning curve anal-
ysis (Cen et al., 2006) to investigate students’ skill learning within guided practice sessions. This analysis
technique involves plotting students’ error rate on problems against the number of problems the student has
encountered. If students learn as a result of attempting to solve these problems, their error rate will decrease
with practice. Because of the small number of tutorial sessions available for analysis, the present analysis
created three learning curves: one for causal reasoning problems, one for reading problems, and one for quiz
evaluation problems. These curves are pictured in Figure 6.7.
The learning curves show minimal evidence of learning on causal reasoning and reading problems and
114

Figure 6.7: Study 3 learning curves of guided practice problem performance.
115
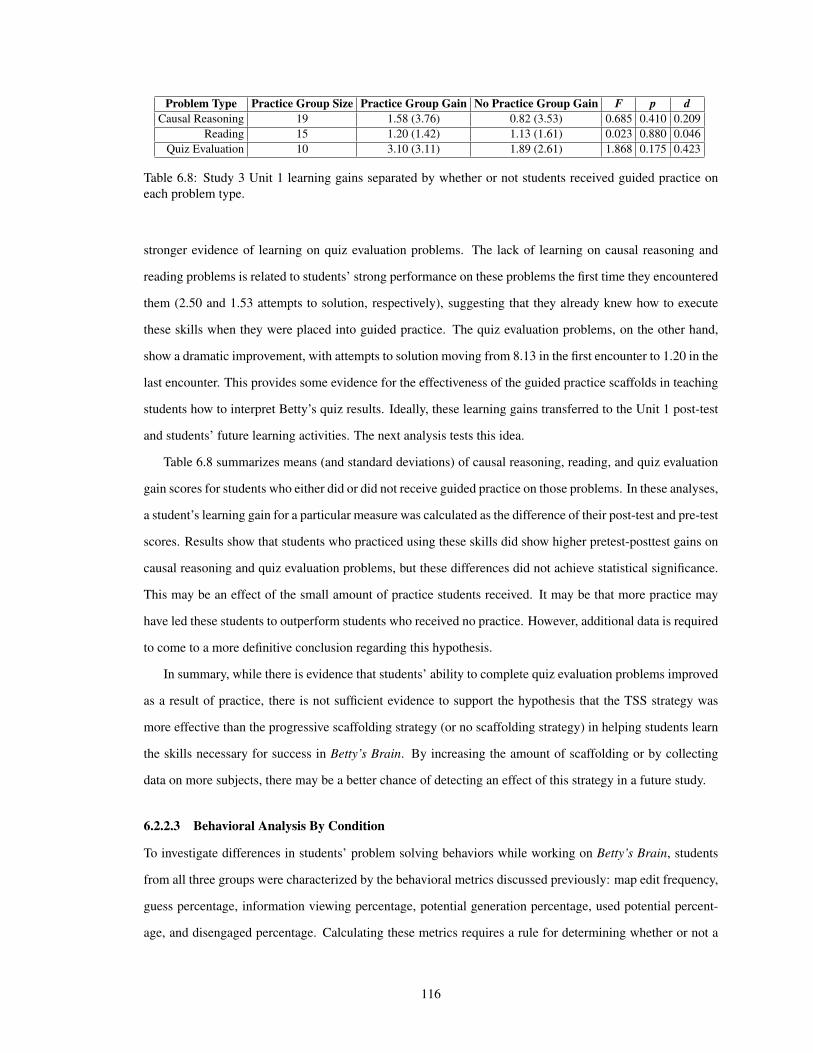
Problem Type Practice Group Size Practice Group Gain No Practice Group Gain F p dCausal Reasoning 19 1.58 (3.76) 0.82 (3.53) 0.685 0.410 0.209
Reading 15 1.20 (1.42) 1.13 (1.61) 0.023 0.880 0.046Quiz Evaluation 10 3.10 (3.11) 1.89 (2.61) 1.868 0.175 0.423
Table 6.8: Study 3 Unit 1 learning gains separated by whether or not students received guided practice oneach problem type.
stronger evidence of learning on quiz evaluation problems. The lack of learning on causal reasoning and
reading problems is related to students’ strong performance on these problems the first time they encountered
them (2.50 and 1.53 attempts to solution, respectively), suggesting that they already knew how to execute
these skills when they were placed into guided practice. The quiz evaluation problems, on the other hand,
show a dramatic improvement, with attempts to solution moving from 8.13 in the first encounter to 1.20 in the
last encounter. This provides some evidence for the effectiveness of the guided practice scaffolds in teaching
students how to interpret Betty’s quiz results. Ideally, these learning gains transferred to the Unit 1 post-test
and students’ future learning activities. The next analysis tests this idea.
Table 6.8 summarizes means (and standard deviations) of causal reasoning, reading, and quiz evaluation
gain scores for students who either did or did not receive guided practice on those problems. In these analyses,
a student’s learning gain for a particular measure was calculated as the difference of their post-test and pre-test
scores. Results show that students who practiced using these skills did show higher pretest-posttest gains on
causal reasoning and quiz evaluation problems, but these differences did not achieve statistical significance.
This may be an effect of the small amount of practice students received. It may be that more practice may
have led these students to outperform students who received no practice. However, additional data is required
to come to a more definitive conclusion regarding this hypothesis.
In summary, while there is evidence that students’ ability to complete quiz evaluation problems improved
as a result of practice, there is not sufficient evidence to support the hypothesis that the TSS strategy was
more effective than the progressive scaffolding strategy (or no scaffolding strategy) in helping students learn
the skills necessary for success in Betty’s Brain. By increasing the amount of scaffolding or by collecting
data on more subjects, there may be a better chance of detecting an effect of this strategy in a future study.
6.2.2.3 Behavioral Analysis By Condition
To investigate differences in students’ problem solving behaviors while working on Betty’s Brain, students
from all three groups were characterized by the behavioral metrics discussed previously: map edit frequency,
guess percentage, information viewing percentage, potential generation percentage, used potential percent-
age, and disengaged percentage. Calculating these metrics requires a rule for determining whether or not a
116

coherence relation is valid. In this analysis, we chose to select a temporal support window: the maximum
amount of time allowed between two actions for them to be considered coherent rather than unrelated.
Determining an appropriate temporal window for CGA is not a straightforward process. Choosing too
large a window might result in an undesirably high amount of false positives (i.e., interpreting a student’s
action as supported by a previous action when, in the student’s mind, the second action was not motivated
by the first). Conversely, choosing too small a window may fail to recognize a large portion of students’
coherent behaviors. To explore this problem, the present analysis calculated all coherence relations from the
logs of all students over both units using a support window of eight hours. This effectively captures every
coherence relation between actions executed on the same day. These relations were then separated into two
categories: support relations in which the potential is generated by a page view and support relations in which
the potential is generated from other sources. Page view actions generate a large amount of potential; they
can support several causal link additions, removals, and sign changes that involve concepts discussed on that
page. Such a large amount of potential generation can be prone to false positives, especially as the size of
the support window increases. In the extreme, a student who views every page of the resources generates
potential for a large number of map edits for as long as these views remain within the window. With a large
enough window, students’ future guesses would be classified as supported by these page views. Conversely,
other supporting actions (e.g., viewing quiz results or listening to a hint from Mr. Davis) generally support
a much narrower set of actions. For example, viewing Betty’s explanation of a correct quiz answer provides
support for marking all links used in that explanation as correct.
Once these relations were separated, they were analyzed in order to determine the percentage of support
relations recognized within support windows of different lengths. The goal was to find a reasonable cutoff that
includes most, but not all, of the non-page view support relations. The results of this analysis are presented
in Figure 6.8. Of the non-page view support relations observed, 63.8% of them took place within a one-
minute window, and 86.7% of them took place within a five-minute window. Thus, when students utilized
information from quizzes, explanations, and Mr. Davis’s feedback, they usually did so within five minutes
of encountering the information. This is in stark contrast to page view support relations, 30.8% of which
occurred within a one-minute support window. When the support window is expanded to ten minutes, it still
only captures 79.7% of the observed support relations. To minimize the inclusion of potential false-positive
page-view support relations, the analyses in this section all utilize a support window of five minutes.
Table 6.9 summarizes means (and standard deviations) of the behavioral metrics and significance tests
for differences between the experimental groups for both units. The results of this analysis show that, as
with the assessment test results, students’ behaviors while using the system were similar across groups and
highly variable within groups. Students edited or annotated links on their causal maps roughly once every
117

Figure 6.8: Study 3 percent of support relations captured in windows of varying sizes.
2 minutes, and about half of these edits were unsupported. It may be that these unsupported edits were
motivated by invalid sources of information. For example, students may be employing a teaching to the test
strategy (Segedy et al., 2011b) in which they attempt to correct Betty’s inability to answer a quiz question at
all by teaching Betty a link that directly connects the two concepts in the question. In choosing the sign of
the link, students may rely on their own prior knowledge rather than reading the resources. Students spent
roughly 13 of their time viewing either the science resources or Betty’s graded answers, and just under 2
3 of
this time was spent viewing information that was useful for improving their causal maps. Unfortunately,
students appear to have had trouble recognizing the information they encountered; just over half of the time
spent viewing helpful sources of information supported a future change to their causal maps. Interestingly,
the used potential % metric during the climate change unit differed significantly between the groups. Students
receiving the TSS scaffolding strategy used significantly less of the potential they generated. One possible
explanation is that students in the TSS group were more hesitant to edit their map after viewing sources of
information. They may have performed poorly on Mr. Davis’s diagnostic test, creating a self awareness
that led to higher levels of caution among these students. Alternatively, Mr. Davis’s interventions may have
prevented these students from utilizing the potential they generated within a five minute period. This may
explain why the difference did not persist during Unit 2.
Students in all three groups spent a moderate amount of time disengaged from the learning task, with 13
and 6 students spending more than 30% of their time on the system disengaged during the climate change
and thermoregulation units, respectively. These numbers are striking, and they illuminate an opportunity for
future improvements to the TSS strategy. When students in the TSS group were disengaged (as defined in
118

Measure Unit TSS Group PS Group Control Group F p
Edits/Annotations per MinClimate Change 0.459 (0.238) 0.534 (0.240) 0.570 (0.256) 1.759 0.178
Thermoregulation 0.561 (0.333) 0.595 (0.393) 0.636 (0.368) 0.339 0.713
Unsupported Edit %Climate Change 57.0% (27.8%) 51.6% (20.9%) 61.0% (23.1%) 1.253 0.290
Thermoregulation 47.5% (23.6%) 41.1% (20.7%) 44.3% (21.6%) 0.680 0.509
Information Viewing %Climate Change 32.5% (14.3%) 31.8% (11.4%) 29.8% (12.2%) 0.406 0.667
Thermoregulation 37.2% (12.1%) 37.1% (10.4%) 36.8% (11.2%) 0.010 0.990
Potential Generation %Climate Change 59.2% (18.5%) 61.4% (19.7%) 64.9% (21.0%) 0.684 0.507
Thermoregulation 63.3% (21.7%) 67.3% (14.4%) 65.4% (14.4%) 0.435 0.648
Used Potential %Climate Change 43.8% (20.4%) 56.7% (18.3%) 56.9% (20.9%) 4.673 0.012
Thermoregulation 59.3% (23.0%) 64.0% (20.1%) 63.7% (19.9%) 0.500 0.608
Disengaged %Climate Change 15.2% (12.3%) 13.8% (10.0%) 18.1% (13.9%) 1.061 0.350
Thermoregulation 11.2% (10.5%) 12.6% (11.2%) 9.8% (9.9%) 0.583 0.560
Table 6.9: Study 3 behavioral metrics for both units.
Section 6.2.1.5), Mr. Davis did not intervene to help them; instead, he only intervened when students made
several ineffective or unsupported changes to their causal maps. In future work, it may be useful to detect
and respond to extended periods of disengagement.
In looking at the differences between the climate change and thermoregulation units, students behaviors
seemed to have improved from Unit 1 (climate change) to Unit 2 (thermoregulation). A repeated-measures
ANOVA performed on this data (without regard to experimental group) confirmed this; it revealed a sig-
nificant effect of Unit on edits/annotations per minute (F = 6.569, p = 0.012), unsupported edit percentage
(F = 33.863, p< 0.001), information viewing percentage (F = 27.389, p< 0.001), used potential percentage
(F = 17.034, p < 0.001), and disengaged percentage (F = 12.275, p = 0.001). Students’ behaviors during
Unit 2 involved lower amounts of unsupported edits and disengaged time as well as more map editing, in-
formation viewing, and used potential. The analysis failed to reveal an effect of time on potential generation
percentage (F = 2.991, p = 0.087), indicating that students did not spend significantly more of their infor-
mation viewing time focusing on information that could help them improve their causal maps during Unit
2.
Overall, these results show that students struggled to succeed in Betty’s Brain despite their strong learning
gains. Their problem-solving approaches included high amounts of unsupported edits and a fairly large
amount of unused potential. Additionally, many students disengaged from the task for extended periods of
time. These results may help explain students’ best map scores, which were relatively low in all three groups.
Students’ behaviors improved from Unit 1 to Unit 2, indicating that their ability to complete the Betty’s Brain
learning task may have improved with experience. As with the learning and performance results presented
earlier, the results presented here show no statistically significant differences in student behaviors between
the groups. Instead, they show high levels of variability within each group for each CGA metric, suggesting
that individual differences most likely dominated any effect of the scaffolding strategies implemented by Mr.
119

Behavior Metrics Best Map Score and Learning GainsBest Map Score Science Content Short Answer Causal Reasoning Reading Quiz Eval.
Edits & Annotations / Min 0.141 0.235* 0.198 0.023 -0.025 0.069Unsupported Edit % -0.546** -0.055 -0.034 -0.034 -0.028 0.251*
Information Viewing % 0.119 -0.105 -0.063 -0.012 -0.143 -0.186Potential Generation % 0.495** 0.048 0.159 0.027 0.209 -0.158
Used Potential % 0.383** -0.074 0.020 0.051 0.085 -0.162Disengaged % -0.353** -0.123 -0.229* -0.160 0.047 0.281*
Note. *p≤ 0.05. **p≤ 0.01.
Table 6.10: Study 3 Unit 1 behavior and performance correlations.
Davis. The next set of analyses examines students’ problem solving behaviors without regard to experimental
condition. These analyses seek to investigate the value of the CGA-based metrics in generating actionable
information that could be used by scaffolding agents and classroom teachers.
6.2.2.4 Correlations between Behavior, Learning, and Performance Metrics
A primary focus of this study is to investigate the value of the CGA-based metrics in providing interpretable,
actionable information about students’ skill levels and problem solving behaviors. Ideally, the CGA-based
learner model creates a comprehensive view of each student that can be used by teachers (and scaffolding
agents in OELEs) to quickly and easily: (i) understand learners’ problem solving approaches and the success
of those approaches; (ii) infer potential reasons for the success level achieved by students; and (iii) make
predictions about students’ learning and performance while using the system. This information can help
classroom teachers assign performance and effort grades, select relevant classroom lessons to cover skills that
students are struggling with, assign homework to reinforce these skills, and make other relevant pedagogical
decisions outside of the system.
The following sets of results stem from multiple exploratory analyses designed to demonstrate the value
of the CGA-based learner model in creating this comprehensive picture. The first analysis investigates the
relationship between the learning and performance results and the behavioral results via bi-variate correla-
tions. Table 6.10 shows the correlations between assessment test results and behavioral metrics for Unit 1. In
this unit, several students (n = 21) achieved high scores on the pre-test short answer questions (8 or higher
out of 13), indicating that they already possessed a strong understanding of the material before using Betty’s
Brain. In order to focus the analysis on the learning, performance, and behavior of students with less prior
knowledge, these 21 students were excluded from this Unit 1 analysis.
The Unit 1 correlations show that several of the behavior metrics were significantly and moderately-to-
strongly correlated with students’ best map scores. Students with higher proportions of unsupported edits and
disengaged time produced lower quality concept maps. Conversely, students with higher levels of potential
generation and used potential percentages produced higher quality concept maps. In addition, some of these
120

Edits & Annotations / Min Unsup. Edit % Info. Viewing % Potential Gen. % Used Potential % Disengaged %Edits & Annotations / Min 1 – – – – –
Unsupported Edit % 0.191 1 – – – –Information Viewing % -0.510** -0.373** 1 – – –Potential Generation % -0.017 -0.515** 0.164 1 – –
Used Potential % 0.108 -0.452** -0.026 0.299** 1 –Disengaged % -0.152 0.391** -0.550** -0.305** -0.108 1
Note. *p≤ 0.05. **p≤ 0.01.
Table 6.11: Study 3 Unit 1 behavior correlations.
metrics were weakly and significantly correlated with learning gains. Students who engaged in higher levels
of editing and annotating causal links scored higher on science content and short answer questions, though
the relationship with short answer questions did not reach statistical significance. Conversely, students who
spent proportionally more time disengaged from the system achieved lower short answer gains. Interestingly,
students with a higher proportion of unsupported edits and disengaged time achieved higher gains on quiz
evaluation problems. These students may have relied on the quiz as their primary source of information,
choosing not to utilize the science resources. To investigate this further, Table 6.11 illustrates the correlations
between the Unit 1 behavior metrics.
These correlations reveal several significant and moderate-to-strong relationships between the Unit 1
behavior metrics. In particular, students who spent more time disengaged had a higher proportion of unsup-
ported map edits and lower amounts of information viewing and potential generation. Additionally, students
who made more edits to their map spent less of their time viewing sources of information, and students who
generated proportionally higher levels of potential used a higher proportion of the potential they generated.
Table 6.12 shows the combined behavior and performance correlations for Unit 2. Because students
achieved very little gain on the Unit 2 skill tests, these metrics were omitted from the analysis. Overall, Unit
2 correlations were similar to those observed during Unit 1. Students’ best map scores were moderately and
positively correlated with science content gain, and they were strongly and positively correlated with short
answer gain, edits and annotations per minute, potential generation percentage, and used potential percentage.
Map scores were also strongly and negatively correlated with unsupported edit percentage and disengaged
percentage. Thus, students who edited their maps more often, viewed proportionally more relevant sources
of information, and attempted to apply that information (via supported edits) achieved higher map scores.
Students’ behavior in the program was also correlated with their learning gains; their short answer question
gains were moderately and significantly correlated with edits and annotations per minute, potential generation
percentage, and used potential percentage. In other words, students who engaged more meaningfully with
the science resources and Betty’s quizzes achieved larger learning gains.
The behavior metrics were again moderately and significantly correlated with each other. Specifically,
students with higher levels of disengagement performed fewer edits per minute as well as a higher proportion
121

Bes
tMap
Sci.
Con
tent
Shor
tAns
.E
dits
&A
nno.
/Min
Uns
up.E
dit%
Info
.Vie
win
g%
Pote
ntia
lGen
.%U
sed
Pote
ntia
l%B
estM
ap1
––
––
––
–Sc
i.C
onte
nt0.
299*
*1
––
––
––
Shor
tAns
.0.
580*
*0.
286*
*1
––
––
–E
dits
&A
nnos
./M
in0.
564*
*0.
155
0.40
2**
1–
––
–U
nsup
.Edi
t%-0
.488
**-0
.124
-0.1
45-0
.135
1–
––
Info
.Vie
win
g%
0.10
5-0
.022
-0.0
70-0
.353
**-0
.266
**1
––
Pote
ntia
lGen
.%0.
408*
*0.
096
0.26
3**
0.13
5-0
.480
**-0
.008
1–
Use
dPo
tent
ial%
0.59
5**
0.16
20.
255*
0.56
9**
-0.4
29**
-0.1
770.
342*
*1
Dis
enga
ged
%-0
.458
**0.
047
-0.1
70-0
.490
**0.
281*
*-0
.386
**-0
.151
-0.3
79**
Not
e.*p≤
0.05
.**p≤
0.01
.
Tabl
e6.
12:S
tudy
3U
nit2
beha
vior
and
perf
orm
ance
corr
elat
ions
.
122

Causal Reasoning Reading Quiz Eval.Causal Reasoning 1 – –
Reading 0.534** 1 –Quiz Eval. 0.168 0.202* 1
Edits & Annos. / Min 0.233* 0.343** 0.191Unsup. Edit % -0.140 -0.240* -0.163
Info. Viewing % 0.071 -0.007 -0.024Potential Gen. % 0.170 0.260** 0.161Used Potential % 0.272** 0.208* 0.241*
Disengaged % -0.141 -0.225* -0.128Note. *p≤ 0.05. **p≤ 0.01.
Table 6.13: Study 3 Unit 2 behavior and skill level correlations.
of unsupported edits. They also spent much less of their time viewing sources of information and they took
advantage of proportionally less of the information they encountered. Overall, these results are encourag-
ing. They show that, at least in this study, students’ behaviors while using the system were predictive of
students’ best map scores and learning gains. In addition, the results show consistent relationships between
the behavior metrics. While some of these correlations were expected (e.g., students with higher levels of
disengagement spent less of their time viewing sources of information), others were not (e.g., students who
spent more of their time viewing sources of information executed far fewer causal link edits and annotations).
When brought together, these correlations can start to explain why particular students experienced more or
less success. For example, the negative correlations in Unit 2 between unsupported edit percentage and in-
formation viewing percentage, potential generation percentage, and used potential percentage along with the
positive correlation between unsupported edit percentage and disengaged percentage suggest a behavior pro-
file characterized by disengagement, effort avoidance, and/or a difficulty in identifying causal links in the
resources. Understanding how students’ skill levels (as obtained via the Unit 2 pre-test) relate to these Unit 2
behavior metrics provides additional insight into this behavior profile. These correlations are shown in Table
6.13.
These results show that students’ skill levels were moderately and significantly correlated with several
behavior metrics. Students with higher causal reasoning skills edited their maps more often and used pro-
portionally more of the potential they generated. Those with higher reading skills edited their maps more
often, executed proportionally fewer unsupported edits, had higher potential generation, higher used poten-
tial percentage, and lower disengaged percentage. Finally, students with higher quiz evaluation skills used
more of the potential they generated. This adds to the behavior profile discussed previously. Students who
were disengaged scored lower on their test of identifying causal links in text passages. These students may
have disengaged from the task because they were unsure of how to proceed. Alternatively, they may have
been exhibiting effort avoidance and disengagement both on the skill test and on the main Betty’s Brain task.
123

In either case, these CGA-based analyses are finer-grained than the HMM and sequence mining analyses
utilized during the first phase of research (presented in Chapter 3). As such, they provide more interpretable
and actionable information for researchers and classroom teachers.
6.2.2.5 Exploratory Clustering and Classification Analyses
To gain a deeper understanding of students’ behavior patterns and their relationship to students’ skill lev-
els, map scores, and learning gains, the next set of analyses involved employing a hierarchical clustering
algorithm to group students based on their behavior metrics. The analysis used a complete-link hierarchical
clustering algorithm (Jain and Dubes, 1988; Murtagh, 1983) to discover groups of similar behavior patterns
within each unit. Each input to the clustering algorithm was one students’ set of behavior metrics calculated
from their activity logs. In these analyses, hierarchical clustering was performed using version 2.7 of the
Orange data mining toolbox (Demsar et al., 2013).
Figure 6.9 illustrates the dendrogram produced from clustering the Unit 1 behavior profiles. In this analy-
sis, distance between data points was calculated using the Euclidean distance metric on students’ normalized
behavior data. The analysis revealed five relatively distinct clusters with a dissimilarity cutoff of approxi-
mately 1.2. The sizes of these clusters, numbered 1-5, varied moderately, containing 23, 35, 16, 10, and 14
students’ behavior profiles. Table 6.14 displays the means (and standard deviations) of the behavior met-
rics for each cluster. Note that in this table, “Edits/Min.” represents the number of causal link edits and
annotations per minute.
The clustering results show distinct behavior profiles among the 98 students in the study. Cluster 1
students (n = 23) may be characterized as frequent researchers and careful editors; these students spent large
amounts of time viewing sources of information and did not edit or annotate links on their maps very often.
Many times, these students viewed information that was useful for improving their maps. However, they
often did not take advantage of this information. When they did edit the map, however, the edit was usually
supported by recent activities. Interestingly, five out of the seven TSS students that never received guided
practice scaffolds fell into this cluster, with the other two students split between clusters 2 and 5. Cluster 2
students (n = 35) may be characterized as strategic experimenters. These students conducted a fair amount
of research before editing their map, and they more often than not used what they learned to motivate future
map edits. However, they also made several guesses (i.e., unsupported edits) as they tried to discover the
correct causal model.
Cluster 3 students (n = 16) may be characterized as confused guessers. These students edited and an-
notated their maps fairly frequently, but usually without support. They spent an average of 30% of their
time viewing sources of information, but most of what they chose to view did not generate potential. One
124

Figure 6.9: Study 3 dendrogram of students’ climate change behavior profiles.
Cluster Edits/Min. Unsup. Edit % Info. View % Poten. Gen. % Used Poten. % Disengaged %1 (Res./Careful Editors) 0.30 (0.10) 34.7% (19.8%) 45.2% (12.3%) 67.8% (15.1%) 48.0% (12.6%) 11.6% (7.3%)2 (Str. Exps.) 0.69 (0.24) 47.8% (19.2%) 30.3% (8.2%) 68.4% (16.9%) 66.6% (13.1%) 7.5% (6.0%)3 (Confused Guessers) 0.49 (0.20) 78.2% (10.7%) 30.0% (9.7%) 47.6% (12.0%) 24.3% (13.7%) 15.4% (8.7%)4 (Disengaged) 0.51 (0.25) 76.2% (15.9%) 20.5% (7.6%) 33.0% (16.9%) 61.1% (22.2%) 31.6% (7.7%)5 (Disengaged) 0.52 (0.19) 75.0% (12.3%) 20.9% (7.4%) 72.0% (14.6%) 50.3% (16.7%) 31.6% (10.8%)
Table 6.14: Study 3 Unit 1 behaviors by cluster.
possibility is that these students struggled to differentiate more and less helpful sources of information. Un-
fortunately, when they did view useful information, it only supported a future edit an average of 24.3% of
the time. Students in Clusters 4 (n = 10) and 5 (n = 14) may be characterized as disengaged from the task.
On average, these students spent more than 30% of their time on the system in a state of disengagement.
The two clusters mainly differ in their potential generation percents, with Cluster 4 generating proportionally
less potential than Cluster 5. Interestingly, these students were active map editors despite their high levels of
disengagement.
Table 6.15 shows the pretest-posttest results broken down by cluster. A repeated-measures ANOVA run
on the data revealed a main effect of cluster on short answer questions (F = 3.509, p = 0.010) and reading
problems (F = 2.538, p = 0.045). The difference in causal reasoning scores across clusters also approached
statistical significance (F = 2.261, p = 0.068). Pairwise comparisons between the clusters showed that: (i)
Cluster 2’s short answer scores were significantly higher than the scores of Clusters 1 (p = 0.049) and 3
125

Measure Maximum Cluster Pretest Posttest t p d
Science content 7
1 (Researchers/Careful Editors) 3.61 (1.16) 5.04 (1.40) 4.580 0.001 0.9582 (Str. Exps.) 3.91 (1.50) 5.69 (1.41) 6.508 0.001 1.1083 (Confused Guessers) 3.25 (1.57) 5.13 (1.41) 4.204 0.001 1.0564 (Disengaged) 3.20 (2.20) 4.90 (1.60) 3.597 0.006 1.2275 (Disengaged) 3.64 (1.55) 4.71 (1.68) 2.446 0.029 0.655
Short answer 13
1 (Researchers/Careful Editors) 4.35 (2.67) 6.63 (2.82) 5.508 0.001 1.1502 (Str. Exps.) 5.36 (3.07) 8.44 (2.72) 8.319 0.001 1.4223 (Confused Guessers) 3.44 (2.82) 6.34 (2.72) 3.744 0.002 0.9364 (Disengaged) 3.10 (2.63) 4.55 (3.05) 2.824 0.020 0.9235 (Disengaged) 4.46 (3.23) 6.68 (2.89) 3.894 0.002 1.054
Causal reasoning 20
1 (Researchers/Careful Editors) 9.17 (3.46) 10.52 (4.37) 2.029 0.055 0.4392 (Str. Exps.) 10.77 (3.80) 12.11 (3.50) 1.876 0.069 0.3173 (Confused Guessers) 9.31 (2.30) 10.25 (2.65) 1.086 0.295 0.2734 (Disengaged) 9.20 (2.90) 8.50 (3.63) 0.761 0.466 0.2475 (Disengaged) 9.57 (2.87) 10.21 (3.12) 0.822 0.426 0.219
Reading 10
1 (Researchers/Careful Editors) 4.17 (1.47) 5.30 (1.22) 3.896 0.001 0.8212 (Str. Exps.) 4.86 (1.82) 5.97 (1.89) 4.365 0.001 0.7343 (Confused Guessers) 4.00 (1.55) 5.00 (1.41) 1.867 0.068 0.4934 (Disengaged) 3.70 (1.25) 4.20 (1.40) 2.236 0.052 0.7215 (Disengaged) 4.21 (2.04) 6.07 (2.09) 3.789 0.002 1.016
Quiz evaluation 14
1 (Researchers/Careful Editors) 3.35 (2.08) 5.17 (2.42) 3.275 0.003 0.6852 (Str. Exps.) 4.34 (2.09) 5.57 (2.59) 2.793 0.009 0.4793 (Confused Guessers) 3.56 (2.78) 6.00 (2.71) 3.538 0.003 0.8854 (Disengaged) 3.60 (1.84) 6.50 (2.22) 3.097 0.013 0.9845 (Disengaged) 2.43 (2.17) 5.57 (2.24) 5.397 0.001 1.444
Table 6.15: Study 3 Unit 1 pretest-posttest results by cluster.
(p = 0.013); (ii) Cluster 2’s reading scores were significantly higher than the scores of Clusters 3 (p = 0.043)
and 4 (p = 0.007); and (iii) Cluster 2’s causal reasoning scores were significantly higher than the scores of
Clusters 1 (p = 0.046) and 4 (p = 0.016). The interaction effect of time and cluster, however, did not reach
statistical significance for any of the learning measures.
These results show that the learning by students in particular behavioral clusters did not differ signif-
icantly. However, students in different clusters performed at different levels on both the pre-test and the
post-test. In particular, Cluster 2 (the strategic experimenters) performed better than Clusters 1, 3, and 4 on
several test metrics. Recall that strategic experimenters were characterized as being more active (in terms of
editing and annotating links), being more engaged, and making proportionally fewer unsupported edits, when
compared to the other clusters. These behaviors may have been at least partially due to their higher levels of
initial understanding as measured by the pre-test scores. It may be that students’ higher ability levels allowed
them to more effectively regulate their own problem solving activities. Another possible explanation is that
these students were, in general, more engaged. They may have exerted more effort on the pre-test, post-test,
and Betty’s Brain learning task. Cluster 1 students (the frequent researchers and careful editors), who spent
more of their time viewing sources of information and edited their maps less often, performed worse on causal
reasoning and short answer questions. These students may have had trouble understanding how to interpret
126

the information they were reading in terms of causal structures. This difficulty in understanding may have
translated to their difficulty in answering the short answer questions, which required students to express their
answers using cause-and-effect reasoning.
Cluster 3 students (confused guessers) were characterized by high unsupported edit percentages and low
potential generation and used potential percentages. These students may have struggled to effectively read the
resources, and this may have led them to rely on Betty’s quiz results as their primary source of information.
However, even quizzes were not used particularly effectively, as more than 34 of their map edits were unsup-
ported. The lower test scores, especially on the reading problems, may help to explain this behavior. These
students may have had trouble interpreting the reading materials, making it difficult for them to succeed in
their task. Finally, Cluster 4 students were characterized by high levels of disengagement and unsupported
edits as well as low levels of information viewing and potential generation. These students scored lower on
tests of reading and causal reasoning. It may be that they did not understand how to complete the Betty’s
Brain task. Alternatively, they may have been disengaged from the task during both the learning assessments
and the Betty’s Brain task.
One interesting result from this analysis lies in the differences between Clusters 4 and 5. Both clusters
were characterized by high levels of information viewing, unsupported edits and disengagement. However,
Cluster 5 students spent much more of their information viewing time generating potential (72% vs. 33% for
Cluster 4 students). Cluster 5 students also seem to have struggled while using Betty’s Brain but performed
comparatively better during the learning assessments. They may have been more comfortable with indepen-
dent reading, and, therefore, successfully identified important information and remembered it well enough
to utilize it during the post-test. In addition, they may have been uncomfortable directing their own com-
plex problem solving activities, or they may have been unwilling to exert the effort necessary to successfully
complete the Betty’s Brain task.
Table 6.16 displays the means (and standard deviations) of the best map scores achieved by students in
each cluster. These scores differed significantly across clusters (F = 6.958, p< 0.001). Pairwise comparisons
between the clusters showed that: (i) Cluster 1 students attained higher map scores than students in Clusters
3 (p = 0.035, Cohen’s d = 0.807) and 4 (p = 0.017, Cohen’s d = 1.267); and (ii) Cluster 2 students attained
higher map scores than students in Clusters 3 (p < 0.001, Cohen’s d = 1.276), 4 (p < 0.001, Cohen’s d =
1.780), and 5 (p = 0.001, Cohen’s d = 1.129).
Overall, students’ behaviors in Unit 1 were largely predictive of their performance and somewhat predic-
tive of their learning. More importantly, the behavior profiles combined with students’ skill level estimates
present a comprehensive picture of common behavior profiles and their associated learning and performance
on the system. To see how students’ behavior profiles changed from Unit 1 to Unit 2, a second clustering
127

Cluster Best Map - Correct Links Best Map - Incorrect Links Best Map Score1 (Researchers/Careful Editors) 9.61 (7.66) 2.13 (2.53) 7.48 (6.71)2 (Str. Exps.) 13.94 (7.64) 3.51 (3.97) 10.43 (7.53)3 (Confused Guessers) 4.00 (4.20) 0.69 (0.87) 3.31 (3.63)4 (Disengaged) 2.40 (2.22) 0.40 (0.84) 2.00 (1.94)5 (Disengaged) 6.14 (5.70) 1.93 (2.37) 4.21 (3.49)
Table 6.16: Study 3 Unit 1 map scores by cluster (max = 25).
Figure 6.10: Study 3 dendrogram of students’ thermoregulation behavior profiles.
analysis was conducted using the Unit 2 data.
Figure 6.10 illustrates the dendrogram produced from clustering the Unit 2 behavior profiles. The analysis
revealed five relatively distinct clusters with a dissimilarity cutoff of approximately 1.35. The sizes of these
clusters, numbered 1-5, varied largely, containing 24, 39, 5, 6, and 24 students’ behavior profiles. Table
6.17 displays the means (and standard deviations) of the behavior metrics for each cluster. As in the Unit 1
analysis, “Edits/Min.” represents the number of causal link edits and annotations per minute.
The Unit 2 clustering analysis identified many of the same behavior profiles that were identified during
the Unit 1 analysis. Cluster 1 students (n = 24) are similar to the frequent researchers and careful editors
from Unit 1. Their behavior is characterized by infrequent editing, and most of these edits were supported.
Cluster 1 students spent an average of 42.4% of their time viewing sources of information, and most of this
time was spent viewing information that generated potential. These students were also disengaged for a fair
amount of time (15.7%). Cluster 2 students (n = 39) are similar to the strategic experimenters from Unit 1.
They are characterized by a moderate amount of editing and annotating, and just over half of their edits and
annotations were unsupported. Additionally, Cluster 2 students viewed sources of information for about 13 of
128

Cluster Edits/Min. Unsup. Edit % Info. View % Poten. Gen. % Used Poten. % Disengaged %1 (Res./Careful Editors) 0.30 (0.11) 29.4% (16.1%) 42.4% (11.0%) 71.4% (10.6%) 58.9% (15.4%) 15.7% (9.9%)2 (Str. Exps.) 0.60 (0.23) 54.4% (14.8%) 33.5% (8.3%) 58.7% (18.9%) 62.6% (16.2%) 10.9% (7.4%)3 (Confused Guessers) 0.21 (0.06) 73.5% (13.5%) 58.9% (7.7%) 45.8% (19.4%) 23.1% (12.6%) 4.8% (5.4%)4 (Disengaged) 0.33 (0.11) 74.7% (17.4%) 27.0% (9.6%) 54.9% (9.3%) 28.0% (8.7%) 33.6% (8.4%)5 (Engaged/Efficient) 1.04 (0.32) 29.1% (15.2%) 35.4% (8.6%) 76.8% (9.5%) 82.0% (9.0%) 3.1% (5.0%)
Table 6.17: Study 3 Unit 2 behaviors by cluster.
their time, and just under 60% of their information viewing time generated potential. These students used a
fair amount of the potential they generated, and were only disengaged for a small proportion of their time on
the system.
Cluster 3 students (n = 5) were characterized by very few edits and annotations (about one edit every five
minutes), and most of these edits were unsupported. Cluster 3 students are similar to the confused guessers
from Unit 1, but with two exceptions: (i) they spent proportionally more of their time viewing sources of
information; and (ii) they edited and annotated causal links far less frequently. Despite this proportionally
larger amount of time viewing information, less than half of what they viewed actually generated potential,
and only an average of 23.1% of the generated potential supported future map edits. Cluster 4 students
(n = 6) are similar to the disengaged students from Unit 1’s Cluster 5. Their behavior is characterized by
infrequent and unsupported edits and annotations, most of these edits were unsupported, and they only spent
about 14 of their time viewing sources of information. Unfortunately, a large proportion of the information
they viewed did not generate potential, and students in this cluster only took advantage of an average of 28%
of the potential they generated.
Cluster 5 students (n = 24) were not similar to any of the Unit 1 clusters; their behavior is characterized
by high levels of editing and annotating links (just over 1 edit per minute), and most of these students’ edits
were supported. Additionally, they spent just over 13 of their time viewing information, and over 3
4 of this
time was spent viewing information that generated potential. These students are distinct from students in the
other four clusters in that they used a large majority of the potential they generated (82.0%) and were rarely
in a state of disengagement (3.1%). In other words, these students appeared to be engaged and efficient. Their
behavior is indicative of students who knew how to succeed in Betty’s Brain and were willing to exert the
necessary effort.
Table 6.18 shows the Unit 2 pretest-posttest results broken down by cluster. A repeated-measures ANOVA
run on the data revealed a main effect of cluster on short answer questions (F = 5.085, p = 0.001), reading
problems (F = 2.819, p = 0.029), and quiz evaluation problems (F = 3.960, p = 0.005). Pairwise compar-
isons between the clusters showed that: (i) Cluster 5’s short answer scores were significantly higher than
the scores of Clusters 1 (p < 0.001), 2 (p = 0.035), 3 (p = 0.031), and 4 (p = 0.009); (ii) Cluster 2’s short
129

Measure Maximum Cluster Pretest Posttest t p d
Science content 6
1 (Researchers/Careful Eds.) 2.17 (1.40) 3.88 (1.51) 3.481 0.002 0.7132 (Str. Exps) 2.59 (1.21) 3.72 (1.73) 4.519 0.001 0.7573 (Confused Guessers) 2.20 (1.79) 3.60 (1.95) 1.247 0.280 0.5584 (Disengaged) 2.83 (1.47) 3.33 (1.21) 0.745 0.490 0.3075 (Engaged & Efficient) 2.58 (1.32) 4.42 (1.59) 5.100 0.001 1.049
Short answer 11
1 (Researchers/Careful Eds.) 0.73 (1.13) 3.46 (2.50) 5.167 0.001 1.1512 (Str. Exps) 1.44 (1.27) 4.53 (2.14) 8.747 0.001 1.4723 (Confused Guessers) 0.70 (0.45) 3.80 (2.68) 2.443 0.071 1.2424 (Disengaged) 0.67 (0.61) 3.42 (2.06) 3.514 0.017 1.8415 (Engaged & Efficient) 1.08 (1.00) 6.44 (2.46) 11.286 0.001 2.687
Causal reasoning 20
1 (Researchers/Careful Eds.) 10.67 (3.71) 11.17 (4.40) 0.891 0.382 0.1872 (Str. Exps) 11.72 (3.75) 11.62 (3.77) 0.249 0.805 0.0393 (Confused Guessers) 9.60 (3.36) 9.80 (3.70) 0.218 0.838 0.0994 (Disengaged) 8.83 (1.33) 9.83 (1.72) 2.236 0.076 0.9715 (Engaged & Efficient) 12.79 (3.97) 12.88 (4.46) 0.200 0.843 0.045
Reading 10
1 (Researchers/Careful Eds.) 5.79 (1.77) 5.88 (1.87) 0.310 0.759 0.0692 (Str. Exps) 5.85 (1.71) 5.97 (2.13) 0.508 0.614 0.0793 (Confused Guessers) 5.80 (3.42) 6.20 (3.27) 1.000 0.374 0.4524 (Disengaged) 4.83 (1.33) 4.00 (1.55) 1.274 0.259 0.5215 (Engaged & Efficient) 7.04 (2.16) 7.00 (2.09) 0.204 0.840 0.040
Quiz evaluation 14
1 (Researchers/Careful Eds.) 5.21 (2.11) 5.75 (3.19) 1.248 0.225 0.2892 (Str. Exps) 5.26 (1.94) 5.64 (1.86) 1.417 0.165 0.2243 (Confused Guessers) 2.00 (2.00) 3.00 (2.83) 1.414 0.230 0.7324 (Disengaged) 5.00 (2.76) 3.67 (2.58) 1.754 0.140 0.7175 (Engaged & Efficient) 6.08 (2.69) 6.54 (2.11) 0.917 0.369 0.191
Table 6.18: Study 3 Unit 2 pretest-posttest results by cluster.
answer scores were significantly higher than the scores of Cluster 1 (p = 0.017); (iii) Cluster 5’s reading
problem scores were significantly higher than the scores of Clusters 1 (p = 0.032), 2 (p = 0.026), and 4
(p = 0.003); (iv) Cluster 5’s quiz evaluation problem scores were significantly higher than the scores of Clus-
ter 4 (p = 0.040); and (v) Cluster 3’s quiz evaluation problem scores were lower than the scores of Clusters
1 (p = 0.005), 4 (p = 0.004), and 5 (p < 0.001).
The analysis also revealed an interaction effect of time and cluster for short answer questions (F = 4.860,
p = 0.001). Follow-up ANOVAs on the pre-test and post-test short answer scores found no significant effect
of cluster on short answer pre-test scores (F = 1.921, p = 0.113), but they did find a significant effect of
cluster on short answer post-test scores (F = 5.699, p < 0.001). Pairwise comparisons between the clusters
showed that Cluster 5’s short answer post-test scores were significantly higher than the scores of Clusters 1
(p < 0.001, Cohen’s d = 1.202), 2 (p = 0.002, Cohen’s d = 0.831), 3 (p = 0.024, Cohen’s d = 1.025), and
4 (p = 0.006, Cohen’s d = 1.336).
These results show that Cluster 5 students, who were characterized as engaged and efficient, had higher
reading scores on the skill tests and learned significantly more of the science information required for the
short answer questions when compared to all other clusters. In contrast, Cluster 3 students, who were charac-
terized as confused guessers, attained significantly lower quiz scores on both the pre-test and post-test when
130

Cluster Best Map - Correct Links Best Map - Incorrect Links Best Map Score1 (Researchers/Careful Eds.) 6.42 (5.69) 0.96 (1.65) 5.46 (5.27)2 (Str. Exps) 7.54 (4.76) 1.41 (1.58) 6.13 (4.40)3 (Confused Guessers) 2.80 (2.39) 0.80 (1.30) 2.00 (2.00)4 (Disengaged) 1.17 (1.94) 0.00 (0.00) 1.17 (1.94)5 (Engaged & Efficient) 12.67 (2.85) 0.75 (1.15) 11.92 (3.37)
Table 6.19: Study 3 Unit 2 map scores by cluster (max = 15).
compared to most other clusters. However, this disadvantage did not measurably prevent them from learning
the science content; their learning gains were not significantly different from the learning gains achieved by
students in Clusters 1, 2, and 4.
Table 6.19 displays the means (and standard deviations) of the best map scores achieved by students in
each cluster. As in the climate change unit, students’ best map scores differed significantly across clusters
(F = 13.851, p < 0.001). Pairwise comparisons between the groups showed that: (i) Cluster 1 students
achieved higher map scores than students in Cluster 4 (p = 0.029, Cohen’s d = 1.190); (ii) Cluster 2 students
achieved higher map scores than students in Clusters 3 (p = 0.043, Cohen’s d = 1.291) and 4 (p = 0.009,
Cohen’s d = 1.565); and (iii) Cluster 5 students achieved higher map scores than students in Clusters 1
(p < 0.001, Cohen’s d = 1.495), 2 (p < 0.001, Cohen’s d = 1.490), 3 (p < 0.001, Cohen’s d = 3.695), and
4 (p < 0.001, Cohen’s d = 4.049). These results are similar to those in Unit 1 in that strategic guessers
achieved higher map scores than both the disengaged students and confused guessers. In addition, frequent
researchers/careful editors also achieved higher map scores than disengaged students. As with the learning
results, engaged and efficient students performed significantly better than all other groups of students.
Overall, students’ behaviors during Unit 2 were similar to those of Unit 1, but there were two key differ-
ences. First, far fewer students exhibited high levels of confusion and disengagement during Unit 2. While
40 students were characterized as either disengaged of confused guessers in Unit 1, only 11 students fell
into these clusters during Unit 2. Second, a new behavior profile emerged in Unit 2 that was not present
in Unit 1. This new profile, characterized by engaged and efficient learning behaviors, was associated with
high levels of success in the system and significantly higher learning gains than other students. As with Unit
1, students’ behavior profiles were strongly predictive of their performance and somewhat predictive of their
learning. The behavior profiles that were consistent across the two units were associated with similar levels of
performance across the two units. This suggests that the CGA-based behavior metrics were consistent across
units within this population, providing some evidence for the value and potential generalization of the CGA
approach. Of course, evidence from different student populations would further strengthen this hypothesis.
To look for patterns in how students’ behaviors changed from Unit 1 to Unit 2, Table 6.20 compares
students’ clusters between the two units. The result of this analysis shows that of the 98 students in this
131

Unit 2 ClusterCluster 1 Cluster 2 Cluster 3 Cluster 4 Cluster 5
(Researchers/Careful Eds.) (Str. Exps.) (Confused Guessers) (Disengaged) (Engaged & Efficient)
Unit 1 Cluster
Cluster 1 8 8 4 0 3(Researchers/Careful Eds.)Cluster 2 5 14 0 1 15(Str. Exps.)Cluster 3 4 7 1 2 2(Confused Guessers)Cluster 4 3 5 0 1 1(Disengaged)Cluster 5 4 5 0 2 3(Disengaged)
Table 6.20: Study 3 shifts in behavior profiles across the two units.
study, 60 of them transitioned from a cluster characterized by less productive behaviors during Unit 1 (e.g.,
confused guessers and disengaged students) to a cluster characterized by more productive behaviors during
Unit 2 (e.g., strategic experimenters and engaged and efficient students). Of the remaining 38 students, 28 of
them remained in the same or a similar cluster during Unit 2, and the remaining 10 of them moved to less
productive clusters during Unit 2. An analysis of students’ behavioral shifts based on their treatment group
(i.e., TSS, PS, or NS) revealed no relationships between groups and particular shifts.
Interestingly, most of the students who were disengaged during Unit 1 shifted to either strategic experi-
menters (10 out of 24) or frequent researchers/careful editors (7 out of 24). Another interesting trend involves
the engaged and efficient students during Unit 2. Most of the students in this cluster (15 out of 24) were clas-
sified as strategic experimenters in Unit 1. Recall that strategic experimenters achieved the most success
during Unit 1 and a fair amount of success during Unit 2. In addition, students from several different clus-
ters shifted to the strategic experimenters during Unit 2. In fact, the Unit 2 strategic experimenters cluster
is the largest of the Unit 2 clusters. Based on the previous analyses, strategic experimenters tended to have
a fair amount of skills and to remain engaged with the task. These students executed a mix of supported
and unsupported edits and achieved moderate causal map scores. In contrast, engaged and efficient students
tended to have comparatively higher skill levels and achieved higher learning gains and causal map scores.
One possible explanation for these results is that several strategic experimenters transitioned to engaged and
efficient students as their skill levels increased.
In general, several students from all of the Unit 1 clusters either exhibited similar or improved behavior
profiles during Unit 2. This upward trend in performance is associated with students’ skill improvements (as
indicated on the Unit 2 pre-test). It may be that when students better understood their task, they were better
prepared to engage with Betty’s Brain in a more effective manner.
132

6.2.3 Discussion
Study 3 provided valuable insight into the three broad research questions that this study was designed to
investigate. The first question related to students’ effectiveness in executing the tasks necessary for success
in Betty’s Brain, and the results produced by this study were encouraging. Students in all experimental
conditions exhibited strong, significant gains on the science content while also improving their skills related
to causal reasoning, reading, and quiz evaluation. By the end of both units, students’ average scores on the
skill tests were close to 60% of the maximum score for causal reasoning and reading problems and just under
50% of the maximum score for quiz evaluation problems. Thus, even though students learned a significant
portion of these skills, there was still room for growth. This is somewhat disappointing, especially when
combined with the fact that students’ skill test scores did not improve during Unit 2. It may be that students
were not exposed to many of the more difficult skills, such as identifying the causal link in the sentence
“Ticks increase when Tacks are decreased.” Perhaps with additional practice of and exposure to these skills
students may have been able to master them.
The second question related to the effectiveness of the TSS scaffolding strategy in helping students learn
the skills they need in order to succeed in completing the Betty’s Brain task. Unfortunately, the results of this
study offered only suggestive, inconclusive evidence in support of the strategy. Students in the TSS group did
not learn significantly more causal reasoning, reading, or quiz evaluation skills than students in the other two
groups. Upon closer inspection, the results showed that TSS students did not receive large amounts of guided
practice. However, this practice was associated with higher (but not significantly higher) gains on the Unit
1 skill tests. One potential explanation for the low amount of guided practice is that the rules for triggering
support failed to take advantage of the full breadth of information provided by CGA. More specifically, these
rules only considered the effectiveness and support of the student’s most recent causal link edits. Thus, less
active map editors did not receive support, even when they needed it. This may explain why five out of
the seven TSS group students that did not receive any guided practice were in the “frequent researchers and
careful editors” cluster. These students edited their map far less than other students. In addition, they viewed
sources of information for longer periods of time and generated a large amount of potential, approximately
half of which went unused. If the TSS scaffolding agent had chosen to offer support to students in response
to low levels of potential generation or used support, these students may have received the help they needed.
Another opportunity for improving the TSS scaffolding agent can be seen in the large amount of disengaged
behavior observed in this study. In the future, the TSS strategy can specifically detect and respond to such
disengaged behavior by offering support and encouragement, quizzing students to gauge their understanding
of important skills and background knowledge, offering alternative educational exercises such as guided
133
practice, and, if necessary, alerting the classroom teacher. A third opportunity for improving the scaffolding
algorithm would be in improving the algorithm used to select the skills for guided practice. The learning
curve analysis showed that many students were required to practice using skills they were already proficient
in. These students may have been better served by practicing more challenging skills.
The third question related to the effectiveness of the CGA-based learner model in providing interpretable,
actionable information about students’ strengths, weaknesses, and problem solving behaviors while using
Betty’s Brain, and in this regard, the results were highly encouraging. The correlation analysis showed that
the CGA-based metrics were strongly predictive of map scores and weakly-to-moderately predictive of learn-
ing gains. In addition, the clustering analyses revealed several distinct behavioral profiles, some of which
exhibited significant differences in content knowledge, map scores, skill levels, and learning gains. These
profiles, especially when combined with students’ skill and knowledge levels, were interpretable and action-
able. They provided valuable insight into why students might have been struggling and how to help them
improve. Importantly, the information gained from CGA provided far more insight into student behaviors,
and with much less data and computation, than the HMM and sequence mining analyses employed in Studies
1 and 2. Moreover, one of our classroom teachers, when shown an earlier version of these results, commented
that the student behaviors he was seeing matched his experience with and understanding of those students (J.
Parsons, personal communication, February 13, 2014).
Another interesting finding concerns the changes in students’ learning and problem-solving from Unit
1 to Unit 2. In this study, students’ overall behaviors during Unit 2 reflected more engaged and effective
problem solving compared to Unit 1. Moreover, students’ learning gains during Unit 2 were even stronger
than they were in Unit 1. In other words, many students in this study exhibited a productive strategy shift.
Students’ behaviors during Unit 2, along with their higher skill test scores during the Unit 2 pretest, indicate
that students possessed stronger task understanding and metacognitive knowledge during Unit 2.
Although many students in this study exhibited similar or improved behavior profiles during Unit 2, a
small number of students actually did exhibit less effective behavior profiles during Unit 2. Of the five
students who were characterized as “confused guessers” during Unit 2, four of them had been previously
characterized as “frequent researchers and careful editors.” Similarly, of the three students who shifted into
a “disengaged” behavior during Unit 2, two of them had been classified as “confused guessers” during Unit
1. It may be that students follow a predictable trajectory toward either the “engaged & efficient” or the
“disengaged” profiles. In this case, the data suggests the possibility of a trajectory from “frequent researchers
and careful editors” to “confused guessers” to “disengaged students.” In the positive direction, the data
suggests the possibility of an upward trajectory from “frequent researchers and careful editors,” “confused
guessers,” or “disengaged students” to “strategic experimenters” to “engaged & efficient students.” Additional
134

data could help discern whether or not such predictable trajectories exist and are visible via the CGA-based
metrics.
Altogether, this study utilized an approach to measuring and scaffolding students that addressed several of
the limitations of the first two studies (as discussed in Section 3.3.1). The CGA approach successfully identi-
fied and characterized students according to their learning behaviors, and the results of the CGA analysis were
interpretable and actionable. In addition, the approach utilized here collected additional data not collected
during previous studies, particularly information about students’ skill levels in causal reasoning, reading, and
quiz evaluation. This data further strengthened the ability to interpret CGA metrics and diagnose students’
misunderstandings.
135

CHAPTER 7
Discussion and Conclusions
Open-ended computer-based learning environments (OELEs) provide students with a learning context and a
set of tools for seeking out information, creating problem solutions, and testing those solutions. To support
students in their learning and problem solving, these environments sometimes include computer-based scaf-
folding agents: software agents that model and support students as they use the system. In doing so, these
agents create opportunities for students to recognize their own knowledge gaps and misunderstandings and
then take actions to correct them. However, a computer-based scaffolding agent’s ability to support students is
dependent on both its methods for analyzing a student’s behaviors and the library of scaffolds (i.e., supportive
actions) that it can perform.
The research presented in this dissertation has focused on expanding the repertoire of scaffolding agents
in OELEs. To effectively scaffold students in these environments, a scaffolding agent requires methods for in-
terpreting both the correctness of students’ solution construction actions and the amount of task understanding
and metacognitive knowledge students exhibit during their problem-solving processes. Additionally, when
students struggle to complete their task, scaffolding agents in OELEs need methods for: (i) diagnosing the
causes of students’ difficulties in the context of the tasks they are performing; and (ii) using this diagnosis to
select and deliver appropriate scaffolds that help students overcome any identified weaknesses in their under-
standing. Importantly, these scaffolds should prepare students for future problem solving by teaching them
the skills they need to succeed in their problem solving tasks. To date, few (if any) OELEs have incorporated
scaffolding agents that perform these tasks. Thus, this dissertation research represents a novel approach to
developing scaffolding agents in OELEs, and it makes valuable contributions to and helps advance the fields
of learning sciences and educational technology.
7.1 Contributions to the Development of Scaffolding Agents
A significant portion of this research involved developing a novel approach to modeling and scaffolding learn-
ers in OELEs. The coherence graph analysis (CGA) approach to learner modeling (presented in Chapter 4) is
more comprehensive than the approaches utilized in previously-developed OELEs (presented in Chapter 2);
in addition to measuring the correctness of the students’ actions and their simple usage statistics, CGA explic-
itly represents information about student’s skill levels and problem solving approaches. To measure students’
skill levels, CGA analyzes their performance on simple exercises that align with those skills; to measure stu-
dents’ problem solving approaches, CGA represents students’ behaviors as a coherence graph, where nodes
136
represent students’ actions and directed links represent coherence relations between those actions.
This approach provides data about students’ approaches to open-ended problem-solving that is not avail-
able in previously-developed OELEs. In particular, the coherence graph provides greater insight into students’
open-ended problem-solving behaviors by illustrating relationships between actions that bring students into
contact with information and actions that utilize that information. An important advantage of coherence
graphs is their generality. Modifying the information contained in a coherence graph only requires specifying
new coherence and incoherence relations. Thus, coherence graphs and algorithms for traversing them are in-
herently general, and they can be used to explore learner behavior in a variety of ways and in several different
OELEs.
The three-stage scaffolding (TSS) strategy includes a more diverse set of scaffolds than the scaffolding
strategies utilized in previously-developed OELEs. The scaffolding strategies in these systems mainly focus
on reviewing information the student has just encountered, telling students that an aspect of their solution
is incorrect, and making general suggestions about how to proceed. Should students continue to struggle
despite receiving scaffolds, these systems typically adopt one of two approaches: (i) they tell students exactly
what they need to do to advance toward their goal, or (ii) they continue to provide general suggestions while
letting students continue to struggle. The TSS strategy provides an alternative to this approach; it involves
interacting with students in order to construct a more accurate understanding of their skill levels, and it then
works to address underdeveloped skills through guided practice scaffolds. In effect, this strategy attempts
to teach students how to achieve success for themselves, and it represents a novel approach to automated
scaffolding in OELEs.
In order to implement and test CGA and the TSS strategy within the Betty’s Brain learning environment,
the Betty’s Brain software was redesigned and reimplemented. The resulting CAILE architecture is general
and flexible, and it provides several new features not available in previous versions of Betty’s Brain.
7.2 Contributions to the Understanding of Students’ Open-Ended Problem Solving Behaviors
The primary contribution of this research is the analysis and characterization of students’ open-ended
problem-solving behaviors via the CGA-based learner modeling approach. The CGA-based learner model
and TSS strategy were tested during Study 3 (presented in Chapter 6), and the study sought to address the
following research questions:
1. How effective is the CGA-based learner model in providing interpretable and actionable information
about students’ strengths, weaknesses, and problem solving behaviors as they use Betty’s Brain?
2. How effective is the three-stage scaffolding strategy in helping students learn how to succeed in com-
137

pleting the Betty’s Brain task?
Results of this study showed that students’ problem-solving behaviors were strongly predictive of map
scores and weakly-to-moderately predictive of learning gains, demonstrating the potential value of this ap-
proach in identifying students who are not benefiting from their use of the system. One of the more important
findings of the clustering analyses was the set of distinct behavioral profiles among the students, including:
• Frequent Researchers and Careful Editors, who spent large amounts of time viewing sources of
information but did not utilize a lot of the information that they encountered. When they did edit their
maps, these edits were usually supported by the information they had been viewing. These students
seemed to be engaged with the task, but may not have understood how to independently construct their
maps. The careful approach of these students was beneficial; it resulted in higher quality concept maps
when compared to the maps created by some of the other identified clusters.
• Strategic Experimenters, who spent a fair amount of time viewing and utilizing sources of infor-
mation but who also made several guesses as they tried to discover the correct causal model. These
students were active in their problem solving; they were more knowledgeable, more skillful and created
higher quality causal maps than students from some of the other clusters.
• Confused Guessers, who spent small amounts of time viewing helpful sources of information and did
not utilize the information they viewed. Instead, these students edited their map without support from
the resources or Betty’s quiz results, and the quality of their resulting causal maps were lower than
those of students from some of the other clusters.
• Disengaged Students, who spent an average of more than 30% of their time on the system in a state of
disengagement. These students were less skillful and created lower quality causal maps than students
from some of the other clusters.
• Engaged and Efficient Students, who edited their maps frequently, rarely edited their maps without
support, and used a high proportion of the potential that they generated. These students were more
skillful, created higher quality causal maps, and learned more than students from all other clusters.
The identification of these behavior profiles provides insight into students’ problem-solving behaviors
that was not previously available to teachers or scaffolding agents. Another particularly important aspect of
these results was the persistence of clusters from Unit 1 to Unit 2 of Study 3. In this study, despite significant
changes in students’ behaviors, the common behavior profiles identified during the clustering analyses were
similar during both units.
138

By comparing students’ behaviors during Units 1 and 2, the analysis also revealed a productive strategy
shift: of the 98 students who took part in this study, 60 of them moved from a cluster characterized by less
productive behaviors during Unit 1 (e.g., confused guessers and disengaged students) to a cluster charac-
terized by more productive behaviors during Unit 2 (e.g., strategic experimenters and engaged and efficient
students). Of the remaining 38 students, 28 of them remained in the same or a similar cluster during Unit 2,
and the remaining 10 of them moved to less productive clusters during Unit 2. Students’ behaviors during
Unit 2 indicated that they possessed stronger task understanding and metacognitive knowledge. This increase
in task understanding was associated with higher skill levels as measured during the Unit 2 pretest, pro-
viding support for the hypothesis that students’ open-ended problem solving behaviors improve when they
gain a stronger understanding of skills important for information seeking, solution construction, and solution
evaluation.
Together, these results provide some support for the three-stage scaffolding strategy tested during this
study. The strategy attempted to diagnose students’ skill levels and help them learn and practice under-
developed skills. Unfortunately, the analyses of the Unit 1 data failed to reach any conclusions about the
value of this scaffolding strategy. The data analysis showed that students only received guided practice on
1–3 skills out of the 27 listed in Table 6.2. Follow up analyses showed suggestive (but inconclusive) evidence
in support of the TSS strategy; the learning curve analysis showed that students improved in their ability to
complete quiz evaluation problems during guided practice. Additionally, the comparison of students who did
and did not receive guided practice showed that students who did receive guided practice achieved higher (but
not statistically significantly higher) gains on causal reasoning and quiz evaluation problems. Future work
will be required to investigate the value of this approach in more depth.
7.3 Future Research Directions
This dissertation research represents a starting point for developing more advanced learner modeling and
scaffolding techniques for open-ended learning environments. Additional research is needed in order to
investigate productive uses of the information available via CGA and more complex automated scaffolding
strategies. Promising research directions include:
Refining the TSS strategy. Section 6.2.3 identified several potential improvements to the TSS strategy
tested during Study 3, including: (i) intervening when students exhibit disengaged behavior, (ii) intervening
when students use a small proportion of the potential they generate; and (iii) revising the algorithm used for
skill selection. In addition, the strategy could be modified to offer guided practice more quickly, especially
when students’ skill levels are extremely low. Future work could test the value of these improvements. Ideally,
they would lead to more effective automated scaffolding for students.
139

Testing the generality of the CGA-based learner modeling approach. Section 4.1 presented the task
model for OELEs, which contained a layer of OELE-general tasks, a layer of Betty’s Brain-specific tasks,
and the interface features in Betty’s Brain (see Figure 4.2). One implication of this model is that it should
be possible to make similar models for other OELEs and then use those models to apply the CGA approach
to learner modeling in those environments. It may be that the task model presented here must be adjusted to
accommodate the needs and restrictions of other learning environments, and future research could investigate
this possibility and, if necessary, refine the task model and modify the approach to utilizing CGA in these
environments.
Incorporating OELEs with CGA into middle school classrooms. Future research is needed to develop
and study the value of reports of students’ performance and behavior for classroom teachers using OELEs
such as Betty’s Brain (an example of such a report is included as Appendix D). Ideally, classroom teachers
could use these reports to quickly and easily: (i) understand learners’ problem solving approaches and the
success of those approaches; (ii) infer potential reasons for the success level achieved by students; and (iii)
make predictions about students’ learning and performance while using the system. This information can help
classroom teachers assign performance and effort grades, select relevant classroom lessons to cover skills that
students are struggling with, assign homework to reinforce these skills, and make other relevant pedagogical
decisions outside of the system. However, research is required to understand how best to present and use this
data with classroom teachers.
Investigating the predictive power of additional CGA-based metrics. In utilizing CGA during Study
3, six CGA-based metrics were utilized and calculated for each student, and these metrics effectively dif-
ferentiated students and predicted aspects of their learning and performance. However, it may be that other
CGA metrics could better predict learning and performance or create a more comprehensive understanding
of student behavior. For example, it may be valuable to represent actions based on the amount of support
they had rather than whether or not they had any support. As another example, it may be valuable to investi-
gate CGA-based metrics that incorporate more fine-grained aspects of how students’ behaviors change over
time. A valuable future direction would involve collecting additional OELE log data, calculating CGA-based
metrics for that data, and identifying additional aspects of CGA data that are predictive of learning and perfor-
mance. A related direction would involve calculating data from students in multiple age groups/populations
and searching for relationships in the data that generalize over these populations.
Validating the identified behavior profiles. The clustering analyses employed during Study 3 identi-
fied a number of behavior profiles across the two instructional units. Further research could investigate: (i)
whether or not these behavior profiles continue to appear in additional data; and (ii) additional behavior pro-
files not identified in this study. In addition, Section 6.2.3 discussed a productive strategy shift that took place
140

when students used Betty’s Brain to learn about a second science topic, and we hypothesized possible trajec-
tories for students as they gain experience using Betty’s Brain. Collecting additional data could help identify
patterns in these strategy shifts and potentially identify positive and negative behavior shifts. These would
provide additional value to classroom teachers and educational psychology researchers in understanding how
students’ approaches to open-ended learning evolve over longer periods of time.
141

REFERENCES
Agrawal, R. and Srikant, R. (1995). Mining sequential patterns. In Proceedings of the Eleventh IEEEInternational Conference on Data Engineering, pages 3–14.
Aleven, V., McLaren, B., Roll, I., and Koedinger, K. (2006). Toward meta-cognitive tutoring: A model of helpseeking with a cognitive tutor. International Journal of Artificial Intelligence in Education, 16(2):101–128.
Anderson, J. (1996). Act: A simple theory of complex cognition. American Psychologist, 51(4):355–365.
Anderson, J., Corbett, A., Koedinger, K., and Pelletier, R. (1995). Cognitive tutors: Lessons learned. TheJournal of the Learning Sciences, 4(2):167–207.
Azevedo, R. (2005). Using hypermedia as a metacognitive tool for enhancing student learning? the role ofself-regulated learning. Educational Psychologist, 40(4):199–209.
Azevedo, R., Cromley, J., and Seibert, D. (2004). Does adaptive scaffolding facilitate students’ ability toregulate their learning with hypermedia? Contemporary Educational Psychology, 29(3):344–370.
Azevedo, R. and Hadwin, A. (2005). Scaffolding self-regulated learning and metacognition - implicationsfor the design of computer-based scaffolds. Instructional Science, 33(5):367–379.
Azevedo, R., Harley, J., Trevors, G., Duffy, M., Feyzi-Behnagh, R., Bouchet, F., and Landis, R. (2013).Using trace data to examine the complex roles of cognitive, metacognitive, and emotional self-regulatoryprocesses during learning with multi-agent systems. In Azevedo, R. and Aleven, V., editors, InternationalHandbook of Metacognition and Learning Technologies, pages 427–449. Springer.
Azevedo, R. and Jacobson, M. (2008). Advances in scaffolding learning with hypertext and hypermedia: Asummary and critical analysis. Educational Technology Research and Development, 56(1):93–100.
Azevedo, R., Johnson, A., Chauncey, A., and Burkett, C. (2010a). Self-regulated learning with metatutor:Advancing the science of learning with metacognitive tools. In Khine, M. and Saleh, I., editors, NewScience of Learning, pages 225–247. Springer.
Azevedo, R., Landis, R., Feyzi-Behnagh, R., Duffy, M., Trevors, G., Harley, J., Bouchet, F., Burlison, J.,Taub, M., Pacampara, N., Yeasin, M., Rahman, A., Tanveer, M., and Hossain, G. (2012). The effectivenessof pedagogical agents’ prompting and feedback in facilitating co-adapted learning with metatutor. In Cerri,S., Clancey, W., Papadourakis, G., and Panourgia, K., editors, Intelligent Tutoring Systems, volume 7315of Lecture Notes in Computer Science, pages 212–221. Springer.
Azevedo, R., Moos, D., Johnson, A., and Chauncey, A. (2010b). Measuring cognitive and metacognitive regu-latory processes during hypermedia learning: Issues and challenges. Educational Psychologist, 45(4):210–223.
Azevedo, R. and Witherspoon, A. (2009). Self-regulated learning with hypermedia. In Hacker, D., Donlosky,J., and Graesser, A., editors, Handbook of Metacognition in Education, pages 319–339. Taylor & Francis.
Baker, R., Corbett, A., Koedinger, K., Evenson, S., Roll, I., Wagner, A., Naim, M., Raspat, J., Baker, D., andBeck, J. (2006). Adapting to when students game an intelligent tutoring system. In Ikeda, M., Ashley, K.,and Chan, T., editors, Intelligent Tutoring Systems, volume 4053 of Lecture Notes in Computer Science,pages 392–401. Springer.
Baker, R., D’Mello, S., Rodrigo, M., and Graesser, A. (2010). Better to be frustrated than bored: The inci-dence, persistence, and impact of learners’ cognitive-affective states during interactions with three differentcomputer-based learning environments. International Journal of Human-Computer Studies, 68(4):223–241.
142

Baker, R., Goldstein, A., and Heffernan, N. (2011). Detecting learning moment-by-moment. InternationalJournal of Artificial Intelligence in Education, 21(1-2):5–25.
Baker, R., Gowda, S., Wixon, M., Kalka, J., Wagner, A., Salvi, A., Aleven, V., Kusbit, G., Ocumpaugh,J., and Rossi, L. (2012). Towards sensor-free affect detection in cognitive tutor algebra. In Yacef, K.,Zaıane, O., Hershkovitz, H., Yudelson, M., and Stamper, J., editors, Proceedings of the 5th InternationalConference on Educational Data Mining, pages 126–133. International Educational Data Mining Society.
Baker, R. and Yacef, K. (2009). The state of educational data mining in 2009: A review and future visions.Journal of Educational Data Mining, 1(1):3–17.
Barab, S., Hay, K., Barnett, M., and Keating, T. (2000). Virtual solar system project: Building understandingthrough model building. Journal of Research in Science Teaching, 37(7):719–756.
Benjamin, A., editor (2005). Differentiated instruction using technology: A guide for middle & HS teachers.Eye on Education, Larchmont, NY.
Biswas, G., Jeong, H., Kinnebrew, J., Sulcer, B., and Roscoe, R. (2010). Measuring self-regulated learningskills through social interactions in a teachable agent environment. Research and Practice in Technology-Enhanced Learning, 5(2):123–152.
Biswas, G., Kinnebrew, J., and Segedy, J. (2012). Modeling student behaviors in an open-ended learningenvironment. In Duffy, V., editor, Advances in Applied Human Modeling and Simulation, pages 202–211,San Francisco, CA. CRC Press.
Biswas, G., Leelawong, K., Schwartz, D., and Vye, N. (2005). Learning by teaching: A new agent paradigmfor educational software. Applied Artificial Intelligence, 19(3-4):363–392.
Biswas, G., Roscoe, R., Jeong, H., and Sulcer, B. (2009). Promoting self-regulated learning skills in agent-based learning environments. In Kong, S., Ogata, H., Arnseth, H., C.K.K, C., Hirashima, T., Klett, F.,Lee, J., Liu, C., Looi, C., Milrad, M., Mitrovic, A., Nakabayashi, K., Wong, S., and Yang, S., editors,Proceedings of the 17th International Conference on Computers in Education, pages 67–74, Hong Kong.Asia-Pacific Society for Computers in Education.
Biswas, G. and Sulcer, B. (2010). Visual exploratory data analysis methods to characterize student progressin intelligent learning environments. In Proceedings of the 2010 International Conference on Technologyfor Education (T4E), pages 114–121, Mumbai. IEEE.
Bondareva, D., Conati, C., Feyzi-Behnagh, R., Azevedo, R., and Bouchet, F. (2013). Inferring learning fromgaze data during interaction with an environment to support self-regulated learning. In Lane, H., Yacef,K., Mostow, J., and Pavlik, P., editors, Artificial Intelligence in Education, volume 7926 of Lecture Notesin Computer Science, pages 229–238. Springer.
Bouchet, F., Harley, J., Trevors, G., and Azevedo, R. (2013). Clustering and profiling students according totheir interactions with an intelligent tutoring system fostering self-regulated learning. Journal of Educa-tional Data Mining, 5(1):104–146.
Bransford, J., Brown, A., and Cocking, R., editors (2000). How People Learn. National Academy Press,Washington, D.C.
Bransford, J. and Schwartz, D. (1999). Rethinking transfer: A simple proposal with multiple implications.Review of Research in Education, 24(1):61–101.
Bravo, C., van Joolingen, W., and de Jong, T. (2006). Modeling and simulation in inquiry learning: Checkingsolutions and giving intelligent advice. Simulation, 82(11):769–784.
Brown, A. (1975). The development of memory: Knowing about knowing, and knowing how to know. InReese, H., editor, Advances in child development and behavior, pages 103–152, New York, NY. AcademicPress.
143
Brown, J. and Burton, R. (1978). Diagnostic models for procedural bugs in basic mathematical skills. Cog-nitive Science, 2(2):155–192.
Brunstein, A., Betts, S., and Anderson, J. (2009). Practice enables successful learning under minimal guid-ance. Journal of Educational Psychology, 101(4):790–802.
Brush, T. and Saye, J. (2001). The use of embedded scaffolds with hypermedia-supported student-centeredlearning. Journal of Educational Multimedia and Hypermedia, 10(4):333–356.
Burton, R. and Brown, J. (1979). An investigation of computer coaching for informal learning activities.International Journal of Man-Machine Studies, 11(1):5–24.
Butler, D. and Winne, P. (1995). Feedback and self-regulated learning: A theoretical synthesis. Review ofEducational Research, 65(3):245–281.
Cen, H., Koedinger, K., and Junker, B. (2006). Learning factors analysis - a general method for cognitivemodel evaluation and improvement. In Ikeda, M., Ashley, K., and Chan, T., editors, Intelligent TutoringSystems, volume 4053 of Lecture Notes in Computer Science, pages 164–175. Springer.
Chase, C., Chin, D., Oppezzo, M., and Schwartz, D. (2009). Teachable agents and the protege effect: In-creasing the effort towards learning. Journal of Science Education and Technology, 18(4):334–352.
Chen, Z. and Klahr, D. (1999). All other things being equal: acquisition and transfer of the control of variablesstrategy. Child Development, 70(5):1098–1120.
Chi, M. (2009). Active-constructive-interactive: A conceptual framework for differentiating learning activi-ties. Topics in Cognitive Science, 1:73–105.
Chi, M., Siler, S., Jeong, H., Yamauchi, T., and Hausmann, R. (2001). Learning from human tutoring.Cognitive Science, 25:471–533.
Chipman, S., Schraagen, J., and Shalin, V. (2000). Introduction to cognitive task analysis. In Schraagen, J.,Chipman, S., and Shalin, V., editors, Cognitive Task Analysis, pages 3–23. Psychology Press.
Clarebout, G. and Elen, J. (2008). Advice on tool use in open learning environments. Journal of EducationalMultimedia and Hypermedia, 17(1):81–97.
Clark, D., Nelson, B., Chang, H., Martinez-Garza, M., Slack, K., and D’Angelo, C. (2011). Exploringnewtonian mechanics in a conceptually-integrated digital game: Comparison and learning and affectiveoutcomes for students in taiwan and the united states. Computers & Education, 57(3):2178–2195.
Clarke, J. and Dede, C. (2005). Making learning meaningful: An exploratory study of using multi user virtualenvironments (muves) in middle school science. In Paper presented at the American Educational ResearchAssociation Conference.
Conati, C., Muldner, K., and Carenini, G. (2006). From example studying to problem solving via tailoredcomputer-based meta-cognitive scaffolding: Hypotheses and design. Technology, Instruction, Cognition,and Learning, 4(2):139–190.
Corbett, A. and Anderson, J. (1995). Knowledge tracing: Modeling the acquisition of procedural knowledge.User Modeling and User-Adapted Interaction, 4:253–278.
Crews, T., Biwas, G., Goldman, S., and Bransford, J. (1997). Anchored interactive learning environments.International Journal of Artificial Intelligence in Education, 8(2):142–178.
Cross, D. and Paris, S. (1988). Developmental and instructional analyses of children’s metacognition andreading comprehension. Journal of Educational Psychology, 80(2):131–142.
Demsar, J., Curk, T., Erjavec, A., Crt Gorup, Hocevar, T., Milutinovic, M., Mozina, M., Polajnar, M., Toplak,M., Staric, A., Stajdohar, M., Umek, L., Zagar, L., Zbontar, J., Zitnik, M., and Zupan, B. (2013). Orange:Data mining toolbox in python. Journal of Machine Learning Research, 14:2349–2353.
144

Flavell, J. (1976). Metacognitive aspects of problem solving. In Resnick, L., editor, The Nature of Intelli-gence, pages 231–236, Hillsdale, NJ. Erlbaum.
Flavell, J. (1979). Metacognition and cognitive monitoring: A new area of cognitive–developmental inquiry.American psychologist, 34(10):906–911.
Flavell, J., Miller, P., and Miller, S. (1985). Cognitive Development. Prentice-Hall, Englewood Cliffs, NJ.
Florez-Puga, G., Gomez-Martın, M., Gomez-Martın, P., Dıaz-Agudo, B., and Gonzalez-Calero, P. (2009).Query-enabled behavior trees. IEEE Transactions on Computational Intelligence and AI in Games,1(4):298–308.
Forbus, K. (1984). Qualitative process theory. Artificial Intelligence, 24(1-3):85–168.
Fosnot, C., editor (2005). Constructivism: theory, perspectives, and practice. Teachers College Press, NewYork, NY, 2nd edition.
Gamma, E., Helm, R., Johnson, R., and Vlissides, J. (1994). Design Patterns: Elements of Reusable Object-Oriented Software. Addison-Wesley Professional.
Graesser, A. and McNamara, D. (2010). Self-regulated learning in learning environments with pedagogicalagents that interact in natural language. Educational Psychologist, 45(4):234–244.
Greene, J. and Azevedo, R. (2007). A theoretical review of winne and hadwin’s model of self-regulatedlearning: new perspectives and directions. Review of Educational Research, 77:334–372.
Hacker, D. and Donloskey, J., editors (2009). Handbook of metacognition in education. Taylor & Francis,New York, NY.
Hadwin, A., Wozney, L., and Pontin, O. (2005). Scaffolding the appropriation of self-regulatory activity:A socio-cultural analysis of changes in teacher-student discourse about a graduate research portfolio. In-structional Science, 33(5-6):413–450.
Hennessey, M. (1999). Probing the dimensions of metacognition: Implications for conceptual changeteaching-learning. In Paper presented at the Annual Meeting of the National Association for Researchin Science Teaching. ERIC.
Hilbert, T. and Renkl, A. (2008). Concept mapping as a follow-up strategy to learning from texts: whatcharacterizes good and poor mappers? Instructional Science, 36:53–73.
Jain, A. and Dubes, R. (1988). Algorithms for clustering data. Prentice Hall, Upper Saddle River.
Jeong, H. and Biswas, G. (2008). Mining student behavior models in learning-by-teaching environments. InBaker, R., Barnes, T., and Beck, J., editors, Proceedings of the 1st International Conference on EducationalData Mining, pages 127–136. International Educational Data Mining Society.
Jeong, H., Gupta, A., Roscoe, R., Wagster, J., Biswas, G., and Schwartz, D. (2008). Using hidden markovmodels to characterize student behaviors in learning-by-teaching environments. In Woolf, B., Aımeur,E., Nkambou, R., and Lajoie, S., editors, Intelligent Tutoring Systems, volume 5091 of Lecture Notes inComputer Science, pages 614–625. Springer.
Johnson, W., Rickel, J., and Lester, J. (2000). Animated pedagogical agents: Face-to-face interaction ininteractive learning environments. International Journal of Artificial Intelligence in Education, 11(1):47–78.
Jonassen, D. (1991). Objectivism versus constructivism: Do we need a new philosophical paradigm? Edu-cational Technology Research and Development, 39(3):5–14.
Kalyuga, S. and Sweller, J. (2005). Rapid dynamic assessment of expertise to improve the efficiency ofadaptive e-learning. Educational Technology Research and Development, 53(3):83–93.
145

Kapur, M. (2008). Productive failure. Cognition and Instruction, 26:379–424.
Kinnebrew, J. and Biswas, G. (2012). Identifying learning behaviors by contextualizing differential sequencemining with action features and performance evolution. In Yacef, K., Zaıane, O., Hershkovitz, H., Yudel-son, M., and Stamper, J., editors, Proceedings of the 5th International Conference on Educational DataMining, pages 57–64. International Educational Data Mining Society.
Kinnebrew, J., Loretz, K., and Biswas, G. (2013). A contextualized, differential sequence mining method toderive students’ learning behavior patterns. Journal of Educational Data Mining, 5(1):190–219.
Koedinger, K. and Corbett, A. (2006). Cognitive tutors: technology bringing learning science to the class-room. In Sawyer, K., editor, The cambridge handbook of the learning sciences, pages 61–78, New York,NY. Cambridge University Press.
Koedinger, K., Corbett, A., and Perfetti, C. (2012). The knowledge-learning-instruction framework: Bridgingthe science-practice chasm to enhance robust student learning. Cognitive Science, 36:757–798.
Land, S. (2000). Cognitive requirements for learning with open-ended learning environments. EducationalTechnology Research and Development, 48(3):61–78.
Land, S. and Hannafin, M. (1997). Patterns of understanding with open-ended learning environments: Aqualitative study. Educational Technology Research and Development, 45(2):47–73.
Land, S., Hannafin, M., and Oliver, K. (2012). Student-centered learning environments: Foundations, as-sumptions and design. In Jonassen, D. and Land, S., editors, Theoretical Foundations of Learning Envi-ronments, pages 3–25, New York, NY. Routledge.
Leelawong, K. and Biswas, G. (2008). Designing learning by teaching agents: The betty’s brain system.International Journal of Artificial Intelligence in Education, 18(3):181–208.
Luckin, R. and du Boulay, B. (1999). Ecolab: The development and evaluation of a vygotskian designframework. International Journal of Artificial Intelligence in Education, 10(2):198–220.
Luckin, R. and Hammerton, L. (2002). Getting to know me: Helping learners understand their own learningneeds through metacognitive scaffolding. In Cerri, S., Gouardres, G., and Paraguau, F., editors, IntelligentTutoring Systems, volume 2363 of Lecture Notes in Computer Science, pages 759–771. Springer.
Lumpe, A. and Butler, K. (2002). The information seeking strategies of high school science students. Re-search in Science Education, 32(4):549–566.
Mannila, H., Toivonen, H., and Inkeri Verkamo, A. (1997). Discovery of frequent episodes in event se-quences. Data Mining and Knowledge Discovery, 1(3):259–289.
Martinez, M. (2006). What is metacognition? Phi Delta Kappan, pages 696–699.
Mayer, R. (2004). Should there be a three-strikes rule against pure discovery learning? American Psycholo-gist, 59(1):14–19.
McLaren, B., Lim, S., Gagnon, F., Yaron, D., and Koedinger, K. (2006). Studying the effects of personalizedlanguage and worked examples in the context of a web-based intelligent tutor. In Ikeda, M., Ashley, K.,and Chan, T., editors, Intelligent Tutoring Systems, volume 4053 of Lecture Notes in Computer Science,pages 318–328. Springer.
McNamara, D. (2004). Sert: Self-explanation reading training. Discourse Processes, 38(1):1–30.
McQuiggan, S., Rowe, J., Lee, S., and Lester, J. (2008). Story-based learning: The impact of narrativeon learning experiences and outcomes. In Woolf, B., Aımeur, E., Nkambou, R., and Lajoie, S., editors,Intelligent Tutoring Systems, volume 5091 of Lecture Notes in Computer Science, pages 530–539. Springer.
Mendicino, M., Razzaq, L., and Heffernan, N. (2009). Comparison of traditional homework with computersupported homework. Journal of Research on Technology in Education, 41(3):331–359.
146

Millan, E., Loboda, T., and de-la Cruz, J. P. (2010). Bayesian networks for student model engineering.Computers & Education, 55(4):1663–1683.
Mitrovic, A. (2003). An intelligent sql tutor on the web. International Journal of Artificial Intelligence inEducation, 13(2):171–195.
Murtagh, F. (1983). A survey of recent advances in hierarchical clustering algorithms. The Computer Journal,26(4):354–359.
Nelson, T. (1996). Consciousness and metacognition. American Psychologist, 51:102–116.
Nesbit, J. and Adesope, O. (2006). Learning with concept and knowledge maps. Review of EducationalResearch, 76:413–448.
Novak, J., editor (1998). Learning, creating, and using knowledge: Concept maps as facilitative tools inschools and corporations. Erlbaum, Mahwah, NJ.
Palma, R., Gonzalez-Calero, P., Gomez-Martın, M., and Gomez-Martın, P. (2011). Extending case-basedplanning with behavior trees. In Proceedings of the Twenty-Fourth International Florida Artificial Intelli-gence Research Society Conference, pages 407–412. AAAI.
Pea, R. (2004). The social and technological dimensions of scaffolding and related theoretical concepts forlearning, education, and human activity. The Journal of the Learning Sciences, 13(3):423–451.
Perry, N. and Winne, P. (2006). Learning from learning kits: gstudy traces of students’ self-regulated engage-ments with computerized content. Educational Psychology Review, 18(3):211–228.
Pintrich, P. (2004). A conceptual framework for assessing motivation and self-regulated learning in collegestudents. Educational Psychology Review, 16:385–407.
Puntambekar, S. and Hubscher, R. (2005). Tools for scaffolding students in a complex learning environment:What have we gained and what have we missed? Educational Psychologist, 40(1):1–12.
Quintana, C., Reiser, B., Davis, E., Krajcik, J., Fretz, E., Duncan, R., Kyza, E., Edelson, D., and Soloway, E.(2004). From example studying to problem solving via tailored computer-based meta-cognitive scaffold-ing: Hypotheses and design. The Journal of the Learning Sciences, 13(3):337–386.
Rabiner, L. (1989). A tutorial on hidden markov models and selected applications in speech recognition. InProceedings of the IEEE, pages 257–286.
Reiser, B. (2004). Scaffolding complex learning: The mechanisms of structuring and problematizing studentwork. The Journal of the Learning Sciences, 13:273–304.
Rodrigo, M., Baker, R., Agapito, J., Nabos, J., Repalam, C., Jr., S. R., and Pedro, M. S. (2012). The effectsof an interactive software agent on student affective dynamics while using an intelligent tutoring system.IEEE Transactions on Affective Computing, 3(2):224–236.
Roll, I., Holmes, N., Day, J., and Bonn, D. (2012). Evaluating metacognitive scaffolding in guided inventionactivities. Instructional Science, 40:691–710.
Roll, I., McLaren, B., and Koedinger, K. (2011). Improving students’ help-seeking skills using metacognitivefeedback in an intelligent tutoring system. Learning and Instruction, 21(2):267–280.
Romero, C. and Ventura, S. (2010). Educational data mining: A review of the state of the art. IEEE Transac-tions on Systems, Man, and Cybernetics, 40(6):601–618.
Roscoe, R. and Chi, M. (2007). Understanding tutor learning: knowledge-building and knowledge-telling inpeer tutors’ explanations and questions. Review of Educational Research, 77(4):534–574.
147

Roscoe, R., Segedy, J., Sulcer, B., Jeong, H., and Biswas, G. (2013). Shallow strategy development in ateachable agent environment designed to support self-regulated learning. Computers & Education, 62:286–297.
Rowe, J., Shores, L., Mott, B., and Lester, J. (2011). Integrating learning, problem solving, and engagementin narrative-centered learning environments. International Journal of Artificial Intelligence in Education,21(1-2):115–133.
Sabourin, J., Shores, L., Mott, B., and Lester, J. (2012). Predicting student self-regulation strategies in game-based learning environments. In Cerri, S., Clancey, W., Papadourakis, G., and Panourgia, K., editors,Intelligent Tutoring Systems, volume 7315 of Lecture Notes in Computer Science, pages 22–32. Springer.
Sao Pedro, M., Baker, R., and Gobert, J. (2013). Incorporating scaffolding and tutor context into bayesianknowledge tracing to predict inquiry skill acquisition. In D’Mello, S., Calvo, R., and Olney, A., editors,Proceedings of the 6th International Conference on Educational Data Mining, pages 185–192. Interna-tional Educational Data Mining Society.
Saye, J. and Brush, T. (2002). Scaffolding critical reasoning about history and social issues in multimedia-supported learning environments. Educational Technology Research and Development, 50(3):77–96.
Schmidt, D., Stal, M., Rohnert, H., and Buschmann, F. (2000). Pattern-Oriented Software ArchitectureVolume 2: Patterns for Concurrent and Networked Objects. Wiley.
Schraw, G., Crippen, K., and Hartley, K. (2006). Promoting self-regulation in science education: Metacogni-tion as part of a broader perspective on learning. Research in Science Education, 36(1):111–139.
Schraw, G., Kauffman, D., and Lehman, S. (2002). Self-regulated learning theory. In Nadel, L., editor, Theencyclopedia of cognitive science, pages 1063–1073. Nature Publishing Company, London, England.
Schraw, G. and Moshman, D. (1995). Metacognitive theories. Educational psychology review, 7(4):351–371.
Schwartz, D., Lindgren, R., and Lewis, S. (2009). Constructivism in an age of non-constructivist assessments.In Sigmund, T. and Duffy, T., editors, Constructivist Instruction: Success or Failure?, pages 34–61, NewYork, NY. Routledge/Taylor & Francis Group.
Segedy, J., Biswas, G., Blackstock, E., and Jenkins, A. (2013a). Guided skill practice as an adaptive scaf-folding strategy in open-ended learning environments. In Lane, H., Yacef, K., Mostow, J., and Pavlik, P.,editors, Artificial Intelligence in Education, volume 7926 of Lecture Notes in Computer Science, pages532–541. Springer.
Segedy, J., Biswas, G., and Sulcer, B. (2014). A model-based behavior analysis approach for open-endedenvironments. The Journal of Educational Technology & Society, 17(1):272–282.
Segedy, J., Kinnebrew, J., and Biswas, G. (2011a). Investigating the relationship between dialogue respon-siveness and learning in a teachable agent environment. In Biswas, G., Bull, S., Kay, J., and Mitrovic,A., editors, Artificial Intelligence in Education, volume 6738 of Lecture Notes in Computer Science, pages547–549. Springer.
Segedy, J., Kinnebrew, J., and Biswas, G. (2011b). Modeling learners’ cognitive and metacognitive strategiesin an open-ended learning environment. In Advances in cognitive systems: Papers from the AAAI FallSymposium, pages 297–304, Menlo Park, CA. AAAI Press.
Segedy, J., Kinnebrew, J., and Biswas, G. (2012a). Relating student performance to action outcomes andcontext in a choice-rich learning environment. In Cerri, S., Clancey, W., Papadourakis, G., and Panourgia,K., editors, Intelligent Tutoring Systems, volume 7315 of Lecture Notes in Computer Science, pages 505–510. Springer.
148

Segedy, J., Kinnebrew, J., and Biswas, G. (2012b). Supporting student learning using conversational agentsin a teachable agent environment. In van Aalst, J., Thompson, K., Jacobson, M., and Reimann, P., editors,The future of learning: Proceedings of the 10th international conference of the learning sciences (ICLS2012): Vol. 2. Short Papers, Symposia, and Abstracts, pages 251–255. International Society of the LearningSciences.
Segedy, J., Kinnebrew, J., and Biswas, G. (2013b). The effect of contextualized conversational feedbackin a complex open-ended learning environment. Educational Technology Research and Development,61(1):71–89.
Segedy, J., Loretz, K., and Biswas, G. (2013c). Model-driven assessment of learners in an open-endedlearning environment. In Proceedings of the Third International Conference on Learning Analytics andKnowledge, pages 200–204, New York, NY. ACM.
Segedy, J., Loretz, K., and Biswas, G. (2013d). Suggest-assert-modify: A taxonomy of adaptive scaffolds incomputer-based learning environments. In Walker, E. and Looi, C., editors, Workshop Proceedings of the16th International Conference on Artificial Intelligence in Education, volume 1009 of CEUR WorkshopProceedings, pages 73–80. CEUR.
Sengupta, P., Kinnebrew, J., Basu, S., Biswas, G., and Clark, D. (2013). Integrating computational thinkingwith k-12 science education using agent-based computation: A theoretical framework. Educational andInformation Technologies, 18(2):351–380.
Sherin, B., Reiser, B., and Edelson, D. (2004). Scaffolding analysis: Extending the scaffolding metaphor tolearning artifacts. The Journal of the Learning Sciences, 13(3):387–421.
Shute, V. (2008). Focus on formative feedback. Review of Educational Research, 78(1):153–189.
Spires, H., Rowe, J., Mott, B., and Lester, J. (2011). Problem solving and game-based learning: Effectsof middle grade students’ hypothesis testing strategies on learning outcomes. Journal of EducationalComputing Research, 44(4):453–472.
Stone, A. (1998). The metaphor of scaffolding: Its utility for the field of learning disabilities. Journal ofLearning Disabilities, 31:344–364.
Suh, J. and Moyer, P. (2007). Developing students’ representational fluency using virtual and physical algebrabalances. The Journal of Computers in Mathematics and Science Teaching, 26(2):155–173.
van Joolingen, W., de Jong, T., Lazonder, A., Savelsbergh, E., and Manlove, S. (2005). Co-lab: Research anddevelopment of an online learning environment for collaborative scientific discovery learning. Computersin Human Behavior, 21(4):671–688.
VanLehn, K. (1988). Student modeling. In Polson, M. and Richardson, J., editors, Foundations of IntelligentTutoring Systems, pages 55–78. Lawrence Erlbaum.
VanLehn, K. (2006). The behavior of tutoring systems. International Journal of Artificial Intelligence inEducation, 16(3):227–265.
VanLehn, K., Lynch, C., Schulze, K., Shapiro, J., Shelby, R., Taylor, L., Treacy, D., Weinstein, A., andWintersgill, M. (2005). The andes physics tutoring system: Lessons learned. International Journal ofArtificial Intelligence in Education, 15(3):147–204.
Veenman, M. (2011). Learning to self-monitor and self-regulate. In Mayer, R. and Alexander, P., editors,Handbook of Research on Learning and Instruction, pages 197–218, New York, NY. Routledge.
Veenman, M. (2012). Metacognition in science education: Definitions, constituents, and their intricate rela-tion with cognition. In Zohar, A. and Dori, Y., editors, Metacognition in Science Education, pages 21–36.Springer.
149

Veenman, M. (2013). Assessing metacognitive skills in computerized learning environments. In Azevedo,R. and Aleven, V., editors, International Handbook of Metacognition and Learning Technologies, vol-ume 26 of Springer International Handbooks of Education, pages 157–168, New York, NY. SpringerScience+Business Media.
Veenman, M. and Spaans, M. (2005). Relation between intellectual and metacognitive skills: Age and taskdifferences. Learning and individual differences, 15(2):159–176.
Vygotsky, L., editor (1978). Mind in society: The development of higher psychological processes. HarvardUniversity Press, Cambridge, MA.
Wagster, J., Tan, J., Biswas, G., and Schwartz, D. (2007). Do learning by teaching environments withmetacognitive support help students develop better learning behaviors? In McNamara, D. and Trafton, J.,editors, Proceedings of the 29th Annual Meeting of the Cognitive Science Society, pages 695–700, Austin,TX. Cognitive Science Society.
Wenger, E., editor (1987). Artificial Intelligence and Tutoring Systems. Morgan Kaufman.
Whitebread, D. and Cardenas, V. (2012). Self-regulated learning and conceptual development in youngchildren: The development of biological understanding. Metacognition in Science Education, pages 101–132.
Whitebread, D., Coltman, P., Pasternak, D., Grau, C. S. V., Bingham, S., Almeqdad, Q., and Demetriou,D. (2009). The development of two observational tools for assessing metacognition and self-regulatedlearning in young children. Metacognition and Learning, 4(1):63–85.
Winne, P. (1996). A metacognitive view of individual differences in self-regulated learning. Learning andindividual differences, 8(4):327–353.
Winne, P. (2001). Self-regulated learning viewed from models of information processing. In Zimmerman,B. and Schunk, D., editors, Self-regulated learning and academic achievement: Theoretical perspectives,pages 153–189. Erlbaum.
Winne, P. and Hadwin, A. (1998). Studying as self-regulated learning. In Hacker, D., Dunlosky, J., andGraesser, A., editors, Metacognition in Educational Theory and Practice, pages 277–304. Lawrence Erl-baum Associates Publishers.
Winters, F., Greene, J., and Costich, C. (2008). Self-regulation of learning within computer-based learningenvironments: A critical synthesis. Educational Psychology Review, 20(4):429–444.
Wood, D., Bruner, J., and Ross, G. (1976). The role of tutoring in problem solving. Journal of ChildPsychology and Psychiatry, 17(2):89–100.
Wood, H. and Wood, D. (1999). Help seeking, learning and contingent tutoring. Computers & Education,33:153–169.
Young, A. and Fry, J. (2008). Metacognitive awareness and academic achievement in college students.Journal of the Scholarship of Teaching and Learning, 8(2):1–10.
Zimmerman, B. and Schunk, D., editors (2001). Self-regulated learning and academic achievement: Theo-retical perspectives. Lawrence Erlbaum Associates, Mahwah, NJ.
Zimmerman, B. and Schunk, D., editors (2011). Handbook of self-regulation of learning and performance.Routledge, New York, NY.
Zohar, A. and Dori, Y., editors (2012). Metacognition in science education. Springer.
150

Appendix A
Reference Materials for Study 1
A.1 Assessment Test Questions
A.1.1 Science Content Questions
1. What is thermoregulation?
(a) Thermoregulation is the body’s process of keeping the body from getting too hot or too cold.
(b) Thermoregulation is the normal or “regular” temperature of the body, which is about 37 degrees
Celsius.
(c) Thermoregulation is a disease that causes people to be unable to control their own body tempera-
ture.
(d) Thermoregulation includes all of the processes the body uses to stay in balance.
2. How does the hypothalamus determine if the body is too cold?
(a) Sensors in the skin measure the body’s skin temperature, and they send that information to the
hypothalamus.
(b) The hypothalamus measures the temperature of the blood flowing through the heart.
(c) The hypothalamus receives information from the muscles when they get cold and start to shiver.
(d) The hypothalamus receives information from the sensors in the skin and measures the tem-
perature of the blood that flows through the brain.
3. How does the hypothalamus regulate body temperature when the body gets too cold?
(a) The hypothalamus causes the heart to speed up. This will help blood flow to cold areas of the
body and warm them up.
(b) The hypothalamus causes blood vessels to become wider. Wider blood vessels allow more blood
to flow to parts of the body that are cold.
(c) The hypothalamus causes skeletal muscles to stop moving. When we get cold, we start to shiver,
and shivering wastes too much energy and causes us to lose body heat.
(d) None of the above.
4. What is shivering, and how does it help regulate body temperature?
151

(a) Shivering is the contraction and relaxation of skeletal muscles. This slows down the blood flow
to keep more heat in the body.
(b) Shivering is the contraction of skeletal muscles, which increases body temperature by increasing
blood flow to the skin.
(c) Shivering is the contraction of muscles in the skin, which increases body temperature by causing
the whole body to shake.
(d) Shivering is the contraction and relaxation of skeletal muscles, which increases body tem-
perature by creating friction in the muscles.
5. How do blood vessels change when the body is exposed to cold temperatures?
(a) Cold causes contraction, so the blood vessels exposed to cold temperatures contract.
(b) The hypothalamus responds to cold skin temperatures by making the blood vessels near the
skin narrower. This reduces blood flow to the skin, preventing heat loss from the body.
(c) The hypothalamus responds to cold skin temperatures by making the blood vessels near the skin
wider. This increases blood flow to the skin and keeps the skin warm.
(d) The cold causes the skeletal muscles to contract. The skeletal muscles squeeze the blood vessels
and they become narrower.
6. How does raised skin hair (“goose bumps”) affect body heat?
(a) When the hairs stand up, it is easier for air to reach our skin to cool us off. So raised hair decreases
body heat.
(b) When the hairs stand up, more air is trapped close to the body. The air holds heat around
us like a blanket to prevent loss of body heat.
(c) Raised hair does not affect body heat. Raised hair is just a side effect of shivering. Shivering
causes our skin to tighten and makes the hair stand up.
(d) None of the above.
7. When wind blows across the skin, it replaces the warm air near the skin with air at the outside temper-
ature. How would a body respond to a cool, windy day?
(a) The wind will raise the hairs on the skin. The skin will detect these raised hairs and respond by
contracting to produce heat.
152

(b) The wind will raise the hairs on the skin. The skin will detect these raised hairs and respond by
contracting blood vessels to prevent heat loss.
(c) The loss of the warm air near the skin will increase the amount of heat loss from the body.
The hypothalamus will detect the body getting colder and respond to keep the body warm.
(d) The loss of the warm air near the skin will increase the amount of heat loss from the body. The
blood vessels near the skin will detect the cold and respond to keep the body warm.
8. Drinking alcohol causes a person’s blood vessels to become wider, allowing more blood to flow. How
would drinking alcohol affect a person outside on a cold day?
(a) The person would be warmer. The increased blood flow through the blood vessels would allow
more blood to warm the cold parts of the body.
(b) The person would be warmer. The cold sensors would receive more blood, and that would de-
crease the cold signals that they send to the hypothalamus.
(c) The person would be colder. There would be more blood flowing to the skin, so more body
heat would be lost from the skin.
(d) The person would be colder. There would be more blood flowing to the muscles, and this would
stop them from shivering as much.
A.1.2 Causal Reasoning Questions
All five causal reasoning questions used the same causal map, shown in Figure A.1. Students could answer
each question by selecting either It would increase, It would decrease, or No change or no effect. The
problems were as follows:
1. If A increased, what would happen to B?
2. If B increased, what would happen to C?
3. If B decreased, what would happen to E?
4. if D increased, what would happen to E?
5. if A increased, what would happen to C?
153

Figure A.1: Study 1 abstract causal map used for causal reasoning problems.
A.1.3 Short Answer Questions
1. Use a sequence of cause-and-effect relationships to explain what causes raised body hair when someone
goes outside on a cold day.
When someone goes outside on a cold day, the cold temperatures increase the heat loss the person
experiences. This causes...
2. Frostbite is a medical condition that takes place when cold temperatures damage parts of the body
(often fingers, toes, and noses). The body parts that get frostbitten first are the parts of our body that
are not receiving enough blood flow.
Please explain exactly how and why being exposed to very cold weather could cause frostbite in a
person’s fingers and toes. You may draw a complete diagram like a concept map to help answer the
questions. If you use a diagram, be sure to label every concept and link that you draw.
A.2 Science Resources
The hypertext resources used during Study 1 are included on the following 8 pages.
154

Thermoregulation Thermoregulation is the process that warm-blooded animals use to keep their body from getting too hot or too cold. The word comes from the two words "Thermal" and "regulation." Something that is "thermal" relates to heat and "regulation" means keeping something regular or normal. So thermoregulation is a process humans and other warm-blooded animals use to keep their body heat at a regular level (usually near 37 degrees Celsius). Thermoregulation is also sometimes called "temperature homeostasis." Homeostasis is a Greek word that simply means "same state" and it is sometimes used to describe the process of keeping the internal environment of a body in a balanced or a normal state. Our body has many homeostatic processes that monitor and regulate our important systems without our even knowing it. Breathing, heart rate, and blood pressure are all regulated by these processes. In humans, temperature homeostasis is controlled by the thermoregulatory center in the hypothalamus, a part of the nervous system in the brain. The hypothalamus measures the body's temperature in two ways. First, sensors in the hypothalamus measure the temperature of the blood as it passes through the brain. Second, sensors in the skin measure the body's external temperature. With these two pieces of information, the hypothalamus can tell if the body's temperature is too low or too high. If the body's temperature is not right, the hypothalamus sends signals that cause the body to take corrective actions. In other words, the hypothalamus tells a body that gets too cold to do things to warm up, and it tells a body that gets too warm to do things to cool down. This is similar to how many heating and cooling systems work in homes. Once a person has set the target temperature on the system's thermostat, the system monitors the home temperature and turns on heating or air conditioning when it gets too cold or too hot. In this text, we will focus on the body's response to cold temperatures.
155

Homeostasis Homeostasis means "same state" and it refers to the process of keeping the internal conditions of a system in a normal or steady state of operation. For instance, animals need to have food in their bodies in order to live. When an animal does not have enough food in its body to produce energy for its cells, its brain sends hungry signals, and the animal looks for some food to eat. The animal's brain is using homeostasis to sense when it needs food, and it sends signals to the animal's body that cause the animal to find food. That way the cells of the animal's body keep functioning normally. Hunger and eating to keep enough energy is one example of homeostasis in animals. A great deal of an animal's hormone system and the autonomic nervous system in its brain are dedicated to homeostasis. All homeostatic processes use to stay in a constant state (called the ). Negative feedback means that whenever a change occurs in a system, the change automatically causes a corrective response. This response reverses the original change and brings the system back to normal. It also means that the bigger the change, the bigger the corrective response.
156

Cold Temperatures n order for thermoregulation to keep our body heat in balance, we need to have ways for detecting and responding to cold temperatures.
There are a number of ways that we can experience cold. In the winter, the air temperature outside is cold. In the summer, swimming on a windy day can also make us cold. When we feel cold, we are actually experiencing heat loss from our warmer bodies. So, cold temperatures increase heat loss from our bodies. And this heat loss makes our body temperatures drop. So what happens if our body temperatures drop? When the human body temperature drops below 35 degrees C, it gets into a dangerous state called hypothermia. When people have hypothermia for a long period of time, they can get "frost-bite" and their internal organs may stop working. In order to prevent hypothermia, our brain and nervous system have ways to stop our body from getting too cold. First, a part of the brain called the hypothalamus detects that our body's temperature is dropping. This cold detection causes a hypothalamus response which will eventually warm us back up. The hypothalamus triggers certain bodily responses. Some of these responses work by reducing heat loss. Others actually generate more heat. These
157

responses cause changes that eventually lead to the body temperature remaining steady. So this is another example of homeostasis that we are studying. As our body warms up, the bodily responses decrease. This makes sense because the hypothalamus is always measuring the body's temperature. So as the body warms up to its set point of about 37 degrees C, the hypothalamus does not detect as much cold, and so it slows down the body's responses. In this text, we will cover three main bodily responses that help us stay warm when the outside environment starts making the body cold: skin contraction, skeletal muscle contractions, and blood vessel constriction. When your hypothalamus detects cold temperatures, it increases all of these responses in the body. Response 1: Skin Contraction
One easy way that you can stay warm is by keeping warm air near your body. This is why people wear hats in the winter. A hat traps the air that has been
158
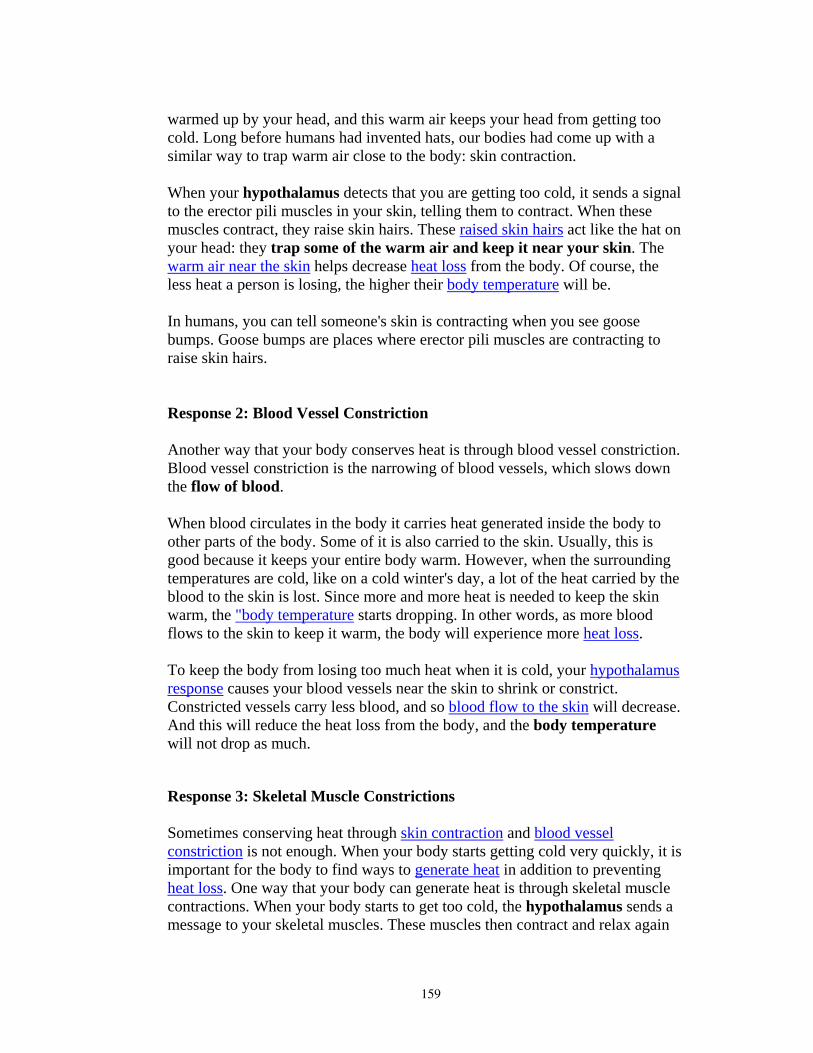
warmed up by your head, and this warm air keeps your head from getting too cold. Long before humans had invented hats, our bodies had come up with a similar way to trap warm air close to the body: skin contraction. When your hypothalamus detects that you are getting too cold, it sends a signal to the erector pili muscles in your skin, telling them to contract. When these muscles contract, they raise skin hairs. These raised skin hairs act like the hat on your head: they trap some of the warm air and keep it near your skin. The warm air near the skin helps decrease heat loss from the body. Of course, the less heat a person is losing, the higher their body temperature will be. In humans, you can tell someone's skin is contracting when you see goose bumps. Goose bumps are places where erector pili muscles are contracting to raise skin hairs. Response 2: Blood Vessel Constriction Another way that your body conserves heat is through blood vessel constriction. Blood vessel constriction is the narrowing of blood vessels, which slows down the flow of blood. When blood circulates in the body it carries heat generated inside the body to other parts of the body. Some of it is also carried to the skin. Usually, this is good because it keeps your entire body warm. However, when the surrounding temperatures are cold, like on a cold winter's day, a lot of the heat carried by the blood to the skin is lost. Since more and more heat is needed to keep the skin warm, the "body temperature starts dropping. In other words, as more blood flows to the skin to keep it warm, the body will experience more heat loss. To keep the body from losing too much heat when it is cold, your hypothalamus response causes your blood vessels near the skin to shrink or constrict. Constricted vessels carry less blood, and so blood flow to the skin will decrease. And this will reduce the heat loss from the body, and the body temperature will not drop as much.
Response 3: Skeletal Muscle Constrictions Sometimes conserving heat through skin contraction and blood vessel constriction is not enough. When your body starts getting cold very quickly, it is important for the body to find ways to generate heat in addition to preventing heat loss. One way that your body can generate heat is through skeletal muscle contractions. When your body starts to get too cold, the hypothalamus sends a message to your skeletal muscles. These muscles then contract and relax again
159

and again at high speeds. You might recognize this process by the name of "shivering."
When humans shiver, the movement of their skeletal muscles creates friction. Friction happens when two objects rub together, and this rubbing creates heat. To see how this works, try rubbing your hands together quickly for a few seconds. Notice how they feel warmer? When you shiver (just like when you exercise), your skeletal muscles expand and contract, and this creates friction in the muscles. This friction generates heat inside the body and makes up for the heat loss due to the cold. Body Temperature Body temperature refers to the overall temperature of a living body. Humans, like other mammals, regulate their body temperature. The normal body temperature for humans is about 37 degrees Celsius. Body temperature is an important concept related to cold temperatures and thermoregulation. Blood Flow to the Skin Blood flow describes how blood travels throughout human and animal bodies. Blood flow is important to humans and animals for many reasons. For example, it lets blood carry oxygen and nutrients to the cells all over the body. Blood flow is also important for thermoregulation. More specifically, blood flow to the skin is related to the overall process of conserving heat through blood vessel constriction.
160

Cold Detection Temperature detection describes how, in humans and animals, a part of the brain called the hypothalamus measures body temperature. When the hypothalamus discovers that the body temperature is too cold, we say that "cold detection" is happening. Without cold detection, humans would not be able to respond to cold temperatures. Friction Friction happens when two objects rub together, and this rubbing transforms mechanical energy into heat energy. In thermoregulation, friction is related to the overall process of heat generation through skeletal muscle contractions. Heat Generation Heat generation is one of the ways the human body protects itself from becoming too cold. When the body's temperature starts dropping below safe levels, it will start doing things to create its own heat. A good example of heat generation can be seen in the process of skeletal muscle contractions. Heat Loss Heat loss describes the fact that when we go outside on a cold day, some of our body heat is lost to the cold air around us. Our body can do things to eventually decrease heat loss. The processes of skin contraction and blood vessel constriction describe two ways that the body conserves heat by decreasing heat loss. Hypothalamus Response The hypothalamus is a vital part of the brain that acts like a control center. It is always making sure that your body is healthy. When it finds that your body is in danger of becoming unhealthy, it makes you do and feel certain things. These "responses" to unhealthy conditions lead you to "take action" and keep your body healthy. For example, it makes us feel hungry when we need food for energy, thirsty when we need water, and tired when we need to sleep. It also measures the body's temperature, which is important for thermoregulation.
161

Raised Skin Hairs Humans and animals have hair on different parts of their body. Some hair is long and thick, like the hair on your head. Other hair is tiny and short. The body has a way of using short hair to stay warm by raising it, and raised skin hairs are an important part of the process of skin contraction. Warm Air Near Skin The temperature of the air near your skin can have a large effect on your body's temperature. When the air is very cold, heat energy from your body will escape into the colder air around you. When the air is very warm, heat energy from the air will enter into your colder body. When your body gets cold, it tries to keep warm air near the skin through the process of skin contraction.
162

A.3 Causal Reasoning Training Packet
The causal reasoning tutorial packet given to students during Study 1 is included on the following 6 pages.
163

Single-Link Causal Reasoning
The rules below will help you understand how to use a concept map to answer questions about how a change in the source concept affects the target concept.
1. If the source concept causes an increase in the target concept, then an increase in the source concept will cause an increase in the target concept.
2. If the source concept causes an increase in the target concept, then a decrease in the source concept will cause a decrease in the target concept.
3. If the source concept causes a decrease in the target concept, then an increase in the source concept will cause a decrease in the target concept.
4. If the source concept causes a decrease in the target concept, then a decrease in the source concept will cause an increase in the target concept.
164

Exercise 1: What do these concept maps mean? The goal for this exercise is for you to understand how to read simple concept maps. Look at the concept maps below and write down the statements they represent.
1.______________________________________________________________ 2.______________________________________________________________
1.______________________________________________________________ 2.______________________________________________________________
1.______________________________________________________________ 2.______________________________________________________________ Exercise 2: Reasoning with Concept Maps Using the concept maps shown below, answer the following questions.
1. If the number of Animals increases (goes up), what happens to the
amount of Waste?
165

2. If the number of Cats increases (goes up), what happens to the amount
of Milk?
3. If the number of Bees decreases (goes down), what happens to the amount of Honey?
Section 3: Reading Big Concept Maps So far, we have only seen concept maps that involve 2 concepts and one link. In this section, we will learn how to work with bigger maps. For example, look at the concept map below, which contains 3 concepts and 2 links.
This big concept map can be thought of as two small concept maps, shown below:
Based on what we’ve already learned, we know how to read these two small concept maps. What do these two smaller concept maps tell us about wolves,
166
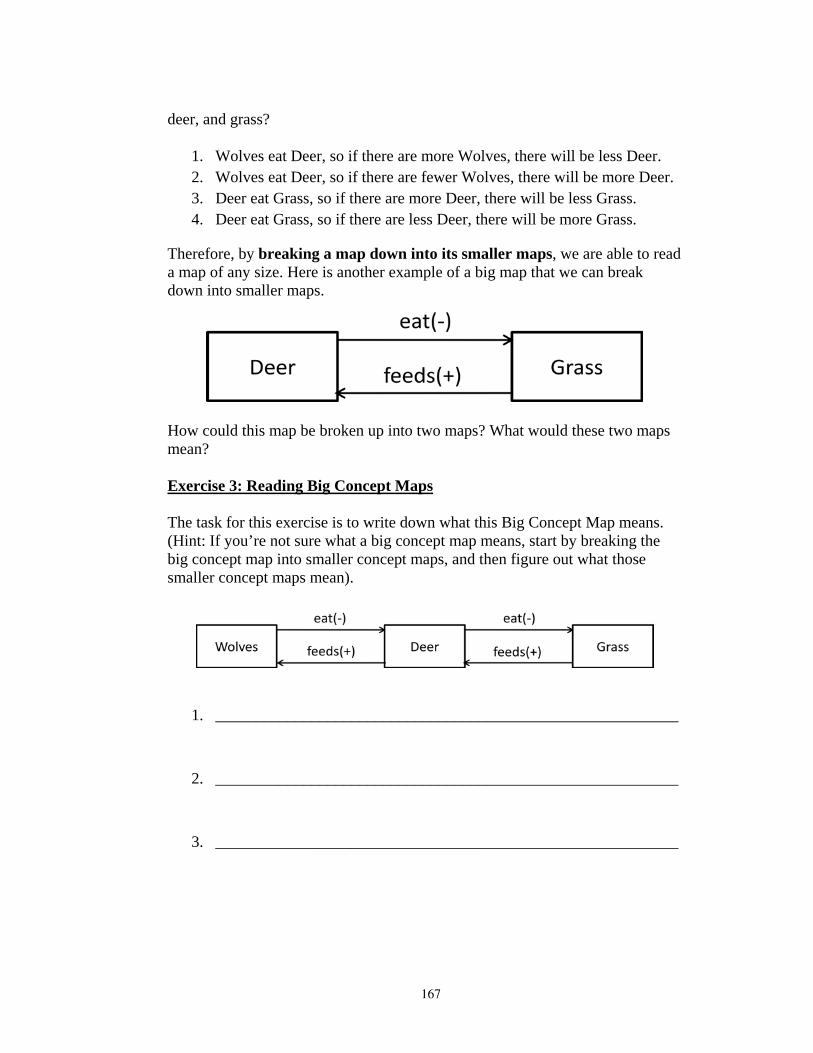
deer, and grass?
1. Wolves eat Deer, so if there are more Wolves, there will be less Deer. 2. Wolves eat Deer, so if there are fewer Wolves, there will be more Deer. 3. Deer eat Grass, so if there are more Deer, there will be less Grass. 4. Deer eat Grass, so if there are less Deer, there will be more Grass.
Therefore, by breaking a map down into its smaller maps, we are able to read a map of any size. Here is another example of a big map that we can break down into smaller maps.
How could this map be broken up into two maps? What would these two maps mean? Exercise 3: Reading Big Concept Maps The task for this exercise is to write down what this Big Concept Map means. (Hint: If you’re not sure what a big concept map means, start by breaking the big concept map into smaller concept maps, and then figure out what those smaller concept maps mean).
1. __________________________________________________________
2. __________________________________________________________
3. __________________________________________________________
167

4. __________________________________________________________
5. __________________________________________________________
6. __________________________________________________________
7. __________________________________________________________
8. __________________________________________________________
Exercise 4: Reasoning through Big Concept Maps The task for this exercise is to practice reading all of the information that exists in Big Concept maps. Using the map below, answer all of the following questions by circling either increase (go up) or decrease (go down).
1. If there are more Wolves, what will happen to the number of Deer?
Increase Decrease
2. If there are fewer Wolves, what will happen to the number of Deer? Increase Decrease
3. If there are more Deer, what will happen to the amount of Grass? Increase Decrease
168

4. If there are less Deer, what will happen to the amount of Grass? Increase Decrease
5. If there are more Wolves, what will happen to the amount of Grass? Increase Decrease
6. If there are fewer Wolves, what will happen to the amount of Grass? Increase Decrease
169

Appendix B
Reference Materials for Study 2
B.1 Assessment Test Questions
B.1.1 Science Content Questions
1. What is the greenhouse effect?
(a) The atmosphere of the earth traps some heat energy and prevents it from being released
into space. This makes the earth warmer.
(b) The atmosphere of the earth is reflective like the glass of a greenhouse. The light reflection keeps
the earth from getting too hot.
(c) The atmosphere acts like a magnifying glass. This makes the light stronger and makes the earth
hotter.
(d) The atmosphere traps pollution from cars and factories. Over time, the air will become more
polluted and the earth will get warmer.
2. Which of these gases is a greenhouse gas?
(a) Nitrogen
(b) Carbon dioxide
(c) Oxygen
(d) All of the above
3. About what percentage of the solar energy the earth receives is absorbed by the surface?
(a) 25%
(b) 33%
(c) 50%
(d) 100%
4. Which of the following best describes the relationship of sea ice and global temperature?
(a) When sea ice melts, it cools the temperature of the oceans. When the oceans get colder, it lowers
global temperatures.
170

(b) Sea ice increases global temperatures because it absorbs solar energy. The more solar energy that
is absorbed, the higher the global temperature will be.
(c) Sea ice does not affect global temperatures because it reflects solar energy away from the earth
before it can heat the earth.
(d) Sea ice reflects solar energy, which reduces the amount of solar energy the earth absorbs. If
the earth absorbs less energy, it will be cooler.
5. How does vegetation affect the amount of carbon dioxide in the air?
(a) Vegetation produces carbon dioxide through the process of photosynthesis, which increases the
amount of carbon dioxide.
(b) Vegetation releases water vapor through the process of photosynthesis. The vapor bonds with
carbon dioxide, which reduces the amount of carbon dioxide.
(c) Vegetation absorbs carbon dioxide as part of the process of photosynthesis, which reduces
the amount of carbon dioxide.
(d) Vegetation produces oxygen as a result of photosynthesis, which does not affect carbon dioxide.
6. Which of the following sequences best describes the order of events in the water cycle?
(a) Vegetation→ transpiration→ precipitation
(b) Evaporation→ condensation→ precipitation
(c) Precipitation→ transpiration→ evaporation
(d) Precipitation→ condensation→ evaporation
7. How does the greenhouse effect help or hurt the environment?
(a) The greenhouse effect normally helps the environment by keeping the earth warm enough
for plants and animals to live. But the greenhouse effect can also harm the earth if it be-
comes too strong due to too much greenhouse gases.
(b) The greenhouse effect hurts the environment. It causes excess heat from the earth to get trapped.
All of this trapped heat raises the earth’s temperature.
(c) The greenhouse effect helps the environment. It acts like a blanket that protects the earth from
harmful solar radiation, and it keeps the earth from getting too cold.
(d) The greenhouse effect hurts the environment by trapping excess heat in the atmosphere so the
earth cannot cool down. But it helps the environment by protecting the earth from harmful solar
rays.
171

B.1.2 Causal Reasoning Questions
Refer to Figure B.1 for the causal maps students were expected to use as they answered causal reasoning
questions. For each question, students could either choose “increase,” “decrease,” or “no change or no effect.”
1. If A increased, what would happen to B?
2. If A decreased, what would happen to B?
3. If A increased, what would happen to B?
4. If A increased, what would happen to B?
5. If A decreased, what would happen to B?
6. If A increased, what would happen to C?
7. If A decreased, what would happen to C?
8. If A increased, what would happen to C?
9. If A increased, what would happen to C?
10. If A decreased, what would happen to C?
11. If A increased, what would happen to D?
12. If A decreased, what would happen to D?
13. If A increased and B increased, what would happen to C?
14. If A decreased and B increased, what would happen to C?
15. If A decreased and B increased, what would happen to C?
16. If A increased and B increased and C decreased, what would happen to D?
17. If A did not change and B increased and C decreased, what would happen to D?
18. If A increased, what would happen to F?
19. If A increased, what would happen to E?
20. If A decreased, what would happen to E?
172

Figure B.1: Study 2 abstract causal maps used for causal reasoning problems.
173

B.1.3 Short Answer Questions
1. We now know that deforestation, i.e., cutting of a large number of trees increases global temperature.
Can you clearly list step-by-step the chain of events that explains how deforestation increases global
temperature?
2. Scientists and engineers have invented exciting new ways to make more affordable powerful batteries!
This makes it possible for more people to use electric cars instead of regular cars that use gasoline
and produce carbon dioxide. Please explain, step-by-step, how this invention could influence climate
change.
B.2 Science Resources
The hypertext resources used during Study 2 are included on the following 22 pages.
174

Introduction to Climate Change
Climate change is an important topic that many people are talking about.
One kind of climate change is global warming. Over the last 100 years, the
average global temperature has increased by about 1.3 degrees Fahrenheit (0.75
degrees Celsius).
Global temperature could rise another 2.0 to 11.5 degrees Fahrenheit (1.1 to 6.4
degrees Celsius) over the next century. This might sound like a small change,
but it can greatly affect the environment.
As the temperature of the Earth increases, we might have more extreme weather
patterns such as hurricanes and droughts. But why? Global temperature affects
how much precipitation the Earth receives.
So, why are these changes happening? A lot of evidence suggests that humans
are affecting the environment through our lifestyle. We burn a lot of fossil fuels
in generating electricity, in our factories, and by driving cars, which add carbon
dioxide and other greenhouse gases to the atmosphere. We also cut down a lot
of trees and other vegetation causing deforestation.
Energy Cycle
The earth receives most of its energy from the sun. If the earth continued to
absorb all of the energy it would grow hotter and hotter. That does not happen
because some of the sun's energy is reflected back by the surface of the earth
that is covered by ice. This process that keeps the earth's temperature at
moderate levels is the energy cycle. You can learn more about the energy cycle
by starting with the page on solar energy.
175

Global Temperature
Temperatures in our local region change from day to day and season to season.
Temperatures in places around the world might be very different from each
other. It might be freezing cold in Antarctica and sweltering hot in the Sahara
desert at the same time.
So why do people say that the Earth is getting warmer?
When we talk about global warming and climate change, we are not talking
about the temperature of just one place. Instead, we are talking about the
average global temperature of the whole world. Some places may be hotter or
colder, but the global temperature tells us how hot or cold the whole Earth is on
average.
Global temperature increases when the Earth absorbs more light energy.
However, some of the extra heat is lost to space due to heat radiation. Heat
radiation lowers the global temperature.
176

Heat radiation is also affected by the greenhouse effect. The greenhouse effect
traps heat in the atmosphere. So the greenhouse effect can reduce some of the
Earth's heat from being radiated into space.
Habitat and Sea Ice
What’s a habitat? A habitat is the place or area where plants and animals live,
giving them food and shelter. Sea ice is the main habitat for polar bears, ringed
seals, and ice algae. Organisms such as Arctic cod and Arctic krill live in the
cold Arctic Ocean waters.
Guess what? Since it’s so cold up there, over time, plants and animals have
adapted to their habitats. For example, polar bears have a thick layer of fat to
stay warm in the icy, cold Arctic environment. If they were moved to a much
warmer environment, their layers of fat might cause them to get overheated and
get sick.
Sometimes habitats can change very quickly due to changes in weather or
human actions. If a habitat changes too quickly, the plants and animals cannot
adjust and they lose their habitat. Some of the plants and animals might die.
One example of this is global warming and sea ice. Sea ice is the main habitat
for polar bears, ringed seals, and ice algae. Rising global temperatures cause the
sea ice to melt. This makes it hard for the seals and polar bears to survive
because they lose their shelter and hunting areas. Remember food chains? If the
polar bear population decreases due to a loss of habitat, the ringed seals will
have fewer predators eating them. The seal population might survive longer.
177

The diagram below shows what may happen if sea ice (in white) continues to
shrink as fast as it has been shrinking recently. By the year 2050, there may be
only half as much ice as there was in 1950.
Solar Energy
The sun is a star at the center of our solar system. Even though it is far away,
solar energy from the sun is the major source of energy for the planet Earth.
This energy keeps our planet warm enough for things to live and grow.
How does the sun produce so much energy? Most of the sun is made of
hydrogen gas. Through a process called nuclear fusion, some of the hydrogen in
the sun is turned into helium. This releases a huge amount of energy! The
energy from nuclear fusion in the sun is radiated into space as electromagnetic
waves. Solar energy is electromagnetic radiation that sends out the energy of the
sun to the Earth.
The ground and water that make up the earth's surface absorbs about 50% of the
light energy the Earth receives. The energy absorbed by the Earth is called
absorbed light energy. The more solar energy that the Earth receives, the more
light energy it will absorb. But, the Earth does not absorb all of the solar energy
that reaches it, however. Sea ice located around the world can act like a giant
mirror. We have a lot of that in the Arctic! The ice reduces the amount of
absorbed light energy of the Earth.
Heat Energy
Everything in the universe is made of atoms and molecules. These particles are
always moving around. Heat energy comes from the motion of atoms and
molecules. The more they move, the more energy they have!
178

The energy of motion is called kinetic energy (KE). Why do we call it "heat"
energy when it is actually kinetic energy from the moving particles? That is
because objects with more kinetic energy feel hot to us. Excess energy is sent
from the objects and that can increase the energy in other objects.
When solar energy hits a surface like the Earth, some of the energy is absorbed.
The large amount of energy in the absorbed light energy can excite the
molecules in the surface. As the molecules move around faster, they produce
heat energy that we feel as heat. This is why an increase in absorbed light
energy causes an increase in average global temperature.
This is also why solar energy, or sunlight, feels warm on our skin. Solar energy
increases the energy in the molecules of our skin!
Sea Ice
Sea ice can take several forms, such as giant icebergs floating in the ocean. Near
the polar regions of the Earth, you see very large ice masses that are attached to
the land. The polar ice caps are the size of whole continents!
Sea ice reflects most of the light that hits it, which reduces the amount of
absorbed light energy that the Earth receives. This ice acts like a giant mirror
that bounces sunlight back into space.
Sea ice can melt when ocean temperatures get too warm. It’s like putting an ice
cube in a cop of hot chocolate. As the global temperature rises due to global
warming, one side effect is that sea ice starts to melt. As the sea ice melts, the
Earth loses some of its reflectivity. With less sea ice, the Earth absorbs more
light energy, which increases absorbed light energy.
179

Sea ice has been shrinking by about 5% per decade. By the later part of the 21st
century, a lot of Arctic ice may be gone. This could mean that global
temperature could continue to go up.
Sea ice is the main habitat for polar bears, ringed seals, and ice algae.
Absorbed Light Energy
Absorbed light energy is the amount of incoming solar energy that is actually
absorbed by the Earth. Some of this absorbed light energy is made into heat
energy. This is because the energy in the light excites the molecules of the
surface it hits. This heat energy raises the temperature of the Earth and
atmosphere.
Some solar energy is reflected back into space by the atmosphere before ever
reaching the Earth's surface. The amount of absorbed light energy that the Earth
actually absorbs is also blocked by sea ice, which is highly reflective. It’s like a
huge mirror! Only about 50% of the solar energy received by the Earth is
actually absorbed by the Earth.
The sun shines on the Earth all the time. So why doesn't the Earth keep getting
hotter and hotter? One reason is that some of the heat energy of the Earth is sent
back into space. The heat radiation into space lowers the global temperature of
the Earth.
180

Some of the heat radiation is trapped by greenhouse gases like carbon dioxide
and held in the Earth's atmosphere. This is the greenhouse effect. This leads to
an increase in the global temperature because the trapped heat increases the
earth's temperature.
Water Cycle
The water in our environment is constantly being recycled through the water
cycle. Water is constantly moving from lakes and oceans into the air, blown
over the land, and then falling back to the ground.
The water cycle starts with water on the surface of the Earth - rivers, lakes, and
oceans. Through the process of evaporation, some of this water is turned into
water vapor. Water vapor is the gaseous form of water. The water vapor flows
through the atmosphere.
When water vapor cools, the process of condensation occurs. Water vapor
particles collect together to form droplets of liquid water. When these droplets
are small, they can form together into clouds. As the droplets get bigger, they
form raindrops and snowflakes. When these raindrops and snowflakes fall to the
Earth, it is called precipitation.
Precipitation collects in rivers and oceans... and the whole process starts over
again!
181

Evaporation
Evaporation is the process of how liquid water turns into a gas in the form of
water vapor. Water that collects on the ground from precipitation evaporates to
form water vapor. Another source of water vapor in the atmosphere is
transpiration from vegetation.
Water molecules have two atoms of hydrogen and one atom of oxygen. So the
chemical formula for water is H2O. In the diagram below the oxygen atom is
colored red and the hydrogen atoms are colored white.
In liquid form, water molecules are close together, but they can move around
each other easily. However, every once in a while a molecule of water will
break free of the rest and move into the air. When that happens, it is called
evaporation.
182

Evaporation happens faster when the molecules gain energy (such as heat
energy from solar energy). When these molecules gain energy, they move
around even faster and they are more likely to break free and move into the air.
This is why a puddle of water will "dry up" faster on a hot day. The water is
evaporating faster. But remember that the water is not disappearing... it is just
changing to the gaseous form from the liquid form!
Vegetation
Vegetation includes all of the plants, such as flowers and trees, that grow on the
Earth. Although every plant is different, they all use sunlight to combine carbon
dioxide and water into food. This process is called photosynthesis. The "food"
that plants make is sugar called carbohydrates.
183

Photosynthesis and vegetation are an important part of the global climate. One
major product of photosynthesis is oxygen, which is a gas that many living
things need to breathe. Oxygen molecules are made of two oxygen atoms and
have the formula O2. In the diagram below, the oxygen atoms are colored red.
In order for photosynthesis to occur, plants must absorb carbon dioxide from the
air. So the more vegetation there is, the less excess carbon dioxide will be in the
atmosphere. This is why deforestation is such a big problem.
Another major product of photosynthesis is water. This water leaves the plant
leaves through the process of transpiration. The water that is released from plant
leaves becomes water vapor in the atmosphere.
184

Condensation
You have probably seen water droplets form on the outside of a glass of ice
water. As invisible water vapor in the air around the glass touches the glass, the
cold temperature causes it to condense.
Condensation occurs when gaseous water vapor cools and changes into liquid
water droplets, which can form clouds in the atmosphere. When these droplets
become big enough, they fall back to the Earth as precipitation. This is an
important part of the water cycle.
Condensation can only occur when the air is saturated with water vapor. This
means that there is a relatively large amount of vapor in one area. Condensation
occurs when saturated air cools even further.
Another important factor is carrying capacity. Carrying capacity tells us how
much water vapor is needed for the air to be saturated. When the carrying
capacity increases, condensation will decrease. Carrying capacity increases in
warmer temperatures.
Carrying Capacity
Saturation is the amount of moisture the air contains compared with the
maximum amount it could possibly hold at a specific temperature. When air
holds all the water it can at a given temperature, the air is said to be saturated.
The amount of water that the air can hold before becoming saturated is called
the carrying capacity.
185

When air is warmer, it can hold more water before it becomes saturated. So
when global temperatures increase, the carrying capacity of the atmosphere also
increases. This means there will be less condensation.
Precipitation
Precipitation is water that falls from the air to the Earth. When this water is in
liquid form we call it rain. When it is solid we call it snow. About 90 percent of
precipitation falls into the ocean. The rest falls on land, renewing the supply of
fresh water
Precipitation is important because it provides water that plants need to grow. A
healthy amount of precipitation will increase the amount of vegetation in a
region. That is why the rainforests are filled with many plants, but very dry
places like deserts are not.
A severe lack of precipitation over a long period of time is called a drought.
Precipitation is produced by condensation of water vapor in clouds. A cloud
produces rain when its water droplets become large enough to fall. The water
vapor that produces clouds comes from evaporation. Water in lakes, rivers, and
the oceans evaporate in the heat of the sunlight. The water vapor forms clouds
in the sky.
186

The diagram below shows the whole water cycle. Ground water turns into water
vapor through evaporation. The water vapor condenses into clouds as it cools.
The clouds then condense even further to form precipitation. The precipitation
falls to the ground as rain or snow. This new ground water then begins to
evaporate… and the whole cycle starts over!
Water Vapor
Water vapor is water in the form of a gas and is invisible. It is not the same
thing as steam, which is made up of tiny droplets of liquid water. Each water
molecule contains two atoms of hydrogen and one atom of oxygen. In the
diagram below the oxygen atom is colored red and the hydrogen atoms are
colored white.
The amount of water vapor in the air can be very different in different locations
or times. In a desert or polar region, the air may have almost no water vapor. In
a tropic rainforest, as much as 5% of the air may be water vapor.
Water vapor is an important part of Earth's weather. Clouds form when due to
condensation of water vapor into tiny droplets of liquid water or crystals of ice.
If these droplets or crystals become large enough, they can fall to the Earth as
precipitation.
187

Water vapor is added to the atmosphere by evaporation of the water from
precipitation. This is a key part of the water cycle. Water vapor is also produced
by vegetation through the process of transpiration.
Greenhouse Effect
You might have heard about the greenhouse effect on television or in your
science classes. That is because the greenhouse effect is an important part of
how the world normally works. But when the greenhouse effect becomes too
strong, it can lead to global warming.
Our atmosphere is a layer of various gases that surrounds the whole Earth.
Some of these gases, called greenhouse gases, have the ability to trap heat
radiation from the Earth. The result is that the Earth does not lose all of its heat
into space. Instead, the atmosphere is like a blanket that keeps the planet from
getting too cold for things to live. This is basically how the greenhouse effect
works.
So what is the problem? Why are so many people worried about global
warming and the greenhouse effect if the greenhouse effect is a normal part of
the world?
188

One problem is carbon dioxide. Carbon dioxide is a common greenhouse gas
that has increased a lot over the last few decades. As carbon dioxide increases,
the greenhouse effect gets stronger. The greenhouse effect prevents heat
radiation. More heat is trapped in the atmosphere and the Earth cannot cool
down as effectively. As a result, global temperatures go up.
Carbon Dioxide
Carbon dioxide is a colorless and odorless gas found in the atmosphere. Carbon
dioxide molecules have two atoms of oxygen and one atom of carbon. So the
chemical formula for carbon dioxide is CO2. In the diagram below the carbon is
colored black and the two oxygen atoms are colored red.
Carbon dioxide is added to the atmosphere in several ways. Most living things
(like people, plants, and animals) produce carbon dioxide through respiration. In
the process of respiration, food and nutrients are broken down to get energy.
This process produces carbon dioxide. Carbon dioxide is a greenhouse gas. This
189
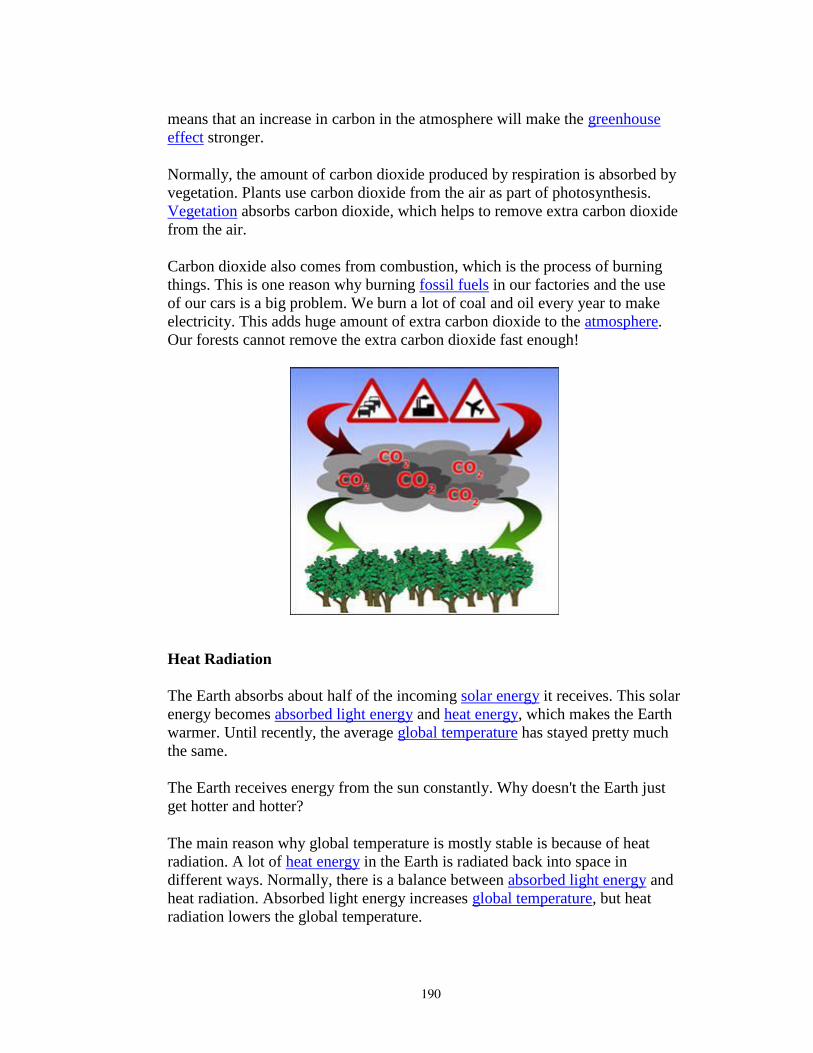
means that an increase in carbon in the atmosphere will make the greenhouse
effect stronger.
Normally, the amount of carbon dioxide produced by respiration is absorbed by
vegetation. Plants use carbon dioxide from the air as part of photosynthesis.
Vegetation absorbs carbon dioxide, which helps to remove extra carbon dioxide
from the air.
Carbon dioxide also comes from combustion, which is the process of burning
things. This is one reason why burning fossil fuels in our factories and the use
of our cars is a big problem. We burn a lot of coal and oil every year to make
electricity. This adds huge amount of extra carbon dioxide to the atmosphere.
Our forests cannot remove the extra carbon dioxide fast enough!
Heat Radiation
The Earth absorbs about half of the incoming solar energy it receives. This solar
energy becomes absorbed light energy and heat energy, which makes the Earth
warmer. Until recently, the average global temperature has stayed pretty much
the same.
The Earth receives energy from the sun constantly. Why doesn't the Earth just
get hotter and hotter?
The main reason why global temperature is mostly stable is because of heat
radiation. A lot of heat energy in the Earth is radiated back into space in
different ways. Normally, there is a balance between absorbed light energy and
heat radiation. Absorbed light energy increases global temperature, but heat
radiation lowers the global temperature.
190

Some of the heat radiated into space is prevented by the greenhouse effect. The
atmosphere contains many different gases, and some of these gases (like carbon
dioxide) can trap heat radiation before it can escape into space.
Global Warming
One kind of climate change is global warming. Over the last 100 years, the
average global temperature has increased by about 1.3 degrees Fahrenheit (0.75
degrees Celsius).
Global temperature could rise another 2.0 to 11.5 degrees Fahrenheit (1.1 to 6.4
degrees Celsius) over the next century. This might sound like a small change,
but it can greatly affect the environment.
191

As the temperature of the Earth increases, we might have more extreme weather
patterns such as hurricanes and droughts. But why? Global temperature affects
how much precipitation the Earth receives.
So, why are these changes happening? A lot of evidence suggests that humans
are affecting the environment through our lifestyle. We burn a lot of fossil fuels
in generating electricity, in our factories, and by driving cars, which add carbon
dioxide and other greenhouse gases to the atmosphere. We also cut down a lot
of trees and other vegetation causing deforestation.
Atmosphere
The atmosphere is a mixture of gases that surrounds the Earth. In addition to
containing the oxygen that we breathe, it also protects us from the sun's harmful
rays. Nitrogen and carbon dioxide are also gases that are present in the
atmosphere.
The atmosphere also contains tiny particles such as dust, smoke, and volcanic
ash. The most common liquid in the atmosphere is water. Some of the water is
in gas form called water vapor, and some of the water is in liquid form in
clouds. When this water falls to the Earth from the sky, it is called precipitation.
Snow and rain are examples!
Some gases in the atmosphere are called greenhouse gases. One example of a
greenhouse gas is carbon dioxide. Greenhouse gases trap some of the heat
radiating up from the surface of the Earth in the atmosphere. This is called the
greenhouse effect.
192

The atmosphere acts like a blanket that insulates the Earth. It keeps us from
getting too warm or too cold. However, if we change the atmosphere by adding
too much carbon dioxide, we might increase the greenhouse effect and the Earth
will get warmer.
Human Impact
There has been a large increase in the number of factories that produce
numerous goods for the earth's populations. The earth's population is steadily
increasing, and it needs more and more space to live in. This additional space is
often created by removing forests and wooded areas. What else are we doing?
We drive a lot of cars, trucks, and buses. When going long distances, we fly
aircraft. We need to produce energy to support our cities, factories, and our
transportation vehicles. All of these are having an impact on our environment.
Scientists have labeled this the human impact on global warming.
Car Emissions
193

The cars we drive release over 1.7 billion tons of carbon dioxide into the
atmosphere. This is much more than what the vegetation can consume for
photosyntheses. Each gallon of gasoline you burn creates 20 pounds of carbon
dioxide. Gasoline is a fossil fuel. Therefore, cars play a big role in global
warming.
Extreme Weather
One of the consequences of global warming and climate change is that weather
patterns around the world may become more extreme or damaging.
For example, a drought is a long period of lower than normal rainfall in a
region. The vegetation does not get the water it needs to survive and begins to
die off. Occasional droughts are a normal part of the Earth's climate. However,
droughts become more and more common as a result of global warming. Global
warming causes the Earth to become hotter, and the increase in the Earth's
average temperature can eventually cause decreases in precipitation
194

Another extreme form of weather is a hurricane. A hurricane is a large rotating
tropical weather storm. Hurricanes generally form over warm, tropical oceans.
At higher latitudes, the water is too cold for hurricanes to form. Hurricanes are
the most powerful storms on Earth.
A hurricane starts as a group of thunderstorms moving over tropical ocean
waters. Winds traveling in two different directions collide, causing the storm to
rotate over an area of low pressure. Hurricanes get their energy from the
condensation of water vapor. Once formed, the hurricane gets stronger through
contact with the warm ocean water. Moisture is added to the warm air by
evaporation from the ocean. As the warm, moist air rises, the water vapor
condenses, releasing large amounts of energy and precipitation
When the surface of the ocean is warmer, we get heavier rains and stronger
wind. So as the global temperature increases and warms the oceans, the tropical
storms that form every year may have a much greater chance of turning into
full-fledged hurricanes.
Fossil Fuels
Fossil fuels include things like coal, oil, and natural gas. These fuels contain lots
of carbon. This is because they are made of organic matter that has been buried
under pressure and heat for millions of years. About 90% of the energy
Americans use to run our factories, cars and trucks, and heat and cool our
houses come from burning fossil fuels.
Unfortunately, when we burn these fossil fuels to create energy, they add tons
of carbon in the form of carbon dioxide and other gases into the atmosphere.
In the past 100 years, humans have been using more and more fossil fuels. In
the United States, most of our electricity is generated by power plants that burn
coal and natural gas. All of these power plants burn large amounts fossil fuels
each year to generate electricity for things like lights, heaters, televisions, and
computers.
195

The more electricity we use, the more fossil fuel emissions, especially carbon
dioxide, are added to the atmosphere. All this extra carbon dioxide can increase
the strength of the greenhouse effect. This is one of the causes of global
warming.
Deforestation
Plants use carbon dioxide to make food. As plants and vegetation are removed
from the Earth, the carbon dioxide that would have been used by the plants
builds up in the atmosphere.
The forests normally consume lots of carbon dioxide. This keeps the amount of
carbon dioxide in balance so that the amount of carbon dioxide in the Earth's
atmosphere does not change much. However, humans are rapidly cutting down
the rainforests in order to create more farmland and expand cities. Cutting down
all of these forests is called deforestation.
With less vegetation, there is less carbon dioxide being used in photosynthesis.
This leads to an increase in the level of carbon dioxide in the atmosphere.
196

B.3 Causal Reasoning Training Packet
The causal reasoning tutorial packet given to students during Study 2 is included on the following 18 pages.
197
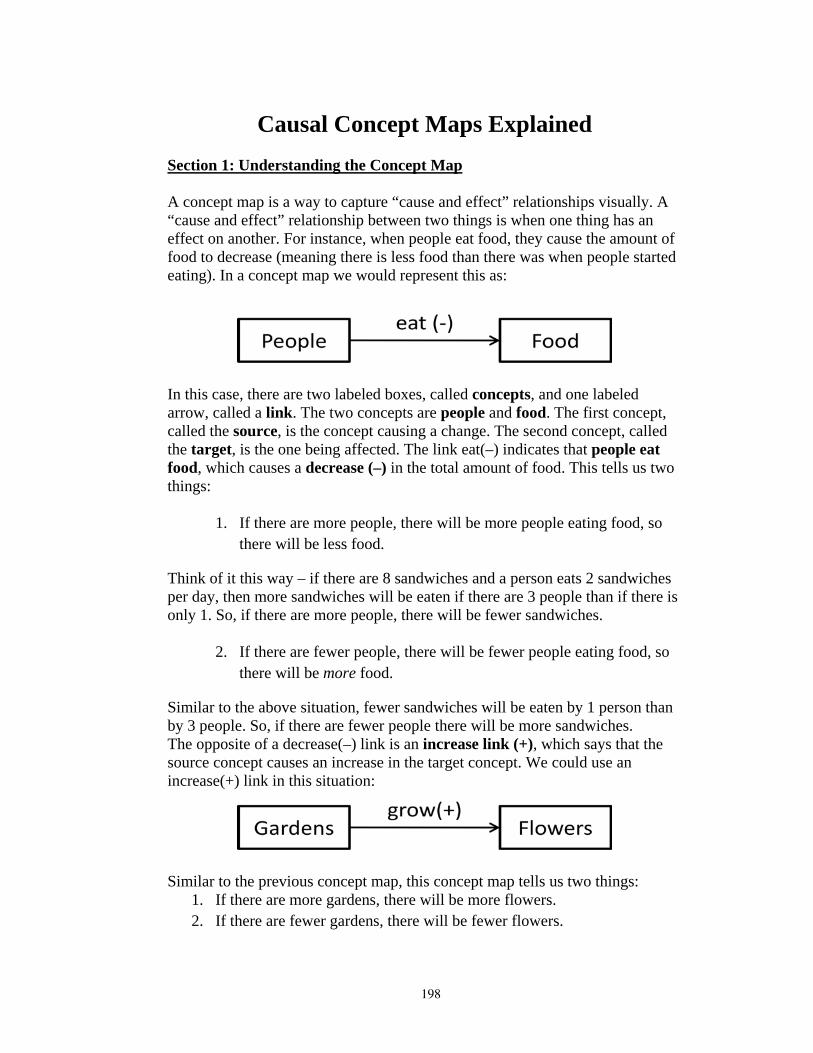
Causal Concept Maps Explained Section 1: Understanding the Concept Map A concept map is a way to capture “cause and effect” relationships visually. A “cause and effect” relationship between two things is when one thing has an effect on another. For instance, when people eat food, they cause the amount of food to decrease (meaning there is less food than there was when people started eating). In a concept map we would represent this as:
In this case, there are two labeled boxes, called concepts, and one labeled arrow, called a link. The two concepts are people and food. The first concept, called the source, is the concept causing a change. The second concept, called the target, is the one being affected. The link eat(–) indicates that people eat food, which causes a decrease (–) in the total amount of food. This tells us two things:
1. If there are more people, there will be more people eating food, so there will be less food.
Think of it this way – if there are 8 sandwiches and a person eats 2 sandwiches per day, then more sandwiches will be eaten if there are 3 people than if there is only 1. So, if there are more people, there will be fewer sandwiches.
2. If there are fewer people, there will be fewer people eating food, so there will be more food.
Similar to the above situation, fewer sandwiches will be eaten by 1 person than by 3 people. So, if there are fewer people there will be more sandwiches. The opposite of a decrease(–) link is an increase link (+), which says that the source concept causes an increase in the target concept. We could use an increase(+) link in this situation:
Similar to the previous concept map, this concept map tells us two things: 1. If there are more gardens, there will be more flowers. 2. If there are fewer gardens, there will be fewer flowers.
198
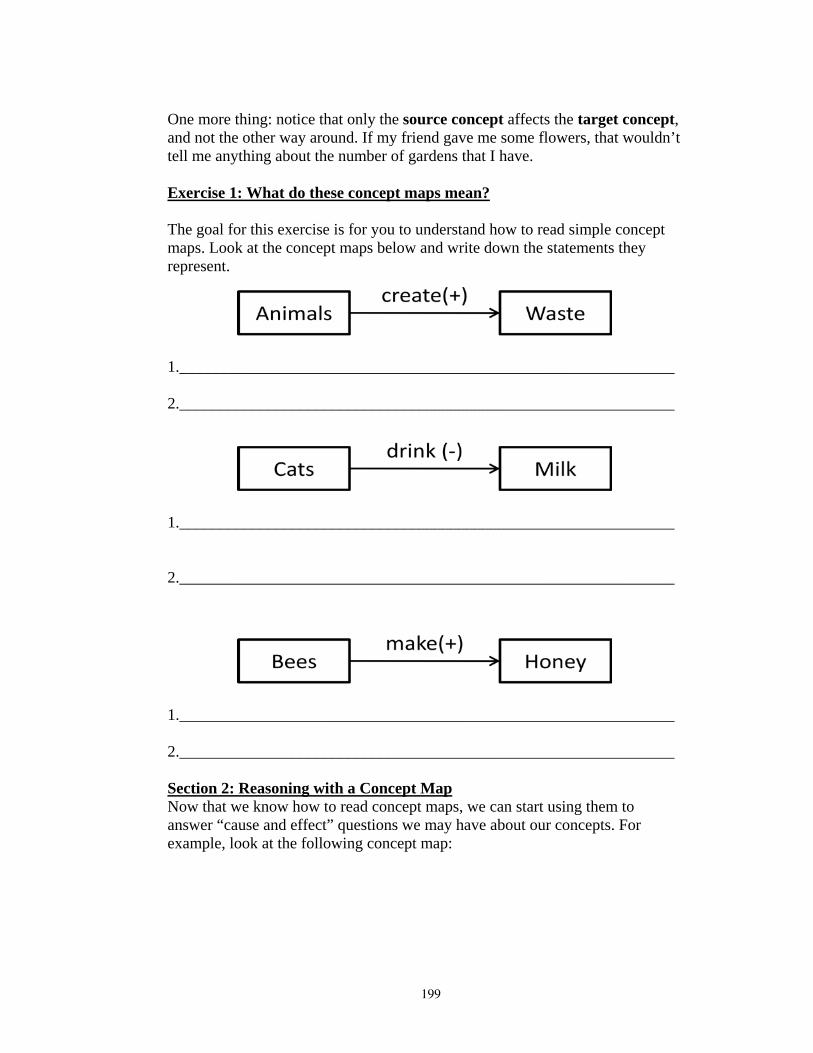
One more thing: notice that only the source concept affects the target concept, and not the other way around. If my friend gave me some flowers, that wouldn’t tell me anything about the number of gardens that I have. Exercise 1: What do these concept maps mean? The goal for this exercise is for you to understand how to read simple concept maps. Look at the concept maps below and write down the statements they represent.
1.______________________________________________________________ 2.______________________________________________________________
1.______________________________________________________________ 2.______________________________________________________________
1.______________________________________________________________ 2.______________________________________________________________ Section 2: Reasoning with a Concept Map Now that we know how to read concept maps, we can start using them to answer “cause and effect” questions we may have about our concepts. For example, look at the following concept map:
199

If your friend wanted to know what would happen to the amount of furniture if there were fewer carpenters, he or she could use the concept map to answer the question. Remember, this concept map tells us two things:
1. If there are more carpenters, there will be more furniture. 2. If there are fewer carpenters, there will be less furniture.
One of these two sentences answers the question. Can you figure out which sentence will help us? Can you answer your friend’s question? Write your answers here:
• Which of the two facts tells us the answer? _______________
• What is the answer to your friend’s question? _______________
You may have noticed that so far, our concept map can’t answer very many questions. It can only tell us what happens to furniture if the number of carpenters changes. In general, there are only two questions you can ask about a concept map like this:
1. If the source concept increases, then what happens to the target concept?
2. If the source concept decreases, then what happens to the target concept?
The answers to these questions depend on what kind of link connects the source and target concept.
• If the link is an increase link (+), then the answer to question 1 will always be “the target concept will increase” and the answer to question 2 will always be “the target concept will decrease.”
• If the link is a decrease link (-), then the answer to question 1 will always be “the target concept will decrease” and the answer to question 2 will always be “the target concept will increase.”
200

This information is summarized in the following figures.
1. If the source concept causes an increase in the target concept, then an increase in the source concept will cause an increase in the target concept.
2. If the source concept causes an increase in the target concept, then a decrease in the source concept will cause a decrease in the target concept.
3. If the source concept causes a decrease in the target concept, then an increase in the source concept will cause a decrease in the target concept.
4. If the source concept causes a decrease in the target concept, then a decrease in the source concept will cause an increase in the target concept.
201

Exercise 2: Reasoning with Concept Maps Using the concept maps shown below, answer the following questions.
1. If the number of Animals increases (goes up), what happens to the
amount of Waste?
2. If the number of Cats increases (goes up), what happens to the amount
of Milk?
3. If the number of Bees decreases (goes down), what happens to the amount of Honey?
Section 3: Reading Big Concept Maps So far, we have only seen concept maps that involve 2 concepts and one link. In this section, we will learn how to work with bigger maps. For example, look at the concept map below, which contains 3 concepts and 2 links.
This big concept map can be thought of as two small concept maps, shown below:
202

Based on what we’ve already learned, we know how to read these two small concept maps. What do these two smaller concept maps tell us about wolves, deer, and grass?
1. Wolves eat Deer, so if there are more Wolves, there will be less Deer. 2. Wolves eat Deer, so if there are fewer Wolves, there will be more Deer. 3. Deer eat Grass, so if there are more Deer, there will be less Grass. 4. Deer eat Grass, so if there are less Deer, there will be more Grass.
Therefore, by breaking a map down into its smaller maps, we are able to read a map of any size. Here is another example of a big map that we can break down into smaller maps.
How could this map be broken up into two maps? What would these two maps mean? Exercise 3: Reading Big Concept Maps The task for this exercise is to write down what this Big Concept Map means. (Hint: If you’re not sure what a big concept map means, start by breaking the big concept map into smaller concept maps, and then figure out what those smaller concept maps mean).
203

1. __________________________________________________________
2. __________________________________________________________
3. __________________________________________________________
4. __________________________________________________________
5. __________________________________________________________
6. __________________________________________________________
7. __________________________________________________________
8. __________________________________________________________
Section 4: Reasoning through Big Concept Maps Now that we know how to read Big Concept Maps, the next step is to be able to reason with them. Just like we did with smaller concept maps, we are going to be able to answer questions about how a change in one concept affects another concept. Look at the concept map below.
This concept map tells us four things. Two of them are about how Lumberjacks affect Trees, and the other two are about how Trees affect Oxygen. Using these facts, we can create new information that tells us how Lumberjacks affect Oxygen. We can do this because even though there is no direct link from Lumberjacks to Oxygen, there is a path that connects Lumberjacks to Oxygen through Trees. This is called an indirect relationship because there is no direct link from Lumberjacks to Oxygen.
204

Imagine now, how you might answer the question “If there are more Lumberjacks, what would happen to the amount of Oxygen?” None of the information we currently have about Lumberjacks and Oxygen can help us answer the question directly. However, we do know how Lumberjacks affect Trees and we also know how Trees affect Oxygen, so we can answer this question in two steps.
1. If we want to know how Lumberjacks affect Oxygen, we first need to know how Lumberjacks affect trees. So, we want to answer the question “If Lumberjacks increase, what happens to the number of trees?”
Since there are more Lumberjacks cutting down trees, there will be fewer trees:
Now that we know how Lumberjacks affect Trees, we can put this information back into the big concept map:
2. We know that an increase in Lumberjacks will lead to a decrease in Trees. Now, we need to answer the question “If Trees decrease, what happens to Oxygen?”
205
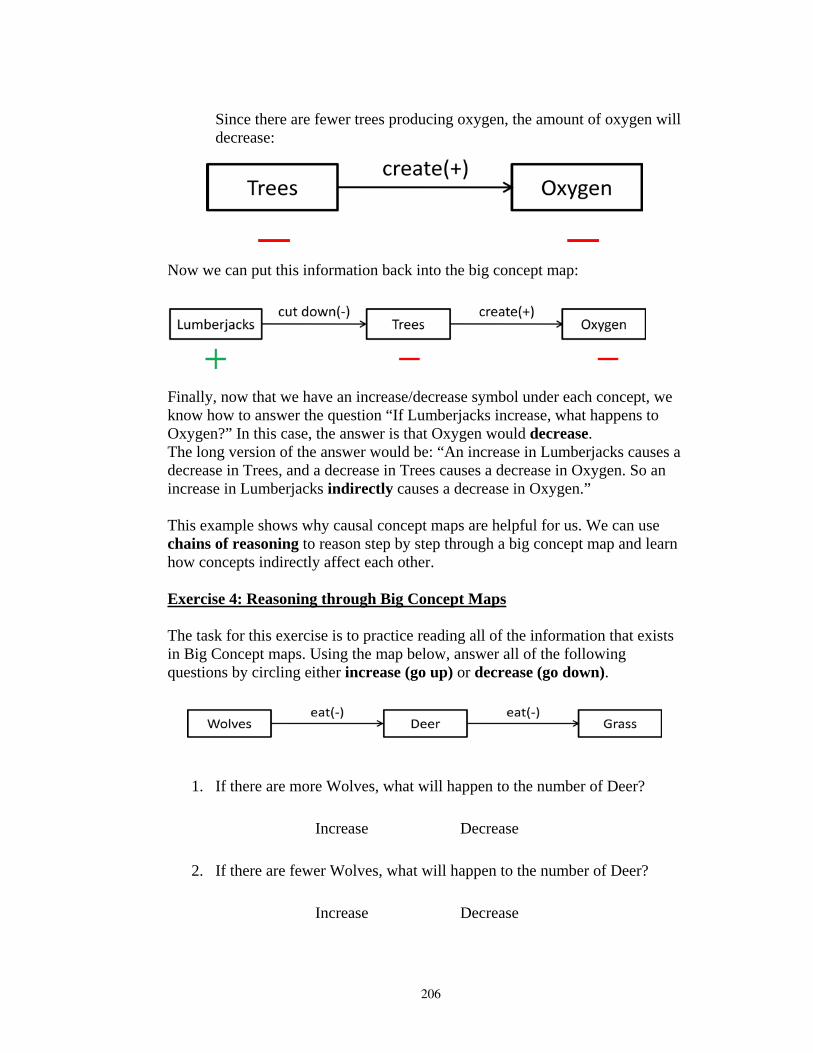
Since there are fewer trees producing oxygen, the amount of oxygen will decrease:
Now we can put this information back into the big concept map:
Finally, now that we have an increase/decrease symbol under each concept, we know how to answer the question “If Lumberjacks increase, what happens to Oxygen?” In this case, the answer is that Oxygen would decrease. The long version of the answer would be: “An increase in Lumberjacks causes a decrease in Trees, and a decrease in Trees causes a decrease in Oxygen. So an increase in Lumberjacks indirectly causes a decrease in Oxygen.” This example shows why causal concept maps are helpful for us. We can use chains of reasoning to reason step by step through a big concept map and learn how concepts indirectly affect each other. Exercise 4: Reasoning through Big Concept Maps The task for this exercise is to practice reading all of the information that exists in Big Concept maps. Using the map below, answer all of the following questions by circling either increase (go up) or decrease (go down).
1. If there are more Wolves, what will happen to the number of Deer?
Increase Decrease
2. If there are fewer Wolves, what will happen to the number of Deer? Increase Decrease
206

3. If there are more Deer, what will happen to the amount of Grass? Increase Decrease
4. If there are less Deer, what will happen to the amount of Grass? Increase Decrease
5. If there are more Wolves, what will happen to the amount of Grass? Increase Decrease
6. If there are fewer Wolves, what will happen to the amount of Grass? Increase Decrease
Section 5: Concept Maps with Multiple Paths In this section, we’ll make big concept maps even more complex by creating questions that involve multiple paths of reasoning. For example, look at the map below:
From what we’ve learned before, we already know how to read this map: • First, we break it up into smaller maps and read those smaller maps.
This tells us about the direct relationships in the map (how one concept directly affects another).
• Then, we can use the information we gain from the smaller maps to generate new information about how concepts that are not connected indirectly affect each other.
207
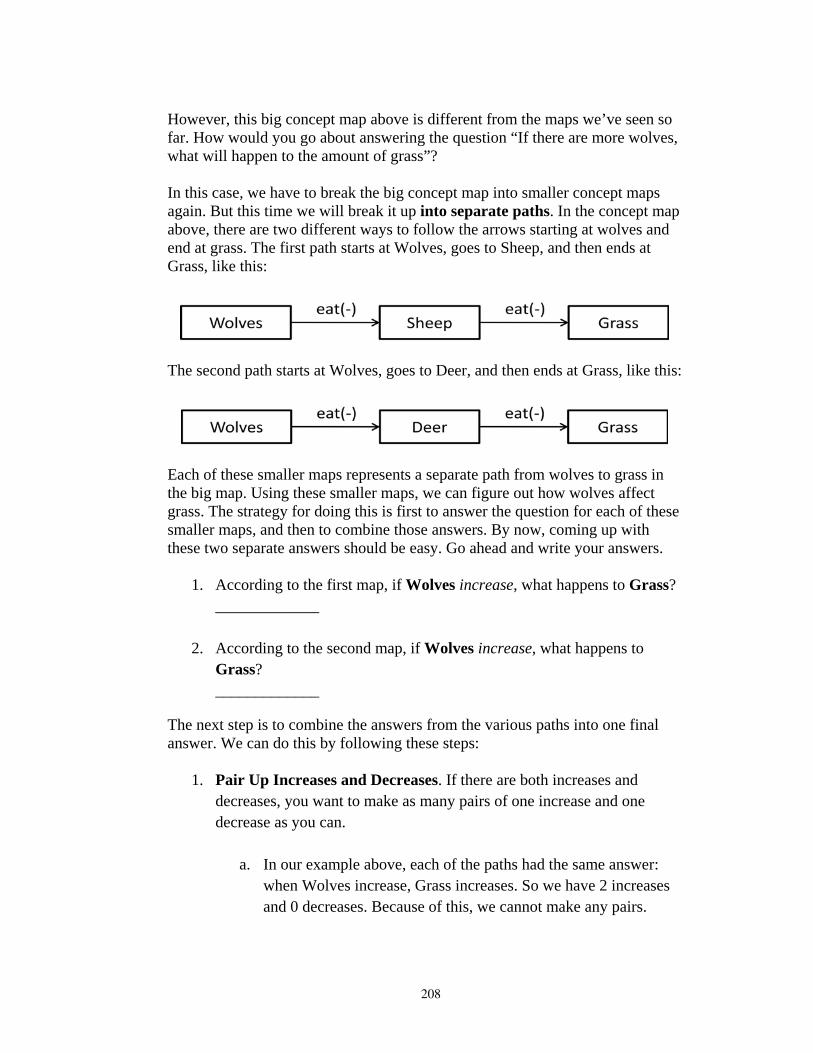
However, this big concept map above is different from the maps we’ve seen so far. How would you go about answering the question “If there are more wolves, what will happen to the amount of grass”? In this case, we have to break the big concept map into smaller concept maps again. But this time we will break it up into separate paths. In the concept map above, there are two different ways to follow the arrows starting at wolves and end at grass. The first path starts at Wolves, goes to Sheep, and then ends at Grass, like this:
The second path starts at Wolves, goes to Deer, and then ends at Grass, like this:
Each of these smaller maps represents a separate path from wolves to grass in the big map. Using these smaller maps, we can figure out how wolves affect grass. The strategy for doing this is first to answer the question for each of these smaller maps, and then to combine those answers. By now, coming up with these two separate answers should be easy. Go ahead and write your answers.
1. According to the first map, if Wolves increase, what happens to Grass? _____________
2. According to the second map, if Wolves increase, what happens to Grass? _____________
The next step is to combine the answers from the various paths into one final answer. We can do this by following these steps:
1. Pair Up Increases and Decreases. If there are both increases and decreases, you want to make as many pairs of one increase and one decrease as you can.
a. In our example above, each of the paths had the same answer: when Wolves increase, Grass increases. So we have 2 increases and 0 decreases. Because of this, we cannot make any pairs.
208
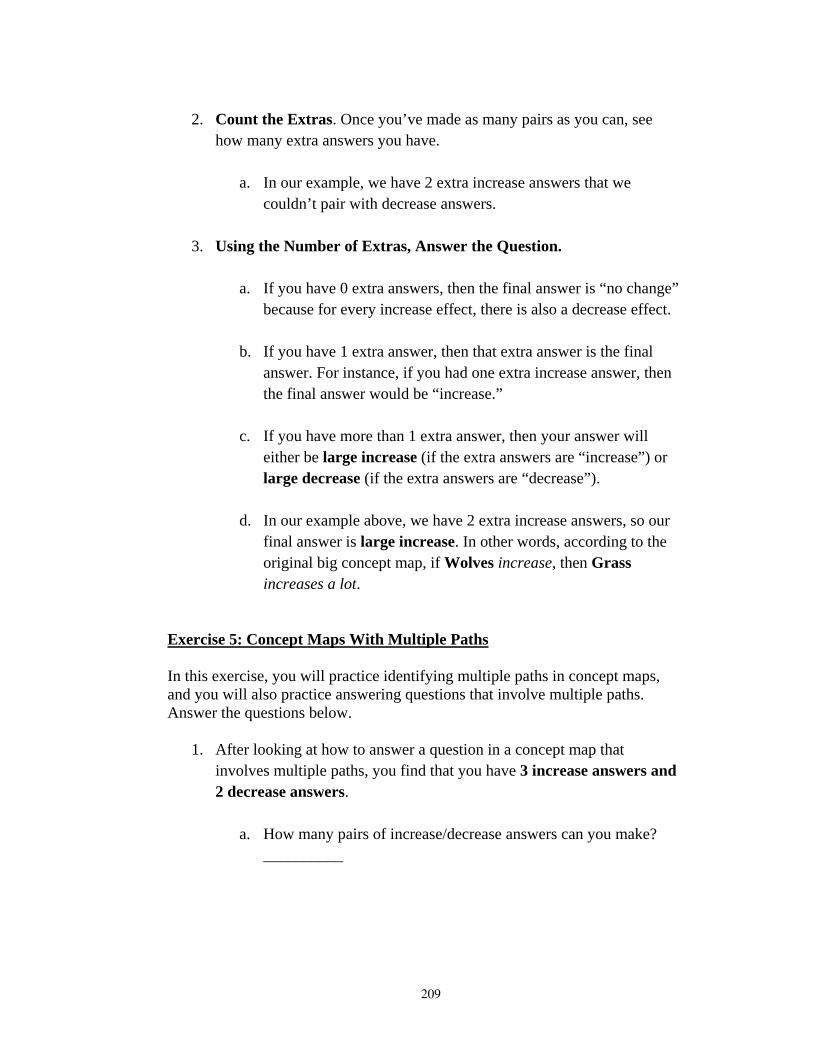
2. Count the Extras. Once you’ve made as many pairs as you can, see how many extra answers you have.
a. In our example, we have 2 extra increase answers that we couldn’t pair with decrease answers.
3. Using the Number of Extras, Answer the Question.
a. If you have 0 extra answers, then the final answer is “no change” because for every increase effect, there is also a decrease effect.
b. If you have 1 extra answer, then that extra answer is the final answer. For instance, if you had one extra increase answer, then the final answer would be “increase.”
c. If you have more than 1 extra answer, then your answer will either be large increase (if the extra answers are “increase”) or large decrease (if the extra answers are “decrease”).
d. In our example above, we have 2 extra increase answers, so our final answer is large increase. In other words, according to the original big concept map, if Wolves increase, then Grass increases a lot.
Exercise 5: Concept Maps With Multiple Paths In this exercise, you will practice identifying multiple paths in concept maps, and you will also practice answering questions that involve multiple paths. Answer the questions below.
1. After looking at how to answer a question in a concept map that involves multiple paths, you find that you have 3 increase answers and 2 decrease answers.
a. How many pairs of increase/decrease answers can you make? __________
209

b. How many extra answers are there after you make pairs? __________
c. Are the extra answers increase answers or decrease answers? __________
d. Based on this information, what is the answer to the question? __________
e. If the original question was “If rain increases, then what happens to ducks?”, then what would your answer be in words? ____________________________________________________ ____________________________________________________
2. After looking at how to answer a question in a concept map that involves multiple paths, you find that you have 1 increase answer and 3 decrease answers.
a. How many pairs of increase/decrease answers can you make? __________
b. How many extra answers are there after you make pairs? __________
c. Are the extra answers increase answers or decrease answers? __________
d. Based on this information, what is the answer to the question? __________
e. If the original question was “If bananas increase, then what happens to fleas?”, then what would your answer be in words? ____________________________________________________
210

____________________________________________________
3. After looking at how to answer a question in a concept map that involves multiple paths, you find that you have 1 increase answer and 1 decrease answer.
a. How many pairs of increase/decrease answers can you make? __________
b. How many extra answers are there after you make pairs? __________
c. Are the extra answers increase answers or decrease answers? __________
d. Based on this information, what is the answer to the question? __________
e. If the original question was “If heat increases, then what happens to rivers?”, then what would your answer be in words? ____________________________________________________ ____________________________________________________
4. Using the concept map below, answer the question “If there are fewer
lumberjacks, what will happen to the amount of oxygen” In doing this, circle the separate paths on the map, and indicate the answer to the question in each path. Then, combine your separate answers to come up with a final answer.
211

Answer: If Lumberjacks decrease, then Oxygen will: ____________________________.
Section 6: Converting Words into Concept Maps In this section, you will learn how to make a concept map from words. We’ve already seen that concept maps represent sentences, so now we can focus on how to create concept maps from those sentences. For instance, the following concept map could be made from the sentence:
“Living things produce carbon dioxide.”
In order to make this concept map, we had to find the two concepts from the sentence. Usually, a concept is a noun. The sentence contains two nouns, “Living Things” and “Carbon Dioxide.” So those become the two concepts. Next, we have to understand the relationship between the two concepts. The sentence tells us that Living Things produce Carbon Dioxide. This tells us two things. First, it tells us that Living Things is causing a change in Carbon Dioxide. We represent this by making Living Things the source concept and Carbon Dioxide the target concept. Next, we need to figure out whether to use a decrease link or an increase link. “Produce” is a word that means to make something. For instance, when you answer a question you are producing an answer. This means that Living Things make Carbon Dioxide, which increases the amount of Carbon Dioxide. To show this on the concept map, we use an increase link. For your project, you will be creating a climate change concept map. As you are working on your climate change concept map, you will have to read about the concepts and links related to climate change, so that you can build the correct concept map. One thing to remember is that for this project, your reading will only tell you about direct relationships. It will not talk about the indirect relationships. You will be reminded about this when you start working on the computers.
212

Exercise 6: Converting Words into Concept Maps The task for this exercise is to create concept maps from the following sentences. Good luck! (Hint: These sentences all represent small concept maps. This means they have two concepts and one link. Try to identify the source and target concept first, and then determine how the source concept affects the target concept)
1. My mom once told me that a rabbit’s favorite food is carrots. I think she is right, because I’ve seen my rabbit eat carrots many times.
2. It is hard for people to see in the dark because our sight only works if there is light. Thankfully, the sun comes out every day, providing light so that we all can see.
3. Usually when I see people dancing, they are listening to music. So I think that music probably causes people to dance.
Name: __________________________ Section: __________________________ Date: __________________________
Causal Concept Maps Homework
1. Look at the following concept map, which includes two concepts, A and B, and one link.
a. Which concept is the source concept? _________________
b. Which concept is the target concept? _________________
c. If A increases, what happens to B? _________________
213

d. If A decreases, what happens to B? __________________
2. Look at the following concept map, which includes two concepts, C and D, and one link.
a. Which concept is the source concept? __________________
b. Which concept is the target concept? __________________
c. If D decreases, what happens to C? __________________
d. If D increases, what happens to C? __________________
3. Look at the following concept map, which includes three concepts, Dogs, Dog Food, and Holes, and two links.
a. Which concept(s) are source concept(s)? _________________
b. Which concept(s) are target concept(s)? __________________
c. If Dogs increase, what happens to Dog Food? ______________
d. If Dogs decrease, what happens to Holes? __________________
e. If Dog Food increases, what happens to Dogs? ______________
f. If Dogs decrease, what happens to Dog Food? ______________
g. If Dog Food decreases, what happens to Dogs? _____________
h. If Dogs increase, what happens to Holes? __________________
214

4. Chain of Reasoning: use a chain of reasoning to answer the following question.
a. If Hunters increase, what is the indirect effect they have on Wool? Will there be more wool or less wool?
b. To answer this question, use a chain of reasoning by answering the following questions:
i. If Hunters increase, what happens to Wolves? __________________
ii. How does the change in Wolves affect the Sheep? __________________
iii. How does the change in Sheep affect the Wool? __________________
c. So, an increase in the number of Hunters indirectly causes Wool to: _______________
d. Using the same technique, answer the following question: If Hunters decrease, what happens to Wolves?
215

Appendix C
Reference Materials for Study 3
C.1 Assessment Test Questions
C.1.1 Climate Change Questions
C.1.1.1 Science Content Questions
1. What is the greenhouse effect?
(a) The atmosphere of the earth traps some radiated heat energy and reflects it back to the
earth. This makes the earth warmer.
(b) The atmosphere of the earth is reflective and keeps sunlight away from the earths surface. This
light reflection keeps the earth from getting too hot.
(c) The atmosphere acts like a magnifying glass. This makes the light stronger and makes the earth
hotter.
(d) The atmosphere traps pollution from cars and factories. Over time, the air will become more
polluted and the earth will get warmer.
2. Light from the sun comes to the earth and its energy is absorbed by the atmosphere. What is the relation
between this absorbed light energy and heat energy absorbed by the earth?
(a) Absorbed light energy increases the amount of absorbed heat energy.
(b) Absorbed light energy decreases the amount of absorbed heat energy.
(c) Absorbed light energy does not change the amount of absorbed heat energy.
(d) Absorbed light energy is not related to absorbed heat energy.
3. Clouds are made up of water vapor. How does condensation of water vapor in clouds affect precipita-
tion?
(a) Condensation and precipitation are not related.
(b) Condensation decreases precipitation.
(c) Condensation increases precipitation.
(d) An increase in condensation may increase or decrease precipitation.
4. What is the main greenhouse gas created in landfills?
216

(a) Carbon dioxide
(b) Methane
(c) Oxygen
(d) All of the above
5. How does vegetation affect the amount of carbon dioxide in the atmosphere?
(a) Vegetation produces carbon dioxide through the process of photosynthesis, which increases the
amount of carbon dioxide in the atmosphere.
(b) Vegetation releases water vapor through the process of photosynthesis. The vapor bonds with
carbon dioxide, which reduces the amount of carbon dioxide in the atmosphere.
(c) Vegetation absorbs carbon dioxide as part of the process of photosynthesis, which reduces
the amount of carbon dioxide in the atmosphere.
(d) Vegetation produces oxygen because of photosynthesis, but it does not affect the amount of carbon
dioxide in the atmosphere.
6. How does an increase in carbon dioxide affect sea ice?
(a) Carbon dioxide is absorbed by sea ice. This increases the melting point of sea ice and more sea
ice melts.
(b) Carbon dioxide reflects heat radiated from the earth back to earth. This radiation keeps the earth
cool, and so it decreases the amount of sea ice that melts.
(c) Carbon dioxide forms a shield around the earth. This protects solar energy from heating the ice
caps, so less sea ice melts.
(d) Carbon dioxide reflects heat radiated from the earth back to earth. This radiation increases
the earths temperature, and more sea ice melts.
7. Which statement best explains how driving more cars affects global temperature?
(a) Car engines run hot. This increases the surrounding temperatures. The more cars we drive, the
higher the global temperature.
(b) Cars burn fossil fuels, and this produces carbon dioxide. The carbon dioxide prevents solar energy
from entering the earths atmosphere. This reduces global temperature.
217

(c) Cars burn fossil fuels, and this produces carbon dioxide. The carbon dioxide prevents radi-
ated heat energy from leaving from the earths atmosphere. This increases global tempera-
ture.
(d) Car engines run hot, and this produces carbon dioxide. But the carbon dioxide cools quickly, and
it does not affect the global temperature.
C.1.1.2 Short Answer Questions
1. We know that deforestation (cutting down a large number of trees) increases the earth’s absorbed heat
energy. Explain, step-by-step, how deforestation increases the earth’s absorbed heat energy.
Step 1: Deforestation reduces the amount of trees and vegetation on the earth, so more deforestation
would decrease vegetation. Step 2: When vegetation decreases...
2. Carpooling is a great way to cut down on vehicle use. When people carpool, there are fewer cars on
the road, and this decreases vehicle use. Explain, step-by-step, how carpooling changes the amount of
carbon dioxide in the earth’s atmosphere.
Step 1: When people carpool, vehicle use decreases. So more carpooling would decrease vehicle use.
3. Explain, step-by-step, how increases in global temperature would affect coastal flooding.
4. Explain, step-by-step, how increases in condensation would affect drought in inland areas.
5. Explain, step-by-step, how carbon dioxide affects global temperature.
C.1.2 Thermoregulation Questions
C.1.2.1 Science Content Questions
1. What is thermoregulation?
(a) Thermoregulation is the bodys process of keeping itself from getting too hot or too cold.
(b) Thermoregulation is the normal or “regular” temperature of the body, which is about 37 degrees
Celsius.
(c) Thermoregulation is a disease that causes people to be unable to control their own body tempera-
ture.
(d) Thermoregulation includes all of the processes the body uses to stay in balance.
2. How does the hypothalamus regulate body temperature when the body gets too cold?
218

(a) The hypothalamus causes the heart to speed up. This will help blood flow to cold areas of the
body and warm them up.
(b) The hypothalamus causes blood vessels to become wider. Wider blood vessels allow more blood
to flow to parts of the body that are cold.
(c) The hypothalamus causes skeletal muscles to stop moving. This saves energy, and we can use
that energy to stay warm.
(d) None of the above.
3. How does shivering help regulate body temperature in cold temperatures?
(a) Shivering decreases blood flow to the skin. When blood isnt flowing toward the skin, more heat
stays in the core of the body.
(b) Shivering increases blood flow to the skin. When blood is flowing toward the skin, it gets warmer,
and this warms up the body.
(c) Shivering causes our muscles to move very quickly. When this happens, we lose less of our heat
to the cold air around us.
(d) Shivering causes our muscles to move very quickly. When this happens, our muscles rub
together and create friction. Friction generates heat and keeps us warm.
4. How do blood vessels change when the body is exposed to cold temperatures?
(a) Cold temperatures make blood vessels contract (or become narrower), so the blood vessels ex-
posed to cold temperatures contract.
(b) Cold temperatures are detected by the brains hypothalamus. The hypothalamus sends sig-
nals to blood vessels near the skin, telling them to contract (or become narrower).
(c) Cold temperatures are detected by the brains hypothalamus. The hypothalamus sends signals to
blood vessels near the skin, telling them to become wider.
(d) Cold temperatures cause the skeletal muscles to contract and relax rapidly. This rapid movement
makes the blood vessels become narrower.
5. How do raised skin hairs affect body heat?
(a) Raised skin hairs let cold air get to our skin faster. So raised skin hairs decrease body heat.
(b) Raised skin hairs stop warm air near our skin from escaping as quickly. So, raised skin
hairs stop us from losing as much body heat.
219

(c) Raised skin hairs do not affect body heat.
(d) None of the above.
6. When a person drinks alcohol, their blood vessels become wider. How would drinking alcohol affect a
person outside on a cold day?
(a) It would make more blood flow through their blood vessels. Then, more blood would be able to
warm up the cold parts of the body. The body’s core temperature would not change.
(b) It would make more blood flow through their blood vessels. Then, more blood would be able
to warm up the cold parts of the body. The bodys core temperature would increase because the
blood going to the cold parts of the body would still be warm.
(c) It would make more blood flow through their blood vessels. Then, more blood would be able
to warm up the cold parts of the body. The bodys core temperature would decrease because
it is sending more heat to the cold parts of the body.
(d) It would make more blood flow through their blood vessels. Then, more blood would flow to the
muscles, and this would make the person shiver.
C.1.2.2 Short Answer Questions
1. Explain, step-by-step, how skin contraction reduces heat loss from the body.
Step 1: When the hypothalamus detects cold temperatures, it sends signals to the skin muscles telling
them to contract. So the hypothalamus response increases skin contraction.
2. Explain, step-by-step, how skeletal muscle contractions increase body temperature.
Step 1: When the hypothalamus detects cold temperatures, it sends signals telling the skeletal muscles
to rapidly contract and relax. So the hypothalamus response increases skeletal muscle contractions.
3. Explain, step-by-step, how blood vessel constriction decreases heat loss form the body.
Step 1: When the hypothalamus detects cold temperatures, it sends signals to the blood vessels near
the skin, telling them to constrict (or become narrower). So the hypothalamus response increases blood
vessel constriction.
4. Explain, step-by-step, how cold temperatures cause a hypothalamus response in the brain.
Step 1: When the body is exposed to cold temperatures, it experiences more heat loss.
220

C.1.3 Skill Problems
C.1.3.1 Causal Reasoning Problems
Refer to Figure C.1 for the causal maps students were expected to use as they answered causal reasoning
questions. For each question, students could either choose “increase,” “decrease,” “it depends,” or “no effect.”
1. If A increases, then what would happen to B?
2. If C decreases, then what would happen to D?
3. If G increases, then what would happen to H?
4. If J decreases, then what would happen to K?
5. If D increases, then what would happen to E?
6. If B decreases, then what would happen to C?
7. If H increases, then what would happen to I?
8. If D decreases, then what would happen to E?
9. If A increases, then what would happen to C?
10. If C increases, then what would happen to E?
11. If E increases, then what would happen to G?
12. If K decreases, then what would happen to M?
13. If B decreases, then what would happen to D?
14. If F increases, then what would happen to H?
15. If I increases, then what would happen to K?
16. If P decreases, then what would happen to R?
17. If B increases, then what would happen to F?
18. If B decreases, then what would happen to F?
19. If N increases, then what would happen to P?
20. If N decreases, then what would happen to P?
221

Figure C.1: Study 3 abstract causal maps used for causal reasoning problems.
C.1.3.2 Reading Problems
For each question, students could either choose “Ticks increase Tacks,” “Ticks decrease Tacks,” “Tacks in-
crease Ticks,” or “Tacks decrease Ticks.”
1. Tacks increase ticks.
2. A decrease in Ticks decreases Tacks.
3. Tacks are decreased by Ticks.
4. Ticks are decreased by a decrease in Tacks.
5. When Ticks increase, Tacks increase too.
6. When Tacks decrease, Ticks increase.
7. When Tacks increase, Ticks decrease.
8. Ticks decrease when Tacks increase.
9. Tacks decrease when Ticks decrease.
10. Ticks are increased when Tacks increase.
222

C.1.3.3 Quiz Evaluation Problems
In quiz evaluation problems, students were presented with an abstract causal map and a set of quiz results
completed using that causal map. Students needed to use the quiz results to determine which links were
correct, incorrect, or possibly incorrect. The following seven pages show the 14 problems on the skill test,
and each problem has the correct answer filled in.
223

224

225

226

227

228
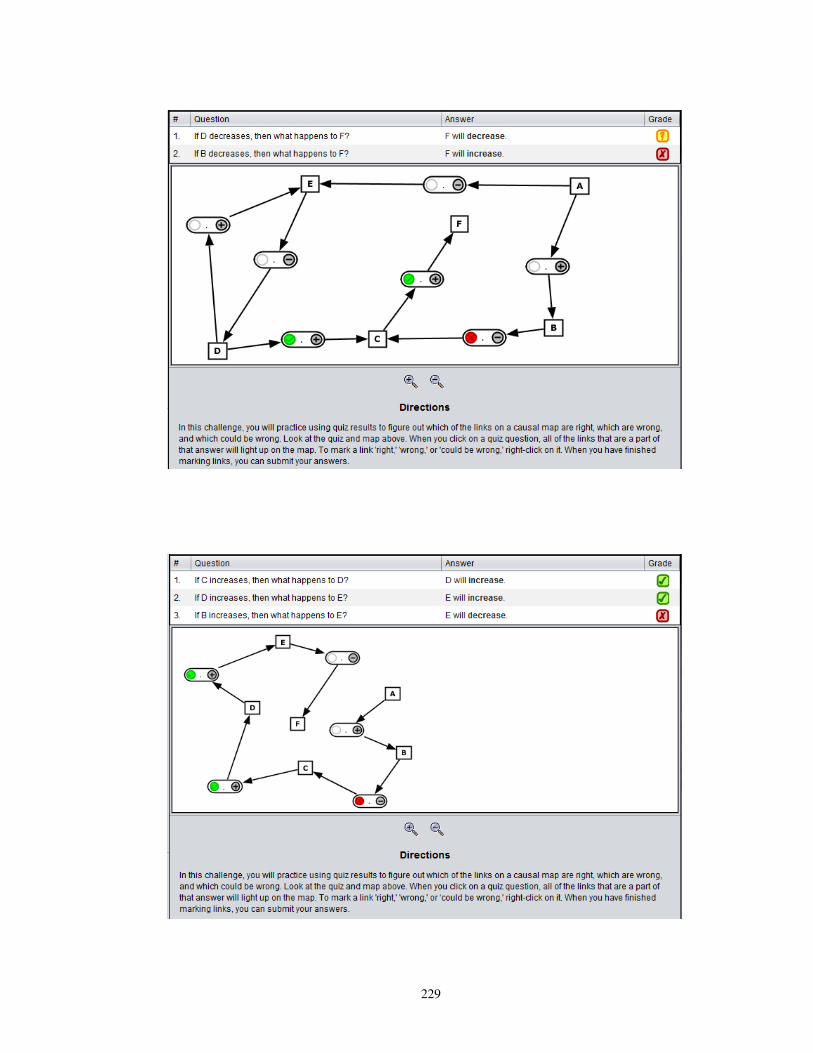
229

230

C.2 Science Resources
C.2.1 Climate Change Resources
The hypertext resources used during the Study 3 climate change unit are included on the following 20 pages.
231

Introduction to Climate Change
Climate change is an important topic that many people around the world are
talking about. The United Nations has sponsored a series of climate change
talks. One of the ones that people know best is the United Nations (UN) Climate
Change Conference. In 2010, the UN Climate Change Conference was in
Cancun, Mexico.
When scientists research climate change, they try to understand why the
weather patterns on the Earth change over long periods of time. This is a large
and difficult task. The weather patterns change in different ways, and there
could be a lot of different ways to explain the changes that we have seen over
time.
Of all of the different kinds of climate change, the one that usually receives the
most attention is called "Global Warming." Meteorologists and Earth scientists
have measured the average global temperature for hundreds of years, and they
have found something interesting: the average global temperature has increased
by about 0.75 degrees Celsius (1.3 degrees Fahrenheit) over the last 100 years!
This might sound like a small change, but it can greatly affect the way that the
world works. Some scientists fear that if the temperature of the earth increases,
it could indirectly lead to more extreme weather patterns. Droughts might
happen more often in some places and less often in others. Near the ocean,
coastal flooding might start happening more often.
Some scientists theorize that this increase in global temperature is because of
the way that we humans live our lives. In these resources, you will learn about
232

the scientific theory that says that humans are making choices that warm up our
planet. First, you will learn about the "Greenhouse Effect" that allows the Earth
to collect the heat from the sun. Then, you will learn about how human activity
may be increasing the greenhouse effect. Finally, you will learn about how an
increase in the global temperature could lead to more extreme weather patterns.
Solar Energy and Absorbed Light Energy
You might have heard about the greenhouse effect on television or in your
science classes. That is because the greenhouse effect is important to how the
world normally works. By trapping heat generated by the sun, the greenhouse
effect keeps the earth warm enough to support life.
The whole process starts with solar energy, which is generated by the sun about
150 kilometers from the Earth. Most of the sun is made of hydrogen gas.
Through a process called nuclear fusion, some of the hydrogen in the sun is
turned into helium. This releases a huge amount of energy! The energy from
nuclear fusion in the sun is radiated into space as electromagnetic waves. Solar
energy is electromagnetic radiation that carries the energy of the sun to the
Earth.
When solar energy reaches the Earth's surface, the Earth absorbs it. Once it has
been absorbed, we call it absorbed light energy. The more solar energy that the
Earth receives, the more light energy it will absorb. The Earth does not absorb
all of the solar energy it receives. Some solar energy is reflected back into space
by the atmosphere before ever reaching the Earth's surface. Other solar energy
is reflected back into space by sea ice, which is a good reflector of light. When
there is more sea ice covering the earth's surface, there will be less absorbed
light energy.
233

Absorbed Light Energy and Absorbed Heat Energy
The next step involves something called heat energy. Everything in the universe
is made of atoms and molecules, and heat energy actually describes how fast
these particles are moving. The energy of motion is called kinetic energy, so
why do we call it heat energy? Well, objects with more kinetic energy feel hot
to us. When they touch us, some of the kinetic energy is transferred to us, and
that makes us feel hotter. Heat energy comes from the motion of these particles.
The more they move, the more energy they have.
Absorbed light energy excites the molecules in the earth's surface. This causes
the molecules to move faster, and the surface of the earth stores this absorbed
heat energy. The absorbed heat energy raises the average global temperature. In
other words, an increase in absorbed light energy produces more absorbed heat
energy. This is why solar energy, or sunlight, feels warm on our skin. Solar
energy excites the molecules of our skin!
Heat Reflected to the Earth
The Earth absorbs about half of the solar energy it receives. Once absorbed, this
absorbed light energy is converted to absorbed heat energy. The absorbed heat
energy makes the Earth warmer.
The rest of the absorbed heat energy drifts away from the earth's surface and
moves back towards outer space. This is where the greenhouse effect comes in.
Some of the heat that drifts toward outer space is actually blocked by the earth's
atmosphere. Gases in the atmosphere called "greenhouse gases" block escaping
heat and reflect it back toward Earth. Two important greenhouse gases are
methane and carbon dioxide. When this heat is reflected back to the earth, it is
re-absorbed by the earth's surface and becomes absorbed heat energy.
Normally, there is a balance between the amount of solar energy absorbed by
the earth and the amount of heat energy that radiates away from the Earth.
Absorbed light energy indirectly increases global temperature, but heat radiation
indirectly lowers it. Some scientists believe that human activity is disturbing
234

this balance. They believe that humans are increasing the amount of heat
reflected to the earth by adding a large amount of extra carbon dioxide and
methane to the atmosphere.
The chart above shows that over the past 70 years, the average global
temperature has been increasing.
An Earth in Trouble
The Earth's population is steadily increasing, and the increase in population has
increased our overall needs: we need more homes to live in, more electricity to
power those homes, more vehicles to travel in, and more essential goods like
food, clothing, tools, and toys. At the same time, we create much more garbage
than we used to.
All of these activities add more greenhouse gases to our environment. When we
build new homes, we contribute to the deforestation of Earth. When we create
electricity or use vehicles, we burn fossil fuels. When we produce essential
goods, we create more garbage.
The increased amounts of greenhouse gases in the atmosphere contribute to the
greenhouse effect and indirectly raise global temperatures. Since humans are
235

causing this increase in greenhouse gases, scientists call it the human impact on
global warming.
Deforestation and Carbon Dioxide
Deforestation is the removal of vegetation from an area. The more deforestation
there is, the less vegetation there is. Vegetation includes all trees, plants, shrubs
and grass that grow on the Earth. Vegetation is important for the global climate
for two reasons. First, vegetation releases water vapor into the air. This
additional water vapor indirectly helps reduce the amount of drought in an area.
Second, vegetation absorbs carbon dioxide from the air during photosynthesis.
So, the more vegetation there is, the less carbon dioxide there will be in the
atmosphere. Carbon dioxide is a greenhouse gas. It traps heat in the earth's
atmosphere, and that increases the amount of heat reflected to the earth. This
heat reflected to the earth indirectly increases the earth's average global
temperature. So, deforestation indirectly raises the average global temperature.
Vehicle Use, Factories, and Electricity
In addition to deforestation, humans use large amounts of fossil fuels in many
different ways. The vehicles we drive use about 378 million gallons of gasoline
every day, and gasoline is a fossil fuel. So, vehicle use increases the levels of
fossil fuel use. Factories are used to produce many different things people use
every day. For example, we have factories that make cement, steel, aluminum,
cars and computers. Most factories have machines that burn fossil fuels like
coal, oil and natural gas. So, factories also increase fossil fuel use. Finally, we
236

constantly use electricity to power lights, microwaves, computers, and all of the
other electrical appliances in homes, schools, and workplaces. Most electricity
is generated by burning fossil fuels like coal, natural gas, and petroleum to
produce heat. The heat boils water, creating steam. The steam then passes
through a turbine to generate electricity. So, electricity generation also causes
more fossil fuel use.
Fossil fuel use releases large amounts of carbon dioxide into the atmosphere.
The increased carbon dioxide in the atmosphere contributes to the greenhouse
effect, and many scientists believe that it is indirectly responsible for the
increase in average global temperatures.
One Person’s Trash is Another Planet’s Peril
Carbon dioxide is not the only greenhouse gas humans release into the
atmosphere. The garbage that we create every day releases another dangerous
greenhouse gas, methane, into the atmosphere. The typical American throws
away about five pounds of trash a day. This adds up to about 251 million tons of
garbage a year, almost twice as much trash per person as most other major
countries. Americans are making waste products faster than nature can break
them down. What happens to all of this trash? Some gets recycled and some
gets burned, but most of it gets buried in landfills. A landfill is a place where we
bury large amounts of garbage underground. Landfills are dangerous for the
environment. In landfills, garbage decays. When it decays, methane is released
into the environment. Methane is more dangerous as a greenhouse gas than
carbon dioxide. Like carbon dioxide, an increase in methane will increase the
heat reflected to the earth.
237

Together, these human activities greatly affect the amount of greenhouse gases
in our atmosphere. The scientists who study global warming urge all people to
try to reduce the amount of greenhouse gases they are creating. This is also
called a person's carbon footprint, and we should all take steps to reduce our
carbon footprints as much as we can!
Rising Ocean Levels
Human activities in the last century have been adding large amounts of
greenhouse gases to the atmosphere. This is making the greenhouse effect
stronger. If greenhouse gases and the global warming that they indirectly cause
are not reduced, they have the potential to cause catastrophic problems for the
Earth and its inhabitants. Some of these problems include rising ocean levels,
coastal flooding, and drought.
One of these problems, rising ocean levels, might already be happening. In fact,
the world's oceans have already risen 4-8 inches. As the global temperature has
increased, sea ice in the Arctic and Antarctic has started to melt. It's like putting
an ice cube in a cup of hot water. As the sea ice melts, it turns into water. When
ice turns into water, it takes up more space than it does when it is frozen.
Because of this, sea ice actually limits the ocean levels, and the more sea ice we
have, the lower the ocean levels will be. But when sea ice melts, ocean levels
rise. As a result, people living in some South Pacific islands and off of the coast
of India have had to move to higher ground. These people are moving away
238

because as the ocean levels rise, the water from the oceans creeps farther and
farther onto the land. We call this coastal flooding, and higher ocean levels
cause more coastal flooding. Areas that are low to the ground include some of
the world's largest cities. If these areas flood, millions of people around the
world might have to find new places to live.
Droughts and the Water Cycle
Another problem related to global warming has started to happen. Many dry
areas, including the American West, Southern Africa, and Australia have been
239

experiencing more severe droughts in recent years. In fact, the amount of land
on the Earth suffering from drought has doubled since 1970. The reason for this
is complicated. As the Earth's temperature increases, the air's ability to hold
water vapor increases. We call this carrying capacity. So when global
temperatures increase, the carrying capacity of the atmosphere also increases.
When carrying capacity grows, it takes longer for the air to fill up. Because of
this, there is less condensation.
Condensation is how water vapor in the air is changed into a liquid form. When
the air is completely full of water vapor, we say that it is saturated.
Condensation happens when saturated air cools. When saturated air cools, its
carrying capacity lowers and it can no longer hold all of its water vapor. When
this happens, condensation takes place and the extra water vapor turns back into
liquid water droplets, or precipitation. These water droplets then fall to Earth.
Condensation can't happen without a lot of water vapor in the air. If there isn't
any water vapor in the air when it cools, no condensation will happen. So the
more water vapor there is, the more condensation there is.
240

Condensation increases the amount of precipitation that falls to the earth.
Precipitation is the water that falls to the Earth. When this water is in liquid
form we call it rain. When it is solid we call it snow. This precipitation then
evaporates in the hot sun, creating more water vapor. This new water vapor will
eventually condense, become precipitation, and then fall to the planet's surface
again. This is called the water cycle, and it keeps happening over and over
again. Over time, water vapor keeps condensing, falling to the earth, and again
becoming water vapor.
So what does the water cycle have to do with droughts? A drought is a long
period of lower than normal rainfall in a region. When there is a drought,
vegetation does not get the water it needs to survive and begins to die off.
Precipitation reduces drought. The problem is this: as the global temperature
rises, so does carrying capacity. This limits the amount of condensation, which
limits the amount of precipitation. The lower amounts of precipitation increase
the amount of drought in an area.
Occasional droughts are normal for the Earth's climate. However, droughts may
become more common because of increased greenhouse effects. The table
below shows how droughts have become more severe in recent years.
Absorbed Heat Energy
Everything in the universe is made of atoms and molecules, and heat energy
actually describes how fast these particles are moving. The energy of motion is
called kinetic energy, so why do we call it heat energy? Well, objects with more
kinetic energy feel hot to us. When they touch us, some of the kinetic energy is
transferred to us, and that makes us feel hotter. Heat energy comes from the
motion of these particles. The more they move, the more energy they have.
241

Heat energy is an important part of the greenhouse effect.
Absorbed Light Energy
When solar energy reaches the Earth's surface, the Earth absorbs it. Once it has
been absorbed, we call it absorbed light energy. Absorbed light energy is an
important part of the greenhouse effect.
Carbon Dioxide
Carbon dioxide is a colorless gas found in the atmosphere. Carbon dioxide
molecules have two atoms of oxygen and one atom of carbon. The chemical
formula for carbon dioxide is CO2. In the diagram below the carbon atom is
colored black and the two oxygen atoms are colored red.
Carbon dioxide is a greenhouse gas. Scientists believe that carbon dioxide,
mainly created by human activity, is intensifying the greenhouse effect.
Carrying Capacity
Carrying capacity is the amount of water vapor air can hold. Look at the chart
below. It shows that air can hold more water vapor when it is warmer. An
increased carrying capacity is an important part of global warming's impact on
the earth's climate.
242

Coastal Flooding
Coastal flooding happens when ocean water floods the continental land near the
coast. Coastal flooding is sometimes caused by several natural events on the
planet. Some of these events include sea storms, tsunamis, hurricanes, or
cyclones. Coastal flooding is related to ocean levels. When coastal flooding
243

takes place, it can cause losses of both lives and property. Coastal flooding is
one of the ways that global warming can have an impact on our climate.
Condensation
Condensation is the process by which water vapor in the air is changed into
liquid water. You have probably seen water droplets form on the outside of a
glass of ice water. As invisible water vapor in the air around the glass touches
the glass, the cold temperature causes it to condense. Condensation is an
important part of the water cycle, and is important for understanding how global
warming can impact our climate.
Deforestation
244

Deforestation is a process by which humans reduce the amount of vegetation in
an area. Humans are rapidly cutting down forests in order to create more
farmland and expand cities. Because of this, there is less vegetation on our
planet. Deforestation is one of the primary ways that human activity could be
causing global warming.
Drought
A drought is a long period of lower than normal rainfall in a region. Occasional
droughts are normal for the Earth's climate. But scientists fear that if global
warming continues, droughts will become more common and more severe. This
is one of global warming's potential impacts on climate.
The table below shows how droughts have become more severe in recent years.
Electricity Generation
Electricity generation is the process of creating electricity from other sources of
energy. The first power plants ran on water power or coal. Today, we rely
mainly on coal, petroleum, natural gas, and nuclear power. We also create a
small amount of electricity from renewable resources like wind generators and
geothermal energy.
Most electricity is generated by burning fossil fuels like coal, natural gas, and
petroleum to produce heat. The heat boils water, creating steam. The steam then
passes through a turbine to generate electricity. A single coal plant generates
about 1,322,719 megawatt-hours of electricity every year, and this adds roughly
245

1.2 million metric tons (or 2.6 billion pounds) of carbon dioxide to the
atmosphere. Electricity generation is one of the human activities that scientists
believe is causing global warming.
Fossil Fuel Use
Fossil fuels include things like coal, oil, and natural gas. These fuels contain lots
of carbon. This is because they are made of organic matter that has been buried
under pressure and heat for millions of years. About 90% of the energy used in
the U.S. comes from burning fossil fuels. Fossil fuel use is one of the major
human activities that contributes to global warming.
Garbage and Landfills
The typical American throws away about five pounds of trash a day. This adds
up to about 251 million tons of garbage a year. Garbage isn't just the old food,
drink containers, and food boxes that we throw away in our homes. Regular
household trash is only a part of the garbage people create. We use a lot of
special equipment and materials in our jobs. For example, when we build or fix
buildings, we throw away a lot of construction materials, and when we mine
rocks from the ground, we use up and eventually throw away tools and
equipment that help us get the job done.
What happens to all of this trash? Some gets recycled and some gets burned, but
most of it gets buried in landfills. A landfill is a place where we bury large
246

amounts of garbage underground. As more and more of our garbage piles up, it
becomes harder to figure out where to put it all! Many of the landfills we are
using now are filling up, so we will have to find new places to put our trash. We
can help this problem by finding ways to reduce the amount of trash we
generate. One way to reduce our trash is to recycle it instead. When people
recycle, they take the useful pieces of their garbage, clean them, and use them to
create new things.
Garbage creation is one of the human activities that contribute to global
warming.
Global Temperature
Temperatures in our local region change based on day and season.
Temperatures in places around the world might be very different from each
other. It's often freezing in Antarctica and hot in the Sahara desert at the same
time.
247

So why do people say that the Earth is getting warmer?
When we talk about global warming and climate change, we are not talking
about the temperature of just one place. Instead, we are talking about the
average global temperature of the whole world. Some places may be hotter or
colder, but the global temperature tells us how hot or cold the whole Earth is on
average.
Heat Reflected to the Earth
The Earth absorbs about half of the solar energy it receives. Once absorbed, this
abosorbed light energy is converted to absorbed heat energy. The absorbed heat
energy makes the Earth warmer.
The rest of the absorbed heat energy drifts away from the earth's surface and
moves back towards outer space. Some of this heat is blocked by the earth's
atmosphere. Gases in the atmosphere called "greenhouse gases" block escaping
heat and reflect it back toward Earth. We call this "heat reflected to the earth."
Methane
Methane is a colorless, odorless gas. It is the primary component of natural gas.
Methane molecules have four atoms of hydrogen and one atom of carbon. The
chemical formula for methane is CH4. In the diagram below the carbon is
colored black and the four hydrogen atoms are colored white.
Methane is a dangerous greenhouse gas, and human activities are releasing a lot
of methane into the earth's atmosphere.
248

Ocean Levels
Ocean level refers to the average height of the ocean. Ocean levels are an
important topic in climate change because they have been rising. For the last
100 years, ocean levels have been rising an average of 1.8 millimeters per year.
Scientists have found that with every 1°C rise in global temperature, the ocean
levels will rise by about 1 meter. According to their research, the Netherlands,
Bangladesh, and the coral island Majuro in Oceania will be among the first
areas of the world to suffer if the ocean levels continue to rise.
Precipitation
Precipitation is the water that falls to the Earth. When this water is in liquid
form we call it rain. When it is solid we call it snow. About 90 percent of
precipitation falls into the ocean. The rest falls on land, renewing the supply of
fresh water.
Precipitation is important because plants and animals need fresh water to live.
Precipitation is an important part of the water cycle, and one of global
warming's impacts on climate is closely related to the water cycle.
249

Sea Ice
Sea ice can take several forms. Some of it is seen as giant icebergs floating in
the ocean. Near the polar regions of the Earth, there are large ice masses
attached to the land. The polar ice caps are the size of whole continents! Sea ice
is the main habitat for polar bears, ringed seals, and ice algae.
Solar Energy
The sun is a star at the center of our solar system. Even though it is far away,
solar energy from the sun is the major source of energy for the planet Earth.
This energy keeps our planet warm enough for things to live and grow.
Most of the sun is made of hydrogen gas. Through a process called nuclear
fusion, some of the hydrogen in the sun is turned into helium. This releases a
huge amount of energy! The energy from nuclear fusion in the sun is radiated
into space as electromagnetic waves. Solar energy is electromagnetic radiation
that carries the energy of the sun to the Earth.
Vegetation
250

Vegetation includes all trees, plants, shrubs and grass that grow on the Earth.
While every plant is different, they all use sunlight, carbon dioxide and water
for their normal life processes.
Vegetation is important for the global climate, and one of the dangerous human
activities has been to greatly reduce the vegetation on Earth.
Vehicle Use
Vehicle use refers to the amount of driving humans do. Vehicle use is damaging
to the environment, and it is one of the human activities that may be causing
global warming.
Water Vapor
Water vapor is water in the form of an invisible gas. It is not the same thing as
steam because steam is not actually a gas. Instead, it is made up of tiny droplets
of liquid water. Water is often called H2O. This is because each water molecule
contains two atoms of hydrogen and one atom of oxygen. In the diagram below
the oxygen atom is colored red and the hydrogen atoms are colored white.
The amount of water vapor in the air can vary by season and region. In a desert
or polar region, the air is dry and it has almost no water vapor. In a tropical
rainforest and other humid areas, 5% of the air may be water vapor. That's a lot!
251

C.2.2 Thermoregulation Resources
The hypertext resources used during the Study 3 thermoregulation unit are included on the following 7 pages.
252

Introduction to Thermoregulation
Thermoregulation is the process that warm-blooded animals use to keep their body from getting too hot or too cold. The word comes from the two words "Thermal" and "regulation." Something that is "thermal" relates to heat and "regulation" means keeping something regular or normal. So thermoregulation is a process humans and other warm-blooded animals use to keep their body heat at a regular level (usually near 37 degrees Celsius). Thermoregulation is also sometimes called "temperature homeostasis."
Homeostasis is a Greek word that simply means "same state" and it is sometimes used to describe the process of keeping the internal environment of a body in a balanced or a normal state. Our body has many homeostatic processes that monitor and regulate our important systems without our even knowing it. Breathing, heart rate, and blood pressure are all regulated by these processes.
In humans, temperature homeostasis is controlled by the thermoregulatory center in the hypothalamus, a part of the nervous system in the brain. The hypothalamus measures the body's temperature in two ways. First, sensors in the hypothalamus measure the temperature of the blood as it passes through the brain. Second, sensors in the skin measure the body's external temperature. With these two pieces of information, the hypothalamus can tell if the body's temperature is too low or too high. If the body's temperature is not right, the hypothalamus sends signals that cause the body to take corrective actions. In other words, the hypothalamus tells a body that gets too cold to do things to warm up, and it tells a body that gets too warm to do things to cool down.
This is similar to how many heating and cooling systems work in homes. Once a person has set the target temperature on the system's thermostat, the system monitors the home temperature and turns on heating or air conditioning when it gets too cold or too hot. In this text, we will focus on the body's response to cold temperatures.
253

Homeostasis
Homeostasis means "same state" and it refers to the process of keeping the internal conditions of a system in a normal or steady state of operation. For instance, animals need to have food in their bodies in order to live. When an animal doesn't have enough food in its body to produce energy for its cells, its brain sends hungry signals, and the animal looks for some food to eat. The animal's brain is using homeostasis to sense when it needs food, and it sends signals to the animal's body that cause the animal to find food. That way the cells of the animal's body keep functioning normally. Hunger and eating to keep enough energy is one example of homeostasis in animals.
A great deal of an animal's hormone system and the autonomic nervous system in its brain are dedicated to homeostasis. All homeostatic processes use negative feedback to stay in a constant state (called the set point). Negative feedback means that whenever a change occurs in a system, the change automatically causes a corrective response. This response reverses the original change and brings the system back to normal. It also means that the bigger the change, the bigger the corrective response.
Cold Temperatures and Thermoregulation
In order for thermoregulation to keep our body heat in balance, we need to have ways for detecting and responding to cold temperatures.
254

There are a number of ways that we can experience cold. In the winter, the air temperature outside is cold. In the summer, swimming on a windy day can also make us cold. When we feel cold, we are actually experiencing heat loss from our warmer bodies. So, cold temperatures increase heat loss from our bodies. And this heat loss makes our body temperatures drop.
So what happens if our body temperatures drop? When the human body temperature drops below 35 degrees C, it gets into a dangerous state called hypothermia. When people have hypothermia for a long period of time, they can get "frost-bite" and their internal organs may stop working.
In order to prevent hypothermia, our brain and nervous system have ways to stop our body from getting too cold. First, a part of the brain called the hypothalamus detects that our body's temperature is dropping. We call this cold detection, and it causes a hypothalamus response which will eventually warm us back up.
The hypothalamus triggers certain bodily responses. Some of these responses work by reducing heat loss. Others actually generate more heat. These responses cause changes that eventually lead to the body temperature remaining steady. So this is another example of homeostasis that we are studying. As our body temperature warms up, cold detection decreases. As cold detection decreases, so does the hypothalamus response. When the hypothalamus response decreases, so do the bodily responses. This makes sense because the hypothalamus is always measuring the body's temperature.
In this text, we will cover three main bodily responses that help us stay warm when the outside environment starts making the body cold: skin contraction, skeletal muscle contractions, and blood vessel constriction. When your hypothalamus detects cold temperatures, it increases all of these responses in the body.
255

Response 1: Skin Contraction
One easy way that you can stay warm is by keeping warm air near your body. This is why people wear hats in the winter. A hat traps the air that has been warmed up by your head, and this warm air keeps your head from getting too cold. Long before humans had invented hats, our bodies had come up with a similar way to trap warm air close to the body: skin contraction.
When your hypothalamus detects that you are getting too cold, it sends a signal to the erector pili muscles in your skin, telling them to contract. When these muscles contract, they raise skin hairs. These raised skin hairs act like the hat on your head: they trap some of the warm air and keep it near your skin. The warm air near the skin helps decrease heat loss from the body. Of course, the less heat a person is losing, the higher their body temperature will be.
In humans, you can tell someone's skin is contracting when you see goose bumps. Goose bumps are places where erector pili muscles are contracting to raise skin hairs. Response 2: Blood Vessel Constriction Another way that your body conserves heat is through blood vessel constriction. Blood vessel constriction is the narrowing of blood vessels, which slows down the flow of blood.
256

When blood circulates in the body it carries heat generated inside the body to other parts of the body. Some of it is also carried to the skin. Usually, this is good because it keeps your entire body warm. However, when the surrounding temperatures are cold, like on a cold winter's day, a lot of the heat carried by the blood to the skin is lost. Since more and more heat is needed to keep the skin warm, the body temperature starts dropping. In other words, as more blood flows to the skin to keep it warm, the body will experience more heat loss.
To keep the body from losing too much heat when it is cold, your hypothalamus response causes your blood vessels near the skin to shrink or constrict. Constricted vessels carry less blood, and so blood flow to the skin will decrease. This will reduce the heat loss from the body, and the body temperature will not drop as much.
Response 3: Skeletal Muscle Constrictions
Sometimes conserving heat through skin contraction and blood vessel constriction is not enough. When your body starts getting cold very quickly, it is important for the body to find ways to generate heat to keep itself warm. One way that your body can generate heat is through skeletal muscle contractions. When your body starts to get too cold, the hypothalamus sends a message to your skeletal muscles. These muscles then contract and relax again and again at high speeds. You might recognize this process by the name of "shivering."
When humans shiver, the movement of their skeletal muscles creates friction. Friction happens when two objects rub together, and this rubbing creates heat. To see how this works, try rubbing your hands together quickly for a few seconds. Notice how they feel warmer? When you shiver (just like when you exercise), your skeletal muscles expand and contract, and this creates friction in the muscles. This friction generates heat inside the body and makes up for the heat loss due to the cold.
257
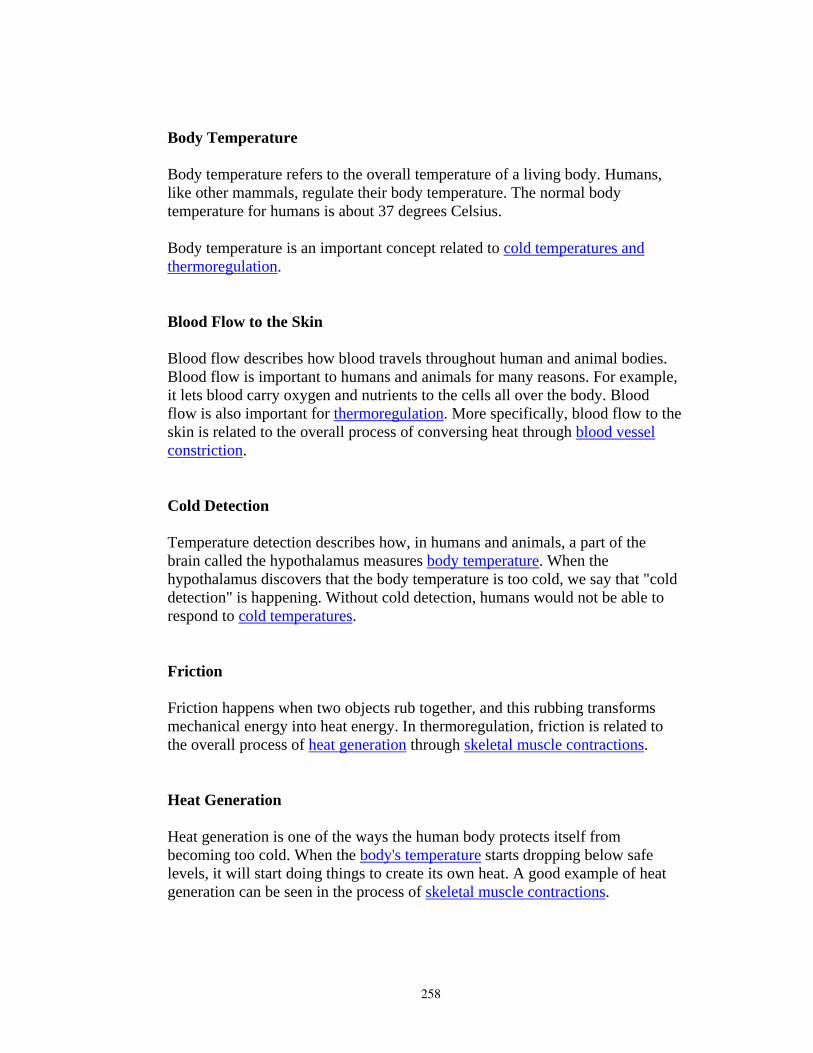
Body Temperature Body temperature refers to the overall temperature of a living body. Humans, like other mammals, regulate their body temperature. The normal body temperature for humans is about 37 degrees Celsius.
Body temperature is an important concept related to cold temperatures and thermoregulation.
Blood Flow to the Skin Blood flow describes how blood travels throughout human and animal bodies. Blood flow is important to humans and animals for many reasons. For example, it lets blood carry oxygen and nutrients to the cells all over the body. Blood flow is also important for thermoregulation. More specifically, blood flow to the skin is related to the overall process of conversing heat through blood vessel constriction.
Cold Detection Temperature detection describes how, in humans and animals, a part of the brain called the hypothalamus measures body temperature. When the hypothalamus discovers that the body temperature is too cold, we say that "cold detection" is happening. Without cold detection, humans would not be able to respond to cold temperatures.
Friction Friction happens when two objects rub together, and this rubbing transforms mechanical energy into heat energy. In thermoregulation, friction is related to the overall process of heat generation through skeletal muscle contractions.
Heat Generation Heat generation is one of the ways the human body protects itself from becoming too cold. When the body's temperature starts dropping below safe levels, it will start doing things to create its own heat. A good example of heat generation can be seen in the process of skeletal muscle contractions.
258

Heat Loss Heat loss describes the fact that when we go outside on a cold day, some of our body heat is lost to the cold air around us. Our body can do things to eventually decrease heat loss. The processes of skin contraction and blood vessel constriction describe two ways that the body conserves heat by decreasing heat loss.
Hypothalamus Response The hypothalamus is a vital part of the brain that acts like a control center. It is always making sure that your body is healthy. When it finds that your body is in danger of becoming unhealthy, it makes you do and feel certain things. These "responses" to unhealthy conditions lead you to "take action" and keep your body healthy. For example, it makes us feel hungry when we need food for energy, thirsty when we need water, and tired when we need to sleep. It also measures the body's temperature, which is important for thermoregulation.
Raised Skin Hairs Humans and animals have hair on different parts of their body. Some hair is long and thick, like the hair on your head. Other hair is tiny and short. The body has a way of using short hair to stay warm by raising it, and raised skin hairs are an important part of the process of skin contraction.
Warm Air Near the Skin The temperature of the air near your skin can have a large effect on your body's temperature. When the air is very cold, heat energy from your body will escape into the colder air around you. When the air is very warm, heat energy from the air will enter into your colder body. When your body gets cold, it tries to keep warm air near the skin through the process of skin contraction.
259

C.3 Teacher’s Guide
The Teacher’s Guide used during Study 3 is included on the following 21 pages.
260

Introduction Hello, and welcome to Betty's Brain! I know that your student is very thankful for your help, and I hope that you will both get along well together.
As a teacher, your job is to learn about a science topic and then teach it to your student. Your student needs to be able to get 100% on Mr. Davis's quiz.
You teach your student by building a causal map that explains important concepts and causal relationships. A concept is any person, place, or thing that is a part of the science topic. A causal relationship shows how one concept causes another concept to change. A concept can either cause another concept to increase (go up) or decrease (go down).
Here’s an example: people use up oxygen by breathing it. When they do this, they decrease the amount of oxygen in the air. This is a causal relation between two concepts: people and oxygen. The relation is a decrease relation: people decrease oxygen.
The concept that is causing a change is called the source concept. The concept that is being changed is called the target concept.
To find out what you need to teach your student, you can read the science book. You can get to the science book by clicking on the Science Book tab at the top of the screen.
This guide is organized into four sections. The first section talks about the science book. The second section talks more about causal maps and how to build them. The third section talks about using quizzes to check your student’s understanding. The last section talks about skills and strategies that are important for teaching your student.
I hope you find this information helpful. Good luck, and thanks again!
Learning About the Science Topic In order to teach your student the information in the science resources, you have to learn about the science yourself. In Betty’s Brain, you learn about the science by reading the science resources.
261

When you open the resources, you will see a navigation pane on the left that displays all of the pages in the resources. These pages are usually organized into sections. When you click on a page, it will appear in the reading pane on the right.
There are two kinds of pages in the science resources: process pages and dictionary pages. The process pages talk about the scientific process or system that you are studying. This includes the important concepts and the causal relations between the concepts. The dictionary pages do two things. They explain what each concept is, and they explain which scientific process or system they are a part of. For example, a dictionary page for plants would explain that plants are an important part of photosynthesis.
An important part of dictionary pages is that they don’t usually discuss any causal relations. To find those, you have to read the process pages.
Finding Causal Relationships in Text Passages To teach your student, you have to find the causal relations between concepts so that you can build a causal map to teach him or her. You’re looking for passages of text in the science resources that explain how one concept causes a change in another.
Remember, concepts are persons, places, or things, and causal relations can either be increase relations or decrease relations. An increase relation means that one concept makes another concept larger or greater in number. A decrease relation is the opposite. It means that one concept makes another concept smaller or less in number. Each causal relation has two concepts: the one causing the change, and the one being changed. The one causing a change is called the source of the change, or the source concept. The one being changed is the target of the change, or the target concept.
Causal relations can be explained in a lot of different ways. The rest of the pages in this section will explain the different ways of writing causal relations. This way, you’ll be able to find them when you read the science resources.
Standard Presentation The standard way of writing a causal relation looks like this: [source concept] [increase or decrease] [target concept].
262

When you write a causal relation like this, you are directly saying how the source concept affects the target concept. Here are some examples of causal relations in standard presentation:
1. Cats decrease mice. 2. Vacuums decrease dust. 3. Sleep increases energy.
When a causal relation is written out in standard presentation, it is easy to find and understand. Thinking about the first example, you can see that:
- The source concept is cats. Cats are causing the change. - The target concept is mice. The mice are the target of the change. - The causal relation is decrease. The cats are decreasing the mice (by
eating them).
Once you know the source concept, target concept, and causal relation, you can teach the information to your student by adding it to the causal map. The image below shows a causal map with all three of the causal relations shown above.
If-Then Presentation In the If-Then presentation of a causal relation, the text explains a causal relation by explaining what happens because of the relation. It looks like this: If [the source concept] increases, then [the target concept] increases.
Here’s an example: When clouds increase, sunlight decreases.
The passage says that if clouds increase, then sunlight decreases. To figure out what kind of relation to create, you have to think backwards. Ask yourself: "Self, what kind of causal relation would make this effect happen? An increase relation or a decrease relation?" To do this, you have to understand how to think with causal relations.
Looking back at the example, here’s what you can do:
1. Try making an increase relation between the source concept, clouds, and the target concept, sunlight: clouds increase sunlight.
2. Think through this relation. What will happen to sunlight if clouds increase? The relation we are testing says that sunlight will increase. But this isn’t right; the text passage says that if clouds increase, sunlight should decrease.
3. Since the increase relation didn’t work, try making a decrease relation: clouds decrease sunlight.
263
4. Think through this new relation. What will happen to sunlight if clouds increase? This new relation says that sunlight will decrease. This is right – it matches the example text passage above.
5. Now you know the relation: Clouds decrease sunlight.
When you’re reading, be on the lookout for causal relations in the if-then form. Make sure you know if the relation should be increase or decrease.
Then-If Presentation The Then-If presentation of a causal relation is similar to the if-then presentation. It’s just flipped around. It looks like this: [The target concept] decreases when [the source concept] increases.
Here’s an example: Garbage decreases when recycling increases.
In the Then-If presentation, the sentence first explains what happens to the target concept, and then talks about what happened to the source concept. To figure out what the causal relation is, you can turn the Then-If presentation around into an If-Then presentation. You do this by rewriting the sentence by moving “Garbage decreases” to the end of the sentence, like this
When recycling increases, garbage decreases.
Once you have flipped the sentence around, it is in the If-Then format, which is easier to understand. If you’re not sure how to figure out a causal relation when it is in the If-Then format, click here.
Transformation Sometimes, causal relations are presented as transformations. When something transforms, it turns into something else. For example, when ice melts, it turns into water.
Transformation relations are always increase relations. In a hot room, an increase of ice will lead to an increase of water, because ice turns into water when it melts. This would be represented as the following relation:
Ice increases water
As you read, be sure to look for sentences that describe transformations.
264
Thinking About Pronouns Sometimes, a causal relation is presented using pronouns. Instead of saying “Cats decrease mice,” the sentence might say “They decrease mice.” Here’s an example:
"Many fish live in rivers, and they all decrease the amount of oxygen in their environment."
To figure out this causal relation, you have to figure out what the word “they” is talking about. It will always refer to a person, place, or thing from somewhere else in the text. So, in this example, the word “they” is either talking about “fish” or “rivers.” Once you have picked out the possibilities, you have to think about what makes the most sense. In this example, it makes more sense if “they” refers to “fish.” So the causal relation is “Fish decrease the amount of oxygen in their environment.”
Causes of Increase and Decrease Sometimes, a causal relation will be written using the words increase and decrease. For example, a sentence might say: “Fish decrease fish food.”
But sometimes, a text passage will explain a causal relation by explaining exactly what the source concept does to the target without explaining whether that action causes an increase or a decrease. For example, the same causal relation about fish and fish food may be written like this: “Fish eat fish food.” To figure out the causal relation, you have to understand that eating something causes it to decrease.
There are a lot of action words that are used to describe causal relations in the science resources, and you will have to know those words in order to find the causal relations that you need to teach your student.
Increase Words
- Create - Generate - Make - Raise - Trigger
Decrease Words
- Lessen
265

- Lower - Prevent - Reduce - Use up
Thinking About the Situation Sometimes, you have to think carefully about the situation that is being described in the reading. Understanding the situation helps you figure out whether a causal relation is an increase or a decrease.
For example, think about these two sentences:
1. “Practicing reading improves a person’s reading ability.” 2. “When you have a fever, taking medicine improves your body
temperature.”
Both sentences describe a causal relation, and both sentences use the action word "improves" to describe the causal relation. Here’s the tricky part: the first sentence is an increase relation and the second sentence is a decrease relation.
Why?
Well, when something “improves,” it gets better. And sometimes “getting better” means increase, but at other times, “getting better” means decrease. We can only know whether the word “improve” is an increase or a decrease if we understand the situation described in the text passage.
When reading ability improves, it gets larger, or increases. When someone has a fever and their body temperature improves, it gets lower, or decreases.
The Passive Voice Sometimes, a causal relation is in a sentence that is written in the passive voice.
In the standard presentation of causal relations, the subject of a sentence is the source concept in the causal relationship. For example, the sentence “Birds eat worms” is in the standard form. The word “birds” is the subject of the sentence. It is also the source concept in the causal relation.
In the passive presentation, things are different. The target concept is the subject of the sentence. Instead of saying “Birds eat worms,” the sentence would be “Worms are eaten by birds.”
266

The causal relation is still the same, but it’s been switched around. Now, the subject of the sentence is the target concept, worms.
When you’re reading, try to think about whether or not the sentence you’re reading is in the passive voice. If it is, remember that the target concept will be first.
When the Source Concept Decreases Normally, when the science book describes a causal relation, it explains what happens when the source concept increases. For example if you have the following causal relation:
Vacuums decrease dust.
Then you know that an increase in vacuums will lead to a decrease in dust. But what happens when vacuums decrease?
Well, when vacuums decrease, there will be fewer vacuums to decrease the dust. So, dust will increase. If you’re not sure how this works, click here to review causal reasoning
Sometimes, when the science resources talk about a causal relation, they explain what happens when the source concept decreases. For example, the text might describe a relation like this:
A decrease in sleep decreases a person’s energy.
To turn this into a relation, you have to ask, "Okay, but what does an increase in sleep do?”
The answer is that an increase in sleep will have the opposite effect on a person’s energy. So, if a decrease in sleep decreases a person’s energy, then an increase in sleep increases a person’s energy.
Once you know this, you can figure out the relation: sleep increases a person’s energy.
Dealing With Categories Sometimes, the science resources explain causal relations using categorical deduction. Here’s how it works:
267

1. The science resources will explain a causal relation where one of the concepts is a category. Here’s an example: “Animals drink water.” This is a causal relation between animals and water: Animals decrease water by drinking it.
2. The science resources then talk about a type of animal, like this: Dogs are animals.
Because dogs are animals, and all animals drink water, you can figure out that dogs also drink water. This leads to another causal relation between dogs and water: Dogs decrease water by drinking it.
Teaching Your Student Once you have learned the material in the science resources, you need to teach it to your student. You do this by building a causal concept map using the causal map interface. You can get to the causal map interface by clicking on the “Causal Map” tab at the top of the screen.
A causal concept map is a representation that shows concepts and causal relationships between the concepts. A concept is a person, place, or thing that is an important part of the science topic. A causal relation describes how one concept influences another concept.
Causal relations can either be increase relations or decrease relations. An increase relation means that one concept makes another concept larger or greater in number. A decrease relation is the opposite. It means that one concept makes another concept smaller or less in number. Each causal relation has two concepts: the one causing the change, and the one being changed. The one causing a change is called the source of the change, or the source concept. The one being changed is the target of the change, or the target concept.
Teaching concepts
To teach a concept to your student, click on the add concept button, and then click anywhere on your student’s brain (the white, blank area). When you do this, a window will appear that will let you choose a concept to teach. This
268

window is shown in the picture below. When you click on the add concept button within the window, the concept that you selected will appear in your student’s brain.
Teaching Causal Relations
To teach a causal relation to your student, click on the add relation button, and then click-and-hold on the relation’s source concept, drag the mouse to the target concept, and then release the mouse button. When you do this, a window (shown below) will appear that will ask you to explain how the source concept affects the target concept. You will also have to choose whether or not the relation is increase or decrease.
Answering Questions with a Single Causal Relation A causal map is a powerful way to represent things. One of the reasons it is so useful is that each causal relation can be used to answer two questions. For example, look at the causal relation shown below.
This picture shows a causal relation between gardens and flowers. Gardens increase flowers. If we accept this relation as a true fact, then we can use it to answer the following two questions:
1. If gardens increase, what will happen to flowers? 2. If gardens decrease, what will happen to flowers?
269
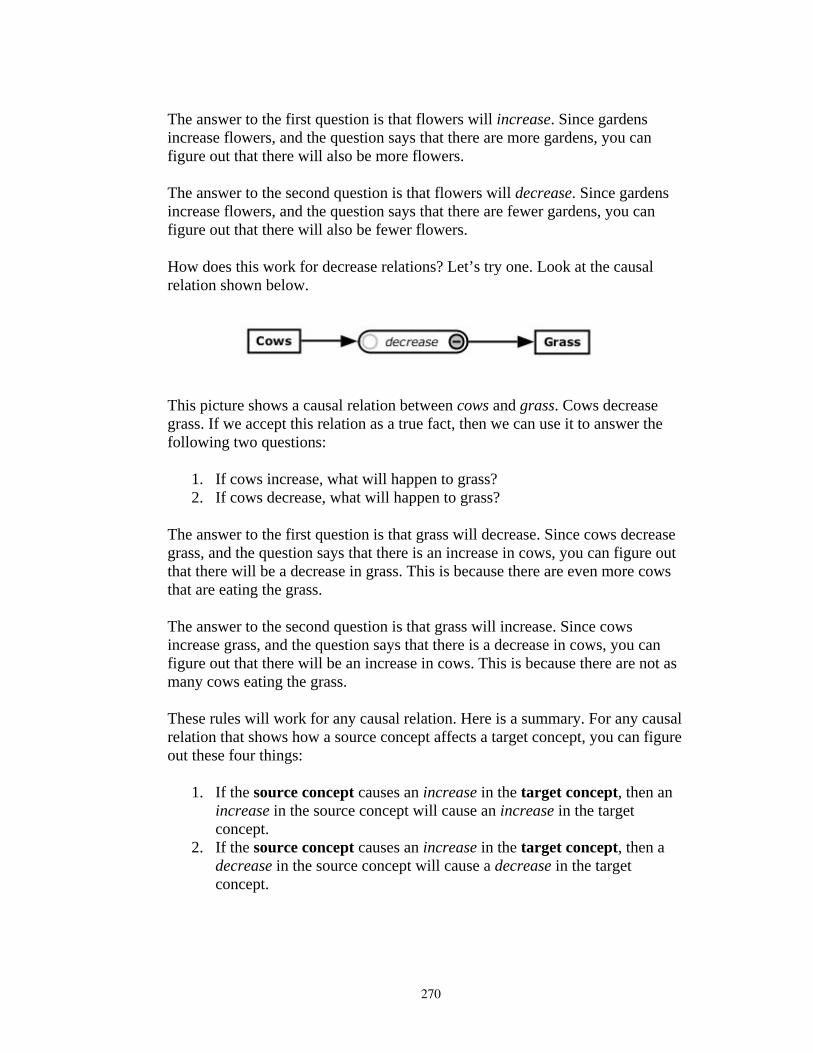
The answer to the first question is that flowers will increase. Since gardens increase flowers, and the question says that there are more gardens, you can figure out that there will also be more flowers.
The answer to the second question is that flowers will decrease. Since gardens increase flowers, and the question says that there are fewer gardens, you can figure out that there will also be fewer flowers.
How does this work for decrease relations? Let’s try one. Look at the causal relation shown below.
This picture shows a causal relation between cows and grass. Cows decrease grass. If we accept this relation as a true fact, then we can use it to answer the following two questions:
1. If cows increase, what will happen to grass? 2. If cows decrease, what will happen to grass?
The answer to the first question is that grass will decrease. Since cows decrease grass, and the question says that there is an increase in cows, you can figure out that there will be a decrease in grass. This is because there are even more cows that are eating the grass.
The answer to the second question is that grass will increase. Since cows increase grass, and the question says that there is a decrease in cows, you can figure out that there will be an increase in cows. This is because there are not as many cows eating the grass.
These rules will work for any causal relation. Here is a summary. For any causal relation that shows how a source concept affects a target concept, you can figure out these four things:
1. If the source concept causes an increase in the target concept, then an increase in the source concept will cause an increase in the target concept.
2. If the source concept causes an increase in the target concept, then a decrease in the source concept will cause a decrease in the target concept.
270
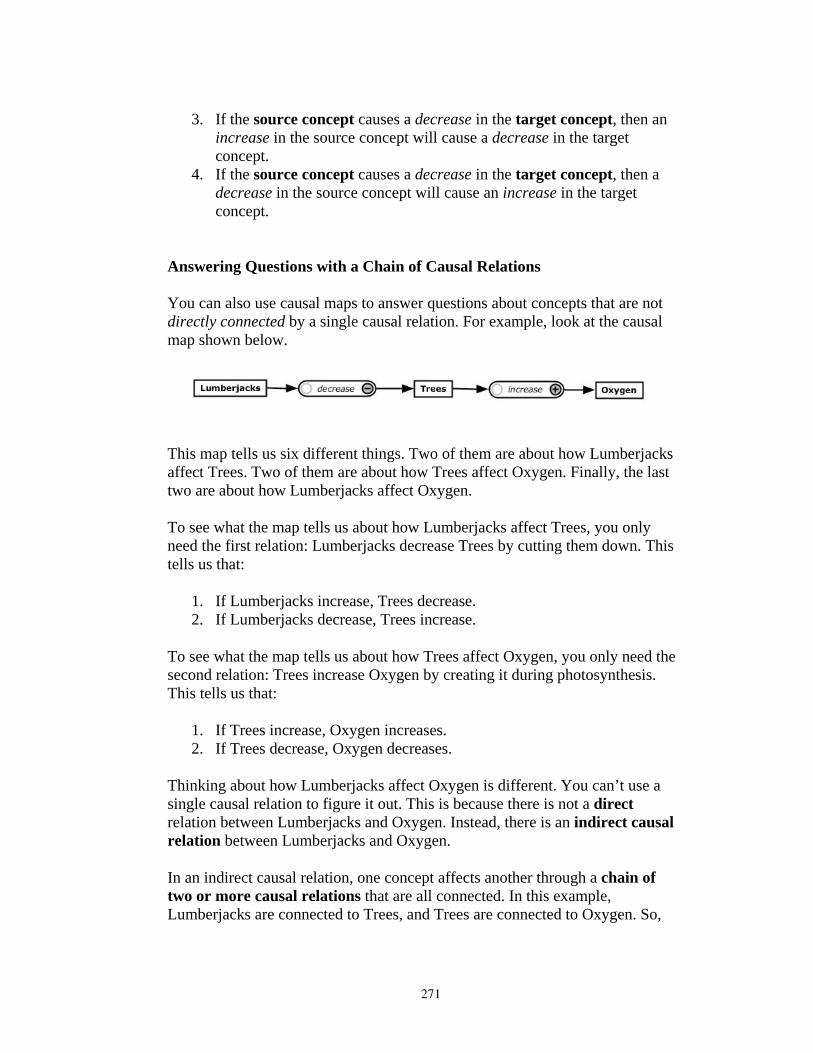
3. If the source concept causes a decrease in the target concept, then an increase in the source concept will cause a decrease in the target concept.
4. If the source concept causes a decrease in the target concept, then a decrease in the source concept will cause an increase in the target concept.
Answering Questions with a Chain of Causal Relations You can also use causal maps to answer questions about concepts that are not directly connected by a single causal relation. For example, look at the causal map shown below.
This map tells us six different things. Two of them are about how Lumberjacks affect Trees. Two of them are about how Trees affect Oxygen. Finally, the last two are about how Lumberjacks affect Oxygen.
To see what the map tells us about how Lumberjacks affect Trees, you only need the first relation: Lumberjacks decrease Trees by cutting them down. This tells us that:
1. If Lumberjacks increase, Trees decrease. 2. If Lumberjacks decrease, Trees increase.
To see what the map tells us about how Trees affect Oxygen, you only need the second relation: Trees increase Oxygen by creating it during photosynthesis. This tells us that:
1. If Trees increase, Oxygen increases. 2. If Trees decrease, Oxygen decreases.
Thinking about how Lumberjacks affect Oxygen is different. You can’t use a single causal relation to figure it out. This is because there is not a direct relation between Lumberjacks and Oxygen. Instead, there is an indirect causal relation between Lumberjacks and Oxygen.
In an indirect causal relation, one concept affects another through a chain of two or more causal relations that are all connected. In this example, Lumberjacks are connected to Trees, and Trees are connected to Oxygen. So,
271

Lumberjacks affect Oxygen because of how they affect Trees. Let’s see how this works by figuring out what happens to Oxygen when Lumberjacks increase.
1. When Lumberjacks increase, Trees decrease. 2. When Trees decrease, Oxygen decreases. 3. So, when Lumberjacks increase, Oxygen decreases.
We can also figure out what happens to Oxygen when Lumberjacks decrease:
1. When Lumberjacks decrease, Trees increase. 2. When Trees increase, Oxygen increases. 3. So, when Lumberjacks decrease, Oxygen increases.
In large causal maps, there can be indirect affects that are very long. They might use as many as 10 relations. This is one of the most useful parts of causal maps. You build the map by thinking about direct causal relations, but then you can use the map to discover indirect causal relations that you might not have thought of yourself!
Answering Questions with Multiple Chains When you build large causal maps, you might find that two concepts have more than one indirect causal relation. When this happens, you have to figure out each indirect causal relation. Then you have to combine the indirect causal relations to figure out how the concepts affect each other.
Here’s an example:
In this example, Wolves have two indirect causal relations with Grass. One of the relations goes through sheep, and the other relation goes through deer.
272

In order to figure out how Wolves affect Grass, we have to think through each of the chains. Let’s see how this works by thinking through this question:
When Wolves increase, what happens to Grass?
Start by thinking through the chain: Wolves → Sheep → Grass.
1. When Wolves increase, Sheep decrease. 2. When Sheep decrease, Grass increases. 3. So, when Wolves increase, Grass increases.
Now, think through the chain: Wolves → Deer → Grass.
1. When Wolves increase, Deer decrease. 2. When Deer decrease, Grass increases. 3. So, when Wolves increase, Grass increases.
So, in this example, both of the chains lead to the same answer: when Wolves increase, Grass increases. Because of this, we know that when Wolves increase, Grass will definitely increase.
Let’s try another example:
In this example, Humans affect Grass in two different ways. One of the ways is the chain Humans → Wolves → Deer → Grass, and the other way is the direct relation Humans → Grass
If we want to answer the question “If Humans decrease, what happens to Grass,” we have to think through both the chain and the direct relation.
Start by thinking through the chain: Humans → Wolves → Deer → Grass.
273

1. When Humans decrease, Wolves increase.
2. When Wolves increase, Deer decreases.
3. When Deer decreases, Grass increases.
4. So, when Humans decrease, Grass increases.
Now, think through the direct relation: Humans → Grass.
1. When Humans decrease, Grass decreases.
In this example, the indirect relation causes an increase in Grass and the direct relation causes a decrease in grass. So how can we answer the question?
When some of the relations lead to an increase and some of the relations lead to a decrease, the answer is it depends. This is because the map doesn’t tell us how much the grass is increasing and decreasing. It might be that Humans plant more grass than the extra Deer eat. But the causal map doesn’t tell us that.
Making Sure Your Student Understands An important part of teaching your student is checking to make sure they understand. In Betty’s Brain, you can do this in several ways:
1. You can ask your student to answer a cause-and-effect question. An example cause-and-effect question is “If Cows increase, what happens to Milk.” After answering the question, your student can explain her thinking.
2. You can ask your student to take a quiz on either a section of the science resources or all of the material in the science resources. A quiz is a set of cause-and-effect questions. After your student takes a quiz, Mr. Davis will grade it and show you the grades.
3. You can ask Mr. Davis to grade your student’s answer to a specific cause-and-effect question.
Asking Your Student to Answer Cause-and-Effect Questions If you want to see how your student will answer a question, you can ask her to answer it by starting a conversation with her. After you start a conversation, select I have a cause-and-effect question for you. Then you will be able to select the question you would like to ask.
274
To answer a cause-and-effect question, your student will think through the information in her causal map. The way your student answers questions is explained here, here, and here.
When your student answers a question, she will only tell you her final answer. She will not explain how she came up with the answer. After she has told you her answer, you can ask her to explain how she came up with it. Your student will then explain her answer and show you how she came up with it. She will highlight the concepts and causal relations she used to answer the question.
Asking your student to explain her answers is important. Sometimes, you need to know which causal relations she used to answer a question. This is really important if the question has been graded by Mr. Davis. Mr. Davis will grade questions when your student takes a quiz. He will also grade a specific question if you ask him too. After your student answers a question, you can select Hey Mr. Davis, is this right? Sometimes, Mr. Davis won't be able to answer your question.
Using Quizzes to Check Your Student’s Understanding If you want to quiz your student, you can ask her to take a quiz by starting a converastion with her. After you start a conversation, select I need you to go take a quiz now, please.
Next, you have to choose what she should take a quiz on. You can either select a quiz on everything in the science book, or you can select a quiz on just a section of the science book.
After your student takes a quiz, the graded quiz will be placed in the Quiz Results tab at the top of the screen.
The quiz tab will show all of the quizzes you have asked your student to take. You can choose which quiz you would like to look at by choosing a quiz from the list on the left.
When you choose a quiz, it will appear in the main section of the quiz tab. The questions appear at the top of the screen in a grid. Each row shows a question, your student’s answer, and a grade. There are four different grades:
1. A green checkmark means that the answer is right. Your student will only get the answer right if she uses the correct set of relations to explain her answer. So, when your student gets the answer right, you know that every relation in her explanation is also correct.
275

2. A red X means that the answer is wrong. Your student will get the answer wrong if any of the relations she used to come up with the answer is wrong. So, when your student gets the answer wrong, you know that at least one of the relations in her explanation is also wrong.
3. A yellow ? means that the answer is right so far, but is missing something. Your student will get a yellow checkmark when all of the relations she used to come with the answer are right, but something is still missing.
4. A gray ? means that your student could not answer the question. This happens when your student’s concept map does not have a direct or indirect causal effect from the first concept in the question to the second concept in the question.
Underneath the quiz questions, you can see your student’s causal map as it was when she took the quiz. This way, you can see what your student understood when she took the quiz. You can see which causal relations your student used to answer a quiz question by clicking on it. All of the relations your student used will light up in blue.
Asking Mr. Davis to Grade Specific Questions If you want to check a specific part of your student’s understanding, you can think of a question that will test that understanding. Then, you can ask your student to answer that question.
After your student answers a question, you can select Hey Mr. Davis, is this right? Sometimes, Mr. Davis won't be able to answer your question.
Marking Relations as Being Correct When your student takes quizzes and gets grades, you get information about which causal relations are right and which ones are wrong. You can keep track of correct relations by marking them as being correct
Here’s how it works: first, make sure you have selected the Causal Map tab. Then, pick a causal relation that you know is right. Next, right click on the relation. You will see a menu of options.
Pick "Mark as 'correct'” When you do, a green checkmark will appear on the left side of the relation.
276

If you ever want to remove the green checkmark, you can right click on the relation and select “Remove 'correct' marking.”
Teaching Tips from the Experts This section has tips from successful teachers. You can use these tips to help you with your own teaching.
Tip #1: Make Sure You’re Teaching Your Student the Information She Needs to Know Your student needs to understand the science topic the way it is explained in the science book. You might know some things about the topic already, and that’s great. But Mr. Davis's quizzes test your student on exactly the information in the science book.
Sometimes, you know things in more detail than what the science book says. Sometimes, there are some things you don’t quite understand. So, before you teach your student, you should make sure that what you know matches the science book.
Tip #2: Be Careful About Shortcut Relations It’s important to think about whether or not a causal relation is direct or indirect. Remember, a direct causal relation is represented as a single link on a causal map. An indirect causal relation is different. In an indirect causal relation, one concept affects another through a chain of two or more causal relations that are all connected.
Look at this example:
Plants increase the amount of oxygen by using photosynthesis to make food.
At first look, the problem looks easy. It looks like there should be a direct relation from plants to oxygen, like this:
But, in this case, a direct relation from plants to oxygen is a shortcut relation. A shortcut relation is a direct relation that explains the effect of a chain of
277

relations. These types of relations can cause big problems. They will cause your student to get quiz questions wrong even though it looks right.
Look at the original sentence more carefully, and ask yourself this question: How do plants increase the amount of oxygen? The answer is they do it by using photosynthesis. Another way to think about this is that plants have an indirect causal relation with oxygen that goes through photosynthesis. This indirect relation goes through two connected causal relations: plants increase photosynthesis, and photosynthesis increases oxygen.
Sometimes, your student will get quiz questions wrong even though all of the relations look right. When this happens, look to see if you taught your student a direct causal relation instead of an indirect causal relation.
Tip #3: Use Quiz Results to Mark Relations as Being Correct Your student’s quiz results tell you a lot about which of the causal relations in her map are right and which are wrong. Whenever you have your student take a quiz, it’s a good idea to think about each question in the quiz.
When your student gets a quiz answer right or right so far, it means that each causal relation used by the student is also right. It’s important to keep track of which relations on your student’s map are definitely right. It will help you later when you are trying to figure out which relations on the map are wrong. It will also help you make sure you don’t delete a correct relation from the map.
You can keep track of which relations are right by marking them as being correct.
278

Tip #4: Use Quiz Results to Figure Out Which Relations are Wrong When your student gets a quiz answer wrong, it means that at least one of the causal relations used by the student is also wrong. If your student only uses one relation to answer the question, then you know that relation is wrong. When this happens, you should delete the causal relation from the map. This will help your student do better next time she takes a quiz.
If the question uses more than one relation, you might not be able to figure out which relation is wrong. But, if you have been marking relations as being correct, this can help you figure out which relation is wrong. This is because you can combine information from right answers and wrong answers.
Here’s an example. The picture below shows a student’s quiz and the map that was used to take it. The quiz has two questions. One of the questions is right, and one of the questions is wrong.
The first question is right, and it uses the relation B → C. This means that the link from B to C is right.
The second question is wrong, and it uses the relations B → C and C → D. This means that at least one of these two relations is wrong. But which one is it?
Well, the first question is right and it uses the relation from B to C. This means that the relation B → C is right. That leaves only one relation that is wrong: the relation from C to D. Once you know this, you can delete C → D from the map.
279

Tip #5: Teach Your Student One Section at a Time Your student needs to learn a lot of information in order to get 100% on Mr. Davis’s quiz. This means that you also have to learn a lot of information. To make it a little bit easier, it’s a good idea to teach your student one section of the science book at a time.
Teaching one section at a time is good for a couple of reasons. First, the quizzes for a section are easier than the final quiz. Your student can get 100% on these quizzes without knowing as many causal relations. Second, once you know that your student has all of the links for a section, you don’t have to worry about that section anymore!
Tip #6: Knowing What to do After a Quiz If your student gets a wrong answer in a quiz and you can’t figure out which causal relation is wrong, you might have to read about the concepts in the question. You can also see what concepts your student used to answer a question and read about those too.
If your student uses a lot of links to answer a question, it might be too much work to read about all of those concepts! One thing you can try is to focus in on smaller questions. Find a question in the quiz that your student used fewer causal relations to answer.
If there aren’t any, and your student just took the final quiz, try having your student take a quiz that only tests her understanding of a single section of the science resources. If that doesn’t help, you can design your own question! Try to think of a good question. A good question will make your student use the causal relations that you think might be wrong.
Once you’ve thought of a question, you can ask Mr. Davis to grade it.
Tip #7: What to do with “Right so Far” Answers It can be really hard to figure out what to do when your student’s quiz answer is graded as “Right so far.” It means that you need to add another causal relation to the map. But where should you start?
One simple strategy would be to read about every concept that your student used to answer the question. As you read, try to find causal relations that you haven’t added to your map.
280

Another strategy is to see what happens when you ask Mr. Davis to grade a “smaller” question - one that your student would use fewer links to answer. If the smaller question is graded as being correct instead of “right so far,” then that tells you what you should be reading about. You should be reading about the concepts that your student used to answer the first question but didn’t use to answer the second question.
Tip #8: Knowing When to Quiz Asking your student to take a quiz is a great way to see what she understands and what she is confused about. But, when should you have your student take quizzes?
You definitely don’t want to give her too many quizzes. It takes a long time to go through those quiz results! You could end up spending most of your time trying to figure out what her quizzes mean! That would take away time from other important things! You need to spend some time reading about the things that your student doesn’t understand so that you can figure out what you need to teach her.
But you also don’t want to give her too few quizzes. The information you get from quizzes is very valuable. So it’s important to give your student a quiz every now and then to make sure that you are teaching her the right things.
A good rule of thumb is to have your student take a quiz after you have added, changed, or deleted 2 – 4 causal links.
281

C.4 Mr. Davis’s Training Script
Mr. Davis’s training script is included on the following 7 pages.
282

At the beginning of the training conversation, Mr. Davis takes control of the interface and switches to the Science Resources Tab.
Mr. Davis: Well hi there, User! Welcome back to Betty's Brain. Now um...what were we supposed to do today?
Betty: Um. Mr. Davis?
Mr. Davis: Not now, Betty! I'm trying to think.
Betty: But Mr. Davis. I know what's next! You're supposed to show User how to use this computer program we're a part of.
Mr. Davis: Computer program? What are you talking about? This is a school.
Betty: Yeah...a school inside a computer...
Mr. Davis: That's crazy talk, Betty! How could we be inside a computer?!? Anyway! Yes, I'm supposed to show you around, User.
Mr. Davis: Let's see here. Well, hm. Okay. You're here because we need some help with tutoring. We have a lot of students that need help learning science, and I can't help them all by myself.
Betty: *whispering* It's true! He couldn't even figure out how to tie his shoes until I showed him. But he does know his science.
Mr. Davis: Hey! Pay attention! Now, you've been assigned to work with Betty. She's a bright student. She'll have no problem remembering what you teach her. The trick is that you have to teach her the right information.
Mr. Davis: You'll work with Betty to teach her about different science topics. In each case, you'll be given a science textbook like the one you see here. Betty needs to know exactly what's in these science resources.
Mr. Davis: The left side of the science resources is organized into sections. Each section is important for Betty to learn. The easiest way to tackle this task is to focus on just one section at a time.
283

Mr. Davis: Betty needs to learn about the causal relationships in her science book. So your job is to read her science book, and find cause-and-effect relationships.
Mr. Davis: A cause-and-effect relationship between two concepts shows how one concept causes a change< in another concept. So, for example, 'birds eat worms' explains a cause-and-effect relationship between the concepts 'birds' and 'worms.' In Betty's Brain, the relationships can either be increase or decrease relationships. The word 'eat' tells us that this is a decrease relationship, because decrease means makes less of or make smaller.
Mr. Davis: When you find a cause-and-effect relationship, you can take a note about it so that you don't forget it. You do this using the “Add a note” button on the very left side of the screen. Try adding a note now. Click the "Add a Note" button and make any note you want. You can add "tags" to your note if you would like. Tags make it easier to search through your notes later.
Mr. Davis waits until the user adds a note.
Mr. Davis: Hey nice work! Now, try adding another note. This time, make sure that you add the tag animals to the note.
Mr. Davis waits until the user adds a note with the tag “animals” and then switches to the Notebook tab.
Mr. Davis: The notes that you make will go here, in your notebook. While here, you can view your notes, edit them, and delete them.
Mr. Davis: You can search for notes based on their tags. Try it out - click on the Filter by Tag button and then select animals. This will bring up the note you created earlier.
Mr. Davis waits until the user filters their notes by the tag “animals.”
Mr. Davis: See what happened? Now, only the notes with animals are showing. To bring up the rest of your notes again, click on the Clear Filter button.
Mr. Davis waits until the user clears the notes filter.
284

Mr. Davis: Great! Now, you can edit or delete notes using the icons located at the top of each note. If you'd like, go ahead and delete those two notes you created. Then, click continue.
Mr. Davis waits until the user presses the continue button.
Mr. Davis: Okay. Once you've done some reading and taken notes, you'll probably have a couple of causal relationships to teach Betty. To do that, you'll come to the Causal Map activity.
Mr. Davis switches to the Causal Map tab.
Mr. Davis: This is the causal map activity. In order to teach Betty, you'll have to "build" her brain by teaching her concepts and links.
Mr. Davis: To teach a concept, you can either: 1. Click the Add Concept Button, which is directly under the pointer button on the right side of the screen. Once you've clicked that button, click anywhere in the causal map canvas. 2. Right-click on the causal map canvas and select the concept you would like to add. Try adding a concept now.
Mr. Davis waits until the user has added a concept.
Mr. Davis: Great! Now add one more concept to the map.
Mr. Davis waits until the user has added a second concept.
Mr. Davis: To teach a link, click the Add Link Button, which is directly under the Add Concept Button. It looks like an oval. Then, click-and-drag from one concept to another. Try adding a link to your map.
Mr. Davis waits until the user has added a causal link.
Mr. Davis: Perfect! Now, when you've taught Betty a lot of concepts and links, you can check your progress by asking her to take a quiz. Here, I'll show you. Hey Betty?
Betty: Yes, Mr. Davis?
285

Mr. Davis: I need you to take a quiz now. It's okay if you don't do very well this time. You haven't had any time to work with User yet.
Betty: Okay…I’ll try…
Mr. Davis assigns Betty a quiz and grades her answers. He then switches to the causal quiz tab, where the results have been displayed.
Mr. Davis: This is the quiz center - while here you can go over Betty's quiz scores.
Betty: Wow. I didn’t do very well…
Mr. Davis: That’s okay, Betty! You haven't even started studying yet, and I know you and User will put the effort in soon.
Betty: Thanks :)
Mr. Davis: In this activity, you can see the list of quizzes that Betty has taken on the left side of the screen. The currently selected quiz shows up in the center of the screen. On the top, you can see each quiz question along with Betty's answer and the grade. Below that, you can see the causal map that Betty used to answer the quiz questions.
Mr. Davis: When you click on a question, the links that Betty used to answer that question light up on the causal map. Since Betty didn't use any links in her test, you won't see any links light up this time. But be sure to try this out later.
Mr. Davis: Seeing which links Betty used to answer questions gives you important information about which of the causal links are right and which are wrong. When Betty gets a question right (green checkmark), that means that all of the links in the answer are also right. When Betty gets a question wrong (red X), that means that at least one of the links in the answer is wrong. When Betty gets a question right so far (yellow ?), that means that all of the links in the answer are right, but not all of the links are on the map yet.
286

Mr. Davis: In this case, Betty didn't use the link that you created, so you can't be sure whether or not it's right or wrong.
Mr. Davis: It's important to keep track of which links are right and which links are wrong, because your goal is to teach Betty all of the right links and none of the wrong links. You can keep track of links in a couple of ways. If you find out that a link is wrong, you should take a note of it so you don't add it again later. Then, you should delete the link from the causal map. If you find out that a link is right, you can mark it as being right on the causal map.
Mr. Davis switches to the Causal Map.
Mr. Davis: To mark a link correct, all you have to do is right-click on the link and choose the Mark as 'correct' option. Try it out. Mark the link you created earlier as being correct.
Mr. Davis waits for the user to mark the link on their map as correct.
Mr. Davis: Perfect. Remember, you only want to mark a link correct if you know that the link is right. If you think a link might be wrong, you can mark it as "could be wrong." Try that out now. Change the link marking from correct to could be wrong.
Mr. Davis waits for the user to mark the link on their map as “could be wrong.”
Mr. Davis: Now, quizzes aren't the only way to test what Betty knows. You can also ask her to answer questions by starting a conversation with her. After she answers the question, she'll offer to explain her answer. Right Betty?
Betty: I'll only answer your questions if you're nice to me. By the way, my favorite ice cream flavor is heavenly hash. Just saying...
Mr. Davis: Fine. I'll get you ice cream later, Betty. Okay?
Betty: Yay!!!
287
Mr. Davis: After Betty answers a question, you can check with me to see if she got the answer right. But you can only ask me about questions that Betty needed to use a lot of links to answer.
Mr. Davis: Okay! Now, onto deleting things from Betty's map. To do this, you have two options: 1. You can right-click on the concept or link and select Delete 2. You can select the concept or link you would like to delete and then press the delete button, which looks like a trash can. Go ahead and delete everything from your map now.
Mr. Davis waits for the user to delete the concepts and link from Betty’s map.
Mr. Davis: Nice work! I think that about covers everything. You need to read the science book, takes notes on any causal relationships you find, and then teach them to Betty. As you teach, you'll need to check on Betty's progress by asking her to answer questions and take quizzes.
Mr. Davis: If you're ever not sure what to do, you have two options. You can search for information in the teacher's guide, or you can ask me for help.
Mr. Davis switches to the Teacher’s Guide tab.
Mr. Davis: The teacher's guide is full of information that can help you with teaching Betty. It has tips for reading the resources, understanding the causal map, and using quizzes. If you're stuck, try to find help here. Of course, I'll try to answer your questions too.
Mr. Davis: Alright, go to it! Have fun, both of you!
Betty: Do I have to?
Mr. Davis: …
Betty: Well???
Mr. Davis: Yes, you have to. Now get to work! :)
288

Betty: Alright User. It's you and me. Let's do this.
User: Okay!
289

C.5 Forest Ecosystem Resources and Expert Map
The hypertext resources used during Mr. Davis’s introduction to the system are included on the following 4
pages. The expert map for this unit, shown in Figure C.2, included 9 concepts and 12 links.
290

Figu
reC
.2:F
ores
teco
syst
emex
pert
map
used
duri
ngSt
udy
3.
291

Introduction
Forests contain many different living things, such as wolves, deer, grass and
plants.
Other factors can affect these animals. Hunters kill the wolves and deer. The
amount of rainfall can affect the grass and plants.
Creatures of the forest.
Wolves
Wolves are mammals that live in a forest. Wolves eat deer, which decreases the
deer population.
Some hunters kill wolves for sport, or to control the wolf population. Hunters
decrease the size of the wolf population.
The mighty wolf.
292

Deer
Deer are mammals that live in the forest. Deer eat plants for food.
Some hunters kill deer for sport, or to control the deer population. Hunters
decrease the size of the deer population.
Wolves also eat the deer. Wolves eat the deer, and the deer increase the energy
for wolves. The more energy there is for wolves, the more wolves there will be.
The graceful deer.
Hunters
Hunters are humans that track and kill animals for different reasons. Some
hunters kill wolves and deer for sport. Other hunters kill them to control the size
of their populations.
If there are more hunters in the forest, the wolf population and the deer
population will decrease.
A hunter in action.
293

Grass and Plants
Grass and plants are found all over the world, even in forests. They provide
energy for animals such as deer and cows. When there is more energy for cows,
there will be more cows. When there is more energy for deer, there will be more
deer.
One of the things grass and plants need to grow is a healthy amount of rainfall.
More rainfall will help the grass and plants grow.
Grass and plants are very tasty to some creatures.
Cows Cows are very useful animals. They provide us with milk and a large variety of
milk products.
Cows eat grass to stay alive. Grass is their primary food source.
Two cows are better than one.
294

Rainfall
Rainfall describes the amount of rain that an area receives. Rainfall provides
water for grass and plants, which helps the grass and plants grow.
It's raining. It's pouring.
295

Appendix D
Sample CGA-based Teacher Report
The sample CGA-based teacher report is included on the following 3 pages.
296
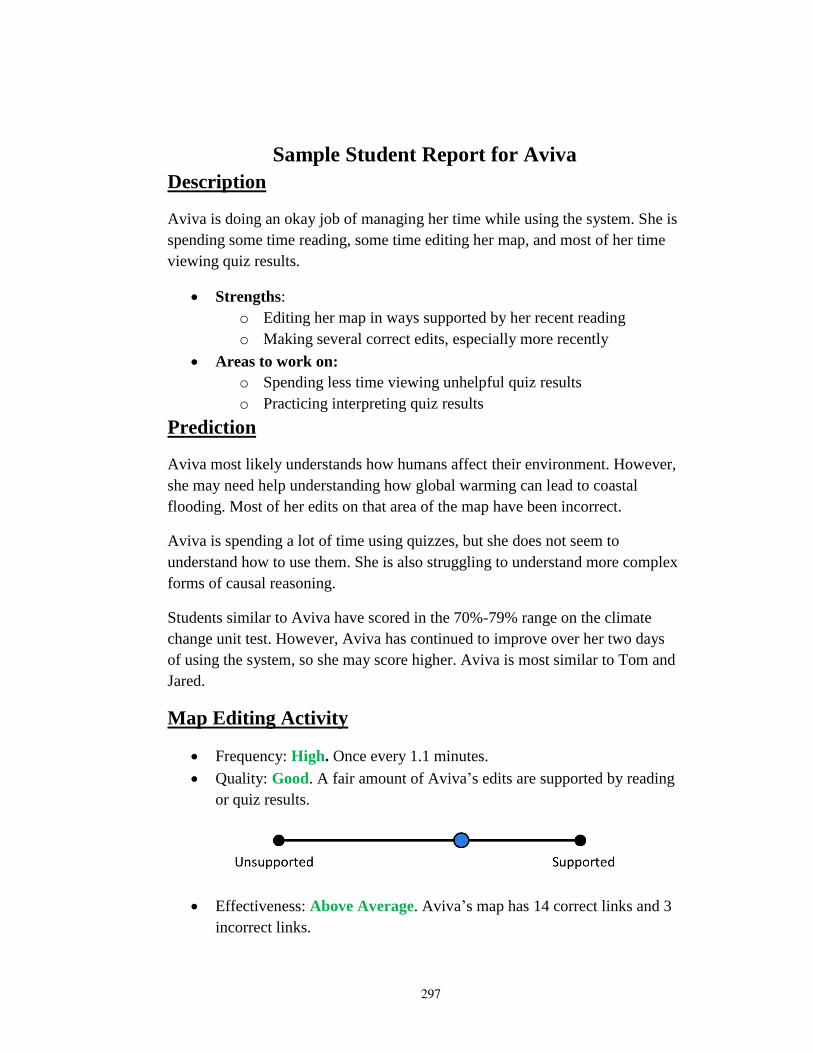
Sample Student Report for Aviva
Description
Aviva is doing an okay job of managing her time while using the system. She is
spending some time reading, some time editing her map, and most of her time
viewing quiz results.
Strengths:
o Editing her map in ways supported by her recent reading
o Making several correct edits, especially more recently
Areas to work on:
o Spending less time viewing unhelpful quiz results
o Practicing interpreting quiz results
Prediction
Aviva most likely understands how humans affect their environment. However,
she may need help understanding how global warming can lead to coastal
flooding. Most of her edits on that area of the map have been incorrect.
Aviva is spending a lot of time using quizzes, but she does not seem to
understand how to use them. She is also struggling to understand more complex
forms of causal reasoning.
Students similar to Aviva have scored in the 70%-79% range on the climate
change unit test. However, Aviva has continued to improve over her two days
of using the system, so she may score higher. Aviva is most similar to Tom and
Jared.
Map Editing Activity
Frequency: High. Once every 1.1 minutes.
Quality: Good. A fair amount of Aviva’s edits are supported by reading
or quiz results.
Effectiveness: Above Average. Aviva’s map has 14 correct links and 3
incorrect links.
297
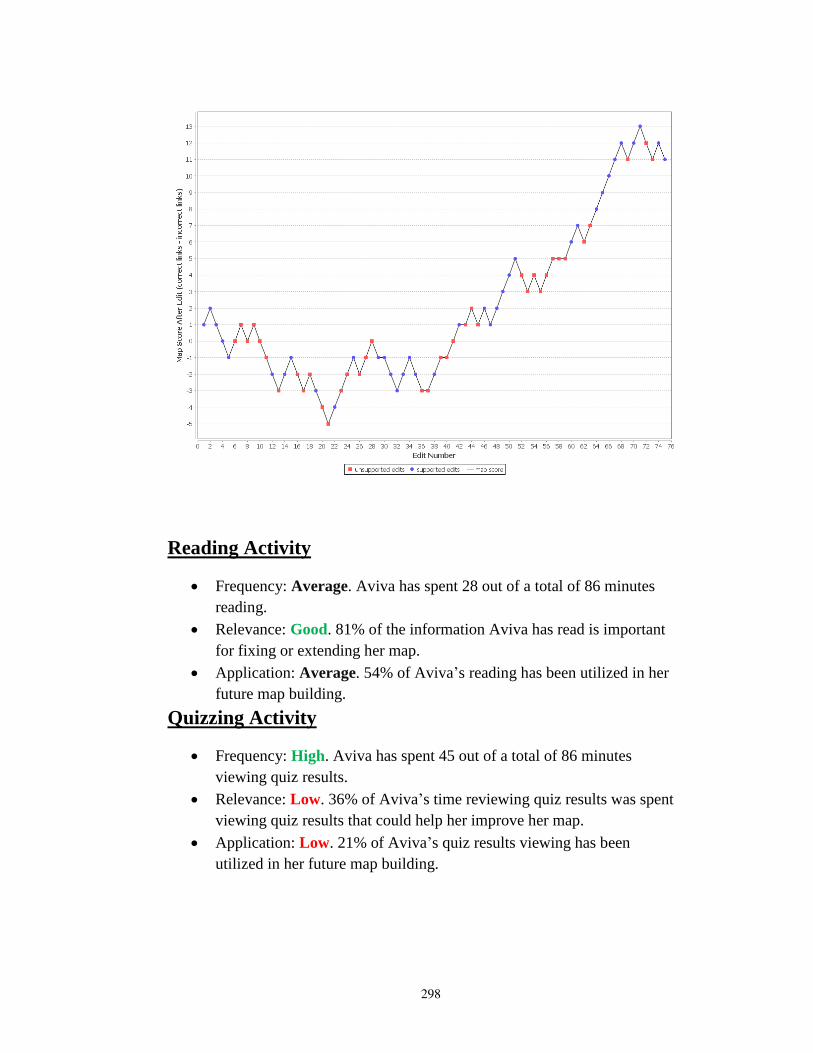
Reading Activity
Frequency: Average. Aviva has spent 28 out of a total of 86 minutes
reading.
Relevance: Good. 81% of the information Aviva has read is important
for fixing or extending her map.
Application: Average. 54% of Aviva’s reading has been utilized in her
future map building.
Quizzing Activity
Frequency: High. Aviva has spent 45 out of a total of 86 minutes
viewing quiz results.
Relevance: Low. 36% of Aviva’s time reviewing quiz results was spent
viewing quiz results that could help her improve her map.
Application: Low. 21% of Aviva’s quiz results viewing has been
utilized in her future map building.
298

Skill Levels
299