Acute Fatal Effects of Short-Lasting Extreme Temperatures in Stockholm, Sweden
10
820 | www.epidem.com Epidemiology • Volume 24, Number 6, November 2013 ORIGINAL ARTICLE Background: Climate change is projected to increase the frequency of extreme weather events. Short-term effects of extreme hot and cold weather and their effects on mortality have been thoroughly doc- umented, as have epidemiologic and demographic changes through- out the 20th century. We investigated whether sensitivity to episodes of extreme heat and cold has changed in Stockholm, Sweden, from the beginning of the 20th century until the present. Methods: We collected daily mortality and temperature data for the period 1901–2009 for present-day Stockholm County, Sweden. Heat extremes were defined as days for which the 2-day moving average of mean temperature was above the 98th percentile; cold extremes were defined as days for which the 26-day moving average was below the 2nd percentile. The relationship between extreme hot/cold tempera- tures and all-cause mortality, stratified by decade, sex, and age, was investigated through time series modeling, adjusting for time trends. Results: Total daily mortality was higher during heat extremes in all decades, with a declining trend over time in the relative risk associ- ated with heat extremes, leveling off during the last three decades. The relative risk of mortality was higher during cold extremes for the entire period, with a more dispersed pattern across decades. Unlike for heat extremes, there was no decline in the mortality with cold extremes over time. Conclusions: Although the relative risk of mortality during extreme temperature events appears to have fallen, such events still pose a threat to public health. (Epidemiology 2013;24: 820–829) T he impact of cold and hot weather on mortality has been known for centuries. The seasonality of mortality in Swe- den was studied in the 18th century using parish and national population statistics. 1 Historical data for England reveal early evidence of increased mortality during severe winters, as well as after cold spells. 2,3 More recently, seasonal fluctua- tions and heightened winter mortality, especially among the elderly, has been reported throughout Europe. 4,5 Contempo- rary research has also focused on heat mortality especially among ageing populations. 6 The frequency and duration of extreme heat events is predicted to increase. 7 The 1987 heat wave in Athens resulted in about 2000 deaths, 8 and the 2003 European heat wave caused some 70,000 deaths. 9 Although the elderly are most susceptible to heat, the fatal effects of such events are also apparent among the middle-aged and the very youngest populations. 10,11 Although not consistent, many studies suggest women face greater relative increases in mortality with heat waves. 12,13 The means by which temperature extremes affect human physiology and performance are well documented. 12 However, the extent and drivers of adaptation to weather and climate are not well understood. Physiologic adaptation to heat occurs within days to weeks in athletes. 14 Social, soci- etal, and behavioral adaptation can also modify a population’s vulnerability to heat and cold. 15,16 Adaptation to regional ambient temperatures has been observed in a few studies of historic registers of short-term mortality caused by weather conditions. 17–19 However, changes in the temperature–mortal- ity relationship cannot be easily separated from underlying demographic changes in the population, changing prevalence of susceptibility factors (well known to have occurred during the 20th century), 20 and extent of natural adaptation to the local environment. We investigate whether sensitivity to temperature extremes of heat and cold changed in Sweden from the Copyright © 2013 by Lippincott Williams & Wilkins. This is an open-access article distributed under the terms of the Creative Commons Attribution- NonCommercial-NoDerivatives 3.0 License, where it is permissible to down- load and share the work provided it is properly cited. The work cannot be changed in any way or used commercially. ISSN: 1044-3983/13/2406-0820 DOI: 10.1097/01.ede.0000434530.62353.0b Submitted 10 September 2012; accepted 4 June 2013. From the a Department of Public Health and Clinical Medicine, Division of Occupational and Environmental Medicine, Umeå University, Umeå, Swe- den; b Ageing and Living Conditions Programme, Umeå University, Umeå, Sweden; c Centre for Population Studies, Umeå University, Umeå, Sweden; and d Department of Public Health and Clinical Medicine, Division of Epi- demiology and Global Health, Umeå University, Umeå, Sweden. D.O.Å. is a PhD candidate receiving financial support from the Swedish Council for Working Life and Social Research. The authors declare no conflict of interest. Supplemental digital content is available through direct URL citations in the HTML and PDF versions of this article (www.epidem.com). This content is not peer-reviewed or copy-edited; it is the sole respon- sibility of the author. Correspondence: Daniel Oudin Åström, Department of Public Health and Clini- cal Medicine, Division of Occupational and Environmental Medicine, Umeå University, 901 87 Umeå, Sweden. E-mail: [email protected]. Acute Fatal Effects of Short-Lasting Extreme Temperatures in Stockholm, Sweden Evidence Across a Century of Change Daniel Oudin Åström, a Bertil Forsberg, a Sören Edvinsson, b,c and Joacim Rocklöv a,d
-
Upload
independent -
Category
Documents
-
view
5 -
download
0
Transcript of Acute Fatal Effects of Short-Lasting Extreme Temperatures in Stockholm, Sweden

820 | www.epidem.com Epidemiology • Volume 24, Number 6, November 2013
Original article
Background: climate change is projected to increase the frequency of extreme weather events. Short-term effects of extreme hot and cold weather and their effects on mortality have been thoroughly doc-umented, as have epidemiologic and demographic changes through-out the 20th century. We investigated whether sensitivity to episodes of extreme heat and cold has changed in Stockholm, Sweden, from the beginning of the 20th century until the present.Methods: We collected daily mortality and temperature data for the period 1901–2009 for present-day Stockholm county, Sweden. Heat extremes were defined as days for which the 2-day moving average of mean temperature was above the 98th percentile; cold extremes were defined as days for which the 26-day moving average was below the 2nd percentile. the relationship between extreme hot/cold tempera-tures and all-cause mortality, stratified by decade, sex, and age, was investigated through time series modeling, adjusting for time trends.Results: total daily mortality was higher during heat extremes in all decades, with a declining trend over time in the relative risk associ-ated with heat extremes, leveling off during the last three decades. the relative risk of mortality was higher during cold extremes for the entire period, with a more dispersed pattern across decades. Unlike for heat extremes, there was no decline in the mortality with cold extremes over time.
Conclusions: although the relative risk of mortality during extreme temperature events appears to have fallen, such events still pose a threat to public health.
(Epidemiology 2013;24: 820–829)
The impact of cold and hot weather on mortality has been known for centuries. the seasonality of mortality in Swe-
den was studied in the 18th century using parish and national population statistics.1 Historical data for england reveal early evidence of increased mortality during severe winters, as well as after cold spells.2,3 More recently, seasonal fluctua-tions and heightened winter mortality, especially among the elderly, has been reported throughout europe.4,5 contempo-rary research has also focused on heat mortality especially among ageing populations.6 the frequency and duration of extreme heat events is predicted to increase.7 the 1987 heat wave in athens resulted in about 2000 deaths,8 and the 2003 european heat wave caused some 70,000 deaths.9 although the elderly are most susceptible to heat, the fatal effects of such events are also apparent among the middle-aged and the very youngest populations.10,11 although not consistent, many studies suggest women face greater relative increases in mortality with heat waves.12,13
the means by which temperature extremes affect human physiology and performance are well documented.12 However, the extent and drivers of adaptation to weather and climate are not well understood. Physiologic adaptation to heat occurs within days to weeks in athletes.14 Social, soci-etal, and behavioral adaptation can also modify a population’s vulnerability to heat and cold.15,16 adaptation to regional ambient temperatures has been observed in a few studies of historic registers of short-term mortality caused by weather conditions.17–19 However, changes in the temperature–mortal-ity relationship cannot be easily separated from underlying demographic changes in the population, changing prevalence of susceptibility factors (well known to have occurred during the 20th century),20 and extent of natural adaptation to the local environment.
We investigate whether sensitivity to temperature extremes of heat and cold changed in Sweden from the
copyright © 2013 by lippincott Williams & Wilkins. this is an open-access article distributed under the terms of the creative commons attribution- noncommercial-noDerivatives 3.0 license, where it is permissible to down-load and share the work provided it is properly cited. the work cannot be changed in any way or used commercially.iSSn: 1044-3983/13/2406-0820DOi: 10.1097/01.ede.0000434530.62353.0b
Submitted 10 September 2012; accepted 4 June 2013. From the aDepartment of Public Health and clinical Medicine, Division of
Occupational and environmental Medicine, Umeå University, Umeå, Swe-den; bageing and living conditions Programme, Umeå University, Umeå, Sweden; ccentre for Population Studies, Umeå University, Umeå, Sweden; and dDepartment of Public Health and clinical Medicine, Division of epi-demiology and global Health, Umeå University, Umeå, Sweden.
D.O.Å. is a PhD candidate receiving financial support from the Swedish council for Working life and Social research.
the authors declare no conflict of interest. Supplemental digital content is available through direct Url citations in the HtMl and PDF versions of this article (www.epidem.com). this content is not peer-reviewed or copy-edited; it is the sole respon-sibility of the author.
correspondence: Daniel Oudin Åström, Department of Public Health and clini-cal Medicine, Division of Occupational and environmental Medicine, Umeå University, 901 87 Umeå, Sweden. e-mail: [email protected].
Acute Fatal Effects of Short-Lasting Extreme Temperatures in Stockholm, Sweden
Evidence Across a Century of Change
Daniel Oudin Åström,a Bertil Forsberg,a Sören Edvinsson,b,c and Joacim Rocklöva,d

Epidemiology • Volume 24, Number 6, November 2013 Fatal Effect of Temperature Extremes in Sweden 1901–2009
© 2013 Lippincott Williams & Wilkins www.epidem.com | 821
beginning of the 20th century to the present. We describe trends in relative risk (rr) of mortality related to temperature extremes, from all causes and stratified by sex and age.
METHODSWe collected information on the daily numbers of
deaths from all causes during the period 1901–2009 for pres-ent-day Stockholm county, Sweden (table 1).21 these mor-tality data are complete only since 1947; from 1901 through 1946 approximately 46% of original parish records have been
converted to digital format. given that mortality distribu-tions among parishes are similar, the available data for deaths should serve as a valid proxy for fluctuations in daily total mortality of Stockholm county.
Daily mean temperature data were provided by the Swedish Meteorological and Hydrological institute (table 2). Observations were made at the Stockholm Obser-vatory, where temperature data have been recorded at almost exactly the same location since 1756. We defined heat extremes as days for which the 2-day moving average of mean temperature (“lag01”) was above the 98th percentile
TABLE 1. Daily Mortality Counts and the Mortality Distribution by Age
Decade
Daily Deaths No.
Percent Distribution of Deaths by Age Years
Mean Standard Deviation Median Min Max Total 0–14 15–65 65–79 80+
1901–1909 16.7 4.8 16 3 40 54,781 29 42 20 9
1910–1919 17.1 6.0 16 3 60 62,517 21 45 22 11
1920–1929 14.5 4.6 14 3 39 52,814 13 44 29 15
1930–1939 16.9 5.3 16 3 44 61,691 7 42 35 16
1940–1949 22.1 6.4 22 6 53 80,763 6 38 37 20
1950–1959 29.0 5.9 29 13 54 105,851 4 31 42 23
1960–1969 35.3 6.8 35 14 63 128,806 3 28 42 27
1970–1979 39.1 7.1 38 20 72 142,637 2 26 41 31
1980–1989 41.1 7.2 41 20 81 150,221 1 20 40 39
1990–1999 42.2 7.4 42 22 75 (238)a 154,181 1 16 34 48
2000–2009 42.4 7.1 42 20 70 (272)b 154,993 0.7 16 27 57
a238 persons died on 28 September 1994 in the estonia disaster.b272 persons died on 26 December 2004 in the tsunami in Southeast asia.
TABLE 2. Descriptive Statistics for Temperature Data
Decade
Summer Meana
(Lag 01)Max
(Lag 01)
Winter Meanb
(Lag 025)Min
(Lag 025)
Days with Heat
Extremesc
No.
Days with Cold
Extremesd
No.
Decadal 98th Percentile for
Heat ExtremesTemperature
No. Days
Decadal 2nd Percentile for
Cold ExtremesTemperature
No. Days
1901–1909 15.1°c 25.3°c −2.2°c −7.1°c 55 11 20.1°c (66) −4.9°c (66)
1910–1919 15.5°c 24.4°c −2.3°c −8.3°c 66 55 20.2°c (74) −6.2°c (74)
1920–1929 15.1°c 24.5°c −2.3°c −9.1°c 44 64 19.5°c (74) −6.4°c (74)
1930–1939 16.7°c 25.8°c −0.8°c −5.4°c 79 0 20.7°c (74) −3.7°c (74)
1940–1949 16.6°c 26.7°c −3.5°c −13.2°c 91 216 21.1°c (74) −10.3°c (74)
1950–1959 16.1°c 25.7°c −2.2°c −10.7°c 55 53 20.3°c (74) −5.6°c (74)
1960–1969 16.3°c 24.3°c −2.9°c −11.2°c 51 119 20.4°c (74) −7.2°c (74)
1970–1979 16.6°c 27.7°c −1.6°c −10.2°c 66 89 20.9°c (74) −6.6°c (74)
1980–1989 16.2°c 26.9°c −2.6°c −11.9°c 58 158 20.7°c (74) −7.7°c (74)
1990–1999 17.0°c 27.0°c −0.3°c −7.1°c 113 22 21.8°c (74) −4.8°c (74)
2000–2009 17.5°c 25.3°c −0.6°c −7.3°c 126 10 22.0°c (74) −3.6°c (74)
aJune, July, and august months comprise 99% of the heat extremes (five heat extremes occurred in September).bJanuary, February, and March months comprise 99% of the cold extremes (seven cold extremes occurred in December).cabove 98th percentile = 20.8°c.dBelow 2nd percentile = −6.9°c.

Åström et al Epidemiology • Volume 24, Number 6, November 2013
822 | www.epidem.com © 2013 Lippincott Williams & Wilkins
(20.8°c) for the entire period (1901–2009). cold extremes were defined as days for which the 26-day moving average of mean temperature (“lag025”) was below the 2nd percen-tile (−6.9°c). these lags are sufficient to describe effects related to short-term variability in temperature.22 Using the same temperature criteria throughout the study period will not take into account either the increasing temperature over time or acclimatization within decades. a single criterion could lead to bias in the earlier decades due to the fact that we might be estimating mortality for a more extreme relative temperature. to address this problem, we also investigated temperature extremes occurring within each decade, using the same percentiles and lags for heat and cold extremes as defined above.
Statistical Methodsto analyze the relationship between extreme hot or
cold temperatures and mortality, we used an approach that assumed the daily counts of mortality follow an overdis-persed Poisson distribution. a generalized linear model was fit. time trends in the daily number of deaths were described by a smooth function. this function was allowed 400 degrees of freedom (df) over the period, corresponding to around 4 df per year of data. the time-trend function allows base-line mortality to vary depending on demographic changes, changes in the data-collection system, and other slowly time-varying extraneous factors. However, the time-trend func-tion cannot explain the short-term variability of daily deaths, which therefore must be explained by daily temperature fluctuations.
Day of the week was included in the model as a cat-egorical explanatory variable. Binary variables indicated pub-lic Swedish holidays (“holiday”) and the later period when all parishes are included in register data (“from 1947 onwards”) (“complete”). Pandemic episodes of influence were included as binary variables (the Spanish flu, October 1918–november 1920; the asian flu, October 1957–april 1958; and the Hong Kong flu, October 1969–March 1970).23
We established the model: Mortality Poissont t~ µ( )
log( ) int
( , )
µ t ercept weekday holiday
S trend df pandemic
= + ++ = +400
++ + +× +
+
complete heat extreme heat
extreme decade cold extreme
cold extreme decade×
Model 1 was computed using cutoff temperatures for temperature extremes defined for the entire period of investiga-tion 1901–2009, whereas for model 2 the cutoff temperatures for temperature extremes were defined within each decade.
Sensitivity analyses of the estimated heat and cold coefficients were done using 300, 350, 450, and 500 degrees of freedom to investigate the importance of the smoothing parameter. the estimates of the rrs were quite similar for the various degrees of freedom used. See etable 1 (http://links.lww.com/eDe/a724) for the estimates of the rrs and the corresponding 95% confidence intervals (cis) using the vari-ous degrees of freedom.
We analyzed separately to investigate differences in vul-nerability to extreme temperatures between sexes.12,13 Since age has also been shown to modify susceptibility,6,12,13 we ana-lyzed data separately for various age groups. these age groups were 0–14, 14–64, and 65+ years. these age groups are char-acterized by different positions in society, as well as different rates and causes of death. Due to the considerable change in age of mortality over the 110 years under study, we further separated the elderly into two categories: 65–79 and 80+.
the relative effect modification index was used to inves-tigate whether sex and age modified the mortality effects of exposure to extreme temperatures. this index is calculated as the ratio between the rr of the group of interest and the rr from the reference group.24
to investigate time trends in the rrs, bearing in mind the substantial difference in standard errors of the rr estimates
Decade
Num
ber
of te
mpe
ratu
re e
xtre
mes
1901−09 1910−19 1920−29 1930−39 1940−49 1950−59 1960−69 1970−79 1980−89 1990−99
Heat extremes
Cold extremes
2000−09
020
4060
8012
016
020
0
FIGURE 1. Number of periods of cold/heat extremes per decade, 1901–2009.

Epidemiology • Volume 24, Number 6, November 2013 Fatal Effect of Temperature Extremes in Sweden 1901–2009
© 2013 Lippincott Williams & Wilkins www.epidem.com | 823
over time, we performed a weighted least squares linear regres-sion, with the rr estimates as the dependent variable and decade as the independent variable, using the weights inversely proportional to the variance of each rr. SaS version 9.2 soft-ware (SaS institute, cary, nc) was used to create datasets and variables. r version 2.13.1 was used for statistical models and creation of outputs.
RESULTS
Number of Temperature ExtremesFigure 1 presents the number of heat and cold extremes
during 1901–2009, by decade, using cutoff temperatures for temperature extremes defined for the entire period of investi-gation 1901–2009.
Heat extremes increased over the 20th century, with the largest upsurge from 1990 onward. the last two decades had more than half-again as many extreme heat events as any other decade of the period. the number of cold extremes per decade was much more variable, and no trend is apparent. this num-ber during the last two decades was low, as in the 1930s when no cold extremes occurred. During the 1940s and 1980s there were large numbers of cold extremes.
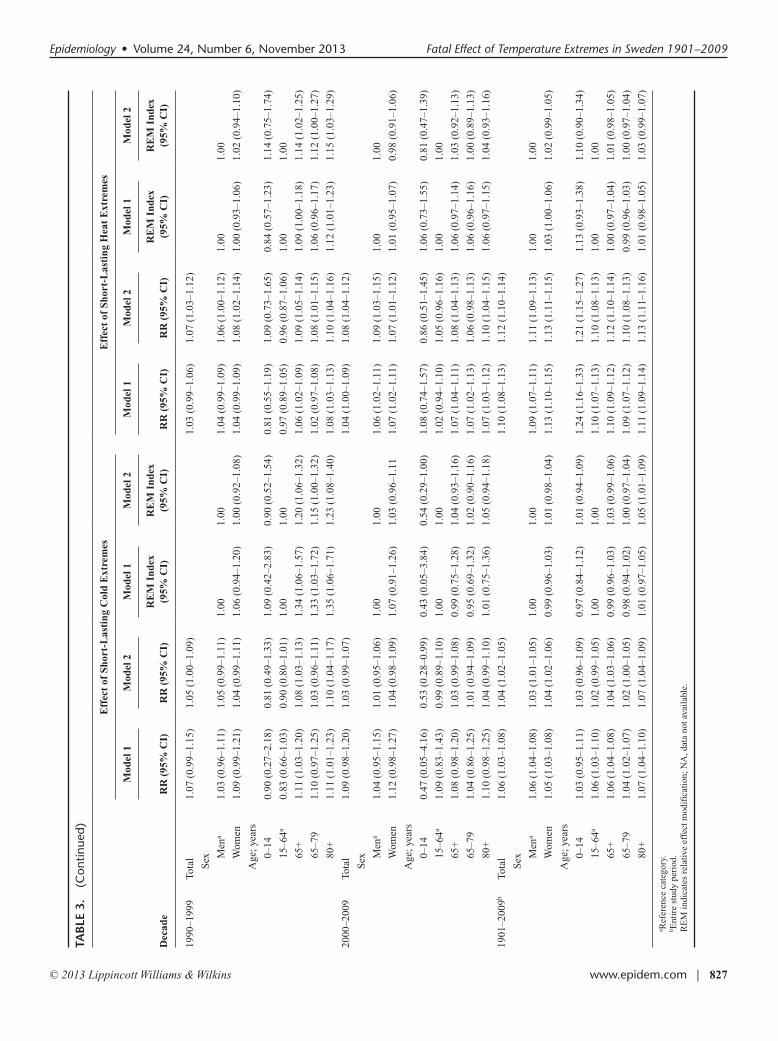
RR of Mortality During Hot and Cold WeatherFigure 2 shows the rr (95% ci) of mortality associ-
ated with extreme heat (lag01) and extreme cold (lag025) compared with nonextreme days, by decade. table 3 presents the results of the regression analyses stratified for sex and age. etable 2 (http://links.lww.com/eDe/a724) presents the results of the regression analysis of trend over time for all investigated groups. Models 1 and 2 yielded similar risk and trend estimates; thus, if not specifically mentioned below, the results and conclusions apply to both models.
Mortality was increased with heat extremes in all decades, as well as for the entire period. the estimated rr of mortality during heat extremes over the entire period was 1.10 (95% ci = 1.08–1.13) and 1.12 (1.10–1.14) for models
1 and 2, respectively. there was a substantial decline of rr estimates for heat extremes during the period.
although mortality with cold extremes was also increased overall (1.06 [1.03–1.08] and 1.04 [1.02–1.05] for models 1 and 2, respectively), the association was more vari-able across decades. During one period 1950–1959, the rr dropped below 1.00. there was little evidence of a declining trend in cold-related mortality over time.
the rrs associated with heat extremes were generally higher than those associated with cold extremes, with both sides risks stabilizing in the last three decades. Patterns and trends were similar for men and women separately (eFigures 1 and 2, http://links.lww.com/eDe/a724). Men had increased mortality during heat extremes in all but 1980–1989. Men’s rr of mortality with heat declined over time. risk with cold also declined over time, although the trend was less marked. results were similar for women, with a decrease in morality rr with heat over time, but no apparent change in mortality risk with extreme cold. Sex was in general not a modifier of risk, for either heat or cold extremes.
rrs for the various age groups are presented in eFigures 3–7 (http://links.lww.com/eDe/a724). an increase in rr for those above age 65 years is present with both heat and cold extremes across the entire period. not surprisingly, this pattern is similar to overall mortality in the last three decades, when over-65 mortality accounted for eight of ten deaths.
results for the other age groups are more difficult to interpret, given the small number of deaths in these groups. risks were elevated during heat extremes for both the age 0–14 and 15–64 years populations in the early 20th century, and then tended to decline. toward the end of the study period, there was an upward risk trend in the 15–64 age group, similar to another study from this region, which indicated a recent increased risk of death among persons aged 45–64 years.11
the trends over time differ somewhat in the various age groups. although rr of mortality from heat was consistently higher than for cold, there was a significant declining trend for
Cold extremes
RR
and
95%
CI
0.8
1.0
1.2
1.4
1.6Model 1
Model 2
Heat extremes
Decade
RR
and
95%
CI
1901−09 1910−19 1920−29 1930−39 1940−49 1950−59 1960−69 1970−79 1980−89 1990−99 2000−09 1901−2009
0.8
1.0
1.2
1.4
1.6Model 1
Model 2
FIGURE 2. Mortality related to temperature extremes per decade, 1901–2009. See Methods section for description of Models 1 and 2.

Åström et al Epidemiology • Volume 24, Number 6, November 2013
824 | www.epidem.com © 2013 Lippincott Williams & Wilkins
TAB
LE 3
. Assoc
iatio
ns of C
old an
d Hea
t Ex
trem
es w
ith Total M
ortality, as well a
s Ana
lyses Stratifi
ed by Se
x an
d Age
Dec
ade
Eff
ect
of S
hort
-Las
ting
Col
d E
xtre
mes
Eff
ect
of S
hort
-Las
ting
Hea
t E
xtre
mes
Mod
el 1
Mod
el 2
Mod
el 1
Mod
el 2
Mod
el 1
Mod
el 2
Mod
el 1
Mod
el 2
RR
(95
% C
I)R
R (
95%
CI)
RE
M I
ndex
(9
5% C
I)R
EM
Ind
ex
(95%
CI)
RR
(95
% C
I)R
R (
95%
CI)
RE
M I
ndex
(9
5% C
I)R
EM
Ind
ex
(95%
CI)
1901
–190
9to
tal
1.27
(1.
14–1
.41)
1.10
(1.
03–1
.16)
1.18
(1.
10–1
.28)
1.16
(1.
08–1
.24)
S
ex
Men
a1.
19 (
1.07
–1.3
2)1.
06 (
0.97
–1.1
5)1.
001.
001.
16 (
1.05
–1.2
9)1.
20 (
1.10
–1.3
1)1.
001.
00
Wom
en1.
34 (
1.15
–1.5
5)1.
14 (
1.04
–1.2
4)1.
12 (
0.94
–1.3
5)1.
08 (
0.95
–1.2
1)1.
24 (
1.11
–1.3
9)1.
11 (
1.01
–1.2
2)1.
07 (
0.92
–1.2
4)0.
92 (
0.81
–1.0
5)
a
ge; y
ears
0–14
1.27
(1.
04–1
.54)
1.10
(0.
98–1
.24)
1.01
(0.
63–1
.64)
1.00
(0.
80–1
.25)
1.32
(1.
17–1
.50)
1.26
(1.
12–1
.40)
1.21
(0.
98–1
.50)
1.16
(0.
96–1
.40)
15–6
4a1.
25 (
1.05
–1.4
9)1.
10 (
1.00
–1.2
2)1.
001.
001.
09 (
0.96
–1.2
4)1.
08 (
0.97
–1.2
1)1.
001.
00
65+
1.25
(1.
05–1
.49)
1.07
(0.
96–1
.19)
1.00
(0.
77–1
.26)
0.97
(0.
84–1
.12)
1.19
(1.
02–1
.39)
1.14
(1.
00–1
.30)
1.09
(0.
89–1
.29)
1.06
(0.
89–1
.23)
65–7
91.
29 (
1.04
–1.6
1)1.
06 (
0.93
–1.2
0)1.
03 (
0.78
–1.3
7)0.
96 (
0.82
–1.1
3)1.
10 (
0.91
–1.3
2)1.
11 (
0.95
–1.3
0)1.
00 (
0.80
–1.2
6)1.
03 (
0.85
–1.2
4)
80+
1.16
(0.
80–1
.67)
1.11
(0.
92–1
.34)
0.92
(0.
62–1
.39)
1.01
(0.
82–1
.25)
1.44
(1.
09–1
.88)
1.21
(0.
95–1
.54)
1.32
(0.
97–1
.78)
1.12
(0.
86–1
.46)
1910
–191
9to
tal
1.01
(0.
94–1
.09)
1.01
(0.
94–1
.07)
1.14
(1.
06–1
.23)
1.14
(1.
07–1
.21)
S
ex
Men
a1.
03 (
0.96
–1.1
0)1.
03 (
0.94
–1.1
2)1.
001.
001.
18 (
1.07
–1.3
1)1.
17 (
1.07
–1.2
7)1.
001.
00
Wom
en0.
98 (
0.89
–1.0
8)0.
98 (
0.89
–1.0
8)0.
95 (
0.85
–1.0
8)0.
96 (
0.84
–1.1
0)1.
13 (
1.02
–1.2
6)1.
11 (
1.02
–1.2
2)0.
96 (
0.83
–1.1
1)0.
95 (
0.84
–1.0
8)
a
ge; y
ears
0–14
0.98
(0.
84–1
.15)
0.99
(0.
85–1
.16)
1.07
(0.
85–1
.34)
1.08
(0.
86–1
.37)
1.30
(1.
12–1
.51)
1.22
(1.
07–1
.38)
1.20
(0.
96–1
.50)
1.15
(0.
96–1
.36)
15–6
4a0.
92 (
0.82
–1.0
3)0.
91 (
0.82
–1.0
2)1.
001.
001.
09 (
0.96
–1.2
4)1.
06 (
0.96
–1.1
7)1.
001.
00
65+
1.13
(1.
02–1
.26)
1.13
(1.
02–1
.26)
1.23
(1.
05–1
.38)
1.24
(1.
06–1
.39)
1.15
(1.
00–1
.31)
1.20
(1.
07–1
.33)
1.05
(0.
88–1
.23)
1.13
(0.
97–1
.27)
65–7
91.
20 (
1.05
–1.3
7)1.
18 (
1.04
–1.3
4)1.
30 (
1.10
–1.5
4)1.
29 (
1.09
–1.5
2)1.
11 (
0.95
–1.3
0)1.
17 (
1.02
–1.3
3)1.
02 (
0.84
–1.2
4)1.
10 (
0.93
–1.2
9)
80+
1.01
(0.
84–1
.21)
1.04
(0.
87–1
.25)
1.10
(0.
88–1
.36)
1.14
(0.
92–1
.41)
1.22
(0.
98–1
.53)
1.26
(1.
05–1
.52)
1.12
(0.
87–1
.45)
1.19
(0.
96–1
.46)
1920
–192
9to
tal
1.10
(1.
04–1
.17)
1.10
(1.
03–1
.17)
1.29
(1.
17–1
.42)
1.23
(1.
15–1
.31)
S
ex
Men
a1.
13 (
1.07
–1.2
0)1.
13 (
1.04
–1.2
3)1.
001.
001.
40 (
1.24
–1.5
9)1.
25 (
1.15
–1.3
7)1.
001.
00
Wom
en1.
06 (
0.98
–1.1
5)1.
07 (
0.98
–1.1
6)0.
94 (
0.85
–1.0
4)0.
95 (
0.84
–1.0
7)1.
21 (
1.06
–1.3
8)1.
21 (
1.10
–1.3
2)0.
86 (
0.72
–1.0
3)0.
96 (
0.85
–1.1
0)
a
ge; y
ears
0–14
1.16
(0.
97–1
.38)
1.15
(0.
96–1
.37)
1.04
(0.
79–1
.37)
1.03
(0.
78–1
.36)
1.34
(1.
03–1
.74)
1.31
(1.
09–1
.58)
1.00
(0.
54–1
.87)
1.09
(0.
72–1
.64)
15–6
4a1.
12 (
1.01
–1.2
3)1.
12 (
1.01
–1.2
3)1.
001.
001.
34 (
1.16
–1.5
3)1.
20 (
1.09
–1.3
3)1.
001.
00
65+
1.06
(0.
97–1
.16)
1.07
(0.
98–1
.17)
0.95
(0.
84–1
.08)
0.96
(0.
84–1
.09)
1.26
(1.
09–1
.45)
1.23
(1.
12–1
.37)
0.94
(0.
77–1
.14)
1.03
(0.
89–1
.17)
65–7
91.
04 (
0.93
–1.1
6)1.
05 (
0.94
–1.1
7)0.
93 (
0.81
–1.0
7)0.
94 (
0.82
–1.0
9)1.
33 (
1.12
–1.5
7)1.
26 (
1.12
–1.4
2)0.
99 (
0.80
–1.2
4)1.
05 (
0.90
–1.2
2)
80+
1.10
(0.
96–1
.27)
1.09
(0.
95–1
.26)
0.99
(0.
83–1
.17)
0.98
(0.
82–1
.16)
1.13
(0.
87–1
.45)
1.18
(0.
99–1
.41)
0.84
(0.
63–1
.13)
0.98
(0.
80–1
.20)
(Con
tinu
ed)

Epidemiology • Volume 24, Number 6, November 2013 Fatal Effect of Temperature Extremes in Sweden 1901–2009
© 2013 Lippincott Williams & Wilkins www.epidem.com | 825
1930
–193
9to
tal
na
1.07
(1.
01–1
.14)
1.17
(1.
10–1
.25)
1.17
(1.
10–1
.24)
S
ex
Men
an
a1.
04 (
0.95
–1.1
3)n
a1.
001.
12 (
1.03
–1.2
2)1.
11 (
1.02
–1.2
1)1.
001.
00
Wom
enn
a1.
10 (
1.02
–1.1
9)n
a1.
06 (
0.94
–1.1
9)1.
25 (
1.15
–1.3
6)1.
23 (
1.13
–1.3
3)1.
12 (
0.99
–1.2
6)1.
10 (
0.98
–1.2
4)
a
ge; y
ears
0–14
na
1.06
(0.
84–1
.34)
na
1.03
(0.
81–1
.31)
1.10
(0.
87–1
.4)
1.09
(0.
86–1
.38)
0.94
(0.
62–1
.40)
0.95
(0.
66–1
.36)
15–6
4an
a1.
04 (
0.94
–1.1
4)n
a1.
001.
18 (
1.07
–1.3
0)1.
15 (
1.05
–1.2
6)1.
001.
00
65+
na
1.10
(1.
02–1
.19)
na
1.06
(0.
94–1
.19)
1.20
(1.
10–1
.31)
1.20
(1.
10–1
.30)
1.02
(0.
90–1
.14)
1.04
(0.
92–1
.16)
65–7
9n
a1.
09 (
0.99
–1.2
0)n
a1.
05 (
0.91
–1.2
0)1.
17 (
1.06
–1.2
9)1.
18 (
1.07
–1.3
0)0.
99 (
0.86
–1.1
4)1.
02 (
0.89
–1.1
7)
80+
na
1.13
(0.
98–1
.29)
na
1.09
(0.
92–1
.29)
1.28
(1.
10–1
.48)
1.24
(1.
08–1
.43)
1.08
(0.
91–1
.29)
1.08
(0.
91–1
.28)
1940
–194
9to
tal
1.17
(1.
12–1
.23)
1.06
(1.
00–1
.12)
1.15
(1.
10–1
.22)
1.20
(1.
14–1
.27)
S
ex
Men
a1.
14 (
1.10
–1.1
9)1.
02 (
0.94
–1.1
0)1.
001.
001.
11 (
1.04
–1.1
9)1.
13 (
1.05
–1.2
2)1.
001.
00
Wom
en1.
16 (
1.10
–1.2
3)1.
10 (
1.02
–1.1
9)1.
02 (
0.95
–1.0
9)1.
08 (
0.97
–1.2
1)1.
23 (
1.15
–1.3
1)1.
27 (
1.18
–1.3
7)1.
11 (
1.00
–1.2
2)1.
12 (
1.01
–1.2
4)
a
ge; y
ears
0–14
0.92
(0.
77–1
.10)
0.91
(0.
70–1
.18)
0.82
(0.
61–1
.10)
0.88
(0.
68–1
.15)
1.27
(1.
04–1
.54)
1.28
(1.
04–1
.58)
1.09
(0.
76–1
.56)
1.08
(0.
74–1
.60)
15–6
4a1.
13 (
1.05
–1.2
0)1.
03 (
0.94
–1.1
4)1.
001.
001.
17 (
1.08
–1.2
7)1.
18 (
1.08
–1.2
9)1.
001.
00
65+
1.19
(1.
14–1
.25)
1.09
(1.
02–1
.17)
1.06
(0.
97–1
.14)
1.06
(0.
94–1
.18)
1.16
(1.
08–1
.24)
1.21
(1.
13–1
.30)
0.99
(0.
89–1
.10)
1.02
(0.
92–1
.13)
65–7
91.
16 (
1.09
–1.2
4)1.
11 (
1.01
–1.2
1)1.
03 (
0.94
–1.1
3)1.
07 (
0.94
–1.2
3)1.
15 (
1.06
–1.2
4)1.
18 (
1.08
–1.2
9)0.
98 (
0.88
–1.1
0)1.
00 (
0.88
–1.1
3)
80+
1.25
(1.
15–1
.35)
1.06
(0.
94–1
.20)
1.11
(1.
00–1
.23)
1.03
(0.
88–1
.20)
1.18
(1.
06–1
.32)
1.26
(1.
12–1
.41)
1.01
(0.
88–1
.16)
1.07
(0.
92–1
.23)
1950
–195
9to
tal
0.95
(0.
89–1
.01)
0.97
(0.
92–1
.02)
1.11
(1.
05–1
.17)
1.09
(1.
04–1
.15)
S
ex
Men
a0.
91 (
0.86
–0.9
7)0.
93 (
0.87
–0.9
9)1.
001.
001.
12 (
1.04
–1.2
1)1.
11 (
1.04
–1.1
9)1.
001.
00
Wom
en0.
97 (
0.89
–1.0
6)1.
01 (
0.94
–1.0
8)1.
07 (
0.96
–1.1
9)1.
09 (
0.99
–1.2
0)1.
12 (
1.03
–1.2
1)1.
07 (
1.00
–1.1
5)1.
00 (
0.90
–1.1
1)0.
97 (
0.88
–1.0
6)
a
ge; y
ears
0–14
0.93
(0.
67–1
.30)
1.00
(0.
77–1
.30)
1.04
(0.
70–1
.54)
1.14
(0.
79–1
.65)
1.58
(1.
24–2
.02)
1.45
(1.
16–1
.82)
1.40
(0.
99–1
.97)
1.34
(1.
02–1
.76)
15–6
4a0.
90 (
0.80
–1.0
1)0.
88 (
0.80
–0.9
7)1.
001.
001.
13 (
1.02
–1.2
5)1.
08 (
0.99
–1.1
8)1.
001.
00
65+
0.96
(0.
89–1
.03)
1.01
(0.
95–1
.07)
1.07
(0.
93–1
.21)
1.15
(1.
03–1
.26)
1.09
(1.
02–1
.16)
1.08
(1.
01–1
.14)
0.96
(0.
85–1
.08)
0.99
(0.
89–1
.10)
65–7
90.
94 (
0.86
–1.0
2)0.
97 (
0.90
–1.0
4)1.
04 (
0.90
–1.2
1)1.
10 (
0.98
–1.2
4)1.
14 (
1.05
–1.2
4)1.
11 (
1.03
–1.1
9)1.
01 (
0.89
–1.1
5)1.
02 (
0.91
–1.1
5)
80+
1.00
(0.
89–1
.12)
1.08
(0.
99–1
.19)
1.11
(0.
94–1
.32)
1.23
(1.
08–1
.41)
0.99
(0.
88–1
.11)
1.02
(0.
92–1
.13)
0.87
(0.
75–1
.02)
0.94
(0.
82–1
.08)
(Con
tinu
ed)
TAB
LE 3
. (C
ontin
ued)
Dec
ade
Eff
ect
of S
hort
-Las
ting
Col
d E
xtre
mes
Eff
ect
of S
hort
-Las
ting
Hea
t E
xtre
mes
Mod
el 1
Mod
el 2
Mod
el 1
Mod
el 2
Mod
el 1
Mod
el 2
Mod
el 1
Mod
el 2
RR
(95
% C
I)R
R (
95%
CI)
RE
M I
ndex
(9
5% C
I)R
EM
Ind
ex
(95%
CI)
RR
(95
% C
I)R
R (
95%
CI)
RE
M I
ndex
(9
5% C
I)R
EM
Ind
ex
(95%
CI)

Åström et al Epidemiology • Volume 24, Number 6, November 2013
826 | www.epidem.com © 2013 Lippincott Williams & Wilkins
1960
–196
9to
tal
1.02
(0.
98–1
.07)
1.02
(0.
97–1
.07)
1.16
(1.
10–1
.21)
1.14
(1.
10–1
.19)
S
ex
Men
a1.
00 (
0.96
–1.0
5)1.
02 (
0.96
–1.0
9)1.
001.
001.
16 (
1.09
–1.2
3)1.
16 (
1.10
–1.2
3)1.
001.
00
Wom
en1.
03 (
0.97
–1.0
9)1.
02 (
0.95
–1.0
9)1.
02 (
0.95
–1.1
0)1.
00 (
0.91
–1.0
9)1.
18 (
1.10
–1.2
6)1.
12 (
1.06
–1.1
9)1.
02 (
0.93
–1.1
2)0.
96 (
0.89
–1.0
5)
a
ge; y
ears
0–14
1.08
(0.
84–1
.38)
0.94
(0.
71–1
.25)
1.00
(0.
75–1
.33)
0.86
(0.
62–1
.20)
1.02
(0.
76–1
.38)
1.02
(0.
78–1
.32)
0.91
(0.
62–1
.32)
0.90
(0.
64–1
.28)
15–6
4a1.
08 (
1.00
–1.1
7)1.
10 (
1.00
–1.2
0)1.
001.
001.
13 (
1.03
–1.2
3)1.
13 (
1.04
–1.2
2)1.
001.
00
65+
0.99
(0.
94–1
.03)
0.99
(0.
94–1
.05)
0.91
(0.
83–1
.01)
0.90
(0.
81–1
.01)
1.19
(1.
13–1
.26)
1.15
(1.
10–1
.21)
1.06
(0.
95–1
.16)
1.02
(0.
93–1
.12)
65–7
90.
96 (
0.90
–1.0
2)0.
96 (
0.90
–1.0
3)0.
89 (
0.80
–0.9
8)0.
88 (
0.78
–0.9
8)1.
16 (
1.08
–1.2
5)1.
12 (
1.05
–1.1
9)1.
03 (
0.92
–1.1
6)0.
99 (
0.90
–1.1
0)
80+
1.02
(0.
95–1
.10)
1.04
(0.
95–1
.12)
0.95
(0.
85–1
.06)
0.95
(0.
84–1
.07)
1.23
(1.
13–1
.34)
1.21
(1.
12–1
.30)
1.10
(0.
97–1
.24)
1.07
(0.
96–1
.19)
1970
–197
9to
tal
0.99
(0.
95–1
.04)
1.00
(0.
95–1
.05)
1.15
(1.
10–1
.20)
1.16
(1.
12–1
.21)
S
ex
Men
a1.
00 (
0.95
–1.0
5)1.
01 (
0.95
–1.0
8)1.
001.
001.
13 (
1.07
–1.1
9)1.
13 (
1.07
–1.1
9)1.
001.
00
Wom
en0.
97 (
0.91
–1.0
4)0.
98 (
0.92
–1.0
5)0.
97 (
0.90
–1.0
6)0.
97 (
0.88
–1.0
6)1.
20 (
1.14
–1.2
7)1.
20 (
1.13
–1.2
7)1.
06 (
0.98
–1.1
5)1.
07 (
0.99
–1.1
5)
a
ge; y
ears
0–14
1.10
(0.
78–1
.56)
1.11
(0.
78–1
.58)
1.02
(0.
70–1
.49)
1.03
(0.
71–1
.51)
1.26
(0.
96–1
.65)
1.22
(0.
93–1
.61)
1.11
(0.
77–1
.60)
1.07
(0.
74–1
.56)
15–6
4a1.
08 (
0.98
–1.1
9)1.
07 (
0.97
–1.1
8)1.
001.
001.
14 (
1.05
–1.2
3)1.
14 (
1.05
–1.2
3)1.
001.
00
65+
0.95
(0.
91–1
.01)
0.97
(0.
92–1
.03)
0.88
(0.
79–0
.99)
0.91
(0.
81–1
.02)
1.17
(1.
12–1
.23)
1.17
(1.
12–1
.22)
1.03
(0.
94–1
.12)
1.03
(0.
94–1
.12)
65–7
90.
94 (
0.87
–1.0
1)0.
96 (
0.89
–1.0
3)0.
87 (
0.77
–0.9
8)0.
90 (
0.79
–1.0
1)1.
15 (
1.09
–1.2
3)1.
15 (
1.09
–1.2
3)1.
02 (
0.92
–1.1
2)1.
02 (
0.92
–1.1
2)
80+
0.97
(0.
90–1
.05)
0.99
(0.
91–1
.07)
0.90
(0.
80–1
.02)
0.92
(0.
81–1
.04)
1.19
(1.
12–1
.28)
1.19
(1.
11–1
.27)
1.05
(0.
95–1
.17)
1.04
(0.
94–1
.16)
1980
–198
9to
tal
1.07
(0.
99–1
.15)
1.07
(1.
03–1
.12)
1.05
(1.
01–1
.10)
1.06
(1.
02–1
.10)
S
ex
Men
a1.
11 (
1.07
–1.1
4)1.
09 (
1.03
–1.1
6)1.
001.
001.
00 (
0.95
–1.0
6)1.
00 (
0.95
–1.0
6)1.
001.
00
Wom
en1.
04 (
1.00
–1.0
9)1.
05 (
0.99
–1.1
2)0.
94 (
0.89
–0.9
9)0.
96 (
0.89
–1.0
5)1.
12 (
1.06
–1.1
9)1.
11 (
1.05
–1.1
7)1.
12 (
1.03
–1.2
1)1.
11 (
1.03
–1.2
0)
a
ge; y
ears
0–14
0.75
(0.
55–1
.03)
0.73
(0.
46–1
.13)
0.69
(0.
49–0
.98)
0.69
(0.
44–1
.09)
0.87
(0.
58–1
.32)
0.78
(0.
52–1
.18)
0.81
(0.
53–1
.26)
0.73
(0.
47–1
.12)
15–6
4a1.
08 (
1.01
–1.1
7)1.
05 (
0.95
–1.1
7)1.
001.
001.
07 (
0.98
–1.1
7)1.
07 (
0.99
–1.1
7)1.
001.
00
65+
1.08
(1.
04–1
.11)
1.08
(1.
03–1
.13)
0.99
(0.
92–1
.07)
1.03
(0.
92–1
.14)
1.06
(1.
01–1
.11)
1.05
(1.
01–1
.10)
0.99
(0.
89–1
.09)
0.98
(0.
89–1
.08)
65–7
91.
08 (
1.04
–1.1
3)1.
05 (
0.98
–1.1
2)1.
00 (
0.91
–1.0
9)1.
00 (
0.88
–1.1
2)0.
99 (
0.93
–1.0
6)1.
00 (
0.94
–1.0
6)0.
93 (
0.83
–1.0
3)0.
93 (
0.83
–1.0
3)
80+
1.08
(1.
02–1
.13)
1.12
(1.
05–1
.19)
0.99
(0.
91–1
.08)
1.06
(0.
94–1
.20)
1.13
(1.
06–1
.21)
1.12
(1.
05–1
.19)
1.05
(0.
94–1
.18)
1.04
(0.
94–1
.16)
(Con
tinu
ed)
TAB
LE 3
. (C
ontin
ued)
Dec
ade
Eff
ect
of S
hort
-Las
ting
Col
d E
xtre
mes
Eff
ect
of S
hort
-Las
ting
Hea
t E
xtre
mes
Mod
el 1
Mod
el 2
Mod
el 1
Mod
el 2
Mod
el 1
Mod
el 2
Mod
el 1
Mod
el 2
RR
(95
% C
I)R
R (
95%
CI)
RE
M I
ndex
(9
5% C
I)R
EM
Ind
ex
(95%
CI)
RR
(95
% C
I)R
R (
95%
CI)
RE
M I
ndex
(9
5% C
I)R
EM
Ind
ex
(95%
CI)
Epidemiology • Volume 24, Number 6, November 2013 Fatal Effect of Temperature Extremes in Sweden 1901–2009
© 2013 Lippincott Williams & Wilkins www.epidem.com | 827
1990
–199
9to
tal
1.07
(0.
99–1
.15)
1.05
(1.
00–1
.09)
1.03
(0.
99–1
.06)
1.07
(1.
03–1
.12)
S
ex
Men
a1.
03 (
0.96
–1.1
1)1.
05 (
0.99
–1.1
1)1.
001.
001.
04 (
0.99
–1.0
9)1.
06 (
1.00
–1.1
2)1.
001.
00
Wom
en1.
09 (
0.99
–1.2
1)1.
04 (
0.99
–1.1
1)1.
06 (
0.94
–1.2
0)1.
00 (
0.92
–1.0
8)1.
04 (
0.99
–1.0
9)1.
08 (
1.02
–1.1
4)1.
00 (
0.93
–1.0
6)1.
02 (
0.94
–1.1
0)
a
ge; y
ears
0–14
0.90
(0.
27–2
.18)
0.81
(0.
49–1
.33)
1.09
(0.
42–2
.83)
0.90
(0.
52–1
.54)
0.81
(0.
55–1
.19)
1.09
(0.
73–1
.65)
0.84
(0.
57–1
.23)
1.14
(0.
75–1
.74)
15–6
4a0.
83 (
0.66
–1.0
3)0.
90 (
0.80
–1.0
1)1.
001.
000.
97 (
0.89
–1.0
5)0.
96 (
0.87
–1.0
6)1.
001.
00
65+
1.11
(1.
03–1
.20)
1.08
(1.
03–1
.13)
1.34
(1.
06–1
.57)
1.20
(1.
06–1
.32)
1.06
(1.
02–1
.09)
1.09
(1.
05–1
.14)
1.09
(1.
00–1
.18)
1.14
(1.
02–1
.25)
65–7
91.
10 (
0.97
–1.2
5)1.
03 (
0.96
–1.1
1)1.
33 (
1.03
–1.7
2)1.
15 (
1.00
–1.3
2)1.
02 (
0.97
–1.0
8)1.
08 (
1.01
–1.1
5)1.
06 (
0.96
–1.1
7)1.
12 (
1.00
–1.2
7)
80+
1.11
(1.
01–1
.23)
1.10
(1.
04–1
.17)
1.35
(1.
06–1
.71)
1.23
(1.
08–1
.40)
1.08
(1.
03–1
.13)
1.10
(1.
04–1
.16)
1.12
(1.
01–1
.23)
1.15
(1.
03–1
.29)
2000
–200
9to
tal
1.09
(0.
98–1
.20)
1.03
(0.
99–1
.07)
1.04
(1.
00–1
.09)
1.08
(1.
04–1
.12)
S
ex
Men
a1.
04 (
0.95
–1.1
5)1.
01 (
0.95
–1.0
6)1.
001.
001.
06 (
1.02
–1.1
1)1.
09 (
1.03
–1.1
5)1.
001.
00
Wom
en1.
12 (
0.98
–1.2
7)1.
04 (
0.98
–1.0
9)1.
07 (
0.91
–1.2
6)1.
03 (
0.96
–1.1
11.
07 (
1.02
–1.1
1)1.
07 (
1.01
–1.1
2)1.
01 (
0.95
–1.0
7)0.
98 (
0.91
–1.0
6)
a
ge; y
ears
0–14
0.47
(0.
05–4
.16)
0.53
(0.
28–0
.99)
0.43
(0.
05–3
.84)
0.54
(0.
29–1
.00)
1.08
(0.
74–1
.57)
0.86
(0.
51–1
.45)
1.06
(0.
73–1
.55)
0.81
(0.
47–1
.39)
15–6
4a1.
09 (
0.83
–1.4
3)0.
99 (
0.89
–1.1
0)1.
001.
001.
02 (
0.94
–1.1
0)1.
05 (
0.96
–1.1
6)1.
001.
00
65+
1.08
(0.
98–1
.20)
1.03
(0.
99–1
.08)
0.99
(0.
75–1
.28)
1.04
(0.
93–1
.16)
1.07
(1.
04–1
.11)
1.08
(1.
04–1
.13)
1.06
(0.
97–1
.14)
1.03
(0.
92–1
.13)
65–7
91.
04 (
0.86
–1.2
5)1.
01 (
0.94
–1.0
9)0.
95 (
0.69
–1.3
2)1.
02 (
0.90
–1.1
6)1.
07 (
1.02
–1.1
3)1.
06 (
0.98
–1.1
3)1.
06 (
0.96
–1.1
6)1.
00 (
0.89
–1.1
3)
80+
1.10
(0.
98–1
.25)
1.04
(0.
99–1
.10)
1.01
(0.
75–1
.36)
1.05
(0.
94–1
.18)
1.07
(1.
03–1
.12)
1.10
(1.
04–1
.15)
1.06
(0.
97–1
.15)
1.04
(0.
93–1
.16)
1901
–200
9bto
tal
1.06
(1.
03–1
.08)
1.04
(1.
02–1
.05)
1.10
(1.
08–1
.13)
1.12
(1.
10–1
.14)
S
ex
Men
a1.
06 (
1.04
–1.0
8)1.
03 (
1.01
–1.0
5)1.
001.
001.
09 (
1.07
–1.1
1)1.
11 (
1.09
–1.1
3)1.
001.
00
Wom
en1.
05 (
1.03
–1.0
8)1.
04 (
1.02
–1.0
6)0.
99 (
0.96
–1.0
3)1.
01 (
0.98
–1.0
4)1.
13 (
1.10
–1.1
5)1.
13 (
1.11
–1.1
5)1.
03 (
1.00
–1.0
6)1.
02 (
0.99
–1.0
5)
a
ge; y
ears
0–14
1.03
(0.
95–1
.11)
1.03
(0.
96–1
.09)
0.97
(0.
84–1
.12)
1.01
(0.
94–1
.09)
1.24
(1.
16–1
.33)
1.21
(1.
15–1
.27)
1.13
(0.
93–1
.38)
1.10
(0.
90–1
.34)
15–6
4a1.
06 (
1.03
–1.1
0)1.
02 (
0.99
–1.0
5)1.
001.
001.
10 (
1.07
–1.1
3)1.
10 (
1.08
–1.1
3)1.
001.
00
65+
1.06
(1.
04–1
.08)
1.04
(1.
03–1
.06)
0.99
(0.
96–1
.03)
1.03
(0.
99–1
.06)
1.10
(1.
09–1
.12)
1.12
(1.
10–1
.14)
1.00
(0.
97–1
.04)
1.01
(0.
98–1
.05)
65–7
91.
04 (
1.02
–1.0
7)1.
02 (
1.00
–1.0
5)0.
98 (
0.94
–1.0
2)1.
00 (
0.97
–1.0
4)1.
09 (
1.07
–1.1
2)1.
10 (
1.08
–1.1
3)0.
99 (
0.96
–1.0
3)1.
00 (
0.97
–1.0
4)
80+
1.07
(1.
04–1
.10)
1.07
(1.
04–1
.09)
1.01
(0.
97–1
.05)
1.05
(1.
01–1
.09)
1.11
(1.
09–1
.14)
1.13
(1.
11–1
.16)
1.01
(0.
98–1
.05)
1.03
(0.
99–1
.07)
a ref
eren
ce c
ateg
ory.
b ent
ire
stud
y pe
riod
.r
eM
indi
cate
s re
lativ
e ef
fect
mod
ifica
tion
; na
, dat
a no
t ava
ilab
le.
TAB
LE 3
. (C
ontin
ued)
Dec
ade
Eff
ect
of S
hort
-Las
ting
Col
d E
xtre
mes
Eff
ect
of S
hort
-Las
ting
Hea
t E
xtre
mes
Mod
el 1
Mod
el 2
Mod
el 1
Mod
el 2
Mod
el 1
Mod
el 2
Mod
el 1
Mod
el 2
RR
(95
% C
I)R
R (
95%
CI)
RE
M I
ndex
(9
5% C
I)R
EM
Ind
ex
(95%
CI)
RR
(95
% C
I)R
R (
95%
CI)
RE
M I
ndex
(9
5% C
I)R
EM
Ind
ex
(95%
CI)

Åström et al Epidemiology • Volume 24, Number 6, November 2013
828 | www.epidem.com © 2013 Lippincott Williams & Wilkins
heat and cold extremes in the 0–14 age group but not the 15–64 age group. time trends among the elderly followed that of total mortality, with a significant declining trend over time for heat extremes but not for cold extremes. We found no strong evi-dence of age being an effect modifier for changes over time.
DISCUSSIONMortality data for the past century in Stockholm, Swe-
den, show a consistent elevation in rr of death after extremes of temperature, with greater risks for extremes of heat than of cold. Over time there has been a generally declining trend of mortality rr with temperature extremes, although risks remain elevated for the elderly. age and sex are not consistent effect modifiers. Because women tend to live longer than men, the modifying effect in older age groups is hard to disentangle from the effect of sex. there are even indications that, begin-ning one to three decades ago, the population of Stockholm county may be becoming more susceptible to heat extremes. in particular, men and the middle-aged appear to contribute to this recent upward trend.
recent changes are occurring at a time when the number of cold extremes is decreasing and heat extremes are becom-ing more frequent and intense. a decrease in cold extremes may be contributing to a shift in susceptible populations, such that mortality formerly caused by cold is more likely to occur with heat.25 a doubling of susceptibility to heat-related mor-tality in the last two decades has been reported in this region.25
Patterns of temperature-related mortality over a lon-ger period may shed light on results from studies focused on shorter periods. We found reduced vulnerability to heat- and cold-related mortality over time. this decline may be attrib-utable to better housing and health systems, behavioral and physiologic adaptation, and heightened public awareness of dangers associated with extreme temperatures. given that Stockholm is situated in a cold climate, it is likely that many of the adaptive measures over time have aimed at reducing the adverse effects of cold temperatures.
the past 100 years has been a time of fundamental changes in both public health and mortality. life expectancy at the national level increased from about 56 years during the first decade of the 20th century to more than 81 years in 2009.26 the epidemiologic transition20 changed mortality patterns from death primarily in childhood to death in old age. this development is connected to changes in the causes of death. the dominant cause of mortality in early industrial periods was infectious disease, often of epidemic character, whereas chronic diseases are presently responsible for most deaths.
Our results are similar to those of carson et al17 and ekamper et al19 who reported declining vulnerability to tem-perature-related mortality in england and the netherlands over the 20th century. Davis et al18 investigated whether annual heat-related mortality rates had changed in the United States during 1964–1998. they detected a decline in heat-related vulnerability, which they attributed mainly to improvements
in the health sector, population adaptation, improvements in urban design, and increased use of air conditioning. lerchl27 found declining seasonality of mortality in germany dur-ing 1946–1995 and concluded that this was mainly due to increased use of central heating and improvements in the pub-lic health sector.
We report results from two models—model 1 produc-ing estimates with fixed criteria for extreme temperatures over time, and model 2 using decade-specific criteria. the results of these models should be interpreted somewhat differently. Model 2 defines temperature extremes relative to the prevail-ing climate, thus assuming adaptation to potentially increas-ing temperatures and accounting for changes in temperature extremes over time. even though both models show increased risk of mortality during heat extremes, model 1 generally reports higher estimates than model 2 in the earlier part of the century whereas model 2 shows higher estimates in the later part of the century. this contrast is presumably due to increas-ing temperatures over time.
One limitation to the study is that neither intensity nor duration of the temperature extremes were taken into account when estimating the rrs of mortality. Barnett et al28found that more intense heat waves increased the risk of mortal-ity, whereas the same was not true for cold spells. gasparrini and armstrong29 found heat waves lasting more than 4 days had a small effect on mortality (compared with the effect of temperature itself). Due to data availability, we report only results for all-cause mortality. given the substantial changes in causes of mortality over the study period, and given that temperature–mortality relationships differ among vulnerable groups, it would be of interest to be able to present results for cause-specific mortality.
Previous studies have suggested that adaptation to weather has occurred over the 20th century. However, the changes observed in this and previous studies cannot be attributed to adaptation alone. none of these investigations has controlled for variables independent of adaptation, which potentially modify temperature effects and their change over time (eg, causes of death, demographic factors, and preva-lence of medical conditions). Unexpectedly, we observed a recent leveling of the decreasing trend of heat susceptibility, with some groups experiencing an upward trend in tempera-ture susceptibility in recent decades.
in conclusion, we found that susceptibility to heat extremes has decreased substantially over the last 110 years in Stockholm, Sweden. a decreasing susceptibility to cold extremes was also found, although with more variability. this apparent progress over time may indicate improvements in adaptation and general conditions, although recent increases in risk indicate possible increasing susceptibility to temper-ature extremes, particularly heat. to the extent that climate change brings increased episodes of extreme heat, this poses a challenge to societies and to the health sector, especially in protecting susceptible populations.

Epidemiology • Volume 24, Number 6, November 2013 Fatal Effect of Temperature Extremes in Sweden 1901–2009
© 2013 Lippincott Williams & Wilkins www.epidem.com | 829
REFERENCES 1. Wargentin P. Uti hvilka månader flera människor årligen födas och dö i
Sverige 1767 K. Vetenskapsac Handl Avhandling 43. Stockholm, Sweden: Kungl. Vetenskapsakademien; 1767.
2. guy Wa. On temperature and its relation to mortality: an illustration of the application of the numerical method to the discovery of truth. J Statistical Soc. 1881;44:235–262.
3. Farr W. Vital Statistics: A Memorial Volume of Selections from the Reports and Writings of William Farr. Metuchen, nJ: Scarecrow Press; 1885.
4. Wilkinson P, landon M, armstrong B, et al. Cold Comfort: The Social and Environmental Determinants of Excess Winter Death in England, 1986-1996. York: Joseph rowntree Foundation; 2001.
5. Donaldson gc, Keatinge Wr. excess winter mortality: influenza or cold stress? Observational study. BMJ. 2002;324:89–90.
6. Åström DO, Forsberg B, rocklöv J. Heat wave impact on morbidity and mortality in the elderly population: a review of recent studies. Maturitas. 2011;69:99–105.
7. iPcc. Managing the Risks of Extreme Events and Disasters to Advance Climate Change Adaptation. A Special Report of Working Groups I and II of the Intergovernmental Panel on Climate Change, Field CB, Barros V, Stocker TF, et al. cambridge, UK, and new York, nY: cambridge University Press; 2012:582.
8. Katsouyanni K, trichopoulos D, Zavitsanos X, touloumi g. the 1987 athens heatwave. Lancet. 1988;2:573.
9. robine JM, cheung Sl, le roy S, et al. Death toll exceeded 70,000 in europe during the summer of 2003. C R Biol. 2008;331:171–178.
10. Fouillet a, rey g, laurent F, et al. excess mortality related to the august 2003 heat wave in France. Int Arch Occup Environ Health. 2006;80:16–24.
11. rocklöv J, ebi K, Forsberg B. Mortality related to temperature and per-sistent extreme temperatures: a study of cause-specific and age-stratified mortality. Occup Environ Med. 2011;68:531–536.
12. Kovats rS, Hajat S. Heat stress and public health: a critical review. Annu Rev Public Health. 2008;29:41–55.
13. Basu r. High ambient temperature and mortality: a review of epidemio-logic studies from 2001 to 2008. Environ Health. 2009;8:40.
14. Parsons Kc. the effect of gender, acclimation state, the opportunity to adjust clothing and physical disability on requirements for thermal com-fort. Energ Buildings. 2002;34:593–599.
15. Moseley Pl. Mechanisms of heat adaptation: thermotolerance and ac-climatization. J Lab Clin Med. 1994;123:48–52.
16. Stafoggia M, Forastiere F, agostini D, et al. Vulnerability to heat-relat-ed mortality: a multicity, population-based, case-crossover analysis. Epidemiology. 2006;17:315–323.
17. carson c, Hajat S, armstrong B, Wilkinson P. Declining vulnerability to temperature-related mortality in london over the 20th century. Am J Epidemiol. 2006;164:77–84.
18. Davis re, Knappenberger Pc, Michaels PJ, novicoff WM. changing heat-related mortality in the United States. Environ Health Perspect. 2003;111:1712–1718.
19. ekamper P, van Poppel F, van Duin c, garssen J. 150 years of tempera-ture-related excess mortality in the netherlands. Demographic Research. 2009;14:385–426.
20. Omran ar. the epidemiologic transition. a theory of the epidemiology of population change. Milbank Mem Fund Q. 1971;49:509–538.
21. Sveriges Dödsbok Nr.5 1901-2009. Sweden: Sveriges Släktforskarförbund; 2010.
22. anderson Bg, Bell Ml. Weather-related mortality: how heat, cold, and heat waves affect mortality in the United States. Epidemiology. 2009;20:205–213.
23. elgh F. Pandemiers påverkan på samhället. Läkartidningen. 2007;104: 615–619.
24. Stafoggia M, Forastiere F, agostini D, et al. Vulnerability to heat-relat-ed mortality: a multicity, population-based, case-crossover analysis. Epidemiology. 2006;17:315–323.
25. rocklöv J, Forsberg B, Meister K. Winter mortality modifies the heat-mortality association the following summer. Eur Respir J. 2009;33:245–251.
26. Historisk Statistik för Sverige. Del 1. Befolkning. Statistics Sweden. Life Expectancy 1751–2011. 2nd ed. Stockholm: ScB; 1969.
27. lerchl a. changes in the seasonality of mortality in germany from 1946 to 1995: the role of temperature. Int J Biometeorol. 1998;42: 84–88.
28. Barnett ag, Hajat S, gasparrini a, rocklöv J. cold and heat waves in the United States. Environ Res. 2012;112:218–224.
29. gasparrini a, armstrong B. the impact of heat waves on mortality. Epidemiology. 2011;22:68–73.