Action Potential-Dependent Regulation of Gene Expression: Temporal Specificity in Ca21,...
15
Action Potential-Dependent Regulation of Gene Expression: Temporal Specificity in Ca 21 , cAMP-Responsive Element Binding Proteins, and Mitogen-Activated Protein Kinase Signaling R. Douglas Fields, Feleke Eshete, Beth Stevens, and Kouichi Itoh National Institute of Child Health and Human Development, National Institutes of Health, Bethesda, Maryland 20892 Specific patterns of neural impulses regulate genes controlling nervous system development and plasticity, but it is not known how intracellular signaling cascades and transcriptional activa- tion mechanisms can regulate specific genes in response to specific patterns of action potentials. Studies using electrical stimulation of mouse dorsal root ganglion neurons in culture show that the temporal dynamics of intracellular signaling path- ways are an important factor. Expression of c-fos varied in- versely with the interval between repeated bursts of action potentials. Transcription was not dependent on a large or sus- tained increase in intracellular Ca 21 , and high Ca 21 levels separated by long interburst intervals (5 min) produced minimal increases in c-fos expression. Levels of the transcription factor cAMP-responsive element binding protein (CREB), phosphory- lated at Ser-133, increased rapidly in response to brief action potential stimulation but remained at high levels several min- utes after an action potential burst. These kinetics limited the fidelity with which P-CREB could follow different patterns of action potentials, and P-CREB levels were not well correlated with c-fos expression. The extracellular-regulated kinase (ERK) mitogen-activated protein kinases (MAPK ) also were stimulated by action potentials of appropriate temporal patterns. Bursts of action potentials separated by long intervals (5 min) did not activate MAPK effectively, but they did increase CREB phos- phorylation. This was a consequence of the more rapid de- phosphorylation of MAPK in comparison to CREB. High ex- pression of c-fos was dependent on the combined activation of the MAPK pathway and phosphorylation of CREB. These ob- servations show that temporal features of action potentials (and associated Ca 21 transients) regulate expression of neuronal genes by activating specific intracellular signaling pathways with appropriate temporal dynamics. Key words: CREB phosphorylation; calcium; c-fos; signal trans- duction; activity-dependent plasticity; LTP; MAP kinase; SRE How specificity is maintained between stimulus and transcription of specific genes is a fundamental problem in cell biology. In neurobiology an additional complexity arises, because information in the nervous system is coded in the temporal pattern of impulse activity. Although there is considerable information on the multi- ple signal transduction pathways leading from membrane depolar- ization to gene transcription, it is not fully understood how these reactions operate as a system to extract and transmit information from temporally varying stimulation. This is an important ques- tion, considering the f undamental role of action potential- dependent gene regulation in brain function and nervous system development. Neuronal electrical activity has an important influ- ence on development and postnatal shaping of neuronal connec- tions (Shatz, 1990; Fields and Nelson, 1992; Goodman and Shatz, 1993; Gu and Spitzer, 1995). It is well established that specific patterns of action potentials can regulate the expression of specific genes, including those coding neural cell adhesion molecules (Itoh et al., 1995), ion channels (Li et al., 1966; Garcia et al., 1994), neurotransmitters (Hodaie et al., 1995), and immediate early (I E) genes (Sheng et al., 1993; Worley et al., 1993). The concentration of second messengers and differences in activation thresholds for calcium-dependent signaling reactions are important factors in controlling cellular responses to stimu- lation (C lapham, 1995; Ghosh and Greenberg, 1995). In addition, subcellular heterogeneity in the concentration dynamics of sec- ond messengers can contribute to stimulus–response specificity (Bading and Greenberg, 1993; Bootman and Berridge, 1995). The objective of the present study was to investigate whether differ- ences in the temporal dynamics of the second messenger Ca 21 and integration by downstream signaling elements could contrib- ute to specific activation of genes in response to specific patterns of neuronal firing. Patterns of stimulation were delivered that resembled normal bursting activity in utero (Meister et al., 1991; Fitzgerald and Fulton, 1992). Stimulus parameters were developed that would produce similar or countervailing differences in the magnitude of calcium increase (residual, peak, and time-integrated Ca 21 ) but that differed in specific temporal features (e.g., the interval of time between repeated bursts). In contrast to chemical stimula- tion of neurons in vitro, which drives cellular signaling systems to steady-state equilibrium, electrical stimulation in multicompart- ment cell cultures can model the important dynamics of intracel- lular signaling systems driven by impulse activity. Dorsal root ganglion (DRG) neurons do not form synapses and lack sponta- neous impulse activity in culture. They respond to brief electrical stimulation with a single action potential, enabling precise regu- lation of the pattern of impulse activity (Fields et al., 1992). Received May 28, 1997; revised July 14, 1997; accepted July 16, 1997. We thank J. Morgan, T. Curran, and L. Robertson for generously providing the fos/LacZ transgenic mouse strain and D. Abebe for establishing and maintaining the colony of transgenic mice. Correspondence should be addressed to Dr. R. Douglas Fields, Head, Neurocy- tology and Physiology Unit, National Institutes of Health, National Institute of Child Health and Human Development, Laboratory of Developmental Neurobiology, Building 49, Room 5A38, Bethesda, MD 20892. Dr. Itoh’s present address: Tokyo Metropolitan Institute of Medical Science, Tokyo 113, Japan. Copyright © 1997 Society for Neuroscience 0270-6474/97/177252-15$05.00/0 The Journal of Neuroscience, October 1, 1997, 17(19):7252–7266
Transcript of Action Potential-Dependent Regulation of Gene Expression: Temporal Specificity in Ca21,...
Action Potential-Dependent Regulation of Gene Expression:Temporal Specificity in Ca21, cAMP-Responsive Element BindingProteins, and Mitogen-Activated Protein Kinase Signaling
R. Douglas Fields, Feleke Eshete, Beth Stevens, and Kouichi Itoh
National Institute of Child Health and Human Development, National Institutes of Health, Bethesda, Maryland 20892
Specific patterns of neural impulses regulate genes controllingnervous system development and plasticity, but it is not knownhow intracellular signaling cascades and transcriptional activa-tion mechanisms can regulate specific genes in response tospecific patterns of action potentials. Studies using electricalstimulation of mouse dorsal root ganglion neurons in cultureshow that the temporal dynamics of intracellular signaling path-ways are an important factor. Expression of c-fos varied in-versely with the interval between repeated bursts of actionpotentials. Transcription was not dependent on a large or sus-tained increase in intracellular Ca21, and high Ca21 levelsseparated by long interburst intervals (5 min) produced minimalincreases in c-fos expression. Levels of the transcription factorcAMP-responsive element binding protein (CREB), phosphory-lated at Ser-133, increased rapidly in response to brief actionpotential stimulation but remained at high levels several min-utes after an action potential burst. These kinetics limited the
fidelity with which P-CREB could follow different patterns ofaction potentials, and P-CREB levels were not well correlatedwith c-fos expression. The extracellular-regulated kinase (ERK)mitogen-activated protein kinases (MAPK) also were stimulatedby action potentials of appropriate temporal patterns. Bursts ofaction potentials separated by long intervals (5 min) did notactivate MAPK effectively, but they did increase CREB phos-phorylation. This was a consequence of the more rapid de-phosphorylation of MAPK in comparison to CREB. High ex-pression of c-fos was dependent on the combined activation ofthe MAPK pathway and phosphorylation of CREB. These ob-servations show that temporal features of action potentials (andassociated Ca21 transients) regulate expression of neuronalgenes by activating specific intracellular signaling pathwayswith appropriate temporal dynamics.
Key words: CREB phosphorylation; calcium; c-fos; signal trans-duction; activity-dependent plasticity; LTP; MAP kinase; SRE
How specificity is maintained between stimulus and transcriptionof specific genes is a fundamental problem in cell biology. Inneurobiology an additional complexity arises, because informationin the nervous system is coded in the temporal pattern of impulseactivity. Although there is considerable information on the multi-ple signal transduction pathways leading from membrane depolar-ization to gene transcription, it is not fully understood how thesereactions operate as a system to extract and transmit informationfrom temporally varying stimulation. This is an important ques-tion, considering the fundamental role of action potential-dependent gene regulation in brain function and nervous systemdevelopment. Neuronal electrical activity has an important influ-ence on development and postnatal shaping of neuronal connec-tions (Shatz, 1990; Fields and Nelson, 1992; Goodman and Shatz,1993; Gu and Spitzer, 1995). It is well established that specificpatterns of action potentials can regulate the expression of specificgenes, including those coding neural cell adhesion molecules (Itohet al., 1995), ion channels (Li et al., 1966; Garcia et al., 1994),
neurotransmitters (Hodaie et al., 1995), and immediate early (IE)genes (Sheng et al., 1993; Worley et al., 1993).
The concentration of second messengers and differences inactivation thresholds for calcium-dependent signaling reactionsare important factors in controlling cellular responses to stimu-lation (Clapham, 1995; Ghosh and Greenberg, 1995). In addition,subcellular heterogeneity in the concentration dynamics of sec-ond messengers can contribute to stimulus–response specificity(Bading and Greenberg, 1993; Bootman and Berridge, 1995). Theobjective of the present study was to investigate whether differ-ences in the temporal dynamics of the second messenger Ca21
and integration by downstream signaling elements could contrib-ute to specific activation of genes in response to specific patternsof neuronal firing.
Patterns of stimulation were delivered that resembled normalbursting activity in utero (Meister et al., 1991; Fitzgerald andFulton, 1992). Stimulus parameters were developed that wouldproduce similar or countervailing differences in the magnitude ofcalcium increase (residual, peak, and time-integrated Ca 21) butthat differed in specific temporal features (e.g., the interval oftime between repeated bursts). In contrast to chemical stimula-tion of neurons in vitro, which drives cellular signaling systems tosteady-state equilibrium, electrical stimulation in multicompart-ment cell cultures can model the important dynamics of intracel-lular signaling systems driven by impulse activity. Dorsal rootganglion (DRG) neurons do not form synapses and lack sponta-neous impulse activity in culture. They respond to brief electricalstimulation with a single action potential, enabling precise regu-lation of the pattern of impulse activity (Fields et al., 1992).
Received May 28, 1997; revised July 14, 1997; accepted July 16, 1997.We thank J. Morgan, T. Curran, and L. Robertson for generously providing the
fos/LacZ transgenic mouse strain and D. Abebe for establishing and maintaining thecolony of transgenic mice.
Correspondence should be addressed to Dr. R. Douglas Fields, Head, Neurocy-tology and Physiology Unit, National Institutes of Health, National Institute of ChildHealth and Human Development, Laboratory of Developmental Neurobiology,Building 49, Room 5A38, Bethesda, MD 20892.
Dr. Itoh’s present address: Tokyo Metropolitan Institute of Medical Science,Tokyo 113, Japan.Copyright © 1997 Society for Neuroscience 0270-6474/97/177252-15$05.00/0
The Journal of Neuroscience, October 1, 1997, 17(19):7252–7266
Electrical stimulation is the most direct means of depolarizingthe membrane to stimulate gene expression.
The relation among neural impulse pattern, intracellular cal-cium transients, activation of MAP kinase (mitogen-activatedprotein kinase; MAPK) and the transcription factor cAMP-responsive element binding protein (CREB), and induction ofc-fos mRNA and Fos-b-galactosidase were studied in mouse pri-mary DRG neurons. The results provide insight into how infor-mation encoded in the temporal pattern of action potentials istransmitted and integrated within the neuron to control theexpression of a gene implicated in adaptive responses in neurons.
Abstracts of portions of this work have appeared previously(Sheng et al., 1992; Fields et al., 1996).
MATERIALS AND METHODSMulticompartment cell culture and stimulation. Multicompartment cham-bers were made of Teflon and attached to collagen-coated 35 mm culturedishes as described (Fields et al., 1992). DRG neurons were dissociatedfrom 13.5 d mouse fetuses, and 0.25 3 10 6 cells were plated into the twoside compartments. Culture medium contained 5% horse serum and 50ng/ml nerve growth factor, as described previously (Fields et al., 1990;Sheng et al., 1993). Mitosis of non-neuronal cells was inhibited by adding13 mg/ml fluoro-2-deoxyuridine 1–2 d after the initial cell plating. Cul-tures were fed twice a week with half changes of fresh medium. Cultureswere used for experiments 3–4 weeks after plating to allow time for mostDRG neurons in the side compartments to extend axons under thebarrier between the side and central compartments. Axons traversing thebarrier were stimulated through platinum electrodes on opposite sides ofthis barrier. Twenty-four hours before stimulation, cultures were washedthree times in serum-free medium lacking added NGF to minimize theserum and neurotrophin response of the c-fos gene.
Stimulation parameters and electrophysiological responses to stimula-tion have been reported previously for DRG neurons in these multicom-partment chambers (Fields et al., 1990, 1992; Sheng et al., 1993). DRGneurons in this preparation respond to 5 V, 200 msec biphasic pulsedstimulation with a single action potential. This permits precise control ofthe frequency and pattern of action potential activity. These cells followstimulation reliably and indefinitely at rates up to 3 Hz, and they follow10 Hz stimulation for several seconds or 30 Hz for short periods (Fieldset al., 1990; Sheng et al., 1993). In addition to testing various stimulusfrequencies from 0.1 Hz to 10 Hz and different durations of stimulation(up to 30 min), we applied four intermittent pulse train stimuli. Theseconsisted of 1.8, 3.6, 5.4, and 9 sec duration 10 Hz bursts repeated at 1,2, 3, and 5 min intervals, respectively. Pulse train stimulation was appliedfor 30 min to deliver a total of 540 action potentials for each differentstimulus pattern.
RNA preparation and RT-PCR analysis. Total RNA from each culturedish was extracted with 400 ml of TRIzol reagent (Life Technologies,Gaithersburg, MD). RNA was reverse-transcribed into cDNA with Su-perscript II (Life Technologies) and c-fos-specific or random hexamers.Approximately 1/10 fraction was added to the PCR reaction and ampli-fied in a solution containing 10 mM Tris-HCl, pH 8.3, 50 mM KCl, 0.2 mMindividual dNTPs, 1.5 mM MgCl2 , 1 mM each primer, and 1 U of TaqDNA polymerase (Perkin-Elmer Cetus, Norwalk, CT) in a final volumeof 50 ml. PCR conditions included a 1 min 94°C denaturation, 1 min 60°Cannealing, and 1 min 72° primer extension for 20–28 cycles.
The oligonucleotide sequence of the forward and reverse primerscorresponds to nucleotides 1392–1414 and 2232–2254 of the mouse c-fosgene (Van Beveren et al., 1983). The primers flank introns 2 and 3,yielding a 341 bp RT-PCR product. Neuron-specific enolase (NSE) wascoamplified as an internal target for normalization of cell count, RNAextraction, and PCR amplification. NSE primers GGA CAG CAA GAAAGA GGC TCC (downstream) and CTC TAC CAG GAC TTT GTCCGC (upstream) were based on the published sequence from rat brain(Sakimura et al., 1985). Preliminary experiments were performed todetermine the range of nonsaturated amplification, using serial dilutionof cDNA and variable cycle numbers. NSE cDNA was amplified colin-early with that of c-fos under the conditions described above. NSE isspecific for neurons, and it is not regulated by electrical stimulation.Constant expression of NSE in our system was confirmed by comparingNSE mRNA levels with those of GADPH. The PCR products wereelectrophoresed in 6% polyacrylamide or 3% NuSieve 3:1 (FMC Bio-
products, Rockland, ME) gels and stained with 0.5 mg/ml ethidium bro-mide. After electrophoresis a picture of the gel was taken, and the intensityof the bands was quantified by densitometry (Image 1, Universal Imaging,West Chester, PA). The results were normalized with respect to theintensity of the NSE band and expressed as a percentage change fromnonstimulated cultures. The specificity of the PCR product was judged bythe expected size of the band in the gel and by hybridization to a specificprobe for c-fos (1919–1942) under stringent conditions (Sheng et al., 1993).
Intracellular calcium. The intracellular calcium concentration was mea-sured by ratiometric fluorescence video microscopy (Image 1, UniversalImaging), using the calcium-sensitive dye fura-2/AM as described previ-ously (Fields et al., 1993). Neurons were washed in a balanced saltsolution containing 2% bovine serum albumin and 5 mM fura-2/AM(Molecular Probes, Eugene, OR) for 10 min at 37°C. Cells were incu-bated at room temperature for 15 min and then washed and maintainedat room temperature for 30 min to allow for hydrolysis of the acetoxym-ethyl ester from the dye. Electrically evoked changes in calcium concen-tration were measured in the cell bodies of neurons plated in the sidecompartments of the multicompartment chambers. Images were obtainedwith a 403 Zeiss lens on an inverted Zeiss microscope (Oberkochen,Germany) equipped with a quartz collector, using an image intensifierand a video camera. Image acquisition was triggered from the electricalstimulus delivered to the cell cultures to synchronize measurement ofresponses to electrical stimuli of different patterns. Excitation wasswitched between 340 and 380 nm with a filter wheel (Sutter Instruments,Novato, CA), and the fluorescent images were acquired and ratioed atrates of ;1/sec. In experiments requiring the highest possible acquisitionspeed with this system, fluorescence intensity was measured at video ratein response to excitation at one wavelength, and an identical electricalstimulus was repeated after a 5 min rest to allow measurements to beacquired by using the other excitation wavelength. Then the fluorescentintensities from the two wavelengths were ratioed.
Confocal microscopy in single line and X-Y scan mode were used tostudy subcellular heterogeneity of electrically evoked calcium transientsin DRG neurons stimulated in multicompartment chambers. Measure-ments were performed on a Bio-Rad 1024 visible/UV confocal micro-scope (Hercules, CA) and a Nikon 403 oil immersion objective on aNikon inverted microscope (Tokyo, Japan). Quantitative calcium mea-surements were made with ratiometric measurements at a fluorescenceintensity at 480 and 405 nm in DRG neurons loaded with Indo-1/AM andexcited by an argon ion laser. These were confirmed by single wavelengthmeasurements with Fluo-3/AM excited by a krypton/argon laser.
CREB phosphorylation. Cultures of DRG neurons were stimulatedelectrically or with 60 mM KCl and fixed immediately after stimulationwith 1% paraformaldehyde for 20 min at room temperature. Cells werepermeabilized with 0.2% Triton X-100 for 2 min, and endogenousperoxidase was blocked with 3% H2O2 for 5 min, followed by 3% normalgoat serum (NGS) for 30 min. Cultures were incubated for 4 hr withantibody against unphosphorylated CREB or CREB phosphorylated atserine-133 (Ginty et al., 1993) (Upstate Biotechnology, Lake Placid, NY,and New England Biolabs, Beverly, MA) at a concentration of 0.25 mg/mlin PBS containing 1% NGS. After washing, the cultures were incubatedfor 30 min with biotinylated goat anti-rabbit IgG and localized by theABC method (Vector Laboratories, Burlingame, CA) according to themanufacturer’s protocol. The relative intensity of the nuclear stain wasquantified by using imaging densitometry on a video microscope (Image1, Universal Imaging).
CREB phosphorylation also was analyzed by Western immunoblottingas described previously (Ginty et al., 1993). Cells lysates made in boilingsample buffer (125 mM Tris-HCl, pH 6.8, 4% SDS, 10%b-mercaptoethanol, 20% glycerol, and 0.04% bromphenol blue), wereboiled for 5 min and resolved in 10% SDS polyacrylamide minigels andelectrotransferred to polyvinylidene fluoride membranes (Immobilon-P,Millipore, Bedford, MA). Membranes were blocked with 5% dry milk inTTBS (10 mM Tris-HCl, pH 7.5, 150 mM NaCl, 0.1% Tween-20) for 1 hrat room temperature, washed, and incubated in the CREB or P-CREBantibodies (1:2500) overnight at 4°C. Immunocomplexes were visualizedby enhanced chemiluminescence reagent (Amersham, ArlingtonHeights, IL) according to the manufacturer’s protocol.
MAP kinase activation. The in vivo MAP kinase activation was mea-sured in cultured DRG neurons after four different action potentialpatterns were elicited. The activation of the extracellular-regulated ki-nase (ERK) MAP kinases was determined by Western immunoblottingas described above, except that polyclonal antibodies raised against dualphosphorylated/active epitope in ERK1 and ERK2 (12.5 ng/ml) (Anti-
Fields et al. • Regulation of Gene Expression by Neural Impulses J. Neurosci., October 1, 1997, 17(19):7252–7266 7253
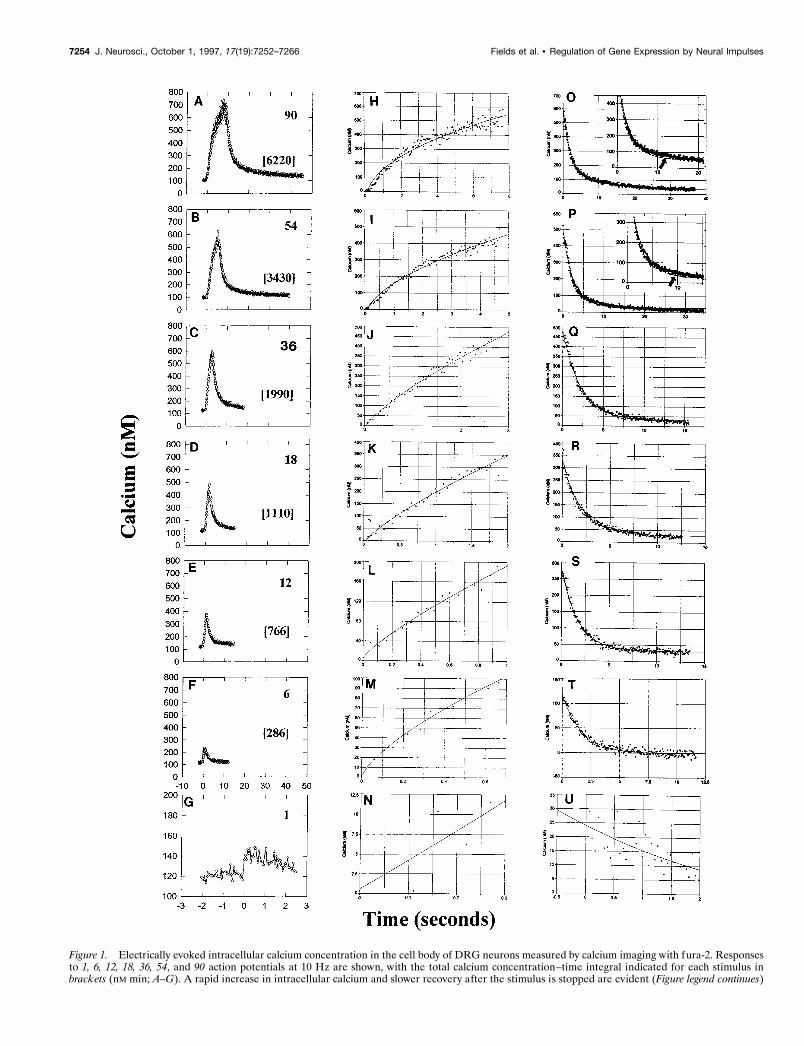
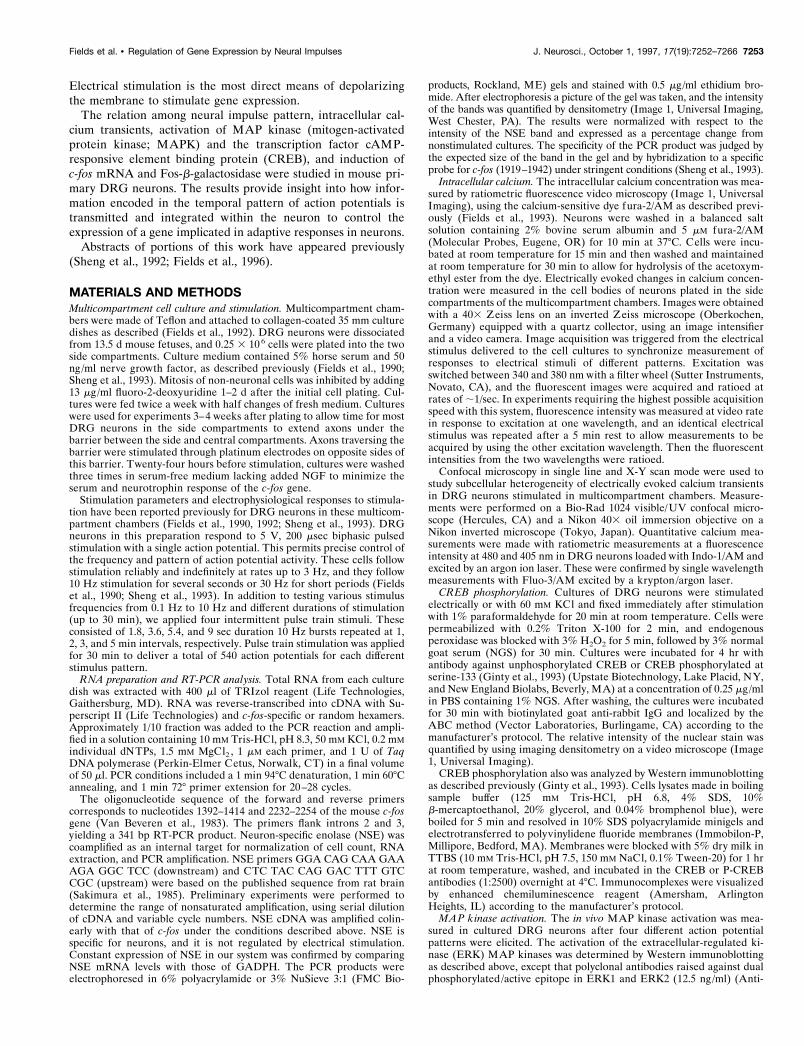
Figure 1. Electrically evoked intracellular calcium concentration in the cell body of DRG neurons measured by calcium imaging with fura-2. Responsesto 1, 6, 12, 18, 36, 54, and 90 action potentials at 10 Hz are shown, with the total calcium concentration–time integral indicated for each stimulus inbrackets (nM min; A–G). A rapid increase in intracellular calcium and slower recovery after the stimulus is stopped are evident (Figure legend continues)
7254 J. Neurosci., October 1, 1997, 17(19):7252–7266 Fields et al. • Regulation of Gene Expression by Neural Impulses
ACTIVE MAPK, Promega, Madison, WI) and total ERK1/ERK2MAP kinases (5 ng/ml) (New England Biolabs) were used. The immu-nocomplexes were detected with either DAB (Vector Laboratories) orenhanced chemiluminescence reagent (Amersham) according to themanufacturers’ protocols. Digitized images of the immunoblots or auto-radiograms were used for densitometric measurements with the Intelli-gent Quantifier software (Bio Image, Ann Arbor, MI). Relative enzymeactivation was determined by normalization of the density of imagesfrom phosphorylated enzyme with that of the total ERK1 MAP kinasefrom parallel experiments in the same sample.
Data anal ysis and experimental design. Calcium responses to electri-cal stimulation were measured in multiple cells in several dishes frommultiple dissections (sample size given with Results). The calciumresponses over time for all cells at each stimulus frequency werepooled and plotted as the mean response at every time point 6 theSEM. Statistical analysis was performed by ANOVA with data analysiscomputer software (Minitab, State College, PA). Calcium responseswere measured in response to different frequencies of stimulation andin response to bursts of 10 Hz stimulation for durations up to 9 sec.Long-term calcium recordings also were performed to monitorchanges in intracellular calcium during the 30 min stimulation periodwith the four different pulse train stimulus patterns used in studies ofc-fos expression. The sampling rate was varied systematically by com-puter program to provide higher temporal resolution during stimulusbursts than during the intervals between bursts. The activation andrecovery kinetics of calcium influx in response to different durations of10 Hz stimulation were modeled with nonlinear regression software(Table Curve, Jandel Scientific, San Rafael, CA). The equation of bestfit was selected on the basis of high regression coefficient and mostuniform distribution of residuals.
The relative intensity of nuclear staining after immunocytochemistry,using antibodies against CREB or P-CREB, was compared by imagingdensitometry in multiple cells from multiple dishes and multiple dissec-tions (sample size reported with Results). Statistical comparisons weremade by ANOVA on differences in nuclear staining intensity after 30min of stimulation with the four different stimulus patterns used inexperiments on c-fos expression or after 10 min of depolarization with 60mM KCl. Differences in staining were also compared after 30 min ofstimulation at 1 and 10 Hz and after fixation after 10 sec and 1, 5, and 10min of 10 Hz stimulation. Fixation was begun immediately after stimu-lation was stopped. Dephosphorylation of CREB at Ser-133 was studiedby stimulating cultures at 10 Hz for 5 min and fixing cultures immediatelyor 1, 5, 10, and 25 min after terminating the stimulus. Images wereacquired from at least 15 randomly chosen fields in each culture with aNuvicon video camera and digitized by computer for storage and display.The mean intensity of staining was quantified in the nucleus of everyneuron in each field. All cultures from a given experiment were analyzedtogether to maintain uniformity. All values were normalized to the meanintensity of nuclear staining in unstimulated cultures to allow for poolingreplicate experiments [arbitrary optical units 5 (((nuclear staining den-sity/average staining density of control nuclei) 3 100) 2100)]. The resultswere presented as mean 6 SEM, and statistical comparisons were eval-uated by ANOVA or two-sample t test. The images were digitized by aneight-bit digitizer, which yields an intensity scale from 0–255 (pure whiteto pure black). The average intensity of unstimulated nuclei was ;100;therefore, the maximal possible increase in staining intensity 5 155%.All experimental designs were balanced to include each stimulus condi-tion and unstimulated cultures to allow normalizing intensities relative tounstimulated controls.
Table 1. Parameter fits using nonlinear regression to electrically induced calcium transients in the cellbodies of DRG neurons after action potential stimulation at 10 Hz for various durations
Number of actionpotentials
Fitted parameter values
a b c d e r2
Calcium increase y 5 a 1 b tc
1 0.608 38.1 1.02 – – 0.6036 21.00 132 0.686 – – 0.978
12 3.63 189 0.798 – – 0.97318 215.1 214 0.764 – – 0.97636 216.6 215 0.752 – – 0.98054 247.1 204 0.560 – – 0.97590 291.8 246 0.459 – – 0.955
Calcium recovery y 5 a 1 b exp(2t/c)1 212.0 36.0 3.60 – – 0.4846 21.03 119 1.69 – – 0.966
12 31.0 251 1.73 – – 0.98618 28.5 300 1.96 – – 0.98436 29.3 452 2.24 – – 0.98954 23.2 460 2.71 – – 0.979**90 51.2 504 2.99 – – 0.968**
Calcium recovery y 5 a 1 b exp(2ct) 1 d exp(2et)54 24.4 450 0.439 27.5 0.103 0.98190 27.6 447 0.545 130 0.0789 0.987
y, Intracellular calcium; t, time; r 2, regression coefficient.**A poor fit at approximately t 5 10 sec because of sustained calcium increase.
4
for all stimulus durations. A single action potential produces a small but detectable increase in [Ca 21]i in the cell body. The kinetics of calcium increaseare well fit by a power function, using nonlinear regression (H–N ) (see Table 1). The kinetics of recovery after the stimulus is terminated are well fitby a single exponential equation for stimulus durations ,54 impulses ( Q–U ), but the recovery deviates from this function for longer bursts by havinga longer sustained increase in intracellular calcium at ;10 sec poststimulus (Table 1; arrow in insets to O, P). A double exponential function is requiredto adequately fit this slower recovery in the following 54 (P) and 90 (O) action potential bursts (see Table 1).
Fields et al. • Regulation of Gene Expression by Neural Impulses J. Neurosci., October 1, 1997, 17(19):7252–7266 7255
RESULTSCalcium transients evoked by trains ofaction potentialsCalcium is a critical second messenger mediating intracellularsignaling and regulating gene expression in neurons (Ghosh andGreenberg, 1995; Fields, 1996; Ginty, 1997), but there is littlequantitative data on the relation between calcium transients andgene expression. It is not yet clear how changes in resting calciumconcentration, amplitude of calcium transient, and dynamics ofcalcium increase and recovery after stimulation relate to tran-scriptional activation of c-fos and other IE genes. Intracellularcalcium concentration was measured in response to specific pat-terns of action potentials to test the hypothesis that the temporaldynamics of intracellular calcium transients could be an impor-tant factor in regulating c-fos mRNA levels, apart from differ-ences in the concentration of intracellular calcium (peak levels,residual calcium, and total integral calcium).
Calcium imaging, using the fluorescent calcium probe fura-2,showed that calcium transients in response to action potentialsexhibited rapid on rates, temporal summation, and relativelyslower recovery (Fig. 1). Quantitative analysis of electricallyevoked calcium transients was performed to allow prediction ofchanges in intracellular calcium in response to a wide range ofpossible stimulus patterns. The immediate objective was to definea set of stimulus patterns that would produce similar or counter-vailing increases in the amount of cytoplasmic calcium but thatdiffered in temporal parameters, such as the interval betweenrepeated bursts. The kinetics of increase in calcium produced by1–90 action potentials (delivered at a frequency of 10 Hz) werewell fit by nonlinear regression to an equation of the form:
y 5 a 1 b tc, (1)
where y 5 the calcium concentration, a 5 the prestimulus calciumconcentration, b 5 the amplitude of the calcium increase, and t 5the duration of stimulation at 10 Hz; c is the constant rangingfrom 1.02 for a single action potential to 0.459 for 90 actionpotentials (Fig. 1H–N, Table 1). Even a single action potentialproduced a small (;20 nM) but measurable increase in intracel-lular calcium concentration (Fig. 1G,N).
Next it was necessary to determine the rate at which thecalcium concentration returns to normal after a stimulus burst, topredict how calcium levels are affected by repeated bursts ofimpulses. The recovery function followed nonlinear kinetics thatdiffered for long and short stimulus bursts. For stimulus bursts of
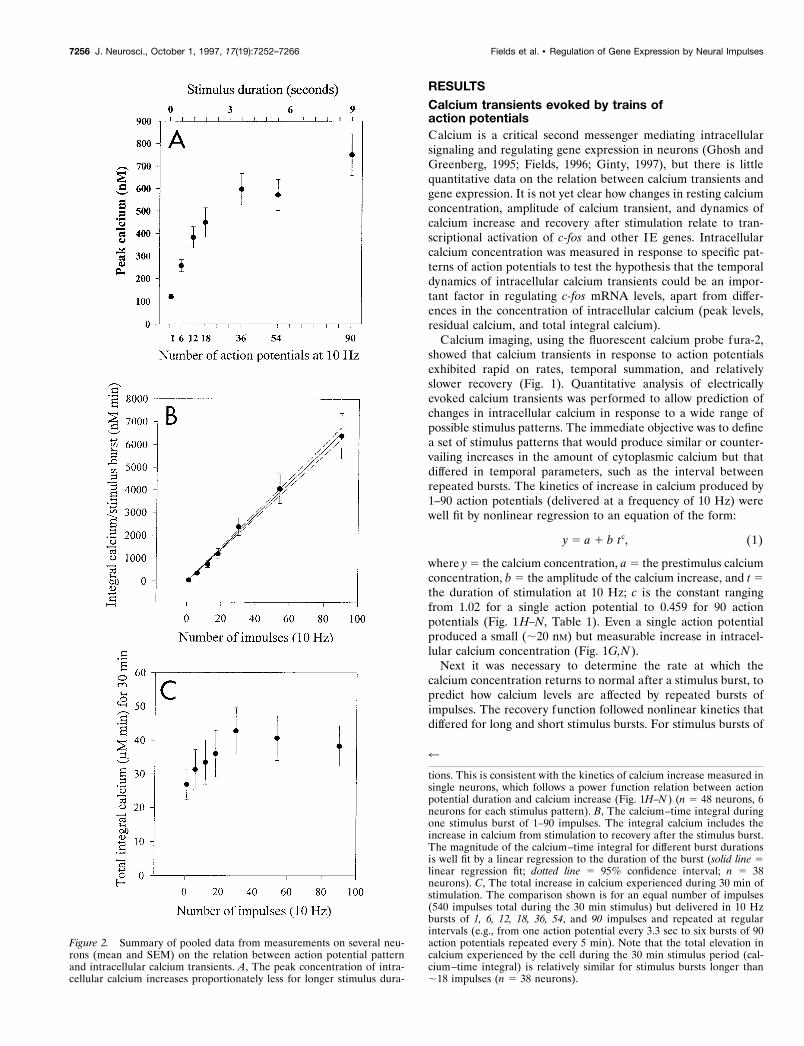
Figure 2. Summary of pooled data from measurements on several neu-rons (mean and SEM) on the relation between action potential patternand intracellular calcium transients. A, The peak concentration of intra-cellular calcium increases proportionately less for longer stimulus dura-
4
tions. This is consistent with the kinetics of calcium increase measured insingle neurons, which follows a power function relation between actionpotential duration and calcium increase (Fig. 1H–N ) (n 5 48 neurons, 6neurons for each stimulus pattern). B, The calcium–time integral duringone stimulus burst of 1–90 impulses. The integral calcium includes theincrease in calcium from stimulation to recovery after the stimulus burst.The magnitude of the calcium–time integral for different burst durationsis well fit by a linear regression to the duration of the burst (solid line 5linear regression fit; dotted line 5 95% confidence interval; n 5 38neurons). C, The total increase in calcium experienced during 30 min ofstimulation. The comparison shown is for an equal number of impulses(540 impulses total during the 30 min stimulus) but delivered in 10 Hzbursts of 1, 6, 12, 18, 36, 54, and 90 impulses and repeated at regularintervals (e.g., from one action potential every 3.3 sec to six bursts of 90action potentials repeated every 5 min). Note that the total elevation incalcium experienced by the cell during the 30 min stimulus period (cal-cium–time integral) is relatively similar for stimulus bursts longer than;18 impulses (n 5 38 neurons).
7256 J. Neurosci., October 1, 1997, 17(19):7252–7266 Fields et al. • Regulation of Gene Expression by Neural Impulses
,54 impulses (Fig. 1Q–U), the kinetics of recovery were well fitby a single exponential equation of the form:
y 5 a 1 b exp(2t/c), (2)
with a time constant in the range of 1.7–3.6 sec.For longer duration bursts, the kinetics of recovery deviated
from the single exponential decay function by having a moresustained increase than expected at ;10 sec after the stimuluswas terminated (Fig. 1, insets to O,P). This plateau response (Fig.
1O,P, Table 1) was better fit by a double exponential equation ofthe form:
y 5 a 1 b 1 exp(2ct) 1 d exp(2et). (3)
Similar plateau responses after intense stimulation have beenreported previously (Thayer and Miller, 1990; Bowie et al., 1994).
High concentrations of intracellular calcium in these neuronswould be reached within the first few seconds of stimulation at afrequency of 10 Hz, with relatively smaller differences in peakcalcium concentration produced after longer duration stimuli.After the stimulus was terminated, calcium recovered to nearprestimulus levels within seconds after 1–18 impulse bursts (at 10Hz) (Fig. 1R–U), but tens of seconds were required to recoverfrom 36 to 90 impulse bursts (Fig. 1O–Q). These kinetics wereconfirmed by measuring mean peak calcium responses to electri-cal stimulation in a larger number of neurons (n 5 42), whichwere stimulated with 10 Hz bursts of seven different durationsranging from 0.1 to 9 sec (Fig. 2A).
Previous research has suggested that, rather than correlatingwith the peak levels of calcium during a given stimulus burst, geneexpression might be related more closely to the net increase inintracellular calcium produced during the entire period of stim-ulation (30 min; Sheng et al., 1993). The total calcium–timeintegral, representing the net increase in intracellular calciumduring the period of calcium influx and recovery from stimulation,increased as a linear function of the duration of an individualstimulus burst of 1.8–9 sec duration (Fig. 2B).
Neural impulse activity and c-fos expressionc-fos is implicated in a wide range of nervous system processes,including the conversion of short-term stimuli into long-termchanges in neurons (Sheng and Greenberg, 1990; Morgan andCurran, 1991; Hughes and Dragunow, 1995), response to braininjury, sensory stimulation, activation of neurotransmitter recep-tors, stress, circadian rhythms, and long-term changes in synapticstrength (e.g., long-term potentiation) (Hughes and Dragunow,1995). Temporal features of action potential activity may berelevant in regulating certain functional response of c-fos activity.
Expression of c-fos differed in response to different patterns ofaction potential stimulation. The amount of c-fos mRNA in-creased as an exponential function of the stimulus frequency overthe range of 0.1–10 Hz, confirming previous research (Sheng etal., 1993). One action potential every 10 sec (0.1 Hz) was nearthreshold stimulation frequency for elevating c-fos expression.Expression increased from 145% of unstimulated values in re-sponse to 0.1 Hz stimulation to ;600% of control after stimula-tion for 30 min at frequencies of 3 Hz or higher (data not shown).
Previous work has shown that c-fos expression increases withincreasing duration of stimulation in DRG neurons (Sheng et al.,1993). However, natural firing patterns are modeled more closelyby pulse train stimulation than by constant frequency stimulation(Meister et al., 1991; Fitzgerald and Fulton, 1992). To investigateeffects of bursts of action potentials that produced similar changesin intracellular calcium, but which differed in the amount of timebetween bursts, we used bursts of 1.8 sec or longer (Fig. 2A). Toavoid saturating stimulus conditions, we delivered the number ofaction potentials that produced ;50% maximal c-fos expression(540 action potentials) in 30 min of constant frequency stimula-tion but grouped into four different stimulus patterns. These fourpulsed patterns consisted of repeated bursts of 1.8, 3.6, 5.4, and 9sec duration (at 10 Hz) separated by 1, 2, 3, and 5 min intervals,respectively (Fig. 3A).
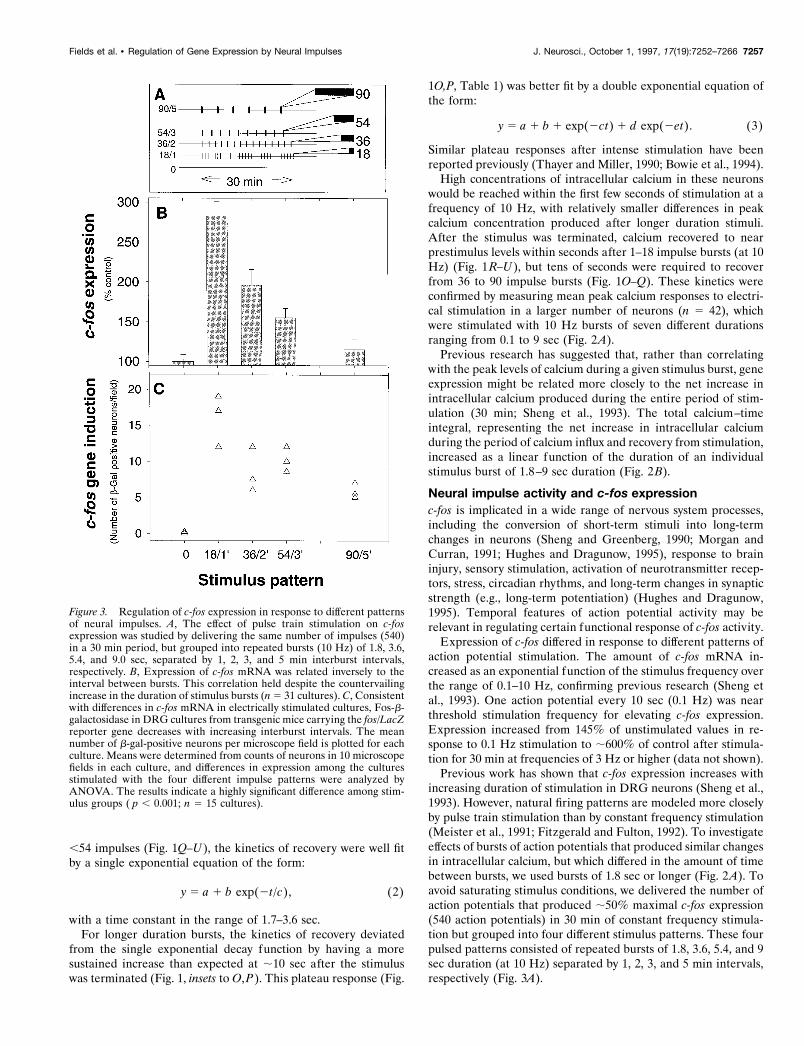
Figure 3. Regulation of c-fos expression in response to different patternsof neural impulses. A, The effect of pulse train stimulation on c-fosexpression was studied by delivering the same number of impulses (540)in a 30 min period, but grouped into repeated bursts (10 Hz) of 1.8, 3.6,5.4, and 9.0 sec, separated by 1, 2, 3, and 5 min interburst intervals,respectively. B, Expression of c-fos mRNA was related inversely to theinterval between bursts. This correlation held despite the countervailingincrease in the duration of stimulus bursts (n 5 31 cultures). C, Consistentwith differences in c-fos mRNA in electrically stimulated cultures, Fos-b-galactosidase in DRG cultures from transgenic mice carrying the fos/LacZreporter gene decreases with increasing interburst intervals. The meannumber of b-gal-positive neurons per microscope field is plotted for eachculture. Means were determined from counts of neurons in 10 microscopefields in each culture, and differences in expression among the culturesstimulated with the four different impulse patterns were analyzed byANOVA. The results indicate a highly significant difference among stim-ulus groups ( p , 0.001; n 5 15 cultures).
Fields et al. • Regulation of Gene Expression by Neural Impulses J. Neurosci., October 1, 1997, 17(19):7252–7266 7257
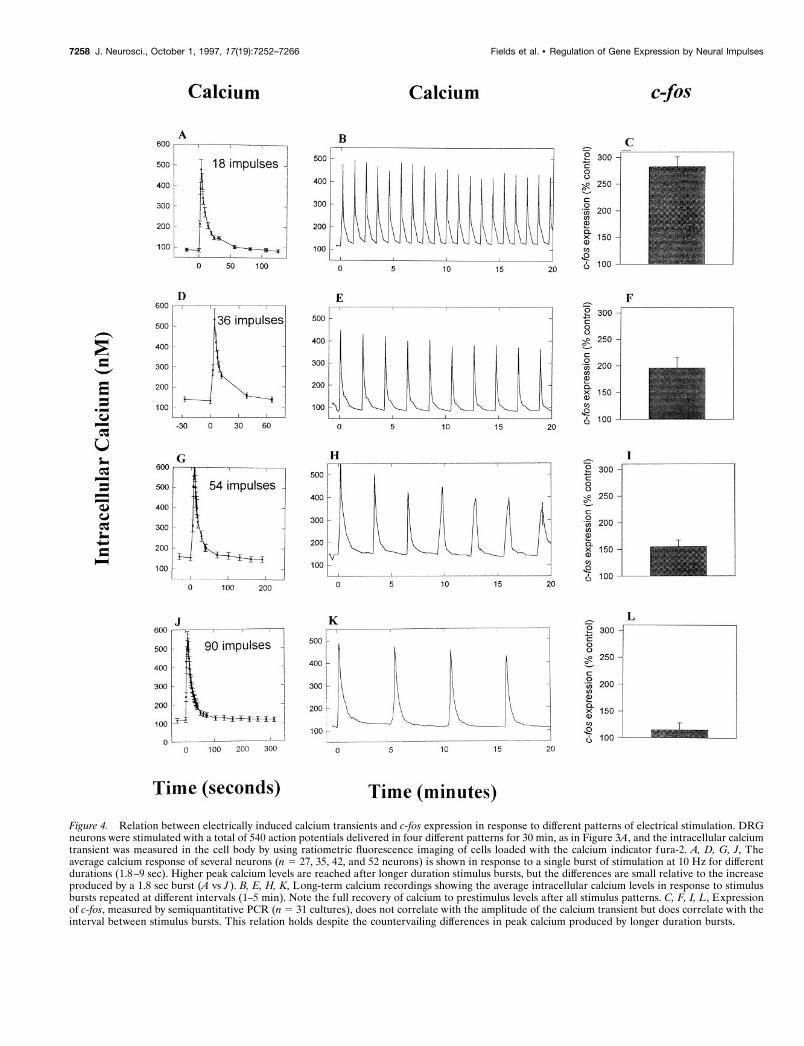
Figure 4. Relation between electrically induced calcium transients and c-fos expression in response to different patterns of electrical stimulation. DRGneurons were stimulated with a total of 540 action potentials delivered in four different patterns for 30 min, as in Figure 3A, and the intracellular calciumtransient was measured in the cell body by using ratiometric fluorescence imaging of cells loaded with the calcium indicator fura-2. A, D, G, J, Theaverage calcium response of several neurons (n 5 27, 35, 42, and 52 neurons) is shown in response to a single burst of stimulation at 10 Hz for differentdurations (1.8–9 sec). Higher peak calcium levels are reached after longer duration stimulus bursts, but the differences are small relative to the increaseproduced by a 1.8 sec burst (A vs J ). B, E, H, K, Long-term calcium recordings showing the average intracellular calcium levels in response to stimulusbursts repeated at different intervals (1–5 min). Note the full recovery of calcium to prestimulus levels after all stimulus patterns. C, F, I, L, Expressionof c-fos, measured by semiquantitative PCR (n 5 31 cultures), does not correlate with the amplitude of the calcium transient but does correlate with theinterval between stimulus bursts. This relation holds despite the countervailing differences in peak calcium produced by longer duration bursts.
7258 J. Neurosci., October 1, 1997, 17(19):7252–7266 Fields et al. • Regulation of Gene Expression by Neural Impulses
Levels of c-fos mRNA differed significantly after these differentpatterns of 540 action potentials (Fig. 3B). An inverse correlationwas evident between c-fos expression and the interval betweensuccessive bursts of action potentials. This correlation held de-spite countervailing differences in the duration of bursts. Maximalexpression was produced by short (1.8 sec) bursts (10 Hz) re-peated at 1 min intervals (18/1), but bursts repeated at 5 minintervals produced minimal increase in c-fos mRNA, although theindividual bursts were five times longer (9 sec). Shorter bursts ofstimulation repeated at 5 min intervals do not produce a para-doxical increase in c-fos expression (data not shown). Thus, theinterval between bursts of action potentials is a critical parameterin regulating c-fos mRNA levels. The same pattern of expressionin response to these different stimulus patterns was observed atthe protein level (Fig. 3C) in DRG neurons cultured from trans-genic mice containing the human fos/lacZ fusion gene (Schillinget al., 1991).
Calcium signaling and c-fos expressionThe concentration dynamics of intracellular Ca21 might encodedifferences in action potential firing pattern to produce the dif-ferences in c-fos expression seen after the various stimuli. Thiswas not the case for the set of pulsed stimuli tested in this study.Instead, c-fos expression correlated better with the temporaldynamics, i.e., expression declined with increasing intervals oftime between periods of calcium influx (Fig. 4). Peak calciumlevel, total calcium–time integral, and residual calcium producedby the various pulse trains of action potentials were not correlatedwith c-fos expression. For example, long duration bursts (9 sec)were not effective in stimulating c-fos expression when separated
by 5 min intervals (Fig. 4L) although the stimulus raised calciumto the highest level (735 nM) (Figs. 2A, 4J). Shorter stimulusbursts, e.g., 1.8 sec, were effective in activating c-fos gene expres-sion if repeated at more frequent intervals (Fig. 4C), althoughshort bursts raised calcium the least (485 nM) (Figs. 2A, 4A). It isclear that a sustained elevation in intracellular calcium is notnecessary for stimulating c-fos expression, because the kinetics ofrecovery are sufficiently rapid to restore calcium to near prestimu-lus levels well within the 1–5 min period separating the bursts(Fig. 4A,D,G,J). Differences in total calcium load to the neuron(calcium–time integral) were relatively minor (not statisticallysignificant; p 5 0.69) for the four stimulus patterns (Fig. 2C). Forexample, six bursts of 90 action potentials would produce 38.3 mM
calcium/min, and 30 bursts of 18 action potentials would produce35.9 mM calcium/min over the 30 min period of stimulation. Thus,this variable is not likely to have a controlling influence ondifferences in gene expression produced by the four differentstimulus patterns.
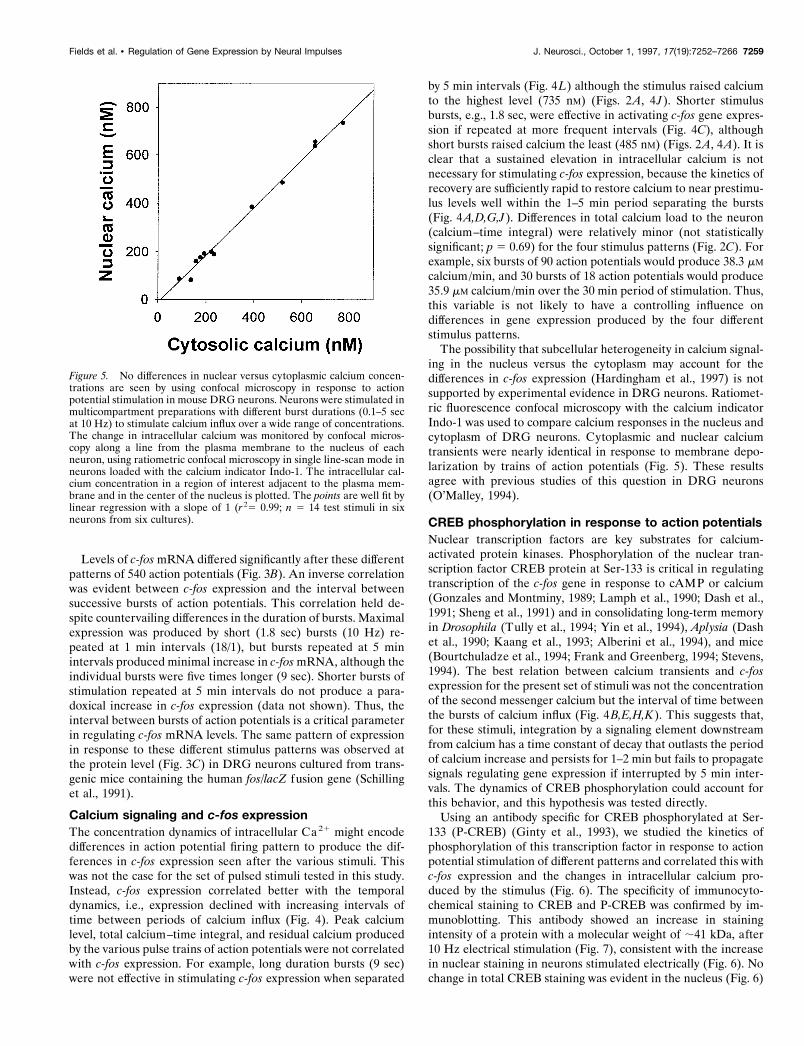
The possibility that subcellular heterogeneity in calcium signal-ing in the nucleus versus the cytoplasm may account for thedifferences in c-fos expression (Hardingham et al., 1997) is notsupported by experimental evidence in DRG neurons. Ratiomet-ric fluorescence confocal microscopy with the calcium indicatorIndo-1 was used to compare calcium responses in the nucleus andcytoplasm of DRG neurons. Cytoplasmic and nuclear calciumtransients were nearly identical in response to membrane depo-larization by trains of action potentials (Fig. 5). These resultsagree with previous studies of this question in DRG neurons(O’Malley, 1994).
CREB phosphorylation in response to action potentialsNuclear transcription factors are key substrates for calcium-activated protein kinases. Phosphorylation of the nuclear tran-scription factor CREB protein at Ser-133 is critical in regulatingtranscription of the c-fos gene in response to cAMP or calcium(Gonzales and Montminy, 1989; Lamph et al., 1990; Dash et al.,1991; Sheng et al., 1991) and in consolidating long-term memoryin Drosophila (Tully et al., 1994; Yin et al., 1994), Aplysia (Dashet al., 1990; Kaang et al., 1993; Alberini et al., 1994), and mice(Bourtchuladze et al., 1994; Frank and Greenberg, 1994; Stevens,1994). The best relation between calcium transients and c-fosexpression for the present set of stimuli was not the concentrationof the second messenger calcium but the interval of time betweenthe bursts of calcium influx (Fig. 4B,E,H,K). This suggests that,for these stimuli, integration by a signaling element downstreamfrom calcium has a time constant of decay that outlasts the periodof calcium increase and persists for 1–2 min but fails to propagatesignals regulating gene expression if interrupted by 5 min inter-vals. The dynamics of CREB phosphorylation could account forthis behavior, and this hypothesis was tested directly.
Using an antibody specific for CREB phosphorylated at Ser-133 (P-CREB) (Ginty et al., 1993), we studied the kinetics ofphosphorylation of this transcription factor in response to actionpotential stimulation of different patterns and correlated this withc-fos expression and the changes in intracellular calcium pro-duced by the stimulus (Fig. 6). The specificity of immunocyto-chemical staining to CREB and P-CREB was confirmed by im-munoblotting. This antibody showed an increase in stainingintensity of a protein with a molecular weight of ;41 kDa, after10 Hz electrical stimulation (Fig. 7), consistent with the increasein nuclear staining in neurons stimulated electrically (Fig. 6). Nochange in total CREB staining was evident in the nucleus (Fig. 6)
Figure 5. No differences in nuclear versus cytoplasmic calcium concen-trations are seen by using confocal microscopy in response to actionpotential stimulation in mouse DRG neurons. Neurons were stimulated inmulticompartment preparations with different burst durations (0.1–5 secat 10 Hz) to stimulate calcium influx over a wide range of concentrations.The change in intracellular calcium was monitored by confocal micros-copy along a line from the plasma membrane to the nucleus of eachneuron, using ratiometric confocal microscopy in single line-scan mode inneurons loaded with the calcium indicator Indo-1. The intracellular cal-cium concentration in a region of interest adjacent to the plasma mem-brane and in the center of the nucleus is plotted. The points are well fit bylinear regression with a slope of 1 (r 25 0.99; n 5 14 test stimuli in sixneurons from six cultures).
Fields et al. • Regulation of Gene Expression by Neural Impulses J. Neurosci., October 1, 1997, 17(19):7252–7266 7259
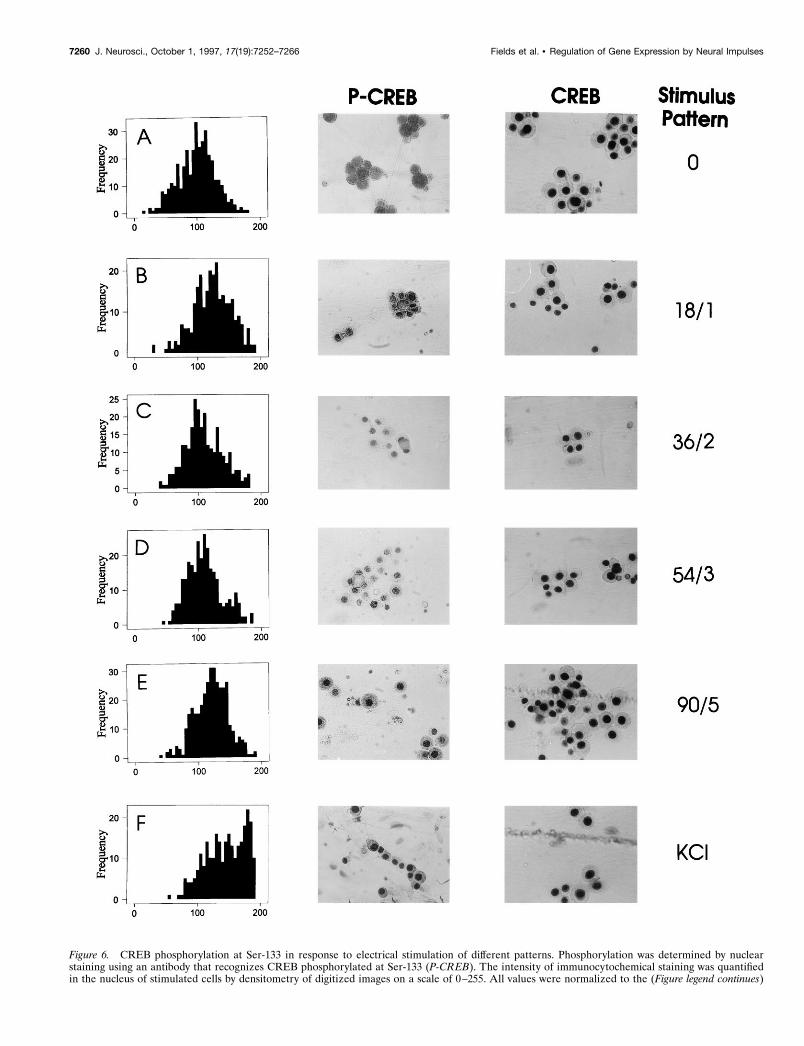
Figure 6. CREB phosphorylation at Ser-133 in response to electrical stimulation of different patterns. Phosphorylation was determined by nuclearstaining using an antibody that recognizes CREB phosphorylated at Ser-133 (P-CREB). The intensity of immunocytochemical staining was quantifiedin the nucleus of stimulated cells by densitometry of digitized images on a scale of 0–255. All values were normalized to the (Figure legend continues)
7260 J. Neurosci., October 1, 1997, 17(19):7252–7266 Fields et al. • Regulation of Gene Expression by Neural Impulses
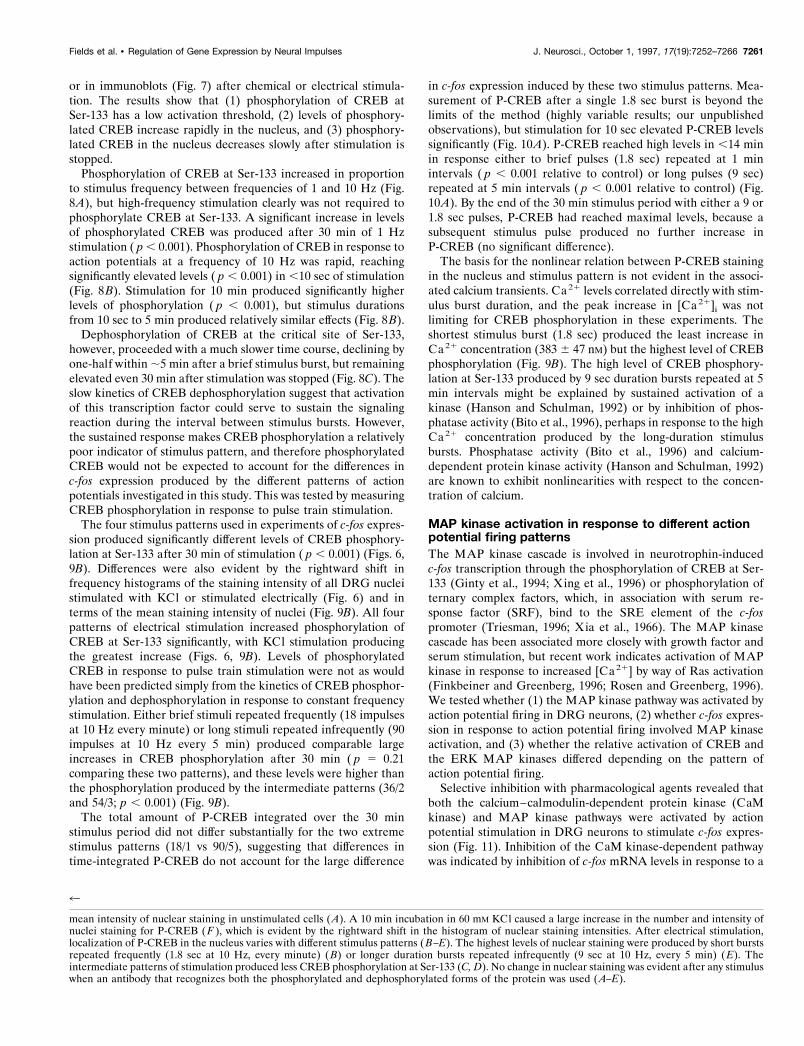
or in immunoblots (Fig. 7) after chemical or electrical stimula-tion. The results show that (1) phosphorylation of CREB atSer-133 has a low activation threshold, (2) levels of phosphory-lated CREB increase rapidly in the nucleus, and (3) phosphory-lated CREB in the nucleus decreases slowly after stimulation isstopped.
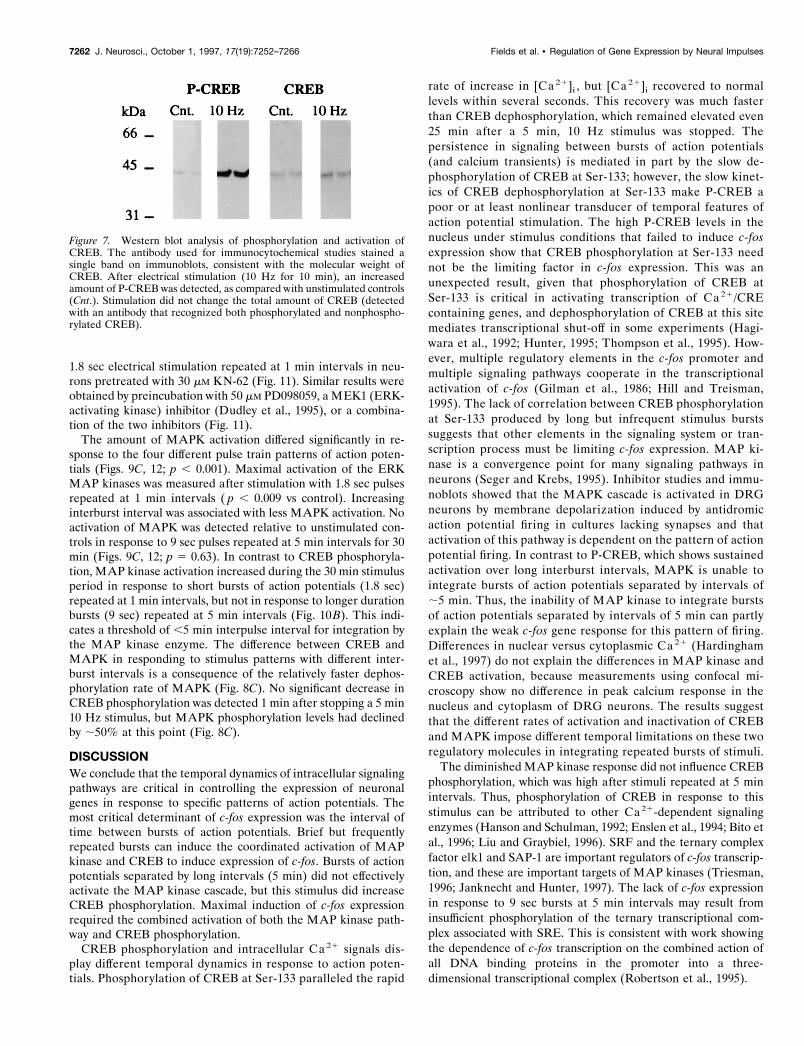
Phosphorylation of CREB at Ser-133 increased in proportionto stimulus frequency between frequencies of 1 and 10 Hz (Fig.8A), but high-frequency stimulation clearly was not required tophosphorylate CREB at Ser-133. A significant increase in levelsof phosphorylated CREB was produced after 30 min of 1 Hzstimulation ( p , 0.001). Phosphorylation of CREB in response toaction potentials at a frequency of 10 Hz was rapid, reachingsignificantly elevated levels ( p , 0.001) in ,10 sec of stimulation(Fig. 8B). Stimulation for 10 min produced significantly higherlevels of phosphorylation ( p , 0.001), but stimulus durationsfrom 10 sec to 5 min produced relatively similar effects (Fig. 8B).
Dephosphorylation of CREB at the critical site of Ser-133,however, proceeded with a much slower time course, declining byone-half within ;5 min after a brief stimulus burst, but remainingelevated even 30 min after stimulation was stopped (Fig. 8C). Theslow kinetics of CREB dephosphorylation suggest that activationof this transcription factor could serve to sustain the signalingreaction during the interval between stimulus bursts. However,the sustained response makes CREB phosphorylation a relativelypoor indicator of stimulus pattern, and therefore phosphorylatedCREB would not be expected to account for the differences inc-fos expression produced by the different patterns of actionpotentials investigated in this study. This was tested by measuringCREB phosphorylation in response to pulse train stimulation.
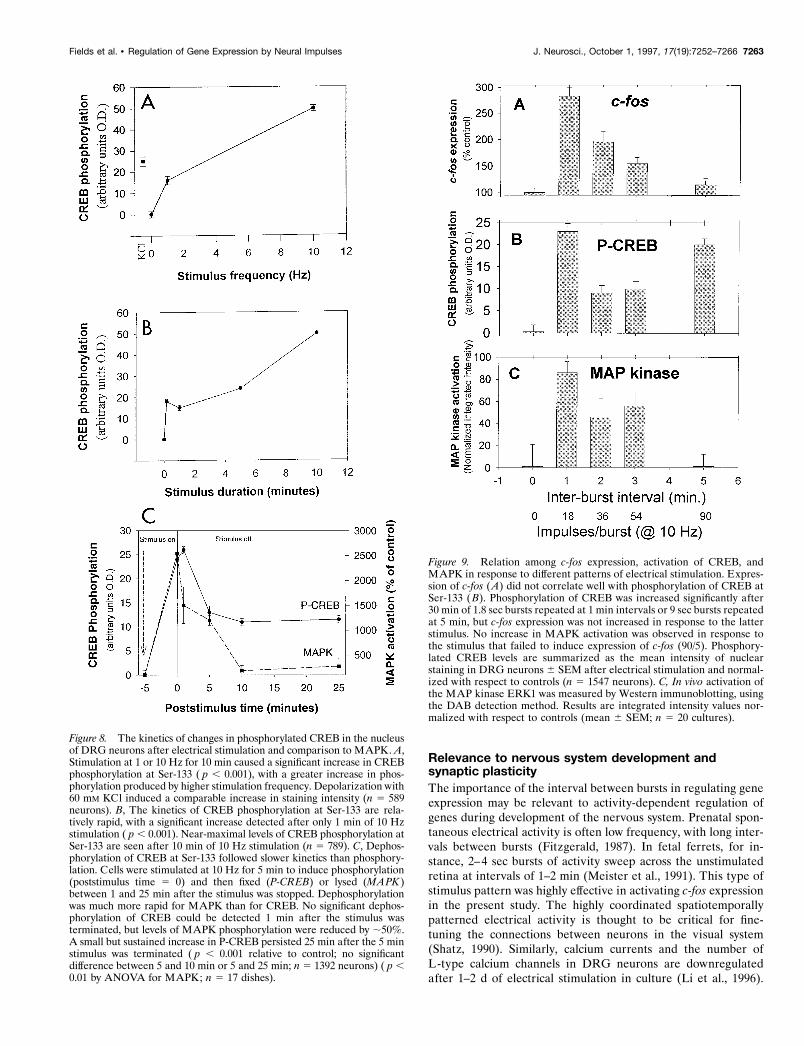
The four stimulus patterns used in experiments of c-fos expres-sion produced significantly different levels of CREB phosphory-lation at Ser-133 after 30 min of stimulation ( p , 0.001) (Figs. 6,9B). Differences were also evident by the rightward shift infrequency histograms of the staining intensity of all DRG nucleistimulated with KCl or stimulated electrically (Fig. 6) and interms of the mean staining intensity of nuclei (Fig. 9B). All fourpatterns of electrical stimulation increased phosphorylation ofCREB at Ser-133 significantly, with KCl stimulation producingthe greatest increase (Figs. 6, 9B). Levels of phosphorylatedCREB in response to pulse train stimulation were not as wouldhave been predicted simply from the kinetics of CREB phosphor-ylation and dephosphorylation in response to constant frequencystimulation. Either brief stimuli repeated frequently (18 impulsesat 10 Hz every minute) or long stimuli repeated infrequently (90impulses at 10 Hz every 5 min) produced comparable largeincreases in CREB phosphorylation after 30 min ( p 5 0.21comparing these two patterns), and these levels were higher thanthe phosphorylation produced by the intermediate patterns (36/2and 54/3; p , 0.001) (Fig. 9B).
The total amount of P-CREB integrated over the 30 minstimulus period did not differ substantially for the two extremestimulus patterns (18/1 vs 90/5), suggesting that differences intime-integrated P-CREB do not account for the large difference
in c-fos expression induced by these two stimulus patterns. Mea-surement of P-CREB after a single 1.8 sec burst is beyond thelimits of the method (highly variable results; our unpublishedobservations), but stimulation for 10 sec elevated P-CREB levelssignificantly (Fig. 10A). P-CREB reached high levels in ,14 minin response either to brief pulses (1.8 sec) repeated at 1 minintervals ( p , 0.001 relative to control) or long pulses (9 sec)repeated at 5 min intervals ( p , 0.001 relative to control) (Fig.10A). By the end of the 30 min stimulus period with either a 9 or1.8 sec pulses, P-CREB had reached maximal levels, because asubsequent stimulus pulse produced no further increase inP-CREB (no significant difference).
The basis for the nonlinear relation between P-CREB stainingin the nucleus and stimulus pattern is not evident in the associ-ated calcium transients. Ca21 levels correlated directly with stim-ulus burst duration, and the peak increase in [Ca 21]i was notlimiting for CREB phosphorylation in these experiments. Theshortest stimulus burst (1.8 sec) produced the least increase inCa21 concentration (383 6 47 nM) but the highest level of CREBphosphorylation (Fig. 9B). The high level of CREB phosphory-lation at Ser-133 produced by 9 sec duration bursts repeated at 5min intervals might be explained by sustained activation of akinase (Hanson and Schulman, 1992) or by inhibition of phos-phatase activity (Bito et al., 1996), perhaps in response to the highCa21 concentration produced by the long-duration stimulusbursts. Phosphatase activity (Bito et al., 1996) and calcium-dependent protein kinase activity (Hanson and Schulman, 1992)are known to exhibit nonlinearities with respect to the concen-tration of calcium.
MAP kinase activation in response to different actionpotential firing patternsThe MAP kinase cascade is involved in neurotrophin-inducedc-fos transcription through the phosphorylation of CREB at Ser-133 (Ginty et al., 1994; Xing et al., 1996) or phosphorylation ofternary complex factors, which, in association with serum re-sponse factor (SRF), bind to the SRE element of the c-fospromoter (Triesman, 1996; Xia et al., 1966). The MAP kinasecascade has been associated more closely with growth factor andserum stimulation, but recent work indicates activation of MAPkinase in response to increased [Ca 21] by way of Ras activation(Finkbeiner and Greenberg, 1996; Rosen and Greenberg, 1996).We tested whether (1) the MAP kinase pathway was activated byaction potential firing in DRG neurons, (2) whether c-fos expres-sion in response to action potential firing involved MAP kinaseactivation, and (3) whether the relative activation of CREB andthe ERK MAP kinases differed depending on the pattern ofaction potential firing.
Selective inhibition with pharmacological agents revealed thatboth the calcium–calmodulin-dependent protein kinase (CaMkinase) and MAP kinase pathways were activated by actionpotential stimulation in DRG neurons to stimulate c-fos expres-sion (Fig. 11). Inhibition of the CaM kinase-dependent pathwaywas indicated by inhibition of c-fos mRNA levels in response to a
4
mean intensity of nuclear staining in unstimulated cells (A). A 10 min incubation in 60 mM KCl caused a large increase in the number and intensity ofnuclei staining for P-CREB ( F ), which is evident by the rightward shift in the histogram of nuclear staining intensities. After electrical stimulation,localization of P-CREB in the nucleus varies with different stimulus patterns (B–E). The highest levels of nuclear staining were produced by short burstsrepeated frequently (1.8 sec at 10 Hz, every minute) (B) or longer duration bursts repeated infrequently (9 sec at 10 Hz, every 5 min) (E). Theintermediate patterns of stimulation produced less CREB phosphorylation at Ser-133 (C, D). No change in nuclear staining was evident after any stimuluswhen an antibody that recognizes both the phosphorylated and dephosphorylated forms of the protein was used (A–E).
Fields et al. • Regulation of Gene Expression by Neural Impulses J. Neurosci., October 1, 1997, 17(19):7252–7266 7261
1.8 sec electrical stimulation repeated at 1 min intervals in neu-rons pretreated with 30 mM KN-62 (Fig. 11). Similar results wereobtained by preincubation with 50 mM PD098059, a MEK1 (ERK-activating kinase) inhibitor (Dudley et al., 1995), or a combina-tion of the two inhibitors (Fig. 11).
The amount of MAPK activation differed significantly in re-sponse to the four different pulse train patterns of action poten-tials (Figs. 9C, 12; p , 0.001). Maximal activation of the ERKMAP kinases was measured after stimulation with 1.8 sec pulsesrepeated at 1 min intervals ( p , 0.009 vs control). Increasinginterburst interval was associated with less MAPK activation. Noactivation of MAPK was detected relative to unstimulated con-trols in response to 9 sec pulses repeated at 5 min intervals for 30min (Figs. 9C, 12; p 5 0.63). In contrast to CREB phosphoryla-tion, MAP kinase activation increased during the 30 min stimulusperiod in response to short bursts of action potentials (1.8 sec)repeated at 1 min intervals, but not in response to longer durationbursts (9 sec) repeated at 5 min intervals (Fig. 10B). This indi-cates a threshold of ,5 min interpulse interval for integration bythe MAP kinase enzyme. The difference between CREB andMAPK in responding to stimulus patterns with different inter-burst intervals is a consequence of the relatively faster dephos-phorylation rate of MAPK (Fig. 8C). No significant decrease inCREB phosphorylation was detected 1 min after stopping a 5 min10 Hz stimulus, but MAPK phosphorylation levels had declinedby ;50% at this point (Fig. 8C).
DISCUSSIONWe conclude that the temporal dynamics of intracellular signalingpathways are critical in controlling the expression of neuronalgenes in response to specific patterns of action potentials. Themost critical determinant of c-fos expression was the interval oftime between bursts of action potentials. Brief but frequentlyrepeated bursts can induce the coordinated activation of MAPkinase and CREB to induce expression of c-fos. Bursts of actionpotentials separated by long intervals (5 min) did not effectivelyactivate the MAP kinase cascade, but this stimulus did increaseCREB phosphorylation. Maximal induction of c-fos expressionrequired the combined activation of both the MAP kinase path-way and CREB phosphorylation.
CREB phosphorylation and intracellular Ca 21 signals dis-play different temporal dynamics in response to action poten-tials. Phosphorylation of CREB at Ser-133 paralleled the rapid
rate of increase in [Ca 21]i , but [Ca 21]i recovered to normallevels within several seconds. This recovery was much fasterthan CREB dephosphorylation, which remained elevated even25 min after a 5 min, 10 Hz stimulus was stopped. Thepersistence in signaling between bursts of action potentials(and calcium transients) is mediated in part by the slow de-phosphorylation of CREB at Ser-133; however, the slow kinet-ics of CREB dephosphorylation at Ser-133 make P-CREB apoor or at least nonlinear transducer of temporal features ofaction potential stimulation. The high P-CREB levels in thenucleus under stimulus conditions that failed to induce c-fosexpression show that CREB phosphorylation at Ser-133 neednot be the limiting factor in c-fos expression. This was anunexpected result, given that phosphorylation of CREB atSer-133 is critical in activating transcription of Ca 21/CREcontaining genes, and dephosphorylation of CREB at this sitemediates transcriptional shut-off in some experiments (Hagi-wara et al., 1992; Hunter, 1995; Thompson et al., 1995). How-ever, multiple regulatory elements in the c-fos promoter andmultiple signaling pathways cooperate in the transcriptionalactivation of c-fos (Gilman et al., 1986; Hill and Treisman,1995). The lack of correlation between CREB phosphorylationat Ser-133 produced by long but infrequent stimulus burstssuggests that other elements in the signaling system or tran-scription process must be limiting c-fos expression. MAP ki-nase is a convergence point for many signaling pathways inneurons (Seger and Krebs, 1995). Inhibitor studies and immu-noblots showed that the MAPK cascade is activated in DRGneurons by membrane depolarization induced by antidromicaction potential firing in cultures lacking synapses and thatactivation of this pathway is dependent on the pattern of actionpotential firing. In contrast to P-CREB, which shows sustainedactivation over long interburst intervals, MAPK is unable tointegrate bursts of action potentials separated by intervals of;5 min. Thus, the inability of MAP kinase to integrate burstsof action potentials separated by intervals of 5 min can partlyexplain the weak c-fos gene response for this pattern of firing.Differences in nuclear versus cytoplasmic Ca 21 (Hardinghamet al., 1997) do not explain the differences in MAP kinase andCREB activation, because measurements using confocal mi-croscopy show no difference in peak calcium response in thenucleus and cytoplasm of DRG neurons. The results suggestthat the different rates of activation and inactivation of CREBand MAPK impose different temporal limitations on these tworegulatory molecules in integrating repeated bursts of stimuli.
The diminished MAP kinase response did not influence CREBphosphorylation, which was high after stimuli repeated at 5 minintervals. Thus, phosphorylation of CREB in response to thisstimulus can be attributed to other Ca 21-dependent signalingenzymes (Hanson and Schulman, 1992; Enslen et al., 1994; Bito etal., 1996; Liu and Graybiel, 1996). SRF and the ternary complexfactor elk1 and SAP-1 are important regulators of c-fos transcrip-tion, and these are important targets of MAP kinases (Triesman,1996; Janknecht and Hunter, 1997). The lack of c-fos expressionin response to 9 sec bursts at 5 min intervals may result frominsufficient phosphorylation of the ternary transcriptional com-plex associated with SRE. This is consistent with work showingthe dependence of c-fos transcription on the combined action ofall DNA binding proteins in the promoter into a three-dimensional transcriptional complex (Robertson et al., 1995).
Figure 7. Western blot analysis of phosphorylation and activation ofCREB. The antibody used for immunocytochemical studies stained asingle band on immunoblots, consistent with the molecular weight ofCREB. After electrical stimulation (10 Hz for 10 min), an increasedamount of P-CREB was detected, as compared with unstimulated controls(Cnt.). Stimulation did not change the total amount of CREB (detectedwith an antibody that recognized both phosphorylated and nonphospho-rylated CREB).
7262 J. Neurosci., October 1, 1997, 17(19):7252–7266 Fields et al. • Regulation of Gene Expression by Neural Impulses
Relevance to nervous system development andsynaptic plasticityThe importance of the interval between bursts in regulating geneexpression may be relevant to activity-dependent regulation ofgenes during development of the nervous system. Prenatal spon-taneous electrical activity is often low frequency, with long inter-vals between bursts (Fitzgerald, 1987). In fetal ferrets, for in-stance, 2–4 sec bursts of activity sweep across the unstimulatedretina at intervals of 1–2 min (Meister et al., 1991). This type ofstimulus pattern was highly effective in activating c-fos expressionin the present study. The highly coordinated spatiotemporallypatterned electrical activity is thought to be critical for fine-tuning the connections between neurons in the visual system(Shatz, 1990). Similarly, calcium currents and the number ofL-type calcium channels in DRG neurons are downregulatedafter 1–2 d of electrical stimulation in culture (Li et al., 1996).
Figure 8. The kinetics of changes in phosphorylated CREB in the nucleusof DRG neurons after electrical stimulation and comparison to MAPK. A,Stimulation at 1 or 10 Hz for 10 min caused a significant increase in CREBphosphorylation at Ser-133 ( p , 0.001), with a greater increase in phos-phorylation produced by higher stimulation frequency. Depolarization with60 mM KCl induced a comparable increase in staining intensity (n 5 589neurons). B, The kinetics of CREB phosphorylation at Ser-133 are rela-tively rapid, with a significant increase detected after only 1 min of 10 Hzstimulation ( p , 0.001). Near-maximal levels of CREB phosphorylation atSer-133 are seen after 10 min of 10 Hz stimulation (n 5 789). C, Dephos-phorylation of CREB at Ser-133 followed slower kinetics than phosphory-lation. Cells were stimulated at 10 Hz for 5 min to induce phosphorylation(poststimulus time 5 0) and then fixed (P-CREB) or lysed (MAPK )between 1 and 25 min after the stimulus was stopped. Dephosphorylationwas much more rapid for MAPK than for CREB. No significant dephos-phorylation of CREB could be detected 1 min after the stimulus wasterminated, but levels of MAPK phosphorylation were reduced by ;50%.A small but sustained increase in P-CREB persisted 25 min after the 5 minstimulus was terminated ( p , 0.001 relative to control; no significantdifference between 5 and 10 min or 5 and 25 min; n 5 1392 neurons) ( p ,0.01 by ANOVA for MAPK; n 5 17 dishes).
Figure 9. Relation among c-fos expression, activation of CREB, andMAPK in response to different patterns of electrical stimulation. Expres-sion of c-fos (A) did not correlate well with phosphorylation of CREB atSer-133 (B). Phosphorylation of CREB was increased significantly after30 min of 1.8 sec bursts repeated at 1 min intervals or 9 sec bursts repeatedat 5 min, but c-fos expression was not increased in response to the latterstimulus. No increase in MAPK activation was observed in response tothe stimulus that failed to induce expression of c-fos (90/5). Phosphory-lated CREB levels are summarized as the mean intensity of nuclearstaining in DRG neurons 6 SEM after electrical stimulation and normal-ized with respect to controls (n 5 1547 neurons). C, In vivo activation ofthe MAP kinase ERK1 was measured by Western immunoblotting, usingthe DAB detection method. Results are integrated intensity values nor-malized with respect to controls (mean 6 SEM; n 5 20 cultures).
Fields et al. • Regulation of Gene Expression by Neural Impulses J. Neurosci., October 1, 1997, 17(19):7252–7266 7263
The efficacy of stimulation in reducing calcium currents variesinversely with the interval between bursts. In developing Xenopusspinal neurons, the frequency of spontaneous calcium transientscorrelates with discrete effects on development (Gu and Spitzer,1995). Low-frequency calcium transients regulate neurite out-growth, and high-frequency calcium transients regulate matura-tion of potassium channels. No relation was evident betweenthese developmental processes and the number of calcium tran-sients, peak calcium concentration, duration, or time integral ofthe calcium transient. Recent work on Drosophila shows thatmultiple training sessions with a rest interval between them
(spaced training) produces stronger, longer-lasting memory thanthe same number of training sessions with no rest interval(massed training) (Yin et al., 1995). Remarkably low frequenciesof stimuli, which would cause minimal changes in concentrationof intracellular signaling molecules, can be effective in regulatinggene expression in the nervous system. Expression of the T-typecalcium currents in DRG neurons can be decreased by stimulusfrequencies as low as 0.5 Hz. Expression of c-fos and the celladhesion molecule L1 genes is regulated by single action potentialstimulation delivered at 10 sec intervals, but not 1–3 sec intervals(Itoh et al., 1995).
These results may have relevance to activity-dependent synap-tic plasticity, but, in contrast to hippocampal neurons, there is noevidence that stimulus–transcription coupling in DRG neurons isrestricted to postsynaptic neurons or dependent on a specialized
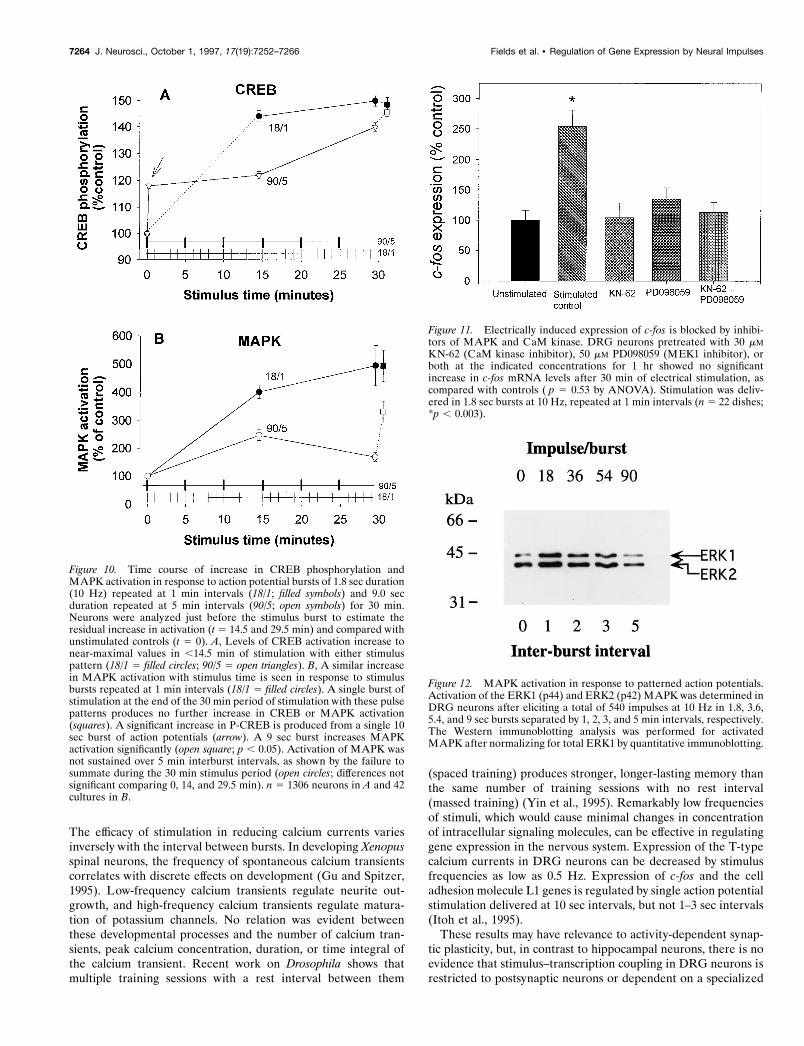
Figure 10. Time course of increase in CREB phosphorylation andMAPK activation in response to action potential bursts of 1.8 sec duration(10 Hz) repeated at 1 min intervals (18/1; filled symbols) and 9.0 secduration repeated at 5 min intervals (90/5; open symbols) for 30 min.Neurons were analyzed just before the stimulus burst to estimate theresidual increase in activation (t 5 14.5 and 29.5 min) and compared withunstimulated controls (t 5 0). A, Levels of CREB activation increase tonear-maximal values in ,14.5 min of stimulation with either stimuluspattern (18/1 5 filled circles; 90/5 5 open triangles). B, A similar increasein MAPK activation with stimulus time is seen in response to stimulusbursts repeated at 1 min intervals (18/1 5 filled circles). A single burst ofstimulation at the end of the 30 min period of stimulation with these pulsepatterns produces no further increase in CREB or MAPK activation(squares). A significant increase in P-CREB is produced from a single 10sec burst of action potentials (arrow). A 9 sec burst increases MAPKactivation significantly (open square; p , 0.05). Activation of MAPK wasnot sustained over 5 min interburst intervals, as shown by the failure tosummate during the 30 min stimulus period (open circles; differences notsignificant comparing 0, 14, and 29.5 min). n 5 1306 neurons in A and 42cultures in B.
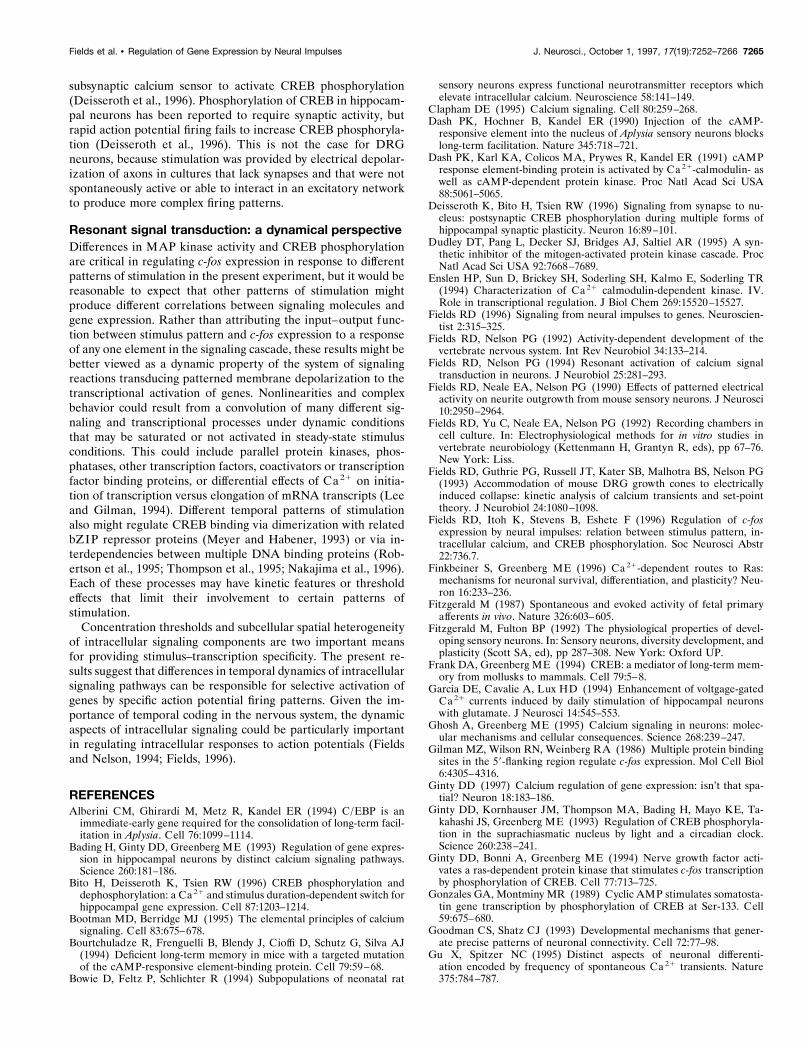
Figure 11. Electrically induced expression of c-fos is blocked by inhibi-tors of MAPK and CaM kinase. DRG neurons pretreated with 30 mMKN-62 (CaM kinase inhibitor), 50 mM PD098059 (MEK1 inhibitor), orboth at the indicated concentrations for 1 hr showed no significantincrease in c-fos mRNA levels after 30 min of electrical stimulation, ascompared with controls ( p 5 0.53 by ANOVA). Stimulation was deliv-ered in 1.8 sec bursts at 10 Hz, repeated at 1 min intervals (n 5 22 dishes;*p , 0.003).
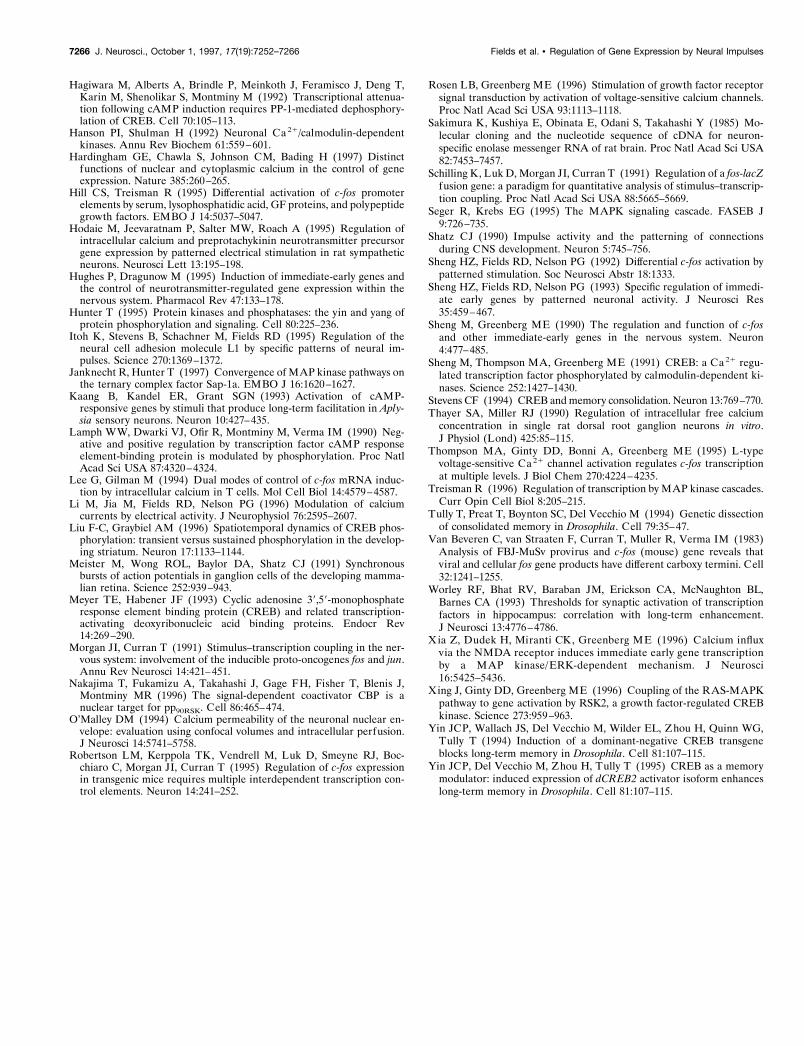
Figure 12. MAPK activation in response to patterned action potentials.Activation of the ERK1 (p44) and ERK2 (p42) MAPK was determined inDRG neurons after eliciting a total of 540 impulses at 10 Hz in 1.8, 3.6,5.4, and 9 sec bursts separated by 1, 2, 3, and 5 min intervals, respectively.The Western immunoblotting analysis was performed for activatedMAPK after normalizing for total ERK1 by quantitative immunoblotting.
7264 J. Neurosci., October 1, 1997, 17(19):7252–7266 Fields et al. • Regulation of Gene Expression by Neural Impulses
subsynaptic calcium sensor to activate CREB phosphorylation(Deisseroth et al., 1996). Phosphorylation of CREB in hippocam-pal neurons has been reported to require synaptic activity, butrapid action potential firing fails to increase CREB phosphoryla-tion (Deisseroth et al., 1996). This is not the case for DRGneurons, because stimulation was provided by electrical depolar-ization of axons in cultures that lack synapses and that were notspontaneously active or able to interact in an excitatory networkto produce more complex firing patterns.
Resonant signal transduction: a dynamical perspectiveDifferences in MAP kinase activity and CREB phosphorylationare critical in regulating c-fos expression in response to differentpatterns of stimulation in the present experiment, but it would bereasonable to expect that other patterns of stimulation mightproduce different correlations between signaling molecules andgene expression. Rather than attributing the input–output func-tion between stimulus pattern and c-fos expression to a responseof any one element in the signaling cascade, these results might bebetter viewed as a dynamic property of the system of signalingreactions transducing patterned membrane depolarization to thetranscriptional activation of genes. Nonlinearities and complexbehavior could result from a convolution of many different sig-naling and transcriptional processes under dynamic conditionsthat may be saturated or not activated in steady-state stimulusconditions. This could include parallel protein kinases, phos-phatases, other transcription factors, coactivators or transcriptionfactor binding proteins, or differential effects of Ca 21 on initia-tion of transcription versus elongation of mRNA transcripts (Leeand Gilman, 1994). Different temporal patterns of stimulationalso might regulate CREB binding via dimerization with relatedbZIP repressor proteins (Meyer and Habener, 1993) or via in-terdependencies between multiple DNA binding proteins (Rob-ertson et al., 1995; Thompson et al., 1995; Nakajima et al., 1996).Each of these processes may have kinetic features or thresholdeffects that limit their involvement to certain patterns ofstimulation.
Concentration thresholds and subcellular spatial heterogeneityof intracellular signaling components are two important meansfor providing stimulus–transcription specificity. The present re-sults suggest that differences in temporal dynamics of intracellularsignaling pathways can be responsible for selective activation ofgenes by specific action potential firing patterns. Given the im-portance of temporal coding in the nervous system, the dynamicaspects of intracellular signaling could be particularly importantin regulating intracellular responses to action potentials (Fieldsand Nelson, 1994; Fields, 1996).
REFERENCESAlberini CM, Ghirardi M, Metz R, Kandel ER (1994) C/EBP is an
immediate-early gene required for the consolidation of long-term facil-itation in Aplysia. Cell 76:1099–1114.
Bading H, Ginty DD, Greenberg ME (1993) Regulation of gene expres-sion in hippocampal neurons by distinct calcium signaling pathways.Science 260:181–186.
Bito H, Deisseroth K, Tsien RW (1996) CREB phosphorylation anddephosphorylation: a Ca 21 and stimulus duration-dependent switch forhippocampal gene expression. Cell 87:1203–1214.
Bootman MD, Berridge MJ (1995) The elemental principles of calciumsignaling. Cell 83:675–678.
Bourtchuladze R, Frenguelli B, Blendy J, Cioffi D, Schutz G, Silva AJ(1994) Deficient long-term memory in mice with a targeted mutationof the cAMP-responsive element-binding protein. Cell 79:59–68.
Bowie D, Feltz P, Schlichter R (1994) Subpopulations of neonatal rat
sensory neurons express functional neurotransmitter receptors whichelevate intracellular calcium. Neuroscience 58:141–149.
Clapham DE (1995) Calcium signaling. Cell 80:259–268.Dash PK, Hochner B, Kandel ER (1990) Injection of the cAMP-
responsive element into the nucleus of Aplysia sensory neurons blockslong-term facilitation. Nature 345:718–721.
Dash PK, Karl KA, Colicos MA, Prywes R, Kandel ER (1991) cAMPresponse element-binding protein is activated by Ca 21-calmodulin- aswell as cAMP-dependent protein kinase. Proc Natl Acad Sci USA88:5061–5065.
Deisseroth K, Bito H, Tsien RW (1996) Signaling from synapse to nu-cleus: postsynaptic CREB phosphorylation during multiple forms ofhippocampal synaptic plasticity. Neuron 16:89–101.
Dudley DT, Pang L, Decker SJ, Bridges AJ, Saltiel AR (1995) A syn-thetic inhibitor of the mitogen-activated protein kinase cascade. ProcNatl Acad Sci USA 92:7668–7689.
Enslen HP, Sun D, Brickey SH, Soderling SH, Kalmo E, Soderling TR(1994) Characterization of Ca 21 calmodulin-dependent kinase. IV.Role in transcriptional regulation. J Biol Chem 269:15520–15527.
Fields RD (1996) Signaling from neural impulses to genes. Neuroscien-tist 2:315–325.
Fields RD, Nelson PG (1992) Activity-dependent development of thevertebrate nervous system. Int Rev Neurobiol 34:133–214.
Fields RD, Nelson PG (1994) Resonant activation of calcium signaltransduction in neurons. J Neurobiol 25:281–293.
Fields RD, Neale EA, Nelson PG (1990) Effects of patterned electricalactivity on neurite outgrowth from mouse sensory neurons. J Neurosci10:2950–2964.
Fields RD, Yu C, Neale EA, Nelson PG (1992) Recording chambers incell culture. In: Electrophysiological methods for in vitro studies invertebrate neurobiology (Kettenmann H, Grantyn R, eds), pp 67–76.New York: Liss.
Fields RD, Guthrie PG, Russell JT, Kater SB, Malhotra BS, Nelson PG(1993) Accommodation of mouse DRG growth cones to electricallyinduced collapse: kinetic analysis of calcium transients and set-pointtheory. J Neurobiol 24:1080–1098.
Fields RD, Itoh K, Stevens B, Eshete F (1996) Regulation of c-fosexpression by neural impulses: relation between stimulus pattern, in-tracellular calcium, and CREB phosphorylation. Soc Neurosci Abstr22:736.7.
Finkbeiner S, Greenberg ME (1996) Ca 21-dependent routes to Ras:mechanisms for neuronal survival, differentiation, and plasticity? Neu-ron 16:233–236.
Fitzgerald M (1987) Spontaneous and evoked activity of fetal primaryafferents in vivo. Nature 326:603–605.
Fitzgerald M, Fulton BP (1992) The physiological properties of devel-oping sensory neurons. In: Sensory neurons, diversity development, andplasticity (Scott SA, ed), pp 287–308. New York: Oxford UP.
Frank DA, Greenberg ME (1994) CREB: a mediator of long-term mem-ory from mollusks to mammals. Cell 79:5–8.
Garcia DE, Cavalie A, Lux HD (1994) Enhancement of voltgage-gatedCa 21 currents induced by daily stimulation of hippocampal neuronswith glutamate. J Neurosci 14:545–553.
Ghosh A, Greenberg ME (1995) Calcium signaling in neurons: molec-ular mechanisms and cellular consequences. Science 268:239–247.
Gilman MZ, Wilson RN, Weinberg RA (1986) Multiple protein bindingsites in the 59-flanking region regulate c-fos expression. Mol Cell Biol6:4305–4316.
Ginty DD (1997) Calcium regulation of gene expression: isn’t that spa-tial? Neuron 18:183–186.
Ginty DD, Kornhauser JM, Thompson MA, Bading H, Mayo KE, Ta-kahashi JS, Greenberg ME (1993) Regulation of CREB phosphoryla-tion in the suprachiasmatic nucleus by light and a circadian clock.Science 260:238–241.
Ginty DD, Bonni A, Greenberg ME (1994) Nerve growth factor acti-vates a ras-dependent protein kinase that stimulates c-fos transcriptionby phosphorylation of CREB. Cell 77:713–725.
Gonzales GA, Montminy MR (1989) Cyclic AMP stimulates somatosta-tin gene transcription by phosphorylation of CREB at Ser-133. Cell59:675–680.
Goodman CS, Shatz CJ (1993) Developmental mechanisms that gener-ate precise patterns of neuronal connectivity. Cell 72:77–98.
Gu X, Spitzer NC (1995) Distinct aspects of neuronal differenti-ation encoded by frequency of spontaneous Ca 21 transients. Nature375:784–787.
Fields et al. • Regulation of Gene Expression by Neural Impulses J. Neurosci., October 1, 1997, 17(19):7252–7266 7265
Hagiwara M, Alberts A, Brindle P, Meinkoth J, Feramisco J, Deng T,Karin M, Shenolikar S, Montminy M (1992) Transcriptional attenua-tion following cAMP induction requires PP-1-mediated dephosphory-lation of CREB. Cell 70:105–113.
Hanson PI, Shulman H (1992) Neuronal Ca 21/calmodulin-dependentkinases. Annu Rev Biochem 61:559–601.
Hardingham GE, Chawla S, Johnson CM, Bading H (1997) Distinctfunctions of nuclear and cytoplasmic calcium in the control of geneexpression. Nature 385:260–265.
Hill CS, Treisman R (1995) Differential activation of c-fos promoterelements by serum, lysophosphatidic acid, GF proteins, and polypeptidegrowth factors. EMBO J 14:5037–5047.
Hodaie M, Jeevaratnam P, Salter MW, Roach A (1995) Regulation ofintracellular calcium and preprotachykinin neurotransmitter precursorgene expression by patterned electrical stimulation in rat sympatheticneurons. Neurosci Lett 13:195–198.
Hughes P, Dragunow M (1995) Induction of immediate-early genes andthe control of neurotransmitter-regulated gene expression within thenervous system. Pharmacol Rev 47:133–178.
Hunter T (1995) Protein kinases and phosphatases: the yin and yang ofprotein phosphorylation and signaling. Cell 80:225–236.
Itoh K, Stevens B, Schachner M, Fields RD (1995) Regulation of theneural cell adhesion molecule L1 by specific patterns of neural im-pulses. Science 270:1369–1372.
Janknecht R, Hunter T (1997) Convergence of MAP kinase pathways onthe ternary complex factor Sap-1a. EMBO J 16:1620–1627.
Kaang B, Kandel ER, Grant SGN (1993) Activation of cAMP-responsive genes by stimuli that produce long-term facilitation in Aply-sia sensory neurons. Neuron 10:427–435.
Lamph WW, Dwarki VJ, Ofir R, Montminy M, Verma IM (1990) Neg-ative and positive regulation by transcription factor cAMP responseelement-binding protein is modulated by phosphorylation. Proc NatlAcad Sci USA 87:4320–4324.
Lee G, Gilman M (1994) Dual modes of control of c-fos mRNA induc-tion by intracellular calcium in T cells. Mol Cell Biol 14:4579–4587.
Li M, Jia M, Fields RD, Nelson PG (1996) Modulation of calciumcurrents by electrical activity. J Neurophysiol 76:2595–2607.
Liu F-C, Graybiel AM (1996) Spatiotemporal dynamics of CREB phos-phorylation: transient versus sustained phosphorylation in the develop-ing striatum. Neuron 17:1133–1144.
Meister M, Wong ROL, Baylor DA, Shatz CJ (1991) Synchronousbursts of action potentials in ganglion cells of the developing mamma-lian retina. Science 252:939–943.
Meyer TE, Habener JF (1993) Cyclic adenosine 39,59-monophosphateresponse element binding protein (CREB) and related transcription-activating deoxyribonucleic acid binding proteins. Endocr Rev14:269–290.
Morgan JI, Curran T (1991) Stimulus–transcription coupling in the ner-vous system: involvement of the inducible proto-oncogenes fos and jun.Annu Rev Neurosci 14:421–451.
Nakajima T, Fukamizu A, Takahashi J, Gage FH, Fisher T, Blenis J,Montminy MR (1996) The signal-dependent coactivator CBP is anuclear target for pp90RSK. Cell 86:465–474.
O’Malley DM (1994) Calcium permeability of the neuronal nuclear en-velope: evaluation using confocal volumes and intracellular perfusion.J Neurosci 14:5741–5758.
Robertson LM, Kerppola TK, Vendrell M, Luk D, Smeyne RJ, Boc-chiaro C, Morgan JI, Curran T (1995) Regulation of c-fos expressionin transgenic mice requires multiple interdependent transcription con-trol elements. Neuron 14:241–252.
Rosen LB, Greenberg ME (1996) Stimulation of growth factor receptorsignal transduction by activation of voltage-sensitive calcium channels.Proc Natl Acad Sci USA 93:1113–1118.
Sakimura K, Kushiya E, Obinata E, Odani S, Takahashi Y (1985) Mo-lecular cloning and the nucleotide sequence of cDNA for neuron-specific enolase messenger RNA of rat brain. Proc Natl Acad Sci USA82:7453–7457.
Schilling K, Luk D, Morgan JI, Curran T (1991) Regulation of a fos-lacZfusion gene: a paradigm for quantitative analysis of stimulus–transcrip-tion coupling. Proc Natl Acad Sci USA 88:5665–5669.
Seger R, Krebs EG (1995) The MAPK signaling cascade. FASEB J9:726–735.
Shatz CJ (1990) Impulse activity and the patterning of connectionsduring CNS development. Neuron 5:745–756.
Sheng HZ, Fields RD, Nelson PG (1992) Differential c-fos activation bypatterned stimulation. Soc Neurosci Abstr 18:1333.
Sheng HZ, Fields RD, Nelson PG (1993) Specific regulation of immedi-ate early genes by patterned neuronal activity. J Neurosci Res35:459–467.
Sheng M, Greenberg ME (1990) The regulation and function of c-fosand other immediate-early genes in the nervous system. Neuron4:477–485.
Sheng M, Thompson MA, Greenberg ME (1991) CREB: a Ca 21 regu-lated transcription factor phosphorylated by calmodulin-dependent ki-nases. Science 252:1427–1430.
Stevens CF (1994) CREB and memory consolidation. Neuron 13:769–770.Thayer SA, Miller RJ (1990) Regulation of intracellular free calcium
concentration in single rat dorsal root ganglion neurons in vitro.J Physiol (Lond) 425:85–115.
Thompson MA, Ginty DD, Bonni A, Greenberg ME (1995) L-typevoltage-sensitive Ca 21 channel activation regulates c-fos transcriptionat multiple levels. J Biol Chem 270:4224–4235.
Treisman R (1996) Regulation of transcription by MAP kinase cascades.Curr Opin Cell Biol 8:205–215.
Tully T, Preat T, Boynton SC, Del Vecchio M (1994) Genetic dissectionof consolidated memory in Drosophila. Cell 79:35–47.
Van Beveren C, van Straaten F, Curran T, Muller R, Verma IM (1983)Analysis of FBJ-MuSv provirus and c-fos (mouse) gene reveals thatviral and cellular fos gene products have different carboxy termini. Cell32:1241–1255.
Worley RF, Bhat RV, Baraban JM, Erickson CA, McNaughton BL,Barnes CA (1993) Thresholds for synaptic activation of transcriptionfactors in hippocampus: correlation with long-term enhancement.J Neurosci 13:4776–4786.
Xia Z, Dudek H, Miranti CK, Greenberg ME (1996) Calcium influxvia the NMDA receptor induces immediate early gene transcriptionby a MAP kinase/ERK-dependent mechanism. J Neurosci16:5425–5436.
Xing J, Ginty DD, Greenberg ME (1996) Coupling of the RAS-MAPKpathway to gene activation by RSK2, a growth factor-regulated CREBkinase. Science 273:959–963.
Yin JCP, Wallach JS, Del Vecchio M, Wilder EL, Zhou H, Quinn WG,Tully T (1994) Induction of a dominant-negative CREB transgeneblocks long-term memory in Drosophila. Cell 81:107–115.
Yin JCP, Del Vecchio M, Zhou H, Tully T (1995) CREB as a memorymodulator: induced expression of dCREB2 activator isoform enhanceslong-term memory in Drosophila. Cell 81:107–115.
7266 J. Neurosci., October 1, 1997, 17(19):7252–7266 Fields et al. • Regulation of Gene Expression by Neural Impulses