
Monitoring Suspended Particle Matter Using GOCI Satellite ...
Geol. Bull. Univ. Peshawar, 1988, Vol. 21, pp. 105-116
SYED SHAFIQUR REHMAN* AND C.E. VINCFNI'
School of Environmental Sciences, University of East Anglia, Norwich, NR4 7TJ, U-K,
ABSTRACT
An Acoustic Backscatter Meter of 2.7 MHz frequency and a working range of 64 crn has been used for measuring profiles of suspended sediments in the eastern Irish Sea. The ABM was running in burst mode, pinging at 4 Hz with a bwst length of 160 seconds and a burst interval of 60 minutes. Data from the first two field deployments, each lasting up to 29 days, is presented here.
The data suggests that most of the suspended load was fine silt/cluy sized material showing strong modulation at the semi-diurnal and spring-map tidal periods. Throughout the tidal cycle the concentrations remained very low except during flood currents of the spring tide when they reach up to 150 mgll. A mild storm was also recorded during the first deployment which resdted in high sw- pended load concentration rising up to about 50 ern above he seabed. Marked difference was also noticed between the suspended bad concentration before and after the storm, suggesting that fine material had been advected out of the area by the storm. This is considered important in the dispersion of pollutants in shnllow seas.
INTRODUCTION
The Irish Sea is a semi-landlocked body of thc Atlantic Ocean between Great Britain and Ireland. It is about 330 km long and 185 km wide with a total. area of about 47, Water depth on southern and wcstern side is 100-1 20 m, while on the eastern side the deplh is lcss than 50 m (Bowdcn, 1980).
Owing to a continuous discharge of low level effluent nuclear waste from h e SeUalield rcproccssing plant since 1952, thc Irish Sca has become the most radioactively polluted sea in the world. These effluents are disposcd in the northeastern Irish Sea hrough a 2.5 km long twin pipclinc in 20 m dcep water. The sourcc of nuclear waste is pond water, which flows continu- ously and where spent fucl elcmcnts arc storcd bcfore reprocessing, and sea tanks which are discharged twice a day and contain wastc arising from the reprocessing (Kershaw et al., 1986; Hain, 1986).
" On study leave from Department of Geology, University of Peshawur, Peshawur, Pakistan

Thcrc me two components of this discharge, the soluble water-borne radio nuclides of lWJICs and wSr and h e insoluble sediment-bound nucI ides 1 ike lo6Ru, ' y e , B8. 239. =Q ='Pu and
w d , 1984)- Thc soluble component of the activity is immediately diluted and ay from the ourfall but it stays in solution and ciher moves with currents or becomes
in h e interstitial water of the substrate. The insoluble components, on the other hand, the surface of fine sediments and are then ttansported and dispersed. Some of
les fom colloids which descend to h e seafloor and are bwried in the course of time. The importance of sediments in rapid and effective remod of pollutants has been obscrvcd by Hethcri n (19761, who showed that about 95% of the total activity discharged into the scawatcr is through the scdimcnts phase immediately. It has also been observed that the seakd in n tern Irish Sca is being bioturbated to a depth of about 1 m (Kershaw et al., 1983; Sills and Edge, 1987) which eventualIy renders the bed more easily erodible than by currents alone.
Over the period of nearly four decades, these pollutants have concentrated in the Irish Sea to such an extent rhar they are posing a serious threat to the environment of the region in gcncral and to marine and human life in particular. One direct and major h d t h hazard to human life arising from his waste disposal is the consumption of diseased/contaminatcd fish and orher sea f d obtained in large quantities from the Irish Sea. Whereas, the other cause of concern is h c onshore transport of insolublc radio nuclides which adhere to fine sediments and arc deposited on the bcachcs around the sca. These polluted particles, if and when, blown inland by strong onshore winds could prove potcntidly dangerous for coastal population and may muse scrious illnesses.
To andyse the problem, a series of cxpcrimcnts was jointly undertaken by the Fisheries Dircctontc of the British Ministry of Agriculture, Fishcries and Food (h4AFF) and the Univer- sity oI'l3st Angba, Norwich. It was dccidcd to study the circulation pattern of the eastern Irish Sca through tides, wavcs and storms and also to mcasure the subsequent sediment tmnsport using underwater acoustic technique. The objective was to develop the technique of acoustic measurement of suspended sedimenLq, and also to explain why the pollutant have not becn removcd from the vicinity of the out fall.
For this purpose the MAFF laboratories dcsigncd a large mctaIlic tetrapod (about 2 m high) which could be Iowerecf to the sca bed and pulled back by a metallic rope. This bottom- m o u n t - autonomous systcm is capable of measuring oceanographic parameters close to the sea bed in continental shelf environments (Fig. 1). The instrurncnts attached to the tctrapod included an Acoustic Backscatter Mcter (ABM), an optical transmissomcter, a vertical array of five electromagnetic current meters, an altimeter (to fix the height above the sea bed), a ther- mistor, a pressure sensor, compass and a tilt mcter (for orientation of the tetrapod) and a battery for the power supply 10 the% instrurncnts. Two Seadata loggers were used to record the data, one for the ABM and the second for other sensors. The loggers and the battery packs were mounted on a platform 2 m above the base of the tetrapod.
ACOUSTICS
The basic theory involved in acoustic measurement of suspended particles in water column is that a pulse of sound is transmitted underwater from a transducer whic
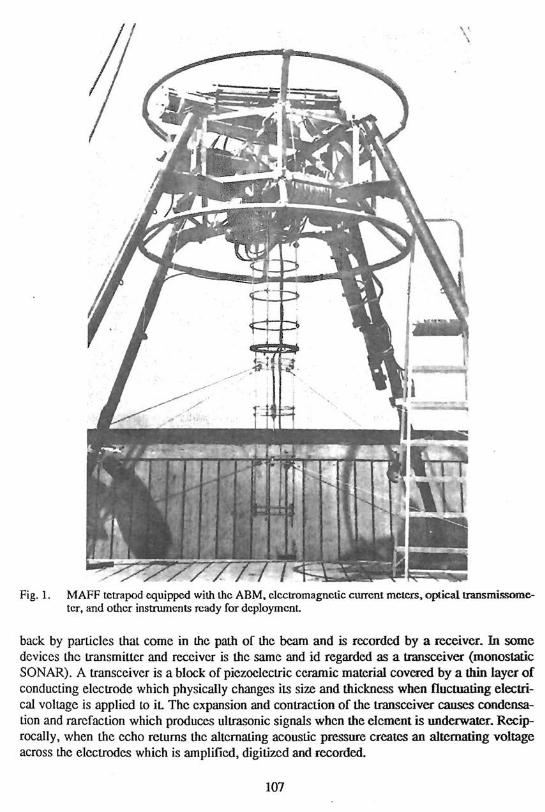
Fig. I. MAFF tctrapod equipped with thc ARM. elccrromagnctic currenl meters, optical transmissome- ter, and other instruments ready for dcploymcnt.
back by particles that come in h e path of Chc b r n and is recorded by a receiver, In some devices thc transmitter and receiver is the same and id regarded as a transceiver (monostatic SONAR). A transceiver is a block of piezoclcctric ceramic material covercd by a thin layer of conducting electrode which physically changes its size and thickness when flucmring electri- cal voltage is applicd to i t The expansion and contraction of the transceiver causes condensa- tion and rarefaction which produces ultrasonic signals when the element is undenvatcr. Recip rocally, when the echo returns the alternating acoustic pressure cream an alternating voltage across the elcctrodcs which is amplified, digitized and recorded.

The device uscd for this purpose is calIed the Acoustic Backscatter Mctcr (ABM) which has two main components namely, the Transceiver Unit and Data Acquisition Unit. Thc fonncr comprises of a prcssure container, A 2.7 MHz transccivcr with 12 mm diameter, analog-to- digital (AD) converter, a small 8-bit computer, an oscillator, an intcrnal clock and a 12 volt battery to supply power to these itcms, The data acquisition unit contains a cassette rccordcr, 140 m long tape and batteries, all houscd in a pressure case which is connected by a cable to the other unit. The ABM has a working range of 64 cm, thercforc, it is deploycd vertical1 y looking down, with its transceiver not more than 64 cm above the scabed.
Thc system is dcsigned to send a burst of high-frequcncy sound signals fusing 2.7 MXlz frcqucncy) at a rate of 4 Hz (4 pings per sccond) for 160 seconds, at a burst interval of 60 minutcs. At the time of measurement, an clcctric pulse of 10 ms duration is generated and applied to the transceiver which converts it into ultrasound and radiates it into the watcr column in a narrow bwn.
Thc backscattered pressure (PJ from an aggrcgau: of particlcs is received by the s'mc transceiver and convertcd into electrical signal which is amplified and eventually digitized by thc A/D converter. The output is rangegated cvcry 12.5 ms to produce a complete profile of 64 digitizd Pb values from succcssive range cells of about 1 cm height. One such profilc is recorded for every ping emitted during a burst and is placed in thc burfcr mcmory. Due to a limited recording capacity of the logger, on-board processing talics place prior to recording and thus 8 profiles are averaged temporally and adjaccnt pairs of two 1 cm rangc-cells vertically to produce a single profile with 2 crn resolution cvcry 2 seconds.
The acoustic measurement of suspcndcd particlcs in watcr is dependent upon the char- acteristics of the Sonar system namcly, intcnsity of the incidcnt signal, range of the ABM, attenuation of bcam due to absorption and scatlcring, and the sizc, shape and dcnsity of the target rnatcrial. These parameters arc combincd mathematically in the Sonar equation and expressed in decibles (Lynch, 1985);
whcre S + NL = total output from the dcvicc including signal plus the noise level (gcncrated by the instrument itself). SL = source levcl i.c., the intcnsity of thc incident signal, while 2TL = two-way transmission loss of the bcam by spreading and attenuation. TS = target strength (size and density of the scatterer) and DI = directivity indcx which includcs bcam pattern and shape of thc transducer.
Prior to its first deployment in the Irish Sea the ABM was calibrated using a rccircu- lating tank of the type described by Vinccnt et al. (1986) against 100 mg/l of 125 mm fine sand. The choice of sediment sizc uscd for calibration was based on grab samplcs taken during an earlier cruise and the problem of bcarn attenuation by suspended material was ignored as the concentration was quite low. Bascd on the results of first calibration excrcisc, following equa- tion was derived to convert thc digilal value of Pb into suspcndcd scdimcnt concentration in milligrams per litrc:
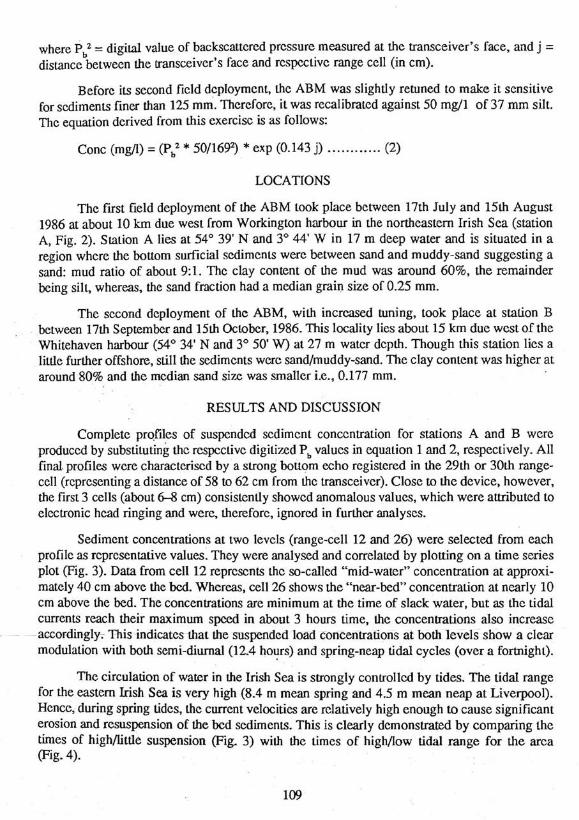
where P,2 = digilal value of backscattcred pressure measured at the transceiver's face, and j = distance between the transceiver's face and rcspcctivc range cell (in cm).
Before its second field deployment, thc ABM was slightly retuned to make it sensitive for sediments finer than 125 mm. Therefore, it was recalibrated against 50 mg/l of 37 rnm silt. Thc equation derived from this exercise is as follows:
Conc (mg) = (PC * 50/16g2) * exp (0.143 j) ............ (2)
LOCATIONS
The first field deployment of the ABM took place between 17th July and 15th August 1986 at about 10 km due west from Workington harbour in the northeastern Irish Sca (station A, Fig. 2). Station A lies at 54" 39' N and 3" 44' W in 17 m deep water and is situated in a region whcre the bottom surficial sediments were between sand and muddy-sand suggcsting a sand: mud ratio of about 9:l. Thc clay content of the mud was around 60%, the remainder being silt, whereas, the sand fraction had a median grain size of 0.25 mm.
The sccond deployment of the ABM, with increased tuning, took place at station B between 17th September and 15th October, 1986. This locality lies about 15 km due west of the Whitehaven harbour (54" 34' N and 3" 50' W) at 27 m water dcpth. Though this station lies a little further offshore, still the sedimcnts were sandfmuddy-sand. The clay content was higher at around 80% and the median sand size was smaller i.e., 0.177 mm.
RESULTS AND DISCUSSION
Complete profiles of suspended scdimcnt conccntration for stations A and B were produccd by substituting thc respcctivc digitized P, values in equation 1 and 2, respectively. All final. profiles wcre characteriscd by a strong bottom echo registered in the 29th or 30th range- ccll (rcprcsenting a distance of 58 to 62 cm from thc transceiver). Close to the device, however, the first 3 cells (about 6-8 cm) consistently showcd anomalous values, which were attributed to electronic had ringing and were, therefore, ignored in further analyses.
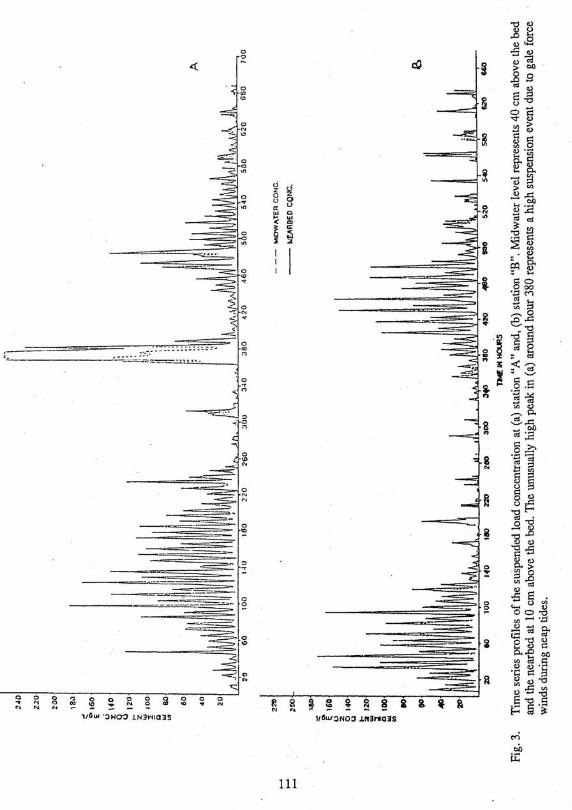
Sediment concentrations at two levcls (range-cell 12 and 26) were selected from each profile as representative values. They wcre analysed and correlated by plotting on a time series plot (Fig. 3). Data from cell 12 reprcscnts thc so-called "mid-water" concentration at approxi- mately 40 cm above the bcd. Whereas, cell 26 shows the "near-bed concentration at nearly 10 crn above the bed. The concentrations are minimum at the time of slack water, but as the tidal currents reach their maximum speed in about 3 hours time, the concentrations also increase ~ord i r@g~; R i s i n b i w c s h t the suspende&load conceniahons at %th-levels show a clear modulation with both semi-diurnal (12.4 hours) and spring-neap tidal cycles (over a fortnight).
The circulation of water in the Irish Sea is strongly controlled by tides. The tidal range for the eastern Irish Sea is very high (8.4 m mean spring and 4.5 m mean neap at Liverpool). Hence, during spring tides, the current velocities are relatively high enough to cause significant erosion and resuspension of the bed sediments. This is clearly dcrnonstrated by comparing the times of highllittle suspension (Fig. 3) with the times of highllow tidal range for h e area (Fig. 4).
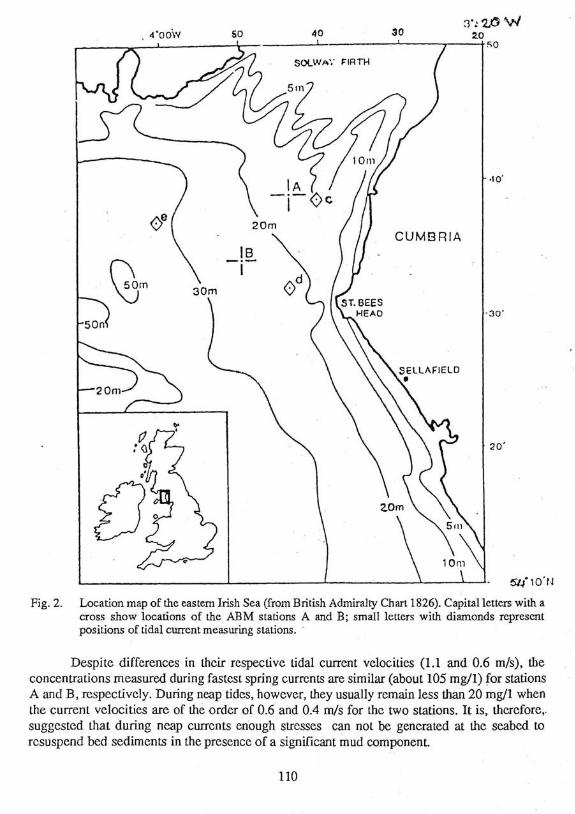
Fig. 2. Location map of the eastern Irish Sea (from British Admiralty Chart 1826). Capital letters with a cross show locations of the ARM stations A and B; small letters with diamonds represent posi~ions of tidal current measuring stations.
Despite differences in thcir respective tidal current velocities (1.1 and 0.6 m/s), the concentrations measured during fastest spring currents are similar (about 105 mg/l) for stations A and B, respectively. During neap tides, howevcr, they usually remain less than 20 mg/l when the current velocities are of the order of 0.6 and 0.4 m/s for the two stations. It is, therefore,. suggested that during neap cwrcnts enough stresses can not be generated at the seabed to resuspend bed sediments in the presencc of a significant mud component.
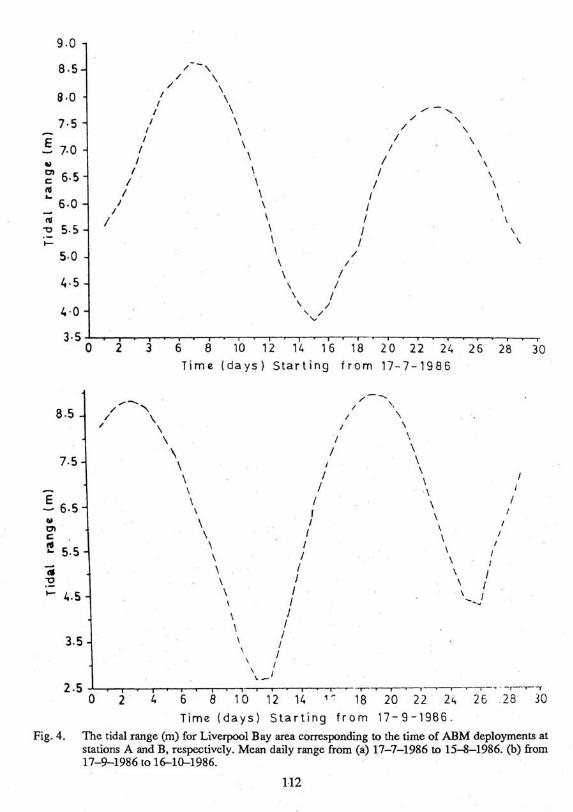
Time ( d a y s ) Start ing f r o m 17-7-1986
Time ( d a y s ) Starting f r o m 1 7 - 9 - 1 9 8 6 Fig. 4. The tidal range (rn) for Liverpool Bay area corresponding to the time of ABM deployments at
stations A and B, respectively. Mean daily range from (a) 17-7-1986 to 15-8-1986. (b) firom 17-9-1986 to 16-10-1986.
Thc time series plot of station A (Fig. 3) also shows an anomaly where and event of very high suspension was recorded from 360-400 hours after h e initial deployment, which falls in the neap tide pcriod. Inspections of the meteorological charts of the region revealed that around thc beginning of August, 1986 a mild cyclone was tracking across the northern Britain and bringing winds of 12-15 m/s to the Irish Sea. Hence on 2nd August, these winds have been slowing across the Irish Sea for more than 12 hours over a fetch of nearly 300 km. Significant wave height of 2 m and wave period of 6 seconds are expected from such fetch-limited winds (Cartcr, 1982). The effcct of such waves on the seabed, in 17 m of water, is wave orbital currents of about 10 cm/s. Whereas, shear strcss on the bed, due to a combined effect of currcnts and waves, can bc considerable (Grant & Madscn, 1979). Thus the concentrations became very high during that pcriod which would otherwise have bcen very low.
During the storm it is clcar that the amount of sediment in suspension increases consid- erably and that the coarscr fraction of the bcd also starts to become mobile. In addition to the mainly oscillatory movcment by tidal currcnts (which give little net transport), during storms the wind-driven currcnts also play an important role as these currents are often not oscillatory in nature. This combination of high suspension and wind-driven circulation suggests an impor- tant role for storms even in regions where tidal currents are strong.
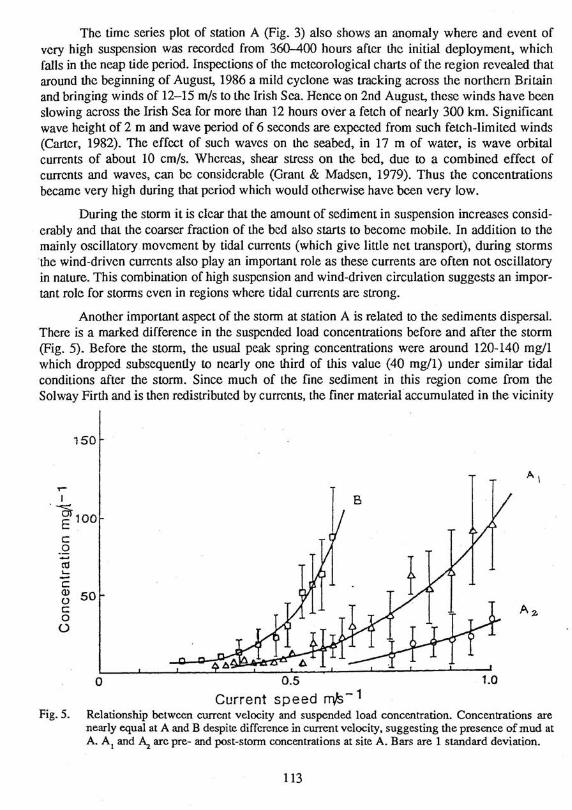
Anothcr important aspect of the storm at station A is related to the sediments dispersal. Thcre is a marked dirference in the suspcnded load concentrations before and after the storm (Fig. 5). Before the storm, the usual peak spring concentrations were around 120-140 mEJl which droppcd subsequently to nearly one third of this value (40 mg/l) under similar tidal conditions after the storm. Since much of the fine sediment in this region come from the Solway Firth and is then redistributed by currcnts, the finer material accumulated in the vicinity
Current speed d-' Fig. 5. Relationship between current velocity and suspended load concentration. Concentrations are
nearly equal at A and B despite difference in current velocity, suggesting the presence of mud at A. A, and 4 arc pre- and post-storm concentrations at site A. Bars are 1 standard deviation.
of station A during the relatively quiscent period was advccted away during the storm. Hence the difference in the pre- and post-storm conditions reflcct also upon the changes in the availa- bility of sediment in the arca.
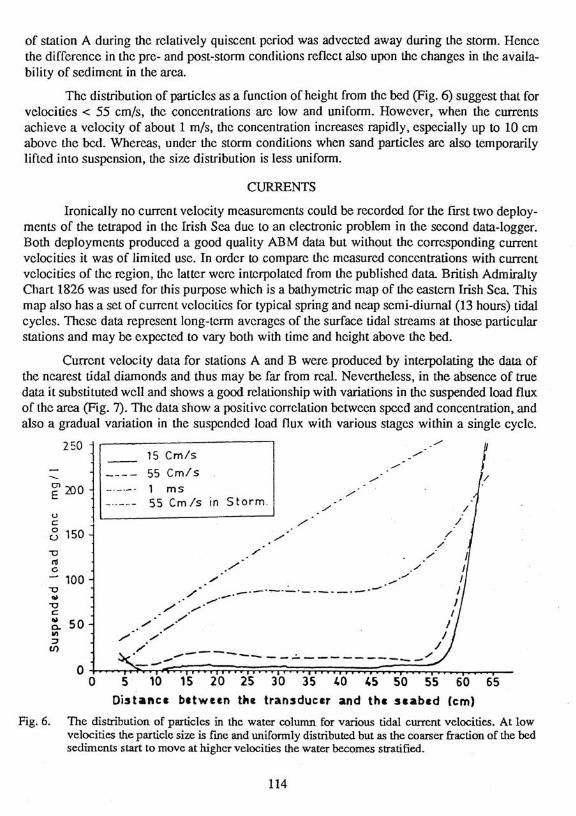
The distribution of particles as a function of height from the bed (Fig. 6) suggest that for velocities -c 55 cm/s, thc concentrations are low and uniform. However, when the currents achieve a velocity of about 1 m/s, the concentration increases rapidly, especially up to 10 cm above the bcd. Whereas, under the storm conditions when sand particles are also temporarily lifted into suspension, the s i 7 ~ distribution is less uniform.
CURRENTS
Ironically no current velocity measurements could be recorded for the first two deploy- ments of the tetrapod in the Irish Sea due to an electronic problem in the second data-logger. Both deployments produced a good quality ABM data but without the corresponding current velocities it was of limited use. In order to compare the measured concentrations with currcnt velocities of the region, the latter were interpolated from the published data. British Admiralty Chart 1826 was used for this purpose which is a bathymetric map of the eastern Irish Sea. This map also has a set of current velocities for typical spring and neap semi-diurnal (13 hours) tidal cycles. These data represent long-term averages of the surface tidal streams at those particular stations and may be expected to vary both with time and height above the bed.
Current velocity data for stations A and B were produced by interpolating the data of the nearest tidal diamonds and thus may be far from real. Nevertheless, in the absence of true data it substituted wcll and shows a good relationship with variations in thc suspendcd load flux of he area (Fig. 7). The data show a positive correlation bctween speed and concentration, and also a gradual variation in the suspcndcd load flux with various stages within a single cycle.
Distance between the transducer and the seabed [cm)
Fig. 6. The distribution of particles in the water column for various tidal current velocities. At low velocities the particle size is fine and unifomily distributed but as the coarser fraction of the bed sediments start to move at highcr velocities the water becomes stratified.
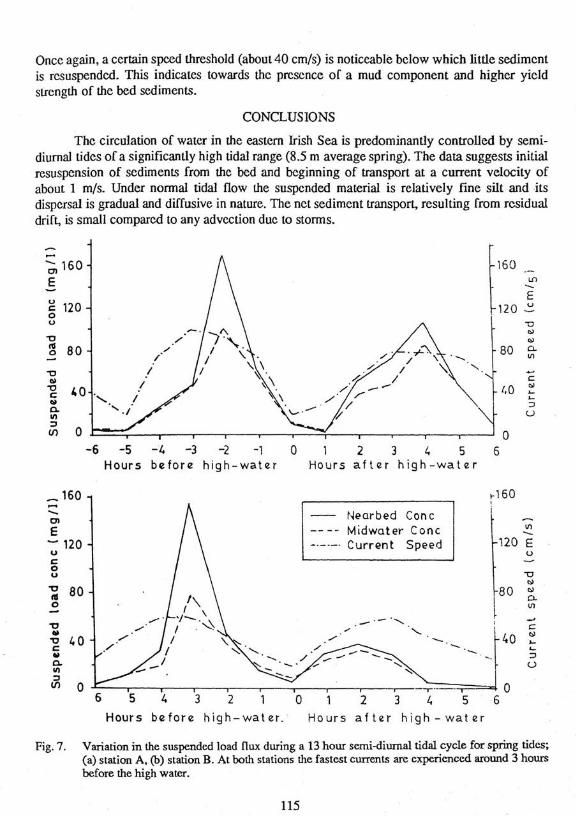
Once again, a certain speed threshold (about 40 cm/s) is noticeable below which little sedimcnt is rcsuspended. This indicates towards thc prcscnce or a mud component and higher yield suength of thc bed sediments.
The circulation of water in the eastern Irish Sea is predominantly controlled by semi- diurnal tides of a significantly high tidal range (8.5 m average spring). The data suggests initial resuspension of sediments from thc bed and beginning of transport at a current velocity of about 1 m/s. Under normal tidal flow the suspended material is relatively fine silt and its dispcrsd is gradual and diffusive in nature. The nct sediment transport, resulting rrom residual drift, is small comparcd to any advection duc to storms.
-6 -5 -4 -3 -2 -1 0 1 2 3 1, 5 6 Hours before h igh-water Hours a f t e r h igh -wat e r
Hours before high-water: H o u r s a f t e r h igh - wat e r
Fig. 7. Variation in the suspended load flux during a 13 hour semi-diurnal tidal cycle for spring tides; (a) station A, (b) station B. At both stations the fastest currents am experienced around 3 hours before the high water.

The significance of storms in net sediment transport in he Irish Sea is reflected by the abnormally high suspended load profiles, measured during that period. The sediment concen- tration in the area is controlled by the availability of the fine particles which are advected away during a storm and require a long quiscent period to re-accmulate in the region. The coarser fraction of the bed sediments moves only during storms, apparently as a result of enhanced bed shear stresses, due to a combined action of tides, waves and wind-driven currents,
A multi-frequency system was developed and then deployed in the Irish Sea to avoid the bias in result arising from the size selected for calibration. The results of the subsequent deployment will be published later.
Acknowledgements: We would like to thank Nick Pearson and Mike Thomas of MAFF for the devclopmcn t of both hardware and software of the ABM. Ministry of Science and Technology, Government of Pakistan is thanked for supporting the research.
REFERENCES
Bowden, K.F., 1980. Physical and dynarnical oceanosaphy of the Irish Sea In: The north-west Eumpean shelf seas: the seabed and the sea in motion. IT Physical and Chemical Oceanography and Physical Resources (F.T. Banner, M.B. CoClins and K.S. Massie, Eds.). Elsevier, Amsterdam, 391414.
Carter, D.J.T., 1982. Prediction of wave height and pcriod for a constant wind velocity, using the JONSWAP results. Ocean Engineering 9. 17-35.
Grant, W.D. 8t Madsen, O.S., 1979. Combined wave and current interaction with a rough bottom. J. Geophys. Res. 84,1797-1808.
Hain, J.H.W., 1986. Low-level radioactivity in the Irish Sea Oceanus 29, 16-27.
Hetherington, J.A., 1976. Radioactivity in surface and coastal waters of h e British Isles. Ministry of Agr. Fisheries and Food, Radiobiol. Lab. Lowestoft, FRL. 11, 1-34.
Howarth, M.J., 1984. Currents in the eastern Irish Sea Oceanogr. Mar. Biol. Ann. Rev. 22, 11-53.
Kershaw, PJ., Swifl, D.J., Pentreah, R.J. & Lovett, M.B., 1983. Plutonium redistribution by bioIogical activity in the Irish Sea sediments. Nature 306,774-775.
, Break, J.H., Woodhead, D.S. & Lovett, M.B., 1986. Alpha-emitting hot particles in the Irish Sea sediments. Sci. Tot. Envir. 53,77437.
Lynch, J.F., 1 985. Theoretical analysis of ABSS data for IIEBBLE. Mar. Geol. 66,277-290.
Sills, G.C. & Edge, MJ., 1987. Sediment behaviour in h e Irish Sea. Unpublished report No. OUEL 1698f87, Depu. Engg. Sci. University of Oxford. 20. pp.
Vincent, C.E., Hanes, D., Tamura, T. & Clarke, T.L., 1986. The acoustic measurement of suspended sand in the surfzone. In: Proc. Inter. Conk Measuring Techniques of hydralulic phenomena in offshore coastal and inland waters. London, 9-1 1 April, 1986, Paper K3.443-451.
Copyright © 2022 FDOKUMEN