Accurate and precise DNA quantification in the presence of different amplification efficiencies...
11
Accurate and Precise DNA Quantification in the Presence of Different Amplification Efficiencies Using an Improved Cy0 Method Michele Guescini* . , Davide Sisti . , Marco B. L. Rocchi, Renato Panebianco, Pasquale Tibollo, Vilberto Stocchi Department of Biomolecular Sciences, University of Urbino ‘‘Carlo Bo’’ Via I Maggetti, Urbino, Italy Abstract Quantitative real-time PCR represents a highly sensitive and powerful technology for the quantification of DNA. Although real-time PCR is well accepted as the gold standard in nucleic acid quantification, there is a largely unexplored area of experimental conditions that limit the application of the Ct method. As an alternative, our research team has recently proposed the Cy0 method, which can compensate for small amplification variations among the samples being compared. However, when there is a marked decrease in amplification efficiency, the Cy0 is impaired, hence determining reaction efficiency is essential to achieve a reliable quantification. The proposed improvement in Cy0 is based on the use of the kinetic parameters calculated in the curve inflection point to compensate for efficiency variations. Three experimental models were used: inhibition of primer extension, non-optimal primer annealing and a very small biological sample. In all these models, the improved Cy0 method increased quantification accuracy up to about 500% without affecting precision. Furthermore, the stability of this procedure was enhanced integrating it with the SOD method. In short, the improved Cy0 method represents a simple yet powerful approach for reliable DNA quantification even in the presence of marked efficiency variations. Citation: Guescini M, Sisti D, Rocchi MBL, Panebianco R, Tibollo P, et al. (2013) Accurate and Precise DNA Quantification in the Presence of Different Amplification Efficiencies Using an Improved Cy0 Method. PLoS ONE 8(7): e68481. doi:10.1371/journal.pone.0068481 Editor: Giovanni Maga, Institute of Molecular Genetics IMG-CNR, Italy Received March 26, 2013; Accepted June 5, 2013; Published July 8, 2013 Copyright: ß 2013 Guescini et al. This is an open-access article distributed under the terms of the Creative Commons Attribution License, which permits unrestricted use, distribution, and reproduction in any medium, provided the original author and source are credited. Funding: The authors have no support or funding to report. Competing Interests: The authors have declared that no competing interests exist. * E-mail: [email protected] . These authors contributed equally to this work. Introduction Real-time quantitative polymerase chain reaction (real-time PCR) is the method of choice for absolute or relative quantifica- tion of nucleic acids (DNA and RNA if preceded by the reverse transcription step) because of its rapidity, accuracy and sensitivity [1–3]. Although real-time PCR is well accepted as the gold standard in nucleic acid quantification and is widely used for validating the results of large-scale microarray experiments [4], two key issues, namely data quality assurance and proper data analysis, may compromise the acquisition of reliable biological results [5–7]. The widely accepted quantification method for determining the quantification cycle (Cq) in real-time PCR is the Ct (threshold cycle) method. The Ct value is defined as the fractional cycle number in the log-linear region of PCR amplification in which the reaction reaches fixed amounts of amplicon DNA [8]. This method requires generating serial dilutions of a given sample and performing multiple PCR reactions on each dilution. The threshold-cycle values are then plotted versus the Log of the dilution and a linear regression, from which the mean efficiency can be derived, is performed [9]. This approach involves the comparison of identical efficiency among amplifications. PCR efficiency can be defined as the fold change in the amount of amplified DNA after each cycle of PCR. In an ideal PCR, the DNA template should double at each cycle according to the equation: F n ~F 0 (1zE) n ð1Þ where n is the cycle number, F 0 is the base fluorescence value and efficiency (E = 1) is constant and maximal over the entire reaction. However, empirical evidence shows that E is not always 1 and constant, conversely it progressively declines at the building up of products and consuming of reagents [10,11]. Hence, we can distinguish E in E max defined as the maximal initial value of PCR efficiency, E n is the efficiency value at the n cycle and the rate of loss in E after each cycle is defined as DE. To provide a complete picture we will discuss overall efficiency when describing the global efficiency of the amplification system calculated using the standard curve method [8]: E overall ~10 { 1 slope {1 ð2Þ where the slope is calculated from the linear regression between the Log of the initial DNA template and the Cq. Small amplification variations may occur in any PCR quanti- fication potentially leading to estimate uncertainty. Among the PLOS ONE | www.plosone.org 1 July 2013 | Volume 8 | Issue 7 | e68481
-
Upload
independent -
Category
Documents
-
view
1 -
download
0
Transcript of Accurate and precise DNA quantification in the presence of different amplification efficiencies...
Accurate and Precise DNA Quantification in the Presenceof Different Amplification Efficiencies Using an ImprovedCy0 MethodMichele Guescini*., Davide Sisti., Marco B. L. Rocchi, Renato Panebianco, Pasquale Tibollo,
Vilberto Stocchi
Department of Biomolecular Sciences, University of Urbino ‘‘Carlo Bo’’ Via I Maggetti, Urbino, Italy
Abstract
Quantitative real-time PCR represents a highly sensitive and powerful technology for the quantification of DNA. Althoughreal-time PCR is well accepted as the gold standard in nucleic acid quantification, there is a largely unexplored area ofexperimental conditions that limit the application of the Ct method. As an alternative, our research team has recentlyproposed the Cy0 method, which can compensate for small amplification variations among the samples being compared.However, when there is a marked decrease in amplification efficiency, the Cy0 is impaired, hence determining reactionefficiency is essential to achieve a reliable quantification. The proposed improvement in Cy0 is based on the use of thekinetic parameters calculated in the curve inflection point to compensate for efficiency variations. Three experimentalmodels were used: inhibition of primer extension, non-optimal primer annealing and a very small biological sample. In allthese models, the improved Cy0 method increased quantification accuracy up to about 500% without affecting precision.Furthermore, the stability of this procedure was enhanced integrating it with the SOD method. In short, the improved Cy0method represents a simple yet powerful approach for reliable DNA quantification even in the presence of markedefficiency variations.
Citation: Guescini M, Sisti D, Rocchi MBL, Panebianco R, Tibollo P, et al. (2013) Accurate and Precise DNA Quantification in the Presence of Different AmplificationEfficiencies Using an Improved Cy0 Method. PLoS ONE 8(7): e68481. doi:10.1371/journal.pone.0068481
Editor: Giovanni Maga, Institute of Molecular Genetics IMG-CNR, Italy
Received March 26, 2013; Accepted June 5, 2013; Published July 8, 2013
Copyright: � 2013 Guescini et al. This is an open-access article distributed under the terms of the Creative Commons Attribution License, which permitsunrestricted use, distribution, and reproduction in any medium, provided the original author and source are credited.
Funding: The authors have no support or funding to report.
Competing Interests: The authors have declared that no competing interests exist.
* E-mail: [email protected]
. These authors contributed equally to this work.
Introduction
Real-time quantitative polymerase chain reaction (real-time
PCR) is the method of choice for absolute or relative quantifica-
tion of nucleic acids (DNA and RNA if preceded by the reverse
transcription step) because of its rapidity, accuracy and sensitivity
[1–3]. Although real-time PCR is well accepted as the gold
standard in nucleic acid quantification and is widely used for
validating the results of large-scale microarray experiments [4],
two key issues, namely data quality assurance and proper data
analysis, may compromise the acquisition of reliable biological
results [5–7].
The widely accepted quantification method for determining the
quantification cycle (Cq) in real-time PCR is the Ct (threshold
cycle) method. The Ct value is defined as the fractional cycle
number in the log-linear region of PCR amplification in which the
reaction reaches fixed amounts of amplicon DNA [8]. This
method requires generating serial dilutions of a given sample and
performing multiple PCR reactions on each dilution. The
threshold-cycle values are then plotted versus the Log of the
dilution and a linear regression, from which the mean efficiency
can be derived, is performed [9]. This approach involves the
comparison of identical efficiency among amplifications. PCR
efficiency can be defined as the fold change in the amount of
amplified DNA after each cycle of PCR. In an ideal PCR, the
DNA template should double at each cycle according to the
equation:
Fn~F0(1zE)n ð1Þ
where n is the cycle number, F0 is the base fluorescence value and
efficiency (E = 1) is constant and maximal over the entire reaction.
However, empirical evidence shows that E is not always 1 and
constant, conversely it progressively declines at the building up of
products and consuming of reagents [10,11]. Hence, we can
distinguish E in Emax defined as the maximal initial value of PCR
efficiency, En is the efficiency value at the n cycle and the rate of
loss in E after each cycle is defined as DE. To provide a complete
picture we will discuss overall efficiency when describing the global
efficiency of the amplification system calculated using the standard
curve method [8]:
Eoverall~10{ 1
slope{1 ð2Þ
where the slope is calculated from the linear regression between
the Log of the initial DNA template and the Cq.
Small amplification variations may occur in any PCR quanti-
fication potentially leading to estimate uncertainty. Among the
PLOS ONE | www.plosone.org 1 July 2013 | Volume 8 | Issue 7 | e68481
numerous factors that affect the sensitivity, accuracy, and
reliability of real-time PCR assay, are many substances found in
biological samples such as co-extracted contaminants, which can
inhibit PCR, confounding template amplification and analysis
[12–15].
Furthermore, poor quality primers or difficult samples may lead
to sub-optimal amplification. Imperfect amplification primers may
be the result not only of non-optimal primer design but,
sometimes, primer sequence and/or position are constrained, as
in the case of detection of sequence variants, intron spanning
primers etc. [16]. Sub-optimal amplification may also be the result
of the inhibiting agents used during nucleic acid extraction or co-
purified components from the biological sample such as bile salts,
urea, haeme, heparin, and immunoglobulin G. The presence of
inhibitors results in deviations of the amplification kinetic from the
optimal amplifications obtained using standard samples [17].
For these reasons, many tools, based on amplification efficiency,
have been developed to detect outlier amplifications [18–20]. A
quality test tool, called SOD, has also recently been developed.
SOD is not based on direct amplification efficiency estimation in
order to detect outliers, but relies on monitoring the shape of the
amplification curve [21].
The most common procedure used to account for any
differences in PCR efficiencies among samples is to amplify a
reference gene in parallel with the reporter gene and to relate their
expression levels. However, this approach assumes that the two
assays are inhibited to the same degree, which is not always the
case. Such variations in assay inhibition are a particular problem
in absolute quantification, where an external calibration curve is
used to calculate the number of transcripts in the test samples, an
approach that is commonly adopted for quantification of
pathogens [22].
In the last few years, a number of studies have attempted to
address these problems determining reaction amplification effi-
ciency through the application of different mathematical models
[17,23–28]. However, the key issue is that the exact equation of
the PCR amplification kinetics is still elusive, and the proposed
models are only good approximations of single portions of the
amplification kinetic.
Bearing in mind these concerns, our group proposed an
alternative method (Cy0 method), in which a new quantitative
entity, Cy0, is defined. The Cy0 method is similar to Ct, but it offers
the important advantage of taking into account the kinetic
parameters of the amplification curve and may compensate for
small variations among the samples being compared [29].
Conversely, with a marked decrease in amplification efficiency
the Cy0 method underestimates. Our proposed improvement in
the Cy0 method is based on the use of kinetic parameters
calculated in the curve inflection point to compensate for efficiency
variations. In addition, the enhanced Cy0 method was integrated
with SOD analysis to quantify starting DNA quantity in the
presence of different amplification kinetics due to inhibition of
primer extension and imperfect primer design. The advantages of
the improved Cy0 method were then evaluated in mtDNA
quantifications from skeletal muscle samples obtained from fine
needle aspiration [30].
Materials and Methods
Quantitative Real-Time PCRThe DNA standard consisted of a pGEM-T (Promega) plasmid
containing a 104 bp fragment of the human mitochondrial gene
NADH dehydrogenase 1 (MT-ND1) as insert. This plasmid was
purified using the Plasmid Midi Kit (Qiagen) according to the
manufacturer’s instructions. The final concentration of the
standard plasmid was estimated spectophotometrically by averag-
ing three replicate A260 absorbance determinations.
This DNA fragment was amplified for quantification by the
high amplification efficiency (HE) primer pair (forward ND1F2:59-
ACGCCATAAAACTCTTCACCAAAG-39 and reverse ND2:59-
TAGTAGAAGAGCGATGGTGAGAGCTA-39) and low ampli-
fication efficiency (LE) primer pair (forward ND1F5:59-
ATAAAACTCTTCACCAAAGAG-39 and reverse ND2:59-
TAGTAGAAGAGCGATGGTGAGAGCTA-39).
Real-time PCR amplifications were conducted using Light-
CyclerH 480 SYBR Green I Master (Roche) according to the
manufacturer’s instructions, with 500 nM primers and a variable
amount of DNA standard in a 20 ml final reaction volume.
Thermocycling was conducted using a LightCyclerH 480 (Roche)
initiated by a 10 min incubation at 95uC, followed by 40 cycles
(95uC for 5 s; 60uC for 5 s; 72uC for 20 s) with a single fluorescent
reading taken at the end of each cycle. Each reaction combination,
was performed in 4–6 replicates and all the runs were completed
with a melt curve analysis to confirm the specificity of
amplification and lack of primer dimers.
Muscle Fine Needle Aspiration (FNA)Students affiliated with the University of Urbino took part in
this study. Individuals were considered eligible if they were .18
years old. Written informed consent was obtained from all
participants. Ethical approval for this study conformed to the
standards of the Declaration of Helsinki. The Urbino University
Ethical Committee (Approval Number 28507) approved the
protocol before study initiation.
Skeletal muscle was obtained by fine needle aspiration (FNA)
from the vastus lateralis muscle. Muscle FNA was performed with
a 22-G spinal needle (Becton Dickinson, Madrid) under ultrasound
guidance as previously described by Guescini et al. [30]. Muscle
tissue was rapidly thawed and incubated with 0.2 mg/ml of
Proteinase K at 55uC for 10 min. Subsequently, genomic DNA
and total RNA were co-purified using silica micro columns by the
RNeasy Micro Kit (Qiagen) according to the manufacturer’s
instructions. Real-time PCR amplifications were conducted using
Specific primers for MT-CO1 (forward: 59-GTGCTATAGTG-
GAGGCCGGA-39 and reverse: 59-GGGTGGGAG-
TAGTTCCCTGC-39). and ATP6 (forward: 59-ATGAGCGGG-
CACAGTGATTA-39 and reverse: 59-
AGGGAAGGTTAATGGTTGATA-39) in a Light-Cycler 480
SYBR Green I Master (Roche, Basilea, Switzerland) according to
the manufacturer’s instructions, with 300 nM primers and 2 ml of
purified FNA sample in 20 ml of final reaction volume. Thermo-
cycling was performed using a LightCycler 480 (Roche) initiated
by a 10 min incubation at 95uC, followed by 40 cycles (95uC for
5 sec; 60uC for 5 sec; 72uC for 10 sec) with a single fluorescent
reading taken at the end of each cycle. Each reaction was
conducted in duplicate and completed with a melt curve analysis
to confirm the specificity of amplification and lack of primer
dimers.
Cy0 MethodThe Cy0 value [29] is the intersection point between the abscissa
axis and tangent of the inflection point of the Richards curve
obtained by the nonlinear regression of raw data. The Richards
equation is an extension of the symmetric logistic-type growth
curve; specifically, when d coefficient is equal to 1, the symmetric
logistic-type and Richards (asymmetric logistic-type) curves are the
same. Shape of amplification curves in real-time PCR ranges from
a perfect symmetric to a strongly asymmetric shape, for example in
Accurate and Precise Real-Time PCR Quantification
PLOS ONE | www.plosone.org 2 July 2013 | Volume 8 | Issue 7 | e68481
presence of inhibitors [21]. The Cy0 method was performed by
nonlinear regression fitting of the Richards function [31], in order
to fit fluorescence readings to the 5-parameter Richards function.
y~Fmax
1ze{1
bx{cð Þ
� �" #dzFb ð3Þ
Where y is the reaction fluorescence at cycle x, Fmax is the maximal
reaction fluorescence, b can be considered a slope parameter, c is
the transition parameter and d represents the Richards coefficient,
and Fb is the background reaction fluorescence. The five
parameters that characterized each run were used to calculate
the Cy0 value by the following equation, corrected in order to
eliminate the influence of baseline correction (Fb). Cy0 values were
obtained as follows:
Cy0~c{b(1z1
d{ ln d) ð4Þ
When the flex ordinate of the raw data curve is lower than Fmax/e
(where e = 2.718281…), the Richards curve does not yield a good
fit because it is not possible to estimate the parameter d; in this
case, the upper points are progressively removed, until an
acceptable fitting is achieved [32]. Cy0 was calculated using the
following web interface: http://www.cy0method.org/, specifically
developed by the authors of this article.
SOD CalculationShape based kinetic outlier detection (SOD) was based on the
shapes of the amplification curves. In order to fit fluorescence raw
data, nonlinear regression fitting of 5-parameter Richards function
was performed. The following shape parameters were used: the
plateau value of the amplification curve (Fmax), the tangent straight
line slope in the inflection point (m) and the y-coordinate of the
inflection point (Yf). For further details, see Sisti et al. [21].
All other statistical elaborations and graphics were obtained
using specific VBA macro developed in the MS Excel and
Statistical Packages for Social Sciences (SPSS 13.0).
Results and Discussion
Mathematical Model for Cy0 CorrectionRegarding the kinetic of PCR amplification we considered the
logistic model as previously reported by Chervoneva et al. and
Rutledge & Stewart [33,34].
y~Fmax
1zFmax
y0
{1
� �Emaxz1ð Þ{x
ð5Þ
where Fmax is the height of amplification profile, Emax is the starting
maximal efficiency value of curve growth rate and y0 is the initial
amount of DNA template. By a simple mathematical elaboration
(reported in Data File S1), it is possible to determine the curve
slope of the inflection point as:
m~Fmaxln Emaxz1ð Þ
4ð6Þ
subsequently, using this equation it is possible to calculate the
value of the starting reaction efficiency:
ln Emaxz1ð Þ~ 2m
yf
ð7Þ
This relation shows that the slope of the inflection point, scaled for
its ordinate, is the natural logarithmic value of starting efficiency
(Emax+1).
Starting from two amplification reactions (A and B) showing the
same starting DNA template (y0), but different Emax, we can
consider the following equivalence:
yfA
1z EmaxAz1
� �xfA~
yfB
1z EmaxBz1
� �xfBð8Þ
from which, introducing some useful approximations and trans-
formations (see Data File S1), it is possible to formulate the
following equation:
xfA~ xfB
2mB
yfB
{ lnyfB
yfA
!yfA
2mA
ð9Þ
where xf and yf are the x- and y-coordinates of the inflection point
of the amplification curve and m is the slope of the curve in
inflection point. In this equation the xf values represent the Cq of
the two amplification reactions while yf and m account for the
kinetic parameters of the amplification (Emax and DE). In
particular, in the presence of different amplification kinetics for
curves A and B, the Cq of curve B (xfB) can be overlapped to the
Cq of curve A (xfA) applying Eq. 9. Notably, to perform this
procedure the only parameters needed are xf, yf and m of the two
curves.
The proposed procedure refers to the comparison of two
amplification curves; however, this formula can be easily
generalized to the standard curve quantification method. In fact,
we propose using yf and m as reference values calculated as the
arithmetic mean of each yfi and mi, estimated from all standard
amplification curves, and as Cq, we replaced xf with Cy0. After
profile correction, the two curves become parallel justifying the use
of the Cy0 value as Cq. Hence, in the presence of unknown
amplification profiles significantly different in shape from that of
the standard curve the obtained Cy0 value should be corrected
using the following formula:
Cy0corrected~ Cy02m
yf
{ lnyf
�yyf
!�yyf
2 �mmð10Þ
Assessing the Cy0 Correction Model in TheoreticalLogistic Curves
The proposed Cy0 correction provides for: a) curve shift of a
factor equal to [ln(yfB/yfA)]/(yfB/2mA)] and b) scaling on the abscissa
axis using the ratio (mB/yfB*yfA/mA). It should be noted that all
these procedures were not necessarily applied simultaneously.
Their application depends on the characteristics of the curves to be
compared and consequently Eq. 10 progressively becomes simpler
when one of the standard curve parameters (m or yf) matches with
one of the corresponding parameters of the unknown curve.
Accurate and Precise Real-Time PCR Quantification
PLOS ONE | www.plosone.org 3 July 2013 | Volume 8 | Issue 7 | e68481
In an attempt to demonstrate the performance of the proposed
Cy0 correction, using Eq. 5, we created two amplification profiles
characterized by different Fmax and Emax and hence different DE
[11], but the same initial DNA template (y0). The analysis of the
resulting profiles allowed us to show how the Cy0 correction
worked and to explain the shifting and scaling factors used in Eq.
10. In these analyses we showed two fluorescence profiles: A and
B; curve A represented the optimal condition, whilst curve B
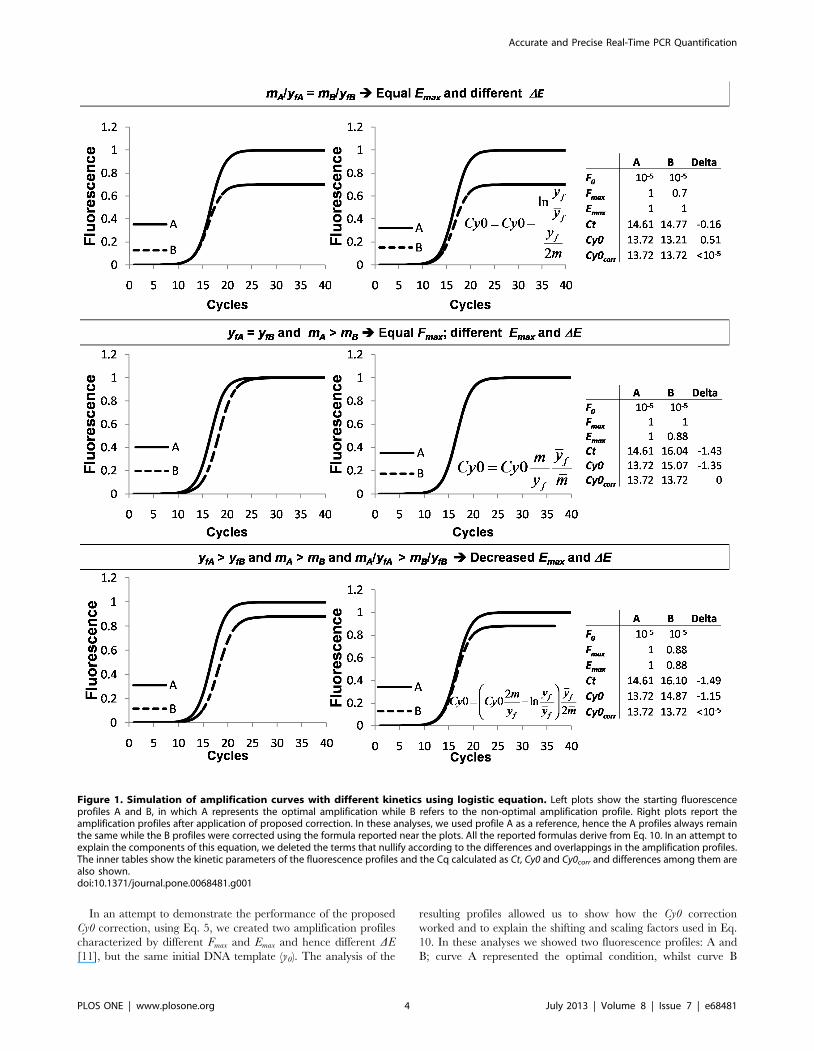
Figure 1. Simulation of amplification curves with different kinetics using logistic equation. Left plots show the starting fluorescenceprofiles A and B, in which A represents the optimal amplification while B refers to the non-optimal amplification profile. Right plots report theamplification profiles after application of proposed correction. In these analyses, we used profile A as a reference, hence the A profiles always remainthe same while the B profiles were corrected using the formula reported near the plots. All the reported formulas derive from Eq. 10. In an attempt toexplain the components of this equation, we deleted the terms that nullify according to the differences and overlappings in the amplification profiles.The inner tables show the kinetic parameters of the fluorescence profiles and the Cq calculated as Ct, Cy0 and Cy0corr and differences among them arealso shown.doi:10.1371/journal.pone.0068481.g001
Accurate and Precise Real-Time PCR Quantification
PLOS ONE | www.plosone.org 4 July 2013 | Volume 8 | Issue 7 | e68481
represented a non-optimal fluorescence profile (Fig. 1 left graphs).
After correction, the fluorescence profile of curve B was modified
following the proposed procedure using the parameters of curve A
as a reference (Fig. 1 right graphs) and Cy0 was recalculated
(Cy0corr).
In the first case, the two curves were characterized by equal Emax
(Emax = 1) and different Fmax corresponding to 1 and 0.7,
respectively (Fig. 1 upper panels). In these conditions, profile B
was less steep and slightly shifted towards the right compared to
profile A. The Cy0 values obtained from the two curves differed,
and in particular, the Cy0 value calculated from the curve with
lower Fmax slightly overestimated the input DNA quantity, whilst
the Ct underestimated the starting quantity. As we can observe in
the inner table, after Cy0 correction, the error became very small
(Cy0A-Cy0corr-B ,1025). Then, we created two profiles where Fmax
was equal but m differed, as shown in Figure 1 (middle panels)
Curve B (Emax = 0.88) was significantly more delayed than curve A
producing a marked underestimation using both Cy0 and Ct
methods. After the application of the proposed correction, curves
A and B overlapped resulting in a full correction of the initial DNA
estimate. Finally, we provided an example that summarizes the
two previous cases, in this elaboration two profiles differing in both
Emax and Fmax were created, and in this case as well the proposed
correction allowed us to compensate for these differences (Fig. 1
lower panels). Hence, we can conclude that Cy0 correction as
reported in Eq. 10 can be applied in all conditions.
The presented data showed that theoretically, it is possible to
account for differences in kinetic parameters between two
amplification profiles estimating xf, yf and m.
The improved Cy0 method re-proposes two previously intro-
duced concepts: curve normalization on Fmax [35] and Cq
correction based on the value of the slope in the maximal of the
second derivative [36]. These aspects were incorporated in the
proposed method and further developed starting from the logistic
curve. Specifically, the significant differences consisted in the use
of yf for normalization to avoid bias due to asymmetric
amplifications and the weighting of the slope of the curve on the
yf value. Furthermore, to the best of our knowledge, the introduced
shift factor [ln(yfB/yfA)]/(yfB/2mA)] has never been reported in
literature.
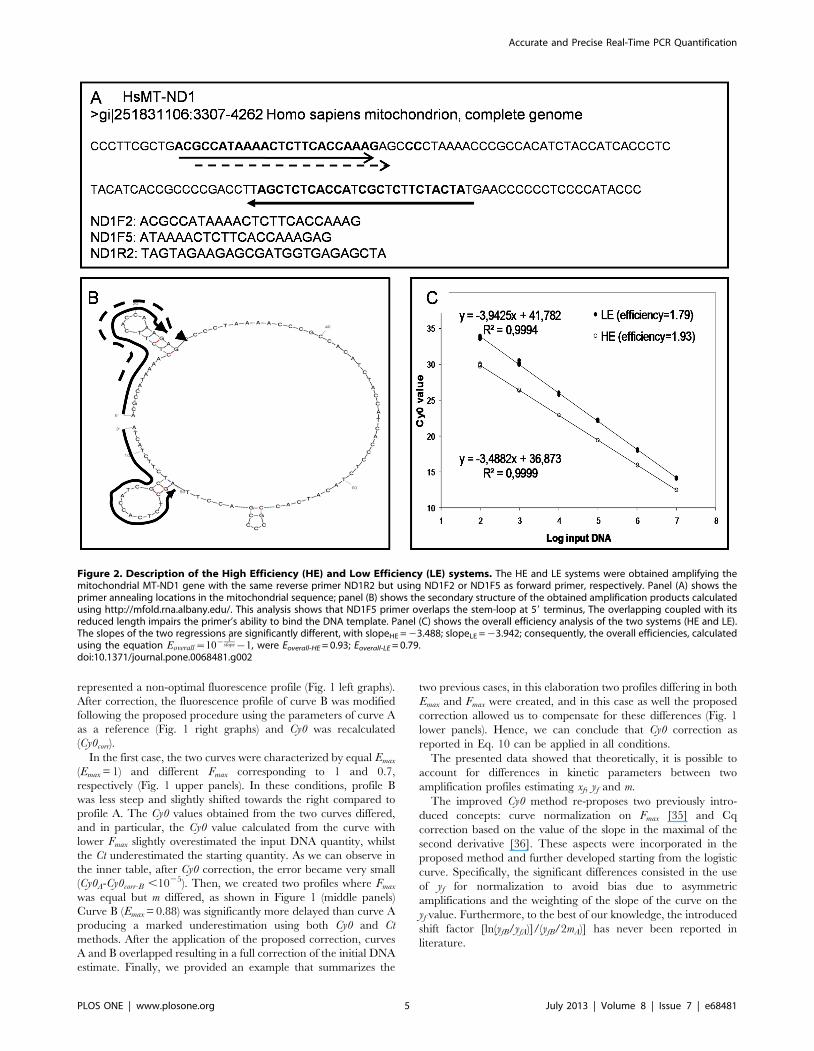
Figure 2. Description of the High Efficiency (HE) and Low Efficiency (LE) systems. The HE and LE systems were obtained amplifying themitochondrial MT-ND1 gene with the same reverse primer ND1R2 but using ND1F2 or ND1F5 as forward primer, respectively. Panel (A) shows theprimer annealing locations in the mitochondrial sequence; panel (B) shows the secondary structure of the obtained amplification products calculatedusing http://mfold.rna.albany.edu/. This analysis shows that ND1F5 primer overlaps the stem-loop at 59 terminus, The overlapping coupled with itsreduced length impairs the primer’s ability to bind the DNA template. Panel (C) shows the overall efficiency analysis of the two systems (HE and LE).The slopes of the two regressions are significantly different, with slopeHE = 23.488; slopeLE = 23.942; consequently, the overall efficiencies, calculatedusing the equation Eoverall~10{ 1
slope{1, were Eoverall-HE = 0.93; Eoverall-LE = 0.79.doi:10.1371/journal.pone.0068481.g002
Accurate and Precise Real-Time PCR Quantification
PLOS ONE | www.plosone.org 5 July 2013 | Volume 8 | Issue 7 | e68481
Low and High Amplification Efficiency SystemsTo examine the usefulness of the developed quantification
method in compensating for PCR efficiency, two amplification
systems were used. The first is characterized by a high
amplification efficiency (HE; Fig. 2C black symbols), while the
second showed a low amplification efficiency (LE; Fig. 2C white
symbols) (Fig. 2). The two systems were obtained amplifying the
same DNA sequence with the same reverse primer ND1R2 but
using ND1F2 or ND1F5 as forward primer for the HE and LE
systems, respectively. Specifically, the annealing region of the
primer ND1F5 is shifted only 5 nucleotides downstream from the
ND1F2 primer location and shortened by three nucleotides
(Fig. 2A). In this region, the DNA template shows a stem-loop
secondary structure (evaluated using http://mfold.rna.albany.
edu/results/10/12Aug30-10-05-01/) that competes with the
forward primers for annealing (Fig. 2B). The primer ND1F5 is
probably less effective than ND1F2 in template binding. Using this
strategy, we were able to amplify the same DNA input template
with two amplification systems that work with marked efficiency
differences. The amplification efficiencies of the HE and LE
systems were determined by the standard curve method. The
obtained standard curves and the corresponding regression
equations are shown in Fig. 2C and the obtained overall
efficiencies of HE and LE were Eoverall-HE = 0.93 and Eoverall-
LE = 0.79.
Evaluation of the Correction Model in the Presence ofDecreased Amplification Efficiency
Hence, we investigated the possible application of this
procedure to experimental amplification plots obtained by the
HE and LE systems (Fig. 2). The LE system is clearly far from a
logistic profile, hence this allowed us to evaluate the robustness of
the proposed model in asymmetric amplifications that deviate
from a logistic shape.
Correction of the Cy0 value estimated from an amplification
reaction is necessary only in the presence of a marked decrease in
the amplification rate compared to that of standard curve samples.
In fact, as reported in our previous work, slight efficiency
variations are well compensated by the Cy0 method alone [29].
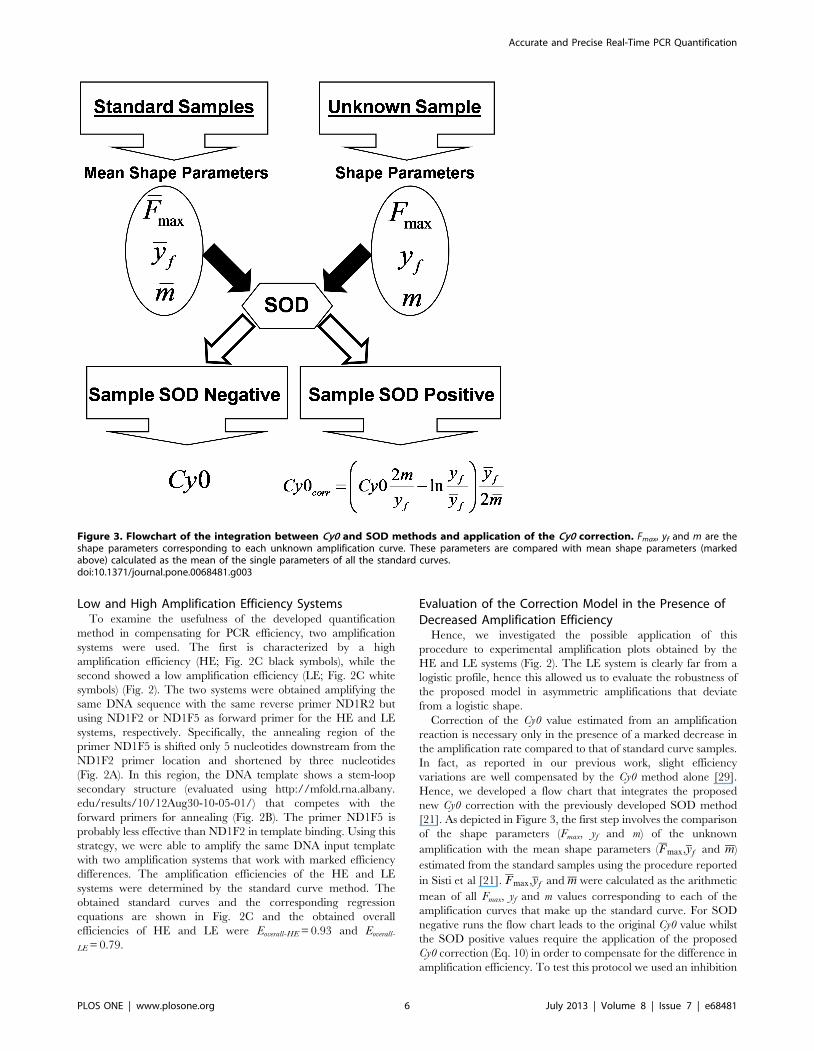
Hence, we developed a flow chart that integrates the proposed
new Cy0 correction with the previously developed SOD method
[21]. As depicted in Figure 3, the first step involves the comparison
of the shape parameters (Fmax, yf and m) of the unknown
amplification with the mean shape parameters (Fmax,yf and m)
estimated from the standard samples using the procedure reported
in Sisti et al [21]. Fmax,yf and m were calculated as the arithmetic
mean of all Fmax, yf and m values corresponding to each of the
amplification curves that make up the standard curve. For SOD
negative runs the flow chart leads to the original Cy0 value whilst
the SOD positive values require the application of the proposed
Cy0 correction (Eq. 10) in order to compensate for the difference in
amplification efficiency. To test this protocol we used an inhibition
Figure 3. Flowchart of the integration between Cy0 and SOD methods and application of the Cy0 correction. Fmax, yf and m are theshape parameters corresponding to each unknown amplification curve. These parameters are compared with mean shape parameters (markedabove) calculated as the mean of the single parameters of all the standard curves.doi:10.1371/journal.pone.0068481.g003
Accurate and Precise Real-Time PCR Quantification
PLOS ONE | www.plosone.org 6 July 2013 | Volume 8 | Issue 7 | e68481
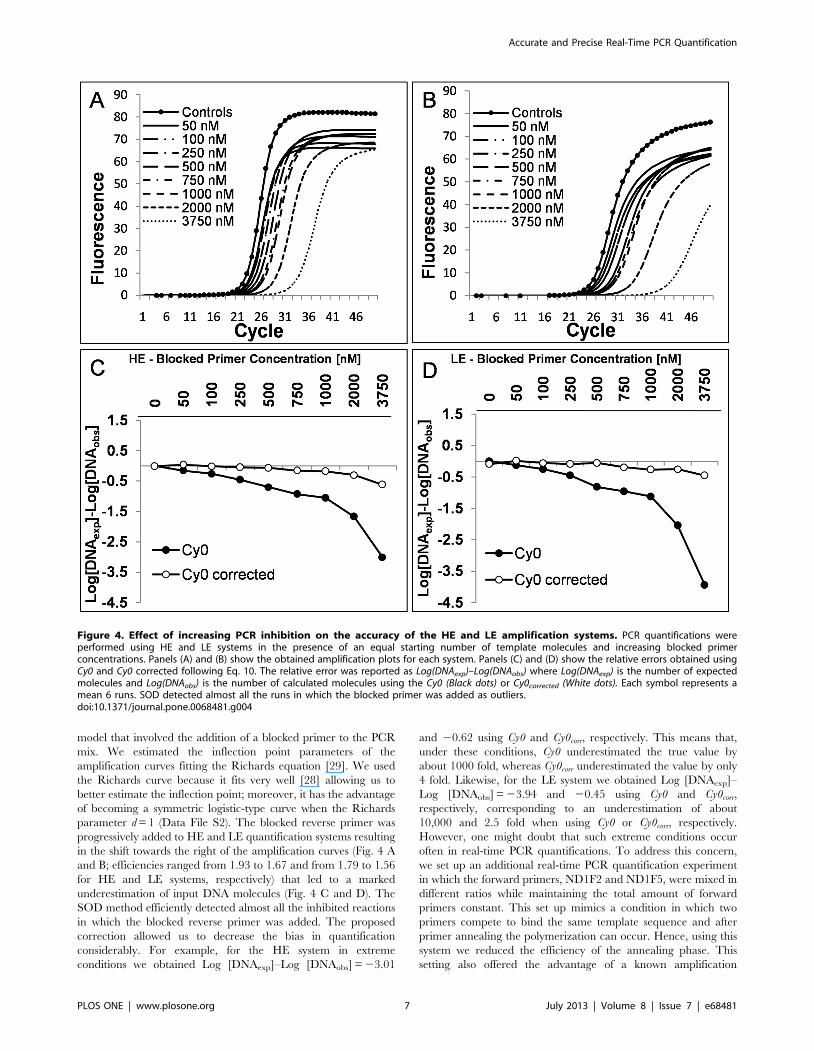
model that involved the addition of a blocked primer to the PCR
mix. We estimated the inflection point parameters of the
amplification curves fitting the Richards equation [29]. We used
the Richards curve because it fits very well [28] allowing us to
better estimate the inflection point; moreover, it has the advantage
of becoming a symmetric logistic-type curve when the Richards
parameter d = 1 (Data File S2). The blocked reverse primer was
progressively added to HE and LE quantification systems resulting
in the shift towards the right of the amplification curves (Fig. 4 A
and B; efficiencies ranged from 1.93 to 1.67 and from 1.79 to 1.56
for HE and LE systems, respectively) that led to a marked
underestimation of input DNA molecules (Fig. 4 C and D). The
SOD method efficiently detected almost all the inhibited reactions
in which the blocked reverse primer was added. The proposed
correction allowed us to decrease the bias in quantification
considerably. For example, for the HE system in extreme
conditions we obtained Log [DNAexp]–Log [DNAobs] = 23.01
and 20.62 using Cy0 and Cy0corr, respectively. This means that,
under these conditions, Cy0 underestimated the true value by
about 1000 fold, whereas Cy0corr underestimated the value by only
4 fold. Likewise, for the LE system we obtained Log [DNAexp]–
Log [DNAobs] = 23.94 and 20.45 using Cy0 and Cy0corr,
respectively, corresponding to an underestimation of about
10,000 and 2.5 fold when using Cy0 or Cy0corr, respectively.
However, one might doubt that such extreme conditions occur
often in real-time PCR quantifications. To address this concern,
we set up an additional real-time PCR quantification experiment
in which the forward primers, ND1F2 and ND1F5, were mixed in
different ratios while maintaining the total amount of forward
primers constant. This set up mimics a condition in which two
primers compete to bind the same template sequence and after
primer annealing the polymerization can occur. Hence, using this
system we reduced the efficiency of the annealing phase. This
setting also offered the advantage of a known amplification
Figure 4. Effect of increasing PCR inhibition on the accuracy of the HE and LE amplification systems. PCR quantifications wereperformed using HE and LE systems in the presence of an equal starting number of template molecules and increasing blocked primerconcentrations. Panels (A) and (B) show the obtained amplification plots for each system. Panels (C) and (D) show the relative errors obtained usingCy0 and Cy0 corrected following Eq. 10. The relative error was reported as Log(DNAexp)–Log(DNAobs) where Log(DNAexp) is the number of expectedmolecules and Log(DNAobs) is the number of calculated molecules using the Cy0 (Black dots) or Cy0corrected (White dots). Each symbol represents amean 6 runs. SOD detected almost all the runs in which the blocked primer was added as outliers.doi:10.1371/journal.pone.0068481.g004
Accurate and Precise Real-Time PCR Quantification
PLOS ONE | www.plosone.org 7 July 2013 | Volume 8 | Issue 7 | e68481
efficiency of the extreme conditions (in the presence of only
ND1F2 or ND1F5 primers). In these experiments the curve shift
was present but it was less pronounced than in the previous
experiments. Moreover, as the efficiency of the curves decreased
(demonstrated using the standard curve method), the fluorescence
profiles showed decreased Fmax and steepness, and increased
asymmetry (Fig. 5 A; and Data file S3). We used the amplification
in the presence of 500 nM ND1F2 and 500 nM ND1R2 as
reference (HE system). Once again, SOD correctly identified the
runs obtained with ND1F5.250 nM as outliers. The most
promising finding showing the effectiveness of the proposed
method came to light from the comparison of the extreme
conditions, where in the presence of a difference in overall
efficiency of 14.18%, we were able to decrease the relative error
from 5.89-fold to 0.65-fold using Cy0corr (Fig. 5 B). Finally, but no
less important, we evaluated the variability of the Cy0corr values
among replicates in the efficiency models used. As expected, these
values proved to be very stable with a CV among replicates
ranging from 0.002 to 0.02 (Fig. 6).
To further substantiate the presented results related to Cy0
method in presence of decreasing amplification efficiency, the Cy0
correction was applied to the freely available data set named
‘‘Competimer’’, reported in Ruijter et al. [32]. This data set is
independent and obtained with completely different chemistry and
PCR hardware (Data File S4). The proposed Cy0 correction
allowed us to efficiently quantify the inhibited amplifications as
shown by the low Cq shift in presence of increasing %
Competimer (Fig. 7A) and by the marked decrease in standard
deviation of Cy0 corrected values compared with uncorrected Cy0
values (Fig. 7B) in all the conditions tested. These results further
demonstrate the effectiveness of the proposed Cy0 correction and
support the notion that it is generally applicable.
Evaluation of the Cy0 Correction in Muscle SamplesObtained using Fine Needle Aspiration
In order to evaluate the output of the improved Cy0 method in
biological samples, we quantified mtDNA from skeletal muscle fine
needle aspiration [30]. This technique allowed us to recover only
small quantities of biological materials, hence it was very difficult,
if not impossible, to establish PCR efficiency using the standard
curve method. To assess the accuracy of the proposed method we
estimated the mtDNA quantity by using two amplification systems,
one targeted to the MT-CO1 gene and the other to ATP6 gene.
Because the mtDNA is a circular DNA molecule, the correlation
analysis between MT-CO1 and ATP6 estimated from several
specimens should tend to one. The overall MT-CO1 and ATP6
efficiencies, calculated with the standard curve method, using
genomic DNA extracted from U87MG cells, were slightly different
(Eoverall = 0.89; Eoverall = 0.94 for ATP6 and MT-CO1, respectively).
We analyzed 40 aspirates and for each one MT-CO1 and ATP6
amplifications were performed in duplicate for a total of 160 runs.
SOD analysis detected 14 and 5 runs as outliers for ATP6 and
MT-CO1, respectively. Interestingly, the amplification system
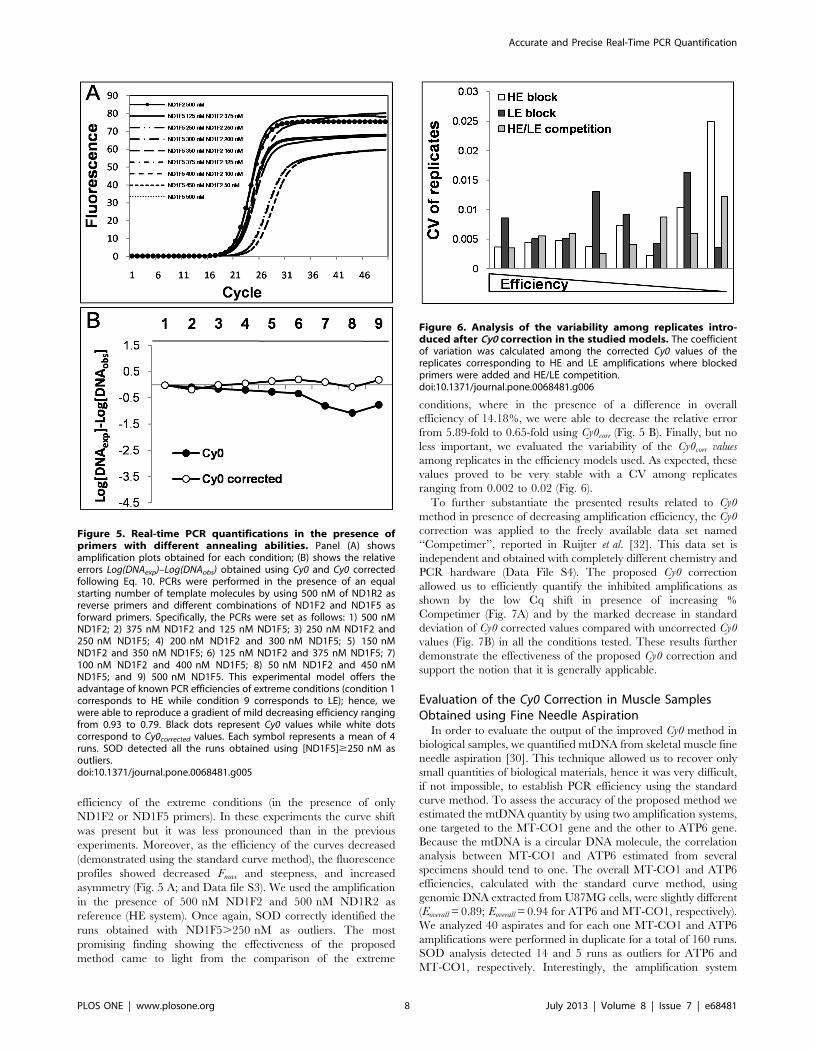
Figure 5. Real-time PCR quantifications in the presence ofprimers with different annealing abilities. Panel (A) showsamplification plots obtained for each condition; (B) shows the relativeerrors Log(DNAexp)–Log(DNAobs) obtained using Cy0 and Cy0 correctedfollowing Eq. 10. PCRs were performed in the presence of an equalstarting number of template molecules by using 500 nM of ND1R2 asreverse primers and different combinations of ND1F2 and ND1F5 asforward primers. Specifically, the PCRs were set as follows: 1) 500 nMND1F2; 2) 375 nM ND1F2 and 125 nM ND1F5; 3) 250 nM ND1F2 and250 nM ND1F5; 4) 200 nM ND1F2 and 300 nM ND1F5; 5) 150 nMND1F2 and 350 nM ND1F5; 6) 125 nM ND1F2 and 375 nM ND1F5; 7)100 nM ND1F2 and 400 nM ND1F5; 8) 50 nM ND1F2 and 450 nMND1F5; and 9) 500 nM ND1F5. This experimental model offers theadvantage of known PCR efficiencies of extreme conditions (condition 1corresponds to HE while condition 9 corresponds to LE); hence, wewere able to reproduce a gradient of mild decreasing efficiency rangingfrom 0.93 to 0.79. Black dots represent Cy0 values while white dotscorrespond to Cy0corrected values. Each symbol represents a mean of 4runs. SOD detected all the runs obtained using [ND1F5]$250 nM asoutliers.doi:10.1371/journal.pone.0068481.g005
Figure 6. Analysis of the variability among replicates intro-duced after Cy0 correction in the studied models. The coefficientof variation was calculated among the corrected Cy0 values of thereplicates corresponding to HE and LE amplifications where blockedprimers were added and HE/LE competition.doi:10.1371/journal.pone.0068481.g006
Accurate and Precise Real-Time PCR Quantification
PLOS ONE | www.plosone.org 8 July 2013 | Volume 8 | Issue 7 | e68481
showing the lowest efficiency presented more outlier curves.
Subsequently, the correction of the Cy0 values using the efficiency
parameters estimated in the inflection point (Eq. 10) were
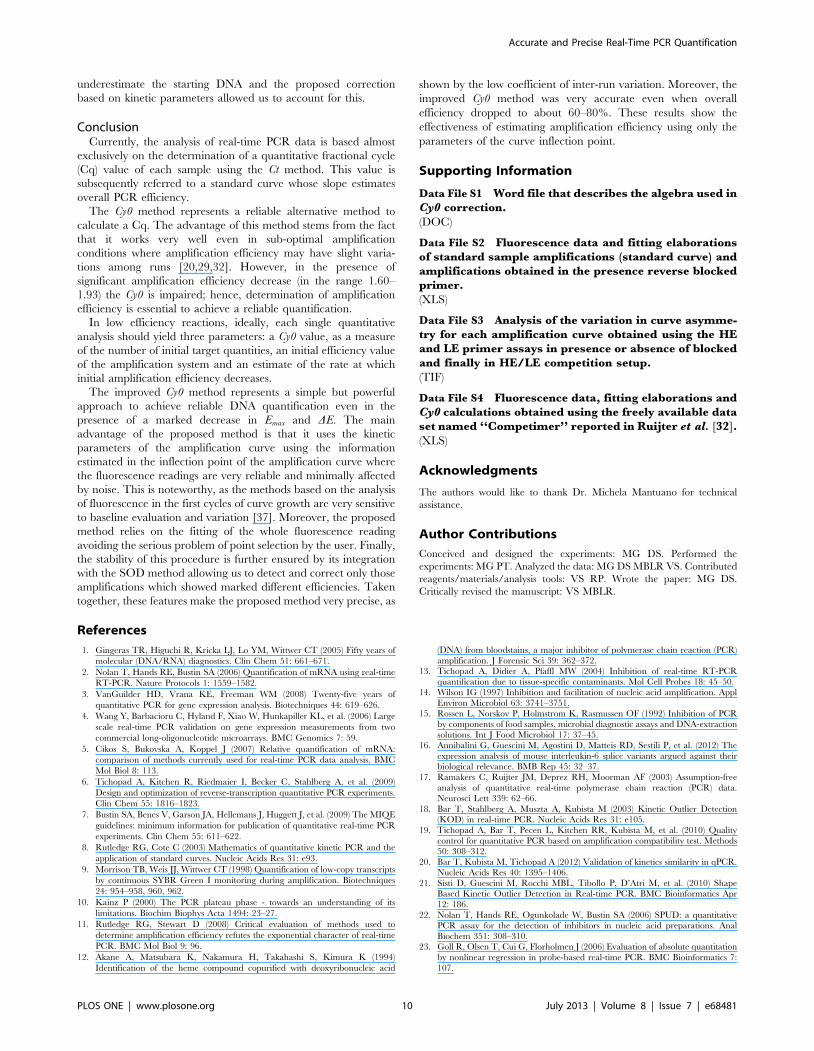
performed only in the outlier runs. Figure 8A shows the descriptive
correlation plot between the MT-CO1 and ATP6 estimates before
and after Cy0 correction. The graph shows that after the proposed
correction the slope and the intercept of the correlation straight-
line were closer to 1 and 0, respectively; hence, the proposed
method enhanced the accuracy of the quantification. The
increased precision obtained after correction was shown by the
higher R2 value (Fig. 8A). In order to evaluate the agreement
between Cy0 and Cy0corr outcomes in fine needle aspiration the
Bland Altman plot was performed. Using this approach it is
possible to show that the quantification differences were propor-
tional to input DNA and that the quantification errors were lower
after correction (p,0.005; permutation test for paired data).
Overall bias in Cy0 quantification was 225.8% whereas in Cy0corr
the bias was reduced to 210.2%. Specifically, in Figure 8B we can
observe that, in outlier runs, uncorrected Cy0 tended to
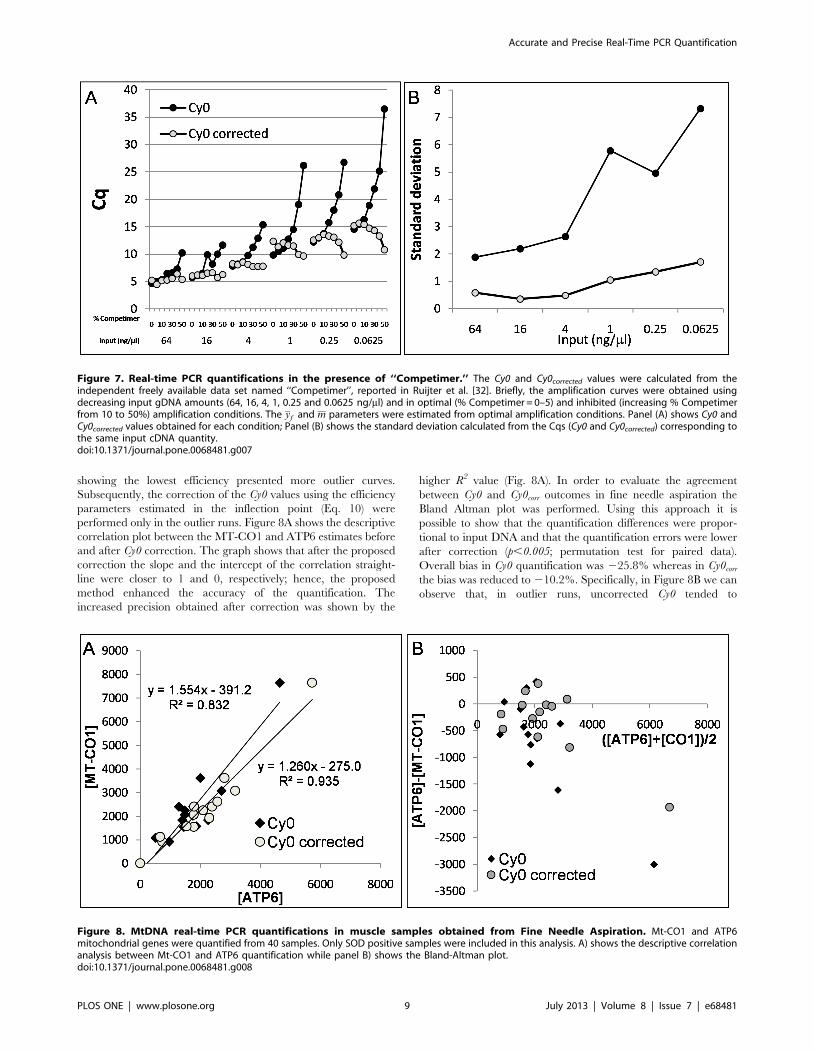
Figure 7. Real-time PCR quantifications in the presence of ‘‘Competimer.’’ The Cy0 and Cy0corrected values were calculated from theindependent freely available data set named ‘‘Competimer’’, reported in Ruijter et al. [32]. Briefly, the amplification curves were obtained usingdecreasing input gDNA amounts (64, 16, 4, 1, 0.25 and 0.0625 ng/ml) and in optimal (% Competimer = 0–5) and inhibited (increasing % Competimerfrom 10 to 50%) amplification conditions. The yf and m parameters were estimated from optimal amplification conditions. Panel (A) shows Cy0 andCy0corrected values obtained for each condition; Panel (B) shows the standard deviation calculated from the Cqs (Cy0 and Cy0corrected) corresponding tothe same input cDNA quantity.doi:10.1371/journal.pone.0068481.g007
Figure 8. MtDNA real-time PCR quantifications in muscle samples obtained from Fine Needle Aspiration. Mt-CO1 and ATP6mitochondrial genes were quantified from 40 samples. Only SOD positive samples were included in this analysis. A) shows the descriptive correlationanalysis between Mt-CO1 and ATP6 quantification while panel B) shows the Bland-Altman plot.doi:10.1371/journal.pone.0068481.g008
Accurate and Precise Real-Time PCR Quantification
PLOS ONE | www.plosone.org 9 July 2013 | Volume 8 | Issue 7 | e68481
underestimate the starting DNA and the proposed correction
based on kinetic parameters allowed us to account for this.
ConclusionCurrently, the analysis of real-time PCR data is based almost
exclusively on the determination of a quantitative fractional cycle
(Cq) value of each sample using the Ct method. This value is
subsequently referred to a standard curve whose slope estimates
overall PCR efficiency.
The Cy0 method represents a reliable alternative method to
calculate a Cq. The advantage of this method stems from the fact
that it works very well even in sub-optimal amplification
conditions where amplification efficiency may have slight varia-
tions among runs [20,29,32]. However, in the presence of
significant amplification efficiency decrease (in the range 1.60–
1.93) the Cy0 is impaired; hence, determination of amplification
efficiency is essential to achieve a reliable quantification.
In low efficiency reactions, ideally, each single quantitative
analysis should yield three parameters: a Cy0 value, as a measure
of the number of initial target quantities, an initial efficiency value
of the amplification system and an estimate of the rate at which
initial amplification efficiency decreases.
The improved Cy0 method represents a simple but powerful
approach to achieve reliable DNA quantification even in the
presence of a marked decrease in Emax and DE. The main
advantage of the proposed method is that it uses the kinetic
parameters of the amplification curve using the information
estimated in the inflection point of the amplification curve where
the fluorescence readings are very reliable and minimally affected
by noise. This is noteworthy, as the methods based on the analysis
of fluorescence in the first cycles of curve growth are very sensitive
to baseline evaluation and variation [37]. Moreover, the proposed
method relies on the fitting of the whole fluorescence reading
avoiding the serious problem of point selection by the user. Finally,
the stability of this procedure is further ensured by its integration
with the SOD method allowing us to detect and correct only those
amplifications which showed marked different efficiencies. Taken
together, these features make the proposed method very precise, as
shown by the low coefficient of inter-run variation. Moreover, the
improved Cy0 method was very accurate even when overall
efficiency dropped to about 60–80%. These results show the
effectiveness of estimating amplification efficiency using only the
parameters of the curve inflection point.
Supporting Information
Data File S1 Word file that describes the algebra used inCy0 correction.
(DOC)
Data File S2 Fluorescence data and fitting elaborationsof standard sample amplifications (standard curve) andamplifications obtained in the presence reverse blockedprimer.
(XLS)
Data File S3 Analysis of the variation in curve asymme-try for each amplification curve obtained using the HEand LE primer assays in presence or absence of blockedand finally in HE/LE competition setup.
(TIF)
Data File S4 Fluorescence data, fitting elaborations andCy0 calculations obtained using the freely available dataset named ‘‘Competimer’’ reported in Ruijter et al. [32].
(XLS)
Acknowledgments
The authors would like to thank Dr. Michela Mantuano for technical
assistance.
Author Contributions
Conceived and designed the experiments: MG DS. Performed the
experiments: MG PT. Analyzed the data: MG DS MBLR VS. Contributed
reagents/materials/analysis tools: VS RP. Wrote the paper: MG DS.
Critically revised the manuscript: VS MBLR.
References
1. Gingeras TR, Higuchi R, Kricka LJ, Lo YM, Wittwer CT (2005) Fifty years of
molecular (DNA/RNA) diagnostics. Clin Chem 51: 661–671.
2. Nolan T, Hands RE, Bustin SA (2006) Quantification of mRNA using real-time
RT-PCR. Nature Protocols 1: 1559–1582.
3. VanGuilder HD, Vrana KE, Freeman WM (2008) Twenty-five years of
quantitative PCR for gene expression analysis. Biotechniques 44: 619–626.
4. Wang Y, Barbacioru C, Hyland F, Xiao W, Hunkapiller KL, et al. (2006) Large
scale real-time PCR validation on gene expression measurements from two
commercial long-oligonucleotide microarrays. BMC Genomics 7: 59.
5. Cikos S, Bukovska A, Koppel J (2007) Relative quantification of mRNA:
comparison of methods currently used for real-time PCR data analysis. BMC
Mol Biol 8: 113.
6. Tichopad A, Kitchen R, Riedmaier I, Becker C, Stahlberg A, et al. (2009)
Design and optimization of reverse-transcription quantitative PCR experiments.
Clin Chem 55: 1816–1823.
7. Bustin SA, Benes V, Garson JA, Hellemans J, Huggett J, et al. (2009) The MIQE
guidelines: minimum information for publication of quantitative real-time PCR
experiments. Clin Chem 55: 611–622.
8. Rutledge RG, Cote C (2003) Mathematics of quantitative kinetic PCR and the
application of standard curves. Nucleic Acids Res 31: e93.
9. Morrison TB, Weis JJ, Wittwer CT (1998) Quantification of low-copy transcripts
by continuous SYBR Green I monitoring during amplification. Biotechniques
24: 954–958, 960, 962.
10. Kainz P (2000) The PCR plateau phase - towards an understanding of its
limitations. Biochim Biophys Acta 1494: 23–27.
11. Rutledge RG, Stewart D (2008) Critical evaluation of methods used to
determine amplification efficiency refutes the exponential character of real-time
PCR. BMC Mol Biol 9: 96.
12. Akane A, Matsubara K, Nakamura H, Takahashi S, Kimura K (1994)
Identification of the heme compound copurified with deoxyribonucleic acid
(DNA) from bloodstains, a major inhibitor of polymerase chain reaction (PCR)
amplification. J Forensic Sci 39: 362–372.13. Tichopad A, Didier A, Pfaffl MW (2004) Inhibition of real-time RT-PCR
quantification due to tissue-specific contaminants. Mol Cell Probes 18: 45–50.14. Wilson IG (1997) Inhibition and facilitation of nucleic acid amplification. Appl
Environ Microbiol 63: 3741–3751.
15. Rossen L, Norskov P, Holmstrom K, Rasmussen OF (1992) Inhibition of PCRby components of food samples, microbial diagnostic assays and DNA-extraction
solutions. Int J Food Microbiol 17: 37–45.16. Annibalini G, Guescini M, Agostini D, Matteis RD, Sestili P, et al. (2012) The
expression analysis of mouse interleukin-6 splice variants argued against theirbiological relevance. BMB Rep 45: 32–37.
17. Ramakers C, Ruijter JM, Deprez RH, Moorman AF (2003) Assumption-free
analysis of quantitative real-time polymerase chain reaction (PCR) data.Neurosci Lett 339: 62–66.
18. Bar T, Stahlberg A, Muszta A, Kubista M (2003) Kinetic Outlier Detection(KOD) in real-time PCR. Nucleic Acids Res 31: e105.
19. Tichopad A, Bar T, Pecen L, Kitchen RR, Kubista M, et al. (2010) Quality
control for quantitative PCR based on amplification compatibility test. Methods50: 308–312.
20. Bar T, Kubista M, Tichopad A (2012) Validation of kinetics similarity in qPCR.Nucleic Acids Res 40: 1395–1406.
21. Sisti D, Guescini M, Rocchi MBL, Tibollo P, D’Atri M, et al. (2010) ShapeBased Kinetic Outlier Detection in Real-time PCR. BMC Bioinformatics Apr
12: 186.
22. Nolan T, Hands RE, Ogunkolade W, Bustin SA (2006) SPUD: a quantitativePCR assay for the detection of inhibitors in nucleic acid preparations. Anal
Biochem 351: 308–310.23. Goll R, Olsen T, Cui G, Florholmen J (2006) Evaluation of absolute quantitation
by nonlinear regression in probe-based real-time PCR. BMC Bioinformatics 7:
107.
Accurate and Precise Real-Time PCR Quantification
PLOS ONE | www.plosone.org 10 July 2013 | Volume 8 | Issue 7 | e68481
24. Liu W, Saint DA (2002) A new quantitative method of real time reverse
transcription polymerase chain reaction assay based on simulation of polymerase
chain reaction kinetics. Anal Biochem 302: 52–59.
25. Peirson SN, Butler JN, Foster RG (2003) Experimental validation of novel and
conventional approaches to quantitative real-time PCR data analysis. Nucleic
Acids Res 31: e73.
26. Rutledge RG (2004) Sigmoidal curve-fitting redefines quantitative real-time
PCR with the prospective of developing automated high-throughput applica-
tions. Nucleic Acids Res 32: e178.
27. Rutledge RG, Stewart D (2008) A kinetic-based sigmoidal model for the
polymerase chain reaction and its application to high-capacity absolute
quantitative real-time PCR. BMC Biotechnol 8: 47.
28. Spiess AN, Feig C, Ritz C (2008) Highly accurate sigmoidal fitting of real-time
PCR data by introducing a parameter for asymmetry. BMC Bioinformatics 9:
221.
29. Guescini M, Sisti D, Rocchi MB, Stocchi L, Stocchi V (2008) A new real-time
PCR method to overcome significant quantitative inaccuracy due to slight
amplification inhibition. BMC Bioinformatics 9: 326.
30. Guescini M, Fatone C, Stocchi L, Guidi C, Potenza L, et al. (2007) Fine needle
aspiration coupled with real-time PCR: a painless methodology to study adaptivefunctional changes in skeletal muscle. Nutr Metab Cardiovasc Dis 17: 383–393.
31. Richards F (1959) A flexible growth function for empirical use. Journal of
experimental Botany 10: 290–300.32. Ruijter JM, Pfaffl MW, Zhao S, Spiess AN, Boggy G, et al. (2013) Evaluation of
qPCR curve analysis methods for reliable biomarker discovery: Bias, resolution,precision, and implications. Methods 59: 32–46.
33. Chervoneva I, Li Y, Iglewicz B, Waldman S, Hyslop T (2007) Relative
quantification based on logistic models for individual polymerase chainreactions. Stat Med 26: 5596–5611.
34. Rutledge RG, Stewart D (2010) Assessing the performance capabilities of LRE-based assays for absolute quantitative real-time PCR. PLoS One 5: e9731.
35. Larionov A, Krause A, Miller W (2005) A standard curve based method forrelative real time PCR data processing. BMC Bioinformatics 6: 62.
36. Shain EB, Clemens JM (2008) A new method for robust quantitative and
qualitative analysis of real-time PCR. Nucleic Acids Res 36: e91.37. Ruijter JM, Ramakers C, Hoogaars WM, Karlen Y, Bakker O, et al. (2009)
Amplification efficiency: linking baseline and bias in the analysis of quantitativePCR data. Nucleic Acids Res 37: e45.
Accurate and Precise Real-Time PCR Quantification
PLOS ONE | www.plosone.org 11 July 2013 | Volume 8 | Issue 7 | e68481