accounts at a glance 2014-15 - CAG
27
-
Upload
khangminh22 -
Category
Documents
-
view
1 -
download
0
Transcript of accounts at a glance 2014-15 - CAG

ACCOUNTS AT A GLANCE
2014-15
GOVERNMENT OF MANIPUR


i
Preface
This is the Seventeenth issue of our annual publication ‘Accounts at a
Glance’.
The Annual Accounts of the State Government are prepared and examined
under the directions of the Comptroller and Auditor General of India in
accordance with the requirements of the Comptroller and Auditor General’s
(Duties, Powers and Conditions of Service) Act, 1971 for being laid before
the Legislature of the State. The Annual Accounts consist of (a) Finance
Accounts and (b) Appropriation Accounts. Finance Accounts are summary
statement of accounts under the Consolidated Fund, Contingency Fund and
the Public Account. The Appropriation Accounts record the Grant-wise
expenditures against provisions approved by State Legislature and offer
explanations for variations between the actual expenditure and the funds
provided. The Office of the Accountant General (Accounts and
Entitlements), Manipur prepares the State Finance Accounts and the
Appropriation Accounts.
‘Accounts at a Glance’ provides a broad overview of Governmental
activities, as reflected in the Finance Accounts and the Appropriation
Accounts. The information is presented through brief explanations,
statements and graphs.
We look forward to suggestions that would help us in improving the
publications.
Date: 01.10.2015 (D. Sahu) Place: Imphal Accountant General (A&E), Manipur


iii
TABLE OF CONTENTS Page(s) Preface (i)
Table of contents (iii)
Chapter – I OVERVIEW 1.1 Introduction 1 1.2 Structure of Accounts 1 1.2.1 Government Accounts 1 1.3 Finance Accounts and Appropriation Accounts 2 1.3.1 Finance Accounts 2 1.3.2 Appropriation Accounts 2 Chapter II 2.1 Highlights of Accounts 3 2.2 Receipts and Disbursements 4 2.3 Receipts 4 2.3.1 Revenue Receipts 4 2.3.2 Revenue Receipts and Grants-in-Aid and Contributions 4 2.4 Capital Receipts 5 2.5 Disbursements 5 2.5.1 Revenue Disbursements 5 2.5.2 Capital Disbursements 5 2.5.3 Plan Disbursements 5 2.5.4 Non–Plan Disbursements 5 2.6 Trend of Expenditure 7 2.7 Debts and Liabilities 8 2.8 Investments and Returns 8

iv
2.9 Loans and Advances by the State Government 8 2.10 Financial Assistance to Local bodies and others 9 2.11 Appropriation Accounts 9 2.12 Reconciliation of Accounts 12 2.13 Submission of Accounts by Treasuries and Divisions 13 CHAPTER III 3.1 Trends in Government Receipt and Expenditure 14 3.1.1 Revenue Receipts 14 3.1.2 Revenue Expenditure 14 3.2 Government Accounts 15 3.3 Liabilities 16 3.4 State Provident Funds 16 3.5 Guarantees 17 3.6 Ways and Means Advances 17 3.7 General Cash Balances 18 3.8 Cash Flow Statement 19 3.9 Contingency Fund 19

1
CHAPTER I OVERVIEW 1.1 Introduction The monthly accounts of the State Government are compiled and consolidated from the
accounts submitted by the District Treasuries, Public Works and Forest Divisions, etc. to
the Accountant General (Accounts and Entitlements). Besides, the Finance Accounts and
the Appropriation Accounts are prepared annually by the Accountant General (Accounts
and Entitlements) under the directions of the Comptroller and Auditor General of India in
accordance with the requirements of the Comptroller and Auditor General’s (Duties,
Powers and Conditions of Service) Act, 1971.
1.2 Structure of Accounts
1.2.1 Government Accounts:
The accounts of Government are kept in the following three parts:
Part I Consolidated Fund
Part II Contingency Fund
Part III Public Account
There are two main divisions under the Consolidated Fund: The Revenue division (Revenue Account) deals with the proceeds of taxation and other
receipts classified as revenue and the expenditure met therefrom, the net result of which
represents the revenue surplus or deficit for the year.
In the Capital division, the section ‘Receipt Heads (Capital Account)’ deals with receipts
of capital nature which cannot be applied as a set off to capital expenditure. The section
‘Expenditure Heads (Capital Account)’ deals with expenditure met usually from borrowed
funds with the object of increasing concrete assets of a material and permanent character.
It also includes receipts of a capital nature intended to be applied as a set off to capital
expenditure. The section ‘Public Debt, Loans and Advances, etc.’ comprises loans raised
and their repayments by Government such as ‘Internal Debt’ and ‘Loans and Advances’
made (and their recoveries) by Government.
In the Contingency Fund, the transactions connected with Contingency Fund established
under Article 267 of the Constitution of India are recorded.

2
In the Public Account, the transactions relating to ‘Debt’ (other than those included in Part
I), ‘Deposits’, ‘Advances’, ‘Remittances’ and ‘ Suspense’ are recorded.
Annual Accounts of the Government of Manipur for the year 2014-15 are being presented
to the State Legislature. Audit Report of the Comptroller and Auditor General of India for
the year 2014-15 is also being presented.
1.3 Finance Accounts and Appropriation Accounts
1.3.1 Finance Accounts
Finance Accounts present the accounts of receipts and outgoings of the Government for
the year together with the financial results disclosed by the revenue and capital accounts,
the accounts of the public debts and the liabilities and assets as worked out from the
balances recorded in the accounts.
During 2014-15 total receipts amounted to ` 86,00.07 crore comprising ` 79,98.27 crore
revenue receipts (` 20,43.72 crore Tax Revenue, ` 1,83.73 crore Non-Tax Revenue and
` 57,70.82 crore Grants-in-aid and Contributions), and ` 6,01.80 crore capital receipts.
Disbursements during the year were ` 86,00.07 crore, that is, ` 72,67.29 crore (84.50 per
cent) on revenue account and ` 13,32.78 crore (15.50 per cent) on capital account.
1.3.2 Appropriation Accounts
Appropriation Accounts bring out the expenditure of the State Government against
amounts voted and charged by the State Legislature and supplement the Finance
Accounts. These comprise accounts of 3 charged Appropriations and 50 voted Grants.
The Manipur Appropriation Act, 2014 and the Manipur Appropriation Act, 2015 for the
year 2014-15 had projected for a gross expenditure of ` 1,24,78.55 crore, including the
Supplementary Grants of ` 27,90.72 crore, passed by State Legislature during the year.
An amount of ` 65.97 crore was projected as recoveries in reduction of expenditure.
Appropriation Accounts 2014-15 show disbursements aggregating ` 88,84.61 crore
against the aggregate budget provision of ` 1,24,78.55 crore, resulting in saving of
` 35,93.94 crore against Grants and Appropriations.
Recoveries in reduction of expenditure amounted to ` 11.30 crore reflecting a decrease of
` 54.67 crore vis-à-vis budget estimates.

3
CHAPTER-II 2.1 HIGHLIGHTS OF ACCOUNTS
( ` in crore )
Sl. No
B.E 2014-15
Actuals
Percentage of Actuals
to B.E
Percentage of Actuals to GSDP (`16122.73 crore)
1. Tax Revenue # 23,74.18 20,43.72 86.08 12.68
2. Non-Tax Revenue 2,84.06 1,83.73 64.68 1.14
3. Grants-in-aid & Contributions 61,68.18 57,70.82 93.56 35.79
4. Revenue Receipts (1+2+3) 88,26.42 79,98.27 90.62 49.61
5. Recovery of Loans & Advances 3.70 0.97 0.26 ...
6. Other Receipts ... ... ... ...
7. Borrowings & Other Liabilities* 5,49.03 6,00.83 1,09.43 3.73
8. Capital Receipts (5+6+7) 5,52.73 6,01.80 1,08.88 3.739. Total Receipts (4+8) 93,79.15 86,00.07 91.69 53.34
10 Non-Plan Expenditure (NPE) 48,81.01 49,67.94 1,01.78 30.81
11. NPE on Revenue Account 48,78.80 49,68.11 1,01.83 30.81
12. NPE on Interest Payments out of 11 4,45.01 4,73.19 1,06.33 2.93
13. NPE on Capital Account 2.21 (-) 0.17 (-) 7.69 ...14. Plan Expenditure (PE) 44,98.14 36,32.13 80.75 22.5315. PE on Revenue Account 27,48.82 22,99.18 83.64 14.2616. PE on Capital Account 17,49.32 13,32.95 76.20 8.27
17. Total Expenditure (10+14) 93,79.15 86,00.07 91.69 53.34
18. Revenue Expenditure (11+15) 76,27.62 72,67.29 95.28 45.07
19. Capital Expenditure (13+16) 17,51.53 13,32.78 76.09 8.27
20. Revenue Surplus(4-18) 11,98.80 7,30.98 60.98 4.53
21. Fiscal Deficit(-)/Surplus(+)
(17)-(4+5+6) (-) 5,49.03 (-)6,00.83 109.43 (-) 3.73
Note:-The final figures are not available in respect of GSDP for 2014-15.Hence the figures have been compared with the current prices (provisional estimates) of GSDP of ` 1,61,22.73 crore as furnished by the Directorate of Economics and Statistics, Government of Manipur.
Expenditure on Capital Account consists of Capital Expenditure ( `13,32.44 crore) and Loans and Advances ( ` 0.34 Crore) disbursed .
# Includes State’s Own Tax Revenue and Central Tax transfers.
* Includes Net of Public Debt(Statement-17), Net of Contingency Fund , Net of Public Account (Statement No.21) and Net of opening and Closing Cash Balance (decrease of Cash Balance over the year means that it has become a source for financing fiscal deficit hence it should be taken as a positive figure & vice versa for an increase in Cash Balance).

4
2.2 RECEIPTS AND DISBURSEMENTS Total receipts during the year were ` 86,00.07 crore, against which total disbursements were ` 86,00.07 crore. The following table summarises the Accounts for 2014-15.
(` in crore )
Total Receipts 8600.07 Total Disbursements 8600.07
Revenue Receipts
79,98.27 (93.00 per cent)
Revenue Disbursements
72,67.29 (84.50 per cent)
Capital Receipts
6,01.80 (7.00 per cent)
Capital Disbursements
13,32.78 (15.50 per cent)
2.3 RECEIPTS 2.3.1 Revenue Receipts
Gross Tax Revenue of ` 20,43.72 crore (including Share of Union Taxes/Duties) and Non-
Tax Revenue of ` 1,83.73 crore formed 12.68 per cent and 1.14 per cent respectively of
the GSDP. Major contributors to revenue were ` 57,70.82 crore under Grants-in-Aid and
Contributions.
Net tax receipts during the year were lower than the budget estimates by ` 4,30.79 crore,
mainly on account of less collection of Taxes on income and expenditure, Water Supply
and Sanitations.
Share of various tax, non-tax revenue and grants-in-aid and contributions to total revenue
receipts is given below:
2.3.2 Revenue Receipts and Grants-in-Aid and Contributions
( ` in crore )
Components Actuals Percentage to total Revenue Receipts
A. Tax Revenue 20,43.72 25.55
Taxes on Income and Expenditure *1 9,37.30 11.72
Taxes on Property and Capital Transactions *2 10.60 0.13
Taxes on Commodities and Services *3 10,95.82 13.70
B. Non-tax Revenue 1,83.73 2.30
Fiscal Services ... ...
Interest Receipts, Dividends and Profits 30.60 0.38

5
Components Actuals Percentage to total Revenue Receipts
General Services 1,37.69 1.72
Social Services 6.11 0.08
Economic Services 9.33 0.12
C. Grants-in-aid and Contributions 57,70.82 72.15
TOTAL-REVENUE RECEIPTS 79,98.27 100.00 (*1) Share of net proceeds received from Union Government: `` 9,14.04 crore)
(*2) Share of net proceeds received from Union Government: `` 1.43 crore )
(*3) Share of net proceeds received from Union Government: `` 6,11.42 crore)
2.4 CAPITAL RECEIPTS
Compared to the revised estimates (` 9,33.53 crore), there was an overall decrease of
` 3,31.73 crore in Capital Receipt (` 6,01.80 crore).
The decrease was mainly under receipts of Borrowing and Other Liabilities.
2.5 DISBURSEMENTS 2.5.1 Revenue Disbursements
Revenue Disbursement was 45.07 per cent of GSDP. It was less than the budget estimates
by ` 3,60.33 crore due to less disbursement of ` (-) 89.31 crore under Non-Plan
Expenditure and less disbursement of ` 4,49.64 crore under Plan Expenditure.
2.5.2 Capital Disbursements
Capital Disbursements were 8.27 per cent of the GSDP. It was less than budget estimates
by ` 4,18.75 crore due to less disbursement under Plan Expenditure (` 4,16.37 crore) and
Non-plan Expenditure (` 2.38 crore) respectively.
2.5.3 Plan Disbursements During the year 2014-15, Plan Disbursements were ` 33,13.53 crore under State Plan and
` 3,18.60 crore under Centrally Sponsored Plan Schemes and Central Plan Schemes.
2.5.4 Non-Plan Disbursements
Non-plan Disbursements during 2014-15 were ` 49,67.94 crore, consisting of ` 49,68.11
crore under Revenue accounts and ` (-) 0.17 crore under Capital accounts, including
Loans and Advances.

6
SECTORAL DISTRIBUTION OF EXPENDITURE AND ITS PERCENTAGE TO TOTAL REVENUE EXPENDITURE
Sectoral distribution of expenditure and its percentage to total revenue expenditure
is given below: ( ` in crore)
Components Amount Percentage to Total
Revenue Expenditure
A. Fiscal Services 49.23 0.68
(i) Collection of Taxes on Income and Expenditure - -
(ii) Collection of Taxes on Property and Capital transactions 36.19 0.50
(iii). Collection of Taxes on Commodities and Services 12.65 0.17
(iv) Other Fiscal Services 0.39 0.01
B. Organs of State 93.68 1.29
C. Interest Payments and Servicing of debt 5,08.13 6.99
D. Administrative Services 11,65.08 16.03
E. Pensions and Miscellaneous General Services 9,35.01 12.87
F. Social Services 20,28.06 27.91
G. Economic Services 20,12.37 27.69
H. Grants-in-aid and Contributions 4,75.73 6.55
TOTAL: EXPENDITURE (REVENUE ACCOUNT) 72,67.29 100.00
* Percentage given in the pie-chart has been rounded

7
2.6 TREND OF EXPENDITURE Trend of expenditure in some important sectors between 2010-11 and 2014-15 (5 years) as below :-
( ` in crore )
Sector 2010-11 Per cent to
2011-12 Per cent to
2012-13 Per cent to 2013-14
. Per cent to 2014-15 Per cent to
B.E. R.E B.E. R.E. B.E. R.E. B.E R.E. B.E. R.E.
A. Social Services
i) General Education 569.02 91.85 86.73 655.88 99.21 91.64 794.71 107.47 92.75
818.07
101.75
93.39 1038.92 100.97 72.20
ii) Health & Family Welfare 209.33 109.24 94.54 251.70 109.05 93.56 262.27 97.78 100.32
296.26
104.96
98.11 417.65 138.36 90.01
B. Economic Services
i) Agriculture 383.68 102.17 89.13 397.03 95.81 97.82 371.64 90.82 81.43
107.50 62.35
94.22 182.40 119.67 89.66
ii) Rural Development
85.86 99.90 94.57 88.18 88.41 88.82 139.21 67.29 87.44 155.50 79.04 88.82 539.93 68.57 48.08
iii) Irrigation & Flood Control 66.67 95.94 91.91 78.03 111.33 99.49 77.74 101.83 99.11
79.24
98.95
93.96 95.16 112.12 95.53
iv) Energy 211.56 102.68 97.98 273.41 126.26 106.11 319.66 103.44 98.18 324.63
86.42
87.85 452.93 103.78 95.64
v) Transport 100.40 91.00 88.21 136.75 120.21 96.82 137.46 94.64 95.51
124.07
80.31
98.42 131.79 95.38 95.38
vi) General Economic Services
104.99 33.41 47.95 119.83 19.46 19.70 96.83 10.41 31.76 96.83
10.91
11.76 122.20 11.27 17.49

8
2.7 DEBTS AND LIABILITIES 2.7.1 Outstanding Public Debt at the end of 2014-15 was ` 43,79.85 crore, comprising
internal debt of ` 39,40.68 crore and loans and advances from Central Government of
` 439.17 crore. Other liabilities accounted under Public Account were ` 29,77.53 crore.
2.7.2 The State also acts as a banker and trustee in respect of deposits like small savings
collections, provident funds and deposits. There was an overall increase of ` 15.99 crore in
respect of such liabilities of State Government during 2014-15.
2.7.3 Interest payments on debt and other liabilities totalling ` 4,73.19 crore constituted
6.51 per cent of revenue expenditure of ` 72,67.29 crore. Interest payments of ` 4,73.19
crore were on account of Internal debt: ` 3,22.36 crore, loans and advances from Central
Governments: ` 37.53 crore and ` 1,13.30 crore on other liabilities. Expenditure on account
of interest payments increased by ` 28.27 crore during 2014-15.
2.7.4 Internal debt of ` 4,89.40 crore raised during 2014-15 was mainly used for (i)
discharge of debt obligations of ` 2,29.07 crore and (ii) payments of interest of ` 3,22.36
crore. Net funds available was (-) ` 62.03 crore.
2.8 INVESTMENTS AND RETURNS Total investments as share capital in non-financial Public Sector Undertakings (PSU) etc.
stood at ` 1,67.13 crore at the end of 2014-15. Dividends received during the year were
` 0.02 lakh on investment. During 2014-15, investments in PSUs increased by ` 6.83 crore,
and there is a decrease of ` 0.01 laks in dividend income over the previous year.
2.9 LOANS AND ADVANCES GIVEN BY THE STATE GOVERNMENT Total loans and advances given by the State Government during 2014-15 was ` 0.34 crore.
Recovery of principal amount aggregating ` 2,04.50 crore and interest on loan amounting to
`* crore was in arrears at the end of 31 March 2015. Total loans and advances given to
Government Corporations/Companies, non-Government Institutes, Local bodies, etc. during
2014-15 is ` Nil crore, and recovery of principal amounting to ` 1,93.96 crore and interest
on loan amounting to ` * crore is in arrears at the end of March 2015.
* Details not received from Government

9
2.10 FINANCIAL ASSISTANCE TO LOCAL BODIES AND OTHERS Assistance to local bodies, etc. during 2014-15 was ` 18,69.63 crore. It was increased from
` 6,66.80 crore in 2010-11 to ` 18,69.63 crore in 2014-15 which was 180.39 per cent
increase in the last five years (` 6,66.80, ` 7,31.40, ` 7,73.50, ` 8,07.62 and ` 18,69.63).
Rastriya Madhyamik Siksha Abhiyan (RMSA), National Rural Health Mission (NRHM),
Jawahar Lal Nehru Institute of Medical Sciences (JNIMS), District Councils, District Rural
Development Agency, Prime Minister Gramin Sarak Yojana (PMGSY), Manipur State Power
Company Limited (MPSCL & MAPDCL), Manipur Development Society and Sarva Siksha
Abhiyan (SSA) consumed the major portion ( ` 36.09, ` 93.87, ` 73.35, ` 3,38.35, ` 4,31.42,
` 1,04.00, ` 3,10.31, ` 45.50 and ` 1,08.78 crore) of the total grants during 2014-15.
2.11 APPROPRIATION ACCOUNTS The Appropriation Accounts of the Government of Manipur for the year 2014-15 present the
accounts of sums expended in the year ended 31 March 2015, compared with the sums
specified in the Schedules appended to the Appropriation Acts passed under Article 204 and
205 of the Constitution of India. The Appropriation Accounts show that in the year 2014-15,
there was actual expenditure of ` 88,84.61 crore, comprising of ` 72,78.06 crore on Revenue
accounts, ` 13,32.97 crore on Capital accounts, ` 2,73.24 crore for Repayment of Debt, and
` 0.34 crore as Loans and Advances given by the State Government. There were
savings/excesses under Revenue/Capital/Public Debt/Loans and Advances with reference to
total grants allocated by the State Legislature, as shown below:
( ` in crore )
Sl. No.
Nature of expenditure
Original grant
Supplementary grant
Re-appropriation
Total Actual expenditure
Savings(-) Excesses(+)
1 Revenue Voted 72,28.51 19,39.60 ... 91,68.11 67,86.72 (-)23,81.39
Charged 4,62.08 13.47 ... 4,75.55 4,91.34 15.79
2 Capital Voted 17,50.83 8,03.20 ... 25,54.03 13,32.97 (-)12,21.06
3 Public Debt Charged 2,42.71 34.35 ... 2,77.06 2,73.24 (-)3.82
4 Loans and Advances Voted
3.70 0.10 ... 3.80 0.34 (-)3.46
Total : 96,87.83 27,90.72 ... 1,24,78.55 88,84.61 (-) 35,93.94

10
TREND OF EXPENDITURE ON SELECTED GRANTS SHOWING PERSISTENT SAVINGS/EXCESSES
Details of persistent savings/excesses on a few selected grants/appropriations are given below: ( ` in crore )
Year Grant No./Appropriation No. Major Head
Total allocation
Savings (-)/ Excess (+)
to total grant
Percentage
2010-11
Demand No.10- Education Demand No.47- Minorities, Other Backward Classes and Scheduled Castes Demand No. 11- Medical, Health and Family Welfare
6,34.22 49.61 2,56.44
(-) 87.04 (-) 4.42
(-)16.45
13.72 8.91
6.41
2011-12
Demand No.10- Education Appropriation No. 2 – Interest Payment and Debt Services Demand No.47-Minorities, Other Backward Classes and Scheduled Castes Demand No. 11- Medical, Health and Family Welfare
7,65.06
5,26.12
59.83
4,38.25
(-)1,24.19
(+) 31.55
(-) 40.63
(-) 46.46
16.23
6.00
67.91
10.60
2012-13
Demand No.10- Education Appropriation No. 2 – Interest Payment and Debt Services Demand No.47-Minorities, Other Backward Classes and Scheduled Castes Demand No. 11- Medical, Health and Family Welfare
8,61.77
5,91.57
57.84
23,6.76
(-) 1,09.53
(+) 5,39.93
(-) 11.21
(-) 80.14
12.71
91.27
19.38
33.85
2013-14
Demand No.10- Education Appropriation No. 2 – Interest Payment and Debt Services Demand No.47-Minorities, Other Backward Classes and Scheduled Castes Demand No. 11- Medical, Health and Family Welfare
9,26.43
6,09.61
66.29
4,17.93
(-) 60.38
(+) 3,69.89
(-) 25.27
(-) 5.75
6.52
60.68
38.12
1.38
2014-15
Demand No.10- Education Appropriation No. 2 – Interest Payment and Debt Services Demand No.47-Minorities, Other Backward Classes and Scheduled Castes Demand No. 11- Medical, Health and Family Welfare
15,11.53
7,30.30
82.31
6,24.50
(-) 4,26.01
(+) 16.12
(-) 23.69
(-) 57.66
28.18
2.21
28.78
9.23

11
STATEMENT OF RUSH OF EXPENDITURE TOWARDS END OF YEAR 2014-15 ( ` in crore )
Sl. No.
Grant No.
Major Head of Accounts Total provision
Total expenditure for 3/2015
Total expenditure during the
year 2014-15
Percentage
Revenue Expenditure
1. 14 2225-Welfare of Scheduled Castes, Scheduled Tribes and Other Backward Classes
1,97.94 1,03.32 1,22.37 84.43
2. 13 2235-Social Security and Welfare 0.50 0.38 0.38 100
3. 34 2235-Social Security and Welfare 4.85 3.06 4.34 70.51
4. 17 2415- Agricultural Research and Education 21.83 21.45 23.11 92.82
5. 17 2435-Other Agricultural Programmes 0.08 0.07 0.07 100
6. 46 2501- Special Programmes for Rural Development 0.30 0.30 0.30 100
7. 30 2552-North Eastern Areas 47.34 1.50 1.50 100
8. 46 2810- Non- Conventional Sources of Energy 3.00 2.24 2.88 77.78
9. 53 3425- Other Scientific Research 61.58 57.66 61.52 93.73
10. 12 3604- Compensation and Assignments to Local Bodies and Panchayati Raj Institutions
12.94 12.94 12.94 100
Capital Expenditure
1 7 4055-Capital Outlay on Police 19.24 19.24 19.24 100
2 30 4059-Capital Outlay on Public Works 4,50.00 92.87 93.05 99.81
3 42 4070-Capital Outlay on Other Administrative Services 0.05 0.05 0.05 100
4 9 4220-Capital Outlay on Information and Publicity 2.15 2.15 2.15 100
5 14
4225-Capital Outlay on Welfare of Scheduled Castes, Scheduled Tribes and Other Backward Classes
13.47 13.24 13.24 100
6 43 4401-Capital Oulay on Crop Husbandry 2.00 2.00 2.00 100
7 16 4425- Capital Outlay on Co-operation 0.39 0.39 0.39 100
8 11 4552- Capital Oulay on North Eastern Areas 1.75 1.75 1.75 100
9 39 4851- Capital Outlay on Village and Small Indusries 50.00 10.00 10.00 100
10 21 4860-Capital Outlay on Consumer Industries 0.56 0.48 0.48 100

12
2.12 RECONCILIATION OF ACCOUNTS Accuracy and reliability of accounts depend on, among other things, timely reconciliation of
the departmental figures with the accounts figures.
Before annual accounts are finalized, the Heads of the Departments reconciled the
departmental accounts figures with those booked in accounts compiled by the Accountant
General (Accounts & Entitlements). The reconciliation of accounts figures is to be done
quarterly, but for the year 2014-15, 41 Controlling Officers had not reconciled at all.
The Departments are :
Sl. No. Name of Controlling Officers
1. Commissioner, General Administrative Department
2. Deputy Commissioner, Imphal East
3. Deputy Commissioner, Churachandpur
4. Deputy Commissioner, Chandel
5. Deputy Commissioner, Thoubal
6. Deputy Commissioner, Ukhrul
7. Deputy Commissioner, Senapati
8. Deputy Commissioner, Tamenglong
9. Secretary, Manipur Public Service Commission
10. Director, Local Fund Audit
11. Director, Settlement & Land Record
12. Commissioner/ Secretary, Finance
13. Director, Transport
14. Director, Municipal Administration, Housing and Urban Development
15. Inspector General of Registration
16. Commissioner, Taxes
17. Commissioner, Excise
18. Chief Engineer, Public Works Department
19. Chief Engineer, Irrigation Flood Control Department
20. Chief Engineer, Public Health Engineer Department
21.
22.
Chief Engineer, Power
Chief Engineer, Minor Irrigation

13
23. Director, Agriculture
24. Director, Fisheries
25. Director, Information & Public Relation
26. Director, Tribal & Hills Affairs
27. Registrar, Co-operative Societies, Manipur
28. Director, Rehabilitation
29. Director, Education (U)
30. Director, Education (S)
31. Director, District Institute of Educational Training
32. Director, Youth Affairs & Sports
33. Controller, Technical Education
34. Deputy Labour Commissioner
35. Director, Sericulture
36. Director, Vety. & Animal Husbandary Services
37. Secretary, Manipur Legislative Assembly
38. District & Session Judge, Manipur East
39. District & Session Judge, Manipur West
40. Secretary, Law Department, Public Prosecutor cum Government Advocate
41. Director, Tourism
2.13 SUBMISSION OF ACCOUNTS BY TREASURIES AND DIVISIONS Under the Government of Manipur, there are 11 (eleven) treasuries, 1 (one) Sub-treasury and
Manipur Bhawan , Guwahati rendering monthly accounts to the Accountant General (A&E),
Manipur. During 2014-15, rendering monthly accounts of 10 (ten) treasuries viz, Ukhrul,
Jiribam, Tamenglong, Lamphel, Bishnupur, Churachandpur,Thoubal, Kangpokpi, Imphal
West and Senapati was delayed by 1 to 15 days and 1 (one) treasury viz, Chandel was
delayed by 16 to 30 days. However, the average delay in receipts of all the treasuries
accounts is 3 (three) days. Similarly, 78 compiled accounts of Public Work Divisions and 29
compiled accounts of Forest Divisions have also been included before the close of Annual
accounts. The average delay in receipts of all the compiled accounts are 25 (twenty five) days
in respect of PW Divisions and 7 (seven) days in respect of Forest Divisions respectively.

14
CHAPTER-III
3.1 TRENDS IN GOVERNMENT RECEIPT AND EXPENDITURE Trends in Government Revenue Receipts and Revenue Expenditure from 2010-11 to 2014-15
(5 years period) is given below :
3.1.1 Revenue Receipts ( ` in crore)
Year Tax Revenue *
Non-Tax Revenue
Grants-in-aid and
Contributions
Gross Revenue Receipts
*GSDP Percentage of Gross Revenue
Receipts to GSDP
2010-12 12,57.62 2,59.88 39,12.44 54,29.94 91,98.14 59.03
2011-12 15,22.10 3,11.53 38,19.92 56,53.55 1,06,18.52 53.24
2012-13 16,50.66 2,31.78 49,37.32 68,19.76 1,17,13.00 58.22
2013-14 19,11.52 2,60.67 51,10.60 72,82.79 1,45,90.31 49.92
2014-15 20,43.72 1,83.73 57,70.82 79,98.27 1,61,22.73 49.61 * inclusive of Share of Union taxes/duties 3.1.2 Revenue Expenditure ( ` in crore)
Year
Revenue Expendi-ture
Total Expendi- ture
GSDP*
Percentage increased over previous year from 2010-11 to 2014-15
Percent-age of Govt. Expendi-ture to GSDP
Revenue Expenditure
Total Expenditure
GSDP
2010-11 40,78.01 59,99.87 91,98.14 35.28 30.18 32.24 65.23
2011-12 50,06.92 67,02.41 1,06,18.52 22.78 11.71 15.44 63.12
2012-13 53,16.53 68,21.39 1,17,13.00 6.18 1.78 10.31 58.24
2013-14 57,18.83 70,10.76 1,45,90.31 7.57 2.78 24.57 48.05
2014-15 72,67.29 86,00.07 1,61,22.73 27.08 22.67 10.50 53.34
* Domestic Product of Manipur as furnished by the Directorate of Economics and Statistics, Government of Manipur at current prices.

15
The overall increase in the Government’s total expenditure during 2014-15 compared to 2010-11
has been ` 26,00.20 crore. Growth in major areas of Revenue Expenditure is shown in the
following table :
(` in crore) Areas of expenditure
2010-11
2011-12
2012-13
2013-14 2014-15
Percentage (-) decrease/ increase
in 2014-15 over last year
Interest Payments & Servicing of Debt
3,86.87 4,23.16 4,60.92 4,75.22 5,08.13 6.93
Pension and Miscellaneous General Services
4,00.70 6,30.28 7,60.92 7,72.30 9,35.01 21.07
Administrative Services 7,68.83 9,60.74 9,55.57 10,56.36 11,65.08 10.29
Agriculture and Allied Activities 3,83.68 3,97.03 3,71.64 3,47.43 4,69.70 35.19
Rural Development 85.86 88.18 1,39.21 1,55.50 5,39.93 2,47.22
3.2 GOVERNMENT ACCOUNTS The total expenditure (Revenue and Capital) for the year is netted against total receipts (Revenue
and non-debt Capital receipts) of the year and the surplus thereof is transferred to a separate
ledger called “Government Account”. In addition, net effect of Prior Period Adjustments,
Miscellaneous Government Accounts, etc. is also transferred to the ledger “Government
Account”. Thus, the ledger “Government Account” represents the cumulative surplus/deficit of
the operations of the Government. The details of the ledger “Government Account” for the past
five years are given below.
( ` in crore)
Year Revenue Heads Capital Heads Other Heads # Deficit(-)/
Surplus (+) for the year
Cumulative surplus/ deficit at the end of the year
Receipts Disburs-
ments Deficit(-)/ surplus(+)
Receip-ts
Disburse- ments
Deficit(-)/ Surplus(+)
Deficit(-)/ Surplus(+)
2010-11 54,29.94 40,78.01 13,51.93 1.19 19,21.86 (-) 19,20.67 ... (-) 5,68.74 (-) 53,09.06
2011-12 56,53.55 50,06.92 6,46.63 1.89 16,95.49 (-) 16,93.60 ...
(-)10,46.97 (-) 63,56.03
2012-13 68,19.76 53,16.53 15,03.23 0.59 15,04.86 (-) 15,04.27 ...
(-) 1.04 (-) 63,57.07
2013-14
72,82.79 57,18.83 15,63.96 1.23 12,91.93 (-) 12,90.70
... (+) 2,73.26 (-) 60,83.81
2014-15 79,98.27 72,67.29 7,30.98 0.97 13,32.78 (-) 13,31.81 ...
(-) 6,00.83 (-) 66,84.64
(# Miscellaneous Government Account.)

16
3.3 LIABILITIES
Liabilities of the State Government increased by ` 11,65.12 crore from ` 61,92.26 crore in 2010-11 to
` 73,57.38 crore during 2014-15. Public debt comprising internal debt of the State Government and
loans and advances from the Central Government increased by ` 6,40.30 crore from ` 37,39.55 crore
in 2010-2011 to ` 43,79.85 crore at the end of the current year (2014-15). Article 293 of the Constitution
of India empowers the State Government to borrow on the security of the Consolidated Fund of the State
within such limits, if any, as may be from time to time fixed by the State Legislature. Details of the
Public Debt and total liabilities of the State Government are as under :
( ` in crore) Year Internal
Debt “A”
Loans & Advances from
Central Govern
ment
Total Public Debt
Small Savin
-gs
Provid-ent
Funds
Other Obligatio
ns*
Total Liabilities
GSDP
Percentage of total liability to GSDP
2010-11 31,00.20 6,39.35 37,39.55 2.39 8,39.41 16,10.91 61,92.26 91,98.14 67.32
2011-12 32,98.22 5,74.42 38,72.64 2.89 10,72.60 14,35.65 63,83.78 1,06,18.52 60.12
2012-13 35,10.66 5,30.42 40,41.08 2.40 12,11.10 15,46.36 68,00.94 1,17,13.00 58.06
2013-14 36,80.35 4,83.34 41,63.69 1.81 13,14.80 15,80.38 70,60.68 1,45,90.31 48.39
2014-15 39,40.68 4,39.17 43,79.85 1.28 14,01.63 15,74.62 73,57.38 1,61,22.73 45.63
* Non-interest bearing and Interest obligations such as deposits of Local Funds, Other earmarked funds, etc.
‘A’ Internal Debt includes Investment of National Small Savings Fund.
3.4 STATE PROVIDENT FUNDS The details of transactions from the State Provident Funds are shown in the following table:
( ` in crore)
Year Opening Balance
Receipts Payments Net accretion for the year
Closing Balance
Interest charged on balance of P.F
2010-11 7,98.00 1,77.77 1,36.36 41.41 8,39.41 63.80
2011-12 8,39.41 3,46.28 1,13.09 2,33.19 10,72.60 76.62
2012-13 10,72.60 2,95.35 1,56.85 1,38.50 12,11.10 95.89
2013-14 12,11.10 2,80.17 1,76.47 1,03.70 13,14.80 1,02.83
2014-15 13,14.80 2,89.00 2,02.16 86.84 14,01.64 1,09.24

17
3.5 GUARANTEES
The position of guarantees by the State Government for the payment of loans and capital
and payment of interest thereon raised by Statutory Corporations, Government Companies,
Corporations, Cooperative Societies, etc. is given below.
( ` in crore)
At the end of the
year Amount Guaranteed (Principal only)
Amount outstanding
Principal Interest
2010-11 1,96.04 1,11.98 1,20.62
2011-12 1,95.55 78.84 96.51
2012-13 1,93.98 72.04 1,19.32
2013-14 1,97.45 75.57 1,39.73
2014-15 1,97.45 62.96 1,29.99
3.6 WAYS AND MEANS ADVANCES The State Government, in order to maintain and sustain its liquidity position, takes Ways and Means
Advances from the Reserve Bank of India and thereafter, draws upon overdraft whenever there is
shortfall in the agreed minimum cash balance in its account with the Reserve Bank of India. The
State Government is required to maintain the minimum cash balance of ` 60 lakh with Reserve Bank
of India. The larger the amount and greater the number of times such ways and means advances are
taken or drawals made, the more it reflects upon the adverse position of the cash balance of the State
Government.
Category 2010-11 2011-12 2012-13 2013-14 2014-15
(i). Number of days on which minimum balance was maintained
a) Without obtaining any advance 365 365 262 352 365
b) By obtaining Ways and Means Advance
Nil
1
72
13 Nil
(ii). Number of days on which overdraft was availed
Nil
Nil
31
8* Nil

18
Category 2010-11 2011-12 2012-13 2013-14 2014-15
(iii) Number of days on which there was shortfall from agreed minimum balance even after availing the ordinary and special Ways and Means Advance to the full extent but no overdrafts were availed
Nil
Nil
69
5 Nil
(iv) Number of days on which minimum balance was maintained by taking special Ways and Means Advance over ordinary Ways and Means Advance
Nil
Nil
72
13 Nil
3.7 GENERAL CASH BALANCES The closing cash balance according to the Reserve Bank of India was ` (-) 2,90.73 crore
against the general cash balance of ` (-) 2,97.95 crore reflected in State Government
accounts. The difference of ` 7.22 crore was due to net unadjusted balance by RBI which is
under reconciliation.
Investments held in the Cash Balance Investment Account* as on 31st March 2015 were
` 1,25.65 crore.
Other cash balances and investment comprising cash with departmental officers
(` 53.45 crore), permanent advances with departmental officers (` 0.02 crore) and investment
of earmarked funds (` 2,35.97 crore) as on 31st March 2015 were at ` 2,89.44 crore.
___________________________ * Note:- Cash Balance Investment Account is the record of transactions connected with temporary investments of cash balances. e.g. in short term loans or Other Government Securities.
19
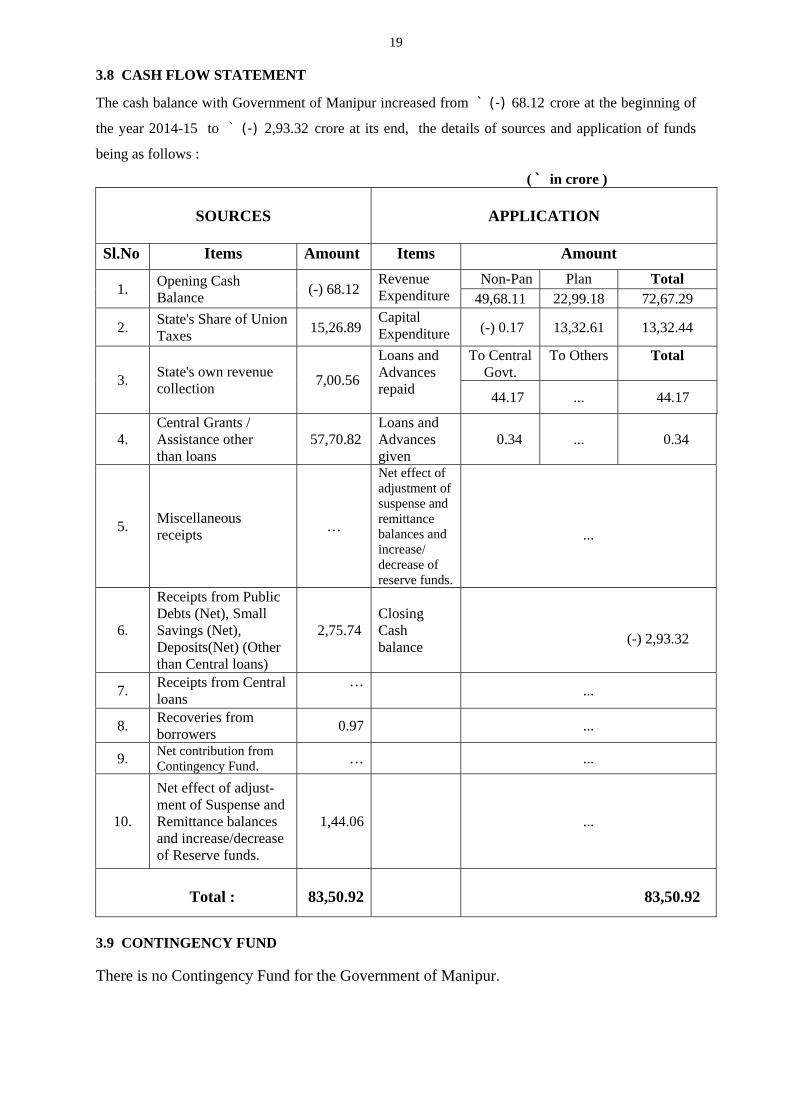
3.8 CASH FLOW STATEMENT
The cash balance with Government of Manipur increased from ` (-) 68.12 crore at the beginning of
the year 2014-15 to ` (-) 2,93.32 crore at its end, the details of sources and application of funds
being as follows :
( ` in crore )
SOURCES
APPLICATION
Sl.No Items Amount Items Amount
1. Opening Cash Balance (-) 68.12
Revenue Expenditure
Non-Pan Plan Total 49,68.11 22,99.18 72,67.29
2. State's Share of Union Taxes 15,26.89
Capital Expenditure (-) 0.17 13,32.61 13,32.44
3. State's own revenue collection 7,00.56
Loans and Advances repaid
To Central Govt.
To Others Total
44.17 ... 44.17
4. Central Grants / Assistance other than loans
57,70.82 Loans and Advances given
0.34 ... 0.34
5. Miscellaneous receipts …
Net effect of adjustment of suspense and remittance balances and increase/ decrease of reserve funds.
...
6.
Receipts from Public Debts (Net), Small Savings (Net), Deposits(Net) (Other than Central loans)
2,75.74 Closing Cash balance
(-) 2,93.32
7. Receipts from Central loans
… ...
8. Recoveries from borrowers 0.97 ...
9. Net contribution from Contingency Fund. … ...
10.
Net effect of adjust-ment of Suspense and Remittance balances and increase/decrease of Reserve funds.
1,44.06
...
Total : 83,50.92
83,50.92
3.9 CONTINGENCY FUND There is no Contingency Fund for the Government of Manipur.